The Dissolution of the Family. A Consequence of Misinterpretation?

Available online at www.sciencedirect.com
www.elsevier.com/locate/gca
Geochimica et Cosmochimica Acta 73 (2009) 6065–6083
Comparative dissolution kinetics of biogenic and chemogenicuraninite under oxidizing conditions in the presence of carbonate
Kai-Uwe Ulrich a,*, Eugene S. Ilton b, Harish Veeramani c, Jonathan O. Sharp c,1,Rizlan Bernier-Latmani c, Eleanor J. Schofield d,2, John R. Bargar d,
Daniel E. Giammar a
a Department of Energy, Environmental and Chemical Engineering, Washington University, One Brookings Drive, St. Louis, MO 63130, USAb Pacific Northwest National Laboratory, 902 Battelle Blvd, Richland, WA 99352, USA
c Ecole Polytechnique Federale de Lausanne, CH-1015 Lausanne, Switzerlandd Stanford Synchrotron Radiation Lightsource, 2575 Sand Hill Rd, Menlo Park, CA 94025, USA
Received 8 January 2009; accepted in revised form 9 July 2009; available online 14 July 2009
Abstract
The long-term stability of biogenic uraninite with respect to oxidative dissolution is pivotal to the success of in situ biore-duction strategies for the subsurface remediation of uranium legacies. Batch and flow-through dissolution experiments wereconducted along with spectroscopic analyses to compare biogenic uraninite nanoparticles obtained from Shewanella oneiden-
sis MR-1 and chemogenic UO2.00 with respect to their equilibrium solubility, dissolution mechanisms, and dissolution kineticsin water of varied oxygen and carbonate concentrations. Both materials exhibited a similar intrinsic solubility of �10�8 Munder reducing conditions. The two materials had comparable dissolution rates under anoxic as well as oxidizing conditions,consistent with structural bulk homology of biogenic and stoichiometric uraninite. Carbonate reversibly promoted uraninitedissolution under both moderately oxidizing and reducing conditions, and the biogenic material yielded higher surface area-normalized dissolution rates than the chemogenic. This difference is in accordance with the higher proportion of U(V)detected on the biogenic uraninite surface by means of X-ray photoelectron spectroscopy. Reasonable sources of a stableU(V)-bearing intermediate phase are discussed. The observed increase of the dissolution rates can be explained by carbonatecomplexation of U(V) facilitating the detachment of U(V) from the uraninite surface. The fraction of surface-associatedU(VI) increased with dissolved oxygen concentration. Simultaneously, X-ray absorption spectra showed conversion of thebulk from UO2.0 to UO2+x. In equilibrium with air, combined spectroscopic results support the formation of a near-surfacelayer of approximate composition UO2.25 (U4O9) coated by an outer layer of U(VI). This result is in accordance with flow-through dissolution experiments that indicate control of the dissolution rate of surface-oxidized uraninite by the solubility ofmetaschoepite under the tested conditions. Although U(V) has been observed in electrochemical studies on the dissolution ofspent nuclear fuel, this is the first investigation that demonstrates the formation of a stable U(V) intermediate phase on thesurface of submicron-sized uraninite particles suspended in aqueous solutions.� 2009 Elsevier Ltd. All rights reserved.
0016-7037/$ - see front matter � 2009 Elsevier Ltd. All rights reserved.
doi:10.1016/j.gca.2009.07.012
* Corresponding author. Present address: BGD Soil andGroundwater Laboratory GmbH, Tiergartenstrasse 48, D-01219Dresden, Germany. Fax: +49 351 438 99 039.
E-mail address: [email protected] (K.-U. Ulrich).1 Present address: Colorado School of Mines, Environmental
Science & Engineering Division, Golden, CO.2 Present address: The University of Kent, School of Physical
Sciences, Canterbury, Kent, UK.
1. INTRODUCTION
The anthropogenic use of uranium (U) for nuclear fuelproduction, weapons manufacturing and research hasresulted in widespread contamination of soils and ground-water. One of the most stable natural forms of uranium isuraninite, a hyperstoichiometric mineral in the range ofUO2+x (0 < x < 0.25) that ubiquitously contains impurities

6066 K.-U. Ulrich et al. / Geochimica et Cosmochimica Acta 73 (2009) 6065–6083
when present in rock or sediment formations (Finch andEwing, 1992; Janeczek and Ewing, 1992a,b). Because sev-eral species of metal and sulfate reducing bacteria areknown to mediate the reduction of dissolved U(VI) toU(IV) (Suzuki and Suko, 2006; Wall and Krumholz,2006), the engineered stimulation of microbial growth incontaminated media by providing an electron donating car-bon source (e.g., ethanol, acetate, lactate, glucose) has beenproposed to initiate the precipitation of sparingly solubleuraninite (Gorby and Lovley, 1992; Lovley and Phillips,1992; Lovley et al., 1991). This strategy of in situ bio-remediation has been studied for more than a decade(N’Guessan et al., 2008; Renshaw et al., 2007 and refer-ences therein). Uranium immobilization can only be suc-cessful if dissolution rates of biogenic uraninite and thelikelihood of reoxidation are low. Although the structureof biogenically immobilized uranium has not yet been fullycharacterized in field-scale U(VI) bioreduction experiments,nanoparticulate UO2+x obtained from cell cultures is betterunderstood and typically exhibits a composition close toUO2.0 (Burgos et al., 2008; Schofield et al., 2008; Singeret al., 2007, 2009). Hence, even more knowledge is requiredwith respect to the chemical stability of biogenic UO2+x, inparticular the kinetics of dissolution reactions under envi-ronmentally relevant scenarios. In this paper, the term‘‘bio-UO2” is used for biogenic uraninite prepared in theabsence of dopants, irrespective of the actual stoichiometry(the number of x in UO2+x). Unless otherwise specified, theterm ‘‘syn-UO2” is used for chemogenic UO2+x where thestoichiometry may range between 0 6 x 6 0.33 dependenton the chemical conditions present and the degree of sur-face oxidation.
In natural groundwater, the potential of the U(IV)/U(VI) redox couple is expected to range between �42 and+86 mV, depending on a number of parameters includingthe pH and concentrations of Ca2+ and dissolved inorganiccarbon (DIC) (Brooks et al., 2003; Wall and Krumholz,2006). Some of the most potent electron acceptors forU(IV) oxidation are dissolved oxygen, nitrate, nitrite, andsolid Mn(IV) and Fe(III). The processes of biogenic urani-nite reoxidation and its suppression have been investigatedfor lab-grown cultures and sediments amended with a car-bon source in situ or in flow-through columns. Dissolvedoxygen (DO) is one of the strongest oxidants of U(IV),and it has been reported to oxidize bioreduced U(IV) withinseveral hours to days in stirred batch experiments (half-lifeof 61 h) (Gu et al., 2005; Zhou and Gu, 2005) or whenmixed with bioreduced sediment (Zhong et al., 2005). How-ever, continuous-flow-through dissolution studies usingbioreduced sediments in soil columns demonstrated that ni-trate and not DO can be the dominant oxidant of U(IV) insediments. The authors hypothesized that oxygen was scav-enged more rapidly by other reduced compounds or bymicrobial metabolism (Moon et al., 2007). In addition tonitrate, which is often found in U-contaminated sites (Finn-eran et al., 2002), intermediate products of dissimilatory ni-trate reduction or denitrification such as NO2
�, N2O andNO can oxidize and remobilize U(IV) (Senko et al., 2002).
Mn oxides can rapidly oxidize bio-UO2 in the absence ofbiological activity (Fredrickson et al., 2002), and freshly
formed biogenic MnO2 can be an even more effective oxi-dant for UO2+x than DO under low partial pressure (PO2)conditions (Chinni et al., 2008). Ferrihydrite can rapidlyoxidize bio-UO2, generating dissolved U(VI) and Fe2+.The oxidation rate is affected by the aqueous speciationof U(VI) which is a function of pH, carbonate, and Ca2+
concentrations because those ions tend to form stable ter-nary complexes with U(VI) lowering the free energy of ura-ninite oxidation (Ginder-Vogel et al., 2006). ReactiveFe(III) oxyhydroxide can also result from enzymatic Fe(II)oxidation coupled to nitrate reduction, or from Fe(II) oxi-dation with nitrite (Senko et al., 2005a). Other work foundthat humic substances, siderophores, and (bi)carbonatefrom the degradation of organics can increase the rate ofbio-UO2 oxidation by formation of stable U(VI) complexes(Frazier et al., 2005; Gu et al., 2005; Wan et al., 2005).
The stability of bio-UO2 can be enhanced by preventingreoxidation of U(IV), for example when sulfides such asmackinawite (FeS) or decaying biomass are present andact as oxygen-scavenging redox buffers or when sulfite isadded to the system (Abdelouas et al., 1999; Wu et al.,2007). Another strategy for stabilizing bio-UO2 is to keepthe rate of U(VI) bioreduction low, which may give riseto larger and more aggregated particles that are more resis-tant to oxidation (Senko et al., 2007). In batch experimentswith air-equilibrated water, small particles of bio-UO2 wereoxidized much faster than were larger particles and aggre-gates. However, the U(VI) bioreduction rate is not a uniquetool to control particle size. This has been exemplified forShewanella oneidensis MR-1 for which the bioreduction ratedid not affect particle size in contrast to results from Shewa-
nella putrefaciens CN32 (Burgos et al., 2008).In most of the above-mentioned studies, the generated
U(IV) phase has not been structurally characterized andthere is little robust information regarding the stability ofthe solid phase. Although several authors have applied X-ray absorption near-edge spectroscopy (XANES) to quan-tify the proportion of biogenic U(IV) and U(VI) in theirsystems, structural characterization of the U(IV) mineralphase is lacking in most U bioreduction - reoxidation stud-ies (Ginder-Vogel et al., 2006; Senko et al., 2005b; Wanet al., 2005; Wu et al., 2007; Zhong et al., 2005). The com-bination of structural investigations with studies on dissolu-tion kinetics is important because structural differences areexpected to modulate chemical stability. For example,Finch and Ewing (1992) reported that cations incorporatedin the uraninite lattice and a corrosion rind of U(VI) on themineral surface inhibited further U(IV) oxidation. Thismade uraninite stable at redox conditions under which syn-thetic UO2 corrodes.
Recent research shows that the nano-sized UO2+x mate-rial generated by lab-grown cultures of S. oneidensis MR-1is near-stoichiometric (x < 0.05) and structurally similar tochemogenic UO2.00 (Schofield et al., 2008). A comparisonof both types of material with respect to stability underreducing, carbonate-free conditions showed that dissolu-tion rates had the same order of magnitude when normal-ized to surface area (Ulrich et al., 2008). The objective ofthe present study is to investigate the effects of carbonateand dissolved oxygen on the stability of biogenic and

Dissolution kinetics of biogenic uraninite 6067
chemogenic UO2+x. Dissolution rates are presented as afunction of varied DO and DIC concentrations, and a con-ceptual mechanistic model of possible surface reactionssupported by spectroscopic results is discussed. The ulti-mate goal of this research is to predict the long-term stabil-ity of a structurally well-characterized biogenic uraniniteunder chemical conditions relevant to contaminatedgroundwater.
2. EXPERIMENTAL SECTION
2.1. Materials
Reagents of certified ACS grade or better and ultrapurewater (resistivity >18.5 MX cm) were used. The UO2+x
materials were prepared in an anaerobic chamber (CoyLaboratory Products) as described in Ulrich et al. (2008).Biogenic UO2+x was produced by the facultative anaerobicS. oneidensis strain MR-1. Bacteria of the genus Shewanella
have been found in the subsurface, e.g., at the Hanford site(Fredrickson et al., 2007). U(VI) reduction was carried outin the presence of 1.2 mM uranyl acetate, 30 mM NaHCO3,and 20 mM lactic acid at pH 6.3 and 8.0, giving rise to dif-ferent ratios of UO2(CO3)2
2� and UO2(CO3)34� as the
dominant U(VI) species under these conditions. The yieldof U(IV) oxide was close to or above 99% at both pH con-ditions. The products are referred to as bio6-UO2 and bio8-UO2. Upon completion of U(VI) bioreduction, the mixtureof bio-UO2 and cells was treated overnight with 1 MNaOH. The organic debris was removed from UO2 byphase separation employing anaerobic hexane. Subsequenttreatment with 0.1 M NaHCO3 solution and repeatedwashing with ultrapure anaerobic water removed less than1% of the total uranium, presumably U(VI). The cleanedbio-UO2 solids were stored anaerobically in light-protectedserum bottles until being used in dissolution experiments.
Synthetic uraninite (syn-UO2) was prepared by reduc-tion of studtite (UO2O2�4H2O(s)) at 400 �C for 4 h in astainless steel reactor in presence of H2(g) (Eq. (1)).
UO2O2 � 4H2OðsÞ þ 2H2ðgÞ ! UO2ðsÞ þ 6H2O ð1Þ
Studtite was precipitated by mixing �88 mM H2O2 (SigmaAldrich) with 2.5 mM UO2Cl2 (Eq. (2)).
UO2Cl2 þH2O2 þ 4H2O! UO2O2 � 4H2OðsÞ þ 2HCl ð2Þ
A light yellow precipitate settled within 3 days. It was dia-lyzed against ultrapure water, dried, and identified as pureUO2O2�4H2O(s) by X-ray diffraction (XRD). The UO2Cl2stock solution was prepared by heating UO2(NO3)2�6H2O(Antec, Inc.) at 275 �C for 3 days to produce solid UO3 thatwas then dissolved in 0.5 M HCl (trace metal grade, FisherScientific).
2.2. Structural properties of unreacted UO2+x
The biogenic and synthetic materials differed notably intheir particle size and surface area. The bio-UO2 particlesexhibited a nano-scale size range of 1.5–3.5 nm (Schofieldet al., 2008) and an average specific surface area of50.1 m2/g obtained from multipoint N2-BET. This surface
area is lower than expected for a spherical UO2 particleof that size (150–360 m2/g), and it is lower than recentlypublished N2-BET data of biogenic UO2 obtained fromS. putrefaciens CN32 (93–129 m2/g, Singer et al., 2009),suggesting significant agglomeration of the nanoparticles.Because particle agglomeration could not be preventedover the course of dissolution experiments, the obtaineddissolution rates were normalized to the measured ratherthan the calculated surface area. The mean diameter ofthe syn-UO2 particles was two orders of magnitude larger(100–200 nm) and revealed a matching N2-BET surfacearea of 5.9 m2/g.
X-ray absorption spectroscopy and synchrotron basedX-ray powder diffraction results showed that the structuresof the bio6-UO2 and bio8-UO2 materials were similar, sug-gesting particles with a highly ordered core in which the U-lattice is preserved (stoichiometry close to UO2.00, x < 0.05)and an outer region with local disorder (Schofield et al.,2008; Ulrich et al., 2008). The lattice parameter of the un-cleaned bio-UO2 was similar to that of chemogenicUO2.00, suggesting that the surface energy is not sufficientto strain the intermediate- and long-range structure of thebio-UO2 particles. Hence, similar intrinsic thermodynamicand kinetic properties would be expected.
2.3. Dissolution experiments
Dissolution rates were quantified using magnetically-stirred continuous-flow tank reactors (CFR, volume of12.6 mL) operated in the dark at room temperature(20 ± 1 �C) as described in detail elsewhere (Ulrich et al.,2008). Each reactor was loaded with a weighed amount ofsyn-UO2 powder or a defined aliquot of well-mixed bio-UO2 suspension with known UO2 concentration and fedwith equilibrated solutions of given chemical composition.All feed solutions contained 1 or 5 mM HEPES buffer ad-justed to pH 7.5 or 8.0. NaHCO3 was added to obtainDIC concentrations of 0.1, 1.0, or 10 mM. Customizedgas mixtures were purged into the feed solution to maintainreducing conditions (95% N2 + 5% H2 in presence of a Pdcatalyst) or oxidizing conditions with 1 vol% O2 (balanceN2) or 21 vol% O2 (compressed air). Influent flow rateswere set between 1.0 and 2.1 mL/min and gravimetricallymonitored based on the effluent volume collected in testtubes using an automatic fraction collector. The DO con-centration of the influent was monitored with a flow-through DO probe (Microelectrodes, Inc.) installed in thetubing between the feed reservoir and the CFR.
Because the available amount of biogenic UO2 was lim-ited, the CFR experiments were carried out either in a con-secutive or intermittent treatment mode. In the consecutivemode, different feed solutions were pumped through theCFR for about 40 residence times for each solution in a se-quence of increasing PO2 (0, 1, 21 vol% while maintaining1 mM DIC), or increasing concentration of carbonate (0,0.1, 1.0, 10 mM while maintaining PO2 constant at1 vol%). Both series started with anoxic atmosphere usingDIC-free, HEPES-buffered feed solution. The same condi-tion was applied during the first and third treatment stepsof the intermittent dissolution modes, interrupted by either

6068 K.-U. Ulrich et al. / Geochimica et Cosmochimica Acta 73 (2009) 6065–6083
feeding 1 mM DIC under reducing conditions or providingDO equilibrated to a 1% PO2 headspace.
Equilibrium [U]diss of UO2 under reducing conditionswas determined by switching the operation mode fromflow-through (i.e., CFR) to stirred batch reactor (SBR).By operating in this order, any labile U(VI) species presentwith the initial solid were washed away during the CFRmode prior to starting the equilibrium measurement inthe SBR mode. The SBR experiments were performed ina closed system in the glovebox. Samples for U analysiswere collected at several points in elapsed time using a nee-dle syringe and filtered through aluminum oxide filter units(Anotop10, Whatman, Inc.) with 0.02 lm pore size. Forspectroscopic investigations, the residual solids of the sus-pension were either accumulated on a filter membrane orcentrifuged. The wet paste was loaded into an aluminumsample holder with Kapton windows and stored at anoxicconditions until the analysis by X-ray absorption spectros-copy. For X-ray photoelectron spectroscopy, the wet sam-ples were dried in an anaerobic chamber prior to theanalysis.
2.4. Analysis
The pH was periodically measured in the feed solutionand the effluent samples. Effluent samples selected for totalU analysis were acidified to 0.1 M nitric acid prior to mea-surement by ICP-MS (Agilent 7500ce). The ICP-MS meth-od for uranium had a detection limit <10 ng/L. Severalsamples were also analyzed specifically for U(VI) using a ki-netic phosphorescence analyzer (KPA) (Chemchek, Rich-land, WA, USA) with a detection limit of <0.1 lg/L(Chinni et al., 2008).
X-ray absorption spectroscopy (XAS) and high-resolu-tion X-ray photoelectron spectroscopy (XPS) were usedto determine the redox state and stoichiometry of uraniumin the bulk and near the surface of UO2+x particles beforeand after their reaction in dissolution experiments.
2.4.1. X-ray photoelectron spectroscopy
The XPS analyses were carried out at Lehigh Universityusing a Scienta ESCA300. The instrument’s operationalparameters as well as methodologies for coping with poten-tial artifacts are discussed elsewhere (Ilton et al., 2004).Briefly, an intense monochromatic Al Ka X-ray beam,which is generated with a rotating anode, was used. Opera-tional conditions yielded Fermi edge widths of 0.41–0.31 eVfor Ag0, depending on the pass energy used. Regional scansof the U4f region were recorded and the energy scale wasreferenced to adventitious C1s at 285.0 eV. For a numberof samples, and in particular for the uncleaned biogenicUO2 samples, the C1s structure was complicated. In suchcases, the C1s peak was curve-resolved with a sufficientnumber of Gaussians to obtain a good fit. The lowest en-ergy Gaussian was then set as the energy scale reference.
Standards for U(VI), U(V) and U(IV) were used todetermine satellite structures and primary peak parameters.Schoepite was precipitated from a supersaturated solutionand used as a U(VI) standard. A U(V)–U(VI) oxyhydroxidephase provided the standard for U(V). The synthesis and
characterization of this compound has been described in de-tail in previous work (Belai et al., 2008). The U(V) compo-nent was derived by fitting the mixed valence phase with theU(VI) component (obtained from schoepite) and solvingfor the U(V) component. The U(IV) standard was preparedas described in Section 2.1 and characterized as stoichiom-etric UO2.00 by X-ray powder diffraction and XAS (Ulrichet al., 2008).
Spectra were best fit by non-linear least squares usingthe CasaXPS curve resolution software. A Shirley back-ground was extended from about 8 eV below the 4f7/2 peakto about 20 eV above the 4f5/2 peak. This binding energy(BE) spread encompassed the major satellite features. TheBE and intensity of individual components, which includedsatellites and primary peaks, were allowed to move as apacket relative to the other components (i.e., satellite-pri-mary peak BE separations and relative intensities were fixedfor a given component). A single, but variable full-width-at-half-maximum (FWHM) value was used for all the corepeak components. Satellite and core peak FWHMs wereset at a fixed ratio for each component. The outstanding en-ergy resolution obtained by the Scienta300, combined withtightly correlating core peaks to their corresponding satel-lites, imposed severe constraints on the solution for eachsample.
Prior to XPS analyses, the wet samples were dried andstored in an airtight container for 24–48 h. The containerwas then placed in an Ar filled glove bag attached to the en-try port of the X-ray photoelectron instrument such thatthe sample transfer occurred with minimal exposure to oxy-gen. Sequential analyses were taken on the same spot, foreach specimen, in order to check for beam induced reduc-tion. The sequential spectra for the U(IV) standard indi-cated no change, and the U(V) standard was stable overthe first several spectra in the sequence. However, mostother specimens, including the U(VI) standard, did indicatereduction over time. Fortunately, reduction was systematicand slow. In order to minimize the reduction of our U(VI)standard, it was analyzed at a lower photon flux. The XPSspectra presented in this work are always the first in eachsequence. Tabulated data give both the valence state de-rived from the first spectrum in the sequence and a valueobtained by extrapolating to time zero.
2.4.2. X-ray absorption spectroscopy
X-ray absorption near-edge (XANES) and extended X-ray absorption fine structure (EXAFS) spectroscopy wascarried out at SSRL beamlines 11–2 and 10–2 using a Si(2 2 0) double-crystal monochromator. Spectra across theU L3 electron binding energy edge position were collectedin transmission mode. Unreacted cleaned biogenic sampleswere analyzed in a liquid nitrogen cryostat (77 K) to im-prove definition of higher-order shells. Reacted samples(subjected to oxidation in the CFRs) were collected onmembrane filters which were analyzed at room tempera-ture. The monochromator was calibrated using an yttriumfoil. EXAFS spectra were background-subtracted, splinedand analyzed using SIXPack (Webb, 2005). Backscatteringphase and amplitude functions required for fitting of spec-tra were obtained from FEFF 8 (Rehr et al., 1992). The

Dissolution kinetics of biogenic uraninite 6069
uncertainty of the U-oxidation state by XANES spectros-copy is about 10% for mixtures containing U(IV) andU(VI), based on Singer et al. (2009) and taking into accountthe lack of knowledge regarding the precise U(VI) speciesfor surface-reacted uraninite.
2.5. Dissolution rate calculation
Dissolution rates of the biogenic and chemogenic UO2
materials are derived from the mass balance approach(Eq. (3)) described in Ulrich et al. (2008).
V �d½U �eff
dt¼ Q � ½U �in � Q � ½U �eff þ V � Rd ð3Þ
In Eq. (3) [U]eff and [U]in (mol L�1) are the U concentra-tions in the effluent and influent, V (L) is the reactor vol-ume, Q (L min�1) is the flow rate, and Rd (mol L�1
min�1) is the rate of U release to solution from UO2 disso-lution. Given a constant Rd and ideal flow conditions, ittakes about five residence times, s = VQ�1 (min), to achievesteady-state, i.e.,
d½U �eff
dt ¼ 0. Assuming [U]in is zero, the dis-solution rate can be calculated:
Rm ¼Q � ½U �ss
V � ½solid� ð4Þ
Rn ¼Q � ½U �ss
V � SSA � ½solid� ð5Þ
where Rm (mol g�1 min�1) and Rn (mol m�2 min�1) are thedissolution rates normalized to mass and specific surfacearea, SSA (m2 g�1), respectively, [U]ss (mol/L) is the effluenturanium concentration at steady-state, and [solid] (g L�1) isthe mass concentration of UO2 in the reactor. The rate cal-culation accounts for the changes in [solid] and SSA withtime, resulting from UO2 dissolution (for details see Ulrichet al., 2008).
To calculate the reaction rate constant, the Gibbs freeenergy of reaction needs to be considered (Kraemer andHering, 1997; Lasaga et al., 1994). While the goal was torun the dissolution experiments far from equilibrium, a lin-ear rate law function (Eq. (6)) has been used to account forthe distance to equilibrium, where IAP is the ion activityproduct, and Ksp the solubility product with respect toUO2 dissolution under anoxic conditions (Eq. (7)) and withrespect to metaschoepite (UO3�2H2O) under oxidizing con-ditions (Eq. (8)). For the anoxic conditions, the measuredequilibrium concentration of dissolved uranium, [U]eq, hasbeen used. The predicted [U]eq of metaschoepite was calcu-lated as a function of [U]diss, pH, and [DIC] using MIN-EQL+ (Schecher and McAvoy, 1998) and a log Ksp of5.39 for the dissolution reaction (Eq. (8)) as suggested byJang et al. (2006) and Langmuir (1978). The dissolutionrate constant k (mol m�2 min�1) for these reactions canthen be calculated from Eq. (9).
f ðDGÞ ¼ 1� IAPKsp
� �ð6Þ
UO2ðsÞ þ 4Hþ ! U4þ þ 2H2O ð7Þ
UO3 � 2H2OðsÞ þ 2Hþ ! UO22þ þ 3H2O ð8Þ
Rn ¼ k � 1� IAPKsp
� �¼ k � 1� ½U �ss
½U �eq
!ð9Þ
3. RESULTS
3.1. Oxidative UO2 dissolution
To study the effects of DO on the stability of bio-UO2
and syn-UO2 in aqueous systems, oxygen-free conditionsprovide the lowest dissolution rates and were applied asthe first step of consecutive UO2+x dissolution (Ulrichet al., 2008). In anoxic, carbonate-free water at pH7.5 ± 0.2, the dissolved U concentrations in the effluentreached steady-state well below or close to the predictedequilibrium solubility of amorphous UO2(am) of 3.2 �10�9 M based on the NEA thermodynamic database (Guil-laumont et al., 2003). The calculated dissolution rates ofboth bio- and chemogenic materials were within the sameorder of magnitude when normalized to surface area, whichis consistent with their structural homology (Ulrich et al.,2008). Under reducing conditions, U(VI) was undetectable(<4.2 � 10�10 M) in the effluent as verified by KPA. Thisresult suggests that the anoxic UO2 dissolution was primar-ily driven by hydrolysis of U(IV) and not by oxidation toU(VI) (Eq. (7)).
Even though carbonate is a common groundwater con-stituent, its aqueous complexes with U(IV) are very weak(Guillaumont et al., 2003) and thus are not expected tochange the solubility and dissolution kinetics of UO2(am)
under the experimental conditions. To test this hypothesis,1 mM DIC was added to the anoxic feed solution as the sec-ond step of consecutive UO2 dissolution. Surprisingly, theeffluent [U]diss increased by more than one order of magni-tude for the syn-UO2 (Fig. 1c), and about three orders ofmagnitude for the bio-UO2 (Fig. 1a and b). Whereas theeffluent of bio8-UO2 and bio6-UO2 approached a pseudosteady-state [U]diss between 1 and 5 lM, the effluent [U]diss
of syn-UO2 peaked at 0.05 lM and then continuouslydiminished toward a steady-state concentration around0.01 lM (Fig. 1c). Roughly the same value has been deter-mined as the experimental equilibrium concentration in theabsence of DIC (Ulrich et al., 2008). The dissolution ratesof the bio-UO2 were up to 20-times higher than those ofthe syn-UO2 when normalized to surface area (Table 1).Hence, at least for the bio-UO2, the presence of carbonateconsiderably accelerated the dissolution process underreducing conditions, which is likely explained by complexa-tion and detachment of a uranium species other thanU(IV). Interestingly, effluent analyses by KPA ruled outthe possibility of U(VI) mobilization beyond the detectionlimit of 4.2 � 10�10 M.
Step three of the flow-through UO2+x dissolution exper-iment showed a change of rate when switching to moder-ately oxidizing conditions (1 vol% PO2) while keeping the1 mM DIC feed solution. The introduced oxygen dissolvedquickly in the feed solution up to a level of 0.4–0.6 mg/L(Fig. 1d–f), which is consistent with the expected DO equi-librium in water at 20 �C and 1 bar of gas pressure. Theeffluent [U]diss of the syn-UO2 material showed the highest

0.001
0.01
0.1
1
10
0 6 12 18 24 30 36 42
[U] eq UO2(am)
[U] e
ff (µ
M)
a
0 6 12 18 24 30 36
[U] eq UO2(am)
b
0 6 12 18 24 30 36
[U]eq UO2(am)
c
bio8-UO2 bio6-UO2 syn-UO2
O2
0.01
0.1
1
10
0 6 12 18 24 30 36
[U] ef
f (µM
), [D
O] in
f (mg/
L)
[DO]inf
d
0 6 12 18 24 30 36
[DO]inf
e
0 6 12 18 24 30 36
[DO]inf
f
1% O2
0.1
1
10
100
0 6 12 18 24 30 36
[U] e
ff (µM
), [D
O] in
f (mg/
L)
[U]eq Metaschoepite
[DO]inf
g
0 6 12 18 24 30 36Normalized Time (t/τ)
[U]eq Metaschoepite
[DO]inf
h0 6 12 18 24 30 36
[U] eq Metaschoepite
[DO]inf
i
Air
Fig. 1. Flow-through dissolution of bio8-UO2 (a, d, g), bio6-UO2 (b, e, h), and syn-UO2 (c, f, i) as a function of oxygen concentration in theinfluent, sequentially raised from reducing atmosphere (5 vol% PH2, a–c) to 1 vol% PO2 (d–f) to 21 vol% PO2 (g–i; each gas balanced with N2).The feed solution contained 1 mM DIC at 7.6 ± 0.1, effluent pH was 8.2 ± 0.3. Symbols represent effluent concentrations of dissolved U oftwo replicate reactors as a function of residence times (t/s, with s = 6–9 min. Error bars reflecting one standard deviation of analysis aremostly smaller than the symbol size. The thin dashed lines show the concentration of dissolved oxygen (DO) monitored in the influent. Thethick dashed and the dotted lines indicate the equilibrium concentrations of amorphous UO2 (log Ksp �1.5) and metaschoepite, UO3�2H2O(log Ksp �5.39) calculated from thermodynamic data. The solid line shows the modeled response to UO2 dissolution with rate constants givenin Table 1. UO2 dissolution was continued from a flow-through experiment which ran under reducing conditions in the absence of carbonate(see Ulrich et al, 2008).
6070 K.-U. Ulrich et al. / Geochimica et Cosmochimica Acta 73 (2009) 6065–6083
increase from 0.01 to 1.2 lM, and appeared to reach stea-dy-state (Fig. 1f). In comparison, the increase of the effluent[U]diss of the bio-UO2 was more moderate and time-de-layed, reflecting only a small acceleration of the dissolutionrate upon switching from reducing to moderately oxidizingconditions. Effluent samples analyzed by KPA indicatedsmall fractions of dissolved U(VI) on the order of 5–10%of [U]diss, demonstrating that at least part of the biogenicUO2 material was fully oxidized from U(IV) to U(VI).Assuming that the effluent concentrations were at steady-state and the final stage of U-oxidation would be meta-schoepite, the surface area-normalized dissolution rates
and rate constants (k) for the biogenic and chemogenicUO2 materials were of the same order of magnitude andwithin the range of 1–6 � 10�10 mol m�2 s�1 (Table 1). Asalready mentioned in Section 2.5, the rate constants werecalculated from experimentally measured dissolution rates.
Step four of the flow-through UO2 dissolution tested thechange of rate following an increase from a 1% to a 21 vol%PO2 atmosphere in the headspace of a 1 mM DIC feed solu-tion. This change in PO2 was quickly recorded by the DOprobe in the influent, showing 9–10 mg/L as expected(Fig. 1g–i). In response to the higher DO concentration,the proportion of U(VI) in the effluent exceeded 80% of

Table 1Comparison of UO2 dissolution rates obtained from flow-through dissolution in 12.6 mL CFRs under different experimental conditions. Udissolution rates are based on mass (Rm) or surface area (Rn) of UO2 solids assuming steady-state was reached. The rate constant k accountsfor the Gibbs free energy function f(DG), calculated with Eq. (9), Section 2.5. All rates account for the time-dependent loss of material duringUO2 dissolution.
Material [Solid] Flow rate PO2 [DIC] pH Rm Rn f(DG) k Refa
g/L mL/min bar M – mol g�1 s�1 mol m�2 s�1 – mol m�2 s�1
This work, anoxic conditions
Bio6-UO2 1.15 1.42 <10�6 10�3 8.57 8.35 � 10�09 1.64 � 10�10 0.896 1.83 � 10�10
Bio8-UO2 1.60 2.02 <10�6 10�3 8.58 1.52 � 10�09 3.03 � 10�11 0.968 3.13 � 10�11
Syn-UO2 0.79 1.97 <10�6 10�3 8.64 4.86 � 10�11 8.56 � 10�12 0.997 8.58 � 10�12
This work, moderately oxidizing conditions
Bio6-UO2 1.73 1.87 0.01 0 8.58 6.63 � 10�11 1.32 � 10�12 0.836 1.58 � 10�12
Syn-UO2 1.23 1.81 0.01 0 8.51 2.36 � 10�11 3.98 � 10�12 0.920 4.33 � 10�12
Bio6-UO2 1.73 2.01 0.01 10�4 8.22 2.30 � 10�09 4.57 � 10�11 0.915 5.00 � 10�11
Syn-UO2 1.23 1.89 0.01 10�4 8.20 1.16 � 10�09 1.95 � 10�10 0.991 1.97 � 10�10
Bio6-UO2 1.10 1.18 0.01 10�3 8.17 1.19 � 10�08 2.27 � 10�10 0.850 2.67 � 10�10
Bio6-UO2 1.66 1.96 0.01 10�3 8.51 1.47 � 10�08 2.88 � 10�10 0.844 3.42 � 10�10
Bio8-UO2 1.59 1.96 0.01 10�3 7.90 4.67 � 10�09 9.25 � 10�11 0.940 9.83 � 10�11
Syn-UO2 0.79 1.91 0.01 10�3 8.00 3.94 � 10�09 6.62 � 10�10 0.993 6.67 � 10�10
Syn-UO2 1.21 1.98 0.01 10�3 8.58 3.35 � 10�09 5.63 � 10�10 0.979 5.75 � 10�10
Bio6-UO2 1.23 1.19 0.01 10�2 8.79 2.53 � 10�08 4.78 � 10�10 0.989 4.83 � 10�10
Syn-UO2 1.14 1.97 0.01 10�2 8.71 1.50 � 10�09 2.50 � 10�10 0.985 2.54 � 10�10
This work, strongly oxidizing conditions
Bio6-UO2 1.00 1.19 0.21 10�3 8.25 7.43 � 10�08 1.02�10�09 0.407 2.50�10�09
Bio8-UO2 1.56 1.78 0.21 10�3 8.10 5.08 � 10�08 9.06�10�10 0.604 1.50�10�09
Syn-UO2 0.75 1.95 0.21 10�3 8.00 2.97 � 10�08 4.84�10�09 0.908 5.33�10�09
Published data, oxidizing conditions
UO2 pellets 1.0 gb 0.10 0.05 0 8.0 3.89�10�12 1UO2 pellets 1.0 gb 0.10 0.05 0 6.5 4.86�10�12 1UO2 pellets Batch 0.20 0 7.0 1.06�10�11 2Syn-UO2(cr) 0.004-0.08 0.21 10�3 8.0 1.00�10�10 3UO2 pellets unknown 0.21 10�2 8.5 1.60�10�10 4Syn-UO2 0.1 gb 0.10 0.21 0 8.6 8.27�10�12 5Syn-UO2 0.1 gb 0.19 0.21 10�2 8.4 1.60�10�10 5
a References: (1) Casas et al. (1994), (2) Thomas and Till (1984), (3) Pierce et al. (2005), (4) De Pablo et al. (1996), (5) Bruno et al. (1995).Data are from the present work if no reference is given.
b A thin film was used in this work.
Dissolution kinetics of biogenic uraninite 6071
[U]diss. While the steady-state concentration of both bio-genic UO2 materials approached the calculated equilibriumconcentration of metaschoepite, the effluent concentrationfrom chemogenic UO2 dissolution stayed below equilib-rium. Nevertheless, the calculated dissolution rate constantsnormalized to surface area were close to one another, rang-ing from 1.5 to 5.3 � 10�9 mol m�2 s�1 (Table 1). Potentialexplanations for this behavior are discussed below inSection 4.3.
3.2. Effect of carbonate on UO2+x dissolution under
moderately oxidizing conditions
The results shown in the previous section demonstratethat carbonate promotes the dissolution of biogenic UO2
under reducing conditions. Likewise, the dissolution ratesare dependent on [DO], an effect which has been studiedat a constant concentration of 1 mM DIC. The followingexperiment investigated the effect of carbonate on UO2 dis-solution under moderately oxidizing conditions. Whilemaintaining a 1 vol% PO2 headspace in the feed solution,the [DIC] was raised step-wise from zero to 0.1, 1.0, and
10 mM by adding the equivalent amount of NaHCO3. InFig. 2, the effluent [U]diss of bio6-UO2 (Fig. 2a and c) andsyn-UO2 (Fig. 2b and d) are compared for duplicate runsat each condition. In the absence of DIC, the effluent [U]diss
steadily increased without reaching a steady-state within�40 residence times (t/s). Hence, the dissolution processaccelerated with time, and the highest rates recorded fromthis period amount to 1.3 � 10�12 and 4.0 � 10�12 molm�2 s�1 for the biogenic and the chemogenic UO2, respec-tively (Table 1). Upon the addition of 0.1 mM DIC, withthe exception of one bio-UO2 replicate, the effluent [U]diss
yielded a transient peak and quickly approached a pseudosteady-state concentration of 0.5–0.6 lM for syn-UO2 and1.0–1.6 lM for bio-UO2 (Fig. 2a and b). The surfacearea-normalized average dissolution rates were 4.6 �10�11 and 2.0 � 10�10 mol m�2 s�1 for the biogenic andthe chemogenic UO2, demonstrating a dissolution-promot-ing effect of carbonate and a higher dissolution rate con-stant for the chemogenic material.
After increasing the DIC in the feed solution to 1 mM,the effluent [U]diss increased slightly for the chemogenicand considerably for the biogenic UO2, reaching a steady-

0 10 20 30 40 50 60 70 80
w/o DIC 0.1 mM DIC
b
0.1
1
10
100
0 10 20 30 40 50 60 70
[U] ef
f (μM
)
1 mM DIC 10 mM DIC
c0 10 20 30 40 50 60 70 80 90
1 mM DIC 10 mM DIC
d
0.001
0.01
0.1
1
10
0 10 20 30 40 50 60 70 80
[U] e
ff (μ
M)
w/o DIC 0.1 mM DIC
a
Normalized Time (t/τ)
bio6-UO2 syn-UO2
Fig. 2. Flow-through dissolution of bio6-UO2 (a and c) and syn-UO2 (b and d) as a function of DIC concentration in the feed solution,sequentially raised from 0 to 0.1 (a and b) and to 1.0 and 10 mM DIC (c and d); vertical dashed lines indicate the switch of experimentalconditions for each reactor. The feed solution was equilibrated with 1 vol% PO2 and 99 vol% PN2. Symbols represent effluent concentrationsof dissolved U of two replicate reactors as a function of residence times (t/s, with s = 6–10 min). Error bars reflecting one standard deviationof analysis are mostly smaller than the symbol size. The effluent pH was 8.5 ± 0.4. The solid line shows the modeled response to UO2
dissolution with rate constants given in Table 1.
6072 K.-U. Ulrich et al. / Geochimica et Cosmochimica Acta 73 (2009) 6065–6083
state of 1.5 and 7 lM, respectively (Fig. 2c and d). The sur-face area-normalized dissolution rates yielded 2.9 � 10�10
and 5.6 � 10�10 mol m�2 s�1 and thus were consistent withthe rates determined from the aforementioned dissolutionexperiment carried out at the same [DIC] and PO2 condi-tions (Table 1). After further increasing the influent [DIC]to 10 mM, the effluent [U]diss of the bio-UO2 materialshowed another step-increase and leveled off at a highersteady-state concentration compared to the preceding con-dition (Fig. 2c). In contrast, for the syn-UO2 a transient[U]diss peak was followed by a slightly lower steady-state le-vel than during the preceding condition (Fig. 1d). The sur-face area-normalized dissolution rate constants (k) of thebio- and chemogenic UO2 were very close to one another,4.8 � 10�10 and 2.5 � 10�10 mol U m�2 s�1, consistentwith the structural homology of both materials (see Section4.3.).
3.3. Effects of intermittent oxygen or carbonate supply on
UO2+x dissolution
Both carbonate and DO accelerated the dissolution ofthe bio- and chemogenic UO2. To study the reversibilityof each dissolution process individually, the syn-UO2 mate-rial was first reacted under carbonate-free reducing condi-tions and then intermittently treated with either 1 mM
DIC or 1 vol% PO2 before re-establishing the initial condi-tion. After adding 1 mM DIC, the effluent [U]diss linearlyincreased indicating that carbonate gradually made theUO2 surface more susceptible to dissolution (Fig. 3a). Ifthe intrinsic rate of UO2 dissolution was unaffected by car-bonate, the effluent [U]diss would have stayed unchanged asrepresented by the dashed line. In contrast, an instanta-neous increase of the dissolution rate constant would haveresulted in a [U]diss curve as shown by the black line. Whenthe influent was switched back to DIC-free water, however,the effluent [U]diss dropped to the preceding concentrationlevel within five residence times, which is consistent withan immediate relapse of the dissolution rate to the preced-ing value and a washout of excess [U]diss that was consistentwith the behavior of a conservative solute in a CFR as dem-onstrated by the model (black line). This result shows thatthe promoting effect of carbonate on UO2 dissolution wasfully reversible.
After switching from reducing to oxidizing conditions,provided by a 1 vol% PO2 atmosphere in the influent, theeffluent [U]diss increased and approached a steady-state of�1 lM after 14 residence times (Fig. 3b). After reintroduc-ing the anoxic influent, the effluent [U]diss level stayed thesame over the subsequent 20 residence times. This resultshows that the oxidative dissolution process was not imme-diately reversible.

Fig. 4. (a) Uranium L3 edge XANES spectra, (b) k3 weighted EXAFunreacted, stoichiometric UO2.00 (serving as U(IV) reference), syn-UOconditions (1% PO2), syn-UO2 residue after treatment in a SBR under strob and c), U4O9, and crystalline uranyl(VI) nitrate (UO2(NO3)2, plot a).
0.00
0.02
0.04
0.06
0.08
0.10
0.12
0.14
0 10 20 30 40 50
exp. [U] eq
a
0.0001
0.001
0.01
0.1
1
10
0 10 20 30 40 50 60Normalized time (t/τ)
[U] e
ff (μM
)[U
] eff (
μM)
b 1% p O2
1 mM DIC
Fig. 3. Effect of intermittent feed of (a) 1 mM DIC, and (b) 1 vol%PO2 on the flow-through dissolution of syn-UO2 at pH 8.0-8.3 (a) andpH�7.5 (b) under otherwise reducing conditions; vertical dashedlines indicate the switch of experimental conditions. Symbols showthe effluent concentrations of dissolved uranium as a function ofresidence times (s = 12–15 min). Error bars reflecting one standarddeviation of analysis are sometimes smaller than the symbol size. Thesolid line shows the modeled response to a step-function change inUO2 dissolution with rate constants of (a) 1.3 � 10�11, 6.3 � 10�11,and 1.3 � 10�11 mol U m�2 s�1, and (b) 4.2 � 10�13 and1.7 � 10�9 mol U m�2 s�1. If carbonate had no effect, [U]eff shouldfollow the dashed steady-state line. The dotted line visualizes theexperimentally determined equilibrium concentration.
Dissolution kinetics of biogenic uraninite 6073
3.4. XAS and XPS spectroscopic analyses of UO2+x
3.4.1. X-ray absorption spectroscopy
XANES and EXAFS spectra for key samples are shownin Fig. 4 and compared to reference spectra for stoichiom-etric UO2.00 (uncorroded uraninite) as well as UO2.20 andUO2.25 (U4O9) obtained from Conradson et al. (2005,2004). Initial fits to the XANES data were performed usinglinear combinations of stoichiometric UO2.0 and crystallineuranyl nitrate. This model assumes that all higher-valent Uis present in the samples exclusively as UO2
2+, for which theformal uranium oxidation state is +VI and has the specifictransdioxo uranyl cation structure. This model is notappropriate for samples containing UO2+x, where the pre-dominant U site local structure is believed to be more sim-ilar to that in UO2.0, and the oxidation state is likely to varybetween +IV and +V, and possibly even as high as +VI(vide infra). In particular, we note that a UO2/uranylXANES fitting model may not detect even moderate con-centrations of higher-valent uranium such as UV+, particu-larly if it occupies a uranium lattice site in UO2+x, due tothe possible similarity between the XANES for UVI+
and UV+ on the same site. Therefore, in the case whereUO2+x is likely to be important, the most appropriateXANES model spectra are those for UO2.0 and UO2.25
(U4O9), which are likely end-members to be encounteredunder groundwater conditions. XANES fits to all samples,except that from the 21% PO2 SBR experiment, yielded100% UO2 regardless of the XANES model used, implyingthat the average uranium oxidation in the bulk of the sam-ples was +IV within the detection limit of 5–10% UO2.25 oruranyl. Fits to the 21% PO2 SBR sample, believed to beUO2+x (vide infra) yielded 80 ± 10% UO2.25 and the balanceUO2.00 (Fig. 4a), yielding an overall bulk stoichiometry ofUO2.20±0.025.
S spectra and (c) corresponding Fourier transform magnitude of
2 residue after treatment in a CFR under moderately oxidizingngly oxidizing conditions (21% PO2), and standards of UO2.20 (plot
Solid lines represent experimental data, dotted lines show the fits.

6074 K.-U. Ulrich et al. / Geochimica et Cosmochimica Acta 73 (2009) 6065–6083
As shown in Fig. 4, the EXAFS spectra and correspond-ing Fourier transforms for the 1% PO2 CFR sample arequalitatively similar to that of stoichiometric UO2.0. Bothshow characteristic FT peaks for the shell of oxygen neigh-bors at 2.35 A and next-nearest U neighbors at 3.87 A (cor-responding to FT peaks at ca 1.8 and 3.8 A, R + dR,respectively). Some differences are apparent between thespectra. In particular, the relative height of the 3.8 A U-peak is reduced as compared to that of bulk UO2, andthe FT peaks above 5 A (R + dR), which indicate the extentof intermediate-range order in the material, are attenuatedor lost. These observations indicate that, after dissolution,the average uranium environment in the samples has be-come disordered as compared to unreacted UO2.0.
The EXAFS spectrum for the 21% PO2 SBR sample dif-fers considerably from that of UO2.0 and the 1% PO2 CFRsample. In particular, the FT peak corresponding to the2.35 A O-shell is sharply diminished. Moreover, there isno O-peak present at ca 1.5 A (R + dR), which would becharacteristic of uranyl. From these observations it can beconcluded that dissolution in air-equilibrated water resultsin substantial disordering of the local coordination environ-ment around U but without significant accumulation ofuranyl (UO2
2+). If uranyl was present, then it representedless than ca 10% of the total. The specific modification ofthe spectrum observed here is characteristic of conversionof UO2.0 to UO2+x (Conradson et al., 2004). As shown inFig. 4, the 21% PO2 SBR spectrum is similar to that ofUO2.20 (the average composition as determined byXANES) and even more similar to that of U4O9. Theseobservations indicate that dissolution in air-equilibratedwater has resulted in the conversion of UO2.0 to UO2+x,with a composition of the final material between UO2.20
and UO2.25 as suggested by XANES and EXAFScombined.
Conradson et al. (2004) suggested that UO2+x may con-tain small quantities of uranyl (up to ca 15% of total U inUO2.20 and U4O9) as part of a separate phase exsolvedwithin the UO2 matrix. If uranyl were present in this formin the samples, then it would occur at or below the detec-tion limit of the present qualitative EXAFS interpretation.To investigate the presence and role of higher valence statesof uranium, XPS measurements were performed, as de-scribed in the next section.
3.4.2. X-ray photoelectron spectroscopy
The original unreacted syn-UO2 material was analyzedby XPS to determine the near-surface stoichiometry andtest whether the surface was oxidized. Several lines of evi-dence suggest that the surfaces of this material were not oxi-dized within the detection limit of XPS (�5% U(VI) orU(V), Fig. 5a). First, the FWHM values of the primarypeaks (i.e., U4f7/2 at 380.16 eV for C1s at 285.0 eV) areamong the lowest reported in the literature, where theFWHM of U4f7/2 is 1.43 eV. Despite excellent energy reso-lution, the primary peaks are largely symmetrical with nodetectable shoulders or inflection points. The primary peakenvelopes required a second small peak at slightly higherbinding energy to optimize the final fit. Nonetheless, thisslight asymmetry can be attributed to manifest multiplet
splitting, not a second component, as suggested by ab initio
simulations of the U4f XPS spectrum for UO2 (Ilton andBagus, 2008). Second, the spin orbit splitting (10.8 eV),and binding energy separation (6.96 eV) between the satel-lites and their corresponding primary peaks are close to lit-erature values for stoichiometric UO2.00. This lastparameter is a sensitive monitor of non-stoichiometry, aseven minor oxidation can significantly decrease this separa-tion (personal observation, ESI). Further, the satellitestructures (shape, position, and intensity) are also typicalof stoichiometric UO2.00. In particular, there is no indica-tion of the U(V) satellite that appears at about 1.5 eV abovethe U(IV) satellite. Finally, the spectra did not vary evenafter several hours of intense X-ray exposure in the XPS.This is important because U(VI) and U(V) were found tobe reducible under the conditions used (Ilton et al., 2007).
The XPS result of the unreacted syn-UO2 is consistentwith EXAFS spectra, which did not show evidence ofU(VI) based on the detection limit of up to 10%-mass.However, the XPS results of uncleaned original bio8-UO2
and bio6-UO2 materials indicated small but measurableapparent non-stoichiometry (Table 2). Some proportionof this apparent non-stoichiometry might be due to oxi-dized U sorbed to the biomass matrix. If so, this signalwould be amplified relative to the signal originating fromthe nanoparticulate UO2 due to the surface sensitivity ofXPS. Indeed, XANES spectroscopy did not detect any ura-nyl components in the nano-biogenic UO2 (Schofield et al.,2008), although these authors pointed out that non-uranylforms of UV+ and UVI+ could not be ruled out. In contrast,XPS analyses of biogenic UO2 washed with anoxic NaOHsolutions recorded significant increases in the proportionof U(V) at the expense of U(IV) (Table 2). This observationsuggests partial pre-oxidation near the surface of thecleaned bio-UO2 that confounded the concomitant XPSanalysis of the dissolution study. Hence, the dissolutionand transformation of syn-UO2 will be the focus of theremaining spectroscopic results and discussion.
After partial dissolution of the syn-UO2 powder in an-oxic water at near-neutral pH (2 replicates), the surface ofthe residual solid exhibited about 18–21% of U(V) and 7–10% of U(VI), as shown by XPS (Table 2). Similar resultswere found after treatment at pH 2. As there is no signifi-cant difference among these results, a representative spec-trum is shown in Fig. 5b. While maintaining anoxicconditions and treating the material with a 1 mM DIC solu-tion at pH 8.5, the proportion of U(VI) on the surface didnot change significantly. Although the proportion of U(V)diminished to 14%, this difference is not significant either,given the estimated relative uncertainties of ±25–30% and±7% for �0.1–0.2 and �0.7 mole fraction components,respectively. When applying moderately oxidizing condi-tions (1% vol PO2) in the absence of DIC, the proportionsof U(V) and U(VI) on the UO2 surface increased to 28%and 17%, respectively (Fig. 5c). However, XANES spectraof the syn-UO2 residues reacted under reducing (data notshown) and moderately oxidizing conditions (Fig. 4a) con-sistently showed 100% U(IV), ruling out substantial oxida-tion in the bulk of the reacted materials. This iscorroborated by the EXAFS results.

a. b.
d.c.
Binding energy (eV) Binding energy (eV)
U(V) U(IV)
U(V) U(IV)
U(V)U(VI) U(VI)
U4f5/2
U4f7/2
6.96 eV
6.96 eV
U(IV)U(V)U(VI)fit envelopedata
8.3 eV8.3 eV
10 eV3.5 eV
400 394 388 382 376 401 395 389 383 377
U(V)
CFR: Anoxic, pH 7.3
CFR: 1% PO2, pH 7.6 SBR: Air, DIC, pH 8.3
Fig. 5. Deconvolution of four representative XPS spectra of chemogenic UO2+x: Original unreacted UO2.0 material (a) and after partialdissolution in the absence of carbonate in a CFR experiment under anoxic conditions at pH 7.3 (b) and under mildly oxidizing conditions (1%PO2) at pH 7.6 (c). Material from an SBR experiment carried out under strongly oxidizing conditions (air) in 1 mM DIC solution at pH 8.3(d).
Dissolution kinetics of biogenic uraninite 6075
After partial dissolution of the syn-UO2 material in air-equilibrated water (21% vol PO2) containing 1 mM DIC,the XPS-detectable U(VI) fraction increased considerablyto 44% in the CFR setup, and to 68% in the SBR experi-ment (Fig. 5d, Table 2), whereas the U(IV):U(V) ratioswere close to 1 in both experiments. The EXAFS resultsdid not support the presence of the short axial U@O bond(i.e., �1.8 A) typical of uranyl (V or VI), implying that theoxidized U identified by XANES primarily exists on urani-nite lattice sites as charge defects. XPS results for U(V) andU(IV) yield a stoichiometry of U4O9. This conclusion isconsistent with that obtained by XANES and EXAFS ifthe XPS-determined U(VI) component is restricted to thenear-surface and was not measurable by XAS, whereasthe UO2 component (see Section 3.4.1.) is restricted to theparticle core and was not measurable by XPS. Note that be-cause the L-edge position for U(V) can be similar to that forU(VI), the XANES results cannot exclude U(V).
Another salient result that supports the presence of anoutermost oxidized layer that was not detected by XAS isthat the experiments reached saturation with respect tometaschoepite, which is consistent with the XPS-deter-
mined U4f binding energies of the dominant U(VI) compo-nent. Because metaschoepite, or any likely uranyl(VI)precipitate under the experimental conditions, should havethe short uranyl axial bond, it is clear that EXAFS andXANES did not detect this outermost oxidized layer. Thus,as discussed later, the cumulative results are compatiblewith zoned particles consisting of a metaschoepite-like out-er layer, a U4O9 intermediate layer containing 50% U(V)and 50% U(IV), and a UO2.00 core.
The XPS analysis detected a higher proportion ofU(VI) on the surface of UO2 dissolving in the SBR com-pared to the material dissolving in the CFR. This resultlikely reflects the longer reaction time of the SBR experi-ment and the continuous flushing of the reactor for greaterremoval of U(VI) by carbonate in the CFR experiment. Incontrast to the original untreated syn-UO2 material, thenear-surface of all the treated and partially dissolved mate-rials had significant proportions of U(VI) and U(V), whichfurther illustrates the impact of surface oxidation underboth anoxic and oxic conditions and the unexpectedly highstability of a near-surface U(V) component (see Section4.1., below).

Table 2Percentage of U(+IV), U(+V), and U(+VI) as determined by X-ray photoelectron spectroscopy (XPS) on synthetic and biogenic UO2 beforeand after continuous-flow dissolution treatments.
Sample Treatment condition U(+IV) U(+V) U(+VI)
Syn-UO2 Original dry solid 100 0 0Syn-UO2 Anoxic diss, pH 7.30 75 (75) 18 (18) 7 (7)Syn-UO2 Anoxic diss, pH 7.31 71 (69) 20 (21) 9 (10)Syn-UO2 Anoxic diss, pH 2.1 76 (76) 18 (18) 6 (6)Syn-UO2
d Anoxic diss, pH 8.5, 1 mM DIC a79 a14 a7Syn-UO2 Oxic diss, pH 7.6, 1% PO2 56 (55) 28 (28) 16 (17)Syn-UO2 Oxic diss, pH 8.3, 1 mM DIC, Air, CFR 29 (28) 30 (28) 41 (44)Syn-UO2
d Oxic diss, pH 8.3, 1 mM DIC, Air, SBR 17 (16) 17 (16) 66 (68)
Bio6-UO2 Original slurry, dried 88 (87) 0 12 (13)Bio6-UO2 1 M NaOH 49 (48) 45 (49) 6b (3)Bio6-UO2 1 M NaOH, anoxic diss, pH 7.40 39 (37) 40 (41) 21 (22)Bio8-UO2 Original slurry, dried 84c (83) 8c (9) 8c (8)Bio8-UO2 1 M NaOH 52 (50) 36 (36) 12 (14)Bio8-UO2 1 M NaOH, anoxic diss, pH 2.1 69 (67) 22 (23) 9 (10)
Values rounded off to integers. Numbers in parentheses are extrapolated time 0 values, unless otherwise noted.a Sequential analyses not performed.b Unexplained unusual behavior.c Average value, no discernable reduction trend.d Material of different production batch.
6076 K.-U. Ulrich et al. / Geochimica et Cosmochimica Acta 73 (2009) 6065–6083
4. DISCUSSION
4.1. Mechanistic model for aqueous UO2+x dissolution
Among the potential physicochemical parameters con-trolling uraninite dissolution in groundwater (e.g., H+, oxi-dants, ligands, temperature), oxygen and carbonate are themost important variables under natural pH conditions.Extensive information is available on the corrosion of spentfuel and synthetic UO2(s) as a function of oxygen and car-bonate concentrations (for review see Shoesmith (2000)).According to the literature, the dissolution process can bedescribed by a three-step mechanism, (a) coordination ofoxygen to the U(IV) surface followed by direct electrontransfer (redox reaction), (b) surface coordination of car-bonate to U(VI), and (c) detachment of a U(VI)-CO3(aq)
species (Bruno et al., 1995; De Pablo et al., 1999). At lowPO2, uraninite dissolution is controlled by sorption of oxy-gen to the surface and thus is expected to be independent ofthe carbonate concentration. At high PO2, carbonate coor-dination with U(VI) and complex detachment are expectedto be rate-limiting until the [DIC] exceeds the concentrationof surface bound U(VI). Both effects are reported in the lit-erature and were consistently predicted using the generalreaction model by De Pablo et al. (1999).
The present study indicates higher complexity of theUO2+x dissolution processes. Dependent on the chemicalconditions, the oxidative dissolution of UO2 particles caninvolve an intermediate U(V) species and lead to the forma-tion of surface layers with distinct hyperstoichiometryincluding UO2.25 (U4O9). In synthesizing our experimentaland spectroscopic results, we propose a slightly modifiedconcept of the aqueous UO2(s) dissolution, the key stepsof which are illustrated in Fig. 6 for reducing (Fig. 6A–C)and oxidizing conditions (Fig. 6D–F) regardless of the ori-gin of the material (biogenic or chemogenic UO2+x).
4.1.1. Reducing conditions (no DIC)
The original chemogenic UO2.0 exhibited U(IV) both inthe bulk and on the particle surface, as shown by XAS andXPS analyses. Furthermore, KPA analysis excluded dis-solved U(VI) in the effluent based on a detection limit of4.2 � 10�10 M. Although the oxidation state remains uncer-tain for a fraction of 10–15% of the dissolved uranium, theICP-MS results suggest a predominance of U(IV)aq. Hence,the main dissolution reaction for materials in contact withanoxic water at near-neutral pH is U(IV) hydrolysis (Eq.(7)), a conclusion that is consistent with the proton-pro-moted mechanism driving UO2+x dissolution under acidicconditions (Ulrich et al., 2008).
Despite the lack of detectable U(VI) in solution, XPS re-corded 7–10% U(VI) and �20% U(V) near the syn-UO2
surface after being suspended in anoxic, DIC-free water(Fig. 5b). The occurrence of U(V) and trace amounts ofU(VI) on the chemogenic UO2 suggests partial surface oxi-dation even under the reducing conditions in the experi-ments. The presence of U(V) on UO2 is of particularinterest because, to the best of our knowledge, it has notbeen reported in previous laboratory-based corrosion stud-ies of synthetic UO2(s). However, a series of papers on theanodic dissolution of SIMFUEL (uranium dioxide dopedwith trivalent rare earth elements to increase the electronicconductivity), where the surface state of the UO2 electrodewas monitored with XPS, have reported U(V) for a widerange of solution compositions and applied potentials (San-tos et al., 2004, 2006). This raises the possibility thatdesorption of surface bound U(V) could be contributingto the U concentrations determined by ICP-MS; anyU(V)aq present at such low concentrations might be stablewith respect to disproportionation. It further raises the pos-sibility that UO2(s) solubility in water might be affected byU(V)aq resulting from surface oxidation of U(IV) under an-oxic conditions.

D. UV accumulates and forms a U4O9
surface layer
UO2.0e
Ox Red
A. Single e transfer rapid at lowest [Ox] (H2O2 / O2 from α-
radiolysis of H2O; H+)
UVI
F. If Rox faster than Rdiss, UVI mineral coating may control U dissolution
B. UV may dispropor-tionate; UVI desorbs
faster than UV
x CO32
[UO2(CO )3]5¯
¯
¯
¯
¯
¯
[UO2(CO )x]-2x+2
C. Carbonate strips UVI and possibly UV
from surface
UO3·2H2O
Strongly oxidizing
Anoxic / reducing UVI
UV
2H+ + ½O2 H O
2e
Mildly oxidizing
?UO2.0
U4O9
E. 2-step e transfer favorable; fast oxidation
triggers UVI accumulation
UVI
D. UV accumulates and forms a U4O9
surface layer
UO2.0e
Ox Red
A. Single e transfer rapid at lowest [Ox] (H2O2 / O2 from α-
radiolysis of H2O; H+)
UVIUVI
F. If Rox faster than Rdiss, UVI mineral coating may control U dissolution
B. UV may dispropor-tionate; UVI desorbs
faster than UV
x CO
2(CO3)3]5
2 3)x]-2x+2
C. Carbonate strips UVI and possibly UV
from surface
UO3·2H2O
Strongly oxidizing
Anoxic / reducing UVI
UV
+ 2 2
2e
Mildly oxidizing
?UO2.0
U4O9
E. 2-step e transfer favorable; fast oxidation
triggers UVI accumulation
UVI
2H
Fig. 6. Conceptual model of mechanisms of UO2 dissolution. Balls and pentagons represent particles and ions attached to the surface,respectively. Details are explained in the text.
Dissolution kinetics of biogenic uraninite 6077
4.1.2. Origin of oxidants under reducing conditions
Water and its dissociation and radiolysis products canact as oxidants of UO2. For natural uranium, water radiol-ysis is mainly caused by alpha radiation from 238U and 234U(each �49% of activity). While the most important oxidantsare H2O2 and O2, H+, HO2
� and free radicals can also berelevant (Clarens et al., 2005; Eriksen et al., 1995). A com-prehensive list of reaction pathways and products is givenelsewhere (Christensen, 1998; Christensen et al., 1994).
The yield of a-radiolytic H2O2 generated in a CFRloaded with nanoparticulate 238UO2 can be estimated fromthe specific activity of the isotope 238U (12,445 Bq/g).Assuming that there is no attenuation of a-radiation withinsubmicron particles, the radiation dose will be independentof the surface area. Given the alpha activity of 1 g of238UO2 (6.58 � 105 dpm, disintegrations per minute), thealpha particle energy of 5.5 � 106 eV and a product yieldof 0.00985 H2O2 molecules per eV in neutral water (Eriksenet al., 1995), and assuming a 40 lm radius for the energyrange of an emitted alpha particle in water (Kubatkoet al., 2003) as well as conservative behavior for H2O2 (nei-ther decay nor consumption), the H2O2 concentration inthe CFR at steady-state can be calculated. Using a UO2(s)
concentration of 1 g/L and integrating the a-activity overa residence time of 6 min, the H2O2 concentration wouldreach 3.55 � 10�13 M. Because this concentration is toolow to account for the oxidation of a surface monolayeron uraninite under the experimental conditions, other oxi-dants are likely involved, for instance H2O. In addition,O2 can result from the decomposition of peroxide, thereduction of which was shown to be catalyzed by the forma-tion of a thin surface layer of a mixed U(IV)/U(V) oxide
(UO2+x) until surface adsorbed U(VI) species begin to form(Goldik et al., 2004).
4.1.3. Surface oxidation under reducing conditions
Even if the concentrations of potential oxidants such asH2O2, O2 or H+ are extremely low, each molecule comingclose to the UO2 surface may transfer electrons to aU(IV) site. Thus, over time, the surface can become moreand more oxidized. Interestingly, the XPS data consistentlyshowed U(V) at a higher percentage than U(VI) on the an-oxic syn-UO2 surface. This is consistent with an oxidationmechanism that involves a relatively fast single electrontransfer reaction to form U(V) (Eq. (10), Fig. 6A) followedby a slower second electron transfer to form U(VI) (Eq.(11), Fig. 6D).
UO2 þH2O! ðUVO2OHÞads þHþ þ e�ðaqÞ ð10Þ
½ðUVO2OHÞ�ads þH2O! ½UVIO2ðOHÞ2�ads þHþ þ e�ðaqÞ
ð11Þ
A similar oxidation mechanism was suggested for theanodic dissolution of SIMFUEL (Santos et al., 2004,2006) based on the apparent coincident prominence ofU(V) and OH� in their XPS spectra, prompting the authorsto hypothesize that an intermediate U(V) species was stabi-lized on the UO2 surface in a hydrolyzed form (Eq. (10)).
Disproportionation of U(V) is another potential reac-tion pathway (Eq. (12)) that can limit the accumulationof U(V) and explain the occurrence of U(VI) on theUO2+x surface under reducing conditions (Fig. 6B).
2ðUVO2OHÞads ! UIVO2 þ ½UVIO2ðOHÞ2�ads ð12Þ

6078 K.-U. Ulrich et al. / Geochimica et Cosmochimica Acta 73 (2009) 6065–6083
Depending on the concentration of U(V)aq in solution,rapid disproportionation of U(V) at the pH of the experi-ments would be expected. However, there is no firm evi-dence that sorbed U(V) is unstable with respect todisproportionation. Although this stability may dependon the substrate to which U(V) is sorbed, evidence frommica surfaces suggests that sorbed U(V) does not readilydisproportionate (Ilton et al., 2005). Consequently, themost likely reaction pathway is sequential oxidation ofU(IV) to U(V) to U(VI).
4.1.4. Effects of carbonate under reducing conditions
The continuous partial oxidation of the UO2+x surfaceunder reducing conditions is also illustrated by the way car-bonate affects uranium release. According to thermody-namic data (Guillaumont et al., 2003) carbonate is a weakcomplexant for U(IV) and thus should not enhanceUO2+x dissolution under strictly reducing conditions andat the carbonate and pH levels of the experiments. How-ever, our results showed that carbonate accelerated UO2
dissolution. Carbonate is known as a strong complexantfor actinyl ions. Its presence in a UO2(s) – H2O systemcan accelerate the detachment of U(VI) from the UO2+x
surface once U(VI) has been formed, thus promotingU(IV) oxidation. Although U(V)-carbonate species are lessstable than U(VI)-carbonate complexes (Guillaumont et al.,2003), they may act in a similar way and promote the oxi-dation of U(IV) to U(V) by facilitating the detachment ofU(V) from the UO2+x surface (Fig. 6C). Eq. (13) gives anexample of such a surface reaction based on the aqueousU(V)-carbonate species [UO2(CO3)3]5� that has been re-solved by means of XAS (Docrat et al., 1999).
½UVO2ðOHÞ�ads þ 3CO32� ! ½UO2ðCO3Þ3�
5� þOH� ð13Þ
If in an anoxic flow-through system the carbonate-pro-moted rate of U(V) and U(VI) detachment from theUO2+x surface is faster than the rate of U(IV) oxidation,then the introduction of carbonate should produce an ini-tial [U]diss peak as the accumulated U(V) and U(VI) is re-moved. The peak would be followed by a continuousdecline of [U]diss to a new steady-state level. This trendwas observed for the syn-UO2 when treated with anoxic1 mM DIC solution (Fig. 2c). In the anoxic flow-throughexperiment in which carbonate was intermittently supplied,the effluent [U]diss increased while carbonate was present,but rapidly returned to the initial steady-state concentra-tion after the initial conditions were re-established(Fig. 3A). These results illustrate that carbonate did notchange the intrinsic oxidation kinetics of UO2 (because itis not an oxidant), but rather it affected the detachment rateof U(IV) oxidation products from the UO2+x surface.
4.1.5. Oxidizing conditions
The dissolution experiments and concomitant spectro-scopic investigations showed a clear response to the in-crease in oxidant concentration. Even at a DOconcentration as low as 0.4–0.6 mg/L (maintained by aPO2 of 0.01 bar in the headspace of the feed solution vessel),the fraction of U(V) and U(VI) near the UO2 surface in-creased to 28% and 17% of total U (Table 2). Similarly,
the KPA detected dissolved U(VI) in the effluent, but thisfraction represented only 5–10% of the effluent [U]diss. Be-cause the concentration of the remaining 90–95% of [U]diss
far exceeded the expected equilibrium concentration ofU(IV)aq, the KPA analyses suggest the presence of anotheruranium component in solution, likely U(V)aq. Even stron-ger changes occurred when the [DO] was raised to �9 mg/Lin equilibrium with air. The proportion of near-surfaceU(VI) increased to 44% at the expense of U(IV) (Table2), and U(VI) became the predominant fraction of the efflu-ent [U]diss at about 80%. The dissolution rates of syn-UO2
increased by a factor of �10 (from 6 � 10�10 to5 � 10�9 mol m�2 s�1) when switching from 1% to 21%PO2 (Table 1). Because the DIC concentration was keptconstant, the increase in dissolution rate reflects the ex-pected strong dependency of the oxidation rate on the oxi-dant concentration.
When the supply of DO was stopped in the intermittentDO dissolution study (Fig. 3B), the effluent [U]diss did notdecline. Rather, the steady-state concentration remainedunchanged for about 20 residence times, although the feedsolution in this intermittent experiment never contained anycarbonate. This result suggests that the detachment ofU(VI) and possibly U(V) was rate-limiting while DO wassupplied in the absence of carbonate, leading to an accumu-lation of oxidized U near the UO2+x surface (Fig. 6F). Thisobservation is consistent with literature describing adecreasing hyperstoichiometry of the syn-UO2 surface withincreasing carbonate concentration under oxidizing condi-tions. While higher stoichiometric ratios of O:U were re-ported in the absence of bicarbonate (x = 0.35–0.38,Bruno et al. (1995), de Pablo et al. (1996)), treatment with0.1 and 1.0 mM DIC solution yielded x = 0.20 (Gimenezet al., 2005), and an even lower value of x = 0.05 was foundafter the treatment of syn-UO2 with a 10 mM DIC solution(De Pablo et al., 1996; Gimenez et al., 2005). Gimenez et al.(2005) concluded in their study that the non-stoichiometrywas not due to deposition of a secondary solid phase. Tor-rero et al. (1997) determined an average solid surface stoi-chiometry of UO2.25 at pH 8.2 as opposed to UO2.0 atpH 5 and explained this difference by a diminishing rateof proton-promoted dissolution with increasing pH, en-abling the incorporation of O2� species into the UO2 lattice.Thus, in the absence of more soluble aqueous U-carbonatespecies at neutral and alkaline conditions, the oxidative dis-solution of UO2+x will be controlled by the detachment ofU(VI) and U(V) from the UO2+x surface.
The highest U(VI) fraction on a syn-UO2 surface (68%of total U) was determined by XPS in a SBR-based disso-lution experiment in which syn-UO2 was exposed to a1 mM DIC solution open to air atmosphere. For this mate-rial, as outlined previously, the combined results ofXANES, EXAFS and XPS suggest layered zones. AU(VI)-rich outer layer in which the binding energy is con-sistent with uranyl(VI) was identified by surface-sensitiveXPS but not by XANES or EXAFS, a U4O9 middle layercontaining U(IV) and U(V) for which both XPS andXANES are sensitive, and a core composed of UO2.00 thatis accessible to XANES but not to XPS (Fig. 6F). The lackof the transdioxo bonding structure as evidenced by EX-
Dissolution kinetics of biogenic uraninite 6079
AFS suggests that U(V) must not be present as the UO2+
cation and therefore we speculate that it can occupy UO2
lattice sites as defects. Previous investigations have con-cluded that U4O9 contains both U(IV) and U(V) (Allenand Holmes, 1993). The clear evidence for U6+ from XPSon the other hand strongly supports the concept of a sur-face coating distinct from U4O9, consistent with a mineralphase like metaschoepite. The possibility that U(V) is incor-porated at lattice sites, most likely within the U4O9 middlelayer, might explain the surprisingly high stability of U(V)near the particle surface.
In conclusion, it is sufficient that all the XPS spectra arebest fit with three components that are derived from well-characterized U(IV), U(V), and U(VI) standards and thatthese components maintain their separate and independentidentities over a wide range of average oxidation states.Further investigation is needed to understand the forma-tion and evolution of the proposed multi-layer oxidationstructure.
4.2. Carbonate-promoted UO2+x oxidation
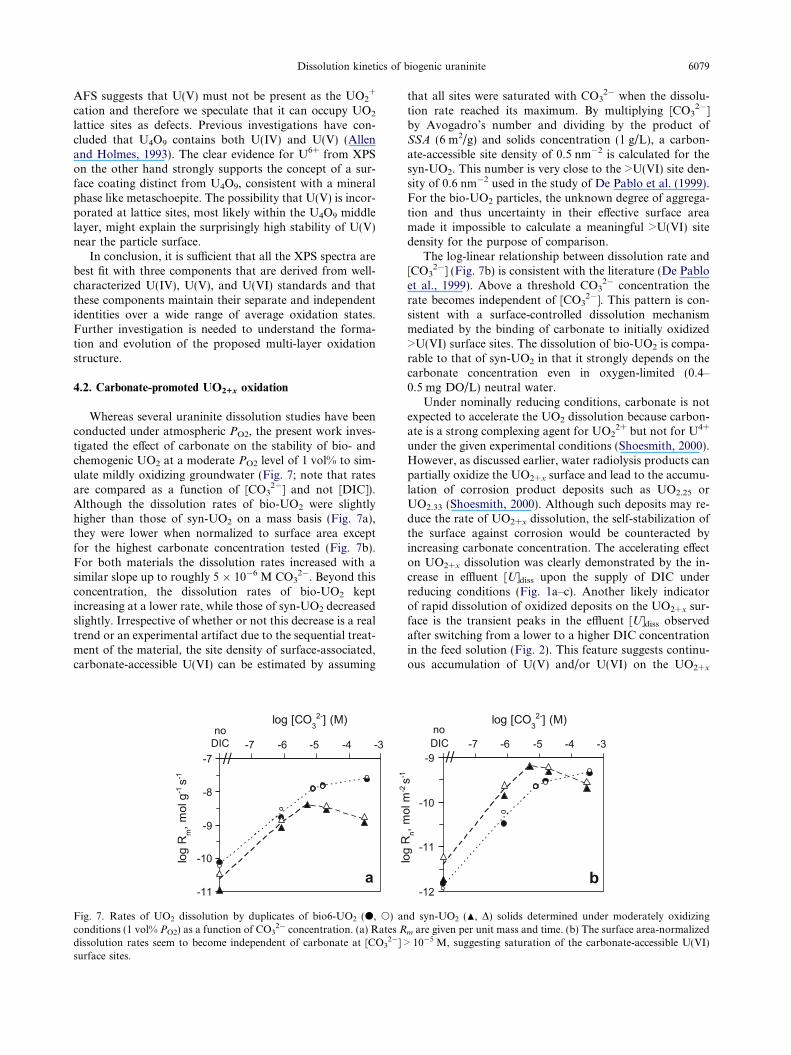
Whereas several uraninite dissolution studies have beenconducted under atmospheric PO2, the present work inves-tigated the effect of carbonate on the stability of bio- andchemogenic UO2 at a moderate PO2 level of 1 vol% to sim-ulate mildly oxidizing groundwater (Fig. 7; note that ratesare compared as a function of [CO3
2�] and not [DIC]).Although the dissolution rates of bio-UO2 were slightlyhigher than those of syn-UO2 on a mass basis (Fig. 7a),they were lower when normalized to surface area exceptfor the highest carbonate concentration tested (Fig. 7b).For both materials the dissolution rates increased with asimilar slope up to roughly 5 � 10�6 M CO3
2�. Beyond thisconcentration, the dissolution rates of bio-UO2 keptincreasing at a lower rate, while those of syn-UO2 decreasedslightly. Irrespective of whether or not this decrease is a realtrend or an experimental artifact due to the sequential treat-ment of the material, the site density of surface-associated,carbonate-accessible U(VI) can be estimated by assuming
-7 -6 -5 -4 -3DIC
-11
-10
-9
-8
-7
log [CO32-] (M)
log
Rm, m
ol g
-1 s-1
no
a
//
Fig. 7. Rates of UO2 dissolution by duplicates of bio6-UO2 (d, s) aconditions (1 vol% PO2) as a function of CO3
2� concentration. (a) Rates R
dissolution rates seem to become independent of carbonate at [CO32�]
surface sites.
that all sites were saturated with CO32� when the dissolu-
tion rate reached its maximum. By multiplying [CO32�]
by Avogadro’s number and dividing by the product ofSSA (6 m2/g) and solids concentration (1 g/L), a carbon-ate-accessible site density of 0.5 nm�2 is calculated for thesyn-UO2. This number is very close to the >U(VI) site den-sity of 0.6 nm�2 used in the study of De Pablo et al. (1999).For the bio-UO2 particles, the unknown degree of aggrega-tion and thus uncertainty in their effective surface areamade it impossible to calculate a meaningful >U(VI) sitedensity for the purpose of comparison.
The log-linear relationship between dissolution rate and[CO3
2�] (Fig. 7b) is consistent with the literature (De Pabloet al., 1999). Above a threshold CO3
2� concentration therate becomes independent of [CO3
2�]. This pattern is con-sistent with a surface-controlled dissolution mechanismmediated by the binding of carbonate to initially oxidized>U(VI) surface sites. The dissolution of bio-UO2 is compa-rable to that of syn-UO2 in that it strongly depends on thecarbonate concentration even in oxygen-limited (0.4–0.5 mg DO/L) neutral water.
Under nominally reducing conditions, carbonate is notexpected to accelerate the UO2 dissolution because carbon-ate is a strong complexing agent for UO2
2+ but not for U4+
under the given experimental conditions (Shoesmith, 2000).However, as discussed earlier, water radiolysis products canpartially oxidize the UO2+x surface and lead to the accumu-lation of corrosion product deposits such as UO2.25 orUO2.33 (Shoesmith, 2000). Although such deposits may re-duce the rate of UO2+x dissolution, the self-stabilization ofthe surface against corrosion would be counteracted byincreasing carbonate concentration. The accelerating effecton UO2+x dissolution was clearly demonstrated by the in-crease in effluent [U]diss upon the supply of DIC underreducing conditions (Fig. 1a–c). Another likely indicatorof rapid dissolution of oxidized deposits on the UO2+x sur-face is the transient peaks in the effluent [U]diss observedafter switching from a lower to a higher DIC concentrationin the feed solution (Fig. 2). This feature suggests continu-ous accumulation of U(V) and/or U(VI) on the UO2+x
-12
-11
-10
-9-7 -6 -5 -4 -3
no DIC
b
//
log [CO32-] (M)
log
Rn,
mol
m-2
s-1
nd syn-UO2 (N, D) solids determined under moderately oxidizing
m are given per unit mass and time. (b) The surface area-normalized> 10�5 M, suggesting saturation of the carbonate-accessible U(VI)

6080 K.-U. Ulrich et al. / Geochimica et Cosmochimica Acta 73 (2009) 6065–6083
surface even during steady-state flow conditions and a fastdesorption reaction when providing higher carbonateconcentrations.
The average dissolution rates of syn-UO2 from thisstudy can be compared with previously published data.The rate obtained under a 1 vol% PO2 atmosphere at0.1 mM DIC and pH 8.2 (2.0 � 10�10 mol m�2 s�1) wassimilar to numbers reported for higher DIC concentrationsand in the presence of air (Table 1). For example, Pierceet al. (2005) measured a rate of 1.0 � 10�10 mol m�2 s�1
for the dissolution of crystalline UO2 at 10�3 M DIC andpH 8.0. A rate of 1.6 � 10�10 mol m�2 s�1 was obtainedwhen dissolving syn-UO2 at 10�2 M DIC and pH 8.5 (Bru-no et al., 1995; De Pablo et al., 1996). In contrast, the dis-solution rate of syn-UO2 determined in the present studyunder atmospheric conditions, 1 mM DIC and pH 8.0(4.8 � 10�9 mol m�2 s�1) was 48-times higher than the ratepublished for similar conditions (Pierce et al., 2005). Thisdiscrepancy can be due to the higher flow rate and thesequential treatment of the UO2+x material used in ourstudy.
In natural groundwater, divalent earth alkali cationssuch as Ca2+ and Mg2+ are common constituents thatcan form very stable aqueous complexes with uranyl car-bonate (Dong and Brooks, 2006). Hence, such speciesmay accelerate UO2 dissolution in a similar manner to car-bonate alone, by accelerating the detachment of surface-associated oxidized uranium species. Divalent cations mayalso interact with U(V) carbonato complexes, but it is un-known whether such species would favor enhanced dissolu-tion or potentially stabilize the U4O9 surface layer.
4.3. Comparison of bio-UO2 and syn-UO2 dissolution
The cleaned biogenic and the chemogenic uraninite sol-ids exhibited similar dissolution trends and comparablerates under the experimental conditions, with one excep-tion. Although the steady-state concentrations of dissolveduranium were generally higher for the bio-UO2 comparedto the syn-UO2 (Figs. 1 and 2), the dissolution rates gener-ally agreed within a factor 2–4 when normalized to theBET surface area (Table 1). Given the complexity of thedissolution experiments and the number of variables thatadd uncertainty to the systems (e.g., mass and homogeneityof the initial solids, analytical uncertainties, variationamong replicates), differences in rates within a factor of 4are not likely to be significant. Based on this result, withinthe margin of experimental uncertainty, the tested biogenicand synthetic UO2 materials exhibited similar reactivitywith respect to oxidative and carbonate-promoted dissolu-tion, where the detachment of U(VI) and probably U(V) isthe dissolution rate-limiting step. This similarity in reactiv-ity of the two size fractions (�3 nm and 100–200 nm parti-cles) implies that the principal surface reactions, at least therates of oxidation and dissolution, are comparable. This inturn suggests similar types and densities of reactive surfacesites und thus surface free energy. A similar conclusion wasobtained with regard to Zn(II) sorption on biogenic,nanoparticulate UO2 and bulk uraninite (Singer et al.,2009).
The exception to the trend of similar reactivity for thebiogenic and chemogenic uraninites in the present study isthe observation made under reducing conditions in thepresence of carbonate, where the dissolution rate of bio6-UO2 was about 20-times higher than that of syn-UO2
(Table 1), indicating that carbonate-promoted the UO2 dis-solution more for the biogenic nanoparticles than for thechemogenic material. A plausible cause is the higher initialsurface oxidation after pretreatment, in particular the accu-mulation of U(V) and U(VI) near the surface which maygive rise to faster detachment of the oxidized uranium spe-cies. At the high pH during the NaOH treatment of the bio-genic UO2, surface oxidation can be more favorable due tohigher activity of water radiolysis products and/or fasteroxidation kinetics. Through protolysis of H2O2 the per-hydroxy anion HO2
� can form and act as an oxidant anda precursor of a chain of radicals that produce an evenstronger oxidizing environment (Clarens et al., 2005). Toverify the impact of the NaOH treatment, the reactivityof uncleaned bio-UO2 material has to be determined. Thepresence of organic matter, in particular when associatedwith the bio-UO2 surface, may lower the UO2 reactivityand preserve the material against oxidative dissolution(Singer et al., 2009).
5. CONCLUSIONS
The long-term stability of biogenic uraninite is a seminalfactor governing the success of bioremediation of uranium-contaminated sites. The stability of nanoparticulate UO2+x
will depend on structural properties that determine surfacereactivity and on physicochemical factors that control sur-face reactions. Building on the recently described structuralhomology of biogenic nanoparticulate UO2 obtained fromS. oneidensis MR-1 and chemogenic UO2.00, the goal of thisstudy was to compare both materials with respect to theirintrinsic solubility and dissolution kinetics under a varietyof geochemical conditions and to investigate the dissolutionmechanisms by bulk XAS and surface-sensitive XPS. Thefollowing conclusions are relevant to uranium geochemistryand bioremediation.
1. The thermodynamic solubility data accepted for so-called amorphous UO2(s) are suitable in predicting theintrinsic solubility of undoped biogenic UO2+x nanopar-ticles in near-neutral water under anoxic conditions.
2. Within the margin of experimental uncertainty and whennormalized to surface area, dissolution rates of bio- andchemogenic UO2+x were similar under carbonate-freereducing and oxidizing conditions, respectively. Thissimilarity enables the modeling of the thermodynamicand kinetic properties of undoped biogenic UO2+x nano-particles based on those known for chemogenic UO2.00.
3. In near-neutral water, dissolved inorganic carbon, whichis an ubiquitous groundwater component, reversiblypromotes the dissolution of UO2+x not only understrongly oxidizing conditions by forming highly solubleU(VI)-carbonate complexes, but also under nominallyreducing conditions, where water and its radiolysis prod-ucts (e.g., H2O2, O2, and radicals) can serve as oxidants.

Dissolution kinetics of biogenic uraninite 6081
This study has shown that intermediate U(V) species canaccumulate on the UO2+x surface. Formation of solubleU(V)-carbonate complexes is a likely driving force forpromoting UO2+x dissolution under anoxic conditions.
4. The mechanism of UO2 oxidation appears to be morecomplex than usually assumed. Spectroscopic and ana-lytical data from XPS, XANES, EXAFS, and KPAcombined with experimental results from the carbonatetreatment of dissolving UO2.0 support the formation ofa near-surface layer with an approximate UO2.25 stoichi-ometry, characterized by a 1:1 ratio of U(IV) to U(V).Whereas low oxidant concentrations lead to an interme-diate surface U(V) species, the sequential electron trans-fer from U(IV) to U(V) to U(VI) becomes favorableunder strongly oxidizing conditions.
5. At the most oxidizing conditions studied the detachmentof surface U(VI) appears to be rate-limiting in theabsence and presence of carbonate up to a thresholdconcentration above which all accessible U(VI) sitesare saturated with carbonate. The accumulated U(VI)can evolve to a metaschoepite-like coating on theUO2+x surface layer, passivating the UO2.0 core by con-trolling the uranium solubility and dissolution kinetics.Future studies should quantify the oxidative dissolutionprocess of layered nano-scale UO2+x materials in thefield and explore the environmental significance of natu-ral dopants and U(V) intermediate species.
ACKNOWLEDGMENTS
We thank Dan Schwarz and David Clark for providing syn-thetic UO2.00 material and Satya Chinni for running samples onthe KPA. We are grateful to Sabine Ulrich, Edgar Leslie, and ScottDixon for their assistance in the laboratory. We appreciate helpfuldiscussions with Steven Conradson. We thank the Associate Edi-tor, Dr. Zhu, and two anonymous reviewers who helped improvean earlier draft of this manuscript. Funding was provided by theU.S. Department of Energy, Office of Basic Energy Sciences grant# DE-FG02-06ER64227, through the linked Grants 1027869(SSRL), 1027833 (EPFL), and 1027834 (WU). Part of this researchwas carried out at the Stanford Synchrotron Radiation Light-source, a national user facility operated by Stanford Universityon behalf of the U.S. DOE-OBER. Portions of this project weresupported by the DOE-BER-funded SSRL Environmental Reme-diation Science Program and the DOE-BER and NIH-NCRR-funded SSRL Structural Molecular Biology Program. Work car-ried out at EPFL was funded in part by the Swiss NSF Grant#20021-113784.
REFERENCES
Abdelouas A., Lutze W. and Nuttall H. E. (1999) Oxidativedissolution of uraninite precipitated on Navajo sandstone. J.
Cont. Hydrol. 36(3–4), 353–375.
Allen G. C. and Holmes N. R. (1993) Mixed-valency behavior insome uranium-oxides studies by x-ray photoelectron spectros-copy. Can. J. Appl. Spectrosc. 38(5), 124–130.
Belai N., Frisch M., Ilton E. S., Ravel B. and Cahill C. L. (2008)Pentavalent uranium oxide via reduction of [UO2]2+ underhydrothermal reaction conditions. Inorg. Chem. 47(21), 10135–
10140.
Brooks S. C., Fredrickson J. K., Carroll S. L., Kennedy D. W.,Zachara J. M., Plymale A. E., Kelly S. D., Kemner K. M. andFendorf S. (2003) Inhibition of bacterial U(VI) reduction bycalcium. Environ. Sci. Technol. 37(9), 1850–1858.
Bruno J., Casas I., Cera E., De Pablo J., Gimenez J. and TorreroM. E. (1995) Uranium (IV) dioxide and SIMFUEL as chemicalanalogues of nuclear spent fuel matrix dissolution. A compar-ison of dissolution results in a standard NaCl/NaHCO3
solution. Scientific Basis for Nuclear Waste Management XVII.
Symposium, vol. 1. pp. 601–608.Burgos W. D., McDonough J. T., Senko J. M., Zhang G. X.,
Dohnalkova A. C., Kelly S. D., Gorby Y. and Kemner K. M.(2008) Characterization of uraninite nanoparticles produced byShewanella oneidensis MR-1. Geochim. Cosmochim. Acta
72(20), 4901–4915.
Casas I., Gimenez J., Marti V., Torrero M. E. and Depablo J.(1994) Kinetic studies of unirradiated UO2 dissolution underoxidizing conditions in batch and flow experiments. Radiochim.
Acta 66–67, 23–27.
Chinni S., Anderson C., Ulrich K.-U., Giammar D. E. and Tebo B.M. (2008) Indirect UO2 oxidation by Mn(II)-oxidizing spores ofBacillus sp. strain SG-1 and the effect of U and Mn concen-trations. Environ. Sci. Technol. 42(23), 8709–8714.
Christensen H. (1998) Calculations simulating spent-fuel leachingexperiments. Nucl. Technol. 124(2), 165–174.
Christensen H., Sunder S. and Shoesmith D. W. (1994) Oxidationof nuclear fuel (UO2) by the products of water radiolysis:development of a kinetic model. J. Alloys Comp. 213(214), 93–
99.
Clarens F., de Pablo J., Casas I., Gimenez J., Rovira M., Merino J.,Cera E., Bruno J., Quinones J. and Martinez-Esparza A. (2005)The oxidative dissolution of unirradiated UO2 by hydrogenperoxide as a function of pH. J. Nucl. Mater. 345(2–3), 225–
231.
Conradson S. D., Begg B. D., Clark D. L., den Auwer C., Ding M.,Dorhout P. K., Espinosa-Faller F. J., Gordon P. L., Haire R.G., Hess N. J., Hess R. F., Keogh D. W., Lander G. H.,Manara D., Morales L. A., Neu M. P., Paviet-Hartmann P.,Rebizant J., Rondinella V. V., Runde W., Tait C. D., Veirs D.K., Villella P. M. and Wastin F. (2005) Charge distribution andlocal structure and speciation in the UO2+x and PuO2+x binaryoxides for x 6 0.25. J. Solid State Chem. 178(2), 521–535.
Conradson S. D., Manara D., Wastin F., Clark D. L., Lander G.H., Morales L. A., Rebizant J. and Rondinella V. V. (2004)Local structure and charge distribution in the UO2–U4O9
system. Inorg. Chem. 43(22), 6922–6935.
de Pablo J., Casas I., Gimenez J., Marti V. and Torrero M. E.(1996) Solid surface evolution model to predict uraniumrelease from unirradiated UO2 and nuclear spent fueldissolution under oxidizing conditions. J. Nucl. Mater.
232(2–3), 138–145.
de Pablo J., Casas I., Gimenez J., Molera M., Rovira M., Duro L.and Bruno J. (1999) The oxidative dissolution mechanism ofuranium dioxide. I. The effect of temperature in hydrogencarbonate medium. Geochim. Cosmochim. Acta 63(19/20),
3097–3103.
Docrat T. I., Mosselmans J. F. W., Charnock J. M., Whiteley M.W., Collison D., Livens F. R., Jones C. and Edmiston M. J.(1999) X-ray absorption spectroscopy of tricarbonatodioxour-anate(V), [UO2(CO3)3]5�, in aqueous solution. Inorg. Chem.
38(8), 1879–1882.
Dong W. M. and Brooks S. C. (2006) Determination of theformation constants of ternary complexes of uranyl andcarbonate with alkaline earth metals (Mg2+, Ca2+, Sr2+, andBa2+) using anion exchange method. Environ. Sci. Technol.
40(15), 4689–4695.

6082 K.-U. Ulrich et al. / Geochimica et Cosmochimica Acta 73 (2009) 6065–6083
Eriksen T. E., Eklund U. B., Werme L. and Bruno J. (1995)Dissolution of irradiated fuel: a radiolytic mass balance study.J. Nucl. Mater. 227(1–2), 76–82.
Finch R. J. and Ewing R. C. (1992) The corrosion of uraniniteunder oxidizing conditions. J. Nucl. Mater. 190, 133–156.
Finneran K. T., Housewright M. E. and Lovley D. R. (2002)Multiple influences of nitrate on uranium solubility duringbioremediation of uranium-contaminated subsurface sedi-ments. Environ. Microbiol. 4(9), 510–516.
Frazier S. W., Kretzschmar R. and Kraemer S. M. (2005) Bacterialsiderophores promote dissolution of UO2 under reducingconditions. Environ. Sci. Technol. 39(15), 5709–5715.
Fredrickson J. K., Zachara J. M., Kennedy D. W., Liu C. X., DuffM. C., Hunter D. B. and Dohnalkova A. (2002) Influence ofMn oxides on the reduction of uranium(VI) by the metal-reducing bacterium Shewanella putrefaciens. Geochim. Cosmo-
chim. Acta 66(18), 3247–3262.
Fredrickson J. K., Zachara J. M., Marshall M. J. and Beliaev A. S.(2007) Biogeochemical mechanisms controlling reduced radio-nuclide particle properties and stability. In 2nd Annual DOE-
ERSP PI Meeting: Abstracts. LBNL-59453 Abs. 2007, Law-rence Berkeley National Laboratory, p. 44.
Gimenez J., Clarens F., Casas I., Rovira M., de Pablo J. andBruno J. (2005) Oxidation and dissolution of UO2 inbicarbonate media: implications for the spent nuclear fueloxidative dissolution mechanism. J. Nucl. Mater. 345(2–3),
232–238.
Ginder-Vogel M., Criddle C. S. and Fendorf S. (2006) Thermo-dynamic constraints on the oxidation of biogenic UO2 byFe(III) (hydr)oxides. Environ. Sci. Technol. 40(11), 3544–
3550.
Goldik J. S., Nesbitt H. W., Noel J. J. and Shoesmith D. W. (2004)Surface electrochemistry of UO2 in dilute alkaline hydrogenperoxide solutions. Electrochim. Acta 49(11), 1699–1709.
Gorby Y. A. and Lovley D. R. (1992) Enzymic uranium precip-itation. Environ. Sci. Technol. 26(1), 205–207.
Gu B. H., Yan H., Zhou P., Watson D. B., Park M. and Istok J.(2005) Natural humics impact uranium bioreduction andoxidation. Environ. Sci. Technol. 39(14), 5268–5275.
Guillaumont R., Fanghanel T., Fuger J., Grenthe I., Neck V.,Palmer D. A. and Rand M. H. (2003) Update on the chemical
thermodynamics of uranium, neptunium, plutonium, americium
and technetium. Elsevier.Ilton E. S. and Bagus P. S. (2008) Ligand field effects on the
multiplet structure of the U4f XPS of UO2. Surf. Sci. 602(5),
1114–1121.
Ilton E. S., Boily J. F. and Bagus P. S. (2007) Beam inducedreduction of U(VI) during X-ray photoelectron spectroscopy:the utility of the U4f satellite structure for identifying uraniumoxidation states in mixed valence uranium oxides. Surf. Sci.
601(4), 908–916.
Ilton E. S., Haiduc A., Cahill C. L. and Felmy A. R. (2005) Micasurfaces stabilize pentavalent uranium. Inorg. Chem. 44(9),
2986–2988.
Ilton E. S., Haiduc A., Moses C. O., Heald S. M., Elbert D. C. andVeblen D. R. (2004) Heterogeneous reduction of uranyl bymicas: crystal chemical and solution controls. Geochim. Cos-
mochim. Acta 68(11), 2417–2435.
Janeczek J. and Ewing R. C. (1992a) Dissolution and alteration ofuraninite under reducing conditions. J. Nucl. Mater. 190, 157–
173.
Janeczek J. and Ewing R. C. (1992b) Structural formula ofuraninite. J. Nucl. Mater. 190, 128–132.
Jang J. H., Dempsey B. A. and Burgos W. D. (2006) Solubility ofschoepite: comparison and selection of complexation constantsfor U(VI). Water Res. 40(14), 2738–2746.
Kraemer S. M. and Hering J. G. (1997) Influence of solutionsaturation state on the kinetics of ligand-controlled dissolutionof oxide phases. Geochim. Cosmochim. Acta 61(14), 2855–2866.
Kubatko K. A. H., Helean K. B., Navrotsky A. and Burns P. C.(2003) Stability of peroxide-containing uranyl minerals. Science
302(5648), 1191–1193.
Langmuir D. (1978) Uranium solution-mineral equilibria at lowtemperatures with applications to sedimentary ore deposits.Geochim. Cosmochim. Acta 42(6, Part 1), 547–569.
Lasaga A. C., Soler J. M., Ganor J., Burch T. E. and Nagy K. L.(1994) Chemical-weathering rate laws and global geochemicalcycles. Geochim. Cosmochim. Acta 58(10), 2361–2386.
Lovley D. R. and Phillips E. J. P. (1992) Bioremediation ofuranium contamination with enzymatic uranium reduction.Environ. Sci. Technol. 26(11), 2228–2234.
Lovley D. R., Phillips E. J. P., Gorby Y. A. and Landa E. R. (1991)Microbial reduction of uranium. Nature 350, 413–416.
Moon H. S., Komlos J. and Jaffe P. R. (2007) Uranium reoxidationin previously bioreduced sediment by dissolved oxygen andnitrate. Environ. Sci. Technol. 41(13), 4587–4592.
N’Guessan A. L., Vrionis H. A., Resch C. T., Long P. E. andLovley D. R. (2008) Sustained removal of uranium fromcontaminated groundwater following stimulation of dissimila-tory metal reduction. Environ. Sci. Technol. 42(8), 2999–3004.
Pierce E. M., Icenhower J. P., Serne R. J. and Catalano J. G. (2005)Experimental determination of UO2(cr) dissolution kinetics:effects of solution saturation state and pH. J. Nucl. Mater.
345(2–3), 206–218.
Rehr J. J., Albers R. C. and Zabinsky S. I. (1992) High-ordermultiple-scattering calculations of X-ray absorption fine struc-ture. Phys. Rev. Lett. 69(23), 3397–3400.
Renshaw J. C., Lloyd J. R. and Livens F. R. (2007) Microbialinteractions with actinides and long-lived fission products.Comptes Rendus Chimie 10(10–11), 1067–1077.
Santos B. G., Nesbitt H. W., Noel J. J. and Shoesmith D. W. (2004)X-ray photoelectron spectroscopy study of anodically oxidizedSIMFUEL surfaces. Electrochim. Acta 49(11), 1863–1873.
Santos B. G., Noel J. J. and Shoesmith D. W. (2006) The effect ofpH on the anodic dissolution of SIMFUEL (UO2). J. Electro-
anal. Chem. 586(1), 1–11.
Schecher W. D. and McAvoy D. C. (1998) MINEQL+: a chemicalequilibrium modeling system, version 4.5. EnvironmentalResearch Software.
Schofield E. J., Veeramani H., Sharp J. O., Suvorova E., Bernier-Latmani R., Mehta A., Stahlman J., Webb S. M., Clark D. L.,Conradson S. D., Ilton E. S. and Bargar J. R. (2008) Structureof biogenic uraninite produced by Shewanella oneidensis strainMR-1. Environ. Sci. Technol. 42(21), 7898–7904.
Senko J. M., Istok J. D., Suflita J. M. and Krumholz L. R. (2002)In-situ evidence for uranium immobilization and remobiliza-tion. Environ. Sci. Technol. 36(7), 1491–1496.
Senko J. M., Kelly S. D., Dohnalkova A. C., McDonough J. T.,Kemner K. M. and Burgos W. D. (2007) The effect of U(VI)bioreduction kinetics on subsequent reoxidation of biogenicU(IV). Geochim. Cosmochim. Acta 71(19), 4644–4654.
Senko J. M., Mohamed Y., Dewers T. A. and Krumholz L. R.(2005a) Role for Fe(III) minerals in nitrate-dependent micro-bial U(IV) oxidation. Environ. Sci. Technol. 39(8), 2529–2536.
Senko J. M., Suflita J. M. and Krumholz L. R. (2005b) Geochem-ical controls on microbial nitrate-dependent U(IV) oxidation.Geomicrobiol. J. 22(7–8), 371–378.
Shoesmith D. W. (2000) Fuel corrosion processes under wastedisposal conditions. J. Nucl. Mater. 282, 1–31.
Singer D. M., Farges F. and Brown G. E. (2007) Biogenic UO2 –characterization and surface reactivity. Am. Inst. Phys. Conf.
Proc. 13th Int XAFS Conf. 882(1), 277–279.

Dissolution kinetics of biogenic uraninite 6083
Singer D. M., Farges F. and Brown, Jr., G. E. (2009) Biogenicnanoparticulate UO2: synthesis, characterization, and factorsaffecting surface reactivity. Geochim. Cosmochim. Acta 73(12),
3593–3611.
Suzuki Y. and Suko T. (2006) Geomicrobiological factors thatcontrol uranium mobility in the environment: update on recentadvances in the bioremediation of uranium-contaminated sites.J. Miner. Petrol. Sci. 101(6), 299–307.
Thomas G. F. and Till G. (1984) The dissolution of unirradiatedUO2 fuel pellets under simulated disposal conditions. Nucl.
Chem. Waste Manage. 5(2), 141–147.
Torrero M. E., Baraj E., De Pablo J., Gimenez J. and Casas I.(1997) Kinetics of corrosion and dissolution of uranium dioxideas a function of pH. Int. J. Chem. Kinet. 29(4), 261–267.
Ulrich K. U., Singh A., Schofield E. J., Bargar J. R., Veeramani H.,Sharp J. O., Bernier-Latmani R. and Giammar D. E. (2008)Dissolution of biogenic and synthetic UO2 under variedreducing conditions. Environ. Sci. Technol. 42(15), 5600–5606.
Wall J. D. and Krumholz L. R. (2006) Uranium reduction. Annu.
Rev. Microbiol. 60, 149–166.
Wan J. M., Tokunaga T. K., Brodie E., Wang Z. M., Zheng Z. P.,Herman D., Hazen T. C., Firestone M. K. and Sutton S. R. (2005)
Reoxidation of bioreduced uranium under reducing conditions.Environ. Sci. Technol. 39(16), 6162–6169.
Webb S. M. (2005) SIXPack: a graphical user interface for XASanalysis using IFEFFIT. Phys. Scripta T115, 1011–1014.
Wu W. M., Carley J., Luo J., Ginder-Vogel M. A., Cardenas E.,Leigh M. B., Hwang C. C., Kelly S. D., Ruan C. M., Wu L. Y.,Van Nostrand J., Gentry T., Lowe K., Mehlhorn T., Carroll S.,Luo W. S., Fields M. W., Gu B. H., Watson D., Kemner K. M.,Marsh T., Tiedje J., Zhou J. Z., Fendorf S., Kitanidis P. K.,Jardine P. M. and Criddle C. S. (2007) In situ bioreduction ofuranium (VI) to submicromolar levels and reoxidation bydissolved oxygen. Environ. Sci. Technol. 41(16), 5716–5723.
Zhong L. R., Liu C. X., Zachara J. M., Kennedy D. W., SzecsodyJ. E. and Wood B. (2005) Oxidative remobilization of biogenicuranium(IV) precipitates: effects of iron(II) and pH. J. Environ.
Qual. 34(5), 1763–1771.
Zhou P. and Gu B. H. (2005) Extraction of oxidized and reducedforms of uranium from contaminated soils: effects of carbonateconcentration and pH. Environ. Sci. Technol. 39(12), 4435–
4440.
Associate editor: Chen Zhu
Copyright © 2022 FDOKUMEN