COMPARATIVE ANALYSIS OF SATELLITE STEREO IMAGES METHODS AND TRADITIONAL TECHNIQUES FOR ENVIRONMENTAL...
9
COMPARATIVE ANALYSIS OF SATELLITE STEREO IMAGES METHODS AND TRADITIONAL TECHNIQUES FOR ENVIRONMENTAL RISK MONITORING M.Caprioli a, , A. Scarano b , A. Scognamiglio c , R.Trizzino d a POLITECNICO DI BARI, DICATECh, v. Orabona 4, 70125 Bari, Italy - [email protected] b POLITECNICO DI BARI, DICATECh, v. Orabona 4, 70125 Bari, Italy –[email protected] c POLITECNICO DI BARI, DICATECh, v. Orabona 4, 70125 Bari, Italy – [email protected] d CNR, IRPI, v. Amendola, 70126, Bari, Italy – [email protected] KEY WORDS: DEM/DTM, LIDAR, Satellite, Stereoscopic, Photogrammetry, Remote Sensing ABSTRACT: The aim of this research is to identify fast and low-cost “Change Detection” techniques. This requirement stems from the need to operate in an efficient and timely manner, especially in case of natural disaster and battle against building abusiveness and, on the other hand, to environment monitoring: coastal erosion, subsidence phenomena, misuse of quarries, deforestation and desertification, etc. In this regard, this survey aims to assess the possibility of using DTM constructed by satellite images rather than DTM extracted through other techniques such as LIDAR and aerial photogrammetry. The results are very interesting and confirm the hypothesis: it is therefore possible to investigate territory in a more quickly and effective way. We have chosen, in line with the targets set, to focus the analysis on geographical areas particularly affected by environmental and anthropic criticalities, territorial morphological changes, building abusiveness, etc. The first study is located on an area near Fasano (BR) - Italy, that is a part of the Alta Murgia National Park. The second one is located in a mountainous area in the Basilicata, Italian region particularly affected by episodes of territorial transformation for both natural and anthropic causes. 1. INTRODUCTION In the last years, land-cover monitoring has gained significant importance especially in conjunction with the recent natural disasters that have affected the Italian territory. The developed research aims to provide fast and low-cost instruments that can fulfill the needs related to an emergency management. Secondly, these instruments are useful for the territory government. Actually some abusive urbanization phenomena or, on the other hand, abandonment of areas with consequent raising of territorial degradation levels too often occurs today. It becomes necessary to identify and monitor these changes in order to fight and delete abuses, and safeguard the territory. We want to demonstrate that to meet these requirements through this research, you can rely on satellite technology, which up to now is the only way to solve the time gap between the immediate urgency of information and the opportunity to get them in a very short term. Furthermore, the “Change Detection analysis” is used to determine and monitor the country changes over time, helping to reduce the processing time of data through automated procedures and providing information with improved qualitative content. For this you need to use the same area images taken at different times; you can made this quickly and low-cost only with satellite images. These ones are then compared in order to identify all the territorial transformation through the use of appropriate software that adopt a complex filter system to eliminate non-significant changes (e.g. vegetation growth, image noise, etc). The availability of repeatedly updated data makes it possible to develop a territory monitoring system that not only acts as a supporting design decisional tool, but also as a way to verify design strategies in case of unforeseeable events. 2. STEREO IMAGES IKONOS ® Pro 1-meter and 4-meter products are perfect for projects requiring high-resolution imagery and positional accuracy when ground control may be costly, difficult, or impossible to acquire. Providing a strong base for three-dimensional feature recognition, extraction and exploitation, the product provides two images with stereo geometry to support a wide range of stereo imagery applications such as DEM creation and three- dimensional feature extraction. Stereo products in epipolar or map projections provide RPC camera model data. The present study reports on the metric comparison between the DEMs respectively realized with the Stereo aerial pair and with the satellite Ikonos stereo pair, and another test with photogrammetric DEM and a Lidar survey. In a short time we will compare also GeoEye-1 stereo pair. The satellite metadata are: IKONOS METADATA Sensor Type: Satellite Sensor Name: IKONOS-2 Processing Level: Standard Geometrically Corrected Image Type: PAN/MSI Pan Resolution: mt 1.0 MSI Resolution: mt 3.28 Interpolation Method: Cubic Convolution Multispectral Algorithm: Projective Map Projection: Universal Transverse Mercator
Transcript of COMPARATIVE ANALYSIS OF SATELLITE STEREO IMAGES METHODS AND TRADITIONAL TECHNIQUES FOR ENVIRONMENTAL...
COMPARATIVE ANALYSIS OF SATELLITE STEREO IMAGES METHODS AND
TRADITIONAL TECHNIQUES FOR ENVIRONMENTAL RISK MONITORING
M.Caprioli a,, A. Scarano b, A. Scognamiglio c, R.Trizzino d
a POLITECNICO DI BARI, DICATECh, v. Orabona 4, 70125 Bari, Italy - [email protected]
b POLITECNICO DI BARI, DICATECh, v. Orabona 4, 70125 Bari, Italy –[email protected]
c POLITECNICO DI BARI, DICATECh, v. Orabona 4, 70125 Bari, Italy – [email protected]
d CNR, IRPI, v. Amendola, 70126, Bari, Italy – [email protected]
KEY WORDS: DEM/DTM, LIDAR, Satellite, Stereoscopic, Photogrammetry, Remote Sensing
ABSTRACT:
The aim of this research is to identify fast and low-cost “Change Detection” techniques.
This requirement stems from the need to operate in an efficient and timely manner, especially in case of natural disaster and battle
against building abusiveness and, on the other hand, to environment monitoring: coastal erosion, subsidence phenomena, misuse of
quarries, deforestation and desertification, etc.
In this regard, this survey aims to assess the possibility of using DTM constructed by satellite images rather than DTM extracted
through other techniques such as LIDAR and aerial photogrammetry. The results are very interesting and confirm the hypothesis: it
is therefore possible to investigate territory in a more quickly and effective way.
We have chosen, in line with the targets set, to focus the analysis on geographical areas particularly affected by environmental and
anthropic criticalities, territorial morphological changes, building abusiveness, etc.
The first study is located on an area near Fasano (BR) - Italy, that is a part of the Alta Murgia National Park. The second one is
located in a mountainous area in the Basilicata, Italian region particularly affected by episodes of territorial transformation for both
natural and anthropic causes.
1. INTRODUCTION
In the last years, land-cover monitoring has gained significant
importance especially in conjunction with the recent natural
disasters that have affected the Italian territory. The developed
research aims to provide fast and low-cost instruments that can
fulfill the needs related to an emergency management.
Secondly, these instruments are useful for the territory
government. Actually some abusive urbanization phenomena or,
on the other hand, abandonment of areas with consequent
raising of territorial degradation levels too often occurs today.
It becomes necessary to identify and monitor these changes in
order to fight and delete abuses, and safeguard the territory.
We want to demonstrate that to meet these requirements
through this research, you can rely on satellite technology,
which up to now is the only way to solve the time gap between
the immediate urgency of information and the opportunity to get
them in a very short term.
Furthermore, the “Change Detection analysis” is used to
determine and monitor the country changes over time, helping
to reduce the processing time of data through automated
procedures and providing information with improved qualitative
content.
For this you need to use the same area images taken at different
times; you can made this quickly and low-cost only with
satellite images. These ones are then compared in order to
identify all the territorial transformation through the use of
appropriate software that adopt a complex filter system to
eliminate non-significant changes (e.g. vegetation growth,
image noise, etc).
The availability of repeatedly updated data makes it possible to
develop a territory monitoring system that not only acts as a
supporting design decisional tool, but also as a way to verify
design strategies in case of unforeseeable events.
2. STEREO IMAGES
IKONOS® Pro 1-meter and 4-meter products are perfect for
projects requiring high-resolution imagery and positional
accuracy when ground control may be costly, difficult, or
impossible to acquire.
Providing a strong base for three-dimensional feature
recognition, extraction and exploitation, the product provides
two images with stereo geometry to support a wide range of
stereo imagery applications such as DEM creation and three-
dimensional feature extraction. Stereo products in epipolar or
map projections provide RPC camera model data.
The present study reports on the metric comparison between the
DEMs respectively realized with the Stereo aerial pair and with
the satellite Ikonos stereo pair, and another test with
photogrammetric DEM and a Lidar survey. In a short time we
will compare also GeoEye-1 stereo pair.
The satellite metadata are:
IKONOS METADATA
Sensor Type: Satellite
Sensor Name: IKONOS-2
Processing Level: Standard Geometrically Corrected
Image Type: PAN/MSI
Pan Resolution: mt 1.0
MSI Resolution: mt 3.28
Interpolation Method: Cubic Convolution
Multispectral Algorithm: Projective
Map Projection: Universal Transverse Mercator
Datum: WGS84
File Format: GeoTIFF
Bits per Pixel per Band: 11 bits per pixel
Multispectral Files: RGB File
Spectral range
Pan 526-929 nm
Blue 445-516 nm
Green 505-595 nm
Red 632-698 nm
Near IR 757-853 nm
Launch date 24-Sep-99
Life Cycle Over 8.5 years
Revisit Time 3 days
Orbital Altitude 681 km
GEOEYE-1 METADATA
Sensor Type: Satellite
Sensor Name: GEOEYE-1
Processing Level: Standard Geometrically Corrected
Image Type: PAN/MSI
Pan Resolution: mt 0.50
MSI Resolution: mt 1.64
Interpolation Method: Cubic Convolution
Multispectral Algorithm: Projective
Map Projection: Universal Transverse Mercator
Datum: WGS84
File Format: GeoTIFF
Bits per Pixel per Band: 11 bits per pixel
Multispectral Files: RGB File
Spectral range
(pan) 450-800 nm
Blue 450-510 nm
Green 510-580 nm
Red 655-690 nm
Near IR 780-920 nm
Launch date 06-Sep-08
Life Cycle 7 years
Revisit Time 3 days
Orbital Altitude 681 km
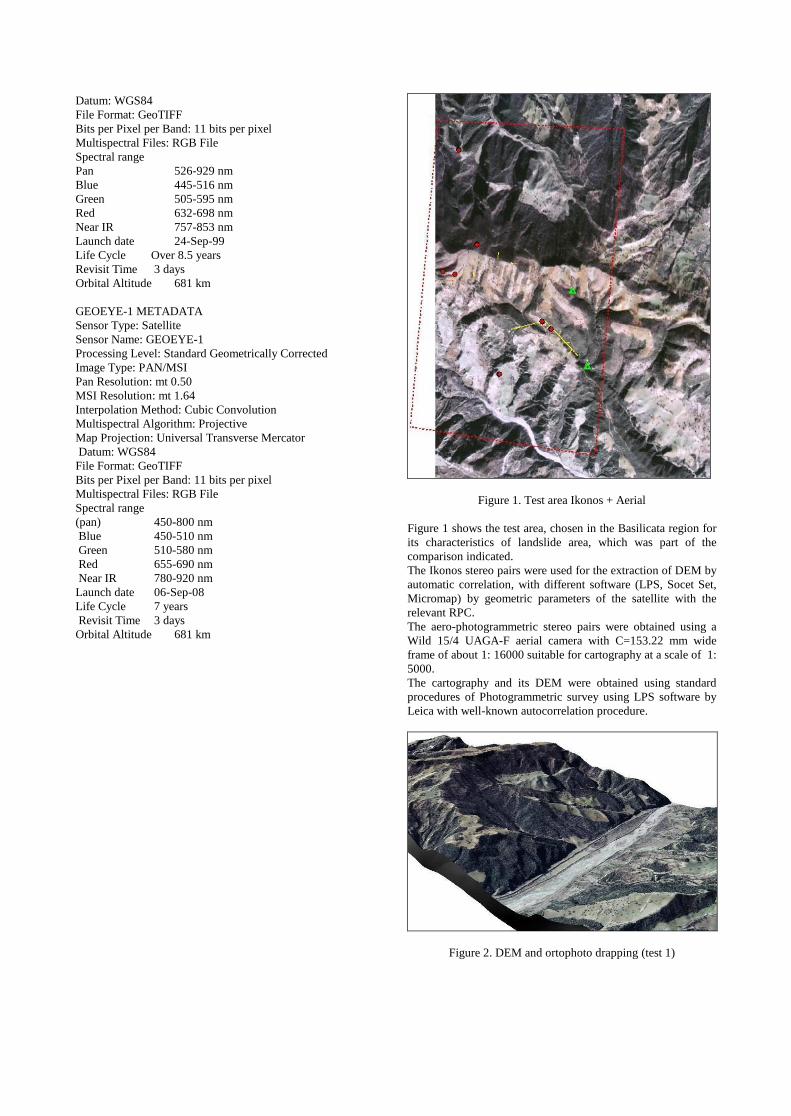
Figure 1. Test area Ikonos + Aerial
Figure 1 shows the test area, chosen in the Basilicata region for
its characteristics of landslide area, which was part of the
comparison indicated.
The Ikonos stereo pairs were used for the extraction of DEM by
automatic correlation, with different software (LPS, Socet Set,
Micromap) by geometric parameters of the satellite with the
relevant RPC.
The aero-photogrammetric stereo pairs were obtained using a
Wild 15/4 UAGA-F aerial camera with C=153.22 mm wide
frame of about 1: 16000 suitable for cartography at a scale of 1:
5000.
The cartography and its DEM were obtained using standard
procedures of Photogrammetric survey using LPS software by
Leica with well-known autocorrelation procedure.
Figure 2. DEM and ortophoto drapping (test 1)
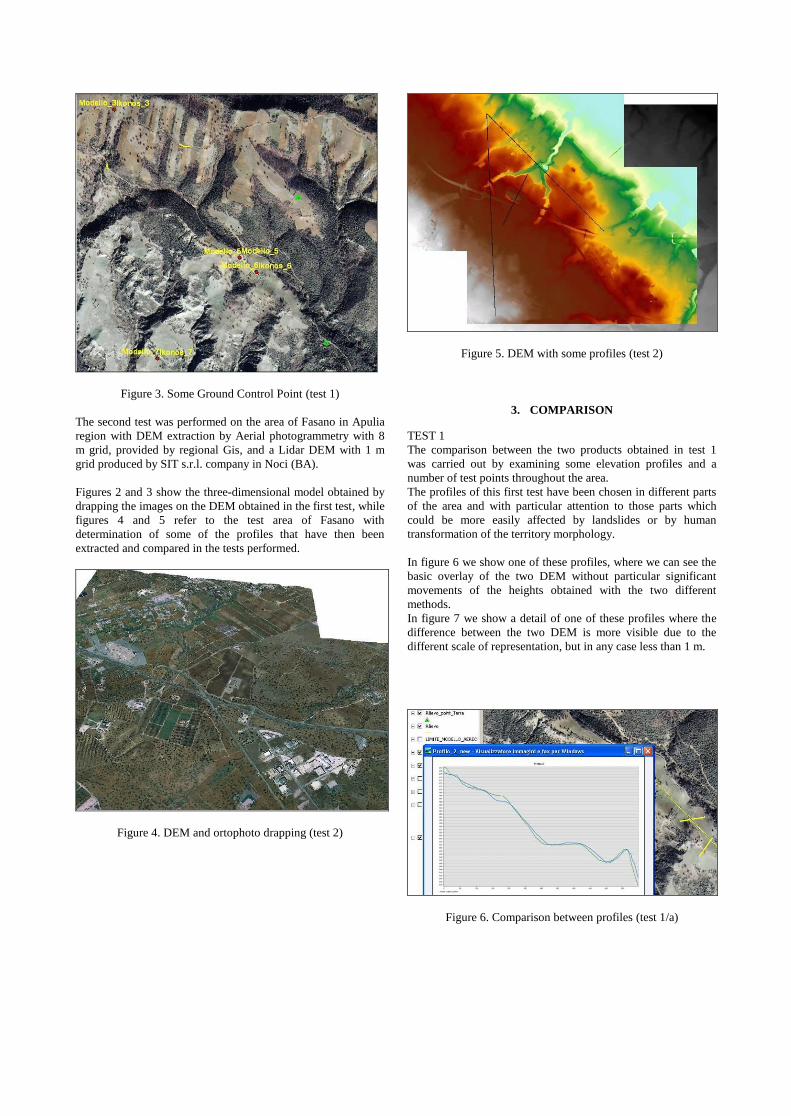
Figure 3. Some Ground Control Point (test 1)
The second test was performed on the area of Fasano in Apulia
region with DEM extraction by Aerial photogrammetry with 8
m grid, provided by regional Gis, and a Lidar DEM with 1 m
grid produced by SIT s.r.l. company in Noci (BA).
Figures 2 and 3 show the three-dimensional model obtained by
drapping the images on the DEM obtained in the first test, while
figures 4 and 5 refer to the test area of Fasano with
determination of some of the profiles that have then been
extracted and compared in the tests performed.
Figure 4. DEM and ortophoto drapping (test 2)
Figure 5. DEM with some profiles (test 2)
3. COMPARISON
TEST 1
The comparison between the two products obtained in test 1
was carried out by examining some elevation profiles and a
number of test points throughout the area.
The profiles of this first test have been chosen in different parts
of the area and with particular attention to those parts which
could be more easily affected by landslides or by human
transformation of the territory morphology.
In figure 6 we show one of these profiles, where we can see the
basic overlay of the two DEM without particular significant
movements of the heights obtained with the two different
methods.
In figure 7 we show a detail of one of these profiles where the
difference between the two DEM is more visible due to the
different scale of representation, but in any case less than 1 m.
Figure 6. Comparison between profiles (test 1/a)
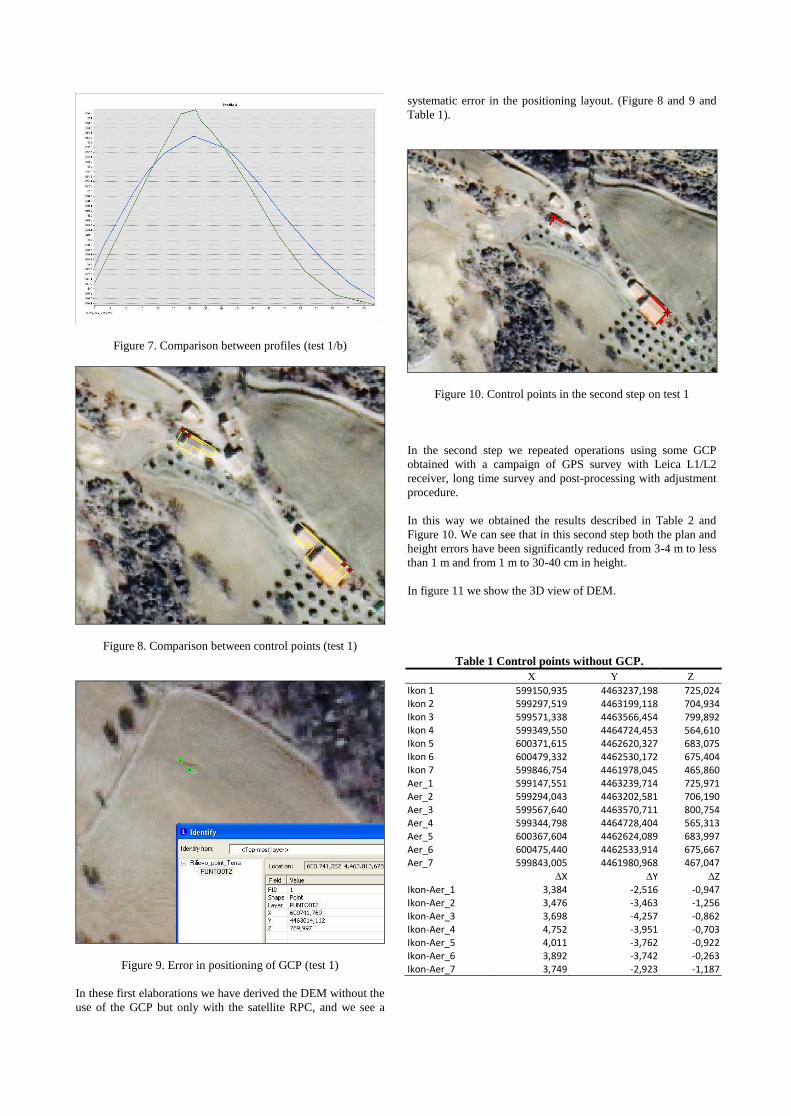
Figure 7. Comparison between profiles (test 1/b)
Figure 8. Comparison between control points (test 1)
Figure 9. Error in positioning of GCP (test 1)
In these first elaborations we have derived the DEM without the
use of the GCP but only with the satellite RPC, and we see a
systematic error in the positioning layout. (Figure 8 and 9 and
Table 1).
Figure 10. Control points in the second step on test 1
In the second step we repeated operations using some GCP
obtained with a campaign of GPS survey with Leica L1/L2
receiver, long time survey and post-processing with adjustment
procedure.
In this way we obtained the results described in Table 2 and
Figure 10. We can see that in this second step both the plan and
height errors have been significantly reduced from 3-4 m to less
than 1 m and from 1 m to 30-40 cm in height.
In figure 11 we show the 3D view of DEM.
Table 1 Control points without GCP.
X Y Z
Ikon 1 599150,935 4463237,198 725,024 Ikon 2 599297,519 4463199,118 704,934 Ikon 3 599571,338 4463566,454 799,892 Ikon 4 599349,550 4464724,453 564,610 Ikon 5 600371,615 4462620,327 683,075 Ikon 6 600479,332 4462530,172 675,404 Ikon 7 599846,754 4461978,045 465,860 Aer_1 599147,551 4463239,714 725,971 Aer_2 599294,043 4463202,581 706,190 Aer_3 599567,640 4463570,711 800,754 Aer_4 599344,798 4464728,404 565,313 Aer_5 600367,604 4462624,089 683,997 Aer_6 600475,440 4462533,914 675,667 Aer_7 599843,005 4461980,968 467,047
X Y Z Ikon-Aer_1 3,384 -2,516 -0,947 Ikon-Aer_2 3,476 -3,463 -1,256 Ikon-Aer_3 3,698 -4,257 -0,862 Ikon-Aer_4 4,752 -3,951 -0,703 Ikon-Aer_5 4,011 -3,762 -0,922 Ikon-Aer_6 3,892 -3,742 -0,263 Ikon-Aer_7 3,749 -2,923 -1,187

Table 2 Differences in Control points with GCP.
X Y Z
X Y Z Ikon-Aer_1 -0,516 0,984 -0,047 Ikon-Aer_2 -0,424 0,037 -0,356 Ikon-Aer_3 -0,202 -0,757 0,038 Ikon-Aer_4 0,852 -0,451 0,197 Ikon-Aer_5 0,111 -0,262 -0,022 Ikon-Aer_6 -0,008 -0,242 0,637 Ikon-Aer_7 -0,151 0,577 -0,287
Figure 11. 3Dview of DEM
TEST 2
In the second test in the Fasano area we verified that there is a
substantial congruence of the Dem extracted with aerial
photogrammetric method and the LIDAR one.
In figures 12 and 13 we can see the trends of the two LIDAR
and photogrammetric profiles which are completely overlayable
and comparable, maintaining the deviations well below 1 m in
most of the analysed territory.
Figure 12. Comparison between profiles (test 2)
Figure 13. Comparison between profiles (test 2)
In the images below, we have highlighted a case of greater
discordance in the heights.
In this case, in figure 14 we find differences of approximately 6
m whereas in figure 15 we find differences of over 8 m between
the two compared DEM.
Figure 14. Comparison between profiles (test 2)
Figure 15. Zoom on new building (test 2)
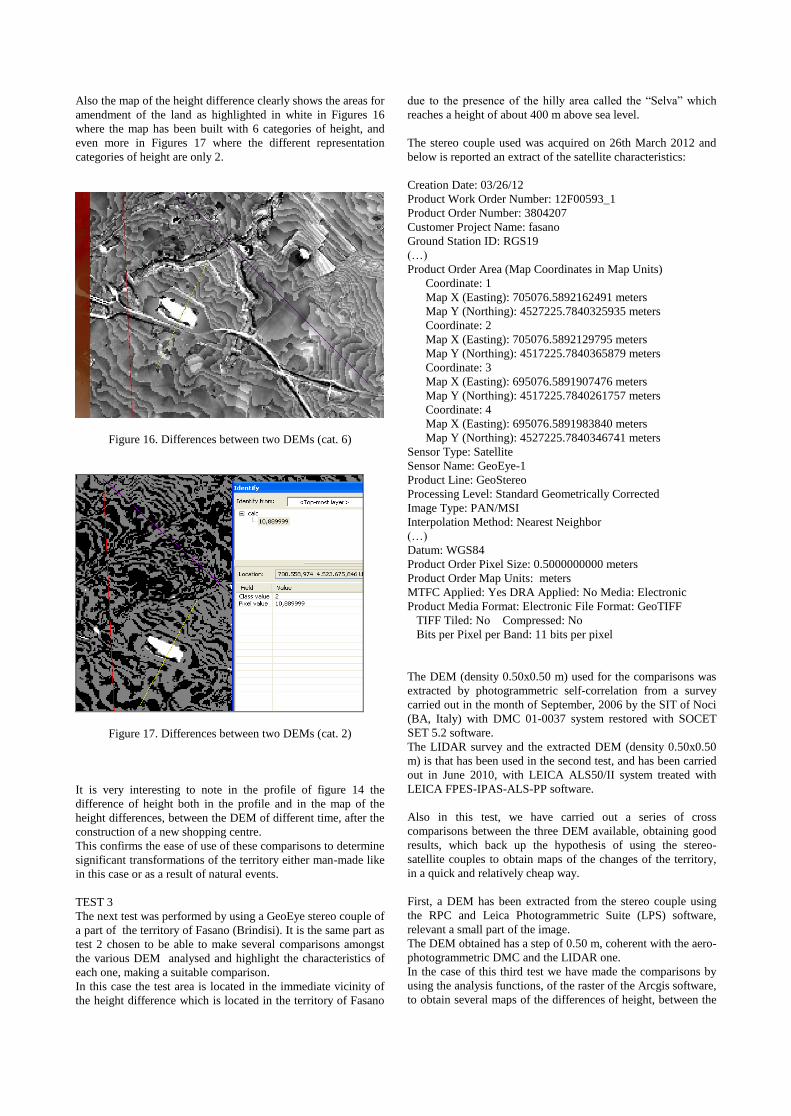
Also the map of the height difference clearly shows the areas for
amendment of the land as highlighted in white in Figures 16
where the map has been built with 6 categories of height, and
even more in Figures 17 where the different representation
categories of height are only 2.
Figure 16. Differences between two DEMs (cat. 6)
Figure 17. Differences between two DEMs (cat. 2)
It is very interesting to note in the profile of figure 14 the
difference of height both in the profile and in the map of the
height differences, between the DEM of different time, after the
construction of a new shopping centre.
This confirms the ease of use of these comparisons to determine
significant transformations of the territory either man-made like
in this case or as a result of natural events.
TEST 3
The next test was performed by using a GeoEye stereo couple of
a part of the territory of Fasano (Brindisi). It is the same part as
test 2 chosen to be able to make several comparisons amongst
the various DEM analysed and highlight the characteristics of
each one, making a suitable comparison.
In this case the test area is located in the immediate vicinity of
the height difference which is located in the territory of Fasano
due to the presence of the hilly area called the “Selva” which
reaches a height of about 400 m above sea level.
The stereo couple used was acquired on 26th March 2012 and
below is reported an extract of the satellite characteristics:
Creation Date: 03/26/12
Product Work Order Number: 12F00593_1
Product Order Number: 3804207
Customer Project Name: fasano
Ground Station ID: RGS19
(…)
Product Order Area (Map Coordinates in Map Units)
Coordinate: 1
Map X (Easting): 705076.5892162491 meters
Map Y (Northing): 4527225.7840325935 meters
Coordinate: 2
Map X (Easting): 705076.5892129795 meters
Map Y (Northing): 4517225.7840365879 meters
Coordinate: 3
Map X (Easting): 695076.5891907476 meters
Map Y (Northing): 4517225.7840261757 meters
Coordinate: 4
Map X (Easting): 695076.5891983840 meters
Map Y (Northing): 4527225.7840346741 meters
Sensor Type: Satellite
Sensor Name: GeoEye-1
Product Line: GeoStereo
Processing Level: Standard Geometrically Corrected
Image Type: PAN/MSI
Interpolation Method: Nearest Neighbor
(…)
Datum: WGS84
Product Order Pixel Size: 0.5000000000 meters
Product Order Map Units: meters
MTFC Applied: Yes DRA Applied: No Media: Electronic
Product Media Format: Electronic File Format: GeoTIFF
TIFF Tiled: No Compressed: No
Bits per Pixel per Band: 11 bits per pixel
The DEM (density 0.50x0.50 m) used for the comparisons was
extracted by photogrammetric self-correlation from a survey
carried out in the month of September, 2006 by the SIT of Noci
(BA, Italy) with DMC 01-0037 system restored with SOCET
SET 5.2 software.
The LIDAR survey and the extracted DEM (density 0.50x0.50
m) is that has been used in the second test, and has been carried
out in June 2010, with LEICA ALS50/II system treated with
LEICA FPES-IPAS-ALS-PP software.
Also in this test, we have carried out a series of cross
comparisons between the three DEM available, obtaining good
results, which back up the hypothesis of using the stereo-
satellite couples to obtain maps of the changes of the territory,
in a quick and relatively cheap way.
First, a DEM has been extracted from the stereo couple using
the RPC and Leica Photogrammetric Suite (LPS) software,
relevant a small part of the image.
The DEM obtained has a step of 0.50 m, coherent with the aero-
photogrammetric DMC and the LIDAR one.
In the case of this third test we have made the comparisons by
using the analysis functions, of the raster of the Arcgis software,
to obtain several maps of the differences of height, between the
two DEM. Then we made also a comparison between
significant profiles extracted in the same area.
The height difference obtained, between photogrammetric
method (DMC) and stereo couple GeoEye, are shown with in
“map of differences”, represented by classification into different
classes to make it easier to understand, using range of 1 m
As can be seen in Figure 18 below, the percentage of pixels
with height difference exceeding 1 m is very limited, indeed the
grey pixels are 88% and the black or the white pixels are 12%
of the whole image.
Figure 18 Differences map DMC-GEOEYE (range 1 m)
If we move the range to 2 m the percentage of pixels, with a
greater difference, drops to a few units (Figure 19).
Figure 19 Differences map DMC-GEOEYE (range 2 m)
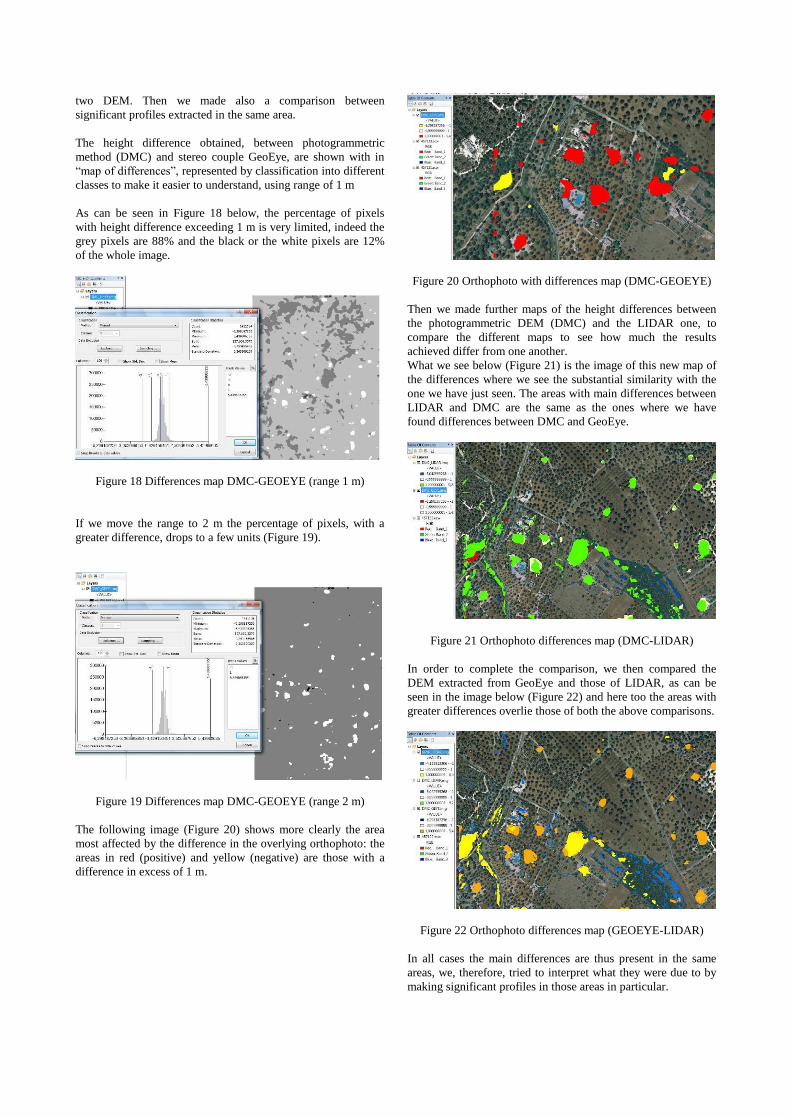
The following image (Figure 20) shows more clearly the area
most affected by the difference in the overlying orthophoto: the
areas in red (positive) and yellow (negative) are those with a
difference in excess of 1 m.
Figure 20 Orthophoto with differences map (DMC-GEOEYE)
Then we made further maps of the height differences between
the photogrammetric DEM (DMC) and the LIDAR one, to
compare the different maps to see how much the results
achieved differ from one another.
What we see below (Figure 21) is the image of this new map of
the differences where we see the substantial similarity with the
one we have just seen. The areas with main differences between
LIDAR and DMC are the same as the ones where we have
found differences between DMC and GeoEye.
Figure 21 Orthophoto differences map (DMC-LIDAR)
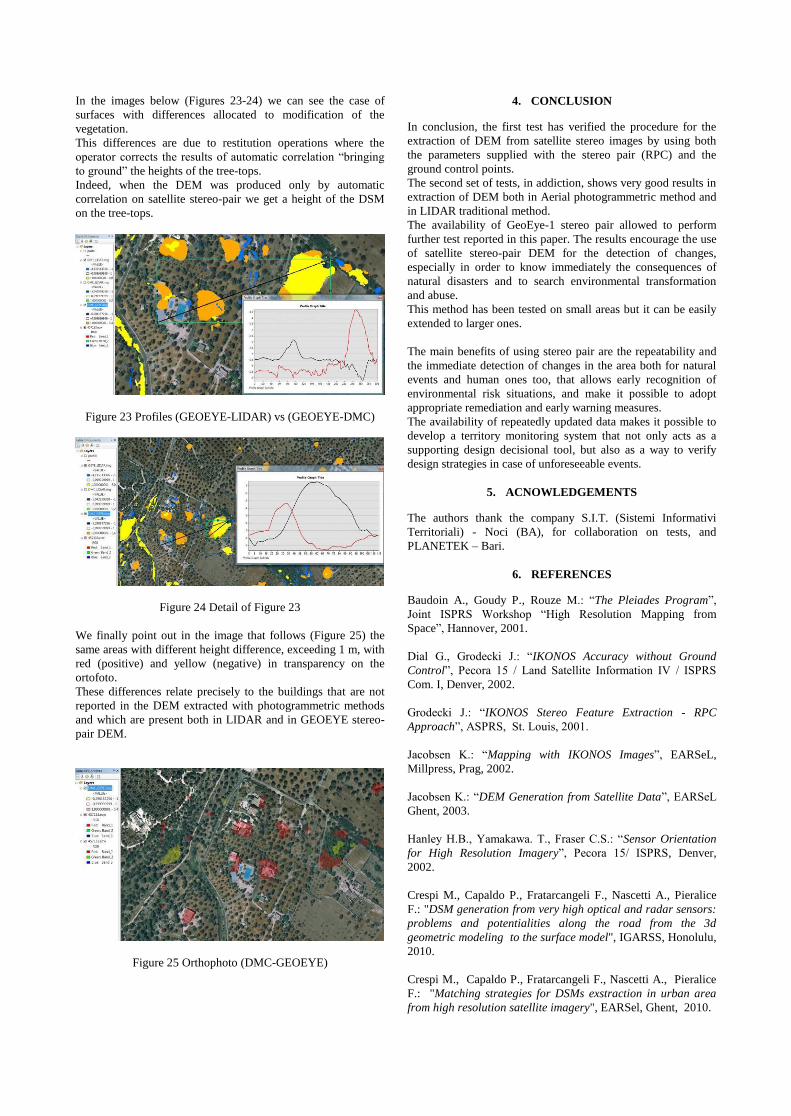
In order to complete the comparison, we then compared the
DEM extracted from GeoEye and those of LIDAR, as can be
seen in the image below (Figure 22) and here too the areas with
greater differences overlie those of both the above comparisons.
Figure 22 Orthophoto differences map (GEOEYE-LIDAR)
In all cases the main differences are thus present in the same
areas, we, therefore, tried to interpret what they were due to by
making significant profiles in those areas in particular.
In the images below (Figures 23-24) we can see the case of
surfaces with differences allocated to modification of the
vegetation.
This differences are due to restitution operations where the
operator corrects the results of automatic correlation “bringing
to ground” the heights of the tree-tops.
Indeed, when the DEM was produced only by automatic
correlation on satellite stereo-pair we get a height of the DSM
on the tree-tops.
Figure 23 Profiles (GEOEYE-LIDAR) vs (GEOEYE-DMC)
Figure 24 Detail of Figure 23
We finally point out in the image that follows (Figure 25) the
same areas with different height difference, exceeding 1 m, with
red (positive) and yellow (negative) in transparency on the
ortofoto.
These differences relate precisely to the buildings that are not
reported in the DEM extracted with photogrammetric methods
and which are present both in LIDAR and in GEOEYE stereo-
pair DEM.
Figure 25 Orthophoto (DMC-GEOEYE)
4. CONCLUSION
In conclusion, the first test has verified the procedure for the
extraction of DEM from satellite stereo images by using both
the parameters supplied with the stereo pair (RPC) and the
ground control points.
The second set of tests, in addiction, shows very good results in
extraction of DEM both in Aerial photogrammetric method and
in LIDAR traditional method.
The availability of GeoEye-1 stereo pair allowed to perform
further test reported in this paper. The results encourage the use
of satellite stereo-pair DEM for the detection of changes,
especially in order to know immediately the consequences of
natural disasters and to search environmental transformation
and abuse.
This method has been tested on small areas but it can be easily
extended to larger ones.
The main benefits of using stereo pair are the repeatability and
the immediate detection of changes in the area both for natural
events and human ones too, that allows early recognition of
environmental risk situations, and make it possible to adopt
appropriate remediation and early warning measures.
The availability of repeatedly updated data makes it possible to
develop a territory monitoring system that not only acts as a
supporting design decisional tool, but also as a way to verify
design strategies in case of unforeseeable events.
5. ACNOWLEDGEMENTS
The authors thank the company S.I.T. (Sistemi Informativi
Territoriali) - Noci (BA), for collaboration on tests, and
PLANETEK – Bari.
6. REFERENCES
Baudoin A., Goudy P., Rouze M.: “The Pleiades Program”,
Joint ISPRS Workshop “High Resolution Mapping from
Space”, Hannover, 2001.
Dial G., Grodecki J.: “IKONOS Accuracy without Ground
Control”, Pecora 15 / Land Satellite Information IV / ISPRS
Com. I, Denver, 2002.
Grodecki J.: “IKONOS Stereo Feature Extraction - RPC
Approach”, ASPRS, St. Louis, 2001.
Jacobsen K.: “Mapping with IKONOS Images”, EARSeL,
Millpress, Prag, 2002.
Jacobsen K.: “DEM Generation from Satellite Data”, EARSeL
Ghent, 2003.
Hanley H.B., Yamakawa. T., Fraser C.S.: “Sensor Orientation
for High Resolution Imagery”, Pecora 15/ ISPRS, Denver,
2002.
Crespi M., Capaldo P., Fratarcangeli F., Nascetti A., Pieralice
F.: "DSM generation from very high optical and radar sensors:
problems and potentialities along the road from the 3d
geometric modeling to the surface model", IGARSS, Honolulu,
2010.
Crespi M., Capaldo P., Fratarcangeli F., Nascetti A., Pieralice
F.: "Matching strategies for DSMs exstraction in urban area
from high resolution satellite imagery", EARSel, Ghent, 2010.

Crosetto M., Pérez Aragues F.: “Radargrammetry and SAR
interferometry for DEM generation: validation and data
fusion”, CEOS SAR Workshop, ESA-CNES, Toulouse, 1999.
Leberl F.W.: “Radargrammetric image processing”, Artech
House, Norwood, 1990.
Li Z., Zhu Q., Gold C.: “Digital terrain modeling: principles
and methodology”, CRC Press, Florida, 2005.
Méric S., Fayard F., Pottier E.,:"Radargrammetric SAR image
processing", Pei-Gee Peter Ho (Eds.), Geoscience and Remote
Sensing, Intech, 2009.
Raggam H., Perko R., Gutjahr K.: “Investigation of the Stereo-
Radargrammetric Mapping Potential of TerraSAR-X”, 29th
EARSeL Symposium, Chania, 2009.
Toutin T., Gray L.: “State-of-the-art of elevation extraction
from satellite SAR data”, ISPRS Journal n. 55, ELSEVIER,
2000.