Comparative analyses of C4 and C3 photosynthesis in developing leaves of maize and rice
11
© 2014 Nature America, Inc. All rights reserved. NATURE BIOTECHNOLOGY ADVANCE ONLINE PUBLICATION ARTICLES C 4 photosynthesis evolved from ancestral C 3 photosynthesis during a global decline in atmospheric CO 2 levels 1 . C 3 photosynthesis uses the three-carbon molecule 3-phosphoglycerate (3-PGA) for carbon fixation, but in C 4 photosynthesis a carbon shuttle system evolved in which carbon is first fixed by incorporation of carbon dioxide into a four-carbon molecule—oxaloacetate (OAA). OAA is transported from the outer mesophyll (ME) cells to inner bundle sheath (BS) cells in the form of malate or aspartate. In maize, CO 2 is liberated inside the bundle sheath chloroplasts—which are enclosed by cell walls impregnated with suberin, a waxy substance—through decar- boxylation by malic enzyme, thereby creating a microenvironment with an increased CO 2 concentration in the vicinity of the Rubisco enzyme. This greatly reduces energetically wasteful photorespira- tion and enables Rubisco to function near its enzymatic V max , thus allowing a much reduced investment of nitrogen in Rubisco protein. These elegant biochemical (C 4 carbon shuttle) and anatomical (Kranz anatomy) innovations improve water and nitrogen use efficiencies and increase plant yields in hot and dry environments 2 . C 4 grasses, such as maize, sorghum and sugarcane, are widely culti- vated in modern agriculture 3 . C 3 grass crops including rice, wheat and barley provide the most calories to human diets. Ensuring food secu- rity is increasingly difficult owing to an expanding global population, unpredictable severe weather patterns and contracting arable land and water resources 4,5 . To alleviate the food crisis, efforts are now ongoing to engineer C 4 traits into C 3 crop species, which has the potential to massively increase C 3 crop yields 6 . Such efforts would be aided by an improved understanding of the regulatory networks underlying C 4 and C 3 photosynthesis, which currently remains very limited 7 . The leaf houses the photosynthetic machinery of the plant, driving sugar production and ultimately yield, and analyses of the leaf tran- scriptome offers insights into the process of differentiation of photo- synthetic tissues 8,9 . In this study, we examine the leaf transcriptomes of maize (C 4 ) and rice (C 3 ), to identify new structural and regulatory components important in photosynthesis. By analyzing the metabolic profiles and correlating orthologous gene expression, we have devel- oped a mathematical model to directly compare two related grass spe- cies undergoing similar leaf development trajectories (e.g., maturing from the tip to base) and performed cluster analysis to define patterns of maize and rice gene expression. Functional enrichment tests cou- pled with cis-regulatory mining tools identified candidate motifs Comparative analyses of C 4 and C 3 photosynthesis in developing leaves of maize and rice Lin Wang 1,11 , Angelika Czedik-Eysenberg 2 , Rachel A Mertz 1 , Yaqing Si 3,11 , Takayuki Tohge 2 , Adriano Nunes-Nesi 2,11 , Stephanie Arrivault 2 , Lauren K Dedow 1,11 , Douglas W Bryant 1 , Wen Zhou 3 , Jiajia Xu 4 , Sarit Weissmann 1 , Anthony Studer 1 , Pinghua Li 5,11 , Cankui Zhang 6,11 , Therese LaRue 7 , Ying Shao 1,11 , Zehong Ding 5 , Qi Sun 8 , Rohan V Patel 9 , Robert Turgeon 6 , Xinguang Zhu 4 , Nicholas J Provart 9 , Todd C Mockler 1 , Alisdair R Fernie 2 , Mark Stitt 2 , Peng Liu 3 & Thomas P Brutnell 1,10 C 4 and C 3 photosynthesis differ in the efficiency with which they consume water and nitrogen. Engineering traits of the more efficient C 4 photosynthesis into C 3 crops could substantially increase crop yields in hot, arid conditions. To identify differences between C 4 and C 3 photosynthetic mechanisms, we profiled metabolites and gene expression in the developing leaves of Zea mays (maize), a C 4 plant, and Oryza sativa (rice), a C 3 plant, using a statistical method named the unified developmental model (UDM). Candidate cis-regulatory elements and transcription factors that might regulate photosynthesis were identified, together with differences between C 4 and C 3 nitrogen and carbon metabolism. The UDM algorithms could be applied to analyze and compare development in other species. These data sets together with community viewers to access and mine them provide a resource for photosynthetic research that will inform efforts to engineer improvements in carbon fixation in economically valuable grass crops. 1 The Donald Danforth Plant Science Center, St. Louis, Missouri, USA. 2 The Max Planck Institute for Molecular Plant Physiology, Wissenschaftspark Golm, Potsdam-Golm, Germany. 3 Department of Statistics, Iowa State University, Ames, Iowa, USA. 4 The Chinese Academy of Sciences-Max Planck Society Partner Institute for Computational Biology, Shanghai Institute for Biological Sciences, Chinese Academy of Sciences, Shanghai, China. 5 The Institute of Tropical Bioscience and Biotechnology, Chinese Academy of Tropical Agricultural Sciences, Hainan, Haikou, China. 6 Department of Agronomy, Purdue University, West Lafayette, Indiana, USA. 7 Department of Biology, Skidmore College, Saratoga Springs, New York, USA. 8 Computational Biology Service Unit, Life Sciences Core Laboratories Center, Cornell University, Ithaca, New York, USA. 9 Department of Cell and Systems Biology/Center for the Analysis of Genome Evolution and Function, University of Toronto, Toronto, Ontario, Canada. 10 Collaborative Innovation Center of Henan Grain Crops and National Key Laboratory of Wheat and Maize Crop Science, Henan Agricultural University, Zhengzhou, China. 11 Present addresses: Monsanto Company, St. Louis, Missouri, USA (L.W.), Southwestern University of Finance & Economics, Chengdu, China (Y. Si), Departamento de Biologia Vegetal, Universidade Federal de Viçosa, Minas Gerais, Brazil (A.N.-N.), Department of Botany and Plant Science, University of California at Riverside, Riverside, California, USA (L.K.D.), Shandong Agricultural University, Tai’an, Shandong, China (P.L.), Department of Agronomy, Purdue University, West Lafayette, Indiana, USA (C.Z.), and St. Jude Children’s Research Hospital, Pediatric Cancer Genome Project, Memphis, Tennessee, USA (Y. Shao). Correspondence should be addressed to T.P.B. ([email protected]). Received 12 April 2013; accepted 14 August 2014; published online 12 October 2014; doi:10.1038/nbt.3019
Transcript of Comparative analyses of C4 and C3 photosynthesis in developing leaves of maize and rice

©20
14 N
atu
re A
mer
ica,
Inc.
All
rig
hts
res
erve
d.
nature biotechnology advance online publication �
A rt i c l e s
C4 photosynthesis evolved from ancestral C3 photosynthesis during a global decline in atmospheric CO2 levels1. C3 photosynthesis uses the three-carbon molecule 3-phosphoglycerate (3-PGA) for carbon fixation, but in C4 photosynthesis a carbon shuttle system evolved in which carbon is first fixed by incorporation of carbon dioxide into a four-carbon molecule—oxaloacetate (OAA). OAA is transported from the outer mesophyll (ME) cells to inner bundle sheath (BS) cells in the form of malate or aspartate. In maize, CO2 is liberated inside the bundle sheath chloroplasts—which are enclosed by cell walls impregnated with suberin, a waxy substance—through decar-boxylation by malic enzyme, thereby creating a microenvironment with an increased CO2 concentration in the vicinity of the Rubisco enzyme. This greatly reduces energetically wasteful photorespira-tion and enables Rubisco to function near its enzymatic Vmax, thus allowing a much reduced investment of nitrogen in Rubisco protein. These elegant biochemical (C4 carbon shuttle) and anatomical (Kranz anatomy) innovations improve water and nitrogen use efficiencies and increase plant yields in hot and dry environments2.
C4 grasses, such as maize, sorghum and sugarcane, are widely culti-vated in modern agriculture3. C3 grass crops including rice, wheat and
barley provide the most calories to human diets. Ensuring food secu-rity is increasingly difficult owing to an expanding global population, unpredictable severe weather patterns and contracting arable land and water resources4,5. To alleviate the food crisis, efforts are now ongoing to engineer C4 traits into C3 crop species, which has the potential to massively increase C3 crop yields6. Such efforts would be aided by an improved understanding of the regulatory networks underlying C4 and C3 photosynthesis, which currently remains very limited7.
The leaf houses the photosynthetic machinery of the plant, driving sugar production and ultimately yield, and analyses of the leaf tran-scriptome offers insights into the process of differentiation of photo-synthetic tissues8,9. In this study, we examine the leaf transcriptomes of maize (C4) and rice (C3), to identify new structural and regulatory components important in photosynthesis. By analyzing the metabolic profiles and correlating orthologous gene expression, we have devel-oped a mathematical model to directly compare two related grass spe-cies undergoing similar leaf development trajectories (e.g., maturing from the tip to base) and performed cluster analysis to define patterns of maize and rice gene expression. Functional enrichment tests cou-pled with cis-regulatory mining tools identified candidate motifs
comparative analyses of c4 and c3 photosynthesis in developing leaves of maize and riceLin Wang1,11, Angelika Czedik-Eysenberg2, Rachel A Mertz1, Yaqing Si3,11, Takayuki Tohge2, Adriano Nunes-Nesi2,11, Stephanie Arrivault2, Lauren K Dedow1,11, Douglas W Bryant1, Wen Zhou3, Jiajia Xu4, Sarit Weissmann1, Anthony Studer1, Pinghua Li5,11, Cankui Zhang6,11, Therese LaRue7, Ying Shao1,11, Zehong Ding5, Qi Sun8, Rohan V Patel9, Robert Turgeon6, Xinguang Zhu4, Nicholas J Provart9, Todd C Mockler1, Alisdair R Fernie2, Mark Stitt2, Peng Liu3 & Thomas P Brutnell1,10
C4 and C3 photosynthesis differ in the efficiency with which they consume water and nitrogen. Engineering traits of the more efficient C4 photosynthesis into C3 crops could substantially increase crop yields in hot, arid conditions. To identify differences between C4 and C3 photosynthetic mechanisms, we profiled metabolites and gene expression in the developing leaves of Zea mays (maize), a C4 plant, and Oryza sativa (rice), a C3 plant, using a statistical method named the unified developmental model (UDM). Candidate cis-regulatory elements and transcription factors that might regulate photosynthesis were identified, together with differences between C4 and C3 nitrogen and carbon metabolism. The UDM algorithms could be applied to analyze and compare development in other species. These data sets together with community viewers to access and mine them provide a resource for photosynthetic research that will inform efforts to engineer improvements in carbon fixation in economically valuable grass crops.
1The Donald Danforth Plant Science Center, St. Louis, Missouri, USA. 2The Max Planck Institute for Molecular Plant Physiology, Wissenschaftspark Golm, Potsdam-Golm, Germany. 3Department of Statistics, Iowa State University, Ames, Iowa, USA. 4The Chinese Academy of Sciences-Max Planck Society Partner Institute for Computational Biology, Shanghai Institute for Biological Sciences, Chinese Academy of Sciences, Shanghai, China. 5The Institute of Tropical Bioscience and Biotechnology, Chinese Academy of Tropical Agricultural Sciences, Hainan, Haikou, China. 6Department of Agronomy, Purdue University, West Lafayette, Indiana, USA. 7Department of Biology, Skidmore College, Saratoga Springs, New York, USA. 8Computational Biology Service Unit, Life Sciences Core Laboratories Center, Cornell University, Ithaca, New York, USA. 9Department of Cell and Systems Biology/Center for the Analysis of Genome Evolution and Function, University of Toronto, Toronto, Ontario, Canada. 10Collaborative Innovation Center of Henan Grain Crops and National Key Laboratory of Wheat and Maize Crop Science, Henan Agricultural University, Zhengzhou, China. 11Present addresses: Monsanto Company, St. Louis, Missouri, USA (L.W.), Southwestern University of Finance & Economics, Chengdu, China (Y. Si), Departamento de Biologia Vegetal, Universidade Federal de Viçosa, Minas Gerais, Brazil (A.N.-N.), Department of Botany and Plant Science, University of California at Riverside, Riverside, California, USA (L.K.D.), Shandong Agricultural University, Tai’an, Shandong, China (P.L.), Department of Agronomy, Purdue University, West Lafayette, Indiana, USA (C.Z.), and St. Jude Children’s Research Hospital, Pediatric Cancer Genome Project, Memphis, Tennessee, USA (Y. Shao). Correspondence should be addressed to T.P.B. ([email protected]).
Received 12 April 2013; accepted 14 August 2014; published online 12 October 2014; doi:10.1038/nbt.3019
©20
14 N
atu
re A
mer
ica,
Inc.
All
rig
hts
res
erve
d.
� advance online publication nature biotechnology
A rt i c l e s
likely to have been recruited in the evolution of C4 photosynthesis. Using these highly resolved transcriptional profiles, we propose a model of suberin biosynthesis and structural features that are associ-ated with NADP-mesophyll subtype C4 grasses, and define candidate transcriptional regulators of this pathway. We have also developed several community tools, including an expression viewer, to enable access to these data sets and provide a foundation for understanding, and ultimately engineering, C4 traits into C3 grasses.
RESULTSMetabolic profiles along maize and rice leaf gradientsGrass leaves are initiated and develop along a basipetal axis that is distinct from eudicots10. This feature facilitates developmental comparisons among different grass species and enables sampling of discrete developmental stages at one fixed time point. Previously, we analyzed dynamic changes in the transcriptome of four different developmental stages of the maize leaf 8. In this study, we carried out an interspecific comparative analysis of photosynthetic differ-entiation in rice and maize by integration of transcriptomics and metabolomics data sets.
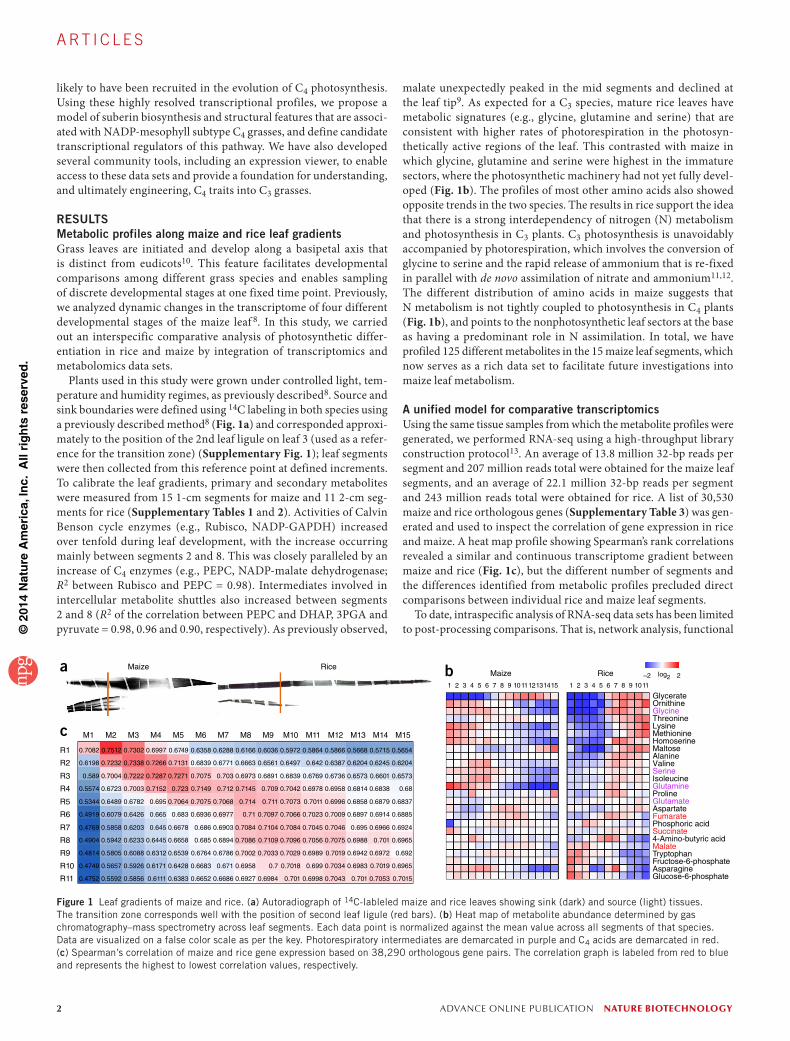
Plants used in this study were grown under controlled light, tem-perature and humidity regimes, as previously described8. Source and sink boundaries were defined using 14C labeling in both species using a previously described method8 (Fig. 1a) and corresponded approxi-mately to the position of the 2nd leaf ligule on leaf 3 (used as a refer-ence for the transition zone) (Supplementary Fig. 1); leaf segments were then collected from this reference point at defined increments. To calibrate the leaf gradients, primary and secondary metabolites were measured from 15 1-cm segments for maize and 11 2-cm seg-ments for rice (Supplementary Tables 1 and 2). Activities of Calvin Benson cycle enzymes (e.g., Rubisco, NADP-GAPDH) increased over tenfold during leaf development, with the increase occurring mainly between segments 2 and 8. This was closely paralleled by an increase of C4 enzymes (e.g., PEPC, NADP-malate dehydrogenase; R2 between Rubisco and PEPC = 0.98). Intermediates involved in intercellular metabolite shuttles also increased between segments 2 and 8 (R2 of the correlation between PEPC and DHAP, 3PGA and pyruvate = 0.98, 0.96 and 0.90, respectively). As previously observed,
malate unexpectedly peaked in the mid segments and declined at the leaf tip9. As expected for a C3 species, mature rice leaves have metabolic signatures (e.g., glycine, glutamine and serine) that are consistent with higher rates of photorespiration in the photosyn-thetically active regions of the leaf. This contrasted with maize in which glycine, glutamine and serine were highest in the immature sectors, where the photosynthetic machinery had not yet fully devel-oped (Fig. 1b). The profiles of most other amino acids also showed opposite trends in the two species. The results in rice support the idea that there is a strong interdependency of nitrogen (N) metabolism and photosynthesis in C3 plants. C3 photosynthesis is unavoidably accompanied by photorespiration, which involves the conversion of glycine to serine and the rapid release of ammonium that is re-fixed in parallel with de novo assimilation of nitrate and ammonium11,12. The different distribution of amino acids in maize suggests that N metabolism is not tightly coupled to photosynthesis in C4 plants (Fig. 1b), and points to the nonphotosynthetic leaf sectors at the base as having a predominant role in N assimilation. In total, we have profiled 125 different metabolites in the 15 maize leaf segments, which now serves as a rich data set to facilitate future investigations into maize leaf metabolism.
A unified model for comparative transcriptomicsUsing the same tissue samples from which the metabolite profiles were generated, we performed RNA-seq using a high-throughput library construction protocol13. An average of 13.8 million 32-bp reads per segment and 207 million reads total were obtained for the maize leaf segments, and an average of 22.1 million 32-bp reads per segment and 243 million reads total were obtained for rice. A list of 30,530 maize and rice orthologous genes (Supplementary Table 3) was gen-erated and used to inspect the correlation of gene expression in rice and maize. A heat map profile showing Spearman’s rank correlations revealed a similar and continuous transcriptome gradient between maize and rice (Fig. 1c), but the different number of segments and the differences identified from metabolic profiles precluded direct comparisons between individual rice and maize leaf segments.
To date, intraspecific analysis of RNA-seq data sets has been limited to post-processing comparisons. That is, network analysis, functional
a
c M1 M2 M3 M4 M5 M6 M7 M8 M9 M10 M11 M12 M13 M14 M15
R1
R2
R3
R4
R5
R6
R7
R8
R9
R10
R11
0.7082
0.6198
0.589
0.5574
0.5344
0.4919
0.4769
0.4904
0.4814
0.4749
0.4752
0.7512
0.7232
0.7004
0.6723
0.6489
0.6079
0.5942
0.5805
0.5657
0.5592 0.5856
0.5926
0.6088
0.6233
0.6203
0.6426
0.6782
0.7003
0.7222
0.7338
0.7302 0.6997
0.7266
0.7287
0.7152
0.695
0.665
0.645
0.6445
0.6312
0.6171
0.6111
0.6749 0.6358
0.6839
0.7075
0.7149
0.6936
0.686
0.685
0.6764
0.6683
0.6652
0.7075
0.6288
0.6771
0.703
0.712
0.6977
0.6903
0.6894
0.6786
0.671
0.6686
0.7068
0.6166
0.6663
0.6973
0.7145
0.71
0.7084
0.7086
0.7002
0.6958
0.6927
0.714
0.6036
0.6561
0.6891
0.709
0.7097
0.7104
0.7109
0.7033
0.7
0.6984
0.711
0.5972
0.6497
0.6839
0.7042
0.7066
0.7084
0.7096
0.7029
0.7018
0.701
0.7073
0.5864
0.642
0.6769
0.6978
0.7023
0.7045
0.7056
0.6989
0.699
0.6998
0.7011
0.5866
0.6387
0.6736
0.6958
0.7009
0.7046
0.7075
0.7019
0.7034
0.7043
0.6996
0.5668
0.6204
0.6573
0.6814
0.6897
0.695
0.6988
0.6942
0.6983
0.701
0.6858
0.5715
0.6245
0.6601
0.6838
0.6914
0.6966
0.701
0.6972
0.7019
0.7053
0.6879
0.5654
0.6204
0.6573
0.68
0.6885
0.6924
0.6965
0.692
0.6965
0.7015
0.6837
0.7131
0.7271
0.723
0.7064
0.683
0.6678
0.6658
0.6539
0.6428
0.6383
0.5858
b Maize Rice
1 2 3 4 5 6 7 8 9 1011 1 2 3 4 5 6 7 8 9 101112131415
–2 log2 2
GlycerateOrnithineGlycineThreonineLysineMethionineHomoserineMaltoseAlanineValineSerineIsoleucineGlutamineProlineGlutamateAspartateFumaratePhosphoric acidSuccinate4-Amino-butyric acidMalateTryptophanFructose-6-phosphateAsparagineGlucose-6-phosphate
Maize Rice
Figure 1 Leaf gradients of maize and rice. (a) Autoradiograph of 14C-lableled maize and rice leaves showing sink (dark) and source (light) tissues. The transition zone corresponds well with the position of second leaf ligule (red bars). (b) Heat map of metabolite abundance determined by gas chromatography–mass spectrometry across leaf segments. Each data point is normalized against the mean value across all segments of that species. Data are visualized on a false color scale as per the key. Photorespiratory intermediates are demarcated in purple and C4 acids are demarcated in red. (c) Spearman’s correlation of maize and rice gene expression based on 38,290 orthologous gene pairs. The correlation graph is labeled from red to blue and represents the highest to lowest correlation values, respectively.

©20
14 N
atu
re A
mer
ica,
Inc.
All
rig
hts
res
erve
d.
nature biotechnology advance online publication �
A rt i c l e s
enrichment and transcriptional regulatory components have been per-formed within species, and these data sets have then been compared between species. In this study we exploited the uniformity of two highly similar developmental and experimental grass leaf systems to perform an integrated comparative transcriptomics study. To account for the different number of segments sampled along the leaves, and variation in developmental progression, we built a unified develop-mental model (UDM) to equate the developmental stages between the two species. Using a core set of 3,559 anchor genes (high-confidence orthologous gene pairs that have similar profiles of gene expression and likely retain similar functionality in rice and maize), we estab-lished a common developmental axis onto which segments from both maize and rice could be mapped (Fig. 2). This approach preserves the order of segments along leaves and does not force the segments to be equally spaced along the common axis. Given the mapped locations of all the leaf segments, we fitted an expression profile for each maize and rice gene along the common axis. Expression comparisons across species were enabled through the production of these fitted profiles despite the developmental variation and different segment numbers used to profile gene expression.
Using the UDM, we were able to fit over 20,656 gene expression pro-files from maize and 17,634 gene expression profiles from rice along the leaf developmental gradient. To validate the RNA-seq results and the UDM, we selected 28 maize and rice genes with expression profiles spanning four orders of magnitude and examined their expression using qRT-PCR (Supplementary Table 4). It is clear the reads per kilobase
per million mapped reads (RPKM) values before and after model fitting are consistent with the qPCR results, with genes expressed at low levels showing more variation than those expressed at high levels (Supplementary Fig. 2). Thus the UDM enables an integrated analysis of maize and rice gene expression data despite 41 million years of evolutionary divergence (http://www.timetree.org/)14. Furthermore, applying the UDM to additional plant and animal systems will be possible when well-calibrated developmental and experimental data sets have been generated.
Candidate photosynthesis cis-regulatory elementsTo test the efficacy of the UDM we used a modified K-means cluster-ing method to examine the expression of genes necessary for pho-tosynthetic differentiation. From the combined set of over 35,000 maize and rice gene profiles, we generated 30 clusters that capture the major trends along the gradient (Supplementary Fig. 3). The TopGO package15 identified clusters 1, 3, 4 and 6 as containing genes that were over-represented for photosynthesis-related GO annotations (Supplementary Table 5). Clusters 1, 3 and 4 share similar profiles of gene expression; expression values are low at the base of the leaf peak-ing at, or near to, the tip of the leaf (Fig. 3). In cluster 6, peak expres-sion occurs earlier, near the mid-point of the leaf, at the source-sink boundary. Genes in cluster 6 include those for tetrapyrrole metabo-lism, chloroplast targeting and secondary cell wall biosynthesis8,16,17. Genes in clusters 1, 3 and 4 include those encoding components of the Calvin cycle, photosystems I and II and electron transport.
1 2 3 4 5 6 7 8 9 10 11 12 13 14 15
0.860.810.76
0.710.65
0.60
0.540.05 0.15 0.21 0.26 0.31 0.36 0.41 0.47
0.12 0.19 0.26 0.33 0.40 0.50 0.61 0.71 0.84 0.93 1
UDMGradient
1 2 3 4 5 6 7 8 9 10 11
Figure 2 A unified developmental model to correlate developmental gradients. UDM was established using a third-degree polynomial function and orthologous rice and maize genes with highly correlated expression profiles. The UDM is represented as a linear gradient from 0 to 1 (dark red line) onto which transformed data from maize and rice are superimposed. Note that regions of the maize leaf base and rice leaf tip are not developmentally paired and that the transition from one developmental segment to the next is nonlinear (i.e., gap size is variable). The original segments from maize and rice are mapped onto the UDM gradient with relative developmental positions shown in blue (maize) and purple (rice).
2 1
Nor
mal
ized
exp
ress
ion
1
0
–1
–2
Rice58%
Maize42%
32
1
0
–1
–2
Rice43%
Maize57%
42
1
0
–1
–2
Rice73%
Maize27%
Rice86%
Maize14%
62
1
0
–1
–2
Figure 3 Clusters enriched with photosynthesis GO annotations. Cluster 1, 3, 4 and 6 were determined to have enriched GO annotations related to photosynthesis (Supplementary Fig. 3). The line plots show gene expression profiles (gray) and the mean (bold red) of the cluster. Corresponding pie charts shows the percentage of maize and rice genes in each cluster.

©20
14 N
atu
re A
mer
ica,
Inc.
All
rig
hts
res
erve
d.
� advance online publication nature biotechnology
A rt i c l e s
Thus, the expression of genes required for plastid biogenesis precedes the expression of genes required for the implementation of photo-synthesis. The UDM indicates that photosynthetic development has progressed slighter further in rice than maize at the time of tissue har-vesting as orthologous genes related to photosynthetic developmental are expressed at higher levels at the base of the rice leaf than the base of the maize leaf (Fig. 2). This is also evident from the measurements of maize and rice metabolites, as the rice profiles of the starch degrada-tion intermediate maltose18 and the Calvin-Benson cycle intermediate 3-PGA seem to peak closer to the mid-region of the rice leaf whereas they peak at the tip of the maize leaf (Supplementary Fig. 4). These observations are consistent with the slight enrichment of rice genes in cluster 1 and maize genes in cluster 3, as only correlated regions from the maize and rice leaf were used for clustering (Fig. 3).
Because the UDM enabled us to simultaneously interrogate the rice and maize gene expression profiles, we could then exploit the evo-lutionary distance between maize and rice as a phylogenetic filter to identify conserved cis-elements that are associated with genes encod-ing photosynthetic components. A modified ELEMENT algorithm19 was developed to incorporate a background correction for multispecies analyses (http://element.mocklerlab.org/). All candidate cis-elements identified in this study are listed in Supplementary Table 6. We then searched for motifs associated with photosynthesis using an Arabidopsis cis-element database for co-expressed genes AtCOECIS20, as some of the candidates enriched in maize and rice are also con-served in Arabidopsis thaliana. For instance, from cluster 6, we identi-fied the sequence ACGTAC (search term = GCCACGTN) as a motif found upstream of genes associated with photosynthesis. Similar results were observed in cluster 3, where candidate cis-elements such as ACGTGTC and CACGTA were conserved among maize, rice and A. thaliana (search term = CACGTGTC). Taken together, the clustering analysis indicates a conservation of putative trans-acting factors that regulate photosynthetic gene expression across angiosperm species. However, additional motifs that are not conserved between the grasses and A. thaliana and thus cannot be detected through this approach, might have driven the diversification of photosynthetic development between monocot and dicot lineages.
Candidate bundle sheath- and mesophyll-specific gene regulatorsA key feature in C4 photosynthesis is the partitioning of photosynthetic activities between two adjacent cell types. In maize, partitioning occurs largely through transcriptional control8. In a dicot system, it has been shown that a cis-element from a C4 plant can be recognized by a C3 plant and confers the same cell-specific pattern of expression on the C3 plant21. Thus, one mechanism of differential gene expression seems to be exploiting existing cis-elements that are conserved between C3 and
C4 species. To identify novel cis-elements that drive cell type–specific gene expression in C4 photosynthetic differentiation, we compared promoter sequences between maize and rice clusters enriched for photosynthesis-related genes, which include most C4 carbon shuttle genes (Fig. 3 and Supplementary Table 7). We examined sequences ≤3 kb upstream from the start codon of all maize and rice genes in these clusters and then searched for occurrences of ELEMENT-defined motifs in all maize genes from the same cluster. The occurrence (counts) was then tested for enrichment of genes that are highly dif-ferentially expressed between bundle sheath and mesophyll cells.
A putative cis element (RGCGR; R = A/G) was found to be over-represented in mesophyll-enriched genes in cluster 3. It was detected upstream of coding regions of several mesophyll-specific carbon shut-tle genes, including pyruvate orthophosphodikinase (PPDK), PPDK-regulatory protein (PPDKRP), phosphoenol pyruvate carboxylase (PEPC) and carbonic anhydrase (CA, also known as CAH ). To further examine this putative element, we used CoGe22 to extract synteny-based conserved sequences in the promoter regions of maize, sorghum, Setaria italica and rice CA genes. An ~60-bp region at roughly 120 bp upstream of the maize CA1 gene (http://genomevolution.org/r/7hwg) was found to be conserved in all four species (as visualized in Fig. 4 using Multialin23). However, the candidate cis element is only present in promoters of C4 grasses (maize, sorghum and S. italica), but is absent from rice. Interestingly, the motif is present multiple times in the promoter regions of photosynthetic genes of C4 grasses, a feature thought to increase the efficacy of cis-elements24 (Fig. 4).
A conserved motif WAAAG (W = T/A) was enriched in bundle sheath–specific genes and appears to be the core component of Dof transcription factors25. The maize PEPCK gene belongs to cluster 1 and may function in a C4 carbon shuttle26. We identified a highly conserved noncoding region upstream of PEPCK using CoGe that contained WAAAG motifs present as a reverse-complement tandem repeat within the sequence and that is conserved in both C4 and C3 grasses. Interestingly, the native rice PEPCK gene is also expressed in a cell type–specific manner (only in bundle sheath, vascular and epidermal cells)27. Thus, unlike the RGCGR motif, the WAAAG motif was likely recruited from ancestral C3 species to drive cell-specific gene expression. We speculate that the WAAAG element functions combinatorially with other motifs in C4 PEPCK genes to drive high levels of bundle-sheath-cell–specific gene expression.
In summary, we have developed an algorithm for ELEMENT to define candidate cis-regulatory elements that drive both bundle-sheath- and mesophyll-cell-specific gene expression. Additional can-didate cis-regulatory elements are shown in Supplementary Table 8. Some of these elements were further characterized using CoGe, and the results (Supplementary Table 8) suggest that the evolution of C4 photosynthesis exploited both novel and existing cis-elements to drive
RGCGR
WAAAG
Sb03g02917
GRMZM2G001696
1 2
2
1
3 4
Si003882mOs01g45274
Consensus
Sb01g040720Si034404m.gLOC_Os03g15050
Consensus
GRMZM2G121878
Figure 4 Candidate cis-regulatory elements for mesophyll and bundle sheath–specific expression. Putative cis-regulatory elements, RGCGR and WAAAG, were discovered by ELEMENT and CoGe. The alignment was generated based on sequences from sorghum, maize, rice and S. italica using Multialin23. Green and blue backgrounds indicate C4 and C3 species, respectively. Red boxes highlight the putative cis-regulatory elements, the blue box indicates that the putative element is found only in sorghum. Red letters are conserved among all species, blue lettering indicates intermediate conservation and black indicates lowest degrees of conservation.

©20
14 N
atu
re A
mer
ica,
Inc.
All
rig
hts
res
erve
d.
nature biotechnology advance online publication �
A rt i c l e s
cell-specific gene expression. Although further experimental valida-tion is needed to confirm the roles of these candidate cis-elements in grasses, we have created a computational pipeline that can greatly accelerate and facilitate this process.
Candidate regulators of C4 photosynthesisTranscriptional activators and repressors are likely to have crucial roles in mediating the cell-specific control of gene expression in C4 photosynthesis28–30. Using the well-defined 2,517 maize transcription factors extracted from the grass database Grassius (http://www.grassius.org/)31, we applied multiple criteria to select a subset of high-confidence transcription factors that were likely to be recruited from the C3 state to perform C4-related functions (Supplementary Table 9). This list contains putative maize transcrip-tion factors that meet the following criteria: (i) they are expressed above background noise in the leaf; (ii) there is a one-to-one cor-respondence with orthologous genes in rice to detect evolutionary divergence (based on synteny and sequence similarity); (iii) there is a consistent profile of differential gene expression in bundle sheath compared with mesophyll cells from two independent cell type–specific data sets8,32; and (iv) the maize transcription factors and their rice orthologs map to different UDM-generated gene clusters (Supplementary Fig. 3). The 118 transcription factors meeting all four criteria are strong candidates for genes that have been recruited from ancestral C3 functions to drive C4 photosynthetic cell type– specific gene expression. Further functional analysis of these candi-date transcription factors will help define their precise roles.
Components of architectural modificationsIn addition to biochemical specialization, C4 photosynthesis is associ-ated with unique anatomical features. These include a high vein density,
photosynthetic bundle sheath cells and in most NADP-mesophyll C4 grasses (including maize), suberized bundle sheath cells. Suberin is a heterogeneous polyester matrix with acyl-lipid–derived aliphatic and phenylpropanoid-derived aromatic monomer constituents33. Suberin lamellae in grass species are deposited beneath the primary cell walls of the root endo-and exodermis and of the leaf bundle and mestome sheath34. In submerged roots, development of extensive exodermal suberin lamellae is inversely correlated with radial O2 loss35. Thus, suberin lamellae function as a diffusion barrier and likely restrict gas exchange during C4 photosynthesis, particularly in NADP- mesophyll species where CO2-fixing plastids are tightly associated with the suberized bundle sheath–mesophyll interface36. However, suberin biosynthesis and its underlying regulation have not been defined in any monocot to date.
Using the transcriptome data, we constructed a putative suberin-biosynthesis pathway based on published maize and rice root endo-dermal monomer profiles36,37 (Fig. 5a, Supplementary Fig. 5 and Supplementary Table 10). The monomer distribution in maize bun-dle sheath and root endo- and exodermis is qualitatively similar to A. thaliana endodermis38. Thus, we identified maize homologs of the acyltransferase AtGPAT5, the fatty acid ω-hydroxylase AtCYP86B1 and the feruloyl transferase AtASFT/HHT that were implicated in suberin biosynthesis in A. thaliana endodermis39–42. In maize, two or more duplicated and unlinked loci show strong homology to each A. thaliana gene (Supplementary Table 10). Transcripts for these genes peak roughly 4 cm above leaf base, and then decline sharply (Fig. 5b and Supplementary Fig. 6a). Although all transcripts peak concur-rently in the UDM, peak expression of ZmASFT and ZmCYP86B occurs before ZmGPAT5 in the maize leaf gradient, which suggests phenolic suberin is synthesized before aliphatics, as previously indicated40,43. Furthermore, a putative suberin synthase homologous
a
20:0-FA
ASFT/?
CYP86B
GPAT5
Glycerol
2-MAG
GDSL
Polymers(2,3)
(1,2)
Total rice lociTotal maize loci
(7,8)
(1,2)
Ferulic acidCoumaric acid
Acyl-ferulateAcyl-coumarate
22:0-FA24:0-FA26:0-FA
20:0-DCAω-OH 20:0ω-OH 22:0ω-OH 24:0ω-OH 26:0ω-OH 28:0ω-OH 30:0
22:0-DCA24:0-DCA26:0-DCA28:0-FA
30:0-FA
b 450
400
350
300
1 2 3 4 5 6 7 8 9 10 11 12 13 14 15
Exp
ress
ion
(RP
KM
)
250
150
50
0
200
100
ZmCYP86BaZmCYP86BbZmGPAT5aZmGPAT5bZmASFTaZmASFTbZmASFTcZmGDSLa
cOsCYP86B3OsGPAT5OsASFTaOsASFTbOsGDSLaOsGDSLb
120
Exp
ress
ion
(RP
KM
)
100
60
20
0
80
40
1 2 3 4 5 6 7 8 9 10 11 12 13 14 15
d
ZmMYB164
ZmMYB48
OsWRKY14
ZmWRKY119OsMYB101
ZmMYB63
100
90
80
70
Exp
ress
ion
(RP
KM
)
60
30
10
0
50
20
40
1 2 3 4 5 6Unified developmental gradientUnified developmental gradient
7 8 9 10 11 12 13 14 15
Figure 5 Suberin biosynthesis and regulatory candidates. (a) A putative pathway for very long-chain fatty-acid oxidation and incorporation into the suberin polymer. Green text denotes suberin monomers detected in both maize and rice37,38; monomers listed in black are only detected in maize (Supplementary Fig. 4). ASFT, aliphatic suberin feruloyl transferase; CYP, cytochrome P450 hydroxylase/monooxygenase; DCA, alpha-omega dicarboxylic acid; FA, fatty acid; ω-OH, omega-hydroxy fatty acid; GDSL, glycine-aspartic acid-serine-leucine motif lipase/hydrolase GPAT, glycerol-3-phosphate acyltransferase; MAG, monoacylglycerol. (b) Expression patterns of maize suberin biosynthesis candidate genes along the unified developmental gradient. (c) Expression patterns of rice suberin-biosynthesis candidate genes along the unified developmental gradient. (d) Expression patterns of maize and rice transcription factors discovered based on homology to known Arabidopsis transcription factors controlling suberin biosynthesis.

©20
14 N
atu
re A
mer
ica,
Inc.
All
rig
hts
res
erve
d.
� advance online publication nature biotechnology
A rt i c l e s
to SlCD1, which polymerizes cutin monomers in the apoplast late in cutin biosynthesis44,45, peaks in section four of maize gradients (Fig. 5b and Supplementary Fig. 6a). Therefore, the maize devel-opmental gradient seems to resolve early and late stages of bundle sheath suberin synthesis into discrete groups. All eight maize suberin biosynthesis candidates belong to cluster 25 based on their UDM expression (Supplementary Table 10).
Peak transcript accumulation of maize suberin biosynthesis candi-dates coincides with the histochemical detection of suberin lamellae beginning 4 cm above the third leaf base in B73 (ref. 7). A simi-lar developmental pattern was observed for fourth leaves of W273 (ref. 46). This region is a transition zone that is characterized by chloroplast differentiation between bundle sheath and mesophyll cells. To investigate whether sheath suberization occurs concurrently with plastid development specifically in NADP-mesophyll C4 grasses, we identified rice homologs of our suberin biosynthesis candidates. All rice candidates are expressed strongly at the leaf base (Fig. 5c and Supplementary Fig. 6b), consistent with data from wheat leaves, where mestome-sheath suberin lamellae development is detectable beginning 7 mm from the base47. Thus, C4 (maize) bundle-sheath suberization occurs concurrently with plastid development, but C3 (rice) mestome-sheath suberization does not.
The narrow spatiotemporal region of suberin deposition in both species indicates that this process is likely under tight control. In maize, positive regulators of both lignin48,49 and cuticular wax50 peaked concurrently with a subset of their putative targets near the transition zone and base, respectively (Supplementary Fig. 7a,b). We mined cluster 25 to identify transcription factors co-expressed with the maize suberin biosynthesis candidates and identified four MYB (ZmMYB48, ZmMYB63, ZmMYB164, and ZmMYB97) and three WRKY (ZmWRKY119, ZmWRKY22, and ZmWRKY100) tran-scription factors with considerable transcript accumulation (Fig. 5d, Supplementary Fig. 6c and Supplementary Table 11). Furthermore, we identified canonical AtMYB4 (ref. 51) and W-Box52 binding motifs in the promoters of the maize suberin-biosynthesis candidates and their A. thaliana homologs53,54 (Supplementary Table 12). The closest A. thaliana homologs of ZmMYB48, ZmMYB63, ZmMYB164 and ZmWRKY119 are enriched in the suberized root endodermis55. Moreover, rice homologs of genes encoding these factors reach peak transcript abundance at the leaf base, concurrently with suberin biosynthesis candidates (Fig. 5c,d, Supplementary Fig. 6b,d and Supplementary Table 10). Thus, these regulatory candidates are co-expressed with putative biosynthesis gene targets in both monocot and dicot lineages, suggesting a strong conservation in endodermal and bundle sheath suberin developmental programs.
Visualization of transcripts and metabolitesOur comparative analysis provides the research community with a resource for analyzing gene expression and metabolite accumu-lation along the maize and rice leaf gradients. To make our data readily accessible, we provide data tables (Supplementary Tables 1 and 13) and visualization tools such as eFP Browsers56 (http://bar.utoronto.ca/Maize-Rice_eFP_Portal/), in which numerical data are represented by color intensity. We have developed eFP Browsers for maize and rice expression data, respectively, and merged maize-rice or rice-maize comparative views. Additionally, maize and rice transcriptome and maize metabolite data along the leaf may be visualized by two further eFP Browsers, which are linked through activated icons to the maize and maize-rice expression eFP Browsers if the corresponding gene has a metabolite or a measured enzymatic activity associated with it.
DISCUSSIONIn this report we have provided the most comprehensive characteri-zation of the maize and rice leaf transcriptomes and metabolomes to date. To interrogate this rich data set, we developed a statistical method to simultaneously examine maize and rice transcriptomics data along a calibrated leaf gradient (UDM). We demonstrate how a clustering method combining both K-means and hierarchical algo-rithms can be used to define cis- or trans-regulatory features using phylogenetic distance as a filter. Importantly, the UDM could also be applied to other plant or animal systems if common tissues or organs that the different species have in common are examined, such as mammalian heart tissues or rice and wheat endosperm.
By sampling maize and rice leaves at comparable points in devel-opment, we were able to examine convergent and divergent compo-nents of C3 and C4 differentiation. Surprisingly, the profile of several important C4 acids including malate was similar in maize and rice leaves, peaking in the expansion zone in both species. This could be interpreted as the asynchronous development of a C4 syndrome. A similar conclusion was recently reached by Pick et al.9, who found that different C4 metabolites peaked in different regions of the maize leaf. However, the analysis of malate levels in this study and the Pick et al.9 report were based on relative values. To explore the asynchro-nous development hypothesis further, we additionally determined the absolute levels of metabolites that are involved in the intercel-lular carbon shuttle of C4 photosynthesis, namely malate, pyruvate, triose phosphates and 3-phosphoglycerate. This analysis allowed us to evaluate whether the absolute concentrations of these metabolites are sufficient to support diffusion between the mesophyll and bundle sheath cells (Fig. 1b). Comparison of malate levels with models for intercellular diffusion57,58 revealed that malate concentrations in the expansion zone are roughly tenfold higher than those that are needed to drive diffusion of malate between the mesophyll and bundle sheath at the rate required to support C4 photosynthesis. Even though abso-lute malate levels are lower at the maize tip, they are still sufficient to drive the required rate of diffusion. Furthermore, though the abso-lute levels of pyruvate, triose phosphates and 3-phosphoglycerate are lower than malate’s (Supplementary Fig. 8), they are still high enough to drive intercellular metabolite shuttles in the expanding and mature segments of the maize leaf. Based on these observations, we propose that the majority of the malate pool is not directly involved in C4 pho-tosynthesis, but instead serves as a carbon reserve in the expanding regions of the leaf. Furthermore, our signatures of C4 photosynthesis indicate that at no point does the maize leaf utilize C3 photosynthesis as a default state, consistent with previous studies8,9.
To exploit the integrated analysis of transcriptomics data sets from two species, we mined cis-regulatory elements from clusters that contained both maize and rice genes. We defined both conserved and nonconserved elements upstream of genes encoding C4 carbon- shuttle enzymes that are expressed at different levels in bundle sheath and mesophyll cells, including a putative M-specific RGCGR (MeBox) and WAAAG (BsBox) motifs. Although the function(s) of these cis-regulatory elements has yet to be validated in transgenic systems, we can now prioritize motifs for future analyses based on several crite-ria, including synteny conservation (e.g., CoGe), over-representation (multiple occurrences in a promoter region) and enrichment (C3 versus C4). Thus, by integrating two species into a transcriptomic profiling experiment, we have enabled the evolutionary filtering of co-expression data sets.
Our approach of comparing transcriptomes and metabolomes dur-ing development between species could be more broadly applied to any biochemical, physiological or developmental network that changes

©20
14 N
atu
re A
mer
ica,
Inc.
All
rig
hts
res
erve
d.
nature biotechnology advance online publication �
A rt i c l e s
with leaf development. As previously shown, nearly 80% of the maize transcriptome is expressed in developing leaves8,59, therefore path-ways ranging from amino acid biosynthesis to nitrogen metabolism can be interrogated in the same fashion as has been demonstrated here for C4 photosynthesis. This approach could result in the identification of motifs that might be combinatorially arrayed to construct modules that respond to developmental, nutritional, biotic or abiotic signals and will serve as a platform for the synthetic design of promoter ele-ments to drive cell-type, developmental-stage or environmentally responsive gene networks.
Climate change, the degradation of arable lands and increasing population size are intensifying pressure on agricultural produc-tion systems30. One strategy to improve the productivity of staple crops is to endow them with C4 photosynthesis traits60. However, to realize this approach we will need to gain a much deeper under-standing of the biochemical and genetic networks that underpin photosynthetic development in grasses61. Here, we have exploited a comparative approach to define the molecular components of an anatomical innovation associated with C4 photosynthesis, a suberized photosynthetic bundle sheath, and to define several maize genes that have been recruited for the C4 carbon shuttle. To help visualize and interrogate these data, we developed community tools, including an eFP browser56 and gene expression tables that provide the richest set of integrated transcriptomics and metabolite data for maize and rice leaves to date. The discovery and characterization of a list of potential transcriptional regulators is necessary for the biochemical implemen-tation of C4 photosynthesis. The tools we have developed and the data sets we have reported in this study will provide a framework for a rational systems approach to the engineering of C4 photosynthesis in rice as part of an ongoing international effort6.
METhODSMethods and any associated references are available in the online version of the paper.
Accession codes. GEO: GSE54274.
Note: Any Supplementary Information and Source Data files are available in the online version of the paper.
ACKNoWLEDgMENTSWe thank J. Schnable for helpful comments and uploading the original sequencing data to the NCBI SRA (SRP018823). This research was supported by the National Science Foundation (IOS-1127017 to T.P.B., T.C.M., P. Liu and R.T.), the National Sciences and Engineering Research Council of Canada (to N.J.P.) and The Max-Planck Society and the European Union Framework 7 Program (3to4) (to A.R.F. and M.S.).
AUTHoR CoNTRIBUTIoNSL.W., M.S., A.R.F. and T.P.B. contributed to the design of the comparative transcriptomics and metabolic profiling, P.L., Y. Si, L.W. and T.P.B. to the design of the unified developmental model, and D.W.B. and T.C.M. to the design of the ELEMENT algorithm. Data visualization tools were developed by R.V.P. and N.J.P. All authors contributed to the design and execution of experiments and to the interpretation of data.
CoMPETINg FINANCIAL INTERESTSThe authors declare no competing financial interests.
reprints and permissions information is available online at http://www.nature.com/reprints/index.html.
1. Sage, R.F., Sage, T.L. & Kocacinar, F. Photorespiration and the evolution of C4 photosynthesis. Annu. Rev. Plant Biol. 63, 19–47 (2012).
2. Hibberd, J.M. & Covshoff, S. The regulation of gene expression required for C4 photosynthesis. Annu. Rev. Plant Biol. 61, 181–207 (2010).
3. Leakey, A.D. Rising atmospheric carbon dioxide concentration and the future of C4 crops for food and fuel. Proc. Biol. Sci. 276, 2333–2343 (2009).
4. Wheeler, T. & von Braun, J. Climate change impacts on global food security. Science 341, 508–513 (2013).
5. Conceição, P. & Mendoza, R.U. Anatomy of the global food crisis. Third World Q. 30, 1159–1182 (2009).
6. von Caemmerer, S., Quick, W.P. & Furbank, R.T. The development of C(4)rice: current progress and future challenges. Science 336, 1671–1672 (2012).
7. Weissmann, S. & Brutnell, T.P. Engineering C4 photosynthetic regulatory networks. Curr. Opin. Biotechnol. 23, 298–304 (2012).
8. Li, P. et al. The developmental dynamics of the maize leaf transcriptome. Nat. Genet. 42, 1060–1067 (2010).
9. Pick, T.R. et al. Systems analysis of a maize leaf developmental gradient redefines the current C4 model and provides candidates for regulation. Plant Cell 23, 4208–4220 (2011).
10. Nelson, T. The grass leaf developmental gradient as a platform for a systems understanding of the anatomical specialization of C(4) leaves. J. Exp. Bot. 62, 3039–3048 (2011).
11. Nunes-Nesi, A., Fernie, A.R. & Stitt, M. Metabolic and signaling aspects underpinning the regulation of plant carbon nitrogen interactions. Mol. Plant 3, 973–996 (2010).
12. Xu, G., Fan, X. & Miller, A.J. Plant nitrogen assimilation and use efficiency. Annu. Rev. Plant Biol. 63, 153–182 (2012).
13. Wang, L. et al. A low-cost library construction protocol and data analysis pipeline for Illumina-based strand-specific multiplex RNA-seq. PLoS ONE 6, e26426 (2011).
14. Hedges, S.B., Dudley, J. & Kumar, S. TimeTree: a public knowledge-base of divergence times among organisms. Bioinformatics 22, 2971–2972 (2006).
15. Alexa, A., Rahnenfuhrer, J. & Lengauer, T. Improved scoring of functional groups from gene expression data by decorrelating GO graph structure. Bioinformatics 22, 1600–1607 (2006).
16. Prioul, J.L., Brangeon, J. & Reyss, A. Interaction between external and internal conditions in the development of photosynthetic features in a grass leaf: II. Reversibility of light-induced responses as a function of developmental stages. Plant Physiol. 66, 770–774 (1980).
17. Miranda, V., Baker, N.R. & Long, S.P. Anatomical variation along the length of the Zea mays leaf in relation to photosynthesis. New Phytol. 88, 595–605 (1981).
18. Smith, A.M., Zeeman, S.C. & Smith, S.M. Starch degradation. Annu. Rev. Plant Biol. 56, 73–98 (2005).
19. Mockler, T.C. et al. The DIURNAL project: DIURNAL and circadian expression profiling, model-based pattern matching, and promoter analysis. Cold Spring Harb. Symp. Quant. Biol. 72, 353–363 (2007).
20. Piganeau, G., Vandepoele, K., Gourbiere, S., Van de Peer, Y. & Moreau, H. Unravelling cis-regulatory elements in the genome of the smallest photosynthetic eukaryote: phylogenetic footprinting in Ostreococcus. J. Mol. Evol. 69, 249–259 (2009).
21. Kajala, K. et al. Multiple Arabidopsis genes primed for recruitment into C(4) photosynthesis. Plant J. 69, 47–56 (2012).
22. Lyons, E. & Freeling, M. How to usefully compare homologous plant genes and chromosomes as DNA sequences. Plant J. 53, 661–673 (2008).
23. Corpet, F. Multiple sequence alignment with hierarchical clustering. Nucleic Acids Res. 16, 10881–10890 (1988).
24. Mehrotra, R. et al. Effect of copy number and spacing of the ACGT and GT cis elements on transient expression of minimal promoter in plants. J. Genet. 84, 183–187 (2005).
25. Yanagisawa, S. & Schmidt, R.J. Diversity and similarity among recognition sequences of Dof transcription factors. Plant J. 17, 209–214 (1999).
26. Wingler, A., Walker, R.P., Chen, Z.H. & Leegood, R.C. Phosphoenolpyruvate carboxykinase is involved in the decarboxylation of aspartate in the bundle sheath of maize. Plant Physiol. 120, 539–546 (1999).
27. Nomura, M. et al. Differential expression pattern of C4 bundle sheath expression genes in rice, a C3 plant. Plant Cell Physiol. 46, 754–761 (2005).
28. Zinger, L., Coissac, E., Choler, P. & Geremia, R.A. Assessment of microbial communities by graph partitioning in a study of soil fungi in two Alpine meadows. Appl. Environ. Microbiol. 75, 5863–5870 (2009).
29. Wang, L., Peterson, R.B. & Brutnell, T.P. Regulatory mechanisms underlying C(4) photosynthesis. New Phytol. 190, 9–20 (2011).
30. Tilman, D., Balzer, C., Hill, J. & Befort, B.L. Global food demand and the sustainable intensification of agriculture. Proc. Natl. Acad. Sci. USA 108, 20260–20264 (2011).
31. Yilmaz, A. et al. GRASSIUS: a platform for comparative regulatory genomics across the grasses. Plant Physiol. 149, 171–180 (2009).
32. Chang, Y.M. et al. Characterizing regulatory and functional differentiation between maize mesophyll and bundle sheath cells by transcriptomic analysis. Plant Physiol. 160, 165–177 (2012).
33. Ranathunge, K., Schreiber, L. & Franke, R. Suberin research in the genomics era-New interest for an old polymer. Plant Sci. 180, 399–413 (2011).
34. Eastman, P.A.K., Dengler, N.G. & Peterson, C.A. Suberized bundle sheaths in grasses (Poaceae) of different photosynthetic types. 1. Anatomy, ultrastructure and histochemistry. Protoplasma 142, 92–111 (1988).
35. Kotula, L., Ranathunge, K., Schreiber, L. & Steudle, E. Functional and chemical comparison of apoplastic barriers to radial oxygen loss in roots of rice (Oryza sativa L.) grown in aerated or deoxygenated solution. J. Exp. Bot. 60, 2155–2167 (2009).
36. Schreiber, L., Franke, R., Hartmann, K.D., Ranathunge, K. & Steudle, E. The chemical composition of suberin in apoplastic barriers affects radial hydraulic conductivity differently in the roots of rice (Oryza sativa L. cv. IR64) and corn (Zea mays L. cv. Helix). J. Exp. Bot. 56, 1427–1436 (2005).

©20
14 N
atu
re A
mer
ica,
Inc.
All
rig
hts
res
erve
d.
� advance online publication nature biotechnology
A rt i c l e s
37. Zeier, J., Ruel, K., Ryser, U. & Schreiber, L. Chemical analysis and immunolocalisation of lignin and suberin in endodermal and hypodermal/rhizodermal cell walls of developing maize (Zea mays L.) primary roots. Planta 209, 1–12 (1999).
38. Franke, R. et al. Apoplastic polyesters in Arabidopsis surface tissues–a typical suberin and a particular cutin. Phytochemistry 66, 2643–2658 (2005).
39. Beisson, F., Li, Y.H., Bonaventure, G., Pollard, M. & Ohlrogge, J.B. The acyltransferase GPAT5 is required for the synthesis of suberin in seed coat and root of Arabidopsis. Plant Cell 19, 351–368 (2007).
40. Compagnon, V. et al. CYP86B1 Is required for very long chain omega-hydroxyacid and alpha,omega-dicarboxylic acid synthesis in root and seed suberin polyester. Plant Physiol. 150, 1831–1843 (2009).
41. Gou, J.Y., Yu, X.H. & Liu, C.J. A hydroxycinnamoyltransferase responsible for synthesizing suberin aromatics in Arabidopsis. Proc. Natl. Acad. Sci. USA 106, 18855–18860 (2009).
42. Molina, I., Li-Beisson, Y., Beisson, F., Ohlrogge, J.B. & Pollard, M. Identification of an Arabidopsis feruloyl-coenzyme A transferase required for suberin synthesis. Plant Physiol. 151, 1317–1328 (2009).
43. Naseer, S. et al. Casparian strip diffusion barrier in Arabidopsis is made of a lignin polymer without suberin. Proc. Natl. Acad. Sci. USA 109, 10101–10106 (2012).
44. Isaacson, T. et al. Cutin deficiency in the tomato fruit cuticle consistently affects resistance to microbial infection and biomechanical properties, but not transpirational water loss. Plant J. 60, 363–377 (2009).
45. Yeats, T.H. et al. The identification of cutin synthase: formation of the plant polyester cutin. Nat. Chem. Biol. 8, 609–611 (2012).
46. Evert, R.F., Russin, W.A. & Bosabalidis, A.M. Anatomical and ultrastructural changes associated with sink-to-source transition in developing maize leaves. Int. J. Plant Sci. 157, 247–261 (1996).
47. O’Brien, T.P. & Kuo, J. Development of the suberized lamella in the mestome sheath of wheat leaves. Aust. J. Bot. 23, 783–794 (1975).
48. Zhong, R., Lee, C., Zhou, J., McCarthy, R.L. & Ye, Z.H. A battery of transcription factors involved in the regulation of secondary cell wall biosynthesis in Arabidopsis. Plant Cell 20, 2763–2782 (2008).
49. Zhou, J., Lee, C., Zhong, R. & Ye, Z.H. MYB58 and MYB63 are transcriptional activators of the lignin biosynthetic pathway during secondary cell wall formation in Arabidopsis. Plant Cell 21, 248–266 (2009).
50. Javelle, M. et al. Overexpression of the epidermis-specific homeodomain-leucine zipper IV transcription factor OUTER CELL LAYER1 in maize identifies target genes involved in lipid metabolism and cuticle biosynthesis. Plant Physiol. 154, 273–286 (2010).
51. Lois, R., Dietrich, A., Hahlbrock, K. & Schulz, W. A phenylalanine ammonia-lyase gene from parsley: structure, regulation and identification of elicitor and light responsive cis-acting elements. EMBO J. 8, 1641–1648 (1989).
52. Rushton, P.J. et al. Interaction of elicitor-induced DNA-binding proteins with elicitor response elements in the promoters of parsley PR1 genes. EMBO J. 15, 5690–5700 (1996).
53. Palaniswamy, S.K. et al. AGRIS and AtRegNet. a platform to link cis-regulatory elements and transcription factors into regulatory networks. Plant Physiol. 140, 818–829 (2006).
54. Davuluri, R.V. et al. AGRIS: Arabidopsis gene regulatory information server, an information resource of Arabidopsis cis-regulatory elements and transcription factors. BMC Bioinformatics 4, 25 (2003).
55. Mustroph, A. et al. Profiling translatomes of discrete cell populations resolves altered cellular priorities during hypoxia in Arabidopsis. Proc. Natl. Acad. Sci. USA 106, 18843–18848 (2009).
56. Winter, D. et al. An “Electronic Fluorescent Pictograph” browser for exploring and analyzing large-scale biological data sets. PLoS ONE 2, e718 (2007).
57. Stitt, M. & Heldt, H.W. Generation and maintenance of concentration gradients between the mesophyll and bundle sheath in maize leaves. Biochimica et Biophysica Acta (BBA). Bioenergetics 808, 400–414 (1985).
58. Hatch, M. & Osmond, C. Compartmentation and transport in C4 photosynthesis. Encyclopedia of plant physiology, New Series 3, 144–184 (1976).
59. Schnable, P.S. et al. The B73 maize genome: complexity, diversity, and dynamics. Science 326, 1112–1115 (2009).
60. Mitchell, P.L. & Sheehy, J.E. Supercharging rice photosynthesis to increase yield. New Phytol. 171, 688–693 (2006).
61. Mallmann, J. et al. The role of photorespiration during the evolution of C4 photosynthesis in the genus Flaveria. Elife e02478 (2014).

©20
14 N
atu
re A
mer
ica,
Inc.
All
rig
hts
res
erve
d.
nature biotechnologydoi:10.1038/nbt.3019
ONLINE METhODSPlant growth and RNA-sequencing experiment. Maize and rice growth conditions were described previously8,13. Nine-day-old third leaves of maize were cut into 15 1-cm segments; samples were pooled from an average of seven plants per biological replicate and six biological replicates in total were collected on different dates. 14-day-old third leaves of rice were cut into 11 2-cm segments, samples were pooled from an average of 15 plants per bio-logical replicate and four replicates in total were collected. Total RNA was extracted using TRIzol (Invitrogen, CA) following the manufacturer’s sug-gestion. Subsequent RNA-seq library construction procedures are detailed in Supplementary Note 1. A total of 90 maize and 44 rice leaf libraries were indexed/pooled and sequenced on the Illumina HiSeq 2000 machine, reads were sequenced, deconvoluted and filtered using the manufacturer’s default pipeline and parameters. The reads were aligned to the maize reference genome B73 AGPv2 using Tophat62. Supplementary Table 14 shows the read mapping statistics. Read counting and calculation of RPKM were described previously13, and later verified with Cuffdiff63. The variance between repli-cates is small, as indicated in Supplementary Figure 9. The average Pearson correlation between rice replicates is 0.95 + −0.07. The average Pearson correlation between maize replicates is 0.95 + −0.07. Post-processing of the reads and calculation of RPKM were described previously13. Reads were pooled from individual biological replicates to achieve deeper coverage of genes expressed at low levels8.
Determination of maize and rice orthologs. Orthologous maize and rice genes were determined first by combining the results from a number of known methods, including BBH-LS64, Ensembl65, MSOAR2 (ref. 66), INPARANOID67 and ORTHOMCL68. The results from individual methods were assembled into a nonredundant exhaustive list of orthologous pairs in many-to-many relation-ships that were then filtered to identify one-to-one orthologous gene pairs by choosing the pairs with highest correlation based on nonfitted expression data along the rice and maize leaf gradients.
Constructing a unified maize-rice leaf developmental model. To define the unified maize-rice leaf developmental gradient and map each leaf section onto this hypothetical coordinate (Fig. 2), we developed an iterative computational algorithm as detailed below.
Suppose maize leaf segment i(i = 1…I) is mapped to the developmental gradient Ui (U1 < U2 < … < UI), and rice leaf segment j( j = 1…J) mapped to the developmental gradient Vj (V1 < V2 < … < VJ) (Supplementary Fig. 10).
Given the values U = (U1 … UI) and V = (V1 … VJ), we model the expected value of the gene expressions (RPKM values) of maize gene H of segment i(Xji) as following:
[( ( )] ) ( | , , , ) exp(E X f U U U Ugi i gx
gx
gx
gx
gx
gx
i gx
i gx= = + + +m a b g m a b g2
ii3)
Similarly, we have the model for rice gene h of segment j(yhi):
[( ( )] ) ( | , , , ) exp(E Y f V V V Vhj j hy
hy
hy
hy
hy
hy
j hy
j hy= = + + +m a b g m a b g2
jj3)
Note that we use a 3rd-degree polynomial function to model the logarithm of RPKM values. Based on our empirical analysis, this model is adequate and flexible enough to capture most gene expression patterns and at the same time avoid overfitting. The model parameters mg
x and mhy represent the
baseline gene expressions at Ui = 0 and Vj = 0, respectively, for maize gene H and rice gene h. The parameters q a b gg
xgx
gx
gx= ( , , ) and q a b gh
yhy
hy
hy= ( , , )
capture the gene expression patterns along the leaf gradients and these parameters are our main interest. The goodness of fit of the model is evaluated by correlation.
Given the values of U and V, we can estimate the expression profiles using the above models. Given a set of genes whose expression profiles are shared between maize and rice, we then can refine the gradients by estimating U and V. Repeating these two steps results in an iterative algorithm. However, we found that some orthologous genes are not suitable for defining the developmental gradients, because they do not share similar expression patterns in the two spe-cies. To overcome this problem we added steps in the algorithm to select a set
of “anchor” genes, which were a subgroup of orthologous genes from the two transcriptomes that share highly similar expression patterns, to unify the devel-opmental gradients. Specifically, we started with two groups of 20,656 maize and 17,634 rice orthologous genes and filtered down to 9,845 one-to-one pairs with highest correlation. We then refined the number of ‘anchor genes’ down to 3,559 using the method described below (Supplementary Table 15).
The following iterative algorithm simultaneously selects anchor genes, estimates gene expression profiles and estimates the developmental gradients U and V.
Algorithm:1. Initialize. We set
U ui kk
i=
=∑1
and
V vj kk
j=
=∑1
for uk > 0 and vk > 0. For the initial step, we set uk = 1/I and vk = 1/J for every k.2. Estimate the shared pattern of ortholog pairs. Denote the set of ortholo-
gous gene pairs as O. For any pair (g, h) ∈ O, we estimate the shared pattern parameters by maximizing the correlation between the observed and predicted gene expressions:
m q q mgg
Xg f U gx
gx
g Yh f V hy* [({ , ( | , )])] , ( | ,= = +argmax Corr[ Corr[ qq qh
yg+ )]}
3. Obtain the one-to-one analogous gene pairs. The orthologs were in a many-
to-many relationship. We select one-to-one pairs by two steps. First, we select the rice gene that gives the highest value of
Corr[X P Ug gx
g, ( | )]*q q=
when paired with maize gene µ as calculated in step 2. Then, each maize gene is only paired with one rice gene after the first step. Second, among the remaining pairs, we select the maize gene that gives the highest value of Corr[Y P Vh h
yg, ( | )]*q q= for each rice gene hi. After the two steps, we get the
set of one-to-one ortholog gene pairs, and we denote the set as O−.4. Select anchor genes. A pair of orthologous genes are selected to be anchor
genes if the observed gene expressions for both species have a correlation higher than 0.8 with their shared patterns estimated from step 2:
ˆ {( , ) * : , ˆ ] . & , ˆ ] . }X A g h O X X Yh Yh= ∈ > >Corr[ g g Corr[0 8 0 8
Where Xg and Yg are the fitted values based on the model estimated from step 2.
5. Refine estimates of gradients using anchor genes. Using the newly defined anchor genes where q qg g= * , we re-estimate U and V. As described in step 1,
U ui kk
i=
=∑1
and
V vj kk
j=
=∑1
We maximize the sum of the correlations between the observed patterns and the fitted ones:
{ , }
[ , ( |
* , * . ( , )
u v
X f U
i
uiui
vvj
g h Ag g
x
j
j
=
=< ∈
∑argmax Corr0.9< 1 1
q q gg h hy
gY f V)] , ( | )]+ =
Corr[ q q

©20
14 N
atu
re A
mer
ica,
Inc.
All
rig
hts
res
erve
d.
nature biotechnology doi:10.1038/nbt.3019
where ui* and vj* represent the values of ui or vj from previous steps. We search for the refined values of ui and vj within a range of ratios (between 0.9 and 1.1) when compared to their previous values in order to reduce the computation complexity.
6. Iterate. Repeat steps 2–5 until the estimates of U and V become stable. In our analysis, five rounds of iterations were adequate.
Applying the algorithm described above to the integrative analyses of three or more species is straightforward except that more computation is needed. Additionally, our algorithm is flexible, and it can be adapted to other models of expression profiles and criteria of model fit. R scripts used for constructing the UDM are provided in Supplementary Note 2.
Co-clustering the fitted maize and rice gene expressions. After establishing the unified gradients, U and V, we fit the expression patterns, f U g
x( | )q , andf V h
y( | )q using gene expressions Xg and Yh for each gene µ of maize and each gene h of rice, respectively.
Before clustering, genes with no clearly defined expression patterns were removed because these genes are of much less interest in the scope of our study due to low expression and/or their noisy nature. Genes whose corre-lations between observed patterns and fitted ones are >0.6 are kept in the cluster analysis.
To obtain data vectors to cluster the expression patterns of all selected maize and rice genes, we took N = 15 points on the fitted expression profiles for each gene. These points correspond to the same N equally spaced gradients [(T]1 … TN) with T1 <T2< … < TN, T1 = max(U1, V1), and Th = min(U1, V1). Hence, only the region shared between maize and rice observed profiles is used for cluster analysis.
A hybrid hierarchical clustering algorithm was used for the cluster analysis. First we performed K-means clustering based on Pearson correlation with K = 50 (Supplementary Fig. 11). We then merged two clusters with highest correlation based on average linkage at a time. We stopped the merging when none of any two different clusters had an average correlation above 0.9. We obtained K = 30 clusters for the final result (Supplementary Fig. 3).
Functional enrichment analysis. Genome annotations was updated using the most recent released data for maize (http://maizesequence.org/index.html) and rice (http://rice.plantbiology.msu.edu/) as input for the BLAST2GO soft-ware69. Unique full-length protein sequences were used for BLAST and the resulting GO annotations were converted into the format that is compatible with TopGO package for R15. We then followed the standard TopGO proce-dures detailed in its manual15 with Fisher’s statistical test that generated three tables; they contained the functional enrichment results for all 30 clusters covering three GO classes: Biological Processes (Supplementary Table 16), Molecular Functions (Supplementary Table 17) and Cellular Component (Supplementary Table 18).
Discovering candidate cis-elements with ELEMENT program. ELEMENT is composed of several modules, each responsible for a single specific task and is invoked separately. First, the “bground” module is used to interrogate background statistics, generally over a set of all promoter sequences in a given species, and is responsible for counting and outputting statistics for each input word or motif over each such promoter sequence. Second, count is used to interrogate foreground statistics, generally over a related subset of all promot-ers in a given species or group of species, and is responsible for counting and outputting statistics for each input motif, over each input foreground promoter sequence, given the background statistics calculated via “bground”. Third, filter is used to reduce large sets of results to only those that are significant, filter examines each word and respective statistics generated by count, using Benjamini-Hochberg FDR set at 5%, and then outputs only results found to be significant. Fourth, cluster is used to cluster motifs found to be significant by organizing those which are similar. More detailed about ELEMENT can be found online at http://element.mocklerlab.org/.
Screening candidate C4-related cis-elements. We used a combined approach with ELEMENT and enrichment analysis using two-sided Wilcoxon rank-sum statistics to test for potential candidate cis-elements that contribute to cell-type
specificity. First we built a list of genes that are enriched either in bundle sheath or mesophyll cells in maize leaf tissue based on two previously published data sets8,32. When the differential expression is confirmed in both experiments, we labeled the corresponding gene as cell-type specific. We then counted the occurrences of each cis-element by ELEMENT from cluster 3 and their reverse-complement sequences in the 3 kb upstream regions of all genes from cluster 3. Wilcoxon rank-sum–derived P-values are calculated based on both bundle sheath– and mesophyll-enriched genes and for all nucleotide patterns. The ones that passed the filter were visualized using WebLogo70.
Validating RNA-seq results and the unified model using qRT-PCR. Plant materials for validation were grown independently using the same conditions as previously described: the soil used for both maize and rice was a mix of 75% Metro 360 and 25% Turface MVP. Three biological replicates of maize and rice were used.
RNA samples from each segment were extracted as previously described. Total RNA was treated by DNase I (Roche, CA) before cDNA synthesis using Transcriptior First Strand cDNA Synthesis Kit (Roche, CA) and the Anchored Oligo-dT primer. Two cDNA preparations were performed for each sample along with a negative control without reverse transcriptase.
One maize gene and one rice gene were chosen from 14 of the 30 clusters constructed by the model representing various combinations of gene expres-sion levels and cluster sizes. In order to accurately represent the gene-centric RNA seq results, the selected sequences representing all transcript isoforms of the target gene. Primers were designed using Oligo 7. Primer sequences, cluster number, are listed in Supplementary Table 4.
Two stable reference genes from maize (GRMZM2G157598) and rice (LOC_Os11g34450) samples were chosen based on the RNA-sequencing results from this and previous publications. Control gene assays gave statisti-cally stable expression across all segments and normalization factors were calculated by geometric averaging of the two control genes’ expression levels using BestKeeper software. Quantification of target gene expressions were calculated relative to the calibrator gene using advanced relative quantification in the LightCycler 480 SW 1.5 software (Roche, CA). In each segment, the ratio of the expression level of the calibrator gene to the target gene was calculated using the software. The ratios were plotted as expression patterns along the developmental segments (Supplementary Fig. 2). Reactions were run with LightCycler 480 SYBR Green I Master (Roche, CA) in a Roche LightCycler 480 II Real-Time PCR machine using following program: 95 °C for 5 min, 45 cycles of 10 s at 95 °C, 10 s at 60 °C, and 10 s at 72 °C, followed by 1 cycle of 95 °C for 5 s and 65 °C for 1 min; samples were left at 95 °C without cooling. Three technical replicates of each sample were included in the qPCR experiment.
Measurements of maize and rice metabolites. Leaf samples from maize and rice plants used for metabolite measurements were grown at the same conditions as described previously. Sections from 20-30 plants were pooled for each maize sample and 30–40 for each rice sample. Six biological samples were prepared for maize and four for rice. Frozen leaf material at −80 °C was ground to a fine powder using a cryogenic grinding robot prototype (Labman, Newcastle, UK). Sample subaliquots for the different analyses were either weighed by the robot or by hand using an analytical balance and were constantly kept at freezing temperatures.
Secondary metabolite analysis by liquid chromatography–mass spec-trometry (MS) was performed on high-performance liquid chromatography (HPLC) system Surveyor (Thermo Finnigan, USA) coupled to Finnigan LTQ-XP system (Thermo Finnigan, USA) as described by Tohge and Fernie71. All data were processed using Xcalibur 2.1 software (Thermo Fisher Scientific, Waltham, USA). The obtained data matrix of peak area was normalized using the internal standard (sinigrin, CAS: 3952-98-5). Metabolite identification and annotation were performed using metabolite databases72 and literature survey of Zea mays73,74 and monocot species75,76. Gas chromatography–MS metabolite profiling and carbon starvation experiments were conducted as described in Tohge et al.75. Enzyme activity measurements were conducted as previously described77,78 using an established semi-robotized, 96-well micro-titer plate platform.
©20
14 N
atu
re A
mer
ica,
Inc.
All
rig
hts
res
erve
d.
nature biotechnologydoi:10.1038/nbt.3019
62. Trapnell, C., Pachter, L. & Salzberg, S.L. TopHat: discovering splice junctions with RNA-Seq. Bioinformatics 25, 1105–1111 (2009).
63. Trapnell, C. et al. Differential analysis of gene regulation at transcript resolution with RNA-seq. Nat. Biotechnol. 31, 46–53 (2013).
64. Zhang, M. & Leong, H.W. BBH-LS: an algorithm for computing positional homologs using sequence and gene context similarity. BMC Syst. Biol. 6 (suppl. 1), S22 (2012).
65. Hubbard, T. et al. The Ensembl genome database project. Nucleic Acids Res. 30, 38–41 (2002).
66. Shi, G., Zhang, L. & Jiang, T. MSOAR 2.0: Incorporating tandem duplications into ortholog assignment based on genome rearrangement. BMC Bioinformatics 11, 10 (2010).
67. Ostlund, G. et al. InParanoid 7: new algorithms and tools for eukaryotic orthology analysis. Nucleic Acids Res. 38, D196–D203 (2010).
68. Chen, F., Mackey, A.J., Stoeckert, C.J. Jr. & Roos, D.S. OrthoMCL-DB: querying a comprehensive multi-species collection of ortholog groups. Nucleic Acids Res. 34, D363–D368 (2006).
69. Götz, S. et al. High-throughput functional annotation and data mining with the Blast2GO suite. Nucleic Acids Res. 36, 3420–3435 (2008).
70. Crooks, G.E., Hon, G., Chandonia, J.M. & Brenner, S.E. WebLogo: a sequence logo generator. Genome Res. 14, 1188–1190 (2004).
71. Tohge, T. & Fernie, A.R. Combining genetic diversity, informatics and metabolomics to facilitate annotation of plant gene function. Nat. Protoc. 5, 1210–1227 (2010).
72. Tohge, T. & Fernie, A.R. Web-based resources for mass-spectrometry-based metabolomics: A user’s guide. Phytochemistry 70, 450–456 (2009).
73. Elliger, C.A., Chan, B.G., Waiss, A.C., Lundin, R.E. & Haddon, W.F. C-glycosylflavones from Zea-mays that inhibit insect development. Phytochemistry 19, 293–297 (1980).
74. Snook, M.E. et al. New C-4″-hydroxy derivatives of maysin and 3′-methoxymaysin isolated from corn silks (Zea-mays). J. Agric. Food Chem. 43, 2740–2745 (1995).
75. Tohge, T. et al. Toward the storage metabolome: profiling the barley vacuole. Plant Physiol. 157, 1469–1482 (2011).
76. Matsuda, F. et al. Dissection of genotype-phenotype associations in rice grains using metabolome quantitative trait loci analysis. Plant J. 70, 624–636 (2012).
77. Gibon, Y. et al. A robot-based platform to measure multiple enzyme activities in Arabidopsis using a set of cycling assays: Comparison of changes of enzyme activities and transcript levels during diurnal cycles and in prolonged darkness. Plant Cell 16, 3304–3325 (2004).
78. Sulpice, R. et al. Network analysis of enzyme activities and metabolite levels and their relationship to biomass in a large panel of Arabidopsis accessions. Plant Cell 22, 2872–2893 (2010).