Channelling the future? The use of seasonal climate forecasts in climate adaptation
Upload
khangminh22Category
view
3download
0
February 2011
FINAL REPORT
Community-based Adaptation to Climate Change in Durban
REPO
RT
Report Number. 11977-10286-9 Distribution:1 copy - eThekwini Municipality 2 copies - Golder Associates Africa (Pty) Ltd
Submitted to:eThekwini Municipality 166 K E Masinga Road Durban 4000

COMMUNITY-BASED ADAPTATION - DURBAN
February 2011 Report No. 11977-10286-9 i
Table of Contents
1.0 INTRODUCTION ........................................................................................................................................................ 1
2.0 OVERVIEW OF SUB-PROJECTS ............................................................................................................................. 1
2.1 Sub-project 1: Vulnerability assessment and adaptation planning ................................................................ 2
2.2 Sub-project 2: Food security pilot ................................................................................................................. 2
2.3 Sub-project 3: Water harvesting feasibility assessment and pilot ................................................................. 3
3.0 SELECTED COMMUNITIES ...................................................................................................................................... 3
4.0 SUB-PROJECT 1: VULNERABILITY ASSESSMENT AND ADAPTATION PLANNING ......................................... 4
4.1 Social vulnerability assessment - methodology ............................................................................................ 5
4.1.1 Data collection and analysis .................................................................................................................... 5
4.1.2 Quantitative data collection - survey ....................................................................................................... 5
4.1.3 Qualitative data collection tools ............................................................................................................... 6
4.1.4 Ground-truthing exercise ......................................................................................................................... 7
4.1.5 Biophysical Setting - Ntuzuma ................................................................................................................ 7
4.1.6 Social vulnerability .................................................................................................................................. 9
4.1.7 Biophysical Setting - Ntshongweni ........................................................................................................ 12
4.1.8 Social vulnerability ................................................................................................................................ 14
4.2 Vulnerability assessment ............................................................................................................................ 17
4.3 Adaptation plan ........................................................................................................................................... 24
4.3.1 Social programme to increase social resilience .................................................................................... 24
4.3.2 Climate change specific adaptation ...................................................................................................... 24
4.3.3 Adaptation plan methodology ................................................................................................................ 25
4.3.4 Adaptation planning constraints ............................................................................................................ 34
4.4 Closing remark on vulnerability and adaptation .......................................................................................... 35
5.0 SUB-PROJECT 2: FOOD SECURITY PILOTS ....................................................................................................... 35
5.1 Preliminary food security survey and initial crop projections ....................................................................... 35
5.1.1 Survey approach ................................................................................................................................... 36
5.1.2 Food Expenditure and Consumption ..................................................................................................... 37
5.1.3 Projected impacts of climate change on crops ...................................................................................... 38
5.2 Food security trials ...................................................................................................................................... 40
5.2.1 Study purpose ....................................................................................................................................... 41

COMMUNITY-BASED ADAPTATION - DURBAN
February 2011 Report No. 11977-10286-9 ii
5.2.2 Background on each site ....................................................................................................................... 42
5.2.3 Methodology ......................................................................................................................................... 43
5.2.4 Results .................................................................................................................................................. 68
5.2.5 Discussion ............................................................................................................................................. 78
5.3 Cook-off workshops .................................................................................................................................... 80
5.3.1 Cook-off events ..................................................................................................................................... 82
5.3.2 Summary of cook-off activities .............................................................................................................. 85
5.4 Closing remark on food security pilots ........................................................................................................ 85
6.0 SUB-PROJECT 3: WATER HARVESTING FEASIBILITY ASSESSMENT AND PILOT ........................................ 86
6.1 Water harvesting techniques ...................................................................................................................... 86
6.1.1 Advantages of water harvesting ............................................................................................................ 86
6.2 Water harvesting in and around Durban ..................................................................................................... 87
6.2.1 Methodology ......................................................................................................................................... 87
6.2.2 Amaoti ................................................................................................................................................... 87
6.2.3 Ntshongweni ......................................................................................................................................... 87
6.2.4 Inanda ................................................................................................................................................... 88
6.2.5 Selection procedure .............................................................................................................................. 89
6.2.6 Municipal water harvesting initiative in Durban ..................................................................................... 89
6.2.7 Water harvesting initiatives in other KwaZulu-Natal communities ......................................................... 90
6.2.8 Technology matrix ................................................................................................................................. 90
6.3 Water harvesting pilot project ..................................................................................................................... 91
6.3.1 Interaction with the Agricultural Management Unit (AMU) ..................................................................... 92
6.3.2 Potential sites ........................................................................................................................................ 92
6.4 Selected water harvesting pilot projects ................................................................................................... 102
6.4.1 Closing remarks on water harvesting sub-project ............................................................................... 111
7.0 FINAL CONCLUSIONS ......................................................................................................................................... 113
8.0 REFERENCES ....................................................................................................................................................... 113
COMMUNITY-BASED ADAPTATION - DURBAN
February 2011 Report No. 11977-10286-9 iii
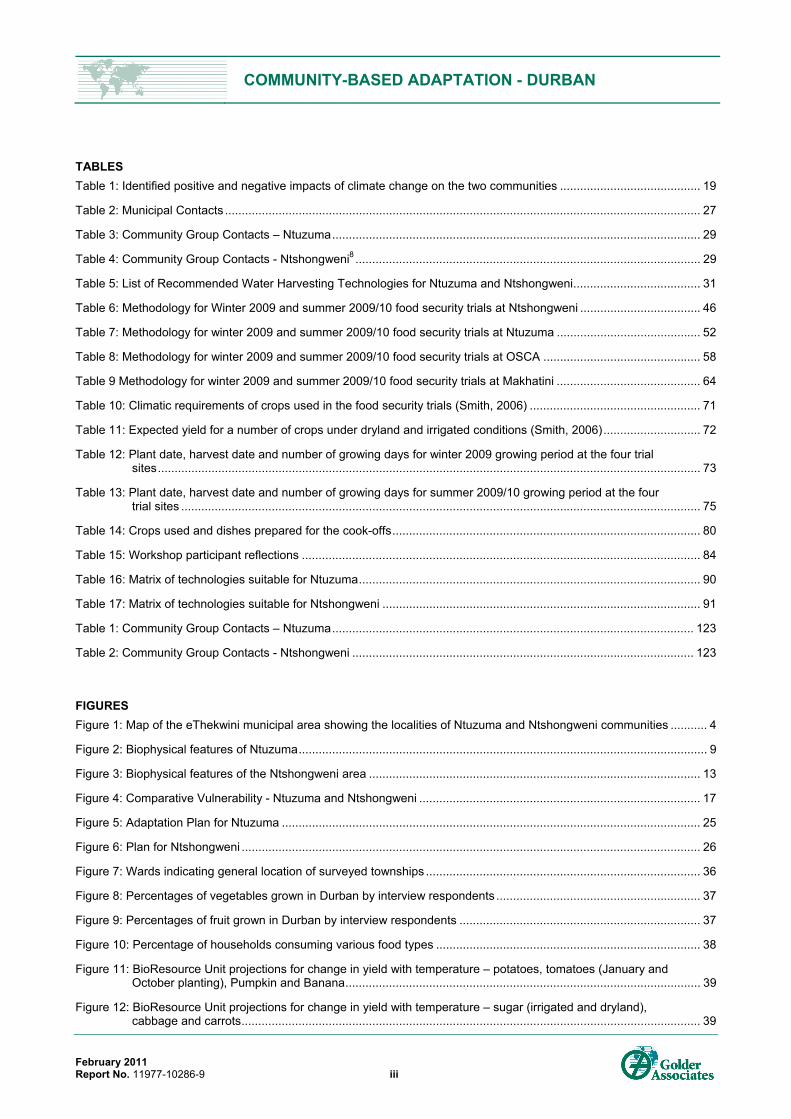
TABLES Table 1: Identified positive and negative impacts of climate change on the two communities .......................................... 19
Table 2: Municipal Contacts .............................................................................................................................................. 27
Table 3: Community Group Contacts – Ntuzuma .............................................................................................................. 29
Table 4: Community Group Contacts - Ntshongweni8 ....................................................................................................... 29
Table 5: List of Recommended Water Harvesting Technologies for Ntuzuma and Ntshongweni ...................................... 31
Table 6: Methodology for Winter 2009 and summer 2009/10 food security trials at Ntshongweni .................................... 46
Table 7: Methodology for winter 2009 and summer 2009/10 food security trials at Ntuzuma ........................................... 52
Table 8: Methodology for winter 2009 and summer 2009/10 food security trials at OSCA ............................................... 58
Table 9 Methodology for winter 2009 and summer 2009/10 food security trials at Makhatini ........................................... 64
Table 10: Climatic requirements of crops used in the food security trials (Smith, 2006) ................................................... 71
Table 11: Expected yield for a number of crops under dryland and irrigated conditions (Smith, 2006) ............................. 72
Table 12: Plant date, harvest date and number of growing days for winter 2009 growing period at the four trial sites .................................................................................................................................................................. 73
Table 13: Plant date, harvest date and number of growing days for summer 2009/10 growing period at the four trial sites ........................................................................................................................................................... 75
Table 14: Crops used and dishes prepared for the cook-offs ............................................................................................ 80
Table 15: Workshop participant reflections ....................................................................................................................... 84
Table 16: Matrix of technologies suitable for Ntuzuma ...................................................................................................... 90
Table 17: Matrix of technologies suitable for Ntshongweni ............................................................................................... 91
Table 1: Community Group Contacts – Ntuzuma ............................................................................................................ 123
Table 2: Community Group Contacts - Ntshongweni ...................................................................................................... 123
FIGURES Figure 1: Map of the eThekwini municipal area showing the localities of Ntuzuma and Ntshongweni communities ........... 4
Figure 2: Biophysical features of Ntuzuma .......................................................................................................................... 9
Figure 3: Biophysical features of the Ntshongweni area ................................................................................................... 13
Figure 4: Comparative Vulnerability - Ntuzuma and Ntshongweni .................................................................................... 17
Figure 5: Adaptation Plan for Ntuzuma ............................................................................................................................. 25
Figure 6: Plan for Ntshongweni ......................................................................................................................................... 26
Figure 7: Wards indicating general location of surveyed townships .................................................................................. 36
Figure 8: Percentages of vegetables grown in Durban by interview respondents ............................................................. 37
Figure 9: Percentages of fruit grown in Durban by interview respondents ........................................................................ 37
Figure 10: Percentage of households consuming various food types ............................................................................... 38
Figure 11: BioResource Unit projections for change in yield with temperature – potatoes, tomatoes (January and October planting), Pumpkin and Banana .......................................................................................................... 39
Figure 12: BioResource Unit projections for change in yield with temperature – sugar (irrigated and dryland), cabbage and carrots ......................................................................................................................................... 39

COMMUNITY-BASED ADAPTATION - DURBAN
February 2011 Report No. 11977-10286-9 iv
Figure 13: BioResource Unit projections for change in yield with temperature – maize, sorghum, soybean and dry bean ................................................................................................................................................................. 40
Figure 14: Location of the four food security trial sites ...................................................................................................... 42
Figure 15: Trial layout of Ntshongweni site during the winter 2009 production season ..................................................... 44
Figure 16: Trial layout of Ntshongweni site during the summer 2009/10 production ......................................................... 45
Figure 17: Images of Ntshongweni site ............................................................................................................................. 49
Figure 18: Trial layout of Ntuzuma site during the winter 2009 production season ........................................................... 50
Figure 19: Trial layout of Ntuzuma site during the summer 2009/10 production season ................................................... 51
Figure 20: Images of Ntuzuma site ................................................................................................................................... 55
Figure 21: Trial layout of OSCA site during the winter 2009 production season ............................................................... 56
Figure 22: Trial layout of OSCA site during the summer 2009/10 production season ....................................................... 57
Figure 23: Images of OSCA site ........................................................................................................................................ 61
Figure 24: Trial layout of Makhatini site during the winter 2009 production season .......................................................... 62
Figure 25: Trial layout of Makhatini site during the summer 2009/10 production season .................................................. 63
Figure 26: Images of Makhatini site .................................................................................................................................. 67
Figure 27: rainfall, and precipitation during the winter 2009 and summer 2009/10 growing season at the 4 trial sites .................................................................................................................................................................. 68
Figure 28: Average temperatures experienced at the four trial sites during the winter 2009 and summer 2009/10 growing seasons. ............................................................................................................................................. 69
Figure 29: Cumulative heat units at the four trial sites expressed as an annual total and total for the two growing seasons. ........................................................................................................................................................... 70
Figure 30: Seasonal variation in monthly heat units at the four trial sites .......................................................................... 71
Figure 31: Yield (kg/Ha) of maize, dry beans, wheat and pumpkin achieved at the four trial sites during the winter 2009 growing season. ...................................................................................................................................... 73
Figure 32: T he four trial sites during the summer 2009/10 planting and growing season ................................................ 75
Figure 33: Yield (kg/Ha) of maize, sorghum, amadumbe, sweet potato and cassava achieved at the four trial sites during the summer 2009/10 planting and growing season ............................................................................... 76
Figure 34: Cook-off Workshop - Ntuzuma ......................................................................................................................... 81
Figure 35: Cook-off Workshop - Ntshongweni ................................................................................................................... 82
Figure 36: Percentage of people involved in food production ............................................................................................ 83
Figure 37: Foods not previously tasted by community members ...................................................................................... 83
Figure 38: Taste preferences for different products .......................................................................................................... 84
Figure 39: Different categories of water harvesting technique (Prinz, 2001) ..................................................................... 86
Figure 40: Water harvesting in Amaoti .............................................................................................................................. 87
Figure 41: Example of a dug out pan ................................................................................................................................ 88
Figure 42: Municipality camp site ...................................................................................................................................... 88
Figure 43: Door sized garden ............................................................................................................................................ 89
Figure 44: Flexible pipes used as gutters in the community .............................................................................................. 89

COMMUNITY-BASED ADAPTATION - DURBAN
February 2011 Report No. 11977-10286-9 v
Figure 45: Potential Micro-AWM Technology implementation sites assessed .................................................................. 93
Figure 46: Phaphamani Community Garden ..................................................................................................................... 94
Figure 47: Ukukhanyakwegugu Community Garden ......................................................................................................... 95
Figure 48: Sukumani Club Garden .................................................................................................................................... 96
Figure 49: Sicelamusa Co-operative Garden .................................................................................................................... 97
Figure 50: Luganda School prior to water harvesting pilot study ....................................................................................... 98
Figure 51: Water harvesting and irrigation layout Luganda School ................................................................................... 99
Figure 52: Insimbini Garden ............................................................................................................................................ 100
Figure 53: SPCA Biodigester Site ................................................................................................................................... 101
Figure 54: SPCA Processing Hub ................................................................................................................................... 102
Figure 55: Overall Luganda site plan showing phase 1 development and tyre garden ................................................... 105
Figure 56: Closer view of specific water harvesting interventions implemented .............................................................. 106
Figure 57: Clean-water harvesting interventions implemented at Luganda School ......................................................... 107
Figure 58: Surface water runoff water harvesting interventions implemented at Luganda School .................................. 108
Figure 59: Figure 5: Tyre-pyramid garden established at Luganda School ..................................................................... 110
APPENDICES APPENDIX A Social Vulnerability - Survey and Results
APPENDIX B Social Vulnerability - Stakeholder Analysis, Ntshongweni
APPENDIX C Focus Group Discussions
APPENDIX D Background Information Document
APPENDIX E Drawings for Luganda School Site
APPENDIX F Bill of Quantities for Water Harvesting Pilot
REPORT CONTRIBUTORS
Kiara Worth
Warren van Niekerk
Mfundo Ndlovu
Catherine Hughes
Rob Hounsome
COMMUNITY-BASED ADAPTATION - DURBAN
February 2011 Report No. 11977-10286-9 vi
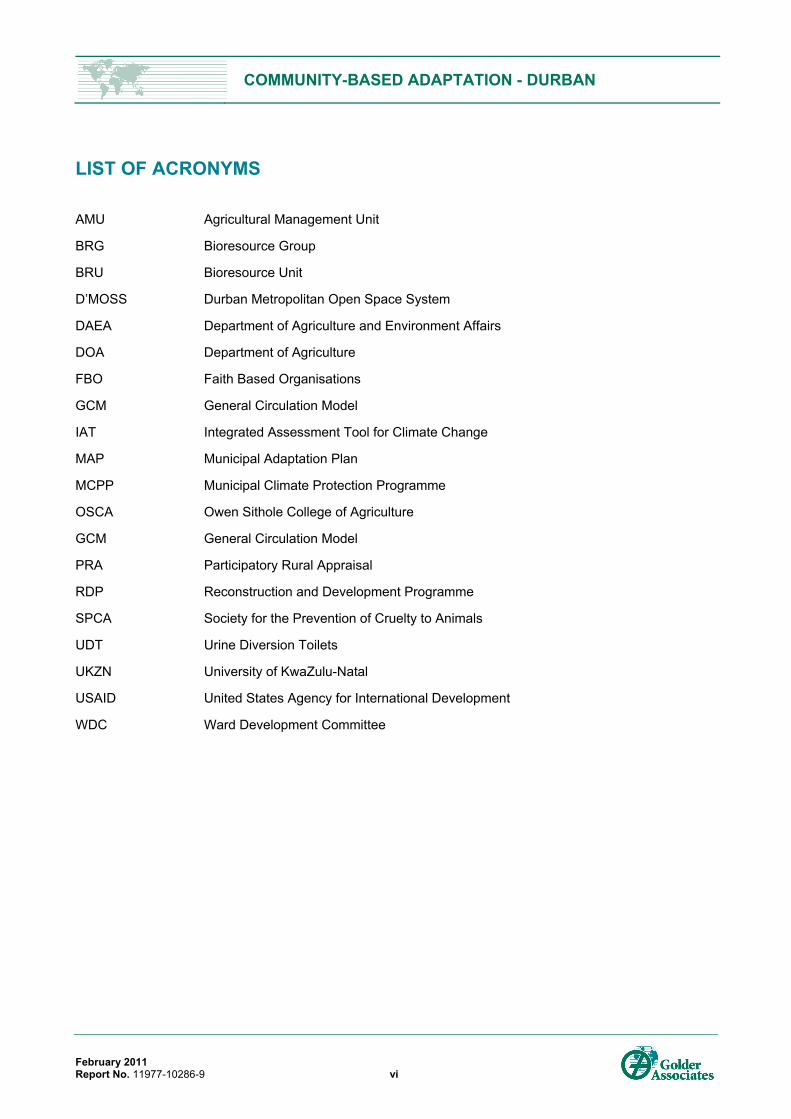
LIST OF ACRONYMS
AMU Agricultural Management Unit
BRG Bioresource Group
BRU Bioresource Unit
D’MOSS Durban Metropolitan Open Space System
DAEA Department of Agriculture and Environment Affairs
DOA Department of Agriculture
FBO Faith Based Organisations
GCM General Circulation Model
IAT Integrated Assessment Tool for Climate Change
MAP Municipal Adaptation Plan
MCPP Municipal Climate Protection Programme
OSCA Owen Sithole College of Agriculture
GCM General Circulation Model
PRA Participatory Rural Appraisal
RDP Reconstruction and Development Programme
SPCA Society for the Prevention of Cruelty to Animals
UDT Urine Diversion Toilets
UKZN University of KwaZulu-Natal
USAID United States Agency for International Development
WDC Ward Development Committee
COMMUNITY-BASED ADAPTATION - DURBAN
February 2011 Report No. 11977-10286-9 1
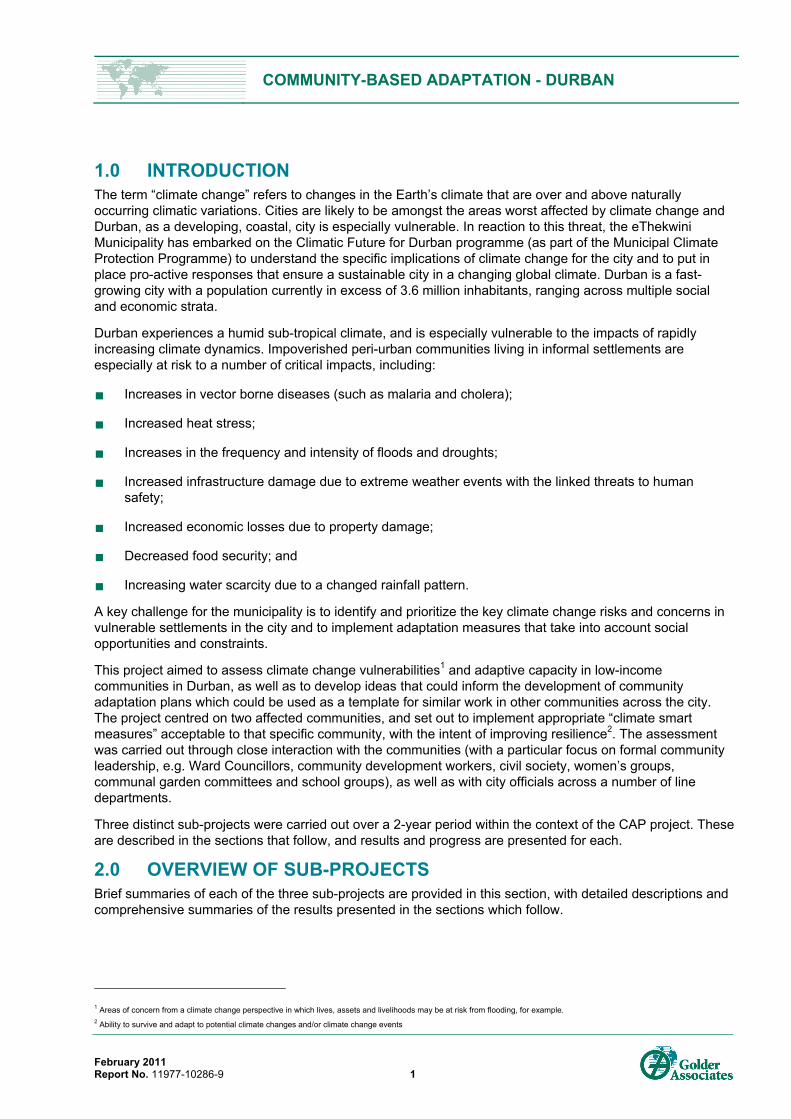
1.0 INTRODUCTION The term “climate change” refers to changes in the Earth’s climate that are over and above naturally occurring climatic variations. Cities are likely to be amongst the areas worst affected by climate change and Durban, as a developing, coastal, city is especially vulnerable. In reaction to this threat, the eThekwini Municipality has embarked on the Climatic Future for Durban programme (as part of the Municipal Climate Protection Programme) to understand the specific implications of climate change for the city and to put in place pro-active responses that ensure a sustainable city in a changing global climate. Durban is a fast-growing city with a population currently in excess of 3.6 million inhabitants, ranging across multiple social and economic strata.
Durban experiences a humid sub-tropical climate, and is especially vulnerable to the impacts of rapidly increasing climate dynamics. Impoverished peri-urban communities living in informal settlements are especially at risk to a number of critical impacts, including:
Increases in vector borne diseases (such as malaria and cholera);
Increased heat stress;
Increases in the frequency and intensity of floods and droughts;
Increased infrastructure damage due to extreme weather events with the linked threats to human safety;
Increased economic losses due to property damage;
Decreased food security; and
Increasing water scarcity due to a changed rainfall pattern.
A key challenge for the municipality is to identify and prioritize the key climate change risks and concerns in vulnerable settlements in the city and to implement adaptation measures that take into account social opportunities and constraints.
This project aimed to assess climate change vulnerabilities1 and adaptive capacity in low-income communities in Durban, as well as to develop ideas that could inform the development of community adaptation plans which could be used as a template for similar work in other communities across the city. The project centred on two affected communities, and set out to implement appropriate “climate smart measures” acceptable to that specific community, with the intent of improving resilience2. The assessment was carried out through close interaction with the communities (with a particular focus on formal community leadership, e.g. Ward Councillors, community development workers, civil society, women’s groups, communal garden committees and school groups), as well as with city officials across a number of line departments.
Three distinct sub-projects were carried out over a 2-year period within the context of the CAP project. These are described in the sections that follow, and results and progress are presented for each.
2.0 OVERVIEW OF SUB-PROJECTS Brief summaries of each of the three sub-projects are provided in this section, with detailed descriptions and comprehensive summaries of the results presented in the sections which follow.
1 Areas of concern from a climate change perspective in which lives, assets and livelihoods may be at risk from flooding, for example. 2 Ability to survive and adapt to potential climate changes and/or climate change events

COMMUNITY-BASED ADAPTATION - DURBAN
February 2011 Report No. 11977-10286-9 2
2.1 Sub-project 1: Vulnerability assessment and adaptation planning The purpose of this sub-project was to conduct detailed vulnerability and risk evaluations in two communities and to develop sustainable cross-cutting adaptation measures. The communities of Ntuzuma and Ntshongweni (in which the Environmental Planning and Climate Protection Department were active or had established institutional links) were selected based on political support and differentiated by their biophysical and infrastructural setting.
To determine the vulnerability of both communities, a survey and livelihoods analysis was conducted through in-depth community participation. Throughout the engagement, focus was placed on five main components; livelihoods and demographics, food security, infrastructure and services, water and sanitation and social networks. Using these components as a basis, insights were gained as to the current vulnerability within the communities, which provided a framework in which to develop the adaptation strategies.
2.2 Sub-project 2: Food security pilot Agricultural production is highly dependent on climate, since solar radiation, temperature and precipitation are the main drivers of crop growth. Climate change is expected to have a significant impact on food supply in terms of the types of food grown, yields as well as the distribution of food production for various crops. The net result could be a significant reduction in the availability of food to the city’s citizens which could impact on food security. In addition, altered weather patterns could increase crop vulnerability to pest infestations and competition from other plants (weeds) and land-uses. These factors are further likely to decrease crops yields, necessitate changes in farming practises (e.g. application of more expensive pesticides/herbicides/fungicides), or result in requirements for the planting of alternative crops. Irrespective of climate change, it is estimated that 35% of the country’s population, or 14 million people, are vulnerable to food insecurity, and that 43% of households suffer from food poverty. There is thus a need to introduce measures that will contribute towards increasing household food security.
As part of a parallel project run by the eThekwini Municipality around climate change impact assessment, Golder carried out a preliminary survey and consulted local scientists with regard to crop vulnerability (this is documented in Section 5.1). This research showed that low-income rural groups in the eThekwini municipal area grow approximately 50% of their food, with the remainder purchased. The purchased food is typically maize, and costs a low income family in excess of 50% of their monthly income. Preliminary research further showed that in the face of climate change, the productivity of agricultural land in the eThekwini municipal area will reduce and the costs of subsistence food will increase significantly. On this basis, alternative food production is likely to be required to maintain food security for the city’s low income groups.
To ascertain the change in food security needs for a climatically different environment, focus was placed on three questions:
What will the change in yields of current staple crops be, given the assumed climate change scenarios?
What alternative crops to the current staple crops can be grown, and what new practices introduced to mitigate changes in yield and increase food security given the assumed climate change scenarios?
Assuming that the future staple crop/s will change from maize, what is the acceptability of these alternative crops from a social perspective?
Given that the current staple crop is maize, potential crops which could become staple food were identified due to their being known to be hardy crops, or successful crops in warmer parts of Africa. Potential crops included:
Sorghum;
Cassava;
Amadumbe;

COMMUNITY-BASED ADAPTATION - DURBAN
February 2011 Report No. 11977-10286-9 3
Pumpkin; and
Sweet potato.
A literature review of staple foods was carried out to finalise the list of crops to be field tested. Once the crops were selected, field trials were undertaken in different climatic zones, to simulate the various climate change scenarios.
In parallel to the field trials, the social acceptability of the proposed crops was tested at two different levels:
The ability of the average household to incorporate the technologies required to prepare the food; and
The palatability of the food (e.g. bread) and its acceptability as a substitute for maize.
The assessment of the social acceptability of the alternative staple foods was carried out through a series of cooking and taste-testing sessions.
2.3 Sub-project 3: Water harvesting feasibility assessment and pilot This project proposed to install water harvesting systems within the two communities identified above. It is important to note that the water harvesting was not planned to be used for potable water supply, but to feed urban agriculture programmes or other non-household uses. The project commenced with a detailed assessment of the technologies that are currently available in South Africa with a specific focus on the relative positive attributes and negative characteristics of each technology.
The implementation of this part of the project proved to be extremely challenging, and resulted in alternative actions and plans being implemented. This learning process is documented in Section 6.3.
3.0 SELECTED COMMUNITIES The two communities selected for implementation of this project were Ntuzuma and Ntshongweni. Ntuzuma is a peri-urban community with a high population density and service provision which appears to be fairly advanced and in a relatively good condition. It is located within the INK (Inanda, Ntuzuma, KwaMashu) area to the north of the city. Ntshongweni is a rural community with low population density, and is located to the outer west of the municipal area. Figure 1 shows the localities of the two communities within the municipal area.

COMMUNITY-BASED ADAPTATION - DURBAN
February 2011 Report No. 11977-10286-9 4
Figure 1: Map of the eThekwini municipal area showing the localities of Ntuzuma and Ntshongweni communities
4.0 SUB-PROJECT 1: VULNERABILITY ASSESSMENT AND ADAPTATION PLANNING
This vulnerability assessment for determination of adaptation options was carried out using an approach which addressed the complex relationships between human and natural systems3. This allowed the assessment to consider the benefits provided by various biophysical ecosystems to local people, and to holistically view these in conjunction with the services provided by the Municipality. This section presents a summary of the methodology used for the social vulnerability assessment, including a survey and livelihoods
3 Myles Mander, pers. Comm.
Durban
Pinetown
Umkomaas
Redcliffe
Hillcrest
Kingsburgh
Umhlanga Rocks
Isipingo Beach
Chatsworth Town Centre
Legend
Ntuzuma Community
Ntshongweni Community
eThekwini Municipality0 4 8 122
Kilometres
³
Ntshongweni
NtuzumaLocation of eThekwini Municipality

COMMUNITY-BASED ADAPTATION - DURBAN
February 2011 Report No. 11977-10286-9 5
analysis, for both Ntuzuma and Ntshongweni. To provide context, the biophysical setting of each community is described in Sections 4.1.5 and 4.1.7.
4.1 Social vulnerability assessment - methodology To conduct a vulnerability assessment of Ntuzuma and Ntshongweni, a methodology was developed which operated within a livelihoods analysis framework. Vulnerability assessments have been applied in a number of contexts, and are often utilised by organisations such as the United States Agency for International Development (USAID) and the World Food Programme, recognising that the interactions between people and their physical and social environments are multidimensional. The vulnerability assessment consisted of five major components, namely:
Livelihoods and demographics;
Food security;
Infrastructure and services;
Water and sanitation; and
Social networks.
These categories were determined based on the projected climatic changes for the eThekwini Municipality, and the anticipated impacts thereof.
4.1.1 Data collection and analysis The data for this vulnerability assessment was collected through quantitative and qualitative analysis. The tools used for each activity are explained in greater detail below. The results of the quantitative analysis served as the basis for vulnerability determination, while the qualitative information further explained and supported the quantitative results.
4.1.2 Quantitative data collection - survey A survey was developed and then conducted with the aim of surveying 250 respondents in Ntuzuma and Ntshongweni, allowing for a confidence interval of 6.16 with a confidence level of 95% 4(CRS, 2009).
Due to issues of safety that had been raised, four local fieldworkers from Ntuzuma were trained and subsequently conducted the survey (as opposed to using external fieldworkers). The surveys were conducted from 20-25 May 2009, including a Saturday to ensure that those who were employed, and thus working during the week, were also interviewed. While the initial objective was to conduct 250 surveys, only 188 household surveys were completed due to unexpected constraints with the fieldworkers. One of the four members could not be contacted after the initial meeting. In terms of the level of confidence of the survey, this change was relatively insignificant, and using the aforementioned methods, the confidence interval increased from 6 to 7. The survey sample was largely determined by the boundary of Ward 42, where access into the community had previously been granted. There are four large sections within Ntuzuma in Ward 42, including Ntuzuma G (location of the trial food plot), J, F and H, and these areas were covered by the survey.
In Ntshongweni, the survey was conducted by four students from the University of KwaZulu-Natal. The surveys were completed over a one week period, including a Saturday, to ensure that those who were employed and thus working during the week were also interviewed. Surveys were completed using the survey questionnaire provided. The survey sample was largely determined by the boundary of Ward 7, 4The confidence interval is the plus-or-minus figure that indicates the interval estimate or parameter; instead of estimating the parameter at a single value, an interval that includes the parameter is given. This is done to indicate the reliability of an estimate.
The confidence level indicates the level of surety of the answers received. Represented as a percentage, the confidence level indicates the true percentage of the population who would select an answer within the confidence interval. For example, a 95% confidence level would indicate that 95% of the population would have responded in this way, and the same applies for a 99% confidence level. It is commonly accepted that confidence levels should be between 99%-95% in order for the survey to be an adequate reflection of the community.
COMMUNITY-BASED ADAPTATION - DURBAN
February 2011 Report No. 11977-10286-9 6
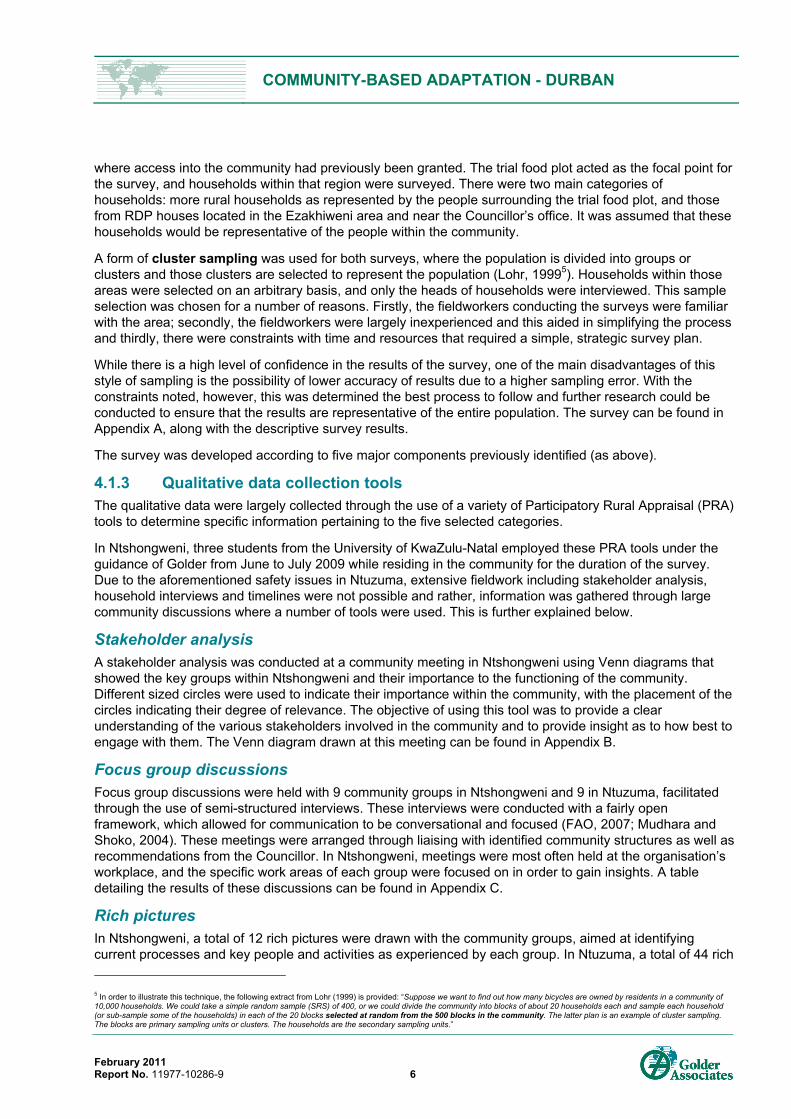
where access into the community had previously been granted. The trial food plot acted as the focal point for the survey, and households within that region were surveyed. There were two main categories of households: more rural households as represented by the people surrounding the trial food plot, and those from RDP houses located in the Ezakhiweni area and near the Councillor’s office. It was assumed that these households would be representative of the people within the community.
A form of cluster sampling was used for both surveys, where the population is divided into groups or clusters and those clusters are selected to represent the population (Lohr, 19995). Households within those areas were selected on an arbitrary basis, and only the heads of households were interviewed. This sample selection was chosen for a number of reasons. Firstly, the fieldworkers conducting the surveys were familiar with the area; secondly, the fieldworkers were largely inexperienced and this aided in simplifying the process and thirdly, there were constraints with time and resources that required a simple, strategic survey plan.
While there is a high level of confidence in the results of the survey, one of the main disadvantages of this style of sampling is the possibility of lower accuracy of results due to a higher sampling error. With the constraints noted, however, this was determined the best process to follow and further research could be conducted to ensure that the results are representative of the entire population. The survey can be found in Appendix A, along with the descriptive survey results.
The survey was developed according to five major components previously identified (as above).
4.1.3 Qualitative data collection tools The qualitative data were largely collected through the use of a variety of Participatory Rural Appraisal (PRA) tools to determine specific information pertaining to the five selected categories.
In Ntshongweni, three students from the University of KwaZulu-Natal employed these PRA tools under the guidance of Golder from June to July 2009 while residing in the community for the duration of the survey. Due to the aforementioned safety issues in Ntuzuma, extensive fieldwork including stakeholder analysis, household interviews and timelines were not possible and rather, information was gathered through large community discussions where a number of tools were used. This is further explained below.
Stakeholder analysis A stakeholder analysis was conducted at a community meeting in Ntshongweni using Venn diagrams that showed the key groups within Ntshongweni and their importance to the functioning of the community. Different sized circles were used to indicate their importance within the community, with the placement of the circles indicating their degree of relevance. The objective of using this tool was to provide a clear understanding of the various stakeholders involved in the community and to provide insight as to how best to engage with them. The Venn diagram drawn at this meeting can be found in Appendix B.
Focus group discussions Focus group discussions were held with 9 community groups in Ntshongweni and 9 in Ntuzuma, facilitated through the use of semi-structured interviews. These interviews were conducted with a fairly open framework, which allowed for communication to be conversational and focused (FAO, 2007; Mudhara and Shoko, 2004). These meetings were arranged through liaising with identified community structures as well as recommendations from the Councillor. In Ntshongweni, meetings were most often held at the organisation’s workplace, and the specific work areas of each group were focused on in order to gain insights. A table detailing the results of these discussions can be found in Appendix C.
Rich pictures In Ntshongweni, a total of 12 rich pictures were drawn with the community groups, aimed at identifying current processes and key people and activities as experienced by each group. In Ntuzuma, a total of 44 rich 5 In order to illustrate this technique, the following extract from Lohr (1999) is provided: “Suppose we want to find out how many bicycles are owned by residents in a community of 10,000 households. We could take a simple random sample (SRS) of 400, or we could divide the community into blocks of about 20 households each and sample each household (or sub-sample some of the households) in each of the 20 blocks selected at random from the 500 blocks in the community. The latter plan is an example of cluster sampling. The blocks are primary sampling units or clusters. The households are the secondary sampling units.”

COMMUNITY-BASED ADAPTATION - DURBAN
February 2011 Report No. 11977-10286-9 7
pictures were drawn, as this was the main activity at one of the community meetings. The rich pictures were used to try and explain often complicated situations by using symbols to depict more subtle points of view, such as the way people perceived their life and their role in it (Skelton, 2000).
Household Interviews Interviews were conducted in 30 households in Ntshongweni (using geographical cluster sampling), with individual sub-communities targeted. Only heads of households were interviewed. The interviews were aimed at answering a broad set of questions developed around the assets framework, and thus were semi-structured in nature. The majority of the questions used were formulated ahead of time rather than during the interview itself. At the beginning of the process, several interviews were conducted as a mini-pilot study, and the information gathered in these interviews was not used in the analysis. At the beginning of each interview, the project was introduced to the household head through the use of a Background Information Document (Appendix D) previously prepared, which served to build an initial rapport with the correspondents and elicit co-operation.
Timeline A timeline was developed in Ntshongweni to list the key events in the history of the community, as recollected by the community members. The timeline indicated changes in the environment, including rainfall patterns and any noticeable land changes. In general, a timeline allows for an understanding of the history of a community and aids in analysing certain events that may have had significant impact in shaping their lives. This tool stimulates people’s memory about their past and present situations and can also enable a better understanding of the culture, values and norms that exist within the community (Mudhara and Shoko, 2004).
4.1.4 Ground-truthing exercise Once these tools had been implemented, key stakeholder interviews were conducted with representatives from the water, health, housing and spatial planning sectors of the eThekwini Municipality. This served as a ‘ground-truthing’ exercise, where the information gathered from the community was compared with that provided by the Municipality. This exercise informed the existing results, providing greater clarity around the infrastructural systems and developmental plans intended for the community, while also providing understanding of community challenges from a different perspective.
Using this methodology, the vulnerability of each community was assessed.
4.1.5 Biophysical Setting - Ntuzuma Topography and hydrology
Box 1: The Geology of Ntuzuma
Dwyka Tillite is generally well-jointed rock. Joints are usually marked by a shale deposit, which is often weathered to clay. These joints play a major role in slope instability, as they are the path for movement of water.
In KwaZulu-Natal, fresh tillite outcrops in valleys were incised during Pleistocene times, while tillites at higher altitudes are covered with residual soil (which can be up to 9 m in depth) and can be highly compressible and expansive. However, most tillites in the province are covered by gravelly soil which is <1 m thick and is underlain by weathered rocks.
Tillite can present severe slope problems, including the sliding of large blocks of rock along thin clay portions. However, due to limited weathering, foundations on tillite merely need to be placed on the weathered rock after removal of the upper residual soil layer.
Natal Group Sandstone has generally well-stratified sediments, in beds up to 1 m in thickness. However, the rock is generally found in blocks due to jointing, and is fairly pervious. Slope stability problems with the residual soils and weathered rock are becoming more common, including wedge-type failures and kaolinitic clay gouges.
Slopes are generally prone to instability in dip slope areas with a high water table, with failure generally manifesting as a downslope flow of saturated soil after heavy rainfall. With a tendency towards excess pore pressure, silty sands of this group can take on a viscous nature in heavy rains, causing vehicles to become trapped in the material.
COMMUNITY-BASED ADAPTATION - DURBAN
February 2011 Report No. 11977-10286-9 8
The altitude of the Ntuzuma settlement area ranges from to 120 to 240 mamsl6. Steep slopes are a key feature of this area. The Ntuzuma study site falls within the lower Mgeni River catchment, north of the Gobogobo River, which forms a part of the municipality’s D’MOSS (Durban Metropolitan Open Space System) system. The Piesangs River and its tributaries also flow through Ntuzuma, joining the uMhlangane River, which ultimately merges with the Mgeni before it enters the sea.
A portion of the Piesangs River floodplain lies within the Ntuzuma settlement to the east of the study area.
The steep slopes of the area lead to considerable runoff, and loss of potential rainwater for harvesting and use. Stormwater systems are present to some degree across most of Ntuzuma, with the exception of Ntuzuma G and the west of Ntuzuma H. it is evident, however, that improvements could be made to systems of diversion and management of water. If re-engineered, stormwater infrastructure can be used to divert water within dedicated channels for collection, treatment and use. Alternatively, clean water can be diverted to the Gobogobo River to supplement the ecological reserve, and to provide dilution for enhanced water quality.
Geology and Soils The geology of Ntuzuma is comprised of Dwyka Tillite (mainly to the west of the site) and Natal Group Sandstone to the east (see Box 1, Brink 1981). Generally, landslides which have taken place in the general area have been associated with shales. Although the Natal Group Sandstones are considered relatively stable, recent years have shown an increased frequency of landslides associated with heavy rains (Bell & Maud, 1996). This is most likely due to clay layers create the potential for slipping.
Several areas of seepage, steep or unstable soils have been identified by the Municipality in and around the Ntuzuma study area, mostly associated with river courses. The steep slopes at Ntuzuma are prone to instability and severe rainwater runoff, which can exacerbate soil erosion and leaching of valuable nutrients, particularly in an environment disturbed to this degree by human settlement. This is of major concern in terms of climate change impacts, as the frequency and intensity of heavy rainfall events is projected to increase, provided increased energy for erosion and leaching.
Soils derived from sandstones generally have a low fertility, and the majority of the area is unsuitable for the growing of crops due to steep slopes and the unavailability of land.
Soil depth across the study area varies between 0.5 and 1 metre, with deeper soils (1-2 m) concentrated in river courses. There are some rocky outcrops to the east of the study area, and soils <0.5 m in depth in areas of higher altitude.
Land Use and Human Settlement Ntuzuma is a densely settled residential area with both formal and informal dwellings. A dense network of supporting infrastructure such as roads, water supply, sewage, electricity and stormwater drains is provided by the Municipality. Very little natural vegetation remains within the settlement areas, but there are dense stands of invasive plant species. There are or small gardens which include some crops and fruit trees. The density of dwellings is very high in the informal settlement areas, and less dense in the formal housing areas.
Vegetation The area is characterised by the broad vegetation type known as KwaZulu-Natal Coastal Belt (Mucina and Rutherford, 2006).This vegetation type is classified as endangered, and is hardly protected. There is little or no vegetation remaining within the community study area, and there are large stands of invasive species. There is essentially no genetic stock for indigenous species or any ecosystems within Ntuzuma.
No vegetation patches upstream of Ntuzuma are formally conserved under the D’MOSS, but the Gobogobo River, which lies south of Ntuzuma, and its floodplains do fall within the D’MOSS.
6 Meters above mean sea level;
COMMUNITY-BASED ADAPTATION - DURBAN
February 2011 Report No. 11977-10286-9 9
Community activities and dwellings have the ability to severely impact on natural water courses and riparian zones. These systems are likely to become more sensitive under climate change, with lower amounts of water and warmer temperatures. It is important that these open space systems are maintained and protected, in collaboration with the community.
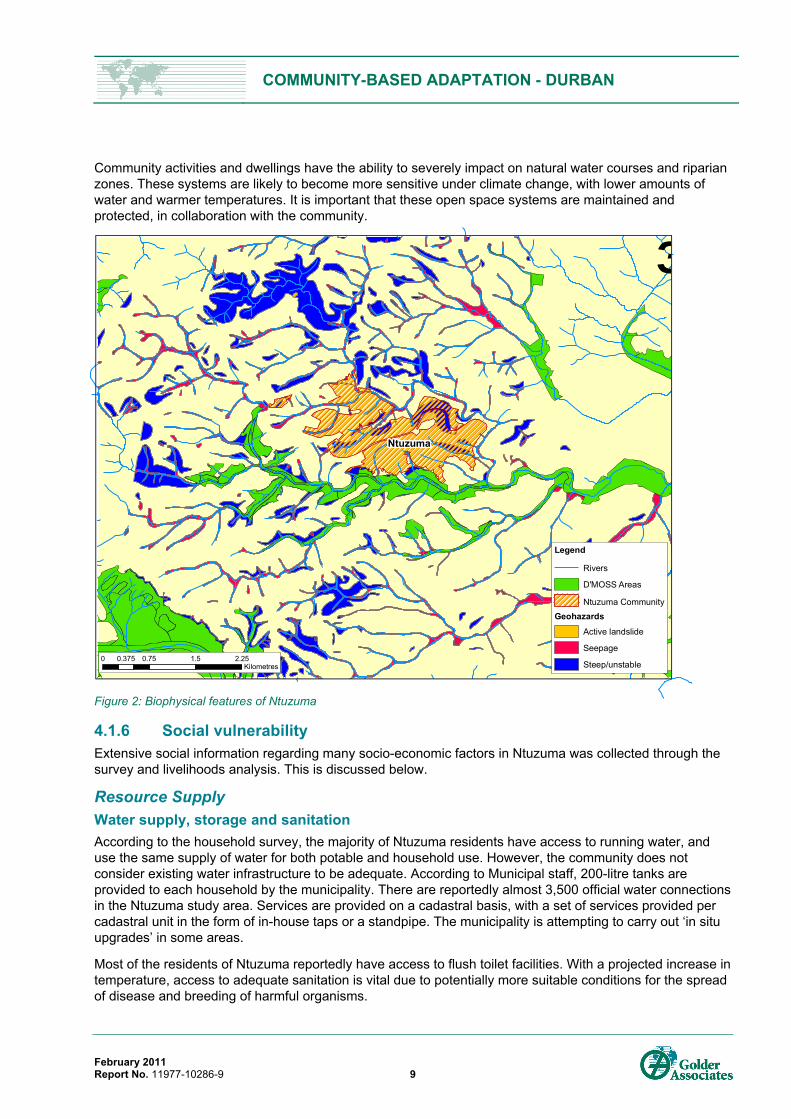
Figure 2: Biophysical features of Ntuzuma
4.1.6 Social vulnerability Extensive social information regarding many socio-economic factors in Ntuzuma was collected through the survey and livelihoods analysis. This is discussed below.
Resource Supply Water supply, storage and sanitation According to the household survey, the majority of Ntuzuma residents have access to running water, and use the same supply of water for both potable and household use. However, the community does not consider existing water infrastructure to be adequate. According to Municipal staff, 200-litre tanks are provided to each household by the municipality. There are reportedly almost 3,500 official water connections in the Ntuzuma study area. Services are provided on a cadastral basis, with a set of services provided per cadastral unit in the form of in-house taps or a standpipe. The municipality is attempting to carry out ‘in situ upgrades’ in some areas.
Most of the residents of Ntuzuma reportedly have access to flush toilet facilities. With a projected increase in temperature, access to adequate sanitation is vital due to potentially more suitable conditions for the spread of disease and breeding of harmful organisms.
Legend
Rivers
D'MOSS Areas
Ntuzuma CommunityGeohazards
Active landslide
Seepage
Steep/unstable0 0.75 1.5 2.250.375
Kilometres
Ntuzuma
³

COMMUNITY-BASED ADAPTATION - DURBAN
February 2011 Report No. 11977-10286-9 10
Energy According to the household survey, almost all respondents have access to electricity. This is an important fact to note in terms of potential climate change as residents will have access to:
Refrigerators for storage and preservation of food for healthy eating and prevention of disease; and
Cooling devices such as fans.
The collective Ntuzuma settlement has both formal and informal housing. Informal houses are often made of metal or other unsuitable materials, which create warm and unhealthy conditions.
It is apparent that the electricity supply is not reliable and is costly, and that many households use fuelwood for cooking and heating in the event of an electricity shortage. Reliance on fuelwood is problematic due to the impact on the natural resources of the area, as biomass is removed from the system affecting nutrient cycles and soil fertility. Furthermore, burning of fuelwood inside houses can lead to poor air quality and respiratory health issues.
It is also a major concern that electrical connections are often illegal, leading to safety risks. This is likely to be exacerbated with climate change as demand for cooling is enhanced.
Infrastructure resilience The community is highly reliant on municipal-supplied infrastructure for survival. The following points were strongly raised:
Health care is accessible but medicines, services and staff are in short supply;
Electricity is often supplied through illegal connections; and
Informal housing is constructed of poor materials and in steep, dangerous areas.
The steep slopes of Ntuzuma furthermore pose considerable risk in terms of runoff. In high energy extreme events there is likely to be a powerful flow of water down these slopes, increasing erosion. Schools and other services are reportedly often located within stormwater runoff courses, leading to flooding on occasion. Roads are also often wet, indicating poor management of stormwater diversion and channelling. In addition, the KwaMashu Waste Water Treatments Works lies downstream of the community, and would be vulnerable should a high energy storm result in severe runoff.
Waste disposal sites were not identified as problematic in Ntuzuma, although certain residents of Ntuzuma have noticed an increase in pest species, such as mosquitoes, rats and flies. Conditions for these species are likely to become more favourable with climate change, and it is vital that effective refuse disposal is encouraged and instituted, in terms of:
Regularity;
Availability of facilities;
Education of the public in terms of waste management and recycling; and
Establishment of a recycling facility.
Transport largely relies on taxis and buses, and the road system is reportedly adequate, apart from the accumulation of water.
Food security The community exhibits a heavy reliance on food purchasing and grows fruit and vegetables only on a minor scale, for subsistence purposes. There is very limited space for crop cultivation, and slopes are steep,

COMMUNITY-BASED ADAPTATION - DURBAN
February 2011 Report No. 11977-10286-9 11
increasing the difficulty of land cultivation. Some community members had noted changes in their production patterns, generally with a decline in yield and an increase in pest occurrence.
Farming groups in the community are generally made up of a collection of unemployed, older women who use a common plot of land to grow vegetables. Produce is used to supply local markets and individual households. Most women join the group due to their vulnerability to poverty, and need to find access to an income and increased food security. A group known as the Ntuzuma Co-operation also indicated that they were involved in environmental management programmes which aimed to remove alien invasive plants.
Some groups indicated that there is a lack of water, and some commented that they use water harvesting techniques to obtain water for irrigation. Concern regarding water quality was raised by some community members.
Health and well-being The majority of the community were of the opinion that health services are inadequate in Ntuzuma, and Health and Sanitation (as a category) was rated as the service in need of the most improvement. However, most respondents considered access to clinics to be possible, but with inadequate service and at least half an hour’s travel required. There is reportedly insufficient medicine supply, as well as a shortage of staff.
Climate change is likely to put pressure on the health service in that warmer temperatures are likely to lead to an increase in heat stress and vector-borne diseases. The possibility exists that malaria may move south into the eThekwini municipal area, unless current spraying programmes are maintained north of the municipality.
It is also vital that water management is improved (correct stormwater diversion and storage) to prevent impoundment and persistence of stagnant water which may lead to the breeding of vectors.
Economic factors There is significant reliance within Ntuzuma on government grants and a high level of unemployment. There are furthermore a large number of children within the community, and a lack of income earners. The lack of social support functions adds to this problem, as children are not raised in a stable environment, and are not taught self-sustaining practices.
Stokvels are used as savings schemes, and funeral schemes and burial societies are viewed as major household expenses.
Disaster control and coping strategies The lack of natural vegetation and prevalence of invasive species exposes the community to the risk of fire and wind damage. There is also a lack of flood attenuation capacity as there is some building of houses in floodplains, and natural vegetation has been cleared.
An identified need in the community was for food parcels, blankets and shelter during disasters such as flooding.
Currently there is little evidence of coping strategies that have been undertaken in Ntuzuma in direct correlation to climate change, but the following strategies were identified as contributing to overall household functioning:
Water is collected from the rivers using buckets;
Water is saved and stored in plastic buckets;
Unclean water is purified through boiling with a teaspoon of bleach before household consumption;
Some water is stored in metal tanks, connected to gutter systems to collect rainwater; and

COMMUNITY-BASED ADAPTATION - DURBAN
February 2011 Report No. 11977-10286-9 12
In times of need, people have created social networks that will enable them access to food parcels and temporary housing through institutions such as the local church groups and the Red Cross.
Social networks The role of social support groups in Ntuzuma is significant. There are three main types of community groups, including farming groups, home-based care groups and support groups. Discussions with these community groups indicated that most people involved in social initiatives (such as communal gardens or health care groups) are elderly, unemployed women. With no other means of income, there is heavy reliance on government grants, particularly pensions, as the main source of provision for households. As a result, income takes a preference over produce in the case of communal garden groups – people would rather grow the vegetables and sell them at the market to generate income than use the produce for household purposes (although this is also done to a minor extent).
Most residents have access to radio, and this medium could be used for communication in awareness campaigns or disaster management systems. Social networks are weak within Ntuzuma, and roll out of municipal initiatives may prove difficult, should Councillor structures not be effective.
4.1.7 Biophysical Setting - Ntshongweni Topography and hydrology Generally, Ntshongweni lies at a higher altitude than Ntuzuma, with the highest point at 652 mamsl and the lowest around 360 mamsl in the Ezakhiweni area. It is a mostly undulating area with some steep slopes.
The Ntshongweni trial plot site (See Section 5.0) was located within the Mlazi River catchment, north of the Umlaas River. This river feeds the Ntshongweni Dam, which lies between the main Ntshongweni community and the Ezakhiweni area. The Mlazi Upper River, a tributary of the Umlaas runs through the community, as does another tributary, the Sterkspruit. The Ezakhiweni area is drained by the Umlaas River itself, with the Wekeweke Stream to the north of the settlement, which also ultimately feeds the Umlaas.

COMMUNITY-BASED ADAPTATION - DURBAN
February 2011 Report No. 11977-10286-9 13
Figure 3: Biophysical features of the Ntshongweni area
COMMUNITY-BASED ADAPTATION - DURBAN
February 2011 Report No. 11977-10286-9 14
Geology and soils The Ntshongweni study area is entirely located in Natal Group Sandstone.
There are some identified areas which have experienced landslides in the Ntshongweni area. To the west of the main Ntshongweni community (an area with the same geology), unstable soils have been identified and no further development has been recommended for this area.
The area is characterised by hard and erodible soils, with some steep and unstable areas. Soils derived from sandstones generally have a low fertility, and less than 25% of the area is reportedly considered to be arable, with the recommended use being extensive livestock grazing with production occurring over 250 days of the year and a recommended carrying capacity of 3.2 ha/AU (Camp, 1995).
The Ntshongweni area is vulnerable to high energy rainwater runoff, which can exacerbate soil erosion. This is of major concern in terms of climate change impacts, as the frequency and intensity of heavy rainfall events is projected to increase.
Land use and human settlement Peri-urban and rural residential housing, as well as subsistence agriculture has been established on the former Ngongoni veld areas (Mucina and Rutherford, 2006), which have mostly been transformed under this land use. Settlements are either rural dwellings or Reconstruction and Development Programme (RDP) houses, which are provided by government.
Vegetation Much of the collective Ntshongweni community area lies adjacent to or is surrounded by parts of the municipality’s D’MOSS system. This area is, however, under considerable cattle grazing pressure and the community makes use of the forest for fuelwood and muthi harvesting. Some invasive species clearing programmes are active in the area, but generally these species (Chromolaena odorata and Lantana camara in particular) pose a severe threat to ecosystem resilience in this area7 due to competition with native species and impacts on catchment water yield.
The Shongweni Resources Reserve lies to the southeast of the main Ntshongweni settlements, and extends east to the Ezakhiweni area. This reserve and the Umlaas River’s associated floodplains (wetlands) form a part of the D’MOSS. These floodplains and naturally vegetated areas provide some flood attenuation.
The western community area is characterised by largely transformed Ngongoni Veld (Mucina and Rutherford, 2006), with the Ezakhiweni area comprising KwaZulu-Natal Sandstone Coastal Sourveld, which is an important veld type in the municipal area as it is classified as endangered. It is also largely unprotected. The patches of KwaZulu-Natal Sandstone Coastal Sourveld are surrounded by Eastern Valley Bushveld. There is little or no vegetation remaining within the community study area.
Surrounding the community are patches of Scarp Forest, some woodland and thicket. These remaining patches are likely to be used for fuelwood collection, on which there is a major reliance.
4.1.8 Social vulnerability Extensive social information regarding many socio-economic factors in Ntshongweni was collected through the survey and livelihoods analysis. This is discussed below.
Resource supply Water supply, storage and sanitation Municipal feedback indicated that houses have access to water through ground tanks or standpipes. Residents expressed that the majority do not have exclusive access to running water, and use the same
7 Errol Douwes, pers. Comm.

COMMUNITY-BASED ADAPTATION - DURBAN
February 2011 Report No. 11977-10286-9 15
supply of water for both potable and household use (standpipes). There are only 203 registered municipal water connections. Residents furthermore rely on the supply of water from the river for farming.
During the household survey, mention was made of the use of vetiver grass for the slowing of water and prevention of erosion in farming areas. Some slopes of the area are prone to considerable runoff, and loss of potential rainwater for harvesting. If properly engineered however, stormwater infrastructure can divert water within dedicated channels for collection, treatment and use. Alternatively, clean water can be diverted to the Umlaas River to supplement the ecological reserve, and to provide dilution for enhanced water quality.
There is no water-borne sewerage system in Ntshongweni. Most residents make use of longdrop toilets, which is of major concern from a hygiene perspective, although a municipal programme has reportedly been in place since 2001 to provide basic sanitation through Urine Diversion Toilets (UDTs). With a projected increase in temperature, access to adequate sanitation is vital due to the likelihood of spread of disease and breeding of harmful organisms.
Energy According to the survey, almost all respondents have access to electricity, although there is still a heavy reliance on fuelwood for household use. It may be possible to institute solar heating and cooking facilities to reduce reliance on firewood.
Infrastructure resilience There is a heavy reliance on municipal-supplied housing and infrastructure. However, the majority of residents reportedly do not have access to running water or in-house toilet facilities. Waste sites were not identified as problematic. There are some flood risk areas south of both community areas (along the Umlaas River) and to the west of Ezakhiweni area around the Shongweni Dam.
Transport largely relies on taxis and buses, and the road network is reportedly fairly effective.
Food security Many community members are involved in food production (mainly maize and a variety of vegetables), although there is still a heavy reliance on food purchasing. Some residents have noticed a change in rainfall patterns (lack of rainfall). Some community members noted changes in their production patterns, generally with a decline in yield and an increase in pest occurrence.
Farming groups in the community are generally made up of unemployed, older women (with some participation of men) who use a common plot of land to grow vegetables. These are used to supply local markets and their individual households. Most women joined the group due to their vulnerability to poverty, and needed access to income and increased food security.
The community exhibits a heavy reliance on food purchasing and food is generally produced for income generation rather than consumption. A major source of income is the sale of produce in neighbouring communities, including those as far as Pinetown and Pietermaritzburg.
The majority of farming groups either have access to taps in their gardens or water tanks. An indication was also given that grey water is used, and some water harvesting techniques are employed. Water is also accessed from the river or dam.
While land is readily available for farming in Ntshongweni, the fields used are reportedly often too big for manual labour to be effective. Tractors and other technologies have been identified as being of use to the community. There is also no designated market place for produce to be sold within the community. People
Box 2. Groundwater Tanks After a pilot study conducted in 1996 in Cato Crest, several issues regarding groundwater tanks as a water supply were identified, including algae formation, water heating, etc. Since then, many improvements have been made. The ‘Ya tap’ has been installed, which acts as a flow limiter, set at 300 litres per day. It is installed outside of the houses, and allows for individual access to water.
No caretakers are required for these tanks as the tap is located within the homeowner’s personal property. There is a crisis management call line for any problems with the tanks. The eThekwini Municipality is reportedly the only municipality in the country to provide individuals with access to water in this manner.
COMMUNITY-BASED ADAPTATION - DURBAN
February 2011 Report No. 11977-10286-9 16
therefore travel to outside the community to sell their produce, incurring greater expenses and reducing their take-home income.
Fences around gardens are often stolen, as well as vegetables and produce. There is also a concern over livestock trampling of crops.
Certain residents of Ntshongweni have noticed an increase in the prevalence of pest species. Conditions for these species are likely to become more favourable under climate change (an increase in rainfall and temperature), and it is vital that appropriate refuse disposal is enforced in terms of:
Regularity;
Availability of facilities; and
Education on waste management and possibly recycling.
Health and well-being In Ntshongweni, Health and Sanitation (as a category) was rated as the service in need of the most improvement. However, most respondents were satisfied with the service received at clinics, and concerns seemed to stem from access to clinics. Climate change is likely to further impact on the health service in that warmer temperatures are likely to lead to an increase in heat stress and vector-borne diseases.
It is also vital that water management is improved (correct stormwater diversion and storage) to prevent impoundment and persistence of stagnant water which may lead to the breeding of disease vectors.
Economic factors Levels of education are fairly low in Ntshongweni compared to Ntuzuma, with approximately 21% of the people surveyed having no formal schooling. There is significant reliance on government grants, with low incomes and a high level of unemployment. There is furthermore a large number of children within the community, and a lack of income earners. The deficiency of social support functions adds to this problem, as children are not adequately cared for and are not taught self-sustaining practices.
There is also a heavy reliance on pension grants. Stokvels are used as savings schemes and funeral schemes and burial societies are viewed as a major household expense.
Theft has been identified as a major concern in the community.
Disaster control and coping strategies The lack of natural vegetation and prevalence of invasive species exposes Ntshongweni to the risk of fire and wind damage. A disaster management plan and emergency procedure is required, particularly with regard to floods (provision of food, shelter, etc.) and potentially landslides during heavy rainfall events.
The most significant coping strategies observed in Ntshongweni have been from initiatives undertaken by farming groups around water issues. The following initiatives, introduced by extension officers from the Department of Agriculture (DOA), were noted:
Trench systems have been put in place to ensure water drainage;
Vetiver grass has been planted in some areas to reduce runoff;
Trenches have been dug to collect rainwater for use in the gardens;
Vegetable gardens are watered early in the morning (before sunrise) to ensure there is less water loss through evaporation; and
Rainwater and grey water is collected in some areas, although there is a perception that rainwater is ‘unclean’ and thus is not used for a wide range of activities.
COMMUNITY-BASED ADAPTATION - DURBAN
February 2011 Report No. 11977-10286-9 17
Interventions have also been put in place in terms of agricultural production. These include:
Use of kraal manure and organic fertilisers. It was mentioned that artificial fertilisers leach into the soil and wash away easily;
Levelling of land to be more conducive to farming practices;
Intercropping; and
Mulching.
Indication was also given of times of high wind. In response to this, people in Ntshongweni build their houses out of bricks where possible and place bricks on their roofs to ensure that they do not blow away.
Social networks Ntshongweni is governed mainly by the Ward Councillor who is democratically elected, although some areas follow more traditional forms of leadership and have an Induna in place to solve disputes. The policing forum is used for crime investigations, and police from Hillcrest also provide security services. There are many social groups in the community: health workers, HIV-AIDS support, sewing, craft and bead work, farming, poultry and tutoring groups. Most of the breadwinners of households are employed outside the community (Pinetown, Pietermaritzburg, and Hammarsdale) and return on a daily or weekly basis. The majority of unemployed people receive an income from government grants, including child support grants, health grants or pensions. The most significant household expenses were reported as being school fees and food. As a result of the latest developments (installation of water pipes), a fair number of people have gained temporary jobs.
Most residents have access to radio, and this medium could be used for communication for awareness campaigns.
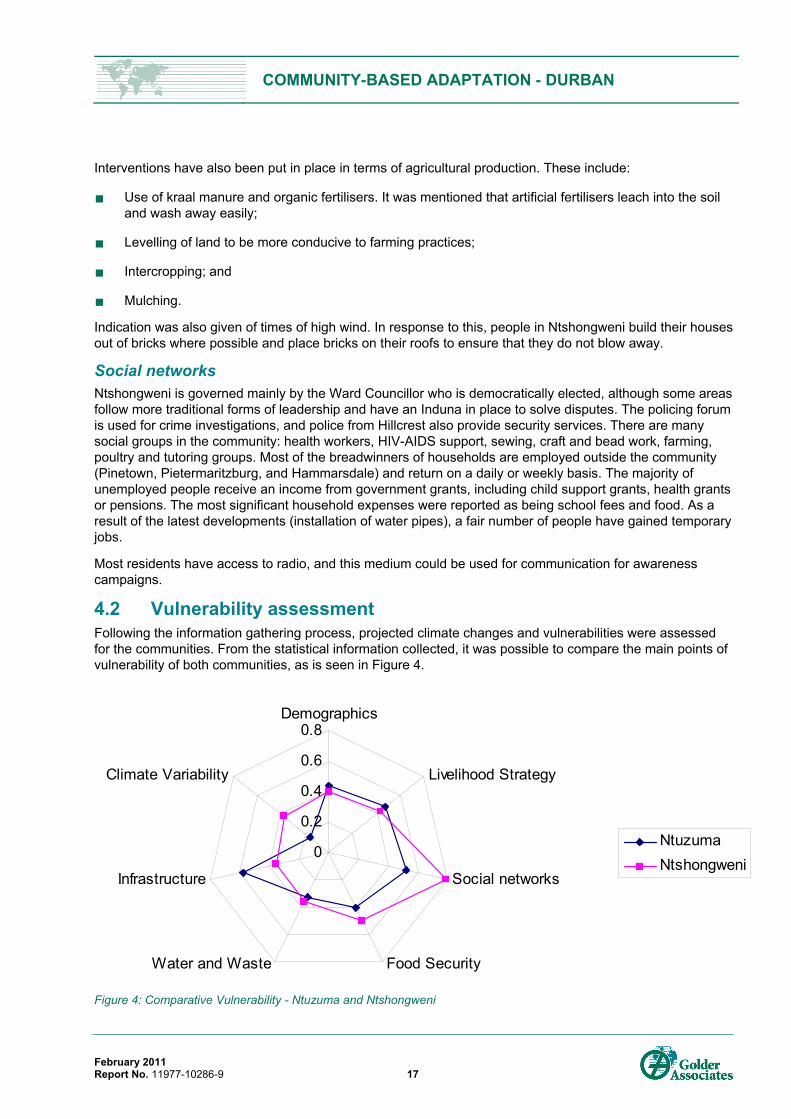
4.2 Vulnerability assessment Following the information gathering process, projected climate changes and vulnerabilities were assessed for the communities. From the statistical information collected, it was possible to compare the main points of vulnerability of both communities, as is seen in Figure 4.
Figure 4: Comparative Vulnerability - Ntuzuma and Ntshongweni
0
0.2
0.4
0.6
0.8Demographics
Livelihood Strategy
Social networks
Food SecurityWater and Waste
Infrastructure
Climate Variability
NtuzumaNtshongweni
COMMUNITY-BASED ADAPTATION - DURBAN
February 2011 Report No. 11977-10286-9 18
Slight differences in the areas of vulnerability between the communities are evident in Figure 4. While infrastructure was rated the most vulnerable for Ntuzuma, and social networks rated the most vulnerable for Ntshongweni, it is clear that livelihood strategies, demographics and social networks are key areas of concern for both communities. These are further discussed below:
Demographics: It is evident in both communities that there are a significant number of children, with a small majority of elderly people upon which the majority of the population depend for their livelihoods. There is an obvious and direct correlation to the livelihood strategies, which demonstrated an overwhelming reliance on government grants.
Social networks: Community groups in both Ntuzuma and Ntshongweni exhibited poor participation levels, reinforcing the general feeling of disunity and lack of social cohesion.
Water and waste: Neither community ranked particularly vulnerable due to the water and sanitation service development in the area.
Climate variability: Ntshongweni ranked as having a greater vulnerability to climate variability due to their reliance on food production and communal gardens.
Food security: The predominant vulnerability with food security for both communities remains the high levels of food purchasing and low levels of food production, and considering the vulnerability with livelihood strategies and low income levels, this stands to be an issue of concern.
Table 1 provides a summary of the identified projected climate change effects on Ntuzuma and Ntshongweni as derived through the social interaction process and the desktop study, and the factors used for the identification of vulnerabilities and priority areas. This table was then used to outline adaptation actions.

COMMUNITY-BASED ADAPTATION - DURBAN
February 2011 Report No. 11977-10286-9 19
Table 1: Identified positive and negative impacts of climate change on the two communities Factor Ntuzuma Ntshongweni
Challenge/Description Implication Current response/s
Challenge/Description Implication Current response/s
Physical Topography Steep slopes • Dangerous living
conditions • Loss of soil cover
None identified – many informal dwellings in steep areas
Steep slopes • Loss of soil cover None identified
Geology/Soils Infertile, unstable, prone to slipping and trapping of vehicles
• Danger to settlements and vehicles in heavy rains
• Lowered soil cover and nutrient leaching
None identified Infertile, unstable, prone to slipping and trapping of vehicles
• Danger to settlements and vehicles in heavy rains (potential landslides)
• Lowered soil cover and nutrient leaching
None identified
Water Courses/Bodies
Gobogobo River, Piesangs River, to Mgeni
• Potential for pollution and contamination of water courses (in terms of sanitation and waste)
None identified Umlaas River Ntshongweni Dam Sterkspruit
• Potential for pollution and contamination of water courses (in terms of sanitation and waste)
None identified
Floodplains Some settlement • Flooding/damage to property and wetland
None identified None identified
Flora & Fauna Natural vegetation
Highly transformed Little natural vegetation remaining D’MOSS to the south
• Poor ecosystem function – Gobogobo area in poor condition
• Community participation in preservation of Gobogobo
None identified Many D’MOSS areas Forest areas used for muthi harvesting
• Depletion for fuelwood & muthi – poor ecosystem services
• Shongweni Resources Reserve and D’MOSS system providing some wetland systems/flood attenuation
Animal life Only domestic animals • Overgrazing and poor soil/veld quality
None identified Only domestic animals
Alien plants Dense stands • Increase under climate change
• Ntuzuma Co-operation (farming group) involved in
Considerable infestation in D’MOSS areas
• Community clearing initiatives
• Existing clearing programmes in D’MOSS

COMMUNITY-BASED ADAPTATION - DURBAN
February 2011 Report No. 11977-10286-9 20
Factor Ntuzuma NtshongweniChallenge/Description Implication Current
response/s Challenge/Description Implication Current response/s
alien plant eradication
Food Security Limited space Steep slopes
• Reliance on purchased food
• Farming groups (mostly unemployed, older women) which grow vegetables for local markets and households
• Some water harvesting for irrigation
Farming land available Lack of availability of farming technology Lack of local markets
• Travel required for sale of produce
• Reliance on external markets
• Farming groups (mostly unemployed, older women) which grow vegetables for local markets and households
• Sale of produce to neighbouring communities brings in some income
Social StructuresSocial Structures
Reliance on government grants High unemployment Culture of dependency Poor social networks
• Income diversification required
• Stokvels used as saving schemes
• Support groups
Reliance on government grants High unemployment Poor social networks Young community (non-income earners)
• Income diversification required
• Need for childcare/basic education
• Stokvels used as saving schemes
• Indunas in some areas (traditional leadership)
• Policing forums for crime investigation, Hillcrest police
• Social groups: health workers, HIV/AIDS support, sewing/craft/ beadwork, farming, poultry, tutoring
Infrastructure Health Accessible but requires
travel Lack of staff Lack of medicine
• Disease – impoundment of water
• Heat stress • Increased vulnerability
of weaker community members
• Spraying programmes for malaria
• Home-based care groups exist
Accessible but requires travel
• Disease – impoundment of water
• Heat stress • Increased
vulnerability of weaker
• Social groups: health workers, HIV/AIDS support

COMMUNITY-BASED ADAPTATION - DURBAN
February 2011 Report No. 11977-10286-9 21
Factor Ntuzuma NtshongweniChallenge/Description Implication Current
response/s Challenge/Description Implication Current response/s
community members
Roads Impoundment of water Transport network
• Vector breeding • Access routes and
transport to employment locations
• Informal taxi system which appears to be adequate
Transport network • Access routes and transport to employment locations
Informal taxi system which appears to be adequate
Water supply – drinking
Municipal tanks • Household access • 200 l tanks provided by municipality to each household
• 3,500 official water connections
• Programme of in situ upgrades by municipality
• Water is collected from the river, saved and stored using buckets
• “Dirty” water is cleaned through boiling with a teaspoon of bleach
• Some houses use metal tanks to collect water from gutters
Standpipes or ground tanks
• Non-exclusive access – spread of disease, unhygienic
• Municipal ground tanks or standpipes supplied
Water supply - farming
Municipal tanks • Household supply • Some water harvesting for irrigation by farming groups
River • Irrigation difficult • Use of river water for farming
• Use of vetiver grass for slowing of water flow and prevention of erosion
• Trench systems for drainage
• Some grey water is

COMMUNITY-BASED ADAPTATION - DURBAN
February 2011 Report No. 11977-10286-9 22
Factor Ntuzuma NtshongweniChallenge/Description Implication Current
response/s Challenge/Description Implication Current response/s
used, with some forms of water harvesting (trenches)
• Watering in the early morning
• Use of kraal manure and organic fertilisers
• Levelling of land • Intercropping • Mulching
Stormwater management
Inadequate – major runoff
• Erosion • Loss of potentially
harvested water • Vector breeding
• None identified – currently inadequate particularly with regard to roads
Improved stormwater infrastructure coverage
• Inadequate – major runoff
None identified
Sanitation Most houses have access to flush toilets
None identified Long drops/Urine Diversion Toilets (UDTs)
• Higher disease incidence
• Municipal programme in place since 2001 to provide Urine Diversion Toilets
Housing Unsuitable materials • Warm conditions • Prone to collapse • Climate resilient building
required
• Use of poor housing materials to construct informal housing
Unsuitable materials • Warm conditions • Prone to collapse • Climate resilient
building required
• Municipal supplied housing
• Use of bricks where possible to build houses (stability in windy conditions) and placement of tyres on roofs to prevent roofs from blowing off
Waste management
Satisfactory • Conditions conducive to disease
• Waste & recycling awareness & employment
None identified Satisfactory • Conditions conducive to disease
• Waste & recycling awareness &
None identified
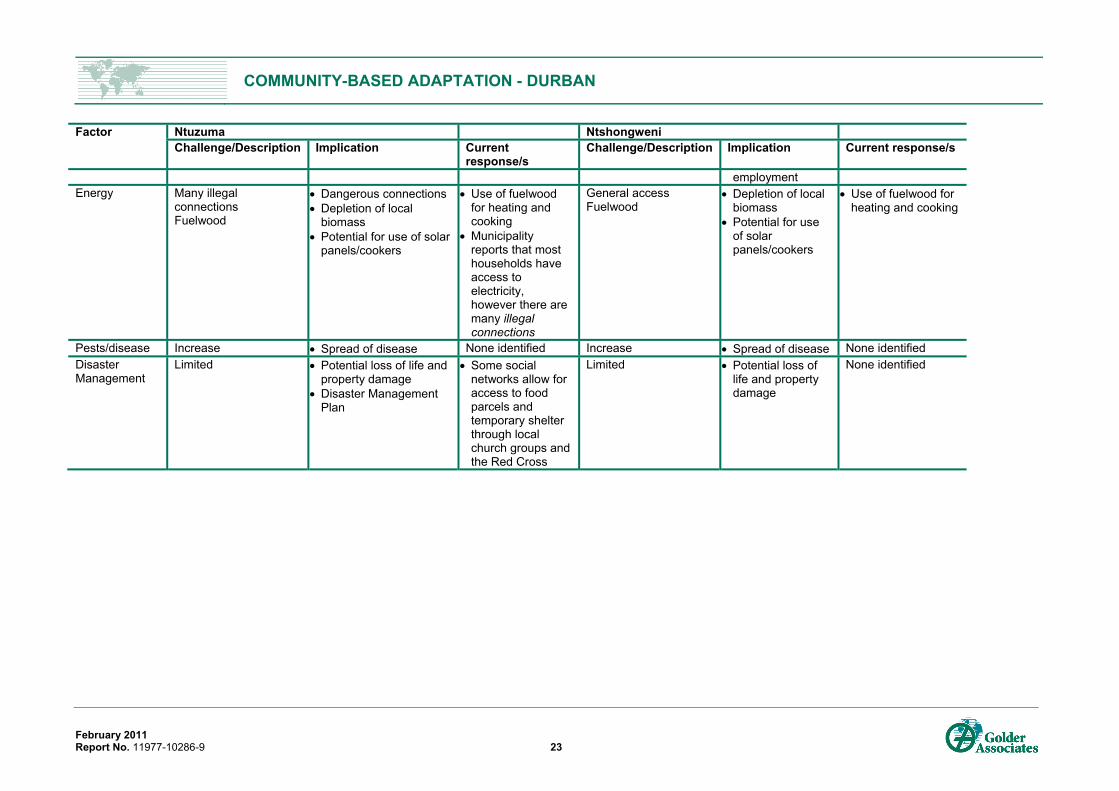
COMMUNITY-BASED ADAPTATION - DURBAN
February 2011 Report No. 11977-10286-9 23
Factor Ntuzuma NtshongweniChallenge/Description Implication Current
response/s Challenge/Description Implication Current response/s
employment Energy Many illegal
connections Fuelwood
• Dangerous connections • Depletion of local
biomass • Potential for use of solar
panels/cookers
• Use of fuelwood for heating and cooking
• Municipality reports that most households have access to electricity, however there are many illegal connections
General access Fuelwood
• Depletion of local biomass
• Potential for use of solar panels/cookers
• Use of fuelwood for heating and cooking
Pests/disease Increase • Spread of disease None identified Increase • Spread of disease None identified Disaster Management
Limited • Potential loss of life and property damage
• Disaster Management Plan
• Some social networks allow for access to food parcels and temporary shelter through local church groups and the Red Cross
Limited • Potential loss of life and property damage
None identified

COMMUNITY-BASED ADAPTATION - DURBAN
February 2011 Report No. 11977-10286-9 24
4.3 Adaptation plan Major issues of concern in the two communities stemmed from crime, particularly in terms of theft of crops and fences. Furthermore, the issues of personal safety in terms of survey procedures in Ntuzuma in particular indicate that there are major social problems in this area. It is evident, given the socio-economic history of the two communities, that there is a lack of social cohesion and economic stability, which is likely to take many years to address. These issues are likely to be of more immediate concern than issues of environmental management and climate resilience.
Following on from the research, two main components of an adaptation strategy are therefore proposed. The first is a long-term social programme that focuses on increasing social resilience through micro-scale engagement. The second is a long-term project that focuses specifically on climate change adaptation.
4.3.1 Social programme to increase social resilience This first component of adaptation will have two main objectives: to implement a programme of social change and to allow the municipality sufficient time to increase their internal capacity to develop plans and foster alignment to the adaptation project.
To achieve the first objective, a long-term social resilience and cohesion programme is recommended. This programme should focus on increasing the capacity and social cohesion at a micro-scale, such as building the resilience of neighbourhoods within the selected communities. It is envisaged that weekly, small group gatherings will take place within neighbourhoods that focus on building unity and fostering a healthy social environment. These gatherings should be well facilitated, thus the programme will be resource intensive. Use should be made of existing community groups and other organisations, as well as relevant municipal departments. As the small group gatherings gain momentum, they can be mobilised to achieve certain social objectives. For example, once a basic communality has been fostered within a neighbourhood, focus can be placed on increasing the safety of the neighbourhood – objectives such as ‘creating a safe street’ can be determined, that requires the support of each household within a neighbourhood. As this is achieved, so the impact of the project will expand. This programme should be complemented by a social educational programme within schools and an improvement to the policing and justice system.
Regular studies are recommended to determine the progress being made in increasing social resilience. It is, however, anticipated that within 5 – 8 years, the communities will have improved this resilience and thus a specific climate change adaptation project can be implemented. During this time, regular monitoring will be needed to determine changes in the stipulated physical and environmental conditions.
4.3.2 Climate change specific adaptation Based on the combined biophysical and social vulnerability assessment, it has been determined that the areas in need of greatest adaptation are shelter, water, health, food and energy. It is understood that municipalities and communities should be adequately informed of the impacts of climate change, from a safety risk and economic perspective. An adaptation plan has been designed towards climate-specific adaptation in relation to these areas. The adaptation plan should generate co-benefits in terms of socio-economic resilience and social cohesion (a more stable society), climate change preparedness and adaptive capacity, as well as environmental management and better preservation of natural systems. As such, the main objectives of the adaptation plan are as follows:
To improve education and awareness of the science of climate change;
To stimulate consciousness of the impacts of climate change and the multi-dimensional ways in which this is manifested;
To provide people with suitable information with which to support their adaptation; and
To better capacitate structures – both municipal and societal – to respond and support local adaptation.
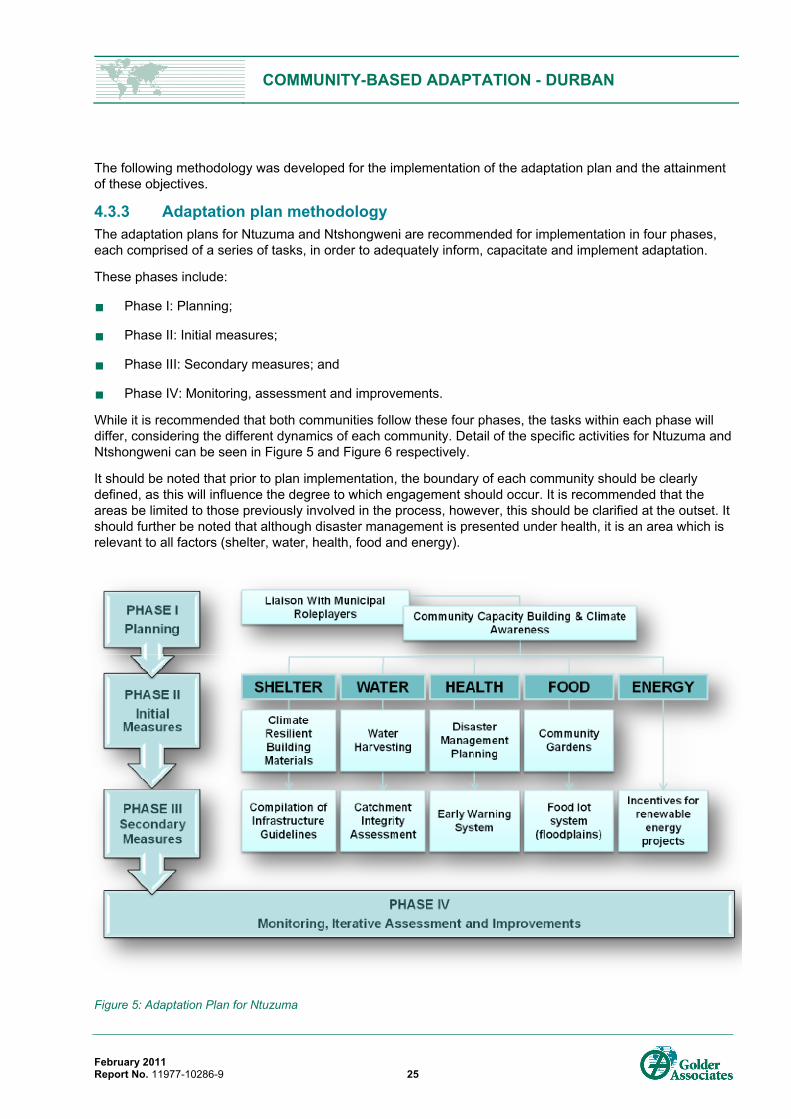
COMMUNITY-BASED ADAPTATION - DURBAN
February 2011 Report No. 11977-10286-9 25
The following methodology was developed for the implementation of the adaptation plan and the attainment of these objectives.
4.3.3 Adaptation plan methodology The adaptation plans for Ntuzuma and Ntshongweni are recommended for implementation in four phases, each comprised of a series of tasks, in order to adequately inform, capacitate and implement adaptation.
These phases include:
Phase I: Planning;
Phase II: Initial measures;
Phase III: Secondary measures; and
Phase IV: Monitoring, assessment and improvements.
While it is recommended that both communities follow these four phases, the tasks within each phase will differ, considering the different dynamics of each community. Detail of the specific activities for Ntuzuma and Ntshongweni can be seen in Figure 5 and Figure 6 respectively.
It should be noted that prior to plan implementation, the boundary of each community should be clearly defined, as this will influence the degree to which engagement should occur. It is recommended that the areas be limited to those previously involved in the process, however, this should be clarified at the outset. It should further be noted that although disaster management is presented under health, it is an area which is relevant to all factors (shelter, water, health, food and energy).
Figure 5: Adaptation Plan for Ntuzuma
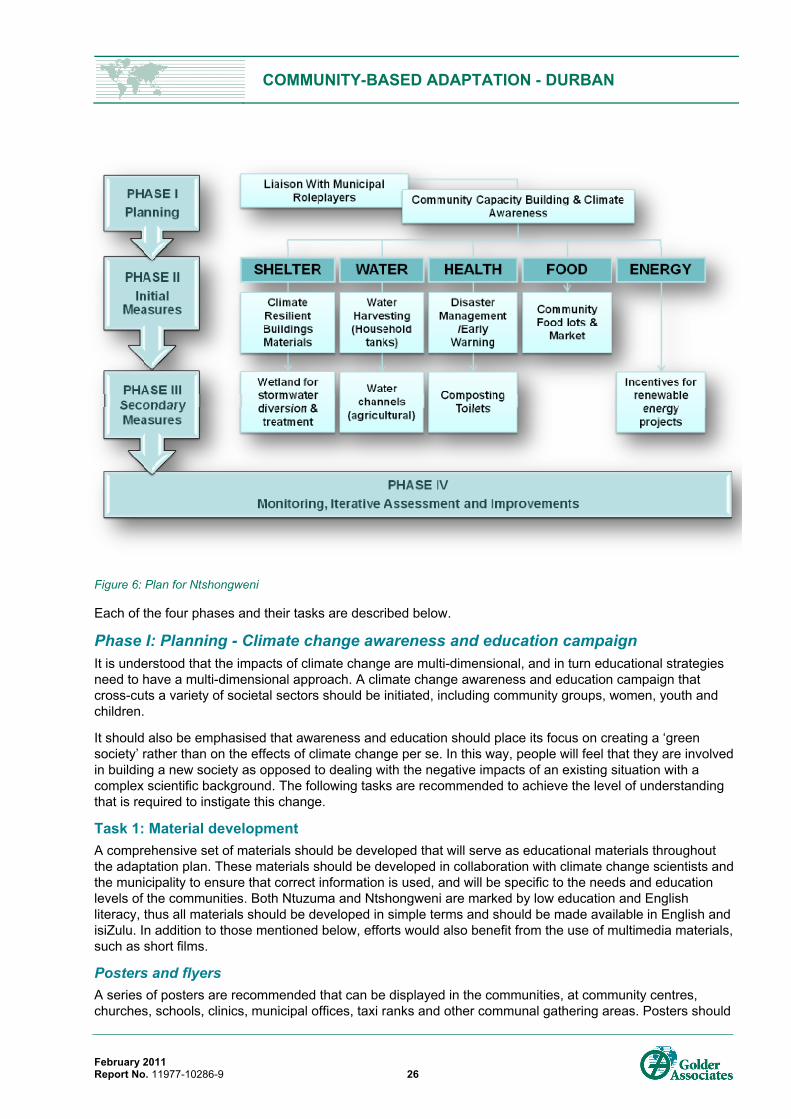
COMMUNITY-BASED ADAPTATION - DURBAN
February 2011 Report No. 11977-10286-9 26
Figure 6: Plan for Ntshongweni
Each of the four phases and their tasks are described below.
Phase I: Planning - Climate change awareness and education campaign It is understood that the impacts of climate change are multi-dimensional, and in turn educational strategies need to have a multi-dimensional approach. A climate change awareness and education campaign that cross-cuts a variety of societal sectors should be initiated, including community groups, women, youth and children.
It should also be emphasised that awareness and education should place its focus on creating a ‘green society’ rather than on the effects of climate change per se. In this way, people will feel that they are involved in building a new society as opposed to dealing with the negative impacts of an existing situation with a complex scientific background. The following tasks are recommended to achieve the level of understanding that is required to instigate this change.
Task 1: Material development A comprehensive set of materials should be developed that will serve as educational materials throughout the adaptation plan. These materials should be developed in collaboration with climate change scientists and the municipality to ensure that correct information is used, and will be specific to the needs and education levels of the communities. Both Ntuzuma and Ntshongweni are marked by low education and English literacy, thus all materials should be developed in simple terms and should be made available in English and isiZulu. In addition to those mentioned below, efforts would also benefit from the use of multimedia materials, such as short films.
Posters and flyers A series of posters are recommended that can be displayed in the communities, at community centres, churches, schools, clinics, municipal offices, taxi ranks and other communal gathering areas. Posters should

COMMUNITY-BASED ADAPTATION - DURBAN
February 2011 Report No. 11977-10286-9 27
also be made available as flyers. Generic posters are recommended for use in both communities. These could include:
Creating a ‘green society’;
Technologies associated with a ‘green society’; and
How building a ‘green society’ can improve things like health, water, shelter, food and/or energy.
Information should also be provided regarding the municipality’s programme for creating a ‘green society’ and how to get involved in the different initiatives. Information about the changing environmental and climatic factors can be included.
Posters should contain essential information pertaining to each of the topics, and should include contact information for the project.
Climate change booklet A booklet about the ‘essentials of building a green society’ could be developed. The information can largely come from the posters, but should be presented in story-form to encourage reading.
Workshop manual A workshop manual is recommended for use in municipal and community group training sessions. The manual should be interactive, complete with relevant information and exercises to ensure experiential learning and engagement.
It should also be noted that AgriSETA (the agricultural Sector Education and Training Authority) has developed a comprehensive set of training manuals that explore various agricultural practices. These manuals form different learning levels (Levels 1 – 5). A Level 1 ‘Agriculture and Creating a Green Society’ module for use in the AgriSETA programme could be developed through consultation with AgriSETA, and the interventions within the communities (particularly in Ntshongweni considering the dependence on agriculture) could serve as a pilot for the manuals. The development of the manuals could be an overall outcome of the adaptation plan, drawing on the lessons learned through this process, and could be made available to serve the greater interests of national education, awareness and adaptation.
Lesson plans A series of weekly lesson plans are recommended for use in primary and high schools. These materials should align with the posters and workshop manual, where each lesson plan will expand on each topic, as well as provide an interactive exercise to aid with learning. These lesson plans can be compiled into a workbook so that students will be able to keep the information for their personal use, and can be easily distributed to teachers and schools.
Task 2: Municipality engagement The vulnerability assessment survey results identified the need to capacitate municipal workers for them to support initiatives in their respective areas. The first recommended step is to conduct a series of meetings with municipal officials to inform them of the plans for the communities, and to seek their guidance and assistance in implementation. Contact must be made with the Ward Councillors of each area, possibly through secretaries or representatives. Materials should be given to the Councillor, through multiple personal visits with the secretary or other members of the Ward Development Committee (WDC). As such, the following people should be contacted to establish the initial meetings:
Table 2: Municipal Contacts Community Municipal Representative
Ntuzuma (Ward 42) WDC Member Ntshongweni (Ward 10) Ward Councillor

COMMUNITY-BASED ADAPTATION - DURBAN
February 2011 Report No. 11977-10286-9 28
Discussions should be held with these representatives regarding other relevant municipal role-players. Departmental representatives for housing, water, agriculture, energy, health and disaster management, based within the communities, should be included in these discussions.
Once this contact has been made, a workshop for representatives should be conducted with the following objectives:
Outline the ‘green society’ programme and identify the new methodologies and technologies;
Explain site-specific concerns with regards to climate change;
Outline the MCPP and the adaptation plan; and
Establish community contacts and plan interventions.
The booklet and other materials will be used in this workshop, which will be interactive.
Task 3: Community interaction Raising awareness in the communities is recommended through a variety of interventions. The awareness process is recommended to take place over a six month period, through indirect and direct processes. The indirect processes should be conducted prior to the direct processes to ensure that the two combine effectively. Each of the different elements in these processes is discussed.
Indirect engagement
Material distribution - Posters and flyers should be distributed throughout the communities at key communal gathering points. These should include community centres, public libraries, churches, municipal offices, taxi ranks, shops, schools and training colleges.
Radio programme - It is recommended that radio programmes be developed for Gagasi and Ukhozi FM that will discuss the concept of a ‘green society’ as well as the actions that can be taken to realise this. It is recommended that this programme be comprised of two aspects:
Weekly information slot: an educational programme should be aired for 15-30 min each week that discusses different elements of a ‘green society’. Each week different themes can be discussed ranging from food security, green technology and information on local and international initiatives, and general awareness. These shows would need to be conducted in isiZulu and made accessible to a wide range of people. Thorough discussions would be recommended with the radio stations.
Weekly radio drama: a 15-30 min weekly radio drama should be developed that translates the information detailed into live characters and real life situations. This radio drama can follow the different ‘green society’ themes and the impact on communities, as well as providing simple adaptation information.
The radio programme should be created by recognised, local developers. Ideally, the radio programme should be a permanent feature, integrated into the social programme, focusing how the social resilience and unity building features in the ‘green society’ initiative.
Newspaper supplements - Educational newspaper supplements are recommended to be printed weekly in the local newspapers, the Ilanga and Isolezwe. These supplements can be a reprint of the posters. This too should be a regular supplement and should slowly increase in its educational level and discussion of the concepts as the capacity of the communities grows.
Direct engagement
Community Groups - Community groups are often the drivers of activities and key information sources, and should be engaged in a workshop process to inform, educate and collaborate. Contact should be made with relevant community groups and meetings held to learn more about their activities

COMMUNITY-BASED ADAPTATION - DURBAN
February 2011 Report No. 11977-10286-9 29
and explain the objectives of the project. Community groups often meet once a week. It should be noted that communication and the process of building relationships is slow, and constant follow up is likely to be required. A preliminary list of community group contacts for each community is provided in Table 3 and Table 4, but upon engagement this list should be expanded.
Table 3: Community Group Contacts – Ntuzuma8 Community Group
Farming Groups
Bojwana Club Buhlebezwe Siya Shikwasa Phezukomkhono Aqophomlando Ntuzuma Co-Op
Home based Health Care Groups
Isolomusa Uthando Good News Bambanani Bambithuba
Women’s Empowerment Groups
Beadwork Women Empowerment
Support Groups Vukuzakhe Thandolude Organisation Ntuzuma Community Resource Centre
In Ntshongweni, community groups were found to be harder to contact, and this was mostly only achieved through home visits. The community has a weekly meeting at the local crèche, however, and participation in this meeting is recommended through the Councillor.
Table 4: Community Group Contacts - Ntshongweni8 Community Group
Health Groups HIV/AIDS Support group Onompilo Community Health Workers
Farming Groups
Ubuhle Buyeza Farming Sizanani Club Zimelane Garden Group Magaba Garden Group Ezakiweni Agricultural Project
Support Groups Lindi’s Creation (beadwork) Masifundisa Literacy Project
Once contact has been made with the different groups and initial meetings have been held, a one-day training workshop is recommended for each group, or a combination of the groups, similar to that held with the municipal representatives. However, in addition to providing a general overview of creating a ‘green society’, these workshops will focus specifically on the themes of each community group and their particular impacts (e.g. health, farming, etc.).
8 Contact details provided in Appendix A
COMMUNITY-BASED ADAPTATION - DURBAN
February 2011 Report No. 11977-10286-9 30
Representatives of the Department of Agriculture (DOA) may be able to assist in this process. The DOA is active in both areas, and has a series of networks and locally based workers who will greatly aid in the process of community engagement. They should be contacted from the onset of the communication process.
Faith Based Organisations - FBOs, predominantly those of a Christian denomination in these particular communities, play a strong role, and in order for education and awareness to be effective, contact with these groups is recommended. FBOs often have different social programmes that they facilitate, and contact with these groups will aid in increasing communication and expanding social networks. Once contact has been made with the different FBOs, it will be necessary to hold initial meetings to gather information about activities, and, depending on their nature, workshops can also be arranged. It may be the case that many FBO members already belong to existing community groups, thus engagement will need to remain flexible and be suited to the specific dynamics of each community. Materials should be made freely available to the FBOs and distribution of these encouraged.
School drama and awareness - A key focus of the awareness campaign should be on children, and on working through existing educational structures within the communities. It is recommended that a climate change awareness and ‘green society’ programme be implemented at the schools through use of school drama and workshops. Contact should be made with a local theatre company that will be able to prepare and perform a play about climate change/’green society’ at the different schools in Ntuzuma and Ntshongweni. Once the play has been performed, an educational and interactive workshop should follow this to ensure that school children and youth are adequately informed of the dynamics of creating a ‘green society,’ and be inspired to take an active role. As part of the larger social programme, this should be a regular feature within the educational system and should include social issues. Promoting education and awareness through the schools will serve several purposes. Firstly, educating children and youth ‘green society’ will help to ensure their understanding and active involvement into the future. Secondly, materials should be provided to school children, which will then be transferred into homes and households, securing a line of knowledge transfer and sharing.
Schools in the area should also be approached to have a regular classroom lesson on creating a ‘green society’. This could either be facilitated by the teachers of the schools (through training and provision of materials), or be organised as a follow-up activity. Investigations should also be made into creating or supporting food gardens at schools. This could be a primary activity within the ‘green society’ lesson plans, and could aid communities in creating experiential learning for children while implementing a food security project that can be used by the school.
Community gatherings - Community gatherings in Ntuzuma and Ntshongweni have been found to be difficult to organise. As such, there is need to generate interest within communities. By conducting the activities as previously described, this may be achieved. The event could be opened by the respective Councillors, have informative discussions and could feature the play previously performed at the schools. There could be interactive workshops that focus on empowering the established neighbourhoods for the implementation of Phase 2 of the adaptation plan. To ensure good attendance of the events, advertising is required. This can be done through community groups, faith based organisations, schools, radio programme and newspaper articles.
Phase II: Initial Measures While effective climate change adaptation will require long-term planning and implementation, there are a number of short-term responses which may be addressed and implemented. There are five fundamental requirements for good quality of life – shelter, water, health, food and energy – and potential adaptation measures with respect to these are discussed below.
Water Water harvesting is a recommended measure towards water resilience and household self-sufficiency. Although there are several social acceptance issues around household tanks, this remains a viable option if correctly implemented. A thorough literature review and study was undertaken to discuss various water

COMMUNITY-BASED ADAPTATION - DURBAN
February 2011 Report No. 11977-10286-9 31
harvesting techniques (see Section 6.1) and the following matrix of opportunities for water harvesting in Ntuzuma and Ntshongweni was developed, as seen in Table 5. Only this table is shown here, but the full discussion around water harvesting can be found in Section 6.0.
Table 5: List of Recommended Water Harvesting Technologies for Ntuzuma and Ntshongweni Technology Advantages Disadvantages NTUZUMA Rooftop water harvesting Ferro-cement tanks • Good quality water
• Easy access • Evaporation losses minimal • Inexpensive • Moderate maintenance
• Vulnerable to contamination, algae growth and warming
• Entry of reptiles and small animals at the top opening
• Tanks are fixed • Metal tanks cause leaching of Zinc
and can rust • Space is required to place tank
Purposefully-built catchment
• Easy to construct; • Inexpensive – depending on the size and
structure to be constructed
• Concrete structures are immovable
Floodwater harvesting Floodwater diversion
• Concentrate water into depleting rivers and streams
• Steep slopes can facilitate
• Flooding of rivulets
Check dams: Concrete built across streams
• Regulates run-off • Trap silt • Safe disposal of run-off • Collect water for irrigation (for communal
gardens) • Replenishes underlying aquifers • Recharge groundwater
• Requires skills in construction
NTSHONGWENI Rooftop water harvesting Ferro-cement/plastic tanks
• Initially good quality water • Easy access • Evaporation losses minimal • Inexpensive • Moderate maintenance
• Vulnerable to contamination, algae growth and warming
• Entry of reptiles and small animals at the top opening
Floodwater harvesting Lined ponds • Cheap and easy to construct
• Can be done by ordinary farmers • If not properly covered, the water
might infiltrate. • Dig out the pond • Lined with propylene plastic
Contour bunding • Inexpensive • Requires few skills • Easy to maintain • Improves soil moisture storage
• Infiltration of water to groundwater
Groundwater harvesting Underground cisterns
• Can potentially hold 6,000 litres • Reduced evaporation • Reduced seepage into the ground
• Access to water is difficult, usually needs a pump to extract water
• Children and small animals might

COMMUNITY-BASED ADAPTATION - DURBAN
February 2011 Report No. 11977-10286-9 32
Technology Advantages Disadvantages (concrete)
• Farming area - a large tank would be beneficial for the farming communities.
fall in the tank if not covered
In Ntuzuma, a number of water harvesting projects are already in progress. It is recommended that these projects be continued and monitored, and investigations made into expanding them. It is possible to use the community groups previously contacted for this project for further pilot studies within the different sectors.
In Ntshongweni, a pilot study using ferro-cement tanks is also recommended, given the space available in the farming areas. An underground cistern (groundwater harvesting) is also recommended to provide access to a large reservoir of water for farming practices, although a pump may be required to provide access to the water.
In addition, an awareness programme should also be implemented in Ntshongweni with farming groups that is focused around creating earth channels for diversion. It is recommended that a training workshop be held with the aforementioned community farming groups with workshop and information materials. This could be implemented in co-ordination with the Department of Agriculture, and the event could take on the form of a farmer’s “field day”.
Health Climate change will place pressure on the health care infrastructure of the municipality due to the increase in vector- and water-borne diseases. There is also a significant health impact on already vulnerable groups, such as those with HIV/AIDS, the very old and the very young.
In response to this, the following adaptation activities should be implemented (aligned with the Municipal Adaptation Plans, MAPs):
Undertake a structured review of the primary health care system to identify interventions required to enhance institutional capacity and develop plan for implementation;
Develop an umbrella Health Department Emergency Plan towards disaster management, to enhance emergency response capability, resourcing, co-ordination and prioritisation of cases between primary, secondary and tertiary response units. Contingency plans should be developed for each response unit including the following aspects:
Early warning of disease outbreaks and extreme weather (heat waves/storms) in conjunction with the South African Weather Service and/or other research organisations;
All hospitals to be equipped with back-up energy (renewable or generators) to cope with the combination of heat related stress and simultaneous power outages;
“Cool rooms” to be identified in local communities (e.g. air-conditioned church hall);
Development and communication of emergency procedures and response actions to the community concerned; and
Particular focus on care for HIV/AIDS patients.
Investigation into further roll-out of composting toilets and other technologies to avoid poor-hygiene situations in low-income housing areas.
Sanitation In terms of sanitation, the use of urine-diversion toilets has reportedly been instituted in the RDP housing areas at Ntshongweni. For the rural areas, the use of composting toilets (or other similar technology) is recommended for more hygienic sanitation and disease prevention. This will be particularly important in a
COMMUNITY-BASED ADAPTATION - DURBAN
February 2011 Report No. 11977-10286-9 33
warmer, wetter climate and discussions with water and housing municipal representatives will need to be arranged.
Public education campaign A public education campaign is recommended for the Department of Public Health that focuses on how communities should respond to various climate change-related health impacts. This could include:
Community actions to be taken in the event of a heat wave;
Investigation of measures to secure the availability of electricity in all conditions and especially during heat waves, cold snaps and heavy rainfall events;
Development and maintenance of an “extreme climate” public early warning system for the community (according to the Disaster Management Plan); and
A training module for community health workers and caregivers.
Food For both communities, the use of food gardens for healthy food production should be encouraged, as outlined in later sections of this report.
Energy There are no adaptation strategies with regard to energy envisioned for this phase of the adaptation plan, due to the complexity of this factor. It will be further discussed in Phase III.
Phase III: Secondary measures It is anticipated that Phase III of the adaptation plan will directly follow on from those activities implemented in Phase II. This phase, however, will focus on expanding those initiatives to ensure their integration into the communities. Specific activities have been envisaged for each community during this phase, and are listed below:
Ntuzuma
Compilation of infrastructural guidelines for housing developments;
A catchment integrity assessment to further understand water impacts and yield;
The development of an early warning system;
The establishment of food lot systems located within existing floodplains; and
Creating incentives for renewable energy projects.
Ntshongweni
Further investigations into using wetlands for stormwater collection, attenuation and treatment;
The creation of water channels for agricultural purposes;
Further implementation of composting toilets; and
Creating incentives for renewable energy projects.
Phase IV: Monitoring, iterative assessment and improvements Monitoring and assessment of the activities in Phases I – III is a crucial step towards the success of the adaptation plan and contributing to local climate change resilience.

COMMUNITY-BASED ADAPTATION - DURBAN
February 2011 Report No. 11977-10286-9 34
A monitoring and evaluation system for each activity should be implemented from the outset, and should include regular updates on activities, insights gained and lessons learned. This will assist in documenting the social and institutional memory of the communities and the activities undertaken, and will help to improve future activities of the municipality with respect to climate change adaptation.
4.3.4 Adaptation planning constraints While the above vulnerabilities have been identified, it is important to acknowledge a number of social trends and reflections that are likely to strongly influence the implementation of adaptation strategies. These include the following:
Unity and social cohesion within the communities: The study has found that there is a high degree of disunity within the communities, and this is likely to make implementation of adaptation measures difficult. There are strong issues of mistrust and lack of transparency. People report that there are high theft and crime rates and the ‘sense of community’ is weak. Adaptation strategies will need to aim at bringing people together and strengthening existing social groups.
Existing political and social structures: The study indicated that the majority of people were not comfortable with community leadership and service delivery, and that differences would often arise between political and traditional leadership. Similarly, there were indications that traditional leadership no longer has the authority that it previously had, and thus decisions by these parties do not always have effective results. Adaptation strategies will need to take these dynamics into account and seek to overcome reliance on external leadership. This will require examination of the current leadership structures within the community and how these can best be used to support such a change.
Increasing interest, participation and motivation levels within the community: The study revealed that while there is potential for increased group activity, this is hampered by a lack of interest and participation within the community. This could be the result of a number of factors:
Limited economic opportunities within the community, leading to an attitude of apathy and de-motivation;
Reliance on government grants - while people have access to some form of income, they are less inspired to create their own income and are reluctant to be involved in more than what they need to be; and
Lack of education and skills development.
The adaptation strategy therefore needs to address elements of education, awareness of environmental changes and social issues, develop skills and inspire motivation and participation from community members. It was also noted that elderly women are the predominant group involved in social activities, and there needs to be increased participation from youth and unemployed men. It was further noted that communication mechanisms around social issues need to be improved and the majority of people felt that drama and music were effective means of achieving this. Adaptation strategies, therefore, will need to aim at improving the skills and education levels within the community through engagement on a socially driven project that will increase participation, generate new activities within the community, and motivate people.
Reliance on government grants and income diversification: The study showed that there is a heavy reliance on government grants, exacerbated by the lack of job opportunities within the area. The majority of formal employment happens outside of the community and thus people are forced to migrate to secure an income. Additionally, one of the most common government grants used is a pension, and there is heavy reliance on the older population to support the younger generations. This is increasingly prevalent with HIV/AIDS (although this is recognised as a societal trend within South Africa as a whole and was not a focus for this study), where economically active people are the most affected by the disease. In both communities, there are significant numbers of children, with a small number of elderly people upon which the majority of the population depend for their livelihoods. As such, there is a great

COMMUNITY-BASED ADAPTATION - DURBAN
February 2011 Report No. 11977-10286-9 35
need for creating employment opportunities and income diversification. Incentives need to be created with the implementation of the adaptation strategy if it is to create an enabling environment where these vulnerabilities can be addressed.
Support of existing coping strategies and community groups: It is evident that coping strategies have been put in place to deal with changes experienced, and adaptation strategies will need to align with these. Water harvesting is a positive option, although emphasis will need to be placed on water safety as this has already been raised as an issue. Systems must ensure that water quality is safe for human consumption and that this is communicated. There are also a number of functioning community groups within the community that should be supported through this process, and techniques should be devised that can address their current needs, while also being accessible to other groups or individuals.
Alignment with government departments: A variety of government departments have connections with the community, and the adaptation strategy will need to ensure that these networks are supported. Particular mention should be made of the extension workers and the large role that they could play in bringing people together to overcome challenging issues. Linkages should be made with the Departments of Agriculture, Social Development, Water, Housing and Health to enable the adaptation strategy to be supported and sustained.
Connection to and improvement of health care systems: One of the main challenges identified by the communities was access to quality health care services. Not only are clinics and hospitals difficult to reach, there is dissatisfaction with the quality of service provided. There is still evidence of stigma regarding certain diseases, namely HIV/AIDS, and the adaptation strategy will need to touch on these issues to ensure that it is viewed as meeting pertinent needs as identified by the community.
4.4 Closing remark on vulnerability and adaptation This section has provided a framework for the implementation of a climate change adaptation strategy in Ntuzuma and Ntshongweni, taking into account the five focus areas of adaptation – shelter, water, health, food, energy, and disaster management.
While this document serves as an overview of the activities to be implemented, each phase and activity will need to be further expanded on to ensure effective adaptation that takes into account both climate science and social and community dynamics. It is also recommended that further consideration be given, and extensive research conducted, to inform the design and implementation of the social programme.
5.0 SUB-PROJECT 2: FOOD SECURITY PILOTS This section introduces and describes the pilot projects carried out towards the identification of climate resilient foodstuffs.
5.1 Preliminary food security survey and initial crop projections The preliminary food security survey carried out in the early stages of the eThekwini Integrated Assessment Tool for Climate Change Project (Golder Associates Report Number 10290-9743-13, October 2010) is documented in this section. This work informed the direction and planning of the CAP project.

COMMUNITY-BASED ADAPTATION - DURBAN
February 2011 Report No. 11977-10286-9 36
5.1.1 Survey approach In order to meaningfully understand the potential impact of climate change on subsistence agriculture, it was necessary to determine the extent to which people in the lower income bracket provide for their own food needs through agricultural activities, and what these activities entail. Two preliminary surveys were undertaken to provide data on food consumption and production related to food security of the rural and peri-urban communities in Durban. The first survey was designed to assess food consumption and entailed a team of researchers travelling throughout the municipal area to retail outlets and questioning the management on the following:
What are the main products being sold?
Where are they being produced?
What are the prices of the products?
Ten points of sale were visited over a two-day period on 6 and 7 December 2007.
The second survey was designed to gather as much information as possible from households and homesteads of rural and peri-urban communities within Durban regarding the following:
Household demographics and socio-economic status;
Crop cultivation;
Livestock ownership;
Food expenditure; and
Consumption.
Forty townships in eighteen wards (Figure 7) were selected, and two teams of two people conducted interviews with people from a total of 207 households on an arbitrary basis. It is recognised that this sampling technique only provides indicative results.
The survey established that there are currently 17 different types of vegetables (Figure 8) and 14 different types of fruit grown (Figure 9) within the municipality.
The most common crop grown within the municipality is maize, which is grown by 89% of the households surveyed. The second most popular crop is pumpkin (36%), followed by beans (28%). The other vegetables include sweet potatoes and spinach which represented 17% each.
The most common fruit grown was found to be banana, followed closely by mango, pawpaw (papaya) and avocado. Fruit growing is generally limited to a few trees per household.
Figure 7: Wards indicating general location of surveyed townships

COMMUNITY-BASED ADAPTATION - DURBAN
February 2011 Report No. 11977-10286-9 37
0.0% 10.0% 20.0% 30.0% 40.0% 50.0% 60.0% 70.0% 80.0% 90.0% 100.0
Beans
Brinjals
Butternut
Cabbage
Carrots
Chillies
Maize
Marrow
Onions
Peas
Peppers
Potatoes
Pumpkin
Spinach
Sw eet potatoes
Tomatoes
Turnip
0.0% 2.0% 4.0% 6.0% 8.0% 10.0% 12.0% 14.0% 16.0%
Apples
Avocado
Bananas
Grapes
Guava
Lemons
Litchis
Mangoes
Mulberries
Naartjies
Oranges
Paw -paw
Peaches
Pineapple
Figure 8: Percentages of vegetables grown in Durban by interview respondents
Figure 9: Percentages of fruit grown in Durban by interview respondents
5.1.2 Food Expenditure and Consumption Figure 10 illustrates the food types consumed by households. The most common food types consumed are staple foods such as mielie (maize) meal, rice, bread and potatoes. Although a large percentage of households consumed tomatoes, carrots and cabbage, the kilograms consumed were relatively low.

COMMUNITY-BASED ADAPTATION - DURBAN
February 2011 Report No. 11977-10286-9 38
0.0%
10.0%
20.0%
30.0%
40.0%
50.0%
60.0%
70.0%
80.0%
90.0%
100.0%
Samp
Mielie M
eal
Rice
Bread
Wheat Flour
Cereal/ M
abela
Peas/Lentils
Potatoes
Tomatoes
Carrots
Cabbage
Pumpkin
Fruit
Tinned Goods
Figure 10: Percentage of households consuming various food types
An extremely important finding emanating out of discussions with the survey team after completion of their work is that it appears that rural communities are producing approximately 50% of their monthly food requirements while purchasing the rest. Given the current escalation in food prices it is likely that the emphasis placed on subsistence agricultural activities will increase.
5.1.3 Projected impacts of climate change on crops A number of the important crops identified during the survey mentioned above were studied in relation to their potential response to increases in temperature, with modelling carried out by the Department of Agriculture and Environment Affairs at Cedara using its BioResource Unit programme. It is unfortunate that potential changes in precipitation could not be considered at the time, as the information was not available at that stage of the project.
A graphical summary of the yield responses to climate change according to the BioResource Unit programme is shown in the following figures.

COMMUNITY-BASED ADAPTATION - DURBAN
February 2011 Report No. 11977-10286-9 39
Figure 11: BioResource Unit projections for change in yield with temperature – potatoes, tomatoes (January and October planting), Pumpkin and Banana
Figure 12: BioResource Unit projections for change in yield with temperature – sugar (irrigated and dryland), cabbage and carrots

COMMUNITY-BASED ADAPTATION - DURBAN
February 2011 Report No. 11977-10286-9 40
Figure 13: BioResource Unit projections for change in yield with temperature – maize, sorghum, soybean and dry bean
In terms of the BioResource Unit and GCM analyses, most results were consistent across the various agricultural yield types, and indicated improved conditions for pumpkins (varieties suited to hotter climates), bananas, mangoes, pawpaws (although this suitability is inland, while coastal areas lose yield capability for this crop, sugar cane and Eragrostis curvula (pasture grass). The analysis of avocadoes indicates that conditions are poor for these fruits within the municipality, and this situation does not improve with changes in temperature. Dry bean yield, according to the BioResource Unit programme, shows a decline in yield with temperature, particularly in a band along the coast. However it remains a viable crop for cultivation in the municipality. Cabbage and carrot yield is projected to decrease with an increase in temperature. Sorghum, although originally identified as a potential replacement staple crop for maize, is projected to experience poorer yields, particularly along the coast. Soybean yield, particularly along the coast, is projected to decrease significantly both in the intermediate (2045 – 2065) and future (2081 – 2100) timeframes. Inland within the municipality some successful crops may be gained, however, this is not likely to be at current production levels.
Importantly, the analysis indicated that poorer yields are projected for dryland maize with an increase in temperature, which is particularly concerning for subsistence farmers who are not able to carry out irrigation and other supplementary farming practices. This analysis also indicates that an April planting of maize is likely to allow for improved yields with an increase in temperatures (maize is currently planted later in the year).
Due to the results available at the commencement of the DANIDA project, and the fact that these indicated that an increase in temperature could lead to a decrease in maize yield (Durban’s most important subsistence vegetable crop), the food security sub-project concentrated on the identification of alternate, climate resilient crops.
5.2 Food security trials As previously stated, agricultural production is highly dependent on climate, because solar radiation, temperature and precipitation are the main drivers of crop growth. Climate change is projected to have a significant impact on food supply in terms of the types of crops, yields and distribution of food for various crops. The net result could be a significant reduction in the availability of food to the city’s citizens, and food security in turn.

COMMUNITY-BASED ADAPTATION - DURBAN
February 2011 Report No. 11977-10286-9 41
5.2.1 Study purpose The purposes of this sub-project were:
To devise a pro-active response to a changing climate with regard to food security in the peri-urban areas around Durban;
To conduct a general study to establish likely scenarios of agricultural productivity in relation to the degree of climatic change, with the more specific objectives of:
Identifying model climatic site/s as possible example/s of Durban’s future agricultural productivity;
Identifying potential alternative crops to maize under these growing conditions;
Identifying other mitigating measures that can be put in place to enhance sustainability and food security under these growing conditions; and
Through these objectives, to answer the following questions:
− What is the change in yields of current staple crops likely to be, given the projected climate change scenarios?
− What alternative crops can be grown to these current staple crops and which new practices introduced to mitigate changes in yield/climate and increase food security, given the projected climate change scenarios?
− Assuming that the future staple crop/s will change from maize, what is the acceptability of these alternative crops from a social perspective?
The current staple crop of the eThekwini Municipality is maize. Although there are many different crops that could be considered, the following crops were identified as being possible alternatives to maize:
Maize intercropped with pumpkins;
Dry beans;
Wheat;
Sorghum;
Sweet potato;
Madumbe; and
Cassava.
These potential alternative crops were grown and trialled in four different climatic zones which simulated some of the projected climate change scenarios, specifically relating to an increase in temperature of between 1°C and 3°C. As such, field trials were established at 4 sites, ranging from cool to very hot, with crops being grown at different times of the year (winter/summer) in order to optimize yields. The sites included:
Ntshongweni;
Ntuzuma;
Owen Sithole College (OSCA, Empangeni); and
Makhatini Flats research station (Jozini).

COMMUNITY-BASED ADAPTATION - DURBAN
February 2011 Report No. 11977-10286-9 42
Ntshongweni and Ntuzuma represent the current climate in Durban, whereas the warmer areas at OSCA and Makhatini may give an indication of Durban’s future climate. The location of the four trial sites is illustrated in Figure 14.
Figure 14: Location of the four food security trial sites
5.2.2 Background on each site Ntshongweni The site co-ordinates were 29°50’89’’S and 30°39’47.67’’E, and the trial plot was located in rural Ntshongweni at higher altitude. The 1 hectare (10,000 m2) trial site area was privately owned by Mr Kunene, who owned a house and shop in close proximity to the site. The topography is characterised as flat to gently sloping in a northerly direction. The trial site is easily accessible and tractor-drawn mechanical operations are fairly feasible. The trial site was initially unprotected from grazing animals, and as such it was necessary to erect a 1.2 m Bonnox perimeter fence.
The Bioresource Unit (BRU) Code for Ntshongweni is Vb15, and it is found in Bioresource Group 4 (BRG subgroup 4.6a). Bioresource Group 4 is defined as "Dry Coast Hinterland Ngongoni Veld".
COMMUNITY-BASED ADAPTATION - DURBAN
February 2011 Report No. 11977-10286-9 43
The average rainfall for this BRU is 767 mm per annum. The mean average annual temperature is 18.3°C, the average minimum is 12.5°C and the average maximum is 24.1°C.
Ntuzuma The Ntuzuma trial site is located at 29°43’14.48’’S and 30°56’46.05’’E in the Ntuzuma Township, which is part of the INK area (Inanda, Ntuzuma, KwaMashu) to the North of Durban. The 5,000 m2 trial site belongs to Dumehlezi High School within the Ntuzuma G Section. The trial site is bordered by a small stream on the east side and the school on the west. The trial area is characterised by a number of rocks in the middle and slopes towards the stream in fairly steeply in places. The area is inaccessible to tractors and all activities have to be performed using manual labour. The area is fenced with a wide concrete palisade fence with several gaps. These gaps were closed as possible by means of razor wire.
The Bioresource Unit Code for Ntuzuma is Wa7 and it is found in Bioresource Group 1 (BRG subgroup1.3). Bioresource Group 1 is defined as "Moist Coast Forest, Thorn and Palm Veld".
The average rainfall for this BRU is 841 mm per annum. The mean average annual temperature is 19.8°C, the average minimum is 15.4°C and the average maximum is 24.3°C.
Owen Sithole College of Agriculture The trial was established at the Owen Sithole College of Agriculture (OSCA) research station, at 28°38’30.79’’S and 31°55’42.59’’E in Zululand, close to the town of Empangeni. The trial site is approximately 5,000 m2 in extent, and is fairly flat to gently sloping in a southerly direction. The trial was established in collaboration with the Department of Agriculture and Environment Affairs (DAEA) through a Memorandum of Agreement, and according to this arrangement, DAEA staff took part in the trial, and DAEA equipment was used to assist in establishing and maintaining the trial plots. The trial site was protected from grazing animals by a wide perimeter fence, and no additional fencing was therefore deemed necessary to protect the trial site. Monkeys and bushpigs were noted to have been a problem in other past trials, therefore a light electric cattle fence was erected around the site as an extra precautionary control measure.
The Bioresource Unit Code for OSCA is WXa3 and it is found in Bioresource Group 1 (BRG subgroup1.2). Bioresource Group 1 is defined as "Moist Coast Forest, Thorn and Palm Veld". The average rainfall for this BRU is 867 mm per annum. The mean average annual temperature is 22°C, the average minimum is 16.8°C and the average maximum is 27.3°C.
Makhatini The trial site at Makhathini Research Station was located at 27°24’11.60’’S, 32°11’9.84’’E, and is 1 hectare (10,000 m2) in size. The trial was also established according to the DAEA Memorandum of Agreement mentioned above. The research trial area had a wide perimeter fence which protected the sites from grazing animals. The trial site area at Makhatini had a flat topography.
The Bioresource Unit Code for Makhatini is Ra1 and it is found in Bioresource Group 22 (BRG subgroup22.1a). Bioresource Group 22 is defined as "Lowveld". The average rainfall for this BRU is 588 mm per annum. The mean average annual temperature is 22.4°C, the average minimum is 16.3°C and the average maximum is 28.5°C.
5.2.3 Methodology The methodology used at each site is demonstrated through the plot layouts and methodology tables as illustrated below.

COMMUNITY-BASED ADAPTATION - DURBAN
February 2011 Report No. 11977-10286-9 44
Ntshongweni The plot layouts for winter 2009 and summer 2009/2010 are illustrated in Figure 15 and Figure 16, and methodology is summarized in Table 6. Images of the Ntshongweni site can be seen in Figure 17
Figure 15: Trial layout of Ntshongweni site during the winter 2009 production season
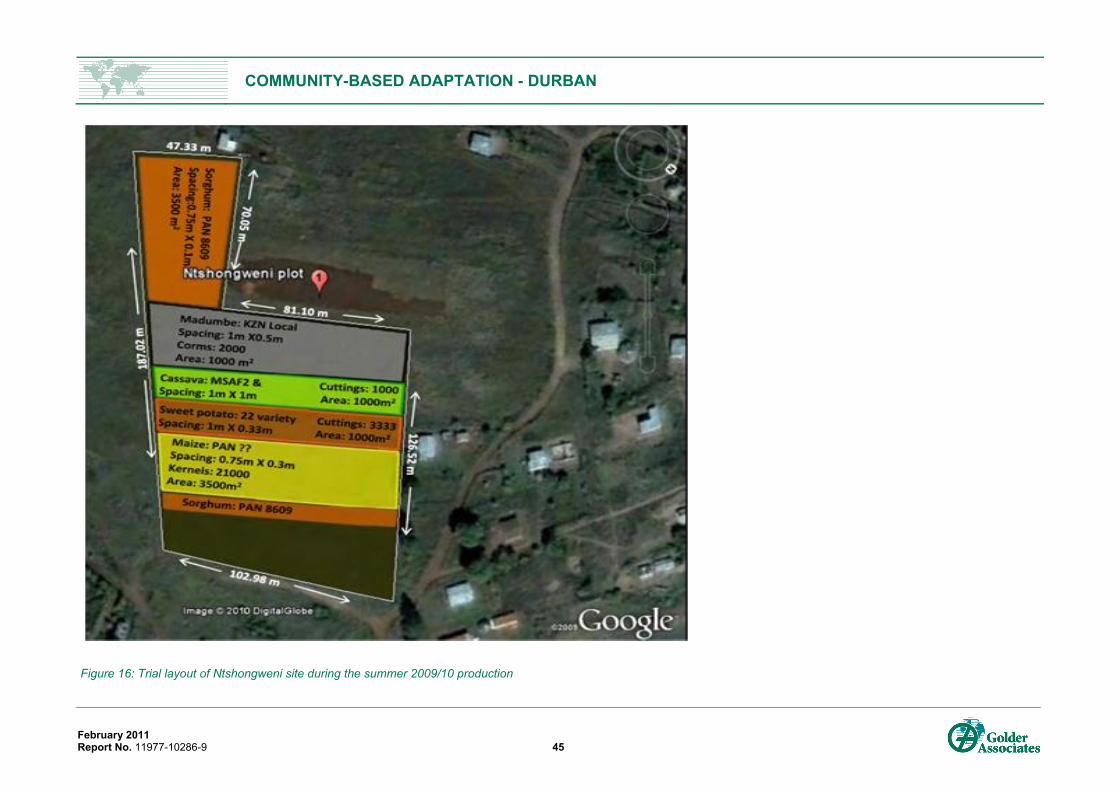
COMMUNITY-BASED ADAPTATION - DURBAN
February 2011 Report No. 11977-10286-9 45
Figure 16: Trial layout of Ntshongweni site during the summer 2009/10 production

COMMUNITY-BASED ADAPTATION - DURBAN
February 2011 Report No. 11977-10286-9 46
Table 6: Methodology for Winter 2009 and summer 2009/10 food security trials at Ntshongweni
Ntshongweni trial plot – 10,000m2
Activity Winter 2009 Summer 2009/10 Land clearing dates
8-20/03/2009 6-8/10/2009
Land preparation
23-25/03/2009 12-21/10/2009
Crops and varieties planted
Maize PAN 6227 inter-planted with Pumpkin White Boer (McDonalds seeds), Beans PAN 3434 and Wheat PAN148
Maize: PAN 6723, Sorghum: PAN 8609, Madumbe: KZN Local, Sweet Potatoes: 22 varieties, Cassava: MSAF2 & OBES7/73
Fertilizer requirements (calculated according to Cedara Fertrec)
Crop Double Supers (Kg/Ha)
LAN (Kg/Ha)
KCL (Kg/Ha) Crop Double Supers (Kg/Ha)
LAN (Kg/Ha)
Maize/pumpkin
600 450 300 Maize 570 285 at plant 285 at topdress
Beans 450 750 225 Sorghum 570 215 at plant 215 at topdress
Wheat 300 60 113 Sweet potato
600 180 at plant 180 at topdress
Cassava/ Madumbe
0 0
Fertilizer application method
Fertilizers were applied into planting trenches in a banded manner using a 2 l cold drink bottle as a measure per metre of planting row. The fertilizer was then moderately covered with soil so as to not to come into contact with the seed being sowed. Wheat was planted as a broadcast crop and the fertilizer was also broadcast in this instance.
Planting dates 26-27/03/2009 19-21/10/2009 (Maize, Sorghum, Madumbe and Cassava cuttings) 4/12/2009 (Sweet potatoes, due to availability)
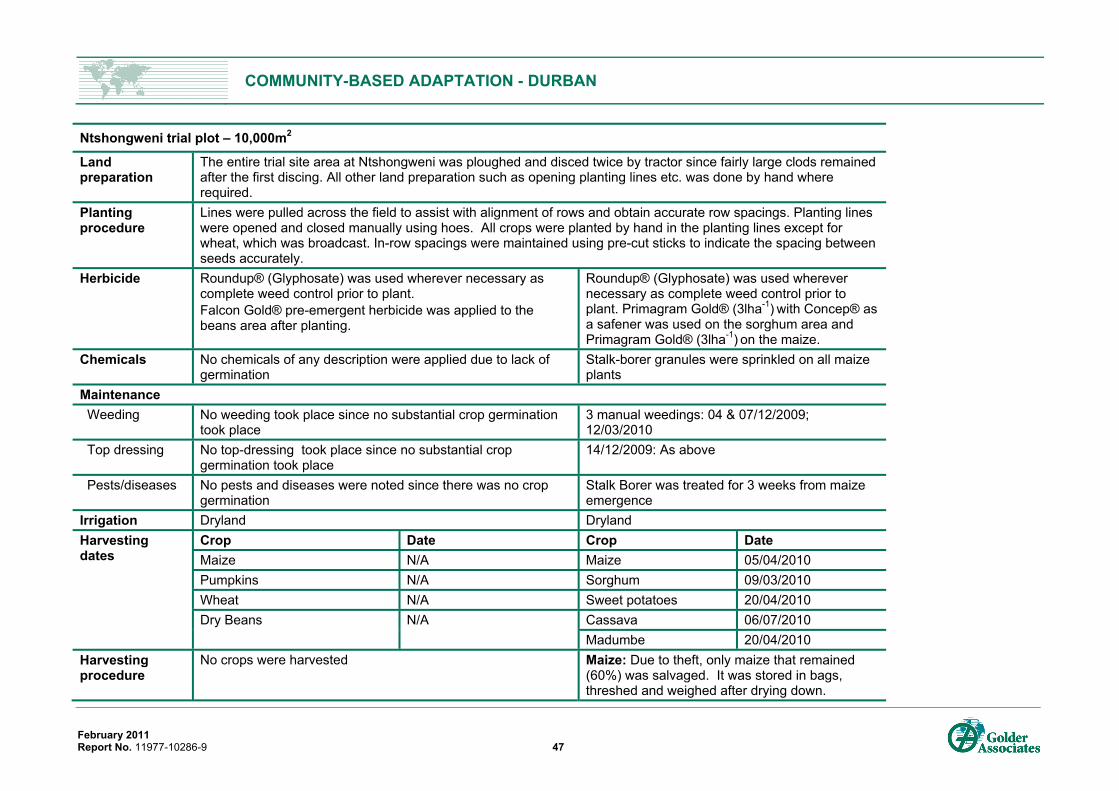
COMMUNITY-BASED ADAPTATION - DURBAN
February 2011 Report No. 11977-10286-9 47
Ntshongweni trial plot – 10,000m2
Land preparation
The entire trial site area at Ntshongweni was ploughed and disced twice by tractor since fairly large clods remained after the first discing. All other land preparation such as opening planting lines etc. was done by hand where required.
Planting procedure
Lines were pulled across the field to assist with alignment of rows and obtain accurate row spacings. Planting lines were opened and closed manually using hoes. All crops were planted by hand in the planting lines except for wheat, which was broadcast. In-row spacings were maintained using pre-cut sticks to indicate the spacing between seeds accurately.
Herbicide Roundup® (Glyphosate) was used wherever necessary as complete weed control prior to plant. Falcon Gold® pre-emergent herbicide was applied to the beans area after planting.
Roundup® (Glyphosate) was used wherever necessary as complete weed control prior to plant. Primagram Gold® (3lha-1) with Concep® as a safener was used on the sorghum area and Primagram Gold® (3lha-1) on the maize.
Chemicals No chemicals of any description were applied due to lack of germination
Stalk-borer granules were sprinkled on all maize plants
Maintenance Weeding No weeding took place since no substantial crop germination
took place 3 manual weedings: 04 & 07/12/2009; 12/03/2010
Top dressing No top-dressing took place since no substantial crop germination took place
14/12/2009: As above
Pests/diseases No pests and diseases were noted since there was no crop germination
Stalk Borer was treated for 3 weeks from maize emergence
Irrigation Dryland Dryland Harvesting dates
Crop Date Crop Date Maize N/A Maize 05/04/2010 Pumpkins N/A Sorghum 09/03/2010 Wheat N/A Sweet potatoes 20/04/2010 Dry Beans N/A Cassava 06/07/2010
Madumbe 20/04/2010 Harvesting procedure
No crops were harvested Maize: Due to theft, only maize that remained (60%) was salvaged. It was stored in bags, threshed and weighed after drying down.
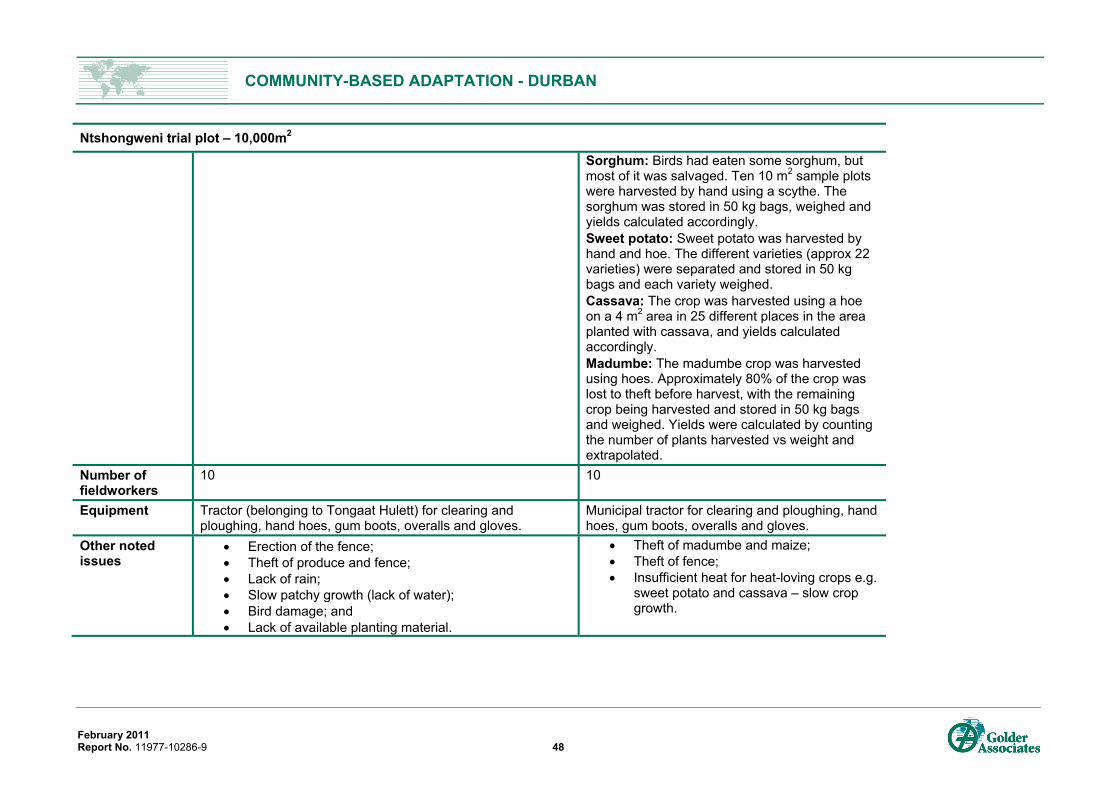
COMMUNITY-BASED ADAPTATION - DURBAN
February 2011 Report No. 11977-10286-9 48
Ntshongweni trial plot – 10,000m2 Sorghum: Birds had eaten some sorghum, but most of it was salvaged. Ten 10 m2 sample plots were harvested by hand using a scythe. The sorghum was stored in 50 kg bags, weighed and yields calculated accordingly. Sweet potato: Sweet potato was harvested by hand and hoe. The different varieties (approx 22 varieties) were separated and stored in 50 kg bags and each variety weighed. Cassava: The crop was harvested using a hoe on a 4 m2 area in 25 different places in the area planted with cassava, and yields calculated accordingly. Madumbe: The madumbe crop was harvested using hoes. Approximately 80% of the crop was lost to theft before harvest, with the remaining crop being harvested and stored in 50 kg bags and weighed. Yields were calculated by counting the number of plants harvested vs weight and extrapolated.
Number of fieldworkers
10 10
Equipment Tractor (belonging to Tongaat Hulett) for clearing and ploughing, hand hoes, gum boots, overalls and gloves.
Municipal tractor for clearing and ploughing, hand hoes, gum boots, overalls and gloves.
Other noted issues
• Erection of the fence; • Theft of produce and fence; • Lack of rain; • Slow patchy growth (lack of water); • Bird damage; and • Lack of available planting material.
• Theft of madumbe and maize; • Theft of fence; • Insufficient heat for heat-loving crops e.g.
sweet potato and cassava – slow crop growth.

COMMUNITY-BASED ADAPTATION - DURBAN
February 2011 Report No. 11977-10286-9 49
Figure 17: Images of Ntshongweni site
Ntuzuma

COMMUNITY-BASED ADAPTATION - DURBAN
February 2011 Report No. 11977-10286-9 50
The plot layouts for winter 2009 and summer 2009/2010 are illustrated in Figure 18and Figure 19 and methodology tables are summarized in Table 7. Images of the Nutuzuma site can be found in Figure 20.
Figure 18: Trial layout of Ntuzuma site during the winter 2009 production season

COMMUNITY-BASED ADAPTATION - DURBAN
February 2011 Report No. 11977-10286-9 51
Figure 19: Trial layout of Ntuzuma site during the summer 2009/10 production season

COMMUNITY-BASED ADAPTATION - DURBAN
February 2011 Report No. 11977-10286-9 52
Table 7: Methodology for winter 2009 and summer 2009/10 food security trials at Ntuzuma Ntuzuma Trial Plot – 5,000 m2
Activity Winter 2009 Summer 2009/10 Land clearing dates 24-27/02/2009 25-31/08/2009 Land preparation 13/03/2009 25-31/08/2009 Crops and varieties planted Maize PAN 6227 inter-planted with Pumpkin White Boer
(McDonalds seeds), Beans PAN 3434 and Wheat PAN148
Maize: PAN 6723, Sorghum: PAN 8609, Madumbe: KZN Local, Sweet Potatoes: 22 varieties, Cassava: MSAF2 & OBES7/73
Fertilizer requirements (calculated according to Cedara Fertrec)
Crop Double Supers (kg/Ha)
LAN (kg/Ha)
KCL (kg/Ha)
Crop Double Supers (kg/Ha)
LAN (kg/Ha)
Maize/pumpkin
600 450 0 Maize 100 667 at plant 367 at top dress
Beans 180 225 0 Sorghum 100 233 at plant 213 at top dress
Wheat 75 75 0 Sweet potato 67 120 at plant 114 at top dress
Cassava/Madumbe 100 200 at plant 150 at top dress
Fertilizer application method Fertilizers were applied into planting trenches in a banded manner using a 2 l cold drink bottle as a measure per metre of planting row. The fertilizer was then moderately covered with soil so as to not to come into contact with the seed being sowed. Wheat was planted as a broadcast crop and the fertilizer was also broadcast in this instance.
Planting dates 18-19/03/2009 28/09/2009 (Sorghum and maize) 22/10/2009 (Cassava cuttings) 4/12/2009 (Sweet potatoes – due to lack of availability) 25/09/2009 (Madumbe)

COMMUNITY-BASED ADAPTATION - DURBAN
February 2011 Report No. 11977-10286-9 53
Land preparation The entire trial site area at Ntuzuma had to be cleared of weeds and brush manually prior to any land preparation, with Roundup® being applied where appropriate. Areas and row spacings were then marked out by means of pulling planting lines, which were opened and closed manually using hoes.
Planting procedure Lines were pulled across the field to assist with alignment of rows and obtain accurate row spacings. All crops were planted by hand in the planting lines except wheat which was broadcast. In-row spacings were maintained using pre-cut sticks to indicate the spacing between seeds accurately.
Herbicide Roundup® (Glyphosate) was used wherever necessary as complete weed control prior to plant. Falcon Gold® pre-emergent herbicide was applied to Beans area after planting.
Roundup® (Glyphosate) was used wherever necessary as complete weed control prior to plant. Primagram Gold® (3lha-1) with Concep® as a safener was used on the Sorghum area and Primagram Gold® (3lha-1) on its own on the Maize.
Chemicals 14/05/2009 stalk borer granules sprinkled on all maize plants
Stalk-borer granules on all maize plants 4 weeks from plant
Maintenance Weeding 1 Manual weeding: 08-09/04/2009 3 Manual weedings: 04 & 14-19/12/2009; 12/03/2010 Top dressing 14/05/2009: A Top-Dressing application of 50 kg N per
Ha on Maize/Pumpkin and Beans in the form of LAN 25/11/2009: As above
Pests/diseases • Downy/powdery mildew (pumpkins); • Stalk borer infestation (maize); • Aphids (Beans)
• Caterpillars on sweet potato; • Stalk borer infestation (maize)
Irrigation Dryland Dryland Harvesting dates CROP DATE CROP DATE
Maize 04/08/2009 Maize 02/03/2010 Pumpkins N/A Sorghum 09/03/2010 Wheat N/A Sweet potatoes 21/04/2010 Dry Beans 23/06/2009 Cassava 13/07/2010
Madumbe 17/05/2010 Harvesting procedure Maize: Due to theft of maize crop in the area, the maize
was harvested in multiple 10 m2 sample areas by hand. The maize cobs were collected in 50 kg sacks, threshed, dried down and weighed. Beans: Beans were harvested by hand. Both green (approx 20%) and dried beans (approx 70%) were
Maize: Due to theft maize was harvested mature but green weekly, dried down, threshed and weighed. Sorghum: Birds had eaten some of the sorghum but most of it was salvaged. 10 m2 sample areas were harvested at 10 random plots within the field by hand using a scythe. Sorghum was stored in 50 kg, dried

COMMUNITY-BASED ADAPTATION - DURBAN
February 2011 Report No. 11977-10286-9 54
harvested due to threat of theft. The dry beans were kept in a 50 kg bag and threshed using threshing sticks. Green beans were sun dried for a week and also weighed. Wheat: Wheat was collected from 10 m2 sample plots and weighed. Pumpkins: No pumpkins were harvested due to theft.
down, threshed and weighed. Sweet potato: Sweet potato was harvested by hand and hoe. The different varieties (approx 22 varieties) were separated and stored in 50 kg bags and each variety weighed. Cassava: The total crop was harvested using a hoe in the area planted, weighed and yields calculated accordingly. Madumbe: The total madumbe crop was harvested using hoes, stored in 50 kg bags and weighed.
Number of fieldworkers 6 6 Equipment Hand slashers, hand hoes, plastic rakes, metal rakes,
gum boots, gloves. Six hand hoes, gum boots, gloves.
Other issues • Theft of produce; • Damage to fence; • Plot used by school children to go home; • Lack of moisture in the ground; • Bird damage; • Lack of availability of planting material.
• Safely concerns when working in area for extended hours;
• Theft of produce e.g. maize; • Bird damage to sorghum; • Site dried off towards end of season.

COMMUNITY-BASED ADAPTATION - DURBAN
February 2011 Report No. 11977-10286-9 55
Figure 20: Images of Ntuzuma site

COMMUNITY-BASED ADAPTATION - DURBAN
February 2011 Report No. 11977-10286-9 56
OSCA Plot layouts for winter 2009 and summer 2009/2010 are illustrated in Figure 21and Figure 22, and methodology tables are summarized in Table 8. Images of the OSCA site can be seen in Figure 23.
Figure 21: Trial layout of OSCA site during the winter 2009 production season
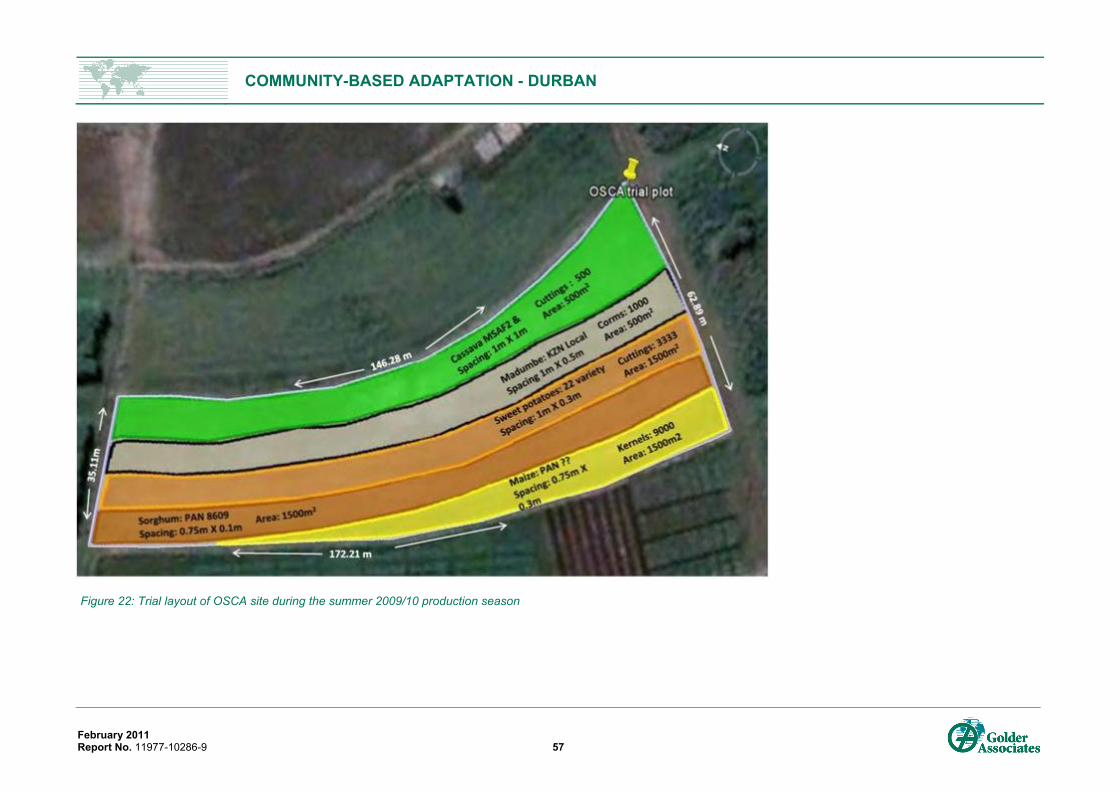
COMMUNITY-BASED ADAPTATION - DURBAN
February 2011 Report No. 11977-10286-9 57
Figure 22: Trial layout of OSCA site during the summer 2009/10 production season

COMMUNITY-BASED ADAPTATION - DURBAN
February 2011 Report No. 11977-10286-9 58
Table 8: Methodology for winter 2009 and summer 2009/10 food security trials at OSCA
OSCA Trial Plot – 5,000 m2
Activity Winter 2009 Summer 2009/10 Land clearing dates N/A N/A Land preparation 31/03/2009 20/09/2009 Crops and varieties planted Maize PAN 6227 inter-planted with Pumpkin White Boer
(McDonalds seeds), Beans PAN 3434 and Wheat PAN148 Maize: PAN 6723, Sorghum: PAN 8609, Madumbe: KZN Local, Sweet potatoes: 22 varieties, Cassava: MSAF2 & OBES7/73
Fertilizer requirements, (calculated according to Cedara Fertrec)
Crop Double Supers (kg/Ha)
LAN (kg/Ha)
KCL (kg/Ha)
Crop Double Supers (kg/Ha)
LAN (kg/Ha)
Maize/pumpkin
300 525 225 Maize 200 333 at plant 333 at top dress
Beans 0 150 0 Sorghum 200 200 at plant 200 at top dress
Wheat 0 450 150 Sweet potatoes
133 120 at plant 120 at top dress
Cassava 200 180 at plant 180 at top dress
Madumbe 200 180 at plant 180 at top dress
Fertilizer application method
Fertilizers were applied into planting trenches in a banded manner using a 2 l cold drink bottle as a measure per metre of planting row. The fertilizer was then moderately covered with soil so as to not to come into contact with the seed being sowed. Wheat was planted as a broadcast crop and the fertilizer was also broadcast in this instance.
Planting dates 31/03/2009 (maize, pumpkins, dry beans) 08/04/2009 (wheat)
15/10/2009 (Sorghum and maize) 21/09/2009 (cassava cuttings and madumbe) 30/09/2009 (Sweet potatoes)

COMMUNITY-BASED ADAPTATION - DURBAN
February 2011 Report No. 11977-10286-9 59
OSCA Trial Plot – 5,000 m2
Land preparation Land preparation and planting took place on the same days where possible. Land prep. Involved the discing of the field and pulling of lines using a tined cultivator (Kongskilde) which had the tines pre-set to the correct row spacings
Planting procedure All crops were planted by hand in the planting lines except Wheat which was broadcast. In-row spacings were maintained using pre-cut sticks to indicate the spacing between seeds accurately.
Herbicide Roundup® (Glyphosate) was used wherever necessary as complete weed control prior to plant. Falcon Gold® pre-emergent herbicide was applied to beans area after planting.
Roundup® (Glyphosate) was used wherever necessary as complete weed control prior to plant. Primagram Gold® (3lha-1) with Concep® as a safener was used on the sorghum area and Primagram Gold® (3lha-1) on its own on the maize.
Chemicals Stalk borer granules sprinkled on all maize plants 6 weeks from emergence
Stalk-borer granules on all maize plants 4 weeks from emergence. Decis Forte at 100 ml/ha was sprayed twice on Sweet potato to control severe weevil outbreak. Hot Sauce sprayed on cassava and madumbe to try and deter bushpigs
Maintenance Weeding 2 weedings: 23/04/2009 & 28/05/2009 4 weedings at 3 to 4 week intervals from plant Top dressing 8/05/2009 50 kg N in the form of LAN was applied to the
maize/pumpkins and beans 02/12/2009: As above
Pests/diseases Very few pests and diseases observed – some stalk borer Bushpigs became a problem closer to harvest for cassava/sweet potato/madumbe Stalk borer in maize and heavy infestation of weevils in sweet potato that required spraying twice
Irrigation 190 mm over the growing season Dryland Harvesting dates CROP DATE CROP DATE
Maize 06/08/2009 Maize 4/03/2010 Pumpkins N/A Sorghum 4/02/2010 Wheat 22/07/09 Sweet potatoes 13/04/2010 Dry Beans 08/07/2009 Cassava 10/06/2010
Madumbe 21/05/2010
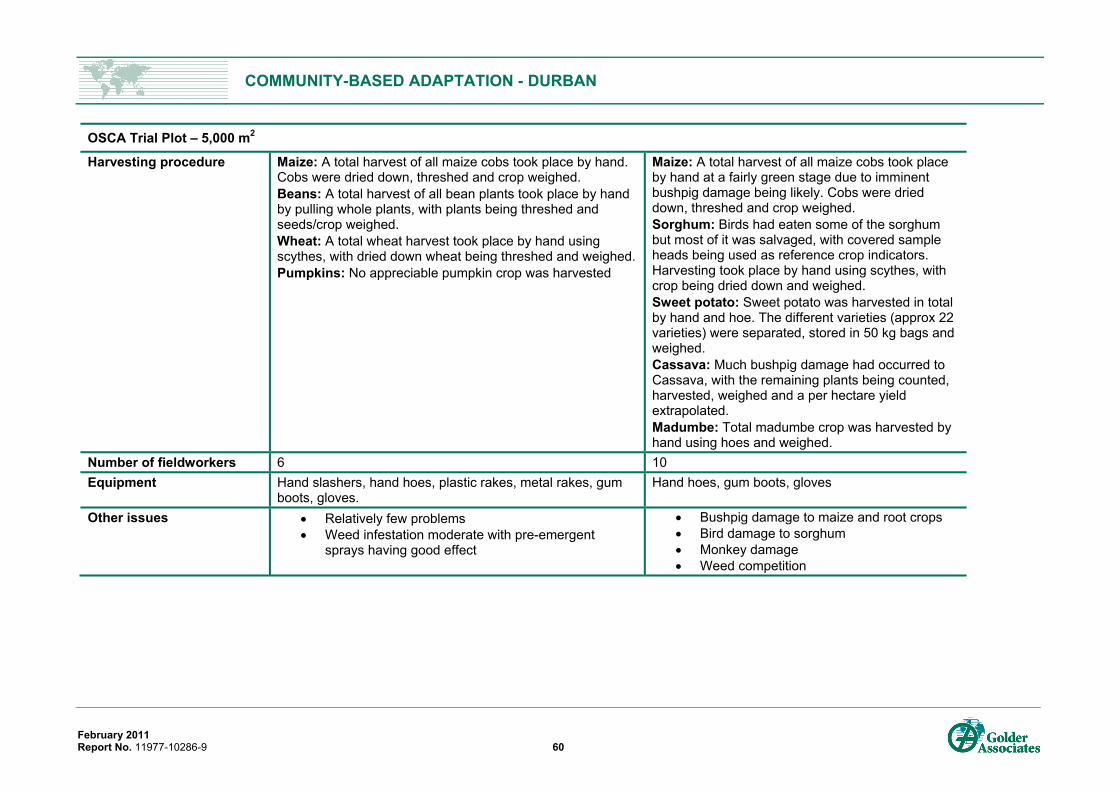
COMMUNITY-BASED ADAPTATION - DURBAN
February 2011 Report No. 11977-10286-9 60
OSCA Trial Plot – 5,000 m2
Harvesting procedure Maize: A total harvest of all maize cobs took place by hand. Cobs were dried down, threshed and crop weighed. Beans: A total harvest of all bean plants took place by hand by pulling whole plants, with plants being threshed and seeds/crop weighed. Wheat: A total wheat harvest took place by hand using scythes, with dried down wheat being threshed and weighed. Pumpkins: No appreciable pumpkin crop was harvested
Maize: A total harvest of all maize cobs took place by hand at a fairly green stage due to imminent bushpig damage being likely. Cobs were dried down, threshed and crop weighed. Sorghum: Birds had eaten some of the sorghum but most of it was salvaged, with covered sample heads being used as reference crop indicators. Harvesting took place by hand using scythes, with crop being dried down and weighed. Sweet potato: Sweet potato was harvested in total by hand and hoe. The different varieties (approx 22 varieties) were separated, stored in 50 kg bags and weighed. Cassava: Much bushpig damage had occurred to Cassava, with the remaining plants being counted, harvested, weighed and a per hectare yield extrapolated. Madumbe: Total madumbe crop was harvested by hand using hoes and weighed.
Number of fieldworkers 6 10 Equipment Hand slashers, hand hoes, plastic rakes, metal rakes, gum
boots, gloves. Hand hoes, gum boots, gloves
Other issues • Relatively few problems • Weed infestation moderate with pre-emergent
sprays having good effect
• Bushpig damage to maize and root crops • Bird damage to sorghum • Monkey damage • Weed competition

COMMUNITY-BASED ADAPTATION - DURBAN
February 2011 Report No. 11977-10286-9 61
Figure 23: Images of OSCA site

COMMUNITY-BASED ADAPTATION - DURBAN
February 2011 Report No. 11977-10286-9 62
Makhatini Plot layouts for winter 2009 and summer 2009/2010 are illustrated in Figure 24and Figure 25, and methodology tables are summarized in Table 9. Images of the Makhatini site can seen in Figure 26.
Figure 24: Trial layout of Makhatini site during the winter 2009 production season

COMMUNITY-BASED ADAPTATION - DURBAN
February 2011 Report No. 11977-10286-9 63
Figure 25: Trial layout of Makhatini site during the summer 2009/10 production season

COMMUNITY-BASED ADAPTATION - DURBAN
February 2011 Report No. 11977-10286-9 64
Table 9 Methodology for winter 2009 and summer 2009/10 food security trials at Makhatini
Makhatini Trial Plot– 10,000 m2
Activity Winter 2009 Summer 2009/10 Land clearing dates N/A N/A
Land preparation 23/03/2009 ploughing 01/04/2009 disking 23-25/09/2009
Crops and varieties planted Maize PAN 6227 interplanted with pumpkin White Boer (McDonalds), beans PAN 3434 and wheat PAN148
Maize: PAN 6723, Sorghum: PAN 8609, Madumbe: KZN Local, Sweet potatoes: 22 varieties, Cassava: MSAF2 & OBES7/73
Fertilizer requirements (calculated according to Cedara Fertrec)
Crop MAP (kg/Ha) Crop Double Supers (kg/Ha) LAN (kg/Ha)
Maize/pumpkin 600 Maize 145 245 at plant 245 at top dress
Beans 150 Sorghum 145 145 at plant 145 at top dress
Wheat 375
Sweet potatoes
400 260 at plant 260 at top dress
Cassava/ madumbe 400 260 at plant
260 at top dress
Fertilizer application method
Fertilizers were applied into planting trenches in a banded manner using a 2 l cold drink bottle as a measure per metre of planting row. The fertilizer was then moderately covered with soil so as to not to come into contact with the seed being sowed. Wheat was planted as a broadcast crop and the fertilizer was also broadcast in this instance.
Planting dates 01/04/2009 01/10/2009 (Sorghum and maize, cassava cuttings, madumbe) 3/12/2009 (Sweet Potatoes – due to availability)
Land preparation Land prep. and planting took place on the same days where possible. Land preparation involved the ploughing and discing of the field and pulling of lines using a tined cultivator (Kongskilde) which had the tines pre-set to the correct row spacings
Planting procedure All crops were planted by hand in the planting lines except Wheat which was broadcast. In-row spacings were maintained using pre-cut sticks to indicate the spacing between seeds accurately.

COMMUNITY-BASED ADAPTATION - DURBAN
February 2011 Report No. 11977-10286-9 65
Herbicide
Roundup® (Glyphosate) was used wherever necessary as complete weed control prior to plant. Falcon Gold® pre-emergent herbicide was applied to Beans area after planting.
Roundup® (Glyphosate) was used wherever necessary as complete weed control prior to plant. Primagram Gold® (3lha-1) with Concep® as a safener was used on the sorghum area and Primagram Gold® (3lha-1) on its own on the maize.
Chemicals Stalk borer granules sprinkled on all maize plants 5 weeks from emergence
Stalk-borer granules on all maize plants 4 weeks from emergence Decis Forte at 100 ml/ha was sprayed once on sweet potato to control weevil outbreak
Maintenance Weeding One weeding: 20-24 April 3 Weedings at 3 to 4 week intervals from planting
Top dressing 50 kg N in the form of LAN was applied on 8/05/2009 to the maize/pumpkins and beans 03/12/2009: As above
Pests/diseases Few pests and diseases observed with the exception of termites which specifically attacked the Wheat crop
Stalk borer in maize and moderate infestation of weevils in sweet potato that necessitated spraying once Birds a problem with sorghum
Irrigation 364 mm Dryland
Harvesting dates
CROP DATE CROP DATE Maize 17/09/09 Maize 26/02/10 Pumpkins N/A Sorghum 03/01/10 Wheat 30/07/09 Sweet potatoes 14/04/10
Dry Beans 30/07/09 Cassava 13/07/10 Madumbe 21/05/10
Harvesting procedure
Maize: A total harvest of all maize cobs took place by hand. Cobs were dried down, threshed and crop weighed. Beans: A total harvest of all bean plants took place by hand by pulling whole plants, with plants being threshed and seeds/crop weighed. Wheat: A wheat harvest took place by hand using scythes of defined areas where the crop stand was reasonably unaffected by termites, with dried down wheat being threshed and weighed.
Maize: A total harvest of all maize cobs took place by hand at a dry stage. Cobs were dried down, threshed and crop weighed. Sorghum: Birds had eaten some of the sorghum but most of it was salvaged, with covered sample heads being used as reference crop indicators. Harvesting took place by hand using scythes, with crop being dried down and weighed. Sweet potato: Sweet potato was harvested by hand and hoe. The different varieties (approx 22 varieties) were

COMMUNITY-BASED ADAPTATION - DURBAN
February 2011 Report No. 11977-10286-9 66
Pumpkins: Although a few pumpkins were noted, no appreciable pumpkin crop was harvested.
separated, stored in 50 kg bags and weighed. Cassava: A total cassava harvest took place using hoes, with the crop then being weighed. Madumbe: Total madumbe crop was harvested by hand using hoes and weighed.
Number of fieldworkers 6 11
Equipment Hand slashers, hand hoes, plastic rakes, metal rakes, gum boots, gloves. Hand hoes, gum boots, gloves.
Other issues • Relatively few problems other than termites • Infestation of weeds moderate with pre-
emergent sprays having good effect
• Bird damage to sorghum • Competition with weeds severe early in the
season

COMMUNITY-BASED ADAPTATION - DURBAN
February 2011 Report No. 11977-10286-9 67
Figure 26: Images of Makhatini site

COMMUNITY-BASED ADAPTATION - DURBAN
February 2011 Report No. 11977-10286-9 68
5.2.4 Results Climatic Data Rainfall Climatic data for the four sites during the two growing seasons (winter 2009 and summer 2009/10) give an indication of potential for successful crop production. Figure 27 shows the rainfall during the entire year as well as during the two growing seasons for all four trial sites. A minimum 500-700mm (white lines Figure 27) of rain is required to produce maize and beans with any degree of success. When observing total rainfall for the year it would appear that there is adequate rainfall to produce either of these crops in any of the four trial sites. However when rainfall during the two planting and growing seasons is considered, it is evident that none of the four trial sites receive sufficient rainfall during winter to produce a decent crop of maize or beans, leading to the decision to irrigate trial sites where possible during this time. This is not surprising as KZN receives the majority of its rainfall during the summer period. Supplementary irrigation during the dry winter period will therefore be necessary to enable successful crop production. Summer 09/10 rainfall appears to be sufficient for crop production, although rainfall at Makhatini was only 528 mm during the summer growing season, which is marginal for Maize. Unfortunately rainfall events are also not always evenly spread out during the growing season and it should be noted that there are certain time periods/crop development stages when water supply is critical. Often seed germination, flowering and seed/fruit set are influenced by water availability. There may therefore be further moisture limiting periods within what seems like a reasonable rainfall season for a given crop.
Figure 27: rainfall, and precipitation during the winter 2009 and summer 2009/10 growing season at the 4 trial sites
Average temperatures The average temperatures experienced at the four sites during the two growing seasons are shown in Figure 28. The average temperature is an average between the minimum and maximum temperature experienced daily. The sites range from coolest to warmest in the following order: Ntshongweni – Ntuzuma – OSCA –
860.60
140.60
528.00
1333.80
324.40
639.10
1184.70
200.60
707.40
1131.80
123.70
633.40
0.00
200.00
400.00
600.00
800.00
1000.00
1200.00
1400.00
1600.00
Total Winter Plant Summer Plant
Rainfall (mm)
Makhatini
OSCA
Ntuzuma
Ntshongweni
2009/10 Rainfall at the 4 Trial Sites

COMMUNITY-BASED ADAPTATION - DURBAN
February 2011 Report No. 11977-10286-9 69
Makhatini. It is interesting to note that Ntshongweni is, on average, approximately 3°C cooler than Ntuzuma, but also falls within the eThekwini municipal area. It can further be seen that although Makhatini is, on average, substantially warmer (2-3ºC) than the other trial sites during the summer periods, the average temperatures during winter for OSCA and Makhatini converge. This is likely due to the low relative humidity experienced at Makhatini, particularly during winter, and points to the important relationship of rainfall and relative humidity in relation to temperature.
In theory, in line with the climate change projections of a 2-3ºC increase in temperature for the Durban area, the Makhatini trial site approximates climate conditions and potentially crop yield conditions for Durban into the intermediate future.
Temperature plays an important role in plant growth. Photosynthesis in plants gradually increases from approximately 5°C to an optimum when leaf temperatures are in the region of 30-35°C, and decreases thereafter. Plant growth is also negatively affected by temperatures that are too high (e.g. over 35°C for maize at flowering) or too low (e.g. below 8°C for banana). These minimum and maximum growth temperatures vary according to crop origin, physiology and growth stage.
Figure 28: Average temperatures experienced at the four trial sites during the winter 2009 and summer 2009/10 growing seasons.
Heat units Heat units are expressed in degree days9. Heat units are accumulated over a period of time. For example, the base temperature for maize and dry beans is 10°C, and the upper limit is 30°C. Maize requires 1,500 heat units to reach maturity, and dry beans require 1,100. The heat units accumulated at the four trial sites
9 Every degree over a certain base/threshold temperature adds one degree of ‘growing temperature’ to the plant. If the threshold temperature for example is 10°C, and the mean temperature of a given day is 20°C, the degree days or heat units are 20-10 = 10.
10.00
12.00
14.00
16.00
18.00
20.00
22.00
24.00
26.00
28.00
30.00
JAN FEB MARCH APRIL MAY JUNE JULY AUG SEPT OCT NOV DEC JAN FEB MARCH APRIL MAY
Tempe
rature (°C)
Month
Average Temperatures for the 4 Food Security Trial Sites
Makhatini
OSCA
Ntuzuma
Ntshongweni
2009 2010

COMMUNITY-BASED ADAPTATION - DURBAN
February 2011 Report No. 11977-10286-9 70
on an annual basis and during the two growing periods are illustrated in Figure 29, with the required units for successful maize and bean production indicated by the respective white lines.
All four trial sites had adequate heat units during summer for the production of beans and maize, whilst in the winter growing period all sites except Ntshongweni experienced adequate heat units for maize and dry bean production. These crops could therefore be grown over a much longer season, with a range of planting times for these three climatic zones when compared to that of Ntshongweni.
Figure 29: Cumulative heat units at the four trial sites expressed as an annual total and total for the two growing seasons.
The relationship between heat units, maximum/minimum temperatures and precipitation during a given growing season are collectively important in crop production. Sub-optimal conditions of any one or more of these potentially crop-limiting factors for a given crop will result in sub-optimal yields.
Figure 30 illustrates the seasonal variation in monthly heat units over time. The trend is similar to that of average air temperature, but this graph is more specific towards maize/bean production. Understanding these variations can be very useful in determining potential planting dates, and when considering required shifts in planting date that may become necessary due to climatic factors becoming limiting to a particular crop’s production.
6687.80
1911.80
3452.90
5970.77
1736.20
3025.90
5597.35
1600.80
2861.20
3956.60
1054.70
2102.70
0.00
1000.00
2000.00
3000.00
4000.00
5000.00
6000.00
7000.00
8000.00
Total Winter Plant Summer Plant
Makhatini
OSCA
Ntuzuma
Ntshongweni
2009/10 Maize/Bean Heat Units at the 4 Trial Sites
Maize
Dry Beans
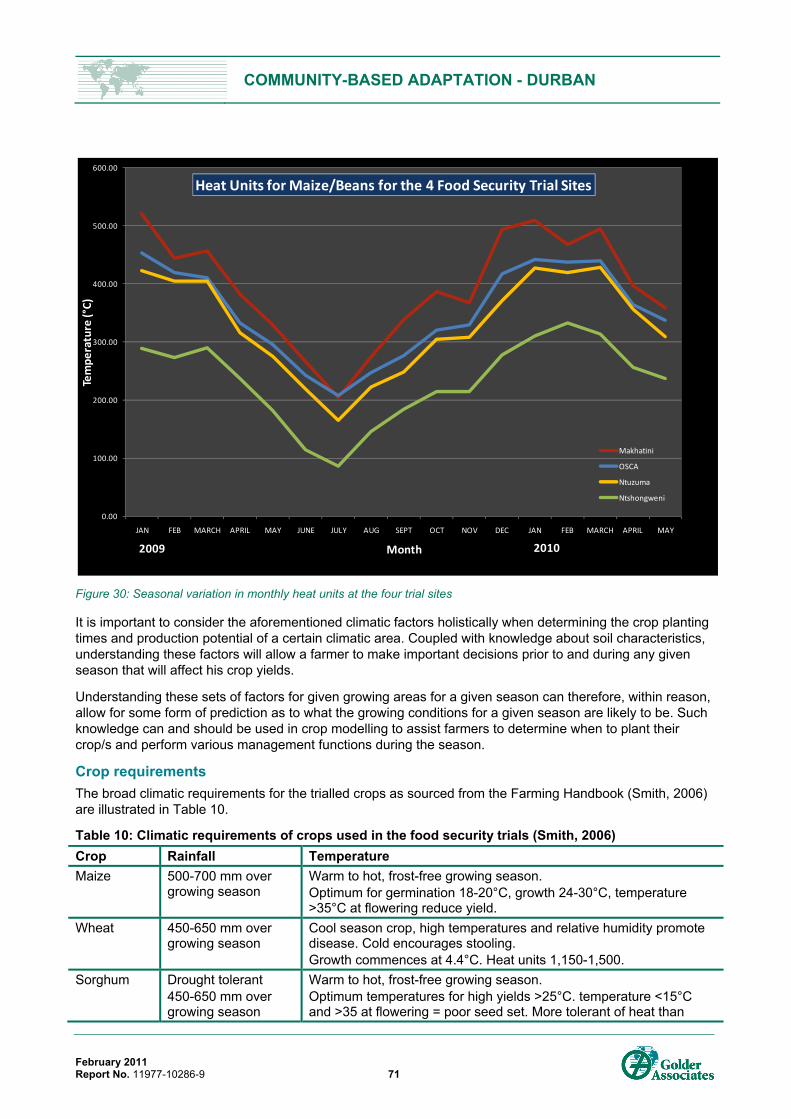
COMMUNITY-BASED ADAPTATION - DURBAN
February 2011 Report No. 11977-10286-9 71
Figure 30: Seasonal variation in monthly heat units at the four trial sites
It is important to consider the aforementioned climatic factors holistically when determining the crop planting times and production potential of a certain climatic area. Coupled with knowledge about soil characteristics, understanding these factors will allow a farmer to make important decisions prior to and during any given season that will affect his crop yields.
Understanding these sets of factors for given growing areas for a given season can therefore, within reason, allow for some form of prediction as to what the growing conditions for a given season are likely to be. Such knowledge can and should be used in crop modelling to assist farmers to determine when to plant their crop/s and perform various management functions during the season.
Crop requirements The broad climatic requirements for the trialled crops as sourced from the Farming Handbook (Smith, 2006) are illustrated in Table 10.
Table 10: Climatic requirements of crops used in the food security trials (Smith, 2006) Crop Rainfall Temperature Maize 500-700 mm over
growing season Warm to hot, frost-free growing season. Optimum for germination 18-20°C, growth 24-30°C, temperature >35°C at flowering reduce yield.
Wheat 450-650 mm over growing season
Cool season crop, high temperatures and relative humidity promote disease. Cold encourages stooling. Growth commences at 4.4°C. Heat units 1,150-1,500.
Sorghum Drought tolerant 450-650 mm over growing season
Warm to hot, frost-free growing season. Optimum temperatures for high yields >25°C. temperature <15°C and >35 at flowering = poor seed set. More tolerant of heat than
0.00
100.00
200.00
300.00
400.00
500.00
600.00
JAN FEB MARCH APRIL MAY JUNE JULY AUG SEPT OCT NOV DEC JAN FEB MARCH APRIL MAY
Tempe
rature (°C)
Month
Heat Units for Maize/Beans for the 4 Food Security Trial Sites
Makhatini
OSCA
Ntuzuma
Ntshongweni
2009 2010

COMMUNITY-BASED ADAPTATION - DURBAN
February 2011 Report No. 11977-10286-9 72
Crop Rainfall Temperature maize. Hot, humid conditions result in disease.
Pumpkin Warm season crop, very sensitive to frost and low temperatures. Optimum for growth 18-30°C, >35°C may lead to reduction in yield.
Beans >500 mm over growing season
Warm season crop sensitive to frost. Optimum growth temperatures 18-24°C. Day temperatures above 30°C during flowering reduce yield.
Sweet potatoes
Drought tolerant Sensitive to frost Require mean monthly temperatures of 21-29°C
Cassava Optimum 1,000-1,500 mm but can grow at 500 mm p.a.
Warm climate 25-30°C. Withstands light frost. Growth stops at temperatures >10°C. Temperatures >29°C can reduce yield.
Amadumbe >1,000 mm Prefer long frost-free periods Optimum temperature 21-27°C
Closing remarks on climatic data Rainfall, temperature and heat unit data indicate that there were sufficient heat units at all four sites to plant maize throughout the year, with the exception of Ntshongweni, which is too cool during the winter period.
Makhatini may also be too hot during the summer months for successful maize production due to high temperatures during tassel formation and/or lack of rainfall becoming limiting during the hot summer period.
On the whole, rainfall seems to have been a more limiting factor to crop production than temperature, with the exception of Ntshongweni, where both factors were limiting during the winter 2009 period.
It is therefore likely that shifts in planting date will play an important role in producing crops successfully in all of these climatically varied sites. It is furthermore likely that the most limiting factor in crop production will be rainfall and the availability of water. The law of the most limiting factor states that yield/production will be determined by that factor which is available at the ‘lowest’ level. This means that even if all other growth parameters such as temperature, nutrition and pest control are present at optimum levels, growth will be limited by a shortage of one parameter, such as water, to the level that that parameter is in short supply. The concept of the most limiting factor, as well as shifting planting dates to mitigate these limiting factors, will be considered in more detail in the section below.
Yield Data Potential yields for the food security crops investigated in the trials under dryland and irrigated conditions are summarized in Table 11.
Table 11: Expected yield for a number of crops under dryland and irrigated conditions (Smith, 2006)
Crop Potential yields (kg/Ha) under dryland conditions
Potential yields (kg/Ha) under irrigated conditions
Maize 3,750-6,000 8,000-10,000 Dry beans 1,000-2,500 1,500-3,000 Wheat 1,500-3,000 3,000-6,000 Pumpkin 12,000-25,000 Sorghum 3,000-6,500 7,000-9,500 Sweet potato 15,000-40,000 Amadumbe 5,000-15,000 Cassava 19,000-33,000 40,000-50,000

COMMUNITY-BASED ADAPTATION - DURBAN
February 2011 Report No. 11977-10286-9 73
Winter 2009 Important dates and the growing period for the winter 2009 trials are summarized in Table 12. The yields of maize, dry beans, wheat and pumpkin achieved at the four trial sites during the winter 2009 planting and growing season are illustrated in Figure 31. The yield trends are discussed for individual crops across all sites.
Table 12: Plant date, harvest date and number of growing days for winter 2009 growing period at the four trial sites Crop Ntshongweni Ntuzuma OSCA Makhatini
Pla
nt D
ate
Har
vest
D
ate
Gro
w D
ays
Pla
nt D
ate
Har
vest
D
ate
Gro
w D
ays
Pla
nt D
ate
Har
vest
D
ate
Gro
w D
ays
Pla
nt D
ate
Har
vest
D
ate
Gro
w D
ays
Maize 27/03/09 N/A N/A 19/03/09 04/08/09 138 31/03/09 06/08/09 128 01/04/09 17/09/09 170
Beans 27/03/09 N/A N/A 19/03/09 23/06/09 96 31/03/09 08/07/09 99 01/04/09 30/07/09 121
Wheat 08/04/09 N/A N/A 19/03/09 N/A N/A 08/04/09 22/07/09 105 01/04/09 30/07/09 121
Pumpkin 27/03/09 N/A N/A 19/03/09 N/A N/A 31/03/09 N/A N/A 01/04/09 N/A N/A
Figure 31: Yield (kg/Ha) of maize, dry beans, wheat and pumpkin achieved at the four trial sites during the winter 2009 growing season.
0
1020
5503
6000
0
479
1320
1560
0
350
1706
3000
0 0 0 00
1000
2000
3000
4000
5000
6000
Ntshongweni Ntuzuma OSCA Makhatini
Yield (kgH
a‐1 )
Maize
Dry‐Beans
Wheat
Pumpkin
Winter 2009 Yields at 4 climatically varied trial sites

COMMUNITY-BASED ADAPTATION - DURBAN
February 2011 Report No. 11977-10286-9 74
Maize yields show a marked increase with an increase in temperature of the site. At Ntshongweni, very little germination was observed and no harvestable crop was produced. This was due to low temperatures as well as a lack of precipitation, as no irrigation was available at the site. The Ntuzuma site produced a low maize yield of 1,020 kg/Ha, and this was due to temperatures being slightly higher than at Ntshongweni, but still not sufficient in combination with low rainfall for a good maize crop to be produced. No irrigation was therefore available at this site and the lack of precipitation further negatively affected yields.
The warmer sites at OSCA and Makhatini produced relatively good yields of 5,503 and 6,000 kg/Ha maize respectively. This was possible only due to these sites having irrigation, which was crucial for producing harvestable crops during the dry season. Supplementary irrigation of 190 mm at OSCA and 364 mm at Makhatini was applied over the winter 2009 growing season. Makhatini has fairly sandy soils making it especially important that these soils are irrigated, since they have a lower water holding capacity. Reasonable yields can therefore be achieved during the winter period at warmer sites, as long as adequate water/precipitation is available.
No dry beans were harvested at Ntshongweni due to low temperatures affecting germination and growth, as well as a lack of precipitation. A low yield (479 kg/Ha) was obtained at Ntuzuma as temperatures were slightly higher than at Ntshongweni. Lack of water, combined with low temperatures, resulted in the low yield. Higher yields were obtained at the two warmer, irrigated sites, with Makhatini obtaining the highest dry bean yield (1,560 kg/Ha). This supports the conclusion that warmer temperatures during the winter positively influence production capacity, as long as water is available for plant growth.
Wheat is a cool season crop, and it could be assumed that wheat would do well in the cooler sites Ntshongweni and Ntuzuma. However, the lack of precipitation at these sites resulted in no harvestable yield at Ntshongweni and a low yield (350 kg/Ha) obtained at Ntuzuma. Averages to reasonable yields (1,706/3,000 kg/Ha) were obtained at the warmer sites, although termites were a problem in the sandy soils of Makhatini.
Pumpkins are a heat-loving crop, and no meaningful harvestable yields were obtained at any of the sites during the winter planting, indicating that pumpkin should be planted during the warm summer season only.
General observations for the production of a number of crops during the cool winter period over a range of climatic areas include:
All crops show an increase in yield as the temperature of the site increases, as long as there is enough water available for crop production;
Irrigation availability at the warmer sites of OSCA and Makhatini played a role in the relatively good yields achieved at these sites;
The sandy soils at Makhatini necessitated water application through irrigation at more regular intervals;
Rain shortly after planting at the Ntuzuma site encouraged good germination, but little precipitation occurred after this and since no irrigation was possible low yields were achieved;
Low temperature combined with a lack of precipitation/water resulted in no harvestable yield of any crops at Ntshongweni; and
Maize performed the best of all crops planted at the trial sites during the winter period.

COMMUNITY-BASED ADAPTATION - DURBAN
February 2011 Report No. 11977-10286-9 75
Summer 2009/10 Important dates and the growing period for the summer 2009/10 trials are summarized in Table 13. The yields of maize, sorghum, amadumbe, sweet potato and cassava achieved at the four trial sites during the summer 2009/10 planting and growing season are illustrated in Figure 32
Figure 32: T he four trial sites during the summer 2009/10 planting and growing season
Table 13: Plant date, harvest date and number of growing days for summer 2009/10 growing period at the four trial sites
Crop Ntshongweni Ntuzuma OSCA Makhatini
Pla
nt D
ate
Har
vest
D
ate
Gro
w D
ays
Pla
nt D
ate
Har
vest
D
ate
Gro
w D
ays
Pla
nt D
ate
Har
vest
D
ate
Gro
w D
ays
Pla
nt D
ate
Har
vest
D
ate
Gro
w D
ays
Maize 19/10/09 5/04/10 168 25/09/09 2/03/10 158 15/10/09 4/03/10 140 1/10/09 26/02/10 149
Sorghum 19/10/09 9/03/10 141 25/10/09 9/03/10 129 15/10/09 4/02/10 112 1/10/09 3/01/10 95
aMadumbe 19/10/09 20/04/10 183 25/09/09 17/05/10 234 21/09/09 21/05/10 242 1/10/09 21/05/10 233
Swt.Potato 4/12/09 20/04/10 137 4/12/09 21/04/10 138 30/09/09 13/04/10 195 3/12/09 14/04/10 128
Cassava 21/10/09 6/07/10 258 22/10/09 13/07/10 264 21/09/09 10/06/10 262 1/10/09 13/07/10 285
8068
1708
5801
1895
7334
3500
7450 75008450
5720 6362
1918
8065
11537
22890
12833
3450
16500
60750
9580
0
10000
20000
30000
40000
50000
60000
70000
Ntshongweni Ntuzuma OSCA Makhatini
Yield (kgH
a‐1 )
Maize
Sorghum
Madumbe
Sweet Potato
Cassava
Summer 2009/2010 Yields at 4 climatically varied trial sites

COMMUNITY-BASED ADAPTATION - DURBAN
February 2011 Report No. 11977-10286-9 76
Figure 33: Yield (kg/Ha) of maize, sorghum, amadumbe, sweet potato and cassava achieved at the four trial sites during the summer 2009/10 planting and growing season
All maize plantings were planted within 25 days of one another. Plantings in the cooler areas took longer to mature and harvest, due to the relatively lower temperatures and heat units available to reach full maturity. The Ntshongweni planting therefore took the longest growing time to harvest (168 days), but produced an excellent yield (8 tonnes/Ha) because enough heat units were available over the summer season to produce a maize crop. Ntshongweni, followed by OSCA, produced the highest maize yields at 8,068 kg/Ha and 5,801 kg/Ha respectively, indicating that conditions were favourable during the growing period.
In contrast, the Makhatini and Ntuzuma sites produced poor yields of 1,895 kg/Ha and 1,708 kg/Ha respectively. Despite a good start to the growing season at these sites, rainfall was often intermittent and it dried off early (December 2009), especially at the Makhatini trial site where what looked like a good crop to that point did not reach its potential at kernel fill. It is also possible that the high summer temperatures had a negative impact on maize yield, as temperatures above 35°C are known to affect maize production negatively. Although somewhat wetter than Makhatini, the Ntuzuma site also underwent relatively dry periods, and having a somewhat sandy soil profile tended to dry off during these periods. Management at this site was also always a challenge, and it is especially apparent in the rapidly growing annual crops where theft and other limiting factors have a greater bearing than in the storage-type crops.
Similarly to maize, the sorghum plantings were planted within 25 days of one another, with the two warmest sites of Makhatini and OSCA producing a crop in the shortest growing times of 95 and 140 days respectively. Once again, the coolest site of the four sites (Ntshongweni) produced a good sorghum crop (±7 tonnes/Ha) over the longest growing season of 141 days, which is some 46 days longer, or almost 50% more time, than at Makhatini (the warmest site).
8068
1708
5801
1895
7334
3500
7450 75008450
5720 6362
1918
8065
11537
22890
12833
3450
16500
60750
9580
0
10000
20000
30000
40000
50000
60000
70000
Ntshongweni Ntuzuma OSCA Makhatini
Yield (kgH
a‐1 )
Maize
Sorghum
Madumbe
Sweet Potato
Cassava
Summer 2009/2010 Yields at 4 climatically varied trial sites
COMMUNITY-BASED ADAPTATION - DURBAN
February 2011 Report No. 11977-10286-9 77
Again, there were however sufficient heat units and moisture to allow for such a good crop to be produced. Sorghum yields were, on the whole, fairly comparable with Ntshongweni, yielding 7,334 kg/Ha, OSCA 7,450 kg/Ha and Makhatini 7,500 kg/Ha. These relatively similar yields largely indicate sorghum’s superior ability to extract groundwater as compared to maize, in the absence of other limiting factors such as a lack of heat units.
The exception to this trend was at the Ntuzuma site, where a generally poor germination rate was noted, and despite in-sowing, a poor yield of 3,500 kg/ha was achieved. It is likely that this was due to a combination of an early warm period allowing for germination to start, followed by a protracted period of relatively cool, dry conditions during the early part of the summer growing period which damaged the germinated stand. This was not the case for the Ntshongweni site, since germination was only achieved once sufficient summer temperatures had been reached here i.e. later than at Ntuzuma.
aMadumbe were harvested ‘early’ (183 days) at the Ntshongweni trial site, since the leaves on the plants had died down in anticipation of winter. As such no further growth or improvement in yield was expected, and harvesting commenced. Despite the relatively short growing season, the Ntshongweni trial site yielded the best of all trial sites for amadumbe at approximately 8.5 tonnes/Ha. The amadumbe at the other trial sites stayed in the ground for more or less the same period of time (233-242 days), but yielded lower than the Ntshongweni trial site. This was seen to be due to the higher rainfall and water available at the Ntshongweni site compared to the other sites, since amadumbe is a water loving crop. Indeed the lowest amadumbe yields (1,918 kg/ha) were achieved at the Makhatini site, despite having the warmest conditions which are favourable to amadumbe production as long as enough water is present in the soil. The low amadumbe production observed here was therefore largely due to this site being the driest site of the 4 during the summer growing season.
The growing periods for sweet potato were similar, at approximately 130-140 days at all the trial sites, with the exception of OSCA (195 days), which acted as a nursery for plant stock at the other sites. Nevertheless, the harvesting of cutting material during crop growth for use at other sites and damage to plants at OSCA caused by bushpigs should make the effective growing period for tuber fill here similar to the other trial sites. The OSCA trial site yielded the best of all at 22,890 kg/Ha, followed by Makhatini (12,833 kg/Ha), Ntuzuma (11.537 kg/Ha) and Ntshongweni (8,065 kg/Ha). Sweet potatoes are heat loving, and it is likely that if the available water for growth at Makhatini were not limiting during the growing period, this site would have yielded in excess of that achieved at OSCA.
The lack of heat seemed to have been compensated for to some extent by the freely available moisture at the Ntshongweni site. It is not unlikely though that this yield would be in the region of the maximum achievable at such a cool site under the given rural management regime. On the whole, sweet potato yields were nevertheless respectable for all the trials sites despite the differing limiting factors occurring at each. This can ascribed to the storage nature of the crop, where the aerial part of the plant (once established) will be able to grow and die back and grow again as the seasonal conditions change. This is made possible by the tubers which act as the energy store to allow the plant to grow through such limiting periods and still optimize yields once conditions are more favourable. It is also worth noting that with the exception of cassava, sweet potatoes produced the overall highest yield of all the crops planted at all the trial sites, with the exception of Ntshongweni where it was nevertheless one of the highest yielding crops.
The cassava plantings took place within a month of each other between sites. The shortest growing season of 258 and 264 days to harvest were at the Ntshongweni and Ntuzuma trial sites, where the onset of winter caused the plants to drop their leaves and become dormant somewhat prematurely. There was therefore no point in delaying harvest any further since any improvements in yields were unlikely. The harvest at OSCA after 262 days was not by choice, but due to on-going bushpig damage that necessitated this action. As such a relatively small sample set was taken which may have resulted in distorted extrapolated yields, although the plants harvested had a unanimously large root crop visible. Cassava at the Makhatini site was allowed to grow for the longest period of 285 days, and was noted to still have leaf cover when harvested. These plants could therefore have remained in the ground for longer, since it was hot enough for the crop to continue growing, but were harvested since the trial
COMMUNITY-BASED ADAPTATION - DURBAN
February 2011 Report No. 11977-10286-9 78
period was completed and cassava had been harvested at all the other trial sites already. The limiting dry conditions at Makhatini resulted in a relatively low yield of 9,580 kg/Ha, despite the crop potentially being able to grow for longer and so produce the highest yield of all 4 trial sites. Indeed the next warmest site of OSCA produced an excellent yield of 60,750 kg/Ha since it had sufficient heat units and rainfall that allowed for optimal growth and production. The poorest yield (3,450 kg/Ha) was achieved at Ntshongweni due to the very short growing season for cassava as a result of the lack of sufficient heat units. It is noteworthy that cassava was the highest yielding crop at Ntuzuma, producing 16,500 kg/Ha, which was far superior to any of the grain crops that battled to produce at this difficult growing site. It is furthermore worth noting that despite the differing limiting factors encountered at Ntshongweni and Makhatini, the cassava plants did not die back completely, and would as such have been able to resume growth, as in the case of the sweet potatoes, at a later stage when conditions were more favourable.
General observations from this season included:
The most successful grain crop across all four sites was sorghum. It is hardier than maize and able to withstand higher temperatures and drier conditions. The biggest potential problem with sorghum production is damage by birds;
High yields of cassava that far outweigh any other crop trialled, can be achieved in warm growing climates, with the crop being drought-hardy. The cassava at the three warmer trial sites produced a far better crop than any of the grain crops, with only sweet potato at Makhatini outperforming it during the summer growing season. It is also worth noting that the lowest number of weeds was observed in the cassava plantings, since these plants tend to canopy quickly and release allelopathic substances that inhibit the germination of many weed seeds. This has the effect of reducing competition for resources such as water that would be required by such weeds;
Sweet potato also showed good results in the warmer areas, and is a useful storage crop that can recover fairly well from periods of stress. It was therefore again able to out-yield the other crops, with the exception of cassava at the three warmer trial sites, and virtually matched the yields of any of the other crops at the cooler Ntshongweni trial site;
An increase in pest and disease as well as weed pressure was notable at the warmer the trial sites, resulting in higher labour requirements during the summer period, especially when good rainfall has occurred; and
The overwhelming challenge inherent in planting in peri-urban areas was noted to be theft of produce and vandalism of equipment in some cases.
5.2.5 Discussion Crop selection and yields Climatic data of the trial sites indicated that future climate in Durban could be represented by the OSCA site towards mid-century, as well as the Makhatini site. It is important to note that this assumption would be made purely on a temperature basis, and that rainfall projections are at present uncertain, although most point to a more erratic rainfall pattern. The soils at Makhatini are also fairly sandy as is the case for a site such as Ntuzuma, and for many areas surrounding Durban, again making a case for using this site as a potential model site of future crop yields under increasing temperature and erratic rainfall conditions.
When looking at alternative crops to maize that may be grown under climate change, it becomes clear that fast growing grain crops such as maize, and even sorghum and wheat (though more drought hardy than maize) becomes more risky. These crops have a relatively small ‘window’ in which to grow and produce a crop, and have even smaller critical ‘window periods’ of physiological development that if adversely affected due to negative climatic or other growing conditions, can very quickly result in massive yield losses. They also have the added drawback of having a relatively low production ceiling or tonnage that can be produced per hectare (3-8 tonnes/Ha) compared to some of the root crops evaluated as alternatives. This also applies

COMMUNITY-BASED ADAPTATION - DURBAN
February 2011 Report No. 11977-10286-9 79
to dry bean, which yields well at 2.5 tonnes/Ha. These crops do have the advantage of being able to be stored dry for lengthy periods if such storage facilities are in place.
In contrast, the storage crops of amadumbe, sweet potato and cassava were noted throughout the summer trial period to have the ability to flush vegetatively and store production during good periods of growth and die-back vegetatively during periods of adverse conditions, only to draw on reserves stored to re-flush and increase production once more when such conditions improved. This was the case particularly for sweet potato and cassava. aMadumbe were noted to suffer under dry conditions, and take time to recover from such conditions. Nevertheless, all three of these storage crops can withstand, to some extent, adverse climatic conditions for a period of time, and make a recovery once such conditions improve. This essentially makes them less risky to grow from a food security point of view. These crops furthermore have a far higher yield potential at 15 tonnes/Ha for amadumbe, and 40 tonnes/Ha or more for sweet potato and cassava, than is the case for any of the faster growing annual crops trialled. They are therefore less risky to grow and have a higher yield potential, both of which can contribute significantly to food security. The best two alternative crops to maize trialled were clearly sweet potato and cassava, with cassava potentially being the drought hardiest of these.
It is clear from these results is that although temperature is an important, potentially growth/yield limiting climatic factor, precipitation or available plant moisture seems to be the greatest single limiting factor to crop production. Where both of these become limiting, as was apparent during the Ntshongweni winter plant, a high likelihood of total crop failure exists. When considering temperature and the potential impacts of a 2-3ºC increase in temperature on the growing of maize in the eThekwini area in isolation (assuming water is not limiting), it becomes clear that such an increase in temperature may in fact result in a longer crop production period than is currently the case. This largely comes about due to the increased heat units available during the winter months, that allows for the production of maize and many of the other crops trialled successfully during a period that is currently either not possible (Ntshongweni) or marginal (Ntuzuma). What is needed however is to be able to estimate new planting dates in accordance with weather patterns from season to season to optimize crop production. Assuming water is not a constraint, a 2-3ºC increase in temperature for the eThekwini area may in fact result in potentially more crop production for longer periods of the year, assuming water is not a limiting factor and that planting times can be projected with a fair degree of accuracy.
It should be noted that this may not be consistent with modelling projections such as those of the BioResource Unit (BRU), but that these models invariably assume a reduction or more erratic rainfall pattern due to increased temperature. They are therefore essentially assuming plant available water will be a limiting factor to crop production in the eThekwini Municipal Area. This is not necessarily incorrect in terms of projection, but it is important not to confuse the increase in temperature with precipitation as being the most limiting factor to crop production. Indeed, if precipitation increased and/or irrigation were possible, greater food production and security would in all likelihood result from such increases in temperature, though planting times would shift from current norms.
Recommended mitigation measures
Arguably, the single biggest mitigating measure against the potential negative effects of climate change on crop production in the eThekwini area would be the assurance of plant available water during cropping. Water should therefore be harvested and stored in various ways (in-field, reservoirs etc.) and be made available to the crop in an efficient manner when needed;
The planting of a mixture of storage and annual crops in a proven interplanted manner will mitigate against total crop failure of any one crop at any one time and provide a measure of improved food security both by reducing cropping risks and potentially increasing the total food cropped yield per hectare of production;
Accurate seasonal crop modelling would be another very valuable tool in mitigating climate change from season to season, since, with a changing climate, traditional crop planting times will no doubt need to change to optimize crop production and the provision of defined optimal planting dates on a per crop basis will be required;

COMMUNITY-BASED ADAPTATION - DURBAN
February 2011 Report No. 11977-10286-9 80
In order to best advise on planting dates and other agricultural practice changes that may be required, and to provide an agricultural support service to smallholder farmers, a dedicated investment in studying such changes, trialling new methods and disseminating findings in a practical manner through an extension service is needed specifically for the eThekwini area. This should be done through a dedicated municipal agricultural study unit or body that concentrates specifically on the needs of the eThekwini area at a fine-scale level, and has defined goals and aims in its functioning;
Different planting systems, including mixed planting such as root crops intercropped with other annual crops etc., improved environment, soil and water management that reduce erosion and improve water harvesting, testing of new varieties etc. should be studied and findings promoted through fine-scale extension by such a dedicated agricultural unit;
Improved co-ordination between this city body and related government bodies (city and national) with regard to agriculture and its various input components will go a long way to enhancing the pace of agricultural research and therefore potential response to climate change in this regard; and
Of utmost importance is the need for the social responses/changes in terms of neighbourly co-operation, increased skills and capacity and a reduction in theft and vandalism for any improvement in food security and readiness from a climate change perspective with regard to agriculture to be made.
5.3 Cook-off workshops Essential to the identification of alternative crops, apart from their ability to yield high results in a climatically changed environment, is the social acceptability of the foods that they produce. To explore this further, a community ‘cook-off’ was undertaken in Ntuzuma and Ntshongweni.
There were two main objectives of the cook-offs:
To determine community perceptions of taste for a variety of foods; and
To determine the ease of preparation of the foods.
To fulfil these objectives, contact was made with the Department of Agriculture Value-Adding Services Division which was asked to host two cooking workshops and community events in Ntuzuma and Ntshongweni. Ten women were selected from both communities through consultation with local councillors and development officers to participate in the process, whereby they would cook a variety of foods in a ‘cook-off’ competition. The crops used and the dishes made are listed in the following table.
Table 14: Crops used and dishes prepared for the cook-offs Crop Dish
Sweet Potato Sweet potato soup
Sweet potato chips
Pumpkin
Imfino (cooked leaves) Pumpkin juice Pumpkin slices Roasted pumpkin seeds
Cassava
Cassava bread Cassava chips Cassava leaves Fufu
Sorghum Sorghum bread Amadumbe Amadumbe soup

COMMUNITY-BASED ADAPTATION - DURBAN
February 2011 Report No. 11977-10286-9 81
The workshops took place over two days in each community and were extremely successful, focusing on a number of key learning areas, including:
Cleanliness;
Nutritional value;
Presentation;
Taste; and
Appearance.
Once the workshops were completed, the 10 participants in each community were divided into five groups of two. These groups were then tasked with preparing all the aforementioned dishes for the community cook-off event, where people would have an opportunity to taste and comment on the different foods prepared. Photographs of the events are shown in Figure 34 and Figure 35.
Figure 34: Cook-off Workshop - Ntuzuma
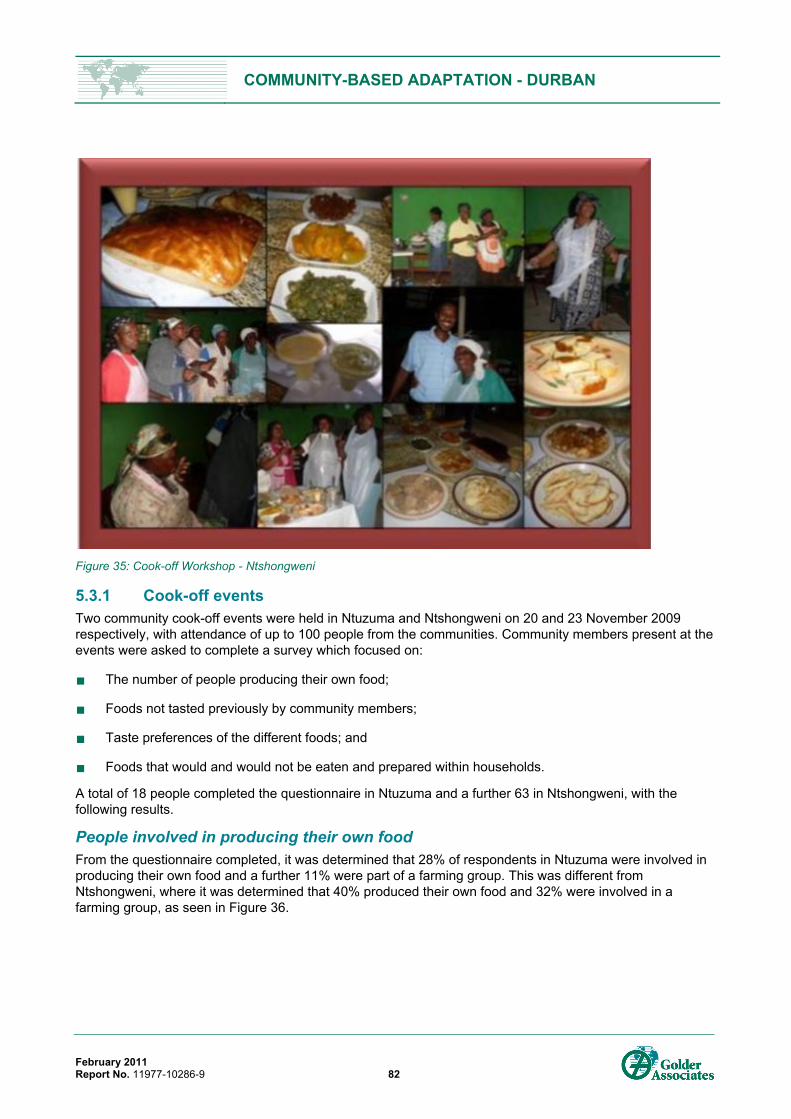
COMMUNITY-BASED ADAPTATION - DURBAN
February 2011 Report No. 11977-10286-9 82
Figure 35: Cook-off Workshop - Ntshongweni
5.3.1 Cook-off events Two community cook-off events were held in Ntuzuma and Ntshongweni on 20 and 23 November 2009 respectively, with attendance of up to 100 people from the communities. Community members present at the events were asked to complete a survey which focused on:
The number of people producing their own food;
Foods not tasted previously by community members;
Taste preferences of the different foods; and
Foods that would and would not be eaten and prepared within households.
A total of 18 people completed the questionnaire in Ntuzuma and a further 63 in Ntshongweni, with the following results.
People involved in producing their own food From the questionnaire completed, it was determined that 28% of respondents in Ntuzuma were involved in producing their own food and a further 11% were part of a farming group. This was different from Ntshongweni, where it was determined that 40% produced their own food and 32% were involved in a farming group, as seen in Figure 36.

COMMUNITY-BASED ADAPTATION - DURBAN
February 2011 Report No. 11977-10286-9 83
Figure 36: Percentage of people involved in food production
Foods not previously tasted by community members It was determined that foods not previously tasted by community members were those made with cassava. It was found that cassava is not a common food within these parts of KwaZulu-Natal and thus few people had tasted its products before. Figure 37 indicates the foods not previously tasted by community members.
Figure 37: Foods not previously tasted by community members
Taste preferences There were a range of taste preferences within the communities, although as seen in Figure 38, the imfino (pumpkin leaves) was considered the most preferred dish in both Ntuzuma and Ntshongweni. In Ntshongweni it is evident that the cassava products were well received, apart from the fufu and cassava leaves which were the least liked dishes of those tasted. In Ntshongweni, the sweet potato products were well liked, whereas in Ntuzuma the pumpkin products were preferred.
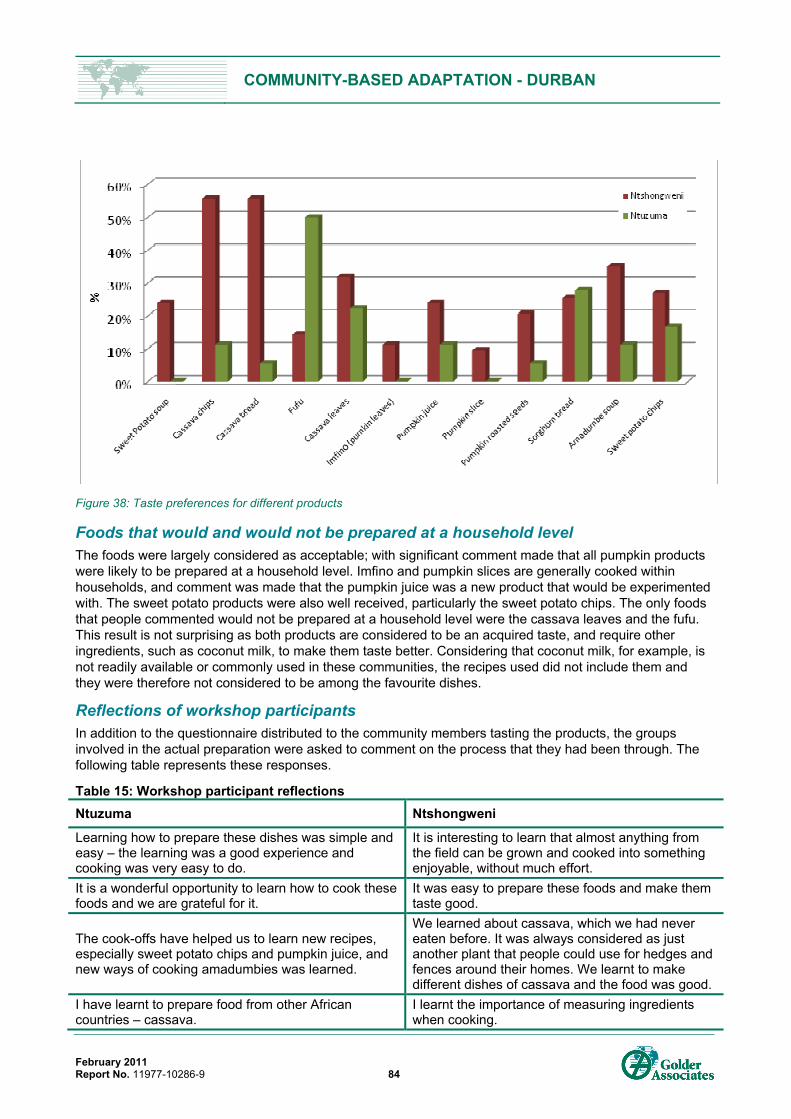
COMMUNITY-BASED ADAPTATION - DURBAN
February 2011 Report No. 11977-10286-9 84
Figure 38: Taste preferences for different products
Foods that would and would not be prepared at a household level The foods were largely considered as acceptable; with significant comment made that all pumpkin products were likely to be prepared at a household level. Imfino and pumpkin slices are generally cooked within households, and comment was made that the pumpkin juice was a new product that would be experimented with. The sweet potato products were also well received, particularly the sweet potato chips. The only foods that people commented would not be prepared at a household level were the cassava leaves and the fufu. This result is not surprising as both products are considered to be an acquired taste, and require other ingredients, such as coconut milk, to make them taste better. Considering that coconut milk, for example, is not readily available or commonly used in these communities, the recipes used did not include them and they were therefore not considered to be among the favourite dishes.
Reflections of workshop participants In addition to the questionnaire distributed to the community members tasting the products, the groups involved in the actual preparation were asked to comment on the process that they had been through. The following table represents these responses.
Table 15: Workshop participant reflections Ntuzuma Ntshongweni
Learning how to prepare these dishes was simple and easy – the learning was a good experience and cooking was very easy to do.
It is interesting to learn that almost anything from the field can be grown and cooked into something enjoyable, without much effort.
It is a wonderful opportunity to learn how to cook these foods and we are grateful for it.
It was easy to prepare these foods and make them taste good.
The cook-offs have helped us to learn new recipes, especially sweet potato chips and pumpkin juice, and new ways of cooking amadumbies was learned.
We learned about cassava, which we had never eaten before. It was always considered as just another plant that people could use for hedges and fences around their homes. We learnt to make different dishes of cassava and the food was good.
I have learnt to prepare food from other African countries – cassava.
I learnt the importance of measuring ingredients when cooking.
COMMUNITY-BASED ADAPTATION - DURBAN
February 2011 Report No. 11977-10286-9 85
Ntuzuma Ntshongweni
The preparation of these different types of foods is an important part of our development process.
We did not know how to make sorghum bread. The sorghum was all good for making beer.
The workshops taught us how to prepare food in a nutritious way and I have transferred these skills to the rest of my family.
I have learnt that we do not need to depend on ‘ready-made’ foods from the shops, but that we can grow our own foods”.
Making sorghum bread was a new experience – we only knew how to make sorghum beer.
5.3.2 Summary of cook-off activities The cook-offs were successful events in both Ntuzuma and Ntshongweni, which allowed for a number of key findings. These can broadly be described as follows:
Both communities were responsive to the idea of exploring new foods and alternative crops. However, motivating the communities to participate in these events was challenging; and
Cassava was specifically identified as a good alternative crop from an agricultural perspective, and while it was also socially accepted, major challenges were faced in terms of acquiring the products. Cassava as a raw product was difficult to purchase in both areas, and could only be purchased in northern KwaZulu-Natal. By-products of cassava were equally difficult to obtain and only found in certain shops in Durban’s city centre. This was an unlikely shopping area for people in Ntuzuma and Ntshongweni. Issues such as access and processing are challenges that will need to be addressed should the crop be considered a reliable alternative.
5.4 Closing remark on food security pilots Ironically, many of the above changes or improvements required, including the social changes, can only be affected through the increased practicing of agricultural crop production in the eThekwini municipal area. Demonstration trials at a fine-scale level should be set up throughout the city, where new technologies can be tested, people can improve their skills and knowledge and social cohesion can be created through working and benefiting from such work in a collective manner.
It is important that these changes and research be carried out at a homestead/household level, where only a few households are involved that can take an active part and strong ownership in all aspects of such trials and results. This requires a ‘bottom-up’ approach. It is furthermore imperative that whilst creating this sense of ownership and pride in what is achieved, a sense of ‘do it for yourself’ should be engendered. People should be made to feel empowered to take charge of their societies and play an active role in creating their societies and reducing reliance on government structures. The establishment of small nuclei of such empowered peoples – as proposed by the social programme in the adaptation plan - throughout the municipal area has the potential to then spread rapidly by word of mouth and demonstration since others (neighbours, etc.), as it is human nature to want to share in evidenced success.
In this manner, it may be possible to steadily improve the food security situation and resilience to food security challenges that may come about due to climate change in eThekwini. Such changes will take many years to manifest and as such will require a steady and deliberate effort on the part of government and the city in terms of its efforts in trying to bring about the necessary changes to ready its citizens for a changing climate.

COMMUNITY-BASED ADAPTATION - DURBAN
February 2011 Report No. 11977-10286-9 86
6.0 SUB-PROJECT 3: WATER HARVESTING FEASIBILITY ASSESSMENT AND PILOT
A literature review of water harvesting techniques and theory was carried out for this part of the project, and a summary of this work is provided below, along with a summary of the current water harvesting efforts in Durban. The process of investigation and progress with the water harvesting pilot project as carried out as part of this project is then presented.
6.1 Water harvesting techniques Water harvesting is a collective term for techniques which depend on rainfall, water vapour or groundwater sources to collect water for a variety of beneficial uses. An understanding of precipitation patterns is vital for the selection of a water harvesting method. It can be an efficient practice that facilitates crop production where rainfall is too low or unreliable. Water harvesting methods can be classified into three categories:
Water from the air - the harvesting of fog and dew from the atmosphere;
Overland flow – rainwater (roofs and ground surfaces) and floodwater harvesting (discharge from water sources); and
Groundwater harvesting - spring water and groundwater aquifer harvesting from below the land surface.
The above categories are illustrated in Figure 39.
Figure 39: Different categories of water harvesting technique (Prinz, 2001)
6.1.1 Advantages of water harvesting The following advantages of water harvesting have been identified (Public Health Engineering Department, Meghalaya (PHEDM), undated):
A water harvesting system can collect and store water within an accessible distance from the place of use, rather than, for example, a fixed Municipal supply;
Reduces consumers’ utility bills;
Water harvesting can allow for a more continuous and reliable supply of water;
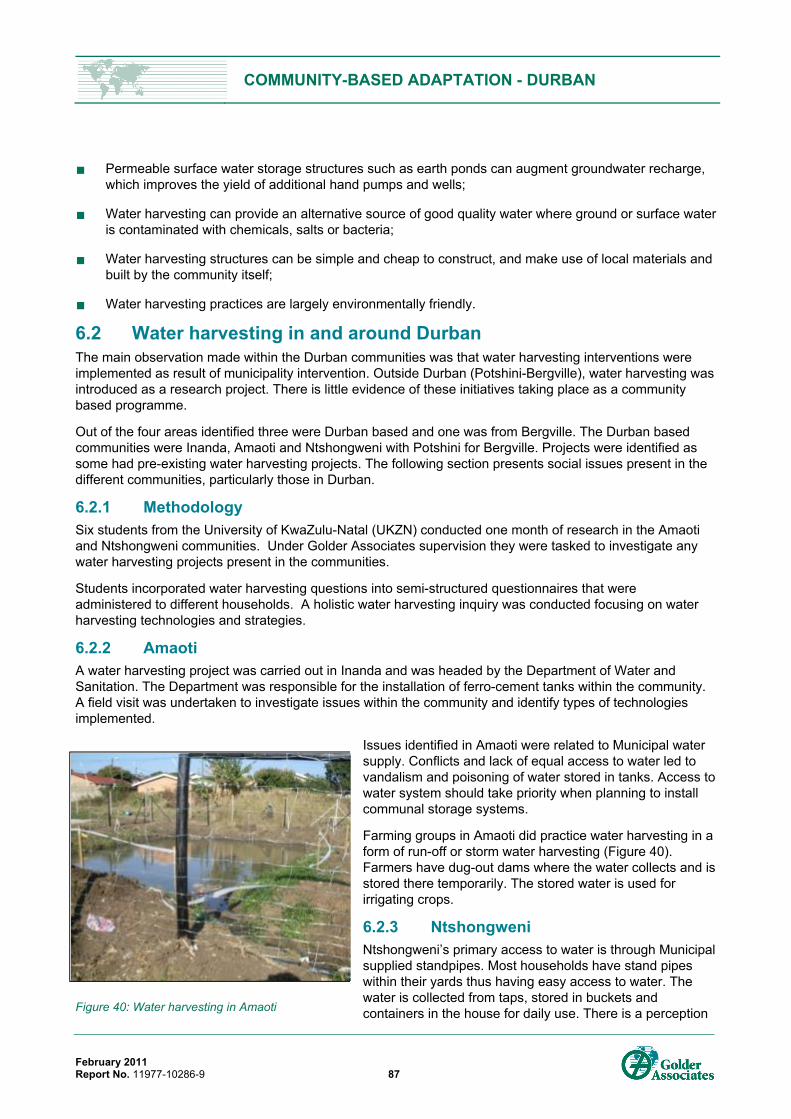
COMMUNITY-BASED ADAPTATION - DURBAN
February 2011 Report No. 11977-10286-9 87
Permeable surface water storage structures such as earth ponds can augment groundwater recharge, which improves the yield of additional hand pumps and wells;
Water harvesting can provide an alternative source of good quality water where ground or surface water is contaminated with chemicals, salts or bacteria;
Water harvesting structures can be simple and cheap to construct, and make use of local materials and built by the community itself;
Water harvesting practices are largely environmentally friendly.
6.2 Water harvesting in and around Durban The main observation made within the Durban communities was that water harvesting interventions were implemented as result of municipality intervention. Outside Durban (Potshini-Bergville), water harvesting was introduced as a research project. There is little evidence of these initiatives taking place as a community based programme.
Out of the four areas identified three were Durban based and one was from Bergville. The Durban based communities were Inanda, Amaoti and Ntshongweni with Potshini for Bergville. Projects were identified as some had pre-existing water harvesting projects. The following section presents social issues present in the different communities, particularly those in Durban.
6.2.1 Methodology Six students from the University of KwaZulu-Natal (UKZN) conducted one month of research in the Amaoti and Ntshongweni communities. Under Golder Associates supervision they were tasked to investigate any water harvesting projects present in the communities.
Students incorporated water harvesting questions into semi-structured questionnaires that were administered to different households. A holistic water harvesting inquiry was conducted focusing on water harvesting technologies and strategies.
6.2.2 Amaoti A water harvesting project was carried out in Inanda and was headed by the Department of Water and Sanitation. The Department was responsible for the installation of ferro-cement tanks within the community. A field visit was undertaken to investigate issues within the community and identify types of technologies implemented.
Issues identified in Amaoti were related to Municipal water supply. Conflicts and lack of equal access to water led to vandalism and poisoning of water stored in tanks. Access to water system should take priority when planning to install communal storage systems.
Farming groups in Amaoti did practice water harvesting in a form of run-off or storm water harvesting (Figure 40). Farmers have dug-out dams where the water collects and is stored there temporarily. The stored water is used for irrigating crops.
6.2.3 Ntshongweni Ntshongweni’s primary access to water is through Municipal supplied standpipes. Most households have stand pipes within their yards thus having easy access to water. The water is collected from taps, stored in buckets and containers in the house for daily use. There is a perception
Figure 40: Water harvesting in Amaoti
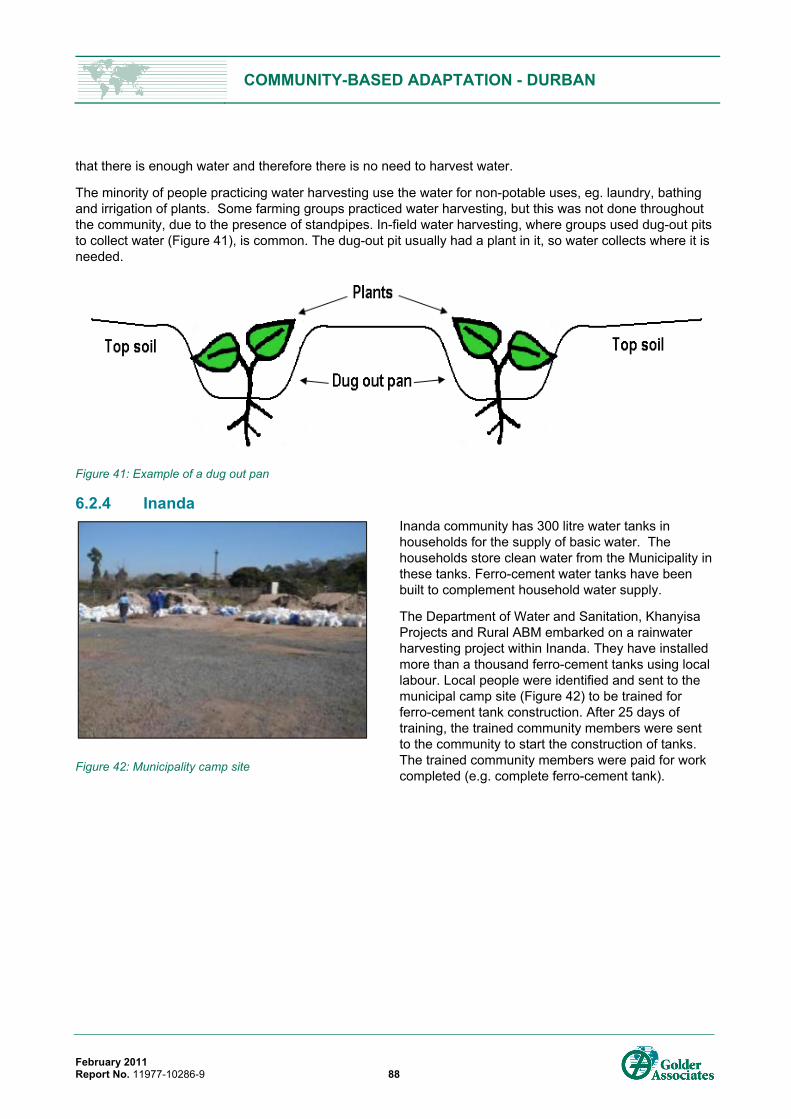
COMMUNITY-BASED ADAPTATION - DURBAN
February 2011 Report No. 11977-10286-9 88
that there is enough water and therefore there is no need to harvest water.
The minority of people practicing water harvesting use the water for non-potable uses, eg. laundry, bathing and irrigation of plants. Some farming groups practiced water harvesting, but this was not done throughout the community, due to the presence of standpipes. In-field water harvesting, where groups used dug-out pits to collect water (Figure 41), is common. The dug-out pit usually had a plant in it, so water collects where it is needed.
Figure 41: Example of a dug out pan
6.2.4 Inanda Inanda community has 300 litre water tanks in households for the supply of basic water. The households store clean water from the Municipality in these tanks. Ferro-cement water tanks have been built to complement household water supply.
The Department of Water and Sanitation, Khanyisa Projects and Rural ABM embarked on a rainwater harvesting project within Inanda. They have installed more than a thousand ferro-cement tanks using local labour. Local people were identified and sent to the municipal camp site (Figure 42) to be trained for ferro-cement tank construction. After 25 days of training, the trained community members were sent to the community to start the construction of tanks. The trained community members were paid for work completed (e.g. complete ferro-cement tank).
Figure 42: Municipality camp site

COMMUNITY-BASED ADAPTATION - DURBAN
February 2011 Report No. 11977-10286-9 89
Figure 43: Door sized garden Figure 44: Flexible pipes used as gutters in the community
6.2.5 Selection procedure The Municipal Councillor was involved in the selection of beneficiaries. The approach presented challenges as locals felt that the selection only served those close to the Councillor. As such, people were reluctant to accept the intervention. Municipal officials had to convince the public for the process to continue. Beneficiaries were selected using the available infrastructure at household level. This included:
The roof size had to be at least 40 square meters in size;
The yard must have a space of at least five meters from the wall; and
The household must have a door sized garden (Figure 43).
Those households without door sized gardens but met other criteria were encouraged to start a door sized garden to qualify for the tank. Door sized gardens was a way of promoting food security within the city.
Households were to use the collected water for non-potable uses like washing, bathing and irrigation. The municipality did not encourage people to use water for potable uses (drinking and cooking). Installing gutter systems was a challenge in rural areas as roofs were not straight. A flexible type of pipe was used to fit the roofs of these households (Figure 44). The site visits identified other water harvesting potential including storm or run-off water harvesting. The steep gradient presented an opportunity to channel run-off water to the food garden.
6.2.6 Municipal water harvesting initiative in Durban The municipality has implemented a number of water harvesting projects within Durban, including:
500 tanks in INK area;
120 tanks to 60 schools in INK area;
4 tanks for 4 clinics in INK area;
1000 tanks in UMzinyathi;
53 tanks in Crowder; and
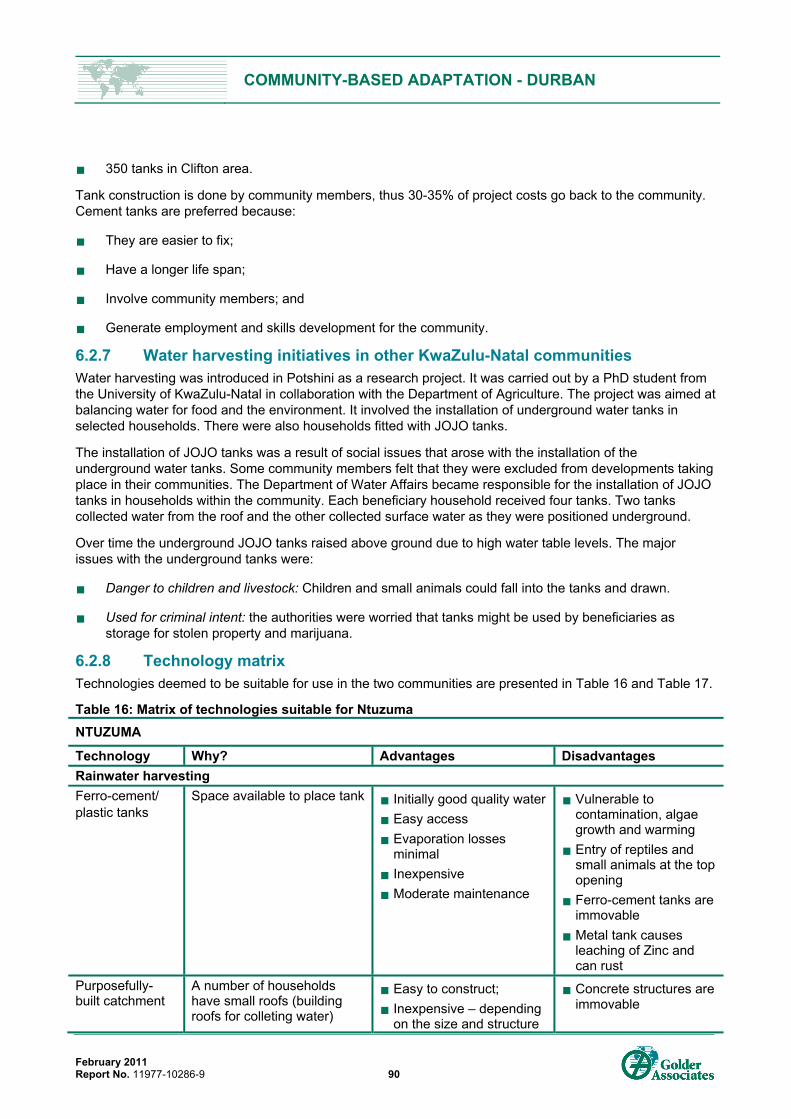
COMMUNITY-BASED ADAPTATION - DURBAN
February 2011 Report No. 11977-10286-9 90
350 tanks in Clifton area.
Tank construction is done by community members, thus 30-35% of project costs go back to the community. Cement tanks are preferred because:
They are easier to fix;
Have a longer life span;
Involve community members; and
Generate employment and skills development for the community.
6.2.7 Water harvesting initiatives in other KwaZulu-Natal communities Water harvesting was introduced in Potshini as a research project. It was carried out by a PhD student from the University of KwaZulu-Natal in collaboration with the Department of Agriculture. The project was aimed at balancing water for food and the environment. It involved the installation of underground water tanks in selected households. There were also households fitted with JOJO tanks.
The installation of JOJO tanks was a result of social issues that arose with the installation of the underground water tanks. Some community members felt that they were excluded from developments taking place in their communities. The Department of Water Affairs became responsible for the installation of JOJO tanks in households within the community. Each beneficiary household received four tanks. Two tanks collected water from the roof and the other collected surface water as they were positioned underground.
Over time the underground JOJO tanks raised above ground due to high water table levels. The major issues with the underground tanks were:
Danger to children and livestock: Children and small animals could fall into the tanks and drawn.
Used for criminal intent: the authorities were worried that tanks might be used by beneficiaries as storage for stolen property and marijuana.
6.2.8 Technology matrix Technologies deemed to be suitable for use in the two communities are presented in Table 16 and Table 17.
Table 16: Matrix of technologies suitable for Ntuzuma NTUZUMA
Technology Why? Advantages Disadvantages Rainwater harvesting Ferro-cement/ plastic tanks
Space available to place tank Initially good quality water
Easy access
Evaporation losses minimal
Inexpensive
Moderate maintenance
Vulnerable to contamination, algae growth and warming
Entry of reptiles and small animals at the top opening
Ferro-cement tanks are immovable
Metal tank causes leaching of Zinc and can rust
Purposefully-built catchment
A number of households have small roofs (building roofs for colleting water)
Easy to construct;
Inexpensive – depending on the size and structure
Concrete structures are immovable
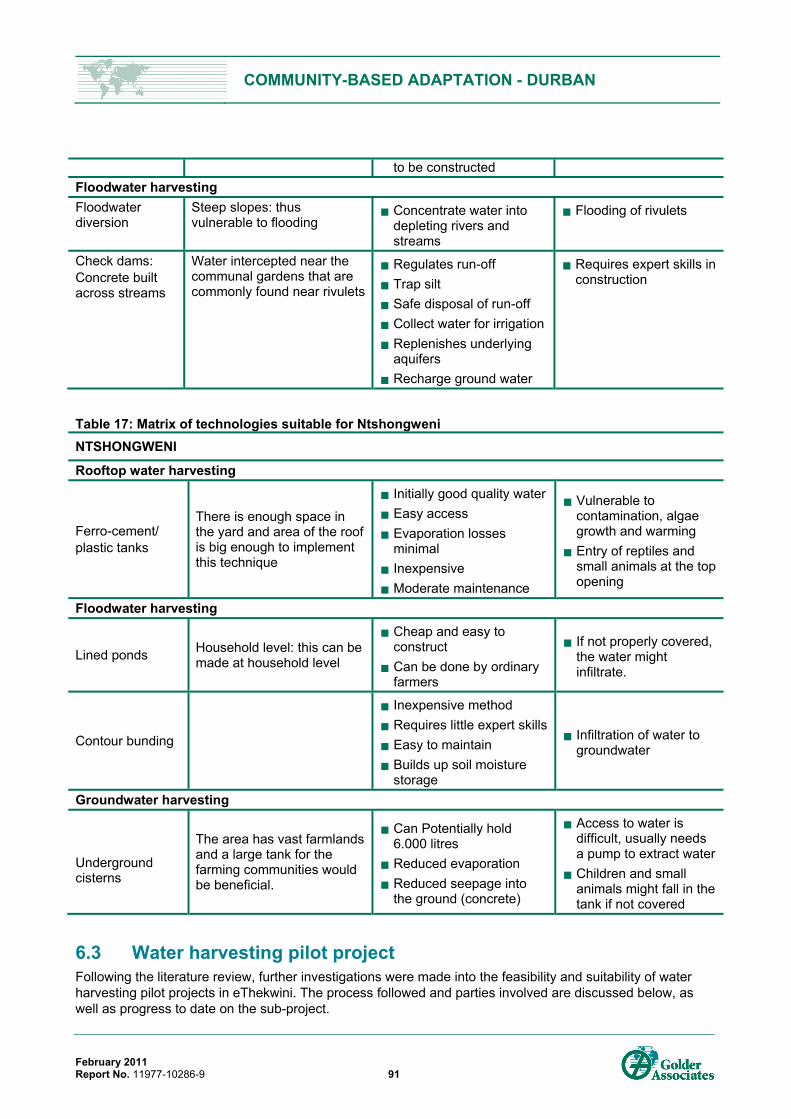
COMMUNITY-BASED ADAPTATION - DURBAN
February 2011 Report No. 11977-10286-9 91
to be constructed Floodwater harvesting Floodwater diversion
Steep slopes: thus vulnerable to flooding
Concentrate water into depleting rivers and streams
Flooding of rivulets
Check dams: Concrete built across streams
Water intercepted near the communal gardens that are commonly found near rivulets
Regulates run-off
Trap silt
Safe disposal of run-off
Collect water for irrigation
Replenishes underlying aquifers Recharge ground water
Requires expert skills in construction
Table 17: Matrix of technologies suitable for Ntshongweni NTSHONGWENI
Rooftop water harvesting
Ferro-cement/ plastic tanks
There is enough space in the yard and area of the roof is big enough to implement this technique
Initially good quality water
Easy access
Evaporation losses minimal
Inexpensive Moderate maintenance
Vulnerable to contamination, algae growth and warming
Entry of reptiles and small animals at the top opening
Floodwater harvesting
Lined ponds Household level: this can be made at household level
Cheap and easy to construct
Can be done by ordinary farmers
If not properly covered, the water might infiltrate.
Contour bunding
Inexpensive method
Requires little expert skills
Easy to maintain
Builds up soil moisture storage
Infiltration of water to groundwater
Groundwater harvesting
Underground cisterns
The area has vast farmlands and a large tank for the farming communities would be beneficial.
Can Potentially hold 6.000 litres
Reduced evaporation
Reduced seepage into the ground (concrete)
Access to water is difficult, usually needs a pump to extract water
Children and small animals might fall in the tank if not covered
6.3 Water harvesting pilot project Following the literature review, further investigations were made into the feasibility and suitability of water harvesting pilot projects in eThekwini. The process followed and parties involved are discussed below, as well as progress to date on the sub-project.

COMMUNITY-BASED ADAPTATION - DURBAN
February 2011 Report No. 11977-10286-9 92
6.3.1 Interaction with the Agricultural Management Unit (AMU) The AMU is a body set up by the eThekwini Municipality for the purpose of directing agricultural activities with respect to the urban and peri-urban dwellers in the municipal area. The purpose of the AMU is to optimize food security, whilst ensuring best practice with regard to the environment, water use and social needs of the community.
An initial meeting was held with the AMU to learn about current projects being implemented, with the objective of finding an urban implementation site and appropriate water harvesting and application technology for such a site. The team discussed various options around technologies that could be and/or had been employed, and provided the names of Mr Mike Leach and Mr Richard Pocock as two of the most experienced people in the Durban area with regard to urban planting systems. Mr Leach and Mr Pocock were contacted, and a meeting held. The meeting centred on the work that was already being done by the AMU and how it may be possible to augment this work by means of implementing novel micro-agricultural water management technologies (micro-AWM technologies) through the DANIDA project. Potential appropriate sites for implementing such technologies were identified, including: Luganda School, Insimbini Garden, SPCA Biodigester, SPCA Processing Hub and the Bluff Eco-Park. Mr Nick Alcock (Khanyisa Projects) provided the Golder team with a comprehensive list of gardens currently being focused on, as well as the relevant contact details of people in these projects. A number of potential sites were visited with Mr Nick Alcock and Mr Dave Alcock on 15 December 2009, to determine whether they would be suitable as implementation sites.
6.3.2 Potential sites The listed AMU sites were also visited with Mr Leach and Mr Pocock respectively to determine what technologies, if any, may be appropriately demonstrated at any of these. All sites were initially identified based on the fact that these technologies were more likely to be successful if they were implemented in existing projects where community participation was already apparent. The potential sites therefore already had an agricultural footprint/project established. A summary of the sites seen and their relative positions to some of the food security trial sites can be seen in Figure 45 below. It should be noted that the SPCA Biodigester site is very near the SPCA Processing Hub, and is as such not clearly visible in Figure 45 , but can be taken as being part of the same site for the purposes of this report. The sites are discussed in turn in the sections which follow.

COMMUNITY-BASED ADAPTATION - DURBAN
February 2011 Report No. 11977-10286-9 93
Figure 45: Potential Micro-AWM Technology implementation sites assessed
Phaphamani Community Garden This garden (Figure 46), situated in lower Maphepheteni, was started in 1980 by 32 community members and is currently in the process of registration as a co-operative. The area can be classified as peri-urban. The garden was first initiated for subsistence, however, the long-term goal is to sell produce on a larger scale. The management team consists of five executive members that oversee the daily running of the garden. All members dedicate a significant amount of their time to the garden and their membership number has recently increased to 34.
95% of the garden is utilized for crop production, and the members adhere to sustainable farming practices such as mulching. Plants are grown in a small cup-like depression to enhance water collection and retention. A recent improvement to the garden is a packhouse and storage facility that will allow for the processing and storage of vegetables. A biogas toilet was also recently constructed on-site and this will provide gas for cooking and liquid fertilizer to use in the garden. It also provides a useful example of the use of grey water as a water harvesting process.
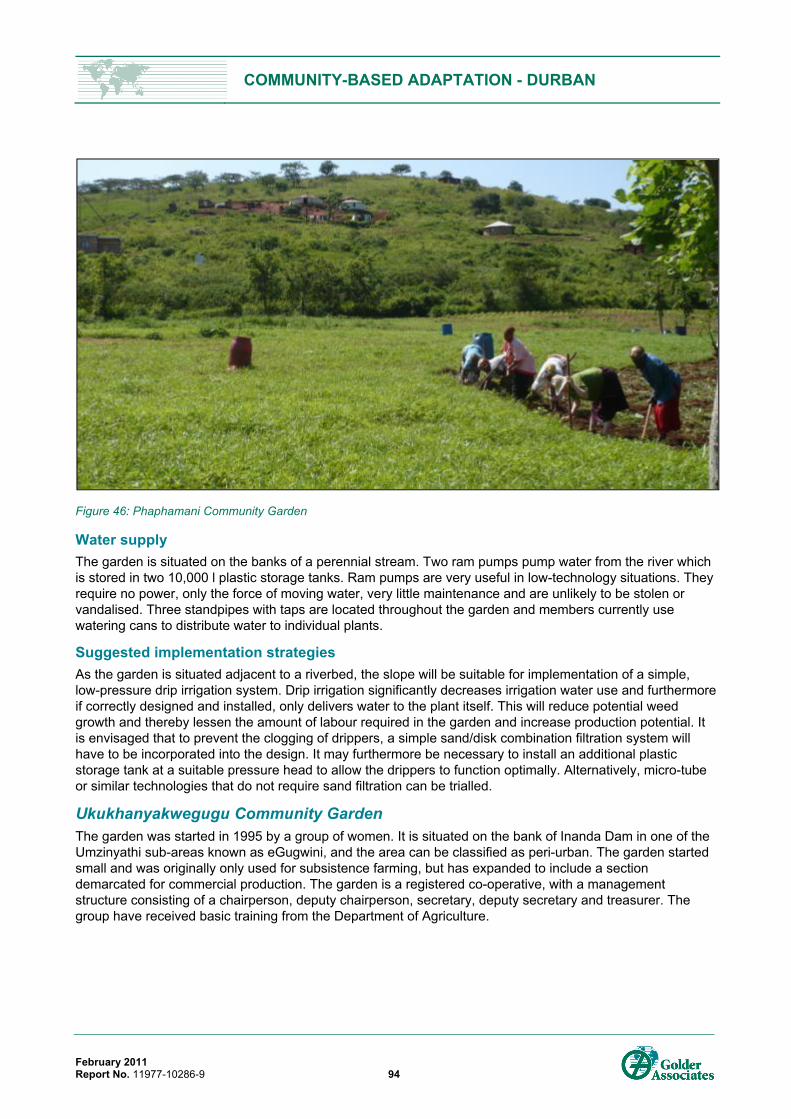
COMMUNITY-BASED ADAPTATION - DURBAN
February 2011 Report No. 11977-10286-9 94
Figure 46: Phaphamani Community Garden
Water supply The garden is situated on the banks of a perennial stream. Two ram pumps pump water from the river which is stored in two 10,000 l plastic storage tanks. Ram pumps are very useful in low-technology situations. They require no power, only the force of moving water, very little maintenance and are unlikely to be stolen or vandalised. Three standpipes with taps are located throughout the garden and members currently use watering cans to distribute water to individual plants.
Suggested implementation strategies As the garden is situated adjacent to a riverbed, the slope will be suitable for implementation of a simple, low-pressure drip irrigation system. Drip irrigation significantly decreases irrigation water use and furthermore if correctly designed and installed, only delivers water to the plant itself. This will reduce potential weed growth and thereby lessen the amount of labour required in the garden and increase production potential. It is envisaged that to prevent the clogging of drippers, a simple sand/disk combination filtration system will have to be incorporated into the design. It may furthermore be necessary to install an additional plastic storage tank at a suitable pressure head to allow the drippers to function optimally. Alternatively, micro-tube or similar technologies that do not require sand filtration can be trialled.
Ukukhanyakwegugu Community Garden The garden was started in 1995 by a group of women. It is situated on the bank of Inanda Dam in one of the Umzinyathi sub-areas known as eGugwini, and the area can be classified as peri-urban. The garden started small and was originally only used for subsistence farming, but has expanded to include a section demarcated for commercial production. The garden is a registered co-operative, with a management structure consisting of a chairperson, deputy chairperson, secretary, deputy secretary and treasurer. The group have received basic training from the Department of Agriculture.
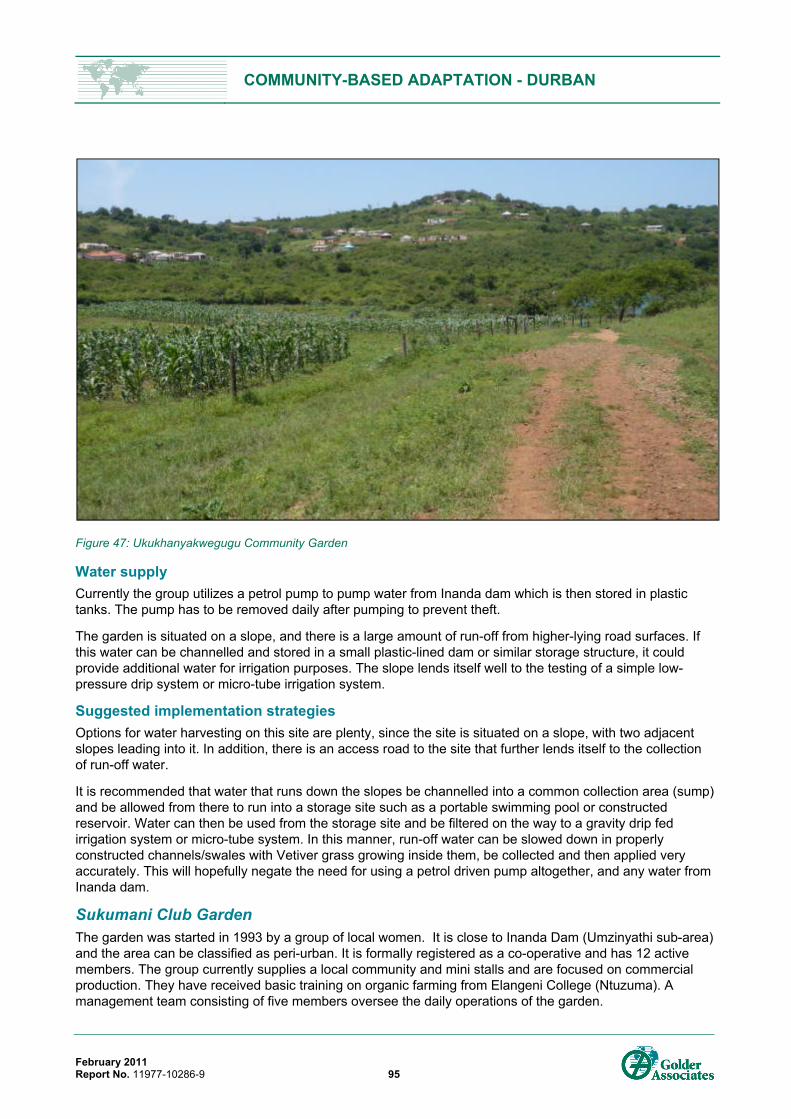
COMMUNITY-BASED ADAPTATION - DURBAN
February 2011 Report No. 11977-10286-9 95
Figure 47: Ukukhanyakwegugu Community Garden
Water supply Currently the group utilizes a petrol pump to pump water from Inanda dam which is then stored in plastic tanks. The pump has to be removed daily after pumping to prevent theft.
The garden is situated on a slope, and there is a large amount of run-off from higher-lying road surfaces. If this water can be channelled and stored in a small plastic-lined dam or similar storage structure, it could provide additional water for irrigation purposes. The slope lends itself well to the testing of a simple low-pressure drip system or micro-tube irrigation system.
Suggested implementation strategies Options for water harvesting on this site are plenty, since the site is situated on a slope, with two adjacent slopes leading into it. In addition, there is an access road to the site that further lends itself to the collection of run-off water.
It is recommended that water that runs down the slopes be channelled into a common collection area (sump) and be allowed from there to run into a storage site such as a portable swimming pool or constructed reservoir. Water can then be used from the storage site and be filtered on the way to a gravity drip fed irrigation system or micro-tube system. In this manner, run-off water can be slowed down in properly constructed channels/swales with Vetiver grass growing inside them, be collected and then applied very accurately. This will hopefully negate the need for using a petrol driven pump altogether, and any water from Inanda dam.
Sukumani Club Garden The garden was started in 1993 by a group of local women. It is close to Inanda Dam (Umzinyathi sub-area) and the area can be classified as peri-urban. It is formally registered as a co-operative and has 12 active members. The group currently supplies a local community and mini stalls and are focused on commercial production. They have received basic training on organic farming from Elangeni College (Ntuzuma). A management team consisting of five members oversee the daily operations of the garden.

COMMUNITY-BASED ADAPTATION - DURBAN
February 2011 Report No. 11977-10286-9 96
Figure 48: Sukumani Club Garden
Water supply Water is pumped directly from Inanda dam with a petrol pump and stored in plastic storage tanks. Water is then gravity fed from these storage tanks to taps situated throughout the field. Water is then carried from these taps using buckets, and plants are watered in this manner by hand.
Suggested implementation strategies Options around water harvesting on this site are not significant since the site is situated on a spur, and although there is a slope and some run-off water could be captured from the road, water effectively runs off the field without many options around collection without the need for pumping. Whilst in-field harvesting techniques would be useful, it was felt that other sites may be more valuable in terms of being able to implement a number of technologies in an integrated manner.
Sicelamusa Co-operative This garden was started in 2002 by a group of unemployed community members from J-section, KwaMashu. This area is far more urban than the previous areas visited and space is therefore a considerable constraint. The land utilized for crop production belongs to the municipality. This registered co-operative has 5 members and they share responsibilities, as there is no separate management team in place. The level of commitment is very high and all members are actively involved in planting and tending of the garden. They have received basic training in business and financial management as well as organic farming. This garden sells to the local community and to large outlets such as Boxer and Spar.

COMMUNITY-BASED ADAPTATION - DURBAN
February 2011 Report No. 11977-10286-9 97
Figure 49: Sicelamusa Co-operative Garden
Water source Water is tapped from a local stream from behind a concrete or sand-bagged weir. Water gravity-feeds to a set of tanks from this weir, and a backup petrol pump is used to pump water from the river only when this water source weir is broken, or water from this source is unavailable.
Suggested implementation strategies It will be difficult to implement any meaningful water harvesting technologies on this site, due to the fact that the topography of this garden is very flat, with no real options around harvesting run-off water from nearby hillsides or roofs. In addition, very little pressure head would be available for driving irrigation systems such as drip or even sprinklers. Other sites seen will therefore be more appropriate for micro-AWM technology implementation.
Luganda School Luganda School is situated in the western area of eThekwini within the suburb of Luganda. The school is situated near the crest of a hill, and consists of a number of fairly modern classroom blocks stepped/terraced down the slope to some extent. School building roofs are made of new Inverted Box Rib (IBR) roofing and guttering to direct water to existing JoJo tanks. Each classroom block has at least one JoJo tank placed on a concrete slab that has a drainage sump and pipe to collect overflow from the tank during high rainfall events.
Some other buildings on the property are older and do not, in some cases, have gutters or JoJo tanks, resulting in runoff water running along the ground down the slope. This is also the case for runoff from the parking lot and the tarred road that runs adjacent to the southern boundary of the property. Some open concrete waterways have been put in place throughout the property to channel this runoff and general surface runoff water to central sumps, from whence the water is channelled by means of sub-surface pipes to a larger drainage pipe that ends abruptly approximately half way down the property.

COMMUNITY-BASED ADAPTATION - DURBAN
February 2011 Report No. 11977-10286-9 98
This entire drainage system is currently in various stages of disrepair at different points, resulting in water running down the slope across the soil surface, causing serious erosion and degradation of the school property.
Figure 50: Luganda School prior to water harvesting pilot study
Current water supply A small section of the property has been terraced with double-dig gardens, and some of the surface runoff water is currently being used to water the lower reaches of this garden where crops such as Madumbe have been planted. The upper reaches of the garden are watered by hand, i.e. carrying buckets of water from the nearest plastic tanks to the crops requiring water. Conflicts over the use of the water for agricultural purposes have been reported, since the school children also use this tank water as drinking water, and the storage is currently limited.
Suggested implementation strategies At the stage of the initial screening for potential pilot sites, it was identified that rainwater could potentially be harvested from two sources:
Clean water collected from the roofs of the buildings - Rainwater is stored in existing plastic tanks, and the overflow from the plastic tanks can be collected and stored in either additional plastic tanks and/or large new prefabricated reservoirs. This is made possible due to the slope of the school ground allowing the water from roofs/tanks to flow downhill to such structures. This system can be implemented in 4 phases. It is possible to build a reservoir on an available piece of land on the eastern side of the school, above the existing garden that will allow water to be gravity fed from the reservoir to the garden below. An area of unused land below the school could be irrigated by constructing a similar reservoir below the lower set of school buildings. It is also possible to duplicate this system on the western side of the school as there are houses with gardens just outside the school boundary that can utilize this water. There are also existing gardens run by the AMU situated below the road below the school that could use this water.

COMMUNITY-BASED ADAPTATION - DURBAN
February 2011 Report No. 11977-10286-9 99
Silt-laden water collected from the open areas of the school – The team could repair and modify the existing surface water run-off infrastructure to better cope with high rainfall events thereby eliminating the current erosion problems. This silt-laden water would be piped to a collection reservoir from where it can be used for irrigation through larger orifice irrigation systems such as impact sprinklers, taps and dragline hoses. It will be possible to collect water at two different points down the slope resulting in potentially two reservoirs feeding water to different gardens down the slope. The silt which collects in the reservoirs will periodically have to be removed and spread onto the fields.
Please note that it is recommended that the existing erosion problem at the school be addressed, should this project be implemented or not.
It is recommended that two drip irrigation technologies be trialled using the clean water to gauge their effectiveness and acceptability to the farmers. It is recommended that 0.2 ha of garden be fitted with black polyethylene pipes and commercially available low pressure emitters. A further 0.2 ha should be fitted with string emitters. To prevent the clogging of drippers, a simple disk filter system should be installed. The disk filter is preferred as it is simple and easy to clean manually.
Depending on the exact location of the reservoir it may be possible to also trial the “Procast” garden type sprinkler. This sprinkler has no moving parts, requires no filtration of the water and is fed by an ordinary garden hose. However this sprinkler requires that the reservoir or dam be located at least 10 metres vertically higher than the garden.
Figure 51 shows the layout of the complete (4 phases) of the clean water rain water harvesting and irrigation system.
Figure 51: Water harvesting and irrigation layout Luganda School

COMMUNITY-BASED ADAPTATION - DURBAN
February 2011 Report No. 11977-10286-9 100
Insimbini Garden The Insimbini Garden is situated just south of “Spaghetti Junction” adjacent to the N2 highway in the suburb of Cato Manor. The garden has been established as a co-operative with the aim establishing and promoting a holistic sustainable integrated farming system. Gardens using double-dig growing beds have been established, composting takes place on site, a mushroom facility is currently being established, banana circles, herb spirals, food-forest and food-fence growing systems are all being implemented and promoted.
Figure 52: Insimbini Garden
Current Water Supply Water is currently pumped from the adjacent river to a 150,000 litre reservoir situated at the crest of the property, from which it is gravity fed for irrigation needs. In addition, two swale structures have been put in place to collect run-off water from the slope and channel it into a clay-lined earth dam at the base of the hill, adjacent to the gardens.
Suggested Water Harvesting and Irrigation Technologies The Insimbini site is managed in a hands-on fashion by Mr Richard Pocock. It therefore lends itself to the testing of new micro-AWM technologies, and new technologies can be carefully monitored and fine-tuned in a practical manner. A system that may potentially be of use in urban areas without extensive available land is the cultivation of crops in a motorcar tyre pyramid irrigated by micro-tubes. Such a practice is best carried out under controlled conditions before implementing in the greater Durban urban and peri-urban areas.
The micro-tube irrigation system will consist of a relatively small storage structure such as a 5,000 litre plastic tank from which water will be conveyed via a 15 mm plastic pipe to a pyramid garden. Micro-tubes then connect to the plastic pipe and convey water to different parts of the pyramid. The amount of water applied is controlled by hand through the opening and closing of a valve or tap.
SPCA biodigester The SPCA biodigester is situated in Cato Manor, close to the Insimbini Garden. This 270 m3 biodigester makes use of an adjacent sewerage line for its feedstock. The digester is new, and has not as yet been commissioned.

COMMUNITY-BASED ADAPTATION - DURBAN
February 2011 Report No. 11977-10286-9 101
Figure 53: SPCA Biodigester Site
Water source Adjacent sewerage-line water that has passed through the biodigester will be discharged into a reedbed system and then aerated before passing into fish farming ponds. This high-nitrogen source of water can be used for growing various crops in gardens.
Suggested implementation strategies Although in theory this site will offer abundant water for use in agricultural systems, much of the micro-AWM technology is not necessary due to the same abundant supply. There is therefore no real need for any additional harvesting and water conservation at thus site. The biodigester is yet not in operation, and therefore no reed beds etc. currently exist, further making this site inappropriate for current consideration.
SPCA Processing Hub The SPCA processing hub is also owned by a co-operative in conjunction with the city. The facility is being established to allow produce grown in gardens in the area to be brought to a central “packhouse”/processing facility where value can be added and marketing can take place co-operatively.

COMMUNITY-BASED ADAPTATION - DURBAN
February 2011 Report No. 11977-10286-9 102
Figure 54: SPCA Processing Hub
Water source Municipal water is the currently planned source. Very few other options around a water source from a water harvesting perspective seem possible. There is a limited amount of roof area on top of containers from which rainwater could be harvested, and a stretch of tar road behind the facility would lend itself to run-off water harvesting. These sources would however currently be limited, and not provide substantial quantities of irrigation water for use in a micro-AWM system.
Suggested implementation strategies This site is not designed to be used for the growing of produce, although there may be land available for doing so in the future. No micro-AWM possibilities around growing crops can therefore be suggested at the moment. It may be possible in the future once some more roof area has been established and the hub is in operation to harvest water both from the roofs and from the processing operation itself for use in gardens to be established adjacent to the current facility.
Bluff Eco-Park The Bluff Eco-Park is privately owned by the Verus Company. Verus own and operates small and large-scale agricultural projects throughout Africa. Verus purchased the Bluff site with the aim of developing and testing new eco-friendly alternative practices in a number of fields, including alternative agricultural growing systems for large and small-scale applications.
The site lends itself to act as a second testing site in addition to the Insimbini Garden for “new” micro-AWM systems such as the tyre pyramid system. The site is appropriately staffed and managed for this purpose, and has many of the materials such as tyres already available for such use on-site. Preliminary discussions with Mr Johan van Huyssteen in this regard have resulted in him offering the facility and available materials for such use should the city wish to make use of it for the testing of these technologies.
6.4 Selected water harvesting pilot projects Due to various challenges regarding logistics, availability of interested parties and the difficulties around water harvesting at personal household level as discussed under the first sub-project, considerable changes

COMMUNITY-BASED ADAPTATION - DURBAN
February 2011 Report No. 11977-10286-9 103
to this part of the project were required. It was found that more success was likely to be had through a pilot project which explored rainwater harvesting from an agricultural perspective, rather than one at household level. The project team collectively decided to focus on the Luganda School project for the pilot, with the “tyre” gardens as an experimental side project.
Three interventions for water harvesting at the Luganda School were proposed on acceptance of this site for the pilot study:
Clean water from roofs;
Dirty water from surface runoff; and
Surface water harvesting.
These were designed with specific cognisance of the water harvesting intervention requirements of the Luganda School (Box 3). The proposed interventions are discussed below.
Clean water from roofs – It is proposed that the existing plastic water storage tanks situated in several locations at the school remain in place. These collect water from the school roofs and used for a variety of purposes. Once these tanks are full, water overflows into a pipe which conveys it under gravity to a battery of 10 kilolitre plastic storage tanks. The drinking water system will receive runoff water as a priority. The irrigation water will only start to accumulate once the drinking water tanks are full. The irrigation system is not connected to the drinking water tanks at all. The 10 kl plastic tanks are connected at the bottom so that they form one large storage facility. Irrigation water is conveyed to the fields under gravity so that farmers can irrigate by handheld bucket, hosepipe or drip irrigation.
Dirty water from surface runoff - The school has an existing system of drains with drop-in catch pits. This system is not functioning. The main reasons for this include:
The drain pipes are too small and get blocked with silt very quickly;
No system to manage surface water runoff has been installed on the school grounds. The result is that water runs off very quickly and basically bypasses the catch pits. The high water velocity causes severe erosion and high silt loads. The small amount of water that enters the catch pits has a very high silt load. The catch pit slows the water down, the silt is deposited and the pipes become blocked.
For the dirty water system, the team proposes to install a system of tyre berms and agricultural contours planted with vetiver grass on the school grounds. This system will divide the school into smaller catchment areas so that water is slowed down and released in a controlled manner, either into a storage reservoir, the double-dig beds or onto well-grassed stable areas adjacent to the school.
Box 3: Water harvesting intervention requirements
Keep “clean” water from the roof separate from “dirty” water from surface runoff;
Store as much water as is practically possible, either in tanks and reservoirs or in the soil profile;
Allow as much water as possible to infiltrate into the soil profile by: increasing contact time between
water and soil, on production and non-production areas, using a system of agricultural contours to slow the flow of water down;
diverting water from non-production areas to production areas via a system of agricultural contours;
Control soil erosion by dividing surface water flow into smaller, more manageable catchment areas using a system of agricultural contours and drains which will slow down the flow, increase the amount of water in the soil profile and allow grass to grow on bare areas, thereby stabilizing the soil;
Avoid the installation of mechanical components which require regular maintenance (for ease of use);
Ensure irrigation is carried out using gravity rather than requiring energy; and
Keep the design as simple as possible.
COMMUNITY-BASED ADAPTATION - DURBAN
February 2011 Report No. 11977-10286-9 104
It is proposed that the team install a new 600 mm diameter drainpipe, with drop-in catch pits, on the south-eastern side of the two lower school buildings. Contours will feed water into the drainpipe, which will empty into a de-silting structure. The relatively clean water will be conveyed to a 110 kl reservoir for storage. The excess water will continue down the drainpipe to be released at the road below. The slope of the pipe is such that the drain should be self-cleaning. If blockage should occur, the large diameter of 600 mm will allow a person to enter the pipe via a catch pit to clear it. The de-silting structure will need to be cleaned of silt on a regular basis. The system of contours will reduce the flow velocity and the silt load which should then allow the existing drainage system to become functional. This system will drain into 2 separate de-silting works, with the cleaner water diverted to 110 kl storage reservoirs. The water that is held in storage will still contain some silt, and the reservoirs will have to be emptied of silt from time to time.
Surface water harvesting - The system of contours will convey excess surface water from the adjacent open school yard and release it to the double-dig beds. This will allow more water to percolate into the soil profile of the beds, thereby improving the water table level and soil moisture conditions. The vetiver grass planted on the crest of the contours acts as a barrier to silt and allows water to percolate through to the soil. Initially the contours will slow the water down and cause silt to be deposited behind the vetiver grass. Over time, silt deposition will cause the ground level behind the grass barrier to rise, and eventually cause a terrace effect. The vegetation will green the school grounds, and will trap silt, allowing for cleaner irrigation water for the farmers and less frequent cleaning of the de-silting structure.
Implementation Strategy A three-phase implementation strategy, complete with the above proposed interventions and infrastructure requirements, was drawn up once a full site survey was completed. These three phases are as follows (refer to Drawings 1-4 in Appendix E). The initial work budgeted for, commissioned and completed only constitutes Phase 1 of these three phases i.e. Phase 2 and 3 would have to be implemented separately under a new budget and project contract/s.
Phase 1 This phase is relevant to the existing farmers at the school. Water from the roof of the original classroom and the new toilet building will be collected and stored in a battery of 10 x 10 kl tanks, creating storage capacity of 100 kl, situated just above the existing double-dig beds. A 63 mm polyethylene pipe conveys the water to the beds for irrigation of 125 m² in summer and 150 m² in winter.
A 600 mm concrete pipe drain with drop-in catch pits situated adjacent to and on the south-eastern side of the two lower classroom blocks will drain water down to a de-silting structure. Clean water be diverted to a 110 kl reservoir situated below the lowest classroom block, and the balance of the water will be released to the road below. A 63 mm polyethylene pipe will convey water from the reservoir to a new area below the reservoir. A system of agricultural contours will discharge water to the catch pits and double-dig beds in a controlled manner.
The existing stormwater drainage system will be cleaned, and a de-silting works constructed at the existing outlet of this system.
Phase 2 Water from the roof of the classroom building situated on the western fence of the school will be collected and stored in two batteries of tanks. One battery of 8 x 10 kl low profile plastic tanks will be situated on the southern side of the building and a second battery of 12 x 10 kl tanks situated on the northern side of this building. The two batteries are located on the same level and are connected by a 110 mm polyvinyl chloride pipe, creating a combined storage capacity of 200 kl. A 63 mm PE pipe will convey the water to a new area situated just outside the school fence on the municipal land to the west of the school. The area that can be irrigated with a high assurance of supply is 250 m² in summer and 300 m² in winter.
A system of contours situated on the school grounds will discharge water onto the new irrigation area.

COMMUNITY-BASED ADAPTATION - DURBAN
February 2011 Report No. 11977-10286-9 105
Phase 3 Water from the roofs of the two classroom buildings situated to the lower area of the school property will be collected and stored in two batteries of tanks. One battery of 10 x 10 kl plastic tanks will be situated below the lower building on the north-western side, and a second battery of 10 x 10 kl tanks below the lower building on the south-eastern side. The two batteries will not be connected, and will form two storage facilities of 100 kl each. A 63 mm polyethylene pipe will convey the water to two new areas situated below each facility. The areas that can be irrigated with a high assurance of supply are 125 m² in summer and 150 m² in winter for each storage facility.
The existing stormwater drainage system will be cleaned. A system of contours situated on the school grounds will discharge water into the existing storm water drainage system. A de-silting works situated towards the lower end of the lower building will feed clean water to a 110 kl storage reservoir situated below the north-western corner of the lower building.
A 63 mm polyethylene pipe will convey water from the reservoir to a new area below the reservoir.
Phase 1: Implementation of Phase 1 - water harvesting interventions and micro-AWM-tech A broad outline of the area included in the Phase 1 and a closer view of specific water harvesting interventions are shown in Figure 55 and Figure 56 respectively. These are further discussed in the sections that follow.
Figure 55: Overall Luganda site plan showing phase 1 development and tyre garden

COMMUNITY-BASED ADAPTATION - DURBAN
February 2011 Report No. 11977-10286-9 106
Figure 56: Closer view of specific water harvesting interventions implemented
Clean roof water harvesting Roof water from the areas marked R1 and R2 on Figure 56 is captured/diverted by means of a pipeline connecting the overflow (top) off-take point of the existing 5,000 litre JoJo tanks (Figure 57) to the newly installed set of 10 x 10,000 litre storage tanks, marked ‘Tanks’ on Figure 56. The total storage capacity for clean water from the R1 and R2 roofs (534 m2), is therefore 110,000 litres. Approximately 206 mm of rainfall is needed fill the total 110,000 litre capacity. Only overflow water from the 5,000 litre JoJo tanks is used, allowing learners to continue using water from these tanks for drinking, as is currently the case.

COMMUNITY-BASED ADAPTATION - DURBAN
February 2011 Report No. 11977-10286-9 107
Figure 57: Clean-water harvesting interventions implemented at Luganda School
Figure 57, from the top left corner, indicates roof area R1 (A) with roof R2 appearing in photo B. Photos C, D, E, and F show their respective JoJo tank connections feeding into a common pipe and directing water to the large storage tank area (also seen in Figure 56, labelled as ‘Tanks’).
Photos G and H in Figure 57 show the reinforced concrete plinth (G) laid to carry the weight of the 100,000 litres of storage capacity (H). Currently these tanks are drained by means of a set of turf valves (not shown) where community gardeners are able to fill buckets or connect dragline hoses for ease of watering adjacent to the ‘Double-dig Beds” shown in Figure 56 and Figure 57 (H).
A
B
C D
E F
G H
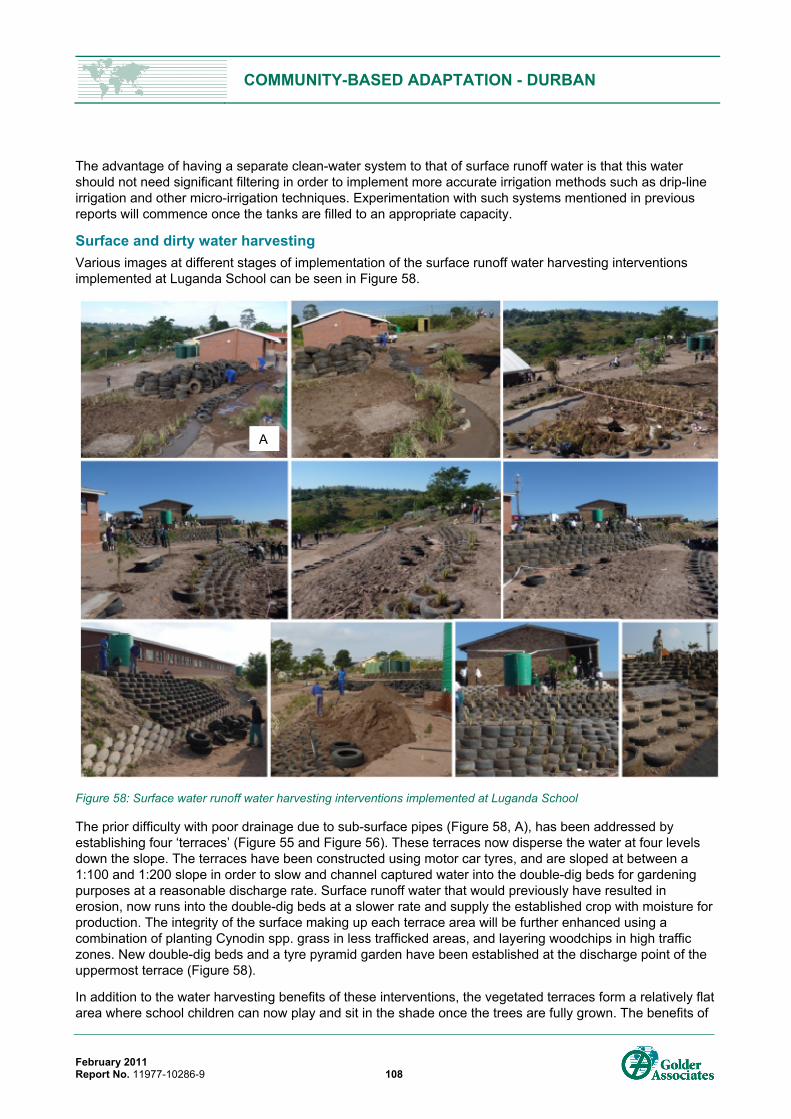
COMMUNITY-BASED ADAPTATION - DURBAN
February 2011 Report No. 11977-10286-9 108
The advantage of having a separate clean-water system to that of surface runoff water is that this water should not need significant filtering in order to implement more accurate irrigation methods such as drip-line irrigation and other micro-irrigation techniques. Experimentation with such systems mentioned in previous reports will commence once the tanks are filled to an appropriate capacity.
Surface and dirty water harvesting Various images at different stages of implementation of the surface runoff water harvesting interventions implemented at Luganda School can be seen in Figure 58.
Figure 58: Surface water runoff water harvesting interventions implemented at Luganda School
The prior difficulty with poor drainage due to sub-surface pipes (Figure 58, A), has been addressed by establishing four ‘terraces’ (Figure 55 and Figure 56). These terraces now disperse the water at four levels down the slope. The terraces have been constructed using motor car tyres, and are sloped at between a 1:100 and 1:200 slope in order to slow and channel captured water into the double-dig beds for gardening purposes at a reasonable discharge rate. Surface runoff water that would previously have resulted in erosion, now runs into the double-dig beds at a slower rate and supply the established crop with moisture for production. The integrity of the surface making up each terrace area will be further enhanced using a combination of planting Cynodin spp. grass in less trafficked areas, and layering woodchips in high traffic zones. New double-dig beds and a tyre pyramid garden have been established at the discharge point of the uppermost terrace (Figure 58).
In addition to the water harvesting benefits of these interventions, the vegetated terraces form a relatively flat area where school children can now play and sit in the shade once the trees are fully grown. The benefits of
A

COMMUNITY-BASED ADAPTATION - DURBAN
February 2011 Report No. 11977-10286-9 109
using tyres have been fully exploited through the planting of Vetiver grass within the ‘tyre slopes’ for soil stabilisation, as well as thorny Carissa macrocarpa, to discourage the children from climbing along the slopes. These ‘tyre slopes’ created from of hundreds of tyres that have been buried within the slope profile, will remain porous as the tyre cavity has been filled with a mixture of soil and compost and the cavity remains exposed to water infiltration. Each tyre will harvest significant volumes of water as a result of the lower side-wall of the tyre structure which effectively traps the water. This ‘stored’ water within each tyre will act as a water reservoir for plants planted into the upper-most tyre cavity. Furthermore, excess water can freely drain into the sub-surface water drainage area without water-logging and eroding the profile.
Images in Figure 58, from the top left (A), show the establishment and vegetation of Terrace 1, as well as various views of the remaining three terraces from different angles. The bottom right image shows steps formed through filling tyres with concrete in the surface cavity, allowing the school children to traverse easily between terraces.
Tyre-Pyramid Garden Pilot The tyre-pyramid garden, originally intended for the Insimbini Garden, was established at Luganda School (Figure 59) due to various complications with using the previously identified site. It is also likely that establishing this garden at Luganda School will result in more exposure in terms of learners potentially taking the idea home for their families to implement should it prove successful.
It should be noted that the tyre-pyramid garden is an experimental water harvesting and urban gardening technique. The tyre-pyramid garden established at Luganda therefore serves as a pilot project to broadly ascertain the potential benefits and drawbacks that such a garden may hold.
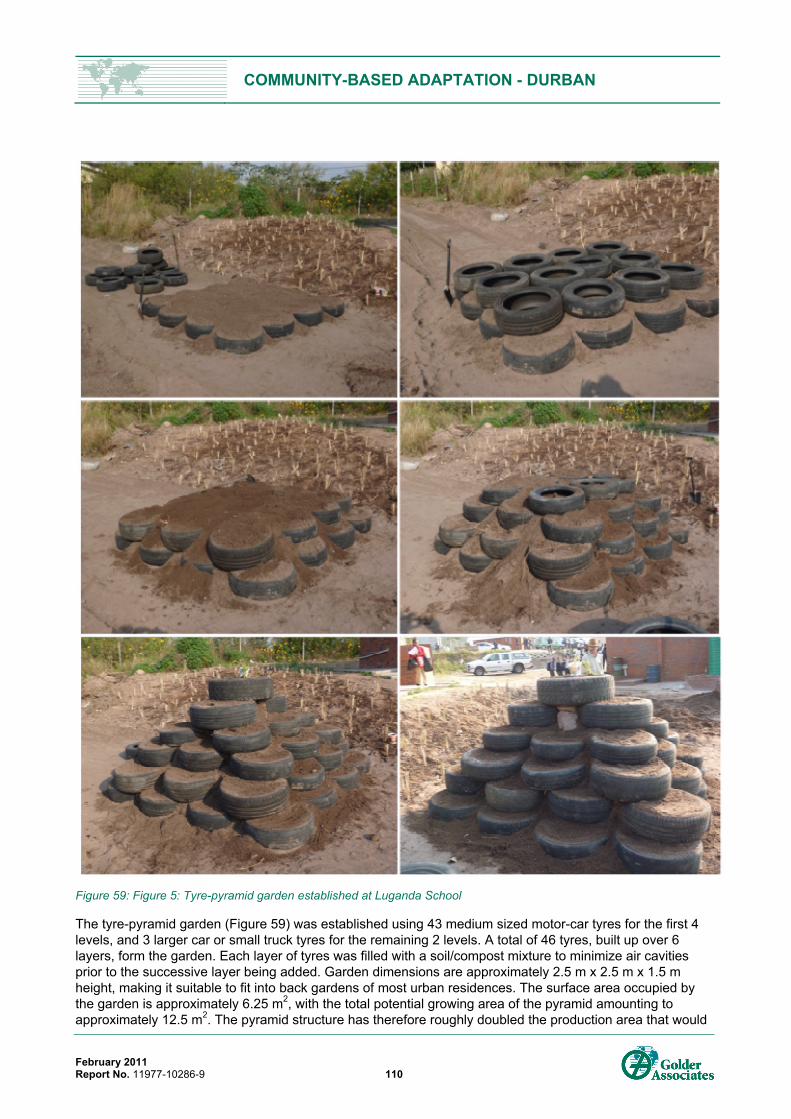
COMMUNITY-BASED ADAPTATION - DURBAN
February 2011 Report No. 11977-10286-9 110
Figure 59: Figure 5: Tyre-pyramid garden established at Luganda School
The tyre-pyramid garden (Figure 59) was established using 43 medium sized motor-car tyres for the first 4 levels, and 3 larger car or small truck tyres for the remaining 2 levels. A total of 46 tyres, built up over 6 layers, form the garden. Each layer of tyres was filled with a soil/compost mixture to minimize air cavities prior to the successive layer being added. Garden dimensions are approximately 2.5 m x 2.5 m x 1.5 m height, making it suitable to fit into back gardens of most urban residences. The surface area occupied by the garden is approximately 6.25 m2, with the total potential growing area of the pyramid amounting to approximately 12.5 m2. The pyramid structure has therefore roughly doubled the production area that would

COMMUNITY-BASED ADAPTATION - DURBAN
February 2011 Report No. 11977-10286-9 111
have been possible on a flat surface. Approximately 4.7 m3 of growing filling/medium was used to fill the entire pyramid.
One of the leading edges of the garden was orientated north in order to optimize sunlight on 2 of the 4 sides of the pyramid. The planting of vegetable seedlings into the 39 cavities created by the tyres will commence once sufficient rainfall has occurred. Further experiments using micro-tubes for irrigation purposes will also take place once these are connected to the main set of storage tanks.
The envisioned benefits of such a garden are:
Each of the tyres used will individually harvest water in its lower sidewall, therefore acting as a water reservoir to provide plants with moisture for period of growth between rainfall events;
The entire pyramid is in effect a cascading reservoir, with water lost to the uppermost layers cascading down the pyramid and being captured for storage by the lower layers;
The pyramid provides approximately double the growing surface that a flat area would, therefore optimizing space in an urban environment;
Despite providing approximately double the growing surface when compared to a flat area, evaporative losses from this structure should be minimal due to the nature of the planting area cavities, whereby the upper tyre-sidewall effectively acts as a barrier to water losses from the growing medium within;
The pyramid shape allows for the optimal utilization of solar radiation by virtue of the fact that light is able to reach plants at various levels that would not be possible on a flat surface;
The pyramid shape provides for a high radiation sunny-side growing area and a slightly shaded, leeward to the sun growing area, allowing for different types of vegetables and food crops that are either sun-loving or not to be planted on such a structure;
The elevated planting of crops at different levels allows for a multitude of different crops to be planted at different appropriate levels depending on their growing habit;
The elevated nature of the growing structure allows for optimal air movement to occur around crops planted, thereby reducing the likelihood of fungal disease infections.
It is recommended that this trial be monitored for a full two seasons using soil moisture and temperature measuring equipment in order to correlate yield and rainfall data to better inform the effectiveness of the structure.
6.4.1 Closing remarks on water harvesting sub-project The Luganda School water harvesting project has been successful, although further monitoring will be required to better ascertain the effectiveness of the different interventions over time. It is recommended that appointed specialists are allocated to this task for a period of two years to ensure effective monitoring and evaluation. The project has allowed for the transformation of the area from an eroded schoolground with little play area, into a clean and vegetated surface water harvesting platform, complete with grass and trees. The schoolground serves a dual purpose: children are able to play in a favourable environment, while water from harvesting practices can be used to irrigate the gardens which could, in turn, provide food for the children. Previously, water that would have actively eroded topsoil, both on and off the schoolground, is now distributed and captured in various ways that allow it to be used for productive purposes, whilst returning that which is not used to the soil profile to allow for natural sub-surface recharge. These water harvesting initiatives and tyre-pyramid garden interventions have the potential to act as practical learning examples to the learners, which may result in the dissemination of such ideas into the community.
Further harvesting capacity and, more importantly, greater storage capacity envisioned under Phase 2 and 3 would allow for a larger volume of water to be made available for the establishment of larger gardens. There is therefore potential for a more expansive and productive gardening area that will benefit both the learners

COMMUNITY-BASED ADAPTATION - DURBAN
February 2011 Report No. 11977-10286-9 112
and local community in terms of increasing the availability of fresh produce for consumption. Furthermore, additional phases would greatly enhance the learner environment at Luganda School in terms of improving aesthetics and providing safer play areas.
An opportunity exists in a school environment such as this to educate the children as to water harvesting potential and use, with the benefits of greater food security in a changing climate. These children may prove effective in terms of communicating these concepts to the greater community in a more effective manner than traditional programs targeted at the community itself.
The types of water harvesting technologies used in Phase 1 can be easily replicated at smaller and larger scales if need be, and are highly adaptable to a wide range of environments. It would therefore be possible to roll-out these approaches in schools and homesteads throughout Kwazulu-Natal and potentially South Africa.

COMMUNITY-BASED ADAPTATION - DURBAN
February 2011 Report No. 11977-10286-9 113
7.0 FINAL CONCLUSIONS This community-based adaptation project has proved to be an extremely varied and rewarding project for the communities involved, the project team, as well as the municipal role-players concerned. In addition to the large amount of information and interaction generated through the project, it has further highlighted key social problems which constitute inherent limitations to effective adaptation to climate change in the municipality’s communities.
Taking social factors into account is crucial to the implementation of adaptation strategies. Until these social factors are overcome, community-based adaptation is likely to be extremely difficult to implement. The social issues that communities face are perceived as being more pressing, with a greater impact on survival than issues such as climate change (notwithstanding the interlinked nature of environmental and social issues), and until there is a fundamental shift in the social fabric of these communities, it is likely that climate change as a distinct concern will remain largely unimportant from their point of view.
Adaptation in these communities should imply the development and implementation of a long-term programme that seeks to radically shift the current social order, one that focuses on building unity and cohesion, improving education and skills, building inter-independence and personal relationships, and increasing notions of ambition and social responsibility. Such a programme would take time, require human and financial resources and need to be directed at the fine fabric level of the communities, but could have immeasurably positive results. This project has already illustrated the encouraging results that can be seen through working with farming communities, including the lively women involved in the cook-offs, as well as the difference which can be made to an educational community such as Luganda School.
The exciting results and recommendations from this project towards improved food security through differential crop selection and shifting of agricultural practices, adaptation planning and water harvesting, will serve to inform the municipality, spread knowledge and continue various initiatives towards creating community resilience in the face of an uncertain climate.
8.0 REFERENCES Bell FG and Maud RR (1996) Examples of landslides associated with the Natal Group and
Pietermaritzburg formation in the greater Durban area of Natal, South Africa. Bulletin of Engineering Geology and the Environment, Volume 53, Number 1, pp 11-20
Brink ABA (1981) Engineering Geology of Southern Africa. Building Publications. Silverton, South Africa. Volumes 2 and 3.
Camp KGT (1995) The BioResource Units of KwaZulu-Natal. Cedara Report N/A/95/32.
Creative Research Systems (CRS) (2009) The Survey System, www.surveysystem.com/sscalc.htm. Accessed 23 March 2009.
Food and Agricultural Organisation (FAO) (2007) The Community’s Toolbox: The Ideas, Methods and Tool for Participatory Development. Corporate Document Repository. www.fao.org. Accessed 12 July 2007.
Golder Associates (2010) Final Report: eThekwini Municipality Integrated Assessment Tool for Climate Change. Golder Associates Report Number 10290-9743-13, October 2010.
Lohr S (1999) Sampling: Design and Analysis. Duxbury Press
Mucina L & Rutherford MC (eds) (2006) The Vegetation of South Africa, Lesotho and Swaziland. Strelitzia 19. South African National Biodiversity Institute, Pretoria.
Mudhara M, Shoko T (2004) A Handbook of PRA Techniques. Training Manual developed for CRS, World Vision International and CARE, July 2004.
COMMUNITY-BASED ADAPTATION - DURBAN
February 2011 Report No. 11977-10286-9 114
Prinz, D. (2001). Water harvesting for afforestation in dry areas. Hydrolic and Rural Engineering. Karlsruhe, German: Institute of Water Resource Management.
Public Health Engineering Department, Meghalaya (PHEDM). (Undated). Rain Water Harvesting Manual. Retrieved July 23, 2009, from Public Health Engineering Department, Meghalaya: http://megphed.gov.in/knowledge/resolution.htm
Skelton D (2000) Real World “Messes”: Possibilities for Teaching IT through a Soft Systems Viewpoint. Eastern Institute of Technology, New Zealand, NACCQ. www.naccq.ac.nz. Accessed 12 July 2007.
Smith B (2006) The Farming Handbook. UKZN Press and CTA.
GOLDER ASSOCIATES AFRICA (PTY) LTD.
Catherine Hughes Rob Hounsome Report Co-ordinator Project Manager
CH/RH/kw/wvn
Reg. No. 2002/007104/07 Directors: FR Sutherland, AM van Niekerk, SAP Brown, L Greyling Golder, Golder Associates and the GA globe design are trademarks of Golder Associates Corporation.
g:\projects\11977_danida_cc_adapt._prog\reports\11977-10286-9_final report jan 11\11977_10286_9_v24.docx

COMMUNITY-BASED ADAPTATION - DURBAN
February 2011 Report No. 11977-10286-9 115
APPENDIX A Social Vulnerability - Survey and Results

COMMUNITY-BASED ADAPTATION - DURBAN
February 2011 Report No. 11977-10286-9 116
House No/address/ Community: ______________________Interviewers name:___________________
Date: ___________________________ Key: income: 0-800 = 1; 801-1200 = 2; 1201-5000 = 3; 5001 and more = 4 Age: <5yr=1; 5-12= 2; 13-18= 3; 19-35= 4, 35-60= 5, <60=6 Grants: Disability grant = 1; child grant = 2, health grant = 3 Education: no schooling = 1, primary school = 2, high school = 3; tertiary = 4
1. HOUSEHOLD INFORMATION How many members are in your household?
Household member (Please answer for each household member below)
1 (head) 2 3 4 5 6 7
Age (yrs) (refer to key below)
Highest level of education attained (refer to key)
Gender Employment status (Please tick the relevant box for each household member)
Self-employed Employee Pensioner Unemployed Scholar Infant How much is your monthly income? (refer to key below)
Who is your employer?
If you are not employed, do you receive a pension or social grant?
Yes No
Yes No
Yes No
Yes No
Yes No
Yes No
Yes No
If yes, which do you receive?
Pension Grant
Pension Grant
Pension Grant
Pension Grant
Pension Grant
Pension Grant
Pension Grant
Which grant (refer to key below)?

COMMUNITY-BASED ADAPTATION - DURBAN
February 2011 Report No. 11977-10286-9 117
2. STAKEHOLDER INFORMATION How long have you lived in Amaoti?
Are there community leaders in Amaoti? Yes No I don’t know
Who are these leaders?
Do you think they are effective?
Yes No
Do you know the Councilor for your area? Yes No
Do you think s/he is accessible? Yes No
Do you think the Municipality is involved in the community and addressing the needs of the people?
Yes No
Comments:
Do community members co-operate and work well together on community activities?
Yes No
3. FOOD SECURITY
Do you produce your own food? Yes No
If yes, what kind of food do you produce?
Have you noticed any of the following changes? If yes, mark the box with an X. Changes in the soil Changes in rainfall patterns
Changes in the amount of produce Increase in diseases
Increase in pests Increase in temperature
Comments: Have you made any of the following changes to your food production?
Changed planting season Changed crop variety Changed livestock Other: How have these changes impacted you? For example, there are improved yields?

COMMUNITY-BASED ADAPTATION - DURBAN
February 2011 Report No. 11977-10286-9 118
4. SOCIAL INFORMATION
Do you belong to any social groups? If so, which ones?
Where does your community group meet, how often and when?
Do you think the community is united? Are you friendly to each other?
What development would you most like to see in the community? Rank the following options 1 – 6, with 1 being the most important.
Roads Communication services
Water services Electricity
Health and sanitation Education Comments:
How far away is nearest clinic/hospital?
Is it easy to get to the clinic/ hospital?
Are you happy with the service provided?
How far away is the nearest school, crèches, or educational facility?
Is it easy to get there?
Are you happy with the service provided?
Are you a part of a religious group?
Yes No
What are the household interests?
Sport Politics
Music Drama
Other:

COMMUNITY-BASED ADAPTATION - DURBAN
February 2011 Report No. 11977-10286-9 119
Comments and observations:
_____________________________________________________________________________________________________________________________________________________________________________________________________________________________________________________________________________________________________________________________________________________________________________________________________________________________________________________________________________________________________________________________________________________________________________________________________________________________________________________________________________________________________________________________________________________________________________________________
5. WASTE AND WATER
Do you have running water in your household?
Yes No
If you do not have running water, where do you get your water from?
Do you use the same water source for your drinking water and your household water?
Yes No
Have you noticed any changes in the water supply or the condition of the water?
Have you noticed any changes in your health because of your water?
What type of toilet do you have?
Flush Long-drop Other:
How do you dispose of your household waste?
Has this changed over the past 5 years?
Are there any waste disposal sites near your house?
Yes No
Have you noticed any changes with the waste sites, e.g. increased size or smell?
Have you noticed an increase in pests such as rats, flies or mosquitoes in your area?
Yes No
If yes, has any action been taken against these pests?

COMMUNITY-BASED ADAPTATION - DURBAN
February 2011 Report No. 11977-10286-9 120
Comments and observations:
____________________________________________________________________________________________________________________________________________________________________________________________________________________________________________________________________________________________________________________________________________________
6. INFRASTRUCTURAL INFORMATION
Do you have electricity?
Yes No
How is your electricity bill paid?
Meter Prepaid
Do you have alternative/additional source of energy?
Firewood Solar system
What kind of house do you live in? What is it made from?
What kind of transport do you use?
Taxi Bus
Own car Other:
How often do you use it?
On average, how much money do you spend on transport monthly?
Less than R100 R101 – R250
R260 – R500 R501+
7. COMMUNICATION
What communication devices do you have in your household?
Radio TV
Other:
Is anyone in the household interested in music, dance or drama?
Has anyone been involved in any of these?
Do you think using the drama is a good way to communicate?

COMMUNITY-BASED ADAPTATION - DURBAN
February 2011 Report No. 11977-10286-9 121
Comments and observations:
_________________________________________________________________________________________________________________________________________________________________________________________________________________________________________________________________________________________________________________________________________________________________________________________________________________________________________
8. CHANGES IN THE ENVIRONMENT
Have you noticed any weather changes over the last 5 years, e.g. rainfall, temperature, storms, etc?
If yes, have these changes affected you in any way?
What actions have you taken to reduce the effect that these changes?
Have you noticed any changes in the general environment (to the soil, trees, grass, etc)?
Have you noticed any changes in the river or water sources?
What impact would change in water patterns or sources have for you?
What strategies can/do you put in place to protect yourself from these changes?
Have droughts become more common in your area?
Yes No I don’t know
Comment:
Have floods become more common in your area?
Yes No I don’t know
Comment:
Has the severity of these droughts changed?
Yes No I don’t know
Has the severity of these floods changed?
Yes No I don’t know

COMMUNITY-BASED ADAPTATION - DURBAN
February 2011 Report No. 11977-10286-9 122
DISCUSSION: NTUZUMA AND SHONGWENI The average number of members per household was 5.07. The modal members per household were 3, 4, and 5 members. The modal age group was 19-35 years (29.3%) followed by 35-60 years (20.8%). There were slightly more females than males per household i.e. 48.7% males and 51.3% females. The sample also indicated that 30% of the respondents had primary schooling and 43.5% had a high school education. The modal employment status was 27% scholar followed by 14.9% pensioners and 24% was unemployed. 40.5% of the respondents earned R801-R1200 followed by 30.1% who earned R1201-R5000.. Of those that did receive some kind of grant, 65.2% of them received a social grant and 34.8% received a pension. The modal type of grant was the child grant (74.5%).
The average number of years respondents lived in Ntuzuma and Shongweni was 16.75 yrs. 92% of the respondents agreed that there are community leaders whilst 62.9% thought the community leaders were effective. A majority 82.4% of the respondents knew the councillor in the area whilst 72.4% thought that the councillor was accessible. 69.7% of the respondents agreed that the Municipality is involved in the community and addressing the needs of the people whilst 69.4% agreed that community members co-operate and work well together on community activities.
A modal 57.6% of the respondents disagreed that the produce their own food whilst the modal food that was produced was general vegetables (59.9%). 26% and 23.9% have noticed Changes in rainfall patterns and Increase in temperature. As a result, 51% have made changes to their crop variety and 39.2% have changed their planting season.
69.1% and 30.9% of the respondents stated “no” and “yes” to whether or not they belonged to any social groups. 87% though that the community is united whilst 86.1% of them though that the community are friendly to each other. The modal development that the community would like to see was roads and communication services. 63.2% of the respondents felt that it was easy to get to the clinic/hospital and 56.5% of them are happy with the service provided. 43.5% disagreed with this. As far as the school/educational facility is concerned, 96.5% felt that it is easy to get there and 93.4% are happy with the services provided. 66.8% are members of a religious group whilst 47.4% and 27% of the respondents indicated music and sports as household interests. The average amount of time taken to get to a health institution/clinic and a educational institution/school is 50.7 minutes and 26.13 minutes.
A majority of 50.7% of the respondents does have running water and 91.1% of the respondents used the same source for their drinking water and your household water. 57.4% of the respondents have not noticed any changes in the water supply or the condition of the water. 96.6% have not noticed any changes in their health because of their water. 63.5% of the respondents have a long drop toilet and 72.1% indicated that this has not changed in the last 5 years. 11.4% indicated that there are waste disposal sites near their houses and 87.3% have not noticed changes with the waste sites. 44.5% have noticed an increase in pests such as rats, flies or mosquitoes in their area. Only 20.8% agreed that action has been taken against these pests.
A vast 95.9% of the respondents indicated that they do have electricity and 87.4% pay their electricity bill through the prepaid system. The only alternative/additional source of energy was firewood (63.6%) and solar system (23.1%). The modal type of transport was taxi (62.6%) followed by bus (31.2%). The average monthly transport cost was “R260-R500” (29.6%) followed by “<R100” (29.6%). The modal communication devices do respondents have in their household was radio (56.6%) followed by TV(43.3%). 58% of the respondents are interested in music, dance or drama whilst 16.1% have been involved in these areas. 83.4% of the respondents felt that the drama is a good way to communicate.
Almost half the sample i.e. 58.5% of the sample have noticed any weather changes over the last 5 years, e.g. rainfall, temperature, storms, etc. and 47.2% of the respondents felt that these changes have affected them in some way. Only 33.8% have noticed changes in the general environment (to the soil, trees, grass, etc) and 13.6% have noticed changes in the river or water sources. 28.1% felt that droughts had become more common in their area and 18.9% felt that floods have become more common their area. 40.9% felt that the severity of the droughts had not changed and 48% just don’t know whilst 39.4% felt that the severity of the floods had not changed and 46.5% are unsure/don’t know.

COMMUNITY-BASED ADAPTATION - DURBAN
February 2011 Report No. 11977-10286-9 123
Table 1: Community Group Contacts – Ntuzuma Community Group Contact Person Contact Number
Farming Groups
Bojwana Club Sbongile Mabaso: Ashwill 076-141-2357 Buhlebezwe T Dimba 072-409-5086 Siya Shikwasa Cebile Ngcina 079-224-0100
Phezukomkhono Mrs T Khanyile 031-509-4975 083-341-1230
Aqophomlando Lihle 072-471-8684 Ntuzuma Co-Op Paulos Gwala10 072-539-5272
Home based Health Care Groups
Isolomusa SD Makhoba 083-714-9353 Uthando Kholeka 079-321-0363 Good News Mrs Cele 072-796-6954 Bambanani Mrs Maphumulo 072-489-8070 Bambithuba Nelly Ngema 082-474-4777
Women’s Empowerment Groups
Women’s Empowerment, Beadwork Thabisile 072-835-6835
Women Empowerment Queen Zulu (Sec) Thobile Mbongwa
079-599-7949 079-266-4708
Beadwork Joyce 076-915-2625
Support Groups
Vukuzakhe Phumzile Zondo 071-330-7011 Thandolude Organisation Nonhlanhla Nxumalo 079-455-4688 Ntuzuma Community Resource Centre Thembinkosi Maseko 079-383-9237
Table 2: Community Group Contacts - Ntshongweni Community Group Contact Person Contact Number
Health Groups
HIV/AIDS Support group Nondumiso Msimango 079-185-6279
Onompilo Community Health Workers
Farming Groups
Ubuhle Buyeza Farming Cecilia Gwala 083-464-4214
Sizanani Club Ayanda Mkhungo 083-768-0439
Zimelane Garden Group Magaba Garden Group Ezakiweni Agricultural Project
Support Groups Lindi’s Creation (beadwork) Masifundisa Literacy Project Nondumiso Msimango 079-185-6279
10 The community groups in Ntuzuma are strong and will provide a good basis for interventions. Paulos Gwala is a good contact for organising these groups and eliciting their participation.

COMMUNITY-BASED ADAPTATION - DURBAN
February 2011 Report No. 11977-10286-9 124
APPENDIX B Social Vulnerability - Stakeholder Analysis, Ntshongweni

COMMUNITY-BASED ADAPTATION - DURBAN
February 2011 Report No. 11977-10286-9 125
ANC
Churches
Taxi Association
Local Businesses
Teachers
Ntshongweni
Councilors
Private property owners
Stokvels
Burial groups
Community Groups
COMMUNITY-BASED ADAPTATION - DURBAN
February 2011 Report No. 11977-10286-9 126
APPENDIX C Focus Group Discussions

COMMUNITY-BASED ADAPTATION - DURBAN
February 2011 Report No. 11977-10286-9 127
Livelihoods Analysis of Farming Groups - Ntuzuma
Ntuzuma Co-op Sinoluthando uBuhle Bezwe Ngqophamlando Sinqobile
Group Description
• 30 members • Remove alien plant species • Nearby river as water source • 1 hectare of land • Food produced is taken to
the market
• 10 members • Crop production • Irrigate using river • Sell produce in
neighbourhoods • Use of kraal manure
• 5 members • Crop production • Sell to market • Profits invested
back
• 6 members • Crop production • Water from river • Sell locally • Monkeys and
livestock are a challenge
• Crop production • Use kraal manure • Sell at the market • Seeds are from Grovida • Fairly new
Social Networks
• Connection with Parks and the Department of Agriculture
• Dumehlezi High School principal
• Ward committee and councillor
• Community Groups
• Department of Agriculture
• Department of Health
• Councillor
• School Principal • Councillor
• Department of Agriculture
• Parks • Social workers and
neighbours
• Department of Agriculture • Councillor • Community groups
Income and expense
Income • Governing body • Sale of goods in schools • Garden produce sales • Pensions and grants Expenses • Foods • Clothing • School fees • Health expenses
Income: • Government grants Expenses • School fees • Clothing • Funeral schemes • Municipal rates • Water and electricity • Transport
Income • Pension • Garden Expenses • Stokvel • Food • Water and
electricity • Transport • Funeral scheme
Income • Pension • Market Expenses • Stokvel • Clothes • Rates and water • School fees • Food and transport • Funeral schemes
Income • Pensions Expenses • Transport • Clothes • Food • Electricity and water • Education • Municipal rates
Water and Climate change
• Main source - rainwater • Early 1980’s water was
collected from rivers • Late 1990’s rain water
collected in tanks • In 2000 piped water was
introduced
• More water in 2000 • Less water in 2008
and poor quality • Water is stored in
tanks – rainwater harvesting
• There was more water in 2001
• 2007 water became contaminated
• Water is collected in tanks
• In 1990 there was more water and it was clean
• Since early 2000 the water is milky
• Water is stored in tanks for washing
• There is a shortage of water • The water has become
expensive and contaminated
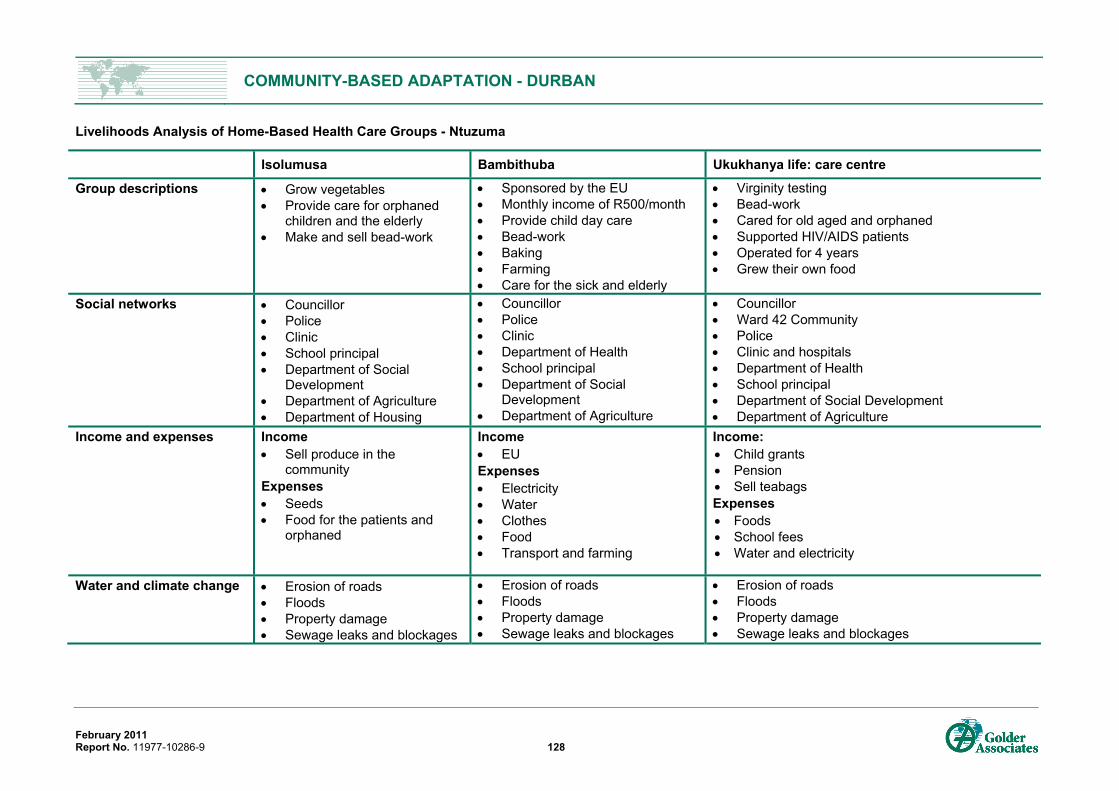
COMMUNITY-BASED ADAPTATION - DURBAN
February 2011 Report No. 11977-10286-9 128
Livelihoods Analysis of Home-Based Health Care Groups - Ntuzuma
Isolumusa Bambithuba Ukukhanya life: care centre
Group descriptions • Grow vegetables • Provide care for orphaned
children and the elderly • Make and sell bead-work
• Sponsored by the EU • Monthly income of R500/month • Provide child day care • Bead-work • Baking • Farming • Care for the sick and elderly
• Virginity testing • Bead-work • Cared for old aged and orphaned • Supported HIV/AIDS patients • Operated for 4 years • Grew their own food
Social networks • Councillor • Police • Clinic • School principal • Department of Social
Development • Department of Agriculture • Department of Housing
• Councillor • Police • Clinic • Department of Health • School principal • Department of Social
Development • Department of Agriculture
• Councillor • Ward 42 Community • Police • Clinic and hospitals • Department of Health • School principal • Department of Social Development • Department of Agriculture
Income and expenses Income • Sell produce in the
community Expenses • Seeds • Food for the patients and
orphaned
Income • EU Expenses • Electricity • Water • Clothes • Food • Transport and farming
Income: • Child grants • Pension • Sell teabags Expenses • Foods • School fees • Water and electricity
Water and climate change • Erosion of roads • Floods • Property damage • Sewage leaks and blockages
• Erosion of roads • Floods • Property damage • Sewage leaks and blockages
• Erosion of roads • Floods • Property damage • Sewage leaks and blockages

COMMUNITY-BASED ADAPTATION - DURBAN
February 2011 Report No. 11977-10286-9 129
Livelihoods Analysis of Support Groups - Ntuzuma
Mkhasela women empowerment Vukuzakhe organisation Kukhanya Life care Centre
Group description • Women empowerment • Food garden • Home-based care
• HIV/AIDS support group • Home-based care • Food gardens
• HIV/AIDS and Diabetes support group • Four years in operation
Social networks
• Councillor • Ward committee • Parks • Agriculture • Schools
• Department of Health • Councillor • Social worker • Church • Extension workers • Development committees
• Department of Health • Government • Johnsons Ambulance
Income and expenses
• Government grants • Sale from produce Expenses • Electricity • School fees • Clothes • Transport • Medical expenses • Food
Income • Child support grant • Sold produce Expenses • Groceries • Water and electricity • Transport • Clothing • Funeral schemes • Medical expenses
Income • Government grants • Wages Expenses • School fees • Electricity and water • Clothing • Food
Water and climate change
• Rainwater • Piped water
• Water far from garden • Piped water • Portable water • Natural disasters (floods)
• Food parcels • Blankets • Shelter

COMMUNITY-BASED ADAPTATION - DURBAN
February 2011 Report No. 11977-10286-9 130
Farming groups livelihoods analysis - Ntshongweni
Ubuhlebuyeza Farmers Group
Magaba Vegetable Garden Zimeleni Garden Group Zakhiweni Agricultural Projects
Group description
• Established in 2005 • Seven members • Has both males and
females • Growing dry foods
(vegetables) o Sweet potatoes o Amadumbe
• Organic producers • Use cow dung
• 15 years old • Eight members • Vegetable production
o Cabbage o Onion o Spinach
• Access to extension officer
• Fenced
• Eight members • Dominated by females • All not employed • Crop production
o Cabbages o Spinach o Beetroot o Maize
• Access to extension officer
• Use water cans to transport water from tank to field
• Use cow and chicken dung
• Crop production o Cabbages o Spinach o Potatoes o Pumpkins
• Have a dam
Social networks
• Community • Training sessions in
Cliffdale
• Ntshongweni Farmers Association
• Department of Agriculture
• Extension worker • Social workers • Local municipality • Councillor
• Burial societies • Stokvels • Councillor
• Agricultural meetings in Cliffdale • Ntshongweni Farmers Association • Bank • Facilitators • Department of Education
Income • Supply to Woolworths Foods
• Sale of produce to the community
• 70% produce sold in the community
• Pension
• Sale of produce • Sale of produce in Pinetown and Pietermaritzburg
Water and Climate change
• River nearby • Use grey water • Use of tanks for irrigation • Vertiver grass to reduce
• Two taps in the garden (free water)
• Tap water used for laundry and drinking
• Water tank • Rain water • Nearby dam(silting) • Tap water

COMMUNITY-BASED ADAPTATION - DURBAN
February 2011 Report No. 11977-10286-9 131
water speed and erosion
Expenses • Transport to meetings • Purchasing of seeds • Household expenses
• Transportation of produce • Garden inputs
o Fertilizer o Seeds
• Household expenses o School fees o Transport o Groceries
• Association membership Challenges • Far from the project
• Fields are huge for manual labour
• Tractor is preferable • Lack of equipment • Lack of market • Pest • Livestock • Fencing

COMMUNITY-BASED ADAPTATION - DURBAN
February 2011 Report No. 11977-10286-9 132
APPENDIX D Background Information Document
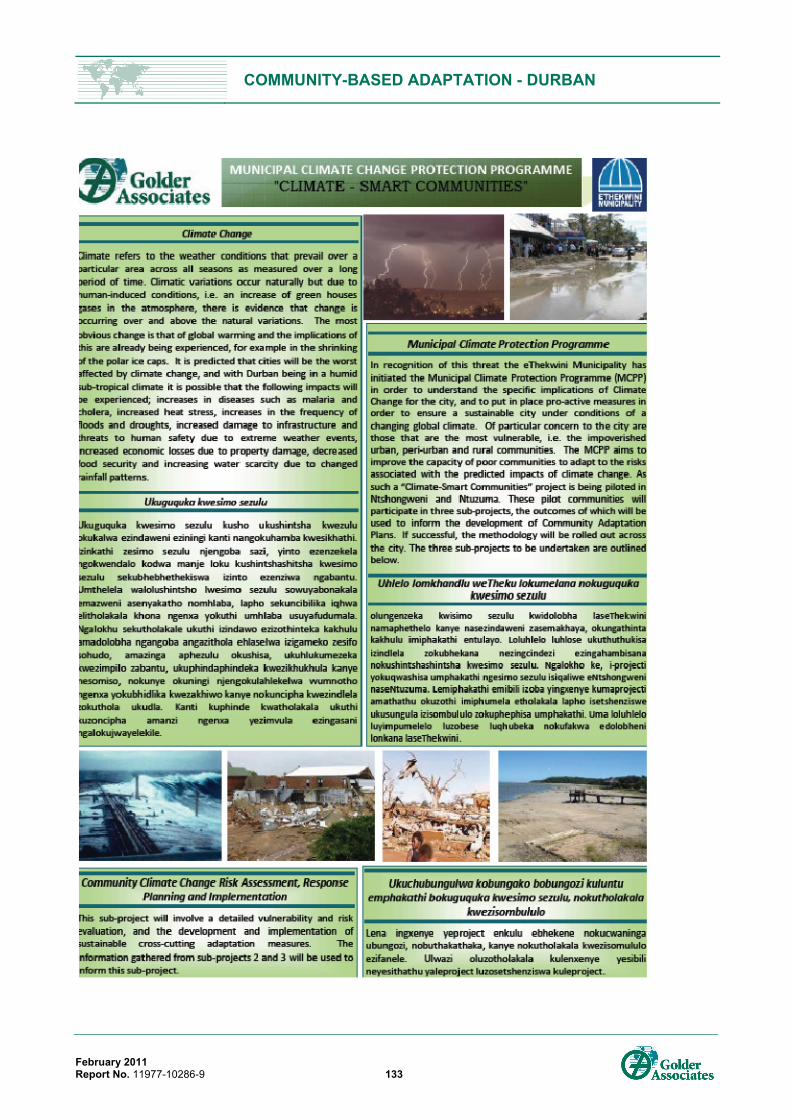
COMMUNITY-BASED ADAPTATION - DURBAN
February 2011 Report No. 11977-10286-9 133

COMMUNITY-BASED ADAPTATION - DURBAN
February 2011 Report No. 11977-10286-9 134
COMMUNITY-BASED ADAPTATION - DURBAN
February 2011 Report No. 11977-10286-9 135
APPENDIX E Drawings for Luganda School Site


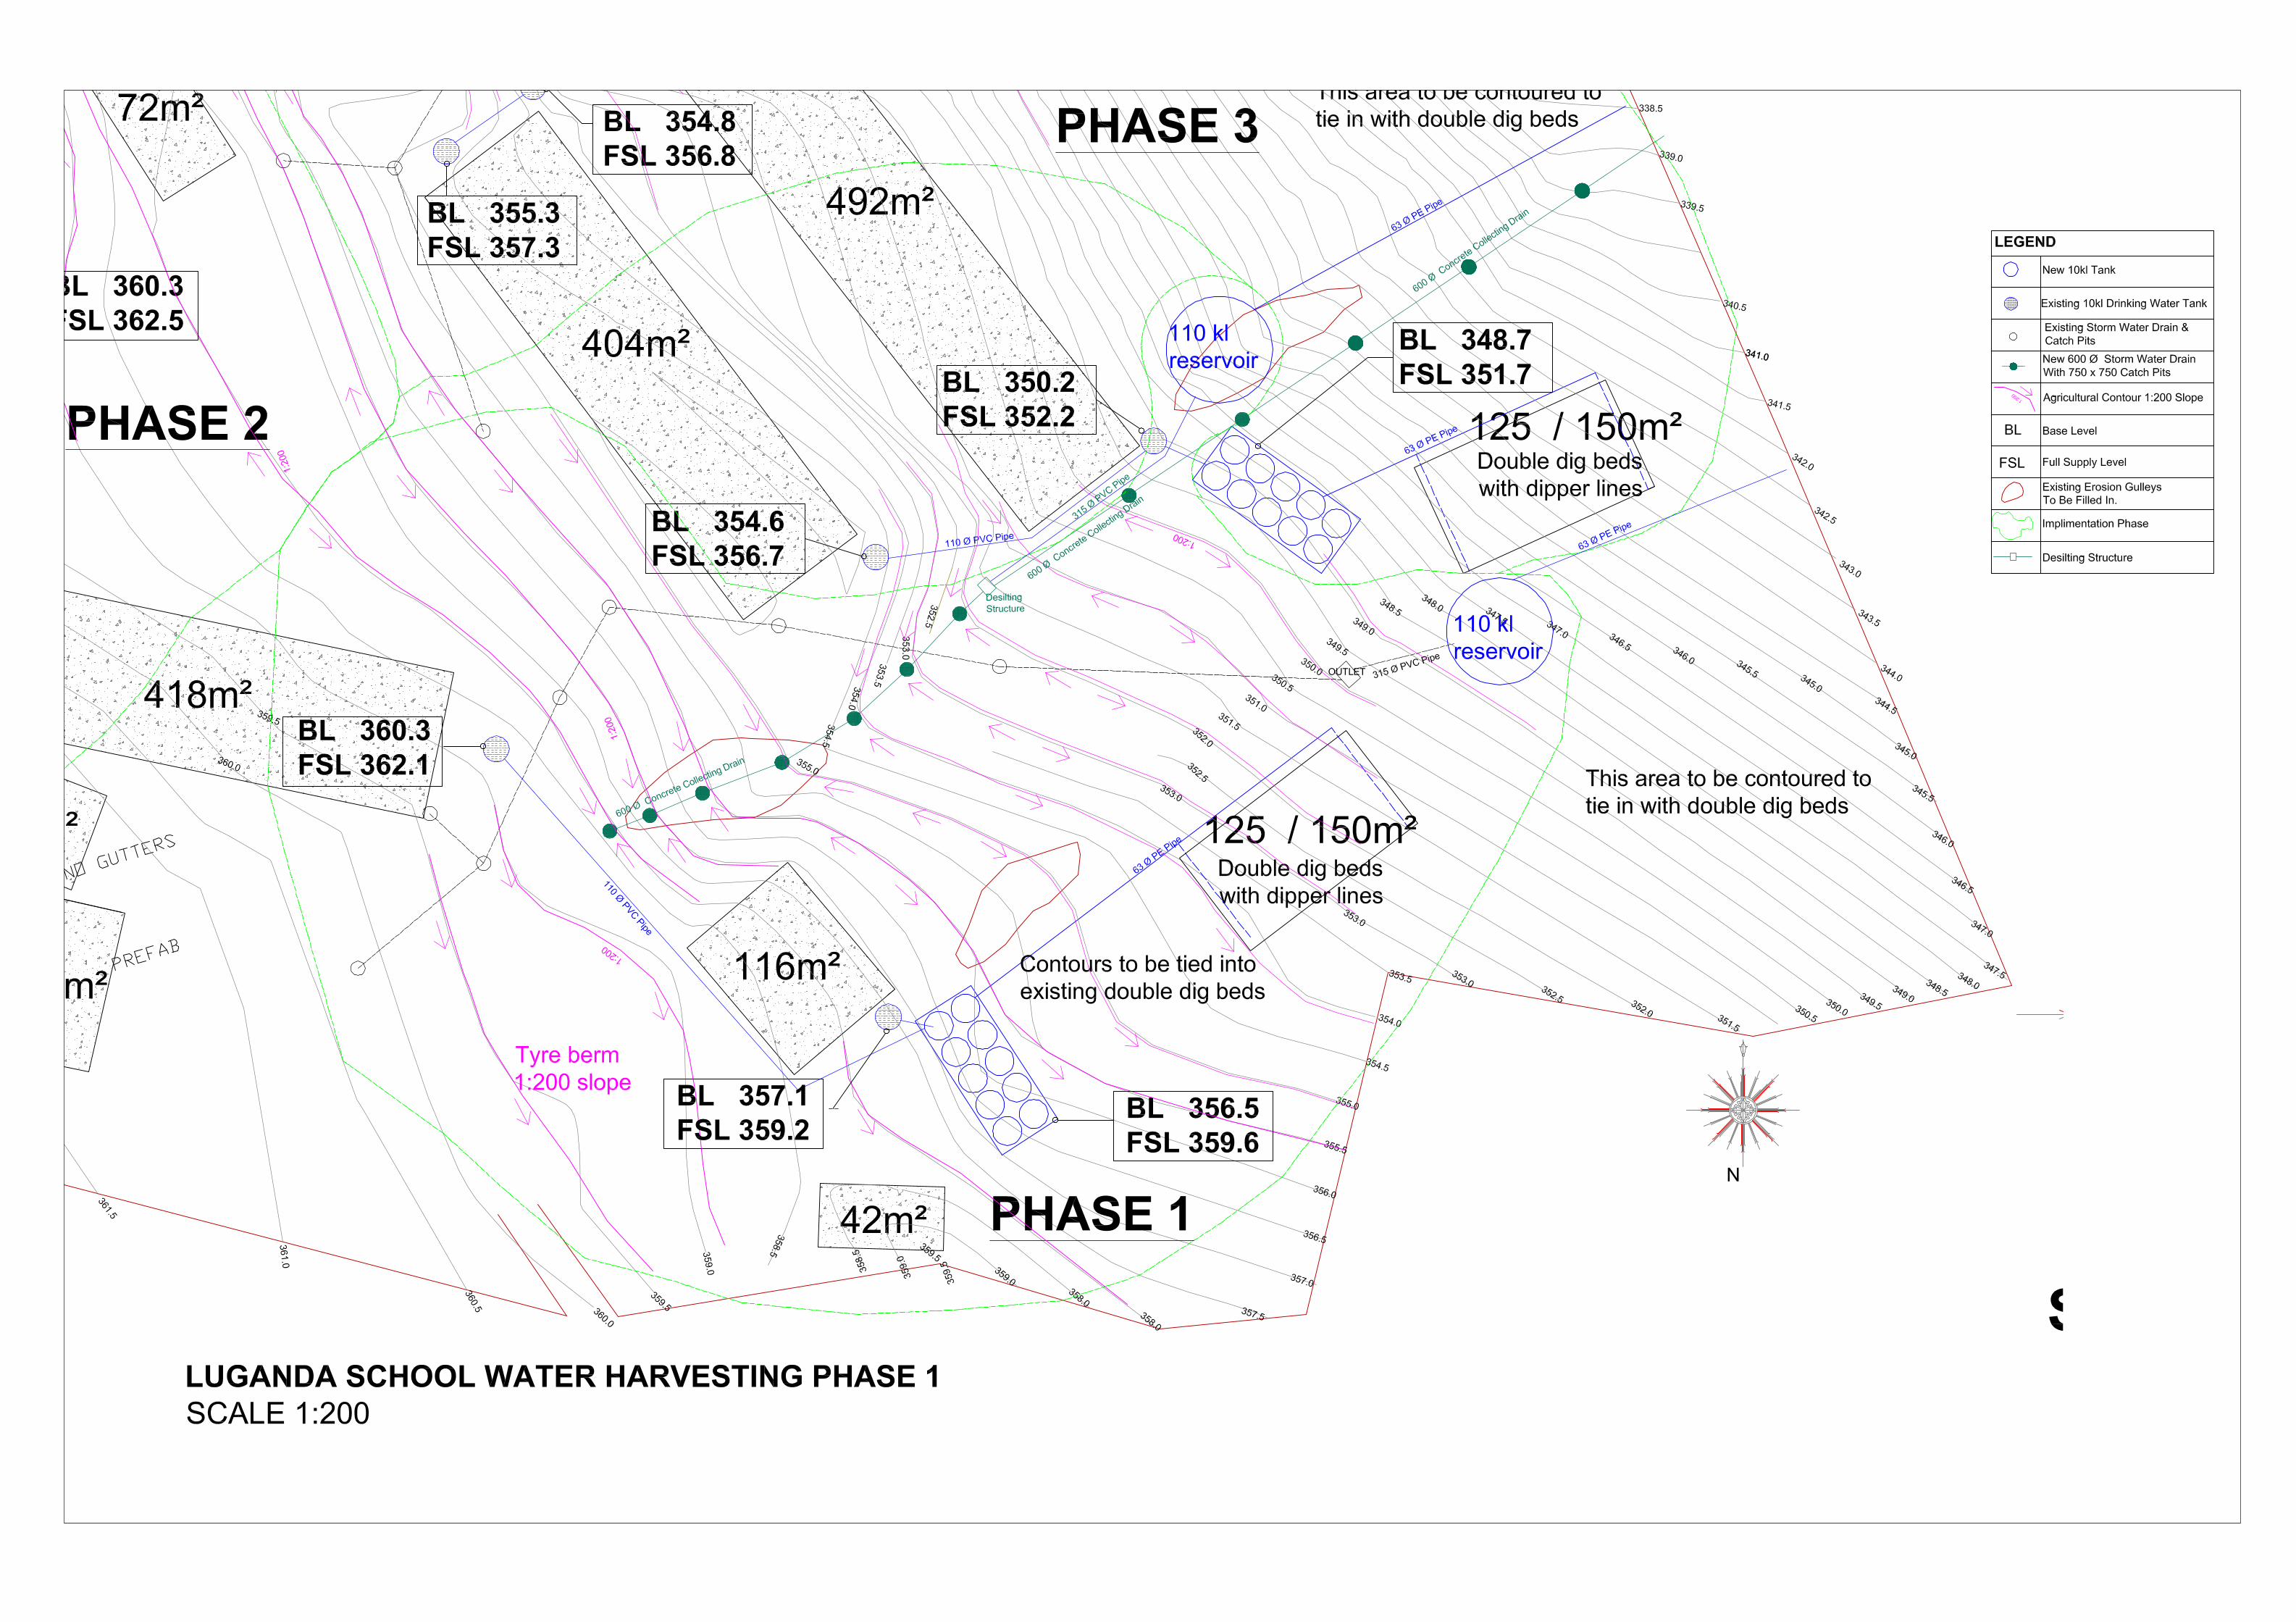


COMMUNITY-BASED ADAPTATION - DURBAN
February 2011 Report No. 11977-10286-9 136
APPENDIX F Bill of Quantities for Water Harvesting Pilot
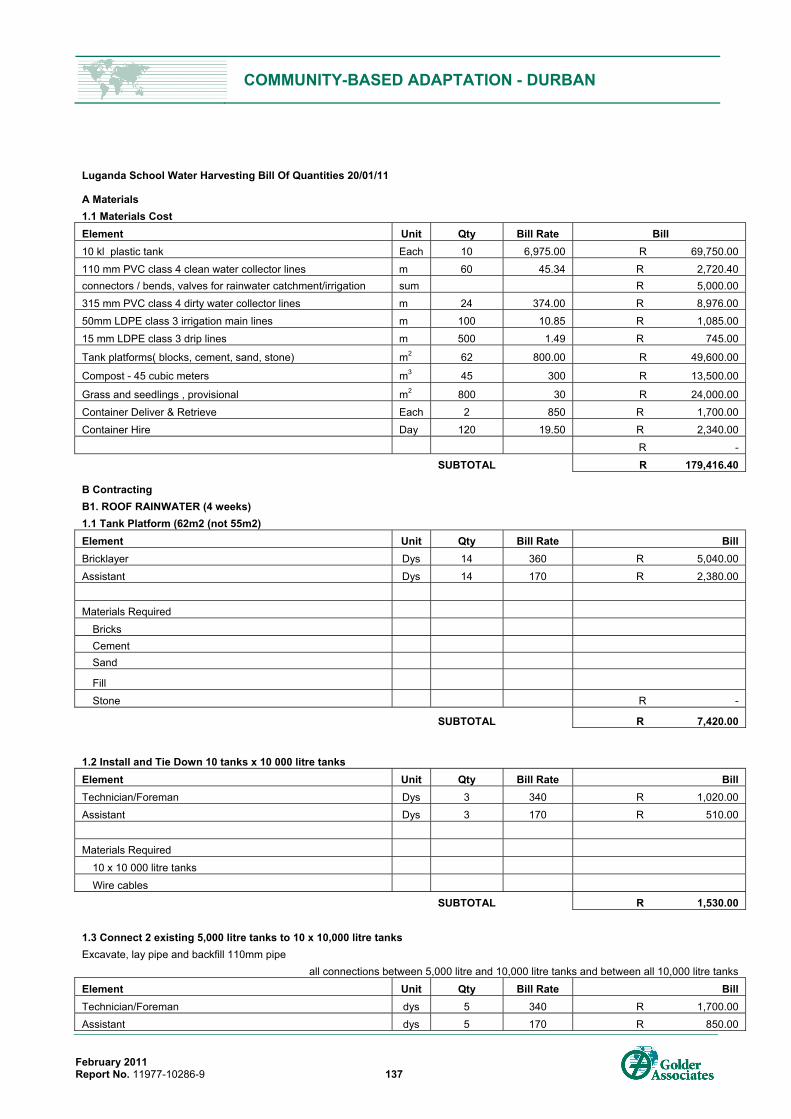
COMMUNITY-BASED ADAPTATION - DURBAN
February 2011 Report No. 11977-10286-9 137
Luganda School Water Harvesting Bill Of Quantities 20/01/11
A Materials 1.1 Materials Cost Element Unit Qty Bill Rate Bill 10 kl plastic tank Each 10 6,975.00 R 69,750.00 110 mm PVC class 4 clean water collector lines m 60 45.34 R 2,720.40 connectors / bends, valves for rainwater catchment/irrigation sum R 5,000.00 315 mm PVC class 4 dirty water collector lines m 24 374.00 R 8,976.00 50mm LDPE class 3 irrigation main lines m 100 10.85 R 1,085.00 15 mm LDPE class 3 drip lines m 500 1.49 R 745.00
Tank platforms( blocks, cement, sand, stone) m2 62 800.00 R 49,600.00
Compost - 45 cubic meters m3 45 300 R 13,500.00
Grass and seedlings , provisional m2 800 30 R 24,000.00 Container Deliver & Retrieve Each 2 850 R 1,700.00 Container Hire Day 120 19.50 R 2,340.00 R -
SUBTOTAL R 179,416.40
B Contracting B1. ROOF RAINWATER (4 weeks) 1.1 Tank Platform (62m2 (not 55m2) Element Unit Qty Bill Rate Bill Bricklayer Dys 14 360 R 5,040.00 Assistant Dys 14 170 R 2,380.00 Materials Required
Bricks Cement Sand
Fill Stone R -
SUBTOTAL R 7,420.00
1.2 Install and Tie Down 10 tanks x 10 000 litre tanks Element Unit Qty Bill Rate Bill Technician/Foreman Dys 3 340 R 1,020.00 Assistant Dys 3 170 R 510.00 Materials Required
10 x 10 000 litre tanks Wire cables
SUBTOTAL R 1,530.00
1.3 Connect 2 existing 5,000 litre tanks to 10 x 10,000 litre tanks Excavate, lay pipe and backfill 110mm pipe
all connections between 5,000 litre and 10,000 litre tanks and between all 10,000 litre tanks Element Unit Qty Bill Rate Bill Technician/Foreman dys 5 340 R 1,700.00 Assistant dys 5 170 R 850.00
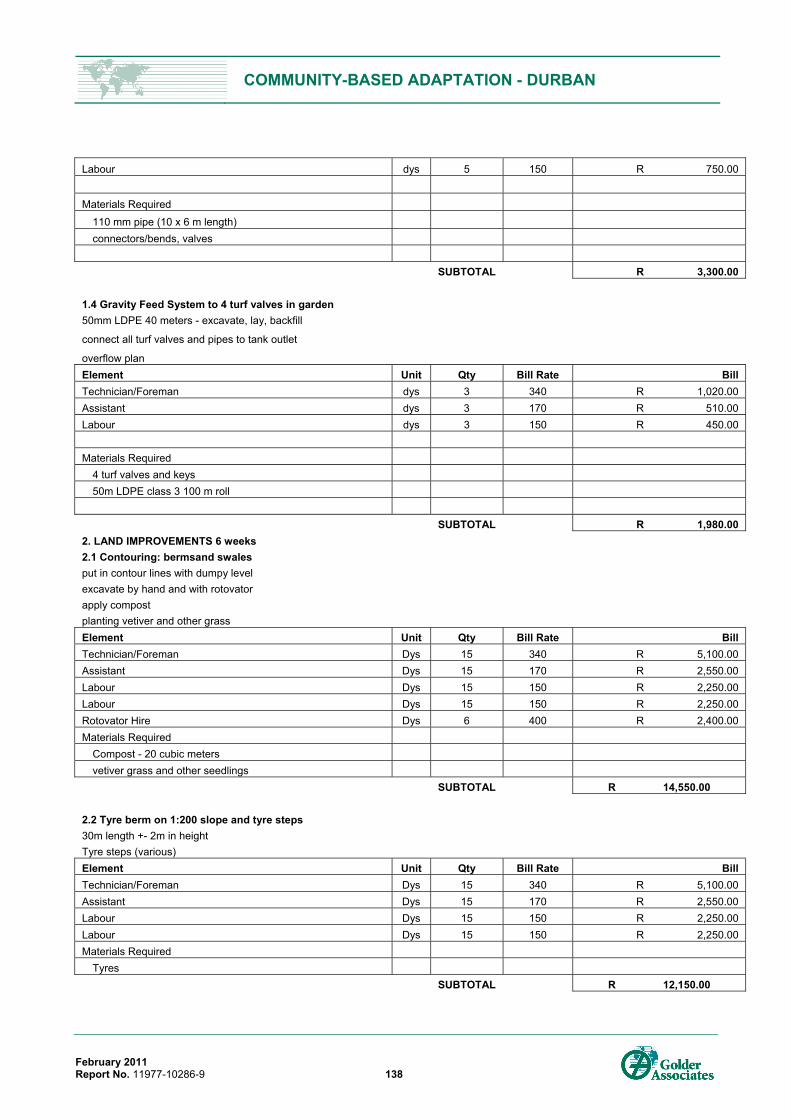
COMMUNITY-BASED ADAPTATION - DURBAN
February 2011 Report No. 11977-10286-9 138
Labour dys 5 150 R 750.00 Materials Required
110 mm pipe (10 x 6 m length) connectors/bends, valves
SUBTOTAL R 3,300.00
1.4 Gravity Feed System to 4 turf valves in garden 50mm LDPE 40 meters - excavate, lay, backfill
connect all turf valves and pipes to tank outlet
overflow plan Element Unit Qty Bill Rate Bill Technician/Foreman dys 3 340 R 1,020.00 Assistant dys 3 170 R 510.00 Labour dys 3 150 R 450.00 Materials Required
4 turf valves and keys 50m LDPE class 3 100 m roll
SUBTOTAL R 1,980.00
2. LAND IMPROVEMENTS 6 weeks 2.1 Contouring: bermsand swales put in contour lines with dumpy level excavate by hand and with rotovator apply compost planting vetiver and other grass Element Unit Qty Bill Rate Bill Technician/Foreman Dys 15 340 R 5,100.00 Assistant Dys 15 170 R 2,550.00 Labour Dys 15 150 R 2,250.00 Labour Dys 15 150 R 2,250.00 Rotovator Hire Dys 6 400 R 2,400.00 Materials Required
Compost - 20 cubic meters vetiver grass and other seedlings
SUBTOTAL R 14,550.00
2.2 Tyre berm on 1:200 slope and tyre steps 30m length +- 2m in height Tyre steps (various) Element Unit Qty Bill Rate Bill Technician/Foreman Dys 15 340 R 5,100.00 Assistant Dys 15 170 R 2,550.00 Labour Dys 15 150 R 2,250.00 Labour Dys 15 150 R 2,250.00 Materials Required
Tyres SUBTOTAL R 12,150.00
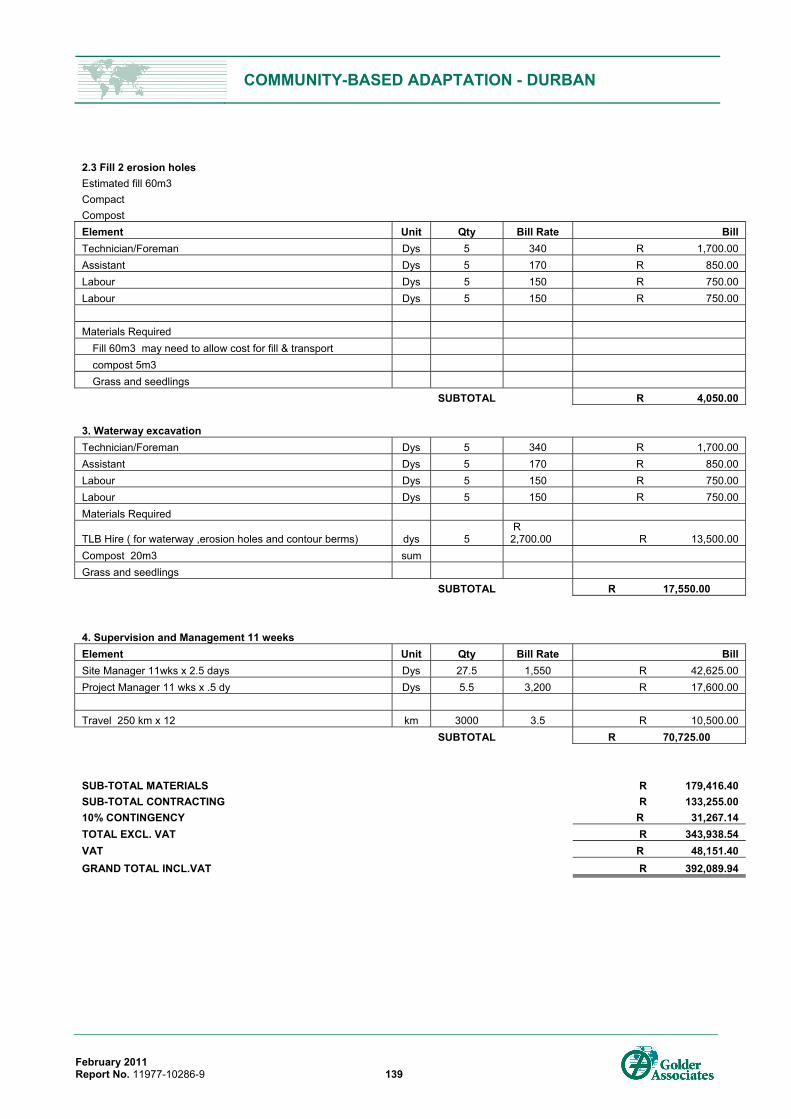
COMMUNITY-BASED ADAPTATION - DURBAN
February 2011 Report No. 11977-10286-9 139
2.3 Fill 2 erosion holes Estimated fill 60m3 Compact Compost Element Unit Qty Bill Rate Bill Technician/Foreman Dys 5 340 R 1,700.00 Assistant Dys 5 170 R 850.00 Labour Dys 5 150 R 750.00 Labour Dys 5 150 R 750.00 Materials Required
Fill 60m3 may need to allow cost for fill & transport compost 5m3 Grass and seedlings
SUBTOTAL R 4,050.00
3. Waterway excavation Technician/Foreman Dys 5 340 R 1,700.00 Assistant Dys 5 170 R 850.00 Labour Dys 5 150 R 750.00 Labour Dys 5 150 R 750.00 Materials Required
TLB Hire ( for waterway ,erosion holes and contour berms) dys 5 R 2,700.00 R 13,500.00
Compost 20m3 sum Grass and seedlings
SUBTOTAL R 17,550.00
4. Supervision and Management 11 weeks Element Unit Qty Bill Rate Bill Site Manager 11wks x 2.5 days Dys 27.5 1,550 R 42,625.00 Project Manager 11 wks x .5 dy Dys 5.5 3,200 R 17,600.00 Travel 250 km x 12 km 3000 3.5 R 10,500.00
SUBTOTAL R 70,725.00
SUB-TOTAL MATERIALS R 179,416.40 SUB-TOTAL CONTRACTING R 133,255.00 10% CONTINGENCY R 31,267.14 TOTAL EXCL. VAT R 343,938.54 VAT R 48,151.40 GRAND TOTAL INCL.VAT R 392,089.94
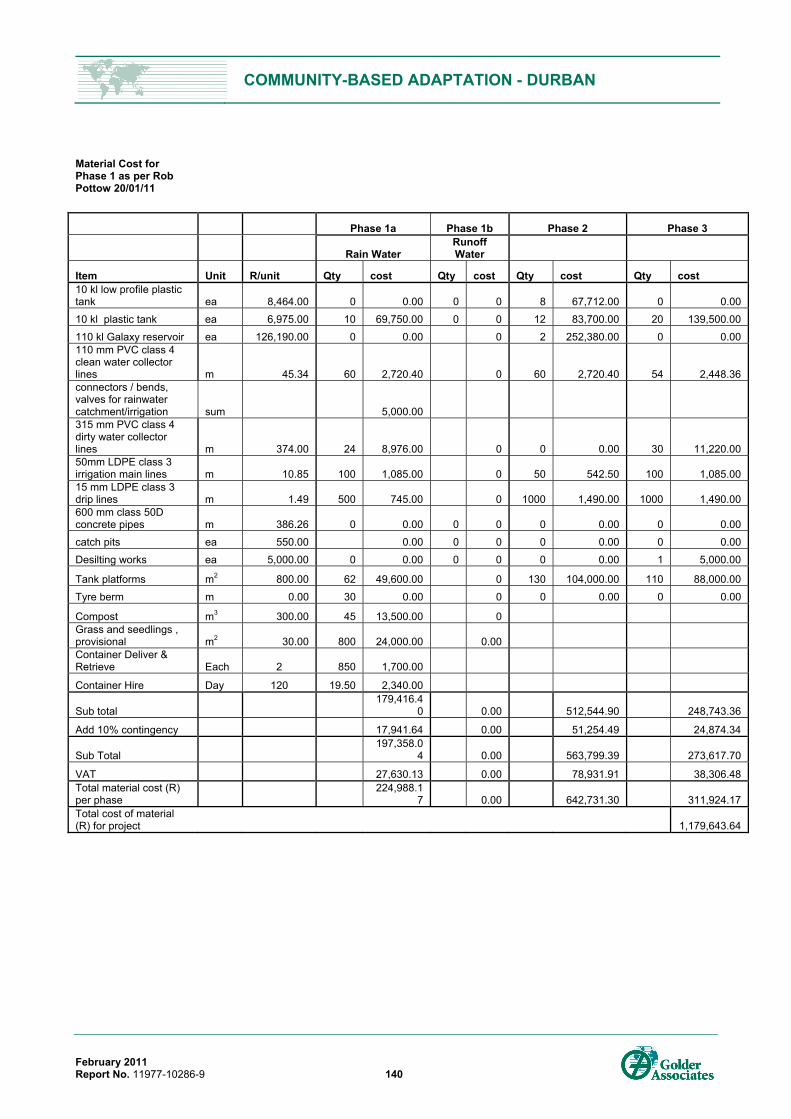
COMMUNITY-BASED ADAPTATION - DURBAN
February 2011 Report No. 11977-10286-9 140
Material Cost for Phase 1 as per Rob Pottow 20/01/11
Phase 1a Phase 1b Phase 2 Phase 3
Rain Water Runoff Water
Item Unit R/unit Qty cost Qty cost Qty cost Qty cost 10 kl low profile plastic tank ea 8,464.00 0 0.00 0 0 8 67,712.00 0 0.00 10 kl plastic tank ea 6,975.00 10 69,750.00 0 0 12 83,700.00 20 139,500.00 110 kl Galaxy reservoir ea 126,190.00 0 0.00 0 2 252,380.00 0 0.00 110 mm PVC class 4 clean water collector lines m 45.34 60 2,720.40 0 60 2,720.40 54 2,448.36 connectors / bends, valves for rainwater catchment/irrigation sum 5,000.00 315 mm PVC class 4 dirty water collector lines m 374.00 24 8,976.00 0 0 0.00 30 11,220.00 50mm LDPE class 3 irrigation main lines m 10.85 100 1,085.00 0 50 542.50 100 1,085.00 15 mm LDPE class 3 drip lines m 1.49 500 745.00 0 1000 1,490.00 1000 1,490.00 600 mm class 50D concrete pipes m 386.26 0 0.00 0 0 0 0.00 0 0.00 catch pits ea 550.00 0.00 0 0 0 0.00 0 0.00 Desilting works ea 5,000.00 0 0.00 0 0 0 0.00 1 5,000.00
Tank platforms m2 800.00 62 49,600.00 0 130 104,000.00 110 88,000.00 Tyre berm m 0.00 30 0.00 0 0 0.00 0 0.00
Compost m3 300.00 45 13,500.00 0 Grass and seedlings , provisional m2 30.00 800 24,000.00 0.00 Container Deliver & Retrieve Each 2 850 1,700.00
Container Hire Day 120 19.50 2,340.00
Sub total 179,416.4
0 0.00 512,544.90 248,743.36
Add 10% contingency 17,941.64 0.00 51,254.49 24,874.34
Sub Total 197,358.0
4 0.00 563,799.39 273,617.70
VAT 27,630.13 0.00 78,931.91 38,306.48 Total material cost (R) per phase
224,988.17 0.00 642,731.30 311,924.17
Total cost of material (R) for project 1,179,643.64

Golder Associates Africa (Pty) Ltd. Block C, Bellevue Campus 5 Bellevue Road Kloof KwaZulu Natal South Africa T: [+27] (31) 717 2790
Copyright © 2022 FDOKUMEN