A Climate Adaptation Strategy for Conservation and ...
392
United States Department of Agriculture Forest Service Pacific Northwest Research Station General Technical Report PNW-GTR-917 January 2016 A Climate Adaptation Strategy for Conservation and Management of Yellow-Cedar in Alaska Paul E. Hennon, Carol M. McKenzie, David V. D’Amore, Dustin T. Wittwer, Robin L. Mulvey, Melinda S. Lamb, Frances E. Biles, Rich C. Cronn
-
Upload
khangminh22 -
Category
Documents
-
view
1 -
download
0
Transcript of A Climate Adaptation Strategy for Conservation and ...

United States Department of Agriculture
Forest Service
Pacific Northwest Research Station
General Technical ReportPNW-GTR-917
January 2016
A Climate Adaptation Strategy for Conservation and Management of Yellow-Cedar in AlaskaPaul E. Hennon, Carol M. McKenzie, David V. D’Amore, Dustin T. Wittwer, Robin L. Mulvey, Melinda S. Lamb, Frances E. Biles, Rich C. Cronn

In accordance with Federal civil rights law and U.S. Department of Agriculture (USDA) civil rights regulations and policies, the USDA, its Agencies, offices, and employees, and institu-tions participating in or administering USDA programs are prohibited from discriminating based on race, color, national origin, religion, sex, gender identity (including gender expres-sion), sexual orientation, disability, age, marital status, family/parental status, income derived from a public assistance program, political beliefs, or reprisal or retaliation for prior civil rights activity, in any program or activity conducted or funded by USDA (not all bases apply to all programs). Remedies and complaint filing deadlines vary by program or incident.
Persons with disabilities who require alternative means of communication for program infor-mation (e.g., Braille, large print, audiotape, American Sign Language, etc.) should contact the responsible Agency or USDA’s TARGET Center at (202) 720-2600 (voice and TTY) or contact USDA through the Federal Relay Service at (800) 877-8339. Additionally, program informa-tion may be made available in languages other than English.
To file a program discrimination complaint, complete the USDA Program Discrimination Complaint Form, AD-3027, found online at http://www.ascr.usda.gov/complaint_filing_cust.html and at any USDA office or write a letter addressed to USDA and provide in the letter all of the information requested in the form. To request a copy of the complaint form, call (866) 632-9992. Submit your completed form or letter to USDA by: (1) mail: U.S. Department of Agriculture, Office of the Assistant Secretary for Civil Rights, 1400 Independence Avenue, SW, Washington, D.C. 20250-9410; (2) fax: (202) 690-7442; or (3) email: [email protected].
USDA is an equal opportunity provider, employer, and lender.
Authors
Paul E. Hennon is a research plant pathologist, David V. D’Amore is a research soil scientist, and Frances E. Biles is a geographer, U.S. Department of Agri-culture, Forest Service, Pacific Northwest Research Station, Forestry Sciences Laboratory, 11175 Auke Lake Way, Juneau, AK 99802. Carol M. McKenzie was the regional silviculturalist and Dustin T. Wittwer is a geospatial specialist, U.S. Department of Agriculture, Forest Service, Alaska Region, P.O. Box 21628, Juneau, AK 99801. Robin L. Mulvey is a plant pathologist and Melinda S. Lamb is a bio-logical technician, U.S. Department of Agriculture, Forest Service, Alaska Region, State and Private Forestry, Forest Health Protection, 11175 Auke Lake Way, Juneau, AK 99802. Rich C. Cronn is a research geneticist, U.S. Department of Agriculture, Forest Service, Pacific Northwest Research Station, Forestry Sciences Laboratory, 3200 Jefferson Way, Corvallis, OR 97331. Carol McKenzie is the vegetation staff officer, U.S. Department of Agriculture, Forest Service, Idaho Panhandle National Forest, 3815 Schreiber Way, Coeur d’Alene, ID 83815.
Cover: The scalelike foliage of yellow-cedar. (Photo by USDA Forest Service.)

AbstractHennon, Paul E.; McKenzie, Carol M.; D’Amore, David V.; Wittwer, Dustin
T.; Mulvey, Robin L.; Lamb, Melinda S.; Biles, Frances E.; Cronn, Rich C. 2016. A climate adaptation strategy for conservation and management of yellow-cedar in Alaska. Gen. Tech. Rep. PNW-GTR-917. Portland, OR: U.S. Department of Agriculture, Forest Service, Pacific Northwest Research Station. 382 p.
A conservation and management strategy for yellow-cedar in Alaska is presented in the context of climate change. This document has four sections. Section 1 covers the ecology and silvics of yellow-cedar, as well as other background information. Section 2 outlines knowledge on the extensive mortality to yellow-cedar, including the role of climate. Section 3 describes opportunities for the conservation and active management of yellow-cedar on lands that are considered either suitable or unsuit-able for yellow-cedar. Section 4 uses risk models and yellow-cedar distribution data to evaluate, quantify, and map areas of habitat suitability for yellow-cedar, both now and predicted through the year 2100. Yellow-cedar at risk of forest decline by the end of the century varies considerably by geography in coastal Alaska. Some areas are already heavily affected by decline, and risk is not expected to increase appre-ciably. Other areas are currently unaffected but are expected to develop decline. Still other areas are expected to remain healthy. This report provides a vulnerability assessment and the scientific foundation for conservation and active management of yellow-cedar on suitable and vulnerable lands. Specific management considerations are presented regionally and for 33 separate geographic zones where yellow-cedar grows in coastal Alaska.
Keywords: Alaska-cedar, Alaska yellow-cedar, Callitropsis nootkatensis, Chamaecyparis nootkatensis, climate adaptation.
ii
SummaryIn 2011, the Alaska Region of the U.S. Department of Agriculture, Forest Service identified the need to develop a conservation and management strategy for yellow-cedar. Forest Service specialists would synthesize what was known about the species in terms of best available science, evaluate the current and future condition and vulnerability of the species, and recommend conservation and management strategies that would address these vulnerabilities. This report is the product of a collaborative team: Alaska Region land managers and specialists, State and Pri-vate Forestry forest health professionals, and Pacific Northwest Research Station scientists.
The report contains four sections and four appendixes. Section 1 provides background on the values, distribution, natural history, ecology, genetics, silvics, and management experience for yellow-cedar to serve as a general reference for the species. Section 2 describes the extent and causes of the widespread decline and mortality of yellow-cedar, with emphasis on the historical and anticipated role of climate. Section 3 offers management considerations on lands in protection and active management status that have current mortality (e.g., succession to other tree species and salvage potential) or in areas of current and future favorable habitat (e.g., favoring yellow-cedar through active management such as planting and thin-ning). Section 4 quantifies and maps the risk of yellow-cedar decline through time as the basis for determining yellow-cedar habitat suitability. The complex cause of yellow-cedar decline is reduced to two risk factors (drainage and snow) that are used to model habitat suitability for yellow-cedar forests in Alaska. Snow is a dynamic risk factor and it is modeled in three time steps to predict future conditions in yellow-cedar forests. Models suggest that risk to yellow-cedar decline in Alaska by the end of the century varies considerably by geography and elevation with some forests already affected, some forests expected to develop mortality, and still others expected to remain healthy.
Appendix 1 provides a detailed risk assessment for 33 geographic units in coastal Alaska on the extent of (a) yellow-cedar populations, (b) forests with current and expected future mortality, and (c) current and expected future risk of yellow-cedar decline. Appendix 2 summarizes information gaps and research needs. Appendix 3 documents known young-growth stands on Tongass National Forest land with a yellow-cedar component. Last, appendix 4 lists common and scientific names of plants, mammals, insects, and fungi mentioned in the report. This docu-ment may serve as a scientific foundation for developing adaptation strategies in other forests affected by climate change.

iii
Contents1 Section 1: Background on Yellow-Cedar
1 Introduction
1 Values
2 Cultural Values
5 Economic Values
8 Ecological Values
11 General Information on Yellow-Cedar
11 Taxonomy and Scientific Names
12 Native Names and Common Names
13 Yellow-Cedar Distribution
27 Tree Morphology
28 Wood Properties and Chemistry
33 Foliage Morphology and Chemistry
34 Distinguishing Yellow-Cedar From Western Redcedar
36 Reproduction and Regeneration
40 Genetics
55 Paleoecology
58 Dendrochronology
59 Ecology and Silvics
59 General Habitat Characteristics
60 Forest Types and Plant Communities
63 Geology and Soils
64 Adaptations to Wet Soils and Related Nutrient Cycling
65 Rooting Habits
66 Adaptations to Drought
67 Shade Tolerance
67 Cold Tolerance
69 Damage Agents
69 Wind

iv
70 Fire
71 Insects
74 Diseases
75 Wood Decays
77 Potential Invasive Species
77 Animal Damage
78 Climate
79 Commercial Use and Forest Management
79 Logging History
83 Silvicultural Systems
85 Reforestation
86 Natural Regeneration
88 Artificial Regeneration
93 Control of Animal Damage
96 Precommercial Thinning
97 Section 2: Climate and Yellow-Cedar Decline
97 Yellow-Cedar Decline
97 Extent and Intensity of Decline
103 Epidemiology, Timing, and Pulses of Mortality
106 Causes of Extensive Tree Death
106 Early Studies on Symptoms and Biotic Agents
109 Abiotic Factors and the Complex Cause: Freezing Injury
116 Relationship of Snow and Yellow-Cedar Decline at Different Spatial Scales
119 Climate Interactions With Yellow-Cedar
121 Conclusions
123 Section 3: Opportunities for Conservation and Management of Yellow-Cedar On Vulnerable and Suitable Habitats
123 Impacts and Considerations for Management Within the Maladaptation Zone: Species Conversions, Timber Salvage, and Conservation on Vulnerable Habitats
v
124 Transition in Overstory Trees and Understory Plants
127 Potential for Salvaging Dead Yellow-Cedar
142 Biogeochemical Implications for the Dead and Dying Yellow-Cedar Component of Forests
143 Changes in Lands Under Protection Status
144 Considerations for Conservation and Management on Suitable Habitat
146 Monitoring Yellow-Cedar Life Stages in Unmanaged Forests
148 Yellow-Cedar Natural Regeneration in Harvested Forests
150 Success of Yellow-Cedar Planting in Harvested Forests
150 Applied Genetics
157 Thinning to Favor Yellow-Cedar in Managed Forests
158 Longer Term Young-Growth Management
159 Special Case of Forest Management: Yellow-Cedar’s Role in the Transition to a Young-Growth Utilization Program
161 Dispersal of Yellow-Cedar to New Habitat Areas With Suitable Climates
163 Section 4: Modeling Future Vulnerability of Yellow-Cedar Forests to Climate Change for Conservation and Management Planning
163 Introduction and Conceptual Basis
165 Modeling of Suitable and Vulnerable Areas for Yellow-Cedar Based On Risk of Decline
167 Yellow-Cedar Distribution
170 Yellow-Cedar Decline
171 Predicting Future Yellow-Cedar Decline With Two Risk Factors: Soil Drainage and Snow
176 Delineating 33 Yellow-Cedar Management Zones in Coastal Alaska for Assessment
178 Challenges in Using Different Scales for Geographic Information Systems Layers
180 Final Risk Assessment Summary
182 Yellow-Cedar Forest Distribution and Decline
185 Projection of Risk of Yellow-Cedar Decline

vi
188 Implications of Risk Models for the Conservation and Management of Yellow-Cedar
188 Lands Under Conservation or Protection Status
189 Lands Under Active Management Status: Intervention Activities
193 Conclusions
194 Acknowledgments
195 Metric Equivalents
195 Literature Cited
227 Appendix 1: Local Assessments of Yellow-Cedar in Alaska
361 Appendix 2: Information Gaps, Needed Research, and Technology Transfer
369 Appendix 3: Yellow-Cedar Occurrence in Young-Growth Stands in Alaska
380 Appendix 4: Common and Scientific Names of Plants, Mammals, Insects, and Fungi Mentioned in This Report

1
A Climate Adaptation Strategy for Conservation and Management of Yellow-Cedar in Alaska
1
IntroductionYellow-cedar (Callitropsis nootkatensis) is a unique tree species with an ancient lineage and a rich cultural history. A comprehensive science synthesis is needed to combine various sources of information on the species. Section 1 is divided as follows: cultural, economic, and ecological values; geographic, physical, chemical, and genetic characteristics; ecology and silvics; damage agents; and commercial use and management of yellow-cedar. Many of these subjects are treated as a review of literature and management experience. Topics in this section with considerable new information include a description of recent genetic research, and a new map of yellow-cedar’s rangewide distribution. The new information on distribution of yellow-cedar is a key component of the vulnerability assessment in section 4. Many aspects of yellow-cedar’s ecology and silvics presented here are important factors in yellow-cedar decline (section 2), conservation and management (section 3), and the construction and interpretation of landscape models (section 4). Note that factors for converting from English measurements to metric units are given before the “Litera-ture Cited” section.
Values Yellow-cedar is an important forest tree in coastal Alaska due to its cultural, economic, and ecological values. We treat each of these values separately in this document, but several values are intertwined. For example, Alaskan Native people have long known the strength of yellow-cedar wood, and selected it for use as canoe paddles because of the potentially dire consequences if a paddle broke while canoe-ing. The same wood properties make yellow-cedar a desirable engineered wood product for bridges and other applications where strength is needed. The unique chemistry of yellow-cedar’s heartwood allows the tree to live for >1,000 yr and per-sist long after death as sequestered carbon and durable wood products. John Muir (1882: 192) summarized the species’ remarkable qualities in the following way:
The most important of Alaska trees measured by the value of its timber is the yellow cedar or cypress (Cupressus nutkatensis), a truly noble tree, attaining a height of 150 feet and a diameter of 3 to 5 feet. The wood of this tree is undoubtedly the best the country affords, and one of the most valuable to be found on the Pacific coast; it is pale yellow, close grained, tough, durable, and takes a good polish, and has a pleasant fragrance, like that of sandal wood. The durability of this timber is forcibly illustrated by the fallen trunks lying in the damp woods. Many of the largest of these last
Section 1: Background on Yellow-Cedar

2
GENERAL TECHNICAL REPORT PNW-GTR-917
for centuries, retaining the delicate color and fragrance unimpaired. Soon after falling they become overgrown with moss, in which seeds lodge and germinate and grow up into vigorous saplings, and as these grow larger they stand astride the parent trunk, their roots stretching to the ground on either side, and when these have reached the age of several hundred years the down-trodden trunk, when cut into, will be found as fresh at the heart as when it fell.
Gifford Pinchot commented on yellow-cedar in a brief silvics guide (Pinchot 1907) by saying that it had valuable, fine-grained, and exceedingly durable wood but that it was one of the least known tree species in western forests. Pinchot also mentioned that yellow-cedar grows in areas where temperature changes are gradual, the climate is especially mild and uniform, and winters are not severe. He continued by stating that the root system is shallow, but more so in wet situations than dry ones. These insightful observations are closely related to our current understanding of the factors that cause the widespread yellow-cedar mortality described in section 2 of this report.
Cultural ValuesYellow-cedar has both spiritual and practical significance to Native peoples in Alaska and British Columbia. There are uses for nearly every part of the tree, but it is the wood and bark of cedars that are extensively used. Alaska Natives and First Nations People of British Columbia have used the wood for canoe paddles, totem poles, chests, dishes, and tool handles (Turner 1979). Today, yellow-cedar continues to be an important wood for carving (fig. 1). The unusual similarity in density
Figure 1—“The raven and the first men” carved by Bill Reid in 1980 and in the collection of the University of British Columbia Museum of Anthropology.
Lind
a St
anfi
eld

3
A Climate Adaptation Strategy for Conservation and Management of Yellow-Cedar in Alaska
between springwood and summerwood (the two parts of an annual growth ring) allows for especially smooth carved surfaces, whether these are for utilitarian or artistic purposes.
The inner bark (phloem tissue) is an important source of fiber. After the outer bark is stripped and removed, the inner bark is sometimes soaked in saltwater and pounded, or often just dried, and then cut into thin strips. These strips are woven into mats, hats, or decorations for masks, or prepared with mountain goat wool and woven into blankets or clothing (Turner 1979). The inner bark has been known to be eaten (Petrof 1880). Where there is access to both western redcedar and yellow-cedar, the bark is collected from each tree for specific types of weaving because of differences in bark texture between the species.
Mature trees with bark sections removed are fairly common in southeast Alaska (fig. 2). These are called culturally modified trees (CMTs). Our own observations indicate that some CMTs appear to have had their bark removed long ago, whereas others have had their bark removed more recently. Bark stripping, once a common practice, was abandoned during most of the 1900s, and is now frequent again with a resurgence of interest in the cultural art of weaving. Cedar trees can survive long after having a section of their bark removed. The traditional practice is to remove only a fraction of the bole’s circumference, typically less than one-quarter or one-third, so as not to cause undue injury. Horizontal cuts are made at the bottom of the tree to initiate bark removal. Cuts are sometimes made to mark the top of the removed bark, but in other cases the bark is simply pulled from the bottom until the sheet breaks free from the top.
Bark is collected in the spring, generally in May, when wood growth is occur-ring and the bark is more easily removed (i.e., “the bark slips”). Cedar trees have several defenses that limit internal wood decay, mainly caused by fungi, which would otherwise develop in the wood around these large wounds. The biologi-cally active compounds in the heartwood greatly reduce fungal growth toward the middle of the tree. Surviving sapwood surrounding the wound also fills with these same compounds as an active response. The adjacent sapwood takes on rich colors similar to the heartwood, an indication that high concentrations of defensive com-pounds are present. These same biological responses have been reported in Alaska in yellow-cedars with lower-bole injuries caused by brown bears (Hennon et al. 1990a). See “Wood properties and chemistry” for more information on the chemical defenses in cedar wood and foliage.
Although yellow-cedar and western redcedar sometimes grow together, they have distinct distributions in coastal Alaska, with yellow-cedar extending farther north and westward around the Gulf of Alaska. Redcedar grows only as far north

4
GENERAL TECHNICAL REPORT PNW-GTR-917
Figure 2—Culturally modified cedars with the bark removed, recently (left) and long ago (right).
as 57° N and has a preference for lower elevations; yellow-cedar is more common at middle and higher elevations in Alaska. The proximity and availability of yellow-cedar and redcedar trees for cultural use vary throughout southeast Alaska due to differences in the species’ latitudinal and elevational distributions. Trees of both species may be available in southern southeast Alaska, yellow-cedar is the only cedar found to the north of the Petersburg and Kake area, and there are some places in coastal Alaska with no cedar present. Historically, where neither cedar species was accessible, bark acquired through trading, or spruce roots were used as an alternative source of fiber for weaving (Harris 1995).
Native people have a keen awareness of where yellow-cedar occurs on the land-scape. The following Haida story, “The Legend of the Yellow Cedar” (Turner and Efrat 1992), indicates knowledge that yellow-cedar is abundant at mid-elevation, a fact later confirmed by analyzing forest inventory data.

5
A Climate Adaptation Strategy for Conservation and Management of Yellow-Cedar in Alaska
Long ago, when the world was not as it is now, Raven, the great creator and trickster[,] came across three young women who were drying salmon on the beach. Ever hungry, the wily bird approached the women and asked. “Are you not afraid of bears?” And again they replied. “No.” Persistent, Raven asked if they were afraid of wolves, marten and various other creatures. Each time they answered no, until he mentioned owls, at which time the three women confessed their terrible fear of owls.
Raven went off and quickly hid himself in some nearby bushes, where he began making owl calls. Terrified, the women fled, running and running until they were halfway up the mountain. They stopped, finally, out of breath. Standing together on the mountainside, the three of them turned into yellow-cedar trees. That is why yellow-cedars are always found on high slopes and why they are so beautiful; their long graceful branches and silky inner bark resemble the women’s hair and their young trunks are smooth to the touch1 [fig. 3].
Economic ValuesYellow-cedar has long been recognized as Alaska’s most economically valued tree species. As early as 1886, the species was documented as the most valuable timber “found on some of the islands in the Alexander Archipelago and in the neighbor-hood of Sitka, and frequently attains a height of one hundred feet, with diameter of five or six feet” (Bancroft 1886). Today, yellow-cedar continues to be the most valued of all tree species commercially harvested in Alaska (table 1). Figure 3—Three graceful yel-
low-cedar trees, a reminder of the legend on the origins of yellow-cedar.
Table 1—Recent values for foreign market sales of old-growth logs, by commercial species in southeast Alaska
Species 2012 value/1,000
board feeta Yellow-cedar $974Western redcedar $800Sitka spruce $596Western hemlock $540a Values from USDA FS (2014).
1 Story as told by Alice Paul in Hesquiat, reproduced with permission.

6
GENERAL TECHNICAL REPORT PNW-GTR-917
Figure 4—Vertical section of a small yellow-cedar tree. The name “yellow-cedar” comes from the distinctively colored yel-low heartwood, which contrasts with the creamy white sapwood.
The wood has many favorable characteristics that make it a high-valued commodity. It is fine textured, straight grained, easily workable, and moderately heavy, and has moderate strength, stiffness, hardness, and shock resistance (For-est Products Laboratory 1963, Harris 1984). The wood has a large sulfur-yellow heartwood core with a narrow band of sapwood (fig. 4). A combination of chemical extractives gives the wood its distinctive yellow color and aromatic odor, and, most importantly, makes the wood highly resistant to fungal decay and attack by marine borers, termites, and other insects (Forest Products Laboratory 1963, Harris 1984, Morales-Ramos et al. 2003). Bannan (1950, 1951) described the microscopic wood anatomy of yellow-cedar.
7
A Climate Adaptation Strategy for Conservation and Management of Yellow-Cedar in Alaska
Yellow-cedar wood has a variety of commercial uses that arise from its desir-able traits, especially its durability, structural integrity, and resistance to rot. Ship and boat building with yellow-cedar has a history that dates back to the early 1800s.
From 1804 to 1863, the Russian American Company operated a shipyard in Sitka, Alaska, and launched some 22 vessels made primarily from yellow-cedar (Andrews 1934). In today’s markets, yellow-cedar wood continues to be sought for the construction of canoes, racing shells, fishing boats, and yachts.
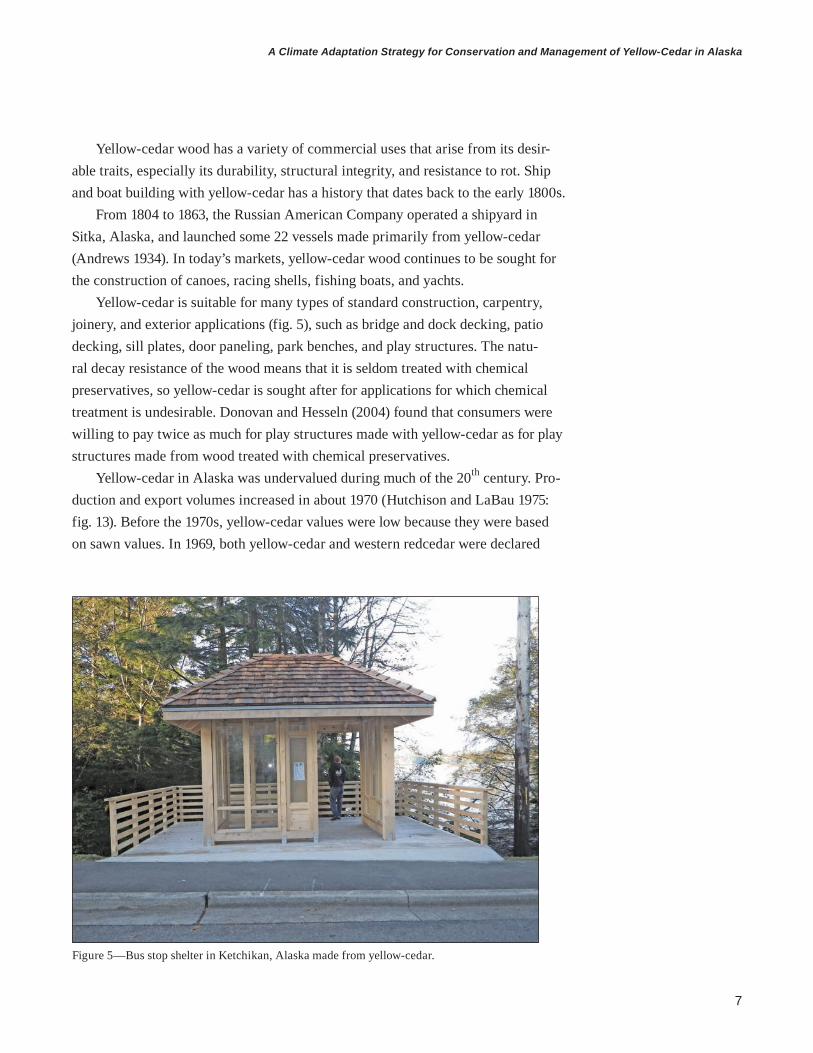
Yellow-cedar is suitable for many types of standard construction, carpentry, joinery, and exterior applications (fig. 5), such as bridge and dock decking, patio decking, sill plates, door paneling, park benches, and play structures. The natu-ral decay resistance of the wood means that it is seldom treated with chemical preservatives, so yellow-cedar is sought after for applications for which chemical treatment is undesirable. Donovan and Hesseln (2004) found that consumers were willing to pay twice as much for play structures made with yellow-cedar as for play structures made from wood treated with chemical preservatives.
Yellow-cedar in Alaska was undervalued during much of the 20th century. Pro-duction and export volumes increased in about 1970 (Hutchison and LaBau 1975: fig. 13). Before the 1970s, yellow-cedar values were low because they were based on sawn values. In 1969, both yellow-cedar and western redcedar were declared
Figure 5—Bus stop shelter in Ketchikan, Alaska made from yellow-cedar.

8
GENERAL TECHNICAL REPORT PNW-GTR-917
Figure 6—Export log selling value (unadjusted for inflation) of yellow-cedar in Alaska from 1980 to 2012, courtesy of Inga Petaisto, U.S. Forest Service, Alaska Region.
surplus to Alaska domestic manufacturing needs and both were freely exportable from federal lands. In 1976, western redcedar was no longer surplus and could be exported only if the Alaska sawmills did not need it (e.g., poor sawn lumber mar-kets due to low U.S. housing construction). Yellow-cedar has continued to remain surplus (i.e., uneconomical to saw) and since 1999, the Alaska Region’s appraisal system has appraised yellow-cedar as export (fig. 6).
Asian markets, especially Japan, pay premium prices for yellow-cedar lumber. Most high-quality yellow-cedar logs are exported to Japan. The wood is also a popular material for dimensional lumber; glue-laminated beams; and rough, green or planed lumber for shoji manufacturing (Gaston and Eastin 2010). The light yellow color and pleasant aroma of yellow-cedar are comparable to the relatively unavailable hinoki cypress, native to Japan, where yellow-cedar is used as an alternative for specialty construction of marinas, temples, and shrines.
Ecological ValuesThe most notable traits of yellow-cedar trees are their longevity and unique chem-istry; these characteristics influence stand structure and nutrient cycling in forests that contain yellow-cedar. Forests of the northern Pacific Northwest coast have

9
A Climate Adaptation Strategy for Conservation and Management of Yellow-Cedar in Alaska
relatively limited coniferous species diversity. There are six main tree species that coexist in forested areas of southeast Alaska: Sitka spruce, mountain hemlock, western hemlock, western redcedar, shore pine, and yellow-cedar. Yellow-cedar is not as common on some landforms, such as alluvial terraces and recently deglaci-ated, early-seral environments. Yellow-cedar frequently grows in wet forests, but can also occur in comparatively drier mixed-conifer forests.
Yellow-cedar is typified by its longevity; once established, it represents an important long-term component of structure and diversity in forested stands (Capp et al. 1992, McClellan 2004). On average, yellow-cedar lives for about 500 to 750 yr (Laroque and Smith 1999), nearly twice as long as the spruce and hemlock trees that dominate most forest stands of southeast Alaska. In addition, many yellow-cedar trees die standing and persist as snags for 80 to 100 yr after death (Hennon et al. 1990b), providing structural diversity in mixed-species stands. The presence of yellow-cedar mixed with other conifers in a stand can be viewed as a two-tiered woody debris system: spruce and hemlock provide downed woody debris and logs in various stages of decay, while yellow-cedar provides standing, relatively unde-cayed snags. This heterogeneity adds diversity for species of wildlife that occupy different strata in the forest. Cedar snags leave areas of forest floor open to light, but unfettered with decaying wood, creating space for forbs to flourish.
Yellow-cedar also provides a unique chemical signature in forests due to the sequestration of abundant calcium in foliage (D’Amore et al. 2009, Kranabet-ter et al. 2003). The store of calcium is transferred to the forest floor during leaf senescence (Alban 1969), altering the chemical balance and microorganism com-munities in the soil (Turner and Franz 1985). Soil and litter layers in yellow-cedar stands tend toward bacterial communities rather than fungal communities, which diversifies the ecosystem at a very fine scale. The nutrient diversity also creates the potential for niche complementarity. This is the process where plants coexist by using different nutrient pools and occupying smaller spaces based on their relative competitive ability (McKane et al. 2002).
The populations of yellow-cedar in Prince William Sound add species diversity to an ecosystem with few tree species. The yellow-cedar populations there are generally small and fragmented, and are thought to have originated from different glacial refugia than populations farther to the southeast. Yellow-cedar forests in Prince William Sound appear healthy and are regenerating well, probably because heavy annual snow accumulation protects yellow-cedar roots from freezing and seedlings from being consumed by deer. Deer were introduced to Prince William Sound, but are locally scarce. Permanent plots installed on Hawkins Island and western Prince William Sound document the growth, regeneration, age structure,
10
GENERAL TECHNICAL REPORT PNW-GTR-917
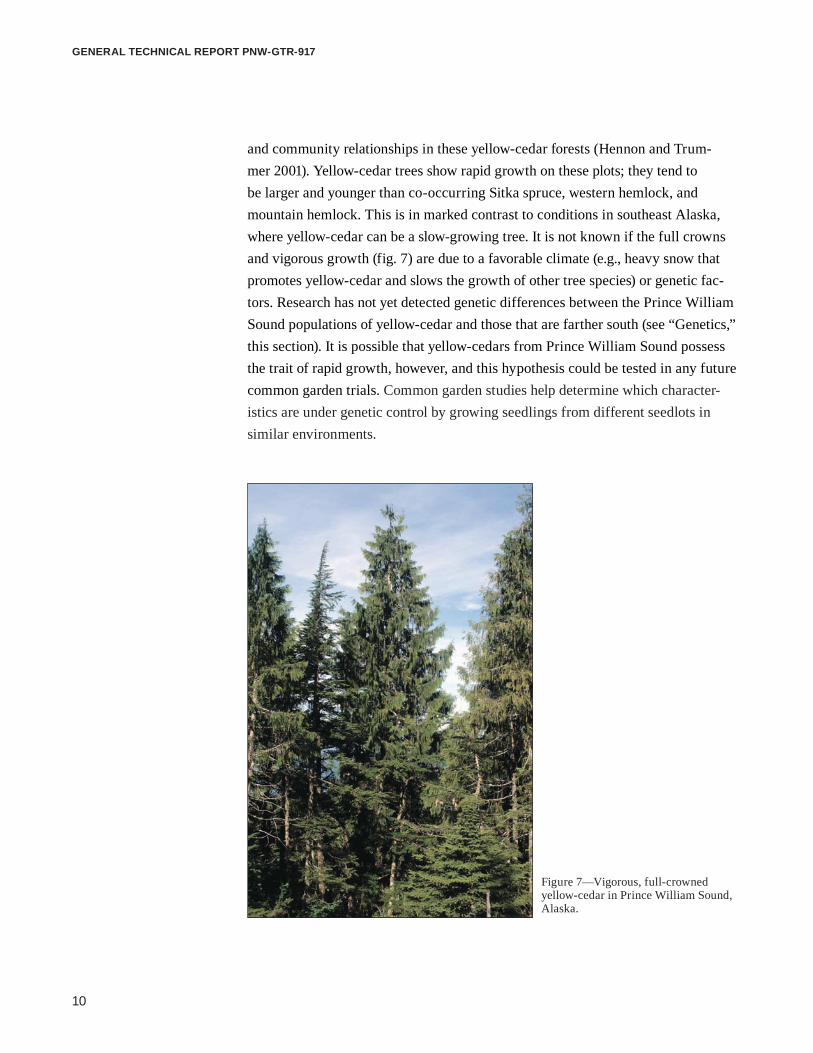
and community relationships in these yellow-cedar forests (Hennon and Trum-mer 2001). Yellow-cedar trees show rapid growth on these plots; they tend to be larger and younger than co-occurring Sitka spruce, western hemlock, and mountain hemlock. This is in marked contrast to conditions in southeast Alaska, where yellow-cedar can be a slow-growing tree. It is not known if the full crowns and vigorous growth (fig. 7) are due to a favorable climate (e.g., heavy snow that promotes yellow-cedar and slows the growth of other tree species) or genetic fac-tors. Research has not yet detected genetic differences between the Prince William Sound populations of yellow-cedar and those that are farther south (see “Genetics,” this section). It is possible that yellow-cedars from Prince William Sound possess the trait of rapid growth, however, and this hypothesis could be tested in any future common garden trials. Common garden studies help determine which character-istics are under genetic control by growing seedlings from different seedlots in similar environments.
Figure 7—Vigorous, full-crowned yellow-cedar in Prince William Sound, Alaska.
11
A Climate Adaptation Strategy for Conservation and Management of Yellow-Cedar in Alaska
General Information on Yellow-CedarTaxonomy and Scientific NamesYellow-cedar is a member of the Cupressaceae, the cypress family of conifers that includes junipers, cypresses, and false-cedars, which are found in many parts of the world. This family of trees and shrubs is both large and ancient. Almost all species in the Cupressaceae have small, scalelike foliage, and lack distinct buds enclosed by bud scales (Hultén 1968, Owens and Molder 1984). Other fairly close relatives such as redwoods and yews once placed in the Taxodiaceae have been merged into a larger family of Cupressaceae based on genetic similarities (Gadek et al. 2000).
There are three abundant Cupressaceae species in Alaska: yellow-cedar, western redcedar (Thuja plicata Donn), and common juniper (Juniperus communis L.) (Viereck and Little 2007). A fourth species, creeping juniper (J. horizontalis Moench), has a limited range around the Wrangell Mountains. Of these species, the junipers generally have a low-growing or shrublike form; only yellow-cedar and western redcedar attain a tree form.
Botanists have had substantial interest in the phylogeny and taxonomy of the Cupressaceae due to the antiquity of the family, and its unusual geographic distribution, which is an outcome of the breakup of the Pangean supercontinent into Laurasia and Gondwana nearly 150 million yr ago (Mao et al. 2012, Yang et al. 2012). Historically, yellow-cedar was first described by the botanist David Don as a member of the genus Cupressus, but later classifications transferred the taxon to the genus Chamaecyparis (Spach 1842) and Callitropsis (Oersted 1864). Recent attention to yellow-cedar’s taxonomic status and scientific name intensified with the discovery of a new cypress in northern Vietnam, golden Vietnamese cypress (Xanthocyparis vietnamensis Farjon & Hiep) (Farjon et al. 2002). Based on mor-phology and genetics, yellow-cedar and the newly discovered tree are considered to be closely related and possibly belong to the same genus (Farjon et al. 2002). A recommendation was made for yellow-cedar to join the Vietnamese tree as the only other member of this genus, and for the scientific name of yellow-cedar to change to Xanthocyparis nootkatensis Farjon & Hiep. In 2004, Damon Little contended that an older name for yellow-cedar, Callitropsis nootkatensis (D. Don) Örest., be used, and that the two species should reside in the genus Callitropsis (Little et al. 2004). A debate ensued in the literature about the validity of the older genus name Callitropsis, which would ordinarily take precedence following botanical rules of nomenclature. Farjon asserted that this name was published in an obscure source in the 1800s, and the newer genus name Xanthocyparis should be used (Mill and Farjon 2006). The situation was finally resolved in the summer of 2011 at the Inter-national Botanical Congress in Australia, where the proposal to use Xanthocyparis
12
GENERAL TECHNICAL REPORT PNW-GTR-917
was not brought to committee, leaving Callitropsis as the accepted genus (personal communication, Damon Little, New York Botanical Gardens, 2013).
It is worth noting that there is growing awareness that species in the genera Xanthocyparis, Callitropsis, and western North American Cupressus (e.g., Baker cypress and Monterey cypress) all share a common lineage, and may trace to a common ancestor that dates to 30–50 million yr ago (Adams et al. 2009, Little 2006), a time of expansive radiation for many conifer lineages (Leslie et al. 2012, Mao et al. 2010, Willyard et al. 2007). These species show similar traits in leaf dimorphism, seed and cone morphology, and the age of cone maturation, and researchers continue to discuss revising these groups to reflect their common ancestry. At present, the names Cupressus and Hesperocyparis are both being used to describe this group; one of these names may replace Callitropsis in the future. For now, we use the genus name Callitropsis, and follow the currently accepted scientific name for yellow-cedar as Callitropsis nootkatensis (D. Don) D.P. Little.
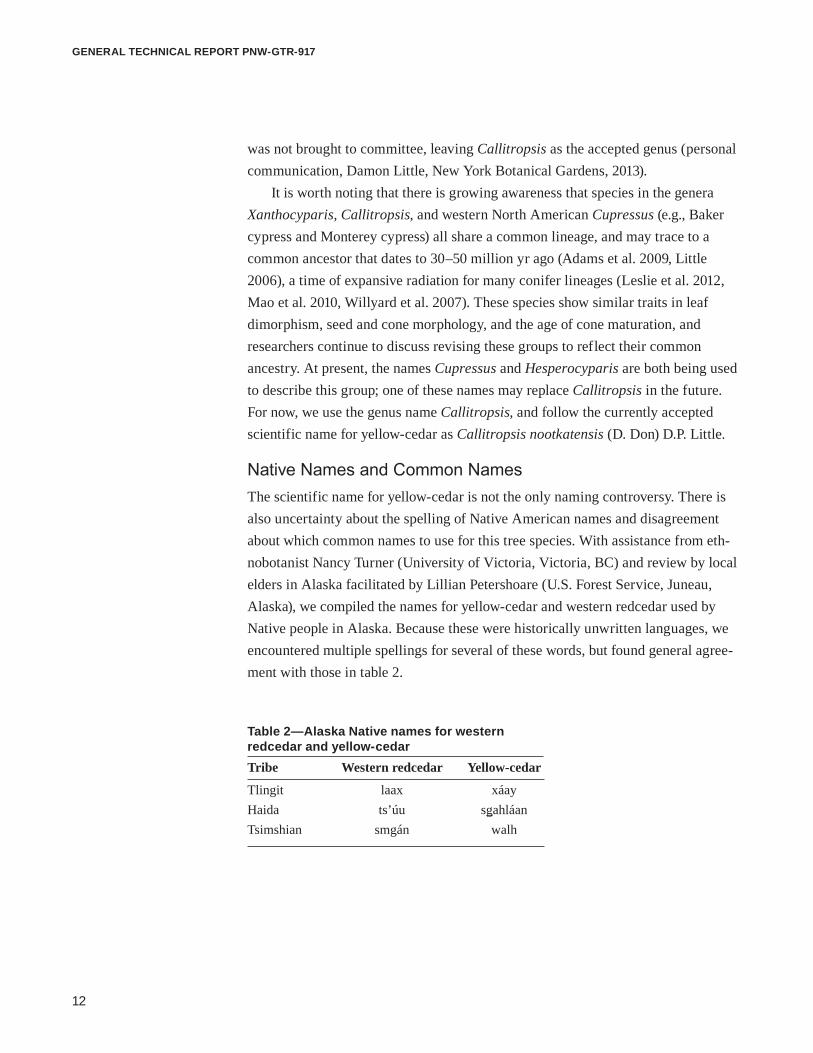
Native Names and Common NamesThe scientific name for yellow-cedar is not the only naming controversy. There is also uncertainty about the spelling of Native American names and disagreement about which common names to use for this tree species. With assistance from eth-nobotanist Nancy Turner (University of Victoria, Victoria, BC) and review by local elders in Alaska facilitated by Lillian Petershoare (U.S. Forest Service, Juneau, Alaska), we compiled the names for yellow-cedar and western redcedar used by Native people in Alaska. Because these were historically unwritten languages, we encountered multiple spellings for several of these words, but found general agree-ment with those in table 2.
Table 2—Alaska Native names for western redcedar and yellow-cedarTribe Western redcedar Yellow-cedar
Tlingit laax xáayHaida ts’úu sgahláanTsimshian smgán walh

13
A Climate Adaptation Strategy for Conservation and Management of Yellow-Cedar in Alaska
A number of other common names (e.g., Nootka cypress, canoe-cedar) applied to the tree that we call yellow-cedar. The commonly used names draw on vari-ous combinations of “Alaska” or “yellow,” followed by “cedar” or, in some cases, “cypress.” “Alaska-cedar” is the common name accepted by the U.S. Forest Service (Little 1979). Our Canadian colleagues disagree with this name and do not use it. Note that the species was first discovered by Archibald Menzies on the Vancouver expedition in British Columbia and named for the Nootka Sound area (hence “nootkatensis”) of western Vancouver Island. The greater acreage and volume of this tree exist in British Columbia, not Alaska, supporting Canadians’ objection to the use of names such as Alaska-cedar or Alaska yellow-cedar. The word “yellow” is a descriptive reference to the distinctive color of the heartwood.
Because this species is not taxonomically a true cedar, there is a convention that a hyphen must be used with the word “cedar,” as in yellow-cedar. True cedars are in the pine family (Pinaceae) and are represented by Old World species with needles in the genus Cedrus (e.g., deodar cedar). Use of the hyphen follows the same logic as with Douglas-fir, which is not a true fir.
“Yellow-cedar” and “yellow cypress,” or sometimes just “cypress,” are used in Canada. We use the name “yellow-cedar” in this document because of its historical use; however, especially in light of new phylogenetic analysis that links yellow-cedar and the New World cypresses (Little 2006), “yellow cypress” would probably be a suitable common name, as would “Nootka cypress” to honor the location of its discovery.
Yellow-Cedar DistributionNearly every form of resource management relies on an accurate account of the spa-tial distribution of important species. Modeling the likely responses of forest species to climate change (i.e., bioclimatic envelopes or geographic shifts in potential habitat) or to disease, insect, or abiotic factors requires a complete species distribution map. Until recently, only a coarse range map (fig. 8) was available for yellow-cedar. This is surprising given the importance and value of this species. Yellow-cedar is known to occur from the northern tip of California (Griffin and Critchfield 1972), through the Siskiyou and Cascade Mountains in Oregon and Washington, and north into coastal areas of British Columbia and Alaska to Prince William Sound (Little 1971). Two well-known small, disjunct populations of yellow-cedar occur farther east in the Aldrich Mountains of Oregon (Frenkel 1974) and near Slocan Lake and Evans Lake, north of Nelson in interior British Columbia (Perry 1954).

14
GENERAL TECHNICAL REPORT PNW-GTR-917
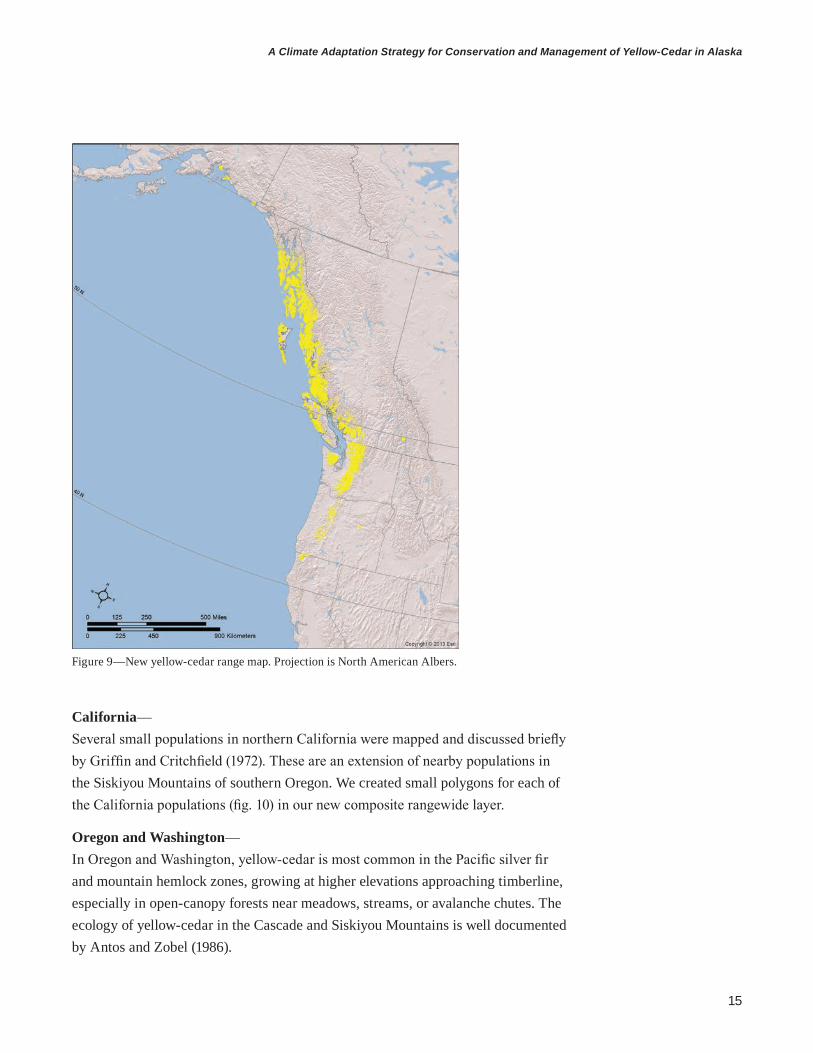
Higher resolution distribution maps or geographic information systems (GIS) layers are now available for yellow-cedar. These are derived from a combination of species distribution models and direct observation during surveys from aircraft or boats. In the following pages we describe these sources of information below, and we integrate them into a new, improved rangewide distribution layer (fig. 9) intended to replace the Little (1972) map. This layer covers area from 41 to 61° latitude and is based on a 240 m × 240 m (800 ft × 800 ft) pixel size. This is a distribution GIS layer (or map) and does not necessarily display the locations where yellow-cedar would be considered the dominant species. Section 4 of this report discusses differences between occurrence and cover type maps.
Figure 8—The Little Atlas distribution for yellow-cedar (Little 1972). Projection is North American Albers.
15
A Climate Adaptation Strategy for Conservation and Management of Yellow-Cedar in Alaska
Figure 9—New yellow-cedar range map. Projection is North American Albers.
California— Several small populations in northern California were mapped and discussed briefly by Griffin and Critchfield (1972). These are an extension of nearby populations in the Siskiyou Mountains of southern Oregon. We created small polygons for each of the California populations (fig. 10) in our new composite rangewide layer.
Oregon and Washington— In Oregon and Washington, yellow-cedar is most common in the Pacific silver fir and mountain hemlock zones, growing at higher elevations approaching timberline, especially in open-canopy forests near meadows, streams, or avalanche chutes. The ecology of yellow-cedar in the Cascade and Siskiyou Mountains is well documented by Antos and Zobel (1986).

16
GENERAL TECHNICAL REPORT PNW-GTR-917
Figure 10—Occurrence of yellow-cedar (yellow shading) in California, Oregon, and Washington. This map was derived from specific locations in California given by Griffin and Critchfield (1972) and using a layer created by nearest neighbor imputation (Ohmann and Gregory 2002) that we modified. Ground observations of yellow-cedar by Murray (a subset of these were reported by Murray (2010)) are shown as dots and were independent from these sources.

17
A Climate Adaptation Strategy for Conservation and Management of Yellow-Cedar in Alaska
The distribution of yellow-cedar in Oregon and Washington (fig. 10) has been predicted at a fine scale through a modeling process known as nearest ecologi-cal neighbor imputation (Ohmann and Gregory 2002). This technique integrates presence/absence data from forest inventory plots with many landscape, climate, and remotely sensed values to display a predicted species occurrence. It was neces-sary to remove some suspicious modeled locations for yellow-cedar in southwest Oregon. To verify this decision, we consulted with Mike Simpson (U.S. Forest Service, Bend, OR), who checked inventory data for the occurrence of yellow-cedar and found it to be absent from southwest Oregon and from portions of northwest Oregon where Little (1971) had shown it to occur. We then added the known loca-tion of yellow-cedar near Mount Aldrich in eastern Oregon (Frenkel 1974). Figure 10 shows the yellow-cedar locations documented on the ground (Murray 2010).
British Columbia— Yellow-cedar is more widespread and abundant in British Columbia than in parts of its range farther south, where it is an important timber resource and is highly valued by First Nations people. The known distribution of yellow-cedar in British Columbia (fig. 11) was provided by Todd Davis (British Columbia Ministry of Forests, Lands and Natural Resource Operations, Nanaimo, B.C.). We consulted with Stefan Zeglen (British Columbia Ministry of Forests, Lands and Natural Resource Operations, Nanaimo, B.C.), who supported deleting from the model several populations outside of the range that were mapped in error, or that repre-sented locations where yellow-cedar was artificially planted. The British Columbia yellow-cedar model was created primarily by photo interpretation, but also includes inputs such as stereograms, ground calibration points, ecological site descriptions, and local knowledge. These interpretations are tempered by knowledge of species heights, crown shapes, and other factors. Pat Martin (British Columbia Ministry of Forests, Lands and Natural Resource Operations), provided details about develop-ment of this model; more information can be found at http://www.for.gov.bc.ca/hts/vri/standards/photo.html.
In British Columbia, yellow-cedar commonly occurs in the windward portions of high-elevation Mountain Hemlock (MHmm1 and MHwh1) subzones. It is also widely distributed throughout the Coastal Western Hemlock zone at low elevations in the Very Wet Hypermaritime (CWHvh2) and Very Wet Maritime (CWHvm1) subzones, and at higher elevations in the CWHvm2 subzone (Klinka et al. 2000, Pojar et al. 1987). These areas encompass much of the outer coast of British Colum-bia, including the Queen Charlotte Islands, the western side of the Coast Moun-tains, and the Hecate Strait. Yellow-cedar can be found down to sea level north of Knight Inlet (Whitford and Craig 1918). The unusual populations in eastern British

18
GENERAL TECHNICAL REPORT PNW-GTR-917
Figure 11—Distribution of yellow-cedar in British Columbia, produced by the Ministry of Forests, Lands and Natural Resource Operations in British Columbia. The projection is Canada Albers Equal Area Conic.

19
A Climate Adaptation Strategy for Conservation and Management of Yellow-Cedar in Alaska
Columbia near Slocan Lake and Evans Lake are disjunct from the main range to the west (Perry 1954). There is an unconfirmed third small population in eastern British Columbia near Trout Lake.
Alaska— In Alaska, the broad range map by Little (1971) has been the main source of distri-bution information for yellow-cedar. The map scale is too coarse for forest planning uses and it is known to contain inaccuracies. Beyond the Little map, forest type and plant association GIS layers and maps (e.g., timber classification cover type) were developed for the panhandle of Alaska, especially for the Tongass National Forest, but are incomplete for yellow-cedar because they exclude some forest types and plant communities in which yellow-cedar is present but not the dominant species. Also, because these layers and maps were derived from aerial photograph interpre-tations, difficulties in distinguishing yellow-cedar in mixed-species stands led to products that could not reliably display yellow-cedar occurrence.
An interim yellow-cedar occurrence layer and map for southeast Alaska was produced by Dustin Wittwer, who used presence/absence data from U.S. Forest Ser-vice, Forest Inventory and Analysis (FIA) forest inventory plots and some Tongass National Forest inventory plots. Groups of watersheds that contained yellow-cedar in forest inventory plots were displayed as containing yellow-cedar. This map provided the context for a coarse map of yellow-cedar distribution that was needed to determine the portion of yellow-cedar’s range affected by yellow-cedar decline (e.g., see Hennon et al. 2006).
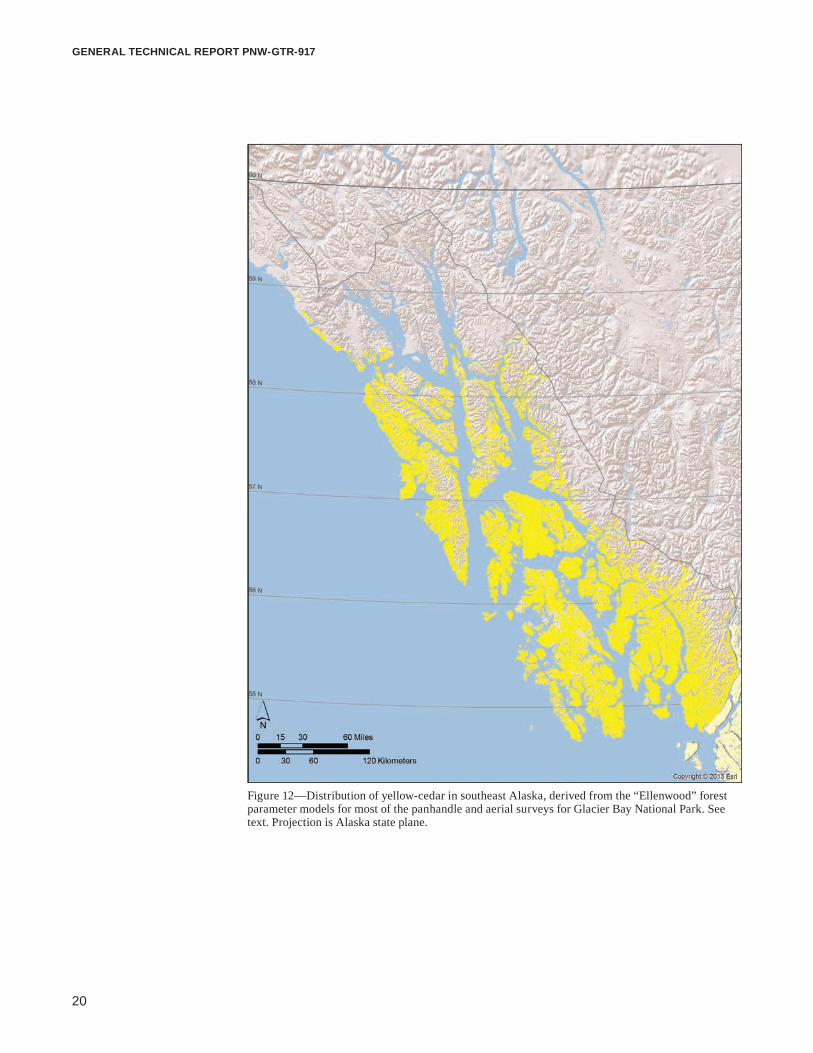
The Forest Service’s Forest Health Technology Enterprise Team in Fort Collins, Colorado, has created species distribution layers and maps for important tree spe-cies in the United States as an initial step in predicting insect and disease risk over the next 15 yr (USDA FS 2014). These “host” maps represent the most advanced tree distribution maps in Alaska. The layers are derived from landscape, site, and climate variables correlated with presence or absence of the host tree species in inventory plots. The remote sensing inputs (i.e., reflectance values) allow for the production of high-resolution (30-m [100-ft] pixel) forest parameter GIS raster sur-face layers, including presence, basal area (BA), and stand density index (SDI). The chief remote sensing analyst producing these maps is Jim Ellenwood, so we call this the Ellenwood layer (fig. 12). Ellenwood (2015) produced aggregated companion data for broad-scale applications at a resolution of 240 m. From the 240-m resolu-tion layers, we produced an index representing yellow-cedar BA as the percentage of the total BA, and used all pixels >1 percent yellow-cedar to represent the entire distribution of yellow-cedar in southeast Alaska (Krist et al. 2014).
20
GENERAL TECHNICAL REPORT PNW-GTR-917
Figure 12—Distribution of yellow-cedar in southeast Alaska, derived from the “Ellenwood” forest parameter models for most of the panhandle and aerial surveys for Glacier Bay National Park. See text. Projection is Alaska state plane.

21
A Climate Adaptation Strategy for Conservation and Management of Yellow-Cedar in Alaska
The 2012 tree species parameter data or Ellenwood tree species layers were derived from statistical models. The modeling technique used data mining soft-ware and ancillary geospatial data to build the statistical relationships to predict occurrence and location of individual tree species and associated density metrics, BA, and SDI. Existing national datasets were used where available, including the National Land Cover Database (NLCD); the state Soil Survey Geographic Database (STATSGO2) of the USDA Natural Resources Conservation Service (NRCS); FIA forest inventory; the National Elevation Dataset of the Department of the Interior, U.S. Geological Survey; and the National Oceanic and Atmospheric Administra-tion’s National Climatic Data Center U.S. normal data (Krist et al. 2014).
Climate data in southeast Alaska were derived from Rehfeldt’s original spline models for western North America. Forest Inventory and Analysis data were extracted from FIADB version 4.0 (Woudenberg et al. 2010) for plot and tree data. Plot data were limited to those that closely aligned with the imagery dates and used live tree data ≥5 in diameter at breast height (d.b.h.) on the main plots, and <5 in, but >1 in d.b.h. on the nested subplots. Coastal Alaska inventories were from a 10-yr annualized scheme and were collected from 2004 through 2009. Imagery data from coastal Alaska were collected in early and late summer from 1994 through 2006 (Krist et al. 2014).
Tree species’ presence/absence, BA, and SDI were constructed from the predic-tor layers listed above by using a classification regression tree modeling method. Subsequently, the presence/absence of the total BA >1 in d.b.h. was modeled by using See5™ version 2.062. These results represent the forested or “treed” area and are shown as the forested area in appendix 1 tables (Krist et al. 2014).
The outputs were then adjusted to ensure the sum of the individual species’ density metric at each location did not exceed a separately modeled total for all spe-cies. Because the vintage of the Landsat satellite imagery used was roughly 2002, growth and mortality adjustments were applied to account for growth from 2002 through 2012. In Alaska, only burned areas were adjusted for growth and mortality; therefore, little to no adjustment was applied in southeast Alaska and on the yellow-cedar layer (Krist et al. 2014).
For yellow-cedar populations in Prince William Sound and extending down through Glacier Bay National Park, other mapping efforts were used rather than the Ellenwood method. For Prince William Sound, too few inventory plots with
2 The use of trade or firm names in this publication is for reader information and does not imply endorsement by the U.S. Department of Agriculture of any product or service.

22
GENERAL TECHNICAL REPORT PNW-GTR-917
yellow-cedar were available. In Glacier Bay, a specific field mapping mission was conducted to delineate yellow-cedar distribution. Mapping in these two locations will be discussed further in the following pages.
The Ellenwood yellow-cedar layer reveals the broad-scale pattern in southeast Alaska that we have described previously (e.g., Hennon 2012); that is, the tree is well distributed in most areas of the panhandle, except to the northeast around Hoonah, Admiralty Island, the Juneau area, and Lynn Canal. Yellow-cedar occurs sparsely in these areas, but is absent or rare over large portions of the landscape that appear to represent suitable habitat. We hypothesize that this incomplete coloniza-tion can be attributed to the past and current yellow-cedar migration from the outer coastal Pleistocene refugia towards the northeast (see “Paleoecology,” this sec-tion). The rarity of yellow-cedar in the Juneau area may indicate that yellow-cedar is just now arriving via this easterly or northeasterly migration. We have found several locations with very small populations, including one lone yellow-cedar tree on Douglas Island. The unique stand of yellow-cedar near Haines found by Roy Josephson (Alaska Department of Natural Resources, Haines, Alaska), may be an example of a founder population that is ahead of the main migration. Josephson estimates the size of this small population to be 30 ac.
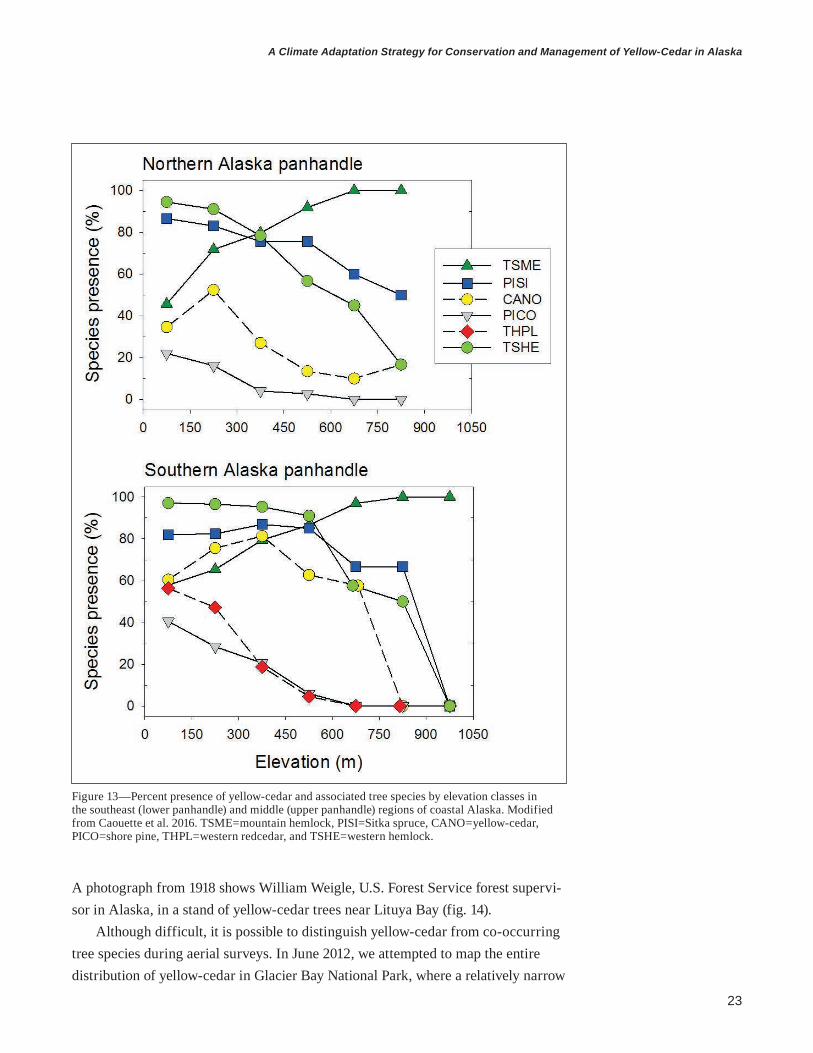
There is also new knowledge of yellow-cedar’s occurrence by elevation in southeast Alaska that comes from analysis of forest inventory plot data. This project was begun by the late John Caouette (The Nature Conservancy, Juneau, Alaska). Yellow-cedar was found to have peak abundance at mid-elevations, whereas western redcedar was more common at lower elevations and mountain hemlock preferred higher elevations (Caouette et al. 2016). These patterns can be observed from analysis of all available plot inventories, but only results from FIA analysis in the lower and upper panhandle of Alaska are shown here (fig. 13). By combin-ing all plots where yellow-cedar occurred in southeast Alaska, Jovan (2011) found live yellow-cedar to have a mean elevation of 973 ft (standard error, 109 ft). Only mountain hemlock had a higher mean elevation in the region.
These patterns of occurrence are shifted to relatively lower elevations with increasing latitude (moving north). Soil hydrology is also known to modify the eleva-tion at which species occur, especially those found at middle and high elevations, such as yellow-cedar and mountain hemlock, respectively. These species are competitive at lower elevations in the marginal environment of saturated peatland soils.
The distribution of yellow-cedar in Glacier Bay National Park has been a gap in our knowledge. With few reported observations and inventory plots, Little (1971) did not know how to portray this portion of the range. This is an important area, as it marks the northwest extent of the main yellow-cedar range in southeast Alaska.
23
A Climate Adaptation Strategy for Conservation and Management of Yellow-Cedar in Alaska
Figure 13—Percent presence of yellow-cedar and associated tree species by elevation classes in the southeast (lower panhandle) and middle (upper panhandle) regions of coastal Alaska. Modified from Caouette et al. 2016. TSME=mountain hemlock, PISI=Sitka spruce, CANO=yellow-cedar, PICO=shore pine, THPL=western redcedar, and TSHE=western hemlock.
A photograph from 1918 shows William Weigle, U.S. Forest Service forest supervi-sor in Alaska, in a stand of yellow-cedar trees near Lituya Bay (fig. 14).
Although difficult, it is possible to distinguish yellow-cedar from co-occurring tree species during aerial surveys. In June 2012, we attempted to map the entire distribution of yellow-cedar in Glacier Bay National Park, where a relatively narrow

24
GENERAL TECHNICAL REPORT PNW-GTR-917
forested strip is wedged between large mountains and the ocean. A 200-m (700-ft) point grid, derived from polygons collected during the aerial surveys, was used to produce the presence/absence layer. The output was linked to existing and continu-ous conifer vegetation classes (Boggs et al. 2008) to improve polygon boundaries and to exclude locations where yellow-cedar would be very unlikely to occur, but was also constrained by the distance from the survey flight line. Greg Streveler, an ecologist from Gustavus, Alaska, with extensive knowledge of the vegetation at Glacier Bay, examined our map for accuracy. We made several changes and remapped portions of the park in July 2012 based on his advice. The final map from these surveys is shown in figure 15. Yellow-cedar does not grow in the central por-tion of Glacier Bay, where extensive even-aged Sitka spruce forests have colonized as glaciers receded from their maximum advances in the Little Ice Age. Yellow-cedar is rare on the older forested wetland benches below Excursion Ridge in the eastern portion of the park (not shown in figure 15). Some of these trees were used in a recent dendrochronology study of yellow-cedar (Wiles et al. 2012). This large forested wetland complex is another example of suitable habitat that is not widely colonized by yellow-cedar, probably because of incomplete migration.
Figure 14—Photograph taken in 1918 showing William Weigle (forest supervisor in Alaska) and yellow-cedar trees. The back of the photo has the inscription, “in the vicinity of Lituya Bay,” a location which is now part of Glacier Bay National Park, Alaska.

25
A Climate Adaptation Strategy for Conservation and Management of Yellow-Cedar in Alaska
Figure 15—Occurrence of yellow-cedar in Glacier Bay National Park, Alaska.
Yellow-cedar is abundant along the west coast of Glacier Bay extending to an area just northwest of Cape Fairweather (fig. 15). We searched for and did not detect yellow-cedar along the coast as far as the southeastern portion of Icy Bay. Except for the population west of Icy Bay (see below), we believe yellow-cedar is absent from the Cape Fairweather area to about 300 mi along the outer coast near the Cordova-Hawkins Island area, which marks the beginning of the Prince William Sound populations. Another exception is the trial planting of yellow-cedar by the U.S. Forest Service near Yakutat established in 2009.
Joel Nudelman (personal communication, Alaska Department of Natural Resources, Juneau, 2013) discovered another small population of yellow-cedar near Icy Bay just west of Lawrence Creek (60.03335° N, 142.05346° W). Icy Bay is in the large expanse between Glacier Bay and Prince William Sound with no previously documented yellow-cedar. The stand was harvested in 2002, and it is not clear if any yellow-cedar seedlings might be present among the natural regeneration growing after the harvest. In 2014, Josephson (personal communication, 2014) observed live yellow-cedar trees (60.004951° N, 141.731458° W) just east of Big Sandy Creek and west of Priest River in a natural stand upslope from a harvested area. He saw numer-ous yellow-cedar trees with 20- to 24-in diameters. These two areas are separated by

26
GENERAL TECHNICAL REPORT PNW-GTR-917
about 11 mi of harvested areas in the lowlands and intact hillside forests. It would be worthwhile to visit this part of Icy Bay to search for other yellow-cedar populations and determine their size, health status, and genetic and age structure, as well as to examine the harvested units for yellow-cedar stumps and yellow-cedar regeneration. Sudworth (1908) mentioned yellow-cedar occurrence near Icy Cape, but he may have been referring to Icy Point near Palma Bay in Glacier Bay (where yellow-cedar is common) because he indicated that it was just north of Cross Sound.
The occurrence of yellow-cedar in Prince William Sound has been described as a phytogeographical problem (Cooper 1942) because the origins of these popula-tions are unclear owing to their considerable geographic isolation from the more contiguous range farther south. Botanical texts and other literature have given conflicting accounts of where yellow-cedar grows in Prince William Sound. Hen-non and Trummer (2001) outlined the history of these reports.
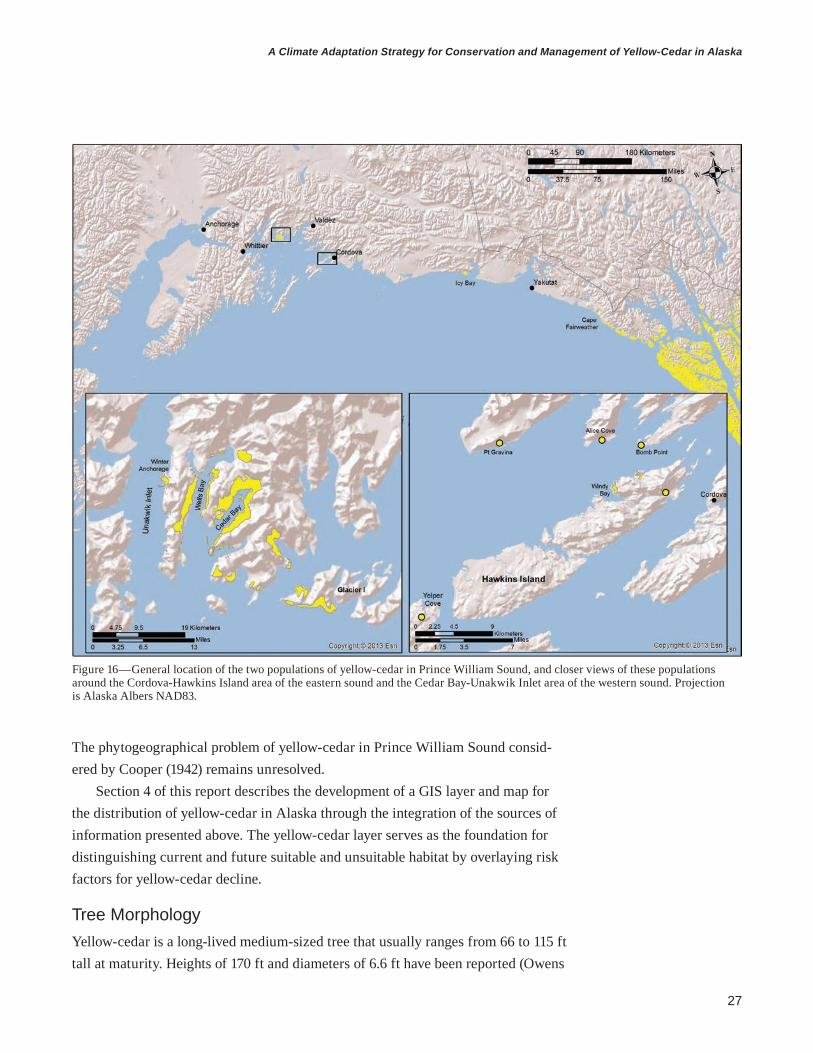
The combination of boat surveys and local knowledge of yellow-cedar is believed to have captured nearly all of the distribution of the species in Prince Wil-liam Sound (Hennon and Trummer 2001), where we now know there are two main populations (fig. 16). The smaller eastern yellow-cedar population near Cordova includes stands at Windy Bay and Mud Bay on Hawkins Island; Point Gravina, Bomb Point, and Alice Cove on the mainland; and Yelper Cove on Hinchinbrook Island. We have not confirmed the presence of yellow-cedar at Cedar Bay on Hawkins Island. This location is not to be confused with Cedar Bay mentioned below (fig. 16). Yellow-cedar is not known to occur between this eastern population and the larger western population that begins on Glacier Island about 40 mi to the northwest. Yellow-cedar is common on the western portion of Glacier Island and continues, in patches, from Eickelberg Bay around to Granite Bay. The largest, most contiguous yellow-cedar forest in this population occurs in Cedar Bay from sea level to near timberline. Yellow-cedar stands are also common in Wells Bay and in small patches along both sides of the peninsula on the east side of Unakwik Inlet. A large stand (about 100 ac), and some smaller scattered stands at Winter Anchorage, mark the western extent of yellow-cedar’s natural range (147.5472° W). Populations along the eastern arm of Wells Bay represent the northernmost extent of yellow-cedar (61.0136° N), but several trees just north of Winter Anchorage extend almost as far north.
The locations of yellow-cedar occurrence in Prince William Sound suggest a different historical origin for these populations, possibly on Hinchinbrook and Montague Islands, which may have been ice-free during parts of the Pleistocene and served as refugia (Lance and Cook 1998). Yellow-cedar may have more distant origins, perhaps being transported by Alaska Natives or by tsunamis to these areas.
27
A Climate Adaptation Strategy for Conservation and Management of Yellow-Cedar in Alaska
Figure 16—General location of the two populations of yellow-cedar in Prince William Sound, and closer views of these populations around the Cordova-Hawkins Island area of the eastern sound and the Cedar Bay-Unakwik Inlet area of the western sound. Projection is Alaska Albers NAD83.
The phytogeographical problem of yellow-cedar in Prince William Sound consid-ered by Cooper (1942) remains unresolved.
Section 4 of this report describes the development of a GIS layer and map for the distribution of yellow-cedar in Alaska through the integration of the sources of information presented above. The yellow-cedar layer serves as the foundation for distinguishing current and future suitable and unsuitable habitat by overlaying risk factors for yellow-cedar decline.
Tree MorphologyYellow-cedar is a long-lived medium-sized tree that usually ranges from 66 to 115 ft tall at maturity. Heights of 170 ft and diameters of 6.6 ft have been reported (Owens
28
GENERAL TECHNICAL REPORT PNW-GTR-917
Table 3—Strength values for yellow-cedar wood (Forest Products Laboratory 1987)Wood property Green wood Dry woodSpecific gravity 0.42 0.44Modulus of rupture (lbs/in2) 6,400 11,100Modulus of elasticity (million lbs/in2) 1.14 1.42Work to max load (in-lb/in3) 9.2 10.4
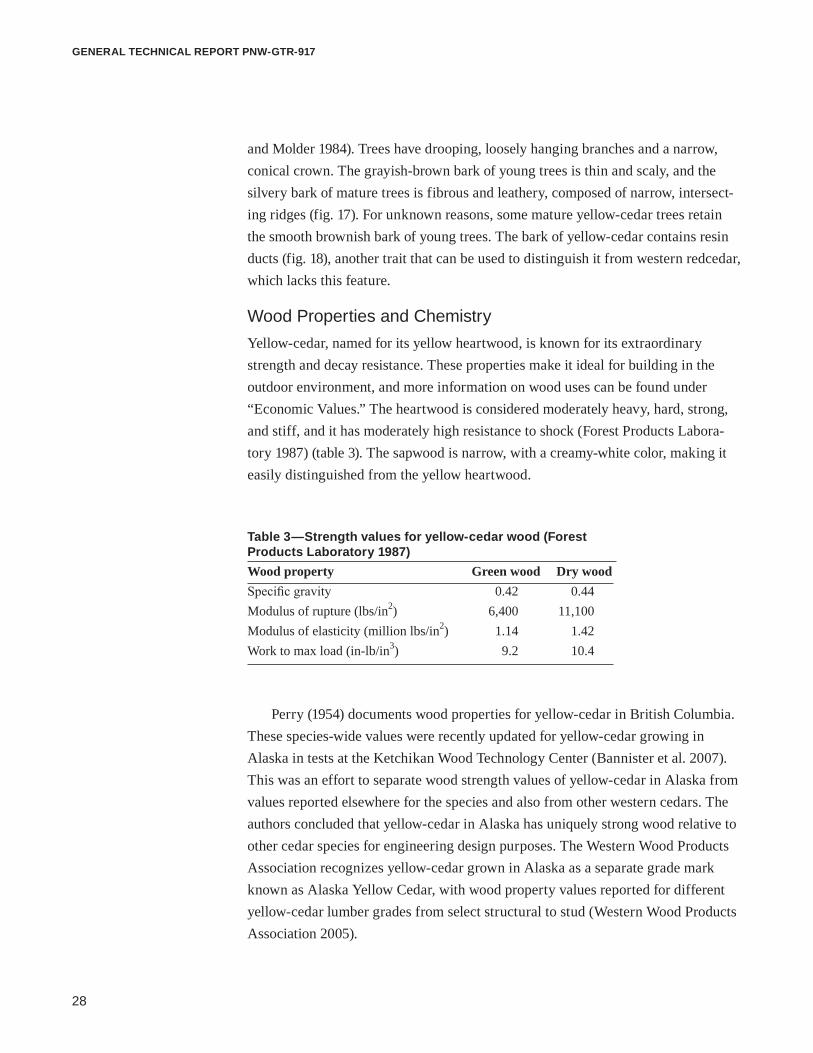
and Molder 1984). Trees have drooping, loosely hanging branches and a narrow, conical crown. The grayish-brown bark of young trees is thin and scaly, and the silvery bark of mature trees is fibrous and leathery, composed of narrow, intersect-ing ridges (fig. 17). For unknown reasons, some mature yellow-cedar trees retain the smooth brownish bark of young trees. The bark of yellow-cedar contains resin ducts (fig. 18), another trait that can be used to distinguish it from western redcedar, which lacks this feature.
Wood Properties and ChemistryYellow-cedar, named for its yellow heartwood, is known for its extraordinary strength and decay resistance. These properties make it ideal for building in the outdoor environment, and more information on wood uses can be found under “Economic Values.” The heartwood is considered moderately heavy, hard, strong, and stiff, and it has moderately high resistance to shock (Forest Products Labora-tory 1987) (table 3). The sapwood is narrow, with a creamy-white color, making it easily distinguished from the yellow heartwood.
Perry (1954) documents wood properties for yellow-cedar in British Columbia. These species-wide values were recently updated for yellow-cedar growing in Alaska in tests at the Ketchikan Wood Technology Center (Bannister et al. 2007). This was an effort to separate wood strength values of yellow-cedar in Alaska from values reported elsewhere for the species and also from other western cedars. The authors concluded that yellow-cedar in Alaska has uniquely strong wood relative to other cedar species for engineering design purposes. The Western Wood Products Association recognizes yellow-cedar grown in Alaska as a separate grade mark known as Alaska Yellow Cedar, with wood property values reported for different yellow-cedar lumber grades from select structural to stud (Western Wood Products Association 2005).

29
A Climate Adaptation Strategy for Conservation and Management of Yellow-Cedar in Alaska
Figure 17—Silvery gray bark common on mature yellow-cedar trees.

30
GENERAL TECHNICAL REPORT PNW-GTR-917
Figure 18—Old resin ducts (white vertical tissue) in the bark of yellow-cedar. Resin ducts are active when they occur in phloem tissue, before being incorporated into the outer bark as in this picture. The presence of resin ducts in bark can be used to distinguish the two cedars in Alaska because western redcedar lacks them in the outer bark.
Yellow-cedar heartwood is known for its bright-yellow color, pleasant aroma, and exceptional decay resistance. These characteristics are derived directly from its biochemical composition. The heartwood contains phenolic compounds with antimicrobial and antifungal properties that afford protection from fungi, insects, and other organisms (Barton 1976) (fig. 19). The high concentration of heartwood defense compounds is an adaptation that allows yellow-cedar trees to survive for >1,000 yr, far exceeding the longevity of most associated tree species. A yellow-cedar tree near Campbell River, B.C., was documented to be 1,600 yr old (Jozsa 1991), and yellow-cedar may reach 3,500 yr of age (Owens and Molder 1984). We

31
A Climate Adaptation Strategy for Conservation and Management of Yellow-Cedar in Alaska
Figure 19—Chemical structure of several important compounds in the heartwood of yellow-cedar.
are unaware of any attempts to document the oldest yellow-cedar in Alaska. Some specialized stain and decay fungi are able to invade the heartwood of live yellow-cedar trees (De Groot et al. 1999, Hennon 1990). Colonization by stain fungi leads to reduced concentrations of defense compounds in yellow-cedar wood, making it vulnerable to further degradation by fungi and insects (Morales-Ramos et al. 2003). Unlike its heartwood, yellow-cedar sapwood contains lower concentrations of defense compounds and is not resistant to decay once the tree is dead because compounds from the heartwood cannot be mobilized to the sapwood.
Extractable bioactive compounds of yellow-cedar heartwood include alaskene, carvacrol, chamic acid, chaminic acid, chanootin, isochamic acid, nootkatene, nootkatin, nootkatone, valerianol, and vetivone (Barton 1976). Table 4 lists many of

32
GENERAL TECHNICAL REPORT PNW-GTR-917
Table 4—Known heartwood constituents of yellow-cedarCompound Identification, conformation, synthesis, or assay
Alaskene Marx and Norman (1973)Carvacrol Carlsson et al. (1952), Erdtman (1952), Kelsey et al. (2005), Voda et al.
(2003)Chamic acida Carlsson et al. (1952), Erdtman (1955), Erdtman et al. (1956), Gensler
and Soloman (1973), Norin (1964), Norin et al. (1982), Rennerfelt and Nacht (1955)
Chaminic acid Erdtman (1955), Erdtman et al. (1956), Norin et al. (1982)Chanootin Karlsson et al. (1973), Norin (1964)Isochamic acid Norin (1964)Nootkatene Erdtman and Topliss (1957), Kelsey et al. (2005)Nootkatinb Aulin-Erdman (1950), Campbell and Robertson (1952), Carlsson et al.
(1952), Duff and Erdtman (1954), Duff et al. (1954), Erdtman and Harvey (1952), Johnson and Cserjesi (1975)
Nootkatol Kelsey et al. (2005)Nootkatone Dastur (1974), Erdtman and Hirose (1962), Ishida et al. (1970), Odom
and Pinder (1972), Yanami et al. (1980)Valerianol Odom and Pinder (1972)Vetivone Dastur (1974)a Biologically active against fungi at 0.01 percent (Rennerfelt and Nacht 1955)b Biologically active against fungi at 0.001 percent (Rennerfelt and Nacht 1955)
the compounds and citations of literature that describes their identification, confor-mation, synthesis, or assay. Barton diagrams the molecular structure of compounds in wood and foliage: carene, carvacrol, chamic acid, chaminic acid, chanootin, limonene, methyl carvacrol, nootkatin, nootkatone, and pinene. In particular, noot-katin and carvacrol are associated with reduced growth rates of fungi (Kelsey et al. 2005, Rennerfelt and Nacht 1955). Nootkatin, carvacrol, valencenes and nootkatone extracted from yellow-cedar heartwood reduced spore formation and hyphal growth of the oomycete (water-mold) pathogen Phytophthora ramorum, cause of sudden oak death, in culture (Manter et al. 2006). Nootkatin is also an effective biocide of ticks (Panella et al. 1997) and mosquitoes, even at very low concentrations (Karch-esy et al. 2010). Yellow-cedar snags retain strength and decay resistance properties long after tree death, which greatly limits snag deterioration. Kelsey et al. (2005) measured the concentration of nootkatin, carvacrol, nootkatol, and nootkatene in the wood of live cedar trees, and snags that had been dead for various lengths of time, and found that chemistry was relatively unaltered until several decades after tree death. The salvage potential, wood properties, and heartwood chemistry of dead yellow-cedar are covered in section 3.

33
A Climate Adaptation Strategy for Conservation and Management of Yellow-Cedar in Alaska
Foliage Morphology and ChemistryMature yellow-cedar foliage is dull green, scalelike, and pointed at the tips. Juvenile foliage of seedlings is needlelike, and mature foliage develops gradually until it is the only foliage produced around age 5. Yellow-cedar twigs lack true buds or bud scales and are four-angled or somewhat flattened in cross section (Hultén 1968).
Similar to yellow-cedar heartwood, bioactive compounds in yellow-cedar foli-age afford protection from biotic herbivory, such as from insects and deer. These compounds include alpha-pinene and limonene, as well as beta-pinene, sabinene, and beta-cymene (Clark and Lucas 1926). Cheng and von Rudloff (1970) analyzed volatile leaf oils of yellow-cedar foliage, and detected alpha-pinene, 3-carene, and limonene as the primary chemical constituents, along with nerolidol, cedrol, bisabolol, and cadinol and a whole suite of hydrocarbons, monoterpenes, oxides, aromatic esters, and acids. Some of these protective compounds are common to foliage of plants in the Cupres-saceae. Others are potentially unique to yellow-cedar or more closely related species.
Vourc’h et al. (2002) evaluated the relationship between deer browse rates and foliar terpene concentrations through yellow-cedar common garden trials at two sites on Vancouver Island. The results demonstrated that genetically identical individuals (from cloning) with lower terpene levels consistently had higher browse pressure, suggesting genetic control over foliar terpene concentration and vulner-ability to deer browse. Young, juvenile foliage of seedlings is known to contain lower concentrations of defense compounds and is significantly more susceptible to herbivory than older, mature foliage. A planting trial near Ketchikan compared the growth and survival of yellow-cedars that originated from seedlings and rooted cuttings (stecklings), and found that seedlings had higher rates of deer browse than did stecklings (Hennon et al. 2009). It is thought that this may be due to the higher terpene levels of mature steckling foliage compared to seedlings. On saplings and young trees, deer frequently feed on the branch tips, probably consuming only recently produced foliage that has relatively lower concentrations of terpenes than adjacent older foliage.
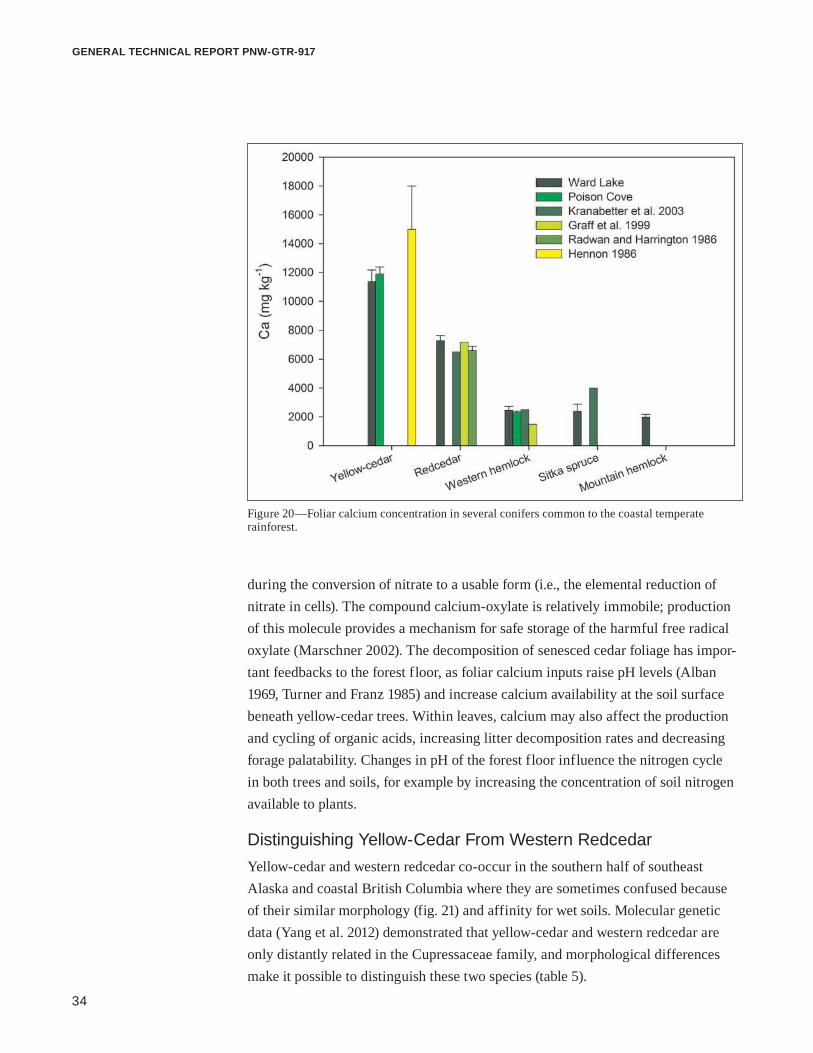
A key feature of yellow-cedar foliage is its greater concentration of foliar calcium compared to other conifers (fig. 20). There are several specific ecological and physiological causes and consequences of abundant foliar calcium. The calcium uptake of yellow-cedar far exceeds its nutritional needs (Krajina 1969, Kranabetter et al. 2003). The high foliar calcium concentration is presumed to be the result of the nitrogen acquisition strategy of yellow-cedar. Inadequate soil nitrogen limits tree growth in low pH (acidic) soils, but yellow-cedar and some related species are better able to use the nitrate form of nitrogen present in acidic soils. The role of calcium in the strategy is to combine with toxic byproducts (e.g., oxylate) produced
34
GENERAL TECHNICAL REPORT PNW-GTR-917
during the conversion of nitrate to a usable form (i.e., the elemental reduction of nitrate in cells). The compound calcium-oxylate is relatively immobile; production of this molecule provides a mechanism for safe storage of the harmful free radical oxylate (Marschner 2002). The decomposition of senesced cedar foliage has impor-tant feedbacks to the forest floor, as foliar calcium inputs raise pH levels (Alban 1969, Turner and Franz 1985) and increase calcium availability at the soil surface beneath yellow-cedar trees. Within leaves, calcium may also affect the production and cycling of organic acids, increasing litter decomposition rates and decreasing forage palatability. Changes in pH of the forest floor influence the nitrogen cycle in both trees and soils, for example by increasing the concentration of soil nitrogen available to plants.
Distinguishing Yellow-Cedar From Western RedcedarYellow-cedar and western redcedar co-occur in the southern half of southeast Alaska and coastal British Columbia where they are sometimes confused because of their similar morphology (fig. 21) and affinity for wet soils. Molecular genetic data (Yang et al. 2012) demonstrated that yellow-cedar and western redcedar are only distantly related in the Cupressaceae family, and morphological differences make it possible to distinguish these two species (table 5).
Figure 20—Foliar calcium concentration in several conifers common to the coastal temperate rainforest.

35
A Climate Adaptation Strategy for Conservation and Management of Yellow-Cedar in Alaska
Table 5—Distinctive characteristics of yellow-cedar and western redcedar
Feature Yellow-cedar Western redcedar
Cones Small, spherical with spikes Small, rosebud shapedMature foliage Less flattened; dull; darker
green, little to no white stoma-tal banding, but if present in the shape of “X”
Flattened; bright green; shiny; white stomatal banding on underside in shape of “W” or butterfly
Shoots Shoots and foliage arrange hap-hazardly; are droopy, hanging
Shoots emerge from branches sys-tematically, usually in flat sprays
Branches Branches sometimes with sweeping form, lower boles tend to be branch-free, bayonet-shaped branches near top less common
Low sweeping branches often maintained on lower bole, bayonet-shaped upward branches and forks near top common
Bark Gray, whitish or reddish-brown; less fibrous; resin ducts pres-ent in bark and phloem
Reddish-brown with vertical furrows, very fibrous, without resin ducts
Heartwood Pale to bright yellow, aromatic Variable in color, tan to dark reddish-brown, aromatic
Seedlings Develop mature, scale like foliage gradually, by the 4th or 5th year
Develop mature, scalelike foliage abruptly in spring of 2nd or 3rd year
Figure 21—Foliage and cones of yellow-cedar (top) and western redcedar (bottom).
36
GENERAL TECHNICAL REPORT PNW-GTR-917
Reproduction and RegenerationYellow-cedar reproduces sexually by seed and asexually by layering. Regeneration is not uniform and does not occur on all sites. In the western hemlock-yellow-cedar series of the Chatham Area, yellow-cedar regeneration was detected in only half of the examined stands, and yellow-cedar seedlings were far less common than prolific western hemlock (Martin et al. 1995).
Seed production of yellow-cedar is considered to be low, but some seed is produced every year (Owens and Molder 1984). Key factors limiting natural regeneration include irregular seed crops, limited cone production, low rates of seed viability and germination, reduced seed production in areas of forest decline, competition with other species, seedling vulnerability to spring root and foliar freezing injury, and preferential deer browsing. Needlelike juvenile foliage is particularly vulnerable to browsing pressure, especially where deer populations are high. Insects and diseases of seeds and cones may also affect regeneration, but these agents are known to be problematic only in yellow-cedar seedling nurseries, and information is lacking about their role in natural forests.
Yellow-cedar begins to produce pollen and seed cones at an early age, often by the time seedlings reach 7 to 8 yr old. Cone formation can also be induced in seedlings as young as 1 yr old in the nursery setting through application of gibberellin-A3 (Owens and Molder 1977). Pollen cones are produced early in the season (April to May), and pollen viability appears to be diminished by warm spring temperatures. Anderson and colleagues (2002) reported that low-elevation seed orchards produced lower quantities of viable seed than higher elevation native stands, and hypothesized that the low viability could be related to negative impacts of higher temperatures on pollen development, as has been reported for other conifers (e.g., Luomajoki 1977). Hak and Russell (2004) examined pollen viability from diverse climatic sources in British Columbia and found that pollen collected from trees at the coldest sites (mean temperature in the coldest month = 18 °F) showed average pollen viability up to 70 percent. Pollen collected from trees at the warmest sites (mean temperature in the coldest month = 37 °F) showed aver-age pollen viability of 16 percent. The exact mechanism responsible for decreased pollen viability is unknown, but it may play a large role in the low germinability of yellow-cedar seeds from low-elevation orchards (Hak and Russell 2004, Owens and Molder 1977). If higher quality pollen is required for controlled pollination, it could be possible to collect pollen from colder sites, but additional investigation is needed to identify the climatic conditions that produce high-viability pollen.
Flowering (cone initiation) takes place from April to May, depending on lati-tude (Harris 1974, Owens and Molnar 1984). Yellow-cedar produces small, yellow

37
A Climate Adaptation Strategy for Conservation and Management of Yellow-Cedar in Alaska
Figure 22—Male pollen flowers of yellow-cedar. Figure 23—Inconspicuous female flower of yellow-cedar at the time of pollination.
to reddish male flowers (strobili) on branch tips in the lower crown (fig. 22), while green, berrylike female flowers are produced on branch tips in the upper crown (fig. 23). Cones form on previously vegetative shoots that are 1 to 2 yr old. Pol-lination takes place during a 2-week period in late spring or early summer about 1 yr after flower initiation. Pollen is dispersed by the wind. Fertilization occurs and embryos develop until winter dormancy is triggered in fall. Seed cones take 2 full yr to mature, or 28 mo across three growing seasons from the time of cone initiation to seed maturity (Owens and Molder 1984). There is evidence that cones can develop in 1 yr on sites with longer growing seasons (Colangeli 1991), and under controlled greenhouse conditions (personal communication, John H. Rus-sell, British Columbia Forest Service, Cowichan Lake, B.C., 2015). Seed dispersal takes place from fall to spring, primarily during periods of dry weather (Harris 1974). Dispersed seeds overwinter in the snowbank over much of the range of yellow-cedar. When collecting seed cones, care must be taken to avoid the soft, green 1-yr-old cones. Immature cones occur on branches with mature cones and are similar in size (0.5-in diameter), but are found closer to branch tips (Harris 1974). Mature cones are hard, yellow- or red-brown to gray, with four to six umbrella-shaped scales that are tipped with conical projections. Empty cones persist on trees for a year or more after seed dispersal.
Seed wings are present (fig. 24), but are sometimes reduced (Hultén 1968). On average, cones produce seven seeds (Bonner 2008), but seed viability is generally low and highly variable (Harris 1974). In British Columbia, Owens and Molder (1977) reported that only 29 percent of seeds were viable. Excised yellow-cedar embryos show 100-percent germination, suggesting that the mechanisms driv-ing dormancy and low germinability are primarily a consequence of structures

38
GENERAL TECHNICAL REPORT PNW-GTR-917
enclosing the embryo (e.g., testa, nucellus, and megagametophyte; Raimondi and Kermode 2004). Detailed anatomical analysis of the yellow-cedar seed germination process points primarily to an inhibitory effect of the megagametophyte (Raimondi and Kermode 2004), perhaps via the action of leachable chemical inhibitors such as abscisic acid (Raimondi and Kermode 2004, Ren and Kermode 1999, Schmitz et al. 2002).
Early attempts to break seed dormancy used a combination of warm and cold stratification; for example, Pawuk (1993) found that the highest germination rate (69 percent) was achieved with 60 d of warm stratification followed by 90 d of cold stratification. Raimondi and Kermode (2004) found that this long stratification could be shortened to 65 d by using a regimen of chemical treatment (1-propanol), followed by a warmwater soak for 3 d, a 2-d treatment with gibberellin-A3, and a 60-d moist chilling incubation. In natural settings, the highest germination rates are achieved on bare mineral soil; however, alder and spruce tend to have a competi-tive advantage on bare microsites (Harris 1974). Large seed crops are produced every 4 to 7 yr (Bonner 2008, Harris 1974, Hennon 1992b), but seed production is never known to be abundant compared to associated conifers (Pawuk 1993). Seed dispersal distances have not been assessed for yellow-cedar, but are believed to be less than the 400-ft dispersal distance of Port-Orford-cedar due to yellow-cedar’s heavier seed weight (Harris 1974) and reduced seed wings (Owens and Molder 1984). Seeds produce two cotyledons upon germinating (fig. 25). Previous recom-mendations were to collect and plant yellow-cedar seeds near the planting site and within a 500-ft elevation range (Martin et al. 1995), but new quantitative genetic research findings show that seed can be moved great distances from source areas without expressing maladaptive traits (see “Genetics,” this section).
Figure 24—The winged yellow-cedar seeds.

39
A Climate Adaptation Strategy for Conservation and Management of Yellow-Cedar in Alaska
Figure 25—New yellow-cedar germinant in organic soil showing the typical two cotyledons.
As noted, yellow-cedar also reproduces asexually by layering, as an aerial stem (i.e., lower branch) can develop roots while still attached to the parent plant, and later detach to form an independent clone (ramet) of the parent (genet) plant. For yellow-cedar, layering is most common on open, bog sites, where live lower branches are retained and are in direct contact with the ground (Hennon et al. 1990) (fig. 26). Ramets derived from layering may be ubiquitous on the landscape. For example, surveys of nine small plots in British Columbia showed that clones could constitute 8 to 70 percent of all trees in an area as small as 1,600 ft2 each (Thomp-son et al. 2008). Although most documented clones derived from layering have been reported to be small, large ancient ramets have been identified in the Echo Basin area of the Oregon Cascades (Rich Cronn, unpublished data).3 Clonal growth may offer advantages by enabling yellow-cedar individuals to capture more resources and occupy a larger physical space, and to persist and spread in habitats that may be unfavorable for sexual reproduction (Vallejo-Marín et al. 2010). A disadvantage of clonal reproduction is that the effective size of local populations may be reduced relative to stands produced by sexual reproduction, thereby leading to an increase in the self-fertilization rate (Thompson et al. 2008), and the expression of deleterious
3 Data on file at USDA Forest Service, Pacific Northwest Research Station, Forestry Sciences Laboratory, 3200 Jefferson Way, Corvallis, OR 97331.
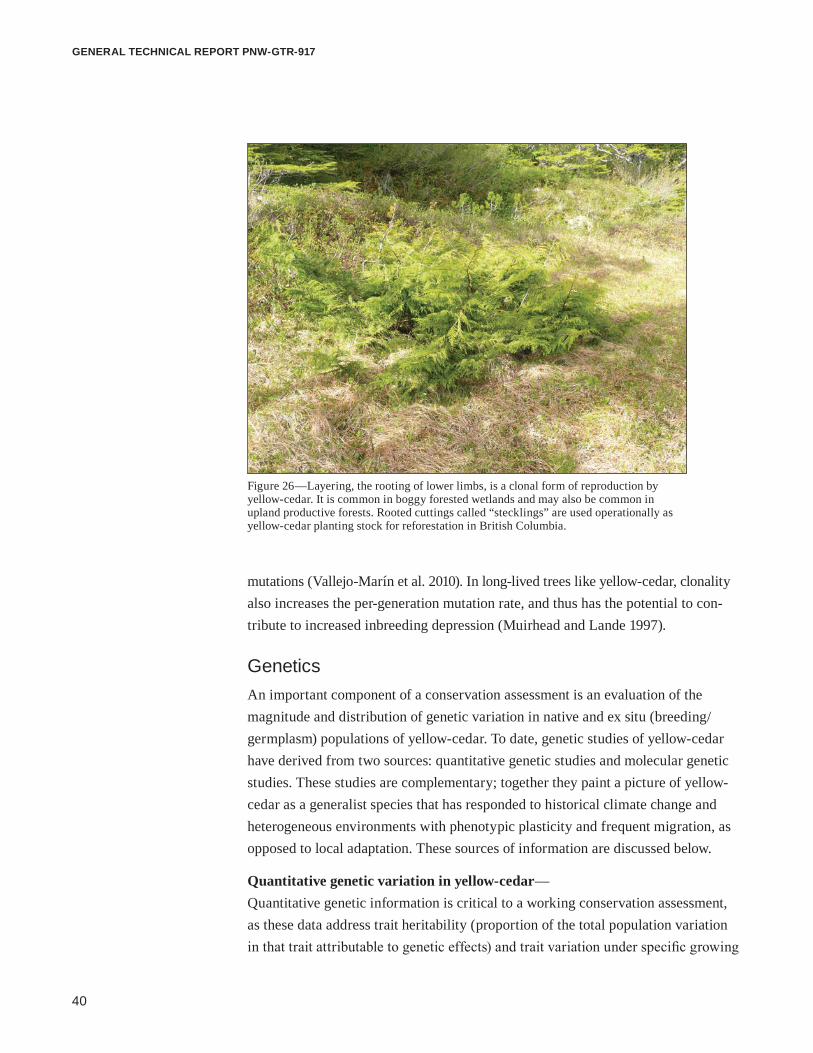
40
GENERAL TECHNICAL REPORT PNW-GTR-917
mutations (Vallejo-Marín et al. 2010). In long-lived trees like yellow-cedar, clonality also increases the per-generation mutation rate, and thus has the potential to con-tribute to increased inbreeding depression (Muirhead and Lande 1997).
GeneticsAn important component of a conservation assessment is an evaluation of the magnitude and distribution of genetic variation in native and ex situ (breeding/germplasm) populations of yellow-cedar. To date, genetic studies of yellow-cedar have derived from two sources: quantitative genetic studies and molecular genetic studies. These studies are complementary; together they paint a picture of yellow-cedar as a generalist species that has responded to historical climate change and heterogeneous environments with phenotypic plasticity and frequent migration, as opposed to local adaptation. These sources of information are discussed below.
Quantitative genetic variation in yellow-cedar— Quantitative genetic information is critical to a working conservation assessment, as these data address trait heritability (proportion of the total population variation in that trait attributable to genetic effects) and trait variation under specific growing
Figure 26—Layering, the rooting of lower limbs, is a clonal form of reproduction by yellow-cedar. It is common in boggy forested wetlands and may also be common in upland productive forests. Rooted cuttings called “stecklings” are used operationally as yellow-cedar planting stock for reforestation in British Columbia.

41
A Climate Adaptation Strategy for Conservation and Management of Yellow-Cedar in Alaska
conditions. Traits modeled in quantitative genetic studies include complex charac-teristics such as plant growth rhythm, biomass accumulation, reproductive output, and biotic/abiotic stress tolerance. Quantitative genetic studies incorporate elements common to ecological studies (e.g., spatial variation), but they explicitly account for genetic phenomena including the mode of transmission (inheritance), penetrance and dominance (trait expression), heritability (ease of trait manipulation, response to selection), and fitness consequences that arise from outbreeding, inbreeding, directional selection, and seed transfer or migration.
Quantitative genetic studies are relevant to conifer landscape restoration and conservation because of the known close association between climatic and edaphic variation and quantitative genetic variation in many conifers (Aitken et al. 2008). The study of this association, called genecology (compare Langlet 1971), forms the basis for transfer guidelines for seedlings and other genetic materials in the U.S. Forest Service and British Columbia Forest Service (Campbell 1971, Johnson et al. 2004, Rehfeldt 1991, Russell and Krakowski 2012). Genecology studies are con-ducted in common gardens so that phenotypic responses of different seed sources can be attributed to their genetic history and composition, rather than phenotypic plasticity to environmental variability. Typically, linear mixed models are used to determine whether differences exist between different populations, and to parti-tion variation among different hierarchies (families, geographic sources, garden environments). Multivariate regression approaches are used to specifically test for associations between genetic variation and physiographic factors (e.g., latitude, longitude, elevation) (Campbell 1971) or climatic variables (temperature, precipita-tion) (St. Clair et al. 2005) that correspond to the seed source locations. Strong correlations between phenotypic responses in common garden studies and the source environment are considered evidence that the trait is responsive to selection, and that the variation is adaptive.
To date, several studies have examined quantitative genetic variation in traits in yellow-cedar. Most have focused on the apportionment of variation within and across populations (Cherry and Lester 1992, El-Kassaby 1995, Russell 1993), and two studies explicitly evaluated this variation in a genecological framework (Rus-sell 1993, Russell and Krakowski 2012). In addition, a more recent study evaluated how additive, dominant, and epistasic modes of inheritance contribute to total vari-ability in yellow-cedar (Russell et al. 2015). All studies were conducted in common gardens with hierarchical variation represented by clones, families, populations, and geographic provenances. An important issue identified in three studies (Cherry and Lester 1992, El-Kassaby 1995, Russell 1993) is that poor germination at the seedling stage presents a large selective barrier to the number of genotypes included

42
GENERAL TECHNICAL REPORT PNW-GTR-917
Table 6—Quantitative traits measured in genetics studies
TraitSignificant by provenancea
Significant by family within provenancea Significant by familya
Percent filled seed n.s.a n.s. n.s.Percent seed germination Cherry and Lester (1992) Russell (1993) n.s.Speed of germination n.s. Russell (1993) n.s.Height at time intervals Cherry and Lester (1992),
Russell (1993), Russell and Krakowski (2012)
Cherry and Lester (1992), Russell (1993), Russell and Krakowski (2012)
n.s.
Root collar diameter Russell (1993) Cherry and Lester 1992, Russell (1993)
n.s.
Shoot weight Cherry and Lester (1992) n.s. n.s.Root weight n.s. n.s. n.s.Nodes to 1st lateral branch n.s. n.s. n.s.Nodes to scalelike foliage n.s. n.s. n.s.Number of lateral branches Cherry and Lester (1992) n.s. n.s.Needles/node n.s. n.s. n.s.Branch angle infection n.s. n.s. n.s.Percent survival to -4 °F Cherry and Lester (1992) n.s. n.s.January cold injury Russell (1993) Russell (1993) n.s.Steckling cold hardiness Russell 1993 (altitude) n.s. Russell and Krakowski
(2012)Terpene production and browse resistance
n.s. n.s. Vourc’h et al. (2002)
Adaptability Russell and Krakowski (2012)b
n.s. n.s.
a Traits showing nonsignificance by provenance, family within provenance, or family are noted as “n.s.”. Traits showing significant differences are identified by the study reporting the result. Cherry and Lester (1992) conducted tests with 1-yr-old seedlings. Russell (1993) used first-year seedlings and 1- to 3-yr-old trees. Vourc’h et al. (2002) used rooted stecklings. Russell and Krakowski (2012) used 15-yr-old trees.b Trait is significant when outlier populations (Oregon, Siskiyou) are included in the study. Trait is nonsignificant for Alaska and British Columbia populations.
in common garden studies. This limitation may prevent genetic diversity associ-ated with seed dormancy from being included in common garden studies, although several lines of evidence suggest that this phenomenon has little effect on common garden results (e.g., Russell and Krakowski 2012, Russell et al. 2015).
The traits examined for yellow-cedar in quantitative genetic studies include life-history and potentially adaptive traits (table 6). Pollen, seed, and seedling traits include factors influenced by the maternal tree and embryo, such as pollen viability, seed production, seed weight, and seed germination rate. Traits related to juvenile growth and differentiation include needle and branch morphology, phenology,

43
A Climate Adaptation Strategy for Conservation and Management of Yellow-Cedar in Alaska
interval height, the allocation of above- and below-ground resources (shoot/root weights and ratios), and cold injury at -4 °F. Traits related to mature growth include survival, height, diameter, tree form, and indices of adaptability (survival × cold damage) and a population index (height × population mean adaptability) (Russell and Krakowski 2012). Based on the evidence from multiple tests, only a few traits show significant differences that are likely to be strongly influenced by genetic variation: these traits are seed germination, height, root collar diameter, shoot weight, speed of germination, cold injury, and “adaptability.” Traits showing the highest likelihood of genetic control and relation to adaption are January cold injury and the “adaptability” index of Russell and Krakowski (2012).
One of the commonly examined adaptive traits measured in conifers—annual height growth, or height growth at a defined time interval—is highly variable in yellow-cedar. A recent study conducted on 15-yr-old trees (Russell and Krakowski 2012) showed a significant source difference in heights, with sources from Alaska, Oregon, and the Siskiyou region of California and Oregon trending shorter than sources from British Columbia. Despite this high variability, traits related to height show weak correlations to climatic or environmental factors related to the original seed source. This result, reported by Cherry and Lester (1992), Russell (1993), and Russell and Krakowski (2012), mirrors findings from other North American Cupressaceae (Harry 1987, Zobel 1985). The finding provides evidence that despite a genetic component to shoot growth in young yellow-cedar (see “Trait heritabili-ties” below), the trait primarily exhibits strong phenotypic plasticity. This result contrasts with other conifer species, such as Douglas-fir (St Clair et al. 2005), where variation in height is correlated with the seed source environment.
Studies of rangewide variation in yellow-cedar (Cherry and Lester 1992, Russell 1993, Russell and Krakowski 2012) report significant among-population variation, but population variation is correlated with the source climate only when the most peripheral yellow-cedar populations (Siskiyou region, interior locations from Oregon and British Columbia, and Prince William Sound) are included in the analysis. If these outlier populations are removed from studies, genetic variation shows no significant correlation with the seed source climate, even though sources span a geographic distance of 1,250 mi and 19° latitude. This phenomenon has led several authors to conclude that there is limited evidence of climate-related adap-tive variation for seed traits, growth traits, and cold-hardiness in yellow-cedar. In the words of Russell (1993), “Yellow-cedar seems to have evolved an intermediate mode of adaptation with less genetic differentiation associated with geography than Douglas-fir, Sitka spruce, and western hemlock, but more genetic differentiation than western white pine and western redcedar.”

44
GENERAL TECHNICAL REPORT PNW-GTR-917
Table 7—Narrow-sense (h2) and broad-sense (H2) trait heritabilities in yellow-cedar
Trait Heritability estimate Reference
Height: 32 wk, yr 1, yr 2, yr 3 h2 = 0.69, 0.64, 0.44, 0.31 Cherry and Lester (1992), Russell (1993), Russell and Krakowski (2012)
Height: yr 12 h2 = 0.07–0.45 Baltunis et al. (2013), Russell et al. (2015)
Shoot growth, first-year growth H2 = 0.58 Russell (1993)Index of injury to cold H2 = 0.38 Russell (1993)Reproductive yellow-cedar plasticity H2 = 0.36 El-Kassaby et al. (1993)Root collar diameter: 32 wk, yr 2 h2 = 0.30, 0.17 Russell (1993)Diameter at breast height: yr 12 h2 = 0.06–0.27 Russell et al. (2015)Total growth at growth cessation h2 = 0.16 Russell (1993)Tree form: yr 12 h2 = 0.02–0.05 Russell et al. (2015)
Trait heritabilities—The heritability of a trait is the proportion of the total popula-tion variation in that trait attributable to genetic effects. Heritability is key to un-derstanding how readily a trait responds to natural selection in the environment or to selection in tree improvement programs. Quantitative genetic studies commonly estimate narrow-sense heritabilities (h2), which consider the portion of total pheno-typic variance (Var P) that is due to additive (allelic) genetic effects (Var A):
The response to selection is a function of the product of narrow-sense heri-tability and the strength of selection. Traits with high heritabilities require com-paratively weak selection to change population means; conversely, traits with low heritabilities require strong selection to change population means.
Examples of trait heritabilities estimated for yellow-cedar are shown in table 7. Traits showing heritabilities of ≥0.10 are often used in conifer breeding programs, as recurrent strong selection on these traits can change population means in a few generations. Traits showing heritabilities of this magnitude include seedling and young tree height, shoot growth during first-year growth, diameter at age 12, cold injury during acclimation, and maximum cold hardiness. Nonadditive inheritance due to dominance or epistasis is negligible in traits examined to date (height, diam-eter; Russell et al. 2015), and the species shows minimal genotype × environment interactions (Baltunis et al. 2013, Russell et al. 2015).

45
A Climate Adaptation Strategy for Conservation and Management of Yellow-Cedar in Alaska
Seed transfer guidelines—Seed and clone transfer guidelines have been estab-lished for yellow-cedar based on direct quantitative/common garden data (Russell 1993, Russell and Krakowski 2012) and indirect comparisons with common gar-den data from other conifer species (Randall and Berrang 2002) and from different geographic/topographic provinces (Alden 1991). In the examples based on common garden data, the metric used to establish a seed transfer guideline is a “risk factor” associated with seed transfer, and it is based on the impact of transfer on individual tree productivity, stand-level survival, and changes in the susceptibility to pests and diseases. In examples of pest and disease susceptibility (Alden 1991, Randall and Berrang 2002), tree seed zones were based on inferred barriers to historical migra-tion (e.g., mountain ranges or channels and straits), and differences in minimum annual temperature. The results of these early efforts were geographically oriented “seed transfer” maps that divided the range of yellow-cedar into “transfer zones”: 5 zones for Oregon and Washington (Randall and Berrang 2002), 4 zones for British Columbia (Russell 1993), and perhaps as many as 40 zones for southeast Alaska (Alden 1991).
Recently, there has been a shift towards defining seed transfer guidelines by relating growth to climate models, also known as climate-based seed transfer (Aitken et al. 2008, Bower et al. 2014, O’Neill et al. 2008, St Clair et al. 2005). This approach is particularly important in the context of climate change, as future seed zones can be modeled if projected climate data are available (O’Neill et al. 2008, St Clair and Howe 2007). With this new perspective, Russell and Krakowski (2012) recently summarized 15-yr growth data from 12 provenance trials in Brit-ish Columbia. The trees in this study spanned the range of yellow-cedar, from the Siskiyou Mountains of California (41.8° N) to Mitkof Island, Alaska (55.8° N). Climate varies greatly across this range, with a twofold difference in the length of growing season and a more than fourfold difference in mean annual precipitation. Additionally, these data are derived from five common garden sites that ranged from cold and arid (mean annual temperature = 37 °F; mean annual precipitation = 30 in) to warm and moist (mean annual temperature = 47 °F; mean annual precipita-tion = 114 in).
Regional differentiation in adaptability and survival was detected only when populations from California and Oregon were included in the analysis. Trees from these sources were significantly smaller and showed lower survival at the British Columbia garden locations than trees from all other sources. If these locations are omitted, tree responses showed no significant relationship to geographic source, and population performance could not be predicted with climatic factors. Russell and Krakowski (2012) conclude that yellow-cedar is a “climate generalist” that

46
GENERAL TECHNICAL REPORT PNW-GTR-917
shows phenotypic plasticity to differences in local climate, but no genetic adapta-tion to climate variation. They also point out that although yellow-cedar shows little differentiation across a large geographic expanse, the central “core” of the yellow-cedar range is homogeneous with respect to climatic factors, even at scales of ≥600 mi. Hence, where early transfer recommendations in British Columbia were limited to approximately 3° latitude and ±1,600 ft of elevation (Russell 1993), the best avail-able science shows that the species can be transferred over 10° latitude with little risk of maladaptation.
The study by Russell and Krakowski (2012) does not explicitly extend to Alaskan populations of yellow-cedar, but their findings are important for Alaskan populations because they show that: (1) yellow-cedar is a climate generalist, (2) historical seed zones for yellow-cedar (e.g., Alden 1991, Randall and Berrang 2002) are too restrictive across their entire range, and (3) some northern populations are currently maladapted to their local environment because of climate change. This last issue is critical for future management of yellow-cedar in Alaska. Evidence from Russell and Krakowski (2012) shows that distant southerly and interior populations are likely to show much higher fitness and adaptability than the trees currently occupying southeast Alaska. For this reason, the use of geographically local Alaska sources (e.g., Alden 1991) for reforestation will not address the current adaptational lag that exists with climate, and it may exacerbate the adaptational lag with future climate change. How far trees can be safely transferred across Alaska remains to be formally evaluated, but distances up to hundreds of miles (several degrees latitude) should be tested.
Molecular genetic variation in yellow-cedar— Molecular genetic information provides important insights into yellow-cedar con-servation, as these data address the magnitude of hidden genetic variation that can-not be measured in common garden settings. Molecular genetic studies can incor-porate information derived from: (1) the genome of individuals or populations using DNA sequences, (2) transcribed messenger RNA copies of genes, and (3) proteins or metabolic products derived from gene pathways. Traditionally, molecular mark-ers have sampled only a tiny fraction of a genome. For this reason, they were rarely linked to genes responsible for quantitative or adaptive variation, but they could provide a proxy for “hidden” variation that could not be quantified in common gardens. New advances in genome sequencing can sample a higher proportion of the genome, and these methodologies may soon make it possible to identify associa-tions between DNA and traits for simple and complex traits.

47
A Climate Adaptation Strategy for Conservation and Management of Yellow-Cedar in Alaska
Where quantitative traits can be used to show the strength of artificial or natural selection, molecular markers reveal the impact of neutral processes such as drift and migration. For this reason, they can be used to examine patterns of histori-cal and contemporary migration, historical changes in population size, and random sampling due to mating. In restoration or breeding populations, molecular markers provide individual identifications, monitor the effectiveness of pollination or seed harvesting methods, and identify germplasm sources for conservation. They can also be used to develop conservation collections that maximize genetic diversity in a small population size.
At present, three classes of molecular markers have been used to assess genetic variation in yellow-cedar. These technologies are briefly described, and advantages of each are outlined in table 8.
1. Allozymes. Developed in the 1950s, allozyme electrophoresis separates enzymes by the protein amino acid sequence. Mutations in amino acid sequences produce polymorphisms with a small number of variants (two to three per gene). Allozymes have a very low per-sample cost (typically a few dollars per sample). Allozymes were used in the rangewide study of yellow-cedar by Ritland et al. (2001).
2. Short simple repeat (SSR) markers. Developed in the 1970s, SSR markers (or “microsatellites”) are tandemly repeated DNA sequences (2–6 bases) that create a multistate polymorphism with a very large number of variants
Table 8—Attributes of allozyme, short simple repeat (SSR), and single nucleotide polymorphism (SNP) genotyping methods (adapted from Guichoux et al. 2011)
Methodological advantages AllozymeSSR
markersSNP
markers
Low development cost ×Low ascertainment bias (bias imparted by process of identifying variation) × ×High power to detect mixed genotypes (e.g., pollen pools) ×High power, accuracy in pedigree analysis ×Detecting recent population expansion, migration ×Identifying private alleles, unique population genetic variation × ×Power to identify linkage disequilibrium and association with phenotypes × ×Accurate estimation of allele frequencies from small samples × ×Low mutation rate, accurate predictor of long-term history × ×Ultra-high throughput methods available ×No need to include common controls among studies over time ×Can be used to assay any tissue (fresh, dried, frozen, degraded/dead) × ×Can be directly linked to regions of the genome that control traits of interest × ×

48
GENERAL TECHNICAL REPORT PNW-GTR-917
(often 20 per gene). These markers have high mutation rates, high infor-mation content, and a low per-sample cost (typically tens of dollars per sample). They have been developed for yellow-cedar (Bérubé et al. 2003, Jennings et al. 2013) and have been applied to studies of clonality in yel-low-cedar (Bérubé et al. 2003, Thompson et al. 2008) and regional genetic diversity across Alaska (Cronn et al. 2014).
3. Single nucleotide polymorphism (SNP) markers. These markers originated with the advent of DNA sequencing in the 1970s, and they represent the most abundant variation in the genome. Because SNP markers show a sim-ple polymorphism (two variants per gene) and exhibit low mutation rates, SNP analyses require large numbers of markers to be informative. These analyses are comparatively expensive on a per-sample basis (often >$100 per sample), but the method is amenable to high-throughput analysis and genome-scale coverage. To date, SNP markers have not been used to study yellow-cedar, but they are likely to be used in the future.
Molecular genetic studies have been conducted on yellow-cedar, although only two studies have specifically included Alaskan populations. Studies have consid-ered many different perspectives, with the greatest number focusing on the evo-lutionary history and phylogenetic resolution of the genus Callitropsis (Mao et al. 2010, Wang et al. 2003, Yang et al. 2012), spatial genetic variation of yellow-cedar populations (Bérubé et al. 2003, Ritland et al. 2001), and the extent of inbreeding in natural (Thompson et al. 2008) and managed (Massah et al. 2010) populations. An additional study described a single-gene homologue of the hormone abscisic acid-insensitive 3 (Lazarova et al. 2002). One published study included a small number of samples from Alaska populations (Ritland et al. 2001), although a newer study has been completed that describes the magnitude and pattern of nuclear genetic variation in Alaska populations (Cronn et al. 2014).
Across all molecular studies, the consensus emerging for yellow-cedar is that the species shows a high level of genetic variation, but little spatial genetic structure across an enormous latitudinal range. The spatial genetic structure that is evident is driven by locally high rates of self-pollination and clonal reproduction, both of which drive populations towards greater homozygosity (similar genes). These findings—high variability, but no detectable spatial differentiation across large geographic scales—mirror those observed in quantitative genetic studies. This information has implications for the management of yellow-cedar, particularly for collecting and propagating materials for restoration activities.

49
A Climate Adaptation Strategy for Conservation and Management of Yellow-Cedar in Alaska
Nuclear genomic variation—The nuclear genome of yellow-cedar has much in common with other Cupressoid trees, with 11 chromosomes (the common number in the family) composed of 12.5 billion base pairs (Bennett and Leitch 2012). The high degree of genomic conservation in the Cupressaceae is important because two species, Asian Chamaecyparis obtusa (hinoki cypress) and North American Thuja plicata (western redcedar), are gaining attention as potential genomic mod-els. Atlases of expressed genes (“transcriptome references”) are already available for these species (University of Alberta 2015), and should be directly transferable to yellow-cedar. When a Cupressoid genome is sequenced, colinearity and gene conservation with yellow-cedar are highly likely, which will enable detailed genetic analysis of genes controlling adaptive traits in yellow-cedar.
Allozyme variation—To date, only one published report exists for allozyme varia-tion in yellow-cedar (Ritland et al. 2001). In this study, allozyme variation was assayed by using 530 trees from 17 populations across the range of the species, from California to Alaska. Genetic information was gathered from eight isoenzyme systems. In general, allozyme variation in yellow-cedar was comparable to that of other Cupressaceae members for many indices, such as the number of variants, or alleles, per locus; percentage of loci that were polymorphic; total observed hetero-zygosity; and inbreeding coefficient (table 9).
This study included four yellow-cedar populations from Alaska. The “Anchor-age” population (Prince William Sound) showed the lowest allelic diversity and heterozygosity in the study; this finding is not surprising, given the degree of geo-graphic isolation of this population. One unexpected finding in this study was the large and variable estimated inbreeding coefficient for Alaskan populations. These estimates suggest that local inbreeding rates can reach exceptionally high levels (37 percent and 60 percent in Prince William Sound and Petersburg, respectively),
Table 9—Allozyme variation in yellow-cedar, as compared to other Pacific Northwest Cupressaceae and other gymnosperms
Species La A PPL FHexp or (HT)
FST or GST Reference
Yellow-cedar 10 1.7 50 0.184 0.17 0.14 Ritland et al. (2001)Western redcedar 19 1.2 16 0.057 0.04 0.03 Yeh (1998)Port-Orford-cedar 32 1.9 65 0.150 0.15 0.05 Millar and Marshall (1991)Average for 89 gymnosperms 17 2.4 71 0.26 0.07 Hamrick et al. (1992)a Abbreviations: L = number of loci screened; A = average number of alleles per locus; PPL = percent polymorphic loci; F = Wright’s inbreeding coefficient; Hexp = expected heterozygosity; HT = total heterozygosity; FST = Wright’s estimator for population-level differentiation (or GST, for loci with multiple alleles).

50
GENERAL TECHNICAL REPORT PNW-GTR-917
which are unusual for conifers (compare Ritland et al. 2001: table 2). Phylogeo-graphic inferences resulting from this study were complicated, as populations >1,000 mi apart (e.g., Prince William Sound versus Mount Washington, B.C.; or, Juneau, Alaska, versus Oakridge, Oregon) appeared to be more closely related to each other than they were to neighboring populations.
Although the Ritland et al. (2001) paper is the first report for molecular genetic variation in yellow-cedar, the allozyme methodology has limitations that may have affected the conclusions reached. A major limitation is that allozyme vari-ability was exceedingly low. In this study (Ritland et al. 2001), four loci showed no variation, and the greatest number of alleles observed at any locus was three. As a consequence, the study includes an unusually large number of repeated genotypes (81 percent of the total), and repeated genotypes were shared among the most geographically separated populations (Whiskey Peak, California, to Prince William Sound). It is improbable for individuals from distant populations to be genetically identical or share recent coancestry; a more reasonable explanation is that allo-zymes could not discriminate even highly divergent individuals. This low level of variation was also paired with a limited genomic sampling, as the study included 10 marker loci. This number of loci is much lower than the average from 89 published allozyme studies of gymnosperms before 1992 (17 loci; Hamrick et al. 1992), and the number used in a similarly designed study of Port-Orford-cedar (32 loci; Millar and Marshall 1991).
Given the low power of allozymes for discriminating variation in yellow-cedar by location, the unusual phylogeographic patterns described in this paper (i.e., affinity between populations from Alaska and Oregon) may be inaccurate. Forest managers are advised to avoid making interpretations based on this paper until the results are confirmed with genetic markers with higher discriminatory power between individuals.
Microsatellite variation—Two studies have described 14 microsatellite loci from the nuclear genome of yellow-cedar. Bérubé et al. (2003) used a yellow-cedar source from British Columbia to produce a library of genomic clones enriched in micro-satellite sequences; from this pool, five loci showed expected segregation in known pedigrees. The second study used a yellow-cedar source from Alaska (Petersburg Ranger District) to produce a library of 489,000 DNA sequences (Jennings et al. 2011, 2013). Screening of 96 repeat-containing regions revealed 9 loci that con-formed to Hardy-Weinberg expectations in Alaskan populations.
Individual microsatellite markers reveal 20 times more genetic variation than do allozymes (table 10). When combined, the available microsatellite markers have the potential to resolve >1 billion unique genotypes. The markers identified by Jennings
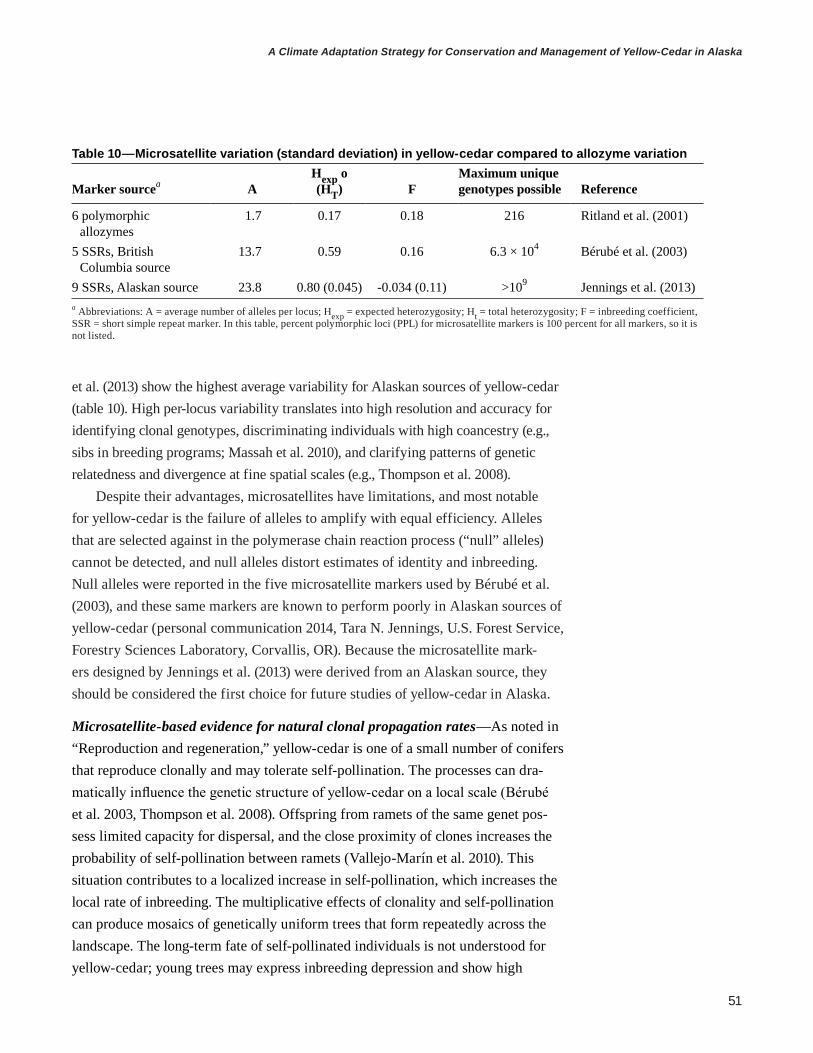
51
A Climate Adaptation Strategy for Conservation and Management of Yellow-Cedar in Alaska
Table 10—Microsatellite variation (standard deviation) in yellow-cedar compared to allozyme variation
Marker sourcea AHexp o (HT) F
Maximum unique genotypes possible Reference
6 polymorphic allozymes
1.7 0.17 0.18 216 Ritland et al. (2001)
5 SSRs, British Columbia source
13.7 0.59 0.16 6.3 × 10⁴ Bérubé et al. (2003)
9 SSRs, Alaskan source 23.8 0.80 (0.045) -0.034 (0.11) >109 Jennings et al. (2013)a Abbreviations: A = average number of alleles per locus; Hexp = expected heterozygosity; Ht = total heterozygosity; F = inbreeding coefficient, SSR = short simple repeat marker. In this table, percent polymorphic loci (PPL) for microsatellite markers is 100 percent for all markers, so it is not listed.
et al. (2013) show the highest average variability for Alaskan sources of yellow-cedar (table 10). High per-locus variability translates into high resolution and accuracy for identifying clonal genotypes, discriminating individuals with high coancestry (e.g., sibs in breeding programs; Massah et al. 2010), and clarifying patterns of genetic relatedness and divergence at fine spatial scales (e.g., Thompson et al. 2008).
Despite their advantages, microsatellites have limitations, and most notable for yellow-cedar is the failure of alleles to amplify with equal efficiency. Alleles that are selected against in the polymerase chain reaction process (“null” alleles) cannot be detected, and null alleles distort estimates of identity and inbreeding. Null alleles were reported in the five microsatellite markers used by Bérubé et al. (2003), and these same markers are known to perform poorly in Alaskan sources of yellow-cedar (personal communication 2014, Tara N. Jennings, U.S. Forest Service, Forestry Sciences Laboratory, Corvallis, OR). Because the microsatellite mark-ers designed by Jennings et al. (2013) were derived from an Alaskan source, they should be considered the first choice for future studies of yellow-cedar in Alaska.
Microsatellite-based evidence for natural clonal propagation rates—As noted in “Reproduction and regeneration,” yellow-cedar is one of a small number of conifers that reproduce clonally and may tolerate self-pollination. The processes can dra-matically influence the genetic structure of yellow-cedar on a local scale (Bérubé et al. 2003, Thompson et al. 2008). Offspring from ramets of the same genet pos-sess limited capacity for dispersal, and the close proximity of clones increases the probability of self-pollination between ramets (Vallejo-Marín et al. 2010). This situation contributes to a localized increase in self-pollination, which increases the local rate of inbreeding. The multiplicative effects of clonality and self-pollination can produce mosaics of genetically uniform trees that form repeatedly across the landscape. The long-term fate of self-pollinated individuals is not understood for yellow-cedar; young trees may express inbreeding depression and show high
52
GENERAL TECHNICAL REPORT PNW-GTR-917
mortality at early life stages, or they may show reduced fertility. The local clustering of clones has practical considerations for seed collection and restoration (Russell and Krakowski 2012, Thompson et al. 2008).
Ritland et al. (2001) provided the first evidence for clonality in yellow-cedar, although the allozyme markers used in this study lacked the power to discriminate individual trees separated by large distances (e.g., hundreds of miles). The microsat-ellite-based study of Bérubé et al. (2003) had sufficient power to show that clones were abundant at the three sampled populations, and that they ranged in frequency from 10 percent at Mount Seymour, B.C., to 25 percent at Black Tusk, B.C. Thomp-son et al. (2008) conducted more extensive surveys from the same populations and showed that clonal reproduction could account for 70 percent of the trees in plots approximately 1/8 ac in size. The largest clonal patch discovered by these authors was 43 ft long. Cloning in yellow-cedar has been described in Alaska based on physical connections of roots and branches in groups of trees (Hennon et al. 1990), but the extent and maximum size of a clone are not yet known. An ongoing study aims to determine the size and frequency of clones along transects in Alaska.
A large, rangewide survey of yellow-cedar from 129 populations (Cronn et al. 2014) found a studywide average of 3.2 percent of repeated genotypes. Three pairs of repeated genotypes were shared between populations, separated by remark-able distances of 48 mi, 88 mi, and 227 mi. Sharing of repeated genotypes at this scale could be due to chance, back-mutation to the same microsatellite genotype in unrelated plants, or long-distance dispersal of cones or vegetative material by cataclysmic events such as flooding in coastal forests (e.g., storms or tsunamis). Cataclysmic dispersal may seem improbable, but back-mutation is equally improb-able. To highlight how unusual repeated genotypes are, a recently completed microsatellite survey of nearly 1,100 wild-collected trees of a related conifer (Port-Orford-cedar) revealed no repeated genotypes (Cronn et al. 2013).
Microsatellite-based evidence for natural self-pollination and inbreeding rates—Given the potential for clonal reproduction, inbreeding rates could be elevated in yellow-cedar, potentially giving rise to patchy, less random distribution of genetic variation on the landscape. The most common measure of inbreeding is Wright’s inbreeding coefficient (F), which measures the difference in observed (HO ) and expected (HE) heterozygosities, scaled to the expected heterozygosity (HE – HO / HE). Restated, F provides an indication of whether populations show a deficiency of heterozygotes (inbreeding condition) or an excess of heterozygotes (outbreeding condition), relative to equilibrium expectations. If the rate of self-pollination is con-stant across generations, then the self-pollination rate is approximately proportional to F through the relationship 2F / (1 + F).
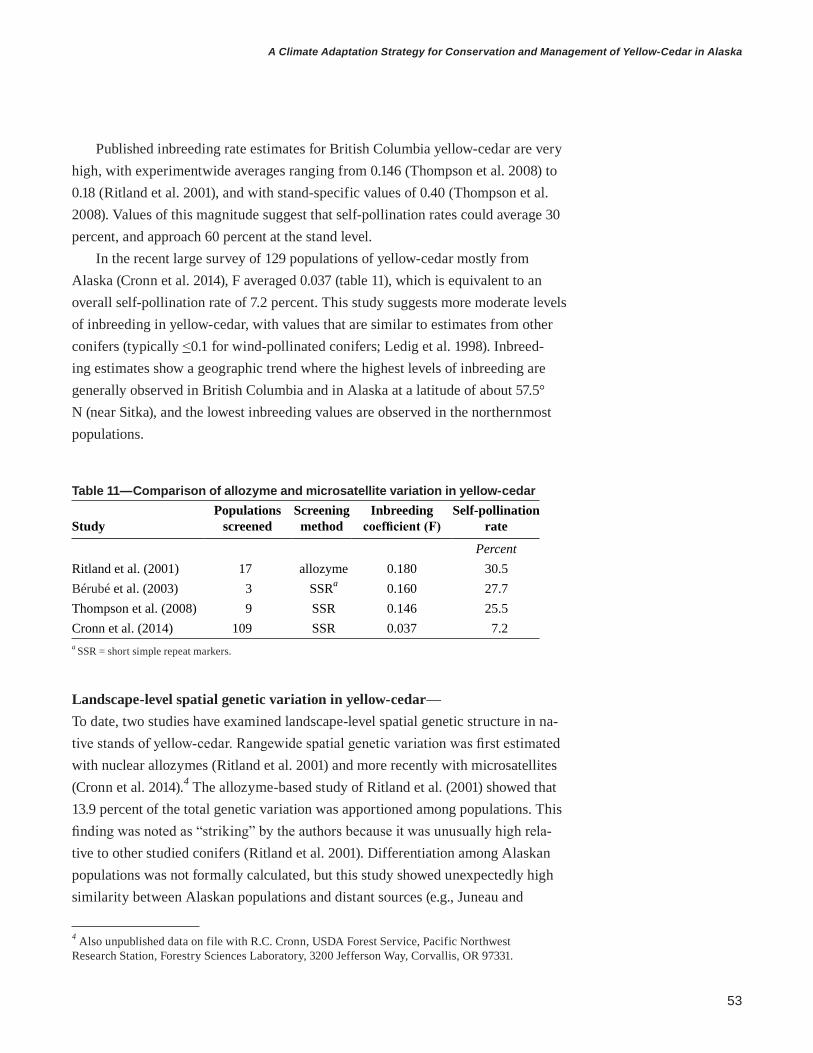
53
A Climate Adaptation Strategy for Conservation and Management of Yellow-Cedar in Alaska
Table 11—Comparison of allozyme and microsatellite variation in yellow-cedar
StudyPopulations
screenedScreening method
Inbreeding coefficient (F)
Self-pollination rate
PercentRitland et al. (2001) 17 allozyme 0.180 30.5Bérubé et al. (2003) 3 SSRa 0.160 27.7Thompson et al. (2008) 9 SSR 0.146 25.5Cronn et al. (2014) 109 SSR 0.037 7.2a SSR = short simple repeat markers.
Published inbreeding rate estimates for British Columbia yellow-cedar are very high, with experimentwide averages ranging from 0.146 (Thompson et al. 2008) to 0.18 (Ritland et al. 2001), and with stand-specific values of 0.40 (Thompson et al. 2008). Values of this magnitude suggest that self-pollination rates could average 30 percent, and approach 60 percent at the stand level.
In the recent large survey of 129 populations of yellow-cedar mostly from Alaska (Cronn et al. 2014), F averaged 0.037 (table 11), which is equivalent to an overall self-pollination rate of 7.2 percent. This study suggests more moderate levels of inbreeding in yellow-cedar, with values that are similar to estimates from other conifers (typically <0.1 for wind-pollinated conifers; Ledig et al. 1998). Inbreed-ing estimates show a geographic trend where the highest levels of inbreeding are generally observed in British Columbia and in Alaska at a latitude of about 57.5° N (near Sitka), and the lowest inbreeding values are observed in the northernmost populations.
Landscape-level spatial genetic variation in yellow-cedar— To date, two studies have examined landscape-level spatial genetic structure in na-tive stands of yellow-cedar. Rangewide spatial genetic variation was first estimated with nuclear allozymes (Ritland et al. 2001) and more recently with microsatellites (Cronn et al. 2014).4 The allozyme-based study of Ritland et al. (2001) showed that 13.9 percent of the total genetic variation was apportioned among populations. This finding was noted as “striking” by the authors because it was unusually high rela-tive to other studied conifers (Ritland et al. 2001). Differentiation among Alaskan populations was not formally calculated, but this study showed unexpectedly high similarity between Alaskan populations and distant sources (e.g., Juneau and
4 Also unpublished data on file with R.C. Cronn, USDA Forest Service, Pacific Northwest Research Station, Forestry Sciences Laboratory, 3200 Jefferson Way, Corvallis, OR 97331.
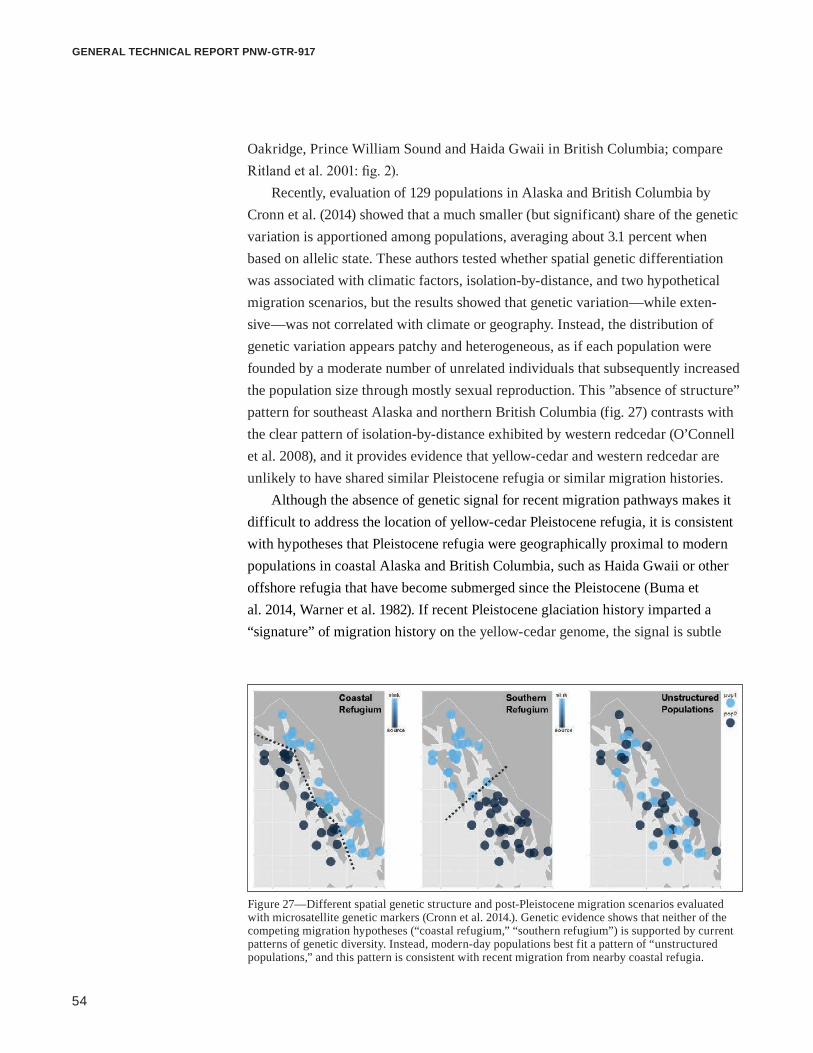
54
GENERAL TECHNICAL REPORT PNW-GTR-917
Oakridge, Prince William Sound and Haida Gwaii in British Columbia; compare Ritland et al. 2001: fig. 2).
Recently, evaluation of 129 populations in Alaska and British Columbia by Cronn et al. (2014) showed that a much smaller (but significant) share of the genetic variation is apportioned among populations, averaging about 3.1 percent when based on allelic state. These authors tested whether spatial genetic differentiation was associated with climatic factors, isolation-by-distance, and two hypothetical migration scenarios, but the results showed that genetic variation—while exten-sive—was not correlated with climate or geography. Instead, the distribution of genetic variation appears patchy and heterogeneous, as if each population were founded by a moderate number of unrelated individuals that subsequently increased the population size through mostly sexual reproduction. This ”absence of structure” pattern for southeast Alaska and northern British Columbia (fig. 27) contrasts with the clear pattern of isolation-by-distance exhibited by western redcedar (O’Connell et al. 2008), and it provides evidence that yellow-cedar and western redcedar are unlikely to have shared similar Pleistocene refugia or similar migration histories.
Although the absence of genetic signal for recent migration pathways makes it difficult to address the location of yellow-cedar Pleistocene refugia, it is consistent with hypotheses that Pleistocene refugia were geographically proximal to modern populations in coastal Alaska and British Columbia, such as Haida Gwaii or other offshore refugia that have become submerged since the Pleistocene (Buma et al. 2014, Warner et al. 1982). If recent Pleistocene glaciation history imparted a “signature” of migration history on the yellow-cedar genome, the signal is subtle
Figure 27—Different spatial genetic structure and post-Pleistocene migration scenarios evaluated with microsatellite genetic markers (Cronn et al. 2014.). Genetic evidence shows that neither of the competing migration hypotheses (“coastal refugium,” “southern refugium”) is supported by current patterns of genetic diversity. Instead, modern-day populations best fit a pattern of “unstructured populations,” and this pattern is consistent with recent migration from nearby coastal refugia.

55
A Climate Adaptation Strategy for Conservation and Management of Yellow-Cedar in Alaska
and cannot be detected from changes in microsatellite allele frequencies. Larger chromosome-scale genome sampling methods may show much finer discrimina-tion, as has recently been shown for human populations over a small geographic range (Leslie et al. 2015).
Molecular genetic data cannot answer all questions of yellow-cedar population history and differentiation; however, studies to date show that the founding source or sources for yellow-cedar in Alaska were genetically diverse, that they expanded at an exponential rate, and that the variation is still being sorted across coastal Alaska and adjacent British Columbia.
PaleoecologyLong-term history of Cupressaceae— The Cupressaceae family evolved some 200 million yr ago in the Triassic period (Taylor and Taylor 1993). Taxa with affinity to yellow-cedar first appeared in the Miocene (Kotyk et al. 2003), although similar macrofossil foliage dates to the Eocene (Axelrod 1976) and cones date to the Late Cretaceous. The fossil record indicates that close relatives of yellow-cedar were once more broadly distributed in the Northern Hemisphere than at present. As of today, they appear to have been confined to moist climates, and some species were lost with climate shifts to drier environments (Kotyk et al. 2003).
Pleistocene and Holocene epochs—Paleoecology studies offer some understand-ing of the species composition of forests in coastal Alaska that emerged and devel-oped as the major ice sheets from the Pleistocene retreated from their maximum advancement some 20,000 yr ago. In southeast Alaska, climate during the late Pleistocene and the subsequent Holocene epoch can be interpreted from the com-position of trees and other plants in pollen profiles taken from lake and peat sedi-ments, including 17 sites investigated by Heusser (1952, 1960). These pollen pro-files provide direct evidence of the postglacial abundance of conifers in southeast Alaska; however, there is the possibility of some long-distance pollen dispersal from trees not growing locally (Elias 2013). Although macrofossils (e.g., foliage, cones, and wood) can also be used to detect the history of vegetation, pollen is par-ticularly useful because it integrates plant abundance from surrounding areas. But some species’ pollen cannot be readily distinguished in the pollen record, or may undergo more rapid breakdown, thus artificially deflating an estimate of the relative abundance of a species in the pollen record (Heusser 1960).

56
GENERAL TECHNICAL REPORT PNW-GTR-917
Temperatures and precipitation about 4,500 yr ago appear to have reached levels somewhat similar to the current maritime climate, both in Alaska (Heusser et al. 1985) and in British Columbia (Mathewes and Heusser 1981). This approximate date corresponds to the establishment of modern western hemlock-Sitka spruce forest composition evident in many pollen cores (Viens 2001) (table 12).
Unfortunately, yellow-cedar was not included in the early pollen studies because, as Heusser (1960: 78) stated, the pollen of Chamaecyparis and some other species had “fragility and non-resistance to decay… [Therefore] it was decided they be omitted” from analysis. Another problem is that pollen of yellow-cedar is difficult to distinguish from that of western redcedar and juniper, and is often tallied as “Cupressaceae pollen” or “cedar-type pollen.” The Cupressaceae family was included in several more recent pollen studies in British Columbia just south of Alaska and reportedly became abundant about 7,000 yr ago (Banner et al. 1983, Hebda and Mathewes 1984), which indicated a cooling trend in climate.
A cool, wet climate with its associated development of poorly drained organic soils (Ugolini and Mann 1979) favors both cedar species (Banner et al. 1983, Hebda 1983). The arrival of western redcedar in Alaska was probably via migration up the coast from southerly distributions (Hebda and Mathewes 1984, O’Connell et al. 2008). At several sites, evidence from pollen studies indicates that the first Cupres-saceous pollen likely to be from yellow-cedar appeared about 5,000 yr ago, and that it became locally abundant in the following millennia. Ager and Rosenbaum (2007) showed that cedar pollen on Prince of Wales Island (Pass Lake) dates to about 5,000 yr before present, and that it became abundant 1,500 yr ago. Hebda (1983) reported that Cupressaceae pollen made a relatively recent appearance about 3,000 yr ago in pollen profiles at a bog site on northern Vancouver Island. Farther north at Mitkof Island near Petersburg, cedar pollen became abundant only about 2,200 yr ago (Ager et al. 2010). Studies similar to these could begin to fill in the historical occur-rence of yellow-cedar at different locations in Alaska.
Table 12—Interpretation of late Pleistocene and Holocene climate and dominant vegetation in southeast Alaska (adapted from a narrative in Viens 2001)
Geologic epoch Years before present Climate Dominant vegetation
Late Pleistocene 16,000–12,500 12,500–9,000
Cool, dry Warm, dry
Tundra/shrubs Pine, alder, willow
Holocene 9,000–6,800 6,800–4,500 4,500–present
Warm, wet Trending wet, cool Cool, wet
Spruce, hemlock Hemlock, spruce, cedar Modern flora
57
A Climate Adaptation Strategy for Conservation and Management of Yellow-Cedar in Alaska
Debate over Pleistocene refugia and migration pathways in Alaska—The two cedars, western redcedar and yellow-cedar, may have different origins and history in Alaska. A recent review paper (Elias 2013) dismissed the possibility of late-Pleistocene refugia as origins for tree species in Alaska and argued that the closest possibilities were in Haida Gwaii. A response paper (Buma et al. 2014) provides evidence of the Alaska refugia by summarizing information from geology, posi-tions of glacial maximum, small-mammal genetics, and tree species distributions and migration rates.
Yellow-cedar has an incomplete current distribution in coastal Alaska, with some large areas of apparently suitable habitat unoccupied (see “Yellow-Cedar Distribution,” this section). The variable presence and absence of yellow-cedar in suitable areas has been noted in the three plant association guides for the Tongass National Forest (DeMeo et al. 1992, Martin et al. 1995, Pawuk and Kissinger 1989). This distribution pattern led us to hypothesize that the rarity of yellow-cedar in the northeastern portion of the panhandle is explained by the distance from the sus-pected Alaska glacial refugia (Carrara et al. 2003) and the likelihood of an eastward migration from refugia in the western coastal areas. The discontinuous occurrence of yellow-cedar along the Gulf of Alaska with presence in Prince William Sound also aligns with the respective absence and presence of known refugial areas. Yellow-cedar may be able to persist during unfavorable climatic episodes, (e.g., the early Holocene epoch) on wet microsites, such as those with abundant soil moisture from groundwater discharge, and may possibly be aided by its ability to survive in shrubby form (layering) (Hebda 1997). Relative to other tree species, a slow postglacial migration from refugia in the western parts of the panhandle and small populations in Prince William Sound could reflect the poor regeneration capacity of yellow-cedar (Harris 1990, Klinka 1999) and strict germination requirements (Pawuk 1983).
As noted under “Genetics,” little of the genetic variation described for yellow-cedar (Cronn et al. 2014, Ritland et al. 2001) is currently explained by geography, and this result may be a consequence of the recent recolonization history of yellow-cedar in Alaska. If palynological evidence is correct in placing yellow-cedar to these dates, the average generation time (defined as years required for offspring to replace parent in stand) for yellow-cedar is probably measured in hundreds of years, and only 15 to 50 generations of trees separate modern-day populations from the founding events that gave rise to these stands. The high genetic variability of yellow-cedar in Alaska shows no evidence of a genetic bottleneck, and is consistent with yellow-cedar occupancy in Alaska throughout the Pleistocene. Our current understanding of the broad-scale genetic structure does not reveal patterns of
58
GENERAL TECHNICAL REPORT PNW-GTR-917
Holocene migration, whether they are from origins in British Columbia or Alaskan refugia. Nor does it currently distinguish the isolated populations in Prince Wil-liam Sound, which may have originated from ice-free refugia near the outer coastal Hinchinbrook and Montague Islands.
Little Ice Age—More recently, a cooler shift, known as the Little Ice Age, oc-curred in the Northern Hemisphere beginning ≥500 yr ago. The onset of the Little Ice Age is uncertain, with initial dates of 1200–1500 C.E. given in the literature. The influence of the Little Ice Age on the climate of forested regions in southeast Alaska is not clearly understood, but advances and retreats of glaciers are consis-tent with changes in the climate in ice fields at higher elevations than where for-ests grow (Viens 2001). During the Little Ice Age most of the glaciers in coastal Alaska reached their maximum extensions of the last 13,000 yr since the end of the Pleistocene epoch (Calkin et al. 2000). It is not known whether these glacial ad-vances were driven by colder temperatures or by increased snowfall.
The end of the Little Ice Age in the mid-to-late 1800s was associated with the onset of yellow-cedar decline, which we have dated as beginning in about 1880–1900 (see section 2). The ages of mature yellow-cedar trees, whether they are dead or still living, indicate that most regenerated and attained upper canopy status during the Little Ice Age (Beier et al. 2008, Hennon and Shaw 1994). We hypoth-esize that this favorable climate allowed yellow-cedar to regenerate prolifically, even at low elevations, where it would later be most vulnerable to decline. There-fore, yellow-cedar forests are composed of trees that regenerated and grew during a favorable climate, but have since been subjected throughout portions of the range to a different climate that exposes them to fine-root freezing injury and decline.
DendrochronologyLaroque and Smith (1999) produced the first tree ring chronology for yellow-cedar. This study was located in high-elevation forests of Vancouver Island. Later, Colin Beier and Scott Sink, then graduate students at University of Alaska Fairbanks, conducted a dendrochronology study of yellow-cedar in southeast Alaska, in both dying and healthy forests (Beier et al. 2008). Their 400-yr chronology of yellow-cedar is the most complete ring chronology for any tree species in southeast Alaska. Yellow-cedars currently growing in both declining and healthy forests had similar patterns of growth until late in the 1800s, at which point growth patterns departed. This publication also reviewed weather station data back through the 1900s and related radial tree growth of yellow-cedar to climate data. The authors correlated tree ring growth with weather variables that represent particular thaw-freeze cycles in the weather record. Their assessment of climate through the 1900s reveals trends

59
A Climate Adaptation Strategy for Conservation and Management of Yellow-Cedar in Alaska
consistent with the prevailing hypothesis for yellow-cedar decline: the timing of decline injury (resulting in smaller ring widths) was associated with warmer winters, less snow, and persistent cold events in late winter through early spring. Stan et al. (2011) provide a chronology for yellow-cedar in coastal British Columbia, including results showing “marker years” of very poor growth in declining stands. They also used cross-dating methods to establish time-since-death estimates for yellow-cedar snags. Robertson (2011) produced chronologies for 50 yellow-cedar trees in the North Cascade Mountains of Washington. Wiles et al. (2012) produced a chronology for yellow-cedar in and near Glacier Bay National Forest at two sites north of the distribution of yellow-cedar decline. They report differing tree ring responses to temperatures from January through July in episodes during the Little Ice Age and periods that followed. They interpreted the observed pattern as the initiation of tree stress—but not extensive tree mortality—in response to reduced snowpack. Before 1999 there were no published dendrochronology studies for yellow-cedar, and now there are five, representing an extensive range of latitudes and forest health conditions.
Ecology and Silvics General Habitat CharacteristicsYellow-cedar has a defensive ecological strategy, in that it survives on harsh sites with limited competition from other species, invests less in reproduction or fast growth, and outlives competitors by accumulating defensive compounds in heart-wood and foliage. These characteristics make yellow-cedar less competitive on productive sites with deep soils. When it does occur on such sites, however, yellow-cedar can achieve its fastest growth and greatest stature (fig. 28). More often, yellow-cedar composition increases in the middle of the gradient from high to low site productivity, as it is able to tolerate poorly drained and shallow, nutrient-poor soils (Martin et al. 1995, Neiland 1971).
Freezing sensitivity has been identified as a key vulnerability of yellow-cedar; inadequate snowpack in spring results in freezing injury to fine roots during cold weather events, gradually resulting in tree mortality. On sites with poor drainage and nutrient availability, yellow-cedar is adapted to root shallowly, exposing roots to greater fluctuations in air and soil temperature (D’Amore and Hennon 2006; Hennon et al. 2006, 2010). Therefore, throughout much of its range, yellow-cedar is most vulnerable to decline on the low-productivity sites on which it previously had a competitive advantage. This topic is the focus of section 2.

60
GENERAL TECHNICAL REPORT PNW-GTR-917
Table 13—Associated tree species that grow with yellow-cedar in different regions of its range (Harris 1990)
Location Associated tree species
Alaska Western hemlock, mountain hemlock, Sitka spruce, western redcedar, shore pine
British Columbia Western hemlock, mountain hemlock, western redcedar, shore pine, pacific silver fir, western white pine
Oregon and Washington Western hemlock, mountain hemlock, subalpine fir, whitebark pine, Pacific silver fir, noble fir, western white pine
California California red fir, Brewer spruce, incense-cedar, Pacific yew, western white pine
Forest Types and Plant CommunitiesYellow-cedar tends to grow singly or in scattered clumps intermixed with other tree species (table 13), and rarely grows in pure stands (Harris 1990). Yellow-cedar stands typically have multiple canopy layers composed of trees of various ages, indicating gap-phase regeneration and a lack of catastrophic disturbance. Associ-ated tree species vary by latitude. Yellow-cedar grows from low elevation to near tree line in the northern extent of its range, and is limited to progressively higher
Figure 28—A yellow-cedar tree, visible with silvery gray bark, in a productive western hemlock-dominated forest. Yellow-cedar trees are less abundant in productive forests but often attain their largest diameter and height there.

61
A Climate Adaptation Strategy for Conservation and Management of Yellow-Cedar in Alaska
elevations in the southern portion of its range. The composition of the plant com-munity associated with yellow-cedar in a given latitude zone is largely controlled by soil drainage, climate, elevation, and aspect.
In Alaska, the Tongass National Forest developed three plant association guides for administrative areas arranged from north to south: the Chatham Area (Martin et al. 1995), the Stikine Area (Pawuk and Kissinger 1989), and the Ketchikan Area (DeMeo et al. 1992). These somewhat independent plant association guides were created because of the large size and the extensive north-south range of the Tongass National Forest. Although there is general consistency in series and associations across these areas, as defined by dominant overstory and understory vegetation, there are also key differences due to temperature trends and limits on species dis-tributions along the north-south gradient. For example, western redcedar and salal are temperature-dependent species common in the southern Ketchikan Area that reach their northern range extent in the mid-latitude Stikine Area. Another example is that mountain hemlock, which has a competitive advantage over western hemlock on colder and more poorly drained sites, is able to persist and dominate at lower elevations in the northern Chatham Area than in the Ketchikan Area. Develice et al. (1999) produced a guide of plant community types for the Chugach National Forest that covers the areas where yellow-cedar grows in Prince William Sound.
There are different estimates of how yellow-cedar contributes to the total acre-age and volume of the forests of southeast Alaska and coastal areas along the Gulf of Alaska. Early estimates undervalue yellow-cedar’s importance because they do not include unproductive (lower volume, noncommercial) forests (i.e., <8,000 board ft/ac). Yellow-cedar and western redcedar received only passing consideration in Hutchinson’s (1968) assessment of Alaska’s resource because markets for these spe-cies did not exist at the time. Western hemlock and Sitka spruce combined to make up 99 percent of the log production in that era. Acreage estimates of 5.8 percent presumably combined both cedar species as “cedar” forest type and the growing stock estimate was reported for redcedar, but not yellow-cedar. Van Hees (2003: 17 and fig. 19) estimated that yellow-cedar composed 9 percent of net volume of unreserved timberland in southeast Alaska. This amounted to 1.93 billion ft3. Tim-berland is forestland that is capable of producing >20 ft3/ac/yr, so lower productivity forests, as well as all reserved lands (e.g., wilderness areas and national parks), were excluded.
Barrett and Christensen (2011) reported estimates of yellow-cedar in forests of all ownerships for coastal Alaska extending from the panhandle to Prince William Sound and the Kodiak area. Table 42 of that publication gave an estimate of 12.1 percent for the amount of forest volume that is considered to be the yellow-cedar

62
GENERAL TECHNICAL REPORT PNW-GTR-917
forest type (i.e., all species in these stands). Table 43 reported a volume estimate of 5.9 billion ft3 of live yellow-cedar trees, which is 10.5 percent of all tree species between 2004 and 2008. An estimated 89.4 percent of this volume of yellow-cedar was on lands managed by the Forest Service (table 43). The estimated yellow-cedar volume would be a marginally higher percentage if only forests in southeast Alaska were considered, as the species is not abundant west of the panhandle.
The forests of southeast Alaska can be viewed as a fine-scale mosaic of series and plant associations, driven by complex landscape patterns of soil drainage and soil depth (Martin et al. 1995). It is important to note that yellow-cedar is not limited to a single plant association. Yellow-cedar is a common component of the western hemlock-yellow-cedar series across the three administrative areas of the Tongass National Forest, but can also occur as a component of mixed-conifer, mountain hemlock, western hemlock, shore pine, and other series. The plant asso-ciations that contain yellow-cedar are arrayed across the drainage gradient. Yellow-cedar can grow on productive, well-drained sites, but is usually outcompeted by western hemlock (Klinka 1999). The mixed-conifer series generally occurs on less productive and poorly drained sites than the western hemlock-yellow-cedar series; the mountain hemlock series occurs on cooler (high-elevation) sites. Yellow-cedar is also a component of the shore pine series on very poorly drained, low-produc-tivity bog or fen sites that have acidic soils with high organic content. Some series and associations that contain yellow-cedar are designated as wetlands and require special care when actively managed.
Drainage is the most important environmental factor affecting series and association distributions in southeast Alaska. The open, poorly drained sites on which yellow-cedar has a competitive advantage over western hemlock are also the sites where it is most vulnerable to root freezing injury due to its shallow rooting habit and exposure to dramatic fluctuation in soil temperature (see section 2). Furthermore, yellow-cedar is most competitive on nutrient-poor sites with wet soils (Gregory 1957, Hennon and Shaw 1997, Krajina 1969, Minore 1983). Biogeographic evaluations of yellow-cedar establish it as a hydrophilic species occurring in wet habitats of British Columbia where soil moisture is maintained by average precipita-tion of >88 in, mostly as snow (Krajina 1969). Yellow-cedar is competitive on wet, poorly drained soils, as indicated by understory plants in southeast Alaska (Hennon et al. 1990b), although large yellow-cedar trees have been documented on better drained soils (D’Amore and Hennon 2006). As mentioned previously, yellow-cedar is a calcium accumulator and therefore grows best in areas with calcium-bearing rocks (Krajina 1969) or soils rich in calcium and magnesium (Krajina 1969, Minore 1983).

63
A Climate Adaptation Strategy for Conservation and Management of Yellow-Cedar in Alaska
Table 14—Biogeoclimate and ecological distribution of yellow-cedar in north coastal British Columbiaa
Subzone or variantb
CWHvh2 CWHvm1 CWHvm2 MHmm1 MHwh1
Elevation range 0–600 m 0–400 m 400–800 m 800–1200 m 600–1100 mPhysiographic
regionHecate Lowland Western slope of
Coast MountainsWestern slope of
Coast MountainsWestern slope of
Coast MountainsHecate Lowland
Climate Hypermaritime; cool, very mild with very little snow; foggy and rainy year round
Wet, humid, mild maritime climate with relatively lit-tle snow and long growing season
Cooler with shorter grow-ing season and much heavier snowpack than CWHvm1
Maritime, cool and very wet year round with deep, wet snow (up to 10 ft); soils never freeze
Hypermaritime; mild, foggy, wet with wet intermittent snowpack (<1.6 ft)
Associated tree species (in de-creasing order of occurrence)
Western redcedar, western hem-lock, lodgepole pine, c mountain hemlock
Western hemlock, Pacific silver fir, western redcedar, Sitka spruce
Western hemlock, Pacific silver fir, mountain hemlock
Mountain hem-lock, Pacific silver fir, western hemlock
Mountain hem-lock, western redcedar, west-ern hemlock, Sitka spruce, lodgepole pinec
a This information may not apply to the small populations of yellow-cedar near Slocan Lake and Evans Lake or those to the south in British Columbia. b CWHvh2 = Coastal Western Hemlock Zone very wet hypermaritime central variant, CWHvm1 = Coastal Western Hemlock Zone very wet maritime submontane variant, CWHvm2 = Coastal Western Hemlock Zone very wet maritime montane variant, MHmm1 = Mountain Hemlock Zone moist maritime windward variant, MHwh1 = Mountain Hemlock Zone wet hypermaritime windward variant. Source: Banner et al. (1993).c Lodgepole pine refers to the species level; shore pine is the subspecies most commonly associated with yellow-cedar.
In British Columbia, plant communities are described within the context of biogeoclimate zones (table 14). Yellow-cedar is most abundant in the windward portion of higher elevation Mountain Hemlock subzones, but is also widely dis-tributed throughout the very wet, low- to moderate-elevation Coastal Western Hemlock subzones (Banner et al. 1993, Klinka et al. 2000, Pojar et al. 1987). These areas encompass much of the outer coast of British Columbia, including the Queen Charlotte Islands, the western side of the Coast Mountains, and the Hecate Strait. Consult Antos and Zobel (1986) and Lesher and Henderson (2010) for plant com-munity relationships in yellow-cedar forests in Oregon and Washington.
Geology and SoilsYellow-cedar is associated with several specific site attributes. Yellow-cedar may gain competitive advantages in nutrient cycling, regeneration, or other processes on some sites, but it can grow on an extensive and diverse array of landscapes and soil types. Yellow-cedar is most competitive in certain areas due to several adaptations and nutrient acquisition strategies.
64
GENERAL TECHNICAL REPORT PNW-GTR-917
The reason that cedars persist and are competitive on marginal sites is not evident from silvicultural or mineral nutrition studies. The site productivity in most yellow-cedar forests is low because of the low turnover and supply of nutrients, especially nitrogen (Prescott and Preston 1994). Numerous studies have identified the distinctive trait of yellow-cedar and redcedar to accumulate calcium in their tissues (Alban 1969, Kranabetter et al. 2003). Calcium accumulation in the foliage of trees in the Cupressaceae family is significantly higher compared to trees in the Pinaceae family (Kiilsgard et al. 1987, Zobel et al. 1985). Calcium-rich, partially decomposed plant litter with elevated pH (higher alkalinity) has been detected on the forest floor beneath cedar trees and attributed to higher foliar calcium concen-trations compared to other tree species (Alban 1969, Turner and Franz 1985). The forest floor chemistry in a cedar forest in British Columbia exhibited higher protein content in organic matter compared to western hemlock and Douglas-fir forests (Klinka and Lowe 1975). The presence of proteins may be an indicator of favorable microbial turnover or mineralized soil organic matter.
Adaptations to Wet Soils and Related Nutrient CyclingAs noted previously, yellow-cedar is competitive on marginal sites with low produc-tivity, nearly saturated soils, and open canopy conditions (Martin et al. 1995). On sites with high water tables, yellow-cedar is adapted to root shallowly and concen-trate fine root growth near the soil surface; this strategy allows roots to respire and avoid hypoxia under saturated conditions. Photosynthetic rates of yellow-cedar are highest when water availability is not limited, and decreases with increasing moisture stress (Grossnickle and Russell 1991). However, yellow-cedar is plastic in its physiological response to environmental conditions, and can stop and start growing in response to temperature and, potentially, chemical signaling (Gross-nickle and Russell 2006). Grossnickle and Russell (2010) summarize the extensive research conducted in British Columbia on the physiology of yellow-cedar. The ability of yellow-cedar to persist on marginal sites, where nutrient turnover is low and soil rooting depth is limited, may be due to its ability to exploit periodic pulses in nutrient availability or other favorable soil conditions (D’Amore et al. 2009). Yellow-cedar trees diversify the landscape by occupying soils where other conifers cannot grow well. By doing so, yellow-cedar may be tapping sources of nutrients in a complementary manner with other tree species to enhance productivity on sites (McKane et al. 2002).
Yellow-cedar absorbs more calcium than it needs, and this is part of a mecha-nism for obtaining nitrogen. Plants need large amounts of nitrogen to grow but are unable to use abundant atmospheric nitrogen, requiring it in the form of ammonia

65
A Climate Adaptation Strategy for Conservation and Management of Yellow-Cedar in Alaska
(NH4+ ) or nitrate (NO3
- ). Yellow-cedar commonly grows on acidic soils that have inadequate nitrogen for plant growth. Yellow-cedar and some related species are able to convert nitrogen gas into a usable form in their leaf cells. This process produces the toxic free radical oxalate as a byproduct. Calcium in the leaves binds oxalate into a stabile nontoxic compound. An adaptive strategy for nutrient acquisi-tion that may facilitate tree survival on nutrient-poor sites is coupled assimilation of calcium and nitrogen (D’Amore et al. 2009). The “cedar-nitrate hypothesis” has been proposed as a mechanism that gives yellow-cedar a competitive edge, and facilitates its survival, on poor, acidic sites (D’Amore et al. 2009). This scenario enables some tree species to assimilate nitrogen as NO3
- by accumulating a counter-ion to nitrate, such as calcium in the form of Ca2+, to control internal cell pH and provide electrochemical balance. This process is favored near the soil surface, where aerobic soils promote nitrification (microbial oxidation of NH4
+ to nitrite and then nitrate). Anaerobic conditions and low soil pH significantly reduce the activity of nitrifying bacteria (Richards 1987).
Calcium in cedar foliage also has important effects after foliage senesces and falls to the forest floor. Upon decomposition, foliar calcium makes soil less acidic, thereby increasing both calcium and nitrogen availability in the soil. Within foliage, calcium may also affect the production and cycling of organic acids, discouraging herbivores and increasing litter decomposition rates. In combination, saturated soil conditions and higher nutrient availability in aerobic soils promote prolific fine-root growth of yellow-cedar near the soil surface, where the trees are vulnerable to periodic spring freezing injury.
The foliage of yellow-cedar and other members of the Cupressaceae family contains higher concentrations of calcium than that of other species, and can therefore lead to increased soil calcium and soil pH below their canopies (see “Geology and soils”). Near Ketchikan, yellow-cedar foliage contained about 10.6 g/kg calcium; western redcedar contained 75 percent as much, and Sitka spruce and hemlock spe-cies contained only about 20 percent as much as yellow-cedar (Schaberg et al. 2011). Under more moderate alkaline soil conditions, increased microbial activity and shifts in microbial community composition favor the availability of nitrate. These biochemi-cal changes in forests that contain yellow-cedar are thought to have broad impacts on nutrient cycling at the landscape or watershed level (D’Amore et al. 2009).
Rooting HabitsAs noted previously, yellow-cedar occurs across a gradient of productivity and soil drainage, with its fastest and best growth on sites with well-drained, deep soils as well as soils rich in base cations (Krajina 1969). Yellow-cedar attains its greatest
66
GENERAL TECHNICAL REPORT PNW-GTR-917
competitive status, however, on poor sites with shallow soils and high water tables. These differing soil properties foster deeper or shallower rooting habits. Where insulating snow is not present in the winter and early spring, growth of fine roots in the surface soil horizons on saturated sites increases yellow-cedar’s vulnerability to root freezing injury. Even with limited snowpack, however, yellow-cedar is apparently protected from freezing injury where its roots penetrate subsurface soil horizons. Soil temperature monitoring in yellow-cedar forests shows that soils 6 in or deeper do not frequently freeze (Hennon et al. 2010).
Characteristics of the rooting habit for mature yellow-cedar trees on well-drained sites are not generally available. It is difficult to predict where roots from large trees occur, either vertically or laterally, and this represents a critical knowledge gap for yellow-cedar and other tree species. Rooting depth is thought to be an important predisposing factor for yellow-cedar decline (D’Amore et al. 2009, Hennon et al. 2012). Most information on yellow-cedar rooting depth is based on knowledge of tree physiology as it relates to soil drainage (i.e., trees root more shallowly on sites with high water tables to allow for root respiration and nutrient uptake). Both yellow-cedar and redcedar have optimum root growth when the soil temperature is about 71 °F, and growth decreases 7 percent per 1.8 °F below the optimum (Grossnickle and Russell 2010). This optimum temperature exceeds a typi-cal shallow soil temperature in yellow-cedar forests in Alaska (Hennon et al. 2010). In southeast Alaska, surface and subsurface soil horizons show predictable patterns of available calcium (concentrated near the surface) and aluminum (concentrated deeper); therefore, it is thought that relative concentrations of calcium and aluminum can be used as a surrogate for depth of feeder roots (Schaberg et al. 2011).
Adaptations to DroughtSeveral studies in British Columbia covered the factors that influence drought toler-ance in yellow-cedar regeneration. Yellow-cedar maintains turgor through elastic and osmotic control, but primarily through osmotic adjustments when exposed to limited soil moisture or low temperature (Grossnickle and Russell 1996). Drought tolerance is driven by water availability (late summer drought conditions) and by temperature decreases in fall that trigger winter dormancy. Drought tolerance of yellow-cedar shifts seasonally, with lower drought tolerance during times of active growth and highest tolerance in the winter; it is lowest at air temperatures above 59 ºF, and increases with decreasing temperature (Grossnickle and Russell 2010). Yellow-cedar is more sensitive to increased vapor pressure deficits, low root temperatures, and reduced soil moisture than some other associated conifers (Grossnickle and Russell 1991). Although short day length and water stress reduced

67
A Climate Adaptation Strategy for Conservation and Management of Yellow-Cedar in Alaska
shoot growth of yellow-cedar, responses were found to be transitory (Arnott et al. 1992). Cultural practices in nurseries (Arnott et al. 1992, 1993), planting in spring instead of fall (Folk et al. 1996), and the use of seedlings instead of rooted cuttings as planting stock (Folk et al. 1995, Grossnickle and Russell 1990) can all be used to reduce damage to yellow-cedar regeneration from drought.
Shade ToleranceInformation on yellow-cedar shade tolerance is mostly anecdotal. In general, yellow-cedar is classified as shade-tolerant, but is considered less tolerant in the northern parts of its range (Harris 1974). South of Mount Rainier in Washington, yellow-cedar seedlings can survive under moderately dense canopies, but may have poor form (Harris 1974), and often become established following disturbance (Antos and Zobel 1986). In Alaska, yellow-cedar is considered to be less shade-tolerant than western hemlock, and is most competitive on less productive sites with open canopies and better light availability (Martin et al. 1995). In the understory of western hemlock-yellow-cedar stands, yellow-cedar seedlings and saplings are patchily distributed and far less abundant than prolific, highly shade-tolerant western hemlock (DeMeo et al. 1992, Martin et al. 1995) (see “Reproduction and regeneration,” this section). However, slower growing yellow-cedar can be favored in productive mixed stands by thinning adjacent trees, and can also be planted on cold, wet sites where other tree species are less competitive and abundant spring snowpack protects its roots from freezing injury (see section 3). Yellow-cedar was found to require a high level of photosynthetically active radiation to reach light saturation (Grossnickle and Russell 1991). As light availability increases from 0 to 25 percent of full sunlight, yellow-cedar shows a sharp increase in photosynthetic capacity, which increases more gradually from 25 to 100 percent of full sunlight (similar to western redcedar; Grossnickle and Russell 2010).
Cold ToleranceYellow-cedar is more tolerant of cold, wet conditions than many other members of the Cupressaceae family. At the southern extent of its range in northern California and southern Oregon, yellow-cedar grows at higher elevations (around 5,000 ft). These sites have conditions and growing season length comparable to lower eleva-tions at the northern extent of its range in coastal Alaska and British Columbia (Harris 1990).
Research on cold tolerance of yellow-cedar regeneration in British Columbia was apparently spurred by freezing injury to outplantings in operational reforesta-tion. Both photoperiod and temperature appear to influence hardening (Hawkins

68
GENERAL TECHNICAL REPORT PNW-GTR-917
1993, Hawkins and McDonald 1993). Maximum frost hardiness cannot be main-tained indefinitely with photoperiod (Hawkins and McDonald 1993), and loss of frost hardiness was driven primarily by temperature. Loss of hardiness proceeded at a faster rate when planting stock was formerly exposed to night frosts, and all planting stock in one study began to lose cold tolerance between January and March (Hawkins 1993). Puttonen and Arnott (1994) found that short photoperiod-induced cold hardiness was reversed by warm temperature.
Although yellow-cedar occurs in cold environments, research in southeast Alaska on the seasonal cold tolerance of root tissue has demonstrated that yellow-cedar root tissue is less cold tolerant than redcedar, mountain hemlock, western hemlock, and Sitka spruce (ordered from lowest to highest tolerance) (Schaberg et al. 2011). Root cold hardiness of associated species generally increases from November to January, decreases from January to March, and decreases further from March to May. Cold tolerance of yellow-cedar fine roots follows a similar pat-tern, but exhibits comparatively less seasonal fluctuation, develops minimal winter hardiness (tolerant to 21 °F), and becomes fully dehardened by March (Schaberg et al. 2011). Premature tissue dehardening, greater vulnerability to freezing injury, and a tendency to root shallowly on some sites make fine roots of yellow-cedar suscep-tible to periodic spring freezing events that lead to gradual tree mortality (Hennon et al. 2012).
In southeast Alaska, yellow-cedar is found farther to the north, and at higher elevations, than western redcedar. It is unknown whether the distribution of western redcedar is limited by migration and regeneration patterns, or the relationship between tree physiology and climate factors. Andersen (1953) displayed the north-ern limit of western redcedar in Alaska and suggested that the species was confined by seasonal growing-degree days. It is also possible that the architecture of trees plays a role; the broader crown and lower wood strength of western redcedar may make it susceptible to breakage under heavy snow loads to the north and at higher elevations. Western redcedar has slightly more cold tolerant roots than yellow-cedar in mid-winter (Schaberg et al. 2011), and this finding may seem counterintuitive given their current distributions. Note that this may not apply to foliage, however. The greater cold tolerance of western redcedar may be important because, in the absence of insulating snowpack, western redcedar must withstand winter soil temperatures that are close to its cold tolerance threshold.
Yellow-cedar becomes photosynthetically active in response to increasing temperature conditions (even when associated tree species remain dormant) and has relatively higher photosynthetic capability at cold and near-freezing temperatures (Grossnickle and Russell 2010). This may be an adaptation to help yellow-cedar (as

69
A Climate Adaptation Strategy for Conservation and Management of Yellow-Cedar in Alaska
a “physiologically opportunistic” species) take advantage of suitable conditions for photosynthesis, whenever they occur, and may also allow yellow-cedar to absorb nitrogen that becomes available during freeze-thaw events (D’Amore et al. 2009, Schaberg et al. 2011). This adaptation could benefit yellow-cedar at high elevations, where trees must begin to take advantage of the short growing season as soon as snowpack dissipates. Snowmelt varies from year to year and is not highly depen-dent on photoperiod. This adaptation makes activated tissues vulnerable to freezing injury, so there are tradeoffs between early growth and the risk of injury.
Damage Agents WindWindthrow of individual trees is common in the forests of southeast Alaska due to the combination of wet, often shallow soils and high winds (Martin et al. 1995). Less frequently, stand-level replacement windthrow occurs, particularly on exposed sites when extreme wind follows heavy rain. Windthrow occurs when “wind loads on trees exceed the resistance of tree stems or anchorage” (Zielke et al. 2010: 2-3). Shallow rooting depth, soil saturation, and root diseases increase vulnerability to windthrow from uprooting by decreasing anchor strength. Stem decays, particularly those caused by brown rot fungi, increase vulnerability to windthrow from bole breakage by decreasing stem strength. Topographic conditions and stand manage-ment activities also influence vulnerability to windthrow. Wind accelerates as it moves over and around landscape obstacles, and thinned stands and stands adjacent to clearcuts are likely to be more exposed to wind (Zielke et al. 2010). Stand char-acteristics (height-to-diameter ratios and tree density) and tree metrics (height, diameter, crown size, and rooting depth) are important in predicting windthrow potential (Zielke et al. 2010). Wind firmness increases with deeper rooting depth (greater anchor strength) and tree diameter (greater stem strength), although there is higher likelihood of stem decay in larger, older trees. Wind firmness decreases with increased height growth and crown size.
The largest yellow-cedar trees are on well-drained sites with deep soils, but the species is often more common on sites with poor drainage and shallow soils due to competition with western hemlock and other species. Shallow and poorly drained soils limit rooting depth, while soil saturation and high soil organic matter content weaken contact between the roots and the soil. However, trees growing in these open-canopy forests have been habituated to windy conditions, and stand-replacing events are rare. Yellow-cedar is generally less prone to windthrow than western hemlock, Sitka spruce, and other associated species because it tends to have a

70
GENERAL TECHNICAL REPORT PNW-GTR-917
sparser tree crown (“sail area”) (Harris 1999). It also frequently grows in low-productivity stands of shorter stature and lower density, where wind can maneuver around trees (Martin et al. 1995). Large, old trees often contain heart rot (internal wood decay) and therefore sometimes succumb to windthrow in the form of bole breakage. Yellow-cedar’s heartwood chemical extractives would appear to make it less prone to bole breakage from internal decay compared to associated conifers, but internal defect is relatively high in old yellow-cedar trees. Yellow-cedar snags commonly remain standing 80 yr or more after tree death from yellow-cedar decline because of their exceptional retention of strength and decay resistance prop-erties (i.e., postdeath deterioration), and limited “sail area” with the loss of foliage, twigs, and branches from the tree crown (Hennon et al. 2000).
The wind regime is a significant influence on the spatial distribution of land-slide events within forests containing spruce, hemlock, and yellow-cedar (Buma and Johnson 2015, Johnson et al. 2000, Swanston and Howes 1994, Wu et al. 1979). This effect is mediated by slope, with little interactive effects at low angles and stronger influences on steeper slopes. Mechanistically, the interaction appears to be mediated by root strength, which is an important factor in stability of high-angle slopes with shallow soils (Buma and Johnson 2015). Further, windthrow was found adjacent to at least 75 percent of all hillslope failures for a subset of 45 of 300 landslides occurring on Prince of Wales Island in 1993 (Johnson et al. 2000). For more information on the role of yellow-cedar decline on hillslope stability, refer to section 2.
FireIn the northern portion of its range, yellow-cedar generally grows in coastal rainfor-est ecosystems with year-round precipitation and very low risk of wildfire (Alaback 1982). When rare fire occurs in the coastal rainforest, it is generally stand replacing. One of the few known older even-aged forests in southeast Alaska dominated by yellow-cedar regenerated on a site that experienced wildfire about 1900 at Cannery Point near Tenakee. Hennon (1992) found that planted yellow-cedar seedlings had good survival and growth on a burned site on Etolin Island. In high-elevation for-ests of California, Oregon, and Washington, yellow-cedar occurs in discontinuous populations, often as a minor stand component. Fire return intervals in these stands are probably shorter than in coastal rainforest systems due to the greater incidence of lightning strikes and limited summer precipitation. However, fire movement may be restricted by fuels in low-density subalpine stands, especially along exposed ridges. Yellow-cedar has thin bark and often roots shallowly, and these traits make

71
A Climate Adaptation Strategy for Conservation and Management of Yellow-Cedar in Alaska
it unlikely to survive even low-intensity fires. Estimates of mean fire return inter-vals are 1,500 yr for mountain hemlock stands in the Cascade and Olympic Moun-tains (Lertzman and Krebs 1991) and 1,150 yr for Sitka spruce forests (Fahnestock and Agee 1983).
InsectsYellow-cedar has fewer problems with insects and pathogens than most other conifers. Defensive compounds (secondary metabolites) in the heartwood limit the growth and establishment of pathogens and insect organisms, although some agents are specialized to overcome these chemical defenses. Several components of the essential oils isolated from yellow-cedar are lethal to ticks and mosquitoes and may potentially be used to control these pests (Panella et al. 2005). Yellow-cedar foliage is also rich in phenolic compounds. Juvenile foliage and new needles have lower concentrations of defense compounds than mature, older foliage, and are therefore more susceptible to insect and mammal herbivory.
In Alaska, there are three species of looper known to feed on yellow-cedar foliage: the western hemlock looper, the green-striped forest looper, and the saddle-backed looper. All feed on Sitka spruce or western hemlock as their primary host and are unlikely to feed on yellow-cedar unless populations reach outbreak level. Young cedar foliage is probably more susceptible to feeding due to lower concentra-tions of phenolic compounds in leaf tissue. On species other than cedars, feeding by the green-striped forest looper and saddle-backed looper is most severe in the upper crown and sometimes causes topkill. Severe defoliation may predispose trees to bark beetle attack, but rarely causes direct tree mortality. Cypress tip moths, and cypress leaf tier can also feed on yellow-cedar foliage, but severe damage is uncom-mon (Hennon 1991).
The yellow-cedar gall midge commonly infests trees planted in residential settings and seed orchards (Duncan 1994), and it has also been observed at lower levels in forest settings in southeast Alaska. Typically, only a small proportion of growing tips are damaged and the health of the tree is not greatly affected. Orange-colored larvae burrow in branch tips and cause tiny galls to form. Adults are small dark midges. Damage is usually restricted to lower elevations, possibly because of temperature constraints on the insect.
The yellow-cedar pollen mite causes damage to yellow-cedar pollen and seed cones, and has been documented primarily in seed orchards in British Columbia (Smith 1977). Callus-like growths form on seed cone scales, and infected cones are devoid of mature seeds. Severely damaged seed cones open prematurely and have

72
GENERAL TECHNICAL REPORT PNW-GTR-917
Figure 29—Galleries of the cedar bark beetle, Phloeosinus cupressi, on the bole of a dead yellow-cedar tree with bark removed.
necrotic, discolored cone scales. Mites can be readily observed on damaged por-tions of 1- and 2-yr-old seed cones (Hunt 1976). The mite also girdles the stalks of pollen cones and causes them to abort in fall and winter. It is recognized as a pest of yellow-cedar with studies showing 30- to 60-percent loss of seed cones (Anderson et al. 2002, Hunt 1976). The known distribution of the yellow-cedar pollen mite in the Pacific Northwest extends from coastal British Columbia to Oregon and Cali-fornia (Smith 1984). It has been detected in natural stands on Vancouver Island, but its presence in Alaska has yet to be confirmed (Anderson et al. 2002).
Bark beetles found attacking the inner bark of yellow-cedar almost always belong to the genus Phloeosinus (Coleoptera: Curculionidae: Scolytinae). Species of this genus are generally considered secondary agents, attacking stressed and dying trees (Furniss and Carolin 1977). Three species of Phloeosinus are known to infest large branches, boles, and tops of yellow-cedar: P. cupressi, P. sequoia, and P. keeni. Frequently detected in stands undergoing yellow-cedar decline, P. cupressi infests declining yellow-cedar trees before death. Adult beetles of this genus are reddish-brown to dark brown and 0.08 to 0.16 in long. Trees are attacked in the spring and summer, when adult beetles penetrate the bark to lay their eggs. Larvae create distinctive galleries as they excavate the phloem (fig. 29) and there are 1 to 1.5 generations/yr, depending on location (Furniss and Carolin 1977).

73
A Climate Adaptation Strategy for Conservation and Management of Yellow-Cedar in Alaska
Ambrosia beetles nearly always infest dead or dying trees, including yellow-cedar, and seldom cause tree mortality. However, infestations can cause significant loss of wood value in felled trees, and have serious implications for wood exporta-tion due to concerns about introducing nonnative beetles and fungi. Ambrosia beetles have a mutualistic relationship with ambrosia fungi (now more commonly called ophiastomatoid fungi), which the beetles vector to larval galleries and har-vest as a food source (Mitton and Sturgeon 1982). Ambrosia beetles have evolved specialized structures known as mycangia, which store fungal spores to be vectored in a new host. Ophiastomatoid fungi are diverse, and many are tree pathogens (e.g., blue stain fungi) and quarantine pests. Ambrosia beetles are attracted to recently downed trees and trees with broken tops, and infest only boles and large branches. Damage is confined to the sapwood; therefore, yellow-cedar is as vulnerable as other conifer species to ambrosia beetle attack because the sapwood lacks the unique defense chemistry of the heartwood. The risk of ambrosia beetle attack can be mitigated by appropriately timing timber harvest. Material felled after March is unlikely to be attacked that year, but will be susceptible the next year if it remains on the ground (Holsten et al. 2009).
A wood wasp, or horntail (Sirex sp. (Hymenoptera: Siricidae)), infests yellow-cedar (Smith and Schiff 2002) and is thought to vector a black stain fungus that has been tentatively identified as a Sporidesmium species. Proper identification of the horntail and fungus species is needed. Trees usually survive larval feeding, mak-ing it difficult to identify attacked trees, and accumulate callus tissue to confine the fungus and prevent continued spread. Attacks are apparently cyclic, occurring at roughly 60- to 100-yr intervals at one site near Wrangell. It is thought that the fungus’ initial infection of the sapwood inhibits the development of decay resistance properties in the heartwood where staining has occurred. Staining has significant impacts on merchantability. Stained wood has a value about half that of clear wood, and is sometimes completely unmarketable (fig. 30). Damage appears to be limited to specific sites in southeast Alaska, although no information is available on levels of staining at specific geographic locations. Related wood wasps usually attack weak-ened trees, downed timber, or saw logs, so the situation with Sirex and yellow-cedar may be unique. The female penetrates the bark with an ovipositor to deposit a single egg. Larval galleries excavated into the sapwood are round in cross section, tightly packed with frass, and average 0.1 in wide and 0.27 in long. Larvae require one to two seasons to develop, and construct pupal chambers in the outer layers of sapwood on the upper sides of logs. The brood adult leaves through a round exit hole.

74
GENERAL TECHNICAL REPORT PNW-GTR-917
DiseasesA shoot blight fungus (Kabatina thujae) causes significant disease of yellow-cedar seedlings and saplings. It primarily damages shoots of young trees but apparently does not affect older shoots and mature trees. Terminal and lateral shoots on seed-lings and saplings become infected and die during late winter or early spring, and dieback may extend several inches from the tip of the shoot (fig. 31). Entire seed-lings up to 1 to 2 ft tall are sometimes killed, but only if they are heavily colonized. Surveys suggest that this disease is common on both planted and naturally regen-erated seedlings after clearcut harvest. Long-term tree form is not thought to be compromised by shoot and leader damage. Symptoms of this disease are sometimes confused with spring frost damage.
Shoot blight of yellow-cedar caused by K. thujae has been reported to inflict considerable damage in nursery settings in British Columbia. A severe outbreak in the Fraser River area in 1969 killed up to half the shoots of affected nursery trees, and fungicides were ineffective at treating the outbreak (Funk 1974, Funk and Molnar 1972).
Additional fungi that can attack or kill yellow-cedar seedlings in nursery set-tings include Botrytis cinerea and damping-off fungi that kill emerging seedlings, but these diseases can be effectively controlled with chemical or cultural methods. An inconspicuous rust fungus, Gymnosporangium nootkatense, is present wherever yellow-cedar grows in Alaska (Hennon 1991, Ziller 1974). It infects individual leaf scales as tiny infections and has never been observed causing substantial damage to trees.
Figure 30—Black stain of yellow-cedar heartwood is caused by a fungus but probably vectored to trees by a Sirex wood wasp.

75
A Climate Adaptation Strategy for Conservation and Management of Yellow-Cedar in Alaska
Figure 31—Shoot disease of yellow-cedar regeneration caused by a fungal pathogen, Kabatina thujae.
Root disease fungi that attack yellow-cedar are generally not aggressive and do not cause serious disease. Although an Armillaria species is frequently detected on dying or dead yellow-cedar (Hennon et al. 1990), it is not aggressive enough to damage healthy trees and therefore tends to occur opportunistically on trees stressed by abiotic factors. Inoculation trials have shown that Phytophthora late-ralis, which causes severe root disease of Port-Orford-cedar in northern California and southern Oregon, has very low virulence on yellow-cedar and does not pose a serious risk to yellow-cedar in Alaska (personal communication, 2011. Mike McWilliams, Oregon Department of Forestry, Salem, Oregon; currently with the USDA Forest Service, Forest Health Protection, La Grande, Oregon).
Wood DecaysLittle is known about heart rot, or stem decay, of live yellow-cedar, because the species was not evaluated in the two classic studies of cull or stem decay in southeast Alaska (Farr et al. 1976, Kimmey 1956). Although yellow-cedar wood in service is remarkably decay resistant, some specialized fungi are able to attack the heartwood and cause extensive decay in live trees (fig. 32). Cruisers and others with

76
GENERAL TECHNICAL REPORT PNW-GTR-917
Figure 32—Unidentified white pocket rot stem decay of yellow-cedar.
knowledge from the timber industry indicate that larger, older yellow-cedar trees have substantial butt rot and ring shake (concentric patterns of decay in heartwood). Observations of snapped yellow-cedar boles suggest that decay fungi can be important mortality agents for yellow-cedar (Hennon 1995, Hennon and McClellan 2003). However, there is limited information on how often such mortality occurs, what fungal species are usually responsible, and how it varies by location. Although it is assumed that older trees are likely to have higher rates of decay, research has not been conducted to establish the relationship between tree age and the volume or incidence of decay in yellow-cedar. Many fungal species attack the sapwood of yellow-cedar, which does not contain the concentrated chemical defenses found in the heartwood, and these fungi are particularly common on dead trees. Only a few conk-forming macrofungi such as Polyporus elegans and Auricularia auricularis are often observed on dead yellow-cedar in Alaska. These fungi decompose the outer sapwood, usually of recently killed trees (Hennon 1990). The cedar form of Phellinus weirii may cause significant cull of yellow-cedar as a butt rot, but does not cause root disease or direct tree mortality. A study begun in 2013 will attempt to identify the “hidden defect” in both western redcedar and yellow-cedar in coastal Alaska. Information on the major causal fungi of internal wood decay of live trees is expected from this effort.

77
A Climate Adaptation Strategy for Conservation and Management of Yellow-Cedar in Alaska
Potential Invasive SpeciesRecent findings in Argentina and Scotland indicate the need to learn more about the threat of the pathogen Phytophthora austrocedrae to yellow-cedar in Alaska. This pathogen was described as a new species in 2007 after it was isolated from dying Chilean cypress in Argentina, where it is destructive and presumably invasive (Greslebin et al. 2007). In 2011, this pathogen was isolated from dying ornamental yellow-cedar in a park in Scotland (Great Britain Forestry Commission 2013). The origin of the pathogen, the relative susceptibility of yellow-cedar, and the ability for the pathogen to survive in Alaska’s coastal rainforest climate are unknown. This pathogen has never been detected in Alaska, even with the use of stream- or soil-baiting, which are common techniques used to monitor Phytophthora species. Other diseases and fungal pathogens that could present a threat to yellow-cedar if intro-duced within its range include Seiridium shoot blight and resinous stem canker.
Animal DamageBrown bear and Sitka black-tailed deer are the primary animal damage agents of yellow-cedar in southeast Alaska. Brown bears typically cause damage to mature trees, whereas deer typically browse juvenile foliage of seedlings and saplings. The western hemlock-yellow-cedar stand series, especially the skunk cabbage associa-tion, is reported to be heavily used by deer and bears in spring, and by deer in the fall (Martin et al. 1995). Porcupines damage many tree species in southeast Alaska, but tend to avoid feeding on yellow-cedar and western redcedar (Eglitis and Hen-non 1997). Therefore, these species may be good options on sites with significant damage from porcupine feeding.
In spring, brown bears strip bark from the lower bole of yellow-cedar trees to reach the sugary phloem tissue as a food source (fig. 33). In some locations with high brown bear populations, such as Chichagof and Baranof Islands, up to half of the yellow-cedar boles may be scarred by brown bears, evidenced by teeth marks on exposed wood (Hennon et al. 1990a). The highest incidence of basal scarring occurs on productive sites with deep soil drainage, where yellow-cedar reaches its greatest size. This type of damage is not known to occur on islands inhabited only by black bears. Wounding from brown bear feeding creates avenues for infection by decay fungi, but yellow-cedar walls off (i.e., compartmentalizes) the fungi to create nar-row bands of decay. There is no relationship between the incidence of basal scarring and yellow-cedar decline, indicating that bear damage is not a factor in the decline.
Sitka black-tailed deer tend to feed on 1- to 2-yr-old foliage of yellow-cedar, which is more palatable to them possibly because it contains lower concentrations

78
GENERAL TECHNICAL REPORT PNW-GTR-917
of defense compounds than older foliage. Seedlings that are browsed over consecu-tive years assume a bushy form, but usually recover if browsing ceases and they are able to attain sufficient height growth to have protected foliage above browse-height. In some locations with high deer populations, deer may have a significant impact on yellow-cedar regeneration (Martin et al. 1995), and may make yellow-cedar less competitive than fast-growing brush and tree species, such as western hemlock (Hennon 1992a). More information on deer browse on yellow-cedar regeneration can be found below.
ClimateClimate exerts long-term influence over vegetation patterns, hydrology, and soil development, and relatively shorter term influence over seasonal precipitation, temperature, and acute weather events. The widespread mortality of yellow-cedar in Alaska and British Columbia, or yellow-cedar decline, is associated with freez-ing injury to fine roots that occurs where snowpack in early spring is insufficient to protect roots from late-season cold events. Yellow-cedar trees appear to be protected from spring freezing injury where snow is present in spring and able to insulate tree roots and prevent premature dehardening and freezing. For more information on the role of climate in yellow-cedar decline, refer to section 2.
Figure 33—Bole wounding on yellow-cedar by a brown bear showing marks left by canine teeth.

79
A Climate Adaptation Strategy for Conservation and Management of Yellow-Cedar in Alaska
Commercial Use and Forest ManagementUtilization and management of yellow-cedar are usually considered in the context of management of western hemlock and Sitka spruce, as those species are more abundant, especially on productive forestland. Yellow-cedar is seldom found in pure single-species stands in southeast Alaska, and it has fluctuated in commercial value from being noncommercial to being the most valuable wood in the region. The management history of yellow-cedar in Alaska is also primarily concerned with activities on the Tongass National Forest and state and corporate lands. Although yellow-cedar’s distribution extends into the Chugach National Forest in the Prince William Sound area, records do not indicate that it has been actively managed there.
Logging HistoryThe coastal forests of Alaska have a long history of providing timber products, including yellow-cedar, to local and regional economies and Asian markets. During the period of Russian colonization (1799 to 1867), many areas around Sitka were harvested for the construction of a fort and magazine, and for supplies of firewood and charcoal. Supplying a continuous flow of firewood and charcoal to Sitka resulted in some of the earliest clearcut harvests documented in Alaska. At the base of Mount Verstovia, just south of present-day Sitka, there is a 189-ac clearcut that was harvested in 1861 for fuelwood and charcoal (Russell 1996). This site is now an even-aged, single cohort forest composed primarily of western hemlock and Sitka spruce, with some yellow-cedar found at higher elevations of the stand. This second-growth forest has a stand density of 440 ft2 of basal area/ac and an average diameter of 16 in.5 The Russians also did selective partial harvesting for high-qual-ity Sitka spruce and yellow-cedar. Trees were sawn for local construction, as well as for export to countries such as Chile and China (Russell 1996). Yellow-cedar was favored in hull construction for Sitka’s shipbuilding industry. Selective harvesting of yellow-cedar occurred along the shorelines near Sitka and as far as Peril Strait, 60 mi north of Sitka (Harris and Farr 1974). “Because of the demand for Alaska-cedar for ship construction and other uses, the Russians were reported later to have exhausted the accessible supply of cedar near Sitka” (Harris and Farr 1974: 3).
In 1867, Russia ceded the territory of Alaska to the United States. U.S. land laws and title of timber lands did not extend to the Alaska territory, so timber operators were not permitted to export lumber (Harris and Farr 1974). It was not
5 Russell, J. 1996. Mt. Verstovia Russian era harvest young single cohort stand. On file with: USDA Forest Service, Alaska Regional Office, 709 West 9th Street, Juneau, AK 99801.
80
GENERAL TECHNICAL REPORT PNW-GTR-917
until 1907, when President Roosevelt created the Chugach and Tongass National Forests, that formulized regulations for the cutting and disposal of federal timber in Alaska were developed. Alaska’s timber industry was slow to grow because of limited national demand for western hemlock, Sitka spruce, western redcedar, or yellow-cedar. In 1909 the two national forests in Alaska harvested about 15 million board feet (MMBF) (USDA FS 2012). Sitka spruce and yellow-cedar were primar-ily used in the local fishing, canning, and mining industries, with only a small amount of wood exported.
During the early period (1909 to 1950) of forest management in Alaska, the total volume of timber harvested from both national forests averaged about 43 MMBF/yr (USDA FS 2012). Ninety percent of this volume was harvested from the Tongass National Forest (fig. 34). Due to the lack of inland road systems, selective harvest of high-quality spruce and yellow-cedar predominantly occurred along the shorelines near local communities. The U.S. Forest Service believed that an extensive timber industry could not expand until a pulp and paper industry was developed to improve the economic feasibility of commercial timber harvest.
In the early 1950s the Forest Service’s efforts to contribute to the economic development of southeast Alaska were realized with increased demand for residen-tial construction lumber to rebuild Japan after World War II and with the develop-ment of long-term (50-yr) timber sale contracts (Brackley et al. 2009). Regional timber harvest averaged 356 MMBF/yr for the next 45 yr (1950 to 1995) (fig. 35). To ensure the development of pulp mills and large sawmills, the Forest Service placed restrictions on the export of unprocessed logs (round logs) (Brackley et al. 2009, Lane 1998). During this time, export regulations for logs primarily applied to western hemlock and Sitka spruce harvested from federal lands. Western redcedar and yellow-cedar were only a small portion of the total volume harvested. They were determined surplus to local manufacturing needs and therefore were freely exported as logs. The policy of unrestricted export of yellow-cedar remains in effect today. The export restrictions on western redcedar have been more varied over time. Currently, there are restrictions on the export of western redcedar.
Although the Forest Service oversaw the harvest of most of the timber for local pulp mills and sawmills, Native corporation lands also supplied some of the timber. The Alaska Native Claim Settlement Act [ANCSA] of 1971 (ANCSA 1971) estab-lished 12 local Native corporations and 1 regional corporation in southeast Alaska. The Native corporations were entitled to select about 540,000 ac of land from the Tongass National Forest; by 1992 about 95 percent of the land had been conveyed (Gunnar 1992). The timber harvest from Native corporation lands began in earnest in 1980 and by 1983 volume harvested exceeded volume harvested from the Ton-gass National Forest (fig. 35).

81
A Climate Adaptation Strategy for Conservation and Management of Yellow-Cedar in Alaska
Figure 34—The average annual timber volume harvested per decade of all species harvested in the Alaska Region from 1910 through 2010 (USDA FS 2012).
Figure 35—Annual timber volume of all species harvested in the state of Alaska from 1970 through 2011. State of Alaska totals also includes volume from State, Bureau of Indian Affairs, Bureau of Land Management and Chugach National Forest lands (Brackley 2009, USDA FS 2012, Zhou and Warren 2012).
82
GENERAL TECHNICAL REPORT PNW-GTR-917
Unlike timber harvested from federal lands, timber harvested from Native lands can be freely exported without any primary processing requirements. Most of the high-quality western hemlock, Sitka spruce, western redcedar, and yellow-cedar from Alaska Native lands is exported to Asian markets. In the 1980s and 1990s, the primary markets for Native utility logs (lower grade logs) were the two pulp mills in southeast Alaska (Gunnar 1992).
In 1994 the pulp mill located in Sitka closed. The last long-term contract with Ketchikan Pulp Company was negotiated in 1997; its pulp mill closed that same year. Since 1995, annual volume offered for sale by the Alaska Region has declined steadily from 199 MMBF in 1995 to 23 MMBF in 2011 (USDA FS 2012). Timber harvested from Native lands has also declined from 454 MMBF in 1995 to 125 MMBF in 2011 (Brackley et al. 2009, Zhou and Warren 2012). Only one medium-sized sawmill and several small specialty sawmills are in operation today. In addition, there are three principal logging companies that sell unprocessed logs to the local sawmills or export logs to overseas markets.
Before the 1990s, most of the harvesting on the Tongass National Forest was disproportionally concentrated on higher productivity sites at lower elevations. These sites were usually adjacent to the beach and within floodplain riparian areas with abundant large Sitka spruce (USDA 2008a). Yellow-cedar simply was not pres-ent in any abundance on these high-productivity sites, where it is generally outcom-peted by western hemlock and Sitka spruce (D’Amore and Hennon 2006, USDA 2008b). The yellow-cedar that occurred on high-productivity sites was often felled and left in the woods because of the poor export market for yellow-cedar before the 1980s (Ruth and Harris 1979).
As more complex and restrictive land use designations and forest management practices were crafted under the 1979 and 2008 Tongass Forest Plans (USDA FS 1979, 2008a) and the Tongass Timber Reform Act (TTRA) of 1990 (TTRA 1990), the practice of harvesting a disproportionate amount of old-growth timber on the highest volume productivity sites (volume classes 6 and 7) was changed. By the late 1990s, harvest activities began to occur across a more diverse range of volume classes (volume classes 4 through 7). Correspondingly, more yellow-cedar was harvested because yellow-cedar abundance was greater on poorly and moderately drained sites. Additionally, the utilization of yellow-cedar increased due to height-ened market demand in Asian countries.
On average, yellow-cedar represents about 10 percent of the estimated net volume of growing stock on timberland in southeast Alaska (table 15) (USDA 2008). There is considerable variation in actual cedar volume harvested among sale areas, based on site productivity and the local abundance of cedar. Regardless of the

83
A Climate Adaptation Strategy for Conservation and Management of Yellow-Cedar in Alaska
Table 15—Percentage of net volume of growing stock of commercial softwood species on timberlanda in southeast Alaska
Species Net total volume
PercentYellow-cedar 10Sitka spruce 27Western redcedar 6Western and mountain hemlock 57
a Timberland: forestland that is not withdrawn from timber production by statute or administrative regulation and is capable of producing >20 ft3/ac/yr.
Table 16—Acres and percentages of harvest in three areas of the Tongass National Forest by silvicultural system, 1910 through 2010
LocationaEven-aged
harvestTwo-aged harvest
Uneven-aged harvest
Intermedi-ate harvest
Total harvest
North Tongass 87,280 372 4,464 3,457 95,573 (21.1%)
Central Tongass 101,605 1,423 7,956 3,326 114,310 (25.2%)
South Tongass 238,155 3,912 1,230 601 243,898 (53.8%)
Tongass National Forest grand total
427,040 (94%)
5,707 (1.3%)
13,650 (3.0%)
7,384 (1.6%)
453,781 (100%)
a North Tongass (Yakutat, Hoonah, Juneau, Sitka, and Admiralty Ranger Districts), Central Tongass (Petersburg and Wrangell Ranger Districts), South Tongass (Craig, Thorne Bay, and Ketchikan Ranger Districts).
Source: Forest Service Activity Tracking System [FACTS] July 2012.
amount of yellow-cedar harvested, most of it is exported to Asian countries because of the premium value it brings in those markets.
Silvicultural SystemsThe primary silvicultural system used to manage Sitka spruce-western hemlock and mixed-conifer forest types in southeast Alaska has been, and continues to be, pri-marily an even-aged regime. Of the 453,781 ac harvested on the Tongass National Forest, 94 percent has been harvested under even-aged systems with natural regen-eration (table 16). The long-term management objective under an even-aged system is to regenerate the stand with a new stand of trees that are essentially the same age, which is usually achieved through clearcutting, or felling trees after seed tree and shelterwood harvests. In southeast Alaska, clearcutting is primarily used where
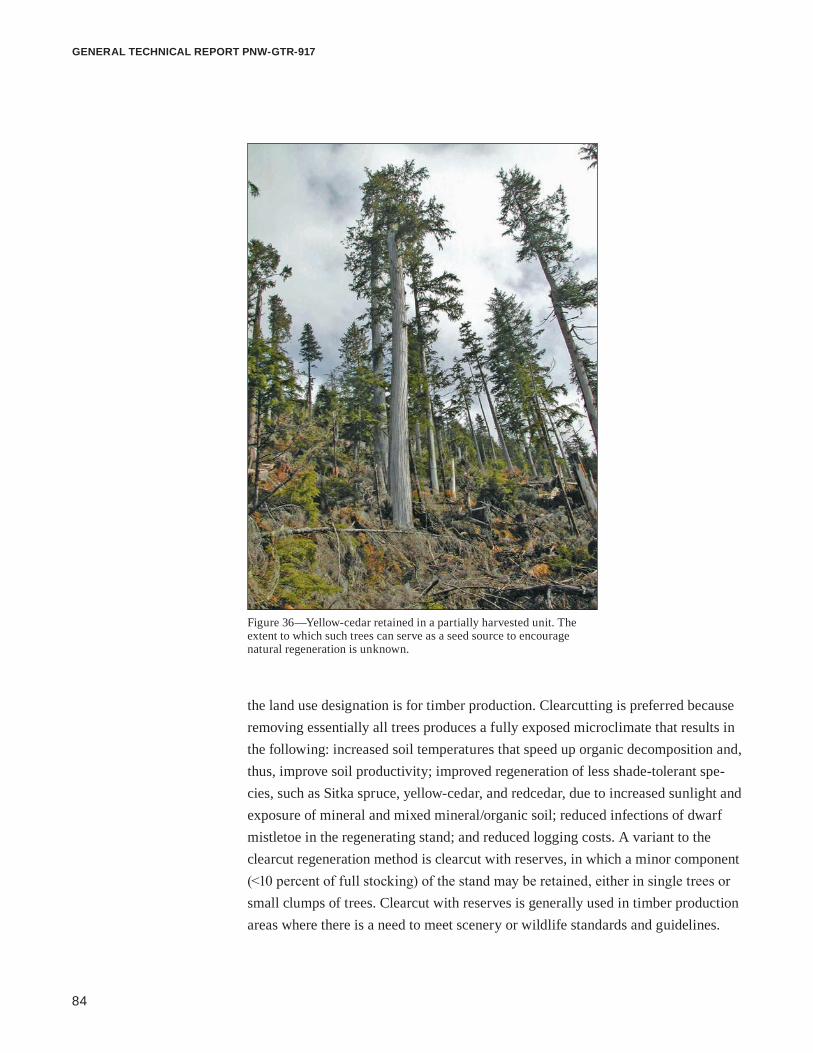
84
GENERAL TECHNICAL REPORT PNW-GTR-917
the land use designation is for timber production. Clearcutting is preferred because removing essentially all trees produces a fully exposed microclimate that results in the following: increased soil temperatures that speed up organic decomposition and, thus, improve soil productivity; improved regeneration of less shade-tolerant spe-cies, such as Sitka spruce, yellow-cedar, and redcedar, due to increased sunlight and exposure of mineral and mixed mineral/organic soil; reduced infections of dwarf mistletoe in the regenerating stand; and reduced logging costs. A variant to the clearcut regeneration method is clearcut with reserves, in which a minor component (<10 percent of full stocking) of the stand may be retained, either in single trees or small clumps of trees. Clearcut with reserves is generally used in timber production areas where there is a need to meet scenery or wildlife standards and guidelines.
Figure 36—Yellow-cedar retained in a partially harvested unit. The extent to which such trees can serve as a seed source to encourage natural regeneration is unknown.

85
A Climate Adaptation Strategy for Conservation and Management of Yellow-Cedar in Alaska
Reserve trees are not necessarily prescribed as “seed trees,” but an auxiliary benefit of reserve trees is that they can enhance the natural regeneration and subsequent spatial distribution of desired species, such as yellow-cedar, redcedar, and Sitka spruce.
Alternatives to even-aged systems are available and often prescribed when the land management objectives emphasize resource values other than timber produc-tion, such as wildlife habitat or scenery management. These alternative systems are two-aged and uneven-aged. A two-aged system is designed to regenerate and maintain a stand with two age classes. The initial harvest entry reserves trees either individually or in clumps, with reserve trees representing ≥15 percent of a stand’s pretreatment basal area. The resulting stand may be two-aged, or tend toward multiaged, as a consequence of an extended rotation period and the retention of reserve trees that may represent one or more age classes. Similar to the harvest method of clearcut with reserves, a two-aged system can enhance the natural regeneration of yellow-cedar, redcedar, and Sitka spruce. The uneven-aged system regenerates and maintains a stand that has at least three distinct age classes. The initial harvest entry removes 25 to 33 percent of mature trees, in all age classes, either individually or in small groups that are <2 ac in size. Individual and group tree selection may not provide an adequate exposed microclimate to regenerate and establish yellow-cedar. To prevent western hemlock from dominating the new age class, prescriptions often call for retaining advanced cedar and spruce regeneration (seedlings and small trees present in the understory of the previous stand that may grow rapidly after being freed from competition with the dominant harvested trees), as well as larger cedar and spruce trees.
Intermediate harvests, such as salvage and commercial thinning, can also be prescribed when managing for yellow-cedar. These harvests are designed to improve stand conditions or recover timber losses due to insects, disease, or windthrow. Commercial thinning prescriptions can favor the retention of yellow-cedar in order to increase its relative abundance. Salvage sales can be designed to sell dead yellow-cedar to local sawmills that have developed a niche market for yellow-cedar products.
ReforestationAs stated in the National Forest Management Act (NFMA) of 1976 (NFMA 1976), it is the policy of the Congress that all forested lands in the National Forest System shall be maintained in appropriate forest cover with species of trees, degree of stocking, rate of growth, and conditions of stand designed to secure maximum

86
GENERAL TECHNICAL REPORT PNW-GTR-917
benefits of multiple-use sustained yield management in accordance with land man-agement plans (NFMA 1976). These regulations do not specify that harvested units be regenerated with the identical species composition that existed before harvest. The current Tongass National Forest Land and Resource Management Plan (USDA FS 2008a) also does not specify species compositions to regenerate. Instead, the plan defers to site-specific silvicultural prescriptions to determine the appropriate species mix based on the potential of the site as indicated by plant associations and adjacent stand conditions. The plan does emphasize the need to regenerate and maintain particular species such as yellow-cedar and western redcedar where appropriate for the site.
Natural RegenerationOn the Tongass National Forest, natural regeneration accounts for about 94 percent of the reforestation program (USDA FS 2008a). To the extent practical, silvicultur-ists prescribe regeneration harvests designed to create microclimates that favor the establishment of less shade-tolerant western redcedar, yellow-cedar, and Sitka spruce. Yet western hemlock regenerates far more than other species following harvest because of differences in soil and light requirements, seed production, seed dispersal distance, seed dormancy requirements, and other factors. Western hemlock can thrive on organic or mineral soil and in a variety of light conditions. Yellow-cedar can grow in a variety of mineral and organic soils, and in fully open or partially shaded environments.
Western hemlock is a prolific seed producer. In contrast, yellow-cedar cones are small, contain fewer seeds, and irregularly produce large cone crops on a 4- to 7-yr cycle. Owens and Molder (1977) found that the proportion of filled seeds from mature yellow-cedar cones was low and extremely variable. In seven trees studied, the number of seeds per cone averaged 7.2, but the proportion of filled seed averaged only 29 percent. Western hemlock seeds disperse up to 1 mi (Burns and Honkala 1990). Yellow-cedar seed dispersal distances have not been measured, but studies of related Port-Orford-cedar suggest that yellow-cedar seed is not dispersed >400 ft from its source (Burns and Honkala 1990).
Western hemlock seed is not deeply dormant and requires only a short stratifi-cation to germinate (Burns and Honkala 1990). Germination of yellow-cedar seed requires an extensive and complex stratification that consists of warm and cold periods (Pawuk 1993). If stratification requirements are not met, then seeds will not germinate the first year after seed dispersal. Remaining seed may germinate the next year if stratification requirements are met and if the seeds are not consumed by birds or rodents or decayed by fungi.
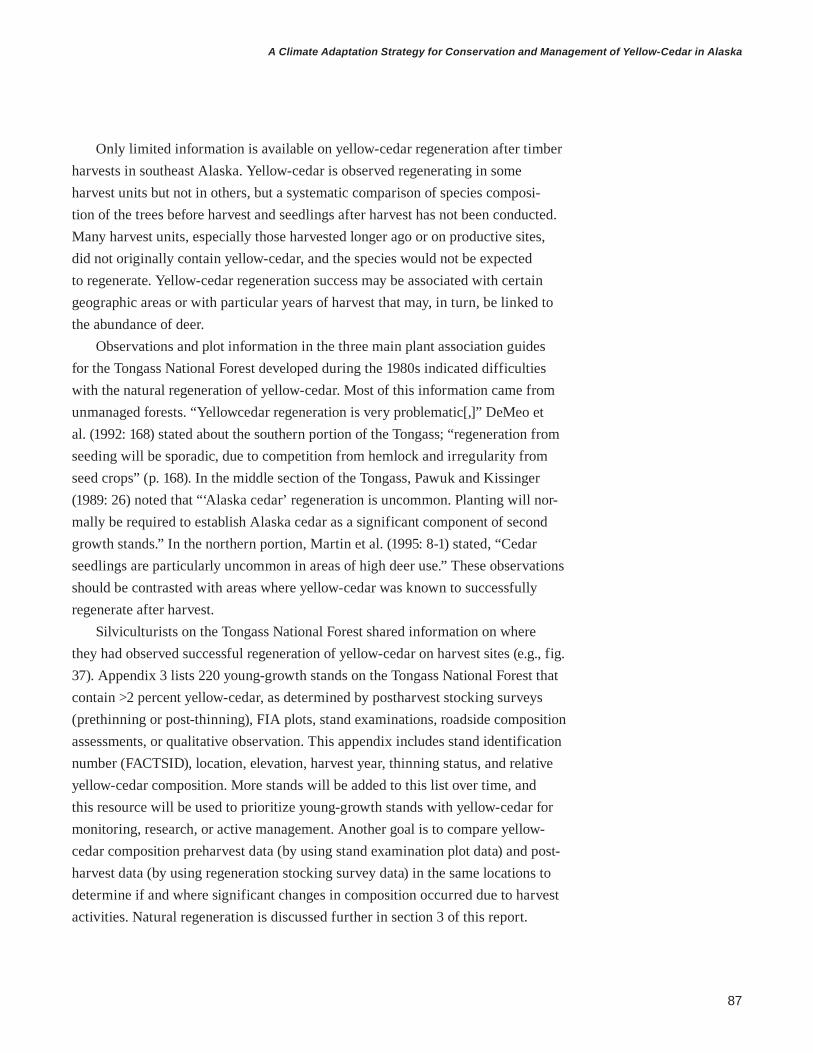
87
A Climate Adaptation Strategy for Conservation and Management of Yellow-Cedar in Alaska
Only limited information is available on yellow-cedar regeneration after timber harvests in southeast Alaska. Yellow-cedar is observed regenerating in some harvest units but not in others, but a systematic comparison of species composi-tion of the trees before harvest and seedlings after harvest has not been conducted. Many harvest units, especially those harvested longer ago or on productive sites, did not originally contain yellow-cedar, and the species would not be expected to regenerate. Yellow-cedar regeneration success may be associated with certain geographic areas or with particular years of harvest that may, in turn, be linked to the abundance of deer.
Observations and plot information in the three main plant association guides for the Tongass National Forest developed during the 1980s indicated difficulties with the natural regeneration of yellow-cedar. Most of this information came from unmanaged forests. “Yellowcedar regeneration is very problematic[,]” DeMeo et al. (1992: 168) stated about the southern portion of the Tongass; “regeneration from seeding will be sporadic, due to competition from hemlock and irregularity from seed crops” (p. 168). In the middle section of the Tongass, Pawuk and Kissinger (1989: 26) noted that “‘Alaska cedar’ regeneration is uncommon. Planting will nor-mally be required to establish Alaska cedar as a significant component of second growth stands.” In the northern portion, Martin et al. (1995: 8-1) stated, “Cedar seedlings are particularly uncommon in areas of high deer use.” These observations should be contrasted with areas where yellow-cedar was known to successfully regenerate after harvest.
Silviculturists on the Tongass National Forest shared information on where they had observed successful regeneration of yellow-cedar on harvest sites (e.g., fig. 37). Appendix 3 lists 220 young-growth stands on the Tongass National Forest that contain >2 percent yellow-cedar, as determined by postharvest stocking surveys (prethinning or post-thinning), FIA plots, stand examinations, roadside composition assessments, or qualitative observation. This appendix includes stand identification number (FACTSID), location, elevation, harvest year, thinning status, and relative yellow-cedar composition. More stands will be added to this list over time, and this resource will be used to prioritize young-growth stands with yellow-cedar for monitoring, research, or active management. Another goal is to compare yellow-cedar composition preharvest data (by using stand examination plot data) and post-harvest data (by using regeneration stocking survey data) in the same locations to determine if and where significant changes in composition occurred due to harvest activities. Natural regeneration is discussed further in section 3 of this report.
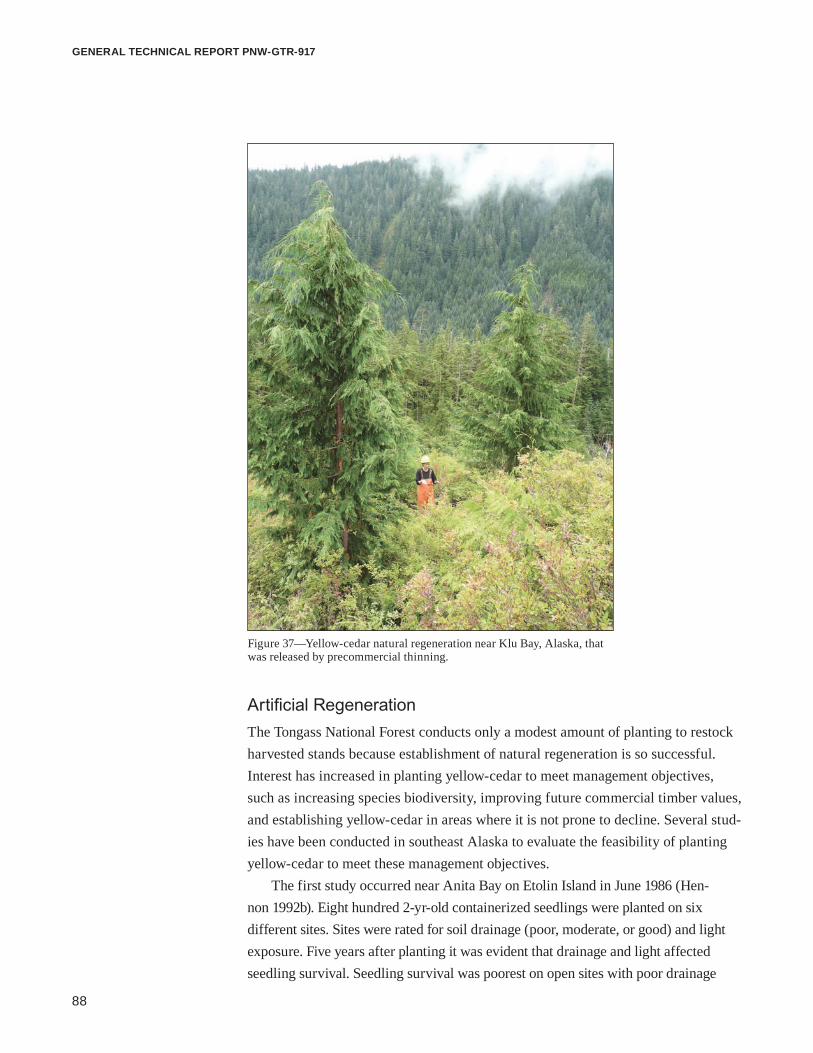
88
GENERAL TECHNICAL REPORT PNW-GTR-917
Artificial RegenerationThe Tongass National Forest conducts only a modest amount of planting to restock harvested stands because establishment of natural regeneration is so successful. Interest has increased in planting yellow-cedar to meet management objectives, such as increasing species biodiversity, improving future commercial timber values, and establishing yellow-cedar in areas where it is not prone to decline. Several stud-ies have been conducted in southeast Alaska to evaluate the feasibility of planting yellow-cedar to meet these management objectives.
The first study occurred near Anita Bay on Etolin Island in June 1986 (Hen-non 1992b). Eight hundred 2-yr-old containerized seedlings were planted on six different sites. Sites were rated for soil drainage (poor, moderate, or good) and light exposure. Five years after planting it was evident that drainage and light affected seedling survival. Seedling survival was poorest on open sites with poor drainage
Figure 37—Yellow-cedar natural regeneration near Klu Bay, Alaska, that was released by precommercial thinning.

89
A Climate Adaptation Strategy for Conservation and Management of Yellow-Cedar in Alaska
(23 percent survival) and on closed canopy sites with good drainage (36 percent). Sites with moderately drained to well-drained soils and good light exposure had high survival rates (88 percent). The planting sites were revisited 20 yr after planting (fig. 38). The survival rate on well-drained sites was still very high at 85 percent (Hen-non and Dowling 2006). The long-term future of these plantings appeared favorable, especially in one area where competing vegetation was reduced by burning as a site-preparation technique. The results of the Etolin Island planting are similar to studies conducted in British Columbia, where outplanting of yellow-cedar resulted in an 88-percent survival rate 10 yr after planting (Mitchell and Koppenaal 2006).
A second planting study (Hennon et al. 2009) was initiated in 1988 to evaluate the survival and growth of yellow-cedar seedlings relative to “stecklings.” Steck-lings are planting stock produced from rooted cuttings, commonly used for refores-tation in British Columbia (Karlsson 1974). Stecklings are convenient to produce, whereas producing yellow-cedar seedlings from seed can be problematic due to difficulty in collecting cones, low seed germination rates, and a complex strati-fication regime. Regardless of source, all planting stock for the study was grown for 1 yr in containers. Survival rates were high (about 87 percent after 6 yr), and survival did not differ by the type of planting stock. Although this study found that seedlings had small but significantly greater final stem diameters and heights than stecklings, a similar study in British Columbia found no difference in growth rates between seedlings and stecklings (Karlsson and Russell 1990). During the 1990s, the Tongass National Forest had a small, active yellow-cedar planting program on the Wrangell and Craig Ranger Districts. Wrangell Ranger District planted 153 ac on Etolin Island, 100 ac on Zarembo Island, 4 ac on Wrangell Island, and 190 ac on Zarembo Island; Craig Ranger District planted 10 ac near Polk Inlet on Prince of Wales Island (Hennon 1992a). These plantings were from local seed sources. Initial survival was generally excellent with >80-percent survival. The Tongass National Forest is resuming its yellow-cedar planting program by interplanting about 1,100 ac on Thorne Bay Ranger District.
The Tongass National Forest has continued its partnership with the Pacific North-west Research Station and has embarked on two planting trials with the objective of developing strategies to address yellow-cedar decline and related changes in climate.
The movement of a species to a new suitable climate, called assisted migration, is an approach to expand a species’ range. As a species declines and dies in part of its range, there may be new locations, sometimes called the leading edge, where the climate becomes suitable. Assisted migration may be necessary for some species of trees that cannot migrate rapidly enough to keep pace with a changing climate. In 2009, a new planting trial was initiated in Yakutat, Alaska, to determine if
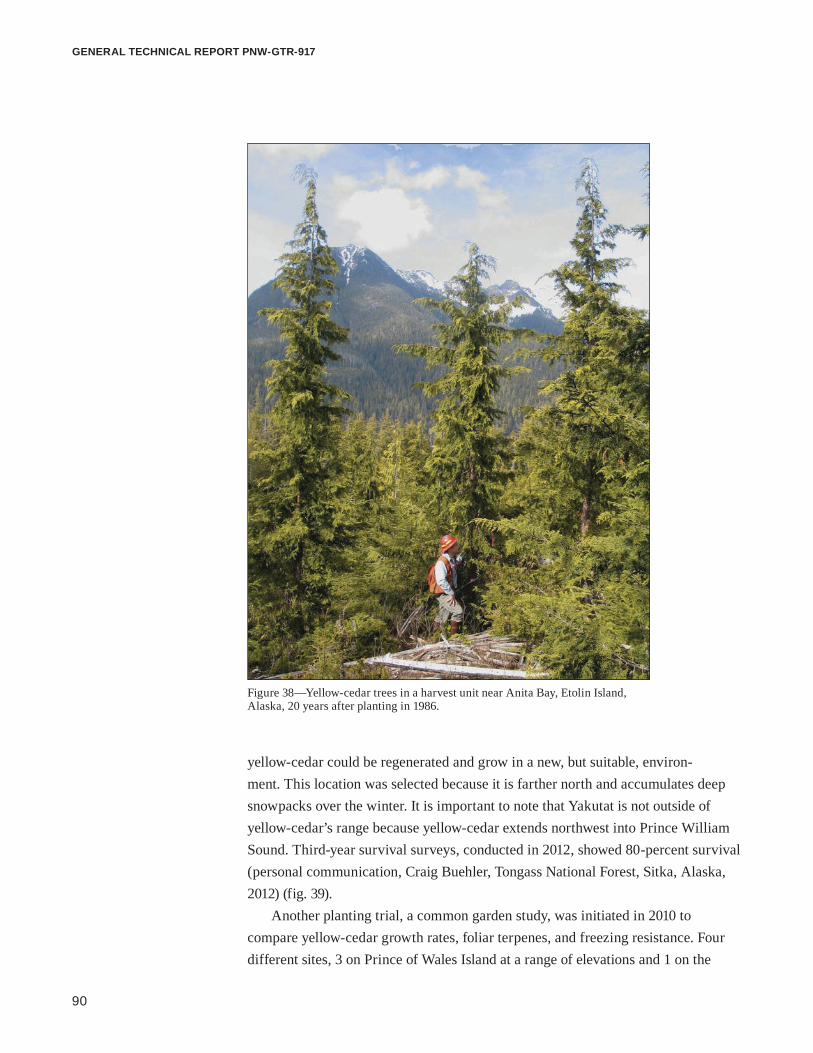
90
GENERAL TECHNICAL REPORT PNW-GTR-917
yellow-cedar could be regenerated and grow in a new, but suitable, environ-ment. This location was selected because it is farther north and accumulates deep snowpacks over the winter. It is important to note that Yakutat is not outside of yellow-cedar’s range because yellow-cedar extends northwest into Prince William Sound. Third-year survival surveys, conducted in 2012, showed 80-percent survival (personal communication, Craig Buehler, Tongass National Forest, Sitka, Alaska, 2012) (fig. 39).
Another planting trial, a common garden study, was initiated in 2010 to compare yellow-cedar growth rates, foliar terpenes, and freezing resistance. Four different sites, 3 on Prince of Wales Island at a range of elevations and 1 on the
Figure 38—Yellow-cedar trees in a harvest unit near Anita Bay, Etolin Island, Alaska, 20 years after planting in 1986.

91
A Climate Adaptation Strategy for Conservation and Management of Yellow-Cedar in Alaska
Figure 39—Three year-old yellow-cedar seedling planted near Yakutat, Alaska.
mainland at Echo Cove north of Juneau, and 16 different seedlots were included in the study design. The second-year height growth and survival data are summarized in table 17 (Paul Hennon, unpublished data).6 All of the sites on Prince of Wales Island had low height growth and poor survival, which were attributed to severe deer browsing. The deer browsing resulted in two types of damage: seedlings were killed because they were pulled out of the ground or the stem was severed below the lowest live branch, or heavy browsing of the terminal and lateral branches resulted in severely stunted growth (fig. 40). One of these two types of damage was recorded on >95 percent of the seedlings on Prince of Wales Island sites. Survival rates are expected to be even poorer on these three sites as browsing by deer continues and severely damaged seedlings eventually die or are outcompeted by associated vegetation. In contrast, no deer browse damage was recorded on any seedling at the Juneau site. Along with low deer concentrations in the area, the seedlings are covered by snow during most of the winter, when seedlings are at the highest risk of
6 Data from yellow-cedar common garden study: first-and second-year growth and survival results, on file with: USDA Forest Service, Forestry Sciences Laboratory, 11175 Auke Lake Way, Juneau, AK 99801.

92
GENERAL TECHNICAL REPORT PNW-GTR-917
Figure 40—Deer browsing damage on a yellow-cedar seedling from a common garden study on Prince of Wales Island.
Table 17—Second-year survival and height of yellow-cedar seedlings in a common garden study
Site SurvivalMean seedling
height
Percent InchesHarris, Prince of Wales Island 1.4 8.3Diesel, Prince of Wales Island 42.8 7.8Sunmore, Prince of Wales Island 61.3 8.8Echo Cove, Juneau Mainland 98.1 18.3

93
A Climate Adaptation Strategy for Conservation and Management of Yellow-Cedar in Alaska
browse. Future common garden trials should be protected from deer (e.g., fencing or shelter of individual seedlings) unless evaluating deer browse is an objective of the study.
The Alaska Department of Fish and Game’s deer management report (Harper 2011) shows a significantly higher deer population on Prince of Wales Island compared to the Juneau area. Prince of Wales Island is part of Alaska’s game management unit (GMU) number 2, which is roughly 3,600 mi2. The deer popula-tion goal for GMU 2 is 71,000 deer, or 19 deer/mi2, with a harvest goal of 2,700 deer. In 2009, the annual deer harvest in GMU 2 was 3,251. The Juneau area is part of GMU 1C, which is 7,600 mi2. The population goal for GMU 1C is 6,200 deer (<1 deer/mi2) while maintaining an annual harvest of 456 deer. In 2009, the annual deer harvest was 291. These deer management objectives, deer harvest records, and the initial results of the yellow-cedar common garden study show that local deer populations need to be considered when prescribing artificial regeneration of yellow-cedar. The same consideration of deer populations may be useful in predict-ing successful natural regeneration of yellow-cedar in harvest areas.
Control of Animal DamageHerbivory from Sitka black-tailed deer is the most significant animal damage that occurs to yellow-cedar regeneration. The yellow-cedar common garden study begun in 2010 (table 17 and fig. 40) demonstrates how local deer populations can decimate planted yellow-cedar. Studies from British Columbia show that deer can also drastically reduce the regeneration of western redcedar (Coates et al. 1985, Martin and Baltzinger 2002). When prescribing deer control measures for yellow-cedar, a silviculturist often tailors the prescription to site conditions, considering local deer population levels, existing habitat, and the timing of deer activity versus availability of yellow-cedar and other palatable plants. By considering the traits of the animal species to be controlled and traits of the plant species to be protected, it may be possible to target costly animal damage control measures such as physical barriers and chemical deer repellents to areas where they are most needed.
Controlling deer browsing could be as simple as delaying spring planting until late May or June. Traditionally, reforestation activities in southeast Alaska occur shortly after snowmelt but before green-up of herbaceous vegetation and leaves of shrubs. Unfortunately, spring planting coincides with deer expanding their move-ment beyond their winter range in search of new plant growth (Person 2009). If preferred browse species such as bunchberry and trailing bramble are not available, deer eat woody browse such as blueberry, yellow-cedar and hemlock, and arboreal lichens (Alaska Department of Fish and Game 2013). If planting could be delayed
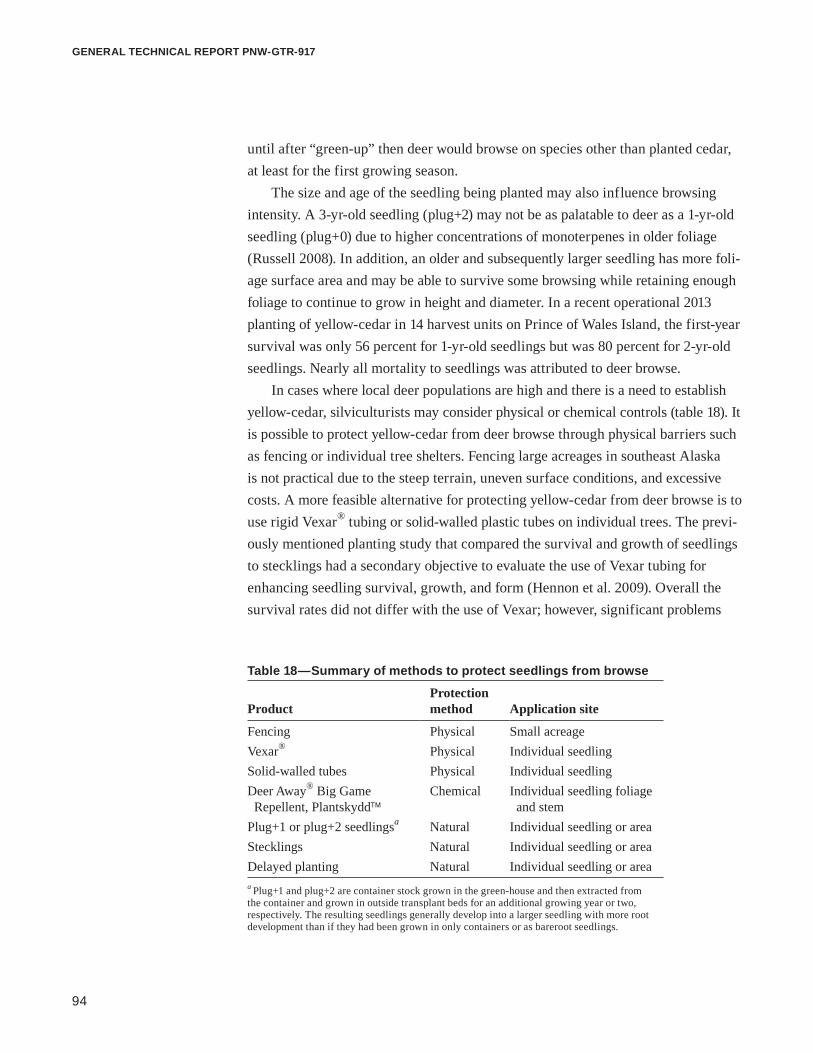
94
GENERAL TECHNICAL REPORT PNW-GTR-917
Table 18—Summary of methods to protect seedlings from browse
ProductProtection method Application site
Fencing Physical Small acreageVexar® Physical Individual seedlingSolid-walled tubes Physical Individual seedlingDeer Away® Big Game Repellent, Plantskydd
Chemical Individual seedling foliage and stem
Plug+1 or plug+2 seedlingsa Natural Individual seedling or areaStecklings Natural Individual seedling or areaDelayed planting Natural Individual seedling or areaa Plug+1 and plug+2 are container stock grown in the green-house and then extracted from the container and grown in outside transplant beds for an additional growing year or two, respectively. The resulting seedlings generally develop into a larger seedling with more root development than if they had been grown in only containers or as bareroot seedlings.
until after “green-up” then deer would browse on species other than planted cedar, at least for the first growing season.
The size and age of the seedling being planted may also influence browsing intensity. A 3-yr-old seedling (plug+2) may not be as palatable to deer as a 1-yr-old seedling (plug+0) due to higher concentrations of monoterpenes in older foliage (Russell 2008). In addition, an older and subsequently larger seedling has more foli-age surface area and may be able to survive some browsing while retaining enough foliage to continue to grow in height and diameter. In a recent operational 2013 planting of yellow-cedar in 14 harvest units on Prince of Wales Island, the first-year survival was only 56 percent for 1-yr-old seedlings but was 80 percent for 2-yr-old seedlings. Nearly all mortality to seedlings was attributed to deer browse.
In cases where local deer populations are high and there is a need to establish yellow-cedar, silviculturists may consider physical or chemical controls (table 18). It is possible to protect yellow-cedar from deer browse through physical barriers such as fencing or individual tree shelters. Fencing large acreages in southeast Alaska is not practical due to the steep terrain, uneven surface conditions, and excessive costs. A more feasible alternative for protecting yellow-cedar from deer browse is to use rigid Vexar® tubing or solid-walled plastic tubes on individual trees. The previ-ously mentioned planting study that compared the survival and growth of seedlings to stecklings had a secondary objective to evaluate the use of Vexar tubing for enhancing seedling survival, growth, and form (Hennon et al. 2009). Overall the survival rates did not differ with the use of Vexar; however, significant problems

95
A Climate Adaptation Strategy for Conservation and Management of Yellow-Cedar in Alaska
with tree form resulted. It should be noted that this study occurred in areas of fairly low deer population and there was a low incidence of browsing on unprotected seedlings. Trees with Vexar were often leaning or prostrate on the ground due to snow loading. In addition, leaders and side branches were often found entangled in the wall of the tube. Other studies have produced similar results (Brandeis et al. 2002, Crouch 1980).
Solid-walled tree shelters are an alternative to Vexar that can withstand high snow loads and improve survival and growth of seedlings (Devine and Harrington 2008, Jacobs and Steinbeck 2001). Even though solid tubes perform better in envi-ronments that receive heavy snowfall, it is still recommended that periodic main-tenance of the tubes occur. Manufacturers of Vexar and solid-walled tubing claim that the material will degrade upon exposure to ultraviolet light within 3 to 5 yr, but Jacobs (2011) found little indication of photodegradation 11 yr after installing tubes on high-elevation clearcuts in southwestern Colorado. Removing or opening shelters is recommended to prevent growth and form deformities rather than relying on photodegradation.
Another silvicultural option to limit damage caused by browsing deer is to apply chemical deer repellents. Chemical repellents generally rely on fear, condi-tioned avoidance, pain, or taste (Trent et al. 2001). The most effective products are fear-inducing and emit sulfurous odors such as predator urine or degrading animal waste products (Nolte 1999, Trent el al. 2001). These repellents include Deer Away® Big Game Repellent (powder and liquid), Bye Deer® Sachets, Deerbusters™ Sachet, and Plantskydd™ (Trent et al. 2001). Deer Away Big Game Repellent and Plantskydd are applied directly to the foliage and stem of the seedlings and are more effective at reducing deer browsing than the area repellents such as Bye Deer Sachets and Deerbuster’s Sachet. Wagner and Nolte (2001) found that spring application of these topical repellents resulted in good protection of western redcedar for 8 to 12 wk. The challenge in using any topical deer repellent is that the repellent needs a sufficient time period, up to 24 h, to dry and adhere to the seedling. This drying requirement makes feasibility in the rainforest setting of coastal Alaska unlikely. The Tongass National Forest is testing if it is feasible to apply deer repellent in the tree cooler before outplanting.
Recently, the Tongass National Forest, Oregon State University, and Sealaska Corporation began a study to evaluate if seedling age, timing of planting, and several methods of protection influence the amount of deer browse on yellow-cedar and redcedar seedlings. First-year results show a high rate of deer browse on four of five sites (47 to 65 percent). Western redcedar had a higher incidence of browse

96
GENERAL TECHNICAL REPORT PNW-GTR-917
than yellow-cedar. The only treatment that reduced browse was the physical protec-tion of tubes. Continuation of this study and similar efforts are needed to develop strategies to successfully regenerate western redcedar and yellow-cedar in areas with high deer populations.
Precommercial ThinningThe stocking and species composition of young hemlock-spruce stands vary across the southeast Alaska landscape primarily due to differences in site productivity and seed sources, but understocking of recently disturbed sites is rare. Harvested hemlock-spruce stands regenerate rapidly from prolific natural seed fall and released advanced regeneration (seedlings and small trees present in the understory of the previous stand that may grow rapidly after being freed from competition with the dominant harvested trees). In some cases, full site occupancy (full stock-ing) is achieved within 15 yr after harvest. Thereafter, controlling the density of trees influences stand characteristics such as tree species composition, tree diameter, height-to-diameter ratios, cover and composition of understory species, and horizontal and vertical diversity. Precommercial thinning is the primary means to manage tree densities at an early age before trees have a marketable value. In southeast Alaska, precommercial thinning is generally prescribed between stand ages 15 and 30 to meet land management objectives such as improved wood produc-tion and value, wildlife habitat, aesthetics, resistance to insects and diseases, and biodiversity.
By favoring yellow-cedar over other species, precommercial thinning can increase the relative abundance of this species within stands and across landscapes. Thinning also releases yellow-cedar from overtopping hemlock and spruce, which on some sites can outgrow yellow-cedar with their more rapid early height growth. Site-specific thinning prescriptions are needed to ensure that yellow-cedar man-agement objectives are compatible with inherent stand variability such as species composition, advanced regeneration, residual overstory, and other important characteristics of the overstory and understory. It is not appropriate to use a blanket prescription that requires all yellow-cedar to be retained during thinning opera-tions. This prescription does not take into consideration factors such as health and form of yellow-cedar trees, quantity and distribution of yellow-cedar on a site, com-petition between trees of the same species, and quality and form of other species. In addition, this practice does not consider a changing climate and the potential that yellow-cedar may be maladapted to a site.

97
A Climate Adaptation Strategy for Conservation and Management of Yellow-Cedar in Alaska
Section 2: Climate and Yellow-Cedar Decline
The extensive yellow-cedar mortality in southeast Alaska and adjacent coastal British Columbia is considered to be a classic forest decline. Forest declines are characterized as being widespread and long-term (i.e., not single events), and have a cause that is either unknown, or has been determined to be a complex of inter-related biotic and abiotic factors (Manion and Lachance 1992). Although the term “decline” suggests reduced growth or changes in populations, forest declines often result in extensive tree mortality, as in the case of yellow-cedar decline. There are several dozen well-established forest declines around the world, including maple and birch declines in the United States and Canada (Manion and Lachance 1992), but the causes of few have been elucidated. Gradual tree death and multiple pre-disposing and inciting factors make it a challenge to unravel the causes of forest declines. Persistent forest disturbances are likely to become more numerous and important as the pace of climate change accelerates; some forest trees are subject to new stresses as climate interacts with other factors, such as insects, pathogens, soils, and intrinsic host tree vulnerabilities, to initiate widespread tree death. Forest declines triggered by shifting climate regimes may be expected in the southern portions of tree species’ ranges. However, yellow-cedar decline diverges from this expectation in that it occurs in the northern areas of its range.
Yellow-Cedar Decline Extent and Intensity of DeclineYellow-cedar mortality is apparent in southeast Alaska and British Columbia, where patches of dead and dying trees are a common sight on hillsides (fig. 41). Yellow-cedar decline, observable from the air as dying trees with yellow to red crowns, has been mapped since about 1990 during annual U.S. Forest Service aerial surveys of forest health. Unlike most transient insect and disease outbreaks, the acreage of yellow-cedar decline represents a long-term feature on these landscapes, not only because tree death occurs gradually, but also because yellow-cedar remains standing for 80 to 100 yr after tree death. These mapping efforts have resulted in a single distribution map of yellow-cedar decline in Alaska (fig. 42). Merging several thousand mapped patches of various sizes creates a cumulative measure of decline that covers >500,000 ac. The wide swath of decline extends from the southern part of southeast Alaska north towards the western coast of Chichagof Island. This value may represent an underestimate of forests affected by yellow-cedar decline because it is difficult to detect mortality where it is older or in less productive forest types. The potential for underestimation in some of the areas of the southern panhandle
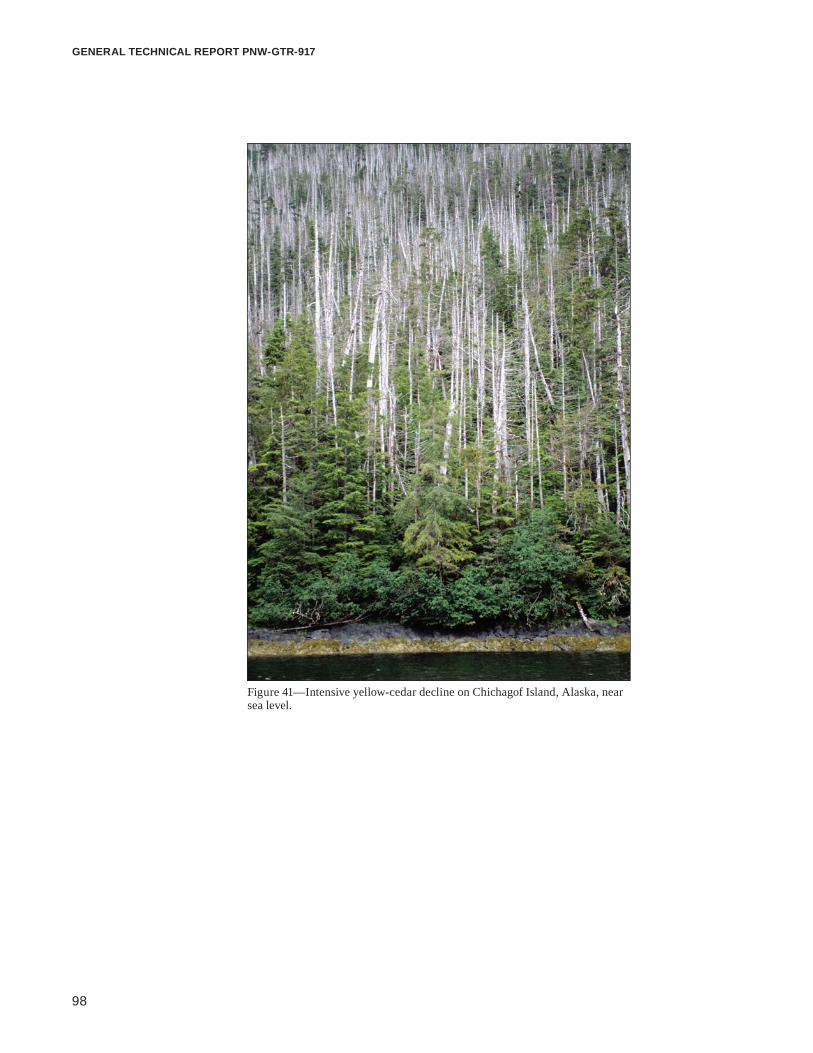
98
GENERAL TECHNICAL REPORT PNW-GTR-917
Figure 41—Intensive yellow-cedar decline on Chichagof Island, Alaska, near sea level.

99
A Climate Adaptation Strategy for Conservation and Management of Yellow-Cedar in Alaska
Figure 42—Occurrence of yellow-cedar decline from aerial detection surveys (red) in the context of yellow-cedar populations (yellow) in southeast Alaska.

100
GENERAL TECHNICAL REPORT PNW-GTR-917
of Alaska that have older mortality on forested wetlands is discussed in appendix 1. Yellow-cedar forests in the northeastern portion of the panhandle, north along the Gulf of Alaska coast above latitude 57.6° N, and to the northwest in Prince William Sound are all apparently free of this intensive mortality. In 2004, yellow-cedar decline was discovered along the northern coast of British Columbia during surveys with the British Columbia Ministry of Forests (Hennon et al. 2005). Subsequent surveys have expanded the acreage and southern extent considerably. To date, yellow-cedar decline in British Columbia has been detected on 235,000 ac (Westfall and Ebata 2014), extending south to the mainland across from Vancouver Island to an area just south of latitude 51° N. Yellow-cedar decline is now known to occur along a north-south axis that covers more than 6° of latitude, or about 600 miles. This mortality is not known to occur furthur south in British Columbia, Washing-ton, Oregon, or California.
At a broad spatial scale, yellow-cedar decline has elevational limits that vary by latitude in a manner that suggests that climate plays a key role in the mortality. Decline at southern latitudes in British Columbia occurs at much higher elevations (650–2,300 ft) (Hennon et al. 2005, Westfall and Ebata 2014, Wooton and Klinken-berg 2011). Along northern latitudes, decline is found at progressively lower eleva-tions; at the northern extent of decline (57.6° N on Chichagof Island, Alaska), tree death is expressed in a narrow, low-elevation band from sea level to only 500 ft. In Alaska, elevational patterns of yellow-cedar decline have been documented over the 3° of latitude where it occurs (Graham and Heutte 2014). This information will be merged with accumulating data from British Columbia, providing a seamless view of the problem over the full 6° of latitude.
Although much of the mapped yellow-cedar decline occurrence has been gathered by using aerial detection survey (ADS) techniques, high-resolution maps of yellow-cedar decline have been produced from aerial photographs for parts of Alaska’s Kruzof, Chichagof, and Baranof Islands (Hennon and Wittwer 2013) (fig. 43). As is common on many landscapes where yellow-cedar decline occurs almost continuously, discrete pockets are too numerous and small to effectively map in real time from a moving aircraft. This finer scale photo-interpreted (PI) dataset show-ing discrete patches of yellow-cedar decline was developed by using 1:60,000 color infrared photographs taken of the Mount Edgecumbe and Peril Strait areas between 1996 and 1998. The interpreted data were then verified during flights by using ADS digital sketch-map techniques.
The two detection techniques (ADS and PI) showed decline in the same general areas, but the fine-scale PI mapping technique yielded only one-fourth the acreage suggested by the ADS data, while showing 25 times the number of discrete decline
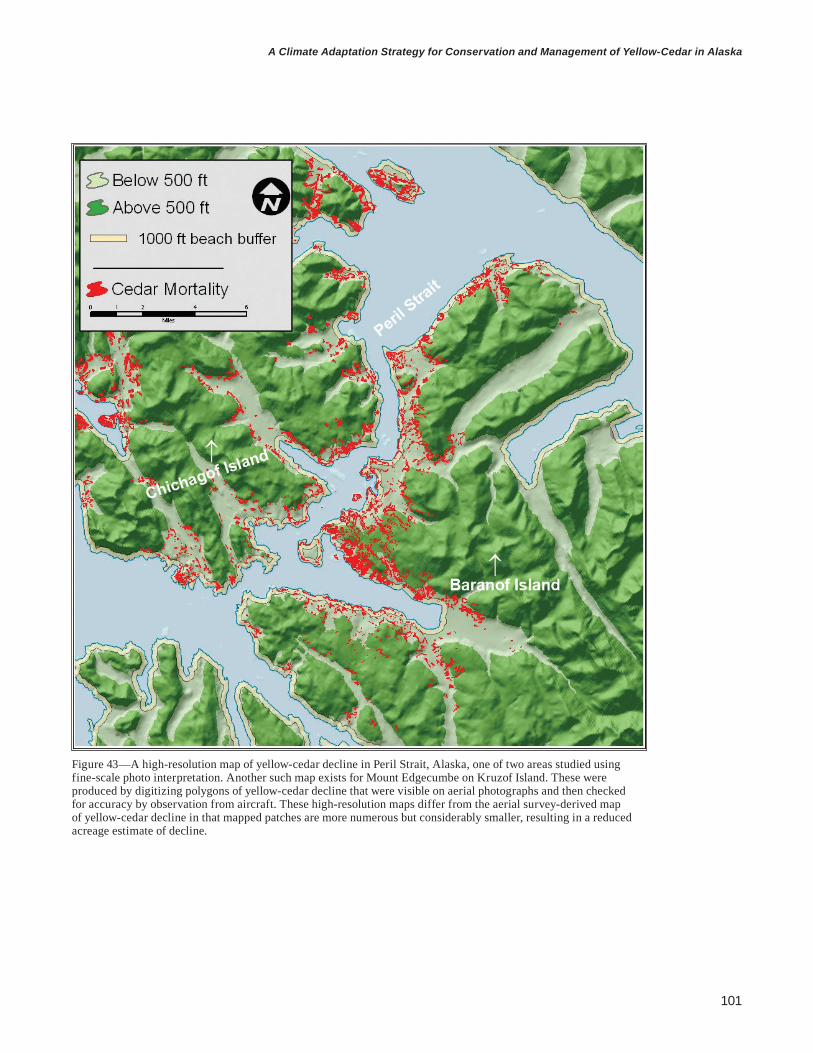
101
A Climate Adaptation Strategy for Conservation and Management of Yellow-Cedar in Alaska
Figure 43—A high-resolution map of yellow-cedar decline in Peril Strait, Alaska, one of two areas studied using fine-scale photo interpretation. Another such map exists for Mount Edgecumbe on Kruzof Island. These were produced by digitizing polygons of yellow-cedar decline that were visible on aerial photographs and then checked for accuracy by observation from aircraft. These high-resolution maps differ from the aerial survey-derived map of yellow-cedar decline in that mapped patches are more numerous but considerably smaller, resulting in a reduced acreage estimate of decline.

102
GENERAL TECHNICAL REPORT PNW-GTR-917
patches. These results should be taken into account when quantifying dead yellow-cedar, such as estimating salvage volume. Also, the PI approach may be biased toward detection of higher volume dead forests because of the vertical view of this photography. When the observer is looking straight down, denser concentrations of dead wood are required for detection of affected forest. The more diffuse patches of dead cedar are visible in the oblique view used in ADS. This bias toward higher density of dead trees could make PI a more selective method for detecting patches suitable for commercial salvage recovery.
Mount Edgecumbe, on Kruzof Island near Sitka, Alaska, at a latitude of 57° N, is a dormant volcano with radial symmetry and gradual slopes that support open-canopy forests with abundant yellow-cedar extending from sea level nearly to timberline at approximately 2,000 ft. Subsequent terrain analysis of the Mount Edgecumbe PI data suggested that, at that latitude, decline is most abundant at an elevation of 400 ft, on southern aspects, and on gentle slopes of 6° to 10°.
Two studies describe the local intensity of yellow-cedar mortality in stands with cedar decline. Both found that, on average, 60 to 70 percent of the yellow-cedar basal area was dead in ground plots in decline-affected forests, with mortality >90 percent in some stands (D’Amore and Hennon 2006, Hennon et al. 1990b). Mortal-ity was more common among larger trees but also occurred in trees with diameters as small as 6 in. Tree species other than yellow-cedar typically do not show elevated mortality rates in stands affected by yellow-cedar decline. Most of the plots evalu-ated in these studies were located on Chichagof and Baranof Islands near the northern extreme of cedar decline; however, the earlier study (Hennon et al. 1990b) also included plots on Wrangell and Prince of Wales Islands. The majority of tree death in these plots occurred on wet soils (D’Amore and Hennon 2006, Johnson and Wilcock 2002), where, paradoxically, yellow-cedar was previously well-adapted and competitive (see “Geology and soils” in section 1) (Hennon et al. 1990a, Neiland 1971). Affected stands are usually composed of long-dead, recently dead, dying, and surviving trees, which suggests that mortality is long-term and continuing. Conversely, newer patches of yellow-cedar decline contain mainly recently killed and surviving trees, indicating later initiation.
Yellow-cedar decline was known to occur only in older, unmanaged forests until recently, when silviculturist Greg Roberts of the Wrangell Ranger District noticed dying yellow-cedar in young-growth forests on Zarembo Island in southeast Alaska. He and colleagues assessed this situation initially in the summer of 2013 (Mulvey et al. 2013). The dying and recently dead yellow-cedars (fig. 44) had been previously selected as crop trees in the 38-yr-old precommercially thinned stand. Symptoms of dying trees in the young-growth forest mirrored the classic symptoms

103
A Climate Adaptation Strategy for Conservation and Management of Yellow-Cedar in Alaska
Figure 44—Dying (left) and nearly dead (right) yellow-cedar crop trees in a thinned 38-year-old stand on Zarembo Island, the first example of yellow-cedar decline in a young-growth forest.
of dying mature trees: dead coarse roots, necrotic phloem lesions extending from coarse roots vertically up the lower bole, and entire crowns dying as a unit with proximal (inner) foliage the first and distal (tip) foliage the last to die. Also, as is common on nearly dead or recently dead mature trees, the galleries of the bark bee-tle Phloeosinus and mycelial fans and rhizomorphs of the fungus Armillaria were found on young yellow-cedars in this stand. The dead and dying young-growth yellow-cedar trees were found in the wetter portions of the stand, as indicated by tree sizes and understory plants, another similarity with yellow-cedar decline in unmanaged forests. Dead mature yellow-cedar stands were observed around these affected young-growth stands, suggesting that landscape position, including eleva-tion, is conducive to decline development. Monitoring of this site will continue, and additional observations in other young-growth yellow-cedar stands will be neces-sary to determine if this case is an isolated occurrence.
Epidemiology, Timing, and Pulses of MortalityA unique snag classification system was designed for use in epidemiology studies on yellow-cedar (fig. 45) because existing systems developed for tree species that
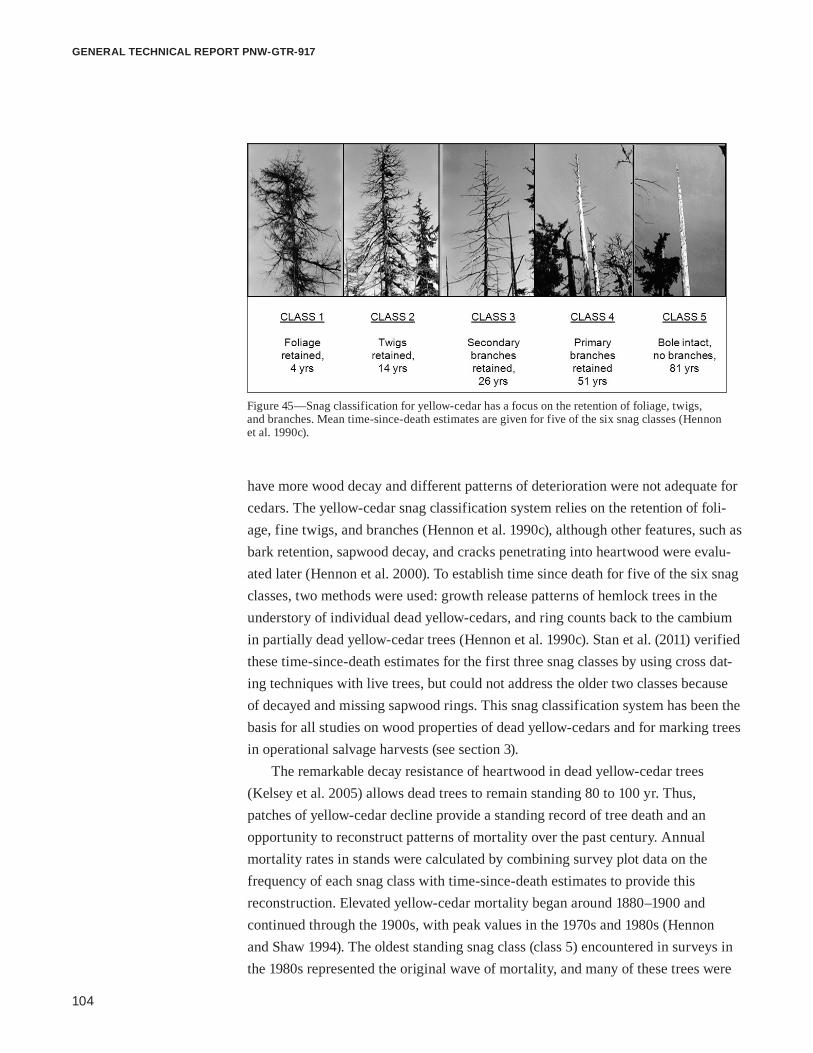
104
GENERAL TECHNICAL REPORT PNW-GTR-917
Figure 45—Snag classification for yellow-cedar has a focus on the retention of foliage, twigs, and branches. Mean time-since-death estimates are given for five of the six snag classes (Hennon et al. 1990c).
have more wood decay and different patterns of deterioration were not adequate for cedars. The yellow-cedar snag classification system relies on the retention of foli-age, fine twigs, and branches (Hennon et al. 1990c), although other features, such as bark retention, sapwood decay, and cracks penetrating into heartwood were evalu-ated later (Hennon et al. 2000). To establish time since death for five of the six snag classes, two methods were used: growth release patterns of hemlock trees in the understory of individual dead yellow-cedars, and ring counts back to the cambium in partially dead yellow-cedar trees (Hennon et al. 1990c). Stan et al. (2011) verified these time-since-death estimates for the first three snag classes by using cross dat-ing techniques with live trees, but could not address the older two classes because of decayed and missing sapwood rings. This snag classification system has been the basis for all studies on wood properties of dead yellow-cedars and for marking trees in operational salvage harvests (see section 3).
The remarkable decay resistance of heartwood in dead yellow-cedar trees (Kelsey et al. 2005) allows dead trees to remain standing 80 to 100 yr. Thus, patches of yellow-cedar decline provide a standing record of tree death and an opportunity to reconstruct patterns of mortality over the past century. Annual mortality rates in stands were calculated by combining survey plot data on the frequency of each snag class with time-since-death estimates to provide this reconstruction. Elevated yellow-cedar mortality began around 1880–1900 and continued through the 1900s, with peak values in the 1970s and 1980s (Hennon and Shaw 1994). The oldest standing snag class (class 5) encountered in surveys in the 1980s represented the original wave of mortality, and many of these trees were

105
A Climate Adaptation Strategy for Conservation and Management of Yellow-Cedar in Alaska
still standing on ground plots more than 100 yr after death (Hennon et al. 1990c). Class 5 snags eventually weaken and break off low on the bole due to decay at the ground line, falling to the forest floor and becoming class 6 downed snags (fig. 46). Class 6 downed yellow-cedar snags were infrequently encountered during surveys in the 1980s, and were found in equal concentrations in dying and healthy forests (Hennon et al. 1990b). This low incidence of downed snags probably represents the sustainable rate of yellow-cedar mortality in healthy forests. As more time elapses, snags created by the original wave of mortality that occurred around 1900 will continue to snap and fall to the ground.
As noted, the decline is progressive in most dying stands, which typically contain a mixture of yellow-cedar trees killed at different times, dying cedars, scattered surviving cedars, and other tree species (Hennon and Shaw 1997). In some stands, there are clear zones of tree death that occurred at different times, suggesting patterns of local (around 300 ft) spread in the last century (Hennon et al.
Figure 46—Old yellow-cedar snags eventually have sufficient decay near the ground line that they break and finally fall to the ground some 80–100 years after death.

106
GENERAL TECHNICAL REPORT PNW-GTR-917
1990b). Plot data reveal that this spread tends to occur along a hydrologic or slope gradient, with long-dead trees in central areas with poorly drained soils and more recently killed or dying trees around the periphery on sites with better drainage (D’Amore and Hennon 2006, Hennon et al. 1990a). A comparative analysis of his-torical and recent aerial photographs (Hennon et al. 1990b), along with subsequent use of remote sensing, vegetation classification, and ground plots with snag class data (D’Amore and Hennon 2006), confirms the slow spread of mortality. Stands at the northern limits of yellow-cedar decline in southeast Alaska from Slocum Arm to Klag Bay on the outer coast of Chichagof Island have a south-to-north sequence of older, recently killed, dying, and healthy yellow-cedar stands (Oakes et al. 2014).
Data from measurements of permanent U.S. Forest Service, Forest Inventory and Analysis (FIA) plots in southeast Alaska were used to detect net changes in tree species’ populations through gains of in-growth and regeneration and losses through harvest and mortality (Barrett and Christensen 2011). Plots were estab-lished from 1995 through 1998 and remeasured from 2004 through 2008. Analysis of yellow-cedar populations did not reveal significant net biomass loss over this period. One explanation is that this evaluation was conducted after the major mortality pulse in the late 1970s and 1980s. In general, FIA plots do not cover wilderness areas managed by the Forest Service, and several, such as the West Chichagof–Yakobi Wilderness Area, are known to have extensive recent mortality (Oakes et al. 2014). Also, there is evidence that the roughly 30 percent of surviving yellow-cedar trees in decline patches eventually release and have good growth as the forest recovers (Beier et al. 2008). The FIA plots throughout coastal Alaska were analyzed, not just those in areas of yellow-cedar decline. Regeneration and tree growth gains in healthy forests at higher elevations or beyond the distribution of yellow-cedar decline may have compensated for mortality losses in decline-affected forests. Every year, the Forest Service’s forest health reports (e.g., Graham and Heutte 2014) document new areas of active yellow-cedar decline. These surveys show that localized active spots of mortality persist from year to year, but generally yellow-cedar decline appears to be episodic on a regional scale.
Causes of Extensive Tree DeathEarly Studies on Symptoms and Biotic AgentsStudy of the cause of yellow-cedar decline (fig. 47) was initiated in 1981 with a rapid field assessment of the problem (Shaw et al. 1985), including observations on crown symptoms, activity of several known insects and disease organisms, and the likely duration of the problem. In prior years, the occurrence of a dead and dying yellow-cedar component of forests was noted in annual forest insect and disease

107
A Climate Adaptation Strategy for Conservation and Management of Yellow-Cedar in Alaska
Figure 47—Dying yellow-cedar expressing symptoms throughout its crown.
reports with speculation about the cause, but it was not fully investigated other than the finding that bark beetles (Phloeosinus species) were present in some of the dying trees (Downing 1960). More deliberate studies on symptoms and biotic agents began in 1982 in a cooperative agreement between the Pacific Northwest Research Station and Oregon State University. Trees in various stages of dying were examined for symptoms in their roots (through excavation), boles, and crowns. Evaluating trees at various stages of symptom development allowed for a sequential description to be formulated on belowground and aboveground symptom progres-sion over the course of tree death (Hennon et al. 1990d). Initially, fine roots die, followed by small-diameter root mortality and the formation of necrotic lesions on coarse roots. Finally, necrotic lesions spread from dead roots vertically, from the root collar up the tree bole (fig. 48). Symptoms of stress in the tree crown lag behind the early root symptoms. The entire crown generally dies as a unit, with

108
GENERAL TECHNICAL REPORT PNW-GTR-917
Figure 48—Lower bole lesions typical of dying yellow-cedar trees in the final stages before death. The bole lesion was infected with the fungus Armillaria sp., which is present on about one-half of dying yellow-cedar trees.
discoloration occurring throughout the crown, sometimes quickly (fig. 47). On slower-dying trees, proximal (inner) foliage dies first, followed by the death of distal (outer) foliage (fig. 49). This slow death, which is more typical, is expressed with crowns thinning progressively over 10 to 15 yr, with an associated stagnation in radial growth. In general, the study of symptoms and their progression suggested a belowground problem for affected trees.
Many groups of organisms were evaluated as potential pathogens involved in the decline syndrome, but each was ruled out by inoculation trials or by the lack of association with symptomatic tissue or dying areas of the forest. Groups of organisms investigated were higher fungi (Hennon 1990, Hennon et al. 1990d),
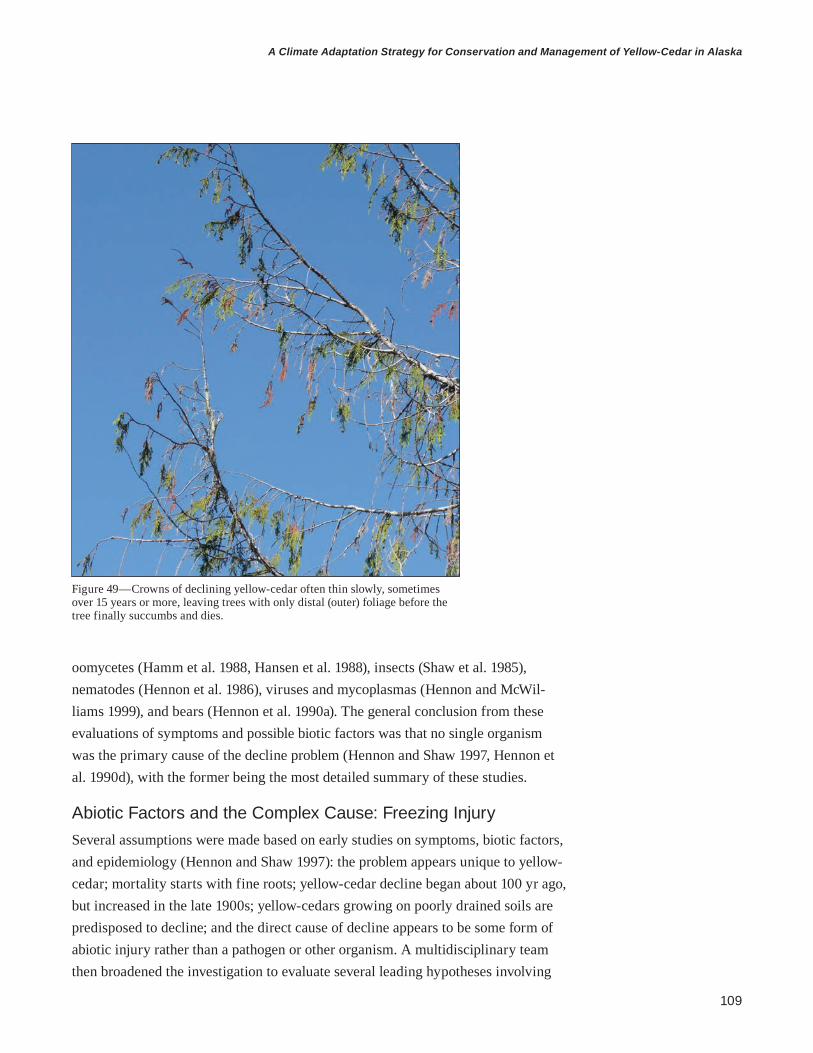
109
A Climate Adaptation Strategy for Conservation and Management of Yellow-Cedar in Alaska
oomycetes (Hamm et al. 1988, Hansen et al. 1988), insects (Shaw et al. 1985), nematodes (Hennon et al. 1986), viruses and mycoplasmas (Hennon and McWil-liams 1999), and bears (Hennon et al. 1990a). The general conclusion from these evaluations of symptoms and possible biotic factors was that no single organism was the primary cause of the decline problem (Hennon and Shaw 1997, Hennon et al. 1990d), with the former being the most detailed summary of these studies.
Abiotic Factors and the Complex Cause: Freezing InjurySeveral assumptions were made based on early studies on symptoms, biotic factors, and epidemiology (Hennon and Shaw 1997): the problem appears unique to yellow-cedar; mortality starts with fine roots; yellow-cedar decline began about 100 yr ago, but increased in the late 1900s; yellow-cedars growing on poorly drained soils are predisposed to decline; and the direct cause of decline appears to be some form of abiotic injury rather than a pathogen or other organism. A multidisciplinary team then broadened the investigation to evaluate several leading hypotheses involving
Figure 49—Crowns of declining yellow-cedar often thin slowly, sometimes over 15 years or more, leaving trees with only distal (outer) foliage before the tree finally succumbs and dies.

110
GENERAL TECHNICAL REPORT PNW-GTR-917
likely abiotic factors to explain tree death: aluminum soil toxicity, calcium defi-ciency, soil acidity, and freezing injury (D’Amore and Hennon 2006). A risk-factor analysis compared the values of these abiotic factors to the health of yellow-cedar forests in two watersheds. This study revealed that greater extremes in seasonal air and soil temperature were consistently associated with the occurrence of yellow-cedar decline, and that other examined factors did not relate to cedar health (D’Amore and Hennon 2006). These findings, along with cumulative knowledge of the symptoms of dying trees and temporal and spatial patterns of decline, suggested a hypothetical cascade of predisposing and inciting factors that led to root-freezing injury as the proximate cause of tree death (fig. 50).
Figure 50—The interrelated factors that contribute to the proximal cause of yellow-cedar decline—fine root freezing—and the mitigating role of snow.
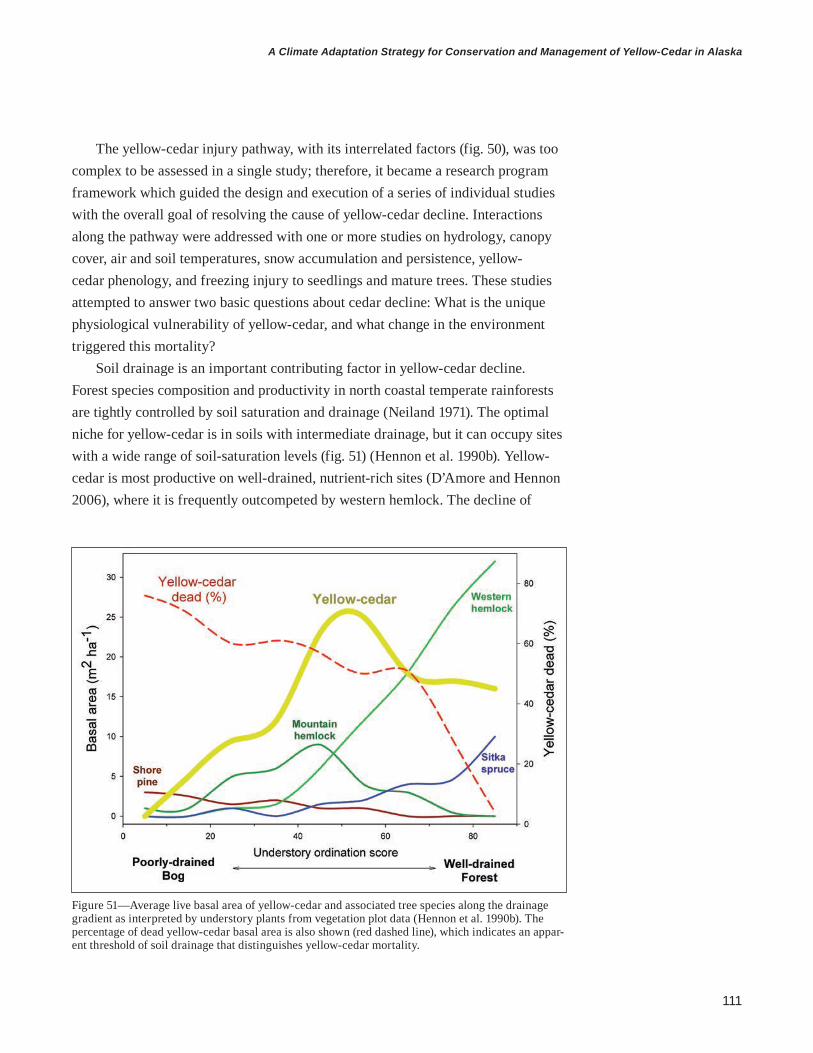
111
A Climate Adaptation Strategy for Conservation and Management of Yellow-Cedar in Alaska
The yellow-cedar injury pathway, with its interrelated factors (fig. 50), was too complex to be assessed in a single study; therefore, it became a research program framework which guided the design and execution of a series of individual studies with the overall goal of resolving the cause of yellow-cedar decline. Interactions along the pathway were addressed with one or more studies on hydrology, canopy cover, air and soil temperatures, snow accumulation and persistence, yellow-cedar phenology, and freezing injury to seedlings and mature trees. These studies attempted to answer two basic questions about cedar decline: What is the unique physiological vulnerability of yellow-cedar, and what change in the environment triggered this mortality?
Soil drainage is an important contributing factor in yellow-cedar decline. Forest species composition and productivity in north coastal temperate rainforests are tightly controlled by soil saturation and drainage (Neiland 1971). The optimal niche for yellow-cedar is in soils with intermediate drainage, but it can occupy sites with a wide range of soil-saturation levels (fig. 51) (Hennon et al. 1990b). Yellow-cedar is most productive on well-drained, nutrient-rich sites (D’Amore and Hennon 2006), where it is frequently outcompeted by western hemlock. The decline of
Figure 51—Average live basal area of yellow-cedar and associated tree species along the drainage gradient as interpreted by understory plants from vegetation plot data (Hennon et al. 1990b). The percentage of dead yellow-cedar basal area is also shown (red dashed line), which indicates an appar-ent threshold of soil drainage that distinguishes yellow-cedar mortality.

112
GENERAL TECHNICAL REPORT PNW-GTR-917
yellow-cedar is associated with the wetter side of the drainage gradient (Hennon et al. 1990). There is an apparent threshold that separates live and dead forests (fig. 51), which means that yellow-cedar’s niche is compromised on sites with poor and moderate drainage (Hennon et al. 2012).
Soil saturation and hillslope stability have been compared on steep slopes (>25°) of Mitkof, Prince of Wales, Baranof, and Kuiu Islands. Although areas of yellow-cedar decline on steep slopes do not have significantly greater soil saturation, soils in yellow-cedar decline areas typically have lower hydraulic conductivities and remain saturated for longer periods of time than soils of healthy cedar and spruce forests on adjacent slopes (Johnson and Wilcock 2002). Yellow-cedar decline was correlated with increasing landslide susceptibility in fine-scale studies (Johnson and Wilcock 1998, 2002) yet the relationship was not significant at larger scales—although a stronger relationship may develop with time (Buma and Johnson 2015).
Nutrient cycling and rooting depth are limited on wet soils, and tree growth rates are inhibited, reducing canopy cover and the standing biomass of live trees (D’Amore and Hennon 2006). The size and age structure of existing trees (Beier et al. 2008, Hennon and Shaw 1994) suggest that wet soil conditions were probably present before yellow-cedar decline started around 1900. These soil conditions may have been established several thousand years ago, when the climate along the Pacific Coast became cool and wet, leading to extensive peatland development (Heusser 1960) (see “Paleoecology” in section 1). Estimating forest canopy cover with hemispherical ground-based photographs (fig. 52) and light detection and ranging (LiDAR) demonstrates that canopy cover varies greatly along drainage gradients (from 0 percent in bogs to >89 percent in upland forests), and is highly correlated with the basal area of live trees (Hennon et al. 2010).
It was initially assumed that yellow-cedar trees had abundant roots in shallow horizons of wet soils as a response to low-oxygen conditions encountered at greater depths. However, measurement of yellow-cedar foliar nutrient concentrations suggested that yellow-cedar may also root shallowly as part of a nutrient-acquisition strategy to maintain growth in a nutrient-limited environment in water-saturated soils (Schaberg et al. 2011). This proposed adaptation might allow cedars to link uptake of nitrate anions and calcium cations in order to exploit shallow, rich sources of nitrogen that are unavailable in deeper soil horizons (D’Amore et al. 2009). Nutritional analysis of the foliage indicated that yellow-cedar takes up more cal-cium (concentrated in upper organic soil horizons) and less aluminum (concentrated in deeper mineral horizons) than other associated conifers, which supports the hypothesis that yellow-cedar has a greater proportion of shallow fine roots than many of its competitors (Schaberg et al. 2011). Along with avoidance of anoxia, this

113
A Climate Adaptation Strategy for Conservation and Management of Yellow-Cedar in Alaska
Figure 52—Hemispherical photograph in a stand of yellow-cedar decline. Canopy cover varies widely along the bog-forest drainage gradient and also is further reduced by tree mortality. Canopy cover was estimated from above by modeling LiDAR data and from below by analyzing hemispheri-cal photographs.
adaptation for enhanced nitrate uptake leads to shallow rooting and predisposes yellow-cedar to increased risk of injury from fluctuations in near-surface soil temperature.
Yellow-cedar has been observed on steep slopes in both British Columbia and Alaska. These observations might appear to conflict with soil drainage and shallow rooting as predisposing factors for yellow-cedar decline. Where we have inves-tigated these situations (e.g., Deep Bay in Peril Strait), we found shallow-rooted yellow-cedar trees growing in very thin soils overlaying unfractured bedrock with seepage coming from above. Thus, even though the sites were extremely steep, tree rooting was restricted to a thin mantle of soil and soils appeared wet.
Canopy cover differs considerably by forest productivity (capacity for a greater rate of tree growth) and modifies air and soil temperatures. Dense canopies inter-cept solar energy and buffer the areas below the canopy from high temperatures through shading. This cover also traps heat that emanates from the ground, which leads to temperature inversions below the canopy during cold weather. Forests with lower canopy cover have warmer daily maximum and colder daily minimum air temperatures, and canopy effects on daily temperature ranges are most pronounced

114
GENERAL TECHNICAL REPORT PNW-GTR-917
in the spring months (D’Amore and Hennon 2006). Soil temperature variability is inversely related to soil depth. The shallow-rooting zone (3-in depth) shows pro-nounced daily temperature variation, with an even greater warming effect and fre-quent subfreezing temperatures where the canopy is less dense (Hennon et al. 2010). In the deeper rooting zone (6-in depth), greater late-winter and spring warming, but only infrequent freezing, occurs in areas with lower canopy cover (D’Amore and Hennon 2006). The roots in shallow soil horizons, especially in areas of less canopy cover, are most vulnerable to repeated cold temperature injury.
A series of measurements in the field and experiments in collaboration with the University of Vermont and the Forest Service’s Northern Research Station estab-lished the link between cold tolerance and freezing injury in yellow-cedar trees. Past work on the physiology of yellow-cedar (e.g., Hawkins et al. 2001) suggested that the species has limited cold hardiness. Seasonal differences in the cold toler-ance of mature yellow-cedar and western hemlock were assessed at a site affected by decline (Poison Cove on Chichagof Island) to determine whether temperature sensitivity was a unique factor predisposing yellow-cedar to decline (Schaberg et al. 2005). Measuring foliar cold tolerance as a surrogate for root cold tolerance (because the two measurements are seasonally correlated), Sakai and Larcher (1987) documented two patterns that were consistent with the proposed decline scenario (fig. 50). First, yellow-cedar foliage on trees was more cold hardy in mid-winter than western hemlock foliage, but yellow-cedar dehardened more rapidly than western hemlock to become more easily injured by early cold temperatures. Second, yellow-cedar trees at low and middle elevations, where decline predomi-nates, were more vulnerable to early dehardening and subsequent freezing injury (Schaberg et al. 2005).
The decline mechanism was more directly tested by examining the influence of simulated snow cover (using perlite) on the cold tolerance and freezing injury of potted yellow-cedar seedlings (Schaberg et al. 2008). The roots of all seedlings were tolerant only to about 23 °F (-5 °C); when soil temperatures fell below this threshold on plots without simulated insulating snow, roots were severely injured and seedlings died (fig. 53) (Schaberg et al. 2008). Importantly, the progression of injury followed the sequence of symptoms for mature trees documented in the field, starting with root mortality in the winter and early spring, then foliar damage, and eventually whole-plant mortality when the dead roots were incapable of supplying the foliage with water and other resources (Hennon et al. 1990b). The hypothesis that yellow-cedar has unique freezing vulnerability was further tested by measuring at regular intervals the fine-root cold hardiness of yellow-cedar and four associated conifer species growing in a mixed-species stand near Ketchikan, Alaska (Schaberg
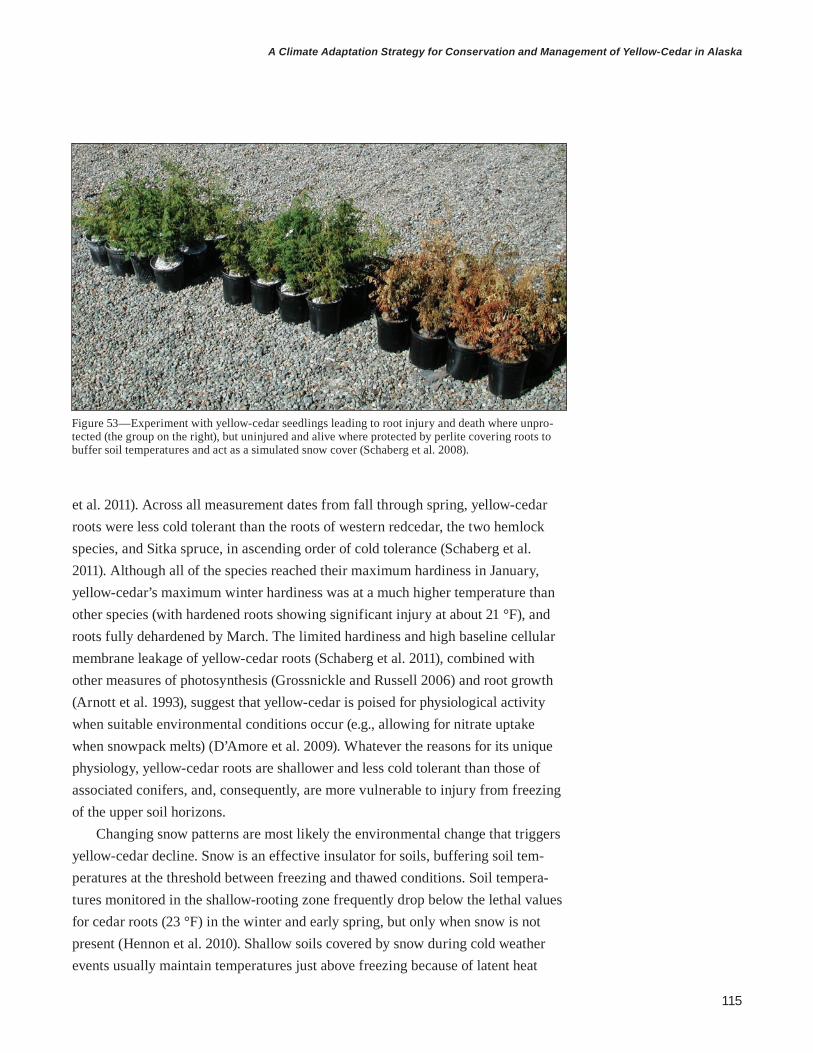
115
A Climate Adaptation Strategy for Conservation and Management of Yellow-Cedar in Alaska
Figure 53—Experiment with yellow-cedar seedlings leading to root injury and death where unpro-tected (the group on the right), but uninjured and alive where protected by perlite covering roots to buffer soil temperatures and act as a simulated snow cover (Schaberg et al. 2008).
et al. 2011). Across all measurement dates from fall through spring, yellow-cedar roots were less cold tolerant than the roots of western redcedar, the two hemlock species, and Sitka spruce, in ascending order of cold tolerance (Schaberg et al. 2011). Although all of the species reached their maximum hardiness in January, yellow-cedar’s maximum winter hardiness was at a much higher temperature than other species (with hardened roots showing significant injury at about 21 °F), and roots fully dehardened by March. The limited hardiness and high baseline cellular membrane leakage of yellow-cedar roots (Schaberg et al. 2011), combined with other measures of photosynthesis (Grossnickle and Russell 2006) and root growth (Arnott et al. 1993), suggest that yellow-cedar is poised for physiological activity when suitable environmental conditions occur (e.g., allowing for nitrate uptake when snowpack melts) (D’Amore et al. 2009). Whatever the reasons for its unique physiology, yellow-cedar roots are shallower and less cold tolerant than those of associated conifers, and, consequently, are more vulnerable to injury from freezing of the upper soil horizons.
Changing snow patterns are most likely the environmental change that triggers yellow-cedar decline. Snow is an effective insulator for soils, buffering soil tem-peratures at the threshold between freezing and thawed conditions. Soil tempera-tures monitored in the shallow-rooting zone frequently drop below the lethal values for cedar roots (23 °F) in the winter and early spring, but only when snow is not present (Hennon et al. 2010). Shallow soils covered by snow during cold weather events usually maintain temperatures just above freezing because of latent heat

116
GENERAL TECHNICAL REPORT PNW-GTR-917
emanating from deeper soils. The persistence of snow beyond the last hard freeze in the spring protects yellow-cedar from root injury, and this relationship explains the broad spatial distribution and elevational patterns of yellow-cedar decline on the landscape (Hennon et al. 2008). In addition to this extensive geographic pattern of decline, mortality-induced changes in microclimate may help spread decline at the local-stand scale. Canopy cover was historically controlled by hydrology (i.e., open canopies on wetter soils) (D’Amore and Hennon 2006). But when trees die, a mortality-caused feedback further opens the canopy, which increases the exposure of neighboring trees to extremes in microclimate (Hennon et al. 2010). This type of spreading pattern is typical at the leading edge of tree mortality on better drained soils, where moving fronts of dying trees have been documented along drainage-productivity gradients (Hennon et al. 1990b).
Relationship of Snow and Yellow-Cedar Decline at Different Spatial ScalesAnalyzing the occurrence of the dead and dying yellow-cedar component of forests at multiple spatial scales has helped to form and evaluate the hypothesis for the cause of yellow-cedar decline. Each of three spatial scales offered a unique inter-pretation of the association between decline and particular climate, landscape, site, or microsite features. Evaluation of aerial survey data established that yellow-cedar decline is limited to lower elevations, but the actual elevational limits are modified by latitude. Snow is the proximal factor that controls this pattern. Maps of yellow-cedar decline and a regional snow accumulation model in southeast Alaska show a pattern of decline closely aligned with the lowest of four snow zones (Hennon et al. 2006) (fig. 54). Beier et al. (2008) quantified this relationship as 79 percent and 94 percent of yellow-cedar decline occurring in the low- and low-to-moderate snow zones, respectively. Yellow-cedar forests appear healthy in Alaska in areas that have higher levels of annual snow accumulation, such as the northeastern portion of the panhandle, Glacier Bay forelands, and Prince William Sound (Hennon and Trum-mer 2001).
High-resolution maps of yellow-cedar decline on Mount Edgecumbe, near Sitka, were used to evaluate the association between decline and topographic features (slope, aspect, and elevation) at a mid-spatial scale. Decline was found to have elevational limits that corresponded to aspect, occurring farther upslope on southerly aspects than on northerly aspects. Detailed snow-accumulation models, which included an elevational downscaling adjustment (Wang et al. 2006) for Mount Edgecumbe, revealed the threshold of estimated annual snowfall—about 10 in (250 mm) of annual precipitation as snow—that distinguishes dying yellow-cedar

117
A Climate Adaptation Strategy for Conservation and Management of Yellow-Cedar in Alaska
Figure 54—Regional snow model by Dave Albert (The Nature Conservancy) showing four classes of annual snow accumulation (left) and distribution of yellow-cedar decline (right). Note the close alignment of yellow-cedar decline with the lowest class of snow accumulation, shown in red.
forests from healthy ones (fig. 55). This value is incorporated into a snow model built from historical weather-station data inputs and future projections from a con-servative general circulation model (fig. 55). Output from this model displays how snow patterns on Mount Edgecumbe are estimated to have changed over time and are projected to change into the future, and how changing patterns are expected to affect the distribution of yellow-cedar decline. By the year 2080, the model predicts that snow accumulation sufficient to protect superficial roots from freezing injury will occur only near the top of the mountain (fig. 55). As noted elsewhere, decline is not expected to emerge where yellow-cedar grows on well-drained soils even in areas of low snow accumulation.
Variation of site and forest conditions at a fine landscape scale was studied by using a grid of ground-based vegetation plots in two watersheds at Poison Cove and Goose Cove north of Sitka, near the northern limit of yellow-cedar decline (D’Amore and Hennon 2006). At this local scale yellow-cedar health could be

118
GENERAL TECHNICAL REPORT PNW-GTR-917
Figure 55—Mount Edgecumbe near Sitka, Alaska. The extent of yellow-cedar decline (red) as mapped from 1998 color infrared photographs and the estimated annual precipitation as snow between 1961 and 1990 are shown with colors indicating values above (blue) and below (tan) the threshold of 10 in (250 mm) of annual precipitation as snow (Hennon et al. 2012). The historical and future (with input by a general circulation model) occurrence of this modeled snow threshold are also shown. Figure produced by Colin Shanley, The Nature Conservancy.
correlated with hydrology, canopy cover, microclimate, and snow in order to test the significance of causal factors. Remote cameras were installed to document snow presence and depth daily from winter through spring, and thermal data loggers monitored how snow altered soil temperatures during cold events. This study found that yellow-cedar was dead and dying in low-elevation areas with poor drainage, where shallow soil temperatures were frequently below the 23 °F (-5 °C) threshold for fine-root mortality. In contrast, yellow-cedar was healthy on wet soils farther upslope, where snow insulated the roots, and on adjacent well-drained soils with deeper rooting (Hennon et al. 2010) (fig. 56).

119
A Climate Adaptation Strategy for Conservation and Management of Yellow-Cedar in Alaska
Figure 56—Air (dashed line) and soil temperature (solid lines) through one winter (2004–5) at the Poison Cove study site illustrating the difference between soil temperature in the largely snow-free lower elevation plots where cedars are dead (red line) and slightly higher elevation plots with a persistent snowpack (green line) where cedars are live.
Climate Interactions With Yellow-CedarA chronology of the natural history of yellow-cedar helps put forest decline into temporal context, and explains why yellow-cedar is currently maladapted on sites where it once thrived. The current distribution of yellow-cedar in Alaska aligns with the location of Pleistocene refugia (Carrara et al. 2003), indicating that existing yellow-cedar populations may have origins in these refugia; however, an ongoing genetics study is providing inconclusive results about yellow-cedar’s origins and migration in Alaska (see “Paleoecology” in section 1). Climate reconstruction through pollen analysis suggests that only in the last several thousand years, during the late Holocene epoch, has coastal Alaska experienced the cool, wet climate that led to the extensive peatland habitat (Heusser 1960) favorable for yellow-cedar

120
GENERAL TECHNICAL REPORT PNW-GTR-917
expansion. During the Little Ice Age (ca. 1200–1900 C.E.) most of the glaciers in coastal Alaska reached their maximum extension since the end of the Pleistocene epoch (Calkin et al. 2000), but we do not know whether these glacial advances were driven by colder temperatures or increased snowfall. As noted previously, snow probably favors yellow-cedar regeneration. The ages of mature yellow-cedar trees, whether they are dead or still living, indicate that most of them regenerated and grew to their canopy status in existing forests during the Little Ice Age (Beier et al. 2008, Hennon and Shaw 1994). Researchers hypothesize that this favorable climate allowed yellow-cedar to regenerate prolifically, at least in part because snow keeps populations of Sitka black-tailed deer in check (White et al. 2009), and deer are major herbivores of cedar seedlings (see “Animal Damage” in section 1). During the Little Ice Age, yellow-cedar may have become more abundant at lower elevations, where it would later be most vulnerable to decline.
The onset of yellow-cedar decline coincided with the end of the Little Ice Age (Hennon et al. 1990c), which is consistent with reduced snow as the trigger for widespread yellow-cedar mortality. A large pulse of yellow-cedar mortality also occurred in the 1970s and 1980s (Hennon and Shaw 1994), during a notably warm period of the Pacific Decadal Oscillation (Mantua 2011). In an analysis of 20th-century weather in southeast Alaska, Beier et al. (2008) reported warmer weather in the late winter and early spring, reduced snow, and persistent cold events in the spring, all of which are conditions consistent with the current understanding of yellow-cedar decline. The lag between root injury and crown symptoms, slow death of individual trees (which can take 15 yr or more to die; Hennon et al. 1990d), and repeated injury events required to kill mature trees all complicate linking the tim-ing of weather events, injury, and mortality.
The forests of coastal Alaska are expected to have the largest increase in frost-free days of anywhere in North America (Meehl et al. 2004) during the 21st century as the winter climate crosses the snow-rain threshold. Temperatures averaged near freezing during the winter months of the 20th century at weather stations located near sea level in southeast Alaska (Beier et al. 2008). With heavy year-round precipitation, this near-freezing winter temperature regime suggests that modest warming would dramatically reduce snow accumulation. Despite the potential for a warming regional climate and less snow accumulation, the close proximity of southeast Alaska to the mainland continental climate in adjacent British Columbia and Yukon Territory still allows cold air to be pushed over yellow-cedar forests during high-pressure weather events in the spring. This juxtaposition of climates produces mild maritime weather that maintains the physiological activity of yellow-cedar and reduces snow, but also allows for periodic infiltration of cold continental

121
A Climate Adaptation Strategy for Conservation and Management of Yellow-Cedar in Alaska
conditions that inflict injury. Overall, yellow-cedar decline is influenced by histori-cal climate that promoted yellow-cedar regeneration and survival at low elevations and mid-elevations; climate, nutrient and drainage features that encourage shallow root systems which are sensitive to freezing injuries where snowpack is insuf-ficient; and recent climate shifts since the end of the Little Ice Age that promote mild winter conditions, favoring limited cold hardening and reducing insulating snowpack. Decadal climate oscillations exacerbate these last two effects, leading to pulses of mortality, such as that observed in the 1970s and 1980s. The individual cold-weather periods in the spring that have the potential to cause proximal injury continue to be frequent events in a warming climate due to the interaction between coastal and continental weather circulation patterns.
ConclusionsThirty years of research by a dynamic and collaborative research team determined the cause of yellow-cedar decline, which culminates in freezing damage to fine roots and eventual tree death. This process is so important to the health and sustain-ability of yellow-cedar forests in Alaska that it could be the primary consideration in developing forest conservation and management plans for the tree species. Although the cause of yellow-cedar decline is complex, it can be reduced to just two risk factors, levels of snow and soil drainage, for landscape modeling to identify favorable and unfavorable yellow-cedar habitat. Section 3 provides considerations for lands in either protected or active management status where yellow-cedar may be dying and dead or healthy and thriving. Section 4 uses the described risk factors in a modeling project to partition landscapes by habitat suitability and the presence and health status of yellow-cedar populations.

122
GENERAL TECHNICAL REPORT PNW-GTR-917
123
A Climate Adaptation Strategy for Conservation and Management of Yellow-Cedar in Alaska
In Alaska, yellow-cedar grows in forests that are actively managed or under protec-tion status, and in habitats that are favorable for the species or likely to be vulnera-ble to decline in the future. The conceptual basis for determining habitat suitability for yellow-cedar is described in section 2; models that delineate current and future habitat suitability are presented in section 4; and the resulting mix of suitable and vulnerable habitats (including future risk of decline), land ownership, and manage-ment categories at a local spatial scale are provided in appendix 1. This section (sec-tion 3) gives narratives on the impacts of yellow-cedar decline and opportunities for monitoring and active management on suitable and vulnerable habitats depending on the protection status of landscapes. The section is divided into two parts: the vulnerable habitat where yellow-cedar decline has already occurred or where it is expected to develop in the future, and the suitable habitat where yellow-cedar is expected to remain healthy.
Impacts and Considerations for Management Within the Maladaptation Zone: Species Conversions, Timber Salvage, and Conservation on Vulnerable Habitats This subsection discusses impacts of the extensive mortality of yellow-cedar in coastal Alaskan forests and provides various management considerations for adapting to this problem. New information is available about long-term shifts in the composition (species mixtures) and shorter term changes in understory plants in forests affected by yellow-cedar decline. Yellow-cedar decline can be considered a form of slow disturbance that directly targets one species, resulting in overstory mortality that then triggers forest succession as stands recover. These changes in forest composition (i.e., succession) following mortality have many consequences, including reduced availability of yellow-cedar for cultural purposes and timber supply, modified soil and stream chemistry, and altered wildlife habitat and plant community characteristics. Also, the large acreage of affected forests coupled with the slow deterioration of yellow-cedar snags suggests an opportunity to shift some of the yellow-cedar timber production from healthy forests to decline-affected forests on lands that are actively managed. The extensive climate-induced yellow-cedar mortality also demonstrates that forests in protected landscapes with minimal management can still be greatly altered by climate change.
Section 3: Opportunities for Conservation and Management of Yellow-Cedar On Vulnerable and Suitable Habitats

124
GENERAL TECHNICAL REPORT PNW-GTR-917
Transition in Overstory Trees and Understory PlantsChanges in the composition of tree species, an aspect of plant succession, is tak-ing place in decline-affected yellow-cedar forests (fig. 57). Yellow-cedar nearly always grows in mixed-species stands. After extensive mortality from yellow-cedar decline, the live overstory is dominated by other tree species, although about 30 percent of the yellow-cedar basal area tends to survive (D’Amore et al. 2009, Hennon et al. 2010, Oakes et al. 2014). The pace and permanency of the overstory conversion to other tree species, as well as possible changes in understory plants, have been a significant information gap.
A recent study reported responses in vegetation to yellow-cedar decline (Oakes et al. 2014). This research was conducted along the outer coast of Chichagof Island in southeast Alaska, which represents the very northern extent of existing yellow-cedar decline. Here, Oakes and colleagues documented the slow northerly shift of yellow-cedar decline over the last 100 yr. The study area offered a template of stands that have been affected by decline for varying lengths of time (i.e., a chrono-sequence) to determine rates of change and successional pathways.
Oakes and colleagues’ results indicate that gains by other conifers, especially western hemlock, and, to a lesser extent, mountain hemlock, accompany losses of yellow-cedar in decline-affected stands. The gains in these tree species result from both new regeneration and growth release of surviving understory and overstory trees among the yellow-cedar snags. Regeneration of other conifers was profuse in recent mortality zones, whereas saplings and small trees were more abundant in older yellow-cedar mortality areas. Sitka spruce saplings were common in recent mortality zones, but few mature spruce trees were detected in the older mortality zones. Understory plant cover increased dramatically after yellow-cedar mortality; some plant groups (grasses) responded rapidly (in a few years) and others (shrubs) increased more gradually (requiring decades). Blueberry (Vaccinium ovalifolium and V. alaskaense) increased ninefold in volume (height × cover area) compared to blueberry in healthy, intact yellow-cedar stands (Oakes et al. 2014). These shifts in understory vegetation may be somewhat transient, however. In the oldest mortality zone, forest canopy cover had returned to levels observed in healthy forests, but there was a significant shift in dominant tree species favoring western hemlock. Almost a century may be required for canopies to become reestablished after the onset of yellow-cedar tree death. Negligible yellow-cedar regeneration combined with mature yellow-cedar mortality suggests a long-term (possibly centuries-long) reduction of yellow-cedar and gain of other species in these stands.

125
A Climate Adaptation Strategy for Conservation and Management of Yellow-Cedar in Alaska
We expect soil drainage and the related forest productivity (capacity for a greater rate of tree growth) to play a role in controlling which tree species are favored, with western hemlock dominating the more productive dead zones and mountain hemlock increasing in prevalence in the wetter, less productive zones. Sitka spruce regenerates well following yellow-cedar mortality where seed sources are present, but its growth then stagnates on these sites. Growth stagnation may occur when trees become too large, and their roots are forced into wetter soils beyond the limited raised microsites with aerobic soils.
The complete tree species life-stage approach that Oakes and others used in studying long-term succession in declining yellow-cedar forests could be replicated in areas farther south in coastal Alaska to provide a broader geographic perspective on succession after yellow-cedar decline and to assess the response of western red-cedar. Colleagues from the British Columbia Ministry of Forests and the University of British Columbia also view the structural and compositional changes that occur in heavily affected forests as a priority research area. U.S. Forest Service, Forest Inventory and Analysis (FIA) plot data could be another source of information for documenting the species and sizes of trees that accompany dead yellow-cedar in the declining stands in southeast Alaska.
Figure 57—Surviving western and mountain hemlock at Goose Cove, Peril Strait, Alaska appear as green trees among the numerous dead yellow-cedar trees, illustrating a successional shift in tree species in response to yellow-cedar decline.
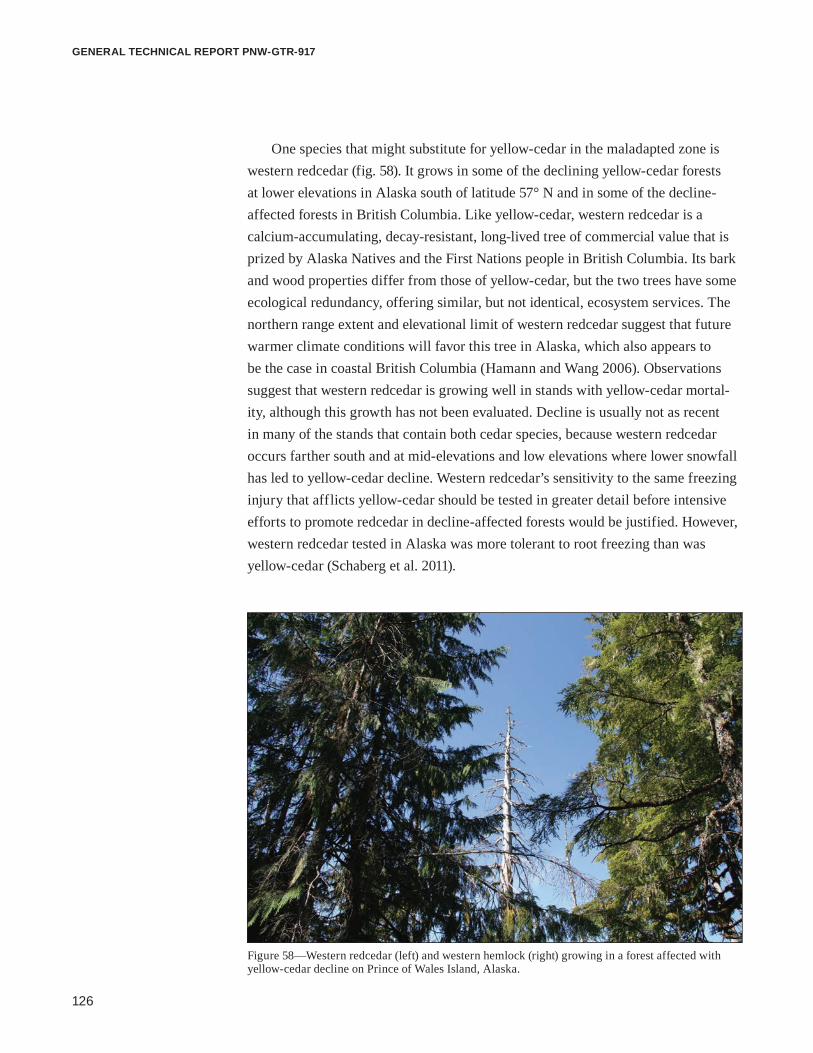
126
GENERAL TECHNICAL REPORT PNW-GTR-917
One species that might substitute for yellow-cedar in the maladapted zone is western redcedar (fig. 58). It grows in some of the declining yellow-cedar forests at lower elevations in Alaska south of latitude 57° N and in some of the decline-affected forests in British Columbia. Like yellow-cedar, western redcedar is a calcium-accumulating, decay-resistant, long-lived tree of commercial value that is prized by Alaska Natives and the First Nations people in British Columbia. Its bark and wood properties differ from those of yellow-cedar, but the two trees have some ecological redundancy, offering similar, but not identical, ecosystem services. The northern range extent and elevational limit of western redcedar suggest that future warmer climate conditions will favor this tree in Alaska, which also appears to be the case in coastal British Columbia (Hamann and Wang 2006). Observations suggest that western redcedar is growing well in stands with yellow-cedar mortal-ity, although this growth has not been evaluated. Decline is usually not as recent in many of the stands that contain both cedar species, because western redcedar occurs farther south and at mid-elevations and low elevations where lower snowfall has led to yellow-cedar decline. Western redcedar’s sensitivity to the same freezing injury that afflicts yellow-cedar should be tested in greater detail before intensive efforts to promote redcedar in decline-affected forests would be justified. However, western redcedar tested in Alaska was more tolerant to root freezing than was yellow-cedar (Schaberg et al. 2011).
Figure 58—Western redcedar (left) and western hemlock (right) growing in a forest affected with yellow-cedar decline on Prince of Wales Island, Alaska.
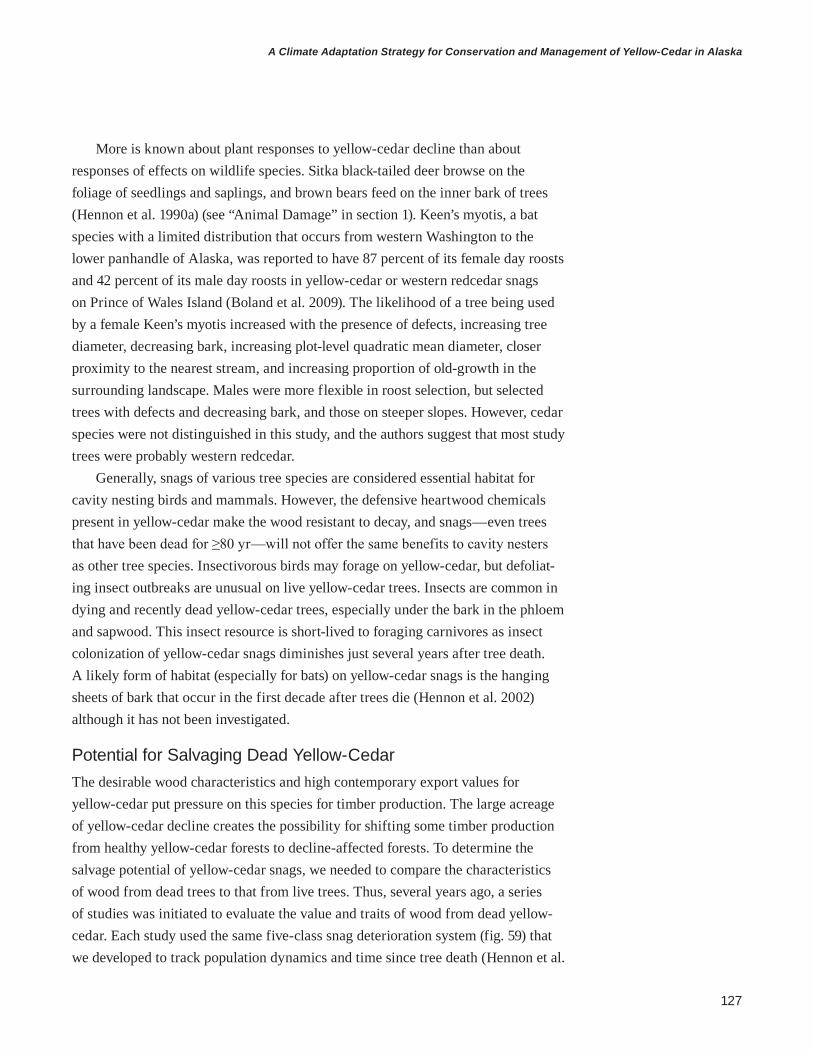
127
A Climate Adaptation Strategy for Conservation and Management of Yellow-Cedar in Alaska
More is known about plant responses to yellow-cedar decline than about responses of effects on wildlife species. Sitka black-tailed deer browse on the foliage of seedlings and saplings, and brown bears feed on the inner bark of trees (Hennon et al. 1990a) (see “Animal Damage” in section 1). Keen’s myotis, a bat species with a limited distribution that occurs from western Washington to the lower panhandle of Alaska, was reported to have 87 percent of its female day roosts and 42 percent of its male day roosts in yellow-cedar or western redcedar snags on Prince of Wales Island (Boland et al. 2009). The likelihood of a tree being used by a female Keen’s myotis increased with the presence of defects, increasing tree diameter, decreasing bark, increasing plot-level quadratic mean diameter, closer proximity to the nearest stream, and increasing proportion of old-growth in the surrounding landscape. Males were more flexible in roost selection, but selected trees with defects and decreasing bark, and those on steeper slopes. However, cedar species were not distinguished in this study, and the authors suggest that most study trees were probably western redcedar.
Generally, snags of various tree species are considered essential habitat for cavity nesting birds and mammals. However, the defensive heartwood chemicals present in yellow-cedar make the wood resistant to decay, and snags—even trees that have been dead for ≥80 yr—will not offer the same benefits to cavity nesters as other tree species. Insectivorous birds may forage on yellow-cedar, but defoliat-ing insect outbreaks are unusual on live yellow-cedar trees. Insects are common in dying and recently dead yellow-cedar trees, especially under the bark in the phloem and sapwood. This insect resource is short-lived to foraging carnivores as insect colonization of yellow-cedar snags diminishes just several years after tree death. A likely form of habitat (especially for bats) on yellow-cedar snags is the hanging sheets of bark that occur in the first decade after trees die (Hennon et al. 2002) although it has not been investigated.
Potential for Salvaging Dead Yellow-CedarThe desirable wood characteristics and high contemporary export values for yellow-cedar put pressure on this species for timber production. The large acreage of yellow-cedar decline creates the possibility for shifting some timber production from healthy yellow-cedar forests to decline-affected forests. To determine the salvage potential of yellow-cedar snags, we needed to compare the characteristics of wood from dead trees to that from live trees. Thus, several years ago, a series of studies was initiated to evaluate the value and traits of wood from dead yellow-cedar. Each study used the same five-class snag deterioration system (fig. 59) that we developed to track population dynamics and time since tree death (Hennon et al.
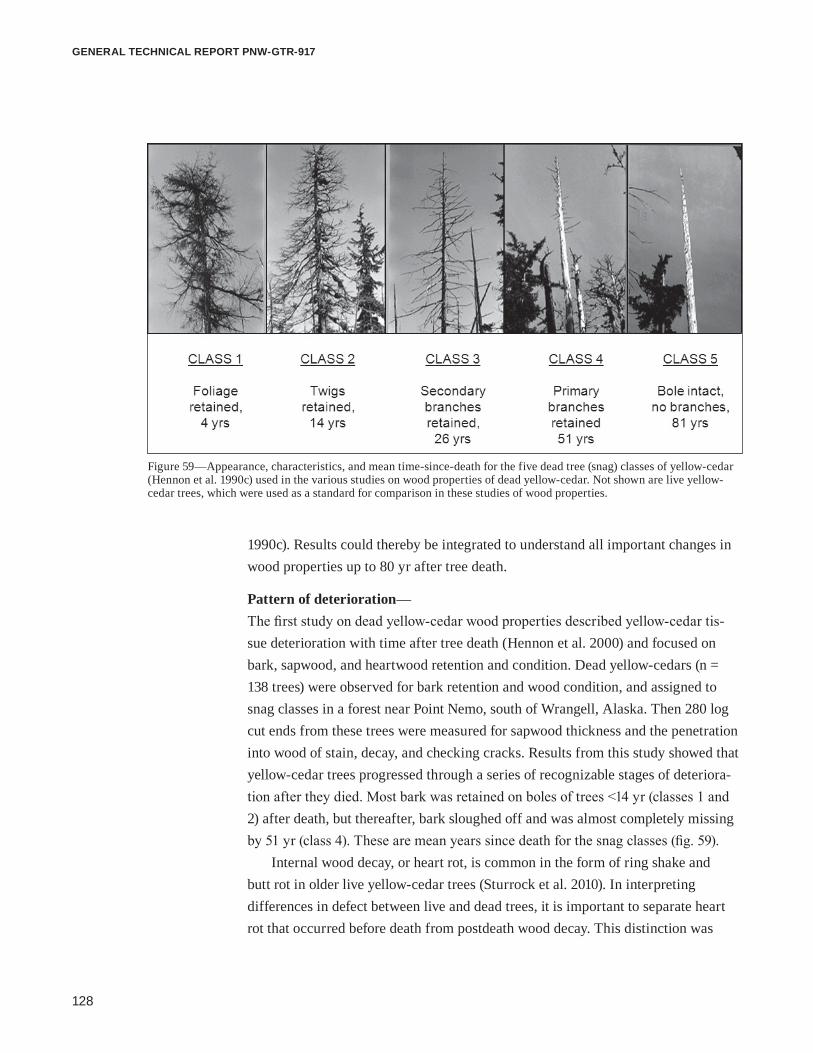
128
GENERAL TECHNICAL REPORT PNW-GTR-917
Figure 59—Appearance, characteristics, and mean time-since-death for the five dead tree (snag) classes of yellow-cedar (Hennon et al. 1990c) used in the various studies on wood properties of dead yellow-cedar. Not shown are live yellow-cedar trees, which were used as a standard for comparison in these studies of wood properties.
1990c). Results could thereby be integrated to understand all important changes in wood properties up to 80 yr after tree death.
Pattern of deterioration— The first study on dead yellow-cedar wood properties described yellow-cedar tis-sue deterioration with time after tree death (Hennon et al. 2000) and focused on bark, sapwood, and heartwood retention and condition. Dead yellow-cedars (n = 138 trees) were observed for bark retention and wood condition, and assigned to snag classes in a forest near Point Nemo, south of Wrangell, Alaska. Then 280 log cut ends from these trees were measured for sapwood thickness and the penetration into wood of stain, decay, and checking cracks. Results from this study showed that yellow-cedar trees progressed through a series of recognizable stages of deteriora-tion after they died. Most bark was retained on boles of trees <14 yr (classes 1 and 2) after death, but thereafter, bark sloughed off and was almost completely missing by 51 yr (class 4). These are mean years since death for the snag classes (fig. 59).
Internal wood decay, or heart rot, is common in the form of ring shake and butt rot in older live yellow-cedar trees (Sturrock et al. 2010). In interpreting differences in defect between live and dead trees, it is important to separate heart rot that occurred before death from postdeath wood decay. This distinction was
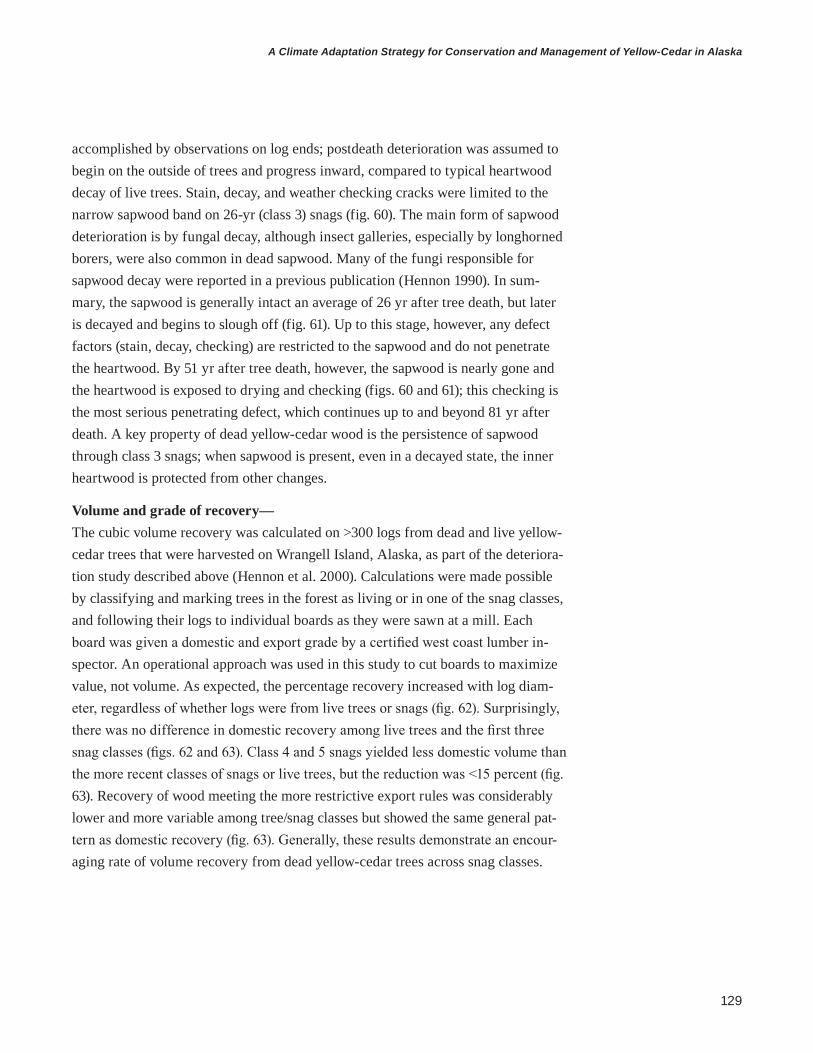
129
A Climate Adaptation Strategy for Conservation and Management of Yellow-Cedar in Alaska
accomplished by observations on log ends; postdeath deterioration was assumed to begin on the outside of trees and progress inward, compared to typical heartwood decay of live trees. Stain, decay, and weather checking cracks were limited to the narrow sapwood band on 26-yr (class 3) snags (fig. 60). The main form of sapwood deterioration is by fungal decay, although insect galleries, especially by longhorned borers, were also common in dead sapwood. Many of the fungi responsible for sapwood decay were reported in a previous publication (Hennon 1990). In sum-mary, the sapwood is generally intact an average of 26 yr after tree death, but later is decayed and begins to slough off (fig. 61). Up to this stage, however, any defect factors (stain, decay, checking) are restricted to the sapwood and do not penetrate the heartwood. By 51 yr after tree death, however, the sapwood is nearly gone and the heartwood is exposed to drying and checking (figs. 60 and 61); this checking is the most serious penetrating defect, which continues up to and beyond 81 yr after death. A key property of dead yellow-cedar wood is the persistence of sapwood through class 3 snags; when sapwood is present, even in a decayed state, the inner heartwood is protected from other changes.
Volume and grade of recovery— The cubic volume recovery was calculated on >300 logs from dead and live yellow-cedar trees that were harvested on Wrangell Island, Alaska, as part of the deteriora-tion study described above (Hennon et al. 2000). Calculations were made possible by classifying and marking trees in the forest as living or in one of the snag classes, and following their logs to individual boards as they were sawn at a mill. Each board was given a domestic and export grade by a certified west coast lumber in-spector. An operational approach was used in this study to cut boards to maximize value, not volume. As expected, the percentage recovery increased with log diam-eter, regardless of whether logs were from live trees or snags (fig. 62). Surprisingly, there was no difference in domestic recovery among live trees and the first three snag classes (figs. 62 and 63). Class 4 and 5 snags yielded less domestic volume than the more recent classes of snags or live trees, but the reduction was <15 percent (fig. 63). Recovery of wood meeting the more restrictive export rules was considerably lower and more variable among tree/snag classes but showed the same general pat-tern as domestic recovery (fig. 63). Generally, these results demonstrate an encour-aging rate of volume recovery from dead yellow-cedar trees across snag classes.

130
GENERAL TECHNICAL REPORT PNW-GTR-917
Figure 60—(A) Mean sapwood thickness for logs that came from live trees and for the five classes of dead yellow-cedars. Error bars are one standard error. (B) Mean sapwood thickness and mean radial penetration of stain, decay, and checking cracks. Note that the sharp reduction in sapwood thickness from snag classes 3 and 4 marks an associated deeper penetration of stain, decay, and checking (Hennon et al. 2000).
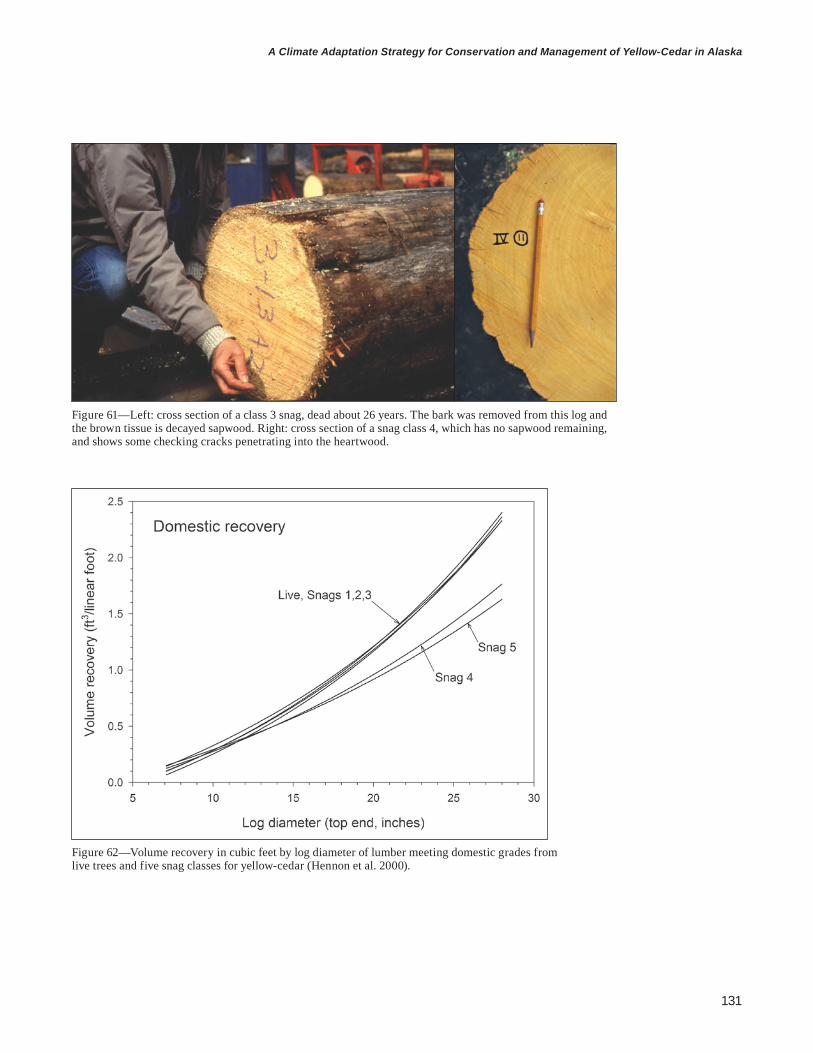
131
A Climate Adaptation Strategy for Conservation and Management of Yellow-Cedar in Alaska
Figure 61—Left: cross section of a class 3 snag, dead about 26 years. The bark was removed from this log and the brown tissue is decayed sapwood. Right: cross section of a snag class 4, which has no sapwood remaining, and shows some checking cracks penetrating into the heartwood.
Figure 62—Volume recovery in cubic feet by log diameter of lumber meeting domestic grades from live trees and five snag classes for yellow-cedar (Hennon et al. 2000).

132
GENERAL TECHNICAL REPORT PNW-GTR-917
Figure 63—Recovery of lumber meeting domestic (A) and export (B) rules from live trees and five snag classes for yellow-cedar (Hennon et al. 2000).
The lumber grade for recovered volume did not differ greatly among live trees and the snag classes, but there was a trend for more poor-grade volume from the older snag classes (fig. 64). There was little difference in the volume recovered in the three most valuable grades (clear, select, and No. 1 structural) from live trees and the first four snag classes. Logs of class 5 snags differed from the other classes by having no recoverable clear grade and a higher percentage recovery of the lower grades.

133
A Climate Adaptation Strategy for Conservation and Management of Yellow-Cedar in Alaska
Figure 64—Percentage of each grade that contributed to domestic recovery volume for live trees and five snag classes of yellow-cedar (Hennon et al. 2000).
Strength properties— Yellow-cedar is known for the strength of its wood (Forest Products Laboratory 1987). Wood strength properties were compared among live yellow-cedar trees and snag classes for trees >15-in diameter at breast height (d.b.h.) in the same stand near Wrangell, as mentioned earlier. Results were published in McDonald et al. (1997) and Green (2002), with the final, combined wood strength values reported in the latter

134
GENERAL TECHNICAL REPORT PNW-GTR-917
publication. One 4-ft-long bolt was removed from the top of the first 11-ft merchant-able log from each tree in the study and shipped to the U.S. Forest Service’s Forest Products Laboratory in Madison, Wisconsin, for testing. Mechanical tests were made on wood sawn into 1 × 1 × 16 in pieces.
There were no significant differences in specific gravity, bending strength (modulus of rupture), stiffness (modulus of elasticity), or hardiness between wood from live trees and any of the four snag classes tested (snag classes 2 through 5) (fig. 65). This was an unexpected result as it was assumed that one or more strength properties may be diminished in trees dead up to 80 yr. An additional goal of the study was to evaluate mechanical properties of wood from live yellow-cedar infected with black stain. Black stain is a fungal-caused stain of heartwood (thought to originate in the sapwood), common in yellow-cedar growing in Alaska and British Columbia (Holsten et al. 2009, Smith 1970). The identity of the fungus is
Figure 65—Mean values of four strength properties of wood from live trees and four snag classes of yellow-cedar from Green et al. (2002). Error bars are not given because these results combine both the first and second phases of wood tests. See Green et al. (2002) for details. The earliest (class 1) snag class was not evaluated in this study as it was assumed to have wood properties similar to live trees. None of the strength properties of wood from snags differed significantly from values from live trees, even for the class 5 snags, dead 81 years.

135
A Climate Adaptation Strategy for Conservation and Management of Yellow-Cedar in Alaska
unresolved. No differences were detected between stained and unstained wood in these tests. All results indicate that wood from dead yellow-cedar trees is suitable for engineering applications where the mechanical properties of yellow-cedar are necessary.
Durability (decay resistance) and termite resistance— Decay resistance of wood from dead trees was tested by two means: in vitro by colonizing pieces of wood with decay fungi growing in culture, and in situ by plac-ing pieces of wood in soil for periods of time before remeasuring them for weight loss. Standard decay fungi, rather than decay fungi specifically collected from yellow-cedar trees or forests, were used to assess wood decomposition rates. In the first study (DeGroot et al. 2000), two wood decay fungi (Postia placenta and Serpula himantioides) caused relatively rapid decay of small pieces of yellow-cedar wood from live trees and snag classes 3 and 5. There were no significant differences among wood from any of these tree classes, nor among wood that came from the inner or outer heartwood. When challenged against a third fungus (Gloeophyllum trabeum), however, wood from live and snag class 3 yellow-cedars had slow decay, while the wood from larger class 5 snags had fairly rapid decay. These results re-vealed that some fungal species can overcome the defensive compounds in yellow-cedar heartwood from both live trees and recent snags, at least in culture, and that wood from class 5 snags is not as decay resistant when colonized by certain fungi.
In a companion study, the deterioration rate of heartwood from live and dead yellow-cedar trees was evaluated by exposing ministakes (¾ × ¾ × 7 in) in soils at field sites in Wrangell and Mississippi for 2 and 4 yr (Hennon et al. 2007). The Mississippi site represents severe climate conditions to test the durability of wood in service. Regardless of the source of wood, vastly different deterioration was found between the two field sites, with considerably more rapid wood decay in Mississippi (fig. 66). The Mississippi site had a warmer, longer growing season and termites were present. Within each of the locations, wood from live yellow-cedar trees and class 3 snags had similar decay rates (fig. 66). Note that wood from snag classes 1 and 2 was used as samples in this study. Wood from class 5 snags decayed faster, but not as rapidly as heartwood of hard southern yellow pine (slash, longleaf, or loblolly pine), which served as the control. Based on the study results, a recom-mendation was made to use chemically treated wood in applications where yellow-cedar is in contact with soil. Wood used aboveground from the early snag classes (through class 3, dead about 26 yr) is expected to perform similarly to wood from live yellow-cedar trees.

136
GENERAL TECHNICAL REPORT PNW-GTR-917
Figure 66—Median deterioration (dry weight loss) of yellow-cedar wood from live trees, class 3 snags, and class 5 snags after 4 years in soil at two field sites. Southern yellow pines were used as a control by the Forest Products Laboratory in all tests (Hennon et al. 2007).

137
A Climate Adaptation Strategy for Conservation and Management of Yellow-Cedar in Alaska
A study on termite feeding on yellow-cedar wood (Morales-Romas et al. 2003) is the only project discussed here that did not include wood from yellow-cedar snags. Instead, this study evaluated feeding by the Formosan subterranean termite on yellow-cedar sapwood and heartwood that was black stained or unstained. Black stain, caused by one or more fungi, is commonly observed in the heartwood of live yellow-cedar wood in British Columbia (Smith 1970) and Alaska (Holsten et al. 2009). Stained wood is considered a commercial value defect because of appearance but does not affect wood strength. When termites were placed with different types of yellow-cedar wood, their survival and feeding was highest in sapwood, followed by black-stained heartwood, and then unstained heartwood. This pattern of survival and consumption by termites was consistent with moderate concentrations of defensive compounds in stained heartwood and high concentrations in unstained heartwood. The authors concluded that black stain reduces resistance of yellow-cedar heartwood to termites, but not to the extent of sapwood or other susceptible woods.
Heartwood chemistry— The most recent study to date on the properties of wood from yellow-cedar snags evaluated changes in heartwood chemistry following tree death (Kelsey et al. 2005). Tree cores were extracted from live yellow-cedar trees and the five snag classes at four locations throughout southeast Alaska. Gas chromatography was used to mea-sure the concentration of 16 extractable compounds, some of which are known to be biologically active against insects, fungi, and other organisms. Heartwood chem-istry was similar among live trees and the first two snag classes, but began to be altered at class 3. Concentration reductions continued for class 4 and class 5 snags. Total extractives and compounds with known biological activity that give decay resistance, such as nootkatin, nookatone, carvacrol, nootkatene, and nootkatol, fol-lowed this trend. We noticed a qualitative difference in wood from snag classes 4 and 5 in this and other studies. Internal wood from these older snags lost both the pale yellow color (becoming tan in color) and the strong aroma found in live trees and earlier snag classes; these changes are consistent with the measured decrease in biologically active compounds.
Mechanisms that may contribute to these chemical changes in aging snags are volatilization to the atmosphere, leaching, and structural changes from dehydra-tion or oxidation, and possibly polymerization. The loss of protection from bark in class 1 and 2 snags, and then sapwood in class 3 and 4 snags, probably allows these mechanisms to proceed.

138
GENERAL TECHNICAL REPORT PNW-GTR-917
Summary of results on wood properties from dead trees— Using the same snag classification system in the various studies on wood properties (i.e., mill recovery, strength properties, heartwood chemistry, and decay resistance) from dead yellow-cedar trees allowed for all results to be summarized and integrated here (table 19). None of the properties tested in these various studies indicates any differences in the heartwood from live trees and from snag classes 1 or 2. The first detection of any substantial change in wood properties occurred in heartwood chem-istry of class 3 snags, about 26 yr after tree death (Kelsey et al. 2005). This change corresponded with decaying sapwood beginning to slough off, exposing heartwood to external environmental factors that expedite physical and chemical change (Hennon et al. 2000). Even with the sapwood decaying in class 3 snags, however, the mill re-covery by wood volume and grade was unchanged relative to wood from live trees. Additionally, class 3 snags still had high overall levels of defensive compounds (not significantly different between live trees and snag classes 1 and 2), but two important chemicals thought to confer much of the decay resistance (nootkatin and carvacrol) were found at lower concentrations at this stage (Kelsey et al. 2005).
This gradual reduction in chemical defense continued as snags aged, and it subsequently led to a decline in heartwood decay resistance. Nootkatin and carva-crol were reduced even further in class 4 and 5 snags, but some other heartwood constituents were still present (Kelsey et al. 2005). The greater wood deterioration rates of class 5 snags—but not class 3 snags—when challenged with decay fungi both experimentally (DeGroot et al. 2000) and occurring naturally (Hennon et al.
Table 19—Summary of changes in bark and wood retention, and wood properties in dead yellow-cedar trees as compared to live trees
Live tree Snag 1 Snag 2 Snag 3 Snag 4 Snag 5
Dead (mean years) 0 4 14 26 54 81Bark Intact Loosening Hanging, sloughing Mainly gone Gone Sapwood Intact Staining, intact Stained, intact Decayed, intact GoneHeartwood Intact Checking
Volume recovery IntactReduced about 15%
Reduced about 15%
Wood grades IntactModestly reduced Reduced
Heartwood compounds Intact
Modestly reduced Reduced
Further reduced
Decay resistance Intact Reduced ReducedStrength properties Intact

139
A Climate Adaptation Strategy for Conservation and Management of Yellow-Cedar in Alaska
2007) suggest that changes in chemistry precede changes in decay resistance. Full exposure of heartwood in class 4 and 5 snags is probably responsible for the slightly reduced volume and grade recovery once the protective sapwood is lost (Hennon et al. 2000). Strength properties (among which specific gravity, modulus of rupture, modulus of elasticity, and hardness were measured) are the wood properties slowest to change, with no measurable reduction in any strength property among the snag classes, even those dead some 80 yr (Green et al. 2002, McDonald et al. 1997). Apparently, the chemical compounds remaining in old snags are adequate to limit wood decay aboveground, and strength properties are preserved. Some 100 yr after tree death, enough localized wood decay occurs at the root collar of snags near the soil line that snags break at the ground level and fall. There, soil-inhabiting fungi decompose the wood, or, in extremely wet soils, logs may remain as sequestered carbon (Hennon et al. 2002).
The unique heartwood chemistry of yellow-cedar, and the slow manner in which it is altered after tree death, has profound ecological and economic implica-tions. Dead yellow-cedar trees across extensive areas of southeast Alaska remain standing as snags for up to a century, and because the heartwood remains strong, hard, and undecayed while standing, they probably offer little habitat for cavity nesting animals (Hennon et al. 2002). This limited deterioration and surprising per-sistence of wood properties also offer considerable opportunities to recover valuable wood products. Therefore, the forests affected by yellow-cedar decline represent an astonishingly valuable wood resource for salvage. Oakes et al. (2015) evaluated the social acceptability of salvaging dead yellow-cedar trees. Shifting a portion of timber logging to dead yellow-cedar forests could divert some harvest away from forests that contain healthy yellow-cedar on suitable habitat, as part of a strategy to conserve and manage yellow-cedar.
Sizes of dead yellow-cedar trees— Another question about salvage recovery of dead yellow-cedar is whether enough dead trees are large enough to make a salvage harvest commercially viable. Dying yellow-cedar stands generally occur along the wetter (peatland bog) portions of the drainage-productivity gradient (D’Amore and Hennon 2006; Hennon et al. 1990b, 2010). The volume of dead yellow-cedar and the diameter classes of individual dead yellow-cedar trees are expected to vary depending on where they fall along this gradient, with greater volume and larger trees on better drained and more produc-tive sites. This variation can be seen in the field or on aerial photographs, or de-tected with other forms of remote sensing. By using aerial photographs, zones of yellow-cedar mortality were classified as bog, scrub, and productive dead in two watersheds in Peril Strait north of Sitka (D’Amore and Hennon 2006). As expected,

140
GENERAL TECHNICAL REPORT PNW-GTR-917
yellow-cedar snags tended to be smallest in the bog zones, of intermediate size in the scrub zones, and largest in the productive dead zones (fig. 67). The productive dead zone at Poison Cove is a good example of a decline-affected forest with large snags of commercial size (i.e., >20 in d.b.h.) (fig. 67). The large snags (fig. 68) most often can be found in the better drained, more productive portions of decline-affect-ed forests, which often occur in bands at slope breaks or along the edges of decline patches.
Figure 67—Concentration of dead yellow-cedar trees in 5-inch diam-eter classes from three productivity zones at the Poison Cove watershed. Note the occurrence and higher concentration of larger snags in the productive zone.

141
A Climate Adaptation Strategy for Conservation and Management of Yellow-Cedar in Alaska
Figure 68—Large dead yellow-cedar tree of commercial size.
Economics of salvage— The feasibility of salvaging dead yellow-cedar will be based in part on economics. Operating in remote, roadless areas may involve the high costs of helicopter yard-ing and barges to transport logs. The most economically feasible opportunities for salvage will include road access through or near dead yellow-cedar forests, high concentrations of snags of commercial size and fairly recent mortality in which wood values are nearly fully retained (i.e., snag classes 1, 2, and 3), gentle slopes for use of ground-based yarding equipment, and access to nearby mills. An ongoing study by the University of Alaska Southeast is evaluating the factors that influence the economic feasibility of salvaging dead yellow-cedar.

142
GENERAL TECHNICAL REPORT PNW-GTR-917
Biogeochemical Implications for the Dead and Dying Yellow-Cedar Component of ForestsThe death of numerous yellow-cedar trees may alter the concentration of nutrients in local soils, streams, and vegetation. As described in section 1, yellow-cedar accumulates calcium in its foliage in large concentrations compared to other conifers (D’Amore et al. 2009). Litterfall derived from the senescence of older foliage from healthy yellow-cedar forests (fig. 69) provides a persistent addition of calcium and other nutrients from litter to the forest floor and O horizons of soils. However, the impact of large amounts of calcium-rich foliage falling on the forest floor under a declining tree is unclear. Both the pulse of normal seasonal litterfall and the episodic, large increase in foliar litter to the forest floor when yellow-cedars die are expected to affect nutrient cycling in these forested stands. There are two main areas of biogeochemical interaction with large-scale yellow-cedar death: the successional trajectory of remaining plants in the stand, and the export of nutrients from declining yellow-cedar watersheds in groundwater and surface water.
Preliminary evidence suggests that yellow-cedar stands alter the nutrient concentration and availability of both nitrogen and phosphorus in the O horizon
Figure 69—Yellow-cedar foliar litter on the forest floor under a healthy yellow-cedar tree in a mixed-species stand at Poison Cove, Chichagof Island, Alaska.

143
A Climate Adaptation Strategy for Conservation and Management of Yellow-Cedar in Alaska
of soils compared to stands dominated by spruce and hemlock.7 Initial results of a study evaluating the response of understory plants and trees after the recent loss of yellow-cedar show that calcium is redistributed to the remaining plants (Radis 2014). Nutrients are tightly cycled in Alaskan coastal forests throughout the yellow-cedar range. Therefore, the liberation of nutrients and availability of light due to reduced canopy cover from dead yellow-cedars could provide a substantial nutrient subsidy and basis for shifts in forest productivity, and changes in species composi-tion from yellow-cedar to other trees, shrubs, and forbs. The key tree species that would benefit from the addition of both calcium and other nutrients is western redcedar (D’Amore et al. 2009).
Forested watersheds in Alaskan coastal forests are not efficient in the recov-ery of all mineralized nutrients; inorganic nitrogen and phosphorus are lost from the system along with large quantities of organic nitrogen (Fellman et al. 2009). Therefore, it seems consistent that the alteration of the nutrient dynamics due to the mortality of yellow-cedar will also have a substantial impact on watershed nutrient dynamics. Nutrient budgets based on water yields in watersheds with live or declin-ing yellow-cedar forests have not been undertaken, but it is likely that the nitrogen liberated from the foliage or available due to reduced uptake by yellow-cedar in affected forests will not be completely captured by succession to other species. An increase in the mobile nitrate compound would result in an increase in nitrogen to freshwater and marine systems in yellow-cedar watersheds.
Changes in Lands Under Protection Status Whatever management regime is undertaken in the maladapted zone where yellow-cedar decline occurs, it is important to recognize the impacts to yellow-cedar populations and the ineffectiveness of restoring yellow-cedar on sites where it is dead, dying, or likely to die. Protected areas are often established to maintain biodiversity, sensitive species, and wildlife habitat. Traditionally, protection through land designation was done based on the premise that forest ecosystems are some-what static or that they may be large enough to absorb disturbance events (Millar et al. 2007). The U.S. Forest Service developed an integrated old-growth conservation strategy of large, medium, and small reserves to protect and maintain old-growth habitat in southeast Alaska; the goal is to maintain the mix of habitats at different spatial scales capable of supporting the full range of naturally occurring flora, fauna, and ecological processes (USDA FS 2008a). Because of the intensive losses
7 Manuscript in preparation; data on file with D. D’Amore, USDA Forest Service, Forestry Sciences Laboratory, 11175 Auke Lake Way, Juneau, AK 99801.

144
GENERAL TECHNICAL REPORT PNW-GTR-917
of mature yellow-cedar trees in protected landscapes (see appendix 1), yellow-cedar decline serves as an example of the need to incorporate shifting climate into con-servation planning (Oakes et al. 2015). West Chichagof–Yakobi and South Baranof Wilderness Areas are two such large protected areas undergoing dramatic reduc-tions in yellow-cedar from extensive yellow-cedar decline. These areas are north of the distribution of western redcedar. Here, plant succession will continue to play out, probably without management intervention, and the forests will become more dominated by hemlock. On actively managed landscapes with yellow-cedar decline, there are probably better uses of resources than for attempted yellow-cedar restora-tion by planting and thinning the species where it is expected to die prematurely.
When there is sufficient knowledge of a species’ responses to climate change, such as the case of yellow-cedar and its forest decline, climate and landscape models can be used to evaluate how well specific conservation areas may meet their goals in the future, and where widespread problems might develop to compromise those values. Similarly, a species’ response to a projected climate should be evalu-ated to determine areas of suitable versus unsuitable habitat before restoration practices are implemented. The next subsection offers information and management considerations on landscapes with suitable climate or soil conditions where yellow-cedar is more likely to survive and thrive.
Considerations for Conservation and Management on Suitable Habitat Section 2 of this report describes how yellow-cedar trees in many areas were once well-adapted to local climates, but became maladapted and died due to diminished snow and continued frequent cold events in late winter and spring. Reductions of yellow-cedar in the maladapted zone heighten the need for the conservation and active management of yellow-cedar in habitats that will continue to be favorable. Modeling snow accumulation into the future helps predict which areas of existing healthy yellow-cedar may be protected by snow (fig. 70), and which are expected to suffer elevated mortality. Current and short-term future suitable habitat in high-elevation forests and forests in the snowy region of Prince William Sound can help meet conservation goals for the species. See section 4 for the model results that describe future risk of forest decline to yellow-cedar forests throughout Alaska. Climate projections beyond the 100-yr span of those currently used are not available but are needed to plan conservation measures for long-lived tree species.
At a more local landscape scale, yellow-cedar is currently healthy on well-drained soils, where it mixes with other tree species, even in areas of little snow accumulation. These areas are often located directly adjacent to dead yellow-cedar

145
A Climate Adaptation Strategy for Conservation and Management of Yellow-Cedar in Alaska
forests on wet soils (e.g., see Hennon et al. 2012: fig. 6). It is on these productive sites with greater tree volume that yellow-cedar roots more deeply and reaches its greatest stature, but not its greatest competitive status. Western hemlock and Sitka spruce can outcompete yellow-cedar through greater rates of reproduction and faster growth to limit yellow-cedar to a smaller component in these forests (Harris 1990). However, active forest management through silviculture can alter this imbalance of regeneration and competition to favor yellow-cedar. These productive sites have received most of the timber harvesting in the region; therefore, this is the primary active-management space that is available to achieve conserva-tion goals for yellow-cedar. Favoring yellow-cedar over other tree species through planting and thinning will effectively expand yellow-cedar’s realized niche. More silvicultural information is needed on the techniques of managing yellow-cedar in young-growth forests to ensure the long-term maintenance of the species. These topics are expanded upon below.
Figure 70—Healthy yellow-cedar trees (appear as bright green) on a peatland and hillside in Dixon Bay, Glacier Bay National Park, Alaska.
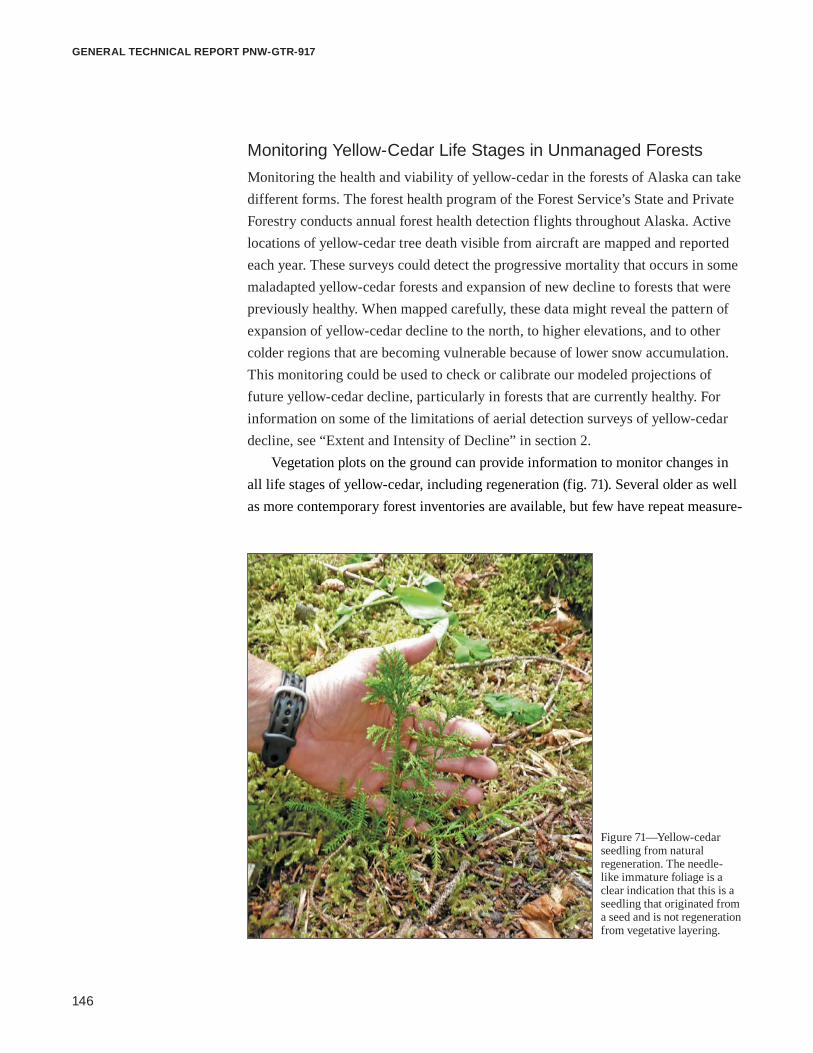
146
GENERAL TECHNICAL REPORT PNW-GTR-917
Monitoring Yellow-Cedar Life Stages in Unmanaged ForestsMonitoring the health and viability of yellow-cedar in the forests of Alaska can take different forms. The forest health program of the Forest Service’s State and Private Forestry conducts annual forest health detection flights throughout Alaska. Active locations of yellow-cedar tree death visible from aircraft are mapped and reported each year. These surveys could detect the progressive mortality that occurs in some maladapted yellow-cedar forests and expansion of new decline to forests that were previously healthy. When mapped carefully, these data might reveal the pattern of expansion of yellow-cedar decline to the north, to higher elevations, and to other colder regions that are becoming vulnerable because of lower snow accumulation. This monitoring could be used to check or calibrate our modeled projections of future yellow-cedar decline, particularly in forests that are currently healthy. For information on some of the limitations of aerial detection surveys of yellow-cedar decline, see “Extent and Intensity of Decline” in section 2.
Vegetation plots on the ground can provide information to monitor changes in all life stages of yellow-cedar, including regeneration (fig. 71). Several older as well as more contemporary forest inventories are available, but few have repeat measure-
Figure 71—Yellow-cedar seedling from natural regeneration. The needle-like immature foliage is a clear indication that this is a seedling that originated from a seed and is not regeneration from vegetative layering.

147
A Climate Adaptation Strategy for Conservation and Management of Yellow-Cedar in Alaska
ments to monitor change. A recent analysis of FIA plots offers an example. Barrett and Christensen (2011) report that yellow-cedar populations in coastal Alaska were stable regionally from the initial measurement sampling in 1995–2003 to the remeasured sampling in 2004–2008. In other words, mortality and harvest were offset by tree growth and in-growth, defined as the growth of smaller trees into larger size classes. These results suggest that this was a period of reduced mortality from yellow-cedar decline, or that gains by tree growth in some areas compensated for losses from decline in other areas. The annual forest health aerial surveys detect some active yellow-cedar decline each year, but we know that the large pulses of tree death are episodic, with mortality in the 1970s and 1980s marking the largest losses. Separating vegetation plot data from healthy and decline-affected forests would help to identify rates of regeneration, growth, and mortality in each health condition within the measurement cycle.
Vegetation plots can be used to assess natural yellow-cedar regeneration in unmanaged forests, a key gap in our understanding. Some older information is available from ecologists who worked to produce plant association guides for three subregions of the Tongass National Forest during the 1980s. These guides represent the southern portion (Ketchikan Area), middle portion (Stikine Area), and northern portion (Chatham Area) of the Alaska panhandle. They report plot information and observations on trees and regeneration from various plant communities, including one series in which yellow-cedar was the most abundant: the western hemlock-yel-low-cedar series, which in one case was called the western hemlock-Alaska-cedar series.
In the Ketchikan Area, second-growth sample plots on northern Prince of Wales Island showed very little yellow-cedar regeneration (DeMeo et al. 1992: 162). The authors state: “Yellowcedar occurred in only half of the sampled understories, and averaged 8 percent of the cover” (p. 165). Note that this is in the western hemlock-yellow-cedar/blueberry/skunk cabbage series, where yellow-cedar was present in all overstory plots. They continue: “Yellowcedar regeneration is very problematic. Advanced regeneration will usually be limited, because of the rela-tively small amount of yellow-cedar in the understory. Regeneration from seeding will be sporadic, due to competition from hemlock and irregularity from seed crops” (p. 168).
For the Stikine Area, Pawuk and Kissinger (1989) reported that young second-growth stands were mostly western hemlock with lesser amounts of Sitka spruce. Yellow-cedar regeneration was uncommon in the western hemlock-Alaska-cedar series. They suggest that plantings will normally be required to establish yellow-cedar as a significant component of second-growth stands.
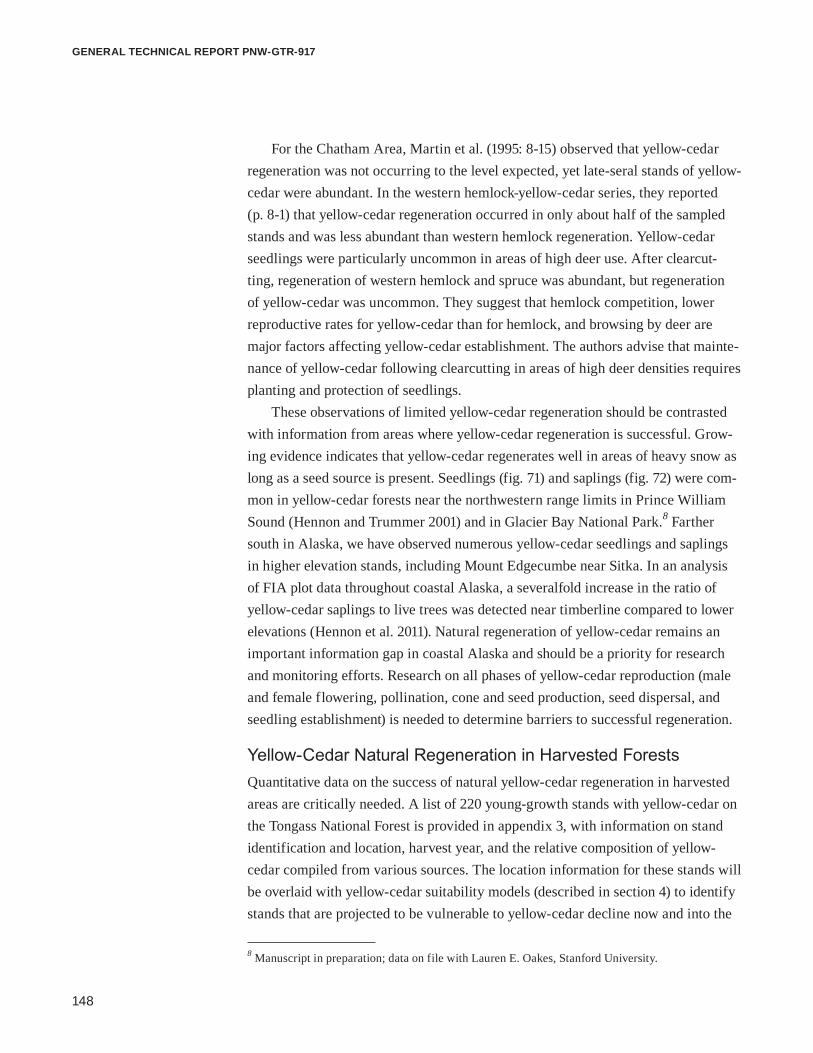
148
GENERAL TECHNICAL REPORT PNW-GTR-917
For the Chatham Area, Martin et al. (1995: 8-15) observed that yellow-cedar regeneration was not occurring to the level expected, yet late-seral stands of yellow-cedar were abundant. In the western hemlock-yellow-cedar series, they reported (p. 8-1) that yellow-cedar regeneration occurred in only about half of the sampled stands and was less abundant than western hemlock regeneration. Yellow-cedar seedlings were particularly uncommon in areas of high deer use. After clearcut-ting, regeneration of western hemlock and spruce was abundant, but regeneration of yellow-cedar was uncommon. They suggest that hemlock competition, lower reproductive rates for yellow-cedar than for hemlock, and browsing by deer are major factors affecting yellow-cedar establishment. The authors advise that mainte-nance of yellow-cedar following clearcutting in areas of high deer densities requires planting and protection of seedlings.
These observations of limited yellow-cedar regeneration should be contrasted with information from areas where yellow-cedar regeneration is successful. Grow-ing evidence indicates that yellow-cedar regenerates well in areas of heavy snow as long as a seed source is present. Seedlings (fig. 71) and saplings (fig. 72) were com-mon in yellow-cedar forests near the northwestern range limits in Prince William Sound (Hennon and Trummer 2001) and in Glacier Bay National Park.8 Farther south in Alaska, we have observed numerous yellow-cedar seedlings and saplings in higher elevation stands, including Mount Edgecumbe near Sitka. In an analysis of FIA plot data throughout coastal Alaska, a severalfold increase in the ratio of yellow-cedar saplings to live trees was detected near timberline compared to lower elevations (Hennon et al. 2011). Natural regeneration of yellow-cedar remains an important information gap in coastal Alaska and should be a priority for research and monitoring efforts. Research on all phases of yellow-cedar reproduction (male and female flowering, pollination, cone and seed production, seed dispersal, and seedling establishment) is needed to determine barriers to successful regeneration.
Yellow-Cedar Natural Regeneration in Harvested ForestsQuantitative data on the success of natural yellow-cedar regeneration in harvested areas are critically needed. A list of 220 young-growth stands with yellow-cedar on the Tongass National Forest is provided in appendix 3, with information on stand identification and location, harvest year, and the relative composition of yellow-cedar compiled from various sources. The location information for these stands will be overlaid with yellow-cedar suitability models (described in section 4) to identify stands that are projected to be vulnerable to yellow-cedar decline now and into the
8 Manuscript in preparation; data on file with Lauren E. Oakes, Stanford University.

149
A Climate Adaptation Strategy for Conservation and Management of Yellow-Cedar in Alaska
Figure 72—Yellow-cedar sapling.La
uren
Oak
es
future. At this time, yellow-cedar decline symptoms have been documented only in two adjacent young-growth stands on Zarembo Island, where the models accurately projected moderate-to-high risk of decline due to low snow and wet, shallow soils.
Irrespective of yellow-cedar decline, observations suggest that the return of the yellow-cedar component in harvested forests through natural regeneration is successful in some areas (fig. 73) and not in others. This topic was discussed in a regional meeting of ecologists, silviculturists, and others >20 yr ago (Hennon 1992a). There are many recent accounts of successful regeneration by yellow-cedar following timber harvesting in southeast Alaska (see section 1). The relationship between the yellow-cedar component before and after harvest has not yet been analyzed, but it could be quantified by contrasting stand examination plot data (i.e., preharvest) with stocking survey plot data on seedlings and saplings collected after harvest. These paired survey datasets from the same forest stands are not widely available, however. The natural regeneration of yellow-cedar in harvested areas could be monitored over a geographic and elevational range in southeast Alaska in an attempt to determine the factors that allow or limit successful seedling and sapling establishment after harvest. It is also possible that there is a temporal component to successful yellow-cedar regeneration. Results might reveal periods

150
GENERAL TECHNICAL REPORT PNW-GTR-917
Figure 73—Yellow-cedar that naturally regenerated in a harvest unit.
of heavy yellow-cedar cone crops, favorable environmental factors, or reduced deer populations that allowed for greater seed production or seedling establishment.
Success of Yellow-Cedar Planting in Harvested ForestsPlanting trials of yellow-cedar conducted from 1986 (fig. 74) to the present in Alaska are described in section 1. The success or failure of yellow-cedar establish-ment in these trials highlights the importance of deer browse. Methods to reduce deer browse of yellow-cedar seedlings are an urgent need. Some form of protection is needed in areas where deer populations aggregate in the fall through spring although protection may not be needed at high elevations because deer are uncom-mon during those times or seedlings are protected by snow.
Applied GeneticsThe current knowledge of yellow-cedar genetics was summarized in section 1. Here, we turn to applications of this knowledge to the conservation and manage-ment of yellow-cedar.

151
A Climate Adaptation Strategy for Conservation and Management of Yellow-Cedar in Alaska
Figure 74—Yellow-cedar trees in a harvest unit near Anita Bay, Etolin Island, Alaska, 8 years after planting in 1986.
Current and future seed inventory in Alaska— Seeds collected for artificial reforestation of native tree species in the Alaska Region are processed and stored in Petersburg, Alaska. As of 2014, 50 seedlots for all species (individual seed collections from one area) were stored at the Petersburg seed-processing facility. Fifteen of these seedlots are yellow-cedar collected from the Tongass National Forest (table 20). Each is a bulk reforestation lot collected from multiple trees. Geneticists recommend routinely testing these for seed viabil-ity. There are no seedlots in the regional seed inventory from yellow-cedar popu-lations in Prince William Sound (Chugach National Forest), Icy Bay, Glacier Bay, the northeastern portion of the panhandle (i.e., islands and mainland Juneau and Admiralty Island), or mainland areas farther south of the panhandle.
In the Alaska Region, the collection and transfer of seed is currently managed under “Provisional Tree Seed Zones and Transfer Guidelines for Alaska” (Alden 1991). Seed collection zones in the absence of genetic data for adaptive traits were inferred based on geographic barriers to historical migration (e.g., mountain ranges, channels, and straits), and differences in minimum annual temperature across geo-

152
GENERAL TECHNICAL REPORT PNW-GTR-917
Table 20—Year of collection and site information for 15 yellow-cedar seedlots maintained at the U.S. Forest Service seed-processing facility in Petersburg, AK
Lot. no. Seed zone Year collected Latitude (°N)/Longitude (°W) Seed source Ranger district
156 10 1993 57°37'00"/-136°10'00" Comp 243 Sitka179 6 1993 56°44'00"/-132°51'00" Twin Creek Petersburg189 5 1995 56°19'00"/-132°17'00" Wrangell Island Wrangell201 10 1995 57°59'00"/-135°00'00" Iyoutug Creek Hoonah204 10 1996 57°58'00"/-135°00'00" Iyoutug Hoonah208 10 1996 57°57'00"/-135°28'00" Game Creek Hoonah213 10 1996 57°33'00"/-135°03'00" Sitkoh River Valley Sitka217 9 1998 57°57'00"/-135°14'00" Appleton Cove Sitka218 4 1998 55°48'30"/-132°34'00" Little Ratz Thorne Bay229 4 2000 55°37'29"/-132°53'00" Steelhead Drainage Thorne Bay237 4 2002 55°48'40"/-132°34'23" Sal Creek Thorne Bay238 4 2012 55°36'21"/-132°53'02" Steelhead Thorne Bay239 4 2012 55°25'16"/-132°44'14" Indian Creek Road Craig240 4 2012 55°25'09"/-132°44'46" Indian Creek Road Craig241 4 2012 55°52'58"/-132°40'42" Ratz, 3026 Road Thorne Bay
graphic subdivisions. The purpose of zoning is to maintain the genetic integrity of indigenous forest species, conserve genetic diversity, minimize maladaptation, and ensure long-term survival and vigor of forests artificially regenerated with native tree species. Alden (1991) mapped 486 provisional tree seed zones for Alaska and the western portion of Canada’s Yukon Territory. In south coastal and southeast Alaska (yellow-cedar range), there are 57 mapped seed zones. The Alaska Region’s yellow-cedar seed inventory (table 20) originates from only five of these seed zones (fig. 75).
The preliminary results on the broad-scale genetic structure of yellow-cedar given in section 1 suggest remarkably mixed genetics, high gene flow, and little genetic differentiation for the species throughout Alaska. These findings have implications for both the genetic conservation of yellow-cedar, and the use of seed collection zones and seed transfer guidelines. There are no known rare or unique genetic populations that need to be preserved by seed collection, tissue preserva-tion, or tree culturing as a form of genetic ex situ conservation, even in the areas mentioned above from which seed has not been collected. This broad genetic mix-ing of yellow-cedar suggests seedlots can be moved to geographic areas that extend beyond their collection source and the provisional seed zones shown in figure 75. In British Columbia, where more information on yellow-cedar genomics and provenance trials is available, seed transfer is based on broader geographic areas compared to Alaska’s narrowly defined seed collection zones. British Columbia
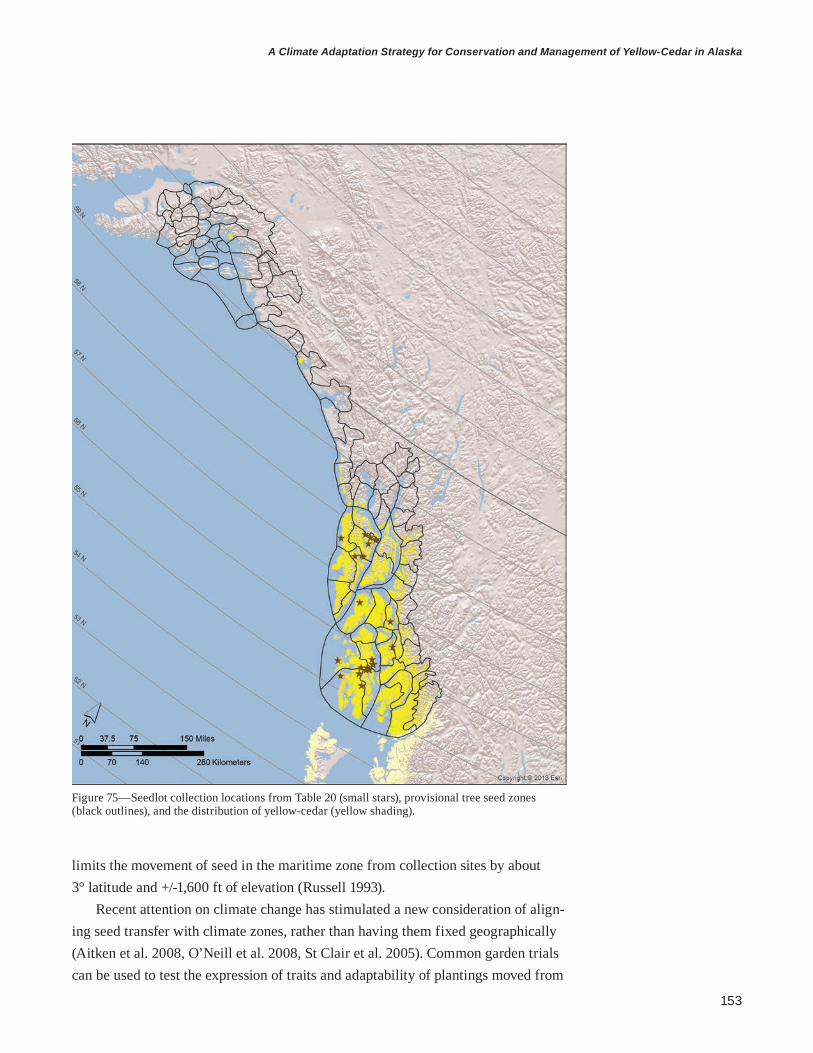
153
A Climate Adaptation Strategy for Conservation and Management of Yellow-Cedar in Alaska
limits the movement of seed in the maritime zone from collection sites by about 3° latitude and +/-1,600 ft of elevation (Russell 1993).
Recent attention on climate change has stimulated a new consideration of align-ing seed transfer with climate zones, rather than having them fixed geographically (Aitken et al. 2008, O’Neill et al. 2008, St Clair et al. 2005). Common garden trials can be used to test the expression of traits and adaptability of plantings moved from
Figure 75—Seedlot collection locations from Table 20 (small stars), provisional tree seed zones (black outlines), and the distribution of yellow-cedar (yellow shading).

154
GENERAL TECHNICAL REPORT PNW-GTR-917
their seed origins, both geographically and climatically. The most comprehensive common garden trial for yellow-cedar was conducted at five sites in British Colum-bia and tested seed from British Columbia, California and Oregon, and one location in Alaska on Mitkof Island (Russell and Krakowski 2012). The only regional differ-ences in the adaptability or survival of any seed sources tested were for those from California and Oregon, which yielded smaller seedlings with lower survival. With these exceptions, tree responses in these trials showed no relationship to geographic or climatic zone source. Including more seed sources from Alaska or conducting long-term common garden trials in Alaska could expand these findings to the northern portions of yellow-cedar’s range.
New research using chloroplast DNA from the existing yellow-cedar foliar collections may distinguish yellow-cedar populations in Alaska. As we learn more about the genetic structure of yellow-cedar in Alaska, it may become apparent that populations in the north and northwestern portions of its range have some unique qualities. If unique genetic structure becomes evident, then seeds or clonal material should be collected for genetic conservation and for testing of phenological traits through common garden trials. Geneticists recommend taking cuttings from wild forms and using them directly in clonal trials.
Based on current knowledge about yellow-cedar genetic variation, land manag-ers might consider revising current seed transfer guidelines and protocols to assure a high probability of adaptation within both the current climatic conditions and those predicted for the future. Given that yellow-cedar is showing high adaptability to a variety of environmental conditions, broad seed zones based on north/south latitudes and high/low elevation bands could be developed. In lieu of creating new seed zones, collection areas could be rotated to target new seed collection zones and broaden the genetic base. The following best management practices could be con-sidered in seed management to broaden the genetic diversity and limit the number of related individuals in a seed lot: (1) Each new seedlot should originate from ≥20 individual seed trees, (2) individual trees should be separated by 200 ft, (3) collect-ing seed from isolated individuals that may have less exposure to the pollen cloud should be avoided, (4) cones should not be collected from very low in the crown, and (5) operational reforestation efforts should consider outplanting more than one seedlot into a planting unit.
Long-term seed procurement plans for yellow-cedar could be developed for Alaska. In British Columbia, seed production areas are developed in zones that have a high demand for seed, are accessible, and have trees that typically produce abundant cones and seeds. Ideally a seed procurement plan would follow a revision of seed collection zones, but a plan could be developed with existing seed zones.

155
A Climate Adaptation Strategy for Conservation and Management of Yellow-Cedar in Alaska
Estimating existing and future seed needs requires careful planning to collect suf-ficient quantities of high-quality seed for future reforestation and restoration needs. A seed procurement plan could address the following: (1) the existing reforestation needs and anticipated needs from harvest levels; (2) projected restoration/reforesta-tion after large-scale disturbance (wind) or accelerated cedar decline from climate change, or a combination thereof; (3) whether there is a need to share seed among land management agencies in British Columbia and Alaska; (4) review of the existing seed inventory; (5) seed and cone periodicity; (6) seed yield data; (7) seed viability data; and (8) nursery sowing factors. The most recent seed stratification protocols should be considered.
Cloning and seed collection— An asexual or cloning form of reproduction called layering (fig. 76) has been ob-served throughout the natural range of yellow-cedar (Antos and Zobel 1986, Bérubé et al. 2003, Hennon et al. 1990b). Layering occurs by adventitious rooting of smaller lower limbs; the connecting stem can die, giving rise to adjacent yellow-cedar in-dividuals with identical genotypes. Patches of low-growing, stunted yellow-cedar that reproduce by layering are common in bog or peatland settings. Thompson et al. (2008) confirmed layering in yellow-cedar stands through molecular analysis.
Figure 76—Multiple stems of yellow-cedar from layering, or the rooting of lower branches, can create a clone of different trees that have identical genotypes.

156
GENERAL TECHNICAL REPORT PNW-GTR-917
They found that a combination of yellow-cedar sexual and asexual reproduction was occurring in nine forests in British Columbia. Individual stems (ramets of a clone) were often confined to a distance spanning 16 ft, but in one case they were separated by 43 ft. Similar sampling has been done in Alaska, but genetic testing has not yet been conducted to determine cloning extent or size in bog and upland settings. Clones should be considered and avoided when making seedlot collections of yellow-cedar. Adjacent trees could be genetically identical and the seeds they produce would be considered half-sibs (i.e., pollinated with one parent in common). Seed could possibly be full-sibs and selfs between the two ramets of the same clone. Collecting from cone trees that are ≥200 ft apart should minimize the possibility of two trees representing a clone. In British Columbia, collections are made from ≥20 trees to create an effective population size because of the possibility that trees might be related from pollen dispersal and historically related mothers.
Adaptation consequences of self-fertilization, cloning, and tree longevity— Aitken et al. (2008) suggest that there are three fates for tree species with regard to rapid climate change: they can migrate, adapt, or face extirpation. Adaptation is achieved through natural selection and differential selection pressures. High genetic diversity is maximized by outbreeding and recombination through sexual repro-duction. Species with short generation times and high fecundity can adapt quickly. Yellow-cedar does not have the capacity to adapt quickly because of its long-lived nature and current low reproductive capacity. Compounding this issue is yellow-cedar’s tendency to be self-fertile (pollen from a tree can fertilize female flowers in the same tree), and the habit of cloning through layers mentioned above. (Note that the inbreeding or self-fertilization in yellow-cedar is not found at unusually high levels compared to many other conifers.) All of these compounding factors may limit yellow-cedar’s ability to adapt to changing climate conditions. The rate of ad-aptation by yellow-cedar may not keep pace with future environmental change.
Despite yellow-cedar’s common habit of vegetative reproduction and self-fer-tilization, especially on some poorly drained site types, genetic work has detected a high degree of genetic variation within and between populations. Natural selection can act upon this potential variation in traits. The long lifespan of trees essentially increases the range of conditions they must be adapted to in order to survive and reproduce as climate changes.
Natural selection in decline-affected stands and genetic improvement—The intensive mortality of yellow-cedar in decline-affected forests may be producing a selective pressure that is altering the genetic character of these populations. In decline-affected forests, about 30 percent of yellow-cedar trees typically remain

157
A Climate Adaptation Strategy for Conservation and Management of Yellow-Cedar in Alaska
alive. Thus, there is differential survival among the trees that grew in these stands before the onset of the forest decline. Currently, it is unknown whether the surviv-ing yellow-cedars escape lethal injury by rooting on better, more protected micro-sites, or whether they might represent a superior genetic form. If the live yellow-cedar trees have greater cold hardiness or slower hardening and dehardening than their dead cohort, and if these traits could be shown to be heritable, then natural selection may shape the genetic structure of these stands. Selecting tissues or seed from these surviving trees might offer an opportunity for genetic improvement in yellow-cedar that could be used in forest regeneration on suitable habitat or even restoration on decline-affected sites. Although we said that restoration planting is not recommended in the maladapted zone, the enhancement of these adaptive traits could make restoration in these stands feasible. It would be desirable to collect seed or foliage material for cloning and begin to test for traits related to cold hardiness.
Thinning to Favor Yellow-Cedar in Managed ForestsThe silvicultural technique of thinning is used operationally to control the density and spacing of trees. It is also useful to adjust the mix of species, or composition, of tree species in managed forests. Thinning can be used to favor yellow-cedar where it successfully regenerates by natural regeneration or planting (fig. 77). Preference for yellow-cedar in thinning contracts has been a common practice on the Tongass National Forest for more than a decade. More information on thinning is presented under “Precommercial thinning” in section 1.
Thinning will be most successful on sites where yellow-cedar is expected to thrive (i.e., not wet soils with insufficient snow). Spacing in operational thinning treatments varies from about 12 ft between crop trees to as wide as 20 ft or more. Recently, yellow-cedar decline was observed in two adjacent 38- to 40-yr-old young-growth stands on Zarembo Island. A considerable component of yellow-cedar was retained through precommercial thinning. A site visit in 2013 detected signs and symptoms of yellow-cedar decline, low productivity (with understory plants and stunted trees indicating wet site conditions), and yellow-cedar snags in unmanaged forest areas adjacent to the cut unit. Yellow-cedar of similar age growing on deeper soils nearby was healthy. Rather than discouraging the practice of favoring yellow-cedar through thinning, this exemplifies the need to assess sites for yellow-cedar habitat suitability before treatment. It is important to recognize the site variation within past harvest units, and to bear in mind that the future health condition of yellow-cedar regeneration may differ on poorly drained and well-drained areas.
Evaluating the past or present health of mature yellow-cedar in surround-ing stands, along with information about snow and drainage, can help managers

158
GENERAL TECHNICAL REPORT PNW-GTR-917
Figure 77—Yellow-cedar selected as “crop trees” in a thinning implementation on the Ketchikan Ranger District.
determine where it is most appropriate to promote yellow-cedar through thinning. It would be desirable to track the survival and growth of yellow-cedar after thin-ning. Additionally, monitoring is needed to detect any new, unexpected situations of young-growth yellow-cedar such as browsing by moose (fig. 78).
Longer Term Young-Growth ManagementThere is relatively little information or experience with the silvics of yellow-cedar in maturing young-growth forests. Tree growth data for southeast Alaska and yield plot data typically do not include yellow-cedar. The board foot and cubic foot volumes estimated for yellow-cedar by DeMars (1996) were from old-growth unmanaged forests. Several known even-aged stands could be used to determine tree growth and form. One example is at Cannery Point near the town of Tenakee in a 100-yr-old even-aged, unmanaged, mixed yellow-cedar and western hemlock stand that regenerated after a fire. Another setting is near Sitka at the approximately 150-yr-old Verstovia forest, which regenerated after clearcutting by the Russians; yellow-cedar mixes with western hemlock in the higher elevation portions of that stand. The recent finding of yellow-cedar decline in a young-growth stand on Zarembo Island (Mulvey et al. 2013) suggests that young, managed yellow-cedar

159
A Climate Adaptation Strategy for Conservation and Management of Yellow-Cedar in Alaska
Figure 78—Browse by moose on the lower limbs of a yellow-cedar tree on Mitkof Island, Alaska, leaving the tree with a pruned appearance.
Ben
Cas
e
forests should be monitored for decline symptoms. Experts in British Columbia could be consulted about yellow-cedar silvics in maturing forests because of their longer-term experience with young-growth yellow-cedar in managed stands.
Special Case of Forest Management: Yellow-Cedar’s Role in the Transition to a Young-Growth Utilization ProgramThe Tongass National Forest has embarked on an effort to rely more on young-growth than old-growth forests for its future supply of timber. Currently, it is unclear how much yellow-cedar is represented in the young-growth forests that have regen-erated following clearcut harvests in southeast Alaska. The oldest young-growth forests and those on the most productive soils will produce the initial wave of timber production on the Tongass National Forest in this transition to young-growth. These older young-growth forests have minimal representation of yellow-cedar for perhaps three reasons. First, the early harvests on the Tongass National Forest targeted

160
GENERAL TECHNICAL REPORT PNW-GTR-917
higher volume western hemlock-Sitka spruce forests because, from the late 1950s through the 1990s, harvests were designed to produce a stream of wood volume to the two large pulp mills in Sitka and Ketchikan. Second, yellow-cedar was of considerably less value in this industrial era; only after about 1970 did it become valued as an export wood. Third, yellow-cedar tends to grow on sites of lower pro-ductivity, where the growth rates of all tree species would be expected to be slower. Several owners of small mills in southeast Alaska rely on high-value niche wood, including yellow-cedar (fig. 79). It is conceivable that the salvage recovery of dead yellow-cedar (see “Potential for Salvaging Dead Yellow-Cedar,” this section) may satisfy a part of that demand until young-growth yellow-cedar is available. Because yellow-cedar is more common in the younger managed forests occurring on lower productivity sites, the future supply of young-growth yellow-cedar may be many decades away. An evaluation of the amount of yellow-cedar by stand age-class and productivity class, coupled with a growth simulation model, is needed to predict the timing of the future supply of yellow-cedar in the young-growth forests of southeast Alaska.
Figure 79—Small dimensional pieces of yellow-cedar lumber for carving and other artisan purposes available commercially from a small mill in southeast Alaska. Small amounts of yellow-cedar lumber can be acquired by order, but are not always readily available to contractors or the public for construction projects.

161
A Climate Adaptation Strategy for Conservation and Management of Yellow-Cedar in Alaska
Dispersal of Yellow-Cedar to New Habitat Areas With Suitable ClimatesWhen climate favorable for yellow-cedar develops beyond its existing range, the species may be particularly slow to migrate because of its low reproductive capac-ity (Harris 1990). Assisted (or facilitated) migration is the deliberate movement by humans of genotypes and species into areas in which the projected climate is associ-ated with high probabilities of persistence over a long time period after establish-ment. These activities can be controversial because widespread movements of species can be interpreted as fostering the introduction of invasive species that could bring unanticipated consequences to existing ecosystems. Assisted migration may be required for species with narrow resource requirements or poor dispersal ability (Warren et al. 2001), such as yellow-cedar. As a test case, the Tongass National For-est conducted a trial planting of yellow-cedar in 2009 near Yakutat, Alaska (an area of discontinuous occurrence for yellow-cedar but still within its range limits) (Hen-non and Trummer 2001) to test the survival and growth of yellow-cedar where it did not previously grow. Survival to date has been >90 percent (fig. 80), which suggests that the targeted expansion of yellow-cedar is possible. Although it has not been attempted, yellow-cedar could be introduced by planting into new environments that would not be subject to future harvest, such as raised microsites in open-canopy peatland forests that are expected to have adequate snow into the future.
Figure 80—Yellow-cedar seedling planted near Yakutat, far from any known natural yellow-cedar populations.

162
GENERAL TECHNICAL REPORT PNW-GTR-917
163
A Climate Adaptation Strategy for Conservation and Management of Yellow-Cedar in Alaska
Introduction and Conceptual BasisThis section integrates the information presented in the first three sections with new risk models to create a vulnerability assessment and a conservation and management strategy for yellow-cedar in Alaska. The assessment and strategy draw on the ecological and silvicultural details of yellow-cedar presented in section 1, climate impacts that triggered the extensive tree mortality described in section 2, and considerations for the conservation and management of yellow-cedar relative to habitat suitability in section 3.
Climate change generates different zones of potential adaptability for tree species on the landscape that vary across climate gradients (or by latitude and elevation) and through time. “Zones of adaptability” for a tree species are locations with specific conditions that are suitable for that species’ growth, survival, and reproduction (fig. 81). Therefore, effective adaptive strategies are dynamic because the habitat suitability of species becomes a moving target. The vulnerability assessment and dynamic climate adaptation strategy presented here can be used in making decisions in land management planning. Considerations related to both conservation and active management are offered according to risk of decline and habitat suitability. For species that are particularly sensitive to climate factors, such as yellow-cedar, one must consider past, current, and future climate effects and their interactions with ecological traits and life stages. Understanding these interac-tions, along with knowledge of the other abiotic factors that interact with climate to initiate widespread mortality, is the cornerstone of the adaptive strategy for the conservation and management of yellow-cedar.
In the conceptual basis for yellow-cedar habitat suitability (fig. 81), we nested the drainage gradient within the broader climate zones. Snow is the overriding broad-scale climate factor that controls the health of yellow-cedar in Alaska, but soil drainage must also be considered because it creates finer-scale zones of suitable habitat in areas of inadequate snow. Yellow-cedar decline emerges in yellow-cedar forests with poorly drained soils where roots are shallow and snow levels are insuf-ficient to provide thermal protection during spring cold air events (shown in red in figure 81). Conversely, suitable yellow-cedar habitat exists where either soil drain-age or snow levels are adequate.
Section 4: Modeling Future Vulnerability of Yellow-Cedar Forests to Climate Change for Conservation and Management Planning

164
GENERAL TECHNICAL REPORT PNW-GTR-917
Figure 81—Conceptual diagram depicting how climate shifts can create three zones of adaptation by a tree species (maladapted, persistent, and migration), and how habitat suitability can be further modified with other niche factors including soils.
The viability of a species depends on its presence, abundance, health condition, and successful regeneration. There is a relationship between the localized popula-tion status of a species on protected landscapes versus on managed landscapes. For example, reductions of yellow-cedar in populations affected by forest decline in wilderness areas may influence how the species is harvested or promoted through silviculture on actively managed lands. Section 3 of this report provides the details on the health status and opportunities for active management on habitats for yellow-cedar that are suitable and vulnerable.
This yellow-cedar vulnerability assessment uses a model designed to predict and map the risk of yellow-cedar decline. The model outputs are used to evaluate yellow-cedar’s present occurrence and the location of yellow-cedar forests vulner-able to decline, for three time periods in the future. These can be compared to our map of preexisting yellow-cedar decline, which represents past mortality events. These series of maps cover the entire distribution of yellow-cedar in Alaska, and in appendix 1 are summarized and displayed for the 33 separate yellow-cedar manage-ment units.
Several terms used in this section are clarified here. Vulnerable refers to habi-tats where yellow-cedar has some risk of developing yellow-cedar decline. Suitable indicates habitats at low risk of developing yellow-cedar decline. When modeling yellow-cedar occurrence (i.e., not mortality), we also use suitable for areas where

165
A Climate Adaptation Strategy for Conservation and Management of Yellow-Cedar in Alaska
the niche factors are met for yellow-cedar, and the species may be present (occu-pied habitat) or absent. Bioclimatic envelopes model climate variables with spe-cies’ current distributions to predict shifts in potential distributions as the climate changes. Risk is the probability that yellow-cedar has developed or will develop decline, with our models producing three risk classes based on risk factors (snow and drainage). Productivity refers to the rate at which a site can produce vegetation biomass. Soil drainage is the ability of soil to move water and in coastal Alaska is the primary control on productivity. Drainage is both a niche factor that influences the presence and abundance of yellow-cedar, and a risk factor that predisposes yellow-cedar to decline. Snow is also a risk factor for yellow-cedar decline. Our risk models use annual snow accumulation (see next subsection), but future efforts could use seasonal snowpack (see appendix 2). Health status of yellow-cedar trees is the degree of mortality, and population stability refers to the overall fluctuation in abundance of yellow-cedar’s life stages including regeneration. For example, the overall population stability of yellow-cedar on protected landscapes (e.g., wilder-ness areas and national parks) may be steady or increasing due to a low mortality rate and vigorous natural regeneration, or may be impaired by either high rates of mortality (indicating poor health status) or low natural regeneration. The concept of forest decline and the term yellow-cedar decline are explained in section 2.
Modeling of Suitable and Vulnerable Areas for Yellow-Cedar Based On Risk of Decline Habitat suitability models for species in the context of climate often use one of two approaches: climate variables are simply correlated with a species’ distribu-tion (e.g., bioclimatic envelope models; Araújo and Peterson 2012), or mechanistic methods using specific climate variables known to act on the species’ responses of regeneration, growth, and mortality (Pearson and Dawson 2003). Both of these approaches rely on accurate information on the distribution of the principal species. Yellow-cedar’s incomplete occupancy of large areas of suitable habitat in Alaska, presumably because of slow migration, suggests that the first modeling method is problematic. The cause of yellow-cedar decline, as described in section 2, involves a number of interacting landscape, site, stand structure, and microclimate factors that operate on the unique vulnerability of yellow-cedar to root-freezing injury. Therefore, our mechanistic knowledge of yellow-cedar’s response to climate allows us to use known and specific risk factors to identify current and future suitable and vulnerable habitat in areas where yellow-cedar occurs.
Hydrologic changes, driven by climate change, are affecting terrestrial and aquatic ecosystems (Melillo et al. 2014). Many plants are shifting their distribution

166
GENERAL TECHNICAL REPORT PNW-GTR-917
due to altered soil moisture, both as precipitation and snow, caused by changes in climate. Land managers in federal and state agencies have placed a high priority on creating adaptation strategies to deal with climate change. Our models are intended to provide a tool for managers to evaluate the impact of present and future environ-mental conditions on forest resources consistent with implementation of the U.S. Forest Service’s forest planning rule (USDA FS 2015). Our approach can be con-sidered a climate vulnerability assessment (Tillman and Glick 2013) for a species, which determines risk factors, provides mitigation and adaptation options, and can be the scientific basis for a conservation and management strategy to be developed by land managers.
We use four variables to map and model yellow-cedar habitat vulnerability in Alaska: the current distribution of yellow-cedar, the extent of the forest decline to date, soil drainage, and snow. The first two factors describe where yellow-cedar currently grows (its distribution), and where it has already been affected by climate and undergone mortality (mapped forest decline areas). The second two factors, described in more detail in section 2, are the forest decline risk factors that help predict the location of yellow-cedar forests that are currently healthy but are at risk of decline due to predicted future climate change. Of the two leading decline risk factors, we assume that soil drainage is relatively stable through time and that the soil characteristics of yellow-cedar forests will not be altered enough to affect future species distribution within our modeling period to 2100. In contrast, winter snow is directly affected by climate and varies on a timescale of years, decades, and centuries. The development of each of these component models is described below in more detail.
Note that we have not attempted to predict new habitat that will be available to yellow-cedar through range extension as a response to a warming climate. A range extension would presumably involve a dispersal of yellow-cedar locally to higher elevations, through river and valley passes into adjacent interior British Columbia and Alaska, and northwesterly through Prince William Sound and into the Kenai Peninsula. Several basic physiological tolerances of yellow-cedar, such as seasonal precipitation (to avoid drought stress) and annual minimum temperature (to avoid outright freezing regardless of the presence of snow), would need to be contrasted with current and future climatic conditions in these areas. Yellow-cedar migration to new habitats is expected to be slow because of its low reproductive capacity. This topic is also discussed in the “Suitable Habitat” subsection of section 3. The approach we took in this section was to assess habitat suitability and vulnerability for yellow-cedar where it currently occurs in Alaska. A different modeling frame-work with a broader geographic area is needed to assess the emergence of new

167
A Climate Adaptation Strategy for Conservation and Management of Yellow-Cedar in Alaska
suitable habitat beyond yellow-cedar’s existing range. This would require modeling of climatic variables (beyond those considered in this report), edaphic factors, biotic interactions, seed dispersal distances, and other factors relevant to yellow-cedar dispersal, establishment, growth, and reproduction.
Yellow-Cedar DistributionThe yellow-cedar distribution map that we developed is a major revision of the geographic occurrence of yellow-cedar in Alaska and throughout its range since publication of the Atlas of United States Trees (Little 1971). The new rangewide yellow-cedar map and the components used to build it are described in detail in section 1. The Alaska portion is outlined briefly here as it is the basis for the assess-ment of yellow-cedar habitat suitability and risk of decline presented in this section. The rangewide distribution was developed at a resolution of 240 m, which is the common denominator for all input data sources. Yellow-cedar areas represented in Prince William Sound and Glacier Bay National Park were derived by using “sketched polygon” methods from boat and aerial surveys. The 240-m rasterized data layer was applied in the respective zones of Glacier Bay, and northwestward for the yellow-cedar suitability/vulnerability predictions. There were either few or no forest inventory plots in these areas to inform a distribution model such as Ellenwood’s for these areas. The Ellenwood model’s 30-m forest parameter data are present only in the southeast Alaska subregion. Therefore, this new data layer (see following) is represented in an aggregated companion dataset at 240 m in order to include the Pacific Coast and south-central Alaska subregions of the Alaskan coastal forest.
The Ellenwood 30-m-extent geographic information systems (GIS) layer for yellow-cedar represents the best available predictive source for areas in southeast Alaska south of Glacier Bay and the Haines area. This layer was produced for those pixels where the calculated probability was ≥50 percent; any single isolated pixels were removed and filled in. Those results were then buffered by two pixels and applied as representing yellow-cedar presence in the respective zones south of, but not including, Glacier Bay and Haines for the yellow-cedar suitability/vulnerability predictions.
The yellow-cedar “suitability” data were modeled at a 50-m resolution by using methods to nest and combine the 50-m hydrology model with the 200-m snow cover models. Here, the term “suitability” is used loosely as additional modeling inputs would be required to produce a robust “suitability” model and is beyond the scope of this work. The yellow-cedar presence data, existing at either 240-m or 30-m resolutions in the northern and southern zones of Alaska, respectively, were applied

168
GENERAL TECHNICAL REPORT PNW-GTR-917
as a yellow-cedar presence mask and used in the vulnerability rating and acreage values discussed in the following portions and appendix 1 of this document. The 240-m-pixel resolution has been used for visual display in the management zone maps in appendix 1.
A distinction should be made between all forests where yellow-cedar occurs (i.e., its full distribution) and areas where the yellow-cedar forest type (i.e., yellow-cedar-dominated cover type or forest type) occurs. The approach we chose for this report was closer to a full distribution representation than a yellow-cedar cover type. We chose to set a low threshold for including the yellow-cedar component of forests (see below) so that our report could help interpret long-term health status of yellow-cedar in Alaska, even in places where the species is not predominant.
A pixel modeled as yellow-cedar by Ellenwood was required to fall within the treed areas. A pixel can have a positive response for species presence even as a relatively small component of the forest. The presence/absence of total (all species) live tree basal area >1 in diameter at breast height (d.b.h.) was independently mod-eled from the predictor sample files by using See5, version 2.06. The model derived from See5 was converted to a raster surface by using the RSAC Cubist/See5 toolset (Ruefenacht et al. 2008). We consider this layer a geospatial representation of treed area, and it was used as a subsequent mask for all other host layers. The minimum density that can be measured on a U.S. Forest Service Forest Inventory and Analysis (FIA) sub-plot is 1.7 ft2/ac basal area of trees >1 in d.b.h. Therefore, a single pixel cannot represent <1.7 ft2/ac basal area (Krist et al. 2014). The yellow-cedar distribution derived in this manner encompasses all lands and includes forests where yellow-cedar may be abundant or only a minor component. The “all lands” category also includes emergent and shrub–scrub wetlands, which are classified as nonforested communities in most definitions of cover and forested land, such as the National Wetlands Inventory (USFWS 2009) and the National Land Cover Database (NLCD) (Multi-Resolution Land Characteristics Consortium 2015).
The best existing spatially explicit information on yellow-cedar occurrence comes from different sources with various resolutions depending on specific area in Alaska. In our vulnerability modeling, we use the higher resolution (30 m) yellow-cedar cover type layer where it is available, and use the lower resolution (240 m) in the remaining area and for graphic display of all maps in appendix 1. However, the scaling and compilation of the total areas using a 30-m or 240-m filter to define the mapping resolution leads to a disparity in the area estimates (see “Challenges in Using Different Scales for Geographic Information Systems Layers,” this section). The acreage estimates from both our yellow-cedar cover layers, produced with

169
A Climate Adaptation Strategy for Conservation and Management of Yellow-Cedar in Alaska
30-m and 240-m filters, can be compared to various estimates of the area occupied by yellow-cedar in Alaska (table 21). The older estimates of yellow-cedar occur-rence exclude unproductive forestland where yellow-cedar is likely to occur, so they would underestimate total yellow-cedar acreage. The estimates based on species distribution models have accompanying mapped output, but they rely on forest inventory plot data as input variables. The most reliable estimates of the acreage are based on inventory plot data through the use of extrapolation procedures (e.g., expansion factors), based on a systemic grid design used in the contemporary FIA
Table 21—Estimates of the acreage for yellow-cedar in Alaskaa
Estimate sourceb Scopeb Basisb ResolutionCover type or distribution
Estimated yellow-cedar
(acres)
FIA (2000–2003),c van Hees (2003)
Southeast Alaska to Yakutat
Inventory Cover type 403,000
FIA (2004–2008),d Barrett and Chris-tensen (2011: table 31)
Alaska Inventory Cover type 2,355,000
Ellenwood panhandle,e USDA FS (2014)
Southeast Alaska, panhandle only
Model 50 m masked by 30-m presence model
Distribution 2,205,791
This reportf Alaska Model + surveys 50 m masked by 240-m range map model
Distribution 6,486,584
This reportg Alaska Model + surveys 50 m with selections from the above two datasets for a com-plete representation of yellow-cedar in Alaska
Distribution 2,272,164
a The resolution or scaling factor and the response surface used for areal estimation are given as a basis for resolving the varying total area estimates that result from each method.b The source, areal coverage (scope), and inventory method are noted to provide a clear basis for comparison.c Yellow-cedar cover type: yellow-cedar is >25 percent, sum of yellow-cedar and western hemlock is >60 percent, and lodgepole pine is <10 percent of tree stocking. Estimate is reduced to 119,000 ac when defined by timberland (capable of producing >20 ft3 of wood/ac/yr and land not removed from timber use).d Includes wilderness areas but not Glacier Bay National Park. Cover type is defined by the tree species that forms the plurality (most numerous) of live-tree stocking. e All zones south and east of Glacier Bay National Park, yellow-cedar management zones 8 through 33 (see appendix 1). Derived from 50-m “suitability” index but masked by the Ellenwood 30-m yellow cedar extent layer. The Ellenwood 30-m-extent layer extended into Glacier Bay, but that area was not included in this value. f The 240-m zones were masked by the 240-m range map representation. Custom mapping and observations were used for management zones 1 through 7. In management zones 8 through 33, we represented yellow-cedar by using the Ellenwood 240-m yellow-cedar basal area layer as a proportion of the Ellenwood 240-m total basal area surface retaining all values >0.01 (1 percent).g The Ellenwood 30-m-extent model for southeast Alaska, management zones 8 through 33, plus aerial and boat surveys in Glacier Bay National Park and Prince William Sound, and inclusion of the small reported populations in Icy Bay and Haines, represented in manage-ment zones 1 through 7 and rendered at 240 m.

170
GENERAL TECHNICAL REPORT PNW-GTR-917
plots. These estimates do not, however, have an accompanying geographic map. Several estimates represent either a portion of yellow-cedar’s range in Alaska (e.g., limited to the panhandle, or having another geographic gap); others cover the entire occurrence as far to the northwest as Prince William Sound. Future efforts to develop species distribution maps and GIS layers for yellow-cedar and other tree species in Alaska should be reconciled with these estimates of acreage occurrence (see appendix 2).
Yellow-Cedar DeclineThe topic of mapping yellow-cedar decline is discussed in more detail in “Extent and intensity of decline” in section 2. High-resolution maps of yellow-cedar decline currently exist for two study areas (Peril Strait and Mount Edgecumbe), but the broader coverage of yellow-cedar decline across the yellow-cedar populations in Alaska is available only in the lower resolution aerial survey mapping product. This broader layer is not able to capture some large areas of older mortality that occur in forested wetland areas or areas where yellow-cedar has died and where it was a small component of the forest. In both cases, the scattered snags do not produce an adequate signature for detection from the air. At the same time, we recognize that the aerial survey mapping overestimates the local occurrence of yellow-cedar decline because the large, coarse polygons drawn by observers in aircraft often contain imbedded areas without yellow-cedar or even forest trees.
To reduce overestimation of decline, we modified the yellow-cedar decline layer by overlaying a derived vegetation landcover map in an attempt to remove areas that would not be expected to have dead yellow-cedar trees. A landscape layer cre-ated for carbon modeling was developed through a collaborative project involving the U.S. Forest Service’s Pacific Northwest Station, University of Alaska Fairbanks, and the U.S. Geological Survey (USGS) (University of Alaska Fairbanks 2015) for use in the Alaska LandCarbon assessment (Energy Independence and Security Act 2007) to model carbon stocks and fluxes. The landcover map was derived primarily from the NLCD (Multi-Resolution Land Characteristics Consortium 2015). The NLCD cover was modified to more accurately identify nonforested and forested landscapes. In particular, the locations of forested wetlands were needed because of their key carbon functions on the landscape. Yellow-cedar occurs frequently in these areas and the identification of these layers along with subsequent screens (described below) for nonforest improved the accuracy of yellow-cedar decline zones with substantial basal area. These layers include the USGS 2001 NLCD version 1.0, NLCD Percent Tree Canopy Cover version 1.0, Tongass National Forest Cover Types, and other layers such as saltwater and second-growth forests. We

171
A Climate Adaptation Strategy for Conservation and Management of Yellow-Cedar in Alaska
joined the yellow-cedar decline polygons with the revised NLCD landcover map and deleted polygons from the yellow-cedar decline layer that had values of no vegetation (rock, snow and ice, saltwater, freshwater, developed areas, sand, and clay), fens, other vegetation, and alpine areas. We retained polygons with values of upland forest and forested wetlands because these are likely to have yellow-cedar decline. The resulting modified yellow-cedar decline layer was used in all further comparisons and analysis.
Future vulnerability assessments and analyses may consider other GIS layers to use as overlays to further refine the yellow-cedar decline layer. Also, remote sensing combined with image analysis offers a promising opportunity to produce spatially explicit, high-resolution coverage of yellow-cedar decline, and may help detect locations missed by aerial survey.
Predicting Future Yellow-Cedar Decline With Two Risk Factors: Soil Drainage and SnowThe distribution of yellow-cedar decline expressed on the landscape is related to two physical factors: snow and soil drainage (Hennon et al. 2012). Our approach outlined here was to identify the areas of suitable and vulnerable habitats for yellow-cedar where it occurs by incorporating snow cover and drainage as risk factors to decline (fig. 81). Yellow-cedar reaches its greatest competitive advantage in poorly and moderately drained soils, but a portion of the population has under-gone mortality on these sites as reduced snow no longer offers adequate thermal protection for yellow-cedar roots. Therefore, we nested soil drainage (considered a constant, unchanging factor on the landscape) within areas of changing snow levels to predict future emergence of yellow-cedar decline. Sites that receive insufficient snow cover will have a reduction in favorable yellow-cedar habitat and the species will be limited to better drained soils where its roots can penetrate deeper soil horizons to avoid freezing injury (the green zone in the lower ellipse in figure 81). Yellow-cedar is expected to be generally less abundant in these vulner-able areas unless active forest management practices favor it over competing tree species. Areas of adequate snow cover (the upper two ellipses in figure 81) would be expected to continue to provide yellow-cedar’s full edaphic niche, including the portions on wet soils.
Soil drainage modeling— Poorly drained sites increase yellow-cedar’s vulnerability to freezing injury, and yellow-cedar is generally outcompeted by spruce and hemlock on better drained sites. Yellow-cedar forests are abundant on wetter areas of the landscape, where water tables are in the rooting zone (approximately 10-in depth) of the soil, as is

172
GENERAL TECHNICAL REPORT PNW-GTR-917
typical in emergent and forested wetlands (D’Amore et al. 2012) (fig. 82). We ap-plied a topographic wetness index (TWI) as the primary tool for modeling soil moisture across the landscape. This index was adjusted for local topographic condi-tions and compared to well-known measurements of soil saturation, and we used the index to partition the landscape of coastal Alaska into several wetness classes for use in the risk assessment model. This approach is well suited for complex forested terrain that is remote and difficult to measure directly (Moore et al. 1991), such as the Alaskan coastal forest. The TWI is derived from a digital elevation model (DEM) by calculating slope (degrees) and flow accumulation at each 50-m pixel (Quinn et al. 2001). Next, TWI is computed by using the form ln(a/tanβ), where tanβ is the local slope angle at a particular location on the landscape, and a is the upslope contributing area to the location (Beven and Kirkby 1979). The comput-ed values of TWI over a given area represent a continuum of wet-to-dry soil areas. High TWI values indicate wet areas and low values indicate dry areas, with mesic sites represented in the middle range of the continuum.
The TWI is a compound topographic index (CTI), meaning that it is calculated from a combination of primary attributes that are directly computed from the DEM (slope and specific catchment area) (Moore et al. 1991). Discrete, continuous soil
Figure 82—Water table depth in relation to rooting zone (10 in (25 cm)) of typical ecosystems (poor fens, forested wetlands, uplands) in the perhumid coastal temperate rainforest. Yellow-cedar is commonly found in poor-fen and forested wetland habitats and these areas have water table average depths <10 in (D’Amore et al. 2012).

173
A Climate Adaptation Strategy for Conservation and Management of Yellow-Cedar in Alaska
wetness was modeled with flow accumulation through a DEM. Mesic areas of water accumulation, where yellow-cedar is most likely to occur, were used to compile acres of potential yellow-cedar habitat. We subdivided the range of CTI values in which yellow-cedar could potentially occur into five classes based on the predicted soil drainage. Each class corresponded to the relative potential for yellow-cedar to occupy the space on the landscape in the more poorly drained conditions. The soil drainage index was combined with the snow model to create a vulnerability scale to identify areas where yellow-cedar is likely to decline under the assumption that no snow is present. We combined the CTI classes with information on snow accumula-tion to assign a relative overall risk of yellow-cedar decline, as described below.
Snow modeling— Snow protects yellow-cedar from seasonal root freezing (see section 2 and fig-ure 83). There are several different methods for modeling snow on the landscape, including the proportion of wet days that precipitation falls as snow, accumulation of snow, and persistence or depth of snowpack on the ground. Monthly, annual, and decadal estimates of snow are possible with some models. To associate snow with yellow-cedar health, we would ideally use variables related to snowpack depth or presence in late winter and early spring because this timeframe coincides with
Figure 83—Yellow-cedar-dominated forest protected by snow on a wet hillside.

174
GENERAL TECHNICAL REPORT PNW-GTR-917
freezing injury. Such a model is not yet available for coastal Alaska, however. We chose to use snow accumulation estimated annually. Note that the unit of “precipi-tation as snowfall” (PAS) uses water equivalents (i.e., melted snow) and not actual snow depth and that PAS may be related to existing snow in late winter if snow is not lost through melting, evaporation, or dispersal by wind. These natural losses would tend to be built into the comparison of annual snow accumulation and forests affected by yellow-cedar decline. The distribution of precipitation as snowfall (PAS) was modeled at a 200-m resolution with ClimateWNA v4.71 (Wang et al. 2010). This program downscales the climate model Parameter-elevation Relationships on Independent Slopes Model (PRISM) (Di Luzio et al. 2008) and calculates climate variables such as annual snowfall based on latitude, longitude, and elevation (Wang et al. 2006). Precipitation and temperature inputs were used to estimate the amount of precipitation as snow that was generated by the ClimateWNA model. We com-pared the spatial arrangement of annual snowfall in the ClimateWNA model to mapped yellow-cedar decline, and determined that about 10.1 in (256 mm) of an-nual precipitation as snowfall (expressed as water equivalents) distinguishes healthy from declining yellow-cedar forests (Hennon et al. 2012).
To project snow into the future, we chose the same five general circulation models (GCMs) that make up the composite used by the Scenarios Network for Alaska + Arctic Planning (SNAP) (University of Alaska Fairbanks 2015). Another model from the Pacific Climate Impacts Consortium (PCIC) recommendations (University of Victoria, PCIC 2013) was added to align with models used for British Columbia (University of Victoria, PCIC 2014). Scenario planning uses several dif-ferent estimates of greenhouse gas emissions to project a range of future potential emissions outcomes. The emissions scenarios were applied to each model according to the availability of AR4 (Fourth Assessment Report) climate scenarios from the Intergovernmental Panel on Climate Change (2007) and temperature and precipita-tion projections in ClimateWNA v4.71 (Wang et al. 2012). For each GCM we chose conservative emissions scenarios (table 22), which entail more limited future green-house gases. These modest scenarios predict less potential future warming than do higher emissions scenarios. But any rise in temperature, even under conservative scenarios, leads to a loss of snow in the models. All models have uncertainty and our results should be interpreted as a means to evaluate relative risk of mortality in areas where yellow-cedar grows in Alaska. Our estimates are modeled to represent a modest change relative to current conditions, yet conditions could potentially have substantial impacts on yellow-cedar forests.

175
A Climate Adaptation Strategy for Conservation and Management of Yellow-Cedar in Alaska
Developing risk classes— We developed risk classes through analysis and interpretation of the distribution of soil saturation and snow on the landscape as they relate to the current distribution of yellow-cedar decline. The distribution of wetness was arrayed into five classes by binning the TWI derived from the CTI model into equal categories across the land-scape. Each class was assigned a CTI risk score according to an ascending scale of relative soil moisture (table 23). These descriptive classes correspond to soil mois-ture classes that indicate the frequency and duration of soil saturation under local conditions of soil formation (Soil Survey Division Staff 1993). The snow risk score was based on the annual amount of snow calculated as PAS that accumulated on the landscape (table 23). The amount of snow present was divided into five snow risk classes from high snow accumulation (low risk) to low snow accumulation (high risk) (table 23).
The overall risk score was calculated for every pixel in the estimated occur-rence of yellow-cedar in Alaska by adding the CTI risk score and the snow risk score to create an index ranging from 2 to 10. These scores were then translated into three classes: low, medium, and high. Higher total risk scores were needed to assign a landscape to moderate or high overall risk classes because both risk factors—drainage and snow—must be present at certain levels for yellow-cedar decline to occur. In other words, risk of yellow-cedar decline is low if either drain-age or snow has a low risk score. Accordingly, assignment to the medium or high risk class required a high combined overall risk score relative to the low risk score. The drainage risk score was held constant, but the snow risk score was modeled by using the GCMs described above for three time periods called 2020, 2050, and
Table 22—General circulation models and emissions scenarios used in snow models, which were combined as one input to yellow-cedar decline risk classification
Model name and version AcronymEmissions scenario
General Circulation Model version 3.1-t47a cccma_cgcm31 B1European Centre Hamburg Model 5 mpi_echam5 B1Coupled Climate Model 2.1 gfdl_cm21 A1BCoupled Model 3.0 ukmo_hadcm3 B1Model for Interdisciplinary Research on Climate (medium resolution)
miroc3_2_medres A2
UK Hadleyb Ukmo_ HadGEM1 A1Ba University of Victoria, Pacific Climate Impacts Consortium (PCIC) model, but emissions scenario changed from A2.b PCIC model.

176
GENERAL TECHNICAL REPORT PNW-GTR-917
2080. The reference climate data for the current/normal time period cover a 30-yr range. Likewise, the three future dates refer to a 30-yr range: 2020 refers to 2011 through 2040, 2050 refers to 2041 through 2070, and 2080 refers to 2071 through 2100. Climate data were obtained from the PCIC (University of Victoria, PCIC 2014; Wang et al. 2010). Note that the names for these three time periods are not the actual midpoints of these ranges; they refer to the middle decade of each interval (2020s, 2050s, 2080s). The overall risk scores for these three time series were mod-eled to produce continuous covers within all the management zones (discussed in the next subsection) and across the entire yellow-cedar forested landscape in Alaska.
Delineating 33 Yellow-Cedar Management Zones in Coastal Alaska for AssessmentWe consulted with local forest managers and others to divide the range of yellow-cedar in Alaska into 33 yellow-cedar management zones for more detailed vulner-ability mapping and analysis (fig. 84). The distribution of yellow-cedar extends to
Table 23—Drainage and snow risk classes and scores, which are summed to assign overall risk of yellow-cedar decline in the areas where yellow-cedar occurs in Alaska
Compound topographic index (CTI) classes
CTI value rangea CTI risk score
Well drained <5.76 1Moderately well drained 5.76–6.59 2Somewhat poorly drained 6.60–7.64 3Poorly drained 7.65–9.32 4Very poorly drained >9.32 5
Snow class (annual PASb) Snow risk score
≥350.1 mm (≥13.9 in) 1300.1–350.0 mm (11.9–13.8 in) 2250.1–300.0 mm (9.9–11.8 in) 3200.1–250.0 mm (7.9–9.8 in) 4≤200 mm (≤7.8 in) 5
Overall risk class Overall risk scorec
Low 2–6Medium 7–8High 9–10a Represents a categorization of CTI values into one of five classes (quintiles).b Annual precipitation as snow (PAS) expressed in water equivalents.c Sum of snow risk score and CTI score.

177
A Climate Adaptation Strategy for Conservation and Management of Yellow-Cedar in Alaska
Figure 84—Map of the 33 yellow-cedar management zones used in assessing the current and future health of yellow-cedar where it grows in Alaska.
178
GENERAL TECHNICAL REPORT PNW-GTR-917
Unakwik Inlet in Prince William Sound, but we added one more management zone (Seward, where yellow-cedar is absent) to complete the Chugach National Forest and consider an area for future migration. These divisions into management zones were made on the basis of land ownership, U.S. Forest Service ranger districts, geomorphology, and forest management emphasis. The management zones in the northwestern area are large because yellow-cedar is generally uncommon in this part of its range. Note that the tools that we used in analysis and mapping are available for evaluating smaller project or analysis areas. Total land area provides a means to make comparisons among management zones and relate the amount of yellow-cedar in the management zone to other factors. The total yellow-cedar decline detected in each management zone is the accumulated mortality mapped and denotes the past damage to yellow-cedar forests. This damage often repre-sents tree mortality over a range of years, typically at least several decades, and sometimes up to a century (see “Epidemiology, Timing, and Pulses of Mortality” in section 2). Estimates of both the past and predicted acreage of yellow-cedar at risk of decline are important for salvage harvest planning activities on lands where this activity is permitted (see “Conversions, Timber Salvage, and Conservation on Vulnerable Habitats” subsection in section 3).
Challenges in Using Different Scales for Geographic Information Systems LayersThe models and survey GIS layers used in this report were constructed from differ-ent data sources and reflect various spatial and temporal scales. One example is the different acreage estimates of yellow-cedar occurrence when modeled at two spatial resolutions (see description in “Yellow-Cedar Distribution,” this section). Applying the 240-m filter in modeling yellow-cedar occurrence produced an estimate with nearly three times the acreage as the models based on the application of a 30-m filter. This dramatic difference is primarily due to the inflation of the extent of yellow-cedar area defined by the pixel size (240 m versus 30 m). The 30-m pixel filter provides a finer resolution and identifies the more specific location of the cedar forest. The 240-m layer is a coarser filter, which would tend to include both yellow-cedar forests and forests not containing yellow-cedar in the mosaic of plant communities typical of coastal Alaska.
Caution should be used when comparing acres of yellow-cedar distribution with acres of yellow-cedar decline. Yellow-cedar decline estimates come from aerial surveys which detect cumulative mortality over decades and even up to a century (see “Yellow-Cedar Decline” subsection in section 2). The most robust yellow-cedar distribution acreage estimates (table 21) were derived from data produced in the late

179
A Climate Adaptation Strategy for Conservation and Management of Yellow-Cedar in Alaska
1900s or early 2000s, either through direct calculation from inventory estimates or as input variables in a species distribution model. Only live yellow-cedar trees from inventory plots (i.e., dead trees were excluded) were used in the development of these inventory-based or model-based estimates. Many yellow-cedar popula-tions were already declining before any of these estimates were made. Reliance on live-tree plot data makes it difficult to reconstruct yellow-cedar occurrence or abun-dance at the onset of the forest decline in about 1880–1900. No estimate of yellow-cedar acreage exists for yellow-cedar forests before the onset of yellow-cedar decline. Based on our knowledge of how yellow-cedar decline progresses in stands, especially with a minor component of yellow-cedar typically surviving, we suspect that yellow-cedar as a percentage of the forest composition has diminished more than has the total acreage of forests that contain some yellow-cedar. Total acreage values would be more sensitive to estimates of yellow-cedar decline if cover types attempted to represent only yellow-cedar-dominated forests.
The patch of forest shown in figure 85 was previously dominated by live yellow-cedar trees, but the progressive mortality that occurred throughout the 1900s reduced the amount of live yellow-cedar by about 70 percent (D’Amore and Hen-non 2006). The central green section, which represents the area of active mortality in the 1900s (Hennon et al. 1990b), is now mainly composed of live trees, most of which are mainly hemlock. Models based on plot data limited to live trees would predict a different composition of species than occurred before the onset of decline throughout this patch. When this situation is repeated across the extent of yellow-cedar decline in Alaska, estimates of yellow-cedar from contemporary data sources are expected to underestimate the yellow-cedar component in forests, and, perhaps to a lesser extent, the acreage of forests that contain yellow-cedar.
There is interest in estimating the portion of yellow-cedar forests that has been affected by yellow-cedar decline in Alaska to gain a broad view of the impacts of this forest decline to date. It is problematic, however, to simply compare acres of mapped yellow-cedar mortality that developed progressively throughout the 1900s with a contemporary (late 1990s to early 2000s) estimate of acres of yellow-cedar forest (fig. 85). Because survey polygons can be coarse, we have attempted to con-strain the acreage estimate of yellow-cedar decline by overlaying another GIS layer to remove areas where yellow-cedar was unlikely to be present. More importantly, we cannot detect and account for yellow-cedar mortality where snags are scattered in forested wetlands or in forests in which yellow-cedar was not dominant. The yellow-cedar decline layer and associated acreage estimates should be viewed as representing yellow-cedar-dominated forests with high concentrations of mortality. Any future efforts to judge the proportion of yellow-cedar affected by forest decline

180
GENERAL TECHNICAL REPORT PNW-GTR-917
should ensure that the two input acreage estimates (yellow-cedar occurrence and yellow-cedar decline) are similar in temporal aspects of inputs, spatial resolution, dominance of yellow-cedar, and site productivity classes. Improvements of spatially explicit maps and associated areal estimates, for both yellow-cedar occurrence and yellow-cedar decline, are high-priority needs (see appendix 2).
Final Risk Assessment SummaryThe detailed risk assessment for each of the proposed 33 yellow-cedar manage-ment zones is presented in appendix 1. In this subsection we summarize the broad geographic patterns that emerged from those separate analyses by reviewing the regional abundance of yellow-cedar, broad areas affected by yellow-cedar decline, and general areas at future risk of yellow-cedar decline. We then consider the occurrence of land ownership and land use designation to evaluate the major oppor-tunities for the conservation and management of yellow-cedar in Alaska.
The risk assessment method estimates the acreage of yellow-cedar that is rated at low, medium, and high risk of developing yellow-cedar decline at three future time intervals: 2020, 2050, and 2080. The predictions are summarized in table 24 to evaluate the regional distribution of yellow-cedar, yellow-cedar decline, and future risk. The existing yellow-cedar decline acreage is given to indicate forests that have been affected to date. The 2020 risk is predicted for a near-term impact, which can
Figure 85—This patch of dead yellow-cedar decline at Poison Cove on Chichagof Island Alaska illustrates the issue of basing species cover types on plot data using live trees only, and the prob-lem of comparing acres of yellow-cedar decline with modeled acres of yellow-cedar occurrence.

181
A Climate Adaptation Strategy for Conservation and Management of Yellow-Cedar in Alaska
Tabl
e 24
—Su
mm
ary
of a
ll ye
llow
-ced
ar m
anag
emen
t are
as in
Ala
ska:
acr
eage
of y
ello
w-c
edar
, acr
eage
of c
urre
nt m
appe
d ye
llow
-ced
ar
decl
ine,
and
pro
ject
ed p
erce
ntag
e of
yel
low
-ced
ar a
t ris
k of
dec
line
in 2
020
(201
1–20
40),
2050
(204
1–20
70),
and
2080
(207
1–21
00)
Zon
eaFo
rest
land
Yello
w-c
edar
b
Map
ped
ye
llow
-ced
ar
decl
ine,
201
3c
Dec
line
risk
cla
ss, 2
020d
Dec
line
risk
cla
ss, 2
050d
Dec
line
risk
cla
ss, 2
080d
Low
Med
ium
Hig
hL
owM
ediu
mH
igh
Low
Med
ium
Hig
h -
- - -
- - -
- - -
- Acr
es -
- - -
- - -
- - -
- -
- - -
- - -
- - -
- - -
- - -
- Per
cent
age
of y
ello
w-c
edar
acr
eage
- - -
- - -
- - -
- - -
- - -
- - -
- -
Sew
ard
262,
164
00
N/A
N/A
N/A
N/A
N/A
N/A
N/A
N/A
N/A
Prin
ce W
illia
m S
ound
Wes
t76
6,92
78,
512
010
00
010
00
099
10
Prin
ce W
illia
m S
ound
Eas
t1,
020,
860
463
089
110
8019
138
4122
Icy
Bay
474,
519
310
100
00
100
00
100
00
Yaku
tat
309,
254
00
N/A
N/A
N/A
N/A
N/A
N/A
N/A
N/A
N/A
Gla
cier
Bay
742,
116
57,3
270
7919
366
268
4232
27H
aine
s32
3,92
240
071
290
3169
05
6629
Chi
chag
of N
orth
451,
225
42,9
2835
761
2712
5032
1825
4530
Chi
chag
of S
outh
550,
460
116,
861
41,0
6145
4114
3148
2114
5828
Kru
zof I
slan
d11
1,77
039
,529
26,7
4015
3748
941
506
4351
Bar
anof
Isla
nd56
3,57
015
4,24
255
,668
5336
1243
4314
2953
18Ju
neau
490,
097
9,48
362
3344
2323
4235
1248
41Tr
acy
Arm
429,
496
39,3
791,
100
8511
476
186
5235
13A
dmira
lty80
1,62
010
8,61
14,
566
5532
1344
3818
2152
27K
uiu
Isla
nd43
8,06
315
6,26
377
,103
3842
2024
4828
957
34K
upre
anof
Isla
nd W
est
483,
563
149,
920
68,5
8424
3838
1438
494
3957
Kup
rean
of Is
land
Eas
t15
5,50
924
,027
14,6
3772
208
5827
1532
3633
Thom
as B
ay18
4,38
423
,526
11,6
8854
3115
4631
2331
3930
Mitk
of Is
land
134,
822
16,4
5811
,672
7519
664
2511
3542
24Za
rem
bo Is
land
145,
573
25,8
9410
,555
6425
1050
3317
1949
32Et
olin
Isla
nd20
1,13
435
,317
23,4
9267
2211
5628
1534
4323
Wra
ngel
l Isl
and
121,
102
24,9
0512
,505
7718
565
259
3839
23St
ikin
e46
9,11
153
,801
21,1
8292
71
8810
371
218
Hec
eta
216,
828
36,9
2316
,818
5037
1338
4318
2055
24Pr
ince
of W
ales
Nor
th72
5,09
513
9,49
144
,730
3940
2127
4627
1154
35C
raig
Out
er Is
land
s35
1,51
465
,962
7,39
726
4826
1652
327
5735
Prin
ce o
f Wal
es S
outh
787,
246
198,
661
37,0
5746
3816
3445
2117
5528
Cle
vela
nd P
enin
sula
269,
680
66,5
4121
,186
5526
1945
3223
2645
29G
ravi
na Is
land
60,4
1811
,322
3,38
828
3933
1945
3610
53+3
7R
evill
agig
edo
Isla
nd W
est
424,
668
120,
920
22,4
6464
197
5325
1132
3918
Rev
illag
iged
o Is
land
Eas
t17
6,13
711
2,81
510
,081
6823
957
3013
3545
20M
isty
Fio
rds
1,07
3,63
540
7,51
822
,978
7120
964
2511
4936
15A
nnet
te a
nd D
uke
Isla
nds
111,
179
24,4
942,
082
2429
4619
3348
1338
49
T
otal
s13
,827
,661
2,27
2,16
456
9,15
3 -
- - -
- - -
100
- - -
- - -
-- -
- - -
- - 1
00 -
- - -
- - -
- - -
- - -
- 100
- - -
- - -
- a S
ee fi
gure
84
for t
he lo
catio
n of
eac
h ye
llow
-ced
ar m
anag
emen
t zon
e. F
or g
raph
ical
repr
esen
tatio
n an
d a
brea
kdow
n ba
sed
on la
nd
owne
rshi
p an
d m
anag
emen
t res
tric
tions
, see
app
endi
x 1.
b A
rea
of c
urre
nt y
ello
w-c
edar
fore
sts,
estim
ated
from
spec
ies d
istr
ibut
ion
mod
els a
nd su
rvey
s (se
e “Y
ello
w-c
edar
dis
trib
utio
n,” t
his s
ectio
n).
c See
“Yel
low
-ced
ar d
eclin
e,” th
is se
ctio
n.d P
erce
ntag
e of
the
estim
ated
yel
low
-ced
ar d
istr
ibut
ion
acre
age
that
is p
roje
cted
to b
e in
low
-, m
ediu
m-,
and
high
-ris
k cl
asse
s for
yel
low
- ce
dar d
eclin
e ba
sed
on h
ydro
logy
and
snow
mod
elin
g. P
erce
ntag
es m
ay n
ot su
m to
100
bec
ause
of r
ound
ing.
N/A
= n
ot a
pplic
able
.

182
GENERAL TECHNICAL REPORT PNW-GTR-917
be compared to existing yellow-cedar decline. The 2050 risk assessment allows for a prediction of the likely distribution of yellow-cedar decline in an intermediate planning timeline. The pace of this change is uncertain, but the GCM predictions are in agreement with the continued reduction of snow through increased tem-peratures in winter. The 2080 predictions provide a longer term perspective on the health of yellow-cedar in the various management zones.
Yellow-Cedar Forest Distribution and DeclineYellow-cedar ranges throughout the coastal forests of Alaska with small popula-tions in the northwest around the Gulf of Alaska and larger concentrations in the southeast panhandle. The largest population in south-central Alaska is located in Prince William Sound West. These yellow-cedar stands are associated with the cluster of coastal forests along the fringing area of the mainland and islands. There is no known yellow-cedar farther west toward Seward and the coastal mountain region of south-central Alaska, but we included this management zone to complete the Chugach National Forest. Smaller populations have been identified along the edge of Prince William Sound near Cordova and to the east at Icy Bay, and these are currently healthy.
Yellow-cedar has a generally continuous distribution and is abundant in most of the panhandle, except for gaps in the northern panhandle. The presence of forests currently affected by yellow-cedar decline varies widely from north to south in the panhandle. The yellow-cedar forests are free of any known intense mortality in the northern and northwestern management zones. The Glacier Bay management zone along the coastal fringe of the northwestern part of the panhandle has a sizable yellow-cedar forested area that is currently healthy. Yellow-cedar is not particularly abundant in some of the areas of the north panhandle (e.g., Juneau, Tracy Arm, and Admiralty Island) and there is very little known forest decline in these areas.
Yellow-cedar is a major component of the landscape in the northwestern portion of the panhandle. Chichagof South, Kruzof Island, and Baranof Island have 21, 35, and 27 percent of the forested area as yellow-cedar, respectively. There is also a high proportion of yellow-cedar southward on Kuiu Island and Kupreanof Island West, which have 36 and 31 percent of the forested area as yellow-cedar, respec-tively. Yellow-cedar accounts for 12 to 29 percent of the forested area in the rest of

183
A Climate Adaptation Strategy for Conservation and Management of Yellow-Cedar in Alaska
the central and southwestern areas; exceptions are the inland areas of Revillagigedo Island East and Misty Fiords, where yellow-cedar is more abundant. The greatest extent of existing yellow-cedar decline acreage is found in management zones in the middle portions of the panhandle: together, Kuiu Island, Kupreanof Island West, Baranof Island, and Chichagof South account for 43 percent of the mapped decline in Alaska.
These areas occur in a broad band at the northernmost extent of yellow-cedar decline (fig. 86). In several cases, they are also north of the distribution of western redcedar, which may have allowed for the expanded presence of yellow-cedar in these forests. These two features, the abundance of yellow-cedar and the climate zone at this latitude, probably contributed to the intensive and relatively recent appearance of yellow-cedar decline on the landscape there. Yellow-cedar forests appear less extensive to the south of these areas, but there is considerable acreage of yellow-cedar decline in Thomas Bay, Mitkof Island, Zarembo Island, Wrangell Island, and Etolin Island.
Yellow-cedar decline has been detected in every management zone farther to the south. Sizable acreages of decline occur in the Prince of Wales North and Prince of Wales South zones, but mortality often appears scattered and not particu-larly concentrated on this large island. Yellow-cedar mortality is found in smaller acreages in some southern coastal areas (e.g., Gravina Island, Annette and Duke Islands). Yellow-cedar is more abundant at higher elevations in this southerly zone. Scattered dead yellow-cedar occurs in forested wetland habitats at lower elevations in these areas, but its lack of concentration has made the mortality difficult to map from the air. Thus, the impacts of yellow-cedar decline are underrepresented. The mortality appears older in many of these areas, as if most of the tree death occurred decades in the past. To the east, yellow-cedar forests are extensive in the Revillagigedo Island East and Misty Fiords management zones. The Revillagigedo Island East zone has a sizable percentage (64 percent) of the forested area as yellow-cedar. The large southern mainland area of Misty Fiords is notable because of its large acreage of yellow-cedar, or 38 percent of its forestland. Yellow-cedar decline is present but limited to small coastal low-elevation forests in these management zones.
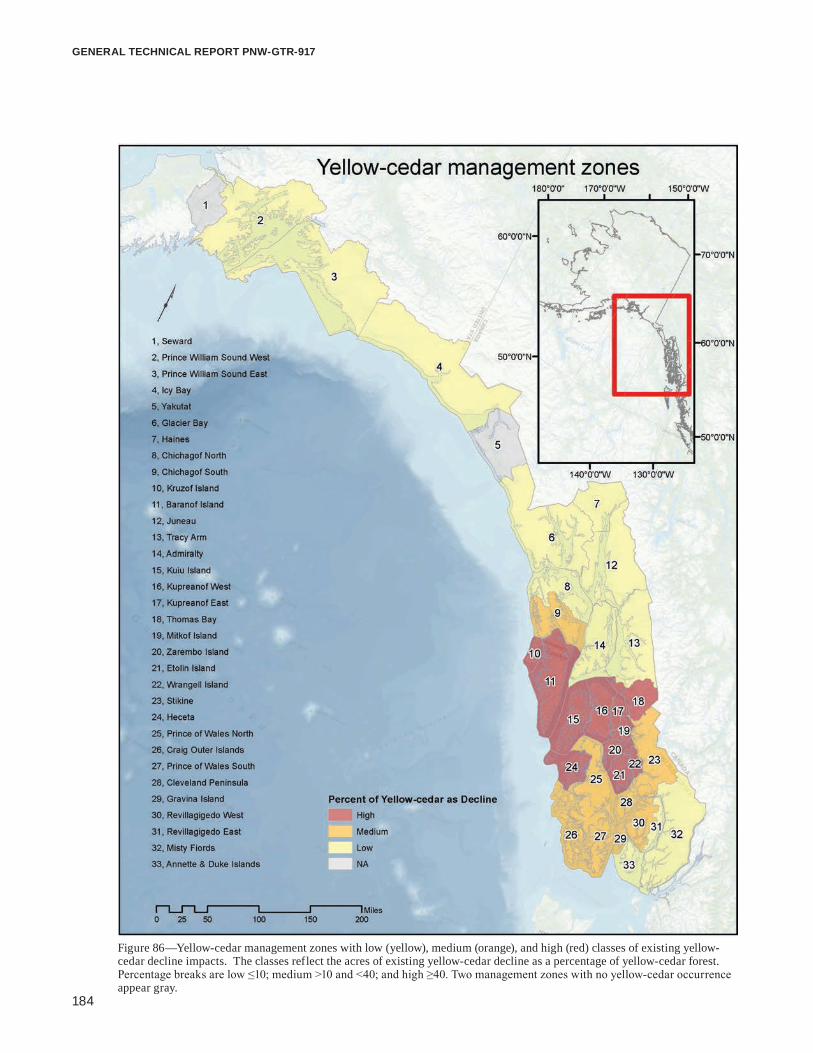
184
GENERAL TECHNICAL REPORT PNW-GTR-917
Figure 86—Yellow-cedar management zones with low (yellow), medium (orange), and high (red) classes of existing yellow-cedar decline impacts. The classes reflect the acres of existing yellow-cedar decline as a percentage of yellow-cedar forest. Percentage breaks are low ≤10; medium >10 and <40; and high ≥40. Two management zones with no yellow-cedar occurrence appear gray.

185
A Climate Adaptation Strategy for Conservation and Management of Yellow-Cedar in Alaska
Projection of Risk of Yellow-Cedar DeclineStrong geographic patterns of near-term and longer term (2020 to 2080) future risk of yellow-cedar decline are expected to affect the health of yellow-cedar forests in Alaska. These general patterns are: (1) low-snow regions where yellow-cedar previously underwent mortality and risk increases only marginally, (2) transitional regions that were previously protected by snow but where warming in the next century is expected to trigger mortality, and (3) high-snowfall areas where yellow-cedar forests remain intact due to sufficient snow cover to protect yellow-cedar by the year 2080 even with warming. These three general patterns, described below, are arrayed broadly from south to north, coastal to interior mainland, and more locally by elevation.
The southern coastal management zones are expected to experience only a modest increased risk of yellow-cedar decline in the future. Most of the vulner-able yellow-cedar stands in these areas have already been affected in areas such as Gravina Island, Prince of Wales South, Prince of Wales North, and Heceta, where only 10 to 20 percent of yellow-cedar is expected to be at low risk by 2080. Thus, the high risk continues, but it does not increase dramatically. Although the risk remains high based on our modeling techniques, the initial waves of mortality have already killed many of the mature yellow-cedar trees in vulnerable microsites and some of these forests are recovering with a lower yellow-cedar component. There-fore, there will be fewer yellow-cedar trees that could succumb and die in these high-risk areas in the future. Mortality may continue but probably at a lower rate in the previously affected forests. Precipitation has been dominated by rain rather than snow in winter in these areas, so rising temperatures will not substantially increase risk by altering snow patterns. The modest increases in risk of yellow-cedar decline are generally at higher elevations, where existing snow cover is predicted to be reduced. In addition, the favorable habitat driven by soil drainage does not vary through time, maintaining the lower-to-moderate risk acreage at local scales in these management zones.
The management zones of Admiralty, Kuiu Island, and Kupreanof Island West contain roughly 15 percent of the yellow-cedar acreage in Alaska, and also have a relatively high percentage of high risk of yellow-cedar decline. These zones appear particularly vulnerable in the future projections. These areas combined with Prince of Wales North and Prince of Wales South have one-third of the yellow-cedar acre-age. About 30 percent of these areas are in the long-term (2080) future high-risk cat-

186
GENERAL TECHNICAL REPORT PNW-GTR-917
egory. The share of high-risk acreage by 2080 is greatest for Kupreanof Island West (57 percent), Kruzof Island (51 percent), and Annette and Duke Islands (49 percent).
The most dynamic change to yellow-cedar forests in the next century may be in areas of the northern panhandle, just beyond the current distribution of yellow-cedar decline (fig. 87). Yellow-cedar forests in Chichagof North, Admiralty, Glacier Bay, Juneau, and Haines have only small acreages of existing yellow-cedar decline. Although these areas show small amounts of high risk of yellow-cedar decline in 2020 (e.g., 0 percent and 3 percent in Haines and Glacier Bay, respectively), their risk increases to about 30 percent in the high-risk class by 2080. Most other manage-ment zones in the northern panhandle are also projected to have 30 percent of their yellow-cedar forests in the high-risk class by 2080. The small populations in Prince William Sound East that are shown as change in figure 87 are mainly going from low to moderate risk between 2020 and 2080. These management zones with antici-pated dynamic change represent yellow-cedar forests that were previously protected by snow but that will be affected as snow accumulation is reduced through warming.
Finally, there are regions of Alaska with yellow-cedar forests that have little to no existing yellow-cedar decline now, and risk is expected to remain relatively low by 2080. The most extreme examples are the small populations of yellow-cedar in Prince William Sound West and Icy Bay, which are all currently healthy; 99 and 100 percent of these acreages, respectively, are expected to be at low risk of decline by 2080. A larger proportion of the small populations of yellow-cedar in Prince William Sound East near Cordova is expected to be at high risk (0 percent in 2020 but 22 percent in 2080).
Yellow-cedar forests along the mainland adjacent to the border with British Columbia are expected to remain relatively healthy into the future. Yellow-cedar is abundant in Tracy Arm, Stikine, and Misty Fiords. Currently these management zones contain only small amounts of yellow-cedar decline, all of which is along the coastal areas. The Misty Fiords, Revillagigedo Island East, and Revillagigedo Island West management zones have almost 30 percent of the yellow-cedar acreage in Alaska, but the acreage at high risk does not rise appreciably by 2080 (i.e., not >20 percent) and about one-third to one-half of these forests are expected to remain at low risk by 2080.
Implications of Risk Models for the Conservation and Management of Yellow-Cedar Lands Under Conservation or Protection StatusThe health status of yellow-cedar in Alaska differs widely with location: the species is impaired by concentrated mortality in some areas and unaffected in other areas.

187
A Climate Adaptation Strategy for Conservation and Management of Yellow-Cedar in Alaska
Figure 87—Yellow-cedar management zones with low (yellow), medium (orange), and high (red) percentage increase in high risk rat-ing between 2020 and 2080. Change for each management zone was determined by the difference in the percentage of yellow-cedar forests rated at high risk between the two time periods with classes of change of low, <2%; medium, 2 to 10%; and high, >10%.

188
GENERAL TECHNICAL REPORT PNW-GTR-917
Large portions of two landscapes under protected status, West Chichagof–Yakobi and South Baranof Wilderness Areas, exemplify yellow-cedar forests that have already undergone intense yellow-cedar decline. These were forested areas with a high abundance of yellow-cedar until the decline caused about 70-percent mortal-ity in many stands. A study on succession in the West Chichagof Wilderness Area documented the loss of yellow-cedar and the transition to western hemlock and other species, and predicted the long-term nature of these changes because of poor yellow-cedar regeneration (Oakes et al. 2014).
Other landscapes that are under protection currently have intact, healthy yel-low-cedar populations, but they are at increasing future risk, and the appearance of mortality is expected in the next century due to reduced snow. As an example, the health status of yellow-cedar in Glacier Bay National Park is expected to change as snow accumulation is reduced through warming (Oakes et al. 2015). Yellow-cedar may shift from thriving in abundant healthy populations to being compromised as yellow-cedar decline emerges in portions of the park. Similarly, yellow-cedar decline is now confined to the southern end of Admiralty Island, but mortality is expected to appear in yellow-cedar forests over large parts of the island by 2080. Without intervention, succession to other species and a long-term reduction in the yellow-cedar component in these forests is expected. More information is needed on the natural regeneration of yellow-cedar in decline-affected forests to determine how permanent these anticipated changes may be.
Meanwhile, other yellow-cedar forests in a land-use classification of protec-tion are expected to persist in a healthy condition even in a warming climate. The small populations of yellow-cedar at the northwest range limits in the Prince William Sound West zone are expected to be almost entirely at low risk of forest decline by 2080. Snow levels are so high in these areas that even with reductions through warming there is still adequate snow to buffer trees from root freezing. Snow is also expected to favor the abundant natural regeneration that continually replenishes yellow-cedar in these forests. Currently, yellow-cedar decline is limited to relatively small coastal fringes in some of the mainland areas such as Tracy Arm, Stikine, and Misty Fiords. These are primarily lands in protection status, and because of their mountainous terrain and colder winter climate, large areas are expected to retain enough snow to protect yellow-cedar into the future. The large mainland portion of Misty Fiords National Monument contains an estimated 407,000 ac of yellow-cedar, but only 15 percent of the yellow-cedar resource is expected to be at high risk of decline by 2080. The continued population stability of yellow-cedar is promising in these important, protected landscapes.

189
A Climate Adaptation Strategy for Conservation and Management of Yellow-Cedar in Alaska
It is important to note that yellow-cedar will not be extirpated from any major areas in Alaska through the process of yellow-cedar decline, even those currently affected or where decline is expected to develop in the future. Large mainland populations and smaller coastal populations along the Gulf of Alaska are expected to remain healthy through the century. At a more local spatial scale, about 30 per-cent of yellow-cedar survives over the long term in declining stands (D’Amore and Hennon 2006, Oakes et al. 2014). Thus, even in intensely affected forests, yellow-cedar may be reduced, but it is not extirpated. Furthermore, yellow-cedar remains healthy, often as a smaller component of forests in mixed stands, on well-drained soils. These healthy yellow-cedar trees are common in stands surrounding patches of dead yellow-cedar. Along with evaluating the health of mature yellow-cedar trees, natural regeneration could be monitored to assess the long-term sustainability of yellow-cedar on these protected landscapes (see appendix 2).
Lands Under Active Management Status: Intervention ActivitiesActive forest management offers the most direct opportunity for adapting to climate change and responding to yellow-cedar decline. Forest management practices can increase the abundance of yellow-cedar in habitats that are expected to be favorable into the future, and other approaches can be used to restore some ecosystem func-tions in decline-affected forests. These management considerations are described in more detail in section 3. Direct intervention may be limited to certain land owner-ships and land use designations on lands managed by the U.S. Forest Service where these activities are permitted.
Lands owned and managed by the state and by private entities have a great deal of flexibility for direct intervention in broad areas of coastal Alaska. Large-scale planting of yellow-cedar most likely would require a program of timber harvest-ing to produce open growing conditions. Good candidates for this approach are areas suitable to yellow-cedar because of high snowfall, such as those near Prince William Sound, Icy Bay, and Yakutat. In this part of the yellow-cedar range, state and private lands are the only lands with an active timber harvesting program. Most commercial timber harvests occur on relatively productive sites where higher volume forests are selected. Planted yellow-cedar on recently harvested lands would have excellent likelihood of survival because they probably would be protected by snow, would grow deep roots owing to local site productivity, and may have limited browse by deer. An example of this type of success has been the experience thus far in the trial planting at Yakutat on lands managed by the Forest Service.
The major areas managed by the Forest Service in land use designations that permit active forest management are in the middle and southern portion of the

190
GENERAL TECHNICAL REPORT PNW-GTR-917
panhandle. At first glance, many of these areas appear to be at high risk of yellow-cedar decline, and would therefore be unlikely locations to favor yellow-cedar. But our maps are displayed at a scale that does not portray the habitat suitable to yellow-cedar on well-drained sites. These favorable sites can occur at low elevations that receive little winter snow and are sometimes located adjacent to forested wetlands with patches of dead and dying yellow-cedar. More importantly, most timber harvest activities occur on well-drained soils that support forests of commercial volumes. Therefore, these sites represent the management space where techniques of planting and thinning to favor yellow-cedar can be applied through traditional silviculture. Yellow-cedar can be planted on productive sites that have been recently harvested, whether the harvest was a previously unmanaged old-growth stand or a young-growth stand. This latter situation of planting yellow-cedar to follow harvest of young-growth would be important as the region shifts to more young-growth harvest. Yellow-cedar planted on low-elevation productive sites will probably need some protection from deer browse to ensure long-term survival. See section 3 for more detail on planting and thinning to favor yellow-cedar on productive sites.
There may be an opportunity to establish new populations of yellow-cedar by planting seedlings in forest settings that are not intensively managed. These situations are presented here as ideas that have not yet been tested by planting trials. Yellow-cedar could be planted in forested wetland environments that receive heavy snow and are expected to represent suitable habitat into the future. Ideally, the seedlings would be planted on raised areas to avoid anaerobic soil conditions. Growth would be expected to be slow on these unproductive sites, yet seedlings may eventually grow into trees that produce cones and seed, or they may spread by clonal layering. Areas of natural disturbance in the form of windthrow and avalanches could be used as planting sites on more productive sites where open or semi-open canopy conditions would favor more rapid yellow-cedar growth and eventual reproduction.
Another form of active management is to salvage dead yellow-cedar trees to capture high-value wood in the forests that have been affected by yellow-cedar decline. Details on the wood properties of dead yellow-cedar and the feasibility of salvage are presented in the “Conversions, Timber Salvage, and Conservation on Vulnerable Habitats” subsection in section 3. Opportunities for salvage would be constrained by the current and future extent of yellow-cedar decline, land owner-ship and land use policies, and economic feasibility. A considerable proportion of yellow-cedar decline—both acreages currently existing and those expected to expand in the future—is on lands under protection status. Salvage opportunities are mentioned for specific yellow-cedar management zones in appendix 1. The most

191
A Climate Adaptation Strategy for Conservation and Management of Yellow-Cedar in Alaska
extensive opportunities for salvage appear to be in the southern and central coastal islands on lands administered by the Forest Service where yellow-cedar decline is common, road access exists, and land use policies allow this activity.
Whether dead yellow-cedar is salvaged or not, silvicultural treatments of plant-ing or thinning could be used to favor certain tree species. Western redcedar would be a desirable choice because it has ecosystem service values similar (but not identi-cal) to those of yellow-cedar. Western redcedar is often absent in decline-affected forests because of the elevational and latitudinal limits of the tree, but the limiting climate barriers (growing season growing-degree days and snow duration) are expected to be more favorable for redcedar in the future. Although there has been no such trial to date, a forest management option for rehabilitating stands affected by yellow-cedar decline is to plant and favor western redcedar.
Another approach could be to combine activities on suitable and vulnerable habitat for yellow-cedar in certain local project areas. Salvage of dead yellow-cedar in decline-affected forests may produce a stream of revenue that could then be used to fund planting, seedling protection, and thinning on nearby suitable habitat (fig. 88).
Figure 88—A patch of yellow-cedar decline above a series of recent timber harvest with a road. This photograph illustrates the opportunity to integrate activities on vulnerable and suitable habitat for yellow-cedar: salvage harvest dead yellow-cedar in the decline-affected forest to produce revenue to fund planting of yellow-cedar seedlings on the productive soils in the new harvest units below.
Alli
son
Bid
lack

192
GENERAL TECHNICAL REPORT PNW-GTR-917
ConclusionsThis report uses the case of yellow-cedar decline to illustrate how climate can interact with other factors to initiate widespread tree mortality, and offers a vulner-ability assessment and opportunities for adaptive responses to help in the conserva-tion and management planning for this important species. An understanding of the cause of yellow-cedar decline required several decades of study, but research eventually revealed that the problem was related to a changing climate. Research also exposed the actual mechanism of tree injury, which helped clarify the specific role of climate in tree death. Climate is just one of the factors that can lead to injury of a forest tree species, but it interacts with soils and a unique vulnerability of yellow-cedar to explain stress and death. Knowledge of these interacting factors can be the foundation for projecting future change and developing adaptive strategies.
Conservation and restoration strategies may acknowledge the dynamic nature of climate, and managers could take into account predicted changes when deciding where to apply these strategies. It is important to recognize that the health status of yellow-cedar has been and will continue to be compromised in some protected landscapes with minimal human development. Forest management strategies on certain land ownerships and land use designations can take several forms, such as the movement of tree species from various genetic sources through assisted migra-tion and the favoring of conditions for a species through active management. This latter method has promise in coastal Alaska. In this area silvicultural techniques of planting or thinning can be used to increase the presence of yellow-cedar on productive soils where it would otherwise be less competitive with western hemlock and Sitka spruce.
Our report summarizes current knowledge on the ecology, silvics, and gene-cology of yellow-cedar. It describes climate impacts on the species and offers adaptive strategies to help ensure the long-term abundance and ecosystem services of yellow-cedar in Alaska. We hope that this report is a useful reference for educa-tors, forest managers, and scientists, and that it will encourage others to study this culturally, economically, and ecologically valuable tree.
AcknowledgmentsWe appreciate the many reviews that we received on drafts of this report from Tara Barrett, Sarah Bisbing, Andy Bower, Brian Buma, Ben Case, Jackie DeMontigny, Rob Develice, Elizabeth Graham, Connie Harrington, Tim Harrington, Pat Heuer, Tom Heutte, Adelaide Johnson, John Krapek, Dennis Landwehr, Nick Lisuzzo, Kate Mohatt, John Russell, Mike Sheets, and Stefan Zeglen. We thank those who helped us interpret distributions of yellow-cedar throughout its natural range: Mike

193
A Climate Adaptation Strategy for Conservation and Management of Yellow-Cedar in Alaska
Simpson, U.S. Forest Service, Forest Health Protection in Bend, OR, for Oregon and Washington; Todd Davis and Stefan Zeglen, British Columbia Ministry of Forests, Lands and Natural Resource Operations, Nanaimo, BC, and Pat Martin, British Columbia Ministry of Forests, Lands and Natural Resource Operations, Victoria, B.C., for British Columbia; Roy Josephson, Alaska Department of Natural Resources, for Haines and Icy Bay; and Greg Streveler of Icy Strait Environmental Services, Gustavus, Alaska, for Glacier Bay. Joel Nudelman, Alaska Department of Natural Resources, Juneau, provided us with the report of yellow-cedar on state Mental Health Corporation land near Icy Bay. Special thanks to Marshall Mur-ray, Centralia, Washington, for supplying us with the locations for more than 300 yellow-cedar populations in Oregon and Washington. We greatly appreciate the thorough and helpful copy editing by Cynthia Moser. We thank Inga Petaisto, U.S. Forest Service, Alaska Region, for sharing information on the historical economic values and export policy of yellow-cedar in Alaska. We are grateful for the finan-cial support from the Forest Management director in the Alaska Region and for the Focus Areas grant that we received from the Pacific Northwest Research Station.
Metric Equivalents When you know: Multiply by: To find:Inches (in) 2.54 CentimetersFeet (ft) 0.305 MetersYards (yd) 0.914 MetersMiles (mi) 1.609 KilometersAcres (ac) 0.405 HectaresSquare feet (ft2) 0.0929 Square metersSquare miles (mi2) 2.59 Square kilometersCubic feet (ft3) 0.0283 Cubic metersCubic inches (in3) 0.0000164 Cubic metersBoard feet 0.0024 Cubic meterCubic feet (ft3) 28.3 LitersPounds (lb) 454 GramsPounds (lb) 0.454 KilogramsTons (ton) 907 KilogramsTons (ton) 0.907 Tonnes or megagramsSquare feet per acre (ft2/ac), basal area
0.229 Square meters per hectare
Cubic feet per acre (ft3/ac) 0.07 Cubic meters per hectareTrees per acre 2.47 Trees per hectareDegrees Fahrenheit 0.56(°F – 32) Degrees CelsiusPounds per square inch (lb/in2) 6,900 PascalPounds per square foot (lb/ft2) 47.9 PascalPounds per cubic foot (lb/ft3) 16.02 Kilograms per cubic meter

194
GENERAL TECHNICAL REPORT PNW-GTR-917
Literature CitedAdams, R.P.; Bartel, J.A.; Price, R.A. 2009. A new genus, Hesperocyparis, for
the cypresses of the western hemisphere (Cupressaceae). Phytologia. 91: 160–185.
Ager, T.A.; Carrara, P.E.; Smith, J.L.; Anne, V.; Johnson, J. 2010. Postglacial vegetation history of Mitkof Island, Alexander Archipelago, southeastern Alaska. Quaternary Research. 73: 259–263.
Ager, T.A.; Rosenbaum, J.G. 2007. Late glacial-holocene pollen-based vegetation history from Pass Lake, Prince of Wales Island, southeastern Alaska. Studies by the U.S. Geological Survey in Alaska, 2007. Prof. Pap. 1780-G. Reston, VA: U.S. Department of the Interior, Geological Survey. 19 p.
Aitken, S.N.; Yeaman, S.; Holliday, J.A.; Wang, T.; Curtis-McLane, S. 2008. Adaptation, migration or extirpation: climate change outcomes for tree populations. Evolutionary Applications. 1: 95–110.
Alaback, P.B. 1982. Dynamics of understory biomass in Sitka spruce-western hemlock forests of southeast Alaska. Ecology. 63: 1932–1948.
Alaska Department of Fish and Game. 2013. Sitka black-tailed deer (Odocoileus hemionus sitkensis), species profile. http://www.adfg.alaska.gov/index.cfm?adfg=deer.main. (February 2013).
Alaska Native Claim Settlement Act [ANCSA] of 1971; 85 Stat. 688; 43 U.S.C. 1601 et seq.
Alban, D. 1969. The influence of western hemlock and western redcedar on soil properties. Soil Science Society of America Proceedings. 33: 453–457.
Alden, J.N. 1991. Provisional tree seed zones and transfer guidelines for Alaska. Gen. Tech. Rep. PNW-GTR-270. Portland, OR. U.S. Department of Agriculture, Forest Service, Pacific Northwest Research Station. 35 p.
Anderson, E.D.; Owens, J.; Colangeli, A.; Russell, J. 2002. Challenges facing Chamaecyparis nootkatensis seed orchards: low seed production, pollen-cone abortion, self-pollination, and accelerated embryo development. Canadian Journal of Forest Research. 32: 1411–1419.
Andersen, H.E. 1953. Range of western redcedar (Thuja plicata) in Alaska. Alaska Forest Research Center Tech. Note 22. Juneau, AK: U.S. Department of Agriculture, Forest Service. 2 p.
Andrews, C.L. 1934. Russian shipbuilding in the American colonies. Washington Historical Quarterly. 25: 3–10.

195
A Climate Adaptation Strategy for Conservation and Management of Yellow-Cedar in Alaska
Antos, J.A.; Zobel, D.B. 1986. Habitat relationships of Chamaecyparis nootkatensis in southern Washington, Oregon, and California. Canadian Journal of Botany. 64: 1898–1909.
Araújo, M.B.; Peterson, A.T. 2012. Uses and misuses of bioclimatic envelope modeling. Ecology. 93: 1527–1539.
Arnott, J.T.; Grossnickle, S.C.; Puttonen, P.; Mitchell, A.K.; Folk, R.S. 1993. Influence of nursery culture on growth, cold hardiness, and drought resistance of yellow cypress. Canadian Journal of Forest Research. 23: 2537–2547.
Arnott, J.T.; Puttonen, P.; Mitchell, A.K. 1992. Short- and long-term responses of yellow cypress cuttings to different environmental regimes in the nursery. Acta Horticulturae. 2(319): 377–382.
Aulin-Erdtman, G. 1950. Studies in the tropolone series. I. Thujaplicins and nootkatin. Acta Chemica Scandinavica. 4: 1031–1041.
Axelrod, D.J. 1976. History of the coniferous forests, California and Nevada, University of California Publications in Botany. 70: 1–62.
Baltunis, B.S.; Russell, J.H.; VanNiejenhuis, A.; Barker, J.; El-Kassaby, Y.A. 2013. Genetic analysis and clonal stability of two yellow cypress clonal populations in British Columbia. Silva Genetica. 62: 173–187.
Bancroft, H.H. 1886. History of Alaska, 1730-1885. San Francisco: The History Co. Publishers. 689 p.
Bannan, M.W. 1950. The frequency of anticlinal divisions in fusiform cambial cells of Chamaecyparis. American Journal of Botany. 37: 511–519.
Bannan, M.W. 1951. The annual cycle of size changes in the fusiform cambial cells of Chamaecyparis and Thuja. Canadian Journal of Botany. 29: 421–437.
Banner, A.; MacKenzie, W.; Haeussler, S.; Thomson, S.; Pojar, J.; Trowbridge, R. 1993. A field guide to the site identification and interpretation for the Prince Rupert Forest Region. Land Manage. Handb. 26. Victoria, BC: British Columbia Ministry of Forests, Research Branch.
Banner, A.; Pojar, J.; Rouse, G.E. 1983. Postglacial paleoecology and successional relationships of a bog woodland near Prince Rupert, British Columbia. Canadian Journal of Forest Research. 13: 938–947.
Bannister, J.; Curtis, K.; Barber, V.; Miller, T. 2007. A mechanical evaluation of Alaska yellow-cedar. Forest Products Journal. 57(6): 19–22.
196
GENERAL TECHNICAL REPORT PNW-GTR-917
Barrett, T.M.; Christensen, G.A. 2011. Forests of southeast and south-central Alaska, 2004–2008, five-year forest inventory and analysis report. Gen. Tech. Rep. PNW-GTR-835. Portland, OR: U.S. Department of Agriculture, Forest Service, Pacific Northwest Research Station: 57–62.
Barton, G.M. 1976. A review of yellow cedar (Chamaecyparis nootkatensis [D. Don] Spach) extractives and their importance to utilization. Wood and Fiber. 8: 172–176.
Beier, C.M.; Sink, S.E.; Hennon, P.E.; D’Amore, D.V.; Juday, G.P. 2008. Twentieth-century warming and the dendroclimatology of declining yellow-cedar forests in southeastern Alaska. Canadian Journal of Forest Research. 38: 1319–1334.
Bennett, M.D.; Leitch, I.J. 2012. Plant DNA C-values database. Release 6.0. Royal Botanic Gardens, Kew, Richmond, Surrey, UK. http://data.kew.org/cvalues/. (July 2, 2015).
Bérubé, Y.; Ritland, C.; Ritland, K. 2003. Isolation, characterization, and cross-species utility of microsatellites in yellow-cedar (Chamaecyparis nootkatensis). Genome. 46: 353–361.
Beven, K.J.; Kirkby, M.J. 1979. A physically-based, variable contributing area model of basin hydrology. Hydrologic Sciences Bulletin. 24: 43–69.
Boggs, K.; Klein, S.; Grunblatt, J.; Streveler, G.; Koltun, B. 2008. Landcover classes and plant associations of Glacier Bay National Park and Preserve. Natural Resource Tech. Rep. NPS/GLBA/NRTR-2008/093. Fort Collins, CO: U.S. Department of the Interior, National Park Service. 255 p.
Boland, J.L.; Hayes, J.P.; Smith, W.P.; Huso, M.M. 2009. Selection of day-roosts by Keen’s myotis (Myotis keenii) at multiple spatial scales. Journal of Mammalogy. 90: 222–234.
Bonner, F.T. 2008. Cupressaceae-Cypress family white-cedar. In: U.S. Department of Agriculture, Forest Service. The woody plant seed manual. Agric. Handb. 727. Washington, DC: 391–395.
Bower, A.D.; St Clair, J.B.; Erickson, V. 2014. Generalized provisional seed zones for native plants. Ecological Applications. 24: 913–919.
Brackley, A.M.; Hayes R.W.; Alexander, S.J. 2009. Timber harvests in Alaska: 1910–2006. Res. Note PNW-RN-560. Portland, OR: U.S. Department of Agriculture, Forest Service, Pacific Northwest Research Station. 24 p.
197
A Climate Adaptation Strategy for Conservation and Management of Yellow-Cedar in Alaska
Brandeis, T.J.; Newton, M.; Cole, E.C. 2002. Biotic injuries on conifer seedlings planted in forest understory environments. New Forests. 24: 1–14.
Buma, B.B.; Hennon, P.E.; Bidlack, A.L.; Baichtal, J.F.; Ager, T.; Streveler, G. 2014. Correspondence regarding “The problem of conifer species migration lag in the Pacific Northwest region since the last glaciation” by Elias, S.A. (2013), Quaternary Science Reviews 77, 55–69. Quaternary Science Reviews. 93: 167–169.
Buma, B.B.; Johnson, A.C. 2015. The role of windstorm exposure and yellow cedar decline on landslide susceptibility in southeast Alaskan temperate rainforests. Geomorphology. 228: 504–511.
Burns, R.M.; Honkala, B.H., tech. cords. 1990. Silvics of North America: 1: Conifers. Agric. Handb. 654. Washington, DC: U.S. Department of Agriculture, Forest Service. 675 p.
Calkin, P.E.; Wiles, G.C.; Barclay, D.J. 2000. Holocene coastal glaciation of Alaska. Quaternary Science Review. 20: 449–461.
Campbell, R.B.; Robertson, J.M. 1952. The structure of nootkatin; an X-ray determination. Chemistry and Industry. 52: 1266–1267.
Campbell, R.K. 1971. Genetic variability in juvenile height-growth of Douglas-fir. Silvae Genetica. 21: 126–129.
Caouette, J.P.; Steel, E.A.; Hennon, P.E.; Cunningham, P.G.; Pohl, C.A.; Schrader, B.A. [In press]. Influence of elevation and site productivity on conifer distribution across Alaskan temperate rainforests. Canadian Journal of Forest Research.
Capp, J.; Van Zee, B.; Alaback, P.; Boughton, J.; Copenhagen, M.; Martic, J. 1992. Ecological definitions for old-growth forest types in southeast Alaska. R10-TP-28. Juneau, AK: U.S. Department of Agriculture, Forest Service, Alaska Region. 63 p.
Carlsson, B.E.; Frank, A.; Harvey, W.E. 1952. The chemistry of the natural order Cupressales. VIII: Heartwood constituents of Chamaecyparis nootkatensis—carvacrol, nootkatin and chamic acid. Acta Chemica Scandinavica. 6: 690–696.
Carrara, P.E.; Ager, T.A.; Baichtal, J.F.; VanSistine, D.P. 2003. Map of glacial limits and possible refugia in the southern Alexander Archipelago, Alaska, during the late Wisconsin glaciation. Misc. Field Studies Map MF-2424. Denver, CO: U.S. Department of the Interior, Geological Survey.

198
GENERAL TECHNICAL REPORT PNW-GTR-917
Cheng, Y.S.; von Rudloff, E. 1970. Two new diterpenoid oxides from the leaf oil of Chamaecyparis nootkatensis. Tetrahedron Letters. 14: 1131–1132.
Cherry, M.L.; Lester, D.T. 1992. Genetic variation in Chamaecyparis nootkatensis from Coastal British Columbia. Western Journal of Applied Forestry. 7: 25–29.
Clark, R.H.; Lucas, C.C. 1926. The essential oil content of Chamaecyparis nootkatensis. Transactions of the Royal Society of Canada. 3(20): 423–428.
Coates, K.D.; Pollack, J.C.; Barker, J.E. 1985. The effect of deer browsing on the early growth of three conifer species in the Queen Charlotte Islands. RR85002-PR. Internal Reports of the Ministry of Forests Research Program. Victoria, BC: British Columbia Ministry of Forests. 13 p.
Colangeli, A.M. 1991. Reproductive biology: pollen/seed/seed orchards. In: Lousier, J.D., ed. Proceedings of a symposium: Yellow cypress: Can we grow it? Can we sell it? FRDA Rep. 171. Victoria, BC: Forestry Canada; British Columbia Ministry of Forests: 29–30.
Cooper, W.S. 1942. Vegetation of the Prince William Sound region, Alaska; with a brief excursion into post-Pleistocene climatic history. Ecological Monographs. 12: 1–22.
Cronn, R.C.; Jennings, T.N.; Hennon, P.E.; D’Amore, D.V. 2014. Development of DNA tools to aid genetic conservation and restoration in Alaska yellow-cedar. Final report, U.S. Forest Service Special Technology Development program. Fairbanks, AK: U.S. Department of Agriculture, Forest Service, Alaska Forest Health and Protection Office. 64 p.
Crouch, G.L. 1980. Plastic cages to protect Douglas-fir seedlings from animal damage in western Oregon. Res. Pap. PNW-271. Portland, OR: U.S. Department of Agriculture, Forest Service, Pacific Northwest Forest and Range Experiment Station. 6 p.
D’Amore, D.V.; Fellman, J.B.; Edwards, R.T.; Hood, E.W.; Ping, C.L. 2012. Hydropedology of the North American coastal temperate rainforest. In: Lin, H., ed. Hydropedology: synergystic integration of soil science and hydrology. London: Academic Press: 351–380.
D’Amore, D.V.; Hennon, P.E. 2006. Evaluation of soil saturation, soil chemistry, and early spring soil and air temperatures as risk factors in yellow-cedar decline. Global Change Biology. 12: 524–545.

199
A Climate Adaptation Strategy for Conservation and Management of Yellow-Cedar in Alaska
D’Amore, D.V.; Hennon, P.E.; Schaberg, P.G.; Hawley, G. 2009. The adaptation to exploit nitrate in surface soils predisposes yellow-cedar to climate change-induced decline and enhances the survival of redcedar. Forest Ecology and Management. 258: 2261–2268.
Dastur, K.P. 1974. A stereoselective approach to eremophilane sesquiterpenes: a synthesis of (plus/minus)-nootkatone and (plus/minus)-alpha-vetivone [Chamaecyparis nootkatensis]. Journal of the American Chemical Society. 96: 2605–2608.
DeGroot, R.C.; Woodward, B.; Hennon, P.E. 2000. Natural decay resistance of heartwood from dead, standing yellow-cedar trees: laboratory evaluations. Forest Products Journal. 50: 53–59.
DeMars, D.J. 1996. Board-foot and cubic-foot volume tables for Alaska-cedar in southeast Alaska. Res. Note PNW-RN-516. Portland OR: U.S. Department of Agriculture, Forest Service, Pacific Northwest Research Station. 14 p.
DeMeo, T.; Martin, J.; West, R.A. 1992. Forest plant association management guide, Ketchikan Area, Tongass National Forest. R10-MB-210. Juneau, AK: U.S. Department of Agriculture, Forest Service, Alaska Region. 405 p.
DeVelice, R.L.; Hubbard, C.J.; Boggs, K.; Boudreau, S.; Potkin, M.; Boucher, T.; Wertheim, C. 1999. Plant community types of the Chugach National Forest: southcentral Alaska. Tech. Publ. R10-TP-76. Anchorage, AK: U.S. Department of Agriculture, Forest Service, Alaska Region, Chugach National Forest. 375 p.
Devine, W.D.; Harrington, C.A. 2008. Influence of four tree shelter types on microclimate and seedling performance of Oregon white oak and western redcedar. Res. Pap. PNW-RP-576. Portland, OR: U.S. Department of Agriculture, Forest Service, Pacific Northwest Research Station. 35 p.
Donovan, G.; Hesseln, H. 2004. Consumer willingness to pay for a naturally decay-resistant wood product. Western Journal of Applied Forestry. 19: 160–164.
Downing, G.L. 1960. A cedar bark beetle outbreak. Forest Insect Survey, Rep. 6. Juneau, AK: U.S. Department of Agriculture, Forest Service, Alaska Forest Research Center. 2 p.
Duff, S.R.; Erdtman, H. 1954. The chemistry of the natural order of Cupressales. X: Nootkatin. Chemistry and Industry. 15: 432–433.

200
GENERAL TECHNICAL REPORT PNW-GTR-917
Duff, S.R.; Erdtman, H.; Harvey, W.E. 1954. The chemistry of the natural order Cupressales. XI: Heartwood constituents of Chamaecyparis nootkatensis (Lamb.) Spach. Nootkatin. Acta Chemica Scandinavica. 8: 1073–1082.
Duncan, R.W. 1994. Bionomics and life history of the gall midge Chamaediplosis nootkatensis Gagne & Duncan (Diptera: decidomyiidae) on yellow cypress in British Columbia. Pan Pacific Entomologist. 70: 103–112.
Eglitis, A.; Hennon, P.E. 1997. Porcupine feeding damage in precommercially thinned conifer stands of central southeast Alaska. Western Journal of Applied Forestry. 12: 115–121.
Elias, SA. 2013. The problem of conifer species migration lag in the Pacific Northwest region since the last glaciation. Quaternary Science Reviews. 77: 55–69.
Ellenwood, J.R.; Krist, F. J., Jr.; Romero, S.A. 2015. National individual tree species atlas. FHTET-15–01. Fort Collins, CO: U.S. Department of Agriculture, Forest Service, Forest Health Technology Enterprise Team. 320 p.
El-Kassaby, Y.A. 1995. The fitness of reproductive-cycle plasticity in yellow-cedar (Chamaecyparis nootkatensis). Silvae Genetica. 44: 217–218.
Energy Independence and Security Act. 2007. http://www.gpo.gov/fdsys/pkg/PLAW-110publ140/html/PLAW-110publ140.htm. (June 30, 2015).
Erdtman, H. 1952. Chemistry of some heartwood constituents of conifers and their physiological and taxonomic significance. In: Cook, J.W., ed. Progress in organic chemistry. London: Butterworth Scientific Publishers: 22–63.
Erdtman, H. 1955. Natural tropolones. In: Paech, K.; Tracey, M.V., eds. Modern methods of plant analysis. Berlin: Springer: 351–358.
Erdtman, H.; Harvey, W.E. 1952. The chemistry of the natural order Cupressales. IX: Nootkatin. Chemistry and Industry. 71: 1267.
Erdtman, H.; Harvey, W.E.; Topliss, J.G. 1956. The chemistry of the natural order Cupressales. XVI: Heartwood constituents of Chamaecyparis nootkatensis (Lamb.) Spach: the structure of chamic and chaminic acids. Acta Chemica Scandinavica. 10: 1381–1392.
Erdtman, H.; Hirose, Y. 1962. The chemistry of the natural order Cupressales. 46: The structure of nootkatone. Acta Chemica Scandinavica. 16: 1311–1314.
201
A Climate Adaptation Strategy for Conservation and Management of Yellow-Cedar in Alaska
Erdtman, H.; Topliss, J.G. 1957. The chemistry of the natural order Cupressales. XVIII: Nootkatene, a new sesquiterpene type hydrocarbon from the heartwood of Chamaecyparis nootkatensis (Lamb.) Spach. Acta Chemica Scandinavica. 11: 1157–1161.
Fahnestock, G.R.; Agee, J.K. 1983. Biomass consumption and smoke production by prehistoric and modern forest fires in western Washington. Journal of Forestry. 81: 653–657.
Farjon, A; Hiep, N.T., Harder; D.K., Loc; P.K.; Averyanov, L. 2002. The new genus and species in Cupressaceae (Coniferales) from northern Vietnam, Xanthocyparis vietnamensis. Novon. 12: 179–189.
Farr, W.A.; LaBau, V.J.; Laurent, T.H. 1976. Estimation of decay in old-growth western hemlock and Sitka spruce in southeast Alaska. Res. Pap. PNW-RP-204. Portland, OR: U.S. Department of Agriculture, Forest Service, Pacific Northwest Forest and Range Experiment Station. 24 p.
Fellman, J.B.; Hood, E.W.; Edwards, R.T.; D’Amore, D.V. 2009. Changes in the concentration, biodegradability and fluorescent properties of dissolved organic matter during stormflows in coastal temperate watersheds. Journal of Geophysical Research—Biogeosciences. 114: G01021.
Folk, R.S.; Grossnickle, S.C.; Arnott, J.T.; Mitchell, A.K.; Puttonen, P. 1996. Water relations, gas exchange, and morphological development of yellow-cedar seedlings. Forest Ecology and Management. 81: 197–213.
Folk, R.S.; Grossnickle, S.C.; Russell, J.H. 1995. Gas exchange, water relations and morphology of yellow-cedar seedlings and stecklings before planting and during field establishment. New Forests. 9: 1–20.
Forest Products Laboratory. 1963. Characteristics of Alaska woods. Res. Pap. FPL 1. Madison, WI: U.S. Department of Agriculture, Forest Service. 64 p.
Forest Products Laboratory. 1987. Rev. ed. Wood handbook: wood as an engineering material. Agric. Handb. 72. Washington, DC: U.S. Department of Agriculture, Forest Service. 466 p.
Frenkel, R.E. 1974. An isolated occurrence of Alaska-cedar (Chamaecyparis nootkatensis [D. Don] Spach) in the Aldrich Mountains, central Oregon. Northwest Science. 48: 29–37.
202
GENERAL TECHNICAL REPORT PNW-GTR-917
Funk, A. 1974. Microfungi associated with dieback of native Cupressaceae in British Columbia. Canadian Plant Disease Survey. 54(4): 166–168.
Funk, A.; Molnar, A.C. 1972. Kabatina thujae on yellow cedar in British Columbia nurseries. Bi-monthly Research Notes. 28: 16–17.
Furniss, R.L.; Carolin, V.M. 1977. Western forest insects. Misc. Publ. 1339. Washington, DC: U.S. Department of Agriculture, Forest Service. 654 p.
Gadek, P. A.; Alpers, D. L.; Heslewood, M. M.; Quinn, C. J. 2000. Relationships within Cupressaceae sensu lato: a combined morphological and molecular approach. American Journal of Botany. 87: 1044–1057.
Gaston, G.; Eastin, I. 2010. A tale of two markets: opportunities for western redcedar and yellow-cedar in Japan and the U.S. In: Harrington, C.A., tech. coord. A tale of two cedars: international symposium on western redcedar and yellow-cedar. Gen. Tech. Rep. PNW-GTR-828. Portland, OR. U.S. Department of Agriculture, Forest Service, Pacific Northwest Research Station: 5.
Gensler, W.J.; Solomon, P.H. 1973. Synthesis of chaminic acid [Chamaecyparis nootkatensis]. Journal of Organic Chemistry. 38: 1726–1731.
Graff, J.; Herman, R.; Zaerr, J. 1999. Ionic balance and organic acids in western redcedar, western hemlock, and Douglas-fir seedlings grown in low- and high-N soils. Canadian Journal of Forest Research. 29: 669–678.
Graham, E.; Heutte, T. 2014. Forest health conditions in Alaska, 2013. Protection Rep. R10-PR-35. Anchorage, AK: U.S. Department of Agriculture, Forest Service, Alaska Region. 81 p.
Great Britain Forestry Commission. Phytophthora austrocedrae. http://www.forestry.gov.uk/forestry/INFD-8RAJZ3. (March 1, 2013).
Green, D.W.; McDonald, K.A.; Hennon, P.E.; Evans, J.W.; Stevens, J. H. 2002. Flexural properties of salvaged dead yellow-cedar. Journal of Forest Products. 52(1): 81–88.
Gregory, R.A. 1957. Some silvicultural characteristics of western redcedar in southeast Alaska. Ecology. 38: 646–649.
Greslebin, A.G.; Hansen, E.M.; Sutton, W. 2007. Phytophthora austrocedrae sp. nov., a new species associated with Austrocedrus chilensis mortality in Patagonia (Argentina). Mycological Research. 111(3): 308–316.

203
A Climate Adaptation Strategy for Conservation and Management of Yellow-Cedar in Alaska
Griffin, J.R.; Critchfield, W.B. 1972. The distribution of forest trees in California. Res. Pap. PSW-RP-82. Berkeley, CA: U.S. Department of Agriculture, Forest Service, Pacific Southwest Forest and Range Experiment Station. 60 p.
Grossnickle, S.C.; Russell, J.H. 1990. Water movement in yellow-cedar seedlings and rooted cuttings: comparison of plant and root system pressurization methods. Tree Physiology. 6: 57–68.
Grossnickle, S.C.; Russell, J.H. 1991. Gas exchange processes of yellow-cedar (Chamaecyparis nootkatensis) in response to environmental variables. Canadian Journal of Botany. 69: 2684–2691.
Grossnickle, S.C.; Russell, J.H. 1996. Changes in shoot water relations parameters of yellow-cedar (Chamaecyparis nootkatensis) in response to environmental conditions. Canadian Journal of Botany. 74: 31–39.
Grossnickle, S.G.; Russell, J.H. 2006. Yellow-cedar and western redcedar ecophysiological response to fall, winter and early spring temperature conditions. Annals of Forest Science. 63: 1–8.
Grossnickle, S.C.; Russell, J.H. 2010. Ecophysiological processes of western redcedar (Thuja plicata) and yellow-cedar (Callitropsis nootkatensis). In: Harrington, C.A., tech. coord. A tale of two cedars: international symposium on western redcedar and yellow-cedar. Gen. Tech. Rep. PNW-GTR-828. Portland, OR: U.S. Department of Agriculture, Forest Service, Pacific Northwest Research Station: 33–36.
Guichoux, E.; Lagache, L.; Wagner, S.; Chaumeil, P.; Léger, P.; Lepais, O.; Lepoittevin, C.; Malausa, T.; Revardel, E.; Salin, F.; Petit, R.J. 2011. Current trends in microsatellite genotyping. Molecular Ecology. 11: 591–611.
Gunnar, K. 1992. Native timber harvest in southeast Alaska. Gen. Tech. Rep. PNW-GTR-284. Portland, OR: U.S. Department of Agriculture, Forest Service, Pacific Northwest Research Station. 48 p.
Hak, O.; Russell, J.H. 2004. Environmental effects on yellow-cedar pollen quality. Forest Genetics Council of British Columbia Extension Note 5, ISBN 0-7726-5336-4. 9 p.
Hamm, P.B.; Hansen, E.M.; Hennon, P.E.; Shaw, C.G., III. 1988. Pythium species from forest and muskeg areas of southeast Alaska. Transactions of the British Mycological Society. 91: 385–388.

204
GENERAL TECHNICAL REPORT PNW-GTR-917
Hamrick, J.L.; Godt, M.J.W.; Sherman-Broyles, S.L. 1992. Factors influencing levels of genetic diversity in woody plant species. New Forests. 6: 95–124.
Hansen, E.M.; Hamm, P.B.; Hennon, P.E.; Shaw C.G., III. 1988. Phytophthora drechsleri in remote areas of southeast Alaska. Transactions of the British Mycological Society. 91: 379–388.
Harper, P. 2011. Deer management report of survey–inventory activities 1 July 2008–30 June 2010. Juneau, AK: Alaska Department of Fish and Game.
Harris, A.S. 1974. Chamaecyparis Spach, white-cedar. In: Schopmeyer, C.S., tech. coord. Seeds of woody plants in the United States. Agric. Handb. 450. Washington, DC: U.S. Department of Agriculture, Forest Service: 316–320.
Harris, A.S. 1984. Alaska-cedar: an American wood. FS-224. Washington, DC: U.S. Department of Agriculture, Forest Service. 6 p.
Harris, A.S. 1990. Chamaecyparis nootkatensis (D. Don) Spach: Alaska-cedar. In: Burns, R.M.; Honkala, B.H., tech. coords. Silvics of North America. 1: Conifers. Agric. Handb. 654. Washington, DC: U.S. Department of Agriculture, Forest Service: 97–102.
Harris, A.S. 1995. Sitka spruce roots used in basketry. Tech. Pap. 4. Juneau, AK: Alaska State Museum Concepts. 8 p.
Harris, A.S. 1999. Wind in the forests of southeast Alaska and guides for reducing damage. Gen. Tech. Rep. PNW-244. Portland, OR: U.S. Department of Agriculture, Forest Service, Pacific Northwest Research Station. 63 p.
Harris, A.S.; Farr, W.A. 1974. The forest ecosystem of southeast Alaska. 7: Forest ecology and timber management. Gen. Tech. Rep. PNW-25. Portland, OR: U.S. Department of Agriculture, Forest Service, Pacific Northwest Forest and Range Experiment Station. 109 p.
Harry, D.E. 1987. Shoot elongation and growth plasticity in incense-cedar. Canadian Journal of Forest Research. 17(6): 484–489.
Hawkins, B.J. 1993. Photoperiod and night frost influence the frost hardiness of Chamaecyparis nootkatensis clones. Canadian Journal of Forest Research. 23: 1408–1414.
Hawkins, B.J.; McDonald, S.E. 1993. Photoperiod influences dehardening of Chamaecyparis nootkatensis seedlings. Canadian Journal of Forest Research. 23: 2452–2454.

205
A Climate Adaptation Strategy for Conservation and Management of Yellow-Cedar in Alaska
Hawkins, B.J.; Russell, J.H.; Arnott, J. 2001. Cold hardiness of yellow-cedar (Chamaecyparis nootkatensis (D. Don) Spach). In: Bigras, F.J.; Colombo, S.J., eds. Conifer cold hardiness. Dordrecht, Netherlands: Kluwer Academic Publishers: 531–554.
Hebda, R.J. 1983. Late-glacial and post glacial vegetation history at Bear Cove Bog, northeast Vancouver Island, British Columbia. Canadian Journal of Botany. 61: 3172–3192.
Hebda, R.J. 1997. Late Quaternary paleoecology of Brooks Peninsula. In: Hebda, R.J.; Haggarty, J.C., eds. The Brooks Peninsula: an ice age refugium on Vancouver Island. Occasional Paper 5. Victoria, BC: British Columbia Ministry of Environment, Lands, and Parks: 15-1 to 15-7.
Hebda, R.J.; Mathewes, R.W. 1984. Holocene history of cedar and native cultures on the North American Pacific Coast. Science. 225: 711–713.
Hennon, P.E. 1986. Pathological and ecological aspects of decline and mortality of Chamaecyparis nootkatensis in Southeast Alaska. Corvallis, OR: Oregon State University. 279 p. Ph.D. dissertation.
Hennon, P.E. 1990. Fungi on Chamaecyparis nootkatensis. Mycologia. 82(1): 59–66.
Hennon, P.E. 1991. Diseases, insects, and animal damage of yellow cypress. In: Lousier, J.D., ed., Proceedings of a symposium: Yellow cypress: Can we grow it? Can we sell it? FRDA Report 171. Victoria, BC: Forestry Canada; British Columbia Ministry of Forests: 36–43.
Hennon, P.E. 1992a. Ecology and silviculture of yellow-cedar in southeast Alaska: November 1992 information exchange at Sitka, Alaska. Forest Health Management Report R10-TP-24. Juneau, AK: U.S. Department of Agriculture, Forest Service, Alaska Region, State and Private Forestry Forest Health Management. 31 p.
Hennon, P.E. 1992b. Survival and growth of planted Alaska-cedar seedlings in southeast Alaska. Tree Planters’ Notes. 43(3): 60–66.
Hennon, P.E. 1995. Are heart rot fungi major factors of disturbance in gap-dynamic forests? Northwest Science. 69: 284–293.
Hennon, P.E.; D’Amore, D.V.; Schaberg, P.G.; Wittwer, D.T.; Shanely, C.S. 2012. Shifting climate, altered niche, and a dynamics conservation strategy for yellow-cedar in the North Pacific coastal rainforest. BioScience. 62(2): 147–158.

206
GENERAL TECHNICAL REPORT PNW-GTR-917
Hennon, P.; D’Amore, D.; Wittwer, D.; Johnson, A.; Schaberg, P.; Hawley, G.; Beier, C.; Sink, S.; Juday, G. 2006. Climate warming, reduced snow, and freezing injury could explain the demise of yellow-cedar in Southeast Alaska, USA. World Resource Review. 18: 427–450.
Hennon, P.E.; D’Amore, D.V.; Wittwer, D.T.; Lamb, M.B. 2010. Influence of forest canopy and snow on microclimate in a declining yellow-cedar forest of southeast Alaska. Northwest Science. 84: 73–87.
Hennon, P.E.; D’Amore, D.V.; Zeglen S.; Grainger, M. 2005. Yellow-cedar decline in the North Coast District of British Columbia. Res. Note RN-549. Portland, OR: U.S. Department of Agriculture, Forest Service, Pacific Northwest Research Station. 16 p.
Hennon, P.E.; Hansen, E.M.; Shaw, C.G., III. 1990a. Causes of basal scars on Chamaecyparis nootkatensis in southeast Alaska. Northwest Science. 64(2): 45–54.
Hennon, P.E.; Hansen, E.M.; Shaw, C.G., III. 1990b. Dynamics of decline and mortality of Chamaecyparis nootkatensis in southeast Alaska. Canadian Journal of Botany. 68: 651–662.
Hennon, P.E.; McClellan, M.H. 2003. Tree mortality and forest structure in temperate rain forests of southeast Alaska. Canadian Journal of Forest Research. 33: 1621–1634.
Hennon, P.E.; McClellan, M.H.; Palkovic, P. 2002. Comparing deterioration and ecosystem function of decay-resistant and decay-susceptible species of dead trees. In: Laudenslayer, W.F., Jr.; Shea, P.J.; Valentine, B.E.; Weatherspoon, C.P.; Lisle, T.E., eds. Proceedings of the symposium on the ecology and management of dead wood in western forests. Gen. Tech. Rep. PSW-GTR-181. Albany, CA: U.S. Department of Agriculture, Forest Service, Pacific Southwest Research Station: 435–444.
Hennon, P.E.; McClellan, M.H.; Spores, S.R; Orlikowska, E.H. 2009. Survival and growth of planted yellow-cedar seedlings and rooted cuttings (stecklings) near Ketchikan. Western Journal of Applied Forestry. 24(3): 144–150.
Hennon, P.E.; McWilliams, M.G. 1999. Decline symptoms do not develop with grafting from dying yellow-cedar. Canadian Journal of Forest Research. 29: 1985–1988.

207
A Climate Adaptation Strategy for Conservation and Management of Yellow-Cedar in Alaska
Hennon, P.E.; Newcomb, G.B.; Shaw, C.G., III; Hansen, E.M. 1986. Nematodes associated with dying Chamaecyparis nootkatensis in southeastern Alaska. Plant Disease. 70: 352.
Hennon, P.E.; Shaw, C.G., III. 1994. Did climatic warming trigger the onset and development of yellow-cedar decline in southeast Alaska? European Journal of Forest Pathology. 24: 399–418.
Hennon, P.E.; Shaw, C.G., III. 1997. The enigma of yellow-cedar decline: What is killing these long-lived, defensive trees? Journal of Forestry. 95 (12): 4–10.
Hennon, P.E.; Shaw, C.G., III; Hansen, E.M. 1990c. Dating decline and mortality of Chamaecyparis nootkatensis in southeast Alaska. Forest Science. 36: 502–515.
Hennon, P.E.; Shaw C.G., III; Hansen, E.M. 1990d. Symptoms and fungal associations of declining Chamaecyparis nootkatensis in southeast Alaska. Plant Disease. 74: 267–273.
Hennon, P.E.; Trummer, L.M. 2001. Yellow-cedar (Chamaecyparis nootkatensis) at the northwest limits of its range in Prince William Sound, Alaska. Northwest Science. 75: 61–72.
Hennon, P.E.; Wittwer, D.; Stevens, J.; Kilborn, K. 2000. Pattern of deterioration and recovery of wood from dead yellow-cedar in southeast Alaska. Western Journal of Applied Forestry. 15: 49–58.
Hennon, P.E.; Wittwer, D.T. 2013. Evaluating key landscape features of a climate-induced forest decline. In: Potter, K.M.; Conkling, B.L., eds. Forest health monitoring: national status, trends, and analysis. Asheville, NC: U.S. Department of Agriculture, Forest Service, Southern Research Station: 117–122.
Hennon, P.; Woodward, B.; Lebow, P. 2007. Deterioration of wood from live and dead Alaska yellow-cedar in contact with soil. Forest Products Journal. 57(6): 23–30.
Heusser, C.J. 1952. Pollen profiles from southeastern Alaska. Ecological Monographs. 22: 331–352.
Heusser, C.J. 1960. Late-Pleistocene environments of North Pacific North America. Special Publ. 35. New York: American Geographical Society. 308 p.
Heusser, C.J.; Heusser, L.E.; Peteet, D.M. 1985. Late-Quaternary climatic change on the American North Pacific coast. Nature. 315: 485–487.

208
GENERAL TECHNICAL REPORT PNW-GTR-917
Holsten, E., Hennon; P.; Trummer, L.; Kruse, J.; Schultz, M.; Lundquist, J. 2009. Insects and diseases of Alaskan forests. Publ. R10-TP-140. Anchorage, AK: U.S. Department of Agriculture, Forest Service. 246 p.
Hultén, E. 1968. Flora of Alaska and neighboring territories: a manual of the vascular plants. Stanford, CA: Stanford University Press. 1008 p.
Hunt, R.S. 1976. Eriophyid mite associated with damaged yellow cypress cones. BiMonthly Research Notes. Ottawa, ON: Environment Canada, Forestry Service, Department of Fisheries and Forestry: 32(3): 1516.
Hutchison, O.K. 1968. Alaska’s forest resource. Resour. Bull. PNW-19. Juneau, AK: U.S. Department of Agriculture, Forest Service, Institute of Northern Forestry. 74 p.
Hutchison, O.K.; LaBau, V.J. 1975. The forest ecosystem of southeast Alaska: 9. Timber inventory, harvesting, marketing, and trends. Gen. Tech. Rep. PNW-GTR-034. Portland, OR: U.S. Department of Agriculture, Forest Service, Pacific Northwest Research Station. 63 p.
Intergovernmental Panel on Climate Change. 2007. Climate change 2007: synthesis report. Contribution of Working Groups I, II, and III to the Fourth Assessment Report of the Intergovernmental Panel on Climate Change. [Core Writing Team. Pachauri, R.K.; Reisinger, A., eds.]. Geneva, Switzerland. http://www.ipcc.ch/publications_and_data/publications_ipcc_fourth_assessment_report_synthesis_report.htm. (April 11, 2014).
Ishida, T.; Suga, T.; Matsuura, T. 1970. Conformation of nootkatone. Experientia. 26: 934–935.
Jacobs, D.F. 2011. Reforestation of a salvage-logged high-elevation clearcut: Engelmann spruce seedling response to tree shelters after 11 growing seasons. Western Journal of Applied Forestry. 26(2): 53–56.
Jacobs, D.F.; Steinbeck, K. 2001. Tree shelters improve the survival and growth of planted Engelmann spruce seedlings in southwestern Colorado. Western Journal of Forestry. 16(3): 114–120.
Jennings, T.N.; Knaus, B.J; Alderman, K.; Hennon, P.E.; D’Amore, D.V.; Cronn, R. 2013. Microsatellite primers for the Pacific Northwest conifer Callitropsis nootkatensis. Applications in Plant Sciences. e1:1300025.
Jennings, T.N.; Knaus, B.J; Mullins, T.D.; Haig, S.M.; Cronn, R.C. 2011. Massively-parallel microsatellite development. Molecular Ecology Resources. 11: 1060–1067.

209
A Climate Adaptation Strategy for Conservation and Management of Yellow-Cedar in Alaska
Johnson, A.C.; Swanston, D.; McGee, K.E. 2000. Landslide initiation, runout, and deposition within clearcuts and old-growth forests of Alaska. Journal of American Water Resources Association. 36: 17–30.
Johnson, A.C.; Wilcock, P. 1998. Effect of root strength and soil saturation on hillslope stability in forests with natural cedar decline in headwater regions in SE Alaska. In: Haigh, M.J.; Krecek, J.; Rajwar, G.S.; Kilmartin, M.P., eds. Headwaters—water resources and soil conservation. Rotterdam, Netherlands: A.A. Balkema: 381–390.
Johnson, A.C.; Wilcock, P. 2002. Association between cedar decline and hillslope stability in mountainous regions of southeast Alaska. Geomorphology. 46: 129–142.
Johnson, E.L.; Cserjesi, A.J. 1975. Gas-liquid chromatography of some tropolone –TMS ethers. Journal of Chromatography. 107: 388.
Johnson, G.R.; Sorensen, F.C.; St Clair, J.B; Cronn, R.C. 2004. Pacific Northwest forest tree seed zones; a template for native plants? Native Plants Journal. 5: 131–140.
Jovan, S. 2011. Forest structure and function. In: Barrett, T.M.; Christensen, G.A., tech. eds. Forests of southeast and south-central Alaska, 2004–2008, five-year forest inventory and analysis report. Gen. Tech. Rep. PNW-GTR-835. Portland, OR: U.S. Department of Agriculture, Forest Service, Pacific Northwest Research Station: 33–45.
Jozsa, L.A. 1991. Yellow cypress trivia. In: Lousier, J.D., ed. Proceedings of a symposium: Yellow cypress: Can we grow it? Can we sell it? FRDA Rep. 171. Victoria, BC: Forestry Canada; British Columbia Ministry of Forests: 1315.
Karchesy, J.; Peralta-Cruz, J.; Khasawneh, M.; Xiong, Y.; Kelsey, R.; Manter, D.; Dolan, M.; Panella, N. 2010. In: Harrington, C.A., tech. coord. A tale of two cedars: international symposium on western redcedar and yellow-cedar. Gen. Tech. Rep. PNW-GTR-828. Portland, OR: U.S. Department of Agriculture, Forest Service, Pacific Northwest Research Station: 147.
Karlsson, B.; Pilotti, A-M.; Wiehager, A-C. 1973. The crystal structure of chanootin, a bicyclic 15 carbon tropolone. Acta Crystallographica Section B, Structural Crystallography and Crystal Chemistry. 29(6): 1209–1213.
Karlsson, I. 1974. Rooted cuttings of yellow cedar (Chamaecyparis nootkatensis [D. Don] Spach). Res. Note 66. Victoria, BC: British Columbia Forest Service. 4 p.

210
GENERAL TECHNICAL REPORT PNW-GTR-917
Karlsson, I.; Russell, J. 1989. Comparisons of yellow cypress trees of seedling and rooted cutting origins after 9 and 11 years in the field. Canadian Journal of Forest Research. 20: 37–42.
Kelsey, R.G.; Hennon, P.E.; Huso, M.; Karchesy, J.J. 2005. Changes in heartwood chemistry of dead yellow-cedar trees that remain standing for 80 years or more in southeast Alaska. Journal of Chemical Ecology. 31: 2653–2670.
Kiilsgaard, C.; Greene, S.; Stafford, S. 1987. Nutrient concentrations in litterfall from some western conifers with special reference to calcium. Plant and Soil. 102: 223–227.
Kimmey, J. W. 1956. Cull factors for Sitka spruce, western hemlock, and western redcedar in southeast Alaska. Alaska Forest Research Station Pap. 6. Juneau, AK: U.S. Department of Agriculture, Forest Service, Alaska Forest Research Station. 31 p.
Klinka, K. 1999. Update on silvics of western redcedar and yellow-cedar. In: Wiggins, G.G., ed. Proceedings of the cedar symposium: growing western redcedar and yellow-cypress on Queen Charlotte Islands/Haida Gwaii. Victoria, BC: British Columbia Ministry of Forests: 14–28.
Klinka, K.; Lowe, L. 1975. Organic constituents of forest humus layers in the coastal western hemlock biogeoclimatic zone of British Columbia in relation to forest ecosystems. Res. Note 74. Victoria, BC: British Columbia Forest Service, Research Division.
Klinka, K.; Worrall, J.; Skoda, L.; Varga, P. 2000. The distribution and synopsis of ecological and silvical characteristics of tree species of British Columbia’s forests. Coquitlam, BC: Canadian Cartographics Ltd. 180 p.
Kotyk, M.E.A.; Basinger, J.F.; McIver, E.E. 2003. Early Tertiary Chamaecyparis Spach from Axel Heiberg Island, Canadian high arctic. Canadian Journal of Botany. 81: 113–130.
Krajina, V. 1969. Ecology of Western North America. 1: Ecology of forest trees in British Columbia. Vancouver, BC: University of British Columbia. 146 p.
Kranabetter, J.; Banner, A.; Shaw, J. 2003. Growth and nutrition of three conifer species across site gradients of north coastal British Columbia. Canadian Journal of Forest Research. 33: 313–324.

211
A Climate Adaptation Strategy for Conservation and Management of Yellow-Cedar in Alaska
Krist, F.J., Jr.; Ellenwood, J.R.; Woods, M.E.; McMahan, A.J.; Cowardin, J.P.; Ryerson, D.E.; Sapio, F.J.; Zweifler, M.O.; Romero, S.A. 2014. 2013-2027 National insect and disease forest risk assessment. FHTET-14–01. Fort Collins, CO: U.S. Department of Agriculture, Forest Service, Forest Health Technology Enterprise Team. 199 p.
Lance, E.W.; Cook, J.A. 1998. Biogeography of tundra voles (Microtus oeconomus) of Beringia and the southeast coast of Alaska. Journal of Mammalogy. 79: 53–65.
Lane, C.L. 1998. Log export and import restrictions of the U.S. Pacific Northwest and British Columbia: past and present. Gen. Tech. Rep. PNW-GTR-436. Portland, OR: U.S. Department of Agriculture, Forest Service, Pacific Northwest Research Station: 23–26.
Langlet, O. 1971. Two hundred years genecology. Taxon. 20: 653–722.
Laroque, C.P.; Smith, D.J. 1999. Tree ring analysis of yellow-cedar (Chamaecyparis nootkatensis) on Vancouver Island, British Columbia. Canadian Journal of Forest Research. 29: 115–123.
Lazarova, G.; Zeng, Y.; Kermode, A.R. 2002. Cloning and expression of an ABSCISIC ACID-INSENSITIVE 3 (ABI3) gene homologue of yellow-cedar (Chamaecyparis nootkatensis). Journal of Experimental Botany. 53(371): 1219–1221.
Ledig, F.T.; Vargas-Hernandez, J.J.; Johnsen, K.H. 1998. The conservation of forest genetic resources: case histories from Canada, Mexico and the United States. Journal of Forestry. 96: 32–41.
Lertzman, K.P.; Krebs. C.J. 1991. Gap-phase structure of a subalpine old-growth forest. Canadian Journal of Forest Research. 21: 1730–1741.
Lesher, R.D.; Henderson, J.A. 2010. Ecology and distribution of western redcedar and Alaska yellow-cedar in northwestern Washington. In: Harrington, C.A., tech. coord. A tale of two cedars: international symposium on western redcedar and yellow-cedar. Gen. Tech. Rep. PNW-GTR-828. Portland, OR. U.S. Department of Agriculture, Forest Service, Pacific Northwest Research Station: 13–18.
Leslie, A.B.; Beaulieu, J.M.; Rai, H.S.; Crane, P.R.; Donoghue, M.J.; Mathews, S. 2012. Hemisphere-scale differences in conifer evolutionary dynamics. Proceedings of the National Academy of Sciences U.S.A. 109: 16217–16221.

212
GENERAL TECHNICAL REPORT PNW-GTR-917
Leslie, S.; Winney, B.; Hellenthal, G.; Davison, D.; Boumertit, A.; Day, T.; Hutnik, K.; Royrvik, E.C.; Cunliffe, B.; Wellcome Trust Case Control Consortium 2; International Multiple Sclerosis Genetics Consortium; Lawson, D.J.; Falush, D.; Freeman, C.; Pirinen, M.; Myers, S.; Robinson, M.; Donnelly, P.; Bodmer, W. 2015. The fine-scale genetic structure of the British population. Nature. 519(7543): 309–314.
Little, D.P. 2006. Evolution and circumscription of the true cypresses (Cupressaceae: Cupresssus). Systematic Botany. 31: 461–480.
Little, D.P.; Schwarzbach, A.E.; Adams, R.P.; Hsieh, C.F. 2004. The circumscription and phylogenetic relationships of Callitropsis and the newly described genus Xanthocyparis (Cupressaceae). American Journal of Botany. 91: 1872–1881.
Little, E.L., Jr. 1971. Atlas of United States trees. 1. Conifers and important hardwoods. Misc. Publ. 1146. Washington, DC: U.S. Department of Agriculture, Forest Service. 9 p. 200 maps.
Little, E.L., Jr. 1979. Checklist of United States trees (native and naturalized). Agric. Handb. 541. Washington, DC: U.S. Department of Agriculture, Forest Service. 375 p.
Luomajoki, A. 1977. Effects of temperature on spermatophyte male meiosis. Heredity. 85: 33–48.
Manion, P.D.; Lachance, D. 1992. Forest decline concepts. St. Paul, MN: American Phytopathological Society Press. 249 p.
Manter, D.K.; Karchesy J.J.; Kelsey, R.G. 2006. The sporicidal activity of yellow-cedar heartwood, essential oil and wood constituents towards Phytophthora ramorum in culture. Forest Pathology. 36: 297–308.
Mantua N. 2011. The Pacific Decadal Oscillation. November 18. http:// www.atmos.washington.edu/~mantua/REPORTS/PDO/PDO_egec.htm. (June 20, 2015).
Mao, K.; Hao, G.; Liu, J.; Adams, R.P.; Milne, R.I. 2010. Diversification and biogeography of Juniperus (Cupressaceae): variable diversification rates and multiple intercontinental dispersals. New Phytologist. 188: 254–272.
Mao, K.; Milne, R. I.; Zhang, L.; Peng, Y.; Liu, J.; Thomas, P.; Renner, S.S. 2012. Distribution of living Cupressaceae reflects the breakup of Pangea. Proceedings of the National Academy of Sciences. 109: 7793–7798.

213
A Climate Adaptation Strategy for Conservation and Management of Yellow-Cedar in Alaska
Mars, J.N.; Norman, L. R. 1973. Synthesis of gamma acoradiene (alpha alaskene) and delta acoradiene. Tetrahedron Letters. 44: 4375–4378.
Marschner, H. 2002. Mineral nutrition of higher plants. 2nd ed. London: Academic Press. 651 p.
Martin, J.L.; Baltzinger, C. 2002. Interaction among deer browsing, hunting, and tree regeneration. Canadian Journal of Forest Research. 32: 1254–1264.
Martin, J.R.; Trull, S.J.; Brady, W.W.; West, R.A.; Downs, J.M. 1995. Forest plant association management guide: Chatham Area, Tongass National Forest. R10-TP-57. Juneau, AK: U.S. Department of Agriculture, Forest Service, Alaska Region. 325 p.
Marx, J.N.; Norman, L.R. 1973. Synthesis of gamma acoradiene (alpha alaskene) and delta acoradiene. Tetrahedron Letters. 44: 4375–4378.
Massah, N.; Wang, J.; Russell, J.H.; Van Niejenhuis, A.; El-Kassaby, Y.A. 2010. Genealogical relationship among members of selection and production populations of yellow-cedar (Callitropsis nootkatensis [D. Don] Oerst.) in the absence of parental information. Journal of Heredity. 101: 154–163.
Mathewes, R.W.; Heusser, L.E. 1981. A 12,000 year palynological record of temperature and precipitation trends in southwestern British Columbia. Canadian Journal of Botany. 59: 707–710.
McClellan, M.H. 2004. Development of silvicultural systems for maintaining old-growth conditions in the temperate rainforest of southeast Alaska. Forest Snow and Landscape Research. 78: 173–190.
McDonald, K.A.; Hennon, P.E.; Stevens, J.H.; Green, D.W. 1997. Mechanical properties of salvaged dead yellow-cedar in southeast Alaska. Res. Pap. FPL-RP-565. Madison, WI: U.S. Department of Agriculture, Forest Service, Forest Products Laboratory. 9 p.
McKane, R.B.; Johnson, L.C.; Shaver, G.R.; Nadelhoffer, K.J.; Rastetter, E.B.; Fry, B.; Giblin, A.E.; Kielland, K.; Kwiatkowski, B.L.; Laundre, J.A.; Murray, G. 2002. Resource-based niches provide a basis for plant species diversity and dominance in arctic tundra. Nature. 415: 68–71.
Meehl, G.A.; Tebaldi, C.; Nychka, D. 2004. Changes in frost days in simulations of 21st century climate. Climate Dynamics. 23: 495–511.

214
GENERAL TECHNICAL REPORT PNW-GTR-917
Melillo, J.M.; Richmond, T.C.; Yohe, G.W., eds. 2014. Climate change impacts in the United States: the third National Climate Assessment. Washington, DC: U.S. Global Change Research Program. 841 p. doi:10.7930/J0Z31WJ2.
Mill, R.R.; Farjon, A. 2006. Proposal to conserve the name Xanthocyparis against Callitropsis Öerst. (Cuppressaceae). Taxon. 55: 229–231.
Millar, C.I.; Marshall, K.A. 1991. Allozyme variation in Port-Orford-cedar (Chamaecyparis lawsoniana): implications for genetic conservation. Forest Science. 37(4): 1060–1077.
Millar, C.I.; Stephenson, N.; Stephens, S.L. 2007. Climate change and forests of the future: managing in the face of uncertainty. Ecological Applications. 17: 2145–2151.
Minore, D. 1983. Western redcedar: a literature review. Gen. Tech. Rep. PNW-150. Portland, OR: U.S. Department of Agriculture, Forest Service, Pacific Northwest Forest and Range Experiment Station. 70 p.
Mitchell, A.K.; Kippenaal, R. 2006. Outplanting performance of western redcedar, yellow-cedar and Douglas-fir in montane alternative silvicultural systems (MASS). Technology Transfer Note 34. Victoria, BC: Natural Resources Canada, Canadian Forest Service, Pacific Forestry Centre. 4 p.
Mitton, J.B.; Sturgeon, K.B. 1982. Bark beetles in North American conifers: a system for the study of evolutionary biology. Austin, TX: University of Texas Press. 527 p.
Moore, I.D.; Grayson, R.B.; Ladson, A.R. 1991. Digital terrain modelling: a review of hydrological, geomorphological, and biological applications. Hydrological Processes. 5: 3–30.
Morales-Ramos, J.A.; Rojas, M.G.; Hennon, P.E. 2003. Black-staining fungus effects on the natural resistance properties of Alaskan yellow cedar to the Formosan subterranean termite (Isoptera: Rhinotermitidae). Environmental Entomology. 32: 1234–1241.
Muir, J. 1882. Letter of Prof. Muir. In: U.S. Navy Department. Reports of Captain L.A. Beardslee, U.S. Navy, relative to affairs in Alaska, and the operations of the U.S.S. Jamestown under his command, while in the waters of that territory. Exec. Doc. 71. Washington, DC: Government Printing Office: 192.
Muirhead, C.A.; Lande, R. 1997. Inbreeding depression under joint selfing, outcrossing, and asexuality. Evolution. 51: 1409–1415.

215
A Climate Adaptation Strategy for Conservation and Management of Yellow-Cedar in Alaska
Multi-Resolution Land Characteristics Consortium. 2015. National Land Cover Database 2001. 2011 ed. http://www.mrlc.gov/nlcd01_data.php. (June 9, 2015).
Mulvey, R.L.; Graham, E.E.; Hennon, P.E.; Cleaver, C. 2013. Forest health assessment of yellow-cedar mortality and dieback on Zarembo Island. Forest Health Protection Biological Evaluation, August 2013. Juneau, AK: U.S. Department of Agriculture, Forest Service, Alaska Region.
Murray, M.D. 2010. The natural range of yellow-cedar: a photographic tour of diverse locations. In: Harrington, C.A., tech. coord. A tale of two cedars—international symposium on western redcedar and yellow-cedar. Gen. Tech. Rep. PNW-GTR-828. Portland, OR: U.S. Department of Agriculture, Forest Service, Pacific Northwest Research Station: 149–152.
National Forest Management Act of 1976 [NFMA]; Act of October 22, 1976; 16 U.S.C. 1600.
Neiland, B.J. 1971. The forest-bog complex in southeast Alaska. Vegetatio. 22: 1–63.
Nolte, D. 1999. Behavioral approaches for limiting depredation by wild ungulates. In: Launchbaugh, K.L.; Sanders, D.; Mosely, J.C., eds. Grazing behavior of livestock and wildlife. Moscow, ID: University of Idaho: 60-69.
Norin, T. 1964. The chemistry of the natural order Cupressales. Part 50. The absolute configurations of chamic, chaminic, and isochamic acids. Arkiv för Kemi (Stockholm). 22: 123–128.
Norin, T.; Stomberg, S.; Weber, M. 1982. Conformation of the bicyclo 4.1.0 hept-2-ene system: configuration and conformation of chamic-acid (trans-car-4-ene-10-oic acid). Chemica Scripta. 20: 49–52.
Nowacki, G.; Krosse, P.; Fisher, G.G.; Brew, D.; Brock, T.; Shephard, M.; Pawuk, W.; Baichtal, J.; Kissinger, E. 2001. Ecological subsections of southeast Alaska and neighboring areas of Canada. Tech. Publ. R10-TP-75. Anchorage, AK: U.S. Department of Agriculture, Forest Service, Alaska Region. 306 p.
Oakes, L.; Hennon, P.; O’Hara, K.; Dirzo, R. 2014. Long-term changes in a temperate forest impacted by climate change. Ecosphere. 5(135): 1–28.
Oakes, L.; Hennon, P.E.; Ardoin, N.M.; D’Amore, D.V.; Ferguson, E.; Steel, A.; Wittwer, D.T.; Lambin, E.F. 2015. Conservation in a Social-Ecological System Experiencing Climate-Induced Tree Mortality. Biological Conservation. 192: 276–285.
216
GENERAL TECHNICAL REPORT PNW-GTR-917
O’Connell, L.M.; Ritland, K.; Thompson, S.L. 2008. Patterns of post-glacial colonization by western redcedar (Thuja plicata, Cupressaceae) as revealed by microsatellite markers. Botany. 86: 194–203.
Odom, H.C., Jr.; Pinder, A.R. 1972. Synthetic experiments in the eremophilane sesquiterpene group: synthesis of racemic 7 epi nootkatone and partial synthesis of valerianol: the structure of nardostachone. Journal of the Chemical Society Perkin Transactions. 1: 2193–2197.
Oersted, A.S. 1864. Bidrag til Naaletraeernes Morphologi, Videnskabelige Meddelelser fra Dansk Naturhistorisk Forening I Kjobenhavn [Contributions to the morphology of conifers, contributions to the Natural History Society of Copenhagen]. Series 2. 6: 1–36.
Ohmann, J.L.; Gregory, M.J. 2002. Predictive mapping of forest composition and structure with direct gradient analysis and nearest neighbor imputation in coastal Oregon, USA. Canadian Journal of Forest Research. 32: 725–741.
O’Neill, G.A.; Hamann, A.; Wang, T. 2008. Accounting for population variation improves estimates of the impact of climate change on species’ growth and distribution. Journal of Applied Ecology. 45: 1040–1049.
Owens, J.N.; Molder M. 1975. Pollination, female gametophyte, and embryo and seed development in yellow cedar (Chamaecyparis nootkatensis). Canadian Journal of Botany. 53: 186–199.
Owens, J.N.; Molder, M. 1977. Cone induction in yellow cypress (Chamaecyparis nootkatensis) by gibberellin A3 and the subsequent development of seeds within the induced cones. Canadian Journal of Forest Research. 7: 605–613.
Owens, J.N.; Molder, M. 1984. The reproductive cycles of western redcedar and yellow-cedar. Victoria, BC: British Columbia Ministry of Forests, Information Service Branch. 28 p.
Panella, N.A.; Dolan, M.C.; Karchesy, J.J.; Xiong, Y., Peralta-Cruz, J.; Khasawneh, M.; Maupin, G.O. 2005. Use of novel compounds for pest control: insecticidal and acaricidal activity of essential oil components from heartwood of Alaska yellow cedar. Journal of Medical Entomology. 42: 352–358.
Panella, N.A.; Karchesy, J.; Maupin, G. O.; Malan, J. C. S.; Piesman, J. 1997. Susceptibility of immature Ixodes scapularis (Acari: Ixodidae) to plant-derived acaricides. Journal of Medical Entomology. 34: 340–345.

217
A Climate Adaptation Strategy for Conservation and Management of Yellow-Cedar in Alaska
Pawuk, W.H. 1993. Germination of Alaska-cedar from seed. Tree Planters’ Notes. 44(1): 21–24.
Pawuk, W.H.; Kissinger, E. 1989. Preliminary forest plant associations: Stikine Area, Tongass National Forest. Tech. Pap. R10-TP-72. Juneau, AK: U.S. Department of Agriculture, Forest Service, Alaska Region. 126 p.
Pearson, R.G.; Dawson, T.P. 2003. Predicting the impacts of climate change on the distribution of species: Are bioclimate envelope models useful? Global Ecology and Biogeography. 12: 361–371.
Perry, R.S. 1954. Yellow cedar: its characteristics, properties, and uses. For. Br. Bull. 114. Ottawa, ON: Canadian Department of Northern Affairs and Natural Resources. 19 p.
Person, D. 2009. Habitat use and survivorship of Sitka black-tailed deer in Southeast Alaska: a regional meta-analysis and synthesis. Federal aid annual research performance report. Juneau, AK: Alaska Department of Fish and Game, Division of Wildlife Conservation. 13 p. http://www.adfg.alaska.gov/static/home/library/pdfs/wildlife/research_pdfs/2.13_09_final.pdf. (July 1, 2015).
Petrof, I. 1880. The population and resources of Alaska. [From U.S. Census report of 1880.] In: U.S. Congress, Senate Committee on Military Affairs. A compilation of narratives of explorations in Alaska. 1869–1900. Washington, DC: Government Printing Office: 145–147.
Pinchot, G. 1907. Yellow cedar, Chamaecyparis nootkatensis (Lamb) Spach. Silvical Leaflet 12. Washington, DC: U.S. Department of Agriculture, Forest Service. 2 p.
Pojar, J.; Klinka, K.; Meidinger, D.V. 1987. Biogeoclimatic ecosystem classification in British Columbia. Forest Ecology and Management. 22: 119–154.
Prescott, C.; Preston, C. 1994. Nitrogen mineralization and decomposition in forest floors in adjacent plantations of western redcedar, western hemlock, and Douglas-fir. Canadian Journal of Forest Research. 24: 2424–2431.
Puttonen, P.; Arnott, J.T. 1994. Influence of photoperiod and temperature on growth, gas exchange, and cold hardiness of yellow cypress stecklings. Canadian Journal of Forest Research. 24: 1608–1616.
Quinn, P.; Beven, K.; Chevallier, P.; Planchon. O. 1991. The prediction of hillslope paths for distributed hydrological modelling using digital terrain models. Hydrological Processes 5: 59–79.

218
GENERAL TECHNICAL REPORT PNW-GTR-917
Radis, C. 2014. Understory plant response to yellow-cedar decline: an exploration of nutrient uptake and availability. Stanford, CA: Stanford University. 26 p. Undergraduate thesis.
Radwan, M.A.; Harrington, C.A. 1986. Foliar chemical concentrations, growth, and site productivity relations in western red cedar. Canadian Journal of Forest Research. 16(5): 1069–1075.
Raimondi, N.; Kermode, A.R. 2004. Seedling growth and establishment in natural stands of yellow-cedar (Chamaecyparis nootkatensis) seedlings derived from the use of modified seed dormancy-breaking treatments. New Forests. 27: 55–67.
Randall, W.K.; Berrang, P. 2002. Washington tree seed transfer zones. Olympia, WA: Washington Department of Natural Resources. 63 p.
Rehfeldt, G.E. 1991. A model of genetic variation of Pinus ponderosa in the Inland Northwest (U.S.A.): applications in gene resource management. Canadian Journal of Forest Research. 21: 1491–1500.
Ren, C.; Kermode, A.R. 1999. Analyses to determine the role of the megagametophyte and other seed tissues in dormancy maintenance of yellow cedar (Chamaecyparis nootkatensis) seeds: morphological, cellular and physiological changes following moist chilling and during germination. Journal of Experimental Botany. 50: 1403–1419.
Rennerfelt, E.; Nacht, G. 1955. The fungicidal activity of some constituents from heartwood of conifers. Svensk Botanisk Tidskrift. 49: 419–432.
Richards, B.N. 1987. The microbiology of terrestrial ecosystems. Essex, UK: Longman Group. 399 p.
Ritland, C.; Pape, T.; Ritland, K. 2001. Genetic structure of yellow cedar (Chamaecyparis nootkatensis). Canadian Journal of Botany. 79: 822–828.
Robertson, C.S. 2011. Dendrochronology of yellow cedar (Callitropsis nootkatensis) in the Pacific Northwest of North America. Bellingham, WA: Western Washington University. 35 p. m.s. thesis.
Russell, J.H. 1993. Genetic architecture, genecology and phenotypic plasticity in seed and seedling traits of yellow-cedar. Vancouver, BC: University of British Columbia. 184 p. PhD dissertation.

219
A Climate Adaptation Strategy for Conservation and Management of Yellow-Cedar in Alaska
Russell, J.H. 2008. Deployment of deer-resistant western redcedar (Thuja plicata). In: Dumroese R.K.; Riley L.E., tech. coords. National proceedings: Forest and Conservation Nursery Associations—2007. Proc. RMRS-P-57. Fort Collins, CO: U.S. Department of Agriculture, Forest Service, Rocky Mountain Research Station: 149–153.
Russell, J.H.; Costa e Silva, J.; Baltunis, B.S. 2015. Multisite parameter estimates from a Callitropsis nootkatensis diallel study with clonally replicated progeny. Canadian Journal of Forest Research. 45: 689–697.
Russell, J.H.; Krakowski, J. 2012. Geographic variation and adaptation to current and future climates of Callitropsis nootkatensis populations. Canadian Journal of Forest Research. 42: 2118–2129.
Ruth, R.H.; Harris, A.S. 1979. Management of western hemlock-Sitka spruce forests for timber production. Gen. Tech. Rep. PNW-88. Portland, OR: U.S. Department of Agriculture, Forest Service, Pacific Northwest Forest and Range Experiment Station. 197 p.
Sakai, A.; Larcher, W. 1987. Frost survival in plants: responses and adaptation to freezing stress. Berlin: Springer-Verlag. 321 p.
Schaberg, P.G.; D’Amore, D.V.; Hennon, P.E.; Halman, J.M.; Hawley, G.J. 2011. Do limited cold tolerance and shallow depth roots contribute to yellow-cedar decline? Forest Ecology and Management. 262: 2142–2150.
Schaberg, P.G.; Hennon, P.E.; D’Amore, D.V.; Hawley, G.J. 2008. Influence of simulated snow cover on the cold tolerance and freezing injury of yellow-cedar seedlings. Global Change Biology. 14: 1–12.
Schaberg, P.G.; Hennon, P.E.; D’Amore, D.V.; Hawley G.J.; Borer, C.H. 2005. Seasonal differences in freezing tolerance of yellow-cedar and western hemlock trees at a site affected by yellow-cedar decline. Canadian Journal of Forest Research. 35: 2065–2070.
Schmitz, N.; Abrams, S.R.; Kermode, A.R. 2002. Changes in ABA turnover and sensitivity that accompany dormancy termination of yellow-cedar (Chamaecyparis nootkatensis) seeds. Journal of Experimental Botany. 53: 89–101.
Shaw, C.G., III; Eglitis, A.; Laurent, T.H.; Hennon, P.E. 1985. Decline and mortality of Chamaecyparis nootkatensis in southeastern Alaska, a problem of long duration but unknown cause. Plant Disease. 69: 13–17.

220
GENERAL TECHNICAL REPORT PNW-GTR-917
Smith, D.R.; Schiff, N.M. 2002. A review of the siricid woodwasps and their ibaliid parasitoids (Hymenoptera: Siricidae, Ibaliidae) in the eastern United States, with emphasis on the mid-Atlantic region. Proceedings of the Entomological Society of Washington. 104: 174–194.
Smith, I.M. 1977. Two new species of Trisetacus (Prostigmata: Eriophyoidea) associated with Cupressaceae. Canadian Entomologist. 109: 843–847.
Smith, R.S. 1970. Black stain in yellow cedar heartwood. Canadian Journal of Botany. 48: 1731–1739.
Soil Survey Division Staff. 1993. Soil survey manual. Agric. Handb. 18. Washington, DC: U.S. Department of Agriculture, Soil Conservation Service.
Spach, É. 1842. Histoire Naturelle des Végétaux. Phanérogames. Paris: Librairie Encyclopédique De Roret. XI: 303–305, 329–333.
Stan, A.B.; Maertens, T.B.; Daniels, L.D.; Zeglen, S. 2011. Reconstructing population dynamics of yellow-cedar in declining stands: baseline information from tree rings. Journal of Tree-Ring Research. 67: 13–25.
St Clair, J.B.; Howe, G.T. 2007. Genetic maladaptation of coastal Douglas-fir seedlings to future climates. Global Change Biology. 13: 1441–1454.
St Clair, J.B.; Mandel, N.L.; Vance-Borland, K.W. 2005. Genecology of Douglas-fir in western Oregon and Washington. Annals of Botany. 96: 1199–1214.
Sturrock, R.N.; Pellow, K.W.; Hennon, P.E. 2010. Phellinus weirii and other fungi causing decay in western redcedar and yellow-cedar. In: Harrington, C.A., tech. coord. A tale of two cedars: international symposium on western redcedar and yellow-cedar. Gen. Tech. Rep. PNW-GTR-828. Portland, OR: U.S. Department of Agriculture, Forest Service, Pacific Northwest Research Station: 47–52.
Sudworth, G.B. 1908. Forest trees of the Pacific Slope. Washington, DC: U.S. Department of Agriculture, Forest Service. 441 p.
Swanston, D. N.; Howes, D. E. 1994. Slope movement processes and characteristics. Chatwin, S.C.; Howes, D.E.; Schwab, J.W.; Swanston, D.N., eds. A guide for management of landslide prone terrain in the Pacific Northwest. Land Management Handbook 18. Vancouver, BC: British Columbia Ministry of Forests: 1–17.

221
A Climate Adaptation Strategy for Conservation and Management of Yellow-Cedar in Alaska
Taylor, T.N.; Taylor, E.L. 1993. The biology and evolution of fossil plants. 2nd ed. New Jersey: Prentice Hall. 982 p.
Thompson, S.L.; Bérubé, Y.; Bruneau, A.; Ritland, K. 2008. Three-gene identity coefficients demonstrate that clonal reproduction promotes inbreeding and spatial relatedness in yellow-cedar, Callitropsis nootkatensis. Evolution. 62: 2570–2579.
Tillman, P.; Glick, P. 2013. Climate change effects and adaptation approaches for terrestrial ecosystems, habitats, and species: a compilation of the scientific literature for the North Pacific Landscape Conservation Cooperative Region. National Wildlife Federation. http://www.nwf.org/~/media/PDFs/Global-Warming/2014/Terrestrial-Report/CC-and-Terrestrial-Systems_Final-Report_NPLCC-NWF_online-size.pdf. (June 30, 2015).
Tongass Timber Reform Act of 1990; Act of November 28, 1990; 104 Stat. 4426; Public Law 101–626; 16 U.S.C. 539d (note).
Trent, A.; Nolte, D.; Wagner, K. 2001. Comparison of commercial deer repellents. Timber Tech Tips 0124-2331-MTDC. Missoula, MT: U.S. Department of Agriculture, Forest Service, Missoula Technology and Development Center. 6 p.
Turner, D.; Franz, E. 1985. The influence of western hemlock and western redcedar on microbial numbers, nitrogen mineralization and nitrification. Plant and Soil. 88: 259–263.
Turner, N.J. 1979. Plants in British Columbia Indian technology. Handb. 38. Victoria, BC: British Columbia Provincial Museum. 304 p.
Turner, N.J.; Efrat, B.S. 1982. Ethnobotany of the Hesquiat Indians of Vancouver Island. Cultural Recovery Paper 2. Victoria, BC: British Columbia Provincial Museum. 99 p.
Ugolini, F.C.; Mann, D.H. 1979. Biopedological origin of peatlands in southeast Alaska. Nature. 28: 366–368.
University of Alaska Fairbanks. 2015. Scenarios Network for Alaska + Arctic Planning home page. http://www.snap.uaf.edu/. (June 9, 2015).
University of Alberta. 2015. 1000 plants. http://www.onekp.com/. (May 18, 2015).
University of Victoria, Pacific Climate Impacts Consortium [PCIC]. 2013. Home page. http://www.pacificclimate.org/. (June 9, 2015).
University of Victoria, Pacific Climate Impacts Consortium [PCIC]. 2014. Statistically downscaled climate scenarios. http://www.pacificclimate.org/data/statistically-downscaled-climate-scenarios. (June 9, 2015).

222
GENERAL TECHNICAL REPORT PNW-GTR-917
U.S. Department of Agriculture, Forest Service. 1979 [USDA FS]. Tongass National Forest land and resource management plan. R10-MB-338dd. Juneau, AK: Alaska Region.
U.S. Department of Agriculture, Forest Service. 2008a [USDA FS]. Tongass National Forest land and resource management plan 2008. R10-MB-603b. Juneau, AK: Alaska Region.
U.S. Department of Agriculture, Forest Service. 2008b [USDA FS]. Tongass National Forest land and resource management plan 2008. Environmental impact statement, record of decision. R10-MB-603c. Juneau, AK: Alaska Region.
U.S. Department of Agriculture, Forest Service. 2012 [USDA FS]. Timber sale summary reports and accomplishments: summary reports: cut history 1908 to present. Alaska Region. http://www.fs.usda.gov/detail/r10/landmanagement/resourcemanagement/?cid=fsbdev2_038785. (July 2, 2015).
U.S. Department of Agriculture, Forest Service. 2014 [USDA FS]. National insect and disease risk maps 2012. Forest Health Technology Enterprise Team. http://www.fs.fed.us/foresthealth/technology/nidrm.shtml. (July 2, 2015).
U.S. Department of Agriculture, Forest Service. 2015 [USDA FS]. The Forest Planning Rule. http://www.fs.usda.gov/planningrule. (June 15, 2015).
U.S. Department of the Interior, Fish and Wildlife Service. 2009 [USFWS]. National Wetlands Inventory. www.fws.gov/wetlands/Data/Mapper.html. (July 3, 2015).
Vallejo-Marín, M.; Dorken, M.E.; Barrett, S.C.H. 2010. The ecological and evolutionary consequences of clonality for plant mating. Annual Reviews in Ecology, Evolution and Systematics. 41: 193–213.
Van Hees, W.S. 2003. Forest resources of southeast Alaska, 2000: results of a single-phase systematic sample. Res. Pap. PNW-RP-557. Portland, OR: U.S. Department of Agriculture, Forest Service, Pacific Northwest Research Station. 104 p.
Viens, R.J. 2001. Late Holocene climate change and calving glacier fluctuations along the southwestern margin of the Stikine Icefield, Alaska. Seattle, WA: University of Washington. 160 p. Ph.D. dissertation.
Viereck, L.A.; Little, E.L., Jr. 2007. Alaska trees and shrubs. 2nd ed. Fairbanks, AK: University of Alaska Press. 355 p.

223
A Climate Adaptation Strategy for Conservation and Management of Yellow-Cedar in Alaska
Voda, K.B.; Vrtacnik, M.; Pohleven, F. 2003. Effect of antifungal activity of oxygenated aromatic essential oil compounds on the white-rot Trametes versicolor and the brown-rot Coniophora puteana. International Biodeterioration and Biodegradation. 51: 51–59.
Vourc’h, G.; Russell, J.H.; Martin, J.L. 2002. Linking deer browsing and terpene production among genetic identities in Chamaecyparis nootkatensis and Thuja plicata (Cupressaceae). Journal of Heredity. 93: 370–376.
Wagner, K.K.; Nolte, D.L. 2001. Comparison of active ingredients and delivery systems in deer repellents. Wildlife Society Bulletin. 29: 322–330.
Wang, T.; Hamann, A.; Spittlehouse, D.; Murdock, T.N. 2012. ClimateWNA-High resolution spatial climate data for western North America. Journal of Applied Meteorology and Climatology. 61: 16–29. http://cfcg.forestry.ubc.ca/projects/climate-data/climatebcwna/. June 16, 2015.
Wang, T.; Hamann, A.; Spittlehouse, D.L.; Aitken, S.N. 2006. Development of scale-free climate data for western Canada use in resource management. International Journal of Climatology. 26: 383–397.
Wang, T.; O’Neill, G.A.; Aitken, S.N. 2010. Integrating environmental and genetic effects to predict responses of tree populations to climate. Ecological Applications. 20: 153–163.
Wang, W.P.; Hwang, C.Y.; Lin, T.P.; Hwang, S.Y. 2003. Historical biogeography and phylogenetic relationships of the genus Chamaecyparis (Cupressaceae) inferred from chloroplast DNA polymorphism. Plant Systematics and Evolution. 2241: 13–28.
Warner, B.G.; Mathews, R.W.; Clague, J.J. 1982. Ice-free conditions on the Queen Charlotte Islands, British Columbia, at the height of Late Wisconsin Glaciation. Science. 218: 675–677.
Warren, M.S.; Hill, J.K.; Thomas, J.A.; Asher, J.; Fox, R.; Huntley, B.; Thomas, C.D. 2001. Rapid responses of British butterflies to opposing forces of climate and habitat change. Nature. 414(6859): 65–69.
Western Regional Climate Center. 2015. Home page. http://www.wrcc.dri.edu. (June 29, 2015).
Western Wood Products Association. 2005. Design values and spans for Alaskan species lumber. TechNotes 2005-01. Portland, OR. http://www.wwpa.org. 6 p. (June 30, 2015).

224
GENERAL TECHNICAL REPORT PNW-GTR-917
Westfall J.; Ebata, T. 2009. 2008 Summary of forest health conditions in British Columbia. Pest Management Rep. 15. Victoria, BC: British Columbia Ministry of Forests and Range. 76 p.
Westfall, J.; Ebata, T. 2014. 2013 Summary of forest health conditions in British Columbia. British Columbia Pest Management Rep 15. Victoria, BC: British Columbia Ministry of Forests, Range and Natural Resource Operations. 78 p.
White, K.S.; Pendleton, G.W.; Hood, E. 2009. Effects of snow on Sitka black-tailed deer browse availability and nutritional carrying capacity in southeastern Alaska. Journal of Wildlife Management. 73: 481–487.
Whitford, H.N.; Craig, R.D. 1918. Forests of British Columbia. Ottawa, ON: Canada Commission of Conservation. 409 p.
Wiles, G.; Mennett, C.R.; Javis, S.K.; D’Arrigo, R.D.; Wiesenberg, N.; Lawson, D.E. 2012. Tree-ring investigations into changing climatic responses of yellow-cedar, Glacier Bay, Alaska. Canadian Journal of Forest Research. 42: 1–6.
Willyard, A.; Syring, J.; Gernandt, D.S.; Liston, A.; Cronn, R. 2007. Fossil calibration of molecular divergence in Pinus: inferences for ages and mutation rates. Molecular Biology and Evolution. 24(1): 90–101.
Wooton, C.E.; Klinkenberg B. 2011. A landscape level analysis of yellow-cedar decline in coastal British Columbia. Canadian Journal of Forest Research. 41: 1638–1648.
Woudenberg, S.W.; Conkling, B.L.; O’Connell, B.M.; LaPoint, E.B.; Turner, J.A.; Waddell, K.L. 2010. The Forest Inventory and Analysis database: database description and users manual version 4.0 for phase 2. Gen. Tech. Rep. RMRS-GTR-245. Fort Collins, CO: U.S. Department of Agriculture, Forest Service, Rocky Mountain Research Station. 336 p.
Wu, T.H.; McKinnell, W.P.; Swanston, D.N. 1979. Strength of tree roots and landslides on Prince of Wales Island, Alaska. Canadian Geotechnical Journal. 16: 19–33.
Yanami, T.; Miyashita, M.; Yoshikoshi, A. 1980. Synthetic study of (+) nootkatone from (-) betapinene. The Journal of Organic Chemistry. 45: 607–612.
Yang, Z.-Y.; Ran, J.-H.; Wang, X.-Q. 2012. Three genome-based phylogeny of Cupressaceae s.l.: further evidence for the evolution of gymnosperms and Southern Hemisphere biogeography. Molecular Phylogenetics and Evolution. 64: 452–470.
225
A Climate Adaptation Strategy for Conservation and Management of Yellow-Cedar in Alaska
Yeh, F.C. 1988. Isozyme variation of Thuja plicata (Cupressaceae) in British Columbia. Biochemical Systematics and Ecology. 16: 373–377.
Zhou, X.; Warren, D.D. 2012. Production, prices, employment, and trade in Northwest forest industries, all quarters 2011. Resour. Bull. PNW-RB-264. Portland, OR: U.S. Department of Agriculture, Forest Service, Pacific Northwest Research Station. 167 p.
Zielke, K.; Bancroft, B.; Byrne, K.; Mitchell, S. 2010. British Columbia timber sales windthrow manual: a compendium of information and tools for understanding, predicting and managing windthrow on the BC Coast. Report to BC timber sales. British Columbia Forest Service. https://www.for.gov.bc.ca/ftp/tch/external/!publish/ems2/supplements/TCH-BCTS-Windthrow-Manual.pdf. (July 2, 2015).
Ziller, W.G. 1974. The tree rusts of western Canada. Publ. 1329. Victoria, BC: Environment Canada, Forestry Service, Pacific Forest Research Centre. 272 p.
Zobel, D.B.; Roth, L.F.; Hawk, G.M. 1985. Ecology, pathology, and management of Port-Orford-cedar (Chamaecyparis lawsoniana). Gen. Tech. Rep. PNW-184. Portland, OR: U.S. Department of Agriculture, Forest Service, Pacific Northwest Research Station. 161 p.

226
GENERAL TECHNICAL REPORT PNW-GTR-917

227
A Climate Adaptation Strategy for Conservation and Management of Yellow-Cedar in Alaska
Overview of Yellow-Cedar Management ZonesWe divided the coastal rainforest environment around the range of yellow-cedar in Alaska into 33 geographic zones to produce a more fine-scale view of yellow-cedar’s current and expected future health status and associated prospects for conservation and management (fig. 86). Yellow-cedar’s occurrence in these zones ranges from abundant to uncommon, rare, and absent (in one zone, Seward, and another, Yakutat, where it exists only due to planting in a small area). The manage-ment zones are arranged in a sequence of northwest to southeast from the Seward and Prince William Sound area south to Dixon Entrance. For each management zone, we briefly describe the geology, climate, acreage of yellow-cedar and mapped forest decline, projections of future risk to yellow-cedar forests in three time steps, and prospects to adapt with new conservation and management measures given changing conditions. We also present a table for each management zone show-ing the relative change among the three risk categories (low, medium, and high) between time steps to describe the amount of change in predicted vulnerability for yellow-cedar through 2080. The tabular outputs are arranged by land ownership and three broad classes of land use for areas managed by the U.S. Forest Service. An accompanying figure summarizes these results in map and chart form for each management zone. The results for this evaluation are derived from the models that are outlined in section 4 of this report. The interpretation of broad-scale patterns of habitat suitability and vulnerability for yellow-cedar, and opportunities for conser-vation and management are also described in section 4.
The primary source of information for the panhandle geology and geomorphol-ogy was the ecological mapping of southeast Alaska (ECOMAP; Nowacki et al. 2001).1 South-central Alaska geomorphic information was derived from the Eco-logical Hierarchy of the Chugach National Forest (DeVelice et al. 1999).2 Coastal information was derived from U.S. Department of the Interior, U.S. Geological Survey reports and other geological and geomorphological descriptions. Climate information was obtained from the Western Regional Climate Center (2015). Data for temperature and precipitation as rain and snow were obtained from weather stations in the study area. Some stations had complete records from 1948 through
1 References in the appendixes are listed in the “Literature Cited” section of the main text. 2 Also from an unpublished administrative report: Davidson, D.F. 1996. Ecological Hier-archy of the Chugach National Forest. On file with the Chugach National Forest, Alaska Region 10, Anchorage, AK. 7 p.
Appendix 1: Local Assessments of Yellow-Cedar in Alaska

228
GENERAL TECHNICAL REPORT PNW-GTR-917
2005; others had shorter records of observation. The maximum temperature is the average of all daily maximum temperatures for each month averaged for the entire year for each year of observation at the specific station. The minimum temperature is the average of all daily minimum temperatures for each month averaged for each year of observation at each station. Therefore, the average high and low tempera-tures are the annual average of monthly observations of the maximum and mini-mum temperatures, respectively, recorded at the observation station. Precipitation is the average of all daily total precipitation values recorded for each day of the year for the period of observation at each station. Precipitation is given as the average annual total precipitation as rain. Snowfall is the annual average total measured snow at each station. These weather averages do not represent entire management areas because they are derived from single weather stations at a specific location, often at or near sea level.
For ownership and land use designation on land managed by the Forest Service, we used the following input data:
For ownership designations on Forest Service lands we used “BasicOwner-ship” data from the Forest Service’s fundamental land survey, the Automated Lands Program (ALP); we also used land status information. For lands outside the extent of ALP, primarily the Haines and National Park Service zones, ownership is informed by the State of Alaska’s “General Land Status,” containing owner-ship records at the Public Land Survey System section level Clipped to 1:63,360 Coastline.
For land use designations, we first categorized all lands occurring in the ALP “RegulatedUse” layer as restricted. These designations include National Forest System land parcels that have management or use limits placed on them by legal authority. Examples are National Wilderness Area, National Recreation Area, and National Monument. Additionally we included Withdrawal areas in this categoriza-tion, areas such as State or Native selections, and power withdrawals.
Additional nonrestricted land use designations were obtained from forest management plans and categorized as “development” or “nondevelopment.” For the Tongass National Forest we used the layer titled “LandUseDesignation” from the “LandUseDesignation” database, which denotes Forest Service land use des-ignations as defined by the 2008 Tongass National Forest Plan. For the Chugach National Forest we used the layer titled “LRMP_Category_Dissolve” from the “LRMP_2002” geodatabase, used to summarize the 2002 Chugach National Forest Plan categories into five categories. For future analyses, we suggest users access the most recent ownership and land use geographic information systems (GIS) layers, as these boundaries can change frequently.
229
A Climate Adaptation Strategy for Conservation and Management of Yellow-Cedar in Alaska
1. Seward
Geomorphology and climate— The Seward management zone is underlain by the Valdez Formation of the Chugach Terrane. This formation consists of Cretaceous marine rocks of metasedimentary and metavolcanic origin. Surficial geologic material is dominated by undifferentiat-ed and unconsolidated surficial deposits from glacial till, glacial-fluvial action, and alluvium along relic and present water courses. The management zone lies mostly within the Western Kenai Mountains and Eastern Kenai Mountains subsections. The area consists of both rounded and jagged mountains and alpine valleys shaped by glaciers. Many of the valleys in the eastern portion of the Kenai Peninsula con-tain alpine glaciers in their upper portions. Abundant precipitation as snow is com-mon throughout the management zone, but varies in total accumulation by eleva-tion. The average annual temperature at sea level ranges from a minimum of 34 °F to a maximum of 46 °F. The average annual precipitation is 68 in, and the average annual snowfall is 83 in (Seward observation station, 508371).
Extent of yellow-cedar— There is no yellow-cedar in this management zone (table 25). The closest natural populations are to the east on the east side of Unakwik Inlet.
Extent of yellow-cedar decline— There is no yellow-cedar decline in this management zone.
Extent of yellow-cedar at future risk— There are no yellow-cedar populations for which to assess risk (fig. 89).
Landscapes in protected and active management zones— Most of the land ownership is National Forest in restricted, nondevelopment status. Therefore, this large area of forest provides a potential conservation area for future migration of yellow-cedar populations into this zone. No yellow-cedar has been identified yet, but if it does migrate and establish in this zone, it will have protection from potential management in most of the area. There are forested areas under State of Alaska jurisdiction and private ownership that provide opportunities for planting.
Opportunities for conservation and management— The snowy climate makes this a desirable area to test facilitated or assisted migra-tion of yellow-cedar, thereby extending its range westward. However, the present habitat is limited to the coastal forest near sea level. The forested habitat is cur-rently drier in much of the area with a mix of black, white, Lutz, and Sitka spruce, quaking aspen, and Kenai and paper birch. Deer would presumably not be a threat to planted yellow-cedar, but moose and other animals might damage regeneration.

230
GENERAL TECHNICAL REPORT PNW-GTR-917
Tabl
e 25
—Se
war
d Ye
llow
-Ced
ar M
anag
emen
t Zon
e (S
ewar
d R
ange
r Dis
tric
t, C
huga
ch N
atio
nal F
ores
t): a
crea
ge o
f yel
low
-ced
ar, a
crea
ge
of c
urre
nt m
appe
d ye
llow
-ced
ar d
eclin
e, a
nd p
roje
cted
per
cent
age
of y
ello
w-c
edar
occ
urre
nce
in th
ree
decl
ine
risk
cla
sses
in 2
020,
20
50, a
nd 2
080
Lan
d ow
ners
hip
Fore
st
land
Yello
w-
ceda
ra
Map
ped
ye
llow
-ced
ar
decl
ine,
201
3b
Dec
line
risk
cla
ss,
proj
ecte
d, 2
020c
Dec
line
risk
cla
sses
, pr
ojec
ted,
205
0cD
eclin
e ri
sk c
lass
, pr
ojec
ted,
208
0c
Low
Med
ium
Hig
hL
owM
ediu
mH
igh
Low
Med
ium
Hig
h
- - -
- - -
- - -
Acre
s - -
- - -
- - -
- - -
- - -
- - -
- - -
- - -
- Pe
rcen
tage
of y
ello
w-c
edar
acr
eage
- - -
- - -
- - -
- - -
- -
Nat
iona
l for
est (
tota
l)21
5,22
30
00
00
00
00
00
Non
rest
ricte
d, d
evel
opm
entd
67,8
730
00
00
00
00
00
Non
restr
icte
d, li
mite
d de
velo
pmen
te0
00
00
00
00
00
0 R
estri
cted
, non
deve
lopm
entf
147,
350
00
990
099
00
00
0St
ate
42,6
350
00
00
00
00
00
Priv
ate
4,30
60
00
00
00
00
00
Oth
er g
over
nmen
tal e
ntity
00
00
00
00
00
00
Unk
now
n0
00
00
00
00
00
0
Tot
al26
2,16
40
00
00
00
00
00
- - -
- - -
100
- - -
- - -
- - -
- - -
100
- - -
- - -
- - -
- - -
100
- - -
- - -
a Are
a of
cur
rent
yel
low
-ced
ar fo
rest
s est
imat
ed fr
om sp
ecie
s dis
trib
utio
n m
odel
s and
surv
eys (
see
“Yel
low
-ced
ar d
istr
ibut
ion”
in se
ctio
n 4)
.b S
ee “Y
ello
w-c
edar
dec
line”
in se
ctio
n 4
for m
ore
info
rmat
ion
on h
ow a
crea
ge o
f yel
low
-ced
ar d
eclin
e w
as m
appe
d.
c Per
cent
age
of th
e es
timat
ed y
ello
w-c
edar
dis
trib
utio
n ac
reag
e th
at is
pro
ject
ed to
be
in lo
w-,
med
ium
-, an
d hi
gh-r
isk
clas
ses f
or y
ello
w-
ceda
r dec
line
base
d on
hyd
rolo
gy a
nd sn
ow m
odel
ing.
Per
cent
ages
may
not
sum
to 1
00 b
ecau
se o
f rou
ndin
g.
d Non
rest
rict
ed, d
evel
opm
ent:
land
use
des
igna
tions
that
per
mit
com
mer
cial
tim
ber h
arve
st o
n a
regu
late
d (s
ched
uled
) bas
is.
e Non
rest
rict
ed, l
imite
d de
velo
pmen
t: la
nd u
se d
esig
natio
ns th
at d
o no
t per
mit
com
mer
cial
tim
ber o
n a
regu
late
d ba
sis.
On
a ca
se-b
y-ca
se
basi
s the
follo
win
g ac
tiviti
es m
ay b
e al
low
ed: s
alva
ge, p
erso
nal u
se, t
hinn
ing,
pru
ning
, or p
lant
ing.
f R
estr
icte
d la
nd is
land
per
man
ently
rese
rved
from
woo
d pr
oduc
ts u
tiliz
atio
n th
roug
h st
atut
e or
adm
inis
trat
ive
desi
gnat
ion.
Exa
mpl
es a
re
natio
nal f
ores
t wild
erne
ss a
reas
, nat
iona
l mon
umen
ts, a
nd w
ithdr
awal
are
as.

231
A Climate Adaptation Strategy for Conservation and Management of Yellow-Cedar in Alaska
Figu
re 8
9—Se
war
d Ye
llow
-Ced
ar M
anag
emen
t Zon
e (S
ewar
d R
ange
r Dis
tric
t, C
huga
ch N
atio
nal F
ores
t): a
reas
and
per
cent
ages
of l
ow, m
oder
ate,
and
hig
h ris
k of
yel
low
-ced
ar d
eclin
e in
fore
sts w
ith y
ello
w-c
edar
bas
ed o
n so
il dr
aina
ge a
nd sn
ow a
ccum
ulat
ion
mod
els.
See
sect
ion
4 fo
r det
ails
on
mod
els f
or
decl
ine
risk
clas
ses.
Are
as w
ithou
t yel
low
-ced
ar a
ppea
r gra
y. L
ocat
ion
for t
his z
one
is g
iven
in th
e in
set m
ap.

232
GENERAL TECHNICAL REPORT PNW-GTR-917
2. Prince William Sound WestGeomorphology and climate— This management zone is part of the Valdez Formation within the Chugach Terrane. These late-Cretaceous sedimentary rocks are prone to weathering due to their composition and origin from marine floor deposition and uplift. Surficial geologic materials are dominated by glacial drift, colluvial material including redeposited glacial materials, and alluvium. The geomorphology is characterized by a diverse assemblage of landscape features. Of the several ecological subsections within the management zone, the largest are the Chugach Icefields, Turnagain Arm, and Eastern Kenai Mountains. The main coniferous forest area is within the Eastern Kenai Mountains subsection, which provides the core habitat for yellow-cedar with-in the management zone. Abundant precipitation as snow is common throughout the management zone, but varies in total accumulation by elevation. The foothills of this management zone have an average minimum temperature of 30 °F and an aver-age maximum temperature of 44 °F. The average annual precipitation is 68 in, and the average annual snowfall is 197 in (Alyeska observation station, 500243). At sea level, the average temperature ranges from a minimum of 35 °F to a maximum of 45 °F. The average annual precipitation is 197 in, and the average annual snowfall is 248 in (Whittier observation station, 509829).
Extent of yellow-cedar— This management zone marks the northwestern range limit for yellow-cedar. There are 8,512 ac of yellow-cedar, which cover 1.1 percent of the total forested area in this management zone (table 26). The yellow-cedar populations here contribute to just 0.4 percent of the yellow-cedar acreage in Alaska. This management zone in-cludes numerous inland mountain valleys, but yellow-cedar populations are gener-ally restricted to the northernmost coastal forests. Large areas of coastal forests to the south represent unoccupied suitable habitat for yellow-cedar. Although yellow-cedar has a limited extent in this management zone, separate populations to the east near Cordova cover an even smaller area.
Extent of yellow-cedar decline— No yellow-cedar decline has been mapped in this management zone. Observations and limited plot data from this area suggest that yellow-cedar populations were healthy as of 2000 (Hennon and Trummer 2001).

233
A Climate Adaptation Strategy for Conservation and Management of Yellow-Cedar in Alaska
Extent of yellow-cedar at future risk— All of the existing yellow-cedar is at low risk (100 percent) in both the 2020 and 2050 projections (fig. 90). By 2080, there is only a 1-percent increase in risk (from low to medium), far less than any other management zone with yellow-cedar popu-lations. The presence of snow covering suitable yellow-cedar habitat keeps the area at low risk.
Landscapes in protected and active management zones— All of the yellow-cedar on land managed by the U.S. Forest Service is located in restricted or nondevelopment land use designations. Yellow-cedar appears to be regenerating well, both in forests and avalanche-disturbed areas (Hennon and Trummer 2001). Yellow-cedar tree growth here is rapid compared to its growth in southeast Alaska. The populations and the range limit may be expanding slowly, perhaps aided by the scarcity of deer. A small amount of the yellow-cedar acreage is located on private and unknown land holdings.
Opportunities for conservation and management— The stable or possibly expanding yellow-cedar populations occur on lands in pro-tection status (Nellie Juan–College Fiord Wilderness Study Area). This manage-ment zone is a prime location for conservation of healthy, intact yellow-cedar for-ests due to low future risk of decline, and potential population and range expansion through natural dispersal. The zone is highly variable and any management actions must evaluate the specific areas of interest with local knowledge of conditions such as snowpack. Some of the areas have a wide range of seasonal temperature and snowpack due to local glacial influence. The proposed Research Natural Area at Cedar Bay presents an opportunity to focus research and monitoring efforts in these intact yellow-cedar forests. This area is also somewhat warmer than other parts of the management zone and will be a good location for future monitoring of yellow-cedar health in the region.
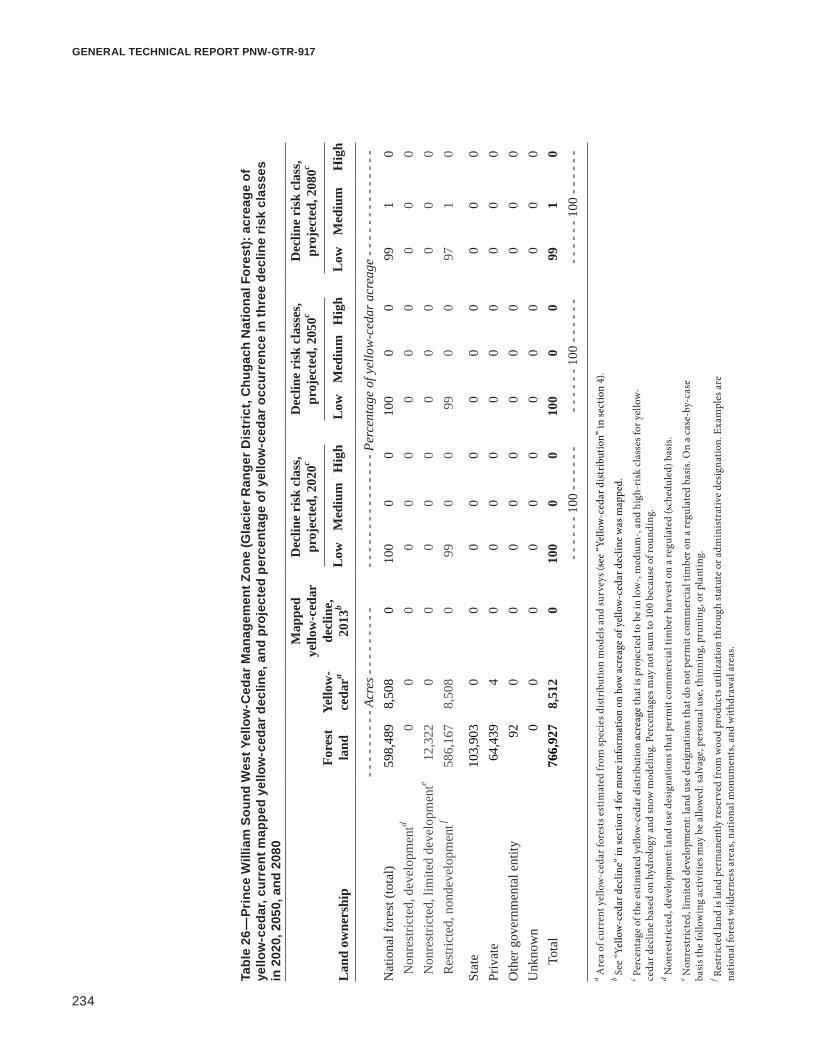
234
GENERAL TECHNICAL REPORT PNW-GTR-917
Tabl
e 26
—Pr
ince
Will
iam
Sou
nd W
est Y
ello
w-C
edar
Man
agem
ent Z
one
(Gla
cier
Ran
ger D
istr
ict,
Chu
gach
Nat
iona
l For
est):
acr
eage
of
yello
w-c
edar
, cur
rent
map
ped
yello
w-c
edar
dec
line,
and
pro
ject
ed p
erce
ntag
e of
yel
low
-ced
ar o
ccur
renc
e in
thre
e de
clin
e ri
sk c
lass
es
in 2
020,
205
0, a
nd 2
080
Lan
d ow
ners
hip
Fore
st
land
Yello
w-
ceda
ra
Map
ped
ye
llow
-ced
ar
decl
ine,
20
13b
Dec
line
risk
cla
ss,
proj
ecte
d, 2
020c
Dec
line
risk
cla
sses
, pr
ojec
ted,
205
0cD
eclin
e ri
sk c
lass
, pr
ojec
ted,
208
0c
Low
Med
ium
Hig
hL
owM
ediu
mH
igh
Low
Med
ium
Hig
h
- - -
- - -
- - -
Acre
s - -
- - -
- - -
- - -
- - -
- - -
- - -
- - -
- Pe
rcen
tage
of y
ello
w-c
edar
acr
eage
- - -
- - -
- - -
- - -
- -
Nat
iona
l for
est (
tota
l)59
8,48
98,
508
010
00
010
00
099
10
Non
rest
ricte
d, d
evel
opm
entd
00
00
00
00
00
00
Non
rest
ricte
d, li
mite
d de
velo
pmen
te12
,322
00
00
00
00
00
0 R
estri
cted
, non
deve
lopm
entf
586,
167
8,50
80
990
099
00
971
0
Stat
e 10
3,90
30
00
00
00
00
00
Priv
ate
64,4
394
00
00
00
00
00
Oth
er g
over
nmen
tal e
ntity
920
00
00
00
00
00
Unk
now
n0
00
00
00
00
00
0
Tot
al76
6,92
78,
512
010
00
010
00
099
10
- - -
- - -
100
- - -
- - -
- - -
- - -
100
- - -
- - -
- - -
- - -
100
- - -
- - -
a Are
a of
cur
rent
yel
low
-ced
ar fo
rest
s est
imat
ed fr
om sp
ecie
s dis
trib
utio
n m
odel
s and
surv
eys (
see
“Yel
low
-ced
ar d
istr
ibut
ion”
in se
ctio
n 4)
.b S
ee “Y
ello
w-c
edar
dec
line”
in se
ctio
n 4
for m
ore
info
rmat
ion
on h
ow a
crea
ge o
f yel
low
-ced
ar d
eclin
e w
as m
appe
d.
c Per
cent
age
of th
e es
timat
ed y
ello
w-c
edar
dis
trib
utio
n ac
reag
e th
at is
pro
ject
ed to
be
in lo
w-,
med
ium
-, an
d hi
gh-r
isk
clas
ses f
or y
ello
w-
ceda
r dec
line
base
d on
hyd
rolo
gy a
nd sn
ow m
odel
ing.
Per
cent
ages
may
not
sum
to 1
00 b
ecau
se o
f rou
ndin
g.
d Non
rest
rict
ed, d
evel
opm
ent:
land
use
des
igna
tions
that
per
mit
com
mer
cial
tim
ber h
arve
st o
n a
regu
late
d (s
ched
uled
) bas
is.
e Non
rest
rict
ed, l
imite
d de
velo
pmen
t: la
nd u
se d
esig
natio
ns th
at d
o no
t per
mit
com
mer
cial
tim
ber o
n a
regu
late
d ba
sis.
On
a ca
se-b
y-ca
se
basi
s the
follo
win
g ac
tiviti
es m
ay b
e al
low
ed: s
alva
ge, p
erso
nal u
se, t
hinn
ing,
pru
ning
, or p
lant
ing.
f R
estr
icte
d la
nd is
land
per
man
ently
rese
rved
from
woo
d pr
oduc
ts u
tiliz
atio
n th
roug
h st
atut
e or
adm
inis
trat
ive
desi
gnat
ion.
Exa
mpl
es a
re
natio
nal f
ores
t wild
erne
ss a
reas
, nat
iona
l mon
umen
ts, a
nd w
ithdr
awal
are
as.
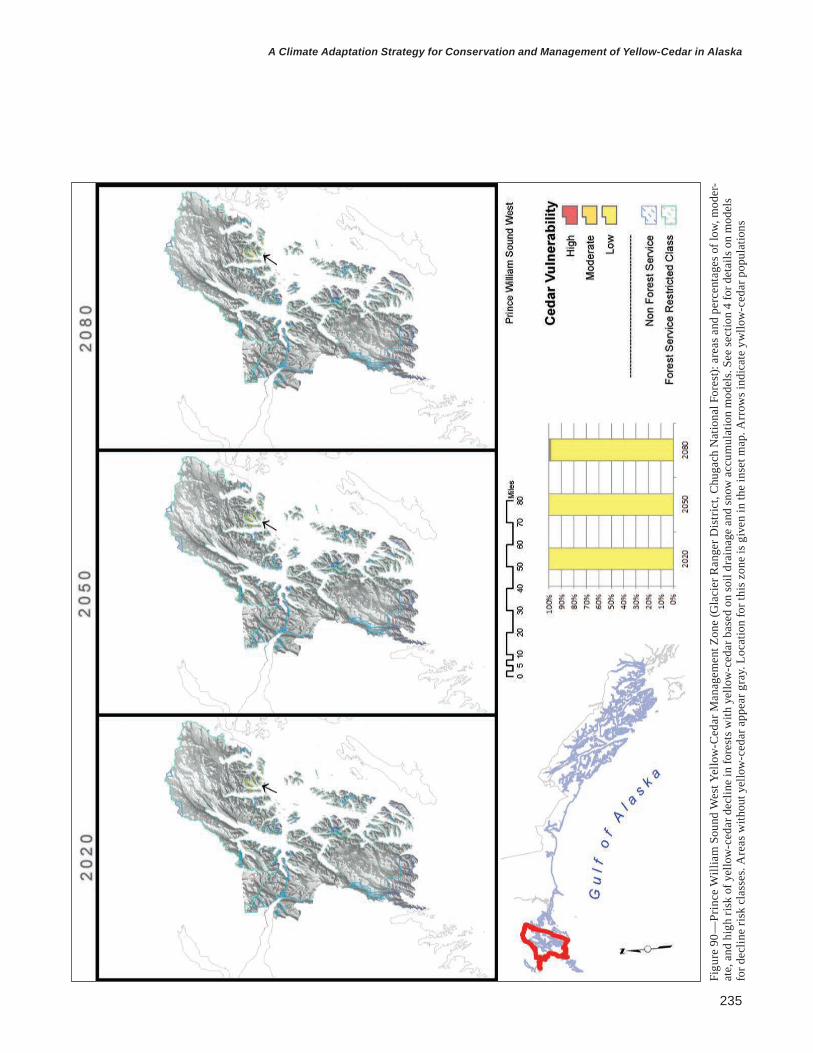
235
A Climate Adaptation Strategy for Conservation and Management of Yellow-Cedar in Alaska
Figu
re 9
0—Pr
ince
Will
iam
Sou
nd W
est Y
ello
w-C
edar
Man
agem
ent Z
one
(Gla
cier
Ran
ger D
istr
ict,
Chu
gach
Nat
iona
l For
est):
are
as a
nd p
erce
ntag
es o
f low
, mod
er-
ate,
and
hig
h ris
k of
yel
low
-ced
ar d
eclin
e in
fore
sts w
ith y
ello
w-c
edar
bas
ed o
n so
il dr
aina
ge a
nd sn
ow a
ccum
ulat
ion
mod
els.
See
sect
ion
4 fo
r det
ails
on
mod
els
for d
eclin
e ris
k cl
asse
s. A
reas
with
out y
ello
w-c
edar
app
ear g
ray.
Loc
atio
n fo
r thi
s zon
e is
giv
en in
the
inse
t map
. Arr
ows i
ndic
ate
ywllo
w-c
edar
pop
ulat
ions

236
GENERAL TECHNICAL REPORT PNW-GTR-917
3. Prince William Sound EastGeomorphology and climate— This management zone includes the Copper River Delta and Copper River Delta ecological subsections as well as portions of the Prince William Sound Islands and Prince William Sound Mainland ecological subsections. Extensive icefields are also present. The most distinctive feature of this landscape is the distal end and delta of the Copper River, with its many islands, sand dunes, and lowlands. This geological-ly unstable landscape has a great deal of past and present alluvial action and recent tectonic activity. The surficial geology is typical of postglacial valleys and deltas with flat outwash plains and dunes. The average annual temperature ranges from a minimum of 31 °F to a maximum of 46 °F. The average annual precipitation is 91 in, and the average annual snowfall is 117 in (Cordova observation station, 502177). A zone of heavy snow accumulation is located at the interface between the coast and the Coast Mountain passes at Valdez. There, the annual temperature ranges from an average minimum of 29 °F to an average maximum of 43 °F. The average annual precipitation is 62 in, and the average annual snowfall is 220 in (Valdez ob-servation station, 509685).
Extent of yellow-cedar— The presence of yellow-cedar in this zone is limited to small stands on or near Hawkins Island. Known yellow-cedar populations occur near Windy and Mud Bays on Hawkins Island; Point Gravina, Bomb Point, and Alice Cove on the mainland to the north of Hawkins Island; and Yelper Cove on Hinchinbrook Island. The total acreage is only about 463 ac, a small fraction of the >1 million ac of forestland in this management zone (table 27). These yellow-cedar populations contribute to 0.02 percent of the yellow-cedar extent in Alaska.
Extent of yellow-cedar decline— Decline has not been documented in any of the small populations in this management zone. The stands visited and measured in the year 2000 (Hennon and Trummer 2001) indicate that yellow-cedar was healthy and growing well at that time.
Extent of yellow-cedar at future risk— There is no acreage at high risk of yellow-cedar decline in 2020, and 89 percent of yellow-cedar acreage is in the low-risk class (fig. 91). High risk rises to 1 percent in 2050 and 22 percent in 2080 with a reduction in snow. By 2080, the proportion of yellow-cedar acreage at low risk is expected to be 38 percent.

237
A Climate Adaptation Strategy for Conservation and Management of Yellow-Cedar in Alaska
Landscapes in protected and active management zones— Most of the yellow-cedar in this management zone is on land managed by the U.S. Forest Service, with almost all in nonrestricted, limited development status. Small acreages are listed as State, private, and unknown ownership. Yellow-cedar is ab-sent from large, managed forested areas on these non-Forest Service lands.
Opportunities for conservation and management— The small populations of yellow-cedar on land managed by the Forest Service could be monitored given their rarity and increasing risk of yellow-cedar decline. The populations at Point Gravina, Bomb Point, Alice Cove, and Yelper Cove should be mapped comprehensively because their boundaries have never been confirmed. The land use classification of the existing yellow-cedar forests may allow some limited management activity to enhance the competitiveness of yellow-cedar within the small populations or to expand these populations to larger forested areas such as Hinchinbrook and Montague Islands. There may be opportunity to plant yellow-cedar on more intensively managed State of Alaska and private lands to promote or expand yellow-cedar populations in these areas. Deer were introduced into the Cordova area in the early 1900s; nonetheless, yellow-cedar is regenerating well on Hawkins Island, so planting would be expected to be successful.

238
GENERAL TECHNICAL REPORT PNW-GTR-917
Tabl
e 27
—Pr
ince
Will
iam
Sou
nd E
ast Y
ello
w-C
edar
Man
agem
ent Z
one
(Cor
dova
Ran
ger D
istr
ict,
Chu
gach
Nat
iona
l For
est):
acr
eage
of
yello
w-c
edar
, cur
rent
map
ped
yello
w-c
edar
dec
line,
and
pro
ject
ed p
erce
ntag
e of
yel
low
-ced
ar o
ccur
renc
e in
thre
e de
clin
e ri
sk c
lass
es
in 2
020,
205
0, a
nd 2
080
Lan
d ow
ners
hip
Fore
st
land
Yello
w-
ceda
ra
Map
ped
ye
llow
-ced
ar
decl
ine,
20
13b
Dec
line
risk
cla
ss,
proj
ecte
d, 2
020c
Dec
line
risk
cla
sses
, pr
ojec
ted,
205
0cD
eclin
e ri
sk c
lass
, pr
ojec
ted,
208
0c
Low
Med
ium
Hig
hL
owM
ediu
mH
igh
Low
Med
ium
Hig
h
- - -
- - -
- - -
Acre
s - -
- - -
- - -
- - -
- - -
- - -
- - -
- - -
- Pe
rcen
tage
of y
ello
w-c
edar
acr
eage
- - -
- - -
- - -
- - -
- -
Nat
iona
l for
est (
tota
l)77
0,38
341
30
7219
170
181
3337
22 N
onre
stric
ted,
dev
elop
men
td12
,013
00
00
00
00
00
0 N
onre
stric
ted,
lim
ited
deve
lopm
ente
682,
660
412
072
191
7018
133
3722
Res
trict
ed, n
onde
velo
pmen
tf75
,711
10
00
00
00
00
0
Stat
e 36
,086
140
30
03
00
03
0
Priv
ate
213,
434
230
50
05
00
41
0O
ther
gov
ernm
enta
l ent
ity95
70
00
00
00
00
00
Unk
now
n0
00
00
02
10
00
0
Tot
al1,
020,
860
463
089
110
8019
138
4122
- - -
- - -
100
- - -
- - -
- - -
- - -
100
- - -
- - -
- - -
- - -
100
- - -
- - -
a Are
a of
cur
rent
yel
low
-ced
ar fo
rest
s est
imat
ed fr
om sp
ecie
s dis
trib
utio
n m
odel
s and
surv
eys (
see
“Yel
low
-ced
ar d
istr
ibut
ion”
in se
ctio
n 4)
.b S
ee “Y
ello
w-c
edar
dec
line”
in se
ctio
n 4
for m
ore
info
rmat
ion
on h
ow a
crea
ge o
f yel
low
-ced
ar d
eclin
e w
as m
appe
d.
c Per
cent
age
of th
e es
timat
ed y
ello
w-c
edar
dis
trib
utio
n ac
reag
e th
at is
pro
ject
ed to
be
in lo
w-,
med
ium
-, an
d hi
gh-r
isk
clas
ses f
or y
ello
w-
ceda
r dec
line
base
d on
hyd
rolo
gy a
nd sn
ow m
odel
ing.
Per
cent
ages
may
not
sum
to 1
00 b
ecau
se o
f rou
ndin
g.
d Non
rest
rict
ed, d
evel
opm
ent:
land
use
des
igna
tions
that
per
mit
com
mer
cial
tim
ber h
arve
st o
n a
regu
late
d (s
ched
uled
) bas
is.
e Non
rest
rict
ed, l
imite
d de
velo
pmen
t: la
nd u
se d
esig
natio
ns th
at d
o no
t per
mit
com
mer
cial
tim
ber o
n a
regu
late
d ba
sis.
On
a ca
se-b
y-ca
se
basi
s the
follo
win
g ac
tiviti
es m
ay b
e al
low
ed: s
alva
ge, p
erso
nal u
se, t
hinn
ing,
pru
ning
, or p
lant
ing.
f R
estr
icte
d la
nd is
land
per
man
ently
rese
rved
from
woo
d pr
oduc
ts u
tiliz
atio
n th
roug
h st
atut
e or
adm
inis
trat
ive
desi
gnat
ion.
Exa
mpl
es a
re
natio
nal f
ores
t wild
erne
ss a
reas
, nat
iona
l mon
umen
ts, a
nd w
ithdr
awal
are
as.

239
A Climate Adaptation Strategy for Conservation and Management of Yellow-Cedar in Alaska
Figu
re 9
1—Pr
ince
Will
iam
Sou
nd E
ast Y
ello
w-C
edar
Man
agem
ent Z
one
(Cor
dova
Ran
ger D
istr
ict,
Chu
gach
Nat
iona
l For
est):
are
as a
nd p
erce
ntag
es o
f low
, mod
-er
ate,
and
hig
h ris
k of
yel
low
-ced
ar d
eclin
e in
fore
sts w
ith y
ello
w-c
edar
bas
ed o
n so
il dr
aina
ge a
nd sn
ow a
ccum
ulat
ion
mod
els.
See
sect
ion
4 fo
r det
ails
on
mod
els
for d
eclin
e ris
k cl
asse
s. A
reas
with
out y
ello
w-c
edar
app
ear g
ray.
Loc
atio
n fo
r thi
s zon
e is
giv
en in
the
inse
t map
. Arr
ows i
ndic
ate
yello
w-c
edar
pop
ulat
ions
.
240
GENERAL TECHNICAL REPORT PNW-GTR-917
4. Icy BayGeomorphology and climate— This management zone is dominated by the glaciated St. Elias–Fairweather Icefield complex. The area is characterized by a continuous plain along the coast with produc-tive coniferous forest bounded by sheer mountain slopes. This zone of unconsolidated glacial, alluvial, and glaciomarine deposits provides substrate that forms a mosaic of productive forest and peatland. The area has generally low relief due to the nature of the uplifted landforms from isostatic rebound. No local weather station is available for this area. However, sea level temperature and precipitation records will be similar to those from Yakutat. Snow accumulation will increase with elevation, leading to large snow accumulations on the foothills and mountain slopes.
Extent of yellow-cedar— There is a very small population of yellow-cedar within the nearly half-million ac of forested land in this management zone. The actual size of the single stand of live yellow-cedar is not known at this time, but it is estimated at 30 ac (table 28). It is located just east of Big Sandy Creek and west of Priest River in a natural stand upslope from a harvested area at 60.0050°N, 141.7315°W. A harvested unit on State land near Laurence Creek was thought to previously contain yellow-cedar.
Extent of yellow-cedar decline— Decline has not been documented in this management zone.
Extent of yellow-cedar at future risk— The area of the small stand of yellow-cedar remains at low risk through 2080 (fig. 92).
Landscapes in protected and active management zones— The small yellow-cedar stand in this zone is administered as Mental Health Trust land and is managed by the State of Alaska. There is no land managed by the U.S. Forest Service in this management zone.
Opportunities for conservation and management— Extensive areas on State lands have been harvested in this management zone. There is a good potential for planting within recent clearcuts to facilitate new yellow-cedar forests. The nearest available yellow-cedar seed source was collected near Hoonah. The cold weather and abundant snow would create optimal conditions for the sur-vival and persistence of yellow-cedar to maturity over the next century. The small live yellow-cedar population near Big Sandy Creek could be genetically unique due

241
A Climate Adaptation Strategy for Conservation and Management of Yellow-Cedar in Alaska
to its isolation and small size and should be mapped for extent on the ground, moni-tored into the future, and protected from harvesting. Collections of foliar tissue and seeds are needed from this stand for genetic analyses. The area near Laurence Creek, which apparently contained yellow-cedar before it was harvested, should be checked for the occurrence of yellow-cedar stumps and regeneration. Further sur-veys could detect yellow-cedar in more locations within this management zone.

242
GENERAL TECHNICAL REPORT PNW-GTR-917
Tabl
e 28
—Ic
y B
ay Y
ello
w-C
edar
Man
agem
ent Z
one:
acr
eage
of y
ello
w-c
edar
, cur
rent
map
ped
yello
w-c
edar
dec
line,
and
pro
ject
ed
perc
enta
ge o
f yel
low
-ced
ar o
ccur
renc
e in
thre
e de
clin
e ri
sk c
lass
es in
202
0, 2
050,
and
208
0
Lan
d ow
ners
hip
Fore
st
land
Yello
w-
ceda
ra
Map
ped
ye
llow
-ced
ar
decl
ine,
20
13b
Dec
line
risk
cla
ss,
proj
ecte
d, 2
020c
Dec
line
risk
cla
sses
, pr
ojec
ted,
205
0cD
eclin
e ri
sk c
lass
, pr
ojec
ted,
208
0c
Low
Med
ium
Hig
hL
owM
ediu
mH
igh
Low
Med
ium
Hig
h
- - -
- - -
- - -
Acre
s - -
- - -
- - -
- - -
- - -
- - -
- - -
- - -
- Pe
rcen
tage
of y
ello
w-c
edar
acr
eage
- - -
- - -
- - -
- - -
- -
Nat
iona
l for
est (
tota
l)0
00
00
00
00
00
0 N
onre
stric
ted,
dev
elop
men
td0
00
00
00
00
00
0 N
onre
stric
ted,
lim
ited
deve
lopm
ente
00
00
00
00
00
00
Res
trict
ed, n
onde
velo
pmen
tf0
00
00
00
00
00
0
Stat
e 24
1,30
431
010
00
010
00
010
00
0
Priv
ate
81,7
430
00
00
00
00
00
Oth
er g
over
nmen
tal e
ntity
151,
472
00
00
00
00
00
0U
nkno
wn
00
010
00
010
00
010
00
0
Tot
al47
4,51
931
010
00
010
00
010
00
0- -
- - -
- 10
0 - -
- - -
- - -
- - -
- 10
0 - -
- - -
- - -
- - -
- 10
0 - -
- - -
- a A
rea
of c
urre
nt y
ello
w-c
edar
fore
sts e
stim
ated
from
spec
ies d
istr
ibut
ion
mod
els a
nd su
rvey
s (se
e “Y
ello
w-c
edar
dis
trib
utio
n” in
sect
ion
4).
b See
“Yel
low
-ced
ar d
eclin
e” in
sect
ion
4 fo
r mor
e in
form
atio
n on
how
acr
eage
of y
ello
w-c
edar
dec
line
was
map
ped.
c P
erce
ntag
e of
the
estim
ated
yel
low
-ced
ar d
istr
ibut
ion
acre
age
that
is p
roje
cted
to b
e in
low
-, m
ediu
m-,
and
high
-ris
k cl
asse
s for
yel
low
- ce
dar d
eclin
e ba
sed
on h
ydro
logy
and
snow
mod
elin
g. P
erce
ntag
es m
ay n
ot su
m to
100
bec
ause
of r
ound
ing.
d N
onre
stri
cted
, dev
elop
men
t: la
nd u
se d
esig
natio
ns th
at p
erm
it co
mm
erci
al ti
mbe
r har
vest
on
a re
gula
ted
(sch
edul
ed) b
asis
.e N
onre
stri
cted
, lim
ited
deve
lopm
ent:
land
use
des
igna
tions
that
do
not p
erm
it co
mm
erci
al ti
mbe
r on
a re
gula
ted
basi
s. O
n a
case
-by-
case
ba
sis t
he fo
llow
ing
activ
ities
may
be
allo
wed
: sal
vage
, per
sona
l use
, thi
nnin
g, p
runi
ng, o
r pla
ntin
g.
f Res
tric
ted
land
is la
nd p
erm
anen
tly re
serv
ed fr
om w
ood
prod
ucts
util
izat
ion
thro
ugh
stat
ute
or a
dmin
istr
ativ
e de
sign
atio
n. E
xam
ples
are
na
tiona
l for
est w
ilder
ness
are
as, n
atio
nal m
onum
ents
, and
with
draw
al a
reas
.
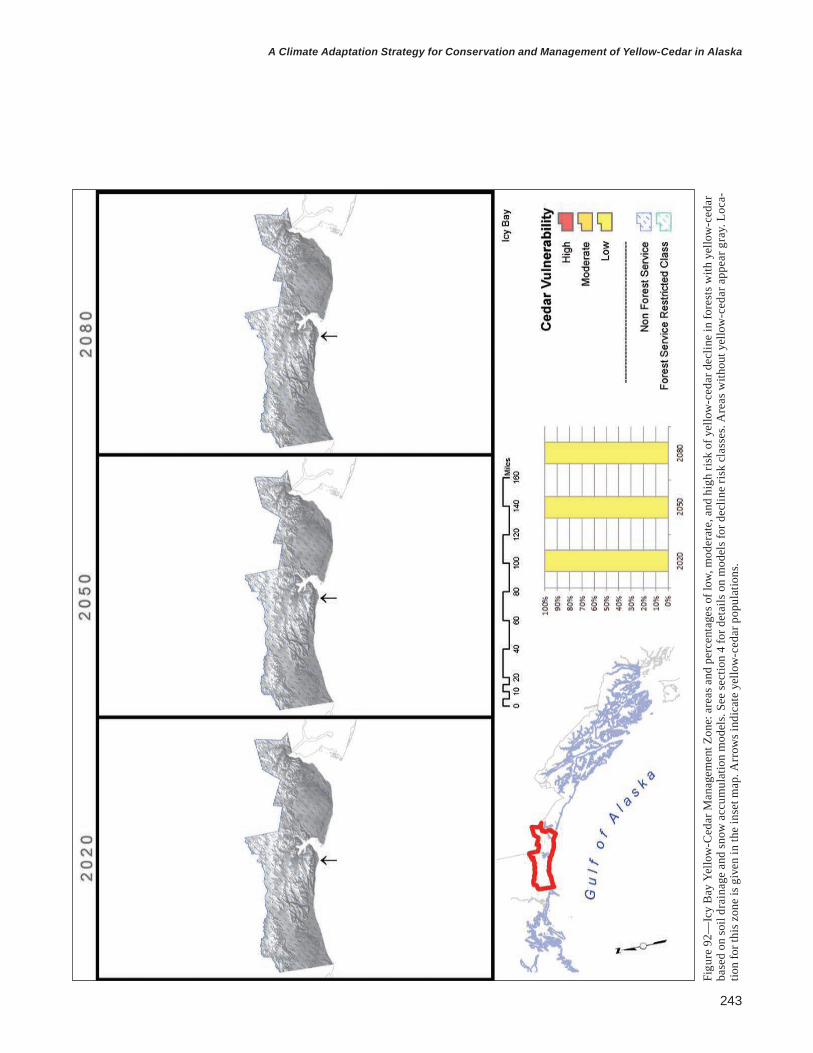
243
A Climate Adaptation Strategy for Conservation and Management of Yellow-Cedar in Alaska
Figu
re 9
2—Ic
y B
ay Y
ello
w-C
edar
Man
agem
ent Z
one:
are
as a
nd p
erce
ntag
es o
f low
, mod
erat
e, a
nd h
igh
risk
of y
ello
w-c
edar
dec
line
in fo
rest
s with
yel
low
-ced
ar
base
d on
soil
drai
nage
and
snow
acc
umul
atio
n m
odel
s. Se
e se
ctio
n 4
for d
etai
ls o
n m
odel
s for
dec
line
risk
clas
ses.
Are
as w
ithou
t yel
low
-ced
ar a
ppea
r gra
y. L
oca-
tion
for t
his z
one
is g
iven
in th
e in
set m
ap. A
rrow
s ind
icat
e ye
llow
-ced
ar p
opul
atio
ns.

244
GENERAL TECHNICAL REPORT PNW-GTR-917
5. YakutatGeomorphology and climate— This area is similar to the Icy Bay management zone. It is dominated by the glaci-ated St. Elias–Fairweather Icefield complex. The vegetated zone is limited to the coastal fringe of the Yakutat Forelands subsection. The Puget Peninsula metasedi-ments also provide areas for coniferous vegetation. This zone of unconsolidated glacial, alluvial, and glaciomarine deposits contains substrate that forms a mosaic of productive forest and peatland. The forested area has generally low relief due to the nature of the uplifted landforms from isostatic rebound. The climate is char-acterized by abundant precipitation and heavy snowfall in winter. At sea level, the annual temperature ranges from an average minimum of 33 °F to an average maxi-mum of 46 °F. The average annual precipitation is 145 in, and the average annual snowfall is 186 in (Yakutat observation station, 509941).
Extent of yellow-cedar— There are no known natural yellow-cedar forests in this management zone, which contains >300,000 ac of forested land (table 29). As an assisted/facilitated migration trial, yellow-cedar was planted in 2009 in several areas near Yakutat that had been harvested where some stands had experienced blowdown (see section 1).
Extent of yellow-cedar decline— Given the lack of natural yellow-cedar forests present, there is no yellow-cedar decline in this management zone.
Extent of yellow-cedar at future risk— There are no natural yellow-cedar forests to form the basis of risk assessment (fig. 93). The planted areas near Yakutat should be monitored for health in this manage-ment zone. Well-drained sites were selected for plantings and are expected to do well. However, the landscape in this area is complex and local areas of near-surface saturation may compromise the success of some planted trees. Yakutat and Icy Bay are considered to have a similar near-sea-level climate, so we might expect to see a low level of risk to yellow-cedar in Yakutat through 2080 similar to that projected for Icy Bay.
Landscapes in protected and active management zones— Most of the lands in this management zone are administered by the U.S. Forest Service; however, sizable areas are also owned and managed by the State and pri-vate entities. The lands managed by the Forest Service are mainly in restricted, nondevelopment land use designations, but the planting trial was conducted in non-restricted, development areas.
245
A Climate Adaptation Strategy for Conservation and Management of Yellow-Cedar in Alaska
Opportunities for conservation and management— This management zone offers no opportunity for conservation because yellow-cedar does not naturally occur here, but the snowy climate and diverse owner-ship suggest good prospects for promoting yellow-cedar forests through planting. Yellow-cedar may have occurred here before the late Pleistocene epoch, but that is speculative. The artificial planting of yellow-cedar in blowdown forests near Yakutat is an example of “assisted” or “facilitated” migration, the dispersal of a species to a climate zone that is suitable but where the species does not yet ex-ist. Given the heavy snow regime and well-drained soils where yellow-cedar was planted, prospects are high for its survival. Results of this trial will provide some information on the suitable microsites for future plantings in this management zone.

246
GENERAL TECHNICAL REPORT PNW-GTR-917
Tabl
e 29
—Ya
kuta
t Yel
low
-Ced
ar M
anag
emen
t Zon
e (Y
akut
at R
ange
r Dis
tric
t, To
ngas
s N
atio
nal F
ores
t): a
crea
ge o
f yel
low
-ced
ar, c
urre
nt
map
ped
yello
w-c
edar
dec
line,
and
pro
ject
ed p
erce
ntag
e of
yel
low
-ced
ar o
ccur
renc
e in
thre
e de
clin
e ri
sk c
lass
es in
202
0, 2
050,
and
208
0
Lan
d ow
ners
hip
Fore
st
land
Yello
w-
ceda
ra
Map
ped
ye
llow
-ced
ar
decl
ine,
20
13b
Dec
line
risk
cla
ss,
proj
ecte
d, 2
020c
Dec
line
risk
cla
sses
, pr
ojec
ted,
205
0cD
eclin
e ri
sk c
lass
, pr
ojec
ted,
208
0c
Low
Med
ium
Hig
hL
owM
ediu
mH
igh
Low
Med
ium
Hig
h
- - -
- - -
- - -
Acre
s - -
- - -
- - -
- - -
- - -
- - -
- - -
- - -
- Pe
rcen
tage
of y
ello
w-c
edar
acr
eage
- - -
- - -
- - -
- - -
- -
Nat
iona
l for
est (
tota
l)28
4,11
50
00
00
00
00
00
Non
rest
ricte
d, d
evel
opm
entd
11,6
170
00
00
00
00
00
Non
rest
ricte
d, li
mite
d de
velo
pmen
te23
,156
00
00
00
00
00
0 R
estri
cted
, non
deve
lopm
entf
249,
343
00
00
00
00
00
0
Stat
e 6,
693
310
00
00
00
00
0
Priv
ate
17,9
810
00
00
00
00
00
Oth
er g
over
nmen
tal e
ntity
465
00
00
00
00
00
0U
nkno
wn
00
00
00
00
00
00
T
otal
309,
254
310
00
00
00
00
0- -
- - -
- 10
0 - -
- - -
- - -
- - -
- 10
0 - -
- - -
- - -
- - -
- 10
0 - -
- - -
- a A
rea
of c
urre
nt y
ello
w-c
edar
fore
sts e
stim
ated
from
spec
ies d
istr
ibut
ion
mod
els a
nd su
rvey
s (se
e “Y
ello
w-c
edar
dis
trib
utio
n” in
sect
ion
4).
b See
“Yel
low
-ced
ar d
eclin
e” in
sect
ion
4 fo
r mor
e in
form
atio
n on
how
acr
eage
of y
ello
w-c
edar
dec
line
was
map
ped.
c P
erce
ntag
e of
the
estim
ated
yel
low
-ced
ar d
istr
ibut
ion
acre
age
that
is p
roje
cted
to b
e in
low
-, m
ediu
m-,
and
high
-ris
k cl
asse
s for
yel
low
- ce
dar d
eclin
e ba
sed
on h
ydro
logy
and
snow
mod
elin
g. P
erce
ntag
es m
ay n
ot su
m to
100
bec
ause
of r
ound
ing.
d N
onre
stri
cted
, dev
elop
men
t: la
nd u
se d
esig
natio
ns th
at p
erm
it co
mm
erci
al ti
mbe
r har
vest
on
a re
gula
ted
(sch
edul
ed) b
asis
.e N
onre
stri
cted
, lim
ited
deve
lopm
ent:
land
use
des
igna
tions
that
do
not p
erm
it co
mm
erci
al ti
mbe
r on
a re
gula
ted
basi
s. O
n a
case
-by-
case
ba
sis t
he fo
llow
ing
activ
ities
may
be
allo
wed
: sal
vage
, per
sona
l use
, thi
nnin
g, p
runi
ng, o
r pla
ntin
g.
f Res
tric
ted
land
is la
nd p
erm
anen
tly re
serv
ed fr
om w
ood
prod
ucts
util
izat
ion
thro
ugh
stat
ute
or a
dmin
istr
ativ
e de
sign
atio
n. E
xam
ples
are
na
tiona
l for
est w
ilder
ness
are
as, n
atio
nal m
onum
ents
, and
with
draw
al a
reas
.

247
A Climate Adaptation Strategy for Conservation and Management of Yellow-Cedar in Alaska
Figu
re 9
3—Ya
kuta
t Yel
low
-Ced
ar M
anag
emen
t Zon
e (Y
akut
at R
ange
r Dis
tric
t, To
ngas
s Nat
iona
l For
est):
are
as a
nd p
erce
ntag
es o
f low
, mod
erat
e, a
nd h
igh
risk
of y
ello
w-c
edar
dec
line
in fo
rest
s with
yel
low
-ced
ar b
ased
on
soil
drai
nage
and
snow
acc
umul
atio
n m
odel
s. Se
e se
ctio
n 4
for d
etai
ls o
n m
odel
s for
dec
line
risk
clas
ses.
Are
as w
ithou
t yel
low
-ced
ar a
ppea
r gra
y. L
ocat
ion
for t
his z
one
is g
iven
in th
e in
set m
ap.
248
GENERAL TECHNICAL REPORT PNW-GTR-917
6. Glacier BayGeomorphology and climate— This zone is a diverse assemblage of both glaciated and recently deglaciated ter-rain with exposed bedrock. The glaciated area is part of the St. Elias–Fairweather Icefields complex. The exposed bedrock consists of several areas of mountainous terrain with varying degrees of vegetation. The vegetated areas are composed of a thin wedge of the Yakutat Forelands, the Berg Bay complex sedimentary and vol-canic subsection, and the Chilkat Peninsula carbonates. A large portion of Glacier Bay was covered by glacial ice during the Little Ice Age. The 60-mi glacial retreat from the maximum extent in the 1700s has been colonized by vegetation, and even-aged spruce-dominated forests are common. The climate is variable in this manage-ment zone but generally has abundant winter snow. At sea level, the average annual temperature ranges from a minimum of 35 °F to a maximum of 47 °F. The average annual precipitation is 70 in, and the average annual snowfall is 109 in (Glacier Bay observation station, 503294).
Extent of yellow-cedar— Yellow-cedar forests have been mapped on >50,000 ac (table 30), all on older land-scapes that were not glaciated during the Little Ice Age. The landscape is replete with yellow-cedar forests along the coastal fringe from the Dundas Bay area west of Glacier Bay along Icy Strait and northward on the outer coastal margin. Yellow-cedar is also common on hillsides facing the Gulf of Alaska to an area northwest of Cape Fairweather. Yellow-cedar is generally lacking on the eastern side of this man-agement zone except for a small population on forested wetlands below Excursion Ridge, even though suitable habitat exists in surrounding areas. Yellow-cedar popu-lations in this management zone contribute 2.5 percent of the yellow-cedar extent in Alaska. This may represent an overestimate because of the coarse 240-m resolution used to convert surveyed acreage to a yellow-cedar map in this management zone.
Extent of yellow-cedar decline— There is no known yellow-cedar decline in this management zone. No mortality was seen during the aerial survey flights in 2012 that produced the distribution map of yellow-cedar in Glacier Bay National Park (see section 1).
Extent of yellow-cedar at future risk— Just 3 percent of yellow-cedar forests are projected to be at high risk in 2020, but this value is expected to rise to 27 percent by 2080 (fig. 94). Low risk prevails in 79 percent of yellow-cedar forests in 2020, but that share drops to 42 percent by 2080.

249
A Climate Adaptation Strategy for Conservation and Management of Yellow-Cedar in Alaska
There is an expected east-to-west progression of high-risk areas developing along the outer coast of Glacier Bay. Most of the yellow-cedar forests to the west of Lituya Bay and in higher elevation areas to the east are expected to remain in the low-risk category through 2080.
Landscapes in protected and active management zones— Most yellow-cedar forests in this management zone occur on lands administered by the U.S. Department of the Interior, National Park Service and hence are in protec-tion status.
Opportunities for conservation and management—The Glacier Bay yellow-ce-dar forests are currently healthy and appear to be regenerating. Forests that remain at low risk are expected to be important for yellow-cedar conservation. The increas-ing risk in other currently healthy yellow-cedar forests offers the opportunity to monitor the emergence of yellow-cedar decline. This monitoring could be accom-plished broadly by aerial survey or remote sensing, and on the ground near Graves Harbor and Dick’s Arm by remeasuring the permanent plots established by Oakes et al. (2015).
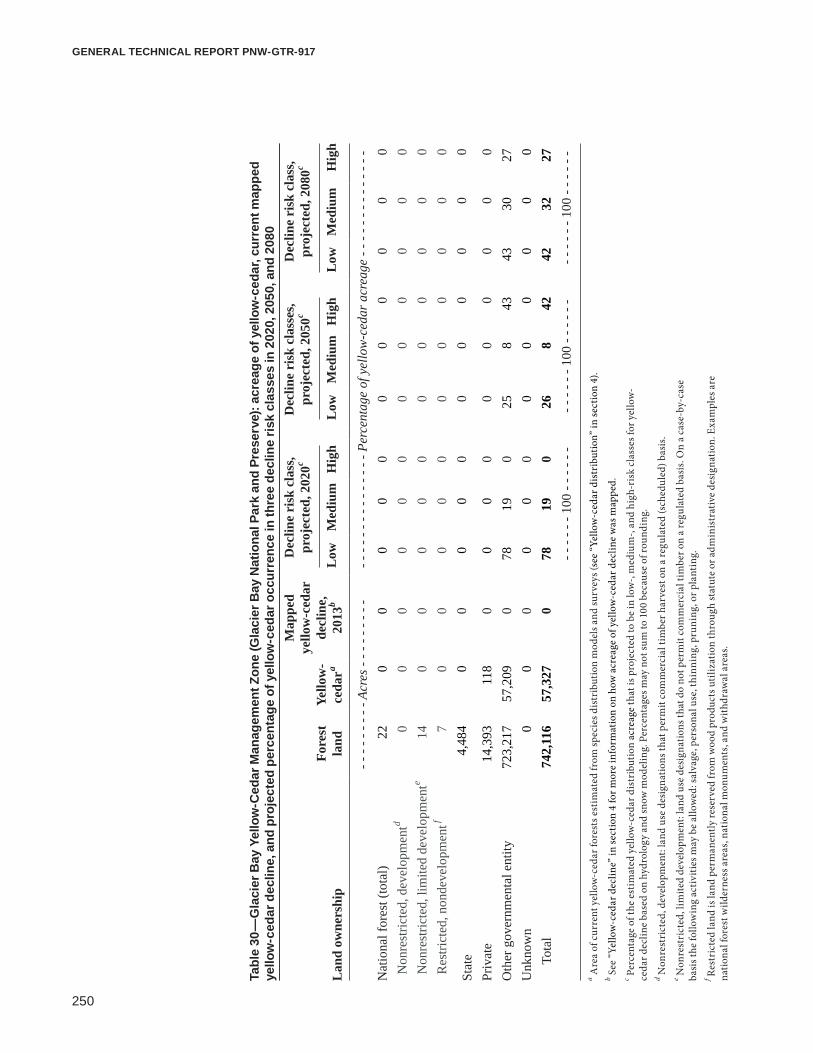
250
GENERAL TECHNICAL REPORT PNW-GTR-917
Tabl
e 30
—G
laci
er B
ay Y
ello
w-C
edar
Man
agem
ent Z
one
(Gla
cier
Bay
Nat
iona
l Par
k an
d Pr
eser
ve):
acre
age
of y
ello
w-c
edar
, cur
rent
map
ped
yello
w-c
edar
dec
line,
and
pro
ject
ed p
erce
ntag
e of
yel
low
-ced
ar o
ccur
renc
e in
thre
e de
clin
e ris
k cl
asse
s in
202
0, 2
050,
and
208
0
Lan
d ow
ners
hip
Fore
st
land
Yello
w-
ceda
ra
Map
ped
ye
llow
-ced
ar
decl
ine,
20
13b
Dec
line
risk
cla
ss,
proj
ecte
d, 2
020c
Dec
line
risk
cla
sses
, pr
ojec
ted,
205
0cD
eclin
e ri
sk c
lass
, pr
ojec
ted,
208
0c
Low
Med
ium
Hig
hL
owM
ediu
mH
igh
Low
Med
ium
Hig
h
- - -
- - -
- - -
Acre
s - -
- - -
- - -
- - -
- - -
- - -
- - -
- - -
- Pe
rcen
tage
of y
ello
w-c
edar
acr
eage
- - -
- - -
- - -
- - -
- -
Nat
iona
l for
est (
tota
l)22
00
00
00
00
00
0 N
onre
stric
ted,
dev
elop
men
td0
00
00
00
00
00
0 N
onre
stric
ted,
lim
ited
deve
lopm
ente
140
00
00
00
00
00
Res
trict
ed, n
onde
velo
pmen
tf7
00
00
00
00
00
0
Stat
e 4,
484
00
00
00
00
00
0
Priv
ate
14,3
9311
80
00
00
00
00
0O
ther
gov
ernm
enta
l ent
ity72
3,21
757
,209
078
190
258
4343
3027
Unk
now
n0
00
00
00
00
00
0
Tot
al74
2,11
657
,327
078
190
268
4242
3227
- - -
- - -
100
- - -
- - -
- - -
- - -
100
- - -
- - -
- - -
- - -
100
- - -
- - -
a Are
a of
cur
rent
yel
low
-ced
ar fo
rest
s est
imat
ed fr
om sp
ecie
s dis
trib
utio
n m
odel
s and
surv
eys (
see
“Yel
low
-ced
ar d
istr
ibut
ion”
in se
ctio
n 4)
.b S
ee “Y
ello
w-c
edar
dec
line”
in se
ctio
n 4
for m
ore
info
rmat
ion
on h
ow a
crea
ge o
f yel
low
-ced
ar d
eclin
e w
as m
appe
d.
c Per
cent
age
of th
e es
timat
ed y
ello
w-c
edar
dis
trib
utio
n ac
reag
e th
at is
pro
ject
ed to
be
in lo
w-,
med
ium
-, an
d hi
gh-r
isk
clas
ses f
or y
ello
w-
ceda
r dec
line
base
d on
hyd
rolo
gy a
nd sn
ow m
odel
ing.
Per
cent
ages
may
not
sum
to 1
00 b
ecau
se o
f rou
ndin
g.
d Non
rest
rict
ed, d
evel
opm
ent:
land
use
des
igna
tions
that
per
mit
com
mer
cial
tim
ber h
arve
st o
n a
regu
late
d (s
ched
uled
) bas
is.
e Non
rest
rict
ed, l
imite
d de
velo
pmen
t: la
nd u
se d
esig
natio
ns th
at d
o no
t per
mit
com
mer
cial
tim
ber o
n a
regu
late
d ba
sis.
On
a ca
se-b
y-ca
se
basi
s the
follo
win
g ac
tiviti
es m
ay b
e al
low
ed: s
alva
ge, p
erso
nal u
se, t
hinn
ing,
pru
ning
, or p
lant
ing.
f R
estr
icte
d la
nd is
land
per
man
ently
rese
rved
from
woo
d pr
oduc
ts u
tiliz
atio
n th
roug
h st
atut
e or
adm
inis
trat
ive
desi
gnat
ion.
Exa
mpl
es a
re
natio
nal f
ores
t wild
erne
ss a
reas
, nat
iona
l mon
umen
ts, a
nd w
ithdr
awal
are
as.
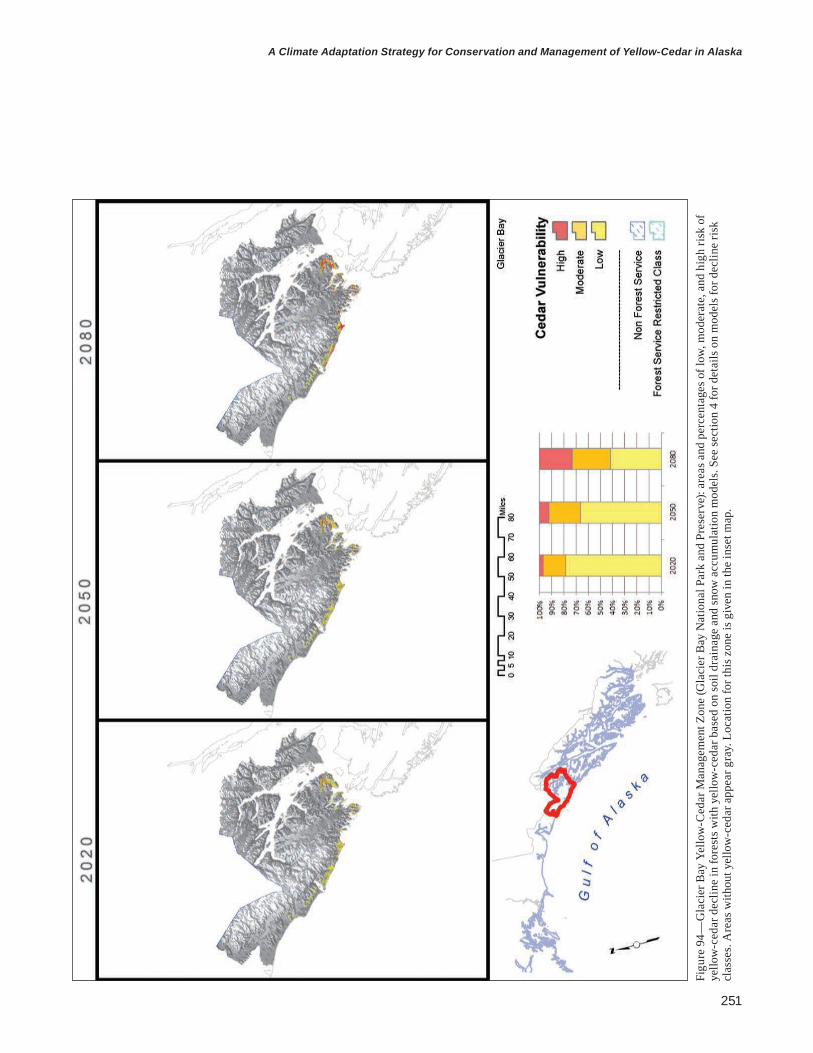
251
A Climate Adaptation Strategy for Conservation and Management of Yellow-Cedar in Alaska
Figu
re 9
4—G
laci
er B
ay Y
ello
w-C
edar
Man
agem
ent Z
one
(Gla
cier
Bay
Nat
iona
l Par
k an
d Pr
eser
ve):
area
s and
per
cent
ages
of l
ow, m
oder
ate,
and
hig
h ris
k of
ye
llow
-ced
ar d
eclin
e in
fore
sts w
ith y
ello
w-c
edar
bas
ed o
n so
il dr
aina
ge a
nd sn
ow a
ccum
ulat
ion
mod
els.
See
sect
ion
4 fo
r det
ails
on
mod
els f
or d
eclin
e ris
k cl
asse
s. A
reas
with
out y
ello
w-c
edar
app
ear g
ray.
Loc
atio
n fo
r thi
s zon
e is
giv
en in
the
inse
t map
.

252
GENERAL TECHNICAL REPORT PNW-GTR-917
7. Haines Geomorphology and climate— The vegetated area of this management zone comprises the Chilkat complex of sed-imentary and volcanic rock. The zone is considerably drier than many other areas of southeast Alaska and has a glacially carved landscape. Coniferous forest is located on colluvial toeslopes, and deciduous vegetation covers much of the remaining area. There may be little opportunity for yellow-cedar to occupy this zone because of the drier conditions and frequency of fire. At sea level, the average annual tempera-ture ranges from a minimum of 35 °F to a maximum of 48 °F. The average annual precipitation is 47 in, and the average annual snowfall is 122 in (Haines observation station, 503490).
Extent of yellow-cedar— A 40-ac stand (table 31) of yellow-cedar occurs in this management zone just north of Haines. Yellow-cedar is also present in a forest inventory plot on the mainland across Lynn Canal from Haines, but the extent of this yellow-cedar forest is not known. Note that this latter population is in the Juneau management zone.
Extent of yellow-cedar decline— The small yellow-cedar forest near Haines currently appears healthy.
Extent of yellow-cedar at future risk— Most of the small population near Haines is projected to be at low risk in 2020, but >60 percent is projected to be at medium risk in 2050 and 2080 (fig. 95). Our snow accumulation model may not portray risk as accurately in locations with cold win-ters but relatively dry conditions because the hydrology model is not as well cali-brated for interior climates such as parts of the Haines management zone.
Landscapes in protected and active management zones— The small yellow-cedar population in this zone is managed by the State in the Haines State Forest. This area would be available for timber harvest, but logging is unlikely because the yellow-cedar stand is in a forested wetland (personal commu-nication, Roy Josephson, Alaska Department of Natural Resources, 2014).
Opportunities for conservation and management— Thinning or other silvicultural activities in the small stand are permissible but unlikely and probably unnecessary. The genetics of this isolated stand may also be of interest because it represents an outlier to the north of most yellow-cedar on

253
A Climate Adaptation Strategy for Conservation and Management of Yellow-Cedar in Alaska
the Panhandle. Collections from 10 trees have been made and are available at the Juneau Forestry Sciences Laboratory. This currently healthy population could be monitored because risk of decline may increase in the future. Other actively man-aged lands on the Haines State Forest might be available to plant yellow-cedar to initiate new stands on well-drained soils.

254
GENERAL TECHNICAL REPORT PNW-GTR-917
Tabl
e 31
—H
aine
s Ye
llow
-Ced
ar M
anag
emen
t Zon
e: a
crea
ge o
f yel
low
-ced
ar, c
urre
nt m
appe
d ye
llow
-ced
ar d
eclin
e, a
nd p
roje
cted
pe
rcen
tage
of y
ello
w-c
edar
occ
urre
nce
in th
ree
decl
ine
risk
cla
sses
in 2
020,
205
0, a
nd 2
080
Lan
d ow
ners
hip
Fore
st
land
Yello
w-
ceda
ra
Map
ped
ye
llow
-ced
ar
decl
ine,
20
13b
Dec
line
risk
cla
ss,
proj
ecte
d, 2
020c
Dec
line
risk
cla
sses
, pr
ojec
ted,
205
0cD
eclin
e ri
sk c
lass
, pr
ojec
ted,
208
0c
Low
Med
ium
Hig
hL
owM
ediu
mH
igh
Low
Med
ium
Hig
h
- - -
- - -
- - -
Acre
s - -
- - -
- - -
- - -
- - -
- - -
- - -
- - -
- Pe
rcen
tage
of y
ello
w-c
edar
acr
eage
- - -
- - -
- - -
- - -
- -
Nat
iona
l for
est (
tota
l)94
00
00
00
00
00
0 N
onre
stric
ted,
dev
elop
men
td0
00
00
00
00
00
0 N
onre
stric
ted,
lim
ited
deve
lopm
ente
130
00
00
00
00
00
Res
trict
ed, n
onde
velo
pmen
tf81
00
00
00
00
00
0
Stat
e 22
8,42
340
071
290
690
55
6629
Priv
ate
64,4
670
00
00
00
00
00
Oth
er g
over
nmen
tal e
ntity
30,9
380
00
00
00
00
00
Unk
now
n0
00
00
00
00
00
0
Tot
al32
3,92
240
071
290
690
55
6629
- - -
- - -
100
- - -
- - -
- - -
- - -
100
- - -
- - -
- - -
- - -
100
- - -
- - -
a Are
a of
cur
rent
yel
low
-ced
ar fo
rest
s est
imat
ed fr
om sp
ecie
s dis
trib
utio
n m
odel
s and
surv
eys (
see
“Yel
low
-ced
ar d
istr
ibut
ion”
in se
ctio
n 4)
.b S
ee “Y
ello
w-c
edar
dec
line”
in se
ctio
n 4
for m
ore
info
rmat
ion
on h
ow a
crea
ge o
f yel
low
-ced
ar d
eclin
e w
as m
appe
d.
c Per
cent
age
of th
e es
timat
ed y
ello
w-c
edar
dis
trib
utio
n ac
reag
e th
at is
pro
ject
ed to
be
in lo
w-,
med
ium
-, an
d hi
gh-r
isk
clas
ses f
or y
ello
w-
ceda
r dec
line
base
d on
hyd
rolo
gy a
nd sn
ow m
odel
ing.
Per
cent
ages
may
not
sum
to 1
00 b
ecau
se o
f rou
ndin
g.
d Non
rest
rict
ed, d
evel
opm
ent:
land
use
des
igna
tions
that
per
mit
com
mer
cial
tim
ber h
arve
st o
n a
regu
late
d (s
ched
uled
) bas
is.
e Non
rest
rict
ed, l
imite
d de
velo
pmen
t: la
nd u
se d
esig
natio
ns th
at d
o no
t per
mit
com
mer
cial
tim
ber o
n a
regu
late
d ba
sis.
On
a ca
se-b
y-ca
se
basi
s the
follo
win
g ac
tiviti
es m
ay b
e al
low
ed: s
alva
ge, p
erso
nal u
se, t
hinn
ing,
pru
ning
, or p
lant
ing.
f R
estr
icte
d la
nd is
land
per
man
ently
rese
rved
from
woo
d pr
oduc
ts u
tiliz
atio
n th
roug
h st
atut
e or
adm
inis
trat
ive
desi
gnat
ion.
Exa
mpl
es a
re
natio
nal f
ores
t wild
erne
ss a
reas
, nat
iona
l mon
umen
ts, a
nd w
ithdr
awal
are
as.

255
A Climate Adaptation Strategy for Conservation and Management of Yellow-Cedar in Alaska
Figu
re 9
5—H
aine
s Yel
low
-Ced
ar M
anag
emen
t Zon
e: a
reas
and
per
cent
ages
of l
ow, m
oder
ate,
and
hig
h ris
k of
yel
low
-ced
ar d
eclin
e in
fore
sts w
ith y
ello
w-c
edar
ba
sed
on so
il dr
aina
ge a
nd sn
ow a
ccum
ulat
ion
mod
els.
See
sect
ion
4 fo
r det
ails
on
mod
els f
or d
eclin
e ris
k cl
asse
s. A
reas
with
out y
ello
w-c
edar
app
ear g
ray.
Loc
a-tio
n fo
r thi
s zon
e is
giv
en in
the
inse
t map
. Arr
ows i
ndic
ate
yello
w-c
edar
pop
ulat
ions
.

256
GENERAL TECHNICAL REPORT PNW-GTR-917
8. Chichagof NorthGeomorphology and climate— The Freshwater Bay and Point Adolphus Carbonates ecological subsections make up a large part of this management zone on the north and northeast side of Chichagof Island. The area has been extensively reworked by glacial action, leav-ing abundant till, alluvium, and colluvial deposits. The zone has a large component of productive forest, but also contains uplifted glaciomarine features with low-ele-vation wetlands. There are extensive rich fens and areas of emergent peatland. To the west lie the North Chichagof Granitics, a rugged subsection with steep, sparsely vegetated mountain slopes and coniferous forests limited to valleys and toeslopes. Climate is variable in this management zone, ranging from very wet in the west to drier in rain shadow areas around the community of Hoonah. In the drier area, the average annual temperatures range from a minimum of 37 °F to a maximum of 48 °F. The average annual precipitation is 62 in, and the average annual snowfall is 87 in (Hoonah observation station, 503695). To the west, average annual temperatures are the same as in the east, but the average annual precipitation is 150 in and the average annual snowfall is 109 in. In Elfin Cove, the average annual temperature ranges from a minimum of 39 °F to a maximum of 47 °F. The average annual pre-cipitation is 102 in, and the average annual snowfall is 96 in (Elfin Cove observa-tion station, 502785).
Extent of yellow-cedar— An estimated 43,000 ac of yellow-cedar occur in this management zone, which ac-counts for 1.9 percent of the yellow-cedar acreage in Alaska (table 32). Yellow-cedar occurrence is patchy in this management zone. It is very abundant in the western region around Yakobi Island, but its distribution to the east around Port Frederick is discontinuous despite large areas of unoccupied suitable habitat. We suspect that historical migration patterns explain the uneven occurrence of yellow-cedar in this management zone.
Extent of yellow-cedar decline— Most of the existing yellow-cedar forests appear healthy; only 357 ac of decline have been mapped by aerial survey.
Extent of yellow-cedar at future risk— Between 2020 and 2080, the percentage of yellow-cedar forests at high risk is ex-pected to rise from 12 percent to 30 percent (mostly in the eastern portion of this zone), and the percentage at low risk is expected to decline from 61 percent to 25 percent (fig. 96). Sizable areas in the Yakobi Island area are expected to move from
257
A Climate Adaptation Strategy for Conservation and Management of Yellow-Cedar in Alaska
low to high risk. The largest concentrations of yellow-cedar forests that persist at low risk by 2080 are near Lisianski Inlet and Port Althorp.
Landscapes in protected and active management zones— The bulk of the 43,000 ac of yellow-cedar and surrounding forested land in this management zone is managed by the U.S. Forest Service, but there is some yel-low-cedar acreage in other ownerships. On land managed by the Forest Service, nearly 10,000 ac of yellow-cedar are in development zones. More than 30,000 ac of yellow-cedar forest are located in the nondevelopment and restricted land-use categories.
Opportunities for conservation and management— Many of the yellow-cedar forests in this management zone are expected to go through dynamic change, as there is currently little decline but risk is expected to increase through time. There will be new opportunities to salvage dead yellow-cedar on managed landscapes. Yellow-cedar could be planted or promoted through thinning in young forests or harvested areas with productive soils in managed land-scapes on various land ownerships. On protected landscapes, the population sta-bility of yellow-cedar is expected to be compromised. Western hemlock and other species will take the place of yellow-cedar in declining stands. Yellow-cedar forests are expected to be maintained in the lower risk areas at higher elevations, and on sites with suitable drainage.
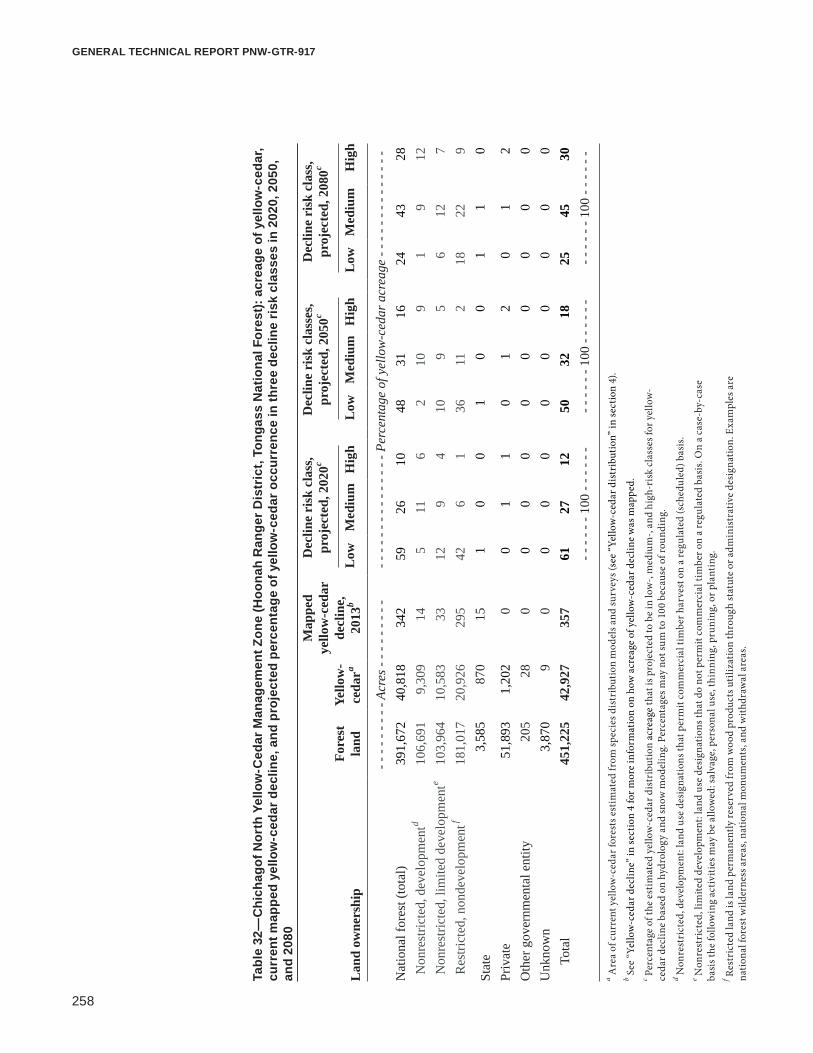
258
GENERAL TECHNICAL REPORT PNW-GTR-917
Tabl
e 32
—C
hich
agof
Nor
th Y
ello
w-C
edar
Man
agem
ent Z
one
(Hoo
nah
Ran
ger D
istr
ict,
Tong
ass
Nat
iona
l For
est):
acr
eage
of y
ello
w-c
edar
, cu
rren
t map
ped
yello
w-c
edar
dec
line,
and
pro
ject
ed p
erce
ntag
e of
yel
low
-ced
ar o
ccur
renc
e in
thre
e de
clin
e ri
sk c
lass
es in
202
0, 2
050,
an
d 20
80
Lan
d ow
ners
hip
Fore
st
land
Yello
w-
ceda
ra
Map
ped
ye
llow
-ced
ar
decl
ine,
20
13b
Dec
line
risk
cla
ss,
proj
ecte
d, 2
020c
Dec
line
risk
cla
sses
, pr
ojec
ted,
205
0cD
eclin
e ri
sk c
lass
, pr
ojec
ted,
208
0c
Low
Med
ium
Hig
hL
owM
ediu
mH
igh
Low
Med
ium
Hig
h
- - -
- - -
- - -
Acre
s - -
- - -
- - -
- - -
- - -
- - -
- - -
- - -
- Pe
rcen
tage
of y
ello
w-c
edar
acr
eage
- - -
- - -
- - -
- - -
- -
Nat
iona
l for
est (
tota
l)39
1,67
240
,818
342
5926
1048
3116
2443
28 N
onre
stric
ted,
dev
elop
men
td10
6,69
19,
309
145
116
210
91
912
Non
rest
ricte
d, li
mite
d de
velo
pmen
te10
3,96
410
,583
3312
94
109
56
127
Res
trict
ed, n
onde
velo
pmen
tf18
1,01
720
,926
295
426
136
112
1822
9
Stat
e 3,
585
870
151
00
10
01
10
Priv
ate
51,8
931,
202
00
11
01
20
12
Oth
er g
over
nmen
tal e
ntity
205
280
00
00
00
00
0U
nkno
wn
3,87
09
00
00
00
00
00
T
otal
451,
225
42,9
2735
761
2712
5032
1825
4530
- - -
- - -
100
- - -
- - -
- - -
- - -
100
- - -
- - -
- - -
- - -
100
- - -
- - -
a Are
a of
cur
rent
yel
low
-ced
ar fo
rest
s est
imat
ed fr
om sp
ecie
s dis
trib
utio
n m
odel
s and
surv
eys (
see
“Yel
low
-ced
ar d
istr
ibut
ion”
in se
ctio
n 4)
.b S
ee “Y
ello
w-c
edar
dec
line”
in se
ctio
n 4
for m
ore
info
rmat
ion
on h
ow a
crea
ge o
f yel
low
-ced
ar d
eclin
e w
as m
appe
d.
c Per
cent
age
of th
e es
timat
ed y
ello
w-c
edar
dis
trib
utio
n ac
reag
e th
at is
pro
ject
ed to
be
in lo
w-,
med
ium
-, an
d hi
gh-r
isk
clas
ses f
or y
ello
w-
ceda
r dec
line
base
d on
hyd
rolo
gy a
nd sn
ow m
odel
ing.
Per
cent
ages
may
not
sum
to 1
00 b
ecau
se o
f rou
ndin
g.
d Non
rest
rict
ed, d
evel
opm
ent:
land
use
des
igna
tions
that
per
mit
com
mer
cial
tim
ber h
arve
st o
n a
regu
late
d (s
ched
uled
) bas
is.
e Non
rest
rict
ed, l
imite
d de
velo
pmen
t: la
nd u
se d
esig
natio
ns th
at d
o no
t per
mit
com
mer
cial
tim
ber o
n a
regu
late
d ba
sis.
On
a ca
se-b
y-ca
se
basi
s the
follo
win
g ac
tiviti
es m
ay b
e al
low
ed: s
alva
ge, p
erso
nal u
se, t
hinn
ing,
pru
ning
, or p
lant
ing.
f R
estr
icte
d la
nd is
land
per
man
ently
rese
rved
from
woo
d pr
oduc
ts u
tiliz
atio
n th
roug
h st
atut
e or
adm
inis
trat
ive
desi
gnat
ion.
Exa
mpl
es a
re
natio
nal f
ores
t wild
erne
ss a
reas
, nat
iona
l mon
umen
ts, a
nd w
ithdr
awal
are
as.

259
A Climate Adaptation Strategy for Conservation and Management of Yellow-Cedar in Alaska
Figu
re 9
6—C
hich
agof
Nor
th Y
ello
w-C
edar
Man
agem
ent Z
one
(Hoo
nah
Ran
ger D
istr
ict,
Tong
ass N
atio
nal F
ores
t): a
reas
and
per
cent
ages
of l
ow, m
oder
ate,
and
hi
gh ri
sk o
f yel
low
-ced
ar d
eclin
e in
fore
sts w
ith y
ello
w-c
edar
bas
ed o
n so
il dr
aina
ge a
nd sn
ow a
ccum
ulat
ion
mod
els.
See
sect
ion
4 fo
r det
ails
on
mod
els f
or d
eclin
e ris
k cl
asse
s. A
reas
with
out y
ello
w-c
edar
app
ear g
ray.
Loc
atio
n fo
r thi
s zon
e is
giv
en in
the
inse
t map
.

260
GENERAL TECHNICAL REPORT PNW-GTR-917
9. Chichagof SouthGeomorphology and climate— Granitic rock of the Peril Strait Granitics subsection and sedimentary materials of the West Chichagof subsection make up most of this management zone. Although there are many glacial scour features, nearly half of the West Chichagof complex is composed of nonproductive forest and extensive yellow-cedar habitat. The Peril Strait Granitics are similar, with about one-third of the area in nonproductive for-est. The uplands and forested wetlands provide ample habitat for yellow-cedar on wet Spodosols and Histosols. The winter climate and associated snowfall are quite variable because of the gradient from western coastal areas to central mountain ranges dissected by Hoonah Sound and Tenakee Inlet. The average annual tempera-ture ranges from a minimum of 35 °F to a maximum of 49 °F. The average annual precipitation is 68 in, and the average annual snowfall is 97 in (Tenakee Springs observation station, 509121).
Extent of yellow-cedar— Yellow-cedar is an important component of the forested land in this management zone, especially in the southwestern portion. An estimated 117,000 ac of yellow-cedar forest occur in this management zone, which accounts for 5.1 percent of the yellow-cedar acreage in Alaska (table 33).
Extent of yellow-cedar decline— Yellow-cedar decline has been mapped on 41,000 ac and is a visible part of the landscape in Peril Strait and along the southwest coast of Chichagof Island. This acreage accounts for 7.2 percent of the mapped yellow-cedar decline in Alaska. The mortality appears intensive in some areas because yellow-cedar was often a signifi-cant component of forests before the onset of mortality.
Extent of yellow-cedar at future risk— The percentage of yellow-cedar forests expected to be at high risk rises from 14 to 28 percent between 2020 and 2080 (fig. 97). Some of the increased risk occurs to the north along the coast, consistent with the documented northerly progression of yellow-cedar decline in Slocum Arm of southwest Chichagof Island (Oakes et al. 2014). By 2080, many low-elevation yellow-cedar forests are at high risk, and low risk is reduced to 14 percent of all yellow-cedar forests.
261
A Climate Adaptation Strategy for Conservation and Management of Yellow-Cedar in Alaska
Landscapes in protected and active management zones— Nearly all of the yellow-cedar forests and forests with mapped yellow-cedar decline are on land managed by the U.S. Forest Service, with sizable acreage in all three management categories. The West Chichagof–Yakobi Wilderness Area occupies the largest acreage of yellow-cedar and current decline.
Opportunities for conservation and management— The yellow-cedar forests in this zone have already had substantial mortality, espe-cially along Peril Strait and the large West Chichagof–Yakobi Wilderness Area to the west. More than 70,000 ac of yellow-cedar forest are in protection status in this management zone. The decline-affected forests mark the northernmost extent of severe yellow-cedar decline in Alaska, and many of these forests were previously dominated by yellow-cedar. The health status and population stability of yellow-cedar in protected areas have been, and will continue to be, severely affected as decline advances northward and upward in elevation. Oakes et al. (2014) document-ed succession to western hemlock and other species in decline-affected stands on outer Chichagof Island. This change in forest composition appears to be a long-term conversion because of the scarcity of yellow-cedar natural regeneration. The per-manent plots in this study could be used to monitor further successional changes. Opportunities to salvage harvest dead yellow-cedar may be limited because of the few road systems in this management zone. Yellow-cedar is expected to remain at low risk at the highest elevations of its occurrence and on well-drained soils, where it is not a major component.

262
GENERAL TECHNICAL REPORT PNW-GTR-917
Tabl
e 33
—C
hich
agof
Sou
th Y
ello
w-C
edar
Man
agem
ent Z
one
(Sitk
a R
ange
r Dis
tric
t, To
ngas
s N
atio
nal F
ores
t): a
crea
ge o
f yel
low
-ced
ar,
curr
ent m
appe
d ye
llow
-ced
ar d
eclin
e, a
nd p
roje
cted
per
cent
age
of y
ello
w-c
edar
occ
urre
nce
in th
ree
decl
ine
risk
cla
sses
in 2
020,
205
0,
and
2080
Lan
d ow
ners
hip
Fore
st
land
Yello
w-
ceda
ra
Map
ped
ye
llow
-ced
ar
decl
ine,
20
13b
Dec
line
risk
cla
ss,
proj
ecte
d, 2
020c
Dec
line
risk
cla
sses
, pr
ojec
ted,
205
0cD
eclin
e ri
sk c
lass
, pr
ojec
ted,
208
0c
Low
Med
ium
Hig
hL
owM
ediu
mH
igh
Low
Med
ium
Hig
h
- - -
- - -
- - -
Acre
s - -
- - -
- - -
- - -
- - -
- - -
- - -
- - -
- Pe
rcen
tage
of y
ello
w-c
edar
acr
eage
- - -
- - -
- - -
- - -
- -
Nat
iona
l for
est (
tota
l)53
3,05
411
5,61
440
,833
4540
1431
4721
1457
28 N
onre
stric
ted,
dev
elop
men
td18
2,87
327
,255
8,10
47
115
412
72
138
Non
rest
ricte
d, li
mite
d de
velo
pmen
te97
,391
18,3
455,
445
67
33
84
110
5 R
estri
cted
, non
deve
lopm
entf
252,
790
70,0
1427
,284
3222
723
2610
1134
15
Stat
e 4,
000
689
00
00
00
00
00
Priv
ate
9,09
353
620
20
00
00
00
00
Oth
er g
over
nmen
tal e
ntity
656
00
00
00
00
00
Unk
now
n4,
248
1626
00
00
00
00
0
Tot
al55
0,46
011
6,86
141
,061
4541
1431
4821
1458
28- -
- - -
- 10
0 - -
- - -
- - -
- - -
- 10
0 - -
- - -
- - -
- - -
- 10
0 - -
- - -
- a A
rea
of c
urre
nt y
ello
w-c
edar
fore
sts e
stim
ated
from
spec
ies d
istr
ibut
ion
mod
els a
nd su
rvey
s (se
e “Y
ello
w-c
edar
dis
trib
utio
n” in
sect
ion
4).
b See
“Yel
low
-ced
ar d
eclin
e” in
sect
ion
4 fo
r mor
e in
form
atio
n on
how
acr
eage
of y
ello
w-c
edar
dec
line
was
map
ped.
c P
erce
ntag
e of
the
estim
ated
yel
low
-ced
ar d
istr
ibut
ion
acre
age
that
is p
roje
cted
to b
e in
low
-, m
ediu
m-,
and
high
-ris
k cl
asse
s for
yel
low
- ce
dar d
eclin
e ba
sed
on h
ydro
logy
and
snow
mod
elin
g. P
erce
ntag
es m
ay n
ot su
m to
100
bec
ause
of r
ound
ing.
d N
onre
stri
cted
, dev
elop
men
t: la
nd u
se d
esig
natio
ns th
at p
erm
it co
mm
erci
al ti
mbe
r har
vest
on
a re
gula
ted
(sch
edul
ed) b
asis
.e N
onre
stri
cted
, lim
ited
deve
lopm
ent:
land
use
des
igna
tions
that
do
not p
erm
it co
mm
erci
al ti
mbe
r on
a re
gula
ted
basi
s. O
n a
case
-by-
case
ba
sis t
he fo
llow
ing
activ
ities
may
be
allo
wed
: sal
vage
, per
sona
l use
, thi
nnin
g, p
runi
ng, o
r pla
ntin
g.
f Res
tric
ted
land
is la
nd p
erm
anen
tly re
serv
ed fr
om w
ood
prod
ucts
util
izat
ion
thro
ugh
stat
ute
or a
dmin
istr
ativ
e de
sign
atio
n. E
xam
ples
are
na
tiona
l for
est w
ilder
ness
are
as, n
atio
nal m
onum
ents
, and
with
draw
al a
reas
.
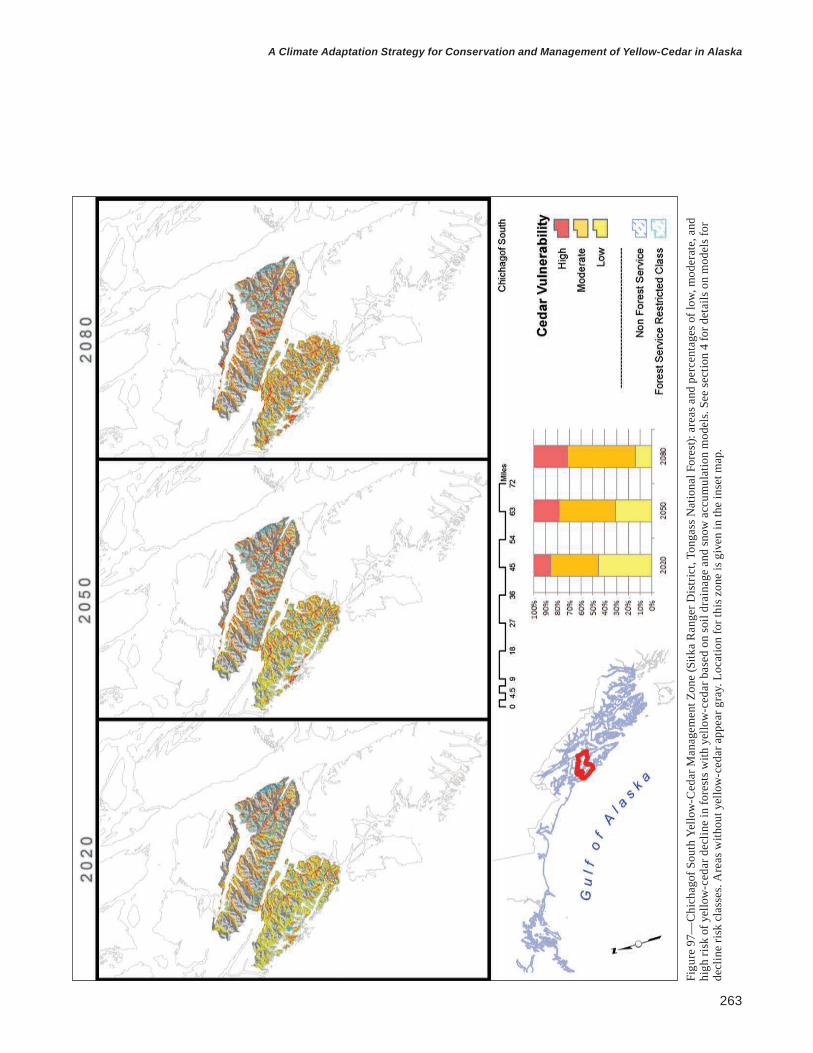
263
A Climate Adaptation Strategy for Conservation and Management of Yellow-Cedar in Alaska
Figu
re 9
7—C
hich
agof
Sou
th Y
ello
w-C
edar
Man
agem
ent Z
one
(Sitk
a R
ange
r Dis
tric
t, To
ngas
s Nat
iona
l For
est):
are
as a
nd p
erce
ntag
es o
f low
, mod
erat
e, a
nd
high
risk
of y
ello
w-c
edar
dec
line
in fo
rest
s with
yel
low
-ced
ar b
ased
on
soil
drai
nage
and
snow
acc
umul
atio
n m
odel
s. Se
e se
ctio
n 4
for d
etai
ls o
n m
odel
s for
de
clin
e ris
k cl
asse
s. A
reas
with
out y
ello
w-c
edar
app
ear g
ray.
Loc
atio
n fo
r thi
s zon
e is
giv
en in
the
inse
t map
.
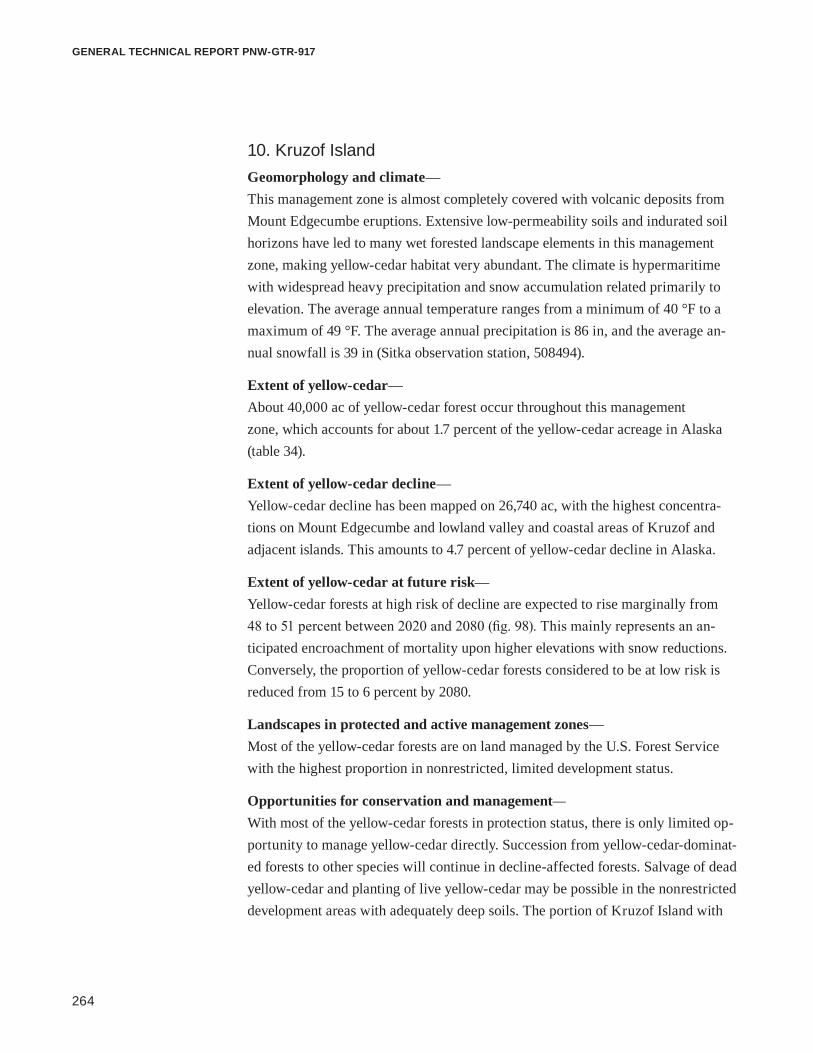
264
GENERAL TECHNICAL REPORT PNW-GTR-917
10. Kruzof IslandGeomorphology and climate— This management zone is almost completely covered with volcanic deposits from Mount Edgecumbe eruptions. Extensive low-permeability soils and indurated soil horizons have led to many wet forested landscape elements in this management zone, making yellow-cedar habitat very abundant. The climate is hypermaritime with widespread heavy precipitation and snow accumulation related primarily to elevation. The average annual temperature ranges from a minimum of 40 °F to a maximum of 49 °F. The average annual precipitation is 86 in, and the average an-nual snowfall is 39 in (Sitka observation station, 508494).
Extent of yellow-cedar— About 40,000 ac of yellow-cedar forest occur throughout this management zone, which accounts for about 1.7 percent of the yellow-cedar acreage in Alaska (table 34).
Extent of yellow-cedar decline— Yellow-cedar decline has been mapped on 26,740 ac, with the highest concentra-tions on Mount Edgecumbe and lowland valley and coastal areas of Kruzof and adjacent islands. This amounts to 4.7 percent of yellow-cedar decline in Alaska.
Extent of yellow-cedar at future risk— Yellow-cedar forests at high risk of decline are expected to rise marginally from 48 to 51 percent between 2020 and 2080 (fig. 98). This mainly represents an an-ticipated encroachment of mortality upon higher elevations with snow reductions. Conversely, the proportion of yellow-cedar forests considered to be at low risk is reduced from 15 to 6 percent by 2080.
Landscapes in protected and active management zones— Most of the yellow-cedar forests are on land managed by the U.S. Forest Service with the highest proportion in nonrestricted, limited development status.
Opportunities for conservation and management— With most of the yellow-cedar forests in protection status, there is only limited op-portunity to manage yellow-cedar directly. Succession from yellow-cedar-dominat-ed forests to other species will continue in decline-affected forests. Salvage of dead yellow-cedar and planting of live yellow-cedar may be possible in the nonrestricted development areas with adequately deep soils. The portion of Kruzof Island with

265
A Climate Adaptation Strategy for Conservation and Management of Yellow-Cedar in Alaska
a road system is one area for potential active management. Protection of planted seedlings would be necessary because of high deer populations in the area. The radial symmetry of Mount Edgecumbe offers an unusual prospect to measure the influence of elevation and aspect on environmental factors. Yellow-cedar is regen-erating well near timberline, just below the mountain hemlock zone. There is an op-portunity to monitor the active upslope advance of yellow-cedar decline on Mount Edgecumbe as snow levels are reduced in the future (Hennon et al. 2012).

266
GENERAL TECHNICAL REPORT PNW-GTR-917
Tabl
e 34
—K
ruzo
f Isl
and
Yello
w-C
edar
Man
agem
ent Z
one
(Sitk
a R
ange
r Dis
tric
t, To
ngas
s N
atio
nal F
ores
t): a
crea
ge o
f yel
low
-ced
ar,
curr
ent m
appe
d ye
llow
-ced
ar d
eclin
e, a
nd p
roje
cted
per
cent
age
of y
ello
w-c
edar
occ
urre
nce
in th
ree
decl
ine
risk
cla
sses
in 2
020,
205
0,
and
2080
Lan
d ow
ners
hip
Fore
st
land
Yello
w-
ceda
ra
Map
ped
ye
llow
-ced
ar
decl
ine,
20
13b
Dec
line
risk
cla
ss,
proj
ecte
d, 2
020c
Dec
line
risk
cla
sses
, pr
ojec
ted,
205
0cD
eclin
e ri
sk c
lass
, pr
ojec
ted,
208
0c
Low
Med
ium
Hig
hL
owM
ediu
mH
igh
Low
Med
ium
Hig
h
- - -
- - -
- - -
Acre
s - -
- - -
- - -
- - -
- - -
- - -
- - -
- - -
- Pe
rcen
tage
of y
ello
w-c
edar
acr
eage
- - -
- - -
- - -
- - -
- -
Nat
iona
l for
est (
tota
l)10
8,40
939
,217
26,4
6115
3748
940
506
4351
Non
rest
ricte
d, d
evel
opm
entd
33,5
5110
,424
6,91
75
129
413
92
1510
Non
rest
ricte
d, li
mite
d de
velo
pmen
te74
,846
28,7
9019
,543
925
396
2740
428
41 R
estri
cted
, non
deve
lopm
entf
123
10
00
00
00
00
Stat
e 1,
594
233
192
00
00
00
00
0
Priv
ate
203
7686
00
00
00
00
0O
ther
gov
ernm
enta
l ent
ity0
00
00
00
00
00
0U
nkno
wn
1,56
42
10
00
00
00
00
T
otal
111,
770
39,5
2826
,740
1537
489
4150
643
51- -
- - -
- 10
0 - -
- - -
- - -
- - -
- 10
0 - -
- - -
- - -
- - -
- 10
0 - -
- - -
- a A
rea
of c
urre
nt y
ello
w-c
edar
fore
sts e
stim
ated
from
spec
ies d
istr
ibut
ion
mod
els a
nd su
rvey
s (se
e “Y
ello
w-c
edar
dis
trib
utio
n” in
sect
ion
4).
b See
“Yel
low
-ced
ar d
eclin
e” in
sect
ion
4 fo
r mor
e in
form
atio
n on
how
acr
eage
of y
ello
w-c
edar
dec
line
was
map
ped.
c P
erce
ntag
e of
the
estim
ated
yel
low
-ced
ar d
istr
ibut
ion
acre
age
that
is p
roje
cted
to b
e in
low
-, m
ediu
m-,
and
high
-ris
k cl
asse
s for
yel
low
- ce
dar d
eclin
e ba
sed
on h
ydro
logy
and
snow
mod
elin
g. P
erce
ntag
es m
ay n
ot su
m to
100
bec
ause
of r
ound
ing.
d N
onre
stri
cted
, dev
elop
men
t: la
nd u
se d
esig
natio
ns th
at p
erm
it co
mm
erci
al ti
mbe
r har
vest
on
a re
gula
ted
(sch
edul
ed) b
asis
.e N
onre
stri
cted
, lim
ited
deve
lopm
ent:
land
use
des
igna
tions
that
do
not p
erm
it co
mm
erci
al ti
mbe
r on
a re
gula
ted
basi
s. O
n a
case
-by-
case
ba
sis t
he fo
llow
ing
activ
ities
may
be
allo
wed
: sal
vage
, per
sona
l use
, thi
nnin
g, p
runi
ng, o
r pla
ntin
g.
f Res
tric
ted
land
is la
nd p
erm
anen
tly re
serv
ed fr
om w
ood
prod
ucts
util
izat
ion
thro
ugh
stat
ute
or a
dmin
istr
ativ
e de
sign
atio
n. E
xam
ples
are
na
tiona
l for
est w
ilder
ness
are
as, n
atio
nal m
onum
ents
, and
with
draw
al a
reas
.
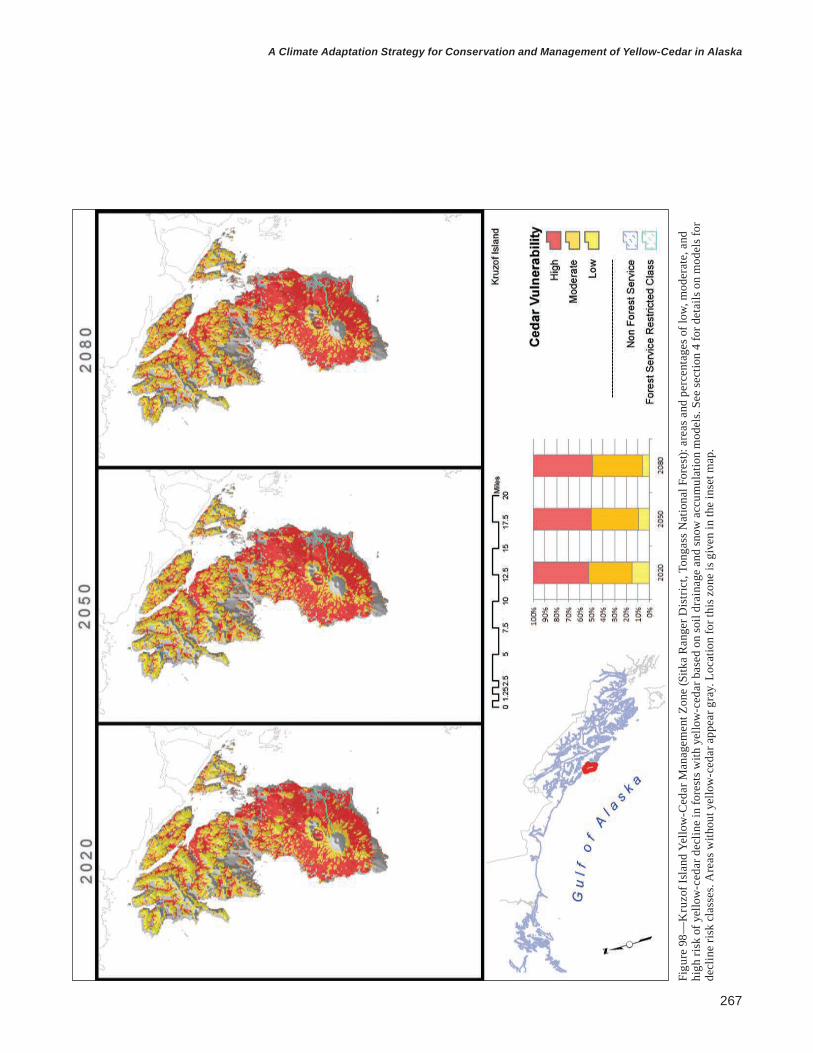
267
A Climate Adaptation Strategy for Conservation and Management of Yellow-Cedar in Alaska
Figu
re 9
8—K
ruzo
f Isl
and
Yello
w-C
edar
Man
agem
ent Z
one
(Sitk
a R
ange
r Dis
tric
t, To
ngas
s Nat
iona
l For
est):
are
as a
nd p
erce
ntag
es o
f low
, mod
erat
e, a
nd
high
risk
of y
ello
w-c
edar
dec
line
in fo
rest
s with
yel
low
-ced
ar b
ased
on
soil
drai
nage
and
snow
acc
umul
atio
n m
odel
s. Se
e se
ctio
n 4
for d
etai
ls o
n m
odel
s for
de
clin
e ris
k cl
asse
s. A
reas
with
out y
ello
w-c
edar
app
ear g
ray.
Loc
atio
n fo
r thi
s zon
e is
giv
en in
the
inse
t map
.
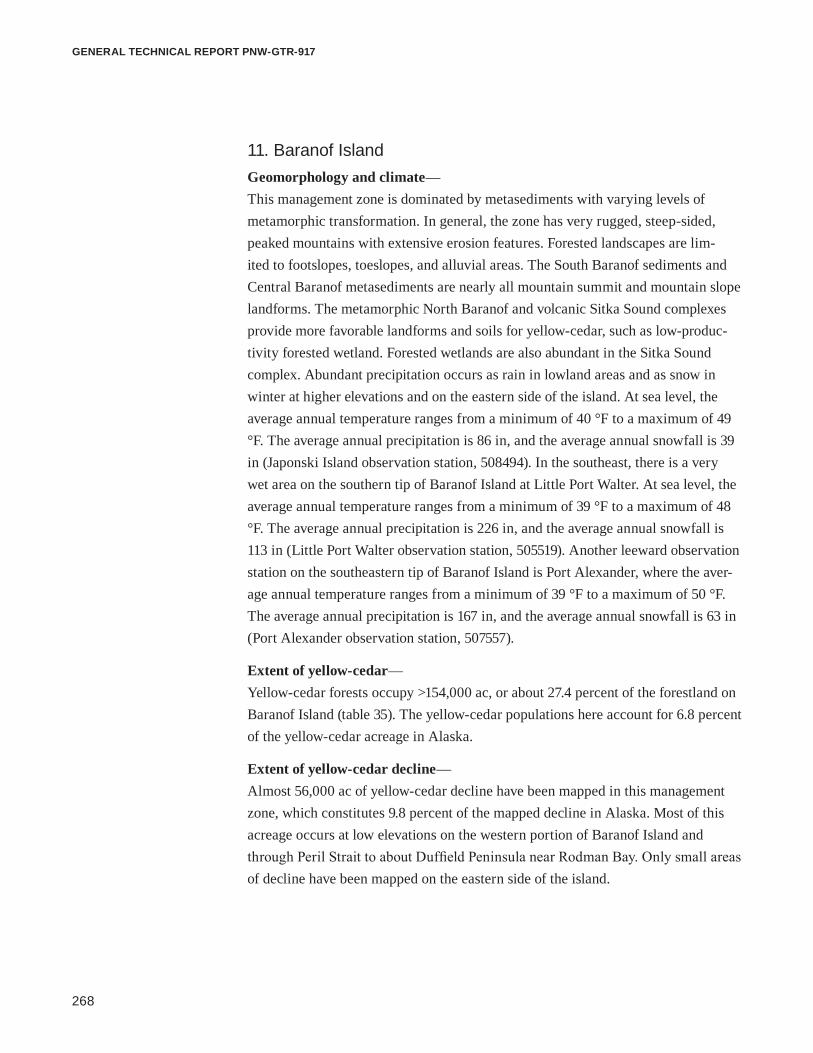
268
GENERAL TECHNICAL REPORT PNW-GTR-917
11. Baranof IslandGeomorphology and climate— This management zone is dominated by metasediments with varying levels of metamorphic transformation. In general, the zone has very rugged, steep-sided, peaked mountains with extensive erosion features. Forested landscapes are lim-ited to footslopes, toeslopes, and alluvial areas. The South Baranof sediments and Central Baranof metasediments are nearly all mountain summit and mountain slope landforms. The metamorphic North Baranof and volcanic Sitka Sound complexes provide more favorable landforms and soils for yellow-cedar, such as low-produc-tivity forested wetland. Forested wetlands are also abundant in the Sitka Sound complex. Abundant precipitation occurs as rain in lowland areas and as snow in winter at higher elevations and on the eastern side of the island. At sea level, the average annual temperature ranges from a minimum of 40 °F to a maximum of 49 °F. The average annual precipitation is 86 in, and the average annual snowfall is 39 in (Japonski Island observation station, 508494). In the southeast, there is a very wet area on the southern tip of Baranof Island at Little Port Walter. At sea level, the average annual temperature ranges from a minimum of 39 °F to a maximum of 48 °F. The average annual precipitation is 226 in, and the average annual snowfall is 113 in (Little Port Walter observation station, 505519). Another leeward observation station on the southeastern tip of Baranof Island is Port Alexander, where the aver-age annual temperature ranges from a minimum of 39 °F to a maximum of 50 °F. The average annual precipitation is 167 in, and the average annual snowfall is 63 in (Port Alexander observation station, 507557).
Extent of yellow-cedar— Yellow-cedar forests occupy >154,000 ac, or about 27.4 percent of the forestland on Baranof Island (table 35). The yellow-cedar populations here account for 6.8 percent of the yellow-cedar acreage in Alaska.
Extent of yellow-cedar decline— Almost 56,000 ac of yellow-cedar decline have been mapped in this management zone, which constitutes 9.8 percent of the mapped decline in Alaska. Most of this acreage occurs at low elevations on the western portion of Baranof Island and through Peril Strait to about Duffield Peninsula near Rodman Bay. Only small areas of decline have been mapped on the eastern side of the island.

269
A Climate Adaptation Strategy for Conservation and Management of Yellow-Cedar in Alaska
Extent of yellow-cedar at future risk— The share of acreage at high risk of yellow-cedar decline is expected to increase from 12 to 18 percent between 2020 and 2080, and the share of low risk shows a corresponding drop from 53 to 29 percent in the same period (fig. 99). Both sides of the southern portion of Baranof Island are expected to have increased risk. Coastal areas that are projected to remain generally at low risk through 2080 occur on the eastern side of Baranof Island from Kelp Bay south to Patterson Bay.
Landscapes in protected and active management zones— Most of Baranof Island is administered by the U.S. Forest Service with large amounts of land in nonrestricted, limited development and restricted, nondevelop-ment status, including the large South Baranof Wilderness Area. Only 16,000 ac of land managed by the Forest Service with yellow-cedar are in nonrestricted, devel-opment status.
Opportunities for conservation and management— This management zone contains extensive dead and dying yellow-cedar forests, many with a high yellow-cedar component. The large acreage of yellow-cedar for-est in protected status suggests only limited management opportunities. Salvage of dead yellow-cedar might be possible in some areas, but the lack of roads diminishes the economic feasibility of these treatments. Succession to other tree species will continue to occur in decline-affected forests. Regeneration of yellow-cedar at low elevations is expected to be limited by deer browse and lack of seed source where mature trees have died. Conservation of intact yellow-cedar forests will occur mainly at high elevations and along eastern portions of Baranof Island.

270
GENERAL TECHNICAL REPORT PNW-GTR-917
Tabl
e 35
—B
aran
of Is
land
Yel
low
-Ced
ar M
anag
emen
t Zon
e (S
itka
Ran
ger D
istr
ict,
Tong
ass
Nat
iona
l For
est):
acr
eage
of y
ello
w-c
edar
, cu
rren
t map
ped
yello
w-c
edar
dec
line,
and
pro
ject
ed p
erce
ntag
e of
yel
low
-ced
ar o
ccur
renc
e in
thre
e de
clin
e ri
sk c
lass
es in
202
0, 2
050,
an
d 20
80
Lan
d ow
ners
hip
Fore
st
land
Yello
w-
ceda
ra
Map
ped
ye
llow
-ced
ar
decl
ine,
20
13b
Dec
line
risk
cla
ss,
proj
ecte
d, 2
020c
Dec
line
risk
cla
sses
, pr
ojec
ted,
205
0cD
eclin
e ri
sk c
lass
, pr
ojec
ted,
208
0c
Low
Med
ium
Hig
hL
owM
ediu
mH
igh
Low
Med
ium
Hig
h
- - -
- - -
- - -
Acre
s - -
- - -
- - -
- - -
- - -
- - -
- - -
- - -
- Pe
rcen
tage
of y
ello
w-c
edar
acr
eage
- - -
- - -
- - -
- - -
- -
Nat
iona
l for
est (
tota
l)53
1,42
114
8,98
552
,889
5234
1142
4014
2851
17 N
onre
stric
ted,
dev
elop
men
td10
8,19
616
,023
7,02
54
52
26
21
73
Non
rest
ricte
d, li
mite
d de
velo
pmen
te27
0,20
565
,315
25,7
1423
155
2017
614
217
Res
trict
ed, n
onde
velo
pmen
tf15
3,02
067
,647
20,1
5025
144
2018
613
238
Stat
e 17
,878
4,14
52,
157
12
10
21
02
1
Priv
ate
5,10
165
138
00
00
00
00
00
Oth
er g
over
nmen
tal e
ntity
4,10
840
921
60
00
00
00
00
Unk
now
n51
0153
260
00
00
00
00
T
otal
563,
570
154,
242
55,6
6853
3612
4343
1429
5318
- - -
- - -
100
- - -
- - -
- - -
- - -
100
- - -
- - -
- - -
- - -
100
- - -
- - -
a Are
a of
cur
rent
yel
low
-ced
ar fo
rest
s est
imat
ed fr
om sp
ecie
s dis
trib
utio
n m
odel
s and
surv
eys (
see
“Yel
low
-ced
ar d
istr
ibut
ion”
in se
ctio
n 4)
.b S
ee “Y
ello
w-c
edar
dec
line”
in se
ctio
n 4
for m
ore
info
rmat
ion
on h
ow a
crea
ge o
f yel
low
-ced
ar d
eclin
e w
as m
appe
d.
c Per
cent
age
of th
e es
timat
ed y
ello
w-c
edar
dis
trib
utio
n ac
reag
e th
at is
pro
ject
ed to
be
in lo
w-,
med
ium
-, an
d hi
gh-r
isk
clas
ses f
or y
ello
w-
ceda
r dec
line
base
d on
hyd
rolo
gy a
nd sn
ow m
odel
ing.
Per
cent
ages
may
not
sum
to 1
00 b
ecau
se o
f rou
ndin
g.
d Non
rest
rict
ed, d
evel
opm
ent:
land
use
des
igna
tions
that
per
mit
com
mer
cial
tim
ber h
arve
st o
n a
regu
late
d (s
ched
uled
) bas
is.
e Non
rest
rict
ed, l
imite
d de
velo
pmen
t: la
nd u
se d
esig
natio
ns th
at d
o no
t per
mit
com
mer
cial
tim
ber o
n a
regu
late
d ba
sis.
On
a ca
se-b
y-ca
se
basi
s the
follo
win
g ac
tiviti
es m
ay b
e al
low
ed: s
alva
ge, p
erso
nal u
se, t
hinn
ing,
pru
ning
, or p
lant
ing.
f R
estr
icte
d la
nd is
land
per
man
ently
rese
rved
from
woo
d pr
oduc
ts u
tiliz
atio
n th
roug
h st
atut
e or
adm
inis
trat
ive
desi
gnat
ion.
Exa
mpl
es a
re
natio
nal f
ores
t wild
erne
ss a
reas
, nat
iona
l mon
umen
ts, a
nd w
ithdr
awal
are
as.
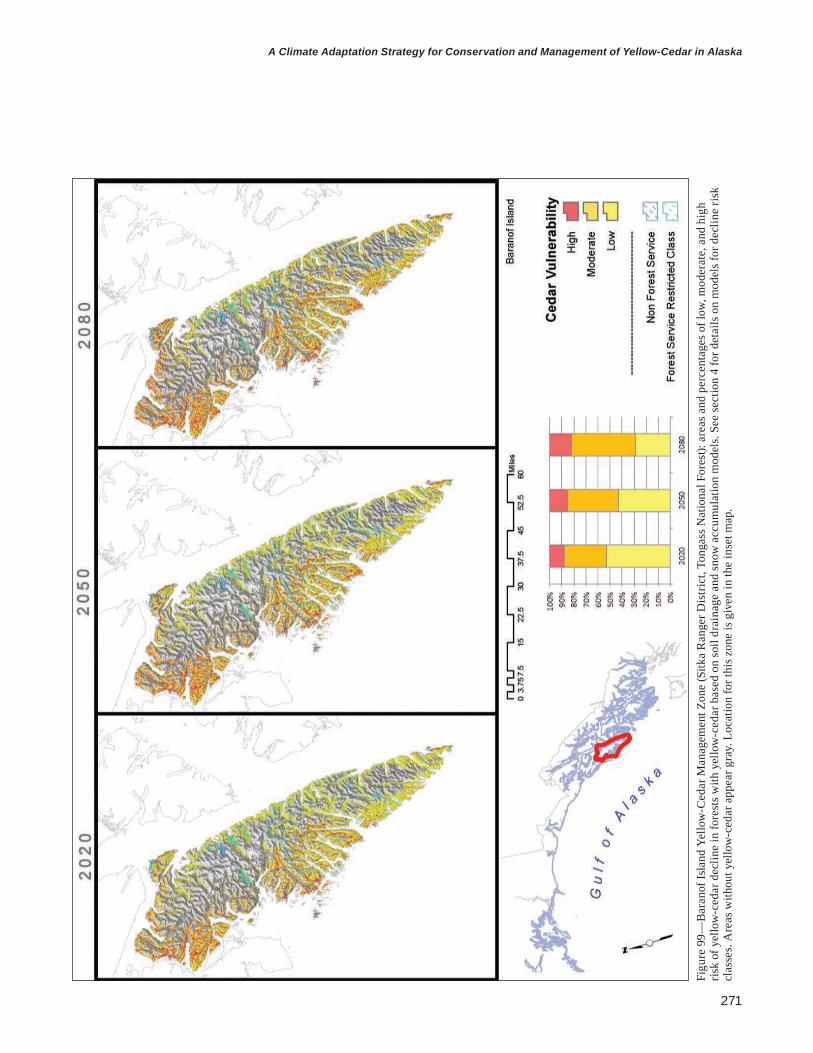
271
A Climate Adaptation Strategy for Conservation and Management of Yellow-Cedar in Alaska
Figu
re 9
9—B
aran
of Is
land
Yel
low
-Ced
ar M
anag
emen
t Zon
e (S
itka
Ran
ger D
istr
ict,
Tong
ass N
atio
nal F
ores
t): a
reas
and
per
cent
ages
of l
ow, m
oder
ate,
and
hig
h ris
k of
yel
low
-ced
ar d
eclin
e in
fore
sts w
ith y
ello
w-c
edar
bas
ed o
n so
il dr
aina
ge a
nd sn
ow a
ccum
ulat
ion
mod
els.
See
sect
ion
4 fo
r det
ails
on
mod
els f
or d
eclin
e ris
k cl
asse
s. A
reas
with
out y
ello
w-c
edar
app
ear g
ray.
Loc
atio
n fo
r thi
s zon
e is
giv
en in
the
inse
t map
.

272
GENERAL TECHNICAL REPORT PNW-GTR-917
12. JuneauGeomorphology and climate— This management zone is dominated by the Boundary Ranges Icefields. There are areas of forest along the fringe of this subsection, which can be both productive and nonproductive. The main forested zones are located in the Stephens Passage–Glacio-Marine Terrace and Douglas Island Volcanic subsections. The uplifted glaciomarine deposits have many emergent and forested wetlands. The Douglas Island Volcanics are a diverse assemblage of alpine, productive, and nonproductive forest and alluvial areas. These two subsections provide about a third of the area as potential yellow-cedar habitat. Climate is variable in this management zone with moderate snow levels in the southern coastal section and extremely high snow accu-mulation in the mountainous inland areas. At sea level, the average annual tempera-ture ranges from a minimum of 35 °F to a maximum of 47 °F. The average annual precipitation is 57 in, and the average annual snowfall is 94 in (Juneau Airport ob-servation station, 504100). Near the icefields, the average annual temperature ranges from a minimum of 33 °F to a maximum of 45 °F. The average annual precipitation is 111 in, and the average annual snowfall is 252 in (Annex Creek observation sta-tion, 500363).
Extent of yellow-cedar— There are >9,000 ac of yellow-cedar in this management zone, which accounts for only about 0.4 percent of the yellow-cedar acreage in Alaska (table 36). We specu-late that this management zone is at the fringe of the apparent yellow-cedar migra-tion pathway, with yellow-cedar still actively migrating. Small, isolated popula-tions are common. New populations have been found near the Juneau road system and on both sides of Lynn Canal at Berners Bay and St. James Bay. There is one reported population in a forest inventory plot farther north on the mainland across from Haines. Yellow-cedar is common in some southern areas of this management zone, such as at Point Couverden, Point Retreat, and the Shelter Island area. Yellow-cedar stands are also known to occur along Taku Inlet and Taku River almost to the Canadian border.
Extent of yellow-cedar decline— Yellow-cedar decline has been mapped on only 62 ac in this management zone.
Extent of yellow-cedar at future risk— The risk to the yellow-cedar populations in this management zone is variable, with an evenly distributed risk profile for the initial projection in 2020 (fig. 100). This diversity in the risk profile is due to the variability in the landscape and landforms

273
A Climate Adaptation Strategy for Conservation and Management of Yellow-Cedar in Alaska
that exist in the management zone. The management zone contains low-elevation uplifted marine geomorphic surfaces that provide abundant wet forest habitat but that are also prone to low snow accumulation currently and into the future. The zone also includes the coastal mountain fringe and icefields, which provide exten-sive cold, snowy areas with low risk. Overall, the risk profile is expected to be mod-erate to high in 2050 and 2080, with most of the high-risk acreage in the southern coastal areas.
Landscapes in protected and active management zones— Most of the yellow-cedar populations occur on land managed by the U.S. Forest Service, but about 1,500 ac are on State land. The majority of the yellow-cedar acreage on land managed by the Forest Service is located in nonrestricted, limited development land use designations.
Opportunities for conservation and management— There are only limited opportunities for active management of yellow-cedar in most of this management zone. The small inland and high-elevation yellow-cedar popu-lations are expected to remain at low risk and offer promise for meeting conserva-tion goals. Cold air drainages that promote persistent snow and favorable soils may provide a long-term refuge for yellow-cedar in certain areas in this zone. These populations could be monitored to track changes in yellow-cedar health and pos-sible population expansion.

274
GENERAL TECHNICAL REPORT PNW-GTR-917
Tabl
e 36
—Ju
neau
Yel
low
-Ced
ar M
anag
emen
t Zon
e (J
unea
u R
ange
r Dis
tric
t, To
ngas
s N
atio
nal F
ores
t): a
crea
ge o
f yel
low
-ced
ar,
curr
ent m
appe
d ye
llow
-ced
ar d
eclin
e, a
nd p
roje
cted
per
cent
age
of y
ello
w-c
edar
occ
urre
nce
in th
ree
decl
ine
risk
cla
sses
in 2
020,
20
50, a
nd 2
080
Lan
d ow
ners
hip
Fore
st
land
Yello
w-
ceda
ra
Map
ped
ye
llow
-ced
ar
decl
ine,
20
13b
Dec
line
risk
cla
ss,
proj
ecte
d, 2
020c
Dec
line
risk
cla
sses
, pr
ojec
ted,
205
0cD
eclin
e ri
sk c
lass
, pr
ojec
ted,
208
0c
Low
Med
ium
Hig
hL
owM
ediu
mH
igh
Low
Med
ium
Hig
h
- - -
- - -
- - -
Acre
s - -
- - -
- - -
- - -
- - -
- - -
- - -
- - -
Per
cent
age
of y
ello
w-c
edar
acr
eage
- - -
- - -
- - -
- - -
- -
Nat
iona
l for
est (
tota
l)41
7,95
37,
228
5625
3120
1930
2710
3531
Non
rest
ricte
d, d
evel
opm
entd
70,0
0479
20
23
32
34
23
4 N
onre
stric
ted,
lim
ited
deve
lopm
ente
238,
179
6,09
856
2127
1715
2624
830
26 R
estri
cted
, non
deve
lopm
entf
109,
770
338
02
10
21
01
21
Stat
e 36
,369
1,56
76
410
22
95
19
7
Priv
ate
8,96
639
00
12
10
22
02
2O
ther
gov
ernm
enta
l ent
ity12
00
00
00
00
00
0U
nkno
wn
26,7
9729
80
3344
2323
4235
1248
41
Tot
al49
0,09
79,
483
6233
4423
2342
3512
4841
- - -
- - -
100
- - -
- - -
- - -
- - -
100
- - -
- - -
- - -
- - -
100
- - -
- - -
a Are
a of
cur
rent
yel
low
-ced
ar fo
rest
s est
imat
ed fr
om sp
ecie
s dis
trib
utio
n m
odel
s and
surv
eys (
see
“Yel
low
-ced
ar d
istr
ibut
ion”
in se
ctio
n 4)
.b S
ee “Y
ello
w-c
edar
dec
line”
in se
ctio
n 4
for m
ore
info
rmat
ion
on h
ow a
crea
ge o
f yel
low
-ced
ar d
eclin
e w
as m
appe
d.
c Per
cent
age
of th
e es
timat
ed y
ello
w-c
edar
dis
trib
utio
n ac
reag
e th
at is
pro
ject
ed to
be
in lo
w-,
med
ium
-, an
d hi
gh-r
isk
clas
ses f
or y
ello
w-
ceda
r dec
line
base
d on
hyd
rolo
gy a
nd sn
ow m
odel
ing.
Per
cent
ages
may
not
sum
to 1
00 b
ecau
se o
f rou
ndin
g.
d Non
rest
rict
ed, d
evel
opm
ent:
land
use
des
igna
tions
that
per
mit
com
mer
cial
tim
ber h
arve
st o
n a
regu
late
d (s
ched
uled
) bas
is.
e Non
rest
rict
ed, l
imite
d de
velo
pmen
t: la
nd u
se d
esig
natio
ns th
at d
o no
t per
mit
com
mer
cial
tim
ber o
n a
regu
late
d ba
sis.
On
a ca
se-b
y-ca
se
basi
s the
follo
win
g ac
tiviti
es m
ay b
e al
low
ed: s
alva
ge, p
erso
nal u
se, t
hinn
ing,
pru
ning
, or p
lant
ing.
f R
estr
icte
d la
nd is
land
per
man
ently
rese
rved
from
woo
d pr
oduc
ts u
tiliz
atio
n th
roug
h st
atut
e or
adm
inis
trat
ive
desi
gnat
ion.
Exa
mpl
es a
re
natio
nal f
ores
t wild
erne
ss a
reas
, nat
iona
l mon
umen
ts, a
nd w
ithdr
awal
are
as.

275
A Climate Adaptation Strategy for Conservation and Management of Yellow-Cedar in Alaska
Figu
re 1
00—
June
au Y
ello
w-C
edar
Man
agem
ent Z
one
(Jun
eau
Ran
ger D
istr
ict,
Tong
ass N
atio
nal F
ores
t): a
reas
and
per
cent
ages
of l
ow, m
oder
ate,
and
hig
h ris
k of
yel
low
-ced
ar d
eclin
e in
fore
sts w
ith y
ello
w-c
edar
bas
ed o
n so
il dr
aina
ge a
nd sn
ow a
ccum
ulat
ion
mod
els.
See
sect
ion
4 fo
r det
ails
on
mod
els f
or d
eclin
e ris
k cl
asse
s. A
reas
with
out y
ello
w-c
edar
app
ear g
ray.
Loc
atio
n fo
r thi
s zon
e is
giv
en in
the
inse
t map
.

276
GENERAL TECHNICAL REPORT PNW-GTR-917
13. Tracy ArmGeomorphology and climate— This management zone is dominated by the Holkham Bay Complex subsection, which is part of the complex sedimentary and volcanic geomorphic class. The rounded mountain zone of the inactive glacial terrain is composed of plutonic intrusions and sedimentary rock substrate. This area is characterized by glacially scoured mountains with little glacial till. Forested wetlands on poorly drained soils make up about 12 percent of the landscape. The climate in most of this management zone is very snowy with a short growing season, except along the coastal fringe. This zone does not have a permanent weather observation system, but is close to the Boundary Ranges Icefield and continental influence of snow and ice. Therefore, coastal climate effects are common at sea level, but a strong cold, snowy climate is present on the continental margin. At sea level, the average annual temperature ranges from a minimum of 39 °F to a maximum of 47 °F. The average annual pre-cipitation is 54 in, and the average annual snowfall is 24 in (Five Finger Lighthouse observation station, 503072).
Extent of yellow-cedar— Yellow-cedar occurs on 39,400 ac, or 9.2 percent of the forestland in this manage-ment zone (table 37). These populations account for 1.7 percent of the yellow-cedar acreage in Alaska.
Extent of yellow-cedar decline— Yellow-cedar decline has been mapped on only 1,100 ac, mostly near the southern coastal extent near Cape Fanshaw.
Extent of yellow-cedar at future risk— The proportion of yellow-cedar acreage categorized as high risk is expected to rise from 4 to 13 percent by 2080 (fig. 101). Most (85 percent) of the yellow-cedar forests are projected to be at low risk in 2020, and 52 percent are expected to remain at low risk by 2080. The modest expansion of the high-risk class occurs first in the south-western part of this zone and then northward along coasts.
Landscapes in protected and active management zones— Most of the yellow-cedar acreage is on land managed by the U.S. Forest Service with the highest acreage in nonrestricted, limited development, followed by nonre-stricted, development and restricted, nondevelopment status. Yellow-cedar occurs in the Tracy Arm–Fords Terror and Chuck River Wilderness Areas. There is a siz-able forested area under private ownership, especially at Hobart Bay (about 1,000 ac of yellow-cedar).

277
A Climate Adaptation Strategy for Conservation and Management of Yellow-Cedar in Alaska
Opportunities for conservation and management— There is an opportunity to plant and manage yellow-cedar on productive soils and where ownership and policy allow active management (e.g., Hobart Bay on private land). Conservation of yellow-cedar populations is promising in some portions of this management zone. Many inland populations appear to be at low risk in 2080, and will presumably regenerate well in those locations to maintain populations over the long term.

278
GENERAL TECHNICAL REPORT PNW-GTR-917
Tabl
e 37
—Tr
acy
Arm
Yel
low
-Ced
ar M
anag
emen
t Zon
e (J
unea
u R
ange
r Dis
tric
t, To
ngas
s N
atio
nal F
ores
t): a
crea
ge o
f yel
low
-ced
ar, c
urre
nt
map
ped
yello
w-c
edar
dec
line,
and
pro
ject
ed p
erce
ntag
e of
yel
low
-ced
ar o
ccur
renc
e in
thre
e de
clin
e ri
sk c
lass
es in
202
0, 2
050,
and
208
0
Lan
d ow
ners
hip
Fore
st
land
Yello
w-
ceda
ra
Map
ped
ye
llow
-ced
ar
decl
ine,
20
13b
Dec
line
risk
cla
ss,
proj
ecte
d, 2
020c
Dec
line
risk
cla
sses
, pr
ojec
ted,
205
0cD
eclin
e ri
sk c
lass
, pr
ojec
ted,
208
0c
Low
Med
ium
Hig
hL
owM
ediu
mH
igh
Low
Med
ium
Hig
h
- - -
- - -
- - -
Acre
s - -
- - -
- - -
- - -
- - -
- - -
- - -
- - -
Per
cent
age
of y
ello
w-c
edar
acr
eage
- - -
- - -
- - -
- - -
- -
Nat
iona
l for
est (
tota
l)40
0,21
938
,254
1,02
483
114
7417
651
3412
Non
rest
ricte
d, d
evel
opm
entd
130,
640
9,70
952
117
43
156
411
86
Non
rest
ricte
d, li
mite
d de
velo
pmen
te15
1,06
413
,169
427
294
125
71
1712
4 R
estri
cted
, non
deve
lopm
entf
118,
515
15,3
7676
372
034
50
2313
3
Stat
e 3,
647
107
00
00
00
00
00
Priv
ate
24,0
961,
017
762
10
21
01
11
Oth
er g
over
nmen
tal e
ntity
00
00
00
00
00
00
Unk
now
n1,
534
10
00
00
00
00
0
Tot
al42
9,49
639
,379
1,10
085
114
7618
652
3513
- - -
- - -
100
- - -
- - -
- - -
- - -
100
- - -
- - -
- - -
- - -
100
- - -
- - -
a Are
a of
cur
rent
yel
low
-ced
ar fo
rest
s est
imat
ed fr
om sp
ecie
s dis
trib
utio
n m
odel
s and
surv
eys (
see
“Yel
low
-ced
ar d
istr
ibut
ion”
in se
ctio
n 4)
.b S
ee “Y
ello
w-c
edar
dec
line”
in se
ctio
n 4
for m
ore
info
rmat
ion
on h
ow a
crea
ge o
f yel
low
-ced
ar d
eclin
e w
as m
appe
d.
c Per
cent
age
of th
e es
timat
ed y
ello
w-c
edar
dis
trib
utio
n ac
reag
e th
at is
pro
ject
ed to
be
in lo
w-,
med
ium
-, an
d hi
gh-r
isk
clas
ses f
or y
ello
w-
ceda
r dec
line
base
d on
hyd
rolo
gy a
nd sn
ow m
odel
ing.
Per
cent
ages
may
not
sum
to 1
00 b
ecau
se o
f rou
ndin
g.
d Non
rest
rict
ed, d
evel
opm
ent:
land
use
des
igna
tions
that
per
mit
com
mer
cial
tim
ber h
arve
st o
n a
regu
late
d (s
ched
uled
) bas
is.
e Non
rest
rict
ed, l
imite
d de
velo
pmen
t: la
nd u
se d
esig
natio
ns th
at d
o no
t per
mit
com
mer
cial
tim
ber o
n a
regu
late
d ba
sis.
On
a ca
se-b
y-ca
se
basi
s the
follo
win
g ac
tiviti
es m
ay b
e al
low
ed: s
alva
ge, p
erso
nal u
se, t
hinn
ing,
pru
ning
, or p
lant
ing.
f R
estr
icte
d la
nd is
land
per
man
ently
rese
rved
from
woo
d pr
oduc
ts u
tiliz
atio
n th
roug
h st
atut
e or
adm
inis
trat
ive
desi
gnat
ion.
Exa
mpl
es a
re
natio
nal f
ores
t wild
erne
ss a
reas
, nat
iona
l mon
umen
ts, a
nd w
ithdr
awal
are
as.

279
A Climate Adaptation Strategy for Conservation and Management of Yellow-Cedar in Alaska
Figu
re 1
01—
Trac
y A
rm Y
ello
w-C
edar
Man
agem
ent Z
one
(Jun
eau
Ran
ger D
istr
ict,
Tong
ass N
atio
nal F
ores
t): a
reas
and
per
cent
ages
of l
ow, m
oder
ate,
and
hig
h ris
k of
ye
llow
-ced
ar d
eclin
e in
fore
sts w
ith y
ello
w-c
edar
bas
ed o
n so
il dr
aina
ge a
nd sn
ow a
ccum
ulat
ion
mod
els.
See
sect
ion
4 fo
r det
ails
on
mod
els f
or d
eclin
e ris
k cl
asse
s. A
reas
with
out y
ello
w-c
edar
app
ear g
ray.
Loc
atio
n fo
r thi
s zon
e is
giv
en in
the
inse
t map
.

280
GENERAL TECHNICAL REPORT PNW-GTR-917
14. AdmiraltyGeomorphology and climate— Diverse ecological subsections are represented in this zone, each with different origins, compositions, and percentages of forested wetland: the South Admiralty Volcanics (17 percent forested wetland), the Thayer Lake Granitics with shal-low lithic soils (16 percent forested wetland), the Hood-Gambier Bay Carbonates with dense and productive upland forest cover (17 percent forested wetland), the Mitchell-Hasselborg Till Lowlands (10 percent forested wetland), and the small Glacio-Marine Terrace (19 percent forested wetland). The climate is variable be-cause of some exposure from Chatham Strait to the south, proximity to the main-land to the east, and vertical relief. On the southwest coast, the average annual temperature ranges from a minimum of 37 °F to a maximum of 48 °F. The aver-age annual precipitation is 42 in, and the average annual snowfall is 61 in (Angoon observation station, 500310). On the northern coast, the average annual temperature ranges from a minimum of 38 °F to a maximum of 48 °F. The average annual pre-cipitation is 60 in, and the average annual snowfall is 65 in (Funter Bay observation station, 503198).
Extent of yellow-cedar— For reasons unknown, yellow-cedar has a patchy distribution on Admiralty Island. We estimate >108,000 ac of yellow-cedar forest, constituting about 13.5 percent of the forested landscape (table 38). There are large forested areas of the island that lack yellow-cedar. The yellow-cedar populations here account for about 4.8 percent of yellow-cedar acreage in Alaska.
Extent of yellow-cedar decline— A relatively small amount of yellow-cedar decline has been mapped in this manage-ment zone, just <4,600 ac in the southern portions.
Extent of yellow-cedar at future risk— The yellow-cedar forests are expected to have increased risk of yellow-cedar decline. The management areas to the south on Kupreanof Island have extensive decline-affected forests. Areas expected to be at high risk of decline more than dou-ble from 13 to 27 percent by 2080 (fig. 102). The high relief and cold drainages of the landscape initially provide some resilience to loss of snow cover. The high-risk areas are expected to be scattered throughout lowland areas of Admiralty Island by 2080 in stark contrast to the current distribution of decline restricted to southern parts of the island. The approximately 73 percent of yellow-cedar forests that are expected to be in medium and low risk classes by 2080 occur at higher elevations.

281
A Climate Adaptation Strategy for Conservation and Management of Yellow-Cedar in Alaska
Landscapes in protected and active management zones— Nearly all of the yellow-cedar forests are under U.S. Forest Service jurisdiction and restricted, nondevelopment status as Kootznoowoo Wilderness Area (Admiralty Island National Monument).
Opportunities for conservation and management— The wilderness designation will restrict most, if not all, management activities over most of the Admiralty Island management zone. The private land around Cube Cove has had extensive forest harvest, and could provide potential areas for planting and managing young-growth yellow-cedar on well-drained soils. The health status of yellow-cedar is expected to be in flux. Most yellow-cedar forests on Admiralty Island are currently intact, but mortality is expected to encroach towards the north and upslope. Monitoring the health and regeneration of yellow-cedar here is impor-tant, but hampered by the lack of access by forest inventory crews. The upper elevations of the southern peninsula represent a low-risk zone with abundant yellow-cedar to meet the goal of conservation.

282
GENERAL TECHNICAL REPORT PNW-GTR-917
Tabl
e 38
—A
dmira
lty Y
ello
w-C
edar
Man
agem
ent Z
one
(Adm
iralty
Nat
iona
l Mon
umen
t, To
ngas
s N
atio
nal F
ores
t): a
crea
ge o
f yel
low
-ced
ar,
curr
ent m
appe
d ye
llow
-ced
ar d
eclin
e, a
nd p
roje
cted
per
cent
age
of y
ello
w-c
edar
occ
urre
nce
in th
ree
decl
ine
risk
cla
sses
in 2
020,
205
0,
and
2080
Lan
d ow
ners
hip
Fore
st
land
Yello
w-
ceda
ra
Map
ped
ye
llow
-ced
ar
decl
ine,
20
13b
Dec
line
risk
cla
ss,
proj
ecte
d, 2
020c
Dec
line
risk
cla
sses
, pr
ojec
ted,
205
0cD
eclin
e ri
sk c
lass
, pr
ojec
ted,
208
0c
Low
Med
ium
Hig
hL
owM
ediu
mH
igh
Low
Med
ium
Hig
h
- - -
- - -
- - -
Acre
s - -
- - -
- - -
- - -
- - -
- - -
- - -
- - -
Per
cent
age
of y
ello
w-c
edar
acr
eage
- - -
- - -
- - -
- - -
- -
Nat
iona
l for
est (
tota
l)77
0,76
510
7,90
14,
566
5532
1344
3817
2152
26 N
onre
stric
ted,
dev
elop
men
td0
00
00
00
00
0 N
onre
stric
ted,
lim
ited
deve
lopm
ente
410
00
00
00
00
0 R
estri
cted
, non
deve
lopm
entf
770,
724
107,
901
4566
5532
1344
3817
2152
26
Stat
e 23
82
00
00
00
00
00
Priv
ate
21,5
3870
70
00
00
00
00
0O
ther
gov
ernm
enta
l ent
ity13
00
00
00
00
00
0U
nkno
wn
00
00
00
00
00
00
T
otal
801,
620
108,
611
4,56
655
3213
4438
1821
5227
- - -
- - -
100
- - -
- - -
- - -
- - -
100
- - -
- - -
- - -
- - -
100
- - -
- - -
a Are
a of
cur
rent
yel
low
-ced
ar fo
rest
s est
imat
ed fr
om sp
ecie
s dis
trib
utio
n m
odel
s and
surv
eys (
see
“Yel
low
-ced
ar d
istr
ibut
ion”
in se
ctio
n 4)
.b S
ee “Y
ello
w-c
edar
dec
line”
in se
ctio
n 4
for m
ore
info
rmat
ion
on h
ow a
crea
ge o
f yel
low
-ced
ar d
eclin
e w
as m
appe
d.
c Per
cent
age
of th
e es
timat
ed y
ello
w-c
edar
dis
trib
utio
n ac
reag
e th
at is
pro
ject
ed to
be
in lo
w-,
med
ium
-, an
d hi
gh-r
isk
clas
ses f
or y
ello
w-
ceda
r dec
line
base
d on
hyd
rolo
gy a
nd sn
ow m
odel
ing.
Per
cent
ages
may
not
sum
to 1
00 b
ecau
se o
f rou
ndin
g.
d Non
rest
rict
ed, d
evel
opm
ent:
land
use
des
igna
tions
that
per
mit
com
mer
cial
tim
ber h
arve
st o
n a
regu
late
d (s
ched
uled
) bas
is.
e Non
rest
rict
ed, l
imite
d de
velo
pmen
t: la
nd u
se d
esig
natio
ns th
at d
o no
t per
mit
com
mer
cial
tim
ber o
n a
regu
late
d ba
sis.
On
a ca
se-b
y-ca
se
basi
s the
follo
win
g ac
tiviti
es m
ay b
e al
low
ed: s
alva
ge, p
erso
nal u
se, t
hinn
ing,
pru
ning
, or p
lant
ing.
f R
estr
icte
d la
nd is
land
per
man
ently
rese
rved
from
woo
d pr
oduc
ts u
tiliz
atio
n th
roug
h st
atut
e or
adm
inis
trat
ive
desi
gnat
ion.
Exa
mpl
es a
re
natio
nal f
ores
t wild
erne
ss a
reas
, nat
iona
l mon
umen
ts, a
nd w
ithdr
awal
are
as.

283
A Climate Adaptation Strategy for Conservation and Management of Yellow-Cedar in Alaska
Figu
re 1
02—
Adm
iralty
Yel
low
-Ced
ar M
anag
emen
t Zon
e (A
dmira
lty N
atio
nal M
onum
ent,
Tong
ass N
atio
nal F
ores
t): a
reas
and
per
cent
ages
of l
ow, m
oder
ate,
and
hi
gh ri
sk o
f yel
low
-ced
ar d
eclin
e in
fore
sts w
ith y
ello
w-c
edar
bas
ed o
n so
il dr
aina
ge a
nd sn
ow a
ccum
ulat
ion
mod
els.
See
sect
ion
4 fo
r det
ails
on
mod
els f
or d
eclin
e ris
k cl
asse
s. A
reas
with
out y
ello
w-c
edar
app
ear g
ray.
Loc
atio
n fo
r thi
s zon
e is
giv
en in
the
inse
t map
.

284
GENERAL TECHNICAL REPORT PNW-GTR-917
15. Kuiu IslandGeomorphology and climate— This management zone is a very diverse assemblage of several geologic formations including granitics, noncarbonate and carbonate sedimentary rocks, and areas of till lowlands. The volcanics offer abundant yellow-cedar habitat with gentle slopes and low-permeability substrate that form wet forested areas for yellow-cedar. In addi-tion, the till lowlands have abundant wetland areas that expand the yellow-cedar habitat in this management zone. Well-drained sites offer opportunities for pro-ductive stands of mixed-conifer forest with a yellow-cedar component. This large island generally has low snow accumulation in the southern portions and heavier snow to the northwest, which may be influenced by the mountainous portion of Baranof Island. At sea level, the average annual temperature ranges from a mini-mum of 36 °F to a maximum of 50 °F. The average annual precipitation is 54 in, and the average annual snowfall is 38 in (Kake observation station, 504155).
Extent of yellow-cedar— More than 156,000 ac of yellow-cedar forests occur on Kuiu Island (table 39). It is locally abundant in the southern portion and less common in the northeast portion of this management zone. These populations account for 6.9 percent of the yellow-cedar acreage in Alaska.
Extent of yellow-cedar decline— Yellow-cedar decline is common. More than 77,000 ac of yellow-cedar decline have been mapped, most of it on the southern two-thirds of the island. This acreage ac-counts for 13.5 percent of the mapped acreage of yellow-cedar decline in Alaska.
Extent of yellow-cedar at future risk— High risk of yellow-cedar decline is projected to be initially low (20 percent of yellow-cedar acreage) and is expected to increase to 34 percent by 2080 (fig. 103). Conversely, low-risk acreage is expected to decrease from 38 percent to just 9 per-cent between 2020 and 2080. By 2080, low-risk areas mainly occur at high eleva-tions, but are more broadly distributed in the northwestern portion of the island.
Landscapes in protected and active management zones— Most of Kuiu Island and almost all of the yellow-cedar forests are on land managed by the U.S. Forest Service, fairly evenly distributed among the three management categories.

285
A Climate Adaptation Strategy for Conservation and Management of Yellow-Cedar in Alaska
Opportunities for conservation and management— An extensive road system is present, but much of it is on portions of the island where yellow-cedar is less common. There may be an opportunity to plant and manage yellow-cedar along the roaded areas on well-drained soils. The health sta-tus of yellow-cedar has been and will continue to be threatened at low and moderate elevations. As succession continues, western redcedar may become a larger compo-nent of decline-affected forests in the southern portion of this management zone.

286
GENERAL TECHNICAL REPORT PNW-GTR-917
Tabl
e 39
—K
uiu
Isla
nd Y
ello
w-C
edar
Man
agem
ent Z
one
(Pet
ersb
urg
Ran
ger D
istr
ict,
Tong
ass
Nat
iona
l For
est):
acr
eage
of y
ello
w-c
edar
, cu
rren
t map
ped
yello
w-c
edar
dec
line,
and
pro
ject
ed p
erce
ntag
e of
yel
low
-ced
ar o
ccur
renc
e in
thre
e de
clin
e ri
sk c
lass
es in
202
0, 2
050,
an
d 20
80
Lan
d ow
ners
hip
Fore
st
land
Yello
w-
ceda
ra
Map
ped
ye
llow
-ced
ar
decl
ine,
20
13b
Dec
line
risk
cla
ss,
proj
ecte
d, 2
020c
Dec
line
risk
cla
sses
, pr
ojec
ted,
205
0cD
eclin
e ri
sk c
lass
, pr
ojec
ted,
208
0c
Low
Med
ium
Hig
hL
owM
ediu
mH
igh
Low
Med
ium
Hig
h
- - -
- - -
- - -
Acre
s - -
- - -
- - -
- - -
- - -
- - -
- - -
- - -
Per
cent
age
of y
ello
w-c
edar
acr
eage
- - -
- - -
- - -
- - -
- -
Nat
iona
l for
est (
tota
l)42
7,99
015
3,33
576
,490
3841
2024
4728
956
33 N
onre
stric
ted,
dev
elop
men
td14
4,71
638
,604
17,0
618
116
412
81
149
Non
rest
ricte
d, li
mite
d de
velo
pmen
te16
0,96
353
,503
32,8
8612
149
815
113
1813
Res
trict
ed, n
onde
velo
pmen
tf12
2,31
161
,228
26,5
4319
165
1219
84
2411
Stat
e 4,
241
2,23
060
30
10
01
10
11
Priv
ate
2,48
365
50
00
00
00
00
0O
ther
gov
ernm
enta
l ent
ity0
00
00
00
00
00
0U
nkno
wn
3,34
944
100
00
00
00
00
T
otal
438,
063
156,
264
77,1
0338
4220
2448
289
5734
- - -
- - -
100
- - -
- - -
- - -
- - -
100
- - -
- - -
- - -
- - -
100
- - -
- - -
a Are
a of
cur
rent
yel
low
-ced
ar fo
rest
s est
imat
ed fr
om sp
ecie
s dis
trib
utio
n m
odel
s and
surv
eys (
see
“Yel
low
-ced
ar d
istr
ibut
ion”
in se
ctio
n 4)
.b S
ee “Y
ello
w-c
edar
dec
line”
in se
ctio
n 4
for m
ore
info
rmat
ion
on h
ow a
crea
ge o
f yel
low
-ced
ar d
eclin
e w
as m
appe
d.
c Per
cent
age
of th
e es
timat
ed y
ello
w-c
edar
dis
trib
utio
n ac
reag
e th
at is
pro
ject
ed to
be
in lo
w-,
med
ium
-, an
d hi
gh-r
isk
clas
ses f
or y
ello
w-
ceda
r dec
line
base
d on
hyd
rolo
gy a
nd sn
ow m
odel
ing.
Per
cent
ages
may
not
sum
to 1
00 b
ecau
se o
f rou
ndin
g.
d Non
rest
rict
ed, d
evel
opm
ent:
land
use
des
igna
tions
that
per
mit
com
mer
cial
tim
ber h
arve
st o
n a
regu
late
d (s
ched
uled
) bas
is.
e Non
rest
rict
ed, l
imite
d de
velo
pmen
t: la
nd u
se d
esig
natio
ns th
at d
o no
t per
mit
com
mer
cial
tim
ber o
n a
regu
late
d ba
sis.
On
a ca
se-b
y-ca
se
basi
s the
follo
win
g ac
tiviti
es m
ay b
e al
low
ed: s
alva
ge, p
erso
nal u
se, t
hinn
ing,
pru
ning
, or p
lant
ing.
f R
estr
icte
d la
nd is
land
per
man
ently
rese
rved
from
woo
d pr
oduc
ts u
tiliz
atio
n th
roug
h st
atut
e or
adm
inis
trat
ive
desi
gnat
ion.
Exa
mpl
es a
re
natio
nal f
ores
t wild
erne
ss a
reas
, nat
iona
l mon
umen
ts, a
nd w
ithdr
awal
are
as.

287
A Climate Adaptation Strategy for Conservation and Management of Yellow-Cedar in Alaska
Figu
re 1
03—
Kui
u Is
land
Yel
low
-Ced
ar M
anag
emen
t Zon
e (P
eter
sbur
g R
ange
r Dis
tric
t, To
ngas
s Nat
iona
l For
est):
are
as a
nd p
erce
ntag
es o
f low
, mod
erat
e, a
nd
high
risk
of y
ello
w-c
edar
dec
line
in fo
rest
s with
yel
low
-ced
ar b
ased
on
soil
drai
nage
and
snow
acc
umul
atio
n m
odel
s. Se
e se
ctio
n 4
for d
etai
ls o
n m
odel
s for
de
clin
e ris
k cl
asse
s. A
reas
with
out y
ello
w-c
edar
app
ear g
ray.
Loc
atio
n fo
r thi
s zon
e is
giv
en in
the
inse
t map
.

288
GENERAL TECHNICAL REPORT PNW-GTR-917
16. Kupreanof Island WestGeomorphology and climate— This management zone has two main areas: (1) The Kake Volcanics with sedimen-tary and volcanic rocks in the northwest part of the management zone, and (2) the Sumner Strait volcanics in the southeast part of the zone. The Kake Volcanics are low-relief rounded hills resulting from extensive glacial erosion. These lowlands have abundant forested wetlands on both Histosols and Spodosols. The Sumner Strait Volcanics are similar, with glacial till lowlands and rolling hills supporting forested wetlands and emergent wetlands. The climate is mild without heavy snow, especially considering the extensive areas of low elevation. At sea level, the aver-age annual temperature ranges from a minimum of 36 °F to a maximum of 50 °F. The average annual precipitation is 54 in, and the average annual snowfall is 38 in (Kake observation station, 504155).
Extent of yellow-cedar— Nearly 150,000 ac of yellow-cedar forest occur and are well distributed throughout this management zone (table 40). These populations account for 6.6 percent of the yellow-cedar acreage in Alaska.
Extent of yellow-cedar decline— Yellow-cedar decline has been mapped on >68,000 ac, representing about 12.1 per-cent of yellow-cedar decline in Alaska.
Extent of yellow-cedar at future risk— High risk of decline is expected to rise from 38 to 57 percent of yellow-cedar acre-age between 2020 and 2080 (fig. 104). Just 4 percent of the yellow-cedar forest is expected to be at low risk by 2080. Large areas with poor drainage and at low eleva-tion contribute to the generally high risk in this management zone.
Landscapes in protected and active management zones— Except for about 6,400 ac of yellow-cedar forest on private land, most of the yellow-cedar forests are on land managed by the U.S. Forest Service. This management zone has a large acreage in nonrestricted, development status.
Opportunities for conservation and management— The large acreage of yellow-cedar decline, nonrestricted development status, and access to stands via the Kake Road and a portion of the Portage Bay Road combine to provide one of the best opportunities for salvage of dead yellow-cedar in Alaska.

289
A Climate Adaptation Strategy for Conservation and Management of Yellow-Cedar in Alaska
There are long stretches of these roads with adjacent concentrations of dead yellow-cedar. Because of the low elevation of this management zone, the most favorable setting for planting and thinning yellow-cedar would be on productive sites with well-drained soils. The relatively small deer population may favor the success of natural and artificial yellow-cedar regeneration on suitable sites. The high risk of decline by 2080 suggests that the health status and population stability of yellow-cedar has been and will continue to be impaired in unmanaged areas.
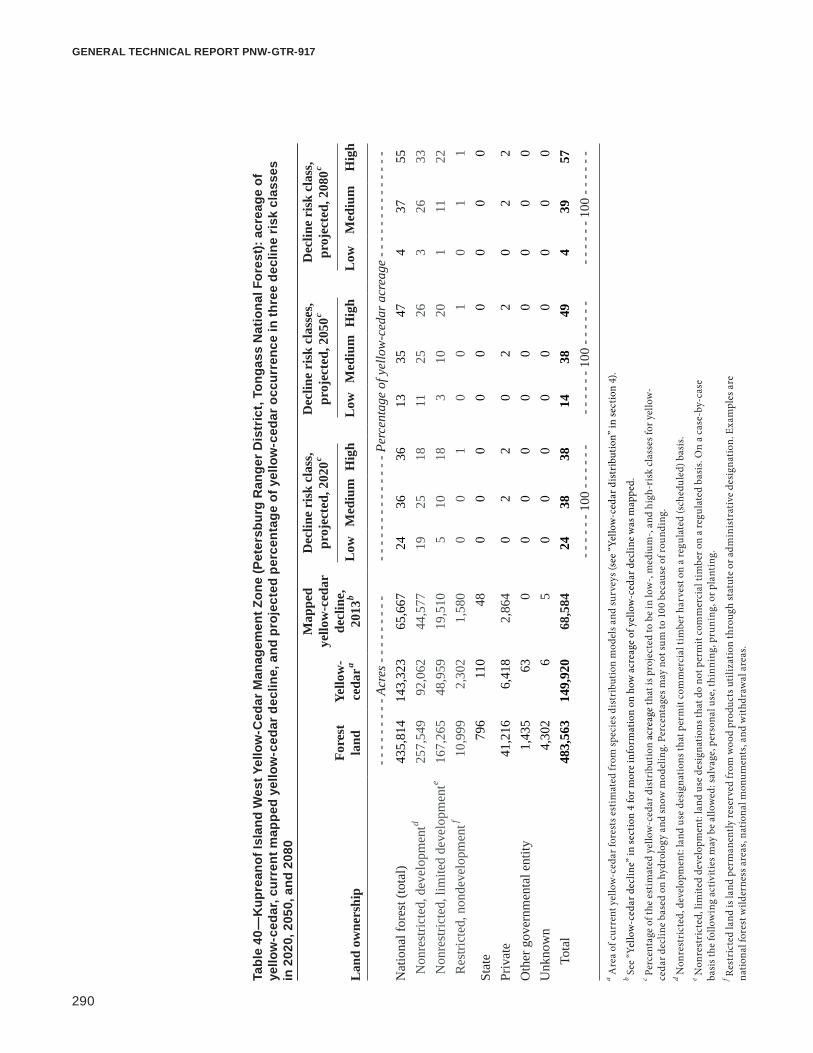
290
GENERAL TECHNICAL REPORT PNW-GTR-917
Tabl
e 40
—K
upre
anof
Isla
nd W
est Y
ello
w-C
edar
Man
agem
ent Z
one
(Pet
ersb
urg
Ran
ger D
istr
ict,
Tong
ass
Nat
iona
l For
est):
acr
eage
of
yello
w-c
edar
, cur
rent
map
ped
yello
w-c
edar
dec
line,
and
pro
ject
ed p
erce
ntag
e of
yel
low
-ced
ar o
ccur
renc
e in
thre
e de
clin
e ri
sk c
lass
es
in 2
020,
205
0, a
nd 2
080
Lan
d ow
ners
hip
Fore
st
land
Yello
w-
ceda
ra
Map
ped
ye
llow
-ced
ar
decl
ine,
20
13b
Dec
line
risk
cla
ss,
proj
ecte
d, 2
020c
Dec
line
risk
cla
sses
, pr
ojec
ted,
205
0cD
eclin
e ri
sk c
lass
, pr
ojec
ted,
208
0c
Low
Med
ium
Hig
hL
owM
ediu
mH
igh
Low
Med
ium
Hig
h
- - -
- - -
- - -
Acre
s - -
- - -
- - -
- - -
- - -
- - -
- - -
- - -
Per
cent
age
of y
ello
w-c
edar
acr
eage
- - -
- - -
- - -
- - -
- -
Nat
iona
l for
est (
tota
l)43
5,81
414
3,32
365
,667
2436
3613
3547
437
55 N
onre
stric
ted,
dev
elop
men
td25
7,54
992
,062
44,5
7719
2518
1125
263
2633
Non
rest
ricte
d, li
mite
d de
velo
pmen
te16
7,26
548
,959
19,5
105
1018
310
201
1122
Res
trict
ed, n
onde
velo
pmen
tf10
,999
2,30
21,
580
00
10
01
01
1
Stat
e 79
611
048
00
00
00
00
0
Priv
ate
41,2
166,
418
2,86
40
22
02
20
22
Oth
er g
over
nmen
tal e
ntity
1,43
563
00
00
00
00
00
Unk
now
n4,
302
65
00
00
00
00
0
Tot
al48
3,56
314
9,92
068
,584
2438
3814
3849
439
57- -
- - -
- 10
0 - -
- - -
- - -
- - -
- 10
0 - -
- - -
- - -
- - -
- 10
0 - -
- - -
- a A
rea
of c
urre
nt y
ello
w-c
edar
fore
sts e
stim
ated
from
spec
ies d
istr
ibut
ion
mod
els a
nd su
rvey
s (se
e “Y
ello
w-c
edar
dis
trib
utio
n” in
sect
ion
4).
b See
“Yel
low
-ced
ar d
eclin
e” in
sect
ion
4 fo
r mor
e in
form
atio
n on
how
acr
eage
of y
ello
w-c
edar
dec
line
was
map
ped.
c P
erce
ntag
e of
the
estim
ated
yel
low
-ced
ar d
istr
ibut
ion
acre
age
that
is p
roje
cted
to b
e in
low
-, m
ediu
m-,
and
high
-ris
k cl
asse
s for
yel
low
- ce
dar d
eclin
e ba
sed
on h
ydro
logy
and
snow
mod
elin
g. P
erce
ntag
es m
ay n
ot su
m to
100
bec
ause
of r
ound
ing.
d N
onre
stri
cted
, dev
elop
men
t: la
nd u
se d
esig
natio
ns th
at p
erm
it co
mm
erci
al ti
mbe
r har
vest
on
a re
gula
ted
(sch
edul
ed) b
asis
.e N
onre
stri
cted
, lim
ited
deve
lopm
ent:
land
use
des
igna
tions
that
do
not p
erm
it co
mm
erci
al ti
mbe
r on
a re
gula
ted
basi
s. O
n a
case
-by-
case
ba
sis t
he fo
llow
ing
activ
ities
may
be
allo
wed
: sal
vage
, per
sona
l use
, thi
nnin
g, p
runi
ng, o
r pla
ntin
g.
f Res
tric
ted
land
is la
nd p
erm
anen
tly re
serv
ed fr
om w
ood
prod
ucts
util
izat
ion
thro
ugh
stat
ute
or a
dmin
istr
ativ
e de
sign
atio
n. E
xam
ples
are
na
tiona
l for
est w
ilder
ness
are
as, n
atio
nal m
onum
ents
, and
with
draw
al a
reas
.

291
A Climate Adaptation Strategy for Conservation and Management of Yellow-Cedar in Alaska
Figu
re 1
04—
Kup
rean
of Is
land
Wes
t Yel
low
-Ced
ar M
anag
emen
t Zon
e (P
eter
sbur
g R
ange
r Dis
tric
t, To
ngas
s Nat
iona
l For
est):
are
as a
nd p
erce
ntag
es o
f low
, mod
er-
ate,
and
hig
h ris
k of
yel
low
-ced
ar d
eclin
e in
fore
sts w
ith y
ello
w-c
edar
bas
ed o
n so
il dr
aina
ge a
nd sn
ow a
ccum
ulat
ion
mod
els.
See
sect
ion
4 fo
r det
ails
on
mod
els f
or
decl
ine
risk
clas
ses.
Are
as w
ithou
t yel
low
-ced
ar a
ppea
r gra
y. L
ocat
ion
for t
his z
one
is g
iven
in th
e in
set m
ap.
292
GENERAL TECHNICAL REPORT PNW-GTR-917
17. Kupreanof Island EastGeomorphology and climate— This management zone is located in a trough between two higher subsections and is dominated by low relief underlain with sedimentary and volcanic rocks. The thick glacial sediment deposition covering the parent rock has created conditions favorable for formation of abundant peatlands and forested wetlands. Histosols are the dominant soil type. The climate varies with elevation. At sea level, the average annual temperature ranges from a minimum of 35 °F to a maximum of 48 °F. The average annual precipitation is 105 in, and the average annual snowfall is 107 in (Petersburg observation station, 507233).
Extent of yellow-cedar— About 24,000 ac of yellow-cedar occur in this management zone (table 41). These populations account for 1.1 percent of the yellow-cedar acreage in Alaska.
Extent of yellow-cedar decline— More than 14,000 ac of yellow-cedar decline have been mapped throughout this management zone, which accounts for about 2.6 percent of the yellow-cedar de-cline acreage in Alaska. There are small watersheds in the northeast portion of Kupreanof Island with particularly concentrated yellow-cedar decline.
Extent of yellow-cedar at future risk— Risk is expected to increase dramatically in this management zone. The propor-tion of yellow-cedar forests expected to be at high risk increases from just 8 to 33 percent between 2020 and 2080 (fig. 105). The high-risk areas initially are around Duncan Canal to Portage Bay and other coastal forests, but expand to include many interior valleys by 2080. Conversely, low-risk acreage is expected to drop from 72 to 32 percent in that time and is limited to higher elevations.
Landscapes in protected and active management zones— There are nearly 1,000 ac of yellow-cedar forest under State ownership, but most of the yellow-cedar acreage occurs on land managed by the U.S. Forest Service with nonrestricted, development status.
Opportunities for conservation and management— Land use designation and road access along the Tonka and Portage Bay roads offer good prospects for salvaging dead yellow-cedar. There is intensive decline near the Bohemian Ridge portion of the Portage Bay road. Expanding mortality is expected

293
A Climate Adaptation Strategy for Conservation and Management of Yellow-Cedar in Alaska
to provide new opportunities for yellow-cedar salvage, especially in interior valleys with road systems. In unmanaged decline-affected forests, western redcedar may increase in abundance, as its northern range limit occurs near this zone. By the end of the century, intact yellow-cedar forests meeting conservation goals for the spe-cies are expected to be restricted to higher elevations.

294
GENERAL TECHNICAL REPORT PNW-GTR-917
Tabl
e 41
—K
upre
anof
Isla
nd E
ast Y
ello
w-C
edar
Man
agem
ent Z
one
(Pet
ersb
urg
Ran
ger D
istr
ict,
Tong
ass
Nat
iona
l For
est):
acr
eage
of
yello
w-c
edar
, cur
rent
map
ped
yello
w-c
edar
dec
line,
and
pro
ject
ed p
erce
ntag
e of
yel
low
-ced
ar o
ccur
renc
e in
thre
e de
clin
e ri
sk c
lass
es
in 2
020,
205
0, a
nd 2
080
Lan
d ow
ners
hip
Fore
st
land
Yello
w-
ceda
ra
Map
ped
ye
llow
-ced
ar
decl
ine,
20
13b
Dec
line
risk
cla
ss,
proj
ecte
d, 2
020c
Dec
line
risk
cla
sses
, pr
ojec
ted,
205
0cD
eclin
e ri
sk c
lass
, pr
ojec
ted,
208
0c
Low
Med
ium
Hig
hL
owM
ediu
mH
igh
Low
Med
ium
Hig
h
- - -
- - -
- - -
Acre
s - -
- - -
- - -
- - -
- - -
- - -
- - -
- - -
Per
cent
age
of y
ello
w-c
edar
acr
eage
- - -
- - -
- - -
- - -
- -
Nat
iona
l for
est (
tota
l)14
6,40
223
,019
13,7
9270
198
5725
1431
3431
Non
rest
ricte
d, d
evel
opm
entd
81,6
7412
,185
8,21
039
74
3312
618
1913
Non
rest
ricte
d, li
mite
d de
velo
pmen
te28
,370
3,86
92,
042
114
19
52
57
5 R
estri
cted
, non
deve
lopm
entf
36,3
586,
965
3,54
019
73
159
68
913
Stat
e 6,
462
804
802
21
01
11
11
1
Priv
ate
122
42
00
00
00
00
0O
ther
gov
ernm
enta
l ent
ity1,
353
197
390
10
00
00
01
Unk
now
n11
703
20
00
00
00
00
T
otal
155,
509
24,0
2714
,637
7220
858
2715
3236
33- -
- - -
- 10
0 - -
- - -
- - -
- - -
- 10
0 - -
- - -
- - -
- - -
- 10
0 - -
- - -
- a A
rea
of c
urre
nt y
ello
w-c
edar
fore
sts e
stim
ated
from
spec
ies d
istr
ibut
ion
mod
els a
nd su
rvey
s (se
e “Y
ello
w-c
edar
dis
trib
utio
n” in
sect
ion
4).
b See
“Yel
low
-ced
ar d
eclin
e” in
sect
ion
4 fo
r mor
e in
form
atio
n on
how
acr
eage
of y
ello
w-c
edar
dec
line
was
map
ped.
c P
erce
ntag
e of
the
estim
ated
yel
low
-ced
ar d
istr
ibut
ion
acre
age
that
is p
roje
cted
to b
e in
low
-, m
ediu
m-,
and
high
-ris
k cl
asse
s for
yel
low
- ce
dar d
eclin
e ba
sed
on h
ydro
logy
and
snow
mod
elin
g. P
erce
ntag
es m
ay n
ot su
m to
100
bec
ause
of r
ound
ing.
d N
onre
stri
cted
, dev
elop
men
t: la
nd u
se d
esig
natio
ns th
at p
erm
it co
mm
erci
al ti
mbe
r har
vest
on
a re
gula
ted
(sch
edul
ed) b
asis
.e N
onre
stri
cted
, lim
ited
deve
lopm
ent:
land
use
des
igna
tions
that
do
not p
erm
it co
mm
erci
al ti
mbe
r on
a re
gula
ted
basi
s. O
n a
case
-by-
case
ba
sis t
he fo
llow
ing
activ
ities
may
be
allo
wed
: sal
vage
, per
sona
l use
, thi
nnin
g, p
runi
ng, o
r pla
ntin
g.
f Res
tric
ted
land
is la
nd p
erm
anen
tly re
serv
ed fr
om w
ood
prod
ucts
util
izat
ion
thro
ugh
stat
ute
or a
dmin
istr
ativ
e de
sign
atio
n. E
xam
ples
are
na
tiona
l for
est w
ilder
ness
are
as, n
atio
nal m
onum
ents
, and
with
draw
al a
reas
.

295
A Climate Adaptation Strategy for Conservation and Management of Yellow-Cedar in Alaska
Figu
re 1
05—
Kup
rean
of Is
land
Eas
t Yel
low
-Ced
ar M
anag
emen
t Zon
e (P
eter
sbur
g R
ange
r Dis
tric
t, To
ngas
s Nat
iona
l For
est):
are
as a
nd p
erce
ntag
es o
f low
, mod
er-
ate,
and
hig
h ris
k of
yel
low
-ced
ar d
eclin
e in
fore
sts w
ith y
ello
w-c
edar
bas
ed o
n so
il dr
aina
ge a
nd sn
ow a
ccum
ulat
ion
mod
els.
See
sect
ion
4 fo
r det
ails
on
mod
els f
or
decl
ine
risk
clas
ses.
Are
as w
ithou
t yel
low
-ced
ar a
ppea
r gra
y. L
ocat
ion
for t
his z
one
is g
iven
in th
e in
set m
ap.

296
GENERAL TECHNICAL REPORT PNW-GTR-917
18. Thomas BayGeomorphology and climate— This zone along the coastal mainland contains the Thomas Bay outwash plains subsection, with plains and low rounded hill landforms. The lowlands are composed of a mix of poorly sorted surficial deposits from glacial outwash. Productive forest has formed on the coarse-textured deposits with some organic soil development. Mixed-conifer forests are common, and forested wetlands are also present. The climate is generally cold and snowy, especially in the extensive mountainous areas and icefields to the west. At sea level, the average annual temperature ranges from a minimum of 39 °F to a maximum of 47 °F. The average annual precipitation is 54 in, and the average annual snowfall is 24 in (Five Finger Lighthouse observation station, 503072).
Extent of yellow-cedar— An estimated 23,500 ac of yellow-cedar forest occur in this management zone (table 42). These populations account for 1.0 percent of the yellow-cedar acreage in Alaska. In this zone, yellow-cedar is mainly confined to coastal areas, but also extends into forested valleys.
Extent of yellow-cedar decline— Yellow-cedar decline has been mapped on nearly 12,000 ac, or 2.1 percent of the yellow-cedar decline acreage in Alaska. Decline is most common near Point Agassiz Peninsula and Cape Fanshaw.
Extent of yellow-cedar at future risk— The percentage of yellow-cedar forest at high risk is expected to increase from 15 to 30 percent by 2080 (fig. 106). Conversely, more than half of yellow-cedar acreage is in low risk status in 2020, but that proportion shrinks to 31 percent by 2080. Most of the inland valley yellow-cedar forests remain at low risk.
Landscapes in protected and active management zones— Nearly all of yellow-cedar forests in this zone occur on land managed by the U.S. Forest Service. Most of the acreage is designated as nonrestricted, development and nonrestricted, limited development status, with a higher percentage in the latter category.

297
A Climate Adaptation Strategy for Conservation and Management of Yellow-Cedar in Alaska
Opportunities for conservation and management— Although there is less yellow-cedar in this management zone than in some others, there are good prospects for both conservation and active management. Yellow-cedar forests in the inland valleys are expected to remain healthy by 2080 to meet conservation goals, and high snow levels should allow these populations to sustain themselves through natural regeneration. Yellow-cedar could be favored by planting and thinning on well-drained soils, although active management may be limited by lack of roads.

298
GENERAL TECHNICAL REPORT PNW-GTR-917
Tabl
e 42
—Th
omas
Bay
Yel
low
-Ced
ar M
anag
emen
t Zon
e (P
eter
sbur
g R
ange
r Dis
tric
t, To
ngas
s N
atio
nal F
ores
t): a
crea
ge o
f yel
low
-ced
ar,
curr
ent m
appe
d ye
llow
-ced
ar d
eclin
e, a
nd p
roje
cted
per
cent
age
of y
ello
w-c
edar
occ
urre
nce
in th
ree
decl
ine
risk
cla
sses
in 2
020,
205
0,
and
2080
Lan
d ow
ners
hip
Fore
st
land
Yello
w-
ceda
ra
Map
ped
ye
llow
-ced
ar
decl
ine,
20
13b
Dec
line
risk
cla
ss,
proj
ecte
d, 2
020c
Dec
line
risk
cla
sses
, pr
ojec
ted,
205
0cD
eclin
e ri
sk c
lass
, pr
ojec
ted,
208
0c
Low
Med
ium
Hig
hL
owM
ediu
mH
igh
Low
Med
ium
Hig
h
- - -
- - -
- - -
Acre
s - -
- - -
- - -
- - -
- - -
- - -
- - -
- - -
Per
cent
age
of y
ello
w-c
edar
acr
eage
- - -
- - -
- - -
- - -
- -
Nat
iona
l for
est (
tota
l)17
8,48
223
,259
11,1
2354
3015
4631
2331
3829
Non
rest
ricte
d, d
evel
opm
entd
77,4
9813
,595
5,40
525
2210
2022
1612
2521
Non
rest
ricte
d, li
mite
d de
velo
pmen
te97
,315
9,36
95,
228
288
525
97
1813
9 R
estri
cted
, non
deve
lopm
entf
3,67
029
549
01
00
10
01
00
Stat
e 4,
386
264
563
01
00
10
01
0
Priv
ate
804
20
00
00
00
00
0O
ther
gov
ernm
enta
l ent
ity0
00
00
00
00
00
0U
nkno
wn
712
02
00
00
00
00
0
Tot
al18
4,38
423
,526
11,6
8854
3115
4631
2331
3930
- - -
- - -
100
- - -
- - -
- - -
- - -
100
- - -
- - -
- - -
- - -
100
- - -
- - -
a Are
a of
cur
rent
yel
low
-ced
ar fo
rest
s est
imat
ed fr
om sp
ecie
s dis
trib
utio
n m
odel
s and
surv
eys (
see
“Yel
low
-ced
ar d
istr
ibut
ion”
in se
ctio
n 4)
.b S
ee “Y
ello
w-c
edar
dec
line”
in se
ctio
n 4
for m
ore
info
rmat
ion
on h
ow a
crea
ge o
f yel
low
-ced
ar d
eclin
e w
as m
appe
d.
c Per
cent
age
of th
e es
timat
ed y
ello
w-c
edar
dis
trib
utio
n ac
reag
e th
at is
pro
ject
ed to
be
in lo
w-,
med
ium
-, an
d hi
gh-r
isk
clas
ses f
or y
ello
w-
ceda
r dec
line
base
d on
hyd
rolo
gy a
nd sn
ow m
odel
ing.
Per
cent
ages
may
not
sum
to 1
00 b
ecau
se o
f rou
ndin
g.
d Non
rest
rict
ed, d
evel
opm
ent:
land
use
des
igna
tions
that
per
mit
com
mer
cial
tim
ber h
arve
st o
n a
regu
late
d (s
ched
uled
) bas
is.
e Non
rest
rict
ed, l
imite
d de
velo
pmen
t: la
nd u
se d
esig
natio
ns th
at d
o no
t per
mit
com
mer
cial
tim
ber o
n a
regu
late
d ba
sis.
On
a ca
se-b
y-ca
se
basi
s the
follo
win
g ac
tiviti
es m
ay b
e al
low
ed: s
alva
ge, p
erso
nal u
se, t
hinn
ing,
pru
ning
, or p
lant
ing.
f R
estr
icte
d la
nd is
land
per
man
ently
rese
rved
from
woo
d pr
oduc
ts u
tiliz
atio
n th
roug
h st
atut
e or
adm
inis
trat
ive
desi
gnat
ion.
Exa
mpl
es a
re
natio
nal f
ores
t wild
erne
ss a
reas
, nat
iona
l mon
umen
ts, a
nd w
ithdr
awal
are
as.
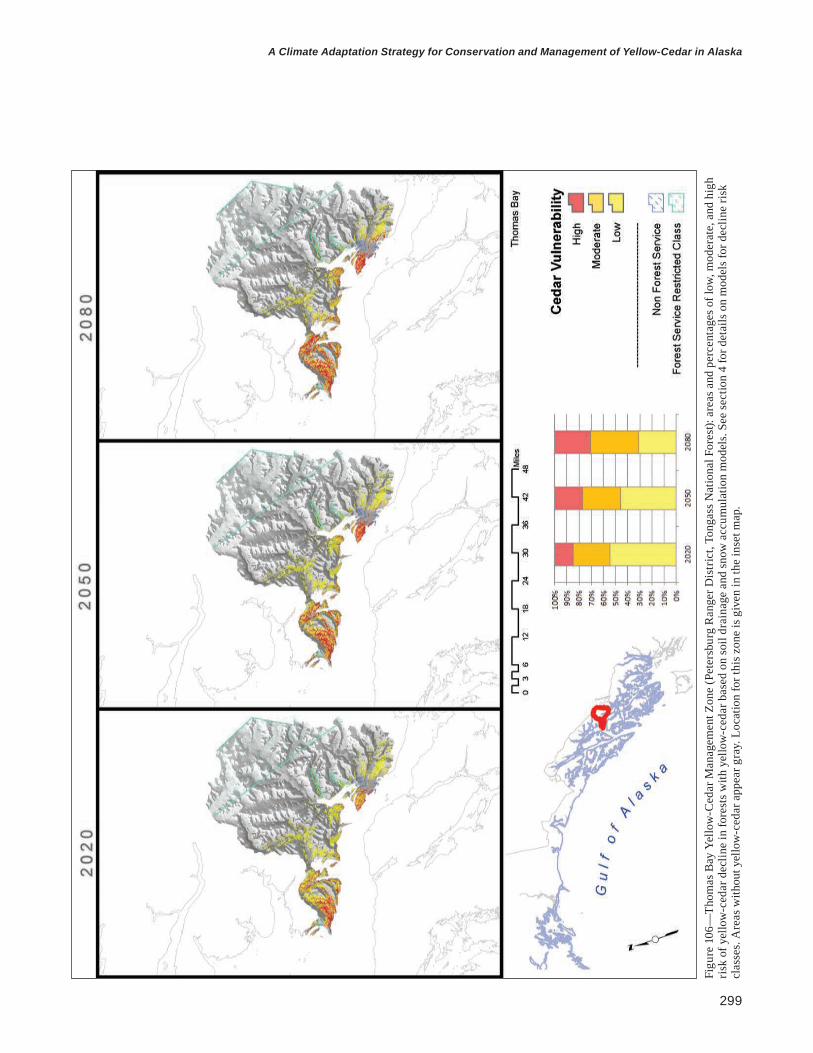
299
A Climate Adaptation Strategy for Conservation and Management of Yellow-Cedar in Alaska
Figu
re 1
06—
Thom
as B
ay Y
ello
w-C
edar
Man
agem
ent Z
one
(Pet
ersb
urg
Ran
ger D
istr
ict,
Tong
ass N
atio
nal F
ores
t): a
reas
and
per
cent
ages
of l
ow, m
oder
ate,
and
hig
h ris
k of
yel
low
-ced
ar d
eclin
e in
fore
sts w
ith y
ello
w-c
edar
bas
ed o
n so
il dr
aina
ge a
nd sn
ow a
ccum
ulat
ion
mod
els.
See
sect
ion
4 fo
r det
ails
on
mod
els f
or d
eclin
e ris
k cl
asse
s. A
reas
with
out y
ello
w-c
edar
app
ear g
ray.
Loc
atio
n fo
r thi
s zon
e is
giv
en in
the
inse
t map
.
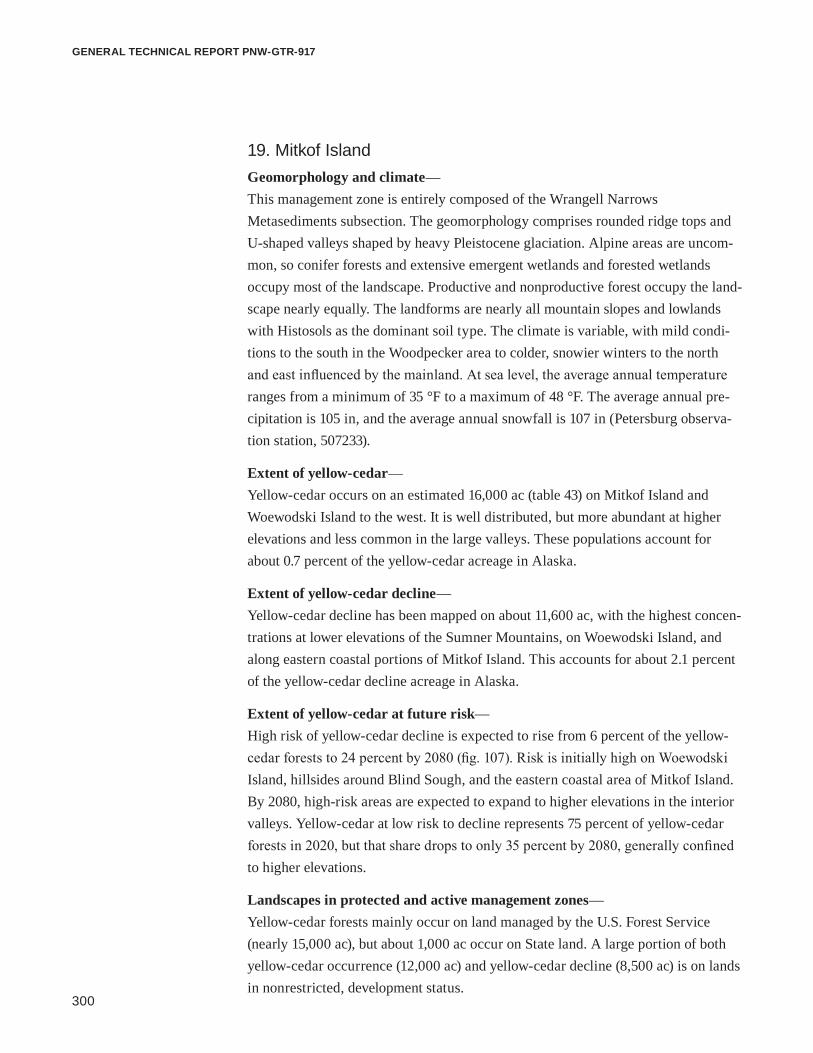
300
GENERAL TECHNICAL REPORT PNW-GTR-917
19. Mitkof IslandGeomorphology and climate— This management zone is entirely composed of the Wrangell Narrows Metasediments subsection. The geomorphology comprises rounded ridge tops and U-shaped valleys shaped by heavy Pleistocene glaciation. Alpine areas are uncom-mon, so conifer forests and extensive emergent wetlands and forested wetlands occupy most of the landscape. Productive and nonproductive forest occupy the land-scape nearly equally. The landforms are nearly all mountain slopes and lowlands with Histosols as the dominant soil type. The climate is variable, with mild condi-tions to the south in the Woodpecker area to colder, snowier winters to the north and east influenced by the mainland. At sea level, the average annual temperature ranges from a minimum of 35 °F to a maximum of 48 °F. The average annual pre-cipitation is 105 in, and the average annual snowfall is 107 in (Petersburg observa-tion station, 507233).
Extent of yellow-cedar— Yellow-cedar occurs on an estimated 16,000 ac (table 43) on Mitkof Island and Woewodski Island to the west. It is well distributed, but more abundant at higher elevations and less common in the large valleys. These populations account for about 0.7 percent of the yellow-cedar acreage in Alaska.
Extent of yellow-cedar decline— Yellow-cedar decline has been mapped on about 11,600 ac, with the highest concen-trations at lower elevations of the Sumner Mountains, on Woewodski Island, and along eastern coastal portions of Mitkof Island. This accounts for about 2.1 percent of the yellow-cedar decline acreage in Alaska.
Extent of yellow-cedar at future risk— High risk of yellow-cedar decline is expected to rise from 6 percent of the yellow-cedar forests to 24 percent by 2080 (fig. 107). Risk is initially high on Woewodski Island, hillsides around Blind Sough, and the eastern coastal area of Mitkof Island. By 2080, high-risk areas are expected to expand to higher elevations in the interior valleys. Yellow-cedar at low risk to decline represents 75 percent of yellow-cedar forests in 2020, but that share drops to only 35 percent by 2080, generally confined to higher elevations.
Landscapes in protected and active management zones— Yellow-cedar forests mainly occur on land managed by the U.S. Forest Service (nearly 15,000 ac), but about 1,000 ac occur on State land. A large portion of both yellow-cedar occurrence (12,000 ac) and yellow-cedar decline (8,500 ac) is on lands in nonrestricted, development status.

301
A Climate Adaptation Strategy for Conservation and Management of Yellow-Cedar in Alaska
Opportunities for conservation and management— The large acreage of yellow-cedar and yellow-cedar decline, combined with the extensive road system on Mitkof Island and nonrestricted, development status, of-fers good prospects for active management. Yellow-cedar stands with concentrated mortality are available for salvage harvest. The sizable increase in projected risk in-dicates that more declining yellow-cedar forests may be available for future salvage. Road access makes salvage more economically feasible. Yellow-cedar is known to have regenerated in some harvest units in this management zone. The relatively small deer populations in some areas of Mitkof Island suggest that planting and thinning to favor yellow-cedar could be used to increase the yellow-cedar compo-nent in managed forests. Protection of seedlings from deer browse may be needed in the warmer southwestern areas. Conservation goals for yellow-cedar could be met at higher elevations, where unmanaged yellow-cedar forests remain at low risk through 2080.

302
GENERAL TECHNICAL REPORT PNW-GTR-917
Tabl
e 43
—M
itkof
Isla
nd Y
ello
w-C
edar
Man
agem
ent Z
one
(Pet
ersb
urg
Ran
ger D
istr
ict,
Tong
ass
Nat
iona
l For
est):
acr
eage
of y
ello
w-c
edar
, cu
rren
t map
ped
yello
w-c
edar
dec
line,
and
pro
ject
ed p
erce
ntag
e of
yel
low
-ced
ar o
ccur
renc
e in
thre
e de
clin
e ri
sk c
lass
es in
202
0, 2
050,
an
d 20
80
Lan
d ow
ners
hip
Fore
st
land
Yello
w-
ceda
ra
Map
ped
ye
llow
-ced
ar
decl
ine,
20
13b
Dec
line
risk
cla
ss,
proj
ecte
d, 2
020c
Dec
line
risk
cla
sses
, pr
ojec
ted,
205
0cD
eclin
e ri
sk c
lass
, pr
ojec
ted,
208
0c
Low
Med
ium
Hig
hL
owM
ediu
mH
igh
Low
Med
ium
Hig
h
- - -
- - -
- - -
Acre
s - -
- - -
- - -
- - -
- - -
- - -
- - -
- - -
Per
cent
age
of y
ello
w-c
edar
acr
eage
- - -
- - -
- - -
- - -
- -
Nat
iona
l for
est (
tota
l)11
0,85
014
,973
10,7
2070
165
6021
933
3820
Non
rest
ricte
d, d
evel
opm
entd
83,3
1412
,045
8,55
555
134
4818
825
3117
Non
rest
ricte
d, li
mite
d de
velo
pmen
te26
,132
2,80
52,
161
143
112
41
77
3 R
estri
cted
, non
deve
lopm
entf
1,40
512
34
10
01
00
00
0
Stat
e 14
,910
1,09
683
84
21
33
12
33
Priv
ate
211
43
00
00
00
00
0O
ther
gov
ernm
enta
l ent
ity7,
913
384
105
11
01
11
01
1U
nkno
wn
937
16
00
00
00
00
0
Tot
al13
4,82
216
,458
11,6
7275
196
6425
1135
4224
- - -
- - -
100
- - -
- - -
- - -
- - -
100
- - -
- - -
- - -
- - -
100
- - -
- - -
a Are
a of
cur
rent
yel
low
-ced
ar fo
rest
s est
imat
ed fr
om sp
ecie
s dis
trib
utio
n m
odel
s and
surv
eys (
see
“Yel
low
-ced
ar d
istr
ibut
ion”
in se
ctio
n 4)
.b S
ee “Y
ello
w-c
edar
dec
line”
in se
ctio
n 4
for m
ore
info
rmat
ion
on h
ow a
crea
ge o
f yel
low
-ced
ar d
eclin
e w
as m
appe
d.
c Per
cent
age
of th
e es
timat
ed y
ello
w-c
edar
dis
trib
utio
n ac
reag
e th
at is
pro
ject
ed to
be
in lo
w-,
med
ium
-, an
d hi
gh-r
isk
clas
ses f
or y
ello
w-
ceda
r dec
line
base
d on
hyd
rolo
gy a
nd sn
ow m
odel
ing.
Per
cent
ages
may
not
sum
to 1
00 b
ecau
se o
f rou
ndin
g.
d Non
rest
rict
ed, d
evel
opm
ent:
land
use
des
igna
tions
that
per
mit
com
mer
cial
tim
ber h
arve
st o
n a
regu
late
d (s
ched
uled
) bas
is.
e Non
rest
rict
ed, l
imite
d de
velo
pmen
t: la
nd u
se d
esig
natio
ns th
at d
o no
t per
mit
com
mer
cial
tim
ber o
n a
regu
late
d ba
sis.
On
a ca
se-b
y-ca
se
basi
s the
follo
win
g ac
tiviti
es m
ay b
e al
low
ed: s
alva
ge, p
erso
nal u
se, t
hinn
ing,
pru
ning
, or p
lant
ing.
f R
estr
icte
d la
nd is
land
per
man
ently
rese
rved
from
woo
d pr
oduc
ts u
tiliz
atio
n th
roug
h st
atut
e or
adm
inis
trat
ive
desi
gnat
ion.
Exa
mpl
es a
re
natio
nal f
ores
t wild
erne
ss a
reas
, nat
iona
l mon
umen
ts, a
nd w
ithdr
awal
are
as.

303
A Climate Adaptation Strategy for Conservation and Management of Yellow-Cedar in Alaska
Figu
re 1
07—
Mitk
of Is
land
Yel
low
-Ced
ar M
anag
emen
t Zon
e (P
eter
sbur
g R
ange
r Dis
tric
t, To
ngas
s Nat
iona
l For
est):
are
as a
nd p
erce
ntag
es o
f low
, mod
erat
e, a
nd h
igh
risk
of y
ello
w-c
edar
dec
line
in fo
rest
s with
yel
low
-ced
ar b
ased
on
soil
drai
nage
and
snow
acc
umul
atio
n m
odel
s. Se
e se
ctio
n 4
for d
etai
ls o
n m
odel
s for
dec
line
risk
clas
ses.
Are
as w
ithou
t yel
low
-ced
ar a
ppea
r gra
y. L
ocat
ion
for t
his z
one
is g
iven
in th
e in
set m
ap.

304
GENERAL TECHNICAL REPORT PNW-GTR-917
20. Zarembo IslandGeomorphology and climate— This management zone consists of several subsections, including the Sumner Strait Volcanics to the west, and the Wrangell Narrows Metasediments to the north, the Stikine Strait Complex to the southeast, and the Duncan Canal Till Lowlands in the central eastern portion of the island. The North Kuiu–Prince of Wales Carbonates dominate the islands to the southwest of Zarembo. This varied geomorphology leads to a great amount of diversity in a small area. The Sumner Strait Volcanics have glacial till lowlands and rolling hills supporting forested and emergent wet-lands. Zarembo Island is very close to Wrangell and has similar weather patterns. At sea level, the average annual temperature ranges from a minimum of 37 °F to a maximum of 50 °F. The average annual precipitation is 80 in, and the average an-nual snowfall is 55 in (Wrangell observation station, 509919).
Extent of yellow-cedar— Yellow-cedar is estimated to occur on nearly 26,000 ac in this zone, which accounts for 1.1 percent of the yellow-cedar acreage in Alaska (table 44). Our GIS layer shows yellow-cedar as absent from some of the extensive bog areas on the western portion of Zarembo and parts of the other islands, but yellow-cedar probably occurs on these unproductive sites as a layering or stunted tree.
Extent of yellow-cedar decline— Yellow-cedar decline has been mapped on about 10,500 ac in this zone, mainly on Zarembo Island. Decline-affected forests are well distributed at low elevations, except for the northern portion of the island, where forested wetland habitat is less common. This management zone contributes about 1.9 percent of the mapped yellow-cedar decline in Alaska.
Extent of yellow-cedar at future risk— The percentage of yellow-cedar forest rated at high risk increases from just 10 to 32 percent between 2020 and 2080 (fig. 108). High-risk areas are mainly at low eleva-tions along the coast and in the valleys, then progress considerably upslope through time. The percentage of yellow-cedar forest at low risk is expected to decrease from 64 to 19 percent between 2020 and 2080.
Landscapes in protected and active management zones— Nearly all of the yellow-cedar acreage is on land managed by the U.S. Forest Service. Most yellow-cedar and mapped decline acreages are on lands in nonre-stricted, development status, with the remainder mostly in nonrestricted, limited development status.

305
A Climate Adaptation Strategy for Conservation and Management of Yellow-Cedar in Alaska
Opportunities for conservation and management— There are good prospects for active forest management in this management zone. The extensive road system, which extends to higher elevations, may facilitate more management. The large amount of yellow-cedar decline and its expected future en-croachment upslope suggest an opportunity for salvaging dead trees. Yellow-cedar could be planted on newly harvested sites, but care should be taken to favor yellow-cedar on well-drained soils. The recently reported decline in two adjacent, relatively wet young-growth yellow-cedar stands on Zarembo Island should be monitored. Yellow-cedar is present in some existing young-growth forests, so thinning could be used to promote yellow-cedar. Succession to other species, including western red-cedar at low elevations, will occur in unmanaged decline-affected forests. Yellow-cedar is expected to remain healthy at the highest elevations on Zarembo Island, thereby helping to meet conservation goals.

306
GENERAL TECHNICAL REPORT PNW-GTR-917
Tabl
e 44
—Za
rem
bo Is
land
Yel
low
-Ced
ar M
anag
emen
t Zon
e (W
rang
ell R
ange
r Dis
tric
t, To
ngas
s N
atio
nal F
ores
t): a
crea
ge o
f yel
low
-ced
ar,
curr
ent m
appe
d ye
llow
-ced
ar d
eclin
e, a
nd p
roje
cted
per
cent
age
of y
ello
w-c
edar
occ
urre
nce
in th
ree
decl
ine
risk
cla
sses
in 2
020,
205
0,
and
2080
Lan
d ow
ners
hip
Fore
st
land
Yello
w-
ceda
ra
Map
ped
ye
llow
-ced
ar
decl
ine,
20
13b
Dec
line
risk
cla
ss,
proj
ecte
d, 2
020c
Dec
line
risk
cla
sses
, pr
ojec
ted,
205
0cD
eclin
e ri
sk c
lass
, pr
ojec
ted,
208
0c
Low
Med
ium
Hig
hL
owM
ediu
mH
igh
Low
Med
ium
Hig
h
- - -
- - -
- - -
Acre
s - -
- - -
- - -
- - -
- - -
- - -
- - -
- - -
Per
cent
age
of y
ello
w-c
edar
acr
eage
- - -
- - -
- - -
- - -
- -
Nat
iona
l for
est (
tota
l)14
3,30
125
,826
10,5
5164
2510
5033
1719
4932
Non
rest
ricte
d, d
evel
opm
entd
97,6
4117
,160
7,55
945
174
3423
911
3322
Non
rest
ricte
d, li
mite
d de
velo
pmen
te42
,497
8,29
12,
923
197
616
97
715
10 R
estri
cted
, non
deve
lopm
entf
3,16
337
569
01
00
10
01
0
Stat
e 1,
599
644
00
00
00
00
0
Priv
ate
30
00
00
00
00
00
Oth
er g
over
nmen
tal e
ntity
00
00
00
00
00
00
Unk
now
n67
04
00
00
00
00
00
T
otal
145,
573
25,8
9410
,555
6425
1050
3317
1949
32- -
- - -
- 10
0 - -
- - -
- - -
- - -
- 10
0 - -
- - -
- - -
- - -
- 10
0 - -
- - -
- a A
rea
of c
urre
nt y
ello
w-c
edar
fore
sts e
stim
ated
from
spec
ies d
istr
ibut
ion
mod
els a
nd su
rvey
s (se
e “Y
ello
w-c
edar
dis
trib
utio
n” in
sect
ion
4).
b See
“Yel
low
-ced
ar d
eclin
e” in
sect
ion
4 fo
r mor
e in
form
atio
n on
how
acr
eage
of y
ello
w-c
edar
dec
line
was
map
ped.
c P
erce
ntag
e of
the
estim
ated
yel
low
-ced
ar d
istr
ibut
ion
acre
age
that
is p
roje
cted
to b
e in
low
-, m
ediu
m-,
and
high
-ris
k cl
asse
s for
yel
low
- ce
dar d
eclin
e ba
sed
on h
ydro
logy
and
snow
mod
elin
g. P
erce
ntag
es m
ay n
ot su
m to
100
bec
ause
of r
ound
ing.
d N
onre
stri
cted
, dev
elop
men
t: la
nd u
se d
esig
natio
ns th
at p
erm
it co
mm
erci
al ti
mbe
r har
vest
on
a re
gula
ted
(sch
edul
ed) b
asis
.e N
onre
stri
cted
, lim
ited
deve
lopm
ent:
land
use
des
igna
tions
that
do
not p
erm
it co
mm
erci
al ti
mbe
r on
a re
gula
ted
basi
s. O
n a
case
-by-
case
ba
sis t
he fo
llow
ing
activ
ities
may
be
allo
wed
: sal
vage
, per
sona
l use
, thi
nnin
g, p
runi
ng, o
r pla
ntin
g.
f Res
tric
ted
land
is la
nd p
erm
anen
tly re
serv
ed fr
om w
ood
prod
ucts
util
izat
ion
thro
ugh
stat
ute
or a
dmin
istr
ativ
e de
sign
atio
n. E
xam
ples
are
na
tiona
l for
est w
ilder
ness
are
as, n
atio
nal m
onum
ents
, and
with
draw
al a
reas
.
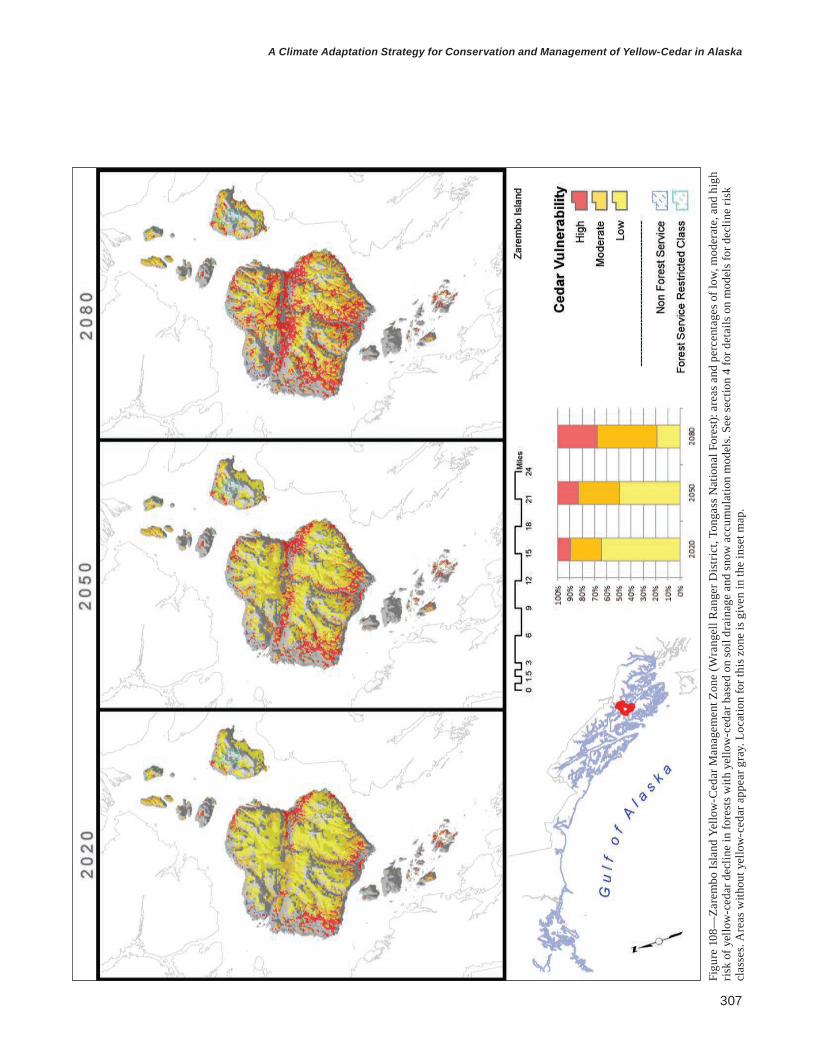
307
A Climate Adaptation Strategy for Conservation and Management of Yellow-Cedar in Alaska
Figu
re 1
08—
Zare
mbo
Isla
nd Y
ello
w-C
edar
Man
agem
ent Z
one
(Wra
ngel
l Ran
ger D
istr
ict,
Tong
ass N
atio
nal F
ores
t): a
reas
and
per
cent
ages
of l
ow, m
oder
ate,
and
hig
h ris
k of
yel
low
-ced
ar d
eclin
e in
fore
sts w
ith y
ello
w-c
edar
bas
ed o
n so
il dr
aina
ge a
nd sn
ow a
ccum
ulat
ion
mod
els.
See
sect
ion
4 fo
r det
ails
on
mod
els f
or d
eclin
e ris
k cl
asse
s. A
reas
with
out y
ello
w-c
edar
app
ear g
ray.
Loc
atio
n fo
r thi
s zon
e is
giv
en in
the
inse
t map
.

308
GENERAL TECHNICAL REPORT PNW-GTR-917
21. Etolin IslandGeomorphology and climate— The central portion of this management zone is dominated by the Etolin Island Granitics group. Other subsections include the Clarence Strait Volcanics to the southwest, the Zimovia Strait Complex to the east, the Stikine Strait Complex to the northwest, and the Clarence Strait Volcanics to the south and west. The landforms of the volcanics consist of mountain slopes and associated valley floors. These landforms support large areas of nonforested vegetation in both alpine and peatland areas. The Etolin Island area has a mild climate with winter snow levels being vari-able and dictated by the island’s considerable elevational variation. At sea level, the average annual temperature ranges from a minimum of 40 °F to a maximum of 50 °F. The average annual precipitation is 64 in, and the average annual snowfall is 12 in (Lincoln Rock Lighthouse observation station, 505499).
Extent of yellow-cedar— There are about 35,000 ac of yellow-cedar forest well distributed across the zone, which constitute about 1.6 percent of the yellow-cedar acreage in Alaska (table 45).
Extent of yellow-cedar decline— About 23,500 ac of yellow-cedar decline have been mapped in the area. This amounts to about 4.1 percent of the mapped yellow-cedar decline acreage in Alaska. Most of the decline is in low-lying areas along the coast or along the deep inlets that bisect Etolin Island (e.g., Mosman, Burnett, and Menefee Inlets).
Extent of yellow-cedar at future risk— The percentage of yellow-cedar forests expected to be at high risk doubles from 11 to 23 percent between 2020 and 2080 (fig. 109). High-risk areas are initially concen-trated on southern, western, and eastern portions of this management zone and then encroach upon higher elevations and more northerly latitudes. Several areas known to have yellow-cedar decline now do not show high risk until 2080 (e.g., the valley between Alice Peak and Helen Peak). Yellow-cedar forests rated at low risk de-crease from 67 percent in 2020 to 34 percent in 2080. Low-risk forests in 2080 are well distributed, but are mainly found at high elevations and interior areas.
Landscapes in protected and active management zones— Almost all of the yellow-cedar forests in this zone occur on land managed by the U.S. Forest Service. The northern portion is mainly in nonrestricted, development status, whereas the southern portion is entirely in restricted, nondevelopment status as the South Etolin Wilderness Area.

309
A Climate Adaptation Strategy for Conservation and Management of Yellow-Cedar in Alaska
Opportunities for conservation and management— Conservation goals for yellow-cedar can be met in the large wilderness area in the southern portion of this management zone. There, extensive yellow-cedar decline occurs now and is expected to progress upslope, but extensive areas of low to me-dium risk persist at higher elevations through 2080. However, some areas that are currently affected by decline are not projected to be at high risk of decline until 2080; therefore, relative risk may be underestimated somewhat for other parts of this management zone. Succession to other species, including western redcedar, is expected in these decline-affected forests. There are good opportunities for ac-tive management in the northern areas, given road systems and land-use status. Yellow-cedar could be planted on well-drained soils, as was done in 1986 at Anita Bay. That small planting trial should be monitored into the future. Yellow-cedar has regenerated in some harvest units, and protection of new plantings may be needed if deer populations increase.

310
GENERAL TECHNICAL REPORT PNW-GTR-917
Tabl
e 45
—Et
olin
Isla
nd Y
ello
w-C
edar
Man
agem
ent Z
one
(Wra
ngel
l Ran
ger D
istr
ict,
Tong
ass
Nat
iona
l For
est):
acr
eage
of y
ello
w-
ceda
r, cu
rren
t map
ped
yello
w-c
edar
dec
line,
and
pro
ject
ed p
erce
ntag
e of
yel
low
-ced
ar o
ccur
renc
e in
thre
e de
clin
e ri
sk c
lass
es in
20
20, 2
050,
and
208
0
Lan
d ow
ners
hip
Fore
st
land
Yello
w-
ceda
ra
Map
ped
ye
llow
-ced
ar
decl
ine,
20
13b
Dec
line
risk
cla
ss,
proj
ecte
d, 2
020c
Dec
line
risk
cla
sses
, pr
ojec
ted,
205
0cD
eclin
e ri
sk c
lass
, pr
ojec
ted,
208
0c
Low
Med
ium
Hig
hL
owM
ediu
mH
igh
Low
Med
ium
Hig
h
- - -
- - -
- - -
Acre
s - -
- - -
- - -
- - -
- - -
- - -
- - -
- - -
Per
cent
age
of y
ello
w-c
edar
acr
eage
- - -
- - -
- - -
- - -
- -
Nat
iona
l for
est (
tota
l)19
8,60
435
,174
23,4
7467
2211
5628
1534
4323
Non
rest
ricte
d, d
evel
opm
entd
87,6
8916
,662
9,25
133
114
2714
616
2111
Non
rest
ricte
d, li
mite
d de
velo
pmen
te43
,233
7,15
96,
066
144
312
53
89
4 R
estri
cted
, non
deve
lopm
entf
67,6
8211
,353
8,15
720
75
1710
610
148
Stat
e 1,
237
137
140
00
00
00
00
Priv
ate
40
00
00
00
00
00
Oth
er g
over
nmen
tal e
ntity
00
00
00
00
00
00
Unk
now
n1,
289
54
00
00
00
00
0
Tot
al20
1,13
435
,316
23,4
9267
2211
5628
1534
4323
- - -
- - -
100
- - -
- - -
- - -
- - -
100
- - -
- - -
- - -
- - -
100
- - -
- - -
a Are
a of
cur
rent
yel
low
-ced
ar fo
rest
s est
imat
ed fr
om sp
ecie
s dis
trib
utio
n m
odel
s and
surv
eys (
see
“Yel
low
-ced
ar d
istr
ibut
ion”
in se
ctio
n 4)
.b S
ee “Y
ello
w-c
edar
dec
line”
in se
ctio
n 4
for m
ore
info
rmat
ion
on h
ow a
crea
ge o
f yel
low
-ced
ar d
eclin
e w
as m
appe
d.
c Per
cent
age
of th
e es
timat
ed y
ello
w-c
edar
dis
trib
utio
n ac
reag
e th
at is
pro
ject
ed to
be
in lo
w-,
med
ium
-, an
d hi
gh-r
isk
clas
ses f
or y
ello
w-
ceda
r dec
line
base
d on
hyd
rolo
gy a
nd sn
ow m
odel
ing.
Per
cent
ages
may
not
sum
to 1
00 b
ecau
se o
f rou
ndin
g.
d Non
rest
rict
ed, d
evel
opm
ent:
land
use
des
igna
tions
that
per
mit
com
mer
cial
tim
ber h
arve
st o
n a
regu
late
d (s
ched
uled
) bas
is.
e Non
rest
rict
ed, l
imite
d de
velo
pmen
t: la
nd u
se d
esig
natio
ns th
at d
o no
t per
mit
com
mer
cial
tim
ber o
n a
regu
late
d ba
sis.
On
a ca
se-b
y-ca
se
basi
s the
follo
win
g ac
tiviti
es m
ay b
e al
low
ed: s
alva
ge, p
erso
nal u
se, t
hinn
ing,
pru
ning
, or p
lant
ing.
f R
estr
icte
d la
nd is
land
per
man
ently
rese
rved
from
woo
d pr
oduc
ts u
tiliz
atio
n th
roug
h st
atut
e or
adm
inis
trat
ive
desi
gnat
ion.
Exa
mpl
es a
re
natio
nal f
ores
t wild
erne
ss a
reas
, nat
iona
l mon
umen
ts, a
nd w
ithdr
awal
are
as.
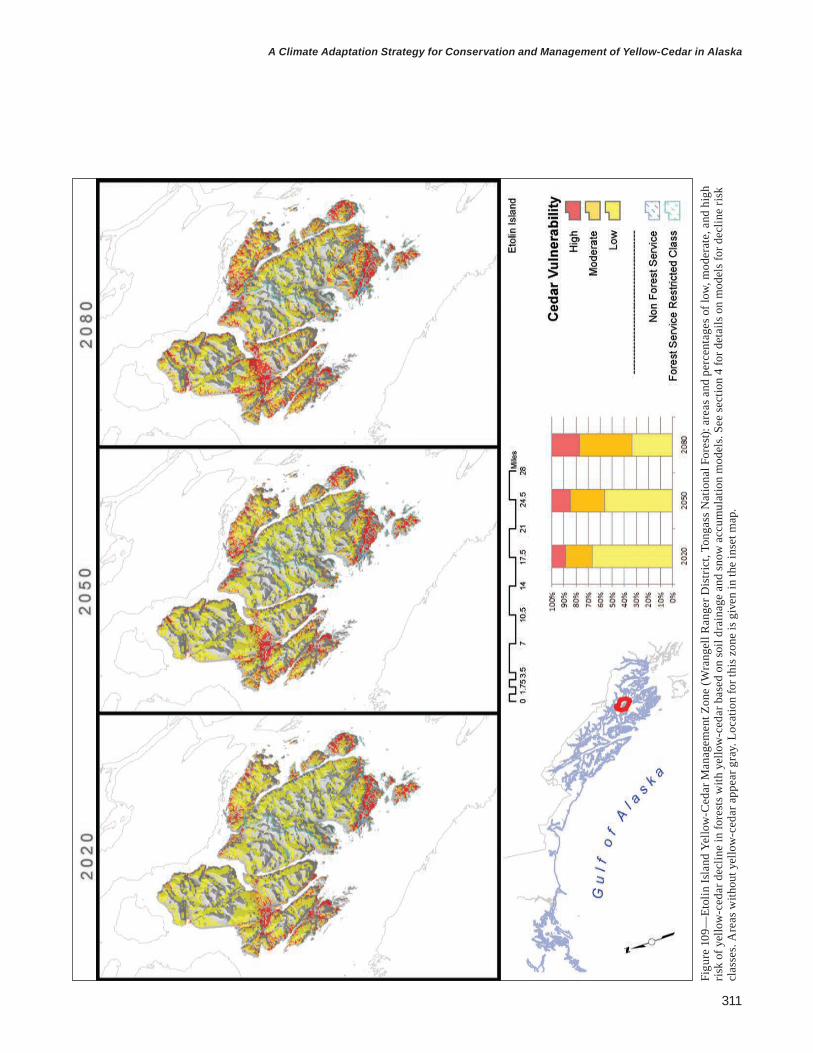
311
A Climate Adaptation Strategy for Conservation and Management of Yellow-Cedar in Alaska
Figu
re 1
09—
Etol
in Is
land
Yel
low
-Ced
ar M
anag
emen
t Zon
e (W
rang
ell R
ange
r Dis
tric
t, To
ngas
s Nat
iona
l For
est):
are
as a
nd p
erce
ntag
es o
f low
, mod
erat
e, a
nd h
igh
risk
of y
ello
w-c
edar
dec
line
in fo
rest
s with
yel
low
-ced
ar b
ased
on
soil
drai
nage
and
snow
acc
umul
atio
n m
odel
s. Se
e se
ctio
n 4
for d
etai
ls o
n m
odel
s for
dec
line
risk
clas
ses.
Are
as w
ithou
t yel
low
-ced
ar a
ppea
r gra
y. L
ocat
ion
for t
his z
one
is g
iven
in th
e in
set m
ap.

312
GENERAL TECHNICAL REPORT PNW-GTR-917
22. Wrangell IslandGeomorphology and Climate— Wrangell Island is in the Zimovia Strait Sedimentary and Volcanics Complex sub-section. This management zone is underlain by volcanic rock and has extensive postglacial surficial deposits. The geomorphology of the area is dominated by roll-ing hills and lowlands, but has some mountainous terrain. The hills and lowlands are poorly to moderately dissected by streams, and the soils are generally moder-ately well-drained to very poorly drained and moderately deep. There is a large area of raised marine sediment that fringes the coastline of the entire management zone and that is associated with poorly drained soils. Climate varies by elevation but is generally mild; less snow is produced on the south and west sides of Wrangell Island. The east side of the island is influenced by mainland mountains. At sea lev-el, the average annual temperature ranges from a minimum of 37 °F to a maximum of 50 °F. The average annual precipitation is 80 in, and the average annual snowfall is 55 in (Wrangell observation station, 509919).
Extent of yellow-cedar— The estimate of live yellow-cedar forest is 25,000 ac, which occupies about 20.6 percent of the total forested land (table 46). Yellow-cedar is well distributed on Wrangell Island. This zone contributes to 1.1 percent of the yellow-cedar acreage in Alaska.
Extent of yellow-cedar decline— Existing yellow-cedar decline has been mapped on 12,500 ac, or about 2.2 percent of the yellow-cedar decline acreage in Alaska. Decline is common on the poorly drained areas and low-relief geomorphic zones throughout the island. Yellow-cedar decline is also extensive on hillsides on the northeastern portion of Wrangell Island facing Blake Inlet.
Extent of yellow-cedar at future risk— Moderately high elevation nonalpine areas of Wrangell Island represent a substan-tial area of yellow-cedar habitat that will be subject to yellow-cedar decline in the future. The percentage of yellow-cedar forest area projected to be at high risk of yellow-cedar decline rises from 5 to 23 percent between 2020 and 2080 (fig. 110). High risk is expected to appear in the interior of the island and to progress upslope. Numerous areas where yellow-cedar decline currently occurs are rated at moder-ate risk in 2020, indicating that models may underestimate risk on Wrangell Island. The percentage of yellow-cedar forests expected to be at low risk decreases from 77 to 38 percent by 2080. These forests primarily occur at higher elevations.

313
A Climate Adaptation Strategy for Conservation and Management of Yellow-Cedar in Alaska
Landscapes in protected and active management zones— Most of the yellow-cedar acreage in this management zone is on land managed by the U.S. Forest Service, but >3,000 ac are estimated on State land. All but a few hundred acres of mapped yellow-cedar decline are on land managed by the Forest Service. Mapped yellow-cedar decline and most of the yellow-cedar acreage in each of the risk classes on land managed by the Forest Service occur in nonrestricted, de-velopment status.
Opportunities for conservation and management— Road access, land-use status, and the abundance of yellow-cedar and yellow-cedar decline all suggest opportunities for active management. Salvage harvest was conducted in the late 1990s on Wrangell Island near Nemo Point and these activities could continue in already declining yellow-cedar forests or those that become affected in the future. Succession to other tree species, including western redcedar, will occur in decline-affected forests whether there is salvage harvest or not. Yellow-cedar is expected to persist in the highest elevation where it grows on Wrangell Island, thereby helping to meet conservation goals.

314
GENERAL TECHNICAL REPORT PNW-GTR-917
Tabl
e 46
—W
rang
ell I
slan
d Ye
llow
-Ced
ar M
anag
emen
t Zon
e (W
rang
ell R
ange
r Dis
tric
t, To
ngas
s N
atio
nal F
ores
t): a
crea
ge o
f yel
low
-ced
ar,
curr
ent m
appe
d ye
llow
-ced
ar d
eclin
e, a
nd p
roje
cted
per
cent
age
of y
ello
w-c
edar
occ
urre
nce
in th
ree
decl
ine
risk
cla
sses
in 2
020,
205
0,
and
2080
Lan
d ow
ners
hip
Fore
st
land
Yello
w-
ceda
ra
Map
ped
ye
llow
-ced
ar
decl
ine,
20
13b
Dec
line
risk
cla
ss,
proj
ecte
d, 2
020c
Dec
line
risk
cla
sses
, pr
ojec
ted,
205
0cD
eclin
e ri
sk c
lass
, pr
ojec
ted,
208
0c
Low
Med
ium
Hig
hL
owM
ediu
mH
igh
Low
Med
ium
Hig
h
- - -
- - -
- - -
Acre
s - -
- - -
- - -
- - -
- - -
- - -
- - -
- - -
Per
cent
age
of y
ello
w-c
edar
acr
eage
- - -
- - -
- - -
- - -
- -
Nat
iona
l for
est (
tota
l)10
1,39
421
,508
12,1
6372
123
6318
638
3217
Non
rest
ricte
d, d
evel
opm
entd
72,2
4516
,118
8,76
957
72
5012
330
2510
Non
rest
ricte
d, li
mite
d de
velo
pmen
te26
,796
4,87
63,
290
144
112
52
87
5 R
estri
cted
, non
deve
lopm
entf
2,35
351
410
41
10
11
00
11
Stat
e 16
,017
3,05
623
05
62
26
31
66
Priv
ate
275
550
00
00
00
00
0O
ther
gov
ernm
enta
l ent
ity3,
196
285
112
00
00
00
01
1U
nkno
wn
220
00
00
00
00
00
0
Tot
al12
1,10
224
,904
12,5
0577
185
6525
938
3923
- - -
- - -
100
- - -
- - -
- - -
- - -
100
- - -
- - -
- - -
- - -
100
- - -
- - -
a Are
a of
cur
rent
yel
low
-ced
ar fo
rest
s est
imat
ed fr
om sp
ecie
s dis
trib
utio
n m
odel
s and
surv
eys (
see
“Yel
low
-ced
ar d
istr
ibut
ion”
in se
ctio
n 4)
.b S
ee “Y
ello
w-c
edar
dec
line”
in se
ctio
n 4
for m
ore
info
rmat
ion
on h
ow a
crea
ge o
f yel
low
-ced
ar d
eclin
e w
as m
appe
d.
c Per
cent
age
of th
e es
timat
ed y
ello
w-c
edar
dis
trib
utio
n ac
reag
e th
at is
pro
ject
ed to
be
in lo
w-,
med
ium
-, an
d hi
gh-r
isk
clas
ses f
or y
ello
w-
ceda
r dec
line
base
d on
hyd
rolo
gy a
nd sn
ow m
odel
ing.
Per
cent
ages
may
not
sum
to 1
00 b
ecau
se o
f rou
ndin
g.
d Non
rest
rict
ed, d
evel
opm
ent:
land
use
des
igna
tions
that
per
mit
com
mer
cial
tim
ber h
arve
st o
n a
regu
late
d (s
ched
uled
) bas
is.
e Non
rest
rict
ed, l
imite
d de
velo
pmen
t: la
nd u
se d
esig
natio
ns th
at d
o no
t per
mit
com
mer
cial
tim
ber o
n a
regu
late
d ba
sis.
On
a ca
se-b
y-ca
se
basi
s the
follo
win
g ac
tiviti
es m
ay b
e al
low
ed: s
alva
ge, p
erso
nal u
se, t
hinn
ing,
pru
ning
, or p
lant
ing.
f R
estr
icte
d la
nd is
land
per
man
ently
rese
rved
from
woo
d pr
oduc
ts u
tiliz
atio
n th
roug
h st
atut
e or
adm
inis
trat
ive
desi
gnat
ion.
Exa
mpl
es a
re
natio
nal f
ores
t wild
erne
ss a
reas
, nat
iona
l mon
umen
ts, a
nd w
ithdr
awal
are
as.

315
A Climate Adaptation Strategy for Conservation and Management of Yellow-Cedar in Alaska
Figu
re 1
10—
Wra
ngel
l Isl
and
Yello
w-C
edar
Man
agem
ent Z
one
(Wra
ngel
l Ran
ger D
istr
ict,
Tong
ass N
atio
nal F
ores
t): a
reas
and
per
cent
ages
of l
ow, m
oder
ate,
an
d hi
gh ri
sk o
f yel
low
-ced
ar d
eclin
e in
fore
sts w
ith y
ello
w-c
edar
bas
ed o
n so
il dr
aina
ge a
nd sn
ow a
ccum
ulat
ion
mod
els.
See
sect
ion
4 fo
r det
ails
on
mod
els f
or
decl
ine
risk
clas
ses.
Are
as w
ithou
t yel
low
-ced
ar a
ppea
r gra
y. L
ocat
ion
for t
his z
one
is g
iven
in th
e in
set m
ap.

316
GENERAL TECHNICAL REPORT PNW-GTR-917
23. StikineGeomorphology and climate— The Eastern Passage Complex of sedimentary and volcanic material is the dominant lithologic formation in this management zone. Mountain slopes and summits domi-nate the area, with few lowland and hill landforms. There are abundant alpine areas on steep mountain slopes; lower elevations support coniferous forest. Small areas of wetland are also present, though glacial till is generally rare. Climate and winter snow vary along the elevation gradient from the coast to the interior mountains with abundant snow associated the steep terrain. There is no permanent weather sta-tion located in the mainland area of this management zone. Fringe forests near sea level will have a climate similar to the weather station at Petersburg, where aver-age annual temperature ranges from a minimum of 35 °F to a maximum of 48 °F, the average annual precipitation is 105 in, and the average annual snowfall is 107 in (Petersburg observation station, 507233).
Extent of yellow-cedar— There are an estimated 54,000 ac of yellow-cedar in this management zone out of a forestland of nearly 500,000 ac (table 47). Yellow-cedar populations here account for about 2.4 percent of the yellow-cedar acreage in Alaska. Yellow-cedar forests appear well distributed along the coast, including areas around Bradfield Canal, and also penetrate some mainland valleys.
Extent of yellow-cedar decline— About 21,000 ac of yellow-cedar decline have been mapped in this management zone, representing about 3.8 percent of the yellow-cedar decline acreage in Alaska. Decline is common in coastal areas, but also extends far back into the Eagle River drainage to the south of Bradfield Canal.
Extent of yellow-cedar at future risk— Projected high risk of yellow-cedar decline is initially low in 2020 (1 percent of yellow-cedar acreage), especially in the southern extreme of this management zone (fig. 111). By 2080, high risk rises to 8 percent of yellow-cedar acreage, developing in some coastal mainland areas adjacent to Wrangell Island. Modeled risk to yel-low-cedar may be underestimated in portions of this zone, as yellow-cedar decline already occurs in some coastal areas that are rated as low-to-moderate risk in 2020; however, some of these areas develop a high risk by 2080. Generally, yellow-cedar forests rated at low risk to yellow-cedar decline initially prevail (92 percent) but

317
A Climate Adaptation Strategy for Conservation and Management of Yellow-Cedar in Alaska
drop to 71 percent by 2080. Yellow-cedar forests that remain at low risk generally occur at high elevation in valleys that extend deeply into the mainland.
Landscapes in protected and active management zones— Nearly all of the yellow-cedar forests in this zone occur on land managed by the U.S. Forest Service, with most of the remainder (2,000 ac) on State land; a smaller amount is on private land. On land managed by the Forest Service, yellow-cedar is well distributed among the land-use categories. Most of the mapped yellow-cedar decline is on lands in nonrestricted, limited development status.
Opportunities for conservation and management— There is only limited opportunity for active forest management given the minimal road access and negligible recent timber harvests. Planting and thinning to promote yellow-cedar is possible, especially considering the large proportion rated at low risk into the future. The health status of yellow-cedar is favorable in this manage-ment zone, with >90 percent persisting at low-to-medium risk of yellow-cedar decline, although this percentage may be an overestimate. Snow protects yellow-cedar trees in these areas, and probably facilitates successful natural regeneration to sustain yellow-cedar forests.
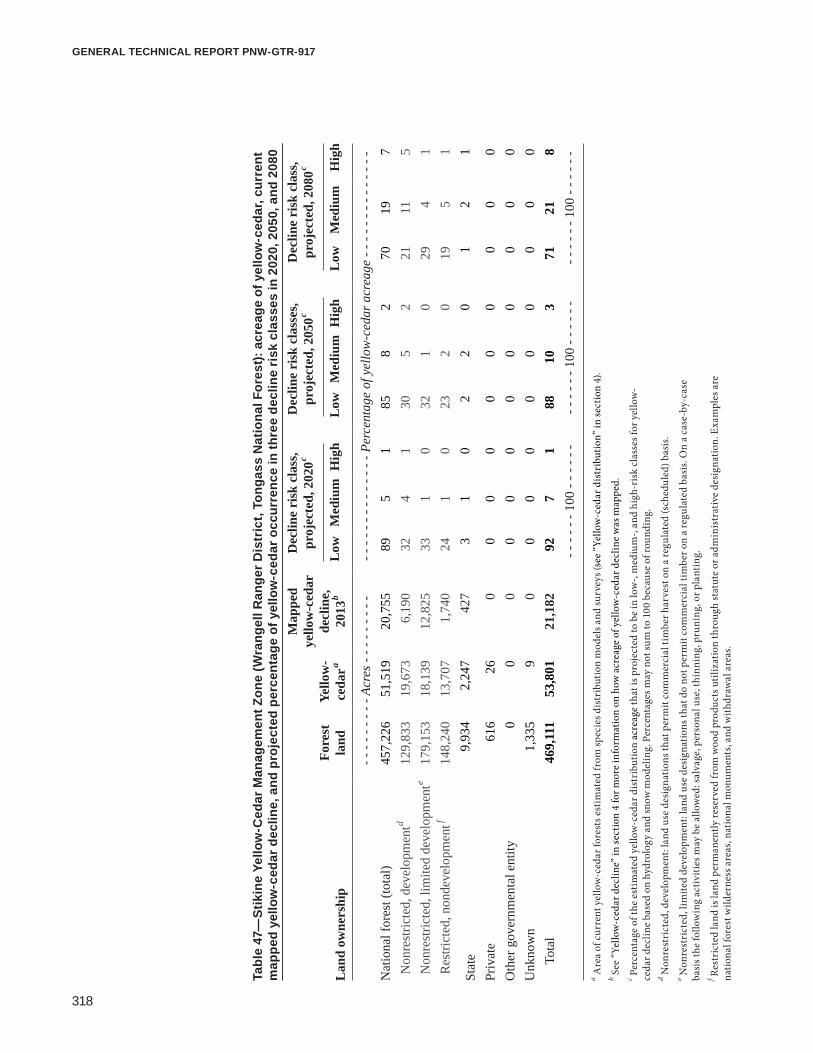
318
GENERAL TECHNICAL REPORT PNW-GTR-917
Tabl
e 47
—St
ikin
e Ye
llow
-Ced
ar M
anag
emen
t Zon
e (W
rang
ell R
ange
r Dis
tric
t, To
ngas
s N
atio
nal F
ores
t): a
crea
ge o
f yel
low
-ced
ar, c
urre
nt
map
ped
yello
w-c
edar
dec
line,
and
pro
ject
ed p
erce
ntag
e of
yel
low
-ced
ar o
ccur
renc
e in
thre
e de
clin
e ri
sk c
lass
es in
202
0, 2
050,
and
208
0
Lan
d ow
ners
hip
Fore
st
land
Yello
w-
ceda
ra
Map
ped
ye
llow
-ced
ar
decl
ine,
20
13b
Dec
line
risk
cla
ss,
proj
ecte
d, 2
020c
Dec
line
risk
cla
sses
, pr
ojec
ted,
205
0cD
eclin
e ri
sk c
lass
, pr
ojec
ted,
208
0c
Low
Med
ium
Hig
hL
owM
ediu
mH
igh
Low
Med
ium
Hig
h
- - -
- - -
- - -
Acre
s - -
- - -
- - -
- - -
- - -
- - -
- - -
- - -
Per
cent
age
of y
ello
w-c
edar
acr
eage
- - -
- - -
- - -
- - -
- -
Nat
iona
l for
est (
tota
l)45
7,22
651
,519
20,7
5589
51
858
270
197
Non
rest
ricte
d, d
evel
opm
entd
129,
833
19,6
736,
190
324
130
52
2111
5 N
onre
stric
ted,
lim
ited
deve
lopm
ente
179,
153
18,1
3912
,825
331
032
10
294
1 R
estri
cted
, non
deve
lopm
entf
148,
240
13,7
071,
740
241
023
20
195
1
Stat
e 9,
934
2,24
742
73
10
22
01
21
Priv
ate
616
260
00
00
00
00
0O
ther
gov
ernm
enta
l ent
ity0
00
00
00
00
00
0U
nkno
wn
1,33
59
00
00
00
00
00
T
otal
469,
111
53,8
0121
,182
927
188
103
7121
8- -
- - -
- 10
0 - -
- - -
- - -
- - -
- 10
0 - -
- - -
- - -
- - -
- 10
0 - -
- - -
- a A
rea
of c
urre
nt y
ello
w-c
edar
fore
sts e
stim
ated
from
spec
ies d
istr
ibut
ion
mod
els a
nd su
rvey
s (se
e “Y
ello
w-c
edar
dis
trib
utio
n” in
sect
ion
4).
b See
“Yel
low
-ced
ar d
eclin
e” in
sect
ion
4 fo
r mor
e in
form
atio
n on
how
acr
eage
of y
ello
w-c
edar
dec
line
was
map
ped.
c P
erce
ntag
e of
the
estim
ated
yel
low
-ced
ar d
istr
ibut
ion
acre
age
that
is p
roje
cted
to b
e in
low
-, m
ediu
m-,
and
high
-ris
k cl
asse
s for
yel
low
- ce
dar d
eclin
e ba
sed
on h
ydro
logy
and
snow
mod
elin
g. P
erce
ntag
es m
ay n
ot su
m to
100
bec
ause
of r
ound
ing.
d N
onre
stri
cted
, dev
elop
men
t: la
nd u
se d
esig
natio
ns th
at p
erm
it co
mm
erci
al ti
mbe
r har
vest
on
a re
gula
ted
(sch
edul
ed) b
asis
.e N
onre
stri
cted
, lim
ited
deve
lopm
ent:
land
use
des
igna
tions
that
do
not p
erm
it co
mm
erci
al ti
mbe
r on
a re
gula
ted
basi
s. O
n a
case
-by-
case
ba
sis t
he fo
llow
ing
activ
ities
may
be
allo
wed
: sal
vage
, per
sona
l use
, thi
nnin
g, p
runi
ng, o
r pla
ntin
g.
f Res
tric
ted
land
is la
nd p
erm
anen
tly re
serv
ed fr
om w
ood
prod
ucts
util
izat
ion
thro
ugh
stat
ute
or a
dmin
istr
ativ
e de
sign
atio
n. E
xam
ples
are
na
tiona
l for
est w
ilder
ness
are
as, n
atio
nal m
onum
ents
, and
with
draw
al a
reas
.
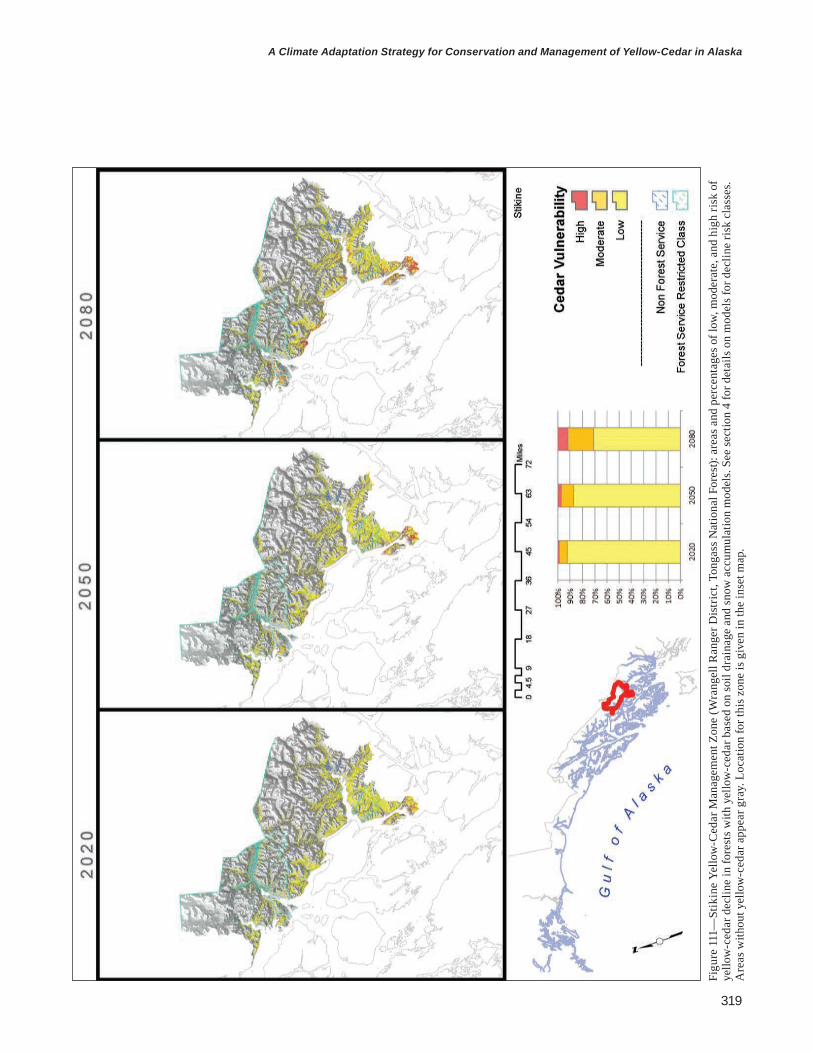
319
A Climate Adaptation Strategy for Conservation and Management of Yellow-Cedar in Alaska
Figu
re 1
11—
Stik
ine
Yello
w-C
edar
Man
agem
ent Z
one
(Wra
ngel
l Ran
ger D
istr
ict,
Tong
ass N
atio
nal F
ores
t): a
reas
and
per
cent
ages
of l
ow, m
oder
ate,
and
hig
h ris
k of
ye
llow
-ced
ar d
eclin
e in
fore
sts w
ith y
ello
w-c
edar
bas
ed o
n so
il dr
aina
ge a
nd sn
ow a
ccum
ulat
ion
mod
els.
See
sect
ion
4 fo
r det
ails
on
mod
els f
or d
eclin
e ris
k cl
asse
s. A
reas
with
out y
ello
w-c
edar
app
ear g
ray.
Loc
atio
n fo
r thi
s zon
e is
giv
en in
the
inse
t map
.

320
GENERAL TECHNICAL REPORT PNW-GTR-917
24. HecetaGeomorphology and climate— This management zone contains several islands, including Heceta, Kosciusko, Tuxecan, Warren, and Coronation Islands. The ecological zones are diverse and include volcanic and sedimentary rock complexes and the Kuiu–North Prince of Wales Carbonate subsection with abundant karst terrain. Karst-derived soils tend to be nutrient-rich and well drained, supporting productive coniferous forests where yellow-cedar is generally outcompeted. The North Prince of Wales Sedimentary and Volcanics Complex on eastern Kosciusko Island includes low rolling hill land-forms, with almost half of this area covered with palustrine and emergent wetland. The climate is mild and snowpack is not consistent in winter except at higher eleva-tions. At sea level, the average annual temperature ranges from a minimum of 38 °F to a maximum of 47 °F. The average annual precipitation is 72 in, and the average annual snowfall is 16 in (Cape Decision Lighthouse observation station, 501269).
Extent of yellow-cedar— Yellow-cedar is estimated to occur on 37,000 ac, making up 17.0 percent of the for-ested land in this zone and about 1.6 percent of the yellow-cedar acreage in Alaska (table 48). Yellow-cedar appears concentrated in certain portions of this manage-ment zone, probably the result of soils, drainage, and site productivity. The species appears less common on some areas of Heceta, Kosciusko, and Tuxecan Islands.
Extent of yellow-cedar decline— Yellow-cedar decline has been mapped on nearly 17,000 ac, or about 3.0 per-cent of the yellow-cedar decline acreage in Alaska. It exists on the outer islands (Coronation and Warren Islands) and the poorly drained portions of the other is-lands.
Extent of yellow-cedar at future risk— The share of yellow-cedar at high risk of decline is expected to increase from 13 to 24 percent between 2020 and 2080, while the share at low risk decreases from 50 to 20 percent in that time (fig. 112). Increased risk is expected to expand to higher elevations and on the northeast portion of Kusciusko Island.
Landscapes in protected and active management zones— Nearly all yellow-cedar in this zone occurs on land managed by the U.S. Forest Service. Most of the yellow-cedar acreage and the mapped yellow-cedar decline is in restricted, nondevelopment status, but sizable areas are also designated as nonre-stricted, development status. By 2080, most of the low-risk acreage is projected to occur on restricted, nondevelopment status lands.

321
A Climate Adaptation Strategy for Conservation and Management of Yellow-Cedar in Alaska
Opportunities for conservation and management— A substantial portion of yellow-cedar has already been affected by yellow-cedar decline, and modest increases in mortality are expected. The restricted land-use classification limits active management, such as salvage harvest and planting of yellow-cedar on well-drained soils. As young-growth stands are harvested in the nonrestricted, development land, some areas could be planted with yellow-cedar where deep rooting would protect them from freezing injury. Any yellow-cedar planting will be threatened by abundant deer populations throughout the zone. The health status of yellow-cedar in protected landscapes (e.g., Coronation Island and Warren Island Wilderness Areas) has been impaired by previous mortality and the long-term effects of limited regeneration, and is expected to be further impaired by future mortality.
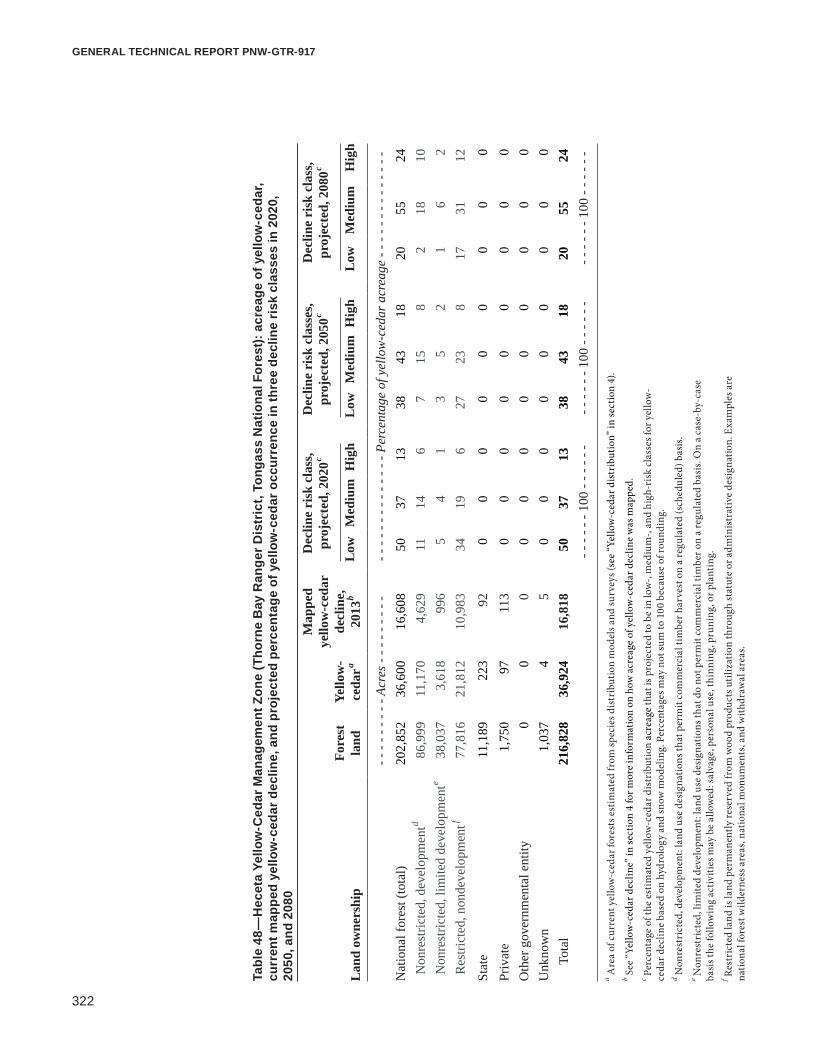
322
GENERAL TECHNICAL REPORT PNW-GTR-917
Tabl
e 48
—H
ecet
a Ye
llow
-Ced
ar M
anag
emen
t Zon
e (T
horn
e B
ay R
ange
r Dis
tric
t, To
ngas
s N
atio
nal F
ores
t): a
crea
ge o
f yel
low
-ced
ar,
curr
ent m
appe
d ye
llow
-ced
ar d
eclin
e, a
nd p
roje
cted
per
cent
age
of y
ello
w-c
edar
occ
urre
nce
in th
ree
decl
ine
risk
cla
sses
in 2
020,
20
50, a
nd 2
080
Lan
d ow
ners
hip
Fore
st
land
Yello
w-
ceda
ra
Map
ped
ye
llow
-ced
ar
decl
ine,
20
13b
Dec
line
risk
cla
ss,
proj
ecte
d, 2
020c
Dec
line
risk
cla
sses
, pr
ojec
ted,
205
0cD
eclin
e ri
sk c
lass
, pr
ojec
ted,
208
0c
Low
Med
ium
Hig
hL
owM
ediu
mH
igh
Low
Med
ium
Hig
h
- - -
- - -
- - -
Acre
s - -
- - -
- - -
- - -
- - -
- - -
- - -
- - -
Per
cent
age
of y
ello
w-c
edar
acr
eage
- - -
- - -
- - -
- - -
- -
Nat
iona
l for
est (
tota
l)20
2,85
236
,600
16,6
0850
3713
3843
1820
5524
Non
rest
ricte
d, d
evel
opm
entd
86,9
9911
,170
4,62
911
146
715
82
1810
Non
rest
ricte
d, li
mite
d de
velo
pmen
te38
,037
3,61
899
65
41
35
21
62
Res
trict
ed, n
onde
velo
pmen
tf77
,816
21,8
1210
,983
3419
627
238
1731
12
Stat
e 11
,189
223
920
00
00
00
00
Priv
ate
1,75
097
113
00
00
00
00
0O
ther
gov
ernm
enta
l ent
ity0
00
00
00
00
00
0U
nkno
wn
1,03
74
50
00
00
00
00
T
otal
216,
828
36,9
2416
,818
5037
1338
4318
2055
24- -
- - -
- 10
0 - -
- - -
- - -
- - -
- 10
0 - -
- - -
- - -
- - -
- 10
0 - -
- - -
- a A
rea
of c
urre
nt y
ello
w-c
edar
fore
sts e
stim
ated
from
spec
ies d
istr
ibut
ion
mod
els a
nd su
rvey
s (se
e “Y
ello
w-c
edar
dis
trib
utio
n” in
sect
ion
4).
b See
“Yel
low
-ced
ar d
eclin
e” in
sect
ion
4 fo
r mor
e in
form
atio
n on
how
acr
eage
of y
ello
w-c
edar
dec
line
was
map
ped.
c P
erce
ntag
e of
the
estim
ated
yel
low
-ced
ar d
istr
ibut
ion
acre
age
that
is p
roje
cted
to b
e in
low
-, m
ediu
m-,
and
high
-ris
k cl
asse
s for
yel
low
- ce
dar d
eclin
e ba
sed
on h
ydro
logy
and
snow
mod
elin
g. P
erce
ntag
es m
ay n
ot su
m to
100
bec
ause
of r
ound
ing.
d N
onre
stri
cted
, dev
elop
men
t: la
nd u
se d
esig
natio
ns th
at p
erm
it co
mm
erci
al ti
mbe
r har
vest
on
a re
gula
ted
(sch
edul
ed) b
asis
.e N
onre
stri
cted
, lim
ited
deve
lopm
ent:
land
use
des
igna
tions
that
do
not p
erm
it co
mm
erci
al ti
mbe
r on
a re
gula
ted
basi
s. O
n a
case
-by-
case
ba
sis t
he fo
llow
ing
activ
ities
may
be
allo
wed
: sal
vage
, per
sona
l use
, thi
nnin
g, p
runi
ng, o
r pla
ntin
g.
f Res
tric
ted
land
is la
nd p
erm
anen
tly re
serv
ed fr
om w
ood
prod
ucts
util
izat
ion
thro
ugh
stat
ute
or a
dmin
istr
ativ
e de
sign
atio
n. E
xam
ples
are
na
tiona
l for
est w
ilder
ness
are
as, n
atio
nal m
onum
ents
, and
with
draw
al a
reas
.

323
A Climate Adaptation Strategy for Conservation and Management of Yellow-Cedar in Alaska
Figu
re 1
12—
Hec
eta
Yello
w-C
edar
Man
agem
ent Z
one
(Tho
rne
Bay
Ran
ger D
istr
ict,
Tong
ass N
atio
nal F
ores
t): a
reas
and
per
cent
ages
of l
ow, m
oder
ate,
and
hig
h ris
k of
yel
low
-ced
ar d
eclin
e in
fore
sts w
ith y
ello
w-c
edar
bas
ed o
n so
il dr
aina
ge a
nd sn
ow a
ccum
ulat
ion
mod
els.
See
sect
ion
4 fo
r det
ails
on
mod
els f
or d
eclin
e ris
k cl
asse
s. A
reas
with
out y
ello
w-c
edar
app
ear g
ray.
Loc
atio
n fo
r thi
s zon
e is
giv
en in
the
inse
t map
.

324
GENERAL TECHNICAL REPORT PNW-GTR-917
25. Prince of Wales NorthGeomorphology and climate— This management zone is primarily composed of volcanics and till lowlands, with volcanic and sedimentary complexes to the north. The Central Prince of Wales Volcanics have steep-sided mountains and glacial till interspersed with alluvial val-leys. The glacial till along the mountain slopes and hills forms peatlands and forested wetlands (20 percent of the area) that provide habitat for yellow-cedar. The Central Prince of Wales Till Lowlands are dominated by glacial till with drumlin landforms and abundant forested and emergent wetland. The climate is mild at low elevations with consistent seasonal snowpack only at higher elevations. In the northern part of this zone, on the windward side of Prince of Wales Island, the average annual temperature ranges from a minimum of 38 °F to a maximum of 47 °F. The average annual precipitation is 72 in, and the average annual snowfall is 16 in (Cape Decision Lighthouse observation station, 501269). In the southern part of this zone, on the leeward side of Prince of Wales Island, the average annual temperature ranges from a minimum of 37 °F to a maximum of 51 °F. The average annual precipitation is 105 in, and the average annual snowfall is 45 in (Hollis observation station, 503650).
Extent of yellow-cedar— This zone has an estimated 139,500 ac of yellow-cedar forest, or 6.1 percent of the yellow-cedar acreage in Alaska (table 49). Yellow-cedar cover makes up 19.2 percent of the forested land in the management zone. Yellow-cedar appears to be widely distributed except in the lowland productive valleys in which much of the past timber harvesting has occurred.
Extent of yellow-cedar decline— Decline has been mapped on about 45,000 ac, or just under one-third of the esti-mated extent of yellow-cedar forest. This acreage accounts for about 7.9 percent of yellow-cedar decline in Alaska. Mapped yellow-cedar decline appears scattered around this zone, with notable patches along the west coast and northwest portion of Prince of Wales Island, often associated with less well-drained sites.
Extent of yellow-cedar at future risk— The percentage of yellow-cedar forests at high risk for decline is projected to rise from 21 to 35 percent between 2020 and 2080, while the percentage at low risk is expected to fall from 39 to 11 percent (fig. 113). Risk increase (from medium to high risk and low to medium risk) through time occurs along an elevation gradient as snow is reduced. Most yellow-cedar forests with low projected risk occur at the highest elevation range of yellow-cedar.

325
A Climate Adaptation Strategy for Conservation and Management of Yellow-Cedar in Alaska
Landscapes in protected and active management zones— The bulk of yellow-cedar and mapped decline are on land managed by the U.S. Forest Service, but both also occur on lands under State and private ownership. More than half of the yellow-cedar forests and about half of the decline on land managed by the Forest Service are in a nonrestricted, development classification.
Opportunities for conservation and management— The occurrence of yellow-cedar and forest decline on different ownerships and the nonrestricted, development status on land managed by the Forest Service suggest opportunity for active management, including salvage harvest of dead yellow-cedar. Forests that are expected to move into higher risk classes may provide increased opportunities for salvage. Decline-affected forests in restricted land classes are ex-pected to transition to western hemlock, western redcedar, and other species. Active management could facilitate this succession. With the active young-growth program on the Thorne Bay Ranger District, there may be opportunity to plant yellow-cedar on productive sites after harvest of young-growth. Natural regeneration of yellow-cedar in natural stands and in harvest units is expected to be severely limited by the large deer population in this management zone; similarly, planted seedlings will probably require protection from deer browse. Yellow-cedar is expected to persist as a larger forest component in high-elevation forests.

326
GENERAL TECHNICAL REPORT PNW-GTR-917
Tabl
e 49
—Pr
ince
of W
ales
Nor
th Y
ello
w-C
edar
Man
agem
ent Z
one
(Tho
rne
Bay
Ran
ger D
istr
ict,
Tong
ass
Nat
iona
l For
est):
acr
eage
of
yello
w-c
edar
, cur
rent
map
ped
yello
w-c
edar
dec
line,
and
pro
ject
ed p
erce
ntag
e of
yel
low
-ced
ar o
ccur
renc
e in
thre
e de
clin
e ri
sk c
lass
es in
20
20, 2
050,
and
208
0 20
20, 2
050,
and
208
0
Lan
d ow
ners
hip
Fore
st
land
Yello
w-
ceda
ra
Map
ped
ye
llow
-ced
ar
decl
ine,
20
13b
Dec
line
risk
cla
ss,
proj
ecte
d, 2
020c
Dec
line
risk
cla
sses
, pr
ojec
ted,
205
0cD
eclin
e ri
sk c
lass
, pr
ojec
ted,
208
0c
Low
Med
ium
Hig
hL
owM
ediu
mH
igh
Low
Med
ium
Hig
h
- - -
- - -
- - -
Acre
s - -
- - -
- - -
- - -
- - -
- - -
- - -
- - -
Per
cent
age
of y
ello
w-c
edar
acr
eage
- - -
- - -
- - -
- - -
- -
Nat
iona
l for
est (
tota
l)65
6,41
712
9,53
242
,757
3836
1926
4225
1050
32 N
onre
stric
ted,
dev
elop
men
td36
7,28
268
,780
21,3
6522
189
1522
136
2618
Non
rest
ricte
d, li
mite
d de
velo
pmen
te23
4,57
049
,346
17,8
5112
168
818
103
2012
Res
trict
ed, n
onde
velo
pmen
tf54
,565
11,4
053,
541
42
23
32
14
3
Stat
e 40
,018
3,99
31,
238
02
10
21
02
1
Priv
ate
25,7
875,
951
731
12
11
21
12
1O
ther
gov
ernm
enta
l ent
ity43
00
00
00
00
00
0U
nkno
wn
2,83
015
50
00
00
00
00
T
otal
725,
095
139,
491
44,7
3039
4021
2746
2711
5435
- - -
- - -
100
- - -
- - -
- - -
- - -
100
- - -
- - -
- - -
- - -
100
- - -
- - -
a Are
a of
cur
rent
yel
low
-ced
ar fo
rest
s est
imat
ed fr
om sp
ecie
s dis
trib
utio
n m
odel
s and
surv
eys (
see
“Yel
low
-ced
ar d
istr
ibut
ion”
in se
ctio
n 4)
.b S
ee “Y
ello
w-c
edar
dec
line”
in se
ctio
n 4
for m
ore
info
rmat
ion
on h
ow a
crea
ge o
f yel
low
-ced
ar d
eclin
e w
as m
appe
d.
c Per
cent
age
of th
e es
timat
ed y
ello
w-c
edar
dis
trib
utio
n ac
reag
e th
at is
pro
ject
ed to
be
in lo
w-,
med
ium
-, an
d hi
gh-r
isk
clas
ses f
or y
ello
w-
ceda
r dec
line
base
d on
hyd
rolo
gy a
nd sn
ow m
odel
ing.
Per
cent
ages
may
not
sum
to 1
00 b
ecau
se o
f rou
ndin
g.
d Non
rest
rict
ed, d
evel
opm
ent:
land
use
des
igna
tions
that
per
mit
com
mer
cial
tim
ber h
arve
st o
n a
regu
late
d (s
ched
uled
) bas
is.
e Non
rest
rict
ed, l
imite
d de
velo
pmen
t: la
nd u
se d
esig
natio
ns th
at d
o no
t per
mit
com
mer
cial
tim
ber o
n a
regu
late
d ba
sis.
On
a ca
se-b
y-ca
se
basi
s the
follo
win
g ac
tiviti
es m
ay b
e al
low
ed: s
alva
ge, p
erso
nal u
se, t
hinn
ing,
pru
ning
, or p
lant
ing.
f R
estr
icte
d la
nd is
land
per
man
ently
rese
rved
from
woo
d pr
oduc
ts u
tiliz
atio
n th
roug
h st
atut
e or
adm
inis
trat
ive
desi
gnat
ion.
Exa
mpl
es a
re
natio
nal f
ores
t wild
erne
ss a
reas
, nat
iona
l mon
umen
ts, a
nd w
ithdr
awal
are
as.
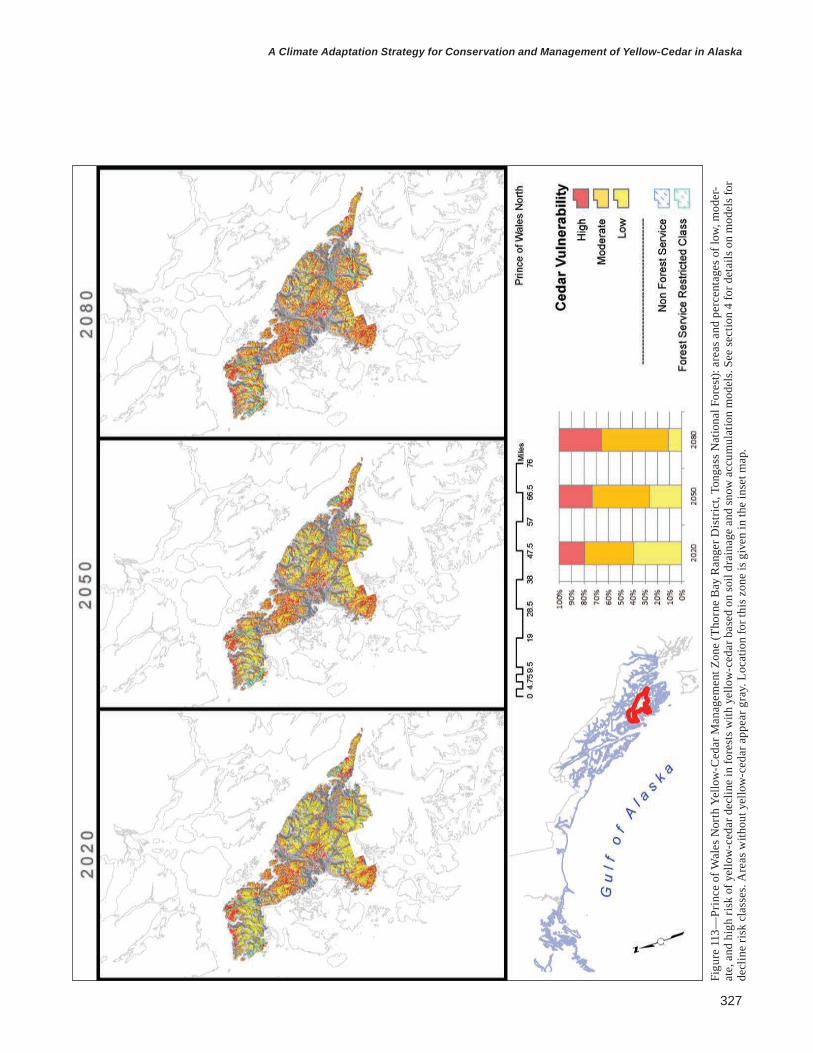
327
A Climate Adaptation Strategy for Conservation and Management of Yellow-Cedar in Alaska
Figu
re 1
13—
Prin
ce o
f Wal
es N
orth
Yel
low
-Ced
ar M
anag
emen
t Zon
e (T
horn
e B
ay R
ange
r Dis
tric
t, To
ngas
s Nat
iona
l For
est):
are
as a
nd p
erce
ntag
es o
f low
, mod
er-
ate,
and
hig
h ris
k of
yel
low
-ced
ar d
eclin
e in
fore
sts w
ith y
ello
w-c
edar
bas
ed o
n so
il dr
aina
ge a
nd sn
ow a
ccum
ulat
ion
mod
els.
See
sect
ion
4 fo
r det
ails
on
mod
els f
or
decl
ine
risk
clas
ses.
Are
as w
ithou
t yel
low
-ced
ar a
ppea
r gra
y. L
ocat
ion
for t
his z
one
is g
iven
in th
e in
set m
ap.
328
GENERAL TECHNICAL REPORT PNW-GTR-917
26. Craig Outer Islands Geomorphology and climate— This management zone includes Noyes, Lulu, San Fernando, Baker, and Suemez Islands to the north, and Dall, Sukkwan, and Long Islands to the south. These southwest Prince of Wales islands are dominated by complex sedimentary and vol-canic rock and till lowlands. The volcanic rock has led to the development of soils conducive to the growth of large and productive coniferous forest. Along with deep-er soils on weathered bedrock, there are areas of glacial till and forested wetlands that provide habitat for yellow-cedar; palustrine emergent peatlands are not as com-mon. The climate is hypermaritime with mild winters and substantial winter snow only at higher elevations. At sea level, the average annual temperature ranges from a minimum of 40 °F to a maximum of 51 °F. The average annual precipitation is 97 in, and the average annual snowfall is 23 in (Craig observation station, 502227).
Extent of yellow-cedar— Yellow-cedar occurs on an estimated 66,000 ac, accounting for 18.8 percent of the forestland in this management zone, and 2.9 percent of the yellow-cedar acreage in Alaska (table 50). There are some large areas of well-drained soil and productive forests where yellow-cedar is uncommon or absent. However, there are also obser-vations of where yellow-cedar competes well on extremely exposed sites along the outside coast. The exposure appears to be the limiting site factor, rather than soil drainage. In this case, yellow-cedar does well, though the trees are not very large.
Extent of yellow-cedar decline— Yellow-cedar decline has been mapped on 7,400 ac, a small portion of the yellow-cedar forests compared to other management zones. This acreage accounts for 1.3 percent of the mapped yellow-cedar decline in Alaska. It is scattered throughout the islands that make up this management zone.
Extent of yellow-cedar at future risk— The percentage of yellow-cedar forest projected to be at high risk of yellow-cedar decline increases from 26 to 35 percent between 2020 and 2080 (fig. 114). The high initial risk and relatively minor increase in risk are driven by the low snow levels that are already present in this zone. Only 7 percent of yellow-cedar forests are at low risk in 2080.
Landscapes in protected and active management zones— Most of the yellow-cedar acreage is on land managed by the U.S. Forest Service. Most yellow-cedar occurs on restricted, nondevelopment status lands, but the acre-age for existing yellow-cedar decline is mixed among the three land-use categories.
329
A Climate Adaptation Strategy for Conservation and Management of Yellow-Cedar in Alaska
About 8,000 ac of yellow-cedar forest and >1,000 ac of yellow-cedar decline are on private land. The large private holdings on Dall and Long Islands contain relatively little yellow-cedar acreage.
Opportunities for conservation and management— The small amount of yellow-cedar decline, land use designation, and remoteness of these areas limit salvage potential of dead yellow-cedar. Succession to other tree species (e.g., western redcedar and western hemlock) will occur in the decline-af-fected forests in the unmanaged wetter forests that are common in this management zone. A portion of this zone has well-drained sites and mild climate, which pro-vide an opportunity to produce the largest, fastest growing yellow-cedar in Alaska. However, planting, protection of seedlings from deer, and thinning will be required to increase the competitive status of yellow-cedar on these sites. In unmanaged ar-eas, the yellow-cedar component is expected to continue to undergo mortality. The exposed, windward sides of these islands may prove difficult locations for trees to thrive. The small area expected to be at low risk of decline by 2080 suggests that conservation goals may be more difficult to meet here than in other management zones.

330
GENERAL TECHNICAL REPORT PNW-GTR-917
Tabl
e 50
—C
raig
Out
er Is
land
s Ye
llow
-Ced
ar M
anag
emen
t Zon
e (C
raig
Ran
ger D
istr
ict,
Tong
ass
Nat
iona
l For
est):
acr
eage
of y
ello
w-c
edar
, cu
rren
t map
ped
yello
w-c
edar
dec
line,
and
pro
ject
ed p
erce
ntag
e of
yel
low
-ced
ar o
ccur
renc
e in
thre
e de
clin
e ri
sk c
lass
es in
202
0, 2
050,
an
d 20
80
Lan
d ow
ners
hip
Fore
st
land
Yello
w-
ceda
ra
Map
ped
ye
llow
-ced
ar
decl
ine,
20
13b
Dec
line
risk
cla
ss,
proj
ecte
d, 2
020c
Dec
line
risk
cla
sses
, pr
ojec
ted,
205
0cD
eclin
e ri
sk c
lass
, pr
ojec
ted,
208
0c
Low
Med
ium
Hig
hL
owM
ediu
mH
igh
Low
Med
ium
Hig
h
- - -
- - -
- - -
Acre
s - -
- - -
- - -
- - -
- - -
- - -
- - -
- - -
Per
cent
age
of y
ello
w-c
edar
acr
eage
- - -
- - -
- - -
- - -
- -
Nat
iona
l for
est (
tota
l)27
2,13
357
,523
6,11
821
4224
1346
286
5031
Non
rest
ricte
d, d
evel
opm
entd
49,7
2110
,605
1,48
06
83
38
51
96
Non
rest
ricte
d, li
mite
d de
velo
pmen
te13
5,94
231
,529
1,95
811
2314
725
164
2717
Res
trict
ed, n
onde
velo
pmen
tf86
,470
15,3
892,
680
511
73
138
113
8
Stat
e 2,
011
150
00
00
00
00
00
Priv
ate
75,8
648,
284
1,27
84
53
36
31
74
Oth
er g
over
nmen
tal e
ntity
00
00
00
00
00
00
Unk
now
n1,
506
51
00
00
00
00
0
Tot
al35
1,51
465
,962
7,39
726
4826
1652
327
5735
- - -
- - -
100
- - -
- - -
- - -
- - -
100
- - -
- - -
- - -
- - -
100
- - -
- - -
a Are
a of
cur
rent
yel
low
-ced
ar fo
rest
s est
imat
ed fr
om sp
ecie
s dis
trib
utio
n m
odel
s and
surv
eys (
see
“Yel
low
-ced
ar d
istr
ibut
ion”
in se
ctio
n 4)
.b S
ee “Y
ello
w-c
edar
dec
line”
in se
ctio
n 4
for m
ore
info
rmat
ion
on h
ow a
crea
ge o
f yel
low
-ced
ar d
eclin
e w
as m
appe
d.
c Per
cent
age
of th
e es
timat
ed y
ello
w-c
edar
dis
trib
utio
n ac
reag
e th
at is
pro
ject
ed to
be
in lo
w-,
med
ium
-, an
d hi
gh-r
isk
clas
ses f
or y
ello
w-
ceda
r dec
line
base
d on
hyd
rolo
gy a
nd sn
ow m
odel
ing.
Per
cent
ages
may
not
sum
to 1
00 b
ecau
se o
f rou
ndin
g.
d Non
rest
rict
ed, d
evel
opm
ent:
land
use
des
igna
tions
that
per
mit
com
mer
cial
tim
ber h
arve
st o
n a
regu
late
d (s
ched
uled
) bas
is.
e Non
rest
rict
ed, l
imite
d de
velo
pmen
t: la
nd u
se d
esig
natio
ns th
at d
o no
t per
mit
com
mer
cial
tim
ber o
n a
regu
late
d ba
sis.
On
a ca
se-b
y-ca
se
basi
s the
follo
win
g ac
tiviti
es m
ay b
e al
low
ed: s
alva
ge, p
erso
nal u
se, t
hinn
ing,
pru
ning
, or p
lant
ing.
f R
estr
icte
d la
nd is
land
per
man
ently
rese
rved
from
woo
d pr
oduc
ts u
tiliz
atio
n th
roug
h st
atut
e or
adm
inis
trat
ive
desi
gnat
ion.
Exa
mpl
es a
re
natio
nal f
ores
t wild
erne
ss a
reas
, nat
iona
l mon
umen
ts, a
nd w
ithdr
awal
are
as.

331
A Climate Adaptation Strategy for Conservation and Management of Yellow-Cedar in Alaska
Figu
re 1
14—
Cra
ig O
uter
Isla
nds Y
ello
w-C
edar
Man
agem
ent Z
one
(Cra
ig R
ange
r Dis
tric
t, To
ngas
s Nat
iona
l For
est):
are
as a
nd p
erce
ntag
es o
f low
, mod
erat
e, a
nd
high
risk
of y
ello
w-c
edar
dec
line
in fo
rest
s with
yel
low
-ced
ar b
ased
on
soil
drai
nage
and
snow
acc
umul
atio
n m
odel
s. Se
e se
ctio
n 4
for d
etai
ls o
n m
odel
s for
dec
line
risk
clas
ses.
Are
as w
ithou
t yel
low
-ced
ar a
ppea
r gra
y. L
ocat
ion
for t
his z
one
is g
iven
in th
e in
set m
ap.

332
GENERAL TECHNICAL REPORT PNW-GTR-917
27. Prince of Wales SouthGeomorphology and climate— The ecological subsections in this management zone are the South Prince of Wales Granitics to the south, the Moira Sound Complex and Central Prince of Wales Volcanics in the central portion, and the Hetta Inlet Metasediments and Skowl Arm Till Lowlands to the north. The Moira Sound Complex is lightly metamorphosed sedimentary and volcanic bedrock. Most of the area is underlain by colluvium that promotes poorly drained soils. The Central Prince of Wales Volcanics subsection has igneous intrusive rocks arrayed across mountainous terrain. This area has dis-sected mountain slopes and many large river drainages with well-developed flood-plains. There are also rolling hills at the toeslopes and footslopes of these steep mountainsides containing poorly drained soils that serve as the main yellow-cedar habitat. Climate is mild, and precipitation is mainly as rain except at higher eleva-tions. At sea level, the average annual temperature ranges from a minimum of 40 °F to a maximum of 51 °F. The average annual precipitation is 97 in, and the average annual snowfall is 23 in (Craig observation station, 502227).
Extent of yellow-cedar— Yellow-cedar occupies nearly 200,000 ac, or 25.2 percent of the forestland in this management zone and 8.8 percent of the yellow-cedar acreage in Alaska (table 51). Yellow-cedar appears common throughout this zone, but is generally outcompeted and less prevalent in productive lowland valley forests. There is a lack of yellow-cedar in the oldest young-growth stands, and regeneration of yellow-cedar is more likely to occur in more recent harvest areas in less productive sites.
Extent of yellow-cedar decline— Just over 37,000 ac of yellow-cedar decline have been mapped in this manage-ment zone, accounting for about 6.5 percent of the yellow-cedar decline acreage in Alaska. Yellow-cedar decline is currently scattered throughout, but is most common on hillsides because yellow-cedar is more abundant at middle and high elevations.
Extent of yellow-cedar at future risk— The percentage of yellow-cedar forest projected to be at high risk to yellow-cedar decline is expected to increase from 16 to 28 percent between 2020 and 2080 (fig. 115). High-risk areas in 2020 are concentrated in the southern portion of the island and at several low-elevation areas on to the northwest and western coasts. Some of

333
A Climate Adaptation Strategy for Conservation and Management of Yellow-Cedar in Alaska
these areas are low-productivity forested wetland and do not contain large trees. By 2080, increased risk is predicted for the inland yellow-cedar forests, with decline progressing upslope. The percentage of yellow-cedar forest modeled as having low risk to decline decreases from 46 to 17 percent by 2080, with relatively lower risk projected for upper-elevation yellow-cedar forests.
Landscapes in protected and active management zones— Most of the estimated 200,000 ac of yellow-cedar forest in this zone are on land managed by the U.S. Forest Service, but a significant portion (25,500 ac) occurs on private land. On land managed by the Forest Service, there are large acreages of yellow-cedar forest in all three land use designations, though few are dominated by yellow-cedar.
Opportunities for conservation and management— The distribution of yellow-cedar risk classes and land use designations indicate good prospects for both yellow-cedar conservation and management. The extensive road system may allow for yellow-cedar salvage in decline-affected forests and in areas expected to be affected in the future. Succession to other tree species, includ-ing western redcedar, will occur in unmanaged forests with yellow-cedar decline, such as the extensive southern portion in the South Prince of Wales Wilderness Area. Yellow-cedar regeneration is expected to be reduced by deer browse in un-managed natural stands at low elevations. Yellow-cedar could be promoted through planting and thinning in high-elevation forests and on productive sites with well-drained soils. With the active management that is expected in this management zone, there may be opportunities to plant yellow-cedar after timber harvest (in-cluding young-growth harvest) on all ownerships. Deer are expected to severely limit the success of natural yellow-cedar regeneration and planted seedlings unless protective measures are taken.

334
GENERAL TECHNICAL REPORT PNW-GTR-917
Tabl
e 51
—Pr
ince
of W
ales
Sou
th Y
ello
w-C
edar
Man
agem
ent Z
one
(Cra
ig R
ange
r Dis
tric
t, To
ngas
s N
atio
nal F
ores
t): a
crea
ge o
f yel
low
-ce
dar,
curr
ent m
appe
d ye
llow
-ced
ar d
eclin
e, a
nd p
roje
cted
per
cent
age
of y
ello
w-c
edar
occ
urre
nce
in th
ree
decl
ine
risk
cla
sses
in 2
020,
20
50, a
nd 2
080
Lan
d ow
ners
hip
Fore
st
land
Yello
w-
ceda
ra
Map
ped
ye
llow
-ced
ar
decl
ine,
20
13b
Dec
line
risk
cla
ss,
proj
ecte
d, 2
020c
Dec
line
risk
cla
sses
, pr
ojec
ted,
205
0cD
eclin
e ri
sk c
lass
, pr
ojec
ted,
208
0c
Low
Med
ium
Hig
hL
owM
ediu
mH
igh
Low
Med
ium
Hig
h
- - -
- - -
- - -
Acre
s - -
- - -
- - -
- - -
- - -
- - -
- - -
- - -
Per
cent
age
of y
ello
w-c
edar
acr
eage
- - -
- - -
- - -
- - -
- -
Nat
iona
l for
est (
tota
l)58
3,83
817
1,73
830
,749
4033
1329
4018
1548
24 N
onre
stric
ted,
dev
elop
men
td22
8,48
666
,333
13,9
3417
124
1215
66
189
Non
rest
ricte
d, li
mite
d de
velo
pmen
te20
3,87
962
,523
11,3
9214
125
1015
75
188
Res
trict
ed, n
onde
velo
pmen
tf15
1,47
342
,882
5,42
39
94
710
53
126
Stat
e 14
,025
1,33
682
80
00
00
00
00
Priv
ate
184,
780
25,5
565,
468
65
34
53
26
4O
ther
gov
ernm
enta
l ent
ity37
211
00
00
00
00
00
Unk
now
n4,
231
2013
00
00
00
00
0
Tot
al78
7,24
619
8,66
137
,057
4638
1634
4521
1755
28- -
- - -
- 10
0 - -
- - -
- - -
- - -
- 10
0 - -
- - -
- - -
- - -
- 10
0 - -
- - -
- a A
rea
of c
urre
nt y
ello
w-c
edar
fore
sts e
stim
ated
from
spec
ies d
istr
ibut
ion
mod
els a
nd su
rvey
s (se
e “Y
ello
w-c
edar
dis
trib
utio
n” in
sect
ion
4).
b See
“Yel
low
-ced
ar d
eclin
e” in
sect
ion
4 fo
r mor
e in
form
atio
n on
how
acr
eage
of y
ello
w-c
edar
dec
line
was
map
ped.
c P
erce
ntag
e of
the
estim
ated
yel
low
-ced
ar d
istr
ibut
ion
acre
age
that
is p
roje
cted
to b
e in
low
-, m
ediu
m-,
and
high
-ris
k cl
asse
s for
yel
low
- ce
dar d
eclin
e ba
sed
on h
ydro
logy
and
snow
mod
elin
g. P
erce
ntag
es m
ay n
ot su
m to
100
bec
ause
of r
ound
ing.
d N
onre
stri
cted
, dev
elop
men
t: la
nd u
se d
esig
natio
ns th
at p
erm
it co
mm
erci
al ti
mbe
r har
vest
on
a re
gula
ted
(sch
edul
ed) b
asis
.e N
onre
stri
cted
, lim
ited
deve
lopm
ent:
land
use
des
igna
tions
that
do
not p
erm
it co
mm
erci
al ti
mbe
r on
a re
gula
ted
basi
s. O
n a
case
-by-
case
ba
sis t
he fo
llow
ing
activ
ities
may
be
allo
wed
: sal
vage
, per
sona
l use
, thi
nnin
g, p
runi
ng, o
r pla
ntin
g.
f Res
tric
ted
land
is la
nd p
erm
anen
tly re
serv
ed fr
om w
ood
prod
ucts
util
izat
ion
thro
ugh
stat
ute
or a
dmin
istr
ativ
e de
sign
atio
n. E
xam
ples
are
na
tiona
l for
est w
ilder
ness
are
as, n
atio
nal m
onum
ents
, and
with
draw
al a
reas
.

335
A Climate Adaptation Strategy for Conservation and Management of Yellow-Cedar in Alaska
Figu
re 1
15—
Prin
ce o
f Wal
es S
outh
Yel
low
-Ced
ar M
anag
emen
t Zon
e (C
raig
Ran
ger D
istr
ict,
Tong
ass N
atio
nal F
ores
t): a
reas
and
per
cent
ages
of l
ow, m
oder
ate,
and
hi
gh ri
sk o
f yel
low
-ced
ar d
eclin
e in
fore
sts w
ith y
ello
w-c
edar
bas
ed o
n so
il dr
aina
ge a
nd sn
ow a
ccum
ulat
ion
mod
els.
See
sect
ion
4 fo
r det
ails
on
mod
els f
or d
eclin
e ris
k cl
asse
s. A
reas
with
out y
ello
w-c
edar
app
ear g
ray.
Loc
atio
n fo
r thi
s zon
e is
giv
en in
the
inse
t map
.
336
GENERAL TECHNICAL REPORT PNW-GTR-917
28. Cleveland PeninsulaGeomorphology and climate— The western portion of this management zone is part of the Clarence Strait Volcanics subsection. Moving inland, other ecological subsections in this zone are the Traitors Cove Metasediments, the Ketchikan Mafics/Ultramafics, the Vixen Inlet Till Lowlands, the Zimovia Strait Complex, and the Berg Bay Complex. The geology is composed of plutonic rock that has been extensively modified by gla-cial action. Shallow to bedrock soils on summits and high-elevation alpine areas transition to deeper soils formed on colluvial footslopes and till toeslopes. Low-productivity forested wetlands make up about 35 percent of the western volcanics area. Climate varies widely from the mild coastal areas to the mountainous areas of the zone’s eastern portion, which has colder winters and consistent winter snow-pack. At sea level, the average annual temperature ranges from a minimum of 41 °F to a maximum of 51 °F. The average annual precipitation is 66 in, and the average annual snowfall is 33 in (Guard Island Lighthouse observation station, 503454).
Extent of yellow-cedar— Yellow-cedar occupies an estimated 66,500 ac, constituting 24.7 percent of the for-ested acreage in this management zone and 2.9 percent of the yellow-cedar forests in Alaska (table 52). Yellow-cedar appears well distributed throughout this manage-ment zone, but is lacking from some productive forested valleys and the areas above timberline to the east.
Extent of yellow-cedar decline— About 21,000 ac of yellow-cedar decline have been mapped in this management zone. This accounts for about 3.7 percent of yellow-cedar decline acreage in Alaska. Yellow-cedar decline is common on hillsides at mid-elevation.
Extent of yellow-cedar at future risk— The pattern of risk to yellow-cedar decline in this zone follows a west-to-east gradi-ent. The percentage of yellow-cedar forest projected to be at high risk to yellow-cedar decline is expected to increase from 19 to 29 percent by 2080 (fig. 116). High risk is modeled as being concentrated initially at low elevations in the western portion of the management zone, advancing to higher elevations and eastward over time. The percentage of yellow-cedar projected to be at low risk to yellow-cedar decline decreases from 55 to 26 percent by 2080. Despite this significant drop in the proportion of acreage at low risk, abundant low-risk forests occur at higher eleva-

337
A Climate Adaptation Strategy for Conservation and Management of Yellow-Cedar in Alaska
tions in the western portion and extensive inland areas to the east. Our models may underestimate risk in some portions of this management zone; for example, yellow-cedar decline already occurs on Bell Island and some adjacent mainland coastal areas and valleys rated to have medium risk in 2020 and 2050, but these areas prog-ress to high risk by 2080.
Landscapes in protected and active management zones— Nearly all of yellow-cedar forests occur on land managed by the U.S. Forest Service. Most of this acreage is on nonrestricted, limited development and nonre-stricted, development designations. By 2080, most of the yellow-cedar forests at low risk are only on nonrestricted, limited development lands.
Opportunities for conservation and management— The mixtures of yellow-cedar risk classes and land use designations suggest oppor-tunities for both yellow-cedar conservation and management. Lands with yellow-cedar decline and future decline are available for salvage harvest, but the limited road access may make this activity less economically feasible. Succession to other tree species, including western redcedar at low elevations, will occur in decline-affected forests with no management. Conservation goals for yellow-cedar will be met at high elevations and in productive forests where it mixes with other trees spe-cies. Planting and thinning of yellow-cedar can occur in high-elevation forests and eastern mountainous areas that retain low risk due to heavy snow. The success of natural regeneration and planted yellow-cedar are expected to vary by elevation and along the gradient from western coastal forests to the mountainous areas to the east.
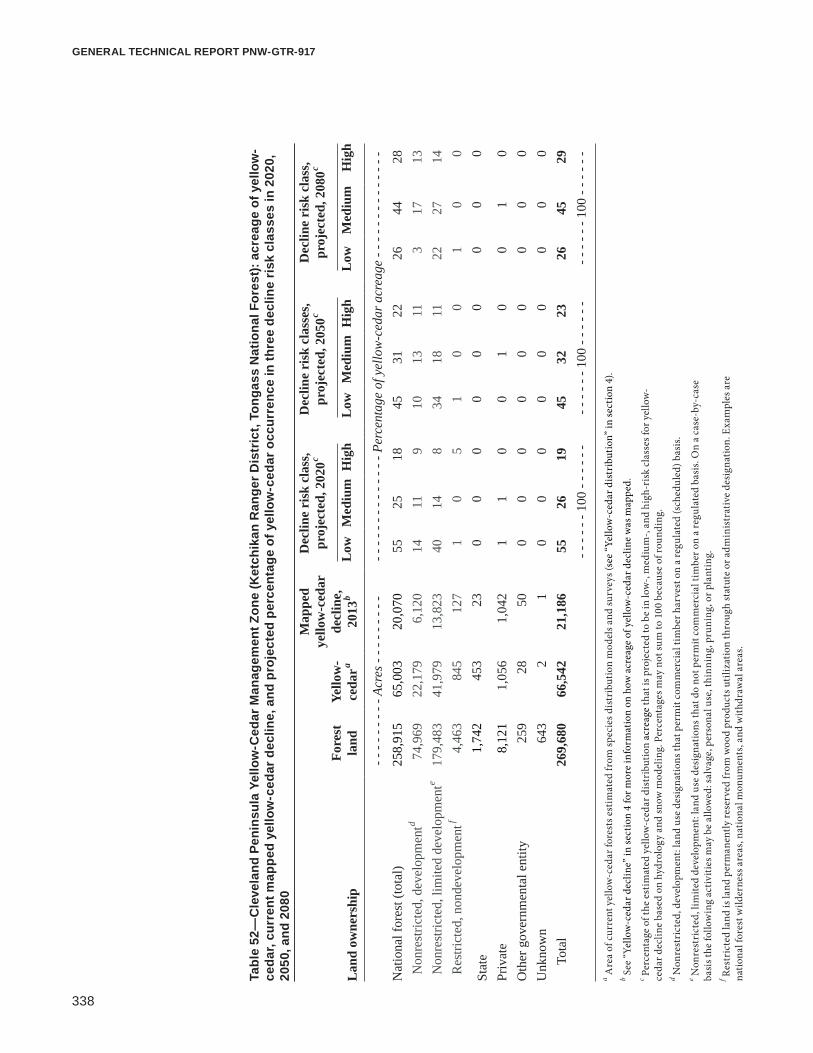
338
GENERAL TECHNICAL REPORT PNW-GTR-917
Tabl
e 52
—C
leve
land
Pen
insu
la Y
ello
w-C
edar
Man
agem
ent Z
one
(Ket
chik
an R
ange
r Dis
tric
t, To
ngas
s N
atio
nal F
ores
t): a
crea
ge o
f yel
low
-ce
dar,
curr
ent m
appe
d ye
llow
-ced
ar d
eclin
e, a
nd p
roje
cted
per
cent
age
of y
ello
w-c
edar
occ
urre
nce
in th
ree
decl
ine
risk
cla
sses
in 2
020,
20
50, a
nd 2
080
Lan
d ow
ners
hip
Fore
st
land
Yello
w-
ceda
ra
Map
ped
ye
llow
-ced
ar
decl
ine,
20
13b
Dec
line
risk
cla
ss,
proj
ecte
d, 2
020c
Dec
line
risk
cla
sses
, pr
ojec
ted,
205
0cD
eclin
e ri
sk c
lass
, pr
ojec
ted,
208
0c
Low
Med
ium
Hig
hL
owM
ediu
mH
igh
Low
Med
ium
Hig
h
- - -
- - -
- - -
Acre
s - -
- - -
- - -
- - -
- - -
- - -
- - -
- - -
Per
cent
age
of y
ello
w-c
edar
acr
eage
- - -
- - -
- - -
- - -
- -
Nat
iona
l for
est (
tota
l)25
8,91
565
,003
20,0
70
5525
1845
3122
2644
28 N
onre
stric
ted,
dev
elop
men
td74
,969
22,1
796,
120
1411
910
1311
317
13 N
onre
stric
ted,
lim
ited
deve
lopm
ente
179,
483
41,9
7913
,823
4014
834
1811
2227
14 R
estri
cted
, non
deve
lopm
entf
4,46
384
512
71
05
10
01
00
Stat
e 1,
742
453
230
00
00
00
00
Priv
ate
8,12
11,
056
1,04
21
10
01
00
10
Oth
er g
over
nmen
tal e
ntity
259
2850
00
00
00
00
0U
nkno
wn
643
21
00
00
00
00
0
Tot
al26
9,68
066
,542
21,1
8655
2619
4532
2326
4529
- - -
- - -
100
- - -
- - -
- - -
- - -
100
- - -
- - -
- - -
- - -
100
- - -
- - -
a Are
a of
cur
rent
yel
low
-ced
ar fo
rest
s est
imat
ed fr
om sp
ecie
s dis
trib
utio
n m
odel
s and
surv
eys (
see
“Yel
low
-ced
ar d
istr
ibut
ion”
in se
ctio
n 4)
.b S
ee “Y
ello
w-c
edar
dec
line”
in se
ctio
n 4
for m
ore
info
rmat
ion
on h
ow a
crea
ge o
f yel
low
-ced
ar d
eclin
e w
as m
appe
d.
c Per
cent
age
of th
e es
timat
ed y
ello
w-c
edar
dis
trib
utio
n ac
reag
e th
at is
pro
ject
ed to
be
in lo
w-,
med
ium
-, an
d hi
gh-r
isk
clas
ses f
or y
ello
w-
ceda
r dec
line
base
d on
hyd
rolo
gy a
nd sn
ow m
odel
ing.
Per
cent
ages
may
not
sum
to 1
00 b
ecau
se o
f rou
ndin
g.
d Non
rest
rict
ed, d
evel
opm
ent:
land
use
des
igna
tions
that
per
mit
com
mer
cial
tim
ber h
arve
st o
n a
regu
late
d (s
ched
uled
) bas
is.
e Non
rest
rict
ed, l
imite
d de
velo
pmen
t: la
nd u
se d
esig
natio
ns th
at d
o no
t per
mit
com
mer
cial
tim
ber o
n a
regu
late
d ba
sis.
On
a ca
se-b
y-ca
se
basi
s the
follo
win
g ac
tiviti
es m
ay b
e al
low
ed: s
alva
ge, p
erso
nal u
se, t
hinn
ing,
pru
ning
, or p
lant
ing.
f R
estr
icte
d la
nd is
land
per
man
ently
rese
rved
from
woo
d pr
oduc
ts u
tiliz
atio
n th
roug
h st
atut
e or
adm
inis
trat
ive
desi
gnat
ion.
Exa
mpl
es a
re
natio
nal f
ores
t wild
erne
ss a
reas
, nat
iona
l mon
umen
ts, a
nd w
ithdr
awal
are
as.

339
A Climate Adaptation Strategy for Conservation and Management of Yellow-Cedar in Alaska
Figu
re 1
16—
Cle
vela
nd P
enin
sula
Yel
low
-Ced
ar M
anag
emen
t Zon
e (K
etch
ikan
Ran
ger D
istr
ict,
Tong
ass N
atio
nal F
ores
t): a
reas
and
per
cent
ages
of l
ow, m
oder
ate,
an
d hi
gh ri
sk o
f yel
low
-ced
ar d
eclin
e in
fore
sts w
ith y
ello
w-c
edar
bas
ed o
n so
il dr
aina
ge a
nd sn
ow a
ccum
ulat
ion
mod
els.
See
sect
ion
4 fo
r det
ails
on
mod
els f
or
decl
ine
risk
clas
ses.
Are
as w
ithou
t yel
low
-ced
ar a
ppea
r gra
y. L
ocat
ion
for t
his z
one
is g
iven
in th
e in
set m
ap.

340
GENERAL TECHNICAL REPORT PNW-GTR-917
29. Gravina IslandGeomorphology and climate— Volcanic rocks of the Gravina Belt make up the Clarence Strait Volcanics sub-section in this management zone. Smooth, rounded mountains have been left by continental ice floes with the landforms dominated by mountain slopes. Forest is abundant with a nearly equal mix of productive and nonproductive forest. Histosols and Spodosols are equally common, leading to abundant mixed-conifer forest in wetlands and wet forested areas. Climate is mild with low snow levels except at higher elevations. The average annual temperature ranges from a minimum of 39 °F to a maximum of 52 °F. The average annual precipitation is 152 in, and the average annual snowfall is 37 in (Ketchikan observation station, 504590).
Extent of yellow-cedar— Yellow-cedar occurs on an estimated 11,300 ac and makes up 18.7 percent of the forestland in this small management zone (table 53). Yellow-cedar populations here amount to only 0.5 percent of the yellow-cedar acreage in Alaska.
Extent of yellow-cedar decline— Yellow-cedar decline has been mapped on 3,388 ac in this management zone, mainly on hillsides at mid-elevations. This accounts for about 0.6 percent of yellow-cedar decline acreage in Alaska.
Extent of yellow-cedar at future risk— The percentage of yellow-cedar forest projected to be at high risk of yellow-cedar decline increases marginally from 33 to 37 percent between 2020 and 2080 (fig. 117). Only 10 percent of yellow-cedar forests are expected to be at low risk by 2080, mainly at the higher elevations of this management zone.
Landscapes in protected and active management zones— Yellow-cedar forests and mapped decline occur on U.S. Forest Service, State, and unknown ownerships. On land managed by the Forest Service, most yellow-cedar forest and yellow-cedar decline are on lands designated as nonrestricted, limited development and nonrestricted, development.
Opportunities for conservation and management— Salvage harvest of dead yellow-cedar is an opportunity on State land and land man-aged by the Forest Service designated as development status. Planting and thinning to favor yellow-cedar in harvested areas could be conducted at higher elevations or

341
A Climate Adaptation Strategy for Conservation and Management of Yellow-Cedar in Alaska
on well-drained sites. Succession to other tree species, including western redcedar at low and middle elevations, will occur in unmanaged, affected forests. Natural regeneration will be limited by deer. The health status of yellow-cedar is not favor-able on this small management zone given the low acreage projected to be at low risk of decline by 2080.

342
GENERAL TECHNICAL REPORT PNW-GTR-917
Tabl
e 53
—G
ravi
na Is
land
Yel
low
-Ced
ar M
anag
emen
t Zon
e (K
etch
ikan
Ran
ger D
istr
ict,
Tong
ass
Nat
iona
l For
est):
acr
eage
of y
ello
w-c
edar
, cu
rren
t map
ped
yello
w-c
edar
dec
line,
and
pro
ject
ed p
erce
ntag
e of
yel
low
-ced
ar o
ccur
renc
e in
thre
e de
clin
e ri
sk c
lass
es in
202
0, 2
050,
an
d 20
80
Lan
d ow
ners
hip
Fore
st
land
Yello
w-
ceda
ra
Map
ped
ye
llow
-ced
ar
decl
ine,
20
13b
Dec
line
risk
cla
ss,
proj
ecte
d, 2
020c
Dec
line
risk
cla
sses
, pr
ojec
ted,
205
0cD
eclin
e ri
sk c
lass
, pr
ojec
ted,
208
0c
Low
Med
ium
Hig
hL
owM
ediu
mH
igh
Low
Med
ium
Hig
h
- - -
- - -
- - -
Acre
s - -
- - -
- - -
- - -
- - -
- - -
- - -
- - -
Per
cent
age
of y
ello
w-c
edar
acr
eage
- - -
- - -
- - -
- - -
- -
Nat
iona
l for
est (
tota
l)38
,175
7,05
12,
012
2222
1916
2621
833
21 N
onre
stric
ted,
dev
elop
men
td15
,972
2,53
492
510
75
710
63
136
Non
rest
ricte
d, li
mite
d de
velo
pmen
te21
,493
4,44
11,
087
1214
139
1614
520
15 R
estri
cted
, non
deve
lopm
entf
710
760
00
00
00
00
0
Stat
e 10
,901
2,22
781
82
108
110
81
108
Priv
ate
360
586
00
00
00
00
0O
ther
gov
ernm
enta
l ent
ity1
00
00
00
00
00
0U
nkno
wn
10,9
811,
986
552
38
63
87
19
7
Tot
al60
,418
11,3
223,
388
2839
3319
4536
1053
37- -
- - -
- 10
0 - -
- - -
- - -
- - -
- 10
0 - -
- - -
- - -
- - -
- 10
0 - -
- - -
- a A
rea
of c
urre
nt y
ello
w-c
edar
fore
sts e
stim
ated
from
spec
ies d
istr
ibut
ion
mod
els a
nd su
rvey
s (se
e “Y
ello
w-c
edar
dis
trib
utio
n” in
sect
ion
4).
b See
“Yel
low
-ced
ar d
eclin
e” in
sect
ion
4 fo
r mor
e in
form
atio
n on
how
acr
eage
of y
ello
w-c
edar
dec
line
was
map
ped.
c P
erce
ntag
e of
the
estim
ated
yel
low
-ced
ar d
istr
ibut
ion
acre
age
that
is p
roje
cted
to b
e in
low
-, m
ediu
m-,
and
high
-ris
k cl
asse
s for
yel
low
- ce
dar d
eclin
e ba
sed
on h
ydro
logy
and
snow
mod
elin
g. P
erce
ntag
es m
ay n
ot su
m to
100
bec
ause
of r
ound
ing.
d N
onre
stri
cted
, dev
elop
men
t: la
nd u
se d
esig
natio
ns th
at p
erm
it co
mm
erci
al ti
mbe
r har
vest
on
a re
gula
ted
(sch
edul
ed) b
asis
.e N
onre
stri
cted
, lim
ited
deve
lopm
ent:
land
use
des
igna
tions
that
do
not p
erm
it co
mm
erci
al ti
mbe
r on
a re
gula
ted
basi
s. O
n a
case
-by-
case
ba
sis t
he fo
llow
ing
activ
ities
may
be
allo
wed
: sal
vage
, per
sona
l use
, thi
nnin
g, p
runi
ng, o
r pla
ntin
g.
f Res
tric
ted
land
is la
nd p
erm
anen
tly re
serv
ed fr
om w
ood
prod
ucts
util
izat
ion
thro
ugh
stat
ute
or a
dmin
istr
ativ
e de
sign
atio
n. E
xam
ples
are
na
tiona
l for
est w
ilder
ness
are
as, n
atio
nal m
onum
ents
, and
with
draw
al a
reas
.

343
A Climate Adaptation Strategy for Conservation and Management of Yellow-Cedar in Alaska
Figu
re 1
17—
Gra
vina
Isla
nd Y
ello
w-C
edar
Man
agem
ent Z
one
(Ket
chik
an R
ange
r Dis
tric
t, To
ngas
s Nat
iona
l For
est):
are
as a
nd p
erce
ntag
es o
f low
, mod
erat
e, a
nd
high
risk
of y
ello
w-c
edar
dec
line
in fo
rest
s with
yel
low
-ced
ar b
ased
on
soil
drai
nage
and
snow
acc
umul
atio
n m
odel
s. Se
e se
ctio
n 4
for d
etai
ls o
n m
odel
s for
dec
line
risk
clas
ses.
Are
as w
ithou
t yel
low
-ced
ar a
ppea
r gra
y. L
ocat
ion
for t
his z
one
is g
iven
in th
e in
set m
ap.

344
GENERAL TECHNICAL REPORT PNW-GTR-917
30. Revillagigedo WestGeomorphology and climate— Sedimentary and metasedimentary rocks of the Behm Canal Complex and Traitors Cove metasediment subsections dominate this management zone. These rocks, along with fissures of weaker rock, were carved by continental ice sheets to form resistant mountains and deeply incised valleys. Mountain sideslopes and summits are common landforms in this zone. About 15 percent of the area contains forested wetlands, but almost half of the area is nonproductive forest. The climate varies considerably from the mild west and south coastal sections to interior valleys and to the mountains with more consistent winter snowpack. At sea level, the aver-age annual temperature ranges from a minimum of 39 °F to a maximum of 52 °F. The average annual precipitation is 152 in, and the average annual snowfall is 37 in (Ketchikan Airport observation station, 504590).
Extent of yellow-cedar— Yellow-cedar occurs on an estimated 120,900 ac, which accounts for 28.5 percent of forestland in this management zone and 5.3 percent of yellow-cedar acreage in Alaska (table 54). Yellow-cedar appears well distributed throughout the zone.
Extent of yellow-cedar decline— Yellow-cedar decline has been mapped on about 22,500 ac, which constitute about 4.0 percent of yellow-cedar decline acreage in Alaska. Decline occurs on hillsides in coastal sections and in some interior valleys with extensive forested wetlands.
Extent of yellow-cedar at future risk— The percentage of yellow-cedar forest projected to be at high risk of decline is ex-pected to rise from 7 to 18 percent between 2020 and 2080, while the percentage at low risk is halved from 64 to 32 percent in this period (fig. 118). There is an appar-ent pattern of higher risk initially developing in southern and coastal areas, and then progressing northward and into the interior of the island by 2080. But a signifi-cant portion of the landscape remains at low risk by 2080, especially in the higher elevation and northern areas.
Landscapes in protected and active management zones— About 10,000 ac of yellow-cedar occur on State and private lands, but >90 percent falls under U.S. Forest Service jurisdiction. On land managed by the Forest Service, there is substantial acreage of yellow-cedar and yellow-cedar decline on both nonre-stricted, development and nonrestricted, limited development land designations.
345
A Climate Adaptation Strategy for Conservation and Management of Yellow-Cedar in Alaska
Opportunities for conservation and management— The large acreage in nonrestricted, development status and the presence of several road systems suggest opportunities for a range of management activities. Salvage of dead yellow-cedar may be feasible in some southern areas that currently have decline or in forests that develop decline in the future. Active management, such as planting and thinning to favor yellow-cedar in well-drained or high-elevation areas, may be warranted. The success of both natural and artificial regeneration is expected to be site-specific given the range of elevation and snow patterns in this management zone. There are some known harvested areas that had abundant natu-ral yellow-cedar regeneration. High-elevation and northern portions of this manage-ment zone offer good prospects for the conservation of yellow-cedar.

346
GENERAL TECHNICAL REPORT PNW-GTR-917
Tabl
e 54
—R
evill
agig
edo
Wes
t Yel
low
-Ced
ar M
anag
emen
t Zon
e (K
etch
ikan
Ran
ger D
istr
ict,
Tong
ass
Nat
iona
l For
est):
acr
eage
of
yello
w-c
edar
, cur
rent
map
ped
yello
w-c
edar
dec
line,
and
pro
ject
ed p
erce
ntag
e of
yel
low
-ced
ar o
ccur
renc
e in
thre
e de
clin
e ri
sk
clas
ses
in 2
020,
205
0, a
nd 2
080
Lan
d ow
ners
hip
Fore
st
land
Yello
w-
ceda
ra
Map
ped
ye
llow
-ced
ar
decl
ine,
20
13b
Dec
line
risk
cla
ss,
proj
ecte
d, 2
020c
Dec
line
risk
cla
sses
, pr
ojec
ted,
205
0cD
eclin
e ri
sk c
lass
, pr
ojec
ted,
208
0c
Low
Med
ium
Hig
hL
owM
ediu
mH
igh
Low
Med
ium
Hig
h
- - -
- - -
- - -
Acre
s - -
- - -
- - -
- - -
- - -
- - -
- - -
- - -
Per
cent
age
of y
ello
w-c
edar
acr
eage
- - -
- - -
- - -
- - -
- -
Nat
iona
l for
est (
tota
l)37
1,13
310
7,85
219
,955
6419
753
2511
3239
18 N
onre
stric
ted,
dev
elop
men
td19
8,55
356
,058
10,4
1832
114
2614
615
2110
Non
rest
ricte
d, li
mite
d de
velo
pmen
te14
3,53
741
,135
7,83
225
63
219
414
146
Res
trict
ed, n
onde
velo
pmen
tf29
,042
10,6
591,
705
72
05
31
34
2
Stat
e 20
,300
6,14
791
92
21
12
21
32
Priv
ate
19,4
704,
145
684
21
01
11
12
1O
ther
gov
ernm
enta
l ent
ity1
00
11
01
11
01
1U
nkno
wn
13,7
652,
776
905
6823
956
3014
3345
22
Tot
al42
4,66
812
0,92
022
,464
6419
753
2511
3239
18- -
- - -
- 10
0 - -
- - -
- - -
- - -
- 10
0 - -
- - -
- - -
- - -
- 10
0 - -
- - -
- a A
rea
of c
urre
nt y
ello
w-c
edar
fore
sts e
stim
ated
from
spec
ies d
istr
ibut
ion
mod
els a
nd su
rvey
s (se
e “Y
ello
w-c
edar
dis
trib
utio
n” in
sect
ion
4).
b See
“Yel
low
-ced
ar d
eclin
e” in
sect
ion
4 fo
r mor
e in
form
atio
n on
how
acr
eage
of y
ello
w-c
edar
dec
line
was
map
ped.
c P
erce
ntag
e of
the
estim
ated
yel
low
-ced
ar d
istr
ibut
ion
acre
age
that
is p
roje
cted
to b
e in
low
-, m
ediu
m-,
and
high
-ris
k cl
asse
s for
yel
low
- ce
dar d
eclin
e ba
sed
on h
ydro
logy
and
snow
mod
elin
g. P
erce
ntag
es m
ay n
ot su
m to
100
bec
ause
of r
ound
ing.
d N
onre
stri
cted
, dev
elop
men
t: la
nd u
se d
esig
natio
ns th
at p
erm
it co
mm
erci
al ti
mbe
r har
vest
on
a re
gula
ted
(sch
edul
ed) b
asis
.e N
onre
stri
cted
, lim
ited
deve
lopm
ent:
land
use
des
igna
tions
that
do
not p
erm
it co
mm
erci
al ti
mbe
r on
a re
gula
ted
basi
s. O
n a
case
-by-
case
ba
sis t
he fo
llow
ing
activ
ities
may
be
allo
wed
: sal
vage
, per
sona
l use
, thi
nnin
g, p
runi
ng, o
r pla
ntin
g.
f Res
tric
ted
land
is la
nd p
erm
anen
tly re
serv
ed fr
om w
ood
prod
ucts
util
izat
ion
thro
ugh
stat
ute
or a
dmin
istr
ativ
e de
sign
atio
n. E
xam
ples
are
na
tiona
l for
est w
ilder
ness
are
as, n
atio
nal m
onum
ents
, and
with
draw
al a
reas
.
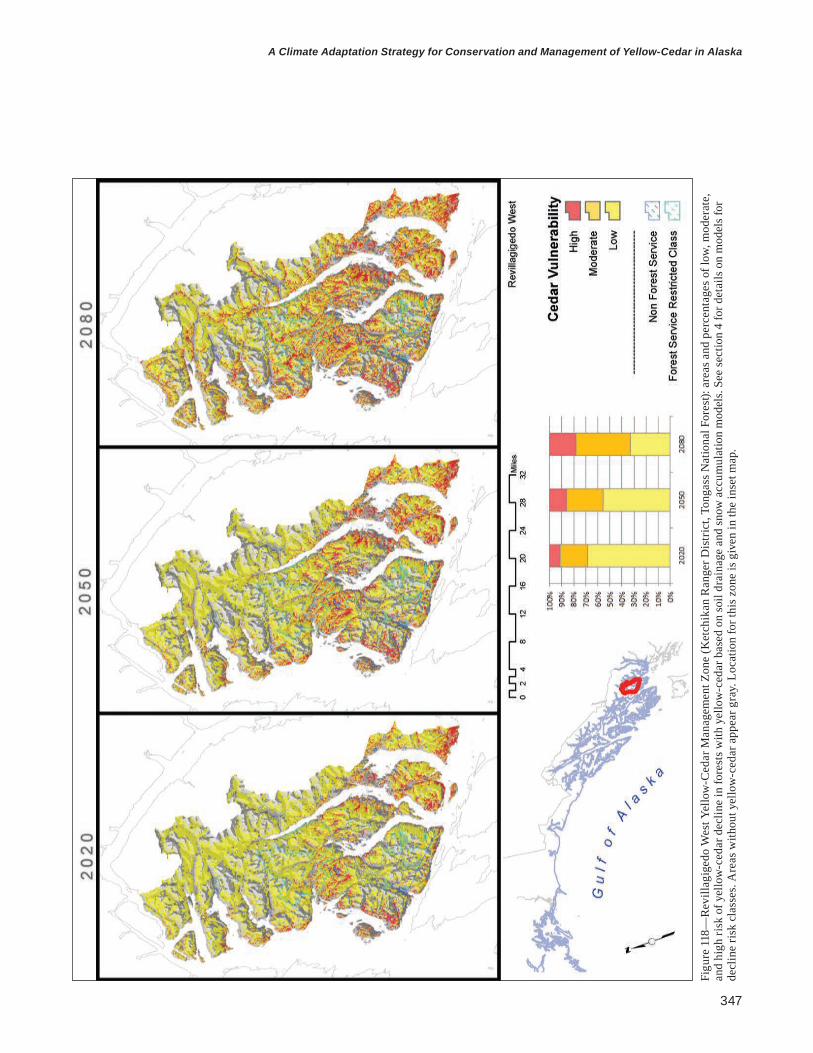
347
A Climate Adaptation Strategy for Conservation and Management of Yellow-Cedar in Alaska
Figu
re 1
18—
Rev
illag
iged
o W
est Y
ello
w-C
edar
Man
agem
ent Z
one
(Ket
chik
an R
ange
r Dis
tric
t, To
ngas
s Nat
iona
l For
est):
are
as a
nd p
erce
ntag
es o
f low
, mod
erat
e,
and
high
risk
of y
ello
w-c
edar
dec
line
in fo
rest
s with
yel
low
-ced
ar b
ased
on
soil
drai
nage
and
snow
acc
umul
atio
n m
odel
s. Se
e se
ctio
n 4
for d
etai
ls o
n m
odel
s for
de
clin
e ris
k cl
asse
s. A
reas
with
out y
ello
w-c
edar
app
ear g
ray.
Loc
atio
n fo
r thi
s zon
e is
giv
en in
the
inse
t map
.
348
GENERAL TECHNICAL REPORT PNW-GTR-917
31. Revillagigedo EastGeomorphology and climate— This management zone lies in the Behm Canal Complex subsection, which is part of the rounded mountain geomorphic class. The geology of this inactive glacial ter-rain is dominated by complex sedimentary and volcanic rock. This area was heavily worked by glacial action across somewhat less resistant bedrock, leading to linear landscape features such as lakes, and low-relief areas. There is an even mix of pro-ductive and nonproductive forests within this management zone. About 15 percent of the area is forested wetland, and another 10 percent is emergent wetland, both of which provide areas of yellow-cedar habitat intermixed with productive upland forest. The climate varies by elevation and latitude. The southern portion of Behm Canal has mild winters, whereas northern areas and higher elevations have more consistent winter snow. At sea level, the average annual temperature ranges from a minimum of 39 °F to a maximum of 52 °F. The average annual precipitation is 152 in, and the average annual snowfall is 37 in (Ketchikan airport observation station, 504590).
Extent of yellow-cedar— Yellow-cedar occupies an estimated 112,800 ac, which represent about 64.1 percent of the forestland in this management zone and about 5.0 percent of the yellow-cedar acreage in Alaska (table 55). Yellow-cedar appears to be well distributed in all areas of the management zone, but is absent from mountainous areas above timberline.
Extent of yellow-cedar decline— Only 10,080 ac of yellow-cedar decline have been mapped in this management zone. Most of this decline has been detected in the southern portions of this zone, but stands of dead and dying yellow-cedar are mapped to the north along the east coast of Behm Canal.
Extent of yellow-cedar at future risk— Risk of yellow-cedar decline varies geographically from south to north. Initially, most of the high-risk areas occur in the southern portion of this zone around Princess Bay, with smaller areas on the east side of Behm Canal. Between 2020 and 2080 high risk of yellow-cedar decline is expected to develop in low-elevation coastal and valley locations to the north. More of this change is expected to occur in the second 30 yrs. Even by 2080, however, the percentage of yellow-cedar forest projected to be at high risk of decline is only 20 percent, and 35 percent of yellow-cedar forests remain at low risk (fig. 119).
349
A Climate Adaptation Strategy for Conservation and Management of Yellow-Cedar in Alaska
Landscapes in protected and active management zones— Nearly the entire distribution of yellow-cedar in this management zone is on land managed by the U.S. Forest Service, and all of it falls under restricted, nondevelop-ment status as the western portion of the Misty Fiords National Monument.
Opportunities for conservation and management— With the restricted, nondevelopment land management classification, there is little opportunity for active management of yellow-cedar. This zone provides a good opportunity to meet conservation goals, as there is a relatively small amount of current yellow-cedar decline and low-to-medium risk accounts for 80 percent of yellow-cedar forests by 2080. Succession favoring other tree species has occurred and will continue to occur in stands with yellow-cedar decline. High current and future snow levels favor yellow-cedar regeneration in healthy forests, which helps yellow-cedar populations to be self-sustaining over the long term.

350
GENERAL TECHNICAL REPORT PNW-GTR-917
Tabl
e 55
—R
evill
agig
edo
East
Yel
low
-Ced
ar M
anag
emen
t Zon
e (K
etch
ikan
Ran
ger D
istr
ict,
Tong
ass
Nat
iona
l For
est):
acr
eage
of y
ello
w-
ceda
r, cu
rren
t map
ped
yello
w-c
edar
dec
line,
and
pro
ject
ed p
erce
ntag
e of
yel
low
-ced
ar o
ccur
renc
e in
thre
e de
clin
e ri
sk c
lass
es in
202
0,
2050
, and
208
0
Lan
d ow
ners
hip
Fore
st
land
Yello
w-
ceda
ra
Map
ped
ye
llow
-ced
ar
decl
ine,
20
13b
Dec
line
risk
cla
ss,
proj
ecte
d, 2
020c
Dec
line
risk
cla
sses
, pr
ojec
ted,
205
0cD
eclin
e ri
sk c
lass
, pr
ojec
ted,
208
0c
Low
Med
ium
Hig
hL
owM
ediu
mH
igh
Low
Med
ium
Hig
h
- - -
- - -
- - -
Acre
s - -
- - -
- - -
- - -
- - -
- - -
- - -
- - -
Per
cent
age
of y
ello
w-c
edar
acr
eage
- - -
- - -
- - -
- - -
- -
Nat
iona
l for
est (
tota
l)17
5,91
011
2,81
010
,080
6823
957
3013
3545
20 N
onre
stric
ted,
dev
elop
men
td0
00
00
00
00
00
0 N
onre
stric
ted,
lim
ited
deve
lopm
ente
00
00
00
00
00
00
Res
trict
ed, n
onde
velo
pmen
tf17
5,91
011
2,81
00
6823
957
3013
3545
20
Stat
e 0
00
00
00
00
00
0
Priv
ate
00
00
00
00
00
00
Oth
er g
over
nmen
tal e
ntity
00
00
00
00
00
00
Unk
now
n22
84
10
00
00
00
00
T
otal
176,
137
112,
815
10,0
8168
239
5730
1335
4520
- - -
- - -
100
- - -
- - -
- - -
- - -
100
- - -
- - -
- - -
- - -
100
- - -
- - -
a Are
a of
cur
rent
yel
low
-ced
ar fo
rest
s est
imat
ed fr
om sp
ecie
s dis
trib
utio
n m
odel
s and
surv
eys (
see
“Yel
low
-ced
ar d
istr
ibut
ion”
in se
ctio
n 4)
.b S
ee “Y
ello
w-c
edar
dec
line”
in se
ctio
n 4
for m
ore
info
rmat
ion
on h
ow a
crea
ge o
f yel
low
-ced
ar d
eclin
e w
as m
appe
d.
c Per
cent
age
of th
e es
timat
ed y
ello
w-c
edar
dis
trib
utio
n ac
reag
e th
at is
pro
ject
ed to
be
in lo
w-,
med
ium
-, an
d hi
gh-r
isk
clas
ses f
or y
ello
w-
ceda
r dec
line
base
d on
hyd
rolo
gy a
nd sn
ow m
odel
ing.
Per
cent
ages
may
not
sum
to 1
00 b
ecau
se o
f rou
ndin
g.
d Non
rest
rict
ed, d
evel
opm
ent:
land
use
des
igna
tions
that
per
mit
com
mer
cial
tim
ber h
arve
st o
n a
regu
late
d (s
ched
uled
) bas
is.
e Non
rest
rict
ed, l
imite
d de
velo
pmen
t: la
nd u
se d
esig
natio
ns th
at d
o no
t per
mit
com
mer
cial
tim
ber o
n a
regu
late
d ba
sis.
On
a ca
se-b
y-ca
se
basi
s the
follo
win
g ac
tiviti
es m
ay b
e al
low
ed: s
alva
ge, p
erso
nal u
se, t
hinn
ing,
pru
ning
, or p
lant
ing.
f R
estr
icte
d la
nd is
land
per
man
ently
rese
rved
from
woo
d pr
oduc
ts u
tiliz
atio
n th
roug
h st
atut
e or
adm
inis
trat
ive
desi
gnat
ion.
Exa
mpl
es a
re
natio
nal f
ores
t wild
erne
ss a
reas
, nat
iona
l mon
umen
ts, a
nd w
ithdr
awal
are
as.
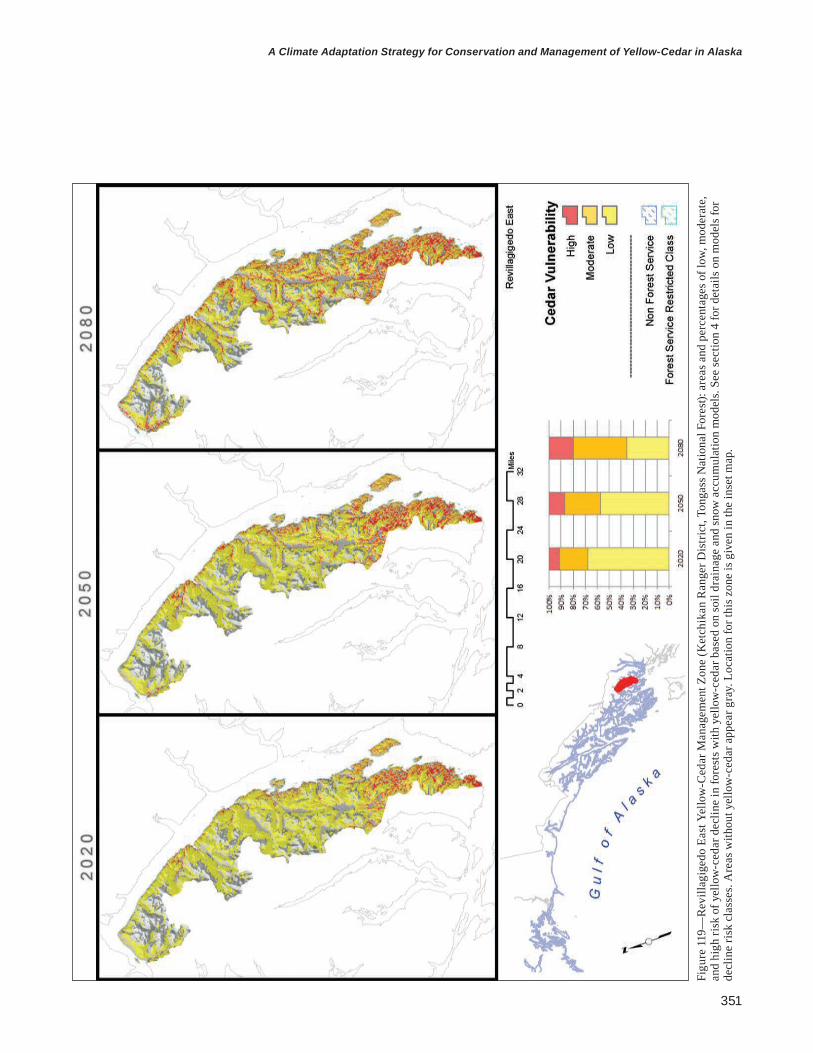
351
A Climate Adaptation Strategy for Conservation and Management of Yellow-Cedar in Alaska
Figu
re 1
19—
Rev
illag
iged
o Ea
st Y
ello
w-C
edar
Man
agem
ent Z
one
(Ket
chik
an R
ange
r Dis
tric
t, To
ngas
s Nat
iona
l For
est):
are
as a
nd p
erce
ntag
es o
f low
, mod
erat
e,
and
high
risk
of y
ello
w-c
edar
dec
line
in fo
rest
s with
yel
low
-ced
ar b
ased
on
soil
drai
nage
and
snow
acc
umul
atio
n m
odel
s. Se
e se
ctio
n 4
for d
etai
ls o
n m
odel
s for
de
clin
e ris
k cl
asse
s. A
reas
with
out y
ello
w-c
edar
app
ear g
ray.
Loc
atio
n fo
r thi
s zon
e is
giv
en in
the
inse
t map
.

352
GENERAL TECHNICAL REPORT PNW-GTR-917
32. Misty FiordsGeomorphology and climate— This management zone lies in the Misty Fiord Granitics subsection, which is part of the granitic subgroup of the rounded mountain geomorphic class. The geology of this inactive glacial terrain is dominated by granitic residuum. Due to the resistant bedrock, the soils tend to be very shallow with little or no organic matter accumu-lation. The only deep, heavily forested soils are located on footslopes and along al-luvial valleys. Nonforested alpine areas dominate the vegetation classes within this management zone. There is very little wetland (about 15 percent), of which about half is in forested wetland classes. Given the mountainous and interior geomorphol-ogy, winters have heavy and persistent snow in all but the low-elevation southwest-ern portion. At sea level, the average annual temperature ranges from a minimum of 39 °F to a maximum of 52 °F. The average annual precipitation is 152 in, and the average annual snowfall is 37 in (Ketchikan Airport observation station, 504590).
Extent of yellow-cedar— This large management zone has an estimated 408,000 ac of yellow-cedar, which account for 38.0 percent of the forested area of the zone and 17.9 percent of yellow-cedar forests in Alaska (table 56).
Extent of yellow-cedar decline— Existing mapped yellow-cedar decline has been detected on nearly 23,000 ac. This amounts to about 4.0 percent of yellow-cedar decline acreage in Alaska. It is com-mon on hillsides in some of the valleys of Boca de Quadra, near Smeaton Bay, and along the east side of Behm Canal.
Extent of yellow-cedar at future risk— High risk of yellow-cedar decline is expected to be limited to just 9 percent of yel-low-cedar forests in 2020 and to rise to 15 percent by 2080 (fig. 120). The propor-tion of yellow-cedar forests at low or moderate risk of decline in 2020 is expected to drop modestly from 91 to 85 percent between 2020 and 2080.
Landscapes in protected and active management zones— Nearly the entire acreage of yellow-cedar is in the Tongass National Forest and in the restricted, nondevelopment designation. A very small area of yellow-cedar, just 86 ac, is in a nonrestricted, development status.
353
A Climate Adaptation Strategy for Conservation and Management of Yellow-Cedar in Alaska
Opportunities for conservation and management— The large yellow-cedar acreage, its current health, relatively minor future risk of yellow-cedar decline, and protection status indicate that this is a key area for the conservation of yellow-cedar. Yellow-cedar decline is projected to be limited to southern areas and coastal areas near Behm Canal in the future. Our models may marginally underestimate decline in this management zone as existing yellow-cedar decline is known to occur along the west side of Behm Canal, and it extends farther up Portland Canal than the risk rating in 2020 would suggest. Our models indicate high risk of decline does occur in these areas by 2080. Decline-affected forests are expected to undergo succession to western hemlock, western redcedar, and other species. The persistent snow levels that protect mature yellow-cedar trees from de-cline also provide protection for yellow-cedar regeneration and facilitate the long-term stability in yellow-cedar populations.

354
GENERAL TECHNICAL REPORT PNW-GTR-917
Tabl
e 56
—M
isty
Fio
rds
Yello
w-C
edar
Man
agem
ent Z
one
(Mis
ty F
iord
s N
atio
nal M
onum
ent,
Tong
ass
Nat
iona
l For
est):
acr
eage
of y
ello
w-
ceda
r, cu
rren
t map
ped
yello
w-c
edar
dec
line,
and
pro
ject
ed p
erce
ntag
e of
yel
low
-ced
ar o
ccur
renc
e in
thre
e de
clin
e ri
sk c
lass
es in
202
0,
2050
, and
208
0
Lan
d ow
ners
hip
Fore
st
land
Yello
w-
ceda
ra
Map
ped
ye
llow
-ced
ar
decl
ine,
20
13b
Dec
line
risk
cla
ss,
proj
ecte
d, 2
020c
Dec
line
risk
cla
sses
, pr
ojec
ted,
205
0cD
eclin
e ri
sk c
lass
, pr
ojec
ted,
208
0c
Low
Med
ium
Hig
hL
owM
ediu
mH
igh
Low
Med
ium
Hig
h
- - -
- - -
- - -
Acre
s - -
- - -
- - -
- - -
- - -
- - -
- - -
- - -
Per
cent
age
of y
ello
w-c
edar
acr
eage
- - -
- - -
- - -
- - -
- -
Nat
iona
l for
est (
tota
l)1,
069,
508
407,
350
22,9
7771
209
6425
1149
3615
Non
rest
ricte
d, d
evel
opm
entd
5,12
786
00
00
00
00
00
Non
rest
ricte
d, li
mite
d de
velo
pmen
te21
,310
569
163
00
00
00
00
0 R
estri
cted
, non
deve
lopm
entf
1,04
3,07
140
6,69
622
,814
7120
964
2511
4936
15
Stat
e 52
928
00
00
00
00
00
Priv
ate
1,42
787
00
00
00
00
00
Oth
er g
over
nmen
tal e
ntity
00
00
00
00
00
00
Unk
now
n2,
172
532
00
00
00
00
0
Tot
al1,
073,
635
407,
518
22,9
7871
209
6425
1149
3615
- - -
- - -
100
- - -
- - -
- - -
- - -
100
- - -
- - -
- - -
- - -
100
- - -
- - -
a Are
a of
cur
rent
yel
low
-ced
ar fo
rest
s est
imat
ed fr
om sp
ecie
s dis
trib
utio
n m
odel
s and
surv
eys (
see
“Yel
low
-ced
ar d
istr
ibut
ion”
in se
ctio
n 4)
.b S
ee “Y
ello
w-c
edar
dec
line”
in se
ctio
n 4
for m
ore
info
rmat
ion
on h
ow a
crea
ge o
f yel
low
-ced
ar d
eclin
e w
as m
appe
d.
c Per
cent
age
of th
e es
timat
ed y
ello
w-c
edar
dis
trib
utio
n ac
reag
e th
at is
pro
ject
ed to
be
in lo
w-,
med
ium
-, an
d hi
gh-r
isk
clas
ses f
or y
ello
w-
ceda
r dec
line
base
d on
hyd
rolo
gy a
nd sn
ow m
odel
ing.
Per
cent
ages
may
not
sum
to 1
00 b
ecau
se o
f rou
ndin
g.
d Non
rest
rict
ed, d
evel
opm
ent:
land
use
des
igna
tions
that
per
mit
com
mer
cial
tim
ber h
arve
st o
n a
regu
late
d (s
ched
uled
) bas
is.
e Non
rest
rict
ed, l
imite
d de
velo
pmen
t: la
nd u
se d
esig
natio
ns th
at d
o no
t per
mit
com
mer
cial
tim
ber o
n a
regu
late
d ba
sis.
On
a ca
se-b
y-ca
se
basi
s the
follo
win
g ac
tiviti
es m
ay b
e al
low
ed: s
alva
ge, p
erso
nal u
se, t
hinn
ing,
pru
ning
, or p
lant
ing.
f R
estr
icte
d la
nd is
land
per
man
ently
rese
rved
from
woo
d pr
oduc
ts u
tiliz
atio
n th
roug
h st
atut
e or
adm
inis
trat
ive
desi
gnat
ion.
Exa
mpl
es a
re
natio
nal f
ores
t wild
erne
ss a
reas
, nat
iona
l mon
umen
ts, a
nd w
ithdr
awal
are
as.

355
A Climate Adaptation Strategy for Conservation and Management of Yellow-Cedar in Alaska
Figu
re 1
20—
Mis
ty F
iord
s Yel
low
-Ced
ar M
anag
emen
t Zon
e (M
isty
Fio
rds N
atio
nal M
onum
ent,
Tong
ass N
atio
nal F
ores
t): a
reas
and
per
cent
ages
of l
ow, m
oder
ate,
and
hi
gh ri
sk o
f yel
low
-ced
ar d
eclin
e in
fore
sts w
ith y
ello
w-c
edar
bas
ed o
n so
il dr
aina
ge a
nd sn
ow a
ccum
ulat
ion
mod
els.
See
sect
ion
4 fo
r det
ails
on
mod
els f
or d
eclin
e ris
k cl
asse
s. A
reas
with
out y
ello
w-c
edar
app
ear g
ray.
Loc
atio
n fo
r thi
s zon
e is
giv
en in
the
inse
t map
.

356
GENERAL TECHNICAL REPORT PNW-GTR-917
33. Annette and Duke IslandsGeomorphology and climate— Sedimentary and metasedimentary rocks of the Behm Canal Complex and Traitors Cove Metasediment subsections dominate this management zone. These rocks, along with fissures of weaker rock, were carved by continental ice sheets to form resistant mountains and deeply incised valleys. Mountain sideslopes and summits are common landforms except in the generally flat Duke Island. About 15 percent of the area contains forested wetlands, but almost half of the area is nonproductive forest. The Duke Island Till Lowlands are dominated by glacial till with drumlin landforms and abundant forested and emergent wetland. The climate is mild in these island environments, with consistent winter snow in only the higher eleva-tions of Annette Island. At sea level, the average annual temperature ranges from a minimum of 41 °F to a maximum of 51 °F. The average annual precipitation is 109 in, and the average annual snowfall is 43 in (Annette Island Observation Station, 500352).
Extent of yellow-cedar— Yellow-cedar occurs on an estimated 24,500 ac in this management zone, which makes up about 1.1 percent of the yellow-cedar forests in Alaska (table 57). Nearly 25 percent of the forested land in this management zone area contains yellow-cedar forest, but it probably occurs as a minor component because at this latitude it is gen-erally more abundant at higher elevations. The mountainside slopes provide habitat for greater abundance of yellow-cedar.
Extent of yellow-cedar decline— Just over 2,000 ac of yellow-cedar decline are mapped in this management zone, or 0.4 percent of the extent in Alaska. Most of the existing yellow-cedar decline is on hillsides. Very little yellow-cedar decline has been mapped on Duke Island, but there is likely to be scattered dead yellow-cedar present that is difficult to detect during aerial surveys.
Extent of yellow-cedar at future risk— Due to the southern latitude and extent of low-elevation forested wetland habitat, this area has been at high risk for future decline for some time. The management zone already experiences low snow levels, particularly on Duke Island, where low elevation prevails. Changing snow patterns will only marginally increase risk in this management zone, and most of these changes will be on Annette Island. About 46 percent of the yellow-cedar resource is expected to be at high risk in 2020 and the medium- and high-risk categories will dominate the overall population in this

357
A Climate Adaptation Strategy for Conservation and Management of Yellow-Cedar in Alaska
zone by 2080 (fig. 121). Only 13 percent of yellow-cedar forests are expected to be at low risk, mainly in the higher elevation areas of Annette Island. Yellow-cedar decline has largely played out in this management zone.
Landscapes in protected and active management zones— Most of the yellow-cedar and yellow-cedar decline present in this management zone are on private land. The U.S. Forest Service land ownership with yellow-cedar is mainly in a nonrestricted, limited development designation.
Opportunities for conservation and management— Yellow-cedar populations probably underwent substantial decline-related mortality through the 1900s, but recent and future losses are expected to be minor. Low snow levels favor deer, which will reduce natural regeneration in natural forests and the long-term abundance of yellow-cedar. Deer will also challenge yellow-cedar natural or artificial regeneration in harvested areas. The older and scattered nature of mor-tality limits salvage opportunities for dead trees. Perhaps the best opportunity for salvage of dead yellow-cedar is on private land on Annette Island. Planting yellow-cedar should be confined to well-drained soils, and seedlings will probably need some protection from deer. Most of the yellow-cedar on Forest Service lands is in a restricted status, where the affected populations may have stabilized with a reduced yellow-cedar component.

358
GENERAL TECHNICAL REPORT PNW-GTR-917
Tabl
e 57
—A
nnet
te a
nd D
uke
Isla
nds
Yello
w-C
edar
Man
agem
ent Z
one
(Ket
chik
an R
ange
r Dis
tric
t, To
ngas
s N
atio
nal F
ores
t): a
crea
ge o
f ye
llow
-ced
ar, c
urre
nt m
appe
d ye
llow
-ced
ar d
eclin
e, a
nd p
roje
cted
per
cent
age
of y
ello
w-c
edar
occ
urre
nce
in th
ree
decl
ine
risk
cla
sses
in
2020
, 205
0, a
nd 2
080
Lan
d ow
ners
hip
Fore
st
land
Yello
w-
ceda
ra
Map
ped
ye
llow
-ced
ar
decl
ine,
20
13b
Dec
line
risk
cla
ss,
proj
ecte
d, 2
020c
Dec
line
risk
cla
sses
, pr
ojec
ted,
205
0cD
eclin
e ri
sk c
lass
, pr
ojec
ted,
208
0c
Low
Med
ium
Hig
hL
owM
ediu
mH
igh
Low
Med
ium
Hig
h
- - -
- - -
- - -
Acre
s - -
- - -
- - -
- - -
- - -
- - -
- - -
- - -
Per
cent
age
of y
ello
w-c
edar
acr
eage
- - -
- - -
- - -
- - -
- -
Nat
iona
l for
est (
tota
l)40
,213
8,47
77
09
250
925
09
25 N
onre
stric
ted,
dev
elop
men
td0
00
00
00
00
00
0 N
onre
stric
ted,
lim
ited
deve
lopm
ente
37,8
648,
112
70
924
09
240
924
Res
trict
ed, n
onde
velo
pmen
tf2,
350
365
00
01
00
10
01
Stat
e 0
00
00
00
00
00
0
Priv
ate
70,0
8916
,016
2075
2420
2119
2422
1329
23O
ther
gov
ernm
enta
l ent
ity0
00
00
00
00
00
0U
nkno
wn
877
10
00
00
00
00
0
Tot
al11
1,17
924
,494
2,08
224
2946
1933
4813
3849
- - -
- - -
100
- - -
- - -
- - -
- - -
100
- - -
- - -
- - -
- - -
100
- - -
- - -
a Are
a of
cur
rent
yel
low
-ced
ar fo
rest
s est
imat
ed fr
om sp
ecie
s dis
trib
utio
n m
odel
s and
surv
eys (
see
“Yel
low
-ced
ar d
istr
ibut
ion”
in se
ctio
n 4)
.b S
ee “Y
ello
w-c
edar
dec
line”
in se
ctio
n 4
for m
ore
info
rmat
ion
on h
ow a
crea
ge o
f yel
low
-ced
ar d
eclin
e w
as m
appe
d.
c Per
cent
age
of th
e es
timat
ed y
ello
w-c
edar
dis
trib
utio
n ac
reag
e th
at is
pro
ject
ed to
be
in lo
w-,
med
ium
-, an
d hi
gh-r
isk
clas
ses f
or y
ello
w-
ceda
r dec
line
base
d on
hyd
rolo
gy a
nd sn
ow m
odel
ing.
Per
cent
ages
may
not
sum
to 1
00 b
ecau
se o
f rou
ndin
g.
d Non
rest
rict
ed, d
evel
opm
ent:
land
use
des
igna
tions
that
per
mit
com
mer
cial
tim
ber h
arve
st o
n a
regu
late
d (s
ched
uled
) bas
is.
e Non
rest
rict
ed, l
imite
d de
velo
pmen
t: la
nd u
se d
esig
natio
ns th
at d
o no
t per
mit
com
mer
cial
tim
ber o
n a
regu
late
d ba
sis.
On
a ca
se-b
y-ca
se
basi
s the
follo
win
g ac
tiviti
es m
ay b
e al
low
ed: s
alva
ge, p
erso
nal u
se, t
hinn
ing,
pru
ning
, or p
lant
ing.
f R
estr
icte
d la
nd is
land
per
man
ently
rese
rved
from
woo
d pr
oduc
ts u
tiliz
atio
n th
roug
h st
atut
e or
adm
inis
trat
ive
desi
gnat
ion.
Exa
mpl
es a
re
natio
nal f
ores
t wild
erne
ss a
reas
, nat
iona
l mon
umen
ts, a
nd w
ithdr
awal
are
as.

359
A Climate Adaptation Strategy for Conservation and Management of Yellow-Cedar in Alaska
Figu
re 1
21—
Ann
ette
and
Duk
e Is
land
s Yel
low
-Ced
ar M
anag
emen
t Zon
e (K
etch
ikan
Ran
ger D
istr
ict,
Tong
ass N
atio
nal F
ores
t): a
reas
and
per
cent
ages
of l
ow, m
oder
-at
e, a
nd h
igh
risk
of y
ello
w-c
edar
dec
line
in fo
rest
s with
yel
low
-ced
ar b
ased
on
soil
drai
nage
and
snow
acc
umul
atio
n m
odel
s. Se
e se
ctio
n 4
for d
etai
ls o
n m
odel
s for
de
clin
e ris
k cl
asse
s. A
reas
with
out y
ello
w-c
edar
app
ear g
ray.
Loc
atio
n fo
r thi
s zon
e is
giv
en in
the
inse
t map
.

360
GENERAL TECHNICAL REPORT PNW-GTR-917
361
A Climate Adaptation Strategy for Conservation and Management of Yellow-Cedar in Alaska
This report provides a comprehensive review of the state of the knowledge for yellow-cedar in many facets of its ecology and management. In addition, a review of the extent and impacts of yellow-cedar decline, and strategies to cope with it, is presented. There remain numerous important information gaps that need to be addressed to enhance our understanding and management of this valuable tree. The following summary lists high-priority information gaps, research needs, and collaboration for yellow-cedar with an emphasis on Alaska.
Yellow-Cedar Values, Ecology, and Silvics Document knowledge and uses of yellow-cedar by Alaska Native people.There is a long history of spiritual connection, ecological knowledge, and use of yellow-cedar by Alaska Native communities. Recording the oral narratives will supplement the current understanding of the yellow-cedar. Traditional ecological knowledge of yellow-cedar could be added to and contrasted with information from scientific research to create a richer understanding of the tree. Management of yellow-cedar should consider Alaska Native communities’ need for access to yellow-cedar. Adaptive management of young stands could include silvicultural trials to promote particular tree characteristics that meet wood and bark needs for Alaska Native uses.
Determine historical origins of yellow-cedar in Alaska, Holocene migration and the influence on current broad genetic structure, and extent of local clonal reproduction. The origins of yellow-cedar in Prince William Sound and southeast Alaska are still unresolved. Thus far, research on the genetic structure of yellow-cedar in Alaska has not clearly identified patterns of postglacial migration of the species. A prevail-ing hypothesis is for the expansion of postglacial populations from outer-coastal refugia in Alaska eastward and northward, and potentially from Haida Gwaii to the mainland of British Columbia and northerly into Alaska. Future research needs to discern both the regional genetic distribution as it relates to historical migration and unravel the interaction with the clonal relationships at local scales.
Appendix 2: Information Gaps, Needed Research, and Technology Transfer

362
GENERAL TECHNICAL REPORT PNW-GTR-917
Merge knowledge on the ecology, climate interactions, and management of yellow-cedar from different parts of the species’ range. The range of yellow-cedar is about 1,600 mi long and crosses a vast expanse of ecosystems and two international boundaries. There is a good opportunity to assess the health status of yellow-cedar and management experience with the species in a unified manner throughout the entire range. Key steps would be to form official working groups and research networks with the goal of refining and implementing this strategy. Coordination between U.S. and Canadian colleagues has improved recently, but merging geographic information systems (GIS) and adopting com-mon plant community guidelines will enhance the integration and the capacity to address the rangewide issues related to ecology, management, and climate interactions of yellow-cedar. A rangewide vulnerability assessment of yellow-cedar will require a coordinated effort from specialists in the Pacific Northwest, British Columbia, and Alaska. Periodic meetings to share information across boundaries on the science and management of yellow-cedar are encouraged.
Improve fine-scale mapping of yellow-cedar; develop techniques for detecting live yellow-cedar populations.Certain small populations, such as the one recently discovered near Icy Bay and several others around Cordova, should be mapped on the ground for extent. Other than aerial observation, remote sensing techniques have thus far been unsuccess-ful at distinguishing yellow-cedar from some other tree species in mixed-species stands. Analysis of higher resolution, multispectral band imagery, possibly combined with light detection and ranging (LiDAR), might eventually solve this problem.
Improve Alaska and rangewide species distribution maps and GIS layers for yellow-cedar; reconcile the various regional esti-mates on the areal occurrence of yellow-cedar forests in Alaska. A new rangewide distribution map and GIS layer for yellow-cedar is presented in section 1. Validation and refinement of the GIS layer are needed. Additional GIS layers that describe several abundance levels of yellow-cedar would be desirable (i.e., yellow-cedar forest or cover types to any level of occurrence); these will undoubtedly have inputs from inventory plot data. Also, this report lists a number of acreage estimates on the occurrence of yellow-cedar in Alaska. The acreage estimates from our spatially explicit mapping efforts differ from the inventory-based estimates reported in the literature. Future improvement of the yellow-cedar

363
A Climate Adaptation Strategy for Conservation and Management of Yellow-Cedar in Alaska
distribution map and GIS layers should reconcile these differences. A close exami-nation is needed of the plot-based measurements versus models that incorporate remote sensing into basal area or volume estimates. A particularly vexing problem is the attempt to compare area estimates of yellow-cedar decline with area estimates of total yellow-cedar occurrence. This comparison is needed to determine the proportion of yellow-cedar populations that have been affected by forest decline. The two types of estimates (i.e., declining yellow-cedar forests and total occurrence of yellow-cedar) come from different data sources, different resolutions, and differ-ent abundance levels of yellow-cedar, and represent different time periods. It will be especially difficult to reconstruct estimates on the occurrence and abundance of yellow-cedar forests before they began to undergo yellow-cedar decline, in many cases more than a century ago.
Determine factors that influence successful natural regeneration in unmanaged forests.Successful regeneration of yellow-cedar is needed to sustain future populations of the species long into the future. There is anecdotal information that seedlings and saplings are rare in some yellow-cedar forests, and abundant in others. Forest inventory data can be used to address this situation, but caution should be exercised if equating seedling and sapling size classes from plot data with actual regeneration because of the perpetually stunted layering form of yellow-cedar that is common in some plant communities. Monitoring natural regeneration in healthy and decline-affected forests is one of the highest priorities for lands in protected status. A comprehensive examination of every aspect of yellow-cedar reproduction is needed to identify barriers to successful regeneration, and should include flowering, pol-lination, cone and seed production, dispersal, germination, seedling establishment, and herbivory.
Climate and Yellow-Cedar Decline Improve the modeling of soil hydrology and snowpack character-istics as decline risk factors.The soil hydrology model in this report is assumed to be static over time due to the lack of information on future potential changes in soil moisture. This factor may actually be more dynamic, and the variability in soil moisture across the landscape must be better understood to refine the risk assessment model. The present snow model uses precipitation and temperature to predict snow accumulation. However, snow accumulation is not a measure of snowpack, which is the factor that more directly protects yellow-cedar roots from freezing injury. A predictive snowpack

364
GENERAL TECHNICAL REPORT PNW-GTR-917
model for February or March would be an improved input for the general risk assessment model. The risk models presented in this report used five classes of risk for both drainage and snow. Determination of the actual threshold values for soil drainage and snow depth and duration that distinguish healthy yellow-cedar forests from decline-affected forests would improve the risk assessment model by collaps-ing five classes into two classes for each of the component input models (drainage and snow).
Refine methods of detecting and mapping yellow-cedar mortality to produce higher resolution GIS layers.The mapping of yellow-cedar decline has been an evolving effort. The coarse mapping product that is available regionwide could eventually be replaced by the higher resolution maps produced from remote sensing images. Until that regionwide layer is available, high-priority areas, such as locations where salvage operations may be planned, could be targeted for the high-resolution mapping. We also suggest using the specific indicators of individual tree stress (foliage flagging and crown thinning) developed by Oakes et al. (2014) as monitoring tools for early detection of yellow-cedar decline in managed and protected landscapes.
Determine successional trajectories of trees and understory veg-etation in forests affected by yellow-cedar decline.Much forested area affected by yellow-cedar decline is in protected landscapes that will not be actively managed. It is important to understand whether the reduction to yellow-cedar in these forests represents a long-term, semi-permanent conversion to other species, and whether forest function and integrity have been impaired. The Oakes et al. (2014) study evaluated all life stages of yellow-cedar and co-occurring tree species and provided a long-term perspective on the fate of these species. Replication of this approach is needed for other affected forests in southeast Alaska and British Columbia. A focused goal of future studies could be to determine how western redcedar responds to the death of yellow-cedar where the two species co-occur. Such a study could be closely associated with the biogeochemical changes in decline-affected forests.

365
A Climate Adaptation Strategy for Conservation and Management of Yellow-Cedar in Alaska
Evaluate the impact of yellow-cedar on biogeochemical cycles in terrestrial and aquatic systems including successional trajecto-ries among plant communities affected by dead and dying yel-low-cedar trees. Yellow-cedar has a distinctive biogeochemical signature in soils, stream water, and understory plants of yellow-cedar stands. The implication of the alteration of nutrient cycles at broader scales and watersheds is unclear. There is a high likeli-hood that abundant yellow-cedar concentrated in a watershed will create a signal in stream water and possibly even estuaries. Therefore, identifying the range of vari-ability in these systems compared with non-yellow-cedar watersheds will provide a new perspective for watershed management in the region. The impacts of yellow-cedar mortality on the biogeochemical cycle, ranging from near-term pulses from dying trees to long-term effects from the reduction of yellow-cedar, are relatively unknown.
Develop a robust bioclimate model and GIS layer for yellow- cedar to indicate emergence of new suitable habitat. Our report assesses the habitat suitability of yellow-cedar based on risk factors of decline within the existing range of yellow-cedar in Alaska. Still unknown is how future climate conditions may eliminate the climate barriers for the species for potential expansion both locally in elevation and regionally to the north and west in Alaska, and east into British Columbia. That investigation will require a separate modeling approach and a broader geographic context than used in this report. Several basic physiological tolerances of yellow-cedar would need to be contrasted with current and future climatic conditions in these areas, such as seasonal precipi-tation (to avoid drought stress) and annual minimum temperature (to avoid outright freezing regardless of the presence of snow). The resulting model outputs should be contrasted with expected migration rates for yellow-cedar to differentiate potential habitat with actual expected occupancy. Planting trials could field-test these poten-tial suitability areas to address the possibility of assisted migration.
Strategic Planning for Yellow-Cedar Conservation and Management Evaluate natural regeneration of yellow-cedar following timber harvest.There is anecdotal information suggesting that natural regeneration by yellow-cedar is successful to replace the species after timber harvests in some areas, but may be unsuccessful in others. Geographic patterns of successful and unsuccessful natural
366
GENERAL TECHNICAL REPORT PNW-GTR-917
regeneration could be revealed by compiling and analyzing existing regeneration stocking data. There is a need to correlate the yellow-cedar component as a percent-age of composition in forests before harvests with the composition percentage in regeneration following harvests. Natural regeneration of yellow-cedar in partial har-vest treatments could be monitored to determine if any alternative harvest systems can promote regeneration of the species.
Develop methods for protecting planted seedlings of yellow- cedar from browse.Deer are a major impediment to the successful establishment and growth of planted yellow-cedar seedlings in some areas. Reduced snow levels in the future could result in larger deer populations and increased browse pressure at higher elevations and regions to the north. The intensity of deer browse on yellow-cedar seedlings needs to be related to deer populations and their seasonal movement before deci-sions are made to leave seedlings unprotected or to use one of the protective measures. Although there are many options, the feasibility and cost-effectiveness of these methods should be evaluated for successful application in the field.
Quantify the amount of yellow-cedar in young-growth forests by stand age and productivity class to indicate future supply of yellow-cedar from young-growth forests.The shift from old-growth to young-growth wood supply on the Tongass National Forest is a high priority for the U.S. Forest Service. Yellow-cedar’s contribution to the supply from young-growth forests has not been determined. Yellow-cedar is not well represented in the oldest and most productive of the young-growth forests because the species was not common on these sites when they were originally harvested. There is a need to determine where yellow-cedar occurs by stand age and site productivity in young-growth forests and project its size and volume by growth models.
Improve understanding of silvicultural options to promote yellow-cedar young-growth forests.Thinning can be used to alter the composition of managed forests and favor one tree species over another. Thinning to favor yellow-cedar is a key tool in helping yellow-cedar to compete with faster growing associated species on productive sites. The response of yellow-cedar that has been released by thinning other trees needs to be monitored. The survival and growth in older young-growth forests need to be evaluated. Growth and yield models should be developed for yellow-cedar in young-growth forests. Communication with foresters in British Columbia would

367
A Climate Adaptation Strategy for Conservation and Management of Yellow-Cedar in Alaska
be helpful because of their longer-term experience with yellow-cedar plantations. Yellow-cedar in young-growth forests should be monitored for any appearance of yellow-cedar decline, as has been observed on Zarembo Island. The emergence of this problem would be most likely in wetter portions of young-growth stands that occur in areas of low snow accumulation.
Develop partnerships of different landowners to expand active management of yellow-cedar in Alaska. Most of the yellow-cedar forests in Alaska occur on land administered by the Ton-gass and Chugach National Forests. Some forms of active management to promote yellow-cedar through planting and thinning may not be permitted on portions of the National Forest System lands (e.g., wilderness areas). State and private landown-ers generally have more discretion for active management but may not have the resources for planting or thinning to enhance populations of yellow-cedar. Coor-dination among various government and private entities is encouraged to expand active management of yellow-cedar in Alaska, including planting trials beyond the current natural range.
Determine economic feasibility of salvaging dead yellow-cedar. The widespread extent of yellow-cedar decline and results from tests on the wood properties of dead yellow-cedar suggest promising prospects for salvage. Economic feasibility needs to be considered before salvage harvests will be attempted on a larger scale, however. One or more salvage trials are needed to test economic feasibility and to identify wood products that might be produced from dead yellow-cedar.
Improve marketing of yellow-cedar wood, including wood from dead trees, in domestic outlets.International export markets for yellow-cedar have been developed and are mature. Yellow-cedar is known locally and in certain specialty markets such as carving and boatbuilding, but yellow-cedar as a forest product is not well known throughout the United States. Marketing wood from dead yellow-cedar as a form of high-value wood produced in an environmentally sensitive manner could potentially expand domestic demand.

368
GENERAL TECHNICAL REPORT PNW-GTR-917
Evaluate the influence of natural selection on genetic traits for surviving yellow-cedar trees in decline-affected forests.With intense but not complete mortality at the stand level, yellow-cedar decline may impose the force of natural selection in affected populations. The surviving yellow-cedar trees could be evaluated for genetic traits that differ from the trees that died. It is conceivable that the surviving trees have greater cold hardiness or deharden more slowly in late winter. If such traits could be found and if they were heritable, then a program of genetic improvement could produce planting stock for the restoration of yellow-cedar in affected forests.
Develop a plan for genetic conservation of yellow-cedar; expand the collections and determine transfer ranges of seedlots.As genetic tools improve, the ability is gained to discern subtle genetic variability among the populations of yellow-cedar in Alaska. Greater understanding of the genomics of the species will assist in targeting the conservation of specific genetic stock by identifying unique genetic populations. A particular need is to collect seeds from the northwestern portion of the species’ range in Prince William Sound, both for genetic conservation and for use in future common garden trials. Another need is to revise tree seed zone and transfer guidelines for Alaska based on current knowledge about yellow-cedar genetic variation. A long-term seed procurement plan for yellow-cedar needs to be developed and should address the following: (1) the existing reforestation needs and anticipated needs from harvest levels, (2) projected restoration/reforestation following large-scale disturbance (wind) or accel-erated cedar decline with climate change, (3) the need to share seed with British Columbia, the State of Alaska, and Tribal corporations, (4) review of the existing seed inventory, (5) seed and cone periodicity, (6) seed yield data, (7) seed viability data, and (8) nursery sowing factors.

369
A Climate Adaptation Strategy for Conservation and Management of Yellow-Cedar in Alaska
Appendix 3: Yellow-Cedar Occurrence in Young-Growth Stands in AlaskaThis appendix provides a limited but growing list of 220 young-growth stands on Tongass National Forest land that contain yellow-cedar, as indicated by roadside surveys, qualitative observations, prethinning or post-thinning stocking survey plots, stand examinations, or other forest inventories (fig. 122, table 58). This infor-mation was compiled from a variety of sources, including reports from Tongass National Forest silviculturists and databases designed to store young-growth stand management information. These databases are FACTS (Forest Service Activity Tracking System), FPS (Forest Planning and Projection System), and FSVeg (Forest Sampled Vegetation). We have included location information, elevation, stand size, productivity class, harvest date, precommercial thinning date, and quantitative information about yellow-cedar composition wherever possible. Stands with <2 percent yellow-cedar composition were excluded, unless the species was known to have been planted. The stands gathered from the FPS database were filtered to exclude stands for which species composition had been modeled rather than mea-sured through silvicultural stand examinations.
This working list will help managers and forest health professionals to iden-tify young-growth stands for yellow-cedar monitoring, research, and modeling purposes. Projecting the health of these stands into the future, given the known hydrologic and snowpack risk factors for decline, may influence thinning prescrip-tions. For example, on low-snow sites, managers may choose not to retain yellow-cedar in particularly wet portions of stands, and retain yellow-cedar within areas having deeper or better drained soils. Using and adding to this list will make it possible to track how thinning and other forms of stand management influence the health of young yellow-cedar. Moving forward, this effort will benefit from more detailed information about stand management history (e.g., dates of management treatments).
Yellow-cedar regeneration success in both unmanaged stands and managed young-growth stands following timber harvest has been identified as a critical information need by the three plant association guides for the Tongass National Forest (DeMeo et al. 1992, Martin et al. 1995, Pawuk and Kissinger 1989). These guides suggest that yellow-cedar regeneration is limited by low reproductive capac-ity, deer browse, and competition with associated conifers, but regeneration has

370
GENERAL TECHNICAL REPORT PNW-GTR-917
not been quantified. In particular, it is unknown if yellow-cedar as a percentage of forest composition changes preharvest to postharvest, and how various management activities in young stands affect the relative composition and competitive status of yellow-cedar. If previously unmanaged stands with yellow-cedar snags or live trees are harvested, it will be worthwhile to track the relative change in yellow-cedar composition in the developing young stand and to add this preharvest versus postharvest information to our growing list.
Special thanks to Carol McKenzie, Melissa Cady, Greg Roberts, Craig Buehler, Ben Case, Sheila Spores, and other Tongass National Forest silviculturists and foresters for their help in gathering this information.

371
A Climate Adaptation Strategy for Conservation and Management of Yellow-Cedar in Alaska
Figure 122—Locations of 220 young-growth stands known to contain yellow-cedar on Tongass National Forest land. More young-growth stands with yellow-cedar will be identified and added over time.

372
GENERAL TECHNICAL REPORT PNW-GTR-917Ta
ble
58—
Youn
g-gr
owth
fore
st s
tand
s on
Ton
gass
Nat
iona
l For
est l
and
that
are
kno
wn
to c
onta
in a
rege
nera
ted
yello
w-c
edar
com
pone
nt (c
ontin
ued)
No.
Ran
ger
dist
rict
Isla
nd
Stan
d id
entifi
catio
n nu
mbe
r (F
AC
TSI
D)
Lat
itude
(°
N)
Lon
gitu
de
(°W
)
Mea
n el
evat
ion
(ft)
Size
(a
c)Pr
oduc
tivity
cl
assa
Har
vest
ye
arYe
ar
thin
ned
Yello
w-c
edar
co
mpo
sitio
n (%
)b,c,
dA
sses
smen
t m
etho
de
Bef
ore/
afte
r pr
ecom
mer
cial
th
inni
ng (P
CT
)?
1Si
tka
Chi
chag
of23
3000
0216
57.7
3112
-135
.306
1622
620
419
7820
053.
8Pl
ots
Bef
ore
2Si
tka
Chi
chag
of23
4000
0145
57.6
9935
-135
.315
2657
613
34
1979
–4.
8Pl
ots
Bef
ore
3Si
tka
Chi
chag
of24
4000
0238
57.5
3943
-135
.077
9855
910
63
1971
2012
17.0
Stan
d ex
amA
fter
4Si
tka
Bar
anof
2920
0002
7557
.457
38-1
35.4
4185
380
511
319
64–
3.0
Stan
d ex
amB
efor
e5
Sitk
aB
aran
of29
3000
0207
57.4
6395
-135
.278
0794
163
1994
–5.
0Pl
ots
Bef
ore
6Si
tka
Bar
anof
2930
0002
0857
.455
78-1
35.3
0350
335
313
1994
–3.
0 (5
.0)b
Plot
sB
efor
e7
Sitk
aB
aran
of29
3000
0209
57.4
5978
-135
.288
6121
48
419
94–
5.0
(8.0
)Pl
ots
Bef
ore
8Si
tka
Bar
anof
2930
0002
1057
.469
13-1
35.2
5101
203
316
1994
–7.
0cPl
ots
Bef
ore
9Si
tka
Bar
anof
2930
0002
1357
.447
44-1
35.2
9818
829
674
1996
–19
.0Pl
ots
Bef
ore
10Si
tka
Bar
anof
2930
0002
1557
.459
24-1
35.3
4681
693
264
1995
–6.
0Pl
ots
Bef
ore
11Si
tka
Bar
anof
2930
0002
1757
.463
72-1
35.2
5026
553
154
1996
–3.
0cPl
ots
Bef
ore
12Si
tka
Bar
anof
2930
0002
1857
.470
81-1
35.2
1693
327
244
1995
–3.
0 (2
.0)b
plot
sB
efor
e13
Sitk
aB
aran
of29
3000
0219
57.4
7062
-135
.232
0933
551
519
96–
3.0
(2.0
)b,c
plot
sB
efor
e14
Sitk
aB
aran
of29
3000
0221
57.4
6645
-135
.256
9527
822
419
96–
9.0
(24.
0)b,
cPl
ots
Bef
ore
15Si
tka
Bar
anof
2930
0002
2257
.461
20-1
35.2
4557
739
274
1996
–3.
0 (1
3.0)
bPl
ots
Bef
ore
16Si
tka
Bar
anof
2930
0002
2657
.461
91-1
35.1
8788
254
64
1996
–0
(8.0
)bPl
ots
Bef
ore
17Si
tka
Bar
anof
2930
0002
3057
.409
47-1
35.3
3071
469
184
1998
–16
.0Pl
ots
Bef
ore
18Si
tka
Bar
anof
2930
0020
7157
.462
24-1
35.2
8327
143
93
1994
–1.
0 (5
.0)b
Plot
sB
efor
e19
Sitk
aB
aran
of29
6000
0005
57.4
0481
-135
.000
3062
413
93
1978
1993
2.1
Plot
sB
efor
e20
Sitk
aB
aran
of29
6000
0194
57.3
7618
-134
.981
7629
521
63
1974
2009
, 201
1“a
bund
ant”
Stan
d ex
amA
fter
21Si
tka
Bar
anof
2960
0002
9457
.400
01-1
35.0
0126
210
134
1993
–3.
0cPl
ots
Bef
ore
22Si
tka
Bar
anof
2960
0003
0857
.394
12-1
35.0
4416
1,07
914
419
98–
34.0
(44.
0)b
Plot
sB
efor
e23
Sitk
aB
aran
of29
6000
0309
57.3
9423
-135
.037
3747
932
519
98–
1.0
(3.0
)bPl
ots
Bef
ore
24Si
tka
Bar
anof
2960
0003
1057
.391
38-1
35.0
4129
806
574
1994
–4.
0Pl
ots
Bef
ore
25Si
tka
Bar
anof
2960
0003
1157
.390
60-1
35.0
2637
328
284
1994
–2.
0Pl
ots
Bef
ore
26Si
tka
Bar
anof
2960
0003
1557
.410
13-1
34.9
9647
467
163
1994
–1.
0cPl
ots
Bef
ore
27Si
tka
Bar
anof
2960
0003
1657
.406
33-1
34.9
9951
624
233
1994
–0c
Plot
sB
efor
e28
Sitk
aB
aran
of29
6000
0317
57.4
0158
-134
.994
6278
931
219
94–
5.0
Plot
sB
efor
e29
Sitk
aB
aran
of29
6000
0322
57.3
8706
-135
.004
8973
653
319
97–
1.0
(9.0
)bPl
ots
Bef
ore
30Si
tka
Bar
anof
2960
0003
5457
.375
64-1
35.0
0079
670
272
1998
–1.
0 (1
0.0)
Plot
sB
efor
e31
Sitk
aB
aran
of29
7000
0063
57.4
1108
-134
.937
7541
419
23
1977
1992
7.2
Plot
s and
FIA
Bef
ore
32Si
tka
Bar
anof
2970
0000
8757
.409
17-1
34.9
2098
510
653
1977
–12
.4Pl
ots
Bef
ore
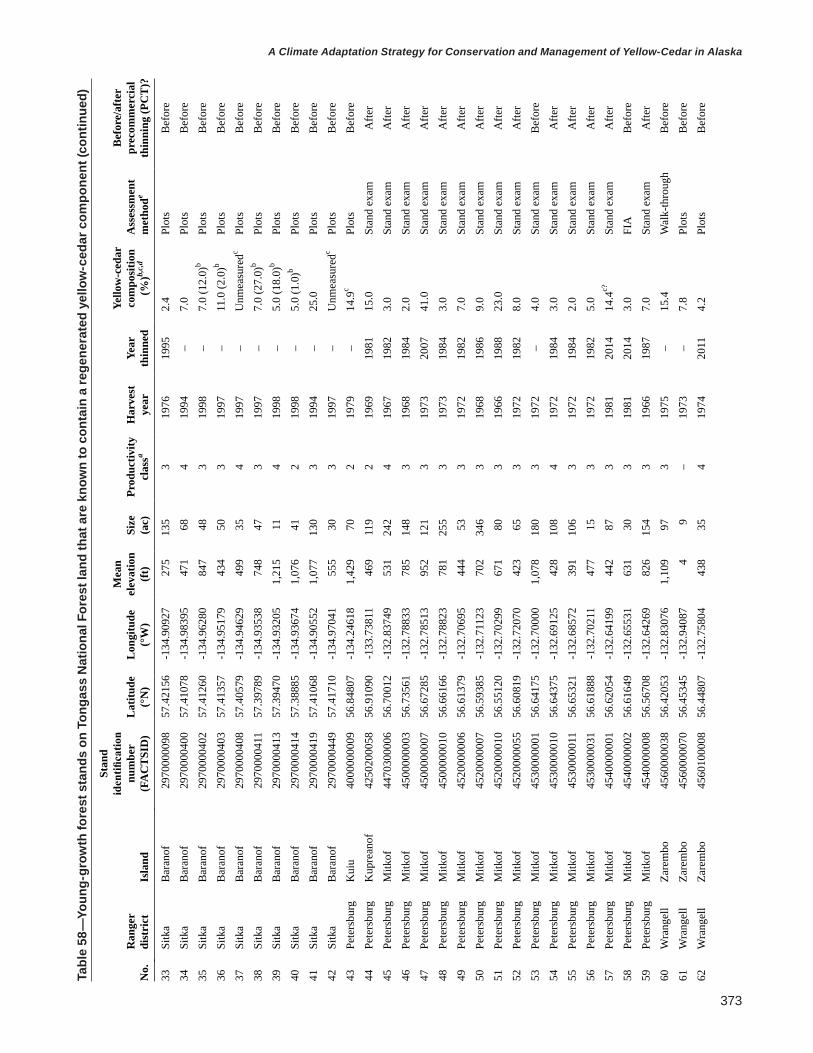
373
A Climate Adaptation Strategy for Conservation and Management of Yellow-Cedar in Alaska
Tabl
e 58
—Yo
ung-
grow
th fo
rest
sta
nds
on T
onga
ss N
atio
nal F
ores
t lan
d th
at a
re k
now
n to
con
tain
a re
gene
rate
d ye
llow
-ced
ar c
ompo
nent
(con
tinue
d)
No.
Ran
ger
dist
rict
Isla
nd
Stan
d id
entifi
catio
n nu
mbe
r (F
AC
TSI
D)
Lat
itude
(°
N)
Lon
gitu
de
(°W
)
Mea
n el
evat
ion
(ft)
Size
(a
c)Pr
oduc
tivity
cl
assa
Har
vest
ye
arYe
ar
thin
ned
Yello
w-c
edar
co
mpo
sitio
n (%
)b,c,
dA
sses
smen
t m
etho
de
Bef
ore/
afte
r pr
ecom
mer
cial
th
inni
ng (P
CT
)?
33Si
tka
Bar
anof
2970
0000
9857
.421
56-1
34.9
0927
275
135
319
7619
952.
4Pl
ots
Bef
ore
34Si
tka
Bar
anof
2970
0004
0057
.410
78-1
34.9
8395
471
684
1994
–7.
0Pl
ots
Bef
ore
35Si
tka
Bar
anof
2970
0004
0257
.412
60-1
34.9
6280
847
483
1998
–7.
0 (1
2.0)
bPl
ots
Bef
ore
36Si
tka
Bar
anof
2970
0004
0357
.413
57-1
34.9
5179
434
503
1997
–11
.0 (2
.0)b
Plot
sB
efor
e37
Sitk
aB
aran
of29
7000
0408
57.4
0579
-134
.946
2949
935
419
97–
Unm
easu
redc
Plot
sB
efor
e38
Sitk
aB
aran
of29
7000
0411
57.3
9789
-134
.935
3874
847
319
97–
7.0
(27.
0)b
Plot
sB
efor
e39
Sitk
aB
aran
of29
7000
0413
57.3
9470
-134
.932
051,
215
114
1998
–5.
0 (1
8.0)
bPl
ots
Bef
ore
40Si
tka
Bar
anof
2970
0004
1457
.388
85-1
34.9
3674
1,07
641
219
98–
5.0
(1.0
)bPl
ots
Bef
ore
41Si
tka
Bar
anof
2970
0004
1957
.410
68-1
34.9
0552
1,07
713
03
1994
–25
.0Pl
ots
Bef
ore
42Si
tka
Bar
anof
2970
0004
4957
.417
10-1
34.9
7041
555
303
1997
–U
nmea
sure
dcPl
ots
Bef
ore
43Pe
ters
burg
Kui
u40
0000
0009
56.8
4807
-134
.246
181,
429
702
1979
–14
.9c
Plot
sB
efor
e44
Pete
rsbu
rgK
upre
anof
4250
2000
5856
.910
90-1
33.7
3811
469
119
219
6919
8115
.0St
and
exam
Afte
r45
Pete
rsbu
rgM
itkof
4470
3000
0656
.700
12-1
32.8
3749
531
242
419
6719
823.
0St
and
exam
Afte
r46
Pete
rsbu
rgM
itkof
4500
0000
0356
.735
61-1
32.7
8833
785
148
319
6819
842.
0St
and
exam
Afte
r47
Pete
rsbu
rgM
itkof
4500
0000
0756
.672
85-1
32.7
8513
952
121
319
7320
0741
.0St
and
exam
Afte
r48
Pete
rsbu
rgM
itkof
4500
0000
1056
.661
66-1
32.7
8823
781
255
319
7319
843.
0St
and
exam
Afte
r49
Pete
rsbu
rgM
itkof
4520
0000
0656
.613
79-1
32.7
0695
444
533
1972
1982
7.0
Stan
d ex
amA
fter
50Pe
ters
burg
Mitk
of45
2000
0007
56.5
9385
-132
.711
2370
234
63
1968
1986
9.0
Stan
d ex
amA
fter
51Pe
ters
burg
Mitk
of45
2000
0010
56.5
5120
-132
.702
9967
180
319
6619
8823
.0St
and
exam
Afte
r52
Pete
rsbu
rgM
itkof
4520
0000
5556
.608
19-1
32.7
2070
423
653
1972
1982
8.0
Stan
d ex
amA
fter
53Pe
ters
burg
Mitk
of45
3000
0001
56.6
4175
-132
.700
001,
078
180
319
72–
4.0
Stan
d ex
amB
efor
e54
Pete
rsbu
rgM
itkof
4530
0000
1056
.643
75-1
32.6
9125
428
108
419
7219
843.
0St
and
exam
Afte
r55
Pete
rsbu
rgM
itkof
4530
0000
1156
.653
21-1
32.6
8572
391
106
319
7219
842.
0St
and
exam
Afte
r56
Pete
rsbu
rgM
itkof
4530
0000
3156
.618
88-1
32.7
0211
477
153
1972
1982
5.0
Stan
d ex
amA
fter
57Pe
ters
burg
Mitk
of45
4000
0001
56.6
2054
-132
.641
9944
287
319
8120
1414
.4c?
Stan
d ex
amA
fter
58Pe
ters
burg
Mitk
of45
4000
0002
56.6
1649
-132
.655
3163
130
319
8120
143.
0FI
AB
efor
e59
Pete
rsbu
rgM
itkof
4540
0000
0856
.567
08-1
32.6
4269
826
154
319
6619
877.
0St
and
exam
Afte
r60
Wra
ngel
lZa
rem
bo45
6000
0038
56.4
2053
-132
.830
761,
109
973
1975
–15
.4W
alk-
thro
ugh
Bef
ore
61W
rang
ell
Zare
mbo
4560
0000
7056
.453
45-1
32.9
4087
49
–19
73–
7.8
Plot
sB
efor
e62
Wra
ngel
lZa
rem
bo45
6010
0008
56.4
4807
-132
.758
0443
835
419
7420
114.
2Pl
ots
Bef
ore

374
GENERAL TECHNICAL REPORT PNW-GTR-917
Tabl
e 58
—Yo
ung-
grow
th fo
rest
sta
nds
on T
onga
ss N
atio
nal F
ores
t lan
d th
at a
re k
now
n to
con
tain
a re
gene
rate
d ye
llow
-ced
ar c
ompo
nent
(con
tinue
d)
No.
Ran
ger
dist
rict
Isla
nd
Stan
d id
entifi
catio
n nu
mbe
r (F
AC
TSI
D)
Lat
itude
(°
N)
Lon
gitu
de
(°W
)
Mea
n el
evat
ion
(ft)
Size
(a
c)Pr
oduc
tivity
cl
assa
Har
vest
ye
arYe
ar
thin
ned
Yello
w-c
edar
co
mpo
sitio
n (%
)b,c,
dA
sses
smen
t m
etho
de
Bef
ore/
afte
r pr
ecom
mer
cial
th
inni
ng (P
CT
)?
63W
rang
ell
Zare
mbo
4560
1000
1156
.441
81-1
32.7
3260
694
734
1975
2004
2.8
Plot
sB
efor
e64
Wra
ngel
lZa
rem
bo45
6010
0014
56.4
4081
-132
.688
8133
710
05
1975
2002
4.9
Plot
sB
efor
e65
Wra
ngel
lZa
rem
bo45
6010
0017
56.4
4659
-132
.739
1755
628
419
8120
115.
1 (7
.0)d
Plot
sB
efor
e, a
fter
66W
rang
ell
Zare
mbo
4560
1000
2156
.435
73-1
32.7
3329
912
203
1980
2012
3.6
Plot
sB
efor
e67
Wra
ngel
lZa
rem
bo45
6010
0022
56.4
4743
-132
.729
6261
619
519
8120
048.
4Pl
ots
Bef
ore
68W
rang
ell
Zare
mbo
4560
1000
2356
.444
31-1
32.7
4324
654
165
1980
2012
9.5
(30.
0)d
Plot
sB
efor
e, a
fter
69W
rang
ell
Zare
mbo
4560
1000
2556
.437
01-1
32.7
4603
808
158
419
8020
1214
.3 (3
0.0)
dPl
ots
Bef
ore,
afte
r70
Wra
ngel
lZa
rem
bo45
6010
0026
56.4
3000
-132
.729
081,
174
103
419
7620
122.
5Pl
ots
Bef
ore
71W
rang
ell
Zare
mbo
4560
1002
7056
.432
89-1
32.6
7267
168
65
1974
–3.
5Pl
ots
Bef
ore
72W
rang
ell
Zare
mbo
4570
0000
0456
.420
00-1
32.9
2034
597
297
419
7019
852.
1Pl
ots
Bef
ore
73W
rang
ell
Zare
mbo
4570
0000
0856
.418
98-1
32.8
7337
1,02
817
73
1972
1987
7.4
Plot
sB
efor
e74
Wra
ngel
lZa
rem
bo45
7000
0012
56.3
9577
-132
.847
521,
483
222
319
7420
143.
7Pl
ots
Bef
ore
75W
rang
ell
Zare
mbo
4570
0000
1356
.400
36-1
32.8
3294
1,50
852
319
7420
145.
7Pl
ots
Bef
ore
76W
rang
ell
Zare
mbo
4570
0000
1456
.358
00-1
32.8
6269
865
335
1981
2011
3.7
Plot
sB
efor
e77
Wra
ngel
lZa
rem
bo45
7000
0015
56.3
6570
-132
.868
4470
426
519
8120
087.
5 (4
9.0)
dPl
ots
Bef
ore,
afte
r78
Wra
ngel
lZa
rem
bo45
7000
0018
56.3
7947
-132
.904
9664
459
319
7520
117.
1 (1
8.0)
dPl
ots
Bef
ore,
afte
r79
Wra
ngel
lZa
rem
bo45
7000
0020
56.3
7674
-132
.920
7875
951
419
7520
0838
.6 (8
0.0)
dPl
ots
Bef
ore,
afte
r80
Wra
ngel
lZa
rem
bo45
7000
0022
56.3
5782
-132
.991
3839
443
319
7919
984.
8Pl
ots
Bef
ore
81W
rang
ell
Zare
mbo
4570
0000
2456
.382
63-1
32.9
7161
115
150
319
7319
83, 2
004
>10
Roa
dsid
eA
fter
82W
rang
ell
Zare
mbo
4570
0000
2656
.386
87-1
32.9
1910
595
543
1975
2002
9.7
Plot
sB
efor
e83
Wra
ngel
lZa
rem
bo45
7000
0039
56.3
5729
-132
.828
8776
022
319
8120
072.
4Pl
ots
Bef
ore
84W
rang
ell
Zare
mbo
4570
0000
4056
.360
93-1
32.8
4654
725
524
1981
2007
2.6
Plot
sB
efor
e85
Wra
ngel
lZa
rem
bo45
7000
0070
56.3
8784
-132
.977
5240
525
319
7520
04>1
0R
oads
ide
Afte
r86
Wra
ngel
lZa
rem
bo45
8040
0011
56.2
4423
-132
.876
3210
061
219
7319
852.
2Pl
ots
Bef
ore
87W
rang
ell
Zare
mbo
4580
4000
1356
.300
39-1
32.8
1657
957
314
1981
2012
9.6
(43.
0)d
Plot
sB
efor
e, a
fter
88W
rang
ell
Zare
mbo
4580
4000
1656
.314
67-1
32.8
3308
559
435
1981
2008
3.1
Plot
sB
efor
e89
Wra
ngel
lZa
rem
bo45
8040
0018
––
––
–19
81–
2.0
Plot
sB
efor
e90
Wra
ngel
lZa
rem
bo45
8050
0001
56.3
4893
-132
.910
5692
711
43
1979
1998
9.5
Plot
sB
efor
e91
Wra
ngel
lZa
rem
bo45
8050
0005
56.3
4366
-133
.007
1340
527
319
7920
042.
3Pl
ots
Bef
ore
92W
rang
ell
Zare
mbo
4580
5000
0756
.325
27-1
32.9
9570
674
543
1979
2011
7.9
(51.
0)d
Plot
sB
efor
e, a
fter

375
A Climate Adaptation Strategy for Conservation and Management of Yellow-Cedar in Alaska
Tabl
e 58
—Yo
ung-
grow
th fo
rest
sta
nds
on T
onga
ss N
atio
nal F
ores
t lan
d th
at a
re k
now
n to
con
tain
a re
gene
rate
d ye
llow
-ced
ar c
ompo
nent
(con
tinue
d)
No.
Ran
ger
dist
rict
Isla
nd
Stan
d id
entifi
catio
n nu
mbe
r (F
AC
TSI
D)
Lat
itude
(°
N)
Lon
gitu
de
(°W
)
Mea
n el
evat
ion
(ft)
Size
(a
c)Pr
oduc
tivity
cl
assa
Har
vest
ye
arYe
ar
thin
ned
Yello
w-c
edar
co
mpo
sitio
n (%
)b,c,
dA
sses
smen
t m
etho
de
Bef
ore/
afte
r pr
ecom
mer
cial
th
inni
ng (P
CT
)?
93W
rang
ell
Zare
mbo
4590
2000
4156
.352
43-1
32.8
1071
682
395
1981
2009
4.3
Plot
sB
efor
e94
Wra
ngel
lZa
rem
bo45
9020
0043
56.3
3514
-132
.809
8173
047
419
8120
139.
7 (1
8.0)
dPl
ots
Bef
ore,
afte
r95
Wra
ngel
lZa
rem
bo45
9020
0044
56.3
3595
-132
.792
4981
712
34
1982
2013
2.9
Plot
sB
efor
e96
Wra
ngel
lZa
rem
bo45
9020
0046
56.3
3714
-132
.779
1393
923
419
8120
083.
1Pl
ots
Bef
ore
97W
rang
ell
Zare
mbo
4590
2003
7056
.325
79-1
32.8
1394
599
494
1981
2012
4.5
Plot
sB
efor
e98
Wra
ngel
lZa
rem
bo45
9060
0002
56.3
1748
-132
.692
6563
229
419
8120
094.
1Pl
ots
Bef
ore
99W
rang
ell
Zare
mbo
4590
6000
0856
.250
38-1
32.7
9934
106
682
1970
1986
2.9
Plot
sB
efor
e10
0W
rang
ell
Zare
mbo
4590
6000
1056
.254
54-1
32.7
7274
118
552
1970
1985
14.6
Plot
sB
efor
e10
1W
rang
ell
Etol
in46
5000
0066
56.1
9971
-132
.596
8761
889
319
8620
1011
.0Pl
ots
Afte
r10
2W
rang
ell
Etol
in46
7000
0029
56.1
9440
-132
.596
3960
629
419
8620
1011
.0Pl
ots
Afte
r10
3W
rang
ell
Wra
ngel
l47
7000
0123
56.2
9279
-132
.346
2863
735
519
8720
122.
0Pl
ots
Afte
r10
4W
rang
ell
Wra
ngel
l47
8000
0184
56.3
0855
-132
.246
841,
031
586
1987
2012
32.0
Plot
sA
fter
105
Wra
ngel
lW
rang
ell
4800
1000
2156
.231
77-1
32.0
8894
491
165
1991
2014
20.0
Plot
sA
fter
106
Thor
ne B
ayPr
ince
of W
ales
5290
1005
0456
.328
46-1
33.5
7102
427
723
1980
–7.
0FI
AB
efor
e10
7Th
orne
Bay
Prin
ce o
f Wal
es53
2030
0520
56.2
8616
-133
.346
4322
088
319
8320
012.
0FI
AA
fter
108
Thor
ne B
ayPr
ince
of W
ales
5340
4005
0356
.183
44-1
33.1
8011
511
200
319
6919
8413
.0St
and
exam
Afte
r10
9Th
orne
Bay
Prin
ce o
f Wal
es53
8010
0504
56.1
7773
-133
.204
281,
283
133
1969
–4.
0St
and
exam
Bef
ore
110
Thor
ne B
ayPr
ince
of W
ales
5380
1005
0656
.170
99-1
33.1
9675
834
115
219
6620
002.
0St
and
exam
Afte
r11
1Th
orne
Bay
Prin
ce o
f Wal
es53
8010
0507
56.1
6847
-133
.180
2152
935
03
1966
1984
3.0
Stan
d ex
amA
fter
112
Thor
ne B
ayPr
ince
of W
ales
5380
2000
1256
.152
42-1
33.2
3322
453
253
1969
2012
2.0
Stan
d ex
amA
fter
113
Thor
ne B
ayPr
ince
of W
ales
5380
3000
9756
.144
20-1
33.1
7611
789
213
319
6619
935.
0St
and
exam
Afte
r11
4Th
orne
Bay
Kos
cius
ko54
5020
0512
55.9
8001
-133
.719
3027
547
219
5919
827.
0St
and
exam
Afte
r11
5Th
orne
Bay
Prin
ce o
f Wal
es55
0020
0511
56.0
8696
-133
.206
0327
276
319
7019
912.
0St
and
exam
Afte
r11
6Th
orne
Bay
Prin
ce o
f Wal
es55
0030
0115
56.0
8663
-133
.186
9451
74
319
6620
022.
0St
and
exam
Afte
r11
7Th
orne
Bay
Prin
ce o
f Wal
es55
0030
0501
56.0
7606
-133
.184
8267
418
93
1966
1986
2.0
Stan
d ex
amA
fter
118
Thor
ne B
ayPr
ince
of W
ales
5500
3005
0656
.080
47-1
33.1
8088
674
155
219
6619
838.
0St
and
exam
Afte
r11
9Th
orne
Bay
Prin
ce o
f Wal
es55
0030
0507
56.0
9436
-133
.181
6443
721
62
1966
1983
, 198
92.
0St
and
exam
Afte
r12
0Th
orne
Bay
Prin
ce o
f Wal
es55
1020
0511
56.0
9246
-133
.082
5438
104
1964
–37
.0St
and
exam
Bef
ore
121
Thor
ne B
ayPr
ince
of W
ales
5600
1005
3055
.821
21-1
33.3
1236
312
185
219
47–
2.0
Stan
d ex
amB
efor
e12
2Th
orne
Bay
Prin
ce o
f Wal
es57
1020
0524
55.9
1908
-133
.069
2440
612
13
1990
2015
3.0
FIA
Bef
ore

376
GENERAL TECHNICAL REPORT PNW-GTR-917
Tabl
e 58
—Yo
ung-
grow
th fo
rest
sta
nds
on T
onga
ss N
atio
nal F
ores
t lan
d th
at a
re k
now
n to
con
tain
a re
gene
rate
d ye
llow
-ced
ar c
ompo
nent
(con
tinue
d)
No.
Ran
ger
dist
rict
Isla
nd
Stan
d id
entifi
catio
n nu
mbe
r (F
AC
TSI
D)
Lat
itude
(°
N)
Lon
gitu
de
(°W
)
Mea
n el
evat
ion
(ft)
Size
(a
c)Pr
oduc
tivity
cl
assa
Har
vest
ye
arYe
ar
thin
ned
Yello
w-c
edar
co
mpo
sitio
n (%
)b,c,
dA
sses
smen
t m
etho
de
Bef
ore/
afte
r pr
ecom
mer
cial
th
inni
ng (P
CT
)?
123
Thor
ne B
ayPr
ince
of W
ales
5740
1005
1755
.912
09-1
32.9
7329
352
813
1988
–5.
0R
oads
ide
Bef
ore
124
Thor
ne B
ayPr
ince
of W
ales
5740
1005
1855
.897
94-1
32.9
4445
288
264
1988
2014
Unm
easu
red
Roa
dsid
eB
efor
e12
5Th
orne
Bay
Prin
ce o
f Wal
es57
4010
0599
55.8
8441
-132
.950
0567
824
219
94–
5.0
Roa
dsid
eB
efor
e12
6Th
orne
Bay
Prin
ce o
f Wal
es57
4010
9501
55.8
7023
-132
.930
0374
629
419
94–
10.0
Roa
dsid
eB
efor
e12
7Th
orne
Bay
Prin
ce o
f Wal
es57
4020
0514
55.9
1499
-132
.898
871,
009
624
1991
–18
.0R
oads
ide
Bef
ore
128
Thor
ne B
ayPr
ince
of W
ales
5740
2005
1655
.922
26-1
32.9
1023
1,28
518
419
9020
1430
.0R
oads
ide
Bef
ore
129
Thor
ne B
ayPr
ince
of W
ales
5740
2025
1655
.921
45-1
32.9
0431
1,33
615
519
8920
1430
.0R
oads
ide
Bef
ore
130
Thor
ne B
ayPr
ince
of W
ales
5740
3005
0955
.899
16-1
32.8
7369
1,79
327
419
89–
30.0
Roa
dsid
eB
efor
e13
1Th
orne
Bay
Prin
ce o
f Wal
es57
4030
0510
55.9
1313
-132
.894
6290
017
319
91–
18.0
Roa
dsid
eB
efor
e13
2Th
orne
Bay
Prin
ce o
f Wal
es57
4040
0511
55.8
6226
-132
.835
6012
9678
419
8820
1430
.0R
oads
ide
Bef
ore
133
Thor
ne B
ayPr
ince
of W
ales
5740
4005
1255
.865
65-1
32.8
4510
1115
404
1988
2014
15.0
Roa
dsid
eB
efor
e13
4Th
orne
Bay
Prin
ce o
f Wal
es57
4040
0521
55.8
6324
-132
.860
441,
357
883
1993
2014
7.0
Roa
dsid
eB
efor
e13
5Th
orne
Bay
Prin
ce o
f Wal
es57
4080
0501
55.7
7991
-132
.854
6745
76
319
91–
3.0
Roa
dsid
eB
efor
e13
6Th
orne
Bay
Prin
ce o
f Wal
es57
5030
0508
55.7
9865
-132
.780
9566
045
319
9220
142.
0R
oads
ide
Bef
ore
137
Thor
ne B
ayPr
ince
of W
ales
5750
3025
0655
.802
12-1
32.7
7989
614
155
1992
2014
5.0
Roa
dsid
eB
efor
e13
8Th
orne
Bay
Prin
ce o
f Wal
es57
5030
2508
55.8
0008
-132
.787
3750
624
519
9220
142.
0R
oads
ide
Bef
ore
139
Thor
ne B
ayPr
ince
of W
ales
5760
1005
0255
.745
68-1
32.8
2920
484
652
1990
2014
2.0
Roa
dsid
eB
efor
e14
0Th
orne
Bay
Prin
ce o
f Wal
es57
6010
0505
55.7
7343
-132
.851
2652
521
319
91–
4.0
Roa
dsid
eB
efor
e14
1Th
orne
Bay
Prin
ce o
f Wal
es57
6010
2504
55.7
6016
-132
.835
5455
941
319
91–
2.0
Roa
dsid
eB
efor
e14
2Th
orne
Bay
Prin
ce o
f Wal
es57
6010
2505
55.7
7399
-132
.852
4852
562
419
91–
3.0
Roa
dsid
eB
efor
e14
3Th
orne
Bay
Prin
ce o
f Wal
es57
7040
0518
55.8
3881
-132
.979
0353
364
419
9020
14U
nmea
sure
d–
?14
4Th
orne
Bay
Prin
ce o
f Wal
es57
9010
0506
55.7
3023
-132
.644
8175
816
53
1988
–6.
0R
oads
ide
Bef
ore
145
Thor
ne B
ayPr
ince
of W
ales
5790
1005
1655
.740
32-1
32.6
6110
741
120
319
90–
5.0
Roa
dsid
eB
efor
e14
6Th
orne
Bay
Prin
ce o
f Wal
es57
9020
9505
55.7
2290
-132
.569
1489
419
419
95–
3.0
Roa
dsid
eB
efor
e14
7Th
orne
Bay
Prin
ce o
f Wal
es58
0020
0516
55.7
9018
-132
.644
0388
610
24
1986
–U
nmea
sure
d–
–14
8Th
orne
Bay
Prin
ce o
f Wal
es58
1010
0517
55.9
5861
-132
.789
501,
148
714
1989
–9.
0R
oads
ide
Bef
ore
149
Thor
ne B
ayPr
ince
of W
ales
5810
2000
0355
.917
68-1
32.7
4019
806
132
319
6919
944.
0St
and
exam
Afte
r15
0Th
orne
Bay
Prin
ce o
f Wal
es58
1020
0007
55.9
5589
-132
.734
5747
376
419
6919
922.
0St
and
exam
Afte
r15
1Th
orne
Bay
Prin
ce o
f Wal
es58
1020
0509
55.9
5300
-132
.731
8584
567
519
96–
20.0
Roa
dsid
eB
efor
e15
2Th
orne
Bay
Prin
ce o
f Wal
es58
1020
0572
55.9
4032
-132
.747
861,
034
404
1993
–20
.0R
oads
ide
Bef
ore
153
Thor
ne B
ayPr
ince
of W
ales
5810
2005
7355
.927
24-1
32.7
3619
1,60
519
519
93–
20.0
Roa
dsid
eB
efor
e

377
A Climate Adaptation Strategy for Conservation and Management of Yellow-Cedar in Alaska
Tabl
e 58
—Yo
ung-
grow
th fo
rest
sta
nds
on T
onga
ss N
atio
nal F
ores
t lan
d th
at a
re k
now
n to
con
tain
a re
gene
rate
d ye
llow
-ced
ar c
ompo
nent
(con
tinue
d)
No.
Ran
ger
dist
rict
Isla
nd
Stan
d id
entifi
catio
n nu
mbe
r (F
AC
TSI
D)
Lat
itude
(°
N)
Lon
gitu
de
(°W
)
Mea
n el
evat
ion
(ft)
Size
(a
c)Pr
oduc
tivity
cl
assa
Har
vest
ye
arYe
ar
thin
ned
Yello
w-c
edar
co
mpo
sitio
n (%
)b,c,
dA
sses
smen
t m
etho
de
Bef
ore/
afte
r pr
ecom
mer
cial
th
inni
ng (P
CT
)?
154
Thor
ne B
ayPr
ince
of W
ales
5810
2095
0155
.948
00-1
32.7
4006
603
115
1995
–2.
0R
oads
ide
Bef
ore
155
Thor
ne B
ayPr
ince
of W
ales
5810
3005
0155
.919
22-1
32.7
7370
167
94
1968
–4.
0St
and
exam
Bef
ore
156
Thor
ne B
ayPr
ince
of W
ales
5810
3005
9855
.892
74-1
32.7
9429
227
15
1992
–10
.0R
oads
ide
Bef
ore
157
Thor
ne B
ayPr
ince
of W
ales
5810
4005
1855
.899
32-1
32.7
7721
426
624
1989
–5.
0R
oads
ide
Bef
ore
158
Thor
ne B
ayPr
ince
of W
ales
5810
4005
2055
.877
26-1
32.7
1887
956
513
1989
–5.
0c?R
oads
ide
Bef
ore
159
Thor
ne B
ayPr
ince
of W
ales
5830
1005
1355
.875
30-1
32.7
0750
915
235
1990
–5.
0R
oads
ide
Bef
ore
160
Thor
ne B
ayPr
ince
of W
ales
5830
1005
1655
.898
80-1
32.6
9286
911
974
1989
–10
.0R
oads
ide
Bef
ore
161
Thor
ne B
ayPr
ince
of W
ales
5830
3005
0355
.878
21-1
32.6
7617
616
193
1989
–7.
0R
oads
ide
Bef
ore
162
Thor
ne B
ayPr
ince
of W
ales
5830
3005
0455
.876
66-1
32.6
9734
764
149
219
89–
5.0
Roa
dsid
eB
efor
e16
3Th
orne
Bay
Prin
ce o
f Wal
es58
4010
0026
55.8
5745
-132
.569
7479
214
1998
2014
5.0
Roa
dsid
eB
efor
e16
4Th
orne
Bay
Prin
ce o
f Wal
es58
4020
0066
55.8
0977
-132
.568
891,
016
515
1998
–5.
0R
oads
ide
Bef
ore
165
Thor
ne B
ayPr
ince
of W
ales
5840
2000
7555
.814
70-1
32.5
6807
1,16
24
719
98–
5.0
Roa
dsid
eB
efor
e16
6Th
orne
Bay
Prin
ce o
f Wal
es58
4020
0583
55.8
0857
-132
.583
2185
759
519
93–
10.0
Roa
dsid
eB
efor
e16
7Th
orne
Bay
Prin
ce o
f Wal
es58
4020
0584
55.8
1562
-132
.581
151,
418
404
1993
–5.
0R
oads
ide
Bef
ore
168
Thor
ne B
ayPr
ince
of W
ales
5840
2005
9755
.817
01-1
32.5
2456
307
254
1992
–5.
0R
oads
ide
Bef
ore
169
Thor
ne B
ayPr
ince
of W
ales
5840
2015
8255
.836
08-1
32.5
4943
390
315
1994
–5.
0R
oads
ide
Bef
ore
170
Thor
ne B
ayPr
ince
of W
ales
5840
3000
1955
.797
06-1
32.5
1592
334
313
1997
–6.
0R
oads
ide
Bef
ore
171
Thor
ne B
ayPr
ince
of W
ales
5840
3005
9455
.808
99-1
32.5
2060
154
865
1992
–5.
0R
oads
ide
Bef
ore
172
Thor
ne B
ayPr
ince
of W
ales
5850
1005
3855
.777
86-1
32.5
6979
1,01
448
519
92–
10.0
Roa
dsid
eB
efor
e17
3Th
orne
Bay
Prin
ce o
f Wal
es58
5010
0539
55.7
6797
-132
.577
4087
561
519
93–
48.0
Roa
dsid
eB
efor
e17
4Th
orne
Bay
Prin
ce o
f Wal
es58
5010
0540
55.7
8666
-132
.585
661,
233
345
1993
–25
.0R
oads
ide
Bef
ore
175
Thor
ne B
ayPr
ince
of W
ales
5850
1005
4255
.786
32-1
32.5
9508
1,46
316
94
1993
–28
.0R
oads
ide
Bef
ore
176
Thor
ne B
ayPr
ince
of W
ales
5850
1005
4455
.779
07-1
32.5
9531
1,24
360
419
93–
40.0
Roa
dsid
eB
efor
e17
7Th
orne
Bay
Prin
ce o
f Wal
es58
5010
9501
55.7
6431
-132
.534
8670
232
519
95–
5.0
Roa
dsid
eB
efor
e17
8Th
orne
Bay
Prin
ce o
f Wal
es58
5010
9505
55.7
7186
-132
.547
1273
114
619
95–
5.0
Roa
dsid
eB
efor
e17
9Th
orne
Bay
Prin
ce o
f Wal
es58
5010
9601
55.7
6039
-132
.571
831,
071
295
1996
–2.
0R
oads
ide
Bef
ore
180
Thor
ne B
ayPr
ince
of W
ales
5850
1096
0355
.767
34-1
32.5
1200
458
257
1995
–2.
0R
oads
ide
Bef
ore
181
Thor
ne B
ayPr
ince
of W
ales
5850
1096
0455
.763
03-1
32.5
1736
570
47
1995
–2.
0R
oads
ide
Bef
ore
182
Thor
ne B
ayPr
ince
of W
ales
5860
1005
0155
.705
72-1
32.5
7549
591
653
319
63–
4.0
Stan
d ex
amB
efor
e18
3Th
orne
Bay
Prin
ce o
f Wal
es58
6010
9507
55.7
2036
-132
.567
5894
59
519
95–
3.0
Roa
dsid
eB
efor
e

378
GENERAL TECHNICAL REPORT PNW-GTR-917
Tabl
e 58
—Yo
ung-
grow
th fo
rest
sta
nds
on T
onga
ss N
atio
nal F
ores
t lan
d th
at a
re k
now
n to
con
tain
a re
gene
rate
d ye
llow
-ced
ar c
ompo
nent
(con
tinue
d)
No.
Ran
ger
dist
rict
Isla
nd
Stan
d id
entifi
catio
n nu
mbe
r (F
AC
TSI
D)
Lat
itude
(°
N)
Lon
gitu
de
(°W
)
Mea
n el
evat
ion
(ft)
Size
(a
c)Pr
oduc
tivity
cl
assa
Har
vest
ye
arYe
ar
thin
ned
Yello
w-c
edar
co
mpo
sitio
n (%
)b,c,
dA
sses
smen
t m
etho
de
Bef
ore/
afte
r pr
ecom
mer
cial
th
inni
ng (P
CT
)?
184
Thor
ne B
ayPr
ince
of W
ales
5860
3005
0455
.683
63-1
32.5
7294
241
412
319
62–
4.0
Stan
d ex
amB
efor
e18
5Th
orne
Bay
Prin
ce o
f Wal
es59
0030
0514
55.7
3303
-132
.952
601,
121
338
319
6719
845.
0St
and
exam
Afte
r18
6Th
orne
Bay
Prin
ce o
f Wal
es59
5030
0074
55.6
5059
-132
.861
571,
317
67
1999
–2.
0R
oads
ide
–18
7Th
orne
Bay
Prin
ce o
f Wal
es59
5030
0521
55.6
6448
-132
.893
0649
761
319
87–
3.0
Roa
dsid
eB
efor
e18
8Th
orne
Bay
Prin
ce o
f Wal
es59
5040
0514
55.6
3436
-132
.859
731,
030
543
1990
–8.
0R
oads
ide
Bef
ore
189
Cra
igPr
ince
of W
ales
5950
4005
1655
.643
89-1
32.9
0677
619
593
1991
–5.
0R
oads
ide
Bef
ore
190
Thor
ne B
ayPr
ince
of W
ales
5950
4025
1955
.621
18-1
32.8
3990
1,54
317
419
9120
143.
0R
oads
ide
Bef
ore
191
Thor
ne B
ayPr
ince
of W
ales
5960
5005
0255
.693
08-1
32.8
1523
882
544
1989
–10
.0R
oads
ide
Bef
ore
192
Thor
ne B
ayPr
ince
of W
ales
5960
5005
0555
.690
62-1
32.8
0210
827
354
1990
–10
.0R
oads
ide
Bef
ore
193
Thor
ne B
ayPr
ince
of W
ales
5971
1005
0555
.705
92-1
32.6
6229
217
763
1988
–5.
0c?R
oads
ide
Bef
ore
194
Thor
ne B
ayPr
ince
of W
ales
5972
1000
4655
.649
25-1
32.7
4817
1,01
380
319
6619
852.
0St
and
exam
Afte
r19
5Th
orne
Bay
Prin
ce o
f Wal
es59
7220
0506
55.6
6677
-132
.721
3574
498
219
88–
3.0
Roa
dsid
eB
efor
e19
6Th
orne
Bay
Prin
ce o
f Wal
es59
7220
0523
55.6
5388
-132
.719
901,
228
432
1993
–2.
0R
oads
ide
Bef
ore
197
Thor
ne B
ayPr
ince
of W
ales
5972
3005
1855
.647
22-1
32.6
5290
645
942
1992
–5.
0R
oads
ide
Bef
ore
198
Thor
ne B
ayPr
ince
of W
ales
5972
3005
1955
.642
62-1
32.6
4433
500
253
1992
–5.
0R
oads
ide
Bef
ore
199
Thor
ne B
ayPr
ince
of W
ales
5972
3005
2055
.636
11-1
32.6
4012
505
474
1992
–U
nmea
sure
d–
–20
0Th
orne
Bay
Prin
ce o
f Wal
es59
7240
0513
55.6
4210
-132
.702
981,
427
773
1989
–3.
0R
oads
ide
Bef
ore
201
Thor
ne B
ayPr
ince
of W
ales
5972
4005
1455
.627
01-1
32.6
3495
574
405
1992
–10
.0R
oads
ide
Bef
ore
202
Thor
ne B
ayPr
ince
of W
ales
5972
4005
1555
.617
68-1
32.6
3835
717
704
1992
–2.
0R
oads
ide
Bef
ore
203
Thor
ne B
ayPr
ince
of W
ales
5972
4005
1655
.612
27-1
32.6
4806
1,01
228
319
92–
5.0
Roa
dsid
eB
efor
e20
4Th
orne
Bay
Prin
ce o
f Wal
es59
8020
0522
55.5
9305
-132
.560
5564
102
319
45–
22.0
Stan
d ex
amB
efor
e20
5C
raig
Prin
ce o
f Wal
es61
3010
0509
55.3
9232
-132
.654
591,
959
147?
2000
–34
.0R
esea
rch
plot
Bef
ore
206
Cra
igPr
ince
of W
ales
6200
5005
0455
.337
14-1
32.4
9037
390
442
1954
1991
6.0
Stan
d ex
amA
fter
207
Cra
igPr
ince
of W
ales
6200
5005
1255
.335
02-1
32.4
8522
286
123
219
54–
10.0
Stan
d ex
amB
efor
e20
8C
raig
Prin
ce o
f Wal
es62
0050
0517
55.3
4269
-132
.495
6016
113
32
1954
–19
.0St
and
exam
Bef
ore
209
Cra
igPr
ince
of W
ales
6210
5005
2255
.356
12-1
32.7
3058
115
177
219
6020
123.
0St
and
exam
Bef
ore
210
Cra
igPr
ince
of W
ales
6210
5005
3455
.321
58-1
32.6
6451
1,03
225
219
97–
Unm
easu
red
––
211
Cra
igPr
ince
of W
ales
6210
6005
1355
.330
29-1
32.7
3669
966
129
219
61–
3.0
Stan
d ex
amSt
and
exam
212
Cra
igPr
ince
of W
ales
6220
1005
0655
.500
89-1
32.8
4617
779
483
1961
–3.
0St
and
exam
Stan
d ex
am21
3K
etch
ikan
Rev
illag
iged
o73
7010
0128
55.7
6925
-131
.497
391,
375
662
1996
2014
14.0
Plot
sA
fter
214
Ket
chik
anR
evill
agig
edo
7380
4000
0955
.665
18-1
31.5
6539
1,20
646
219
9020
05U
nmea
sure
d–
–

379
A Climate Adaptation Strategy for Conservation and Management of Yellow-Cedar in Alaska
Tabl
e 58
—Yo
ung-
grow
th fo
rest
sta
nds
on T
onga
ss N
atio
nal F
ores
t lan
d th
at a
re k
now
n to
con
tain
a re
gene
rate
d ye
llow
-ced
ar c
ompo
nent
(con
tinue
d)
No.
Ran
ger
dist
rict
Isla
nd
Stan
d id
entifi
catio
n nu
mbe
r (F
AC
TSI
D)
Lat
itude
(°
N)
Lon
gitu
de
(°W
)
Mea
n el
evat
ion
(ft)
Size
(a
c)Pr
oduc
tivity
cl
assa
Har
vest
ye
arYe
ar
thin
ned
Yello
w-c
edar
co
mpo
sitio
n (%
)b,c,
dA
sses
smen
t m
etho
de
Bef
ore/
afte
r pr
ecom
mer
cial
th
inni
ng (P
CT
)?
215
Ket
chik
anR
evill
agig
edo
7460
8001
1555
.530
74-1
31.3
6483
394
493
1994
2011
18.0
Plot
sA
fter
216
Ket
chik
anR
evill
agig
edo
7470
6000
8455
.489
43-1
31.4
4776
435
314
1995
2011
53.0
cPl
ots
Afte
r21
7K
etch
ikan
Rev
illag
iged
o74
8040
0084
55.4
3930
-131
.611
0385
116
219
8920
06U
nmea
sure
d–
–21
8K
etch
ikan
Rev
illag
iged
o74
8040
0094
55.4
4762
-131
.620
7261
017
319
97–
Unm
easu
redc?
––
219
Ket
chik
anR
evill
agig
edo
7480
4000
9555
.443
88-1
31.6
1781
687
32
1997
–U
nmea
sure
d–
–22
0K
etch
ikan
Rev
illag
iged
o75
3020
0066
55.5
0137
-131
.262
011,
294
791
1993
2011
16.0
Plot
sA
fter
a Pro
duct
ivity
cla
sses
rang
e fr
om 1
to 7
, fro
m h
ighe
st to
low
est s
ite p
rodu
ctiv
ity o
n th
e ba
sis o
f pre
harv
est t
imbe
r vol
ume
(USD
A F
S 20
08b,
list
ed in
“Li
tera
ture
Cite
d” fo
r mai
n te
xt o
f thi
s rep
ort).
b The
firs
t com
posi
tion
estim
ate
appl
ies t
o se
edlin
gs ≥
4 in
tall;
the
seco
nd a
pplie
s to
seed
lings
<4
in ta
ll.c S
tand
pla
nted
with
yel
low
-ced
ar. A
que
stio
n m
ark
afte
r thi
s sym
bol s
igni
fies
that
a si
te w
as p
lant
ed, b
ut p
ossi
bly
with
spec
ies o
ther
than
yel
low
-ced
ar.
d The
firs
t com
posi
tion
estim
ate
appl
ies t
o su
rvey
s bef
ore
thin
ning
, and
the
seco
nd e
stim
ate
appl
ies t
o su
rvey
s aft
er th
inni
ng.
e Yel
low
-ced
ar c
ompo
sitio
n as
sess
men
ts w
ere
mad
e th
roug
h pl
ot-b
ased
stoc
king
surv
eys,
visu
ally
est
imat
ed ro
adsi
de st
ocki
ng su
rvey
s, st
and
exam
inat
ions
or o
ther
inve
ntor
ies,
or re
sear
ch p
lot
mea
sure
men
ts. “
Roa
dsid
e” is
list
ed a
s the
surv
ey m
etho
d w
hen
the
spec
ific
surv
ey m
etho
d is
not
kno
wn,
as t
his i
s the
mos
t inf
orm
al ty
pe o
f com
posi
tion
asse
ssm
ent l
iste
d he
re. F
IA =
U.S
. For
est
Serv
ice,
For
est I
nven
tory
and
Ana
lysi
s.

380
GENERAL TECHNICAL REPORT PNW-GTR-917
Appendix 4: Common and Scientific Names of Plants, Mammals, Insects, and Fungi Mentioned in This Report
Common name Scientific name
Plants
Alaska blueberry Vaccinium alaskaense HowellAlder Alnus Mill.American skunk cabbage Lysichiton americanus Hultén & H. St. JohnBaker cypress, Modoc cypress, Siskiyou
cypressCupressus bakeri Jeps.
Birch Betula L.Black spruce Picea mariana (Mill.) Britton, Sterns &
PoggenbBlueberry Vaccinium L.Brewer spruce, Brewer’s weeping spruce Picea breweriana S. WatsonBunchberry dogwood, dwarf dogwood Cornus canadensis L.California red fir Abies magnifica A. MurrayChilean cypress, Chilean cedar Austrocedrus chilensis (D. Don) Pic. Serm. &
BizzarriCoast redwood Sequoia sempervirens (D. Don) Endl.Common juniper Juniperus communis L.Creeping juniper Juniperus horizontalis MoenchDouglas-fir Pseudotsuga menziesi (Mirb.) FrancoGolden Vietnamese cypress Xanthocyparis vietnamensis Farjon & HiepHard southern yellow pines (slash,
longleaf, or loblolly pine)Pinus elliotii Engelm., P. palustris Mill., or P.
taeda L.Hinoki cedar/cypress, Japanese cedar/
cypressChamaecyparis obtusa (Siebold & Zucc.)
Endl.Incense-cedar Calocedrus decurrens (Torr.) FlorinKenai birch Betula kenaic W.H. EvansLutz spruce (Sitka × white) Picea lutzi LittleMaple Acer L.Monterey cypress Cupressus macrocarpa Hartw.Mountain hemlock Tsuga mertensiana (Bong.) Carr.Noble fir Abies procera RehderOval-leaved blueberry Vaccinium ovalifolium Sm.Pacific silver fir Abies amabilis Dougl. ex J. ForbesPacific yew Taxus brevifolia Nutt.Paper birch Betula papyrifera Marshall Port-Orford-cedar Chamaecyparis lawsonia (Murray) Parl.Quaking aspen Populus tremuloides Michx.

381
A Climate Adaptation Strategy for Conservation and Management of Yellow-Cedar in Alaska
Common name Scientific name
Redwood Sequoia Endl.Salal Gaultheria shallon PurshShore pine (ssp. Lodgepole pine) Pinus contorta Dougl. ex Loud. var. contortaSitka spruce Picea sitchensis (Bong.) Carr.Skunkcabbage Lysichiton Schott.Trailing bramble Rubus pedatus Sm.Western redcedar Thuja plicata Donn ex D. DonWestern white pine Pinus monticola Dougl. ex D. DonWhite spruce Picea glauca (Moench) VossWhitebark pine Pinus albicaulis Engelm.Yellow-cedar Callitropsis nootkatensis (D. Don) LittleYew Taxus L.
Mammals
Black bear Ursus americanusBrown bear Ursus arctosKeen’s myotis Myotis keeniMoose Alces alcesNorth American beaver Castor canadensisPorcupine Erethizon dorsatumSitka black-tailed deer Odocoileus hemionus sitkensis
Insects
Ambrosia beetles Trypodendron spp. (Coleoptera: Curculionidae)
Cedar bark beetle Phloeosinus cupressi, P. sequoia, and P. keeni (Coleoptera: Curculionidae: Scolytinae)
Cypress tip moths Argyresthia spp. (Lepidoptera: Yponomeutidae)
Formosan subterranean termite Coptotermes formosanus (Blattodea: Rhinotermitidae)
Green-striped forest looper Melanolophia imitata (Lepidoptera: Geometridae)
Longhorned borers Coleoptera: CerambycidaeSaddle-backed looper Ectropis crepuscularia (Lepidoptera:
Geometridae)Western hemlock looper Lambdina fiscellaria lugubrosa (Lepidoptera:
Geometridae)Wood wasp, horntail Sirex sp. (Hymenoptera: Siricidae)Yellow-cedar gall midge Chamaediplosis nootkatensis (Diptera:
Cecidomyiidae) Yellow-cedar pollen mite Trisetacus chamaecyparis (Prostigmata:
Phytopidae)
382
GENERAL TECHNICAL REPORT PNW-GTR-917
Common name Scientific name
Fungi
Ambrosia fungi, ophiastomatoid fungi Ambrosiella spp., Rafaellea spp., Dryadomyces spp. (Ophiostomatales)
Armillaria root disease Armillaria sp.Brown cubical and pocket rot Postia placenta (Fr.) M.J. Larsen & LombardCedar-apple rust Gymnosporangium nootkatense ArthurDry rot fungus Serpula himantioides (Fr.) P. Karst.Ear fungus Auricularia auricularis (Gray) G.W. Martin Elegant polypore Polyporus elegans (Bull.) Trog, Flora
(Regensburg)Gloeophyllum conk Gloeophyllum trabeum (Pers.: Fr.) Murrill Gray mold Botrytis cinerera Pers.: Fr.Laminated root/butt rot Phellinus weirii (Murrill) Gilb.Mal del ciprés Phytophthora austrocedrae Gresl. & EM
HansenPort-Orford-cedar root rot Phytopththora lateralis Tucker & MilbrathResinous stem canker Cistella japonica Suto & Kobayashi Seiridium shoot blight Seiridium cardinal (W. Wagener) B. Sutton
& I. GibsonYellow-cedar black stain Sporidesmium spp. [tentative identification]Yellow-cedar shoot blight Kabatina thujae Schneider & Arx

Pacific Northwest Research Station
Web site http://www.fs.fed.us/pnwTelephone (503) 808-2592Publication requests (503) 808-2138FAX (503) 808-2130E-mail [email protected] address Publications Distribution PacificNorthwestResearchStation P.O. Box 3890 Portland,OR97208-3890

U.S. Department of Agriculture Pacific Northwest Research Station 1220 SW 3rd Ave., Suite 1400 P.O. Box 3890 Portland, OR 97208-3890
Official Business Penalty for Private Use, $300