Communication Bandwidth Prediction Technology for Smart ...
14
electronics Article Communication Bandwidth Prediction Technology for Smart Power Distribution Business in Smart Parks Xia Zhou 1, *, Jianqiang Lu 1 , Xiangpeng Xie 1 , Chengjie Bu 1 , Lei Wan 1 and Feng Xue 2 Citation: Zhou, X.; Lu, J.; Xie, X.; Bu, C.; Wan, L.; Xue, F. Communication Bandwidth Prediction Technology for Smart Power Distribution Business in Smart Parks. Electronics 2021, 10, 3143. https://doi.org/10.3390/ electronics10243143 Academic Editor: Maysam Abbod Received: 3 November 2021 Accepted: 13 December 2021 Published: 17 December 2021 Publisher’s Note: MDPI stays neutral with regard to jurisdictional claims in published maps and institutional affil- iations. Copyright: © 2021 by the authors. Licensee MDPI, Basel, Switzerland. This article is an open access article distributed under the terms and conditions of the Creative Commons Attribution (CC BY) license (https:// creativecommons.org/licenses/by/ 4.0/). 1 Institute of Advanced Technology, Nanjing University of Post and Telecommunication, Nanjing 210032, China; [email protected] (J.L.); [email protected] (X.X.); [email protected] (C.B.); [email protected] (L.W.) 2 NARI Group Corporation, State Grid Electric Power Research Institute, Nanjing 211106, China; [email protected] * Correspondence: [email protected]; Tel.: +86-13-81-39-00-451 Abstract: Accurate prediction of power business communication bandwidth is the premise for the effectiveness of power communication planning and the fundamental guarantee for regular operation of power businesses. To solve the problem of scientifically and reasonably allocating bandwidth resources in smart parks, communication bandwidth prediction technology of intelligent power distribution service for smart parks is proposed in this paper. First, the characteristics of mixed service data arrival rate of power distribution and communication mixed services in smart parks were analyzed. Poisson process and interrupted Poisson process were used to simulate periodic and sudden business of smart parks to realize accurate simulation of the business arrival process. Then, a service arrival rate model based on the Markov modulation Poisson process was constructed. An active buffer management mechanism was used to dynamically discard data packets according to the set threshold and achieve accurate simulation of the packet loss rate during the arrival of smart park business. At the same time, considering the communication service quality index and bandwidth resource utilization, a business communication bandwidth prediction model of smart parks was established to improve the accuracy of business bandwidth prediction. Finally, a smart power distribution room in a smart park was used as an application scenario to quantitatively analyze the relationship between the communication service quality and bandwidth configuration. According to the predicted bandwidth, the reliability and effectiveness of the proposed method were verified by comparison with the elastic coefficient method. Keywords: smart park; communication bandwidth forecast; queuing theory; Markov modulated Poisson process; cache group management 1. Introduction A variety of energy forms and types of smart terminals exist in smart parks [1–4]. The power business in smart parks is complex, such as distributed power business, en- ergy consumption monitoring business, control business, etc., which demands higher requirements on edge computing and edge communication capabilities. Reasonable power communication planning is the basis for regular operation of power business in smart parks [5,6]. Problems such as redundancy and waste of communication network resources and the inability of communication service quality to meet the needs of communication services between terminals are caused by communication bandwidth planning that does not match the actual situation, thereby restricting the development of smart parks [7,8]. The rationality of power communication planning can be guaranteed by accurate power business bandwidth prediction [9,10]. Research on the prediction of communication bandwidth of power distribution busi- ness has mainly focuses on certain aspects. The authors of [11] proposed a bandwidth calculation method based on M/M/1/k queuing theory for information collection services Electronics 2021, 10, 3143. https://doi.org/10.3390/electronics10243143 https://www.mdpi.com/journal/electronics
-
Upload
khangminh22 -
Category
Documents
-
view
1 -
download
0
Transcript of Communication Bandwidth Prediction Technology for Smart ...

electronics
Article
Communication Bandwidth Prediction Technology for SmartPower Distribution Business in Smart Parks
Xia Zhou 1,*, Jianqiang Lu 1, Xiangpeng Xie 1, Chengjie Bu 1, Lei Wan 1 and Feng Xue 2
�����������������
Citation: Zhou, X.; Lu, J.; Xie, X.; Bu,
C.; Wan, L.; Xue, F. Communication
Bandwidth Prediction Technology for
Smart Power Distribution Business in
Smart Parks. Electronics 2021, 10, 3143.
https://doi.org/10.3390/
electronics10243143
Academic Editor: Maysam Abbod
Received: 3 November 2021
Accepted: 13 December 2021
Published: 17 December 2021
Publisher’s Note: MDPI stays neutral
with regard to jurisdictional claims in
published maps and institutional affil-
iations.
Copyright: © 2021 by the authors.
Licensee MDPI, Basel, Switzerland.
This article is an open access article
distributed under the terms and
conditions of the Creative Commons
Attribution (CC BY) license (https://
creativecommons.org/licenses/by/
4.0/).
1 Institute of Advanced Technology, Nanjing University of Post and Telecommunication,Nanjing 210032, China; [email protected] (J.L.); [email protected] (X.X.); [email protected] (C.B.);[email protected] (L.W.)
2 NARI Group Corporation, State Grid Electric Power Research Institute, Nanjing 211106, China;[email protected]
* Correspondence: [email protected]; Tel.: +86-13-81-39-00-451
Abstract: Accurate prediction of power business communication bandwidth is the premise for theeffectiveness of power communication planning and the fundamental guarantee for regular operationof power businesses. To solve the problem of scientifically and reasonably allocating bandwidthresources in smart parks, communication bandwidth prediction technology of intelligent powerdistribution service for smart parks is proposed in this paper. First, the characteristics of mixedservice data arrival rate of power distribution and communication mixed services in smart parkswere analyzed. Poisson process and interrupted Poisson process were used to simulate periodicand sudden business of smart parks to realize accurate simulation of the business arrival process.Then, a service arrival rate model based on the Markov modulation Poisson process was constructed.An active buffer management mechanism was used to dynamically discard data packets accordingto the set threshold and achieve accurate simulation of the packet loss rate during the arrival ofsmart park business. At the same time, considering the communication service quality index andbandwidth resource utilization, a business communication bandwidth prediction model of smartparks was established to improve the accuracy of business bandwidth prediction. Finally, a smartpower distribution room in a smart park was used as an application scenario to quantitatively analyzethe relationship between the communication service quality and bandwidth configuration. Accordingto the predicted bandwidth, the reliability and effectiveness of the proposed method were verified bycomparison with the elastic coefficient method.
Keywords: smart park; communication bandwidth forecast; queuing theory; Markov modulatedPoisson process; cache group management
1. Introduction
A variety of energy forms and types of smart terminals exist in smart parks [1–4].The power business in smart parks is complex, such as distributed power business, en-ergy consumption monitoring business, control business, etc., which demands higherrequirements on edge computing and edge communication capabilities. Reasonable powercommunication planning is the basis for regular operation of power business in smartparks [5,6]. Problems such as redundancy and waste of communication network resourcesand the inability of communication service quality to meet the needs of communicationservices between terminals are caused by communication bandwidth planning that doesnot match the actual situation, thereby restricting the development of smart parks [7,8].The rationality of power communication planning can be guaranteed by accurate powerbusiness bandwidth prediction [9,10].
Research on the prediction of communication bandwidth of power distribution busi-ness has mainly focuses on certain aspects. The authors of [11] proposed a bandwidthcalculation method based on M/M/1/k queuing theory for information collection services
Electronics 2021, 10, 3143. https://doi.org/10.3390/electronics10243143 https://www.mdpi.com/journal/electronics
Electronics 2021, 10, 3143 2 of 14
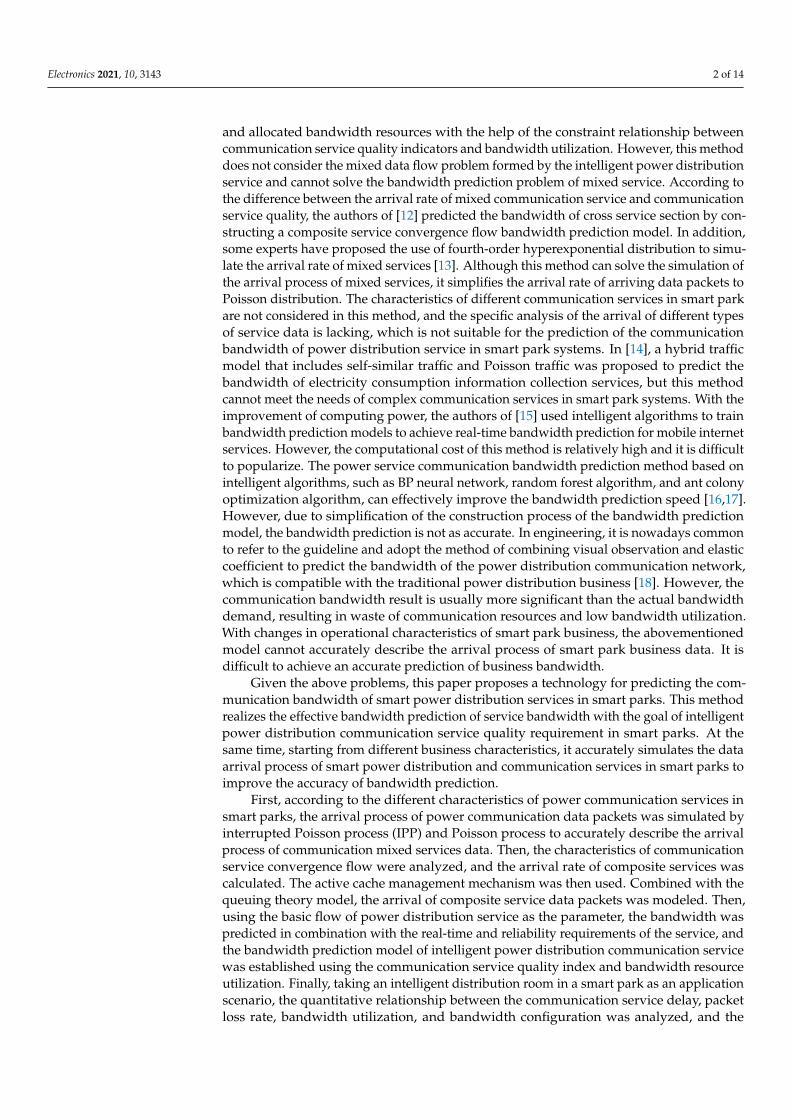
and allocated bandwidth resources with the help of the constraint relationship betweencommunication service quality indicators and bandwidth utilization. However, this methoddoes not consider the mixed data flow problem formed by the intelligent power distributionservice and cannot solve the bandwidth prediction problem of mixed service. According tothe difference between the arrival rate of mixed communication service and communicationservice quality, the authors of [12] predicted the bandwidth of cross service section by con-structing a composite service convergence flow bandwidth prediction model. In addition,some experts have proposed the use of fourth-order hyperexponential distribution to simu-late the arrival rate of mixed services [13]. Although this method can solve the simulation ofthe arrival process of mixed services, it simplifies the arrival rate of arriving data packets toPoisson distribution. The characteristics of different communication services in smart parkare not considered in this method, and the specific analysis of the arrival of different typesof service data is lacking, which is not suitable for the prediction of the communicationbandwidth of power distribution service in smart park systems. In [14], a hybrid trafficmodel that includes self-similar traffic and Poisson traffic was proposed to predict thebandwidth of electricity consumption information collection services, but this methodcannot meet the needs of complex communication services in smart park systems. With theimprovement of computing power, the authors of [15] used intelligent algorithms to trainbandwidth prediction models to achieve real-time bandwidth prediction for mobile internetservices. However, the computational cost of this method is relatively high and it is difficultto popularize. The power service communication bandwidth prediction method based onintelligent algorithms, such as BP neural network, random forest algorithm, and ant colonyoptimization algorithm, can effectively improve the bandwidth prediction speed [16,17].However, due to simplification of the construction process of the bandwidth predictionmodel, the bandwidth prediction is not as accurate. In engineering, it is nowadays commonto refer to the guideline and adopt the method of combining visual observation and elasticcoefficient to predict the bandwidth of the power distribution communication network,which is compatible with the traditional power distribution business [18]. However, thecommunication bandwidth result is usually more significant than the actual bandwidthdemand, resulting in waste of communication resources and low bandwidth utilization.With changes in operational characteristics of smart park business, the abovementionedmodel cannot accurately describe the arrival process of smart park business data. It isdifficult to achieve an accurate prediction of business bandwidth.
Given the above problems, this paper proposes a technology for predicting the com-munication bandwidth of smart power distribution services in smart parks. This methodrealizes the effective bandwidth prediction of service bandwidth with the goal of intelligentpower distribution communication service quality requirement in smart parks. At thesame time, starting from different business characteristics, it accurately simulates the dataarrival process of smart power distribution and communication services in smart parks toimprove the accuracy of bandwidth prediction.
First, according to the different characteristics of power communication services insmart parks, the arrival process of power communication data packets was simulated byinterrupted Poisson process (IPP) and Poisson process to accurately describe the arrivalprocess of communication mixed services data. Then, the characteristics of communicationservice convergence flow were analyzed, and the arrival rate of composite services wascalculated. The active cache management mechanism was then used. Combined with thequeuing theory model, the arrival of composite service data packets was modeled. Then,using the basic flow of power distribution service as the parameter, the bandwidth waspredicted in combination with the real-time and reliability requirements of the service, andthe bandwidth prediction model of intelligent power distribution communication servicewas established using the communication service quality index and bandwidth resourceutilization. Finally, taking an intelligent distribution room in a smart park as an applicationscenario, the quantitative relationship between the communication service delay, packetloss rate, bandwidth utilization, and bandwidth configuration was analyzed, and the

Electronics 2021, 10, 3143 3 of 14
predicted bandwidth was obtained. The reliability and effectiveness of the proposedmethod were verified by comparison with the elastic coefficient method.
2. Convergence Flow Characteristics of Communication Services in Smart Parks2.1. Basic Characteristics of Smart Park Communication Services
Smart parks adopt mature, reliable, economical, and suitable communication methodsfor business, such as WiFi, EPON, industrial ethernet, 4G/5G wireless public network,etc. They support services such as intelligent identification and monitoring of each link ofelectricity distribution, electricity consumption information collection, distributed energycontrol, etc. to meet the data transmission needs between collection equipment, sensors,and smart terminals.
This section analyzes smart park services based on typical QoS indicators and char-acterizes the services. Smart power distribution services included in smart parks can bedivided into four basic types: distributed power supply business, energy consumptionmonitoring business, energy control business, and video surveillance business. With re-gard to the QoS indicators of public network communication services and the “TechnicalRegulations for Power System Communication Design”, the typical communication QoSindicators of the above four basic service categories are given in Table 1.
Table 1. Typical QoS indicators of communication services in smart parks.
Business Type Time Delay Packet Loss Rate Concurrency Rate Way of Communication
Distributed power supply business 50 ms <0.1% 20% EPON, wireless private networkEnergy consumption monitoring business second level <1% 25% LoRa, wireless private network
Energy control business 30 ms <0.01% 100% EPON, wireless private networkVideo surveillance business second level <1% 10% Ethernet, wireless public network
According to the characteristics of communication services in smart parks, variousservices can be divided into periodic services and sudden services. Routine servicesare mostly expressed as typical applications of regular communication with machines.There are many types of routine business data, significant business traffic, and stabledata generation, and most data transmission cycles are fixed values. Sudden servicesare primarily manifested as failures of monitoring points or abnormal control signals.This type of service has high requirements for real-time service and accuracy, and whenmapped to QoS indicators, data delay and packet loss rate requirements are high. The twotypes of service data are independent of each other. The data enters the buffer queue atdifferent arrival rates to form a mixed queue, and the aggregation node allocates bandwidthaccording to different service QoS indicators to meet the service requirements.
2.2. Analysis of Convergence Flow Characteristics of Communication Services in Smart Parks
The traditional network traffic model assumes that the arrival process of the datapacket is a Poisson process. With the expansion of network scale and the continuousdevelopment of new power distribution services in smart parks, network traffic has shownstrong burstiness and randomness. Therefore, it is difficult for the classic Poisson model toaccurately simulate its characteristics.
In this work, the smart park business was divided into periodic business and suddenbusiness. Periodic services include video multimedia communication services, such assmart meter collection, energy storage station monitoring, and on-site video equipmentmonitoring. Sudden services include data communication services, such as distributedpower failure control, power distribution system failure information upload, and preciseload shedding control services. Figure 1 shows the business convergence processing modelfor constructing business sections.

Electronics 2021, 10, 3143 4 of 14
Electronics 2021, 10, x FOR PEER REVIEW 4 of 15
power failure control, power distribution system failure information upload, and precise
load shedding control services. Figure 1 shows the business convergence processing
model for constructing business sections.
sudden business
Periodic business
Bandwidth predictionBandwidth allocation
Cache queuePoisson flow abstract background flow
IPP stream abstract label stream
Figure 1. Convergence flow of intelligent power distribution and consumption communication ser-
vice.
The Poisson process and the IPP were used to simulate the arrival process of periodic
and burst business communication data packets, respectively. The system forwarding rate
(bandwidth) in the service process was set to a fixed value. A mixed service queuing
model was established to realize the analysis of the service convergence characteristics of
smart parks. The details are as follows:
(1) Interrupted Poisson process: The Markov chain describing the IPP arrival process
is shown in Figure 2, where Pa represents the probability of staying in one state, and Pb is
the probability of staying in two states. When the IPP arrival process shifts to the two
states, the arrival obeys the parameter λ0 Poisson distribution.
1 2
1-Pb
1-Pa
Pa Pb
λ0
Figure 2. State transition diagram of an interrupted Poisson process.
(2) Poisson process: λ1 represents the intensity of Poisson distribution arrival, which
can be mapped to the arrival rate of periodic services.
The IPP stream and the Poisson stream were superimposed, which is equivalent to a
Markov modulated Poisson process (MMPP) stream, and the complex mixed data stream
was converted into a single arrival stream analysis [19] using the MMPP stream to de-
scribe the convergence flow of communication business data in smart parks. Compared
with the previous use of traditional Poisson distribution to simulate the arrival rate of all
service data, MMPP can more accurately simulate the arrival process of communication
service data. It makes the bandwidth prediction model more realistic and improves the
accuracy of bandwidth prediction under the premise of meeting the communication ser-
vice quality.
Figure 1. Convergence flow of intelligent power distribution and consumption communication service.
The Poisson process and the IPP were used to simulate the arrival process of periodicand burst business communication data packets, respectively. The system forwarding rate(bandwidth) in the service process was set to a fixed value. A mixed service queuing modelwas established to realize the analysis of the service convergence characteristics of smartparks. The details are as follows:
(1) Interrupted Poisson process: The Markov chain describing the IPP arrival processis shown in Figure 2, where Pa represents the probability of staying in one state, and Pbis the probability of staying in two states. When the IPP arrival process shifts to the twostates, the arrival obeys the parameter λ0 Poisson distribution.
Electronics 2021, 10, x FOR PEER REVIEW 4 of 15
power failure control, power distribution system failure information upload, and precise
load shedding control services. Figure 1 shows the business convergence processing
model for constructing business sections.
sudden business
Periodic business
Bandwidth predictionBandwidth allocation
Cache queuePoisson flow abstract background flow
IPP stream abstract label stream
Figure 1. Convergence flow of intelligent power distribution and consumption communication ser-
vice.
The Poisson process and the IPP were used to simulate the arrival process of periodic
and burst business communication data packets, respectively. The system forwarding rate
(bandwidth) in the service process was set to a fixed value. A mixed service queuing
model was established to realize the analysis of the service convergence characteristics of
smart parks. The details are as follows:
(1) Interrupted Poisson process: The Markov chain describing the IPP arrival process
is shown in Figure 2, where Pa represents the probability of staying in one state, and Pb is
the probability of staying in two states. When the IPP arrival process shifts to the two
states, the arrival obeys the parameter λ0 Poisson distribution.
1 2
1-Pb
1-Pa
Pa Pb
λ0
Figure 2. State transition diagram of an interrupted Poisson process.
(2) Poisson process: λ1 represents the intensity of Poisson distribution arrival, which
can be mapped to the arrival rate of periodic services.
The IPP stream and the Poisson stream were superimposed, which is equivalent to a
Markov modulated Poisson process (MMPP) stream, and the complex mixed data stream
was converted into a single arrival stream analysis [19] using the MMPP stream to de-
scribe the convergence flow of communication business data in smart parks. Compared
with the previous use of traditional Poisson distribution to simulate the arrival rate of all
service data, MMPP can more accurately simulate the arrival process of communication
service data. It makes the bandwidth prediction model more realistic and improves the
accuracy of bandwidth prediction under the premise of meeting the communication ser-
vice quality.
Figure 2. State transition diagram of an interrupted Poisson process.
(2) Poisson process: λ1 represents the intensity of Poisson distribution arrival, whichcan be mapped to the arrival rate of periodic services.
The IPP stream and the Poisson stream were superimposed, which is equivalent to aMarkov modulated Poisson process (MMPP) stream, and the complex mixed data streamwas converted into a single arrival stream analysis [19] using the MMPP stream to describethe convergence flow of communication business data in smart parks. Compared with theprevious use of traditional Poisson distribution to simulate the arrival rate of all servicedata, MMPP can more accurately simulate the arrival process of communication servicedata. It makes the bandwidth prediction model more realistic and improves the accuracyof bandwidth prediction under the premise of meeting the communication service quality.
3. Communication Bandwidth Estimation Model and Solution Method Based onMMPP/m/c/n Queue3.1. Mixed Service Arrival Rate Model
The Poisson process with the parameter λ1 and the interrupted Poisson process withthe parameters λ2, pa, and pb can be superimposed and combined into a double randomPoisson process, that is, a 2-state Markov modulated Poisson process (MMPP(2)). Thecorresponding parameters are r1, r2, λ, and λ0, and the transfer formulas are as follows:
MMPP(2)→M + IPP (1)
λ→λ1 (2)

Electronics 2021, 10, 3143 5 of 14
λ0→λ1 + λ2 (3)
r1→(1 − pa), r2→(1 − pb) (4)
In the formula, λ represents the data packet arrival rate when MMPP(2) is in onestate; λ0 represents the data packet arrival rate when the MMPP(2) is in two states; r1represents the second-order Markov probability of the transition from state 1 to state twoin the Poisson modulation process; r2 represents the probability of transition from statetwo to state one in MMPP(2).
It can be seen that the infinitesimal generating matrix of the Markov chain in MMPP(2)is Q, and the strength matrix of the Poisson process is R. Then, the stable probabilitydistribution Π of the Markov chain is as follows:
Q =
∣∣∣∣ −r1 r1r2 −r2
∣∣∣∣, R =
∣∣∣∣ λ1 00 λ2
∣∣∣∣ (5)
Π = (π1, π2) =1
r1 + r2(r2, r1) (6)
The average reaching rate of MMPP(2), that is, the arrival rate of mixed service datapackets, is as follows:
λ =r2λ1 + r1λ0
(r1 + r2)=
r2λ1 + r1(λ1 + λ2)
(r1 + r2)(7)
3.2. Active Cache Management Mechanism
In terms of packet loss rate, the random early detection (RED) algorithm managespacket loss by taking packet loss actions in advance. Setting the buffer threshold, whenthe number of data packets exceeds the threshold, data packets are randomly discardedto ensure communication efficiency. Still, the packet loss rate will gradually increase, asshown in Figure 3. The packet loss rate mainly affects QoS indicators. Considering thecontinuous improvement of QoS requirements for power communication services in smartparks, an active management mechanism for hybrid service aggregation node buffers isproposed to effectively reduce the packet loss rate and meet the QoS indicator requirements.
Electronics 2021, 10, x FOR PEER REVIEW 6 of 15
discard
data flow
actively discard with probability P
maximum cache n
queue
forward
cache thresholdƳ1
1
Ƴ1 n
sudden service packet loss rate
periodic business packet loss rate
Ƴ2 cache queue length
prob
ability of packet loss
Figure 3. Active cache management mechanism of sink node for mixed services.
In Figure 3, a first-in-first-out (FIFO) single-server queuing system is shown. Two
types of heterogeneous packets share the same buffer, and the maximum buffer packet
length is n. The two types of packet data flow thresholds are represented by γ1 and γ2. The
sudden business flow is simulated by the IPP, and the periodic business flow is affected
by the traditional Poisson process. When the number of data packets in the system exceeds
the set threshold γ, the incoming data packets will be queued in the data buffer for for-
warding. When the number of data packets in the system exceeds the threshold but does
not exceed the maximum packet buffer length n, the system will actively randomly dis-
card the data packets with probability )1( ip , and packet loss will begin to occur, where
)( nii represents the number of data packets in the system. When the number of
data packets in the system exceeds the maximum packet buffer length n, the incoming
data packets will not be queued and directly discarded.
3.3. Performance Index Analysis and QoS Parameter Mapping Model
Related studies have analyzed the M/m/c model and MMPP/m/c model with specific
analytical expressions. The authors of [20] compared the average queue length and aver-
age waiting time of the two models by setting the same number of service desks and av-
erage arrival rate. It was found that when the MMPP contains fewer states, there is no
noticeable difference in the queue length and waiting time between the two. Therefore,
we can use the MMPP to accurately simulate the arrival process of mixed service packets
and calculate the data packet arrival rate of the composite service flow. The mapping of
packet loss rate and delay of communication services in the MMPP/m/c queuing model
can be replaced by the calculation formulas of average queue length and average waiting
time in the M/m/c queuing model, simplifying the calculation difficulty.
Relevant studies have shown that the M/m/c system has higher service efficiency and
shorter queue length compared to multiple M/m/1 systems. In this study, combined with
the proposed active queue management mechanism, the RED algorithm was used to man-
age the packet loss problem. Multiple edge IoT gateways with the same forwarding rate
were set up to forward the array packet queue, and a mixed service data queuing model
was established. The M/m/c infinite buffer model was used to derive the M/m/c/n perfor-
mance index of the finite queue length according to Formulas (8)–(15):
The state transition probability formula is as follows:
Figure 3. Active cache management mechanism of sink node for mixed services.
In Figure 3, a first-in-first-out (FIFO) single-server queuing system is shown. Twotypes of heterogeneous packets share the same buffer, and the maximum buffer packetlength is n. The two types of packet data flow thresholds are represented by γ1 and γ2. Thesudden business flow is simulated by the IPP, and the periodic business flow is affected by
Electronics 2021, 10, 3143 6 of 14
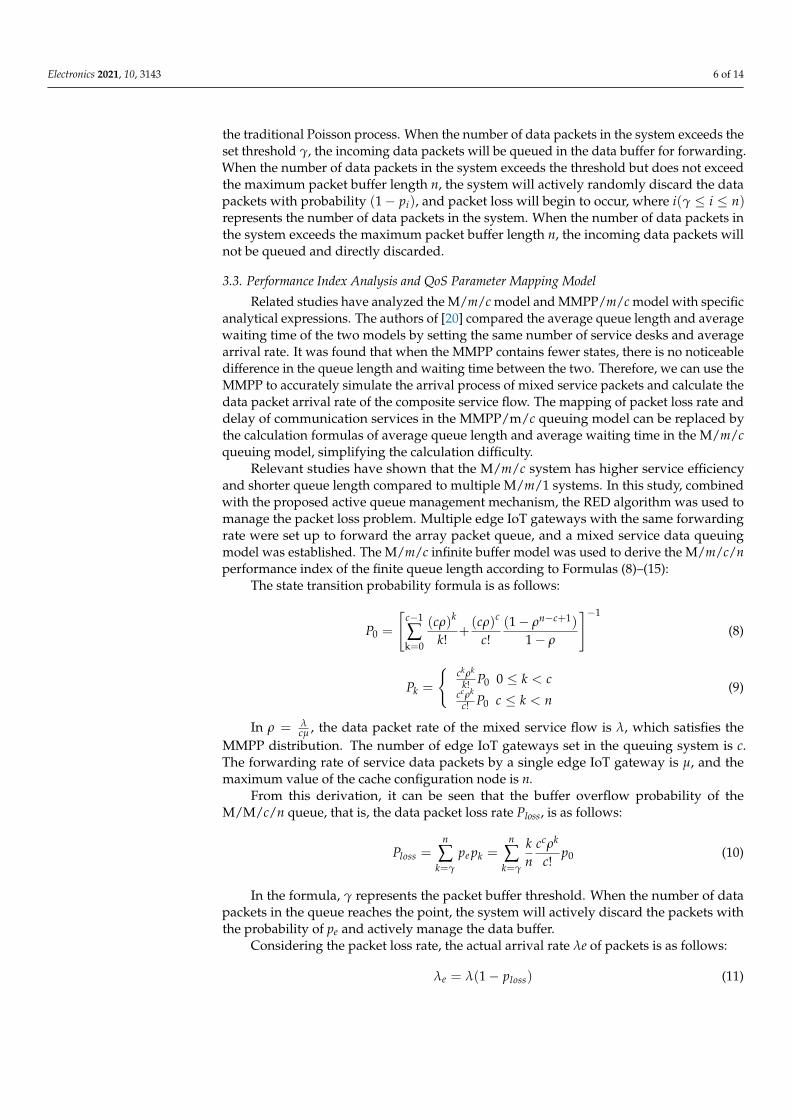
the traditional Poisson process. When the number of data packets in the system exceeds theset threshold γ, the incoming data packets will be queued in the data buffer for forwarding.When the number of data packets in the system exceeds the threshold but does not exceedthe maximum packet buffer length n, the system will actively randomly discard the datapackets with probability (1− pi), and packet loss will begin to occur, where i(γ ≤ i ≤ n)represents the number of data packets in the system. When the number of data packets inthe system exceeds the maximum packet buffer length n, the incoming data packets willnot be queued and directly discarded.
3.3. Performance Index Analysis and QoS Parameter Mapping Model
Related studies have analyzed the M/m/c model and MMPP/m/c model with specificanalytical expressions. The authors of [20] compared the average queue length and averagewaiting time of the two models by setting the same number of service desks and averagearrival rate. It was found that when the MMPP contains fewer states, there is no noticeabledifference in the queue length and waiting time between the two. Therefore, we can use theMMPP to accurately simulate the arrival process of mixed service packets and calculate thedata packet arrival rate of the composite service flow. The mapping of packet loss rate anddelay of communication services in the MMPP/m/c queuing model can be replaced bythe calculation formulas of average queue length and average waiting time in the M/m/cqueuing model, simplifying the calculation difficulty.
Relevant studies have shown that the M/m/c system has higher service efficiencyand shorter queue length compared to multiple M/m/1 systems. In this study, combinedwith the proposed active queue management mechanism, the RED algorithm was used tomanage the packet loss problem. Multiple edge IoT gateways with the same forwardingrate were set up to forward the array packet queue, and a mixed service data queuingmodel was established. The M/m/c infinite buffer model was used to derive the M/m/c/nperformance index of the finite queue length according to Formulas (8)–(15):
The state transition probability formula is as follows:
P0 =
[c−1
∑k=0
(cρ)k
k!+(cρ)c
c!(1− ρn−c+1)
1− ρ
]−1
(8)
Pk =
{ckρk
k! P0 0 ≤ k < cccρk
c! P0 c ≤ k < n(9)
In ρ = λcµ , the data packet rate of the mixed service flow is λ, which satisfies the
MMPP distribution. The number of edge IoT gateways set in the queuing system is c.The forwarding rate of service data packets by a single edge IoT gateway is µ, and themaximum value of the cache configuration node is n.
From this derivation, it can be seen that the buffer overflow probability of theM/M/c/n queue, that is, the data packet loss rate Ploss, is as follows:
Ploss =n
∑k=γ
pe pk =n
∑k=γ
kn
ccρk
c!p0 (10)
In the formula, γ represents the packet buffer threshold. When the number of datapackets in the queue reaches the point, the system will actively discard the packets withthe probability of pe and actively manage the data buffer.
Considering the packet loss rate, the actual arrival rate λe of packets is as follows:
λe = λ(1− ploss) (11)

Electronics 2021, 10, 3143 7 of 14
The average data queue waiting for the captain Ls is as follows:
Ls = Lq + c−c−1
∑k=0
(c− k)pk (12)
where Lq is as follows:
Lq =n∑
k=c(k− c)pk
= ccρc+1 p0
c!(1−ρ)2 [1− (n− c + 1)ρn−c + (n− c)ρn−c+1](13)
The average queuing time Ws in the system and the delay Ts is as follows:
Ts =Ls
λe(14)
The system utilization rate η is as follows:
η =λe
cµ(15)
3.4. Solution of Bandwidth Prediction Model for Power Distribution Communication Service
The M/M/c/n queuing theory model is based on the constructed mixed service dataflow, among the communication service QoS indicators. These parameters best reflectthe communication quality of the intelligent power distribution service, including delay,packet loss rate, and bandwidth utilization. It can be seen from Formulas (10)–(15) thatthe packet delay TS of the mixed service, the composite service data loss rate Ploss, and thesystem bandwidth utilization rate η are functions of the service data forwarding rate µ.
In this study, energy monitoring services was taken as an example to construct aqueuing theory smart park service communication bandwidth optimization model thattakes the data loss rate and delays in the QoS indicators of the communication serviceas the constraint conditions and maximizes the bandwidth utilization, as the objectiveFunction (16) shows:
maxµ
η = λecµ
s.t. Ploss ≤ Closs
Ts ≤ CTs
(16)
In the formula, Closs and CTs represent the minimum value of the packet loss rate anddelay of the service types included in the hybrid service aggregation node.
Therefore, the implementation steps of the optimal bandwidth prediction algorithmfor hybrid power communication services are as follows:
Step 1: Obtain the initial rate of arrival of various periodic service and sudden servicepackets using Formulas (1)–(4) to determine MMPP(2) state transition probability and useFormula (7) to calculate the mixed service achieved rate.
Step 2: Set the constraint conditions Sloss of the periodic service and sudden serviceoptimization models as the minimum packet loss rate of the service, set STs as the minimumdelay of the service, and determine the maximum grouping upper limit of the aggregationnode buffer as [STs*nmax].
Step 3: Set the value range and sampling interval of the predicted bandwidth and setthe cache group variable k = 1.
Step 4: Use the enumeration method to obtain the given cache grouping variable (k = i)and use the nonlinear programming algorithm to obtain the bandwidth utilization ratioηi of the periodic service and sudden service under the condition of Sloss and STs as theconstraints of the corresponding forwarding rate of the predicted bandwidth µi.

Electronics 2021, 10, 3143 8 of 14
Step 5: Set the bandwidth utilization rate ηi of the periodic service and the suddenservice to the bandwidth utilization rate of the sink node when the corresponding cachepacket is i and set the corresponding sink node forwarding rate, that is, the expectedbandwidth µi to the predicted bandwidth.
Step 6: Update the sink node cache group variable k = k + 1. If k is less than the sinknode cache maximum packet upper limit [STs*nmax], go to step 4; otherwise, go to step 7.
Step 7: Calculate the optimal solution of the model η = max{ηi) and its correspondingforwarding rate µi of the sink node, which is recorded as the primary predicted bandwidthvalue of the service section.
4. Analysis of Calculation Examples of Communication Service Bandwidth Prediction
First of all, the quantitative relationship between the communication service qualityindex and the predicted bandwidth was analyzed based on the queuing theory for powercommunication business in smart parks to verify the reliability of the bandwidth predictionmodel proposed in this article. Then, using the smart power distribution room in smartparks as an application scenario, based on relevant data, the communication servicebandwidth was predicted and compared with the traditional elasticity coefficient methodto verify the superiority and reliability of the smart power distribution communicationbandwidth prediction method proposed in this paper.
4.1. Reliability Experiment and Analysis of Bandwidth Prediction Model
Using the complete enumeration method to find the buffered packets (n = i), therelationship between QoS index parameters, such as data delay, packet loss rate, bandwidthutilization, etc., and the forwarding rate was analyzed, as shown in Figures 4–6. Thedynamic link between QoS index parameters and bandwidth prediction was analyzed. Forthe convenience of observation, the bandwidth utilization corresponding to the bandwidthconfiguration of the node that cannot meet the communication QoS index was set to 0, asshown in Figures 4–6.
Electronics 2021, 10, x FOR PEER REVIEW 9 of 15
bandwidth was predicted and compared with the traditional elasticity coefficient method
to verify the superiority and reliability of the smart power distribution communication
bandwidth prediction method proposed in this paper.
4.1. Reliability Experiment and Analysis of Bandwidth Prediction Model
Using the complete enumeration method to find the buffered packets (n = i), the re-
lationship between QoS index parameters, such as data delay, packet loss rate, bandwidth
utilization, etc., and the forwarding rate was analyzed, as shown in Figures 4–6. The dy-
namic link between QoS index parameters and bandwidth prediction was analyzed. For
the convenience of observation, the bandwidth utilization corresponding to the band-
width configuration of the node that cannot meet the communication QoS index was set
to 0, as shown in Figures 4–6.
Delay performance analysis of queuing system
Del
ay
Maximum cache(a.u)Predicted bandwidth(μ kbit/s)
Figure 4. Delay performance analysis of queuing system.
From the analysis in Figure 4, it can be seen that when the node bandwidth is config-
ured as a fixed value, the larger the number of system cache queues and the higher the
system data delay. When the number of cache queues in the system is a fixed value, the
larger the node bandwidth configuration and the lower the data delay. At the same time,
as the number of node caches continues to increase, the impact of node bandwidth on
system latency becomes more apparent.
Performance analysis of packet loss rate in queuing system
Pac
ket
lo
ss r
ate
Maximum cache(a.u)Predicted bandwidth(μ kbit/s)
Figure 5. Performance analysis of packet loss rate in the queuing system.
Figure 4. Delay performance analysis of queuing system.

Electronics 2021, 10, 3143 9 of 14
Electronics 2021, 10, x FOR PEER REVIEW 9 of 15
bandwidth was predicted and compared with the traditional elasticity coefficient method
to verify the superiority and reliability of the smart power distribution communication
bandwidth prediction method proposed in this paper.
4.1. Reliability Experiment and Analysis of Bandwidth Prediction Model
Using the complete enumeration method to find the buffered packets (n = i), the re-
lationship between QoS index parameters, such as data delay, packet loss rate, bandwidth
utilization, etc., and the forwarding rate was analyzed, as shown in Figures 4–6. The dy-
namic link between QoS index parameters and bandwidth prediction was analyzed. For
the convenience of observation, the bandwidth utilization corresponding to the band-
width configuration of the node that cannot meet the communication QoS index was set
to 0, as shown in Figures 4–6.
Delay performance analysis of queuing system
Del
ay
Maximum cache(a.u)Predicted bandwidth(μ kbit/s)
Figure 4. Delay performance analysis of queuing system.
From the analysis in Figure 4, it can be seen that when the node bandwidth is config-
ured as a fixed value, the larger the number of system cache queues and the higher the
system data delay. When the number of cache queues in the system is a fixed value, the
larger the node bandwidth configuration and the lower the data delay. At the same time,
as the number of node caches continues to increase, the impact of node bandwidth on
system latency becomes more apparent.
Performance analysis of packet loss rate in queuing system
Pac
ket
lo
ss r
ate
Maximum cache(a.u)Predicted bandwidth(μ kbit/s)
Figure 5. Performance analysis of packet loss rate in the queuing system. Figure 5. Performance analysis of packet loss rate in the queuing system.
Electronics 2021, 10, x FOR PEER REVIEW 10 of 15
It can be seen from the analysis in Figure 5 that when the system buffer packet length remains the same, the system data packet loss rate keeps decreasing as the node band-width configuration increases. When the node bandwidth is configured as a fixed value, the system buffer packet length continues to increase, and the system data packet loss rate continues to decrease. At the same time, when the system buffer packet length is low, the node bandwidth configuration has a more noticeable impact on the system data packet loss rate.
Performance analysis of bandwidth utilization in queuing system
Band
wid
th u
tiliz
atio
n(%
)
Maximum cache(a.u) Predicted bandwidth(μ kbit/s)
Figure 6. Performance analysis of bandwidth utilization in the queuing system.
It can be seen from the analysis in Figure 6 that when the system cache packet length is a fixed value, the node bandwidth utilization rate is inversely proportional to the node bandwidth configuration. When the node bandwidth is configured as a fixed value, the change of the system buffer packet length has little effect on the system bandwidth utili-zation.
From the above analysis, the following observations can be made: (1) If you need to meet the communication QoS indicators of each business, you need to configure a certain system buffer packet length and node bandwidth. (2) When the system buffer packet length is reasonably configured, with the increase in node communication bandwidth, the communication QoS performance, such as system delay and system packet loss rate, will continue to improve and the service quality of power communication services will be en-hanced. However, an over-configured node bandwidth will affect the system bandwidth utilization and cause waste of communication resources. (3) When a specific node band-width is configured, with the continuous increase in the system buffer packet length, the system packet loss rate gradually decreases, but the system delay will increase. This means that an appropriate increase in the system buffer packet length will improve the accuracy performance (packet loss rate) of the power communication service but will sac-rifice part of the real-time performance (delay).
4.2. Example Analysis of Bandwidth Prediction Optimization Model To verify the bandwidth prediction model for smart power distribution and commu-
nication services proposed in this article, a smart power distribution room in a smart park demonstration project was selected as an application scenario. Various data types, such as environmental monitoring, equipment status, and energy consumption information collection, were connected to different communication interfaces through other commu-nication methods, and the edge IoT gateway was entered to queue for forwarding. At the same time, parameters such as the basic flow of power communication services in the
Figure 6. Performance analysis of bandwidth utilization in the queuing system.
From the analysis in Figure 4, it can be seen that when the node bandwidth is config-ured as a fixed value, the larger the number of system cache queues and the higher thesystem data delay. When the number of cache queues in the system is a fixed value, thelarger the node bandwidth configuration and the lower the data delay. At the same time, asthe number of node caches continues to increase, the impact of node bandwidth on systemlatency becomes more apparent.
It can be seen from the analysis in Figure 5 that when the system buffer packet lengthremains the same, the system data packet loss rate keeps decreasing as the node bandwidthconfiguration increases. When the node bandwidth is configured as a fixed value, thesystem buffer packet length continues to increase, and the system data packet loss ratecontinues to decrease. At the same time, when the system buffer packet length is low, thenode bandwidth configuration has a more noticeable impact on the system data packetloss rate.
It can be seen from the analysis in Figure 6 that when the system cache packet length isa fixed value, the node bandwidth utilization rate is inversely proportional to the node band-width configuration. When the node bandwidth is configured as a fixed value, the changeof the system buffer packet length has little effect on the system bandwidth utilization.
From the above analysis, the following observations can be made: (1) If you need tomeet the communication QoS indicators of each business, you need to configure a certainsystem buffer packet length and node bandwidth. (2) When the system buffer packet

Electronics 2021, 10, 3143 10 of 14
length is reasonably configured, with the increase in node communication bandwidth,the communication QoS performance, such as system delay and system packet loss rate,will continue to improve and the service quality of power communication services will beenhanced. However, an over-configured node bandwidth will affect the system bandwidthutilization and cause waste of communication resources. (3) When a specific node band-width is configured, with the continuous increase in the system buffer packet length, thesystem packet loss rate gradually decreases, but the system delay will increase. This meansthat an appropriate increase in the system buffer packet length will improve the accuracyperformance (packet loss rate) of the power communication service but will sacrifice partof the real-time performance (delay).
4.2. Example Analysis of Bandwidth Prediction Optimization Model
To verify the bandwidth prediction model for smart power distribution and commu-nication services proposed in this article, a smart power distribution room in a smart parkdemonstration project was selected as an application scenario. Various data types, such asenvironmental monitoring, equipment status, and energy consumption information collec-tion, were connected to different communication interfaces through other communicationmethods, and the edge IoT gateway was entered to queue for forwarding. At the sametime, parameters such as the basic flow of power communication services in the smartpower distribution room and the number of smart terminals were given, the bandwidthrequired for communication services of the smart power distribution room in the smartpark was analyzed, and the predicted bandwidth was obtained. According to the type ofintelligent terminal configuration of the power distribution room, the power distributionroom was divided into four types, which were marked as 1©– 4© and used to verify therelationship between the predicted bandwidth value and the size of the communicationservice traffic in the power distribution room. Video monitoring equipment was connectedto the edge IoT gateway by optical fiber, and the rest of the device data was connected tothe edge IoT gateway by WiFi, LoRa, bus, 4G/5G wireless public network, and the servicesincluded in various types of power distribution rooms of the distribution network. Thedetailed configuration table of the types and smart terminal equipment is shown in Table 2.
Table 2. The actual configuration of four types of intelligent distribution rooms in a smart park.
Business Type Equipment Type Basic BusinessFlow(kbit/s)
Configuration Quantity of Each Type ofPower Distribution Room/Piece
Suddenservices
periodicservice 1© 2© 3© 4©
Distributed powersupply business
Distributed power control equipment 12 80 2 3 1 1Distributed power supply access metering equipment 20 90 1 2 2 2
Power quality testing equipment 15 50 2 3 2 2
Energy consumptionmonitoring business
Smart meter 1 3 450 300 250 300Environmental monitoring equipment 20 80 2 1 2 3
Energy storage station monitoring equipment 30 60 2 1 3 2Equipment operating condition monitoring equipment 25 120 2 1 2 2
Energy control business Distribution automation equipment 12 60 1 2 1 2Electricity load demand side response equipment 15 50 1 2 2 3
Video surveillancebusiness
Energy storage field video monitoring equipment 200 1800 1 1 2 3Intelligent building monitoring equipment 300 1500 1 1 2 2
The main parameter settings of the experiment were as follows: (1) The number ofedge IoT gateways in the four types of power distribution rooms was set to 4, that is, thevalue of c in the queuing system was 4. (2) The maximum number of cached data packets kat the edge IoT gateway was taken as λ•CTs (rounded down). The data packet size wastaken as 512 bytes. (3) The communication service quality index QoS was taken as the moststringent condition in the intelligent power distribution business, in which CTs was takenas 0.03 and Closs was taken as 0.1%.
According to the intelligent distribution and utilization communication service band-width prediction method proposed in this article, using the corresponding service flow ofvarious services and the arrival rate of sudden services and periodic services, the arrivalrate of the mixed service was calculated using Formula (7), and the arrival rate of thecomposite service was calculated as a composite service packet. The edge IoT gateway

Electronics 2021, 10, 3143 11 of 14
rate is shown in Table 3. According to Formulas (10)–(15), four types of intelligent powerdistribution rooms were used to predict the relationship between the communicationbandwidth and its network performance (bandwidth utilization, delay, and packet lossrate), as shown in Figures 7–9. The curve segment where the bandwidth utilization rateis 0 indicates that the predicted communication bandwidth failed to meet the delay andpacket loss rate requirements.
Table 3. The arrival rate of communication mixed services in the intelligent power distribution room.
Power DistributionRoom Type
Sudden ServiceArrival Rate
Periodic ServiceArrival Rate
Mixed ServicePacket Arrival Rate
1© 1.17 Mbit/s 6.74 Mbit/s 7.09 Mbit/s2© 1.03 Mbit/s 5.13 Mbit/s 5.40 Mbit/s3© 1.95 Mbit/s 8.25 Mbit/s 4.43 Mbit/s4© 1.76 Mbit/s 10.28 Mbit/s 1.17 Mbit/s
Electronics 2021, 10, x FOR PEER REVIEW 12 of 15
0 indicates that the predicted communication bandwidth failed to meet the delay and
packet loss rate requirements.
Table 3. The arrival rate of communication mixed services in the intelligent power distribution
room.
Power Distribution
Room Type
Sudden Service
Arrival Rate
Periodic Service
Arrival Rate
Mixed Service Packet
Arrival Rate
① 1.17 Mbit/s 6.74 Mbit/s 7.09 Mbit/s
② 1.03 Mbit/s 5.13 Mbit/s 5.40 Mbit/s
③ 1.95 Mbit/s 8.25 Mbit/s 4.43 Mbit/s
④ 1.76 Mbit/s 10.28 Mbit/s 1.17 Mbit/s
Figure 7. Curve between bandwidth utilization and predicted bandwidth.
Figure 8. Curve between packet loss rate and predicted bandwidth.
Figure 9. Curve between queuing delay and predicted bandwidth.
Figure 7. Curve between bandwidth utilization and predicted bandwidth.
Electronics 2021, 10, x FOR PEER REVIEW 12 of 15
0 indicates that the predicted communication bandwidth failed to meet the delay and
packet loss rate requirements.
Table 3. The arrival rate of communication mixed services in the intelligent power distribution
room.
Power Distribution
Room Type
Sudden Service
Arrival Rate
Periodic Service
Arrival Rate
Mixed Service Packet
Arrival Rate
① 1.17 Mbit/s 6.74 Mbit/s 7.09 Mbit/s
② 1.03 Mbit/s 5.13 Mbit/s 5.40 Mbit/s
③ 1.95 Mbit/s 8.25 Mbit/s 4.43 Mbit/s
④ 1.76 Mbit/s 10.28 Mbit/s 1.17 Mbit/s
Figure 7. Curve between bandwidth utilization and predicted bandwidth.
Figure 8. Curve between packet loss rate and predicted bandwidth.
Figure 9. Curve between queuing delay and predicted bandwidth.
Figure 8. Curve between packet loss rate and predicted bandwidth.

Electronics 2021, 10, 3143 12 of 14
Electronics 2021, 10, x FOR PEER REVIEW 12 of 15
0 indicates that the predicted communication bandwidth failed to meet the delay and
packet loss rate requirements.
Table 3. The arrival rate of communication mixed services in the intelligent power distribution
room.
Power Distribution
Room Type
Sudden Service
Arrival Rate
Periodic Service
Arrival Rate
Mixed Service Packet
Arrival Rate
① 1.17 Mbit/s 6.74 Mbit/s 7.09 Mbit/s
② 1.03 Mbit/s 5.13 Mbit/s 5.40 Mbit/s
③ 1.95 Mbit/s 8.25 Mbit/s 4.43 Mbit/s
④ 1.76 Mbit/s 10.28 Mbit/s 1.17 Mbit/s
Figure 7. Curve between bandwidth utilization and predicted bandwidth.
Figure 8. Curve between packet loss rate and predicted bandwidth.
Figure 9. Curve between queuing delay and predicted bandwidth. Figure 9. Curve between queuing delay and predicted bandwidth.
From the figure, the following observations can be made:(1) On the premise of meeting the basic requirements of mixed service data transmis-
sion bandwidth, as the node bandwidth gradually increases, the network delay and packetloss rate decrease progressively, and the system utilization rate also gradually decreases.When the demand for power distribution and communication services in the smart parkis great and the QoS requirements are high, the QoS indicators of the service can be im-proved by appropriately increasing the bandwidth configuration of the aggregation nodeto ensure normal and safe operation of the power distribution and communication servicesin the smart park. However, blindly increasing the bandwidth will lead to a decrease inbandwidth utilization, resulting in a waste of communication resources.
(2) The predicted bandwidth of different types of power distribution rooms in thesmart park is related to the actual configuration of the power distribution room. The higherthe power distribution room (the greater the amount of communication service access),the greater the predicted bandwidth value. When the bandwidth is configured below thecritical bandwidth, the communication service quality indicators of the communicationservices accessed in the distribution network will not be met.
(3) As shown in Figure 8, with the continuous improvement of bandwidth configura-tion, the packet loss rate first drops slowly and then decreases rapidly, which is caused bytaking packet loss actions in advance to manage the packet loss problem. The optimizedpacket loss rate calculation method is more suitable for processing data packets in actualrouting and improves the accuracy of bandwidth prediction.
Table 4 shows the predicted bandwidth of the business section of an intelligent powerdistribution room. In the table, the maximum traffic bandwidth of the mixed businessthrough the power distribution room business section is business traffic×concurrent ratio:0.41 × 100% + 2.41 × 20% + 0.13 × 25% + 3.71 × 10% = 1.3 Mbit/s.
Table 4. Calculation table of communication service bandwidth in the intelligent distribution room.
Business Type BusinessFlow/Mbit/s
ConcurrencyRatio
RedundancyFactor Delay/s Packet Loss
Rate/%
Power distribution operation control business 0.41 100% 2 ≤0.1 ≤0.01Electricity distribution information collection business 2.41 20% 1 ≤2 ≤1
Distributed power business 0.13 25% 1.5 ≤1 ≤5Video surveillance business 3.71 10% 1 ≤3 ≤2
At present, the bandwidth prediction technology commonly used in engineering isthe elastic coefficient method, which is determined by the redundancy coefficient andthe disaster tolerance coefficient, and its maximum theoretical bandwidth utilization
Electronics 2021, 10, 3143 13 of 14
rate is about 66.6%. This method can meet the requirements of power distribution andcommunication services, and the predicted bandwidth is about 1.95 Mbit/s.
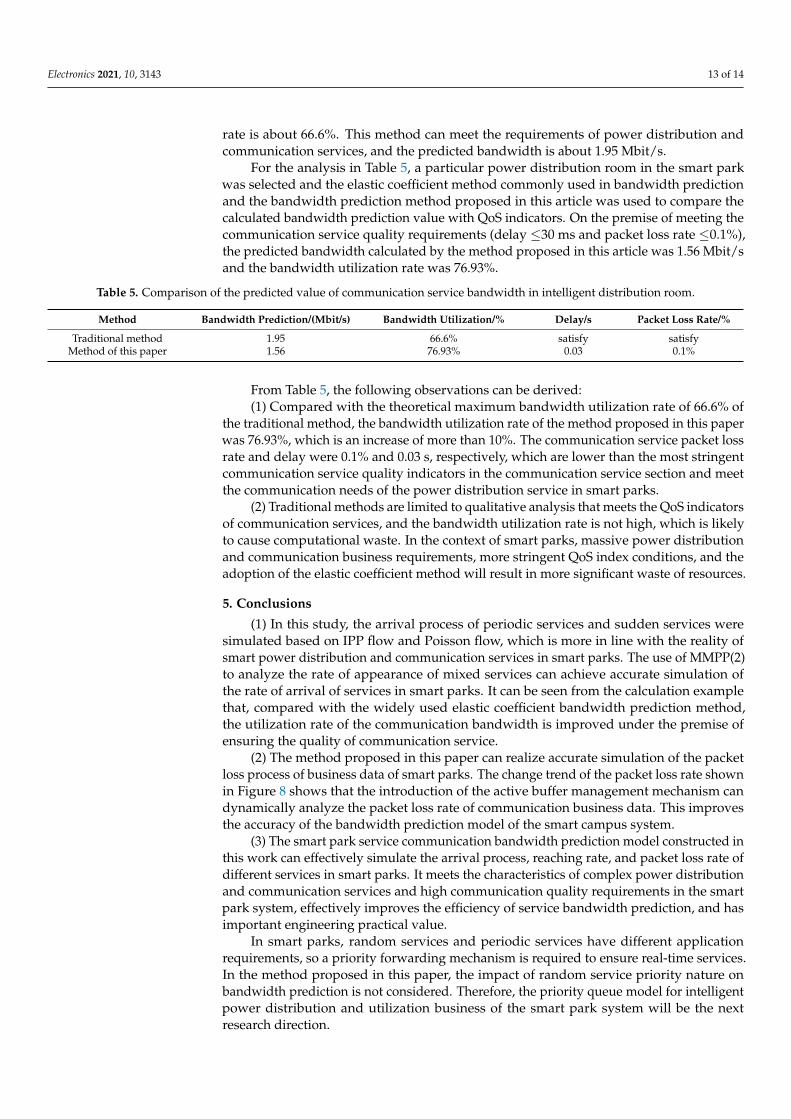
For the analysis in Table 5, a particular power distribution room in the smart parkwas selected and the elastic coefficient method commonly used in bandwidth predictionand the bandwidth prediction method proposed in this article was used to compare thecalculated bandwidth prediction value with QoS indicators. On the premise of meeting thecommunication service quality requirements (delay ≤30 ms and packet loss rate ≤0.1%),the predicted bandwidth calculated by the method proposed in this article was 1.56 Mbit/sand the bandwidth utilization rate was 76.93%.
Table 5. Comparison of the predicted value of communication service bandwidth in intelligent distribution room.
Method Bandwidth Prediction/(Mbit/s) Bandwidth Utilization/% Delay/s Packet Loss Rate/%
Traditional method 1.95 66.6% satisfy satisfyMethod of this paper 1.56 76.93% 0.03 0.1%
From Table 5, the following observations can be derived:(1) Compared with the theoretical maximum bandwidth utilization rate of 66.6% of
the traditional method, the bandwidth utilization rate of the method proposed in this paperwas 76.93%, which is an increase of more than 10%. The communication service packet lossrate and delay were 0.1% and 0.03 s, respectively, which are lower than the most stringentcommunication service quality indicators in the communication service section and meetthe communication needs of the power distribution service in smart parks.
(2) Traditional methods are limited to qualitative analysis that meets the QoS indicatorsof communication services, and the bandwidth utilization rate is not high, which is likelyto cause computational waste. In the context of smart parks, massive power distributionand communication business requirements, more stringent QoS index conditions, and theadoption of the elastic coefficient method will result in more significant waste of resources.
5. Conclusions
(1) In this study, the arrival process of periodic services and sudden services weresimulated based on IPP flow and Poisson flow, which is more in line with the reality ofsmart power distribution and communication services in smart parks. The use of MMPP(2)to analyze the rate of appearance of mixed services can achieve accurate simulation ofthe rate of arrival of services in smart parks. It can be seen from the calculation examplethat, compared with the widely used elastic coefficient bandwidth prediction method,the utilization rate of the communication bandwidth is improved under the premise ofensuring the quality of communication service.
(2) The method proposed in this paper can realize accurate simulation of the packetloss process of business data of smart parks. The change trend of the packet loss rate shownin Figure 8 shows that the introduction of the active buffer management mechanism candynamically analyze the packet loss rate of communication business data. This improvesthe accuracy of the bandwidth prediction model of the smart campus system.
(3) The smart park service communication bandwidth prediction model constructed inthis work can effectively simulate the arrival process, reaching rate, and packet loss rate ofdifferent services in smart parks. It meets the characteristics of complex power distributionand communication services and high communication quality requirements in the smartpark system, effectively improves the efficiency of service bandwidth prediction, and hasimportant engineering practical value.
In smart parks, random services and periodic services have different applicationrequirements, so a priority forwarding mechanism is required to ensure real-time services.In the method proposed in this paper, the impact of random service priority nature onbandwidth prediction is not considered. Therefore, the priority queue model for intelligentpower distribution and utilization business of the smart park system will be the nextresearch direction.

Electronics 2021, 10, 3143 14 of 14
Author Contributions: Conceptualization, X.Z. and J.L.; methodology, X.X. and J.L.; software,X.Z. and C.B.; validation, J.L., X.Z. and L.W.; formal analysis, X.Z., F.X.; investigation, L.W. andX.X.; resources, X.X., F.X.; data curation, J.L.; writing—original draft preparation, X.Z. and J.L.;writing—review and editing, X.Z. and X.X.; visualization, J.L., F.X.; supervision, X.Z., F.X.; fundingacquisition, X.Z. All authors have read and agreed to the published version of the manuscript.
Funding: This research was funded by the National Natural Science Foundation of China, grantnumber 62022044; the Key Program of National Natural Science Foundation of China, grant number61933005; and the Natural Science Foundation of Nanjing University of Posts and Telecommunica-tions, grant number NY219094.
Data Availability Statement: Data is contained within the article.
Conflicts of Interest: The authors declare no conflict of interest.
References1. Quelhas, A.; Gil, E.; Mccalley, J.D.; Ryan, S.M. A multiperiod generalized network flow model of the U.S. integrated energy
system: Part I—model description. IEEE Trans. Power Syst. 2007, 22, 829–836. [CrossRef]2. Colak, I.; Sagiroglu, S.; Fulli, G.; Yesilbudak, M. A survey on the critical issues in smart grid technologies. Renew. Sustain. Energy
Rev. 2016, 54, 396–405. [CrossRef]3. Quelhas, A.; McAlley, J.D. A Multiperiod Generalized Network Flow Model of the U.S. Integrated Energy System:
Part II—Simulation Results. IEEE Trans. Power Syst. 2007, 22, 837–844. [CrossRef]4. Giannopoulos, G.; Galbusera, L.; Theodoridis, G. Intelligent Energy Systems: Introducing Power-ICT Interdependency in
Modeling and Control Design. IEEE Trans. Ind. Electron. 2015, 62, 2468–2477.5. Bedi, G.; Venayagamoorthy, G.K.; Singh, R.; Brooks, R.; Wang, K.C. Review of internet of things (iot) in electric power and energy
systems. IEEE Internet Things J. 2018, 5, 847–870. [CrossRef]6. Bahram, S.; Amjad, A.M.; Juan, V.; Josep, G. Internet of things for modern energy systems: State-of-the-art, challenges, and open
issues. Energies 2018, 11, 1252.7. Huang, J. OPNET Modeler Manages Utilization, Guarantees Quality of Service for Wireless Networks. IEEE Commun. Mag. 2000,
1, 12–22.8. Wu, J.; Yang, C.; Chen, B. Proactive Caching and Bandwidth Allocation in Heterogenous Networks by Learning from Historical
Numbers of Requests. IEEE Trans. Commun. 2020, 68, 4394–4410. [CrossRef]9. Wu, G. Application of adaptive resource allocation algorithm and communication network security in improving educational
video transmission quality. Alex. Eng. J. 2021, 60, 4231–4241.10. Wang, Y.J.; Shao-Cong, L.I.; Zhang, L. A New Method of Traffic Estimation and Bandwidth Planning of Power Grid Transmission
Network. Telecommun. Electr. Power Syst. 2012, 33, 35–39.11. Xu, Z.; Lu, J.; Li, Z.; Zhu, Y.P. Queue-Theory-Based Service-Section Communication Bandwidth Calculation for Power Distribution
and Utilization of Smart Grid. In Proceedings of the 2015 8th International Conference on Intelligent Networks and IntelligentSystems (ICINIS), Tianjin, China, 1–3 November 2015; pp. 137–140.
12. Lu, J.; Li, Z.; Zhu, Y.P.; Xu, Z.Q. Communication bandwidth prediction for information gathering services in power distributionand utilization of smart grid. Power Syst. Technol. 2016, 40, 1277–1282.
13. Xu, Z.Q.; Lu, J.; Zhai, F.; Chuang, Z.; Gangjun, G. Communication Bandwidth Prediction of Aggregation of Multi-Services forSmart Power Distribution and Utilization. Power Syst. Technol. 2015, 39, 712–716.
14. Chen, S.D.; Chen, X.Q.; Huang, R.; Lu, J.; Wang, K.L. Bandwidth Prediction Method for Power Consumption InformationCollecting Service Based on Mixed-Flow Model. Electr. Power Inf. Commun. Technol. 2018, 16, 39–44.
15. Mei, L.F.; Hu, R.C.; Cao, H.W.; Liu, Y.; Han, Z.; Li, F.; Li, J. Realtime mobile bandwidth prediction using LSTM neural networkand Bayesian fusion. Comput. Netw. 2020, 182, 107515. [CrossRef]
16. Ruan, L.; Dias, M.; Wong, E. Machine Learning-Based Bandwidth Prediction for Low-Latency H2M Applications. IEEE InternetThings J. 2019, 6, 3743–3752. [CrossRef]
17. Ruan, L.; Mondal, S.; Wong, E. Machine Learning Based Bandwidth Prediction in Tactile Heterogeneous Access Networks.In Proceedings of the IEEE Conference on Computer Communications Workshops (INFOCOM WKSHPS), Honolulu, HI, USA,15–19 April 2018; pp. 1–2.
18. Liu, X.J.; Zhang, C.; Liu, Z.Y.; Lu, J. A novel qos bandwidth prediction method for power distribution and utilization grid. Appl.Mech. Mater. 2015, 743, 551–554. [CrossRef]
19. Geleji, G.; Perros, H. Jitter analysis of an IPP tagged traffic stream in an {IPP,M}/M/1 queue. Ann. Telecommun. 2014, 69, 283–294.[CrossRef]
20. Jia, Y.; Zhang, Z.G.; Xu, T. Improving the Performance of MMPP/M/C Queue by Convex Optimization–A Real-World Applicationin Iron and Steel Industry. IEEE Access 2020, 8, 185909–185918. [CrossRef]