Common Fisheries Policy reform A new fleet capacity policy
46
Fødevareøkonomisk Institut Rapport nr. 141 Common Fisheries Policy reform A new fleet capacity policy Erik Lindebo, Hans Frost and Jørgen Løkkegaard København 2002
Transcript of Common Fisheries Policy reform A new fleet capacity policy

Fødevareøkonomisk Institut Rapport nr. 141
Common Fisheries Policy reform A new fleet capacity policy Erik Lindebo, Hans Frost and Jørgen Løkkegaard
2
København 200
2 Common Fisheries Policy reform, FOI

Contents
Acronyms ..................................................................................................................... 5
Foreword....................................................................................................................... 7
Summary....................................................................................................................... 9
1. Fishery management and CFP reform.................................................................. 11
2. Capacity and overcapacity ................................................................................... 15
3. EU fleet policy under MAGP............................................................................... 19 3.1. Capacity measurement................................................................................ 19 3.2. MAGP framework ...................................................................................... 21 3.3. Capacity development ................................................................................ 23 3.4. Critique of fleet policy................................................................................ 26
4. Reforming the Common Fisheries Policy ............................................................ 27 4.1. Introduction ................................................................................................ 27 4.2. Proposed management reforms .................................................................. 27 4.3. Multi-annual management plans ................................................................ 28 4.4. Fleet capacity policy................................................................................... 29 4.5. Scrapping of vessels ................................................................................... 31 4.6. Linking MAGP to new reference levels ..................................................... 32
5. Applying capacity analysis to the peer review process ........................................ 33 5.1. Data Envelopment Analysis ....................................................................... 33 5.2. An economic approach to capacity analysis ............................................... 36
References .................................................................................................................. 43
Common Fisheries Policy reform, FOI 3

4 Common Fisheries Policy reform, FOI

Acronyms
CFP Common Fisheries Policy DEA Data Envelopment Analysis EU European Union FAO Food and Agriculture Organisation of the United Nations FIFG Financial Instrument for Fisheries Guidance GCF Gross Cash Flow GT/GRT Gross Tonnage/Gross Registered Tonnage KW Kilowatts MAGP Multi-Annual Guidance Programme MAMP Multi-Annual Management Plan MEY Maximum Economic Yield MSY Maximum Sustainable Yield STECF Scientific, Technical and Economic Committee for Fisheries TAC Total Allowable Catch
Common Fisheries Policy reform, FOI 5

6 Common Fisheries Policy reform, FOI

Foreword
The issue of fishing capacity has been brought to the forefront of discussions sur-rounding the reform of the Common Fisheries Policy of the European Union. What has become increasingly apparent is the downward trend of many fisheries due to management fallacies and a clear unbalance between fishing fleets and available fish-eries resources. This has led to biological overfishing of many commercial fish stocks and an under-utilisation of fishing capacity of Member State fleets. The European Commission, in their attempt to reverse this trend, has put forward a range of management proposals under the Common Fisheries Policy reform initiative of 2002. Among the proposals include the use of multi-annual management, the re-duction of fishing mortality and the strengthening of capacity controls. This report concentrates on the practical objectives of the proposed management system under the Common Fisheries Policy reform, and the particular instruments proposed for at-taining those objectives. This report specifically aims to establish the linkages between management proposals and the new capacity policy, and to further consider how this capacity policy relates to earlier capacity policies under the multi-annual guidance programme. The report also discusses the global perspective of capacity and overcapacity in fisheries. In this respect the report examines how capacity analysis approaches recommended by, among others, the Food and Agriculture Organisation of the United Nations may as-sist the European Commission in evaluating reductions of fishing mortality and fish-ing capacity in a peer review framework. Finally, the report outlines an economic ap-proach to capacity analysis that, once economic information is consistently available for all Member States, could form the basis of capacity analysis from an economic perspective. Danish Research Institute of Food Economics (FOI) October 2002
Ole P. Kristensen Director, FOI
Common Fisheries Policy reform, FOI 7

8 Common Fisheries Policy reform, FOI

Summary
CHAPTER 1
This chapter outlines the major cornerstones of the CFP reform proposalsthat attempt to deal with management difficulties in EU fisheries. These in-clude the continued dependence of biological fish stock assessment as thebasis for management measures, the lacking opportunity to include eco-nomic objectives and instruments, the absence of specific capacity objec-tives, the consequences of failure to comply with capacity adjustment re-quirements, and the role of the peer review process.
CHAPTER 2 The concepts of fishing capacity and overcapacity are presented, where defi-nitions and approaches to measurement are considered from a global per-spective. The approach of FAO and the International Plan of Action for theManagement of Fishing Capacity is seen as the most appropriate in this con-text. The potential impacts of technological progress and fishery dynamics on fishing capacity measurements are also introduced. Further, the assess-ment of overcapacity is based on specific optimal or target capacity levels applied by fishery managers, which highly depend on multiple biological, economic and social criteria of fishery management.
CHAPTER 3 The EU fleet policy under MAGP is comprehensively discussed, outlining the approach to capacity measurement, the use of vessel decommissioning and fishing activity restrictions, and the role of public aid in capacity ad-justment. The development of fleet capacity on a Member State level is gi-ven with respect to MAGP objectives, showing that the total EU fleet has seen reductions of around 20% in terms of vessel tonnage and engine power during the last decade. At the end of 2001, only Denmark, Spain, Portugal and Finland had met their capacity targets in all fleet segments. A critique of the fleet policy involves the modest reductions and continued fish stock overexploitation, explicitly linked to the lack of measurement transparency, complex fleet segmentation, amendment of objectives, and modest targets for cutbacks in fishing mortality.
Common Fisheries Policy reform, FOI 9

CHAPTER 4 The CFP reform proposals are examined. The reform mainly concerns the adoption of multi-annual management plans (MAMPs) and a continuation of technical measures, incorporating objectives of fishing mortality reduction and fixing catch and effort limits to ensure the long-term sustainability of fish stocks. MAMPs will set specific biological targets against which the re-covery of stocks can be measured (e.g. population size, long-term yields). The direct consequences of reductions in fishing opportunities are dealt with under a new policy approach to fleet capacity, which explicitly imposes re-strictions on the use of public aid for fleet renewal and modernisation and establishes new reference levels for Member State fleet capacity based on MAGP objectives. An emergency measure for vessel scrapping is examined, which intends to address the more immediate difficulties experienced by vessel owners who are severely impacted by reductions in fishing opportuni-ties. This aims to encourage rapid fleet adjustment in areas where fish stocks are outside safe biological limits during the 2003-06 period.
CHAPTER 5 This chapter links two feasible approaches to capacity analysis with the pro-posal to introduce a peer review process for monitoring the progress in fish-ing mortality and fishing capacity reductions. Following the recommenda-tions of FAO, the use of Data Envelopment Analysis is outlined, an ap-proach that builds on traditional efficiency analysis and relatively modest data requirements. The approach helps to assess the potential fishing capac-ity, or potential production output, for given level of inputs (e.g. vessel ton-nage, days at sea, etc.) with constant fish stocks. The difference between po-tential output of ‘best practice’ vessels and a vessel’s current observable output serves as an indicator of the level of overcapacity. A simple and ro-bust economic approach to capacity analysis is also presented. This builds on the use of economic indicators sourced from the Annual Economic Re-port for European fisheries, which can be applied to define Break Even re-venue estimations. These estimations help to identify capacity levels in a bio-economic framework that relate to economic sustainability and overca-pacity respectively. Economic sustainability relates to the situation where only invested capital and labour are remunerated, while overcapacity also takes account of the remuneration of fish stocks. The method implies that a fleet segment can be economically sustainable even though there is overca-pacity. In this respect the method highlights the difference between the ob-jectives of fishers and those of society.
10 Common Fisheries Policy reform, FOI
1. Fishery management and CFP reform
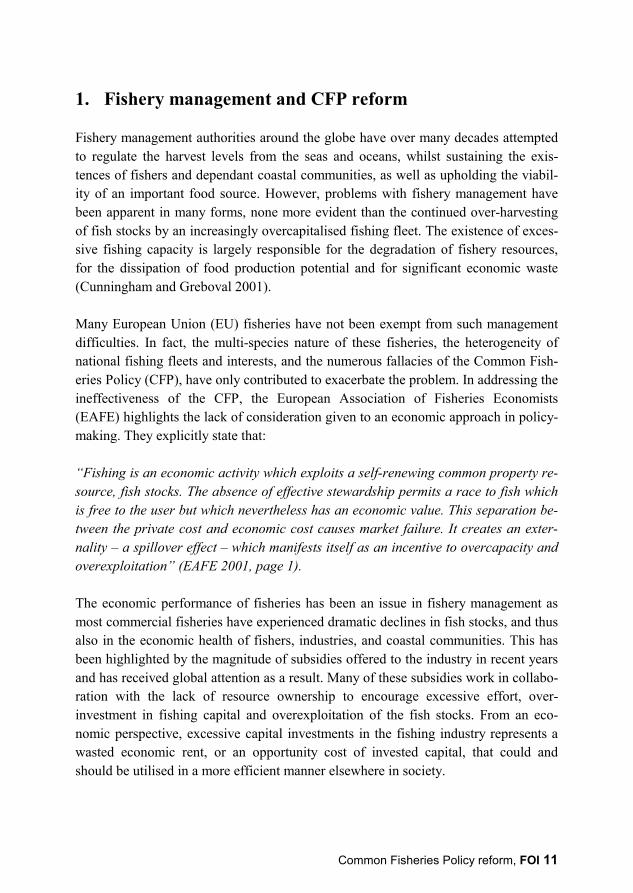
Fishery management authorities around the globe have over many decades attempted to regulate the harvest levels from the seas and oceans, whilst sustaining the exis-tences of fishers and dependant coastal communities, as well as upholding the viabil-ity of an important food source. However, problems with fishery management have been apparent in many forms, none more evident than the continued over-harvesting of fish stocks by an increasingly overcapitalised fishing fleet. The existence of exces-sive fishing capacity is largely responsible for the degradation of fishery resources, for the dissipation of food production potential and for significant economic waste (Cunningham and Greboval 2001). Many European Union (EU) fisheries have not been exempt from such management difficulties. In fact, the multi-species nature of these fisheries, the heterogeneity of national fishing fleets and interests, and the numerous fallacies of the Common Fish-eries Policy (CFP), have only contributed to exacerbate the problem. In addressing the ineffectiveness of the CFP, the European Association of Fisheries Economists (EAFE) highlights the lack of consideration given to an economic approach in policy-making. They explicitly state that: “Fishing is an economic activity which exploits a self-renewing common property re-source, fish stocks. The absence of effective stewardship permits a race to fish which is free to the user but which nevertheless has an economic value. This separation be-tween the private cost and economic cost causes market failure. It creates an exter-nality – a spillover effect – which manifests itself as an incentive to overcapacity and overexploitation” (EAFE 2001, page 1). The economic performance of fisheries has been an issue in fishery management as most commercial fisheries have experienced dramatic declines in fish stocks, and thus also in the economic health of fishers, industries, and coastal communities. This has been highlighted by the magnitude of subsidies offered to the industry in recent years and has received global attention as a result. Many of these subsidies work in collabo-ration with the lack of resource ownership to encourage excessive effort, over-investment in fishing capital and overexploitation of the fish stocks. From an eco-nomic perspective, excessive capital investments in the fishing industry represents a wasted economic rent, or an opportunity cost of invested capital, that could and should be utilised in a more efficient manner elsewhere in society.
Common Fisheries Policy reform, FOI 11

It is the failure of incorporating an economic approach that has at least partly been re-sponsible for the continued problems of fisheries policy. The theory of fisheries eco-nomics indicates that fisheries can be regulated efficiently if market forces are al-lowed to dictate the evolution of fishing fleets. This creates an environment that re-moves incentives for competitive build-up of excessive capacity and fishing effort, an otherwise rational response by fishers to profits existing in the fishery. A management strategy that is based on output constraints and the internalisation of externality prob-lems, through the use of for example landing taxation or individual property rights, would lead to divesting of capital in the fishery and a gradual optimisation of fleet ca-pacity. Prime examples of where property rights have been successfully introduced include New Zealand, Iceland, and a handful of fisheries in Canada and the United States. However, Cunningham and Greboval (2001) recognise that the range of capac-ity management methods is limited and further constrained by socio-political and technical considerations. This is none more evident than in EU fisheries. The CFP reform proposal involves a management system that is based on biological assessment of fish stocks. A consequence of this is that the determination of objec-tives and instruments are based on physical measures, such as stock size, fishing mor-tality, fishing effort, fleet tonnage and engine power. The reform proposal also in-cludes the long-term ambition of incorporating economic considerations into the management system. The current situation, however, where there is a considerable unbalance balance between fleet capacity and fishing opportunities, does not support an economic approach to EU fishery management. On this basis, there does not appear to be an option to include economic objectives and instruments, specifically regarding fleet capacity policy in relation to the CFP re-form. Further, current data availability does not support an economic management approach, as the collection of economic data for fisheries will first become obligatory in 2004. It can therefore be expected that an economic approach to EU fishery man-agement is first likely to be considered in 2006. However, in the overall structure of the CFP reform proposal, fleet policy and structural policy are grouped collectively. Hence, this indirectly serves as an economic approach to fleet management, as the use of public aid for capacity adjustment is of essential importance. This is explicitly re-lated to the withdrawal of aid for capacity renewal and the enhancement of aid for ca-pacity reduction, for example, using decommissioning in cases where impacts of fish-ing effort reductions are severe. From an economic perspective, this adapted frame-work is of fundamental importance in relation to the adjustment of fleet capacity.
12 Common Fisheries Policy reform, FOI

The new management system does not define a set of specific capacity objectives. The adjustment of capacity will occur indirectly via limitations on fishing effort de-fined under multi-annual management plans. The main instrument to physically con-trol fleet capacity will be established via a reference level for the capacity of the indi-vidual Member State, based on the objectives of the current multi-annual guidance programme (MAGP). However, the lack of transparency of the MAGP will create some uncertainty with regard to the establishment of these reference levels, since the foundations of fleet data of Member States is ambiguous. Hence, with regard to strengthening the effectiveness of the physical control, it will be essential to define the degree of the reference levels of Member States. The simple framework is none-theless expected to be more practical than the MAGP. Regulation of fleet entry and exit will be established in relation to the reference levels of the fleet. The proposal suggests an entry/exit ratio of 1. In further deliberations it may be proposed that the entry/exit regulation is strengthened. For example, a 0.5 ra-tio could mean that only 50% of the removed capacity can be reintroduced. The re-placement of existing capacity with new capacity will likely result in a rise in effi-ciency and is hence worthy of further attention. A strengthening of the reform proposal would involve the defining of guidelines for the reduction in fishing opportunities of Member States, seen in the context of failure to comply with fleet adjustment requirements (reference levels, entry/exit ratio and reporting requirements). This could involve a simple percentage reduction in fishing opportunities, defined in terms of the extent of failure to comply with capacity ad-justment requirements. A ‘peer review’ process is proposed under the CFP reform to support the monitoring of Member State obligations to comply with fishing mortality reductions during 2003-06. This report considers two feasible options for capacity analysis that should assist to strengthen this review process, namely Data Envelopment Analysis and Break Even revenue estimations.
Common Fisheries Policy reform, FOI 13

14 Common Fisheries Policy reform, FOI

2. Capacity and overcapacity
Conflicting definitions and measures of fishing capacity often prevail as a result of economic, biological and technical impartiality. These definitions and measures have also often been adopted to agree with objectives of fisheries managers. In order to as-sist a global recognition of the fishing capacity issue, the Food and Agriculture Or-ganisation of the United Nations (FAO) initiated an extensive consultation pro-gramme in 1998 in order to discuss the many conflicting definitions of fishing capac-ity and the possible means of measuring and managing fishing capacity. Capacity, or ability to catch fish, has tended to be more often than not expressed in relatively simple and easily monitored technological (input) terms. These could in-clude number of vessels, physical characteristics of vessels (type, size, engine power, electronic equipment, etc.), gear and fishing methods used, the time available for fish-ing, as well as a major role for human skill and experience. The sum of physical equipment and human characteristics is called the “fishing (or harvesting) capacity”. However, capacity has also been defined in terms of catch (output) or in economic terms (e.g. capital costs). Defining capacity in economic terms has been less widely used due to the relatively large demand for data collection. In 1999, the FAO agreed on an International Plan of Action for the Management of Fishing Capacity. The Plan calls for all member states to achieve efficient, equitable and transparent management of fishing capacity by 2005, and to provide estimates of capacity of their fishing fleets by 2001. In this regard it has been concluded that the capacity definition proposed by Johansen (1968), with slight modification, can be shown to provide a suitable measure of capacity. Guidelines laid down by the FAO Technical Working Group on the Management of Fishing Capacity (FAO 1998a, p.10), hence propose that capacity should be viewed as a physical (technical) output, where: “Fishing capacity is the maximum amount of fish over a period of time (year, season) that can be produced by a fishing fleet if fully utilised, given the biomass and age structure of the fish stock and the present state of the technology”. The optimal level of capacity is often perceived to be a capacity target level of fishery management. The difference between the target capacity and the current potential fishing capacity of a given fishing fleet would therefore indicate the level of overca-pacity that exists. Such an estimate would then allow managers and administrators to
Common Fisheries Policy reform, FOI 15

set a series of meaningful fleet adjustment targets in order to rebalance fleet capacity with resource availability. Porter (1998) discusses that biologically, overcapacity can be thought of as a level of capacity that, when fully utilised, produces a level of fish-ing mortality that threatens to reduce the fish stock biomass below the maximum sus-tainable yield (MSY). From an economic perspective, overcapacity can be defined as a fully utilised fishing capacity that reduces yield below the maximum economic yield (MEY). FAO recommend that MSY be used as a global reference point in addition to refer-ence points that may otherwise be chosen at the national or international levels (Cun-ningham and Greboval 2001). They go on to stress that overcapacity assessed with regard to MSY indicates that fleet size is in excess of the fleet size required to harvest MSY. If the fleet operates at near full capacity then biological overfishing is likely to result. However, if management measures can be successfully introduced to prevent overfishing, leading to low capacity utilisation, then this may not be the case. Thus, overfishing implies overcapacity but overcapacity does not necessarily imply over-fishing. Only a limited amount of empirical work has been undertaken to assess the extent of global overcapacity in fisheries. Garcia and Newton (1997) assess overcapacity to be about 30% with respect to MSY of the major stocks representing 70% of global land-ings in 1989. However, since management often favours a precautionary approach (below MSY), an overcapacity of 30% with respect to biological criteria should be regarded as a minimum. With respect to MEY, they estimate overcapacity to be in the vicinity of 25-53%. Based on this work and preliminary estimates of fleet/stock evo-lution during the 1990s, FAO calls for a “drastic reduction of at least 30% of world fishing capacity” (FAO 1998b, p.1). Mace (1997) further states that perhaps as much as a 50% reduction in global fishing capacity is required for capacity levels to become commensurate with sustainable resource productivity. As discussed, the extent of overcapacity can be estimated by accounting for the dif-ference between the current potential capacity of the fleet and that of a defined opti-mal capacity. However, the estimation of an optimal level will be fishery specific and the contrasting perceptions of biologists, economists, fisheries managers and politi-cians will affect the optimal capacity level that is applied. For example, an optimal level may be determined in accordance with management objectives that maximise firm profits, supply to markets or regional employment, or those that promote fish stock growth. Holland and Sutinen (1998) state that regardless of which level is cho-
16 Common Fisheries Policy reform, FOI

sen, and on what basis, the levels and the mix of variable inputs are expected to change as biological, economic and regulatory conditions change in a dynamic fish-ery. Hence, despite an unaltered fleet size, the potential and optimal capacity levels of the fleet may alter considerably over time. The impact of technical development, through new constructions and modernisation of vessel and gear, would also need to be incorporated if an accurate portrayal of the level of overcapacity is to be given. Technological progress clearly enhances the catching efficiency of fishing vessels. A modest estimate of an effective efficiency increase of 2% per annum in capacity has been suggested in the research literature. However, a recent study (Banks et al. 2000) concludes that a standard correction fac-tor cannot be applied to all vessels, as the results from various national case studies differ substantially. A considerable factor that needs addressing is the management system that is in place, where for example effort-based regulation in the Mediterra-nean appears to have enhanced technological progress and input substitution.
Common Fisheries Policy reform, FOI 17

18 Common Fisheries Policy reform, FOI

3. EU fleet policy under MAGP
3.1. Capacity measurement
Fishing capacity in the EU has historically been measured in terms of two vessel characteristics, namely gross tonnage of the vessel and engine power – assuming full utilisation of fishing vessels. These two characteristics have been measured, moni-tored and registered as indicators of fishing capacity in the majority of Member States, as specified by Council Regulation (EEC) No 2930/86, and are regarded as the most pertinent parameters for expressing fishing capacity of the fleets using active gears1. The number of kilowatts (total of the maximum continuous power) of a vessel engine is a relatively straightforward measure, although differing measurement procedures in Member States have caused some complications. Problems have included de-rating practices, the exclusion of auxiliary engines, as well as differing measurements in terms of official kilowatt (kW) and maximum effect kW. The gross tonnage measure of the vessel has been less straightforward. Historically, tonnage has been measured as Gross Registered Tonnage (GRT), as defined by the Oslo Convention 1947, or as a particular national unit of tonnage. The EU has been progressively moving to a common standard for measuring tonnage, a volumetric measure known as Gross Tonnage (GT), as defined by the International Convention on Tonnage Measurement of Ships 1969. However, the tonnage registration of many Member State fleets still includes a mixture of measurements as a result of the slow and complicated conversion procedure, and so has limited the transparency of results of capacity reduction initiatives. A range of standardisation procedures has been adopted for various vessel length categories and re-measurement is expected to be complete by the end of 2003. In addition to this fishing capacity terminology, fishing capacity has been used in the EU to define a further term known as fishing effort, an aggregate measure of tonnage, engine power and fishing activity (days at sea). The two terms have since 1992 worked in parallel to achieve desired fleet reductions.
1 Council Decision 97/413/EC
Common Fisheries Policy reform, FOI 19

The lack of reliable and homogeneous capacity indicators should be seen as one of the main stumbling blocks in past and present capacity reduction initiatives. Defining fishing capacity in terms of two inputs should be scrutinised. Fishing capacity, or the ability of a vessel to catch fish, is a highly complex concept and depends on multiple inputs. Although tonnage and engine power will significantly impact a vessel’s catch-ing ability, and monitoring of these inputs may provide a simple indicator of capacity, it should be acknowledged that other inputs that are not monitored might allow an in-crease in effective capacity (through input substitution). The Community register of fishing vessels was set up in 1989 to allow the European Commission to implement and monitor the CFP. The register is a record of the physi-cal characteristics of all the commercial marine fishing vessels in the EU fleet. In monthly declarations, each Member State must notify the Commission of any changes to the fleet, such as new constructions, withdrawals, modifications or changes in ac-tivity. At the end of 2001 the register contained just over 92,000 fishing vessels (cf. Table 3.1). Table 3.1. Community register of fishing vessels – Total EU fleet 1991-2001
End of year Tonnage (GT/GRT) Power (kW) Number of vessels 1991 2,295,443 8,471,314 101,733 1992 2,225,460 8,302,453 99,213 1993 2,138,615 8,589,645 96,641 1994 2,153,719 8,331,780 102,348 1995 2,108,060 8,140,679 100,085 1996 2,066,136 7,921,283 97,503 1997 2,010,830 7,942,347 101,746 1998 1,984,251 7,797,787 100,035 1999 1,996,162 7,734,172 97,800 2000 1,995,615 7,547,034 95,163 2001 1,993,511 7,434,614 92,472 Source: 1991-94 figures, DG Fisheries (1999) Statistical Bulletin (note: 1991-93 figures exclude Finland nd Sweden). 1995-2001 figures, Eurostat New Cronos database (data extracted 12 September 2002) a
The main characteristics recorded inter alia include: Country of registration, port of registration, types of fishing gear, length overall, ton-nage 2930/86, tonnage Oslo Convention, main engine power, auxiliary engine power, hull material, year of construction, MAGP segment, event indicator (e.g. modernisa-tion, construction, withdrawal, public aid etc.), days at sea.
20 Common Fisheries Policy reform, FOI

Figure 3.1. Community register of fishing vessels – Total EU fleet 1991-2001
80
85
90
95
100
105
1991 1992 1993 1994 1995 1996 1997 1998 1999 2000 2001
End of year
Inde
xed
chan
ge (1
991=
100)
Tonnage (GT/GRT) Power (kW) Number of vessels
Source: 1991-94 figures, DG Fisheries (1999) Statistical Bulletin (note: 1991-93 figures exclude Finland and Sweden). 1995-2001 figures, Eurostat New Cronos database (data extracted 12 September 2002)
3.2. MAGP framework
In order to attain a sustainable balance between the capacity of the EU fishing fleet and the available resources, and to reduce inefficient ‘race to fish’ behaviour, a com-prehensive structural policy has been in force since 1983. This policy has been sought through a string of structural adjustment measures, including a comprehensive capac-ity adjustment policy known as the multi-annual guidance programme (MAGP). In order to remove excess capacity from fisheries, vessel decommissioning and effort reduction have been the most frequently measures applied. Other measures such as joint enterprises, export to third countries, and reassignment for purposes other than fishing have also been applied, although to a much lesser extent. The measures have been implemented under the MAGP framework, with the present MAGP IV pro-gramme being extended to run until the end of 2002. Additional measures to renew and modernise vessels have also been applied to help restructure the EU fishing fleet, working in conjunction with the MAGP. Currently, the EU fleet is segmented depending on how each vessel is geared towards fish stocks, defined on the basis of the zone fished, the species exploited and the fish-
Common Fisheries Policy reform, FOI 21

ing gear used. Fleet segment reduction objectives are set in accordance with desired fishing mortality rates of certain fish stocks. The extent of these ‘weighted’ reductions has been based on biological advice on fish stock overexploitation2. The principal objective of vessel decommissioning is to reduce capacity through the voluntary removal of redundant vessels, bringing fleets fishing particular resources into balance with their allocated quota. The process works by giving fishers a finan-cial incentive to leave the fishery, usually in the form of public aid. In theory, the ves-sels that remain in the fishery will benefit and improve the overall efficiency as global production increases. The expected effects will include an improvement in the eco-nomic results of the fisheries companies, through a reduction in fixed costs and im-proved catches, and greater competitiveness3. A successful decommissioning programme will rely on whether fishers can be drawn out of the fishery for future financial gain, as opposed to what they would otherwise gain if they remained in the fishery (Frost et al. 1995). Fishers may also withdraw from the fishery because of the poor future prospects regardless, resulting in a finan-cial loss and re-employment elsewhere. Vessel decommissioning is expected to re-move the marginal players first (i.e. often the oldest and least efficient vessels), which may in effect not have a considerable impact on overall catches, and their removal may hence not have a significant effect on fishing pressure. Following vessel with-drawal, the remaining participants may also be able to increase their effort (effort creeping) in order to utilise a larger share of the quota, resulting in a similar level of fishing pressure on stocks. A less permanent measure has been applied to the MAGP since 1992 under the fish-ing effort concept, where Member States may reduce the overexploiting nature of fishing fleets by limiting their fishing activity. This measure requires vessels to re-main in port for a minimum number of days per year, thus reducing the overall fishing effort and subsequent pressure on fish stocks. Although this measure may address the objective of reducing fishing pressure it is unlikely to address the more fundamental issue of improving the long-term structure of the fleets. Reductions in fishing effort has allowed Member States to reduce their required cuts in physical fishing capacity and helped maintain an artificially high level of fishing capacity, in excess what is ul-timately desired.
2 Council Decision 97/413/EC 3 COM(96) 237 final
22 Common Fisheries Policy reform, FOI

Public aid has been allocated to support vessel decommissioning. Aid has also been available for construction and modernisation of fishing vessels to ensure that the EU fleet remains competitive, to improve safety on board vessels, to improve the quality of fish handling and to encourage the use of more selective gears. In earlier years, criticism focused on the lack of co-ordination between decommissioning and the funding of vessel renewal and modernisation, often referred to as the ‘scrap and build’ policy. All the common structural measures relating to fisheries were integrated into an overall system of EU structural funding under a single financial instrument, the Fi-nancial Instrument for Fisheries Guidance (FIFG) in 1993. The specific tasks of the FIFG included helping to achieve a sustainable balance between resources and their exploitation, a strengthening of the competitiveness of structures and the development of economically viable enterprises. Community and national aid to the fisheries sector was in the order of €2.6 billion for the period 1994-99. Of this figure, €894 million was granted to decommissioning and €594 to renewal and modernisation, with the remainder being made available for aquaculture, port facilities, processing and marketing. One-third of total aid was sourced nationally. Initial FIFG structural aid allocations for 2000-2006 total €3.6 bil-lion (DG Fisheries 2001b).
3.3. Capacity development
The following tables outline the trend in capacity development under the MAGP since 1991. Table 3.2. EU fleet development against MAGP III objectives
---------------- Tonnage (GT/GRT) --------------- -------------------- Power (kW) -------------------- End of year Objective Situation Objective Situation 1991 2,044,511 2,010,183 8,290,422 8,347,453 1992 2,003,621 1,934,811 8,124,614 8,188,936 1993 1,977,951 1,843,750 8,020,807 7,963,704 1994 1,936,824 1,777,083 7,896,177 7,778,111 1995 1,895,696 1,710,673 7,771,547 7,555,011 1996 1,859,028 1,644,113 7,691,700 7,328,117 Overall change: -18% Overall change: -12%
Source: COM(97) 352 final N
ote: Figures exclude Finland and Sweden
Common Fisheries Policy reform, FOI 23

Table 3.3. EU fleet development against MAGP IV objectives --------------- Tonnage (GT/GRT) --------------- -------------------- Power (kW) ------------------- End of year Objective Situation Objective Situation 1996 - 2,005,469 - 7,817,117 2001 2,338,215 1,967,391 8,326,627 7,357,075
Overall change: -1.9% Overall change: -5.9% S ource: COM(2002) 446 final
For segments using active gears, Member States were allowed to achieve all or part of their objectives by reducing activity (days at sea). Six Member States (Germany, France, Ireland, Netherlands, United Kingdom and Sweden) chose to achieve their MAGP IV objectives by managing activity as well as capacity in one or more seg-ments of their fleets. This led to lower capacity reduction requirements for those fleet segments concerned and lowered the capacity reduction requirements of the Commu-nity fleet as a whole under MAGP IV. The Commission has acknowledged that for these limitations to have the same effect as the limitation of capacity, activity reduc-tions must be permanent in the same way as capacity reductions. This is especially pertinent given that the proposed reform of the CFP seeks to find a long-term solution to sustainable exploitation of fish stocks. The assessment of MAGP IV outcomes in GT terms will be uncertain until the com-pletion of the re-measurement of fleets at the end of 2003, although it is expected that the decrease in GT outlined in Table 3.3 is under-estimated4. Some Member States will likely achieve their current tonnage objectives in some additional segments after the effect of re-measurement of GT is taken into account. Indeed, Commission Deci-sion 2002/652/EC shows how 2002 capacity objectives of, for example, France and the United Kingdom have seemingly been adjusted to account for such tonnage re-measurements (cf. Table 3.4). At the end of 2001, the Netherlands was the only Mem-ber State not to have complied with global capacity targets in terms of kW.
4 COM(2002) 446 final and COM(2002) 483 final
24 Common Fisheries Policy reform, FOI

Table 3.4. MAGP IV objectives and fleet situation of Member States
Member State
Measure
Situation 2001
Objective 2001
Sit2001/Obj2001
Segment compliance
Objective 2002*
Belgium GT/GRT 24,091 23,323 103 1/2 23,260 Germany
KW GT/GRT
66,34768,766
67,85781,973
9884
1/26/7
67,857 80,965
Denmark Spain France (mainland) Greece Ireland Italy Netherlands Portugal United Kingdom Sweden Finland
KW GT/GRT KW GT/GRT KW GT/GRT KW GT/GRT KW GT/GRT KW GT/GRT KW GT/GRT KW GT/GRT KW GT/GRT KW GT/GRT KW GT/GRT KW
160,56299,663
364,030532,003
1,311,821229,742
1,098,253108,739637,20764,412
185,276217,501
1,315,086179,942426,867116,968403,245255,634953,73350,183
243,30219,748
191,344
170,050132,539463,437799,254
1,802,836213,870
1,161,131120,755654,17269,649
199,009230,177
1,341,775145,520423,161195,885497,246250,684
1,066,46351,159
261,85623,427
217,634
9475796773
10795909793939598
1241016081
1028998938488
6/74/44/47/77/7
15/2119/21
5/65/62/32/3
8/117/115/74/7
10/1010/10
6/87/84/65/64/44/4
166,890 132,706 459,526 783,113
1,793,251 225,757 916,469 119,910 653,497 83,167
215,939 229,833
1,338,972 145,520 423,161 194,756 492,844 269,789
1,065,278 51,436
261,029 23,203
216,195 Total
GT/GRT KW
1,967,3917,357,075
2,338,2158,326,627
8488
--
2,363,415 8,070,908
S
ource: COM(2002) 446 final and (*)Commission Decision 2002/652/EC
Table 3.5. EU fleet development against MAGP IV intermediate targets
------------- Tonnage (GT/GRT) ------------- -------------------- Power (kW) -------------------- Objective Situation Objective Situation End of 1996 - 2,020,770 - 7,872,386 30 June 2002 2,397,193 1,949,629 8,330,580 7,272,752 Overall change: -3.5% Overall change: -7.6%
Sourc
e: COM(2002) 483 final
At 30 June 2002, all Member States had met their overall intermediate targets for kW, whereas only Denmark, Spain, Portugal, Ireland and Finland had met their kW targets in all segments of their fleets. As a consequence, all other Member States had to sus-pend public aid schemes for the construction and modernisation of their fleets in one
Common Fisheries Policy reform, FOI 25

or more segments. In fact, in some segments capacity had risen substantially beyond the MAGP target levels.
3.4. Critique of fleet policy
The European Commission has played its role in the poor results attained through MAGP. Recognised problems include:
- Accepting a variety of capacity units - Complex fleet segmentations and weightings - Amendments of objectives - Not implementing biological advice for cutbacks in fishing mortality
In connection to these recognitions, the Scientific, Technical and Economic Commit-tee for Fisheries (STECF 1999, p.11) state that: “In view of the low reduction rates applied to Member States’ fleets in MAGP III and IV in comparison to what was recommended according to the state of the stocks, and the way they have been applied, the primary objective of matching fishing capacity to resource availability is unlikely to have been fulfilled by the end of 2001”. The difficulties of trying to address biological imperatives while accommodating a multitude of political, economic and socio-economic interests have hampered the progress of capacity adjustment programmes. Although most of the reduction objec-tives were met during the 1990s, the translated effect of a similar reduction in fishing pressure on stocks has not materialised. The Commission (COM(2000) 272 final, p.5) acknowledges that “the fleet would still be more than capable of exerting excessive levels of fishing effort” despite the ob-served capacity reductions. The Commission further states that: “Although the current exploitation rates are too high, they represent only a fraction of what existing fleet capacity is potentially able to exert if it were not for the con-straints imposed by Community regulations, and in particular the quota allocations”.
26 Common Fisheries Policy reform, FOI

4. Reforming the Common Fisheries Policy
4.1. Introduction
In connection with their proposal to reform the CFP, the European Commission (COM(2002) 181 final, p.3) acknowledges that there is currently: “An alarming state of many fish stocks that are outside biological limits” and “if cur-rent trends continue many Community fish stocks will collapse”. With regards to the current level of fishing capacity they continue, by expressing that: “The fishing capacity of the Community fleet far exceeds that required to harvest the available fishery resources in a sustainable manner. The most recent scientific advice from ICES suggests that the level of fishing mortality of the main Community fish stocks needs to be reduced by between one-third and one-half, depending on the type of fishery and area concerned, in order to ensure sustainable fishing.” These symptoms have resulted from the ineffectiveness of the CFP, which the Com-mission attribute to the following internal systematic weaknesses:
- Poor enforcement - Lack of multi-annual management approach - Fleet overcapacity - Insufficient stakeholder involvement - Inability of reversing the increasing threats to important fish stocks
and of providing economic sustainability to the fisheries sector The Community therefore needs a new framework that provides a basis for coherent fishery management measures, based on the precautionary principle.
4.2. Proposed management reforms
The Commission proposes that more effective conservation and management of fish-eries resources is a clear objective of the CFP. Specifically, they regard the aims of a new approach to fishery management to include, among others, a long-term approach to securing sustainable fisheries with high yields. Also, they seek to manage fishing
Common Fisheries Policy reform, FOI 27

effort in line with catching opportunities, requiring an immediate and significant re-duction of fishing effort. The Commission proposes multi-annual management plans (MAMPs) for commercial stocks. These plans are to be based on the best available scientific methods and ad-vice, be consistent with the precautionary approach to ensure long-term safe levels of stock size and fishing mortality, be designed to ensure recovery of depleted stocks, take into account bio-diversity and habitat objectives, and finally allow high and sta-ble yields given the aforementioned constraints. The plans will particularly set targets for population size and fishing mortality rates of fish stocks and harvest rules that es-tablish methods for fixing catch and fishing effort limits to secure long-term goals. Member States will be responsible for the allocation of quotas and fishing effort be-tween vessels. Fishing effort limits are an essential part of the management plans and will gradually become the prime management instrument for mixed fisheries, requir-ing a reduction in the activity of the existing fleet (up to 60% in several fisheries). Technical measures will continue to play an important role. The main aim by the Commission is to reduce catches of younger fish, by-catches in mixed fisheries and discards, and so helping to increase yields from the fisheries in a sustainable manner. Measures will include more selective fishing gear, restricting fishing in areas of juve-nile fish, sensitive non-target species and habitats, minimum landing sizes, “discard ban” trials and voluntary code of conduct to reduce discarding, and economic incen-tives for the use of more selective gears.
4.3. Multi-annual management plans
The Commission proposes that fish stocks be managed on a multi-annual basis, in-corporating targets which take account of scientific advice against which the state of stocks can be measured, and defined harvesting strategies that will pre-determine the method to be used for setting catch and fishing effort limits. The essential components of multi-annual management will be effort limits, catch limits and technical measures. Measures may be imposed for each stock to limit fishing mortality and the environ-mental impact of fishing activities by:
28 Common Fisheries Policy reform, FOI

- Adopting MAMPs - Establishing targets for sustainable exploitation of stocks - Limiting catches - Fixing the number and type of fishing vessels authorised to fish - Limiting fishing effort - Adopting technical measures (gear restrictions, closed areas/seasons,
minimum landing size, measures to reduce impact on marine ecosys-tems and non-target species)
- Establishing incentives to promote more selective fishing
MAMPs shall include targets against which the recovery of stocks to within safe bio-logical limits can be measured, where targets are expressed in terms of:
- Population size, and/or - Long-term yields, and/or - Fishing mortality rate, and/or - Stability of catches
The plans include harvesting rules that consist of a pre-determined set of biological parameters to govern catch limits. For stocks for which an MAMP has been adopted, the Council shall decide on catch and/or fishing effort limits as well as the conditions associated to those limits for the first year of fishing under the plan. For the following years, the Commission shall decide catch and/or fishing effort limits.
4.4. Fleet capacity policy
Reductions in fishing mortality and the establishment of effort limits will have reper-cussions for fleet capacity. The reduction of fishing capacity in response to the fishing effort limits will be the responsibility of Member States, with the Community fleet policy being asked to create the environment to encourage this capacity reduction. An overall reduction in the capital employed is the first essential step towards improving economic performance of the sector. The Commission proposes that a new fleet policy should be based on three main lines of action:
Common Fisheries Policy reform, FOI 29

- Restrictions on aid for modernisation, renewal and export of fishing vessels
- Special measures for vessels affected by MAMPs - A simpler system for limiting fishing capacity
Public aid to investment in the fishing fleet is counter-productive, promoting over-supply of capital by reducing costs and investment risks and thereby distorts competi-tion. Hence, the Commission proposes to restrict aid for modernisation, renewal and export of vessels. No funds can be expected for this purpose from the FIFG following the end of MAGP IV (December 2002). More specifically, the Commission proposes to:
- Remove aid for new capacity - Remove aid for export of vessels and joint enterprises - Restrict modernisation aid to safety on board, more selective fishing
gears, and improvement of production quality (not concerning engine power). This is conditional on the status of overall fleet capacity and does not allow an increase in fishing effort
- Ensure that any fleet renewal must take place without any increase in fishing effort
- Ensure that once a fishing vessel is withdrawn from the fishery, the li-cence associated with that vessel is also withdrawn from the fishery
- Ensure that measures that support small-scale coastal fishing do not in-crease fishing effort nor increase the impact of towed gears
- Ensure that Member States’ programmes under FIFG prioritise fishing capacity reduction measures (scrapping of fishing vessels)
While capacity has been reduced through MAGP, recent reduction targets have been very modest and increasing fleet efficiency and dwindling stocks have meant that, in some segments, the fleet still remains too large for the size of the stock it is targeting (cf. Chapter 3). The funding of scrapping via FIFG has not always allowed for suffi-cient targeting of fleets where overcapacity is particularly marked. The MAGP has been too complicated and insufficiently ambitious to manage fleet capacity and there-fore the Commission now proposes a simpler system for limiting fishing capacity. Within this system an overall ceiling (‘reference level’) for fishing capacity for na-tional fleets will be fixed. This will prevent further expansion of fishing fleet and help
30 Common Fisheries Policy reform, FOI

ensure that Member States comply with obligations under MAGP IV. Hence, the new policy does not set a new range of capacity targets as under the previous programme. The reference levels will be based on the final objectives of MAGP IV (cf. Table 3.4 in Chapter 3). Failure to comply with these levels, as well as failure to comply with reporting obligations and withdrawal of capacity with public aid, will lead to the withholding of all public FIFG aid (except aid for scrapping). It may also lead to a re-duction in the allocation of fishing opportunities (quota) or fishing effort. Further, any new entry will have to result in at least an equivalent withdrawal of capacity (1:1), and when capacity is withdrawn with public aid the reference level will be adjusted downwards by the amount of capacity withdrawn. A ‘peer review’ process will evaluate the progress of fleet capacity reduction and cor-responding fishing mortality rates during 2003-065. It is immediately unclear how the peer review process is to be structured. However, the process should be able to moni-tor the progress of required reductions in fishing mortality on a Member State basis, helping to ascertain whether Member States are complying with targets set by the new management plans for fish stocks.
4.5. Scrapping of vessels
An emergency measure has been proposed to provide additional incentives to the ow-ners of fishing vessels in order to urgently address overcapacity in fisheries where stocks are outside safe biological limits and for which MAMPs have been imple-mented. The management plans will likely cause severe reductions in fishing oppor-tunities in certain segments of the fleet, as currently seen in the downturn in cod and hake fisheries in the North Sea. To address this imbalance it is proposed that the emergency measure allows Member States to offer additional funds for scrapping vessels that are severely impacted. A re-duction of 25% or more in the fishing opportunities of the vessel concerned should be regarded as an objective indicator of ‘severe impact’. The owners of the vessels may be granted increased scrapping premiums (an extra 20%) if the vessel is impacted in such a way. The time frame for this measure is 2003-06 to encourage rapid fleet ad-justment. The measure shall be available solely for Member States that have achieved both global and segment MAGP IV targets for their fleet.
5 Outlined in Article 14 “Exchanges of information”, COM(2002) 185 final
Common Fisheries Policy reform, FOI 31

The Commission has used scientific advice on recommended reductions in fishing ef-fort, linked to the perceived effect such reductions will have on Community fishing vessels in the fishing vessel register, to reach the approximations given in Table 4.1. Table 4.1. Vessel scrapping proposal
Vessel number Total tonnage (GT) € million
Removal to achieve fishing mortality reduction under proposed MAMPs 8,592 351,791
-
Cost assuming 80% uptake - 281,433 1,376 EU contribution - - 712 Funds currently available - - 663 Additional budget requirement* - - 271.6 Source: COM(2002) 190 final Note: *Calculated on the basis of Member State requirements. FIFG funds show that some Member States
ill require extra funds whereas others do not w
Regulation (EC) No 2792/1999 continues to be the framework for payments of scrap-ping premiums. Member States will need to present the Commission with a plan for expected scrapping expenditure, both under the emergency measure outlined above and under the ‘adjustment of fishing effort’ programme of Regulation (EC) No 2792/1999. The impact of MAMPs will also be assessed in order to reach agreement on contributions to be paid on a Member State basis.
4.6. Linking MAGP to new reference levels
Reference levels for the proposed capacity limitations will be directly based on the capacity objectives of MAGP IV outlined in Table 3.4 in Chapter 3. However, it is immediately unclear how MAGP objectives that have involved reductions in activity are interpreted. Clearly the programme set a series of capacity objectives for each fleet segment of each Member State. However, with some Member States deciding to use the activity reduction option to cut back fishing effort requirements, it is unclear whether their overall capacity objectives of MAGP IV were also lowered. If so, the new reference level proposals may require that the MAGP IV objectives are re-defined so they are in capacity terms only. It is pertinent that the newly defined refer-ence levels are purely in capacity terms to allow for consistency and transparency of capacity measurements of Member State fleets.
32 Common Fisheries Policy reform, FOI

5. Applying capacity analysis to the peer review process
As discussed in Section 4.4, the possibilities for reviewing the adjustment of fleet ca-pacity of Member States in relation to fishing opportunities can be strengthened via the ‘peer review’ process. This could be carried out by the application of a range of capacity analysis methods under the guidance of the STECF. This would help to strengthen the appraisal process of fleet capacity adjustment of Member States. Relatively simple approaches to analysing capacity exist. As outlined in the Commis-sion’s Green Paper (DG Fisheries 2001a), the utilisation rate of capacity can be calcu-lated by comparing the total number of days at sea actually recorded to the available capacity. Here it is assumed that available capacity is 265-days effort per vessel per year. Another simple indicator could be catch per unit of effort (CPUE) analysis. Al-so, where only basic catch and aggregated fleet data is available, the FAO (1998, 1999) propose that the peak-to-peak method be applied. An economic approach to analysing capacity should also be considered, and possible progress in this regard is outlined in Section 5.2. However, with economic data collection in the EU first be-coming obligatory in 2004, applying economic analysis to the proposed peer review process is unlikely in the immediate future.
5.1. Data Envelopment Analysis
A possible tool for supporting the peer review process to help analyse capacity of the fleets is Data Envelopment Analysis (DEA). This tool allows for transparent capacity analysis on the Member State level, which would identify the current balance of fleet capacity and its respective productivity. Such an analytical framework could easily be introduced into the peer review process and compliment other analytical procedures that may be put in place. It should be stressed that the analysis would not serve to di-rectly compare the performance of Member State fleets. In follow-up work to the International Plan of Action for the Management of Fishing Capacity of 1999, the FAO set out a series of technical guidelines for measuring ca-pacity during a technical consultation meeting in Mexico in 1999. Among other ana-lytical tools, DEA was identified as a viable option to measure the potential output of a fishery given the current structure of the fleet. DEA was regarded as one of the more simple and robust approaches that could be readily adopted by member states, given that, as a bare minimum, information on aggregated catch and fleet data on a national level is readily available.
Common Fisheries Policy reform, FOI 33

The DEA framework helps us assess fishing capacity, or production output from a fishery given the current level of production inputs, based on traditional efficiency analysis often undertaken in other industry sectors. The analysis concentrates on as-sessing capacity in relation to fleet structure and does not incorporate considerations of the underlying stock dynamics, as outlined in Chapter 2. Academic research has shown that this framework can be modified in order to estimate capacity, which is consistent with the FAO definition of capacity. It has also been applied to estimate optimal input utilisation, productivity, identify strategic groups, determine bench-marks and total quality programmes, and to estimate social and private costs of regu-lating undesirable outputs and capacity. DEA is a non-parametric mathematical programming approach that uses the optimisa-tion of an objective function given a series of constraints. It allows us to assess the efficiency of an existing technology relative to an optimal, ‘best practice’, frontier technology observed in a given fishing fleet. The frontier technology in this case re-sembles the optimal combination of inputs (e.g. tonnage, engine power) and outputs (e.g. catch, landings). The technique allows us to individually assess each in-put/output combination of each observation (e.g. vessel) and compare it to the ‘best practice’ producers in the same fishery. A simple one input one output scenario is portrayed in Figure 5.1 for a given set of firms. Here firms 1-3 form the ‘best prac-tice’ frontier, or the production possibility frontier. Firm 4 resembles an individual who is not efficient, as it is not situated on the frontier. The analysis helps us to identify the magnitude by which each firm or vessel should be able to expand its output production if it were as efficient as the ‘best practice’ vessel that uses the same level of inputs (as viewed in Figure 5.1). The possible out-put expansion measure can be translated into the level of current capacity utilisation, i.e. the observed output divided by potential output. We can observe that Firm 4, gi-ven its inputs, should be able to expand the output so it lies on the frontier. The level of overcapacity that exists in the fishery can thus be estimated based on this relative performance indicator for each firm. However, since the capacity utilisation score is a relative measure between vessels in a given fishery or fleet, it is not advisable to di-rectly compare these scores to other fisheries or fleets in order to ascertain which is more efficient. For further information, comprehensive introductions to DEA can be found in Cooper et al. (2000) and Charnes et al. (1996).
34 Common Fisheries Policy reform, FOI

Best practice frontier
Observed output (Firm 4)
Potential output (Firm 4)
Input
Output
Firm 1
Firm 2
Firm 3
Figure 5.1. Estimating capacity using DEA
The analysis helps us to identify the magnitude by which each firm or vessel should be able to expand its output production if it were as efficient as the ‘best practice’ vessel that uses the same level of inputs (as viewed in Figure 5.1). The possible out-put expansion measure can be translated into the level of current capacity utilisation, i.e. the observed output divided by potential output. We can observe that Firm 4, gi-ven its inputs, should be able to expand the output so it lies on the frontier. The level of overcapacity that exists in the fishery can thus be estimated based on this relative performance indicator for each firm. However, since the capacity utilisation score is a relative measure between vessels in a given fishery or fleet, it is not advisable to di-rectly compare these scores to other fisheries or fleets in order to ascertain which is more efficient. For further information, comprehensive introductions to DEA can be found in Cooper et al. (2000) and Charnes et al. (1996). The data required to undertake DEA capacity analysis can either be aggregated fleet data or individual vessel data, although more disaggregated data is favoured. The Commission and the individual Member State Fisheries Directorates hold detailed
Common Fisheries Policy reform, FOI 35

vessel data on recorded catch and landings and the associated physical inputs of ves-sels (e.g. tonnage, engine power, etc.). This data, if made readily available, would al-low for this type of capacity analysis to be undertaken in support of the peer review process of capacity and fishing mortality reduction. It is clear that the aggregation level of data may be an issue. It is hence important to consider the practical application of this type of analysis to a diverse range of datasets for individual Member States. There should be a process that considers the technical guidelines laid down by FAO, with particular reference to the application of DEA analysis under various levels of data aggregation. This issue is comprehensively dis-cussed in the FAO report (1999). FAO note that DEA can be used to estimate current capacity and potential capacity at the species level by aggregating across fleet seg-ments, and at the fleet level by aggregating across species. However, increasing the level of aggregation reduces the accuracy of the measure due to greater differences between fisheries at each level. Regard to discards and unrecorded catch must also be given. The methodology must be standardised in some manner as to allow consis-tency of capacity measurements among all Member States.
5.2. An economic approach to capacity analysis
The capacity issue could be viewed from the output side or from the input side. From the output side the potential catch volume is calculated with a given capacity. This potential catch volume is then compared to the actual (restricted) catch volume i.e. the total allowable catch (TAC). From the input side the minimum capacity required to catch a given volume is calculated and then compared to the actual capacity. From a pure economic point of view the definition of the minimum capacity is where the av-erage long run variable costs are at minimum, and that would often entail that the ca-pacity use in technical terms, e.g. production hours, is lower than 100%. In fisheries one further aspect is of importance, and that is the fish resource that should be viewed as a production input parallel to the fleet capacity. It is necessary to distinguish between the long run and the short run. In the short run, with given fish stock biomasses and TACs, overcapacity, in terms of non-economic sustainability, can occur and is reflected in the magnitude of the net profit. In the short run situation it is not taken into account whether the fish stock size is at an optimal level or not. This is different from the long run situation because the long run sustainable stock size and hence the TACs could demand a different optimal capacity.
36 Common Fisheries Policy reform, FOI

Costs and earnings compilations and calculations are published in the 2001 Annual Economic Report (AER)6 of selected European fishing fleets, and together with the associated EIAA model (Salz and Frost 2000) this information must be considered a useful instrument with respect to assessment of overcapacity and the distribution of overcapacity on fleet segments. The AER contains tables of the following format with the example taken from the Danish fishery. Table 5.1. Denmark: Trawlers below 200 GT, economic indicators 1995-2000
1995 1996 1997 1998 1999 2000
Costs and earnings (€ million) 1. Gross output 162 144 143 152 165 156 2. Fuel costs 13 13 12 11 13 22 3. Other running costs 22 19 19 20 21 21 4. Vessel costs 33 27 26 27 30 29 5. Crew share 70 66 63 68 74 72 6. Gross cash flowa 24 17 23 27 26 12 7. Depreciationb 23 20 17 20 20 21 8. Interestb 10 8 8 8 10 9 9. Net profit -9 -11 -3 -1 -3 -18
a. Calculated as gross output minus item 2 to 5 b. Constitute the fixed costs Source: AER for selected European fleet segments 2001. European Association of Fisheries Economists.
he figures are retrieved from the Danish Account Statistics, prepared annually by FOI (T www.foi.dk)
The gross cash flow (GCF), which is gross output (revenue) less all variable (opera-tion) costs, is central in the sense that the fisher will stay in the fishery in the short run if the GCF is positive, but in the long run he will stay only if the fixed costs are cov-ered by the GCF. The revenue at which the GCF exactly equals the fixed costs is de-fined as the ‘Break Even’ revenue. It rests on the assumption that GCF per unit revenue is known, and then the Break Even revenue is calculated by use of the following expression: (E1) Break Even revenue = fixed costs / (gross cash flow/revenue), the same as: (E2) Break Even revenue = fixed costs / (1- variable costs/revenue)
6 Economic performance of selected European fishing fleets: Annual Report 2001. Concerted Ac-
tion FAIR CT-97-3541, Promotion of Common Methods for Economic Assessment of EU Fish-eries.
Common Fisheries Policy reform, FOI 37

Figure 5.2 shows the characteristics of the Break Even concept. Break Even is deter-mined by the intersection between the total GCF curve, which is a function of the revenue and the fixed costs curves. The two fixed costs curves are included to de-scribe two cases. The first case is where only vessel costs are considered, while the second case includes vessel costs and cost of access to use the fish stocks as explained further below. Figure 5.2. Break Even revenue
5
10
15
20
25
30
100 120 140 160 180 200
Revenue
Gro
ss c
ash
flow
, Fix
ed c
osts
Fixed Costs Fixed Costs incl. Stock Costs Gross Cash Flow
If the revenue of a fleet segment, given a certain fish stock level, a certain species composition, a set of prices, a set of daily catch rates, and a certain cost structure, is below Break Even revenue we define it as a non-economic sustainable fishery, and vice versa. Looking at Figure 5.2 all the above-mentioned elements affect the level and the slope of the curves. Therefore it is argued that the calculation of economic sustainability of the segment should be made on a long run basis e.g. at least 5 years in order to even out variations. Further it is necessary to distinguish between the Break Even calculations about the adjustment to an economic sustainable fishery where the net profit is zero, and the adjustment to the situation that secures sustain-able fish stocks and attempts to maximise the economic rent from the resources, which is in the interest of society.
38 Common Fisheries Policy reform, FOI

In cost and earning studies it is not always easy to distinguish whether costs for ac-cess to the fish resource is included or not. If there are no costs of access to the fish resource this could be embodied in a higher value of the vessels, because the value of the vessels reflects future earnings, which are then higher compared to the situation where the fish stock owner demands a return. In Figure 5.2 the lower fixed cost curve reflects the cost of one input factor i.e. the vessel, whereas the upper curve reflects the costs of the vessel and access to the resource. The economic sustainability and over/under-capacity of a fleet segment is calculated taking the relation between the Actual revenue and the Break Even revenue, taking into account whether there is a charge for access to the resource or not. Table 5.2 shows the results for the Danish trawler fleet below 200 GT. The fleet segment targets mainly cod, plaice, sole and Norway lobster, which are subject to different yield curves. These yield curves are aggregated by use of fish prices. By use of the above-mentioned Break Even revenue expression (E1) on the “Aver-age” figures in Table 5.2 for calculation of overcapacity, the following Break Even revenue result is obtained using fixed costs that include access costs: 24.8/(21.5/153.7) = 177.2. When the Break Even revenue is related to the Actual revenue (177.2/153.7 = 1.15) the result shows how much the actual revenue should be increased to break even, i.e. secure exactly zero net profit after interest payments, de-preciation and an appropriate salary to the skipper/owner. In this case revenue should be increased by 15% and hence indicates an overcapacity of 15%. Similarly, to calculate economic sustainability we use fixed costs that exclude access costs, and the following results are obtained: 18.2/(21.5/153.7) = 129.9. Relating the Break Even revenue to the Actual revenue we obtain 129.9/157.3 = 0.85. This repre-sents an undercapacity of 15%. In order to manage and restrict capacity an extra stock-related cost in terms of an ad-mission fee could be introduced. The fish stock access could be dependent on the le-vel of overfishing. The higher the overfishing, the higher the access costs, in order to take into account the increasing scarcity of the resource. However, this topic needs to be investigated further. Taking into account fish stock access costs gives an indicator of over/under-capacity, which in the example above, is radically different from the measure of short run economic sustainability (see the two bottom rows in Table 5.2). It should be emphasised that for illustration purposes, the fish stock access costs in
Common Fisheries Policy reform, FOI 39

this example are arbitrarily fixed at 4% of the invested vessel capital. It would be pos-sible to calculate more appropriate access costs. Table 5.2. Estimate of economic sustainability level and over/under-capacity
based on Break Even revenue. Danish trawler fleet below 200 GT 1995 1996 1997 1998 1999 2000 Average Costs and earnings (€ million) Gross output (revenue) 162 144 143 152 165 156 153.7 Cash flow 24 17 23 27 27 12 21.5 Invested capital (IC) 200 166 146 152 159 168 165.4 Fixed costs (FC) at 11% of IC 22 18 16 17 18 19 18.2 Fixed costs (FC) at 15%1 of IC 30 25 22 23 24 25 24.8 Break Even revenue at 11% FC 147 155 102 95 109 244 129.9 Break Even revenue at 15% FC 201 211 139 129 149 332 177.2 Economic sustainability2 9% -8% 29% 38% 34% -56% 15% Overcapacity3 24% 47% -3% -15% -10% 100% 15% 1. Costs are estimated as 11% of invested vessel capital and further 4% of invested vessel capital is used as an estimate of the costs of access to the fish resource 2. Positive numbers show that the fleet segment is economically sustainable, negative numbers show that the fleet segment is not economically sustainable 3. Positive numbers show overcapacity, negative numbers show undercapacity Source: AER for selected European fleet segments 2001. European Association of Fisheries Economists. The figures of invested capital are retrieved from the Danish Account Statistics, prepared annually by FOI (www.foi.dk), while the other figures are calculated by the Working Group
Furthermore, it can be seen that the overcapacity varies quite substantially between years because it is affected by a number of factors, such as catch composition, fish prices, cost change, etc. Therefore, the figures in the column “Average” are of par-ticular interest as they display an estimate of the long run average situation. The use of the Break Even concept to calculate economic sustainability and overca-pacity, and how the two different adjustments take place, is further elucidated in Fig-ure 5.3 below, which aims to explain bio-economic reference points of capacity. If the fleet segment is in an initial position at K1 the first adjustment calculated by the Break Even revenue is from K1 to the intersection between the cost curve C1 and the revenue curve (step I), which also reflects the yield curve of a fish species. This movement could be defined as a movement towards long run economic sustainability. The movement from K1 to K3 will occur as the excess profit (or part of it) will be in-vested in new capacity, or new capacity is being attracted because of the excess profit.
40 Common Fisheries Policy reform, FOI

The difference between K1 and K3 represents the 15% undercapacity estimate in terms of economic sustainability given in Table 5.2. Figure 5.3. Economic sustainability and long run overcapacity
C2
C1
Revenue (yield)
Capacity K2 K1
Total revenue and costs
Actual revenue
Break Even revenue
I
II
K3
The second movement is towards K2 (step II), which represents the situation where the fish stock has recovered. This situation could be defined as the long run socio-economic sustainable situation, and the movement towards the position is induced in the calculation by the introduction of the costs of the access to the fish resource. In-currence of such costs will raise the slope of the cost curve to C2, and the calculated overcapacity is the difference between capacity levels K1 and K2. Similarly, this represents the 15% overcapacity estimate given in Table 5.2, for the case where ac-cess costs are taken into account. To identify overcapacity of a fleet segment from society’s viewpoint, the Break Even method is considered operational on a wider EU level and sufficiently robust, al-though not necessarily theoretically optimal. Further the method is supported by its transparency and acceptability in the industry caused by the use of well-known busi-ness-economics principles. The method can handle many species subject to different
Common Fisheries Policy reform, FOI 41

yield curves by weighting them together using prices. The method takes into account a number of the economic elements the fisher would face and need to include when deciding on whether to leave the industry or remain. Furthermore, because the method is based on remuneration of production factors, be it only vessel capital or both vessel capital and fish stocks, the method could be used independently of TAC and quota settings. Finally, the calculation is based on well-justified costs and earnings statistics produced in the industry. Although the method is based on output it could be applied on the input side as well; in the most simple form, by proportionally changing the fishing capacity in terms of potential number of fishing days (number of vessels times vessel fishing days) with the required change in output. By using models that explicitly take into account a number of capacity and effort variables, e.g. in particular the number of vessels and fishing days categorised in homogenised fleet segments, an estimate of overcapacity could be obtained. Using an optimisation procedure where profit is maximised either on a fleet segment level or the fishery as a whole, will indicate the optimum fleet composition and number of fishing days required to catch a given TAC.
42 Common Fisheries Policy reform, FOI

References
Community papers
COM(2002) 483 final. Report from the Commission to the Council and the European Parliament on the intermediate results of the multi-annual guidance programmes for the fishing fleets at 30 June 2002. Brussels, 03.09.2002.
COM(2002) 446 final. Annual report from the Commission to the Council and the
European Parliament on the results of the multi-annual guidance programmes for the fishing fleets at the end of 2001. Brussels, 01.08.2002.
COM(2002) 190 final. Proposal for a Council Regulation establishing an emergency
Community measure for scrapping fishing vessels. Brussels, 28.05.2002. COM(2002) 187 final. Proposal for a Council Regulation amending Regulation (EC)
No 2792/1999 laying down the detailed rules and arrangements regarding Community structural assistance in the fisheries sector. Brussels, 28.05.2002.
COM(2002) 185 final. Proposal for a Council Regulation on the conservation and
sustainable exploitation of fisheries resources under the Common Fisheries Pol-icy. Brussels, 28.05.2002.
COM(2002) 181 final. Communication from the Commission on the reform of the
Common Fisheries Policy (“Roadmap”). Brussels, 28.05.2002. COM(2001) 541 final. Annual report from the Commission to the Council and the
European Parliament on the results of the multi-annual guidance programmes for the fishing fleets at the end of 2000. Brussels, 01.10.2001.
COM(2000) 272 final. Report from the Commission to the Council: Preparation for a
mid term review of the multi-annual guidance programmes (MAGP). Brussels, 10.05.2000.
COM(97) 352 final. Annual report to the Council and to the European Parliament on
the results of the multi-annual guidance programmes for the fishing fleet at the end of 1996. Brussels, 11.07.1997.
Common Fisheries Policy reform, FOI 43

COM(96) 237 final. Proposal for a Council Decision concerning the objectives and detailed rules for restructuring the Community fisheries sector for the period from 1 January 1997 to 31 December 2001 with a view to achieving a balance on a sustainable basis between resources and their exploitation. Brussels, 29.05.1996.
Commission Decision 2002/652/EC of 29 July 2002 amending Decisions 98/119/EC
to 98/131/EC in order to prolong the multi-annual guidance programmes for the fishing fleets of the Member States until 31 December 2002
Council Decision 97/413/EC of 26 June 1997 concerning the objectives and detailed
rules for restructuring the Community fisheries sector for the period from 1 January 1997 to 31 December 2001 with a view to achieving a balance on a sus-tainable basis between resources and their exploitation.
Council Regulation (EC) No 2792/1999 of 17 December 1999 laying down the de-
tailed rules and arrangements regarding Community structural assistance in the fisheries sector
Council Regulation (EEC) No 2930/86 of 22 September 1986 defining the character-
istics of fishing vessels, amended by Council Regulation (EC) No 3259/94 of 22 December 1994.
DG Fisheries (2001a) “Green Paper: The Common Fisheries Policy after 2002. Re-
port on the economic and social situation of coastal regions”. Volume 2. http://europa.eu.int/comm/fisheries/greenpaper/green/volume2b_en.pdf
DG Fisheries (2001b) “Facts and figures on the CFP: Basic data on the Common
Fisheries Policy”. European Communities, 2001. DG Fisheries (1999) Statistical Bulletin – September 1999.
http://europa.eu.int/comm/fisheries/doc_et_publ/statistic/stat_en.htm Eurostat New Cronos database – Data extracted 12 September 2002.
http://www.europa.eu.int/newcronos
44 Common Fisheries Policy reform, FOI

Other papers
Banks, R., S. Cunningham, W. Davidse, E. Lindebo, A. Reed, E. Sourisseau and J.W. de Wilde (2001), “The impact of technological progress on fishing effort”. Call for Tenders No. XIV-C-1/99/02, European Commission. LEI publication.
Charnes, A., W. Cooper, A.Y. Lewin and L.M. Seiford (1996) “Data Envelopment
Analysis: Theory, Methodology, and Application”. Kluwer Academic Publish-ers, second printing 1996.
Cooper, W.W., L.M. Seiford and K. Tone (2000) “Data Envelopment Analysis: A
Comprehensive Text with Models, Applications, References and DEA-Solver Software”. Kluwer Academic Publishers, second printing 2000.
Cunningham, S. and D. Greboval (2001) “Managing fishing capacity: A review of
policy and technical issues”. FAO Fisheries Technical Paper 409. FAO (1999) “Report of the Technical Consultation on the Measurement of Fishing
Capacity”. Mexico City, Mexico, 29 November – 3 December 1999. FAO Fish-eries Report No. 615.
FAO (1998a) “Report of the Technical Working Group on the Management of Fish-
ing Capacity”. La Jolla, California, United States, 15-18 April 1998. FAO Fish-eries Report No. 586.
FAO (1998b) “FAO: Number of fishers doubled since 1970”. Press release 98/09,
February 1998. Frost, H., R. Lanters, J. Smit and P. Sparre (1995) “An appraisal of the effects of the
decommissioning scheme in the case of Denmark and the Netherlands”. DIFER Publication 16/95.
Garcia, S. and C. Newton (1997) “Current situation, trends and prospects in world
capture fisheries”. “Global trends: Fisheries management”, American Fisheries Society Symposium, Maryland, USA, 1997.
Common Fisheries Policy reform, FOI 45

46 Common Fisheries Policy reform, FOI
Holland, D. and J. Sutinen (1998) “Draft guidelines on fishing capacity”. Paper pre-pared for the Technical Working Group on the Management of Fishing Capac-ity”. La Jolla, California, United States, 15-18 April 1998.
Johansen (1968) “Production functions and the concept of capacity”. Recherches Re-
centes sur le Fonction de Production, Collection, Economie Mathematique et Econometrie, Vol. 2.
Lindebo, E. (2000) “Capacity development of the EU and Danish fishing fleets”. FOI
Working Paper no. 10/2000. Mace, P. (1997) “Developing and sustaining world fishery resources: The state of sci-
ence and management”. World Fisheries Congress, Brisbane, 1996, unpub-lished.
Porter, G. (1998) “Too much fishing fleet, too few fish: A proposal for eliminating
global fishing overcapacity”. Prepublication draft, WWF, August 1998. Salz, P. and H. Frost (2000) “Model for economic interpretation of the ACFM advice
(EIAA)” in Lindebo, E. and N. Vestergaard, edt. (2000) “Proceedings of the XIIth Annual Conference of European Association of Fisheries Economists (EAFE), Esbjerg.