Committee on Labor and Housing From - Maine Legislature
10
PO Box 1374 Yarmouth, ME Phone: (207) 761-5616 www.sierraclub.org/maine To: Committee on Labor and Housing From: David Gibson, Sierra Club Maine Date: February 9, 2021 Re: Testimony in Support of LD 319 An Act To Promote Socially Responsible Investing by Maine PERS by Prohibiting Investment in Senator Rafferty, Representative Sylvester, and members of the Committee on Labor and Housing: my name is David Gibson, and I represent Sierra Club Maine and our 22,000 supporters and members across the state. We voice our support for this legislation: LD 319 An Act To Promote Socially Responsible Investing by MainePERS by Prohibiting Investment in the Fossil Fuel Industry or For-profit Prisons. I have conducted analysis of the MainePERS investment portfolio, and have found myself astonished and dismayed with the quantity of fossil fuel investments. I have attached several pages to this testimony, which includes the current MainePERS investments that are tied to the fossil fuel industry. This is not exhaustive, and I am certain that there are additional fossil fuel investments beyond those that I have identified. As of 12/31/2019, MainePERS had $172 million in publicly traded fossil fuel companies, and more than $1.1 billion invested in private market funds that contain fossil fuels, for a total of over $1.3 billion invested in fossil fuels. The private market investments are particularly troublesome because many are secretive and provide very little information about their holdings. Many of the private equity investment firms provide no public information, so my analysis includes only those that I could positively identify as including fossil fuel investments. Most of the private equity companies host multiple funds, and don’t specify what investments are made by each fund, so it is possible that a few of the funds I have identified will turn out not to contain fossil fuels. Many of the funds that I identified appear to contain fossil fuel assets exclusively. I was able to positively identify MainePERS private equity investments in coal-fired power plants, coal mining, and every stage of the oil and gas industries, from fracking wells and pipelines to refineries and distribution. The publicly traded investments owned by MainePERS include 1 company in the top 100 for global coal reserves 1 , 25 companies in the top 100 for global oil and gas 1 List of top 100 publicly traded companies with coal reserves available by request from: https://www.ffisolutions.com/research-analytics-index-solutions/research-screening/the-carbon-underground-200/
-
Upload
khangminh22 -
Category
Documents
-
view
0 -
download
0
Transcript of Committee on Labor and Housing From - Maine Legislature
PO Box 1374 Yarmouth, ME
Phone: (207) 761-5616 www.sierraclub.org/maine
To: Committee on Labor and Housing
From: David Gibson, Sierra Club Maine
Date: February 9, 2021
Re: Testimony in Support of LD 319 An Act To Promote Socially Responsible Investing by Maine PERS by Prohibiting Investment in the Fossil Fuel Industry or For-profit Prisons
Senator Rafferty, Representative Sylvester, and members of the Committee on Labor and Housing: my name is David Gibson, and I represent Sierra Club Maine and our22,000 supporters and members across the state. We voice our support for this legislation: LD 319 An Act To Promote Socially Responsible Investing by MainePERS by Prohibiting Investment in the Fossil Fuel Industry or For-profit Prisons.
I have conducted analysis of the MainePERS investment portfolio, and have found myself astonished and dismayed with the quantity of fossil fuel investments. I have attached several pages to this testimony, which includes the current MainePERS investments that are tied to the fossil fuel industry. This is not exhaustive, and I am certain that there are additional fossil fuel investments beyond those that I have identified. As of 12/31/2019, MainePERS had $172 million in publicly traded fossil fuel companies, and more than $1.1 billion invested in private market funds that contain fossil fuels, for a total of over $1.3 billion invested in fossil fuels.
The private market investments are particularly troublesome because many are secretive and provide very little information about their holdings. Many of the private equity investment firms provide no public information, so my analysis includes only those that I could positively identify as including fossil fuel investments. Most of the private equity companies host multiple funds, and don’t specify what investments are made by each fund, so it is possible that a few of the funds I have identified will turn out not to contain fossil fuels. Many of the funds that I identified appear to contain fossil fuel assets exclusively. I was able to positively identify MainePERS privateequity investments in coal-fired power plants, coal mining, and every stage of the oil and gas industries, from fracking wells and pipelines to refineries and distribution.
The publicly traded investments owned by MainePERS include 1 company in the top 100 for global coal reserves1, 25 companies in the top 100 for global oil and gas
1 List of top 100 publicly traded companies with coal reserves available by request from:
https://www.ffisolutions.com/research-analytics-index-solutions/research-screening/the-carbon-underground-200/

PO Box 1374 Yarmouth, ME
Phone: (207) 761-5616 www.sierraclub.org/maine
reserves2, and 9 of the top 30 companies owning coal-fired power plants3 – notably, every single company on the list of coal power plant owners based in North America. MainePERS investments also include a variety of midstream oil and gas companies, pipelines, oilfield services companies, and natural gas utilities.
In 2014, there was similar legislation that would have required Maine PERS to divest from fossil fuels, which sadly did not pass. At that time, Maine PERS Director Sandy Matheson provided testimony4, in which she said, “The Maine constitution requiressuch [investment] decisions be made for the exclusive purpose of providing retirement and related benefits to members. We do not believe sufficient market data and analysis exists to demonstrate that divestment would be for the exclusive benefit of the members. …Such a conclusion requires extensive market analysis and certainty that within a specific time frame, that is five years, fossil fuel investments will sustain an irrevocable loss. MainePERS investment staff and consultants study these issues on a regular and on-going basis and cannot definitively draw this conclusion.”
The last seven years have proved conclusively that divestment in 2014 would have avoided an irrevocable loss, and would have created a great deal of additional value for the MainePERS members. My analysis shows that these fossil fuel holdings have lost value over the last 7 years. Even prior to the pandemic and recession, the MainePERS fossil fuel investments had lost millions of dollars. On top of that, the publicly traded fossil fuel holdings lost an additional $35 million in value in 2020, based on MainePERS own records. There are not records going back to 2014 available for their$1.1 billion in private market investments, but my assumption is that they fared similarly to the public funds. MainePERS should provide all their private market investment records online for at least the last decade, to facilitate complete analysis.
Due to the fact that Maine PERS records are only available online for the past year, I had to analyze individual stocks to determine how much they lost prior to that. TheS&P 500 energy sector provides a decent approximation for their non-utility fossil fuel holdings and is representative of the fossil fuel industry. From December 30, 2013 to December 30, 2019 (ignoring the effect of the pandemic), the S&P 500 EnergySector lost 29% of value5. Over the same time period, the entire S&P 500 index gained 107%, more than doubling in value. This means that instead of losing several hundred
2 List of top 100 publicly traded companies with oil & gas reserves available by request from:
https://www.ffisolutions.com/research-analytics-index-solutions/research-screening/the-carbon-underground-200/ 3 List of top 30 companies owning coal-fired power plants: https://macroclimate.com/coal 4 http://www.mainelegislature.org/legis/bills/getTestimonyDoc.asp?id=13194 5 https://www.spglobal.com/spdji/en/indices/equity/sp-500-energy-sector/#overview

PO Box 1374 Yarmouth, ME
Phone: (207) 761-5616 www.sierraclub.org/maine
million dollars with their fossil fuel investments, they could have made over $1 billion in net gains if they had divested from fossil fuels 7 years ago. Their insistence on gambling retiree’s benefits in the fossil fuel industry cost the Maine Retirement system more than $1 billion over the last 6 years leading up to the pandemic.
However, when you include 2020, the numbers are a lot worse. The fossil fuel sector(represented by S&P 500 Energy Sector) has lost 55% between 12/31/13 and 12/31/20. Meanwhile, the S&P 500 as a whole gained 148%. This means that Maine PERS missed out on close to $2 billion in net gains over the last 7 years. This is a travesty and demands immediate action. Maine PERS needs to divest from fossil fuels as quickly as possible.
chart: https://eresearch.fidelity.com/eresearch/markets_sectors/sectors/sectors_in_market.jhtml?tab=learn§or=10
Looking forward, the future for the fossil fuel industry is bleak. Industry analysts atBP say that global oil usage peaked in 20196. President Biden is committed to strong climate action, curbing carbon emissions, and curtailing fossil fuel consumption with 100% clean electricity by 2035 and net-zero carbon emissions by 20507. 189 other
6 https://www.carbonbrief.org/analysis-world-has-already-passed-peak-oil-bp-figures-reveal 7 https://joebiden.com/climate-plan/

PO Box 1374 Yarmouth, ME
Phone: (207) 761-5616 www.sierraclub.org/maine
nations have signed the Paris Climate Accord8. Many states, including Maine, California, and New York, have Renewable Portfolio Standards that require 100% clean electricity by 2050, or sooner9. More than 280 corporations, including household names like Amazon, Walmart, Google and Microsoft, have committed to 100% renewable electricity in their operations, and some have already met that goal10. Globally, we are committed to the transition from fossil fuels to clean energy.
At the Sierra Club, we think it is important to go beyond divesting from fossil fuels. Instead, Maine PERS should be proactive investors, and re-invest these funds into the clean energy sector. Clean energy is experiencing explosive growth and will replace the fossil fuel industry over the next 30 years in meeting global energy demands. As these funds are divested, they should be re-invested in solar, wind, geothermal and energy efficiency companies. This will create the maximum financial returns and provide the most benefit for PERS members.
Maine PERS could go one step further and re-invest a portion of these funds into clean energy projects in Maine. Yes, they are bound by their constitutional obligation to their members, and the funds cannot be diverted for any purpose other than the benefit of their members. However, setting up a revolving fund to offer low- or no- interest loans for Maine PERS participants (both public employees and retirees) to make clean energy improvements to their own homes would meet the constitutional obligations.
I worked for the Nevada Governor’s Office of Energy for two years. During that time, we created the ‘Direct Energy Assistance Loan’, or DEAL program11. Through this program, we offered 0% interest loans for state employees to make energy efficiency improvements to their homes. It was repaid through a payroll deduction, meaning that there was zero risk of default, as long as the employee maintained their employment with the state. This program was met with overwhelming enthusiasm and was very successful, such that it has only been constrained by staff time and funding.
Maine PERS could set up a similar program, with perhaps $100 million in upfront investment, to fund energy efficiency and clean energy improvements for PERS members. This will provide members the direct benefit of annual energy savings for
8 https://unfccc.int/process-and-meetings/the-paris-agreement/the-paris-agreement 9 https://www.ncsl.org/research/energy/renewable-portfolio-standards.aspx 10 https://www.there100.org/re100-members 11 https://energy.nv.gov/layouts/Page_Style_1.aspx?id=132388

PO Box 1374 Yarmouth, ME
Phone: (207) 761-5616 www.sierraclub.org/maine
the life of their home, and increases their home value if they choose to sell. It will create jobs in Maine for energy efficiency and clean energy businesses. The loans can be repaid through a payroll deduction, and could additionally be securitized by the member’s own retirement account, making it impossible to default on the loan. This will directly benefit the members who choose to participate, create local jobs, increase local tax revenue, and provide a better return on investment for PERS than the fossil fuel industry!
Thank you Representative Brennan for bringing this forward.
We ask this committee to voteLD 319 Ought to Pass.
David Gibson, on behalf of Sierra Club Maine
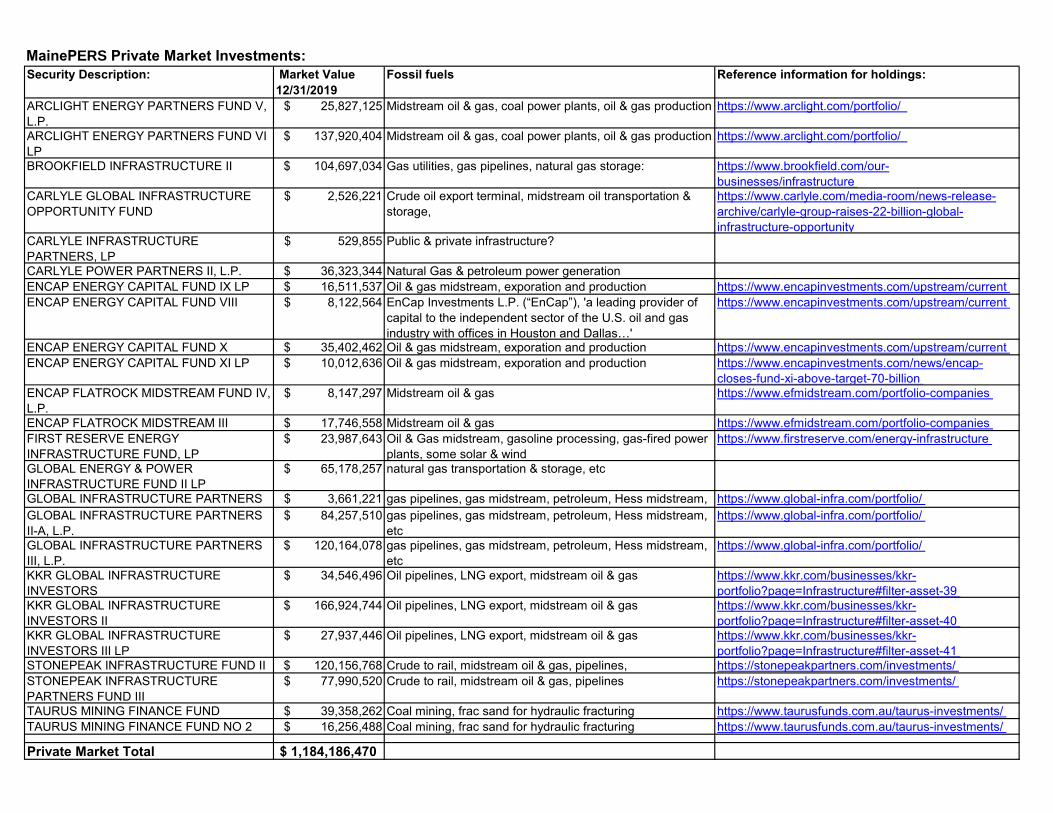
MainePERS Private Market Investments:Security Description: Market Value
12/31/2019
Fossil fuels Reference information for holdings:
ARCLIGHT ENERGY PARTNERS FUND V,
L.P.
$ 25,827,125 Midstream oil & gas, coal power plants, oil & gas production https://www.arclight.com/portfolio/
ARCLIGHT ENERGY PARTNERS FUND VI
LP
$ 137,920,404 Midstream oil & gas, coal power plants, oil & gas production https://www.arclight.com/portfolio/
BROOKFIELD INFRASTRUCTURE II $ 104,697,034 Gas utilities, gas pipelines, natural gas storage: https://www.brookfield.com/our-
businesses/infrastructure CARLYLE GLOBAL INFRASTRUCTURE
OPPORTUNITY FUND
$ 2,526,221 Crude oil export terminal, midstream oil transportation &
storage,
https://www.carlyle.com/media-room/news-release-
archive/carlyle-group-raises-22-billion-global-
infrastructure-opportunity CARLYLE INFRASTRUCTURE
PARTNERS, LP
$ 529,855 Public & private infrastructure?
CARLYLE POWER PARTNERS II, L.P. $ 36,323,344 Natural Gas & petroleum power generation
ENCAP ENERGY CAPITAL FUND IX LP $ 16,511,537 Oil & gas midstream, exporation and production https://www.encapinvestments.com/upstream/current
ENCAP ENERGY CAPITAL FUND VIII $ 8,122,564 EnCap Investments L.P. (“EnCap”), 'a leading provider of
capital to the independent sector of the U.S. oil and gas
industry with offices in Houston and Dallas…'
https://www.encapinvestments.com/upstream/current
ENCAP ENERGY CAPITAL FUND X $ 35,402,462 Oil & gas midstream, exporation and production https://www.encapinvestments.com/upstream/current
ENCAP ENERGY CAPITAL FUND XI LP $ 10,012,636 Oil & gas midstream, exporation and production https://www.encapinvestments.com/news/encap-
closes-fund-xi-above-target-70-billion ENCAP FLATROCK MIDSTREAM FUND IV,
L.P.
$ 8,147,297 Midstream oil & gas https://www.efmidstream.com/portfolio-companies
ENCAP FLATROCK MIDSTREAM III $ 17,746,558 Midstream oil & gas https://www.efmidstream.com/portfolio-companies
FIRST RESERVE ENERGY
INFRASTRUCTURE FUND, LP
$ 23,987,643 Oil & Gas midstream, gasoline processing, gas-fired power
plants, some solar & wind
https://www.firstreserve.com/energy-infrastructure
GLOBAL ENERGY & POWER
INFRASTRUCTURE FUND II LP
$ 65,178,257 natural gas transportation & storage, etc
GLOBAL INFRASTRUCTURE PARTNERS $ 3,661,221 gas pipelines, gas midstream, petroleum, Hess midstream, https://www.global-infra.com/portfolio/
GLOBAL INFRASTRUCTURE PARTNERS
II-A, L.P.
$ 84,257,510 gas pipelines, gas midstream, petroleum, Hess midstream,
etc
https://www.global-infra.com/portfolio/
GLOBAL INFRASTRUCTURE PARTNERS
III, L.P.
$ 120,164,078 gas pipelines, gas midstream, petroleum, Hess midstream,
etc
https://www.global-infra.com/portfolio/
KKR GLOBAL INFRASTRUCTURE
INVESTORS
$ 34,546,496 Oil pipelines, LNG export, midstream oil & gas https://www.kkr.com/businesses/kkr-
portfolio?page=Infrastructure#filter-asset-39 KKR GLOBAL INFRASTRUCTURE
INVESTORS II
$ 166,924,744 Oil pipelines, LNG export, midstream oil & gas https://www.kkr.com/businesses/kkr-
portfolio?page=Infrastructure#filter-asset-40 KKR GLOBAL INFRASTRUCTURE
INVESTORS III LP
$ 27,937,446 Oil pipelines, LNG export, midstream oil & gas https://www.kkr.com/businesses/kkr-
portfolio?page=Infrastructure#filter-asset-41 STONEPEAK INFRASTRUCTURE FUND II $ 120,156,768 Crude to rail, midstream oil & gas, pipelines, https://stonepeakpartners.com/investments/
STONEPEAK INFRASTRUCTURE
PARTNERS FUND III
$ 77,990,520 Crude to rail, midstream oil & gas, pipelines https://stonepeakpartners.com/investments/
TAURUS MINING FINANCE FUND $ 39,358,262 Coal mining, frac sand for hydraulic fracturing https://www.taurusfunds.com.au/taurus-investments/
TAURUS MINING FINANCE FUND NO 2 $ 16,256,488 Coal mining, frac sand for hydraulic fracturing https://www.taurusfunds.com.au/taurus-investments/
Private Market Total $ 1,184,186,470
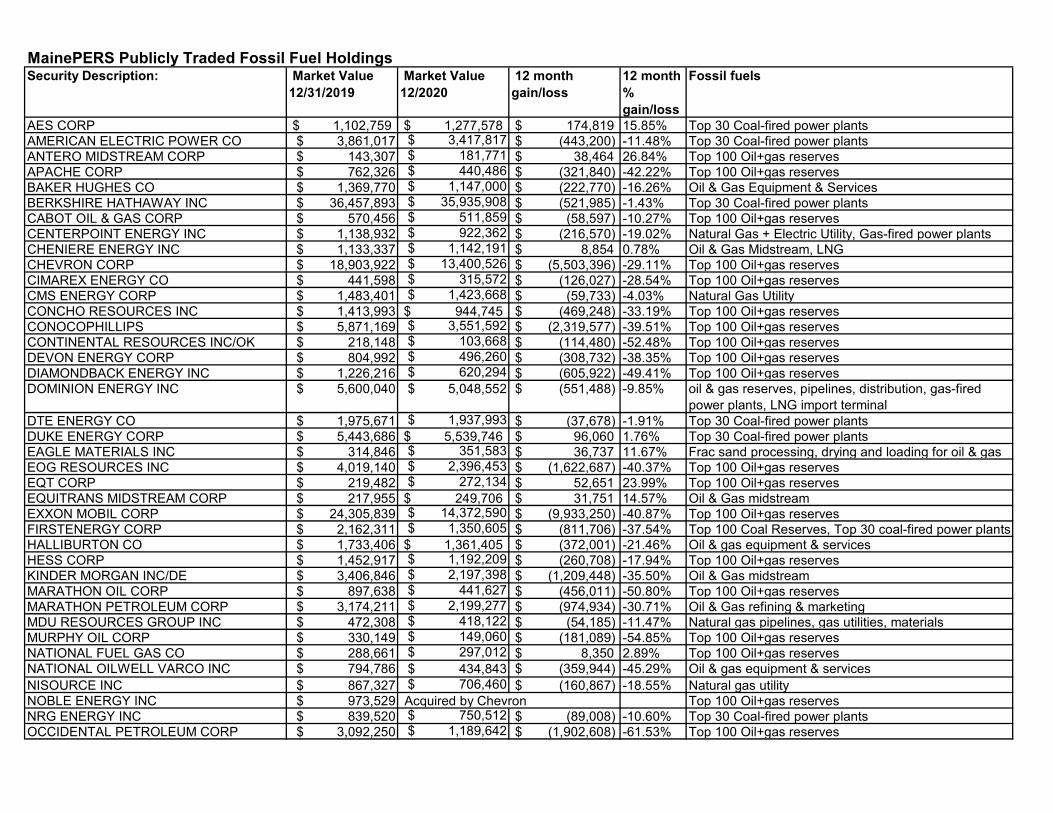
MainePERS Publicly Traded Fossil Fuel HoldingsSecurity Description: Market Value
12/31/2019
Market Value
12/2020
12 month
gain/loss
12 month
%
gain/loss
Fossil fuels
AES CORP $ 1,102,759 $ 1,277,578 $ 174,819 15.85% Top 30 Coal-fired power plantsAMERICAN ELECTRIC POWER CO $ 3,861,017 $ 3,417,817 $ (443,200) -11.48% Top 30 Coal-fired power plantsANTERO MIDSTREAM CORP $ 143,307 $ 181,771 $ 38,464 26.84% Top 100 Oil+gas reservesAPACHE CORP $ 762,326 $ 440,486 $ (321,840) -42.22% Top 100 Oil+gas reservesBAKER HUGHES CO $ 1,369,770 $ 1,147,000 $ (222,770) -16.26% Oil & Gas Equipment & ServicesBERKSHIRE HATHAWAY INC $ 36,457,893 $ 35,935,908 $ (521,985) -1.43% Top 30 Coal-fired power plantsCABOT OIL & GAS CORP $ 570,456 $ 511,859 $ (58,597) -10.27% Top 100 Oil+gas reservesCENTERPOINT ENERGY INC $ 1,138,932 $ 922,362 $ (216,570) -19.02% Natural Gas + Electric Utility, Gas-fired power plantsCHENIERE ENERGY INC $ 1,133,337 $ 1,142,191 $ 8,854 0.78% Oil & Gas Midstream, LNGCHEVRON CORP $ 18,903,922 $ 13,400,526 $ (5,503,396) -29.11% Top 100 Oil+gas reservesCIMAREX ENERGY CO $ 441,598 $ 315,572 $ (126,027) -28.54% Top 100 Oil+gas reservesCMS ENERGY CORP $ 1,483,401 $ 1,423,668 $ (59,733) -4.03% Natural Gas UtilityCONCHO RESOURCES INC $ 1,413,993 $ 944,745 $ (469,248) -33.19% Top 100 Oil+gas reservesCONOCOPHILLIPS $ 5,871,169 $ 3,551,592 $ (2,319,577) -39.51% Top 100 Oil+gas reservesCONTINENTAL RESOURCES INC/OK $ 218,148 $ 103,668 $ (114,480) -52.48% Top 100 Oil+gas reservesDEVON ENERGY CORP $ 804,992 $ 496,260 $ (308,732) -38.35% Top 100 Oil+gas reservesDIAMONDBACK ENERGY INC $ 1,226,216 $ 620,294 $ (605,922) -49.41% Top 100 Oil+gas reservesDOMINION ENERGY INC $ 5,600,040 $ 5,048,552 $ (551,488) -9.85% oil & gas reserves, pipelines, distribution, gas-fired
power plants, LNG import terminalDTE ENERGY CO $ 1,975,671 $ 1,937,993 $ (37,678) -1.91% Top 30 Coal-fired power plantsDUKE ENERGY CORP $ 5,443,686 $ 5,539,746 $ 96,060 1.76% Top 30 Coal-fired power plantsEAGLE MATERIALS INC $ 314,846 $ 351,583 $ 36,737 11.67% Frac sand processing, drying and loading for oil & gas EOG RESOURCES INC $ 4,019,140 $ 2,396,453 $ (1,622,687) -40.37% Top 100 Oil+gas reservesEQT CORP $ 219,482 $ 272,134 $ 52,651 23.99% Top 100 Oil+gas reservesEQUITRANS MIDSTREAM CORP $ 217,955 $ 249,706 $ 31,751 14.57% Oil & Gas midstreamEXXON MOBIL CORP $ 24,305,839 $ 14,372,590 $ (9,933,250) -40.87% Top 100 Oil+gas reservesFIRSTENERGY CORP $ 2,162,311 $ 1,350,605 $ (811,706) -37.54% Top 100 Coal Reserves, Top 30 coal-fired power plantsHALLIBURTON CO $ 1,733,406 $ 1,361,405 $ (372,001) -21.46% Oil & gas equipment & servicesHESS CORP $ 1,452,917 $ 1,192,209 $ (260,708) -17.94% Top 100 Oil+gas reservesKINDER MORGAN INC/DE $ 3,406,846 $ 2,197,398 $ (1,209,448) -35.50% Oil & Gas midstreamMARATHON OIL CORP $ 897,638 $ 441,627 $ (456,011) -50.80% Top 100 Oil+gas reservesMARATHON PETROLEUM CORP $ 3,174,211 $ 2,199,277 $ (974,934) -30.71% Oil & Gas refining & marketingMDU RESOURCES GROUP INC $ 472,308 $ 418,122 $ (54,185) -11.47% Natural gas pipelines, gas utilities, materialsMURPHY OIL CORP $ 330,149 $ 149,060 $ (181,089) -54.85% Top 100 Oil+gas reservesNATIONAL FUEL GAS CO $ 288,661 $ 297,012 $ 8,350 2.89% Top 100 Oil+gas reservesNATIONAL OILWELL VARCO INC $ 794,786 $ 434,843 $ (359,944) -45.29% Oil & gas equipment & services
NISOURCE INC $ 867,327 $ 706,460 $ (160,867) -18.55% Natural gas utilityNOBLE ENERGY INC $ 973,529 Acquired by Chevron Top 100 Oil+gas reservesNRG ENERGY INC $ 839,520 $ 750,512 $ (89,008) -10.60% Top 30 Coal-fired power plantsOCCIDENTAL PETROLEUM CORP $ 3,092,250 $ 1,189,642 $ (1,902,608) -61.53% Top 100 Oil+gas reserves
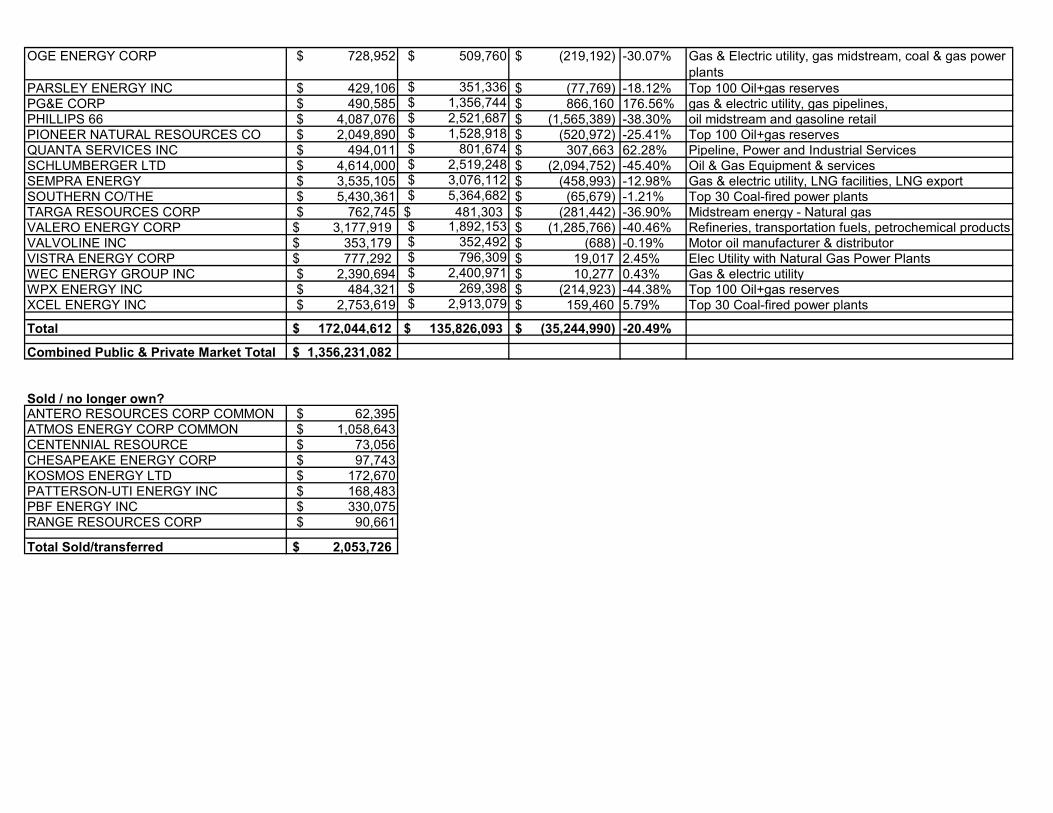
OGE ENERGY CORP $ 728,952 $ 509,760 $ (219,192) -30.07% Gas & Electric utility, gas midstream, coal & gas power plants
PARSLEY ENERGY INC $ 429,106 $ 351,336 $ (77,769) -18.12% Top 100 Oil+gas reservesPG&E CORP $ 490,585 $ 1,356,744 $ 866,160 176.56% gas & electric utility, gas pipelines, PHILLIPS 66 $ 4,087,076 $ 2,521,687 $ (1,565,389) -38.30% oil midstream and gasoline retailPIONEER NATURAL RESOURCES CO $ 2,049,890 $ 1,528,918 $ (520,972) -25.41% Top 100 Oil+gas reservesQUANTA SERVICES INC $ 494,011 $ 801,674 $ 307,663 62.28% Pipeline, Power and Industrial ServicesSCHLUMBERGER LTD $ 4,614,000 $ 2,519,248 $ (2,094,752) -45.40% Oil & Gas Equipment & servicesSEMPRA ENERGY $ 3,535,105 $ 3,076,112 $ (458,993) -12.98% Gas & electric utility, LNG facilities, LNG exportSOUTHERN CO/THE $ 5,430,361 $ 5,364,682 $ (65,679) -1.21% Top 30 Coal-fired power plantsTARGA RESOURCES CORP $ 762,745 $ 481,303 $ (281,442) -36.90% Midstream energy - Natural gasVALERO ENERGY CORP $ 3,177,919 $ 1,892,153 $ (1,285,766) -40.46% Refineries, transportation fuels, petrochemical productsVALVOLINE INC $ 353,179 $ 352,492 $ (688) -0.19% Motor oil manufacturer & distributorVISTRA ENERGY CORP $ 777,292 $ 796,309 $ 19,017 2.45% Elec Utility with Natural Gas Power PlantsWEC ENERGY GROUP INC $ 2,390,694 $ 2,400,971 $ 10,277 0.43% Gas & electric utilityWPX ENERGY INC $ 484,321 $ 269,398 $ (214,923) -44.38% Top 100 Oil+gas reservesXCEL ENERGY INC $ 2,753,619 $ 2,913,079 $ 159,460 5.79% Top 30 Coal-fired power plants
Total $ 172,044,612 $ 135,826,093 $ (35,244,990) -20.49%
Combined Public & Private Market Total $ 1,356,231,082
Sold / no longer own?ANTERO RESOURCES CORP COMMON $ 62,395 ATMOS ENERGY CORP COMMON $ 1,058,643 CENTENNIAL RESOURCE $ 73,056 CHESAPEAKE ENERGY CORP $ 97,743 KOSMOS ENERGY LTD $ 172,670 PATTERSON-UTI ENERGY INC $ 168,483 PBF ENERGY INC $ 330,075 RANGE RESOURCES CORP $ 90,661
Total Sold/transferred $ 2,053,726
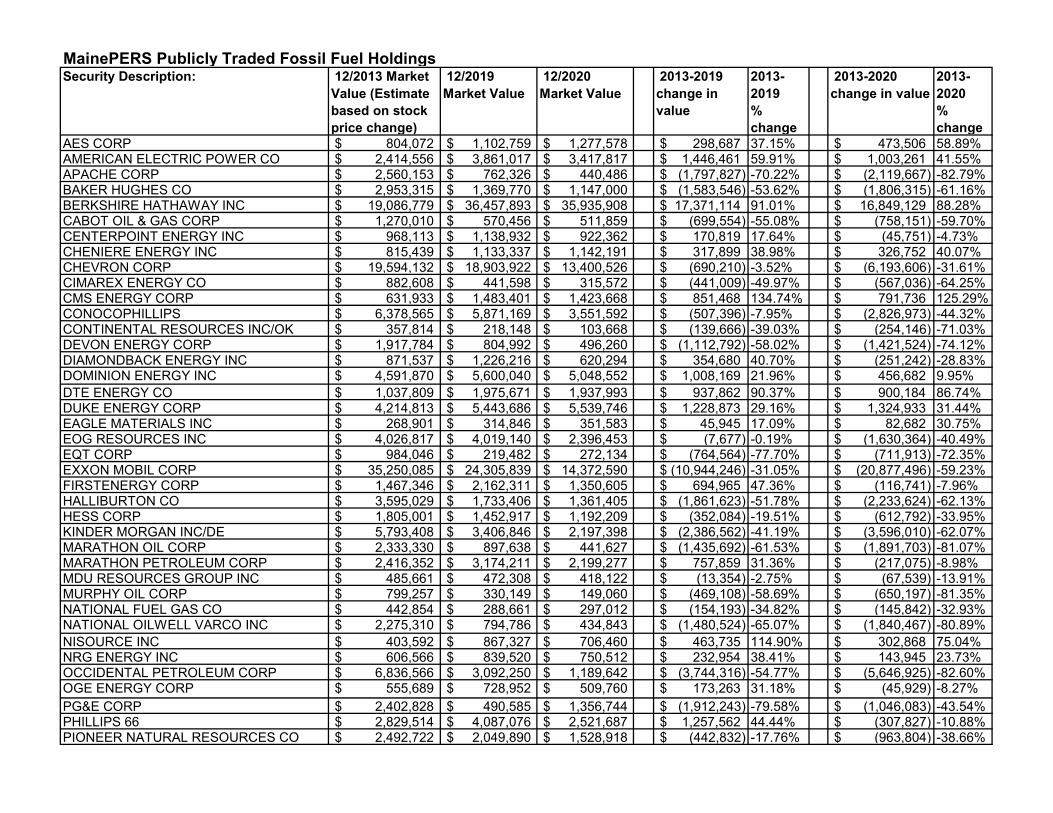
MainePERS Publicly Traded Fossil Fuel HoldingsSecurity Description: 12/2013 Market
Value (Estimate
based on stock
price change)
12/2019
Market Value
12/2020
Market Value
2013-2019
change in
value
2013-
2019
%
change
2013-2020
change in value
2013-
2020
%
changeAES CORP $ 804,072 $ 1,102,759 $ 1,277,578 $ 298,687 37.15% $ 473,506 58.89%AMERICAN ELECTRIC POWER CO $ 2,414,556 $ 3,861,017 $ 3,417,817 $ 1,446,461 59.91% $ 1,003,261 41.55%APACHE CORP $ 2,560,153 $ 762,326 $ 440,486 $ (1,797,827) -70.22% $ (2,119,667) -82.79%BAKER HUGHES CO $ 2,953,315 $ 1,369,770 $ 1,147,000 $ (1,583,546) -53.62% $ (1,806,315) -61.16%BERKSHIRE HATHAWAY INC $ 19,086,779 $ 36,457,893 $ 35,935,908 $ 17,371,114 91.01% $ 16,849,129 88.28%CABOT OIL & GAS CORP $ 1,270,010 $ 570,456 $ 511,859 $ (699,554) -55.08% $ (758,151) -59.70%CENTERPOINT ENERGY INC $ 968,113 $ 1,138,932 $ 922,362 $ 170,819 17.64% $ (45,751) -4.73%CHENIERE ENERGY INC $ 815,439 $ 1,133,337 $ 1,142,191 $ 317,899 38.98% $ 326,752 40.07%CHEVRON CORP $ 19,594,132 $ 18,903,922 $ 13,400,526 $ (690,210) -3.52% $ (6,193,606) -31.61%CIMAREX ENERGY CO $ 882,608 $ 441,598 $ 315,572 $ (441,009) -49.97% $ (567,036) -64.25%CMS ENERGY CORP $ 631,933 $ 1,483,401 $ 1,423,668 $ 851,468 134.74% $ 791,736 125.29%CONOCOPHILLIPS $ 6,378,565 $ 5,871,169 $ 3,551,592 $ (507,396) -7.95% $ (2,826,973) -44.32%CONTINENTAL RESOURCES INC/OK $ 357,814 $ 218,148 $ 103,668 $ (139,666) -39.03% $ (254,146) -71.03%DEVON ENERGY CORP $ 1,917,784 $ 804,992 $ 496,260 $ (1,112,792) -58.02% $ (1,421,524) -74.12%DIAMONDBACK ENERGY INC $ 871,537 $ 1,226,216 $ 620,294 $ 354,680 40.70% $ (251,242) -28.83%DOMINION ENERGY INC $ 4,591,870 $ 5,600,040 $ 5,048,552 $ 1,008,169 21.96% $ 456,682 9.95%
DTE ENERGY CO $ 1,037,809 $ 1,975,671 $ 1,937,993 $ 937,862 90.37% $ 900,184 86.74%DUKE ENERGY CORP $ 4,214,813 $ 5,443,686 $ 5,539,746 $ 1,228,873 29.16% $ 1,324,933 31.44%EAGLE MATERIALS INC $ 268,901 $ 314,846 $ 351,583 $ 45,945 17.09% $ 82,682 30.75%EOG RESOURCES INC $ 4,026,817 $ 4,019,140 $ 2,396,453 $ (7,677) -0.19% $ (1,630,364) -40.49%EQT CORP $ 984,046 $ 219,482 $ 272,134 $ (764,564) -77.70% $ (711,913) -72.35%EXXON MOBIL CORP $ 35,250,085 $ 24,305,839 $ 14,372,590 $ (10,944,246) -31.05% $ (20,877,496) -59.23%FIRSTENERGY CORP $ 1,467,346 $ 2,162,311 $ 1,350,605 $ 694,965 47.36% $ (116,741) -7.96%HALLIBURTON CO $ 3,595,029 $ 1,733,406 $ 1,361,405 $ (1,861,623) -51.78% $ (2,233,624) -62.13%HESS CORP $ 1,805,001 $ 1,452,917 $ 1,192,209 $ (352,084) -19.51% $ (612,792) -33.95%KINDER MORGAN INC/DE $ 5,793,408 $ 3,406,846 $ 2,197,398 $ (2,386,562) -41.19% $ (3,596,010) -62.07%MARATHON OIL CORP $ 2,333,330 $ 897,638 $ 441,627 $ (1,435,692) -61.53% $ (1,891,703) -81.07%MARATHON PETROLEUM CORP $ 2,416,352 $ 3,174,211 $ 2,199,277 $ 757,859 31.36% $ (217,075) -8.98%MDU RESOURCES GROUP INC $ 485,661 $ 472,308 $ 418,122 $ (13,354) -2.75% $ (67,539) -13.91%MURPHY OIL CORP $ 799,257 $ 330,149 $ 149,060 $ (469,108) -58.69% $ (650,197) -81.35%NATIONAL FUEL GAS CO $ 442,854 $ 288,661 $ 297,012 $ (154,193) -34.82% $ (145,842) -32.93%NATIONAL OILWELL VARCO INC $ 2,275,310 $ 794,786 $ 434,843 $ (1,480,524) -65.07% $ (1,840,467) -80.89%
NISOURCE INC $ 403,592 $ 867,327 $ 706,460 $ 463,735 114.90% $ 302,868 75.04%NRG ENERGY INC $ 606,566 $ 839,520 $ 750,512 $ 232,954 38.41% $ 143,945 23.73%OCCIDENTAL PETROLEUM CORP $ 6,836,566 $ 3,092,250 $ 1,189,642 $ (3,744,316) -54.77% $ (5,646,925) -82.60%OGE ENERGY CORP $ 555,689 $ 728,952 $ 509,760 $ 173,263 31.18% $ (45,929) -8.27%
PG&E CORP $ 2,402,828 $ 490,585 $ 1,356,744 $ (1,912,243) -79.58% $ (1,046,083) -43.54%PHILLIPS 66 $ 2,829,514 $ 4,087,076 $ 2,521,687 $ 1,257,562 44.44% $ (307,827) -10.88%PIONEER NATURAL RESOURCES CO $ 2,492,722 $ 2,049,890 $ 1,528,918 $ (442,832) -17.76% $ (963,804) -38.66%
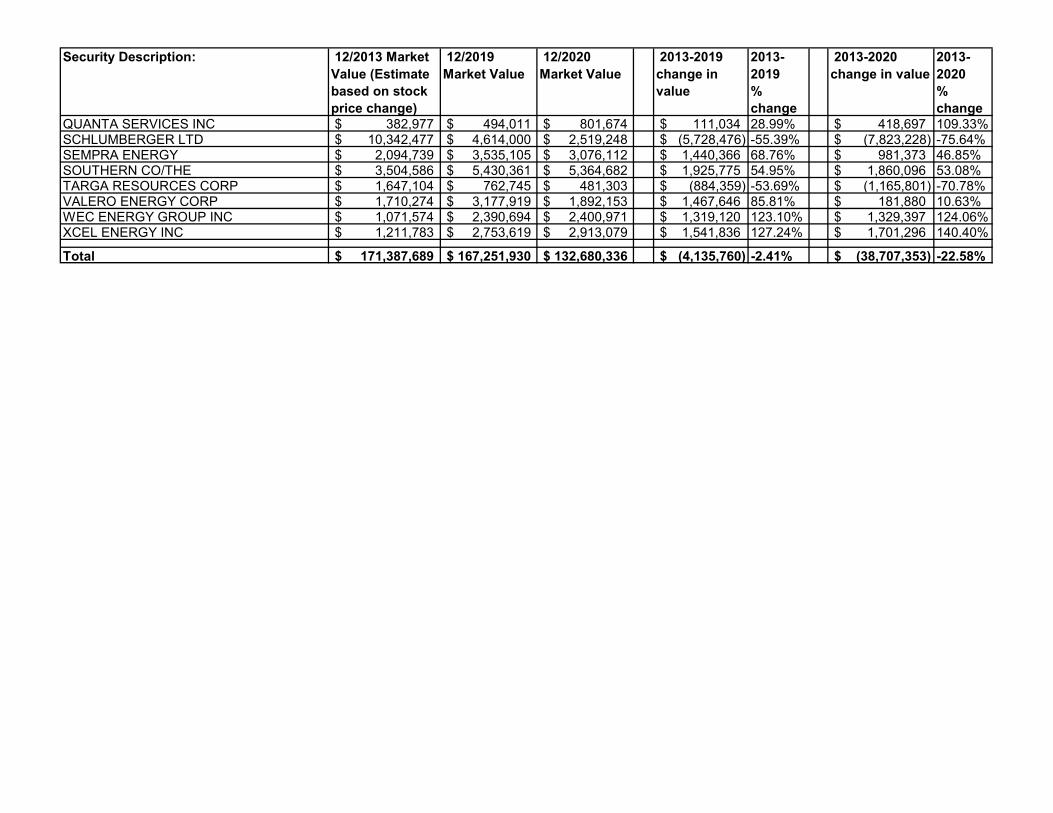
Security Description: 12/2013 Market
Value (Estimate
based on stock
price change)
12/2019
Market Value
12/2020
Market Value
2013-2019
change in
value
2013-
2019
%
change
2013-2020
change in value
2013-
2020
%
changeQUANTA SERVICES INC $ 382,977 $ 494,011 $ 801,674 $ 111,034 28.99% $ 418,697 109.33%SCHLUMBERGER LTD $ 10,342,477 $ 4,614,000 $ 2,519,248 $ (5,728,476) -55.39% $ (7,823,228) -75.64%SEMPRA ENERGY $ 2,094,739 $ 3,535,105 $ 3,076,112 $ 1,440,366 68.76% $ 981,373 46.85%SOUTHERN CO/THE $ 3,504,586 $ 5,430,361 $ 5,364,682 $ 1,925,775 54.95% $ 1,860,096 53.08%TARGA RESOURCES CORP $ 1,647,104 $ 762,745 $ 481,303 $ (884,359) -53.69% $ (1,165,801) -70.78%VALERO ENERGY CORP $ 1,710,274 $ 3,177,919 $ 1,892,153 $ 1,467,646 85.81% $ 181,880 10.63%WEC ENERGY GROUP INC $ 1,071,574 $ 2,390,694 $ 2,400,971 $ 1,319,120 123.10% $ 1,329,397 124.06%XCEL ENERGY INC $ 1,211,783 $ 2,753,619 $ 2,913,079 $ 1,541,836 127.24% $ 1,701,296 140.40%
Total $ 171,387,689 $ 167,251,930 $ 132,680,336 $ (4,135,760) -2.41% $ (38,707,353) -22.58%