Commercialization and Business Planning Guide for the Post ...
247
ADVANCED TECHNOLOGY PROGRAM’S NIST GCR-99-779 Commercialization and Business Planning Guide for the Post-Award Period Designed Especially for the Technology Entrepreneur prepared for The Advanced Technology Program National Institute of Standards and Technology Technology Administration United States Department of Commerce written by Jenny C. Servo, Ph.D. (716) 264-0510 © Dawnbreaker Press September 1998
-
Upload
khangminh22 -
Category
Documents
-
view
2 -
download
0
Transcript of Commercialization and Business Planning Guide for the Post ...

ADVANCED TECHNOLOGY PROGRAM’S
NIST GCR-99-779
Commercialization and Business Planning Guide
for the Post-Award Period
Designed Especially for the Technology Entrepreneur
prepared for
The Advanced Technology Program
National Institute of Standards and Technology
Technology Administration
United States Department of Commerce
written by
Jenny C. Servo, Ph.D.
(716) 264-0510
© Dawnbreaker Press
September 1998

Book design, figures, and tables by Jenny C. Servo, Ph.D.
Graphic design by Linda S. Sherman Design, Inc.
Previous Copyrights Knock their Socks Off: Making Winning Presentations to
Investors (1993); Business Planning for Scientists and Engineers (1995) and
Indicators of Commercial Potential (1996) by Dawnbreaker Press.
The authors have granted the U.S. Department of Commerce the right to publish
this document for government purposes. No part of this book may be reproduced
by anyone else, in any form, or by any means without express written consent of
the author.

ACKNOWLEDGMENTS
I would like to thank Rosalie Ruegg, Richard Spivack, and Robert Sienkiewicz for
making it possible to develop this book. In particular, I would like to thank Rosalie
for her vision, trust, and patience during the completion of this project. I would like
to express my gratitude to Jeanne Powell for providing editorial insights during the
final stages of the project. I would also like to thank the Principal Investigators of
the ATP as well as SBIR and EM-funded companies with which we have worked.
Your questions have led to the development of a book which I hope will be of
unique assistance.

FOREWORD
About the Advanced Technology Program (ATP)
Started in 1990, the Advanced Technology Program (ATP) is a unique partnership
between U.S. industry and government—one that is designed to advance the
nation’s competitiveness. ATP invests in industrial projects that, although high-
risk, have the potential of yielding high payoffs for the nation. The program is
industry-driven, with all projects envisioned, planned, and carried out by U.S. busi
nesses. Both small and large companies, individually or as members of a joint ven
ture, are eligible to participate in the program.
Companies become involved with the Advanced Technology Program
through announced competitions. All competitions are open to single-company
applicants (small, medium, and large firms), as well as to joint ventures. A rigorous
peer-review process is used to evaluate proposals against publicly announced selec
tion criteria. Awards are made for proposals that score high on technical, business,
and national economic merit. From 1994 through 1998, most of ATP’s funding was
applied to focused program areas. Focused Program Competitions channeled sup
port to a technology cluster of related projects. These clusters included:
◗
◗
◗
◗
◗
◗
◗
◗
◗
◗
◗
◗
◗
◗
◗
◗
◗
Adaptive Learning Systems
Catalysis & Biocatalysis Technologies
Component-based Software
Digital Data Storage
Digital Video in Information Networks
Information Infrastructure for Healthcare
Manufacturing Composite Structures
Materials Processing for Heavy Metals
Microelectronics Manufacturing Infrastructure
Motor Vehicle Manufacturing Technology
Photonics Manufacturing
Premium Power
Selective-Membrane Platforms
Technologies for the Integration of Manufacturing Applications
Tissue Engineering
Tools for DNA Diagnostics
Vapor Compression Refrigeration Technology

In each year from 1990 through 1998, ATP also held a General Competition; these
annual competitions were open to all technologies. ATP is currently experimenting
with alternative forms of competition.
ATP awards vary in size. Awards to individual companies are limited to $2
million for a three-year period, and are limited to covering direct research and
development costs only. Fortune 500 companies, or the equivalent, must provide
at least 60 percent of total project costs. Irrespective of the size of the company,
single applicants must cover their own indirect costs. This helps to assure their
commitment and encourages faster commercialization. Awards to joint ventures can
cover a period of up to five years. Joint ventures often take the form of a supplier
chain, acting as a virtual corporation for purposes of this project. Joint ventures must
provide more than 50% of the resources required to complete the project. Again,
this is to assure a high level of commitment on the part of award recipients.
Historically, small businesses have fared well in this program. Of the 352 single
applicant awards made between 1990 and 1998, 146 were made to small businesses.
Of the 119 joint ventures funded during this same period, 39 were led by small
businesses.
ATP funding is for research, not product development. As a result, compa
nies whose ATP funding is ending must locate other sources of funds in order to
make their technologies commercially successful. The objective of this guide is to
assist ATP awardees during this post-award period. Our aim is to help companies
deepen and refine their business plans, as well as attract funding to continue with
the development and commercialization of their technologies.

Table of Contents
SECTION 1 BASIC CONCEPTS
– Meeting the Challenge
– A Financing Primer
– Commercialization Strategies
– Complex Strategies for Rich Technology Platforms
– Licensing
– Teaming for Success
– Equity Investments
SECTION 2 PRESENTING YOUR OPPORTUNITIES
TO EQUITY INVESTORS
SECTION 3 THE WORKBOOK
SECTION 4 INDEX AND BIBLIOGRAPHY

Section 1B
AS
IC C
ON
CE
PTSSection 1
B A S I C C O N C E P T S Meeting the Challenge
A Financing Primer
Commercialization Strategies
Complex Strategies for Rich Technology Platforms
Licensing
Teaming for Success
Equity Investments

1
CHAPTERMeeting the Challenge
PR E L U D E
WH AT M A K E S T H I S B O O K U N I Q U E?
IN T E N D E D A U D I E N C E
CO N C L U S I O N

© DAWNBREAKER PRESS, 1998 M E E T I N G T H E C H A L L E N G E 5
MEETING THE CHALLENGE C H A P T E R1
Prelude
The ATP Commercialization and Business Planning Guide for the Post-Award
Period is a combination text and workbook, with one objective—to increase the
likelihood of commercialization success by companies which receive funding
through NIST’s Advanced Technology Program (ATP). Meeting this objective is a
tall order—and one which a book cannot accomplish on its own. To be of value,
ATP awardees should use the Guide frequently. Pick it up when you first receive
notification that you have won an ATP award, and continue to use it until your pro
gram is complete. “Using” the book doesn’t imply merely dusting it off now and
then for casual reading, but instead means working through the activities found in
the workbook. The activities take time to complete and are intended to create cog
nitive dissonance. In other words, they are designed to help the technology entre
preneur develop new business habits—and part with misconceptions.
Most of you will need help “staying the course.” I recommend that you
seek assistance from members of your Board, staff, advisors, state service providers,
and consultants. As long as the assistance is timely, affordable, motivating, and the
result of solid experience, it does not matter who provides it. Advisors can help you
with the sometimes-difficult task of putting these workbook activities on the front
burner while at the same time keeping you focused on the demands of your core
business. Advisors can also help ensure that that the quality of the work you
accomplish is appropriate to the task with which you are faced.
What Makes this Book Unique?
During the past several years I have had the opportunity to view dozens of
ATP-funded companies from various perspectives and to compare them with
firms that receive funding through other Federal programs. It appears that ATP-
funded firms face some unique problems and issues that arise as a consequence
of the revolutionary nature of the technologies often funded by the Advanced
Technology Program.
The ATP program is intended to promote U.S. competitiveness by sup
porting high-risk R&D in technology areas where there is substantial potential for
enhancing U.S. economic growth. ATP awards vary in size, are multi-year, require a
funding match, and can be made to single companies or joint ventures, including
This book is intended for
use ONLY during the post
ATP-award period. Be sure
to refer to ATP documents
for guidelines on proposal
preparation. Do not use this
book for that purpose.
Seek the involvement of
an experienced, motivating
mentor. A mentor can be a
state service provider or a
consultant. Or, you can find
a mentor among:
◗ your Board of Directors
◗ your staff
◗ your Board of Advisors
ATP gathers feedback on
business and economic
developments from
awardees on a quarterly
basis, through the ATP
Business Reporting System.

UNIQUE ISSUES:
• many suitors for “hot”
technology
• more complex commercial
ization strategies required
• rich technology platform
makes focus a challenge
• more sophisticated
planning
• more rapid learning curve
6 M E E T I N G T H E C H A L L E N G E © DAWNBREAKER PRESS, 1998
both large and small firms. ATP succeeds in attracting firms that work in advanced
technology areas. As a result, ATP awardees often have unique needs. For example:
◗
◗
◗
◗
◗
Some of the technologies funded by ATP are “hot.” Therefore, once an
ATP award is announced, a small company may suddenly find itself
flooded with inquiries and suitors. On the surface, this would appear to
be an enviable situation. However, there is a downside: the company is
suddenly thrust into the position of having to make quick, far-reaching
decisions about partners, commercialization strategies, and valuation.
A related problem is that many small, innovative companies do not yet
have the basis for understanding how much money or effort it truly takes
to bring a product to market. As a result, they either avoid or rush into
arrangements, without understanding the full implication of their actions.
Technologies funded by ATP frequently affect multiple industries. As a
consequence, an ATP awardee needs to contemplate the implementation
of a far more complex “constellation of strategies” to exploit his/her com
pany’s particular technology. Again, this requires the awardee to think
quickly—and strategically—across diverse industries. This is difficult for
even the most skilled businessmen and businesswomen to do. Once a
multi-faceted strategy has been mapped out, the awardee must wisely
select the initial focal point of his/her efforts. When confronted with
many options, it is easy to inadvertently squander precious time, energy,
and resources.
Perhaps as a consequence of the problems faced by awardees early on,
many ATP-funded start-up companies engage in private placements as a
means of financing early-stage growth. Different financing options
require different types of documentation. Often there is confusion about
the differences in style and purpose of business plans used externally
with debt and equity financing, and the prospectus and private place
ment memoranda used with Initial Public Offerings (IPOs) and private
placements.
The prospect of rapid growth requires that a company’s founder spend
more time planning, and that he or she remain focused, so as to steer the
course of a rapidly moving enterprise. From a human resource perspec
tive, rapid expansion is much like an uncontrolled chemical reaction:
highly unpredictable. Growth, therefore, requires a mixture of diplomacy,
vision, energy, and flexibility on the part of the founder.

Companies that receive ATP funding appear to face a sharper and more rapid learn
ing curve than other companies do. As a consequence, the Guide places a special
emphasis on the special issues raised above, at the same time that it attempts to
provide some of the fundamental business knowledge that any technology entre
preneur must master. Throughout the Guide, reference is made to unique consider
ations in biotechnology, information technologies, and other advanced fields.
This ATP Guide is divided into three sections. Section 1 contains seven
chapters and provides the reader with a cognitive framework in which various com
mercialization issues can be considered. Section 2 is a tutorial that describes how to
make a winning presentation to equity investors and/or potential strategic allies.
Section 3 is a workbook of activities which can be completed selectively by the
ATP awardee.
Section 1 opens with this prelude. Following this introductory chapter, it
provides a Primer to Financing Options, intended to introduce the reader to the
domain of available options. A simple typology of commercialization strategies is
presented in Chapter 3. With the framework in place, the reader is then introduced
in Chapter 4 to the complexities posed by having a rich technology platform. In
such situations one must consider the myriad of ways in which to best exploit the
technology. The result is a constellation of strategies which may be applied to vari
ous upstream and downstream applications. Finally, Chapters 5 - 7 provide a more
in-depth treatment of three financing options.
Section 2 provides a sample presentation to equity investors. It is divided
into four parts: Company/Technology/Product, Market Assessment, Goals and
Objectives, and Challenges/Requirements/Opportunities.
Once the reader understands the financing options available, he or she
needs to prepare to meet the demands of the following tasks: (1) select the best
strategy; (2) convey the opportunity to others; (3) understand the value of an oppor
tunity as well as the expenses associated with its commercialization; (4) make a log
ical case for investment by a strategic ally/investor; (5) engage in successful negotia
tions with appropriate partners or investors; and (6) successfully guide the growth of
his or her firm. For most small companies, success in these endeavors requires
increased business acumen. Section 3 of the Guide is designed to sharpen these
business skills.
Intended Audience
This book was written expressly for both ATP awardees and their advisors. It is
directed at the technology entrepreneur. Much of the advanced information con
tained in Section 1, while new for many ATP awardees, should constitute the
© DAWNBREAKER PRESS, 1998 M E E T I N G T H E C H A L L E N G E 7
This book was written for
both ATP awardees and their
advisors to use during the
post-ATP-award period.
However, other companies
will also find the materials
useful.

Lack of knowledge, tradition
al biases, an overwhelming
amount of work, and high
expectations are often a
deadly combination.
8 M E E T I N G T H E C H A L L E N G E © DAWNBREAKER PRESS, 1998
knowledge and experience base of a skilled advisor. Thus, Section 1 is designed to
impart both basic and more advanced information to awardees, with respect to
funding and partnering options.
Section 2 provides guidance on a method for succinctly representing an
awardee’s opportunity in an oral presentation to private sector investors.
Section 3 has a different objective. It outlines a variety of activities which
the ATP awardees can address on their own. At the same time, the awardee’s advi
sor can selectively recommend activities from Section 3 once he or she has deter
mined the weak points in an ATP firm’s preparation.
The reason for including a workbook in this Guide merits more than pass
ing mention. When confronted with inquiries from potential investors and allies,
pressures to grow rapidly, and the need to make quick and profound judgments, an
entrepreneur may be inclined to turn such responsibilities over to a consultant.
This is not the appropriate course of action, however. A technology entrepreneur
MUST be actively involved with all such decisions. Just as a product concept
evolves and changes over time, so, too, must the business acumen of the technology
entrepreneur. Failure to expand one’s understanding of the business will sooner or
later have profound—and usually negative—consequences for the company. Such
consequences include: (1) pursuing less promising product concepts; (2) missing the
market window of opportunity; (3) making poor hiring decisions; (4) picking the
wrong partners; (5) harboring unrealistic expectations; (6) overextending one’s
finances; (7) being blindsided by a competitor’s actions; and (8) failing to negotiate
a win-win relationship with investors and partners. Although preparation is not an
antidote to all of these problems, one stands a far better chance of responding
appropriately if well prepared.
The solution to these problems is not merely a function of money. Without
preparation, money is insufficient. Why am I so convinced that money is not
enough? In the mid-1980’s, I worked as a consultant to a Fortune 500 company
with an “intrapreneuring” program. One of my roles was to assess the training
needs of these intrapreneurs and to outline some of the problems of the fledgling
ventures—a unique opportunity.
The premise behind the intrapreneuring experiments of the 1980’s was the
belief that if one could combine entrepreneurial vision and zeal with the resources
of a large company, success could more readily be realized. Therefore, technology
entrepreneurs from within a company—intrapreneurs—were sent to skunk works or
corporate incubators and provided with whatever resources they required.
Unfortunately, the expectations—at least for this company’s intrapreneuring pro-
gram—were not realized. While there were many reasons, the key seemed to be
the failure of the technology entrepreneurs to adequately increase their business
acumen. Lack of new knowledge and traditional biases, combined with an over
whelming amount of work and high expectations, is a deadly combination.

The good news is that most scientists and engineers can learn the business
skills needed to be successful. But training must be flexible, experienced profes
sionals must provide it, and it must offer a structure that makes the designated
activities a priority. We have used this approach with hundreds of technology entre
preneurs and have demonstrated its effectiveness.
How to Use This Book
The objective of this workbook is to provide you, the ATP awardee, with a way of
increasing your business know-how at a speed commensurate with the challenges
ahead. New information that results from the workbook activities should be synthe
sized and compiled into a set of useful documents, all of which become part of your
commercialization toolkit. Recognizing that it is always difficult to add planning to
an already busy schedule, it is highly recommended that you seek a skilled advisor
to work with you on completing these activities. In fact, your advisor should
become your sparring partner. This person should be vested in your success, rather
than your opinions, and should offer new ways of looking at things.
When to Use This Book
In this workbook, several assumptions have been made regarding when you will
require certain information and tools. Starting with a proposed schedule should
provide you with a clear idea of how to proceed. All companies and situations dif
fer, however, and the proposed schedule may not meet your exact needs. If this is
the case, make appropriate adjustments.
The figure on the next page provides an overview as to when certain docu
ments and activities should be completed. It is important to note that this book is
intended for use by ATP firms during the post-ATP-award period. During the
preparation of an ATP proposal, companies are expected to include a preliminary
business plan with their proposal. Be sure to consult ONLY ATP proposal prepara
tion documents for guidelines on how to produce that plan. Do NOT use the
Guide for that purpose. The Guide is intended for use ONLY in the post-award
period—that is, during the period following the announcement that a company has
received an ATP award. The purpose of this guide is to help ATP awardees to
“flesh-out” and enhance commercialization planning activities initiated at an
earlier time.
Most importantly, planning requires commitment. Unless you decide to
commit the time and resources required for thoughtful planning, you might be
caught off guard when opportunities and challenges present themselves.
© DAWNBREAKER PRESS, 1998 M E E T I N G T H E C H A L L E N G E 9
Commercialization Toolkit TM
◗
◗
◗
◗
Strategic plan
Licensing package
Business plan
Presentation materials

Suggested schedule for com
pleting various activities.
10 M E E T I N G T H E C H A L L E N G E © DAWNBREAKER PRESS, 1998
F I G U R E I I - 2 : S C H E D U L E F O R D E V E L O P I N G A C O M M E R C I A L I Z A T I O N T O O L K I T
READ
ORKBOOK A
OCUMENT E
W
D
CTIVITIES
NHANCEMENT
Chapters 1-7
1 - 6
Strategic Plan Licensing Package Business Plan & Presentation
7 - 9 1 0 - 1 4
Chapter 8
Announcement Start 6 months 12 months
T I M E L I N E
Conclusion
The purpose of the ATP Commercialization and Business Planning Guide is to pro
vide assistance to new ATP awardees. The book is divided into three sections:
◗
◗
◗
Section 1 offers an overview of financing options, with detailed informa
tion on licensing, corporate partnering, and equity investment.
Section 2 provides guidance on how to make a winning presentation to
potential equity investors, strategic allies, and/or potential licensees.
Section 3 is a workbook to be used by the technology entrepreneur on
his or her own or with the guidance of an experienced advisor to develop
specific components of a business plan.
For maximum benefit, you are urged to seek the involvement of an experienced
and motivating mentor or advisor. Working together through the various workbook
activities, you can synthesize and incorporate the material into a variety of docu
ments—documents that will become part of your Commercialization ToolkitTM.
Suggested outlines for the various documents that you are likely to need in the
commercialization of your technology are included at the end of various chapters in
Section 1. These include:
◗
◗
◗
◗
A strategic plan
A licensing package
A business plan
Presentation materials
The quotation on the following page is fictitious but offers insights into the types
of challenges and changes that are commonly experienced when commercializing a
rich technology platform.

One Company’s Perspective
When TechWest applied for ATP funds, we were already a going concern with
equity investment from two private individuals. We sought ATP funding as a
means to develop novel methods of production which would allow us to meet
perceived market need for our product.
Upon receiving the ATP award, our immediate challenge was to raise the addi
tional funding required to meet our overall business objectives. This took most of
my time, but we were successful in realizing our short-term financing goals.
Three years have elapsed since first receiving our ATP award. During this time,
my focus has shifted from inside management to customer-focused activities. I
have added staff to handle more of the day-to-day operations. This shift in role
was easier for me than for some founders, as my background is more on the busi
ness, as opposed to the scientific, side.
Customer interaction was vital to our company’s growth and surfaced new
opportunities which ultimately resulted in a shift away from our initial product
concept to a new focus. TechWest has always been open to investigating new com
mercialization strategies which would result in the creation of greater value.
As a consequence of this new focus, many changes were required in our firm. The
biggest challenge was changing the culture of the company. We had to shift from
being a relatively small, scientific, low-volume operation to a production-orient
ed, ongoing business. This required a change in emphasis from R&D to engineer
ing. Some personnel could not make this shift and are no longer with the compa
ny. This required management action and decisions.
Currently, we also outsource some significant work, and are extremely careful
about protecting our technological base while outsourcing. Outsourcing, by the
way, was not a part of our original intent.
To date, approximately $20 million of private sector financing has been invested
in the firm, from two sources: our initial private investors, who made multiple
rounds of financing, and a customer who made a minority equity investment.
My advice for other ATP firms: be persistent in seeking financing—do not take
“no” for an answer. Have an active and interested Board. Don’t be reluctant to
change focus when you can justify that another direction presents a better business
opportunity, and be prepared to make the necessary cultural shifts.
© DAWNBREAKER PRESS, 1998 M E E T I N G T H E C H A L L E N G E 11

A Financing Primer C H A P T E R
2 AD VA N C E D OR G A N I Z E R
AN EX P E N S I V E EN D E AV O R
WH AT D O Y O U WA N T T O B E
W H E N Y O U G R O W U P?
SW E AT E Q U I T Y
SC I E N C E - F O R -H I R E
DE B T F I N A N C I N G
EQ U I T Y F I N A N C I N G
AVA I L A B I L I T Y O F EQ U I T Y
F I N A N C I N G
STA G E S O F EQ U I T Y F I N A N C I N G
WH AT D O E Q U I T Y I N V E S T O R S
L O O K F O R?
WH AT D O E Q U I T Y I N V E S T O R S
WA N T I N R E T U R N?
CO N C L U S I O N

A FINANCING PRIMER C H A P T E R 2
Advanced Organizer1
The purpose of this chapter is to introduce the five broad areas of financing avail
able to technology entrepreneurs seeking to capitalize the growth of their firm:
sweat equity, publicly-funded R&D programs, debt, equity, and profit. Not all
forms of financing are available to companies at the same time. Debt financing
becomes available when the company has sufficient collateral. Equity investments
become increasingly available as technology and market risks are decreased. From
a financing perspective, the most difficult time for technology entrepreneurs is dur
ing the early R&D phase, when the private sector is loathe to make investments.
Sweat equity and R&D partnerships enable such companies to develop new tech
nology and position them to involve private sector capital once R&D risk has been
decreased.
An Expensive Endeavor
Commercialization is an expensive endeavor, and advanced technology firms have a
voracious appetite for money. As a result, technology entrepreneurs must thorough
ly familiarize themselves with different funding mechanisms. The scientist
shouldn’t approach financing by asking, “which type of funding do I prefer?” but
instead should assume that at different points in the life cycle of their business
they may need to use different types of financing to nurture and sustain their busi
ness. The questions to consider are as follows:
(1) How do the available financing methods vary as a function of the
stage of technology/product development?
(2) In what sequence should different financing options be considered?
(3) How can various financing options be kept available as commitments
to other creditors increase?
(4) How do personal goals and aspirations interact with the available
alternatives?
Why should financing methods be considered prior to the development of a busi
ness plan? The reason is simple: financing is a key variable in shaping the planning
process. It plays a part in every strategic consideration one makes.
In this chapter we will briefly introduce alternative methods of financing.
© DAWNBREAKER PRESS, 1998 A F I N A N C I N G P R I M E R 15
ATP awardees will have
already made certain
choices regarding financing
strategies. This chapter
pinpoints your location on
the financing roadmap,
while Chapters 3-6 provide
detailed insight into
strategies you may wish
to pursue.
1This chapter is an updated
version of Chapter 13 from
Business Planning for
Scientists and Engineers.

Without federally funded
R&D programs, many small
advanced technology pro
grams would not survive.
Private sector investors pre
fer to wait until technology
and market risks are
reduced before investing
their funds.
Generally speaking, there are five broad categories of financing that may be
used to capitalize a firm: sweat equity, publicly funded R&D programs, debt, equi
ty, and profit. The order of the list reflects the general sequence in which start-ups
tend to utilize them. Larger firms use the last five financing categories selectively.
Each of these broad categories will be discussed briefly, and then elaborat
ed upon later in this chapter.
F I G U R E 2 - 1 : M E T H O D S F O R F I N A N C I N G T H E S M A L L H I G H - T E C H F I R M
Sweat Equity
Science for Hire
Debt
Equity
Profit
The term “sweat equity” implies the use of uncompensated time and the
lending of one’s own resources to nourish the business during its earliest phases.
Periodically, when cash flow wanes, it is not uncommon for the founders of a com
pany to delay compensation for their work until a later time. Thus, the use of sweat
equity is a method that many technology entrepreneurs use to give birth to their
business as well as sustain it during periods of financial difficulty.
Many technology entrepreneurs support the preliminary development of a
technology through participation in publicly funded R&D programs. Public funding
sources include state programs and Federal arrangements such as the SBIR program
and the ATP. A variety of contractual arrangements are available through Federal
mission agencies, as well as through state programs, often aligned with Federal ini
tiatives.
Debt financing refers to the borrowing of money with the promise of full
repayment of the principal with interest. A variety of vehicles can be used for debt
financing, including secured and unsecured loans, promissory notes, bonds, leases,
supplier credit, and other debentures. Debt gives its owner the right to be repaid
the investment with interest irrespective of the success or failure of the business
venture. Debt financing can be considered when an individual or a company has
sufficient collateral.
A F I N A N C I N G P R I M E R © DAWNBREAKER PRESS, 1998 16

Equity financing is speculative in nature, as the financier is not guaranteed
repayment of the money invested. This is high-risk capital and therefore commands
hefty compensation—compensation that is commensurate with the degree of risk
taken. Vehicles used for equity financing include the receipt of stock through the
investment of venture capital, business angels, and investment bankers. The return
on an equity investment is dependent upon the success of the business. One reaps
a large financial reward if the company is successful and no reward if the company
fails. Equity financing is subordinate to debt financing, which means that in the
case of bankruptcy, debt financing arrangements must be honored before any pay
ment to equity investors may be made. Business angels are recognized as providing
the most lenient terms and for making smaller equity investments than entities in
the smaller, institutional investor market.
When making decisions regarding the capitalization of a firm with debt or
equity, many things need to be considered. The preliminary choice of debt or equi
ty has IRS implications, as taxation is handled differently with these two methods
of financing. Interest paid on the repayment of a debt is tax deductible. However,
dividends paid on equity investment must be paid with after-tax dollars. This
debt-equity decision also raises control issues. For example, the most common evi
dence of an equity investment is the issuance of common stock. The owners of
common stock have voting rights that give them a say in the management of your
company. Debt can also be changed to equity. A good discussion of these two meth
ods of capitalization can be found in A Desk Book for Setting Up a Closely Held
Corporation, by Robert Hess (1985).
As a company grows and becomes successful, profit is accumulated—profit
that can be used to fund various business needs and decrease reliance on external
sources of capital.
What Do You Want to be When You Grow Up?
Exactly which sources of financing are available to a firm become clear after reflect
ing on a company’s vision. Three prototypical visions exist (Hisrich & Peters,
1989), as follows:
◗
◗
◗
The life-style firm
The high-potential venture
The foundation company
Equity financing is
subordinate to debt financing.
© DAWNBREAKER PRESS, 1998 A F I N A N C I N G P R I M E R 17

Although it is important to
recognize if yours is a
lifestyle company, it is not
recommended that you label
your company as such when
talking with external
audiences.
Different visions:
• Life-style company
• Foundation company
• High-potential venture
T A B L E 2 - 1 : D I F F E R E N T V I S I O N S F O R T H E F U T U R E
Revenue #Employees Purpose Private/Public
Life-Style $2 million 30-40 support owners Private
Foundation $10-30 million 40-400 start new industry Private
High-Potential $20-30 million 500 growth & value Go public
If your intent is to develop a company that will remain fairly small, allow
you to pursue your technical interests, and support you and a few others, yours is
aptly described as a life-style company. Such a company sees itself as having rev
enues of $2-3 million within five years and employing 30-40 people at the most.
Such a company is NOT of interest to the venture capital or investment banker
community, as their purpose in making an investment is to realize a large return
through involvement with fast growth companies. You may find local business
angels to be amenable to small investments, however, if you have a good business
plan and a good team. Life-style firms are best served by pursuing licensing
arrangements, strategic alliances, debt financing, and growth from reinvestment of
profit.
At the other extreme are high-potential ventures. Such firms envision rev
enues in excess of $20-30 million in five to seven years, and anticipate going public
as a means of cashing out and creating value for their investors. A company founder
who selects this path must anticipate that he or she will be stretched to the limits of
their capabilities; will need to involve a multi-disciplinary team early in the compa
ny’s life; will need to become facile with different financing options; and will need
to master coalition building. As if that is not enough, technology entrepreneurs who
aspire to create a high-potential venture must also recognize that that they may
have to step aside when the company goes public if they are unable or unwilling to
redirect energies to investor relations upon becoming a public firm.
If you are looking to be an industry leader and to grow a company hard and
fast, then you are developing a high-potential venture. All forms of financing will be
open to you at different points in the development of your company. The Advanced
Technology Program funds companies with a bold vision for growth and impact.
The foundation company lies somewhere between these two extremes.
The founder has both the technology and the desire to be an industry leader, yet
wants to grow the company in a less meteoric fashion. The technology entrepreneur
is not attached to having the firm remain small, and sees the company developing
A F I N A N C I N G P R I M E R © DAWNBREAKER PRESS, 1998 18

capabilities in all business functions, as is appropriate. The management team is
often more conservative with respect to its involvement of equity investors, and
chooses to have the company remain privately held. The desire to remain privately
held differentiates the high-potential ventures from the foundation companies.
A more detailed treatment of the five major categories for financing a busi
ness follows.
Sweat Equity
The first type of financing commonly used by any entrepreneur is sweat equity.
How the issue of sweat equity is handled depends upon your vision for the future.
If your goal is to develop a high-potential venture, be forewarned that equity
investors putting cash on the line will not be impressed by your investment of time
and passion. As far as equity investors are concerned, if you have little capital
invested in your company, you are not heavily committed. Because your financial
commitment may be represented in the form of collateral as well as cash, keep good
records on the equipment, real estate, and other hard assets that can be counted as
collateral applied to this endeavor.
If you defer compensation during periods of poor cash flow, be sure to keep
good records regarding the cash owed to you by the corporation and have formal
agreements with the company regarding terms of repayment. In addition, talk with
your accountant about what is involved with converting debt to equity in the event
that you wish to change the terms of repayment (Blechman and Levinson, 1991).
Another important factor to be attentive to when using sweat equity is the
question of how to handle intellectual property developed with your own resources
prior to forming your company. If you have clear title to such intangible assets, and
if they provide the foundation for your firm, formalize the relationship of those
assets with your company. This can be done either by licensing rights to your firm
or by selling the intellectual property to the firm. A useful resource to consult for
ideas is Write Your Own Business Contracts (Barrett, 1990).
Sweat equity is invested not only by founders but also sometimes by serv
ice providers. It is not uncommon for founders to seek the assistance of service
providers on a speculative basis. When cash is lean, entrepreneurs often seek patent
attorneys, market research firms, business consultants, and other recruits to the
management team who are willing to become involved “on spec” (speculation). It is
important that you keep in mind that such service providers are taking a big risk
and are, therefore, likely to ask for a substantial return. Be sure to have contractual
arrangements with every party who becomes involved with your company in this
fashion. Be aware that, if you give away a substantial portion of your company at the
outset, you will have little to bargain with later on when more cash is needed. Be
© DAWNBREAKER PRESS, 1998 A F I N A N C I N G P R I M E R 19
At the “possibility” stage, a
young company requires the
passion and enthusiasm of
the founder and a few others
involved in the firm. These
individuals form a special
relationship as a result of
their strong personal
commitment.
Protect your intellectual
property rights.
Owner’s equity refers to
the initial capitalization of a
company by one or more
founders.

sure to think through the relative merits of debt and equity repayment to profes
sionals who have applied their skills and time to your project on spec. Consult an
accountant and/or an attorney regarding the long-term implications of such
arrangements.
F I G U R E 2 - 2 : R O A D M A P O F F I N A N C I N G O P T I O N S
Most ATP
awardees are at
Sweat Equity
Debt
Business angels
Venture capital
Investment Banker
Accountants
Association
Attorneys
Bankers
Brokers
Consultants
Databases
Print media
Equity
Profit
Science-for-hire
Founders
On spec
Federal
State
Corporations
Family, friends
Banks
Finance Co.
Leasing
Fed & State
High Risk Basic Science Mission Hybrid
ATP NSF DoD DOE NASA NIH
this point
MEP SBDC
Licensing Partnerships
A F I N A N C I N G P R I M E R © DAWNBREAKER PRESS, 1998 20

R&D Partnerships
A financing mechanism sought by many advanced technology firms is a Research
and Development partnership. Such arrangements allow the entrepreneur to devel
op intellectual property that can be commercialized through his/her company while
working with other organizations. In various ways, Federal, state, and private
sources provide such opportunities. The Advanced Technology Program (ATP) is
unique in sharing the costs of high-risk technology that result in general economic
growth. The Small Business Innovation Research Program (SBIR) provides funding
to small businesses with innovative technologies that can solve problems of specific
interest to the Federal government. Many of the mission agencies—including the
National Aeronautics and Space Administration (NASA), the Department of
Defense (DoD), the Department of Energy (DoE), and the National Institutes of
Health (NIH)—also contract with technology firms to develop products and servic
es the Agencies wish to buy. The National Science Foundation (NSF), in contrast,
has historically focused on making grants to academic institutions for basic research.
ATP projects are selected on
the basis of their:
• scientific and technologi
cal merit (50%), and
• potential for broad-based
economic benefits (50%)
—ATP Proposal
Preparation Kit,
November 1998
F I G U R E 2 - 3 : R E S E A R C H A N D D E V E L O P M E N T P A R T N E R S H I P S
Sweat Equity
Debt
Equity
Profit
Science-for-hire
Founders
On spec
Federal
State
Corporations
High Risk Basic Science Mission Hybrid
ATP NSF DoD DoE NASA NIH
MEP SBDC
Licensing Partnerships
© DAWNBREAKER PRESS, 1998 A F I N A N C I N G P R I M E R 21

The various R&D partnership
programs conducted by the
Federal government and
buttressed by state programs
provide an excellent and
essential bridge between the
sweat and owner’s equity
invested by the founders,
and the private sector
investments made by lending
institutions and equity
investors.
22
Most federally funded R&D programs allow the entrepreneur to retain
rights to the intellectual property created while performing the work funded in
whole or in part by the Agency. It is the right to retain ownership that provides
incentives for the entrepreneur and provides small businesses with the opportunity
to commercialize. The government typically receives a non-exclusive license to the
technology for government purposes.
Many states also support federal initiatives through services offered by
Manufacturing Extension Programs or Small Business Development Centers.
Another source of funding for Research and Development partnerships is
large corporations. The development and exploitation of a rich technology platform
require considerable resources, and Federal Research and Development programs
will likely only take an awardee part way through the R&D process. In most cases,
the technology entrepreneur must team with other entities in order to commercial
ize the technology. Licensing and Research and Development partnerships provide
excellent opportunities for small companies to extend their effectiveness in bring
ing technology to market. Licensing will be discussed in detail in Chapter 5, and
Research and Development partnerships will be explored in Chapter 6.
Research and Development partnerships can be extremely advantageous to
small advanced technology firms, especially if the entrepreneur views this work as
an opportunity to develop intellectual property that can be used as the foundation
for his or her business. With such arrangements, the money does not have to be
repaid, nor equity parted with. If performing Research and Development for or in
partnership with, the Federal government, the government will receive a non
exclusive license for government purposes on intellectual property created.
However, you will retain all other rights.
Debt Financing
While an R&D Partnership method of capitalization can be highly beneficial, it will
only take you so far. At various times in the evolution of your firm, you will need to
consider debt financing. As mentioned earlier, debt financing gives its owner (the
lender) the right to be repaid the investment with interest irrespective of the suc
cess or failure of your business.
When should you consider such financing?
◗
◗
◗
◗
◗
when you need assistance with cash flow while performing on Research
and Development contracts;
when you need working capital and you wish to retain as much equity as
possible in your firm;
when making large purchases of equipment, buildings, or real estate;
when planning acquisitions; or
when you wish to refinance existing debt
A F I N A N C I N G P R I M E R © DAWNBREAKER PRESS, 1998

There are various debt instruments and various organizations from which you can
seek debt financing. Typical debt instruments include:
◗
◗
◗
◗
Promissory notes
Secured & unsecured loans
Lines of credit
Factoring
Debt financing can be obtained from family and friends, banks, finance companies,
leasing companies, brokerage houses, mutual funds, and state and Federal govern
ment agencies. In most instances a short-term loan is considered to be less than one
year in duration, whereas a long-term loan is usually one made over a period of one
to five years.
F I G U R E 2 - 4 : S O U R C E S O F D E B T F I N A N C I N G
Most ATP
Sweat Equity
Business angels
Venture capital
Investment Banker
Accountants
Association
Attorneys
Bankers
Brokers
Consultants
Databases
Print media
Equity
Profit
Science-for-hire
Founders
On spec
Federal
State
Corporations
Family, friends
Banks
Leasing
Fed & State
High Risk Basic Science Mission Hybrid
ATP NSF DoD DoE NASA NIH
awardees are at
this point
Debt Finance Co.
MEP SBDC
Licensing Partnerships
© DAWNBREAKER PRESS, 1998 A F I N A N C I N G P R I M E R 23

Borrowing from Friends and Family
When borrowing from family and friends, both you and they take a risk. Important
relationships may be damaged if you fail to honor your debt. Also, such lenders may
assume that they own part of your business and try to act as equity investors med
dling in the daily activities of your firm. Such problems can be avoided, however. In
a brief article entitled “How to Borrow from Family and Friends” (Inc, July 1995),
one entrepreneur describes how he successfully used this source of financing during
the first year of his start-up. He first formalized the relationship with each lender by
drafting Promissory Notes due within a specified time period. An option was added
to each Note allowing him to roll the loan over as necessary; in addition, an interest
rate was agreed to. The entrepreneur’s intent was to view these loans as short-term
and shift to bank debt within a year. He did this successfully while maintaining
good relationships with all involved.
Another important item to note is that the IRS may examine such arrange
ments to see if they are truly debt or equity financing. Be sure to discuss this matter
with your accountant and consult Hess’s book for ideas. A good Promissory Note
should clearly indicate the name of the person to whom debt is owed, the maturity
date, who is obligated to pay the debt, the interest due, the right to enforce pay
ment, and the status of the debt relative to other forms of financing.
Borrowing from Banks
Banks are becoming more interested in attracting and retaining small businesses as
clients. This is because many large businesses are going elsewhere to meet their
capitalization needs, since it is easier for them to obtain equity capital and funds
from institutional debt markets. However, the problem for banks is that there is also
a good deal of competition for small business from commercial finance and asset
based-lending firms, leasing companies, brokerage houses, mutual funds, and
microenterprise lending institutions. (Small business is defined by banks as compa
nies with revenues less than $5,000,000.)
Once your company has developed sufficient history, you may wish to
approach commercial banks again for a loan or a line of credit for your business.
Most resources indicate that in order to make this an option, you should develop a
relationship with your banker. You need to educate your banker regarding your
business, your business plan, and your annual sales projections. Personal credibility
develops trust.
As was mentioned earlier, there are many sources that one can approach for
debt financing besides banks. In all cases, before approaching a lender, one should
take stock of the assets that they have and try to match these assets with the appro
priate type of lender to approach. An excellent discussion of how to proceed with
A F I N A N C I N G P R I M E R © DAWNBREAKER PRESS, 1998 24

this is found in Guerrilla Financing: Alternative Techniques to Finance Any Small
Business, by Blechman and Levinson (1991). Most lenders require collateral for
loans, that is, something that can be sold to reimburse them for their loan if you
default. One form of collateral that is interesting to explore is receivables.
Receivable-Lending Institutions and Factors
When a company has a receivable, such as a contract, back order, purchase order, or
work in progress, it can consider approaching a receivable-lending institution or a
“factor” (see explanation of factors, below) for financing. A receivable-lending insti
tution is often a division of a commercial bank that uses receivables as collateral in
providing a loan. The money is usually provided as a line of credit for up to 60 days.
The amount advanced is a percentage of the receivable and varies with the size of
the invoice. Interest rates on such arrangements are typically higher than on tradi
tional secured loans (Garner et al., 1994).
A closely related form of debt financing to cover short-term needs for work
ing capital is a revolving line of credit. Working capital loans of this nature are usu
ally short term (less than a year) and can be secured or unsecured. If the company is
in the start-up mode, the founders may need to pledge the use of personal assets
for collateral. Unsecured loans are a possibility for companies with outstanding
credit histories.
Start-up companies will again have a tough time here, as such institutions
will look at the financial history of your company and the creditworthiness of your
receivables. Certainly, if you are using a contract with the Federal Government as a
receivable, the customer is creditworthy. However, if you are a brand new start-up,
your company will not have any financial history.
Another source that can be approached with receivables is an entity
referred to as a factor. Finance companies often serve as factors. They operate in a
very different fashion than banks. According to Blechman and Levinson, start-ups
and companies with poor credit would find greater receptivity from a factor than
they might from a receivable-lending institution. The fees charged by factors vary
and can be hefty. Finance companies do not have the same regulations placed upon
them as banks, and thus are willing to take somewhat more risk than a bank. For a
good discussion of the pros and cons of factoring and receivable-lending institu
tions, consult Guerrilla Financing by Blechman and Levinson and the Ernst & Young
Guide to Financing for Growth by Garner et al.
© DAWNBREAKER PRESS, 1998 A F I N A N C I N G P R I M E R 25

Leasing
Before making a decision to purchase equipment, land, buildings, or any other tan
gible asset, consider leasing. This will require that you talk with your accountant
about the pros and cons of such decisions, including the impact leasing will have on
your balance sheet. Why your balance sheet? Scientists use calibration devices all
the time, and so do investors. All sources of capitalization look at the health of your
business by examining financial ratios that are based on either your Balance Sheet
and/or your Income & Expense Statement.
The Balance Sheet is a snapshot of your business at a specific point in time.
It is the only financial record in which you will see the phrases “assets” (A), “liabili
ties” (L), and “shareholder equity” (E). A formula is applied to demonstrate the
relationships among these items:
Assets = Liabilities + Shareholder’s Equity
Tangible assets include items such as Cash, Accounts Receivable, Loans to
Stockholders, Land, Equipment, Real Estate, and Pre-Paid Expenses. Liabilities
include items such as Accounts Payable, Loans from Stockholders, Retainers, and
Advances. The decision to purchase or lease a tangible item affects whether or not
it is considered an asset on your balance sheet and will affect the ratios or measur
ing devices that investors examine. Leasing is referred to as “off-balance-sheet”
financing, because it does not appear as an asset on the balance sheet, and because
only the payments that become due show as a liability. Therefore, if you know that
you are going to need a loan, you will want to make your balance sheet look as good
as possible. A good accountant can advise you how the lease/buy decision will affect
your balance sheet.
There are, of course, other more obvious reasons to lease: (1) if you want to
avoid a large cash outlay, (2) if you don’t wish to purchase equipment which may
become obsolete, or (3) if your production volumes favor leasing over buying, or
vice versa.
In a lease scenario, the entity providing the lease is referred to as the lessor
of the property. The entity obtaining the lease is referred to as the lessee. There are
two broad categories of leases: traditional and modified. Other types of leasing
arrangements-referred to as venture leases, master leasing real estate, sale and
leaseback financing-are discussed in detail in the texts by Garner and Blechman &
Levinson referenced previously.
A F I N A N C I N G P R I M E R © DAWNBREAKER PRESS, 1998 26

Supplier Credit
You may not consider it debt financing, but companies with good credit ratings ben
efit from the 15- to 30-day terms their suppliers provide at 0% interest. If you can
speed up the rate at which your customers pay you, you can minimize the need for
other interest-bearing loans to pay your suppliers. You can speed up the rate at
which your receivables are paid by billing at the time services are rendered (instead
of waiting till a specific time each month) or by providing customers with an incen
tive to pay quickly. Other good money management techniques include requesting
progress payments and up-front mobilization fees.
Federal and State Programs
A wide variety of programs provide debt financing to small businesses at both the
Federal and State levels. The incentive is always new job creation. Companies with
500 or fewer employees (the SBA’s definition of a small business) are important
drivers of the economy. Information on these programs is available from your local
Small Business Administration office, an SBDC (Small Business Development
Center), or your local Chamber of Commerce.
Equity Financing
The phrase “equity financing” refers to a class of investments that share a number
of common features. First, from the investor’s perspective, equity financing is spec
ulative. With all forms of equity investments, no guarantees exist that investors will
be repaid. Realizing a return on such an investment is dependent upon the success
of your business. An investor reaps a large financial reward if your company is suc
cessful and no reward if your company fails. For this reason, equity investors com
mand hefty compensation commensurate with their risk.
Another feature that equity investors share is ownership in your business.
Equity implies the exchange of stock in return for money—as it is through owner
ship that the investor will profit from the success of your firm. For this reason,
founders must decide if they are willing to share the control, as well as the risks and
rewards of their company.
Sources of equity investments include professional venture capitalists
(sometimes referred to as traditional or institutional investors and venture funds),
business angels (also referred to as the nontraditional or informal investment com
munity), and investment bankers. Common vehicles utilized by this community for
raising funds and/or cashing out include Private Placements and Initial Public
Offerings (IPOs). The Securities Exchange Commission (SEC) as a means of
© DAWNBREAKER PRESS, 1998 A F I N A N C I N G P R I M E R 27

More detailed information on
equity financing can be
found in Chapter 7.
28
protecting unqualified investors from unscrupulous entrepreneurs regulates both of
these activities. As an aside, the SEC considers qualified or accredited investors
to include:
◗
◗
◗
◗
◗
Company officers and directors
Individuals with an annual income of over $200,000 annually
Individuals whose net worth is over $1 million
Broker/dealers
A wide range of financial institutions are also considered accredited or
qualified investors (See The Entrepreneur’s Guide to Going Public by James
Arkebauer for more details)
A modified version of the model we have been developing is depicted
below. It shows the primary sources of equity investments and the wide range of
intermediaries that often serve as a buffer between entrepreneurs and equity
investors. This community, more than any other, relies heavily on the use of inter
mediaries. Although one can also go directly to equity investors, the recommenda
tion of a trusted intermediary is often beneficial.
F I G U R E 2 - 5 : E Q U I T Y I N V E S T O R S
Sweat Equity
Business angels
Investment Banker
Profit
Science-for-hire
Debt
Venture capital
Brokers
Accountants
Attorneys
Databases
Print media
Association
Consultants
Bankers
Equity
Availability of Equity Financing
The availability of equity financing from business angels, venture capitalists, and
investment bankers varies widely. Although one hears frequently about the venture
capital (VC) community, the business angel market is considerably larger.
A F I N A N C I N G P R I M E R © DAWNBREAKER PRESS, 1998

Business Angels
Business angels are typically self-made individuals with large net worth. This group
includes medical professionals, lawyers, accountants, successful entrepreneurs and
middle managers looking to move out of large corporations. The transactions of
angels are unregulated, so it is hard to determine the actual size of this risk-capital
pool. Some have estimated this to be a $50 billion-per-year capital pool, and others
estimate it to be considerably higher. There is wide agreement, however, that this
pool provides the largest source of financing for start-ups in the country. It is esti
mated that angels have backed between 50,000 and 100,000 companies and that
29% of angel funding has been provided at the seed stage (Wetzel, 1989;
Hughes, 1989).
Institutional Venture Capital
By comparison, the size of the venture capital market is smaller and varies
tremendously from year to year. For example, the total amount of venture capital
committed in 1980 was $661 million. In 1996 it reached a high of $11.6 billion.
According to the Wall Street Journal (August 1998), 1998 could be the best year
ever. The highest investments have been in communications, computers, software,
and biotech.
Clear geographic patterns exist in venture capital investments. In 1997, a
total of $8.5 billion was invested in the internet, and a sizable part of that was
invested in Silicon Valley. In the second quarter 1998, one-third of all venture capi
tal investments was made in Silicon Valley ($1.25 billion, in 224 companies). New
England came in second with $379.5 million invested in 86 companies, and the
Southeast region received $348.2 million, invested in 73 companies.
Historically, the venture capital (VC) market has been far more conservative
than the business angel community. A significant difference between angels and
institutional venture capitalists is that business angels invest their own money,
whereas VCs invest other people’s money—primarily from pension funds. With this
level of fiduciary responsibility, VCs have historically been more conservative in
their investments than angels have been.
Figure 2-6 provides an overview of the industries in which the venture cap
ital community invested during the first quarter of 1998. During that quarter, the
total value of investments made was approximately $3 billion.
One-third of venture capital
funding went to Silicon Valley
and nearly 48% to software
and information services.
—Source: Boston Globe, August 16, 1998
© DAWNBREAKER PRESS, 1998 A F I N A N C I N G P R I M E R 29

F I G U R E 2 - 6 : V E N T U R E C A P I T A L I N V E S T M E N T S B Y I N D U S T R Y ( 1 S T Q U A R T E R , 1 9 9 8 )
Pharmaceuticals
Instrument & device
Biotech Software & information
Cards Health-care services
Biotech
Instrument & device Health-care services
Pharmaceuticals
Software & information
Initial Public Offerings
As mentioned earlier, Initial Public Offerings (IPOs) are regulated by the Securities
& Exchange Commission (SEC) and involve the sale of stock to both qualified and
unqualified investors. The size of this market is also quite volatile, ranging from $6
billion in 1969 to almost $40 billion in 1993.
F I G U R E 2 - 7 : I P O I N V E S T M E N T S B Y Y E A R
A F I N A N C I N G P R I M E R © DAWNBREAKER PRESS, 1998 30
------------
------------
------------
------
---
------------
------------
------------
------
40 —
35 —
30 —
25 —
$B --
20 —
15 —
10 —
5 —
0 —
Year: 1969 Year: 1975 Year: 1983 Year: 1986 Year: 1992 Year: 1993

A small entrepreneurial company looking to get on the fast track is most
likely to raise money from angels, then from institutional venture capital investors,
and lastly IPOs. There are many other factors to consider besides the relative avail
ability of funds, however, when deciding whether you should seek equity invest
ment, and if so, from what source. Before going to the equity market, familiarize
yourself with the terminology used to describe the stages at which investments are
made.
Stages of Equity Financing
Equity investors use various terms to describe the stages at which equity financing
is provided. These terms reflect the degree of risk and changes in the types of
activities typically accomplished by the firm receiving the investment. Moving
down the list from top to bottom, one moves from the most to the least risky.
Each of these terms is described below. There is some variation in how
investors use these terms, however, so you should seek clarification of terms when
you encounter them, to confirm that they are being used in the same way:
EARLY-STAGE FINANCING means financing that is available during peri
ods when no revenues are being generated (see also Seed Financing and Start-Up
Financing).
SEED FINANCING refers to early-stage financing of under $1 million. Such
monies are usually spent on product development, market research, business plan
development, and the hiring of the management team.
START-UP FINANCING refers to early-stage financing typically provided to
those who are “ready to do business.”
FIRST-STAGE FINANCING is funding needed to initiate full-scale manufac
turing and sales.
SECOND-STAGE FINANCING is capital provided at times of expansion to
provide operating capital for a company that is shipping product, although the com
pany may not yet be profitable.
MEZZANINE FINANCING is for companies that are beginning to turn a
profit and require funding for expansion of various functional elements of their
business.
BRIDGE FINANCING is funding provided to companies that plan to go public
within six months to a year.
© DAWNBREAKER PRESS, 1998 A F I N A N C I N G P R I M E R 31

Management!
Management!
Management!
Venture capitalists don’t deal
with sole proprietors.
LEVERAGED BUYOUT means using the assets of the acquired company to
help fund its acquisition by an outside party.
What Do Equity Investors Look For?
Equity investors look at the management team of a company in which they are con
sidering making an investment. Unlike banks and other sources of debt financing
that require collateral to assure repayment of their loans, equity investors view the
management team as paramount to the success of the business and realizing a
return on their investment. A seasoned, well-balanced team serves as a form of
human collateral, as it is the management team that makes the opportunity come
alive. It is often said of venture capitalists that they prefer a Grade A management
team with a Grade B plan to a Grade A plan with a Grade B team. This statement is
not intended to minimize the importance of a good business plan, but rather to
indicate that a strong management team is needed when seeking venture capital.
According to John Preston, previously with MIT’s Technology Transfer Office, a
strong management team is one that “keeps a healthy balance sheet, has a clearly
focused strategy, and is realistic about marketing.”
In other words, before approaching an equity investor, the technology
entrepreneur should realize that venture capitalists don’t deal with sole proprietors.
A well-balanced management team includes individuals with expertise in at least
three areas: (1) finance and administration, (2) sales & marketing, (3) and R&D,
engineering and manufacturing (as appropriate).
If a venture capitalist invests large sums of money in a company, it is likely
that he or she will require a seat on the Board of Directors and will take strong
interest in—and work hard toward—the company’s success.
The venture capitalist becomes an important part of the team. When court
ing an equity investor, one should ask for references, as well as the names of other
entrepreneurs in their portfolio who can be contacted. It is also helpful to ask about
their contacts in your industry and their experience with your company’s technolo
gy. Look for the synergy and the value these investors can add.
Keep in mind that while venture capital firms sometimes invest on their
own, they often invest in conjunction with others as well. (They may invest as part
of a syndicate—a cluster of investment firms—for example.) In addition, a number
of Fortune 500 companies have venture capital arms affiliated with them or other
venture capital firms with which they often team. If your technology or product will
eventually be a good acquisition candidate for a large firm, determine if that firm
has a venture capital arm or a venture capital company with which it teams.
A F I N A N C I N G P R I M E R © DAWNBREAKER PRESS, 1998 32

What Do Equity Investors Want in Return?
Equity investors make money by helping firms grow. They then cash out, usually at
year five. The phrase “cashing out” implies the following:
◗
◗
going public via an Initial Public Offering, or
selling stock, either back to the company or to another company,
at a premium
VCs tend to be more risk
adverse and wait to enter a
deal when technology and
market risks have been
decreased.
These two techniques for liquefying the initial investment are referred to
as Exit Scenarios. The whole intent of equity investors is to invest money in
exchange for equity (ownership of stock); to sell the stock (liquefy their invest
ment) in about five years; and to realize a substantial return on their investment
(ROI). A substantial return is approximately 5 -10 times their initial investment.
That would mean that on an investment of $3 million, equity investors would look
to make $15 - $30 million in 5 -10 years. This is typically done by substantially
increasing the value of the company and then conducting an IPO or selling
the company.
Return on Investment (ROI)
The earlier an equity investor invests in a company, the greater the return on
investment (ROI) the investor expects—and the greater the equity in the firm that
the firm must give up. According to Garner et al., “It is not uncommon that first-
and second-round capital might take 40 to 60 percent of the equity shares, and suc
ceeding rounds of financing, including public offerings, may leave the original own
ers with as little as 5 to 20 percent of the stock” (1994, p. 70).
Most venture capital firms are not interested in running the day-to-day
operations of a firm as long as the company is doing a good job of creating value.
However, if the company’s management doesn’t keep stride with the demands of a
fast-growing venture, it runs the risk of being replaced. Technology entrepreneurs
can minimize the likelihood that this will occur if (a), they seek a role in the rapidly
growing company which allows them to utilize their strengths or (b), they form a
spin-off company to which they license technology developed in a closely-held firm
and seek a good management team and equity investments in the spin-off.
Business angels, venture capitalists, and investment bankers look for similar
things in making equity investments. However, business angels, being an informal,
part-time investment source, tend to be more lenient and patient with their money.
Chapter 7 provides more detailed information on equity investors.
In summary, the risk-capital community is made up of three distinct types
of equity investors: business angels, venture capital, and investment bankers (who
issue IPOs). The business angel community is the largest, and is responsible for
© DAWNBREAKER PRESS, 1998 A F I N A N C I N G P R I M E R 33

much seed financing. Such investors invest their own funds. They each make a
couple of deals a year. The venture capital community is considerably smaller, and
makes fewer investments in early-stage companies. VCs invest other people’s
money, primarily from pension funds. They tend to be more risk averse, and wait
to enter a deal when technology and market risks have been somewhat decreased.
The IPO market has been booming and is appropriate for high-potential ventures
to consider. An IPO is an expensive process and one that totally changes the future
operating procedures of the company. In all cases, equity investors take equity or
ownership of company stock and look to make a significant return on their
investment.
Conclusion
The purpose of this chapter was to provide a general overview of the financing
options that a high-tech firm could consider for advancing the commercialization of
its technology. These options include sweat equity, R&D partnerships, debt, equity,
and profit. ATP awardees have already made some financing choices prior to sub
mitting their ATP proposal. Advancing the commercialization of that technology
requires ongoing attention to additional forms of financing.
A F I N A N C I N G P R I M E R © DAWNBREAKER PRESS, 1998 34

Commercialization StrategiesCHAPTER
3
WH AT I S A
C O M M E R C I A L I Z AT I O N S T R AT E G Y?
PR O T O T Y P I C A L
C O M M E R C I A L I Z AT I O N S T R AT E G I E S
ST R AT E G Y 1: L I C E N S I N G W I T H D E V E L O P M E N TA L
F U N D S
ST R AT E G Y 2: ST R AT E G I C A L L I A N C E S
ST R AT E G Y 3: EQ U I T Y I N V E S T O R S I N T H E PA R E N T
C O M PA N Y
ST R AT E G Y 4: EQ U I T Y I N V E S T M E N T I N A S P I N -O F F
ST R AT E G Y 5: IN I T I A L P U B L I C O F F E R I N G
CO N C L U S I O N

3C H A P T E R
COMMERCIALIZATION STRATEGIES
By the time a company sub-
mits an ATP proposal, it has
already selected one or
more commercialization
strategies to pursue.
However, the complexity of
the task at hand requires
constant re-evaluation of
one’s strategy.
The phrase commercialization strategy refers to the series of financing options that
a company entertains to move its technology/product from concept to the market-
place. As was discussed in the previous chapter, an increasing number of financing
options become available to a firm as a product approaches completion, as collateral
is developed, and as market risk is decreased.
The financing options available to your firm also depend upon your
vision for the future. Do you envision your company remaining a contract
research and development firm? Will you commercialize by licensing your tech-
nology to others, or do you wish to perform most business functions within your
own firm? Are you willing to share control of your enterprise with equity
investors, or is your goal to develop a closely held firm? These are important
considerations that will affect the preliminary shape of your commercialization
strategy. Your vision acts as an anchor point.
A commercialization strategy will also be affected by personal philosophies
about business. It is not uncommon for founders to start a firm with the following
premise: “I want to grow this company without giving up any equity.” Others may decide,
“I don’t care who else gets rich off my business, as long as I retain the right to do what I enjoy
and make good money in the process.” Still others may assume, “I am going to pay for the
best help available. I don’t believe in getting something for nothing.” Such philosophies may
not be expressed in so many words, but be aware that such underlying philosophies
may influence your choices for a commercialization strategy.
If you are developing a technology platform with the ability to affect multi-
ple industries, you will also need to include an assessment of which applications
you believe will develop first. This should be discussed in their commercialization
strategy, and potential markets should be rank ordered in terms of their readiness.
A company should position itself to hit windows of opportunity on time.
A commercialization
strategy is affected by:
◗
◗
◗
◗
◗
◗
37
your vision,
your business philosophy,
the stage of technology
development,
market risk,
competitive activities,
window of opportunity.
What is a Commercialization Strategy?
Vision, business philosophies, and a logical assessment of market opportu-
nities are all-important considerations when developing a commercialization strate-
gy. However, when positioning a firm to be a high-potential venture, the ultimate
strategic choices made will be decisions that keep you ahead of the competition
and enable you to hit the window of opportunity. You must estimate when your
product will be commercially available, when your principal competitors are likely
to enter the market, and when your target customers will become responsive to
your technology/product. Work backward from this target date, setting your firm’s
© DAWNBREAKER PRESS, 1998 C O M M E R C I A L I Z A T I O N S T R A T E G I E S

marketing, research, and financing milestones on the timeline necessary for you to
hit the projected date of market entry. Seizing your market advantage will increase
the likelihood of realizing the objective of becoming a fast-growth firm—one that
will create value for you, your commercial partners, and your investors.
Prototypical Commercialization Strategies
This chapter introduces you to a variety of commercialization strategies that
advanced technology firms have used successfully:
Licensing with developmental fundsStrategic alliancesEquity investment in the parent companyEquity investment in a spin-offInitial Public Offerings
Each of these strategies usually involves several stages of financing. Although the
last step used is the one that lends each strategy its name, the other modes of
financing are included, too, in the tables that follow. These tables also list the type
of “vision” for each of the hypothetical enterprises described, as well as a statement
of each one’s “philosophy.”
Strategy #1: Licensing with Developmental Funds
C O M M E R C I A L I Z A T I O N S T R A T E G I E S © DAWNBREAKER PRESS, 199838
Licensing-in is the term used
to describe the process of
obtaining rights to use the
intellectual property of oth-
ers, external to a company.
Many life-style firms use licensing as the commercialization strategy of choice. With
this strategy, the advanced technology firm specializes in technology development
and limits its marketing and sales activities to the overtures it makes to potential
licensees. The licensees, in turn, perform all of the other tasks associated with com-
mercialization—marketing, sales and distribution, engineering, manufacturing, and
the like. In this day of shrinking research and development budgets in large corpo-
rations, licensing-in is increasingly a strategy of choice if the technology enables the
licensee to enter new markets or retain market position without having to make
costly investments in the original R&D, skilled personnel, and/or equipment.
By contrast, the inventor or
small company which is
granting the license,
licenses-out.
Table 3-1 provides a thumbnail sketch of the commercialization strategy
used by a small, advanced technology firm (not an ATP awardee) using a licensing
strategy. This table is followed by an excerpt from an interview with a company
president describing why his firm used this strategy and how the firm made it work.

T A B L E 3 - 1 : L I C E N S I N G W I T H D E V E L O P M E N T A L F U N D S
39© DAWNBREAKER PRESS, 1998 C O M M E R C I A L I Z A T I O N S T R A T E G I E S
Vision: Life-style company
Philosophy: “I want to enjoy what I do best.”
Financing methods:
— For preliminary R&D, participated in a Federal contract for
R&D; paid careful attention to intellectual property.
— Periodically used revolving line of credit for working capital
(debt financing).
— Approached another company to complete commercialization
of technology.
— Procured a private contract for application-specific R&D.
Retained some rights within other markets.
Under the Federal Acquisition Regulations (FAR), a small business such as ours retains the
rights to the technology it develops for the government outside the government arena. As a
result, we have quite a few undeveloped, patented technologies “on the shelf.” We generate 4-5
patented technologies each year.
Large corporations become familiar with both our expertise and our technologies
through our technical literature and conference presentations. Later, they approach us to solve
a problem in one of our demonstrated areas of expertise. This usually involves developing
one of our undeveloped technologies to solve a specific problem of interest to them. Many of
the technologies, though patented by us, are still at quite an early stage of development. A
great deal of inventing must still take place during the development process to adapt our tech-
nology to our client’s specific application needs.
Summary
The party interviewed clearly leveraged the R&D developed under a Federal R&D
contract. The company paid careful attention to intellectual property; was mindful
of the importance of developing and maintaining relationships with champions; and
entered contractual arrangements with corporations on a realistic basis.

Strategy #2: Strategic Alliances
Soul-searching often leads company founders to decide that they don’t wish to
assume certain business functions. This often happens, for example, when the com-
pany makes a component for, or an enhancement to, a system. After weighing the
pros and cons of manufacturing and marketing the component to a limited number
of system integrators, it may seem more appropriate to form a strategic alliance with
an entity in the supplier chain. The immediate customer could become a site for
testing the technology/product, a potential licensee, or an investor in the firm.
When a company makes a decision to mutually align itself with a customer, it has
developed a strategic ally or teaming partner. Many types of strategic alliances can
be formed for purposes of marketing, R&D, manufacture, equity, joint ventures,
and/or licensing.
T A B L E 3 - 2 : S T R A T E G I C A L L I A N C E S
C O M M E R C I A L I Z A T I O N S T R A T E G I E S © DAWNBREAKER PRESS, 199840
Vision: Foundation company (R&D and manufacturing)
Philosophy: “Conservative”
Financing methods:
— For preliminary R&D, participated in a Federal R&D program
(not ATP); paid careful attention to intellectual property.
— Obtained equity investment from foreign investor, later
converted to debt.
— Formed strategic alliance with customer
(To supply our component for his system).
Zentech received its first Federal funding in 1986. Its decision to respond to RFPs has tradi-
tionally been driven by the company’s marketing and financial strategies. Routinely, Zentech
examines the market looking for “market-pull” opportunities for its technologies and prod-
ucts. If it sees opportunities to commercialize a particular application, the company then
examines RFPs from the various Federal agencies to determine if there is a good strategic fit.
Zentech will not bid on RFPs for which it has not independently assessed a market need that
fits with the company’s mission.
Zentech manufactures a widget that is sold to manufacturers of a high-tech system.
In 1986, Zentech employed 42 people. Today, it employs 135. Its growth has been primarily

dependent upon a philosophy that can only be characterized as “getting close to the customer.”
This trial-and-error approach has been of great value.
Zentech initially spent a lot of time knocking on doors, presenting its idea of what
the customer wanted, and then receiving corrections from the customer. Through the process of
“getting close to the customer” it has developed a strategic alliance. When initially assessing
the market, Zentech realized that the opportunity for a return on its investment would only
come if the widget were successfully integrated into its customer’s high-tech system. Therefore,
in mapping out the R & D and marketing strategies, it anticipated the final goal not as pro-
duction of the widget, but as utilization of the widget as a critical component of the customer’s
high-tech system. That last phase of the plan has been financed by the customer. The customer’s
motivation in this process was sparked by the fact that the use of the widget in a new high-tech
system would open up new markets.
Funding has always been a challenge to Zentech. The company initially received
equity financing from an overseas firm. The foreign investor provided the cash and Zentech
provided the technology. This initial funding enabled the company to conduct its preliminary
work with customers. However, funding problems on the part of the investor, coupled with its
early success, led Zentech to buy back its equity.
For Zentech, the hardest part of the commercialization process has been obtaining
good data on performance in actual field locations. The company had to expend a lot of
effort to gain permission from potential customers to install the equipment, obtain good field
data, and convince them to continue running the tests.
At one point, when reviewing its strategies for growth, Zentech considered getting into
the manufacturing of the high-tech instrument. However, when it assessed this market it
learned that 20-24% of the gross sales of the instrument market was spent on sales promotion
and service. Upon reflection, Zentech decided that it did not wish to develop a large sales
force or customer service department or pay for the costs involved with developing the high
tech item itself. It made a strategic decision to continue manufacturing the widget and not get
into the high tech instrument business. It only spends 5% of gross dollars on sales and servic-
es, has a smaller staff, and needs only one location.
Zentech presently has 14 ongoing programs, including one (non-ATP) federally
funded program. It must ramp staff up and down quickly and plan shifts for its staff
between programs, sometimes anticipated over a year in advance. Staff members are shifted
to support funded programs. Zentech has commercialized one model of widget, obtained a
“design win” on another, and applied for three patents. Its management feels that the strate-
gies being followed are allowing company growth while staying within the constraints of
prudent financial management.”
41© DAWNBREAKER PRESS, 1998 C O M M E R C I A L I Z A T I O N S T R A T E G I E S

Summary
Strategic relationships are on the increase, intertwining the future of companies in a
sequence of customer-supplier relationships (Hanan, 1992). A good alliance is like a
good marriage, and requires that respect and fair play characterize the relationships.
Ohmae (1989) recommends that participants do the following in order to develop
successful collaborations:
◗
◗
◗
◗
◗
◗
◗
◗
◗
make a personal commitment to the alliance;
have mutual respect and trust;
take time to develop and maintain the relationship;
clarify the relationship in a contractual form and then quickly put the
contract away;
clarify mutual expectations and timeframes;
maintain an awareness of the partner’s problems;
learn to interpret particular responses in a culturally appropriate way;
recognize a partner’s independence; and
celebrate success together
Some ideas about how to maintain good relationships are expressed in the interview
excerpt below:
We put a lot of effort into establishing and maintaining relationships, keeping each other
informed of travel plans to conferences—so that opportunities to interact remain constant.
You have to work the relationships up and down the ladder. Management needs to dialog
with management, and technical people in both firms need to interact with one another.
Networking is important. Our people attend approximately 20 conferences a year. It is a
major investment of time and resources, but enables us to develop and maintain relation-
ships, and to keep interested parties aware of our new research efforts through the conference
presentations that we make.
Strategy #3: Equity Investment in the Parent Company
Often times the founder knows at the outset what type of firm he/she wishes to
develop. If the founder has the vision to become a high-potential venture, he/she
will begin to make decisions from day one that will position the company for rapid
growth. An example of such planning follows:
C O M M E R C I A L I Z A T I O N S T R A T E G I E S © DAWNBREAKER PRESS, 199842

T A B L E 3 - 3 : E Q U I T Y I N V E S T M E N T I N T H E P A R E N T C O M P A N Y
43© DAWNBREAKER PRESS, 1998 C O M M E R C I A L I Z A T I O N S T R A T E G I E S
Vision: High-potential venture
Philosophy: “Rich is good!” “Selling is like shaving.
If you don’t do it every day, you’re a bum!”
Financing methods:
—Sweat equity
—Federal SBIR funding
—A private placement
—Debt financing from an equity investor
FastTrack had its eyes on becoming a fast-growth company from the get-go. The founder had
both a business and a technical background, and was very familiar with federally-funded
R&D partnership programs. After investing sweat equity to get the company started, the
founder applied for SBIR funding. After winning both a Phase I and Phase II award, he
quickly assembled a multi-disciplinary team. Vested in the vision of becoming a high-potential
venture, the team worked diligently on issues related to business planing, leveraging their time
to complete this task by utilizing assistance from a local university.
To accelerate the rate of market entry and to allow the company to gear up for
manufacturing, the founder decided to conduct a private placement. Equity investors were
courted for a couple of years, but only became involved once market risk had decreased and
sales were doing well. The team negotiated a loan from an institutional investment firm.
Summary
The vision a founder has for the future of a company directs and focuses the firm’s
activities. In the example provided above, FastTrack, knowing that it wanted to
position itself to be a high-potential venture, relied on a wide variety of financing
options.
Strategy #4: Equity Investment in a Spin-Off
Parent company
Spin-off
A complex strategy, but one which can be exercised successfully, equity investment
in a spin-off is a hybrid of the approaches already discussed. The founder of the
technology firm decides that he or she wishes to keep the company fairly small,

focused on research and development, and privately held. However, the founder
entertains spinning off a related company in which equity investments could be
made, the intent being to grow the spin-off as a high-potential venture. In order to
make this strategy succeed, issues related to human resources, intellectual property,
and non-compete arrangements need to be artfully addressed.
C O M M E R C I A L I Z A T I O N S T R A T E G I E S © DAWNBREAKER PRESS, 199844
Human resources,
intellectual property, and
non-compete arrangements
need to be artfully
addressed.
With respect to human resources, any entity seeking equity investment
must have an excellent management team in place. The dilemma should be appar-
ent. The founder of the parent company should not be in both the parent firm and
the spin-off, because of split loyalties. Because an equity investor wants to be
assured that the management team is fully committed to making the venture a suc-
cess, such an arrangement is generally unacceptable. The technology entrepreneur,
therefore, tends to stay with the parent firm. This requires that another manage-
ment team be assembled to drive the growth of the spin-off. Most companies con-
templating this strategy do not have the resources available to hire a management
team for another firm prior to receiving an equity investment. They therefore have
to grapple with how to address this requirement.
One strategy is to have a phantom management team in the wings that
could step in once equity financing is obtained. This is not an optimal alternative
for an equity investor, but one that is understandable.
A second strategy is to groom a vice president from the parent company to
become the president of the spin-off. This has benefits to the spin-off, but creates a
hole in the management team of the parent company. Some technology firms,
strapped for resources, utilize a third strategy and offer the position of president to a
retiring executive, often from a large firm. This is done because the executive may
have a golden parachute that he is willing to invest in the spin-off, or because it is
believed that his contacts should attract capital. This strategy is risky, however, as
executives from a corporate environment usually do not have experience growing a
high-potential venture. There is a big difference between building a car (i.e., work-
ing in an entrepreneurial environment) and driving a car (i.e., working for a large
corporation).
You will be best served by involving a management team that has had expe-
rience in growing a company—a team that has contacts in the market of interest
and has a pedigree that will satisfy the needs of equity investors. The bottom line:
If you want to form a spin-off, you must grapple with how to best proceed to put a
capable, dedicated team in place to drive the growth of the venture.
The intellectual property issues must also be adequately addressed. Formal
arrangements that license or sell the intellectual property to the spin-off must be
drafted. The terms need to be appropriate to allow an incentive for the manage-
ment team and the equity investors, while still providing a return to the parent
company. If there are restrictions on market applications to which the technology
may be applied, these must be discussed and clarified.

A related issue is non-compete arrangements. You must decide if any R&D
will be conducted in the spin-off or if it will take place only in the parent company.
You must clarify whether the spin-off will have the right to obtain intellectual prop-
erty from other sources in order to expand its intellectual property estate, or
whether all intellectual property will have to come from the parent company.
Summary
A spin-off strategy can work well. However, issues related to human resources,
intellectual property, and non-compete issues need to be addressed. An equity
investor will have no interest in the spin-off if it is unduly fettered or if it is a sham.
Strategy #5: The Initial Public Offering
Perhaps the most glamorous commercialization strategy is an Initial Public Offering
(IPO). Going public is the ultimate sign that you have arrived. It is a means of
recapitalizing your firm, appreciating the value of stock, and the most common
means for allowing equity investors to cash out. It brings lots of attention to your
company and is a good strategy to use if you are positioning to be acquired or merge
with another firm. It is also by far the most expensive commercialization strategy,
requiring large amounts of money to be paid to underwriters, attorneys, account-
ants, public relations firms, printers, and state and Federal organizations. A compa-
ny that goes this route will never be the same. In exchange for the glamour and the
rapid capitalization of the company, one acquires a public of owners who have the
right to full disclosure from that time forward.
T A B L E 3 - 4 : T H E I N I T I A L P U B L I C O F F E R I N G
45© DAWNBREAKER PRESS, 1998 C O M M E R C I A L I Z A T I O N S T R A T E G I E S
Vision: High-potential venture
Philosophy: I want to do it, I want to do all of it!
Financing methods used:
—Sweat equity and owner’s equity
—A Federal R&D partnership
—Seed financing from venture capitalists and angels
—Equity investment from a Fortune 500 company
—Second round financing from venture capitalists
—A private placement
—A line of credit from bank
—Profits plowed back into the company
—Initial Public Offering

As can be seen from the list of financing methods, a company positioning
itself for this future will spend considerable time working on financial planning.
The technology entrepreneur has to be mindful from the start that every time equi-
ty is given away, the return for subsequent investors and the founders must be
anticipated. As cited at the beginning of this chapter, “You read a book from the begin-
ning to the end. You run a business in the opposite way. You start with the end, and then do
everything you must to reach it.”
Reaching the goals set requires planning—business planning made in light
of your vision for the company’s future. The examples provided in this chapter have
been fairly straightforward. However, often the richness of a technology platform
dictates a far more complex approach to issues of commercialization. In such
instances, the technology entrepreneur must step back, look at the potential impact
the technology could have on multiple industries, and develop a constellation of
strategies to realize the opportunity. The purpose of the next chapter is to provide
guidance on how to develop a constellation of commercialization strategies.
Conclusion
A commercialization strategy refers to the series of financing options that a
founder or management team chooses to pursue in order to bring a technology
from concept to the marketplace. Attention to a commercialization strategy must
be ongoing because the strategy selected is dynamic and should evolve over time.
Commercialization strategies are affected by many factors, including (1) the vision
and business philosophy of the founder, (2) the stage of technology development,
and (3) industry and market conditions. The degree of technology risk, market
risk, a competitor’s activities, and the window of opportunity should all affect a
company’s commercialization strategy.
C O M M E R C I A L I Z A T I O N S T R A T E G I E S © DAWNBREAKER PRESS, 199846

C H A P T E R
4
Complex Strategies for Rich Technology Platforms
AD VA N C E D OR G A N I Z E R
SU S TA I N A B L E C O M P E T I T I V E
A D VA N TA G E
EC O N O M I C B A R R I E R S I N
T E C H N O L O G Y PA R T I T I O N I N G
ST R AT E G I C P L A N
CO N C L U S I O N

COMPLEX STRATEGIES FOR RICH TECHNOLOGY PLATFORMS 4
Advanced Organizer
In Chapter 3, the concept of the commercialization strategy was introduced and
suggestions made regarding how to develop a sound strategy for bringing a product
to market. When a company has a rich technology platform, an additional dilemma
arises. Specifically, when many product options are possible:
◗
◗
◗
◗
◗
Where should the small firm focus its limited resources?
What type of commercialization strategy(ies) should it pursue?
With whom should it partner?
How should it decide what constitutes a good deal?
How can the firm grow rapidly and still remain intact?
The answer to these questions lies in maintaining the company’s sustainable com
petitive advantage. By the end of this chapter, the reader should be prepared to
develop a strategic plan that addresses the commercialization of a rich technology
platform.
In developing an ATP pro
posal, submitters are asked
to identify multiple applica
tions. The challenge in the
post-award period is to
make those possibilities a
reality.
Sustainable Competitive Advantage
To grow and flourish, a company must have a sustainable competitive advantage—
that is, an advantage that will give the company staying power over the long haul.
The types of things which provide a company with such an advantage include:
◗ Intellectual property: patents, trade secrets, copyrights, trademarks
◗
◗ Cost of entry
◗
◗
◗
The uniqueness of the technology and the limited number of people
who have expertise in this area (hopefully, many of them are employed
by the company)
Strategic allies and champions
Marketing and sales capabilities, access to distribution networks, and the
quality of the work done
The company’s record with respect to selecting successful new products
or technologies, as well as its ability to keep to development timelines
© DAWNBREAKER PRESS, 1998 M E E T I N G T H E C H A L L E N G E 49
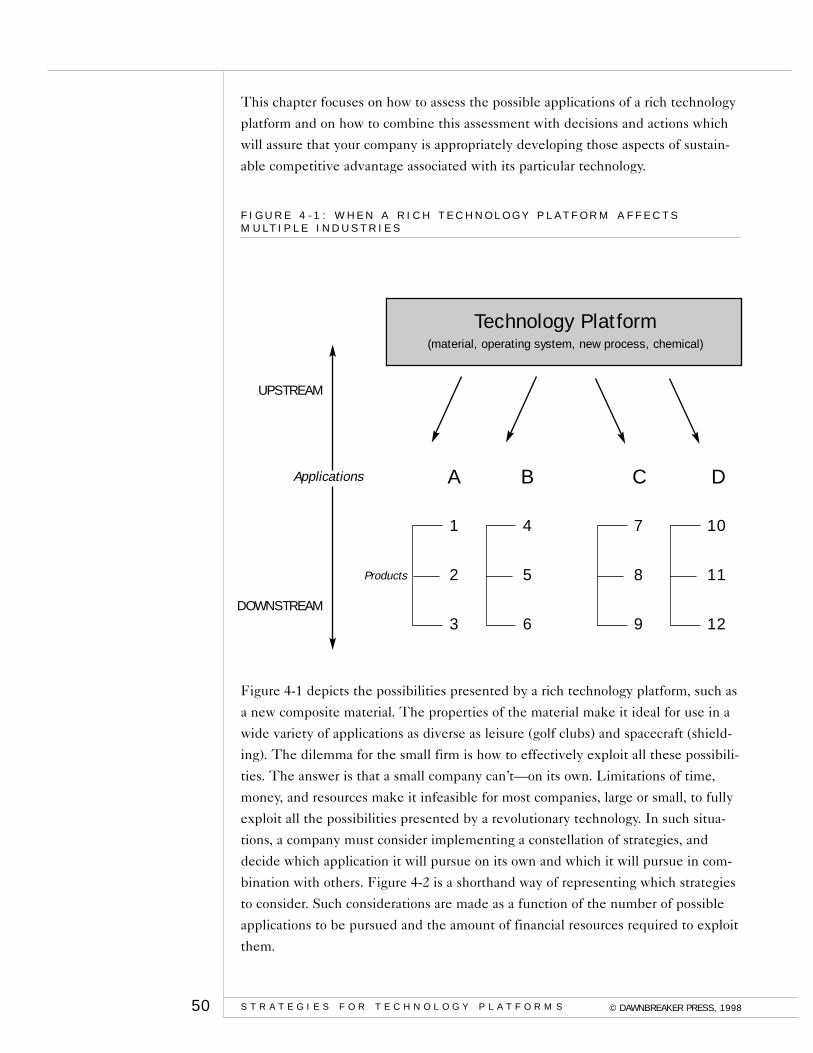
This chapter focuses on how to assess the possible applications of a rich technology
platform and on how to combine this assessment with decisions and actions which
will assure that your company is appropriately developing those aspects of sustain
able competitive advantage associated with its particular technology.
F I G U R E 4 - 1 : W H E N A R I C H T E C H N O L O G Y P L A T F O R M A F F E C T S M U L T I P L E I N D U S T R I E S
Technology Platform (material, operating system, new process, chemical)
UPSTREAM
Applications A B C D
1 4 7 10
Products 2 5 8 11
DOWNSTREAM 3 6 9 12
Figure 4-1 depicts the possibilities presented by a rich technology platform, such as
a new composite material. The properties of the material make it ideal for use in a
wide variety of applications as diverse as leisure (golf clubs) and spacecraft (shield
ing). The dilemma for the small firm is how to effectively exploit all these possibili
ties. The answer is that a small company can’t—on its own. Limitations of time,
money, and resources make it infeasible for most companies, large or small, to fully
exploit all the possibilities presented by a revolutionary technology. In such situa
tions, a company must consider implementing a constellation of strategies, and
decide which application it will pursue on its own and which it will pursue in com
bination with others. Figure 4-2 is a shorthand way of representing which strategies
to consider. Such considerations are made as a function of the number of possible
applications to be pursued and the amount of financial resources required to exploit
them.
S T R A T E G I E S F O R T E C H N O L O G Y P L A T F O R M S © DAWNBREAKER PRESS, 1998 50

F I G U R E 4 - 2 : F I N A N C I N G O P T I O N S A S A F U N C T I O N O F A P P L I C A T I O N S A N D R E S O U R C E S R E Q U I R E D
APPLICATIONS
■ Spin-off ■ Joint R&D
■ Joint venture ■ Licensing
■ Equity investment ■ Strategic Alliance
■ Equity investment
■ Bootstrap ■ Partnerships
■ Angel investment ■ Licensing
■ Debt financing ■ Angel investment
Large
$ REQUIRED
A little
Few Many
Figure 4-2 represents financing options to consider as a function of the number of
applications for the technology, as well as the perceived financial resources
required. For example, if a technology has few applications and requires limited
resources for successful commercialization, the firm should be able to realize this
opportunity on its own, by bootstrapping. However, even with limited applications,
if significant funding is required, one should consider seeking direct investment in
the company, a joint venture, or a spin-off. If the technology has many possible
applications, then one should consider a wider range of strategies, involving a larger
universe of potential partners.
Most new technology entrepreneurs don’t have a good basis for knowing
how much money its takes to bring a product to market, so it is important that this
figure be examined. For example, “The R&D costs to generate and maintain the
technology required for each new chemical entity is now greater than $100 million
and increasing. …To maintain the 10% pace of investment, each new chemical enti
ty would have to generate, on the average, $1 billion in sales over its lifetime,
assuming no inflation.” This is obviously not a task a small company can tackle on
its own.
The implications are very clear. A company should assess whether it or
other entities can best exploit various options. For example, if it truly won’t take a
© DAWNBREAKER PRESS, 1998 S T R A T E G I E S F O R T E C H N O L O G Y P L A T F O R M S 51

lot of money to complete production and bring the product to market, the small
company may be the best candidate to do it. However, as the amount of money
required and the number of possible applications increase, the universe of commer
cialization strategies to consider also expands.
When trying to determine the constellation of strategies to pursue, you should
simultaneously consider three issues:
(1) How can the basic and application R&D be expeditiously completed?
(2) Which firms/investors will make the best partners to fully exploit the
technology?
(3) How can you assure that your company maintains an essential role in
the commercialization of the technology it originated?
Completing Research and Development
To maintain a substantial lead, firms developing pioneer technologies must assess
not only what research and development needs to be accomplished, but also which
partners may be good to involve in “upstream” activities (Heuss and Jolly, 1990).
The greatest flexibility comes from strategic alliances, including consortia and joint
ventures that are structured to preserve organizational autonomy and individual
incentives (Teece, 1991).
Before deciding which firms/investors to approach regarding the down
stream applications of your specific opportunities, you should assess the structure of
the industries and the extent to which the opportunities can be partitioned.
Partitioning of multifaceted opportunities is usually the result of intellectual proper
ty protection and economic barriers. In the example represented in Figure 4-3, the
company has developed a portfolio of intellectual property that protects the process
for creating the material as well as the devices used to produce the composite.
These both fall within the category of upstream applications. The company has also
developed downstream, application-specific intellectual property it can license sep
arately. A company interested in application-specific licenses would have to pur
chase the composite material from the Licensee that holds the exclusive patent on
the production of the composite—or, if economically feasible, should consider
trying to obtain an application-specific license or sublicense for its own
production needs.
S T R A T E G I E S F O R T E C H N O L O G Y P L A T F O R M S © DAWNBREAKER PRESS, 1998 52

F I G U R E 4 - 3 : S T R A T E G I C M I N D M A P F O R A R I C H T E C H N O L O G Y P L A T F O R M
Technology Platform (material, operating system, new process, chemical)
Opportunity 1—exclusive licence to produce composite
Opportunity 2—exclusive licence to production equipment
UPSTREAM
Applications
Opportunity 3: Exclusive Licence Application A
A: Leisure B C D
Tennis 4 7 10
GolfProducts 5 8 11
DOWNSTREAM Skateboards 6 9 12
Partitioning—dividing the
domain of possible products
and imposing or utilizing
intellectual property or eco
nomic barriers.
Economic Barriers in Technology Partitioning
The economic barriers that can be used in partitioning an opportunity are not actu
ally created by the licensee, but rather are leveraged by him or her. With economic
barriers, one is really taking advantage of the downstream infrastructure and the
position of the dominant players within it. In other words, the goal is to prevent
others from entering that market by making use of the existing infrastructure and
relative positions of the key players.
When looking at the dynamics of various industries, one consideration
should be to examine each industry relative to the presence of a dominant design
(Teece, 1991). This is essential, according to Teece, since clever market entry
strategies will keep innovation imitators at bay. Building on the work of Abernathy
(Abernathy and Utterback, 1978), Teece maintains, “In the early stages of develop
ment of many industries and product families, designs are fluid, manufacturing
processes are loosely and adaptively organized. ... Competition among firms mani
fests itself in competition among designs.” This is evident in products and
© DAWNBREAKER PRESS, 1998 S T R A T E G I E S F O R T E C H N O L O G Y P L A T F O R M S 53
Economic barriers:
◗ industry cohesiveness
dominant players
distribution channels
dominant or emerging
design
certification & regulatory
requirements
competitors
◗
◗
◗
◗
◗

protocols such as Apple vs. IBM computers, Netscape vs. AOL, VHS vs. beta, and
the like. Prior to the emergence of a dominant design, a company can position its
product to become an industry standard and/or should “hang loose” and resist
becoming too tied to a design which may ultimately “lose.” Teece recommends that
if a company has the ability to promote a dominant design, it should do so.
However, if it lacks this capability, the firm should wait for the dominant design to
emerge.
Once a dominant design has emerged, the emphasis shifts to more evolu
tionary innovations capable of driving down costs. At such times, it is often
advantageous for a company (large or small) to team with other players with com
plementary assets and products. If a company has bet on the wrong horse, it is still
possible to participate in the new design regime by forming strategic alliances
through technology swaps, joint R&D, co-development, or sharing of complementa
ry assets. Teece clarifies what he means by complementary assets by drawing the
distinction between what a customer perceives as a product and simply a device. An
item that fully meets a customer’s defined need will tend to be viewed as a product.
For example, an optical scanner sold with a range of software, cabling, and customer
support is likely to be viewed as a product—whereas a scanner sold without soft
ware is likely to be viewed as a device. A company which provides only part of a
solution to a customer need should look to producers or providers of complimentary
products, components, and services as potential strategic allies.
Other industry characteristics that are important to consider when deciding
upon the commercialization strategies to be pursued include:
◗
◗
◗
◗
Cohesiveness of the industry
Premarket testing, certification, and regulatory requirements
Product liability issues
Channels of distribution
When an industry is fragmented, the formation of a strategic alliance is often an
advantageous commercialization strategy to pursue. When significant capitalization
is required for pre-market testing or to address product liability issues, significant
investment will be required by a potential licensee, strategic ally, or equity investor.
An understanding of the dynamics within the various industries to which a
rich technology platform can be applied is important before beginning the process
of mapping out the commercialization strategies to be pursued. Finally, the compa
ny needs to consider how to structure relationships so that the originating company
will maximize its participation in the financial benefits that result from commercial
ization of the technology.
S T R A T E G I E S F O R T E C H N O L O G Y P L A T F O R M S © DAWNBREAKER PRESS, 1998 54

Maximizing Financial Return
Before determining how to maximize financial return from the commercialization of
the technology platform, you must begin by generating a list of possible applica
tions for the technology. Once this has been accomplished and you have examined
the structure of each related industry, the company must decide where in this
panorama it wishes to “hang its hat”—the place Heuss and Jolly refer to as the
center of gravity. It is impossible to determine how best to maximize your return
from other relationships before deciding where in this panorama you wish to play.
Determining your center of gravity is a function of your interests, your
vision, and other considerations which allow you to maintain a degree of control
over the evolution of the technology.
The progenitor’s relationship to a newly created technology is unique. The
inventor brings a heightened desire and commitment to see his or her technology
utilized. Therefore, if you have a strong vision for your technology, you should care
fully consider how far down the commercialization path you wish to proceed. As the
progenitor, you are more likely to pursue a given path longer than others will.
(According to Heuss and Jolly, licensees may drop a line of pursuit earlier than a
progenitor.) Thus, if there are areas of technological risk which you feel would be
difficult for others to navigate or to which they would be less committed, you
should consider staying with the technology development course longer, before
handing it off to another entity for the final stages of commercialization. The prog
enitor’s commitment is a double-edged sword, however. Although persistence has
its value, an inventor also needs to know when to let go. Nevertheless, in all cases,
the more technology risk is decreased, the greater the return you can negotiate.
To remain attractive to potential partners, the technology entrepreneur
should keep his or her technology in the spotlight, even going so far as to develop
trademarks to help accrue goodwill. As Heuss and Jolly point out, developing trade
marks “offer the potential to prolong market acceptance even after the underlying
technology rights expired” (Heuss and Jolly, 1990).
Strategic Plan
An outline for a strategic planning document is included here. It is intended to be
a proprietary, internal document used by ATP-funded companies that have a rich
technology platform. Such companies often need to develop a constellation of com
mercialization strategies to fully exploit their given technology.
Remember, the value of a company’s technology lies in the decisions made
and actions taken to realize an opportunity! A strategic plan starts with analysis but
must end in action in order to be of any real value.
© DAWNBREAKER PRESS, 1998 S T R A T E G I E S F O R T E C H N O L O G Y P L A T F O R M S 55

STRATEGIC PLAN
Commercialization ToolkitTM
• Strategic Plan
1.0 Technology Platform
1.1 List possible upstream roles by industry. These usually will be asso
ciated with production of raw material or equipment to be used across
downstream applications.
1.2 List possible downstream application areas by industry and products
nested within each industry. If possible, represent this in graphic form,
similar to Figure 4-3.
1.2.1 Industry 1
Specific product or process 1
Specific product or process 2
Specific product or process n
1.2.2 Industry 2
Specific product or process 1
Specific product or process 2
Specific product or process n
1.2.3 Industry 3
Specific product or process 1
Specific product or process 2
Specific product or process n
2.0 Intellectual Property
In this section, map out your intellectual property strategy for partitioning
the available opportunities, differentiating between base patents and
application patents. Be sure to pay appropriate attention to other forms
of intellectual property—copyrights, trademarks, trade secrets, and know-
how—and how these can be used to increase the dependence that
potential partners will have on you.
2.1. Patents
Clarify which patents are pending and which ones have been
awarded. Indicate which other innovations you are likely to patent
during the process of commercializing the technology.
S T R A T E G I E S F O R T E C H N O L O G Y P L A T F O R M S © DAWNBREAKER PRESS, 1998 56

2.2. Trademarks
Clarify which trademarks you have already registered, which ones
you are using in interstate commerce and are not yet registered,
and how you can use copyrights to your advantage vis a vis
potential partners.
2.3. Trade secrets
Indicate whether you have or will institute appropriate procedures
to assure that certain types of information are maintained as
trade secrets. Indicate by broad category which types of informa
tion fall into the trade secret area.
2.4. Know-how
Clarify which types of information you have opted to maintain as
“know-how”—and determine whether this information could
potentially be of value to allies.
3.0 Research and Development Timeline
Draw upon your ATP proposal in completing this section. Provide an indi
cation of key research and development milestones, as well as the
approximate timeframe required to complete this work. Be sure that this
section addresses the upstream and downstream applications indicated
previously.
4.0 Industry analysis
This section requires considerable accomplishedindustry analysis. For
each industry referenced in section 1, indicate the following:
4.1. Industry 1
◗ cohesiveness of industry
◗ dominant players
◗ channels of distribution
4.1.1. Relative to specific product
◗
◗
◗
◗
dominant or emerging design
premarket testing, certification, regulatory require
ments
product liability issues
competitors
© DAWNBREAKER PRESS, 1998 S T R A T E G I E S F O R T E C H N O L O G Y P L A T F O R M S 57

Not a Straight-jacket!
All of the suggested outlines
in this document are intend
ed as a guide, not a straight
jacket. Please feel free to
vary the format to suit your
needs. The emphasis is on
the content and NOT
the form.
4.2. Industry 2
◗
◗
◗
cohesiveness of industry
dominant players
channels of distribution
4.2.1. Relative to specific product
◗
◗
◗
◗
dominant or emerging design
premarket testing, certification, regulatory
requirements
product liability issues
competitors
4.3. Industry 3
◗
◗
◗
cohesiveness of industry
dominant players
channels of distribution
4.3.1. Relative to specific product
◗
◗
◗
◗ competitors
dominant or emerging design
premarket testing, certification, regulatory
requirements
product liability issues
5.0 Center of Gravity
In light of the preceding, and in consideration of your personal vision,
which business functions to you wish to reserve for yourself? What is the
mission of your company?
5.1. Mission
In this section, clarify the business functions you will perform.
5.2 Intellectual property
In this section, list the intellectual property rights you wish to
retain exclusively for your firm, i.e., those you will not share with
a partner.
5.3. Industry/market focus
In this section, clarify the industry, or more specifically the
market, you need to tackle on your own.
S T R A T E G I E S F O R T E C H N O L O G Y P L A T F O R M S © DAWNBREAKER PRESS, 1998 58

5.4. Commercialization strategy
In this section, clarify how you will fund the commercialization of
what you have carved out as your center of gravity.
6.0. Strategies and Partners for Commercializing Related Opportunities
In this section you will map out how you will exploit other opportunities.
The timing associated with the unfolding of this plan will be driven by
the research and development timeline clarifiedoutlined in Section 3.
Start by developing a list of upstream and downstream opportunities
sequenced according to when the R&D would be complete. Then, con
duct another sort of the information, based on the difficulty associated
with bringing the product to market. Consideration should be given to
factors such as premarket testing, certification, and regulatory require
ments. Finally, indicate whether there is a dominant or emerging design;
also, the relative size of the market opportunity. In addition, note the
amount of money required to commercialize the technology. The clearest
way to do this is to represent this information in tabular form.
For example:
In light of the industry information presented earlier, your consideration
of your intellectual property strategy, your R&D timeline, and your center
of gravity, indicate with whom it would be best to partner.
Application 1 Application 2 Application 3
R&D readiness 1st 3rd 2nd
Marketresponsiveness L H H
Emerging or Dominant design D E E
Market size $50 million $500 million $750 million
Finances required $3 million $10 million $20 million
© DAWNBREAKER PRESS, 1998 S T R A T E G I E S F O R T E C H N O L O G Y P L A T F O R M S 59

Conclusion
The value of your technology
does not lie in the possibili
ties—but in the decisions
that you make and the
actions that you take to
realize the opportunity. A
strategic plan starts with
analysis—but must end in
action in order to be of any
value.
Many ATP-funded companies are developing rich technology platforms that have
the capability of having a profound impact on multiple industries. The purpose of
this chapter has been to introduce the reader to ways of partitioning an opportunity
for maximum exploitation, as well as ways of deciding which constellation of strate
gies to use with each of the upstream and downstream opportunities identified.
Choice and sequencing of strategies requires careful consideration to the trends and
structure of each relevant industry.
The aim of the next three chapters is to provide the reader with more
advanced, in-depth information on three strategies: licensing, R & D partnerships,
and equity investment. ATP-funded firms are often quickly confronted with the
need to make a choice regarding financing options, so the objective of these chap
ters is to better prepare the reader for the types of considerations required.
60 S T R A T E G I E S F O R T E C H N O L O G Y P L A T F O R M S © DAWNBREAKER PRESS, 1998

C H A P T E R
5
Licensing
AD VA N C E D OR G A N I Z E R
WH Y C O M PA N I E S L I C E N S E I N
WH AT I S A L I C E N S E?
HO W D O E S O N E M A K E M O N E Y
F R O M L I C E N S I N G?
D I F F E R E N T T Y P E O F L I C E N S E S
PR E PA R AT I O N F O R L I C E N S I N G
EL E M E N T S O F A L I C E N S I N G
PA C K A G E
BU S I N E S S O P P O R T U N I T Y P R E V I E W
AS S E S S M E N T O F P O T E N T I A L L I C E N S E E S
NE G O T I AT I O N I S S U E S
CO N C L U S I O N

LICENSING C H A P T E R 5
Advanced Organizer
Licensing requires planning
and dedicated resources.
Many small firms select licensing as their commercialization strategy of choice, after
concluding that they don’t wish to act as a manufacturer, marketer, or distributor.
Although it is important to recognize and understand your interests, your firm’s
approach to licensing will be more comprehensive and successful if you view
licensing as the conscious choice to provide one or more entities with the right to
exploit your technology for mutual gain. When viewed in this fashion, you will
become more concerned about the selection of an appropriate licensee, as well as
the best method of structuring a mutually beneficial relationship. The word “selec
tion” is not meant to imply that potential licensees line up to court a technology
entrepreneur. In fact, the reverse is often true. Nonetheless, the word “selection”
appropriately conveys the care and considerations that you should make in looking
for potential licensee(s). Remember: licensing doesn’t just happen. It requires con
siderable planning and resources.
This chapter is organized around the themes represented in Figure 5-1.
F I G U R E 5 - 1 : L I C E N S I N G A D V A N C E D O R G A N I Z E R
© DAWNBREAKER PRESS, 1998 L I C E N S I N G 63
S U C C E S S F U L L I C E N S I N G
MAKING DIFFERENT PREPARATION WHY COMPANIES WHAT IS A LICENSINGMONEY FROM TYPES OF FOR
LICENSE IN? LICENSE? PACKAGE LICENSING LICENSES LICENSING
Strategic fit
Can’t do it all
Synergy with strengths
Licensed property
Licensor title
Territory
Size of opportunity
Consulting
Royalty
Product
Hybrid
Multimedia
Software
Identify potential licenses
Opportunity value
Assemble your team
Estimate costs
Make your case
Assessment of licenses
Opportunity preview
Marketing & sales plan

Why Companies License-In
Licensing-in describes the
process of obtaining rights to
use the intellectual property
of others, external to a com
pany.
◗
◗
◗
◗
◗
◗
◗
◗
64
Licensing-in is a unique form of sales in which the inventor/technology entrepre
neur provides the potential licensee with a compelling reason to license his or her
technology. To effectively make your case, it is important to understand why a
potential licensee would be interested in licensing-in. Companies are interested in
increasing their assets. Intellectual property (patents, copyright, trademark, trade
secret, know-how) are considered assets—but intangible and risky ones with poor, if
any, liquidity. The dilemma, however, is that such assets are essential for future cor
porate growth (Parr, 1990). Larger firms invest as much as 10% of sales on R&D.
“The cost of original research is high and therefore requires maximum market pen
etration to pay for it” (Andonian, 1989). If a company can decrease the costs associ
ated with strategic R&D and at the same time minimize risk, licensing-in becomes
an appealing option.
Strategic Fit
Sources of Information about
R&D available for license:
Universities
Trade shows
Manufacturers
Patent searches
Scientific literature
Agents
Licensing events
Unsolicited contacts
Technology will be licensed-in or acquired by a firm if it meets a strategic interest
that the company is not capable of addressing on its own. In all cases, if a potential
licensee can do the development work better itself, it has no desire to look outside.
Pioneer technologies present a novel opportunity, however. In such cases, there is
an increasing trend toward financing options that share risk. According to Teece
(1991), these include the following: ◗
◗
◗
R&D joint venture with Option to License R&D joint venture with Option to Purchase Strategic alliances
When licensing is the option of choice, the intellectual property being considered
must offer the licensee one or more of the following advantages. The intellectual
property should (1) present a new business opportunity to the licensee which builds
on its core competencies; (2) provide better access to markets that the licensee
wishes to penetrate; (3) offer additional products to sell through existing distribu
tion channels; (4) preclude other organizations from having access to the technolo
gy; and/or (5) decrease production costs.
When presenting your opportunity to a potential licensee, you must there
fore make your case in consideration of the potential licensee’s strategic intent. You
must examine the licensee’s priorities and demonstrate how your technology would
meet the licensee’s strategic goals. Such information about publicly traded compa
nies is readily available. Sources that can be consulted in assessing potential
licensees will be addressed in Section 2.
L I C E N S I N G © DAWNBREAKER PRESS, 1998

Outsourcing R&D
Technology Acquisition
Process
A company actively looking to license-in technology has many choices.
Representatives of a firm can look for technology from universities, other manufac
turers, and agents. They can find out about opportunities through an examination
of patent and scientific literature, attendance at trade shows, and/or participation in
meetings of the Licensing Executive Society. It is important that technology entre
preneurs recognize that large firms dedicate limited resources to such search activi
ty; that their searches are strategic in nature; and that there are many sources to
which they can turn. The bottom line is that in order to make your case, you need
to be well prepared.
From the licensee’s perspective, the Technology Acquisition Process (Manfroy
et al., 1989) features a number of steps, including: ◗
◗
◗
◗
◗
◗
◗
◗
Identification of need Technology sourcing Technology assessment License negotiation Financing Transfer of technology Implementation Termination of license
Synergy with Strengths
From the preceding list, three general categories of concerns are recommended for
the licensee to consider relative to technology assessment: technology concerns,
market concerns, and overall concerns. The licensee should assess the new product
or processes and its relationship to the licensee’s technology strength. The firm
must also assess issues pertaining to potential implementation, including the num
bers and types of employees involved, the feasibility and costs associated with man
ufacturing, and how much additional funding is still required. On the market side,
the company must assess potential sales, profits, use of marketing, sales and distri
bution channels, and competitive advantage. Overall, the fit with the company’s
strategic direction and risks must be examined.
Because the Technology Acquisition Team has to sell its management on
the merits of the technology of interest, it is important that a potential licensor
make it as easy as possible for the potential licensee to buy, by addressing its needs.
Also, to assure that a win-win situation is achieved, it is important that you have a
means of assessing the value of what you are presenting—and that you understand
the various aspects of licensing negotiation to which you will be exposed.
© DAWNBREAKER PRESS, 1998 L I C E N S I N G 65

66
The balance of this chapter assumes that you have already determined that
licensing is one of the best ways to exploit the market potential of your technology.
As such, it is assumed that your objective in reading this chapter is to understand
more about what is involved and how to prepare for successfully locating a licensee.
What is a License?
Formally speaking, a license is “permission granted by an owner or inventor, gener
ally for a consideration, to a person, firm, or corporation to use the owner’s propri
etary information, invention or material” (Goldscheider, 1993). All forms of intel
lectual property can be licensed, including patent, copyright, trademark, trade
secret, and know-how. The nature of the “use” granted in the license varies and
can include manufacture, use, lease, sale, distribution, or any combination thereof.
When the owner of intellectual property grants a license to another entity, it retains
ownership or title to the intellectual property. An initial word of caution: the defini
tions of all terms used in a licensing agreement need to be carefully considered—
especially those associated with the licensed property, the licensor, and the licensee.
Definition of Licensed Property
Ownership issues are not
always straightforward.
The licensed property should be defined with great specificity. Registered items
(trademarks, copyrights, and patents) should include the registration number
(Epstein & Politano, 1995). There are a number of situations where exceptional
care should be taken in drafting the definitions. Biotech is a most noticeable exam
ple. Fordis and Griffen note that difficulties arise because: (1) many biotech prod
ucts are not the subject of issued or pending patents; and (2) there are a number of
ways to define the biotech products. Special care should also be taken in licensing
computer software: it should be made explicit as to whether or not the license
applies to both the object and source code.
A single license may be drafted to cover one or multiple products/technolo
gies and various forms of intellectual property. “The more restrictive the definition
of licensed products, the smaller the potential royalty base” (Greeley, 1990). You
should expect there to be a natural tension in licensing negotiations, as each party is
motivated to obtain what is best for the organization it represents.
Licensor Title
The licensor must have clear title to the rights it is conveying. This may seem
straightforward and self-evident. However, when dealing with biological materials,
especially those derived from humans, the issue of ownership is complex and often
L I C E N S I N G © DAWNBREAKER PRESS, 1998

disputed (Fordis and Griffen, 1991). Sometimes, to avoid any infringement issues, a
potential licensee may conduct a right-to-use study in order to assure clear title
(Greeley, 1990).
Of equal importance is the consideration given to the definition “licensee.”
The licensor must be certain that he or she understands whether or not the term
licensee is extended to subsidiaries, related companies, and affiliates, or strictly to
the entity named. When specifying whether the license is exclusive or non-exclu
sive, the licensor should carefully attend to the implications that this statement has
for his or her own work. Most licensors don’t intentionally wish to exclude them
selves from being able to make use of the intellectual property. However, this could
inadvertently be the result of carelessness when granting an exclusive license. The
rights of the licensor should be clearly stated in an exclusive license. Often a licen
sor may grant an exclusive license, but one that reverts to non-exclusive status if
certain conditions are not met.
Territory
Territory deals with the specific geographic area to which the license applies. It
should be noted that a license could vary from narrow use—one that is restricted to
one site or plant at a specific location—to one that is global in scope.
Within a licensing agreement, many other issues are important to address.
These include Indemnification, Arbitration, Best Efforts, Technical Information,
Assignability, Sublicensing, Rights & Remedies, Termination, Approvals, Changes,
Technical Assistance, and Improvements, among others. Such issues require careful
attention by both parties (Goldscheider, 1993). Always be sure that you understand
the full implication of everything in the agreement and seek appropriate counsel.
ISSUES
Indemnification
Arbitration
Best Efforts
Technical Information
Assignability
Sublicensing
Termination
Technical Assistance
Improvements
Rights & Remedies
Approvals
How does one make money from licensing?
The most common form of remuneration is a royalty. Royalties may take many dif
ferent forms, including running base, lump sum, or prepayment-of-running royal
ties. Royalties can be calculated at a constant rate, change over time, and/or specify
mandatory minimum and/or maximum payments.
“Unless substantial benefits
(profits) can be made, there
is no point in making a deal.”
Size of the Opportunity
The manner in which the royalty rate is derived depends upon many factors,
including industry standards, the degree of development, the magnitude of the
licensed property, and market potential (Parr, 1990). Many technology entrepre
neurs approach licensing with the mistaken belief that they don’t need to
© DAWNBREAKER PRESS, 1998 L I C E N S I N G 67
◗
◗
◗
◗
◗
◗
◗
◗
◗
◗
◗

understand the market, assuming that that’s the licensee’s job. As a result, the
importance of “sizing the profitability pie” must be stressed (Epstein and Politano,
1995). With the exception of the progenitor of the technology, you should expect
that everyone else who becomes involved with the technology is interested in its
potential to generate wealth. According to Epstein and Politano, “Unless substantial
benefits (profits) can be made, there is no point in making a deal.” Estimating the
size of the pie is a way of determining whether the deal is worth pursuing.
Epstein and Politano name six items that should be considered when sizing
an opportunity. These include: market size, stage of market development, special
status of technology in question (e.g., a pioneer patent), economic health, benefits
from association with licensor, and synergy with licensee’s marketing, sales, and dis
tribution strengths. Prior to making his initial approach to the licensee, the licensor
should have addressed these issues and should be prepared to make the case that
there is an opportunity that can be exploited for mutual benefit. Don’t expect the
potential licensee to do this for you. In order to structure a “win-win” deal, both
parties need to be prepared.
Another element of preparation is understanding the relative contributions
both parties will make. There is often the tendency for technology entrepreneurs
to overestimate their technology’s contribution. This assumption often reflects a
lack of understanding of what the licensee must add to the mix in order to
commercialize the technology. Factors that strengthen the licensor’s bargaining
position include the following: ◗
◗
◗
◗
◗
A positive track record as an experienced and valued licensor R&D-generating capability (a good facility with a rigorous R&D program) Items that contribute to goodwill, such as trademarks Related patents, trade secrets, and know-how A reputation for enforcing patents against infringers
The licensee’s bargaining position is augmented by the amount of risk it assumes,
as well as its established manufacturing, marketing, and distribution capabilities.
Consulting
Another way for the licensor to accrue more value from the licensing relationship is
to limit the technical, sales, and service support provided as part of the licensing
agreement (Greeley, 1990), and to instead offer these services—when provided
above a certain level—as consulting services, through an annual retainer or per
diem (Epstein and Politano, 1995). If the licensor has marketing strengths, it could
also seek to retain marketing rights on excess production of the licensee in areas
that it does not serve.
L I C E N S I N G © DAWNBREAKER PRESS, 1998 68

Royalty Rates
It is debatable as to what is the best approach to calculating royalties. The base to
which royalty rates are applied can include: (1) net or gross profit; (2) net or gross
sales price; (3) the gross production of the licensee. The method of calculating the
royalty rates also varies. Regardless of its shortcomings, one of the most commonly
used methods is comparison with industry standards. It is important to recognize
that these standards vary widely. Table 6-1 provides a summary of a number of dif
ferent types of standards:
T A B L E 5 - 1 : S A M P L E I N D U S T R Y S T A N D A R D S I N S E L E C T I V E F I E L D S
Factors Affecting Royalty
Rates, by McGavock, Hass &
Patin- -les Nouvelles, June
1992.
Chemicals (Epstein and Politano, 1995)
1-3% of net sales for low margin items
Computers (Epstein and Politano, 1995)
3-5% of net sales
Pharmaceuticals (Fordis and Griffen, 1991)
Research reagents (expression vector, cell culture) 1-5% of
net sales
Diagnostic products (monoclonal antibodies, DNA probes) 5
8% of net sales
Therapeutic products (monoclonal antibodies, expressed proteins) 5
10% of net sales
Vaccines (5-10% of net sales)
Animal health products (3-6%of net sales)
Plant/agricultural products (3-5% of net sales)
Semiconductors (Epstein and Politano, 1995)
1.75 to 3% of net sales
Types of Licenses
There are many types of licenses. They reflect differences in both the “use” and
the “type” of licensed material. A sampler of licensing agreements—product,
hybrid, multimedia, and software—follows, with brief definitions of each.
© DAWNBREAKER PRESS, 1998 L I C E N S I N G 69

70
Product License
A product license is appropriate in the prototypical situation in which a licensor
grants to the licensee the right to make, use, or sell a defined “Product.” In such an
agreement, items typically specified are the application of the product, any territori
al restrictions, the time frame, and whether or not the license is exclusive or non
exclusive. Villeneuve et al. point out a number of areas of caution in negotiating
such licenses. These include: (1) the royalty base; (2) the inclusion of technology,
rather than only products; (3) the importance of marketing obligations of the licens
ee in exclusive licensing arrangements; (4) sub-licensing; and (5) grant-backs.
As indicated earlier, the base to which royalties are applied may vary. It is
therefore very important that you are clear regarding the definition of the base, and
that you also probe to assure that the base fits all intended applications by the
licensee. For example, assume that you have negotiated a royalty based on the sale
of the licensed product. This does not entitle you (unless specified) to benefit from
revenue made by the licensee in providing a service in which he utilizes the
licensed product. This is because the royalty base was defined in terms of sales of
the product and did not specify revenue generated from services in which the prod
uct was used.
A licensee tries to obtain as much value for its organization as it can from an
agreement. Therefore, it is common for the licensee to push to expand the domain
of licensed property. The licensor must carefully consider the implications of what
is being asked for. Assume, for example, that the licensee wishes to add to the
product license and gain access to know-how, trade secrets, and patents owned or
controlled by the licensor presently and in the future. The implications are pro
found. First, with respect to your future technology developments, you would be
providing these to the licensee in this one agreement and would thereby limit your
future business options. Second, such statements have implications for any
licensed-in technology you have. By virtue of having “control” over patents you are
licensing from others, you may be obligated to sub-license these as well (Villeneuve
et al., 1995).
The third area of negotiation requiring caution is with respect to exclusive
licenses. The licensor will not benefit from an exclusive license if the licensee does
not make significant marketing and sales. Therefore, the licensor should carefully
attend to the licensee’s marketing obligations—going so far as to specify the nature
of the actions to be taken by the licensee. This is better than settling for the “best
efforts” obligation. Another way to assure that the licensee makes significant efforts
is to require a significant upfront payment as well as minimum royalty payments.
The licensee will only recoup these expenses if it makes sales. When there is a
financial penalty for failure to attend to marketing and sales obligations, it is less
likely that marketing and sales will be given short shrift.
L I C E N S I N G © DAWNBREAKER PRESS, 1998
From a licensor’s perspec
tive, “best efforts” with
respect to marketing and
sales is not a viable option.

Another item meriting careful consideration is sublicensing. Sublicensing
refers to granting to a licensee the right to license to a third party. This provides the
licensee with the right to have things made, used, or distributed by others.
However, this may not be beneficial to a licensor. A license can therefore indicate
that no sublicensing is permitted without prior written approval of licensor, or that
the licensee may sublicense subject to meeting specific conditions (Goldscheider,
1995).
The final situation to be considered is the area of improvements and grant-
backs. When you are dealing with dynamic forms of intellectual property (e.g., trade
secrets and know-how), it is reasonable to assume that this body of knowledge will
grow. The question becomes who receives the benefits of this growth. If the licens
ee is given the rights to use the technology, it is very likely that the licensee will
discover new knowledge. It is, therefore, common for a licensor to seek a “grant
back” of any improvements in the initial field of use. The terms and conditions
associated with this are subject to negotiation (Goldscheider, 1995).
Hybrid Licensing Agreement
A hybrid licensing agreement is one which includes “a license for an issued or
pending patent, together with some other form of intellectual property rights that is
not coextensive with the patent” (Goldscheider, 1995). Such licenses present a new
issue: what do you do if a pending patent that was part of an agreement does not
issue? In such a situation, it is suggested that the royalty rate be decreased.
Multimedia Licenses
Multimedia licenses are complex because of the variety and sheer number of intel
lectual property items included. Multimedia products typically include text, movie
images, still images, music, audio, and computer software—all of which are subject
to copyright and other forms of protection. Epstein and Politano point out that a
multimedia developer may need to negotiate over a hundred separate agreements
in order to obtain all of the rights needed for one multimedia product. The other
factor that makes multimedia licenses difficult to negotiate is that many content
developers ask unreasonable and prohibitive fees, making such projects untenable.
(See Smedinghoff, 1998, for a detailed treatment of the legal issues involved with
licensing multimedia products.)
© DAWNBREAKER PRESS, 1998 L I C E N S I N G 71

Software License
Licensing PackageTM
◗
◗
◗
Licensee Assessment
Business Opportunity
Preview
Negotiation Issues
Given the dynamic nature of the software industry, software licenses present many
special considerations. These include: (1) rights to updates and new releases of the
software; (2) testing and development support; (3) whether or not source code is
included; and (4) royalty payments. If, for example, a software developer is trying to
promote a new industry standard, it is not uncommon for it to provide a non-exclu
sive license (Villeneuve et al., 1995) and accept a flat fee, rather than an ongoing
royalty. (See Villeneuve et al. for a more detailed discussion of this topic.)
Most mass-market software is distributed with shrink-wrap licenses. These
licenses indicate that, by virtue of opening a certain package, users accept the terms
of the licensing agreement. This is done because it is not feasible to obtain a signed
license agreement from every user (Epstein and Politano, 1995).
Another type of license referred to as a run-time license is used with
“authoring tools.” These are used in the development of multimedia products, and
are required for use of the final multimedia product.
Preparation for Licensing
The intricacies of licensing are important to understand if you don’t want to walk
into negotiations blindly. Any company interested in licensing-in has developed a
method for examining opportunities which may meet its strategic needs, as well as
a method for assessing its opportunity potential (Manfroy et al., 1989). You should
do no less, especially if licensing is going to be the primary commercialization strat
egy used by your firm. Specifically, you should pursue the following steps: ◗
◗
◗
◗
◗
◗
◗
◗
◗
Identify a potential licensee Assess the ability of the licensing opportunity to generate value Put together your negotiation team Estimate the costs of the effort Make your case Negotiate a license Determine financing Implement the license Terminate the license
72 L I C E N S I N G © DAWNBREAKER PRESS, 1998
Selecting a Good Licensee?
◗
◗
◗
◗
◗
Strategic fit
Can they do it better on
their own?
Financial resources
Synergy
NIH

Identifying a Potential Licensee
When searching for a potential licensee, it is important that what you have to offer
fits with the partner’s strategic direction; also, that it falls into an area where the
potential licensee cannot do it better on its own. Furthermore, the potential
licensee must have financial resources available, have a good sales and distribution
network, and not an excessive dose of the Not Invented Here syndrome. These are
the same factors Manfroy et al. suggest the licensee consider about its organization
before starting down a path. In this “lock and key” situation, each of you has part of
the solution and each is looking for an entity to fill the complementary role.
The Workbook in this Guide addresses in great detail the methods and
resources for collecting information on potential licensees. You have limited time
and resources available for your endeavor, and you need to expend your resources
on appropriate prospects. Identification of Potential Licensees is the first element
of the Licensing PackageTM.
Don’t walk into negotiations
unprepared.
Assessing the Ability to Generate Value
The inventor of a technology wants to see it utilized, and often perceives licensing-
out as a means of doing this and completing a cycle. However, if the inventor
intends to become involved with licensing as a strategy of choice that he will use
frequently, he must attempt to develop some objectivity concerning the technology.
Does this opportunity have the potential to create significant value? Not all inven
tions do, and those which don’t are often not good candidates for licensing.
Methods for assessing the size of the opportunity are presented in the Workbook. If
an opportunity exists, we recommend putting together a Business Opportunity
PreviewTM to share in total or in part with a potential licensee, once appropriate
Non-Disclosure Agreements have been signed. A Business Opportunity Preview is
the second element of the Licensing PackageTM.
Putting Your Team Together
You need a negotiation team that you can draw upon at the appropriate times.
You will most likely need the services of an attorney, a negotiator, and someone
who can assist with valuation—and you should anticipate the costs associated with
their efforts.
© DAWNBREAKER PRESS, 1998 L I C E N S I N G 73

Estimating Costs and Pay-Back
As was mentioned at the outset, licensing is a unique form of sales. As such, it has
associated expenses. It is recommended that you develop a marketing and sales
plan specifically for licensing the technology in question, to assure that you antici
pate both the time and the expenses associated with the effort. Out-of-pocket
expenses will include travel to the potential licensee’s site, the development of
presentation materials, and the costs associated with putting together your licensing
team. In addition, you should factor in the time that you will need to devote
to this endeavor.
When in the midst of negotiations, carefully consider the implications of all
the items that have a price tag associated with them. Such items include indemnifi
cation, maintenance of patents and responsibilities relative to infringers, technical
assistance, and travel.
Carefully consider how to create the best revenue stream for your company
and a win-win situation for both you and the licensee.
Making Your Case
Licensee Introductions
◗
◗
◗
◗
◗
◗
Colleague
Consultant
National events
Professional meetings
Trade shows
Unsolicited inquiries
Once you have selected the appropriate domain of potential licensees and devel
oped the materials to be used in making your case, you should determine the best
approach to a potential licensee. Common choices include introductions by a col
league or consultant, participation in national events that focus on licensing and/or
professional meetings and trade shows, and submission of unsolicited inquiries.
Although some people recommend making inquiries sequentially, it is often best to
start interacting with a number of relevant prospects simultaneously. This goal is
not to play one potential licensee off of the other, but simply to make the most of
what is usually a limited market window of opportunity. Once a potential licensee
shows interest—and perhaps requests a “stand-still” agreement—then you can
focus your efforts on that one party.
The importance of making a compelling case to potential licensees cannot
be underestimated. You don’t have to divulge a lot of information about what you
have, but in your initial approach you should demonstrate an understanding of their
strategies, their needs, and the manner in which what you have can further their
aims.
This is important, because most large companies erect a large initial hurdle
to potential licensees. They routinely request that interested parties sign a disclo
sure document indicating that everything that is shared with them they are free to
L I C E N S I N G © DAWNBREAKER PRESS, 1998 74

use. Some companies will only interact with outside sources after a patent has been
issued for the invention in question. The reason for this behavior is that the first
priority of any large company is to protect its assets. Large firms with a strong
emphasis on R&D have hundreds of research projects on-going at any given point
in time. No single point of contact could possibly have the knowledge of the
breadth and diversity of projects in-house. For this reason, when first contacted, any
large firm will routinely provide an inventor with a disclosure document indicating
that whatever the inventor shares with the company, the firm is free to use. This is
done to protect the company from possible lawsuits that could arise if someone sub
mits an idea to the company which is rejected, and on which the company is
already working. The inventor could incorrectly conclude that his or her idea was
stolen because of the timing of the product release subsequent to his or her inquiry.
For large firms, safety comes from adopting a set of procedures and protocols that
minimize the likelihood that these types of situations will arise. That is why you
have to work hard to create initial interest.
You need to decide at the outset what information you will disclose readily
and what information you need to hold back until the potential licensee has signed
a confidentiality agreement.
License Negotiation
Much was said earlier in the chapter about issues to be addressed during negotia
tions. Before getting to that point, however, the company will conduct due dili
gence on the technology and the market. During this period it is important that you
provide the potential licensee with information that they can use to sell up-line. It
is vital to the success of the project that many champions are formed along the way.
A well-developed Business Opportunity Preview can serve that need.
The following account from an executive experienced with high-tech licensing mat
ters highlights many aspects of the attitude you want to bring to the table during
licensing negotiations.
© DAWNBREAKER PRESS, 1998 L I C E N S I N G 75

ATTITUDE IS EVERYTHING
In the following excerpt from an interview with Mike Weiner, Chairman and
Founder of Manning and Napier Information Services—and previously the
Founder and CEO of Microlytics, a Xerox spin-off—it becomes clear that suc
cess depends more on your attitude and attention to detail than on what you
think you can do than on what you are told the rules are. There are always
exceptions to the rule!
I began to use personal computers at Xerox, and then moved into the software
marketing business. I found that the company wasn’t taking advantage of its software
assets, and I wanted the opportunity to take some of its assets outside. I kept looking for
people in the company who were supportive of my idea and ignoring those who were
opposed. Most were opposed.
Unlike the employees who left to form companies such as Adobe, 3COM, and
others, I was able to form a unique relationship with Xerox where Microlytics would
have an arms-length relationship with Xerox and license software that was underuti
lized and not of strategic interest. I have a no-fee consulting arrangement with the com
pany that allows me access while assuring confidentiality. Having an outlet such as
Microlytics is useful to a large firm. Technology assets are like milk. If you don’t do
something with them on a timely basis, they spoil.
We have had several licensing arrangements with Xerox. Our initial license
provided Microlytics with broad sub-licensing rights that were pivotal to our early suc
cess. We went from $3 to $14 million in three years. During the past 10 years, we have
dealt with the same corporate staff and the same R&D staff and maintained excellent
relationships.
In looking at what makes licensing successful, there are many factors. On many
occasions employees who leave a large company become very arrogant in their dealings
with the firm. That is counter-productive. Xerox is like family, and there is a tremen
dous amount of informal networking that takes place.
What we tend to do in our negotiations is to be sure that we understand the
issues of concern to the company with whom we are negotiating and address those issues.
During licensing negotiations with any firm, if you agree to something in your
verbal conversations, it is your obligation to address any omissions that you see in the
written document—omissions which not only favor you, but also omissions which favor
your negotiating partner. There must be reciprocity. You must be straight.
Issues regarding “know-how” are addressed up front. We also negotiate “flow
back” rights and specify which divisions get the rights in “licensing-back” arrangements.
Many times what we will do is select a company which we think will be the best
possible partner and offer the company a “no-cost, stand-still agreement” (30-60 days).
L I C E N S I N G © DAWNBREAKER PRESS, 1998 76

This allows the internal champion the time and incentive to try and gain a corporate
commitment. However, this offer has to be genuine on your part, and not a ploy.
In negotiations, it helps to be high-minded. Be consistent and over time many
of your partners will become that way also. However, it is imperative to review careful
ly any licensing agreement that you sign. You can never have too many eyes looking at a
document.
We have also walked away from deals because we have assessed the guys we are
dealing with to be disreputable.
I would recommend to anyone entering a licensing arrangement that he should
start by thinking about and defining the nature of the relationship that he wishes with a
licensee. Begin to act as if you have that type of relationship—model it in your actions.
Then articulate to the potential licensee what relationship you want. Attitude, more than
anything else, determines outcome. Also, above all, for an inventor or an entrepreneur,
consistency, credibility, and integrity are your greatest assets. Don’t forget what you have
agreed to.
When licensing arrangements go bad, it is usually because the licensee finds or
develops an alternative technology, and then devalues yours; or management changes
and doesn’t know about the relationship—or devalues it. Or it’s due to buyer’s remorse
or greed and avarice.
However, you should keep in mind that it is hard to unseat the status quo and,
if you are, work hard to maintain those relationships and your position.
Scientists and engineers want to see their ideas and inventions validated and
come to fruition. Corporations which don’t provide this run the risk of frustrating their
best and brightest. Yet most companies cannot hope to market all the productive output
of a bright and creative workforce. This is where an employee intrapreneurship and a
licensing-out policy can pay substantial dividends, including reduction of employee
turnover.
Implementation
During the implementation of a license, you should continue to monitor the extent
to which the terms of the agreement are being met. As the summaries below reveal,
failure to raise issues early can lead to unforeseen difficulties.
© DAWNBREAKER PRESS, 1998 L I C E N S I N G 77

RELEVANT LEGAL CASES
Introduction
In this section, we present a sample case in which contractual licensing
arrangements deteriorated and resulted in litigation. In this case, intellec
tual property protection was granted at the Federal level.
CASE 1: Coleman v. Corning Glass Works (U.S. District Court, Western District of New York, 1985)
Dr. Coleman, the owner of a U.S. patent, entered into a licensing agree
ment with Corning Glass Works, granting Corning an exclusive license for
the commercial development of a commercial integrated blood serum sep
arator under his patent. Corning terminated the agreement three years
later, alleging that a commercial, functioning blood separation machine
could not be made in accordance with Dr. Coleman’s patent. Allegedly,
independent research by Corning had also resulted in the development of
a superior approach to designing a serum machine.
Corning continued development of its serum machine, the “Corvac
Serum Machine,” and began production in 1975. Corning then sold the
entire product line to Sherwood Medical Industries three years later.
Dr. Coleman alleges that the blood separation device manufac
tured and sold by Corning (the Corvac Serum Machine) was within the
scope of his original patent. Corning moved for summary judgment on the
grounds that the plaintiff was too late in bringing this suit (16 years after
the initial licensing agreement was signed).
The court agreed with Corning, and Dr. Coleman lost the suit on
the grounds that he was too late bringing suit.
Some Lessons to be Learned by Independent Inventors
◗ Plan for what each party can or cannot do with shared informa
tion if a signed agreement is terminated.
◗
◗
Act sooner, rather than later.
Be sure of which statutes of limitations may be applicable.
Some Lessons to be Learned by Corporations
◗
◗
Good documentation is required of independent creation.
Act in good faith and try to structure “win-win” situations.
L I C E N S I N G © DAWNBREAKER PRESS, 1998 78

Elements of a Licensing PackageTM
A Licensing Package is a means of compiling pertinent information that you will
need during the licensing process. It should contain the following three compo
nents:
(1)
(2)
(3)
Business Opportunity PreviewTM
Analysis of Potential Licensees
Negotiation Issues
Activities designed to surface the information needed to develop each sec
tion of this package can be found in the Workbook in this Guide. Each of these ele
ments will be used in a different way. The Business Opportunity PreviewTM is
the document used to make your business case. It clarifies the nature of the oppor
tunity at hand. The Executive Summary should not contain any proprietary infor
mation, and should be used in your initial interaction with a potential licensee
when your discussions are not covered by a Confidentiality Agreement. The bal
ance of the document can be used in part or in its entirety, once you have clearly
established the interest of the potential licensee. Much of the information should
only be shared with a potential licensee once a Confidentiality Agreement has been
signed. However, you may find it necessary to share elements of this document
with a potential licensee prior to signing a Confidentiality Agreement, in order to
enable him or her to sell up-line. Information that demonstrates that you under
stand customer specifications and that demonstrates customer receptivity to the
product is often appropriate to share. A suggested outline for a Business
Opportunity PreviewTM follows.
Business Opportunity PreviewTM
1.0 EXECUTIVE SUMMARY This is a suggested outline,
and is not meant to be a
straight-jacket. In some situa
tions, a more compelling
case can be made if the
information is sequenced in a
different fashion. The overrid
ing concern is not the form,
but the presentation of a
believable case given the size
of the opportunity.
1.1 Description of industry
◗
◗ Industry drivers & issues
◗
Overview
Opportunity & threats
1.2 Technology available for Licensing
◗ Brief description
1.3 Licensing arrangement
◗
◗
Types of partners sought
Types of arrangements
(continued on the next page)
© DAWNBREAKER PRESS, 1998 L I C E N S I N G 79

2.0 COMPANY & TECHNOLOGY
2.1 Brief company introduction
◗
◗
◗
◗
Mission
Location, size, history
Overview of company capabilities
Management Team
2.2 Technology/product description
◗
◗
◗
Detailed description
Present state of development
Intellectual property
2.3 Related technology (only if appropriate)
3.0 CUSTOMERS
3.1 How need is currently filled
3.2. Important product specs and features
3.3. Degree of customer interest
3.4. Decision-makers and influencers
3.5. Basis for purchase decision
◗
◗
Frequency
Timing of purchase decision
4.0 MARKET
4.1 Market definition
◗ Market segmentation
Across applications (if appropriate)
Within applications
4.2 Market Size
◗
◗
Served available market
Rate of market growth
5.0 COMPETITORS
5.1 Indirect & Direct competitors
5.2 Competitive advantages
◗ Features, Advantages, Benefits
L I C E N S I N G © DAWNBREAKER PRESS, 1998 80
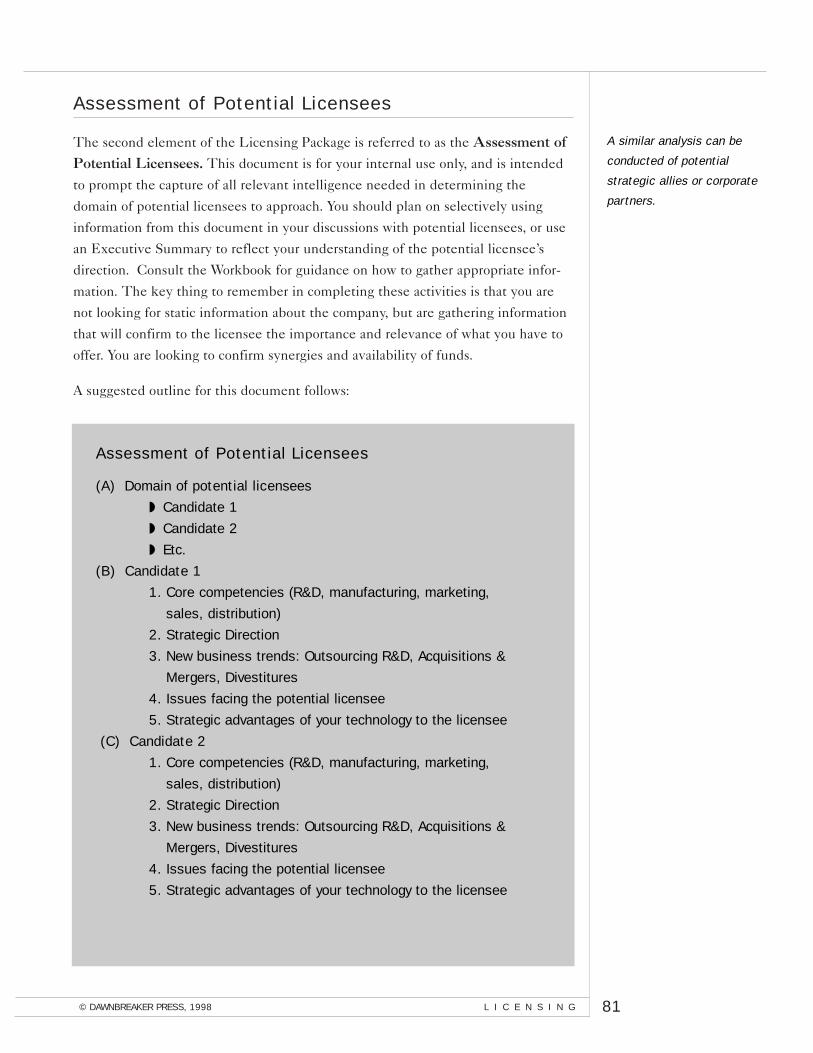
Assessment of Potential Licensees
A similar analysis can be
conducted of potential
strategic allies or corporate
partners.
The second element of the Licensing Package is referred to as the Assessment of Potential Licensees. This document is for your internal use only, and is intended
to prompt the capture of all relevant intelligence needed in determining the
domain of potential licensees to approach. You should plan on selectively using
information from this document in your discussions with potential licensees, or use
an Executive Summary to reflect your understanding of the potential licensee’s
direction. Consult the Workbook for guidance on how to gather appropriate infor
mation. The key thing to remember in completing these activities is that you are
not looking for static information about the company, but are gathering information
that will confirm to the licensee the importance and relevance of what you have to
offer. You are looking to confirm synergies and availability of funds.
A suggested outline for this document follows:
Assessment of Potential Licensees
(A) Domain of potential licensees
◗
◗
◗
Candidate 1
Candidate 2
Etc.
(B) Candidate 1
1. Core competencies (R&D, manufacturing, marketing,
sales, distribution)
2. Strategic Direction
3. New business trends: Outsourcing R&D, Acquisitions &
Mergers, Divestitures
4. Issues facing the potential licensee
5. Strategic advantages of your technology to the licensee
(C) Candidate 2
1. Core competencies (R&D, manufacturing, marketing,
sales, distribution)
2. Strategic Direction
3. New business trends: Outsourcing R&D, Acquisitions &
Mergers, Divestitures
4. Issues facing the potential licensee
5. Strategic advantages of your technology to the licensee
© DAWNBREAKER PRESS, 1998 L I C E N S I N G 81

Negotiation Issues
This third element of the Licensing Package is also a proprietary document and is
directly related to your Strategic Plan. After reviewing your Strategic Plan, complete
the following.
(1) Relevant Intellectual Property
1.1. Patents (issued and pending)
1.2. Trade-secrets
1.3. Copyrights
1.4. Trade secrets
1.5. Know-How
1.6 Licenses you hold from others
(2) Partitioning of the Opportunity
2.1 Upstream/downstream
2.2 Industry
2.3 Geographic location
(3) Rights You Wish to Retain
• Itemize applications
(4) Consulting and/or Development Role
• As part of license
• In addition to license
(5) Grant-backs & Improvements
(6) What You Are Willing to Provide
• Itemize
(7) What Licensee Would Need to Provide
• Degree of technology risk
Conclusion
Licensing is one of a variety of strategies that can be used to successfully commer
cialize a technology. Success in this arena requires that the potential licensor
becomes skilled in locating the best potential licensee, developing a compelling
case, and nurturing the relationship through the stages of due diligence, negotia
tion, and implementation. A company that is serious about licensing should develop
a Licensing Package as a means of pulling together all pertinent information that
will be needed during the licensing process.
L I C E N S I N G © DAWNBREAKER PRESS, 1998 82

C H A P T E R
6
Teaming For Success
AD VA N C E D OR G A N I Z E R
DE F I N I T I O N S
JO I N T VE N T U R E S
WH Y F O R M A C O R P O R AT E
PA R T N E R S H I P?
WH AT A R E T H E R I S K S O F
C O R P O R AT E PA R T N E R I N G?
HO W T O S T R U C T U R E A
S U C C E S S F U L C O R P O R AT E
PA R T N E R S H I P
CO N C L U S I O N

TEAMING FOR SUCCESSS C H A P T E R 6
Advanced Organizer
The expense of bringing products to market in highly competitive industries such
as pharmaceuticals and semiconductors—as well as the need to accelerate product
introduction and shore up competitive positions—have led many large and small
firms to collaborate. Once fierce competitors, companies such as General Motors
and Toyota, Siemens and Philips, and Canon and Kodak have become allies
(Hamel et al., 1989). The purpose of this chapter is to examine corporate partnering, and to provide insight into when and how you may wish to consider corporate
partnering as a commercialization strategy.
F I G U R E 6 - 1 : C O R P O R A T E P A R T N E R I N G A D V A N C E D O R G A N I Z E R
S U C C E S S F U L C O R P O R AT E PA R T N E R I N G
CORPORATE PARTNERING
JOINT VENTURES
JOINT VENTURES
R&D agreements
Distribution Agreements
Manufacturing Agreements
Contractual
Separate entity
Why form?
Risks?
Solid foundation
© DAWNBREAKER PRESS, 1998 M E E T I N G T H E C H A L L E N G E 85

Definitions
Villeneuve, Thomas, F.,
Gunderson Jr., Robert V., and
Kaufman, Daniel M.,
Corporate Partnering:
Structuring and Negotiating
Domestic and International
Strategic Alliances. Aspen
Law & Business, 1995.
86 T E A M I N G F O R S U C C E S S © DAWNBREAKER PRESS, 1998
Corporate partnering is not the same as a strategic alliance (Villeneuve et al., 1995).
The former is distinguished by the presence of the following:
◗ Two or more organizations (e.g., a customer and a supplier or two or
more competitors),
◗ A relationship which requires performance over time
◗ Two or more contractual or transactional elements, such as a licensing
agreement, a research and development agreement, a distribution agree
ment, equity financing, a manufacturing agreement, or debt financing
◗ A system of interdependencies
By contrast, a strategic alliance may be short in duration, less formal, and/or
contain fewer contractual or transactional elements. Some of these elements are
described below.
This section describes part
nering primarily at the later
stages of R&D and for com
mercialization. Partnering in
an ATP joint venture involves
a somewhat different set of
motivations and challenges,
not fully covered here.
The Research and Development Agreement
A research and development agreement is a common element of corporate partner
ing arrangements. Such agreements clarify the following: (1) the research and devel
opment responsibilities of each party; (2) who will fund the components of the
effort; and (3) what rights will be divided among the players upon completion of the
research and development. As was mentioned at the outset, corporate partnering
arrangements involve a family of contractual elements. For example, it is not
uncommon with pharmaceutical research and development agreements that another
contractual element be a license and supply agreement. Villeneuve provides an
example of a research and development agreement with an option (Villeneuve et al.,
Chapter 13).
Because of the risk associated with research and development activities, it
is best for the developer (the junior party) to maintain its obligation level to “rea
sonable commercial efforts” (Radcliffe and Clowes, 1991). This is suggested
because research and development outcomes cannot be guaranteed. In addition, the
R&D agreement should clarify how changes in specifications will be handled.
Many ATP awardees have
already formed some
research and development
partnerships. The intent of
this chapter is to provide
insight into additional
options.
The Distribution Agreement
A distribution agreement is a common element of many corporate partnering
arrangements between small and large firms. The smaller firm typically provides
the product, while the larger company provides the distribution channel. The bene
fit of this arrangement to the small firm is quicker time to market and money saved

through bypassing an investment in the development of an effective distribution
channel (often an impossible task when there are strong incumbents). For the large
company, the benefit comes in the form of revenue generation, which results from
having new product to pump through existing distribution channels. The large com
pany also saves money in this arrangement, by having the option to invest less in
internal research and development.
Villeneuve et al. indicate that many contractual agreements are really varia
tions of a supply/distribution agreement. These variations include the Supply Agreement, the Original Equipment Manufacturer (OEM) Agreement, the
Value-Added Reseller (VAR) Agreement, and the Distribution Agreement. In most supply agreements, the purchaser agrees to purchase and use the
supplied material in the production of its own product. An OEM agreement is simi
lar, but in this case, the purchaser typically bundles the supplied product with, or
incorporates it into, its own products. Labeling needs to be clarified in such agree
ments. With a Value-Added Re-seller agreement (VAR), the supplier may customize
the product for a specific vertical market application and/or provide the end-user
with services. Under a distribution agreement, the supplied product in its original
form is distributed under the supplier’s trademark. An excellent example of a
Supply Agreement for a biotechnology firm can be found in Villeneuve et al.
(Chapter 7).
SUPPLIER AGREEMENT
◗
◗
◗
◗
◗
buyer is obligated to
purchase from seller
buyer is required to
provide forecasts
seller has delivery
obligations
product acceptance
procedures are clarified
liability and compliance
requirements are clarified
The Manufacturing Agreement
Hamel recommends a change in focus with respect to OEM agreements, especially
when corporate partnering crosses international lines (Hamel et al., 1989). U.S.
firms, he maintains, typically enter OEM agreements as a way to avoid costs, as
well as to gain competitive edge quickly and with minimum effort. By contrast,
many overseas firms enter an arrangement with the intent to learn as much as possi
ble about their partner’s customers, methods of doing business, and markets. For
example, Hamel mentions that in the case of one particular alliance between a
European and Japanese firm, every time the European firm asked for manufactur
ing design modifications to be made, the Japanese partner asked for detailed
information about customers and competitors before it would respond to the
request. In this fashion, the Japanese partner developed very detailed information
about the marketplace. Hamel recommends that U.S. firms adopt a similar attitude
toward partnering—namely, to view it as a means of strategic learning. In addition,
he recommends that special precautions be taken to minimize the unwanted
transfer of information.
Collaboration is competition in a different form, according to Hamel.
Successful companies never forget that their new partners may be out to disarm
© DAWNBREAKER PRESS, 1998 T E A M I N G F O R S U C C E S S 87

them. It is therefore important that companies engaged in corporate partnerships
inform employees at all levels as to which skills and technologies they should not
share. In addition, companies should consider restricting access to their facilities.
Joint Ventures
Most corporate partnerships are purely contractual in nature, although some result
in the formation of a new corporate entity. In contractual joint ventures, the larger
company is often referred to as the senior party, while the smaller company is
referred to as the junior party. The objective of the relationship is to sell product
and finance additional research and development (Radcliffe and Clowes, 1991).
Technology, research and development, or products are usually provided by the
smaller entity, while the senior party provides financing (debt, equity, or R&D
funding), as well as services.
The allocation of subsequent manufacturing and distribution rights is
another key element of the agreement. In some cases, the junior party may wish to
establish and expand its manufacturing capabilities, utilizing capital from the senior
party to build such facilities. It may give up marketing and distribution rights but
insist that it retain manufacturing rights. Furthermore, it may insist on minimum
and firm purchase orders to justify and support the expanded manufacturing capaci
ty (Villeneuve et al., 1995). The contractual relationship between the two parties
may also be useful in attracting financing from a third party.
In some situations, the joint venture may take the form of a new corporate
entity. This option is typically considered when it is not anticipated that there will
be significant early losses (Greeley, 1990). In such cases, the investment may take
the form of preferred stock because of the preference it offers on liquidation, anti-
dilution protection, and special voting rights. Valuation and control issues come to
the foreground when a new corporate entity is formed.
In joint ventures between
software developers and
computer manufacturers or
operating system vendors,
the senior party typically pro
vides funding, equipment,
and tools in exchange for
rights to market the ported
product (Villeneuve et al.,
1995). Why Form a Corporate Partnership?
A corporate partnership is a competitive tool. “The challenge is to share enough
skills to create advantage vis a vis companies outside the alliance, while preventing
a wholesale transfer of core skills to the partner (Hamel et al., 1989).” When oppor
tunity costs and entry risk are extremely high, it is often not feasible to conduct all
development work in-house (Krubasik, 1988). In such instances, joint ventures may
be the preferable choice.
According to Harrigan (1986), joint ventures provide tremendous opportuni
ties for an organization to strengthen its current strategic platform. In emerging
fields, joint ventures enable companies to:
T E A M I N G F O R S U C C E S S © DAWNBREAKER PRESS, 1998 88

◗
◗
◗
◗
◗
◗
influence the evolution of an industry’s structure
pre-empt competitors
share cost and risk
obtain additional financing
expand corporate intelligence
retain entrepreneurial employees
In some instances, a joint venture does not offer a fast enough response to changing
conditions. Under such circumstances, an acquisition may be necessary in order to
quickly obtain the desired competitive advantage.
What Are the Risks of Corporate Partnering?
Whenever an interdependency is formed, both parties assume risk. If a company of
any size comes to rely upon another for a specific business function, it is unlikely to
develop that capacity itself. Unless a partner makes itself indispensable to the rela
tionship, an ally could become a competitor.
Other risks are loss of flexibility and future opportunities. This is more like
ly to occur with inexperienced, smaller companies which may be naive when first
entering a corporate partnering arrangement. The terms and conditions of the joint
venture could potentially be so inclusive as to be, in essence, an acquisition.
According to Villeneuve et al., potential investors in the smaller firms have often
walked away from deals that on the surface seemed attractive, but which due dili
gence revealed to be little more than an research and development arm locked into
a relationship with a large firm.
How Is a Successful Corporate Partnership Structured?
Corporate partnerships are not panaceas, and they require a great deal of attention
to make them function well over the long haul. As with most relationships, when
corporate partnerships fail, it is due to poor initial choice of partners, unrealistic
expectations, poorly articulated objectives, and changes in corporate direction.
When considering a corporate partnership, it is a good idea to keep in mind the
strategic planning and competitive intelligence tips discussed in Chapters 4 and 5.
In addition, Badaracco (1991) recommends that the following:
(1) Have a clear understanding of your company’s present and
future capabilities.
(2) Carefully consider the strengths and weaknesses of potential partners.
(3) Examine your own and your partner’s values, capabilities,
and commitment level.
© DAWNBREAKER PRESS, 1998 T E A M I N G F O R S U C C E S S 89

If you determine that a corporate partnership is appropriate for the com
mercialization of your technology platform, and if you have chosen a partner care
fully, remember that the corporate partnership will take considerable time and
attention to develop trust and understanding. As Badaracco notes, alliances need to
be led, not just managed.
Lay the foundation well, beginning with the Letter of Intent— also called a
Memorandum of Understanding (MOU) or an Agreement in Principle. The Letter
of Intent should be reviewed by legal counsel to minimize delays and frustrations.
Immediately after signing the letter, begin preparation and negotiation of the family
of interrelated final agreements (e.g., a research and development agreement, a
supply agreement, and a financing agreement). These documents are negotiated as
a package, even though they constitute separate agreements. (See Chapter 1 of
Villeneuve et al., 1995, for numerous tips on how to prepare for negotiations.)
Conclusion
Corporate partnering can provide many strategic benefits. In the next chapter we
see that with some technologies, corporate partnering may be the only way to ade
quately share risk and obtain the investment required. Although the equity invest
ment market is growing, it is focused on a limited number of markets—those that
can yield a short-term payback.
T E A M I N G F O R S U C C E S S © DAWNBREAKER PRESS, 1998 90

C H A P T E R
7
Equity Investments
AD VA N C E D OR G A N I Z E R
BU S I N E S S AN G E L S
IN S T I T U T I O N A L VE N T U R E CA P I TA L
IN V E S T M E N T BA N K E R S
IN I T I A L PU B L I C OF F E R I N G S
TO O L S T O U S E W I T H E Q U I T Y
I N V E S T O R S
WH O S H O U L D D E V E L O P T H E
B U S I N E S S P L A N?
WH AT F O R M AT D O I F O L L O W?
BU S I N E S S PL A N OU T L I N E (GE N E R A L)
BU S I N E S S PL A N OU T L I N E (DE TA I L E D)
EX E C U T I V E SU M M A RY
GE T T I N G F E E D B A C K O N T H E P L A N
RE V I S I N G T H E P L A N
GU I D E L I N E S F O R B U S I N E S S P L A N
R E V I S I O N S
HO W T O U S E Y O U R B U S I N E S S P L A N
HO W T O C R E AT E O P P O R T U N I T I E S F O R
D I S T R I B U T I N G Y O U R P L A N
IN T E R N A L VA L U E O F T H E P L A N
SU M M A RY

EQUITY INVESTORS C H A P T E R 7
Advanced Organizer
In Chapter 2 we offered a general roadmap to financing and discussed the relative
size of different equity markets. In this chapter we provide more detailed informa
tion about how to find and approach various types of equity investors, whether they
be business angels, institutional venture capital firms, or investment bankers. We
also provide information on how to develop an appropriate business plan.
Regardless of which form of equity financing you choose to pursue, you will still
need a good business plan. Many documents are called “business plans,” but most
fit the bill in name only. The basic plan, with which we conclude this chapter, has
been used with over 400 small businesses. Business plans developed using this
methodology are frequently rated in the top 20% of business plans seen
by investors.
Please note that the outline
for a business plan included
in this chapter is intended
for use in the post-ATP
award period ONLY. Please
be sure to consult ATP’s
proposal preparation guide
lines if you are preparing a
business plan to include
with the ATP proposal.
F I G U R E 7 - 1 : A D V A N C E D O R G A N I Z E R F O R E Q U I T Y
F I N D I N G E Q U I T Y I N V E S T O R S
TYPES OF BUSINESS DOCUMENTS
INVESTORS PLANS
Business Angels
Venture Capital
Investment Bankers
Scope
Audiences
Business plan
Presentation Chapter 8
© DAWNBREAKER PRESS, 1998 E Q U I T Y I N V E S T O R S 93
This chapter is intended to
expand and enhance the pre
liminary plan developed as
part of the ATP proposal into
a robust operating plan
which can be used for both
internal and external
applications.

Business Angels
Finding Your Wings: How to
Locate Private Investors to
Fund Your Venture, by Gerald
A. Benjamin and Joel
Margulis. John Wiley and
Sons: (800) 225-5945.
Who Should Approach Business Angels?
As we mentioned in an earlier chapter, there are three types of entrepreneurial
companies: the life-style firm, the foundation company, and the high-potential ven
ture. Any of these entities could benefit from approaching a business angel. A life
style company might approach an angel for a loan, whereas a foundation company
or high-potential venture might approach an angel for an early-stage equity invest
ment. If relatively small amounts of money are needed (defined as amounts under
$500,000), an entrepreneur might be best served by approaching a business angel.
How Do You Find a Business Angel?
Business angels invest their
own money and tend to
shield themselves from the
barrage of needy companies.
Intermediaries are frequently
used as a filter.
Unlike banks or venture capital firms, business angels do not publish their address
es and phone numbers. Investing is not the primary activity of business angels, but
something they do on the side. Angels will either seek investment opportunities on
their own or work through intermediaries that serve as both buffers and filters.
According to a study conducted by William Wetzel in 1984, the most common
sources of referrals are friends, business associates, or active personal searches.
Other, less-used sources include investment bankers, business brokers, commercial
bankers, attorneys, and accountants.
How do you find an angel? Look close to home—within a 50-mile radius.
Network with your colleagues. Ask your accountant, lawyer, doctor, or other suc
cessful entrepreneurs in the community who they think might invest in start-ups.
Visit or call these potential investors—and take your business plan with you. You
might also become a member of a computer matching service, and attend venture
capital club meetings.
94 E Q U I T Y I N V E S T O R S © DAWNBREAKER PRESS, 1998
The Technology Capital Network at MIT
The Technology Capital Network at MIT is a database that acts as an intermediary
between entrepreneurs and investors. Information on venture capitalists and other
funding sources are entered into a database, along with data on entrepreneurs, for a
subscription period of at least one year. Each time a new subscriber arrives, whether
investor or entrepreneur, a run is made through the entire database to find matches
between entrepreneurs seeking funding and investors seeking viable alternatives.
Prior matches are screened out to avoid duplicate matchmaking.
Matches are made against a profile of each entrant. A questionnaire is used
for both investors and entrepreneurs. Entrepreneurs must also provide a copy of the

Executive Summary from their business plans, and one-page financials.
When a match is found, general material describing the entrepreneur and
the opportunity is mailed to the matching capital sources. When the capital
source(s) indicate(s) further interest, the name of each party is supplied to the
other, and they are left to arrange meetings and follow up. One popular matching
service is ACE-Net.
The Technology Capital Network has been at MIT since 1990. In essence,
it is a transplanted version of the Venture Capital Network of the Center for
Venture Research at the University of New Hampshire. The database currently
contains approximately 250 names, with a ratio of two entrepreneurs for each
investor. Funding of this network is accomplished through fees and sponsors. The
fees are $300 per year for entrepreneurs, $350 per year for private investors, and
$700 a year for professional investors (both companies and venture capital funds).
Sponsors include the Digital Equipment Corporation (the primary sponsor) and the
Commonwealth of Massachusetts.
Venture Capital Clubs
The business angel community is quite different in other parts of the country. In
New York State, for example, one can find out about meetings of the informal ven
ture capital community by contacting any local Chamber of Commerce. Other
states lack formal relationships with the angel community, however, so other
approaches are required there.
To find out if there are venture capital clubs in your area, contact the
National Venture Capital Association. Venture capital clubs tend to meet on a
monthly basis and invite two to four entrepreneurs who are interested in raising
money to come and make a 15-minute presentation to a group over breakfast. The
audience will often include many service providers, but enough business angels
should be present for you to begin the process of networking locally.
How Do Angels Make Money?
Investment is not a full-time endeavor for business angels, so the angel market
tends to be less sophisticated than the professional venture capital (VC) market.
Nevertheless, business angels look for a Return on Investment (ROI) in a similar
fashion to the VC community. Angels’ terms and conditions are often more lenient
than those of institutional venture capitalists.
© DAWNBREAKER PRESS, 1998 E Q U I T Y I N V E S T O R S 95

◗
◗
◗
96 E Q U I T Y I N V E S T O R S © DAWNBREAKER PRESS, 1998
Institutional Venture Capital Community
National Venture Capital
Association (NASBIC)
(703) 351-5267.
Be selective when
contacting institutional
investors. Contact those
venture capital firms which
invest in your:
geographic region
industry
stage of development
There are approximately 1,000 institutional investment companies in the U.S.
Some of these are partnerships, others are affiliated with large corporations, and still
others are affiliated with the government (SBIC—Small Business Investment
Corporations, and MSBIC—Minority Small Business Investment Corporations).
Such funds are usually staffed by professional money managers who make decisions
regarding the investment of other people’s money in businesses that have a high
promise of return. The funds they invest typically come from pension funds, corpo
rations, and insurance companies. It is for this reason that most professional venture
capital funds prefer to enter at the level of Second Stage Financing, and not before.
How to Find Out About the Venture Capital Community
Venture capitalists are full-time professionals and make their whereabouts well-
known. Rather than approaching venture capitalists cold, however, it is best to have
a personal introduction; also, make sure you have a solid business plan that’s ready
to distribute. A primary source for locating venture capitalists is Pratt’s Guide to
Venture Capital. This source is updated annually, and is found in the reference sec
tion of most libraries. Pratt’s Guide lists investors by technology, service areas of
interest, and geographic location. You will find the name, address, fax, and phone
number of appropriate contacts, plus information regarding the level of investment
that they make, the kinds of financials that they wish to see, and whether they are
currently making any investments.
Processes and documents
Pratt’s Guide to Venture
Capital, edited by Daniel
Bokser, Securities Data
Publishing, (800) 455-5844.
Venture capitalists see hundreds of business plans in any given week. Most of the
plans don’t make it past a cursory review. According to Pratt’s Guide, 60% are reject
ed after a 20-30 minute scanning, and 25% are discarded after a lengthier review.
The remaining 15% are looked at in more detail, and of these, 10% are dismissed
due disqualifying flaws in the management team or the business plan. Only 5% are
considered to be viable investment opportunities and 3% result in successful
financing.
Again, your firm must have a management team before it seeks out institu
tional venture capital, since sole proprietorships are NOT of interest to the VC
community. Your management team must have an appropriate balance of experi
ence and authority, such that it can cover all of the following: marketing and sales,
research and development, operations, and finance and administration.
Venture Capital Resource
Library
http://www.vfinance.com

If you get to first base with a venture capital investor and follow due diligence, you
will need to draft a number of documents as part of the follow-through process:
◗
◗
◗
Letters of Intent
Financing Agreements
Operating Covenants
Investment Bankers
The Private Placement
High-potential ventures and foundation companies may find private placements to
be a good financing option. Private Placements and Initial Public Offerings (IPOs)
involve the SEC, a quasi-judicial administrative agency of the Federal govern
ment—as well as the SEC’s counterpart organizations in each state. SEC-regulated
financing methods are complex, and so are best avoided by life-style firms. For an
excellent discussion of this topic, you may wish to pick up a copy of The
Entrepreneur’s Guide to Going Public, by James B. Arkebauer.
To understand private placements, one needs to understand some of the
legislative background of the SEC. The Securities and Exchange Commission was
formed in 1934 pursuant to the Securities Exchange Act of 1933. The purpose
of this Act was to form an entity that would guard against fraudulent sales practices,
supervise the registration of securities, and regulate the over-the-counter and secu
rities markets. The New York Stock Exchange (NYSE), American Stock Exchange
(AMEX), the National Association of Securities Dealers Automated Quotation
System (NASDAQ)—as well as the Over-The-Counter (OTC) markets—are all reg
ulated by the SEC and its regional offices. The SEC and the Act of ’33 require that
when securities are sold, information be fairly and fully disclosed to the public.
Companies comply in many ways, including an elaborate and expensive registration
process, the preparation of a document referred to as a prospectus, and by heeding
limitations on other information it may divulge once an underwriter has been
signed.
Due to the inability of many small companies to participate in the costly
IPO process, new legislation—the Small Business Investment Incentive Act—was
passed in 1980. One of the results of the law was that in 1982, the SEC implement
ed an exemption referred to as Regulation D, or Reg D for short. It had positive
implications for small business that are described in Arkebauer’s book. In 1988, still
other revisions were implemented, making it easier still for small businesses to
engage in equity fund-raising.
© DAWNBREAKER PRESS, 1998 E Q U I T Y I N V E S T O R S 97

An important caveat to
mention here is that every
state has its own laws,
referred to as “blue-sky”
laws, which also affect the
sale of securities. Be
mindful that there are both
state and federal regula
tions, as well as registra
tion processes, for each.
You are advised to consult
a corporate attorney who
specializes in SEC issues
to guide you through this
process.
Regulation D clarifies exemptions to the SEC regulations as articulated in the Act
of ’33, and provides the basis for Private Placements. There are six rules that consti
tute Regulation D:
Rule 501 definitions and terms
Rule 502 conditions, limitations, and information requirements
Rule 503 SEC notification requirements
Rule 504 raising money through securities sales up to $1 million
Rule 505 raising money through securities sales of between $1 and
$5 million
Rule 506 raising money through securities sales over $5 million
For detailed descriptions of each of these rules, you may wish to read Arkebauer’s
book and contact a regional or state SEC office for information on the registration
process for Private Placements (Regulation D) and other SEC exemptions. You
might also request a copy of a small brochure called Q&A: Small Business and the SEC, from your regional SEC office. Contact information for the 12 regional
offices is listed below:
Securities & Exchange Commission Northeast Regional Office 7 World Trade Center, 13th Floor
New York, NY 10048
(212) 748-8000
e-mail: [email protected]
Securities & Exchange Commission Southeast Regional Office 1401 Brickell Avenue, Suite 200
Miami, FL 33131
(305) 536-4700
e-mail: [email protected]
Securities & Exchange Commission Boston District Office 73 Tremont Street, Suite 600
Boston, MA 02108-3912
(617) 424-5900
e-mail: [email protected]
Securities & Exchange Commission Atlanta District Office 3475 Lenox Road, N.E., Suite 1000
Atlanta, GA 30326-1232
e-mail: [email protected]
Securities & Exchange Commission Philadelphia District Office The Curtis Center, Suite 1120 East
601 Walnut Street
Philadelphia, PA 19106-3322
(215) 597-3100
e-mail: [email protected]
Securities & Exchange Commission Midwest Regional Office Citicorp Center
500 West Madison Street, Suite 1400
Chicago, IL 60661-2511
(312) 353-7390
e-mail: [email protected]
E Q U I T Y I N V E S T O R S © DAWNBREAKER PRESS, 1998 98

Securities & Exchange Commission Central Regional Office 1801 California Street, Suite 4800
Denver, CO 80202-2648
(303) 844-1000
e-mail: [email protected]
Securities & Exchange Commission Fort Worth District Office 801 Cherry Street, Suite 1900
Fort Worth, TX 76102
(817) 978-3821
e-mail: [email protected]
Securities & Exchange Commission Salt Lake District Office 500 Key Bank Tower
50 South Main Street, Suite 500,
Box 79
Salt Lake City, UT 84144-0402
(801) 524-5796
e-mail: [email protected]
Securities & Exchange Commission Pacific Regional Office 5670 Wilshire Boulevard, 11th Floor
Los Angeles, CA 90036-3648
(213) 965-3998
e-mail: [email protected]
Securities & Exchange Commission San Francisco District Office 44 Montgomery Street, Suite 1100
San Francisco, CA 94104
(415) 705-2500
e-mail: [email protected]
© DAWNBREAKER PRESS, 1998 E Q U I T Y I N V E S T O R S 99

100 E Q U I T Y I N V E S T O R S © DAWNBREAKER PRESS, 1998
In addition, be sure to contact the appropriate organization to determine filing fees
and regulations that your state has for Private Placements. A source you can consult
for such information is The National Directory of Addresses and Telephone Numbers, which you can find in most libraries at the reserve desk. It lists the tele
phone numbers for many state agencies.
A contact list for a few selected states follows here.
Arizona
Arizona Corporation Commission
1300 W. Washington
Phoenix, AZ 85007
(602) 542-4242
California
Department of Corporation
3700 Wilshire Blvd., 6th Floor
Los Angeles, CA 90010
(213) 736-3015
Colorado
Colorado Division of Securities
1580 Lincoln, Suite 420
Denver, Colorado 80203
(303) 894-2320
Massachusetts
Massachusetts Securities Division
Room 1701
One Ashburton Place
Boston, MA 02108
Ohio
Ohio Division of Securities
77 S. High St., 22nd Floor
Columbus, OH 43266-0548
(614) 644-7381
Initial Public Offerings
When a firm conducts an Initial Public Offering (IPO) or Goes Public, the life of
that firm will never be the same. From that day forward, the company will have
many owners, all of whom need information about every aspect of the business and
all of whom will have a say in the future of the company. Management teams that
are unwilling to share control of their business—as well as its risks and rewards—are
not good candidates for an IPO. On the other hand, the rewards of going public are
many. It is a means for recapitalizing a firm, and for appreciating a company’s stock
value. Going public brings prestige and glamour to a company. It is a good strategy
to use if positioning for an acquisition or a merger. It is also the primary vehicle
used by the venture capital community for “cashing out.” The downside, as men
tioned previously, includes loss of control, strict disclosure requirements, and cost—
of both initiating the IPO and operating as a public company afterwards.
“Technology-driven compa
nies, especially start-ups
need more capital at a much
faster rate than their low-tech
counterparts. The reason is
straightforward....they have a
narrow window of opportunity
in an environment that sees
new technologies daily.”
Technology & Jobs Agenda
http://www.ilcoaliation.org/
sec1.htm

The costs associated with IPOs fall into four categories:
◗
◗
◗
◗
Underwriter costs
Professional costs
Up-front costs
Hidden and future costs
An underwriter is an investment banker or a broker/dealer who serves as an inter
mediary between a) the company offering securities for sale, and b) the investing
public that purchases them. The underwriter’s fee, sometimes referred to as a
commission or underwriter’s discount, is a percentage of the value of the stock
sold. For smaller offerings, the current standard is approximately 10%. In addition,
the underwriter receives an expense allowance ranging from 1 to 4% of the amounts
raised in the IPO. Thus, if your IPO were for $10 million, the underwriter’s dis
count at 10% would be $1 million. The expense allowance of the IPO, say 2%,
would be an additional $200,000. So in this case, the total underwriter’s cost would
be $1.2 million.
A few additional notes on IPO fees and documentation:
Professional fees include the cost of attorneys and accountants, and can
vary widely—between $20,000 and $200,000, depending on the size of the issue.
Professional expenses are in large part determined by the amount of corporate
cleanup resulting from previous arrangements, poor record-keeping and related
complexities.
Up-front fees include costs for printing the Registration statement, the
document referred to as a red herring, and the definitive prospectus. The total
printing costs can vary between $10,000 and $40,000. There are also filing fees with
the SEC, the state, the National Association of Securities Dealers, and other enti
ties. Many of these fees are expressed as a percentage of the total amount of the
offering.
After the IPO, the company will have the continued obligation to prepare
and print a variety of disclosure documents, including a Form SR: Application of Proceeds; Form 8-K: Current Reports; Form 10-K: Annual Report; Form 10-Q: Quarterly Report. As a result, a publicly traded company needs to add staff
or contract with a financial public relations firm to produce such documentation
throughout the life of the public company. The role of management also shifts, to
assure that good relationships are maintained with the shareholders.
Arkebauer calculates that, for smaller offerings, total costs and expenses can
reach 24% to 39% of the offering. Choosing a private placement rather than and
IPO can obviate the need for many of these expenses, restrictions, and reporting
requirements.
© DAWNBREAKER PRESS, 1998 E Q U I T Y I N V E S T O R S 101

Tools to use with Equity Investors
The following section contains a description of and the outlines for various tools
that you will need to interest equity investors, or to assist in your negotiations
with them.
The Business Plan
To be useful, a business plan must be very specific, for only in the presence of
detailed information can one ascertain customer needs and develop strategies, costs,
and realistic financial goals. This need for specificity means that you should limit
the scope of your business plan, however. For example, suppose you have devel
oped a rich technology platform that has diverse applications in the automotive,
computer, and chemical industries. Furthermore, suppose you wish to pursue differ
ent commercialization strategies with each application—licensing to the automotive
industry, equity financing to manufacture a component for use in the computer
industry, and a joint venture with a large firm in the chemical industry. The ques
tion is whether you should develop one business plan or three. In order to make
the business planning process productive and manageable, the answer is three: one
plan around each of the three different applications. If you tried to tackle all three
concurrently, the information would be kept at the macro level, resulting in a super
ficial, misleading treatment of the opportunities. Technology-rich companies are
best served by developing plans around a) lines of business, b) strategic business
units, or c) product lines aimed at similar markets.
Scope also refers to time. Business plans have a five-year horizon. In other
words, they reflect a course charted for a five-year period. The operational plans for
the first year are usually expressed in great detail, and in a more general fashion for
years two through five. Business plans should be revisited annually (if not more fre
quently), and adjustments made in light of new information acquired during the
realization of the first year’s goals and objectives.
A business plan is the result of a rigorous planning process. As in science,
the document produced is only as good as the research that precedes it. To merely
package the information that you currently have without first testing your hypothe
ses and assumptions would be tantamount to writing a conclusive technical paper
based on the hypotheses and assumptions that precede rigorous scientific inquiry.
Detailed guidelines for conducting the business research which precedes the devel
opment of an excellent business plan can be found in Business Planning for Scientists
and Engineers (Servo, 1999). Section 3 of this ATP guide includes activities to help
the entrepreneur develop a more detailed picture of his or her business opportunity.
E Q U I T Y I N V E S T O R S © DAWNBREAKER PRESS, 1998 102

Commercialization Plans vs. Business Plans
Companies often confuse business plans with commercialization plans. The two
are not the same, even though they do have a direct bearing on one another. A com
mercialization plan is a strategic statement of how you will bring one or more tech
nologies to market. It is a strategic overview that often includes an analysis of which
applications and which markets are likely to mature first. By contrast, a business
plan is detailed and charts a clear, specific path to realizing financial reward around
well-defined opportunities. Each business plan will tie back to the commercializa
tion plan. In summary, a commercialization plan is macro, the business plan is
micro; a commercialization plan is global, a business plan is specific; and a commer
cialization plan encompasses a whole technology, while a business plan is tied to
lines of business.
The Prospectus vs. The Business Plan
Confusion often arises between a business plan and a prospectus. A prospectus is a
stylized, public, disclosure document developed in accordance with the guidelines
of the Securities and Exchange Commission. It is developed specifically for an
external audience of unqualified and qualified investors—investment bankers place
much emphasis on this document. “Buyer beware” is the message that the prospec
tus must portray. The focus of the document is full disclosure of financials, money
requested and how it will be used, risk, and the management team. The prospectus
does not address the market, customers, or operational plans in the fashion
described in the business plan. Nevertheless, a business plan is an important docu
ment for companies wishing to go public. It is a necessary document for gaining the
interest and involvement of viable underwriters.
Who Should Develop a Business Plan?
The founder of a small company is often overextended, and often looks to others to
draft a business plan for the company. When money is readily available, a founder
usually hires a consultant. When funds are tight, however, a founder often tries to
involve someone else in developing the plan “on-spec”—that is, to invest his/her
time working on the plans in exchange for a job or an equity positions in the firm.
If you are the founder, develop your business plan yourself—no matter how appeal
ing these other options may seem. As the leader of your firm, you must be directly
and intimately involved. Business planning is a transformational process, and if you
are not involved, you will fail to grow with your business. If you are serious about
developing a good business plan, you must begin by setting aside time on a weekly
© DAWNBREAKER PRESS, 1998 E Q U I T Y I N V E S T O R S 103
This outline is to be used in
the post-ATP-award period
ONLY. Please consult ATP’s
proposal preparation guide
lines if you are preparing a
business plan to submit as
part of an ATP proposal.
No matter how appealing it
may be to have someone
else develop a business plan
for your company, you must
do it yourself.

basis to complete various tasks associated with the business planning process.
At the same time, being involved does not mean that you should proceed
without help. Quite the contrary. In order to be able to add this activity to an
already busy schedule, you must look for ways to leverage your time—by finding an
appropriate way of involving others.
What Format Do I Follow?
We have included two versions of a business plan outline on the following pages to
familiarize you with what the end product should look like. When reviewing these
outlines, keep in mind that any business plan is only as good as the research that
precedes it. If you merely package the hypotheses and assumptions that you cur
rently have, you will have missed the point. Once again: a good business plan
requires good business planning.
Why two business plan outlines? The first provides you with an overall look
at the structure of the document. When used as a selling tool, the purpose of this
general business plan is to create a logical case for investment. Section 2 of the plan
states who you are and what you have. Sections 3 to 5 constitute the market assess
ment. The purpose of the market assessment is to demonstrate that you have first
hand experience with your customers and that there are enough of them who are
ready, willing, and able to buy your product, technology, or service. Sections 7 to 10
indicate how your company will realize this opportunity, and consist of a set of oper
ational plans for each functional area. Section 11, the contingencies section, indi
cates that you have thought through responses to various impediments that may
arise, and that you recognize that any business is fallible. Section 12, the financials
section, builds on everything that has gone before. Revenue streams are identified,
and costs are clarified for each functional area. This section is a numerical presenta
tion—the one that articulates how you will grow the company and provide a return
on investment (ROI) for you and your investors.
The second plan outline provides the elements of a good business case in
more detail. The items in italics are topics to be addressed in whatever sequence
seems most appropriate.
E Q U I T Y I N V E S T O R S © DAWNBREAKER PRESS, 1998 104

BUSINESS PLAN OUTLINE (GENERAL)
1. Executive Summary
2. Company & Technology
3. Customers
4. Market
5. Industry Analysis
6. Competitors
7. Marketing/Sales Plan
8. R&D Plan
9. Manufacturing/Engineering Plan
10. Human Resource Plan
11. Contingencies
12. Financials
13. Appendices
14. References
© DAWNBREAKER PRESS, 1998 E Q U I T Y I N V E S T O R S 105

BUSINESS PLAN OUTLINE (DETAILED)
Cover Page
Table of Contents
1. EXECUTIVE SUMMARY
2. COMPANY & TECHNOLOGY
2.1 Brief company introduction
◗
◗ Location, size, history
◗
◗
Mission
Overview of company capabilities
Customers & past performance
2.2 Product or technology description
◗
◗
Brief description
Present state of development
2.2.1 Intellectual property status
2.3 Commercialization strategy
3. CUSTOMERS
3.1 Customers & end-users
◗
◗
Description and geographic distribution
How need is currently filled
3.2 Buying behavior
◗
◗
◗
◗
Decision makers
Influencers
Basis for purchase decisions
Frequency of purchase decisions
4. MARKET
4.1. Market definition
4.1.1. Primary market
4.1.2. Secondary markets
4.2. Market size and trends - Primary market
◗
◗
Current total and served-available markets
Predicted annual growth rate
E Q U I T Y I N V E S T O R S © DAWNBREAKER PRESS, 1998 106

5. INDUSTRY ANALYSIS
5.1. Industry definition and description
◗ Relevant SIC
◗ Current industry status
New products and developments within the industry
5.2. Legislation and policies driving the industry
◗ Future and historical trends
6. COMPETITORS
6.1. Indirect competitors
6.2. Direct competitors
◗
◗
◗
Who are they?
Strengths and weaknesses
Market share of competitors
7. MARKETING/SALES PLAN
7.1. Marketing & sales objectives
7.2. Current customers (if appropriate)
7.3. Potential customers
◗
◗
◗
Customers targeted for intensive selling efforts
How other customers will be identified and qualified
Product features emphasized and contrasted with
competitors
7.4. Analysis of potential teaming partners
◗
◗
Who are they?
Basis for selection: strengths, weaknesses,
and synergies
7.5. Pricing
◗
◗
Basis for targeted price point
Margins & levels of profitability at various levels of
production and sales
7.6. Sales Plan
◗
◗
◗
◗
Sales force analysis (reps, distributors, direct)
Sales expectations for each salesperson and each
distribution channel
Margins given to intermediaries
Service and warranties
© DAWNBREAKER PRESS, 1998 E Q U I T Y I N V E S T O R S 107

◗ Organizational chart for sales/marketing staff,
indicating planned growth for 3 - 5 years
7.7. Advertising
◗ Year 1: Detailed Marketing Communications plan
◗ Year 2 - 5 (general)
7.8. Sales/Marketing Budget*
◗ Assumptions
8. R&D PLAN
8.1. R&D Objectives
8.2. Milestones and current status
◗ What remains to be done to make the
product marketable?
8.3. Difficulties and risks
8.4. Staffing
8.5. R&D Budget*
◗ Assumptions
9. MANUFACTURING/ENGINEERING PLAN
9.1. Objectives
9.2. Use of Subcontractors
9.3. Quality control
9.4. Staffing
9.5. Manufacturing/Engineering budget*
◗ Assumptions
10. HUMAN RESOURCE PLAN
10.1. Staffing Objectives
10.2. Organizational structure - over 3-5 years
◗
◗
◗
◗
Introduction of management team
Key individuals to be recruited and plans
for recruiting
Board of Directors, Advisory Board
Incentives for commitment
10.3. Human Resource Budget*
◗ Assumptions
E Q U I T Y I N V E S T O R S © DAWNBREAKER PRESS, 1998 108

11. CONTINGENCIES
11.1. Potential Risks
◗ Impact and responses
12. FINANCIALS
12.1. Financial Objectives
◗
◗
◗
Commercialization strategy
Use of fund
Terms & conditions of any previous financing
arrangements
12.2. Pro Forma Profit & Loss statements
12.3. Pro Forma Cash Flow projections
12.4. Pro Forma Balance Sheet
12.5. Alternative return scenarios
◗ Exit scenarios
Appendices
References
* In the initial draft of the business plan, include the budget for each
functional area at the end of each section as indicated. In the final draft
you may prefer to remove these individual budgets and weave them into
the financials, in Section 12.
© DAWNBREAKER PRESS, 1998 E Q U I T Y I N V E S T O R S 109

Executive Summary
Investors often start by reading ONLY your executive summary and financials—
then they make a decision as to whether they should read the rest of the plan.
Because the executive summary is so important, we include a suggested outline of
one below. The summary should be no longer than three pages in length, and may
include figures and tables.
Company & Background
◗
◗
◗
company location and mission statement,
sustainable competitive advantage
background on core technology
commercialization strategy
The Market Opportunity
◗
◗
market need
market size and trends
Management Team
◗
◗
key players and relevant background
highlights and accomplishments
Investment Highlights
◗
◗
◗
◗
what level of financing you seek
how funds will be used
what type of partner/investor you seek
why this is a good opportunity
Get Feedback on the Plan
Once you have your first draft of the plan, do NOT give it directly to a potential
investor to read. It will be too long and cumbersome. Give it to others—including
members of your team and board members for feedback. Tell them that you know
it is too long, but that would like to know their reaction to the content—with spe
cific attention to all of the action plans that you have mapped out for the company.
Gather their feedback, and use it to re-evaluate your course of action.
E Q U I T Y I N V E S T O R S © DAWNBREAKER PRESS, 1998 110

Revising the Plan
The next draft of the business plan should be the one you prepare for distribution.
This is the point at which you must pay attention to page limits. The way to reduce
the length of your plan is to use graphics, tables, and charts wherever you can and
relegate some information to appendices. In this final iteration, form becomes vital.
As you work on the final draft, you should keep in mind an old Marshall McLuhan
cliche: “The medium is the message.” In other words, you should remember that
the appearance of the document, i.e., the form in which the business plan is pre
sented, tells the potential investor something about you. Furthermore, it affects the
attitude with which he or she will read your document. It determines whether your
plan stands out among the hundreds of others the investor has to review. The mes
sages you want to leave with the investor are that you: 1) have a technology that is
of value; 2) are an excellent technologist; 3) are also a business person, and are sen
sitive to market issues, design, engineering, and production costs; 4) have an oppor
tunity for him or her to consider; and 5) have a good firm with which to work.
Some general guidelines are listed below:
◗
◗
◗
◗
◗
◗
◗
Adopt a style that you will use throughout.
Use a type font and point size that are easy to read.
Whenever possible, represent market data by use of pie charts, tables,
and other figures.
Represent development time lines with Gantt and PERT charts.
If you have too much data for some sections of the plan, place them in
the Appendices. The document should read smoothly and not appear to
go off on many tangents.
Make sure the document photocopies well.
Consider the use of color.
Due to their proprietary nature, we could not include in this Guide a copy of any of
the business plans we have helped to develop. Nevertheless, we hope our guide
lines will give you a sense of what is required.
© DAWNBREAKER PRESS, 1998 E Q U I T Y I N V E S T O R S 111

Guidelines for Business Plan Revisions
Listed below are some general guidelines regarding page lengths.
1. Executive summary 2 - 3 pages
2. Company & Technology 3 pages
3. Customers 2 - 3 pages
4. Market 2 - 3 pages
5. Industry analysis 1 page
6. Competitors 2 - 3 pages
7. Marketing/sales plan 3 - 4 pages
8. R & D plan 2 - 3 pages
9. Manufacturing/Engineering plan 2 - 3 pages
10. Human resource plan 2 - 3 pages
11. Contingencies 1 page
12. Financials 3 - 4 pages
How to Use Your Business Plan
Your business plan has both internal and external value. Since the external value is
the primary purpose, we will discuss the external application first. Your business
plan should be valid for approximately one year. (At the end of that period, you
should reassess the situation and revise the plan as necessary.) During the course of
the year, your business plan will serve as a very important selling document. You
should distribute it with great care, however, as it contains very complete informa
tion on your business. Listed below are some general guidelines for distribution.
Do not “overshop” your busi
ness plan. In other words,
do NOT send it out to every
venture capitalist in your
geographic area. Be selec
tive. Your opportunity should
generate excitement and be
something which only the
appropriate audience sees.
112 E Q U I T Y I N V E S T O R S © DAWNBREAKER PRESS, 1998
Distribution protocols
(1) Distribute your plan only to those who have demonstrated a sincere
interest in your technology/product. Gauge their sincerity by the confi
dence and trust they engender.
(2) Keep track of all your business plan copies by number, recording their
distribution in a log. Request their return within 30 days. Extend on an
exception basis only.
(3) Clearly mark each business plan copy in the following manner:
Proprietary, Confidential, Not to be Duplicated.
(4) Ask any person to whom you are considering giving the plan to sign a
confidentiality agreement. If the individual has any problem doing so,
you can remove the more sensitive sections of your plan.

How to Create Opportunities for Distributing Your Plan
During the development of your plan, you will have taken several steps “to get
close to the customer.” This should be an ongoing activity. In the process, it is like
ly that you will find potential teaming partners. If you are particularly impressed
with a potential customer, explore whether the customer has any interest in devel
oping a relationship (research and development partnership, licensing, or other
teaming arrangements). At this point, you are looking to create a sponsor. If there
appears to be interest, ask the potential sponsor to sign a confidentiality agreement.
Although some companies are reluctant, they do sign confidentiality agreements if
the prospects look promising. Once the agreement has been signed, share your
business plan with the company following the protocols outlined above.
If a potential sponsor is reluctant to sign a confidentiality agreement, you
could provide him with an abbreviated copy of your Executive Summary to whet
his appetite. Be sure that the summary provided on this basis contains no propri
etary information. Once a confidentiality agreement has been signed, some compa
nies provide only the abbreviated financials in the financials section of the plan,
placing the complete set in an appendix.
How Do You Know If You Are Making Progress?
The following steps indicate increasing interest on the part of a potential sponsor:
(1) Potential sponsor signs a confidentiality agreement
(2) Site visits—needs are clarified
(3) “Due diligence”—the potential sponsor does some probing at his own
expense, usually into the markets.
(4) Another site visit
(5) Negotiations begin
During this process, pay particularly close attention to the objections and concerns
raised by the potential sponsor. Try to formulate ways in which these can be
addressed, whether by research and development activities or by other means. The
negotiations that ensue involve clarification and give-and-take by both parties. Stay
in contact and be responsive. If the negotiations end with the investor saying, “Get
back to me when you have addressed issue X,” be sure to do so! This type of state
ment is typically a “buying signal.” Your response should be, “If we can solve this
problem, would you be interested in X?” Don’t feel that because an objection was
raised the door has been closed forever. Remember that the potential sponsor has
already invested time and money in the evaluation of the opportunity. If you
address the concerns and are persistent, you will present yourself as a responsive
potential partner.
© DAWNBREAKER PRESS, 1998 E Q U I T Y I N V E S T O R S 113

Internal Value of the Plan
The biggest mistake a company can make is to put its business plan on the shelf
once it has attempted to obtain funds. A well-developed business plan should act as
your guide and as a rallying point for your staff. In quarterly reviews with your man
agement team, see how the company is tracking relative to goals and objectives
articulated in the plan. Use the business plan as a screen to decide whether unfore
seen events are opportunities or diversions. Also use it to remind yourself of your
priorities.
As conditions change—and as you continue to learn about your market and
how your company is perceived—your plan will change. Just as a ship’s captain
adjusts course when the winds change direction, so will you. It is, therefore, impor
tant to re-work your plan annually. This re-working will seldom require as much
work as the original draft, because you will have considerable data in hand, will
understand the business planning process, and will know how to go about looking
for opportunities.
Summary
Take great care in the drafting and distributing of your business plan. It should
communicate effectively with the intended audience, whether internal or external.
Keep the document alive. Use it to guide your behavior, benchmark your progress,
effectively communicate with your management, and seek investors and strategic
allies.
By the time you have created a solid business plan, it will contain a consid
erable amount of in-depth information about your firm and the business opportuni
ty you seek to exploit. For this reason, it is best to pre-qualify potential partners
and investors before sharing your plan with them. This pre-qualification can often
be accomplished within the context of a non-proprietary oral presentation that high
lights the salient aspects of the business case. The next chapter includes a sample
presentation.
E Q U I T Y I N V E S T O R S © DAWNBREAKER PRESS, 1998 114

Section 2P
RESEN
TING
YO
UR
OP
PO
RTU
NITIES…
Section 2 P R E S E N T I N G
Y O U R
O P P O R T U N I T I E S
T O E Q U I T Y
I N V E S T O R S
Company/Technology/Product
Market Assessments
Goals and Objectives
Challenges/Requirements/Opportunities

PRESENTING YOUR OPPORTUNITIES TO EQUITY INVESTORS
Advanced Organizer
Most ATP-funded firms are positioning themselves to become high-potential ven
tures. Issues related to financing, developing joint ventures, and commercialization
strategies were addressed in preparation for submitting an initial ATP proposal.
Advanced technology firms often have a long-term appetite for capital, however,
and must be diligent in their efforts to attract it. A diligent but reasoned approach
to investment will increase the likelihood that private sector funds will be available
when needed for your company’s growth. The objective of this section is to provide
guidance on a method for succinctly representing your opportunity in an oral pres
entation to private sector investors.
The section begins with a description of the typical contexts in which such
presentations are made. These include: (1) presentations to groups at national
and/or regional events; (2) presentations to local groups of business angels; and (3)
presentations to potential partners/investors. This chapter deals ONLY with person
al presentations and does not address other approaches to finding potential
allies/investors, such as press releases, computerized matchmaking, or advertise
ments. Although these can be useful adjuncts to other initiatives, personal presen
tations provide both parties with the opportunity to assess the individuals involved
and to begin the development of a relationship.
The remainder of the section consists of a fictitious presentation to poten
tial equity investors. A set of viewgraphs, sample narrative, and explanatory notes
are included. It is just an example, and can be modified to meet individual needs.
It is important for busy entrepreneurs to develop a procedure that will
allow them to qualify potential partners/investors quickly and to diligently pursue
promising ones while graciously closing the loop with others.
© DAWNBREAKER PRESS, 1998 E Q U I T Y I N V E S T O R S 117

Opportunities for Making Personal Presentations
Presentations at National and/or Regional Events
Once you have developed your business plan, creating a set of presentation materi
als that you can use to bring your business opportunity to the attention of potential
strategic allies and investors is invaluable. Although such presentations are often
made within the context of individual meetings with qualified leads and referrals,
national, regional, and local investment events provide an ideal context for making
a presentation to numerous organizations concurrently. If it appears that historically
a specific event has attracted the types of organizations that are of interest to your
firm, it will be cost-effective to participate in that event. At the same time, you
should exhibit restraint in making any public presentations when preparing for an
Initial Public Offering and/or if you have signed a “stand-still” agreement. Legal
restrictions apply in these situations.
Calendar of Events
Many investment events are promoted within industry trade journals. A sampler of
annual events that might be appropriate for well-prepared entrepreneurs to attend
is listed below. In some cases, geographic and/or topic restrictions apply. Most of
these events involve a screening process to select viable participants based on a pre
liminary review of an executive summary and/or business plan. You should antici
pate participation fees of between $200 and $900. Names of some of the more well
known investor events are listed below:
◗
◗
◗
◗
◗
◗
◗
◗
◗
◗
◗
Arizona Venture Capital Forum
Bio Investment and Partnering Conference
Florida Venture Capital Conference
The Great Midwest Venture Capital Conference
Illinois Venture Capital Conference
MidAtlantic Venture Fair
North Coast Growth Capital Conference and Technology Showcase
Pittsburgh Venture Capital Conference
Software Investment Conference
Upstate New York Venture Capital Forum
Venture Market East
E Q U I T Y I N V E S T O R S © DAWNBREAKER PRESS, 1998 118

Presentations to Local Business Angels
Many communities have groups of business angels and institutional investors which
meet frequently to learn about new business opportunities. These events tend not
to be well advertised. The best way to find out about them is to contact your local
Chamber of Commerce. Inquire whether there is a local venture capital or invest
ment group that meets regularly. Indicate that you are interested in presenting your
business opportunity and would like to contact the person responsible for schedul
ing presenters. For example, if you were to contact the Rochester Chamber of
Commerce, you would find that a Venture Capital Breakfast has been held there on
a monthly basis for several years. There is room on the agenda for each of these
breakfasts for three local businesses to present their business opportunities. The
audience typically consists of 30-40 people, including service providers and poten
tial investors. Most large communities have such groups.
Although larger events run by institutional investors tend to be much more
effective than smaller, more local events, the value of participating in local invest
ment events is that they provide a context for you to appear in front of the commu
nity’s establishment. The contacts you make here may know people in larger finan
cial communities, and may be able to assist you with networking.
Individual Presentations During Site Visits
A presentation made within the context of an investor or partnering event is the
first step in developing a successful relationship. A desirable outcome is for a poten
tial investor/partner to request a site visit.
Before your visitor arrives, be sure to determine the objectives of the visit
and whether others will accompany him or her. It is important to understand both
the roles and objectives of the visitors so that you can determine what information
is important to share with them.
Information that you provide must be relevant to your visitors’ goals. If the
people making the site visit represent a corporate venturing area and have a strong
background in marketing and sales, it would be inappropriate to spend a great deal
of time talking about research and development. It would be far more important to
talk about value creation and marketing and sales initiatives. Provide your visitor
with materials that they can use to sell up-line. Decisions regarding partnering
and/or investing are rarely made by one person. Others need to be convinced of the
value your opportunity has for their organization. Therefore, always provide an
© DAWNBREAKER PRESS, 1998 E Q U I T Y I N V E S T O R S 119

appropriate packet of information that he or she can share on your behalf. If the
visitor has not signed a confidentiality agreement, be certain that you share only
non-proprietary information.
Preparing a Winning Presentation
If given in its entirety, a
presentation addressing all
the topics covered in this
section could run between
30 minutes and an hour. For
a shorter presentation, such
as is typical for presenta
tions to a group of potential
investors, you will need to
modify your viewgraphs
based on the needs of your
audience.
Irrespective of where you are making your presentation, you will find it invaluable
to have a well-prepared set of slides or transparencies to draw upon. In this section,
we provide guidance on how to prepare and deliver a presentation to investors. The
following opportunity by Soarrell Medical Systems is fictitious. It is based upon
issues and trends in information systems as they apply to health care.
This section includes topics and sample slides or transparencies designed to
assist potential investors in quickly previewing the business opportunity of your
company, product, or division. (The term viewgraph will be used throughout and
will refer to either slides OR transparencies).
Keep in mind that you will want to vary your presentation depending upon
your audience and your commercialization strategy. For example, if you are one of a
diverse group of firms making a presentation to potential investors, your audience
will need to pick up key concepts about diverse business opportunities quickly.
Within an hour, your listener might hear a presentation on a new fiber optic materi
al, a golf course, and a new medical cure. Your goal must be to focus the potential
investor quickly on your opportunity, create a favorable impression, teach the listen
er key concepts, and provide financial information to serve as the basis for further
discussions. In order to do this effectively, you must control the sequence of infor
mation and its manner of presentation.
The potential investors for whom this presentation is appropriate include
venture capitalists, investment bankers, potential strategic partners, and upper man
agement within your corporation.
If you are presenting your opportunity in a more homogeneous context,
e.g., all of the presentations at the event relate to one focused area, you could spend
less time “teaching” the audience about pertinent industry drivers and instead
focus on the unique implications that your opportunity may have. This would avoid
redundancy across presentations.
The presentation following outline can be used to reflect the business
opportunity of an entire company or a strategic business unit within a larger firm.
When deciding upon the scope of the business opportunities being presented, your
goal should be clarity. Often, individuals in contract research and development
E Q U I T Y I N V E S T O R S © DAWNBREAKER PRESS, 1998 120

firms try to represent the business opportunities spanning their entire company.
This can be confusing. If your company is involved with highly diverse technolo
gies, it may be best to focus on the opportunity related to a Strategic Business
Unit (SBU).
Sample viewgraphs for each of 25 topics follow, accompanied by explanatory
notes. The set of viewgraphs presents an opportunity for one fictitious firm—
Soarrell Medical Systems. If you wish to obtain a sense of the overall business case
being made, scan the set of viewgraphs and the accompanying narrative first. Then,
refer back to the accompanying notes associated with each viewgraph in order to
understand why the presentation was developed in this fashion.
If you are unfamiliar with making business presentations, or if you wish
to try a new approach, it is recommended that you try to emulate the set of view-
graphs presented. Once you have a “rough cut” of this set and are familiar with the
approach, you can pick and choose and re-sequence the viewgraphs to meet the
needs of different situations or personal preferences. The feedback we have
received consistently from hundreds of investors over the last several years is
that this format makes it very easy for them to form an initial impression of an
opportunity. They can then start a one-on-one conversation at a higher level
with companies in which they have an interest.
Visuals
The visuals that follow are grouped into four categories:
Company/Technology/Product; Market Assessment; Goals and Objectives; and
Challenges/Requirements/Opportunities. Each viewgraph page contains explanatory
notes with the following subheadings:
WHAT A clear description of the type of information to be
included on this viewgraph
WHY An explanation as to why that information is important for
the investor’s decision-making process
PITFALLS TO AVOID Typical mistakes frequently made by
technology entrepreneurs
VARIATIONS Variations on the theme to be expressed
VIEWGRAPH # A sample viewgraph. Please note: Soarrell
Medical Systems is a fictitious company and the data provided
are fabricated. Do not use these data as a source of information.
© DAWNBREAKER PRESS, 1998 E Q U I T Y I N V E S T O R S 121

Some information in this
section is taken from a pro
prietary document called
Knock Their Socks Off:
Making Winning
Presentations to Investors,
by Jenny C. Servo and Paul
D. Hauler.
NARRATIVE Accompanying script for the reader to see how the
verbal presentation and the accompanying visuals work together.
HIGHLIGHTS Points that should be included in this section of
your presentation.
The viewgraphs are intentionally brief. Remember: readers are not listeners!
The goal is to capture the audience’s full attention. The viewgraphs you ultimately
produce must emphasize and support key points that will be discussed during your
presentation. The viewgraphs should not duplicate all the information you plan to
express verbally.
You should aim to represent key concepts visually in 25 words or less. The
reason for imposing this limit is to provide a simple index for assuring that you do
not present too much information visually. Remember, the more words added to the
viewgraphs, the greater the probability that the audience will become readers,
rather than listeners. You will lose momentum and, more importantly, lose the
opportunity to move potential investors through the first decision gate. That gate
opens communication with the audience after the presentation. Use a pie chart, a
simple table, or a picture to express a concept, whenever appropriate. Images are
much easier for most listeners to retain.
When reading this section, your goal should be to understand the nature
of the presentation. Before actually making the presentation, assess the unique
characteristics of the audience, the opportunity, and the time constraints presented.
Modify the final presentation as appropriate, by removing or adding materials.
Keep in mind that this outline is intended to serve as a guide, not as a straight
jacket. The presentations developed will be variations on the theme provided. First
master the theme—then, improvise, as appropriate, to connect with your audience.
122 E Q U I T Y I N V E S T O R S © DAWNBREAKER PRESS, 1998

1 Company/Technology/Product
Viewgraph 1: Title Viewgraph
Viewgraph 2: Mission
Viewgraph 3: Management Team
Viewgraph 4: Technology/Product
Viewgraph 5: Product Feature, Advantages, and Benefits (FABs)
Viewgraph 6: Success Ingredients

COMPANY/TECHNOLOGY/PRODUCT
■
■
■
■
Who are you? What is the nature of your opportunity?
What does your company do? What gives it a unique edge in the marketplace?
Who are your management team? What are their strengths?
What technology/product/service are you selling? What are its key features?
Can you present a visual picture?
© DAWNBREAKER PRESS, 1998 E Q U I T Y I N V E S T O R S 125

1V I E W G R A P H 1 Viewgraph 1: Title
S O A R R E L L M E D I C A L S Y S T E M S
An Equity Investment Opportunity
for organizations interested in enhancing patient care
and managing costs
Joan Smith, Ph.D. President
What
A title viewgraph simply presents who
you are, the organization with which you
are affiliated, and the nature of your
opportunity. State on the title viewgraph
whether this is an equity, joint venture,
or licensing opportunity. Then provide a
generic statement that describes the type
of partner(s) or investor(s) in which you
are interested. Unless you are able to
easily produce slides or color transparen
cies, it is best that you not date the title
slide or specify the event for which the
viewgraphs have been prepared. That
way, your viewgraphs will be reusable.
Why
When making a presentation at a partnering or investment event, there is often a
flurry of activity among speakers as audience members enter and/or exit. A title
slide gives the audience time to move about and re-orient. In this way, they will be
focused when you begin to address substantive parts of your talk.
The title slide alerts the audience to the set of filters they should apply
when listening to your opportunity. Depending on your commercialization strategy
and how it relates to their interests, the audience will want to know more about
specific parts of the presentation.
Pitfalls to avoid
Select a title that demonstrates that you know what is important to the
audience, i.e., investment and/or partnering. If you select a title that only empha
sizes the technology or the industry, it sends the message that your approach is aca
demic, technical, and one-sided (what’s in it for you). In this type of presentation, it
is important to establish oneself as a businessman or woman, and to convey the
opportunity as a benefit to those you wish to involve.
E Q U I T Y I N V E S T O R S © DAWNBREAKER PRESS, 1998 126

Narrative
Good morning. I’m Dr. Smith, the President of Soarrell Medical Systems. In the next few
minutes, I will highlight those factors that make our opportunity worthy of your considera
tion. Soarrell Medical Systems is positioning itself to become a dominant player in the
Computerized Patient Record market focusing on two niches: portability of patient records
and patient education. We are seeking either a strategic alliance with a large HMO or an
infusion of venture capital funds that will take us through initial product introduction. Long
term, we are looking to be acquired by a larger supplier of practice management software.
Highlights
Notice that this presentation does NOT repeat information presented on the view-
graph. Instead, the narrative embellishes the key points in the visual presentation.
The best presentations are those in which the speaker doesn’t read from a text, but
rather elaborates upon the viewgraphs in a predetermined fashion. The result is a
presentation that looks impromptu, but is highly polished.
© DAWNBREAKER PRESS, 1998 E Q U I T Y I N V E S T O R S 127

2V I E W G R A P H 2 Viewgraph 2: Mission
S O A R R E L L M E D I C A L S Y S T E M S
Mission Statement
■ develop, produce, market, and support
■ proprietary patient-oriented software tools and devices — biometric smart cards & readers
■ interface with computerized patient record (CPR) systems
■ patient education within medical practices
What
A mission statement is a clear, succinct
statement describing:
◗
◗
◗ the market or industry in which
you operate
the business functions your company
performs, i.e., research and develop
ment, marketing, manufacturing,
distribution
your company’s sustainable
competitive advantage
Why
In order to shape how the investor
listens to your presentation, it is impor
tant to clarify at the outset what is most fundamental to your company—its mission.
If you do not identify what your company does, the listener will spend time trying to
ascertain this during the first few minutes and will miss other important information.
Lead with the most fundamental information. Indicate which business functions your
company or division performs: contract research and development, manufacturing,
customer service, marketing and distribution. Clarify what is unique about your com-
pany and what will give your firm an edge in the marketplace, i.e., your sustainable
competitive advantage. Also, name the market or industry in which you compete.
Presenting this information at the outset provides the investor with a frame of refer
ence and allows him or her to listen to your presentation intelligently. Also, be sure
to mention the nature of your commercialization strategy.
For assistance in developing
your mission statement, see
Workbook Activity 4. For
assistance in articulating
your sustainable competitive
advantage, see Workbook
Activity 2.
Pitfalls to Avoid
Many times, entrepreneurs confuse “vision” with “mission.” Although a vision
statement is important, do not present it in this presentation. Vision statements
tend to be “soft.” Many new start-ups tend to focus on the creation of a culture in
their vision statements, rather than emphasize business issues. The culture is of no
interest to an investor, although it may be very important to you. If you talk about
E Q U I T Y I N V E S T O R S © DAWNBREAKER PRESS, 1998 128

“vision,” you are likely to get yourself into trouble, as the investor may attach
unwanted stereotypes to you and your company.
Also, DO NOT make statements that would give the listener the impres
sion that your mission is fragmented or unfocused. Statements like, “We are a con
tract research and development firm that performs cutting-edge research in any
field” is a killer. What you have told the investor is that you chase research and
development money and will do anything. Investors want to create value and not
simply fund research and development.
Narrative
Soarrell Medical Systems develops unique software and hardware devices that interface with
computerized patient record (CPR) systems. We are organized to provide excellent customer
support. We also share the risk with clients and facilitate the shift to a new patient-practi
tioner relationship through training.
Highlights
Although the printed mission statement is somewhat dense and abbreviated, it
clearly provides the potential investor with the appropriate frame of reference. The
investor immediately knows what business functions Soarrell Medical Systems per
forms and what is unique about the firm. In the accompanying visuals, key words
are clearly laid out and correspond with the unique features highlighted. Although
the presenter does use some jargon (CPR), it is defined.
Variations
If you are presenting a business opportunity for a new strategic business unit, a
spin-off business, or a division, it will be important to show your relationship to the
parent organization and to clarify the mission of that organization. You might find
that you need to add another graphic to show the relationship between this entity
and others. Keep both the explanation and the graphics simple.
© DAWNBREAKER PRESS, 1998 E Q U I T Y I N V E S T O R S 129

3V I E W G R A P H 3 Viewgraph 3: Management Team
S O A R R E L L M E D I C A L S Y S T E M S
Management Team
■ Dr. Joan Smith-President
■ Led 2 successful start-ups in medical industry
■ Dr. Reginald Bolton-Vice President, Tech Transfer
■ Skilled Practitioner, advocate of CPR, Inventor
■ Mr. Trevor Baker-Vice President, Finance & Admission
■ Twenty years’ experience in medical business administration
What
Investors prefer management teams to
individual proprietors for company man
agement, as the latter are usually more
vulnerable and less well-rounded. In this
viewgraph, mention facts related to:
◗
◗
◗
◗
management experience
intellectual property developed
by members of your team
experience in your chosen
marketplace
other unique characteristics of your
team that are relevant to investors
Why
Investors look for Grade A management teams, so it is important that you promote
yourself. This is accomplished by making statements that will engender confidence
in the ability of your management team to implement the business opportunity you
are presenting. Establish credibility at the outset! Highlight the strengths of your
team and their knowledge of the marketplace. Mention any unique intellectual
property your firm may possess.
Pitfalls to Avoid
Although scientists and engineers have a natural tendency to highlight certain
things that are significant to them—including the number of articles they have pub
lished, or the number of papers they have presented at international conferences—
DO NOT feature this type of information. It reinforces in the investor’s mind the
stereotype of the scientist who is interested in obtaining funds for research and
development, but who isn’t really interested in creating value. While some readers
may find this counter-intuitive, the point cannot be overstated.
E Q U I T Y I N V E S T O R S © DAWNBREAKER PRESS, 1998 130

Variations
If, prior to receiving your ATP award, you primarily performed contract research
and development, highlight the unique scientific credentials of primary players in
your company. Combine this information with statements regarding successful per
formance on contracts, successful commercialization through licensing, and patent
protection acquired. Such information will demonstrate to potential strategic
alliance partners that you are experienced in these areas and will engender more
confidence regarding teaming arrangements.
If your company is small and lacks a diversified management team, draw
attention to the members of your Board of Directors, Advisory Board, or consultants
and staff. Experience provides investors with confidence! If you do not have it,
actively try to recruit such people to your company prior to making your presenta
tion to investors.
Narrative
Soarrell Medical Systems is based in Boulder City, CO. Two members of our management
team—Dr. Joan Smith and Dr. Reginald Bolton—have been with the firm since its forma
tion in 1996. Mr. Baker was explicitly recruited to our management team earlier this year.
Dr. Bolton, Vice President of Tech Transfer, currently chairs a national CPR specifi
cation committee, practiced family medicine for 10 years, is the inventor of Soarrell’s portable
patient verification card, and is responsible for developing our training packages.
Mr. Trevor Baker is the most recent addition to the team and comes to us from the
Alliant Health Systems Network. He has 20 years of hospital administration experience. In
the CPR arena, he has a particular interest in patient confidentiality.
I’m Dr. Joan Smith, the President and founder of Soarrell Medical Systems. This is
my third start-up company. In 1988, I started a software development firm that was
acquired by Microsoft in 1993. In 1994, I was brought in as the CEO of a 5-year-old firm
which specialized in archiving information for records management. Between 1994 and
1996, I led that company in a new direction which resulted in a 200% increase in sales. In
1996, I founded Soarrell Medical Systems with Dr. Bolton.
Highlights
It is important to mention the location of your firm, because many investors
limit their investments to firms that are within a two-hour distance from their
office. Small start-ups are risky by their nature; you should highlight the amount
of time your company has been in existence as appropriate. Mention those features
of your management team’s experience that will contribute favorably to investor
confidence.
© DAWNBREAKER PRESS, 1998 E Q U I T Y I N V E S T O R S 131

4V I E W G R A P H 4 Viewgraph 4: Technology/Product/Service
What
Once you have made your mission clear
to investors (Viewgraph 2), and have
given them a reason to listen to you
(Viewgraph 3), you are ready to tell them
about your technology, product, and/or
service. Include a graphic representation
of your product at this point. If your
product is small in size, or if you have a
small-scale model of the larger item, it is
better to display the real thing. Nothing
makes an impact like holding up a sam
ple of the product. Depending upon
your product’s complexity, a series of
viewgraphs may be valuable at this
point. Without being overly complex, you need to convey to the listener what you
have, before you move on to the next topic.
S O A R R E L L M E D I C A L S Y S T E M S
Products ANNUAL PHYSICAL & PATIENT VERIF ICATION SYSTEMS
■ Portable patient verification cards and software — biometric voice encryption
■ Patient education archives-Annual Physical — CD-ROM and internet
Why
For the most part, investors are looking to reduce risk. The more tangible the prod
uct or service, the less risk likely is associated with the project. Many investors are
only interested in companies that are already selling products, as this shows market
acceptance. If you are selling the product, make sure that it is abundantly clear in
your accompanying dialogue.
Pitfalls to Avoid
The most common mistake made by scientists at this point in their presentation is
to include either too much or too little information. Those who include too little
tend to err on the side of paranoia. Those who include too much information do so
because this area is their comfort zone. Whatever you do, DON’T fail to include a
visual of your product. The worst presentations we have seen are those which have
no visual aid regarding the technology, product, or service. Remember: the investor
has to learn quickly about your company. If you fail to provide enough information,
E Q U I T Y I N V E S T O R S © DAWNBREAKER PRESS, 1998 132

he will make an assumption (which may be faulty) about the product, or become
distracted by trying to figure it out. Do not try to include a video in your presenta
tion: switching mediums often results in fumbling and loss of momentum.
Variations
If your company has a family of related products, present a schematic that demon
strates what is common to the product family. The unifying factor may be a propri
etary component that is used in a variety of products, or a technology base which is
applied in different areas. Strive to demonstrate what it is that unifies your products
or services; otherwise your opportunity may appear fragmented. Fragmentation
presents a bad image to investors. They appreciate focus.
Narrative
Our initial product entry is a package that contains two items: a patient smart card and a
computer archive with both internet and CD-ROM access. This package is called the “Annual
Physical and Patient Verification System.” The Portable Patient Verification CardTM was
designed by Dr. Bolton and uses a combination of known technology and patented biometric
voice encryption algorithms. As you can see, this card looks like an ordinary credit card. This
smart card has the patient’s picture, name, and address on the front. Embedded in the card is
an integrated circuit that contains pertinent information regarding the individual’s immu
nization status, chronic problems, drug allergies, relevant family medical history, medical
insurance status, and the like. Smart cards have read-write capability. Our unique biometric
voice encryption algorithm assures that information on the card is activated and verified
only by the patient, and that this is done on an annual basis. Health smart cards will be of
great value to patients. Instead of a medical alert card, the individual will carry the patient
smart card in his wallet. In case of an emergency, the card can quickly be scanned by ambu
lance or emergency personnel, or by modified home security systems of bedridden patients.
We have piloted the use of this card in a number of medical practices that are cur
rently using computerized patient record software. It is used within the context of the Annual
Physical Exam episode. Prior to the physical exam, a member of the clinician’s staff reviews
the relevant information that is contained within the CPR system with the patient, allowing
the patient time to note any errors. This procedure is much akin to the process used at a bank
for verifying on-line information regarding one’s bank account. Once verified, a photo is
taken and the patient is issued the Portable Patient Verification Card. Every year, prior to
the physical exam, the information on file is reviewed for accuracy. It also is updated, and a
new card issued.
The other component of this “Annual Physical and Patient Verification System” is
an archive containing information regarding the most common ailments detected during a
physical exam. The archive is stored in local libraries (CD-ROM) and/or on a server for the
© DAWNBREAKER PRESS, 1998 E Q U I T Y I N V E S T O R S 133

doctor’s home page. Printed copies are also available from the vendor upon request.
When the result of the annual physical is mailed to a patient, the postcard lists both
a URL and the library locations that have the CD-ROM. If the patient has internet access, he
can look up relevant information from the remotely accessible server. If internet service is not
available, he can review materials in the library or request that a copy be mailed to them.
Following a review of relevant information regarding ailments, the patient would either call
or E-mail the doctor’s office to schedule a face-to-face meeting to discuss his questions and the
recommended course of action. In subsequent years, scheduling of appointments could be han
dled electronically or by phone depending upon the individual’s preference.
Highlights
You will notice that the presenter did not provide much information on the techni
cal aspects of the product. The focus was on what the system does. Visuals were
used to provide “face validity,” i.e., to demonstrate that a real product exists. If your
audience consists mostly of research and development personnel, it will be appro
priate to spend more time elaborating upon unique features of the system.
However, avoid sharing any proprietary information during a public presentation.
E Q U I T Y I N V E S T O R S © DAWNBREAKER PRESS, 1998 134

THIS PAGE HAS BEEN INTENTIALLY LEFT BLANK
© DAWNBREAKER PRESS, 1998 E Q U I T Y I N V E S T O R S 135

5V I E W G R A P H 5 Viewgraph 5: Product FABs
S O A R R E L L M E D I C A L S Y S T E M S
Features, Advantages, Benefits ANNUAL PHYSICAL & PATIENT VERIF ICATION SYSTEM
Feature
1. Annual physical
2. Interface w CPR
3. CD-ROM/internet
4. Utilizes staff
5. Voice encryption
Advantage
1. Consistency
2. Consistency
3. Versatility
4. Minimal MD impact
5. Security
Benefit
1. Update Verification
2. Simplicity
3. Accessibility
4. Better patient care
5. Mistake reduction
What
The acronym FAB stands for Feature,
Advantage, and Benefit. A Feature is an
element or property of the product or
technology. The Advantage answers the
question “so what?” and indicates the
value of this feature. A Benefit describes
the value to the customer or end user, as
he or she would perceive it. Frequently
FABs are best expressed in tabular form,
often contrasting the product or technol
ogy with those of your competitors.
Why
For assistance in
developing FABs, see
Workbook Activity 7.
First and foremost, the articulation of
FABs assures that you are moving away from a subjective view of the technology to
a perspective that focuses on the customer’s needs. In developing these FABs, talk
with both customers and end users to assure that the features of your product, tech
nology, or service do indeed have an expressed benefit to them. The terms “cus
tomer” and “end-user” are NOT synonyms. “Customer” is defined as the person
or organization that will purchase something directly from you. The “end-user” is
the person that will ultimately use the product. The “end user” may or may not
also be your customer. For example, suppose you wish to license computerized
patient record software to a hospital. Your licensee will be your customer. The end-
user is the person who ultimately uses the software, perhaps the office staff person
who enters patient information. Understand the needs of both your customers and
the end-users, as defined above.
Talking about FABs in your presentation makes it easier for the potential
investor to see what is distinctive about the product and demonstrates that you are
“getting close to the customer.”
E Q U I T Y I N V E S T O R S © DAWNBREAKER PRESS, 1998 136

Pitfalls to Avoid
Don’t skimp on this part of the presentation. Develop FAB tables only after speak
ing with potential customers and end-users. Don’t assume that you know what the
customers want without speaking to them.
Variations
Sometimes this section will take the form of talking about competing technologies
or different ways of addressing the problem you are solving. In this case, you would
highlight the features, advantages, and benefits of your technology as compared
with others. In such instances, you may need to use more than one viewgraph.
Don’t make your visuals too complex. The listener must be able to clearly ascertain
your message. Remember the “KISS” acronym: Keep It Simple, Stupid! Just as
complex theories indicate that it’s time for something more simple and elegant, so it
is with graphics. If a visual requires too much explanation, it’s too complex.
Change it!
Narrative
There are several unique aspects of this system which make it extremely easy for a physician to
add to an existing office management software suite. The Soarrell software used in produc
ing the smart cards interfaces easily with the most commonly used CPR systems, including
M.D. Workbench, SMART-MED, MedTrac, and SOAPware. The software can be used with
any PC, with Mac G3’s, and with Unix systems. Another feature of this system with great
appeal to MDs is that it makes better use of para-professionals in the office and helps limit
the MD’s involvement to patient care.
Highlights
Note that the presenter did not go over every item listed in the viewgraph, but
instead elaborated upon only a couple of items. This approach makes the presenta
tion more interesting. The other information is there for the audience to read
quickly or note.
© DAWNBREAKER PRESS, 1998 E Q U I T Y I N V E S T O R S 137

6V I E W G R A P H 6 Viewgraph 6: Success Ingredients
S O A R R E L L M E D I C A L S Y S T E M S
Success Ingredients
■ Incentive payments based on patient satisfaction
■ Computer platforms and CPR software supported
■ Board of Advisors
■ Intellectual property
■ Physician in primary care role
What
In this viewgraph, tell the audience why
your company will succeed. Statements
must be comparative in nature, but need
not necessarily single out specific com
petitors by name. For example, you can
indicate a cost savings of 40% without
naming the competitors. Delay specifics
until later in this presentation to focus
the listener’s attention on the one item
you wish to emphasize at this point:
ingredients for your success.
Why
An investor or strategic partner is looking
to create value. This can be accomplished if you have products, technologies, or
services which are unique (such as patent-protected products), and/or which are
price or performance competitive. Success ingredients can also refer to items such
as management team experience, established distribution networks, and the like.
Pitfalls to Avoid
Many scientists are accustomed to being cautionary in their statements and to quali
fying everything they say. If you listen closely, you will hear scientists use qualifiers
such as “may,” “should,” and “it seems.” This use of qualifiers is often accompa
nied by the tendency to mention all the things that could go wrong and to be very
guarded about conclusions. It is inappropriate to color the comments with such
statements. Know what makes your company distinctively positioned for success. If
you don’t, you are not ready to make this presentation. Clearly, and without hesita
tion, state the advantage of your firm with respect to success. Later, address issues
and contingencies for dealing with them. Don’t be tentative in business. You must
be knowledgeable, focused, and bold.
E Q U I T Y I N V E S T O R S © DAWNBREAKER PRESS, 1998 138

Variations
The nature of your success ingredients is related to your company’s mission, your
management team, and your FABs. The items chosen as ingredients for success will
vary from company to company.
Narrative
Soarrell’s management team has the requisite experience for making this opportunity a signifi
cant financial success. As was indicated previously, the team has led start-ups before and our
knowledge is deep with respect to the health care industry. In addition, Soarrell has propri
etary technology that is perfectly positioned to become available at the right time. We are not
too early or too late for this market opportunity. Our system is versatile and not limited by
computer platforms or choice of CPR software. More importantly, we are willing to share a
risk with our customers and to accept milestone fees based upon minimum disruption to the
office workflow and increased patient satisfaction.
Highlights
In this example, the presenter used the opportunity to reemphasize the experience
of the management team, as well as some of the FABs mentioned previously (i.e.
versatility of platforms and software). Sharing the risk with the customer was a new
concept that was introduced.
© DAWNBREAKER PRESS, 1998 E Q U I T Y I N V E S T O R S 139

Market Assessment
2
Viewgraph 7: Business Environment
Viewgraph 8: Customer
Viewgraph 9: Market Segmentation
Viewgraph 10: Total and Served Available Market
Viewgraph 11: Market Trends
Viewgraph 12: Competition

MARKET ASSESSMENT
■
■
■
■
■
■
What is the market need you are addressing?
Who are your customers? Who are your end-users?
What market segment are you pursuing?
What is the size of this market segment?
What are the market trends for this segment?
Who are your competition? What are they doing?
© DAWNBREAKER PRESS, 1998 E Q U I T Y I N V E S T O R S 143

7V I E W G R A P H 7 Viewgraph 7: Business Environment
S O A R R E L L M E D I C A L S Y S T E M S
Business Environment
■ Slower move to CPR than expected
■ Decentralization
■ Growing apprehension about cost of hardware
■ Lack of programmers
■ Acquisitions
■ Flattening of savings by HMOs
What
Now that your audience knows about your company’s mission, management team, product, and ingredients for success, you will begin transitioning to discussions regarding the market. Do this in a staged fashion, describing the target market from a distant aerial view first, and then moving closer to the defined target. Carrying this analogy a little further, the business environment is the aerial view. It is the big picture that affects not only your market, but others as well.
The business environment statement should make reference, where appropriate, to things such as:
◗
◗
◗
◗
◗
◗
◗
Economic drivers Technology innovations Regulatory drivers Federal legislation and Executive Orders that will effect your market Federal, state, and local incentives, such as rebate programs Movements such as the quality control movement Changes in tax law
Keep in mind that these are sweeping movements which affect not only your market, but other industries as well. For example, the Patient Access to Responsible Care Act has an impact on the following industries: Heath-care delivery, Information Systems, and Legal. (This list is illustrative, not comprehensive.) Only mention those items that affect your market. For example, in the viewgraph provided, only Federal, state, and local policies are mentioned, since these have the greatest single impact on this opportunity.
144 E Q U I T Y I N V E S T O R S © DAWNBREAKER PRESS, 1998

Why
What you are selling is only half the equation for commercial success. What people are buying is the other essential half. Examining your market from different vantagepoints increases the likelihood that you will understand those factors that affect your ability to compete. Such examination also helps determine if there is an existing market for your product and/or when one should emerge. Starting at this most distant perspective helps you to understand the more generic needs of potential customers. Aim selling efforts at matching your products with your customers’ “needs.” Keep in mind that “selling” is also involved when you are licensing. In the case of a license, you are selling to a potential licensee and must understand the market for the product into which the licensee will sell.
Variations
Depending on the factors at play in your business environment, you may wish to relabel this viewgraph “Federal, State, and Local Policies” or “Environmental Analysis.” Also, in some presentations it makes more sense to mention the business environment before mentioning your opportunity. This may be the case if you are pursuing a licensing strategy.
Narrative
The major driver affecting the market for Soarrell’s products is the need for cost containment of health-care delivery systems. In a report by Decision Resources, it was noted that in 1990, 25% of health care costs were administrative and most were associated with the management of patient information. As a response, information technologists focused on a bevy of issues associated with computerized patient records (CPR). In 1995, the Medical Records Institute went so far as to predict that the medical industry would spend up to $5 trillion on computerized patient record systems between 1995 and the year 2000.
This has not happened. Problems plaguing the adoption of such systems include cost of hardware and software, lack of trained IT specialists, the Year 2000 problem, issues of client confidentiality, lack of standardized definitions of medical terms, and the fact that MDs would rather use software in running their business than in delivering their service.
Nonetheless, headway is being made, but at a slow pace and with twists and turns. There is a trend toward decentralized rather than centralized record keeping, with much headway being made in practitioners’ offices. It has become increasingly recognized that informed patients are less expensive patients; i.e., they require fewer post-op doctor visits, develop greater trust of doctors, and have higher satisfaction and shorter recovery time.
For the most part, the general public is unaware of the changes taking place at the information technology level. Once the public becomes aware, it is likely that they will also become concerned about the type of information in the system, the correctness of the information, and how it will be used. The Annual Physical and Patient Verification System addresses this need.
© DAWNBREAKER PRESS, 1998 E Q U I T Y I N V E S T O R S 145

8V I E W G R A P H 8 Viewgraph 8: Customers
S O A R R E L L M E D I C A L S Y S T E M S
Customers
■ Medical practices already utilizing CPR
■ Piloted program in Salt Lake City — 200 patients in 5 practices — increased customer satisfaction — highly rated for ease of use by clinical staff
What Before discussing the size of specific
markets, identify who the customers are
for your technology, product, and/or serv
ice. Be very clear about the definition of
“customer.” Remember that the cus
tomer is the entity that purchases prod
ucts directly from you. Your firm might
have more than one type of customer.
For example, you may wish to license to
some customers, but sell components
that you manufacture directly to others.
If you have a variety of customers, indi
cate this. Highlight the factors that
affect your customers’ buying decisions,
as well as information regarding sell cycle, key product features, and your sustain
able competitive advantage.
Why
Fundamental to commercial success is knowledge of your potential customers.
Demonstrate to potential investors that you have clearly identified your customers
and have spoken to them regarding the FABs (mentioned earlier). Remember, the
investor and/or strategic ally is interested in creating wealth. This can only be
accomplished if you have customers and if you have an intimate and documented
knowledge of their needs.
E Q U I T Y I N V E S T O R S © DAWNBREAKER PRESS, 1998 146

Pitfalls to Avoid
If you haven’t met personally with potential customers, you are not ready to make
this presentation.
Variations
For assistance in developing
this section of your presenta
tion see Workbook Activity 8.
If you are planning to license, break this discussion of customers into two
sections—one about customers, and the other about end-users. Keep in mind that
customers are entities that pay your firm, while end-users are the individuals or
companies that actually use the product. Many times the end-users are not the indi
viduals who purchase your product. For example, the end-users for a CAT Scan are
highly skilled technicians in hospitals. However, they are usually not the individu
als responsible for making the purchasing decisions regarding the CAT equipment.
Narrative
We will be focusing our initial marketing efforts on medical practices that already utilize a
CPR system. We have just completed a beta test of our system in five medical practices in the
Salt Lake City area. Our goal in this beta test was to determine ease of use for the various
levels of staff in the medical practice and the patients’ degree of satisfaction. There was mini
mal disruption of workflow in the medical practices during set-up.
Patients were surprised to know that the medical practitioners had computerized
patient records and were pleased with the opportunity to verify their information. Errors
were found in five percent of the cases. Twenty percent of the patients had internet access, and
subsequent to receiving the results of their physical, downloaded relevant information from
the practitioners’ servers. Forty percent of the patients requested printed copies of reading
material which we supplied; others asked to purchase a copy of the CD-ROM rather than
using it in a library. Based on this input, we are considering making a copy of the medical
archive directly available to patients at a reasonable charge.
Highlights
The presenter used this opportunity to clarify that there had been initial market
acceptance of the system during a beta tet. The presenter further used the results
of the beta test to indicate that there had been a change in strategy based on cus
tomer feedback.
© DAWNBREAKER PRESS, 1998 E Q U I T Y I N V E S T O R S 147

9V I E W G R A P H 9 Viewgraph 9: Market Segmentation
S O A R R E L L M E D I C A L S Y S T E M S
Market Segmentation
■ Existing CPR users — Multi-site, largest number of general design features — Clinical Master, Dr. Chart, Encounter, Health
Probe, PAL/MED, Pearl, Practice Partner, QD Clinical, Smart-Med, and SOAPware
■ Individual sites, less functionality
What
“Segmenting your market” refers
to the process of grouping potential
customers together in meaningful
ways. The reason for grouping is to
assess how large and how accessible
the potential customer base is.
Determine whether the customer base
can be reached through affordable
advertising programs and whether this
cluster or segment is large enough to
sustain your business. If it is not, go
back to the drawing board and try seg
menting your market in different ways.
Segmenting the market appro
priately is an art and takes considerable time and effort. When the market for your
product, technology, or service is emerging, segmenting it is especially difficult.
Some of the most common ways are by:
◗
◗
◗
Standard Industrial Classification Code (SIC) and/or North American
Industrial Classification Codes (NAICS)
Technology
Product characteristics—high, medium, or low-end
Again, this list is illustrative and not exhaustive.
Why
The reason for segmenting your market is to make it more approachable and less
amorphous. That is part of the process of carving out the domain for your business.
E Q U I T Y I N V E S T O R S © DAWNBREAKER PRESS, 1998 148

Pitfalls to Avoid
For assistance in
developing this section of
your presentation, see the
Workbook Activities (7, 8 ,
and 9) under Customers/End-
Users and Market
A common mistake, and one that most first time entrepreneurs make, is to segment
the market in such a way that it appears “really big!” Individuals who seek venture
capital funds are most likely to make this mistake. They have often heard that the
venture capital community won’t be interested in an opportunity unless the market
is substantial. Such entrepreneurs feel more comfortable saying that market Y is a
$2 billion industry and we will get 1% of that, rather than saying that market Y1 is a
$50 million market and our goal is to obtain 20% of that. The entrepreneur naively
assumes that the investor would rather see a poorly defined $2 billion market than a
more tightly defined $50 million market that is still within the range of investment
interest. The reason for this error is the conceptual leap that only 1% of a huge
market should be easy to attain, whereas stating a goal of 20% of $50 million
implies, “Oh my! We have to get real specific about how we are going to DO this.”
Yes, you do!
You should aim at defining your market in such a way that it’s small enough
for you to dominate and large enough to be profitable. Forty percent is better than
one percent. The size of the market is obviously also important. Some markets are
clearly too small to pursue.
Narrative
The computerized patient record market is rapidly emerging. Given that our software, smart
card, and reader all interface with CPR systems, we decided that the best way to segment our
potential market is to base it on the existing pool of medical practice CPR users. A number of
surveys have been conducted by vendors of CPR systems, with the most recent being a survey
completed in December 1997. The major vendors, the products, prices, and installed bases
were described in that study.
Highlights
The presenter has provided a clear conceptual definition of the market that it will
pursue, i.e., the installed base of CPR systems—focusing on those serving multiple
sites and those with the greatest number of design features. Selected software pro
grams with which it can interface are listed.
© DAWNBREAKER PRESS, 1998 E Q U I T Y I N V E S T O R S 149

10V I E W G R A P H 10 Viewgraph 10: Total Market and Served Available Market
150 E Q U I T Y I N V E S T O R S © DAWNBREAKER PRESS, 1998
S O A R R E L L M E D I C A L S Y S T E M S
Served Available Markets
Patient Education
Smart Card Readers
Office Customization Smart Card Software
Cards
Cards
Smart Card Software
Office Customization
Smart Card Readers
Patient Education
$40 M
$10 M
$10 M
$40 M $20 M
$120,000,000 in 1998
What
The phrase “size of the market” or
“market size” refers to the annual poten
tial of the market expressed in dollars,
units, or both. This concept is applied to
all segments for which the product is
appropriate.
Another important concept to
consider when sizing the market is the
difference between the total market and
the served available market. The served
available market defines the market
niche in which the company will operate
in more precise terms. By contrast, the
total available market is the larger, relat
ed market in which one is operating. The served available market is a subset of the
total market.
Why
If the size of the served available market is too small, a potential investor will not
be interested in investing because the return on investment (ROI) will be unattrac
tive. If the market size is fairly small, the entrepreneur should reconsider whether
the technology, product, or service is worthwhile pursuing or whether he should re-
conceptualize how he or she has segmented the market. As indicated previously,
market segmentation is fluid and has profound “decision implications” for everyone
involved. If the market is truly small, the entrepreneur may still decide to conduct
business in this market. However, he should realize that if the market has a poten
tial of under $50 million and holds little promise of growth, it is unlikely that he
will find an appropriate strategic partner or investor.
Pitfalls to Avoid
For assistance in developing
this section of your presen
tation, see the Workbook
Activities (7, 8, and 9) under
Customers/End-Users and
Market
Sometimes naive entrepreneurs define the market size in numbers that
represent a composite for “X” number of years, rather than in annualized figures.
A better approach is to show the market size at a given point in time and then show

predicted rates of growth. Just as a balance sheet is a snapshot of your financials at a
given point in time, so is market size.
Entrepreneurs selling a system component typically make another error.
More often than not, when estimating the size of an emerging market, their tenden
cy is to define the market size in terms of the annual sales of systems rather than
the sales of components. When inducing market size in such situations, base your
estimate of market size upon a sound model that reflects the projected selling price
of the system and the number of components comprising the system.
There is also a tendency to confuse served available market with sales pro
jections. Sales projections are tied to your goals for market share, not to market size.
All you are doing by using the concepts of total market and served available market
is attempting to define and quantify your market segment more tightly. You should
revisit your definition of your market segment annually, and see if it merits redefin
ition. The entrepreneur’s knowledge of the marketplace improves with experience,
so it is common to redefine his or her market niche.
Narrative
We have used a market build-up method to estimate the size of the market potential for
our system in 1998. We have come to a conservative but justifiable estimate of the market
potential based on the number of doctors’ offices which appear to currently be using a CPR
system. The survey of CPR vendors indicated that eight of the most popular CPR vendors
had their software in more than 100 sites and that they had multiple installations at most
sites. Since we will be segmenting the market based on the installed base of the most popular
CPR software, we decided to use these data. We assumed that the eight most popular systems
were currently being used in over 800 sites (100 sites x 8 vendors), and that each served 5
different sites. If we estimate the cost of each component and multiply this by the total poten
tial number of sites that would use this in 1998, we come to an estimated market size for
1998 of $120 million.
Highlights
The presenter has built upon the information provided in the market segmentation
viewgraph, and has provided the audience with an idea of the magnitude of the
niche that will be pursued.
© DAWNBREAKER PRESS, 1998 E Q U I T Y I N V E S T O R S 151

Viewgraph 11: Market Trends
S O A R R E L L M E D I C A L S Y S T E M S
Market Trends
$600 —
$500 —
$400 —
$300 —
$200 —
$100 —
1998 1999 2000 2001 2002
11V I E W G R A P H 11
What
Market trends include both historical
data and future predictions regarding the
rate of growth in selected markets.
Why
Market conditions frequently change
due to shifts in demographics, technolo
gy, regulations, and other economic con
ditions. Your company’s economic health
is partly a function of these changes. If
significant downturns are predicted in
the market you are targeting, you should
reconsider whether this is a good market
to enter. Market trends will affect an
investor’s decision making regarding which investments will be made. Aim to enter
a healthy, growing market, rather than one which is receding.
Pitfalls to Avoid
If the market associated with your business is taking a “nose-dive,” don’t put all of
your efforts into this one market. Seek market opportunities in healthier industries.
Narrative
The estimates of the rate at which the CPR market will grow are wildly divergent. Again, we
have taken a conservative view and have estimated the rate of growth for our market niche,
which is related not only to CPR software, but also to the use of patient education software.
E Q U I T Y I N V E S T O R S © DAWNBREAKER PRESS, 1998 152

12V I E W G R A P H 12 Viewgraph 12: Competition
S O A R R E L L M E D I C A L S Y S T E M S
Competition
■ Precis Healthcare Smart Card System
■ Software & Systems International Limited
■ Alladin Knowledge Systems
■ Patient Education Computer Software
What
You have presented information regard
ing the size of the market opportunity to
your potential investors. Your presenta
tion demonstrates that you have consid
ered the various markets for this technol
ogy, product, or service and have defined
an appropriate niche in which to grow
your business. To interest a prospective
strategic partner or an equity investor,
the market upon which you have settled
should be of sufficient size to merit an
investment. Once your playing field is
defined, you can begin the process of
describing who else is in this arena.
Why
Your success in making sales in the market you have defined will depend upon vari
ous factors. One important factor is who else is playing in this market. You need
knowledge of your competitors in order to develop sound strategies and tactics that
will enable you to take market share away from your competitors or to collaborate
with them to jointly develop an emerging market.
Pitfalls to Avoid
For assistance in preparing
this section of your presen
tation, see Workbook
Activity 13.
This topic is often not adequately addressed. In thinking about competitors, some
firms limit their discussions to companies that have a similar profile (i.e., other con
sulting engineering firms), or to companies that are working on the same solution
(i.e., the same technology). Both approaches are inappropriate. There are many
ways to fulfill a need—perhaps with your technology, perhaps with a quite different
approach. For example, a company with a machine vision technology for sorting
blemished fruit on a conveyer belt competes with human beings who visually scan
citrus. These are clearly very different approaches for solving the same problem.
You should consider as competitors all other individuals or firms working on the
© DAWNBREAKER PRESS, 1998 E Q U I T Y I N V E S T O R S 153

solution to the same problem, even if they are using totally different approaches.
The profile of the company doing the work is totally irrelevant to their defi
nition as your competitor. Any firm working on the solution to the same problem as
you are is your competitor, irrespective of its size, its mission, or its technology.
Variations
If you are conducting unique research in a critical technology area, it may be appro
priate for you to omit names of competitors while highlighting differences among
the approaches being taken to solve the problem and drawing attention to the
advantages of your approach. If you are working in a more established field, you
will want to draw attention to specific competitors and spell out how your technolo
gy, product, or service compares on FABs.
Narrative
This market is evolving in a very unusual way. Smart cards were developed in France and
have been around since the late 1970’s. Most commonly they are used as Loyalty cards or
Electronic Wallets. A few companies have been using these in the health care industry includ
ing Healthcare Smart Card System and Software and Systems International Limited.
However, none of these have the voice encryption algorithm, the patient verification focus, or
the integration with patient education that our system offers. Another company, Patient
Education Computer Software, focuses on patient education, but has nothing to do with
smart cards. We believe that, for such health care related services, consumers would rather
deal with a company that specializes in health care, rather than a smart card company which
receives most of its revenue from other applications of smart cards. In addition, Soarrell’s
biometric voice encryption technology provides the firm with a strong competitive advantage
over other health care systems products.
Highlights
There are always competitors. The presenter has used this viewgraph not only to
introduce the competitors, but also to differentiate his product from the competi
tors’ by highlighting his sustainable competitive advantage.
E Q U I T Y I N V E S T O R S © DAWNBREAKER PRESS, 1998 154

Goals and Objectives
3
Viewgraph 13: Goals
Viewgraph 14: Objectives: Marketing and Sales
Viewgraph 15: Marketing Communication Plan
Viewgraph 16: Objectives: Research and Development
Viewgraph 17: Research and Development Milestones/Timeline
Viewgraph 18: Objectives: Manufacturing/Production
Viewgraph 19: Customer Service

GOALS AND OBJECTIVES
■
■
■
■
■
What are your company’s goals for market share and return on investment?
What are your major milestones for marketing and sales?
What are your marketing tools?
What R&D needs to be completed? What is the timeline?
What are the manufacturing/production milestones? What is the timeline?
© DAWNBREAKER PRESS, 1998 E Q U I T Y I N V E S T O R S 157

13V I E W G R A P H 13 Viewgraph 13: Goals and Objectives
S O A R R E L L M E D I C A L S Y S T E M S
Company Goals & Objectives
■ To be the dominant supplier of Patient Verification Software Systems to provide medical practices.
■ Grow that market by 15% yr.
■ 20% ROI by year 5
What
Up to this point, everything in your
presentation can be considered as back
ground, leading up to the punch line.
The punch line starts here and crescen
dos throughout the rest of your presenta
tion. With the first 10 slides, you told
your potential investor about your mis
sion, your technology, and the market
place that you have carved out. The
balance of your presentation is used to
unfold your plan for creating value
for both yourself and the investor(s).
Begin by defining what your company
will look like in five years. Focus on
quantified terms that relate strictly to creating value. Common company goals
include the following:
◗
◗
◗
◗
◗
Introducing X new products
Achieving X% market share
Achieving ROI of Y%, ROI of X%
Becoming the vendor of choice in Y arena
Licensing X% of products into targeted markets
Why
“If you don’t know where you are going, you will probably end up somewhere else.”
—Laurence J. Peter (Thomsett, 1990)
The plan of action that will unfold during the balance of this presentation is one
that you articulated in your business plan. Its intent is to maximize the probability
of realizing the goal that you have defined.
E Q U I T Y I N V E S T O R S © DAWNBREAKER PRESS, 1998 158

Pitfalls to Avoid
The goals are not something that you just pull out of the air. They have a direct
relationship to your mission, your knowledge of your market, your competitors, and
your ambition. The plans you develop must be realistic in directing you in the suc
cessful attainment of your goals, in accordance with your mission.
Narrative
Our goal is quite straightforward. By using the “Annual Physical” as the episode of focus,
our goal is to become the dominant supplier of Patient Verification Software Systems. The
CPR market is very dynamic. It is our intent to take a strong lead in growing this market.
We plan to obtain approximately 40% of the market within five years. By year five, we are
targeting an ROI of 20%.
Highlights
The presenter uses this viewgraph as an opportunity to reconfirm many messages
introduced earlier regarding the market and Soarrell’s intent to become a dominant
player. The presenter conveys an aggressive stance in the marketplace and, there
fore, poses specific information regarding financial objectives, percent market share
desired, and the ROI targeted.
The ATP requires that proposers include goals and objectives in ATP pro
posals. However, during the post-award period, a company is expected to become
more quantitative in the details provided.
© DAWNBREAKER PRESS, 1998 E Q U I T Y I N V E S T O R S 159

14V I E W G R A P H 14 Viewgraph 14: Objectives - Marketing and Sales
S O A R R E L L M E D I C A L S Y S T E M S
Objectives: M A R K E T I N G & S A L E S
■ Develop marketing and sales tools — 1st Quarter, 1998
■ Establish nationwide distributors — 3rd Quarter, 1999
■ Obtain initial orders — 3rd Quarter, 1999
What
The next series of viewgraphs includes
specific objectives for each functional
area, with accompanying milestones
and timelines. An objective is a state
ment that implies an action plan. This
action plan indicates what will be done
and when. Such expressions must be
quantitative and NOT qualitative.
Since the presenter will not have much
time to spend on these topics during a
20-minute presentation, the discussion
of objectives is limited to the 12-month
period following the presentation.
Why
In order to reach the company goals, the entrepreneur must develop a series of
well-conceived action plans. These action plans start with the expression of objec
tives for each functional area. Value creation is the consequence of sales in the
served available market that was defined earlier. Thus, your marketing and sales
plan is pivotal to the success of your company and of utmost interest to potential
investors. The specific roles and responsibilities of employees in each functional
area should be keyed to the objectives expressed in this section.
Pitfalls to Avoid
Most technology entrepreneurs err on the side of being too general in the expres
sion of their objectives. Objectives must be quantified and indicate both what will
be done and a timeline for when it will be done.
Variations
The form your marketing and sales objectives takes relates both to your company’s
mission and to the commercialization strategy which you have selected. For exam
ple, if the business function that your firm performs is strictly contract research and
E Q U I T Y I N V E S T O R S © DAWNBREAKER PRESS, 1998 160

development and if you have selected licensing as your commercialization strategy,
the nature of your marketing and sales objectives will be quite different from that
of a manufacturing firm such as Soarrell Industries, which is illustrated below. In
the licensing case, your customers would be potential licensees. Your marketing
efforts would, therefore, involve the development of materials to be used in pre-
qualifying and courting potential licensees. Your sales objectives would all relate to
developing licensing agreements.
When making a presentation to potential licensees, exclude your action
plan for marketing, distribution, and volume of sales from your presentation.
Including such information would be akin to telling a customer for a car what your
strategy is for selling it to him. However, your business plan should clearly identify
this information.
Narrative
Let’s take a look at our marketing and sales objectives. During the first quarter of 1999, we
will be developing specific marketing and sales tools to service a nationwide network. These
tools will be in place by March 1999. John Doe’s task during the second and third quarters
will be to develop a cohesive set of 30 U.S. distributors. This is a formidable task. However,
one of the larger CPR software developers has agreed to work with us.
Once the distribution network is in place, our task will be to obtain initial orders
from each of the distributors.
Highlights
The presenter has indicated when each of these objectives would be fulfilled and
has also quantified each objective. Such quantification will make it easier for the
entrepreneur to chart progress during the year. This quantified information also
helps potential investors begin to assess the adequacy of your action plan and its
potential to create value.
Notice that the presenter subtly weaves in information that reveals existing
collaboration with CPR software developers. This is useful information to share
with potential investors because it reduces perceived risk.
© DAWNBREAKER PRESS, 1998 E Q U I T Y I N V E S T O R S 161

15V I E W G R A P H 15 Viewgraph 15: Marketing Communications Plan
S O A R R E L L M E D I C A L S Y S T E M S
Objectives: M A R K E T I N G & S A L E S
Develop marketing tools
Train distributors
Attend Trade Show
Advertise
1 2 3 4 5 6 7 8 9 10 11 12
Months
What
In defining a marketing communications
plan, describe the development of mate
rials that will be used in sales, and occa
sions for presenting these materials to
potential customers. Processes for quali
fying and closing sales to potential cus
tomers presume the existence of a mar
keting communications plan. Common
elements of a marketing communications
plan include:
◗ development of marketing and
sales literature, videos, and training
materials for use by direct and
indirect sales staff
◗
◗
◗
participation in trade shows
direct mailing campaigns
press releases and advertising in trade journals
This list is illustrative, not comprehensive.
Why
Without a marketing communications plan, the investor cannot adequately assess
your degree of preparedness for marketing and sales, or the adequacy of your
staffing plan and the financial resources allocated for this task. Marketing and sales
issues are of fundamental interest to potential investors.
Pitfalls to Avoid
Technology entrepreneurs tend to underestimate the amount of effort required to
make sales. They also skimp on the marketing initiatives. For example, one might
assume that advertising once in each of four different trade journals would be an
effective way to generate sales. However, a far better way would be to carefully
select one trade journal and advertise in it four times. Repeated exposure to a
E Q U I T Y I N V E S T O R S © DAWNBREAKER PRESS, 1998 162

message is required for your potential customers to even notice that it is there.
The other error that technology entrepreneurs make is to keep the marketing
communications plan too general. Name the specific journals in which you will
advertise, specify the dates and locations of the trade shows you will attend, and
include appropriate cost estimates for all aspects of your marketing plan in your
pro forma financials.
Variations
The specific items included in your marketing communications plan depend
upon who your customers are and the most cost-effective way to reach them.
Narrative
This slide provides a timeline for execution of our marketing communications plan. As you
can see, once the marketing and sales tools have been developed, training of our distributor
network will begin. We will introduce the Annual Physical and Patient Verification Software
System at two trade shows—The Healthcare Information and Management Systems Society
show to be held in St. Louis in February and another trade show in Phoenix in September.
We will begin promotion in print media at the end of the first quarter and will run a series of
four advertisements in two trade journals starting in April.
Highlights
The presenter provided a fairly general graphic, drawing attention to the specific
activities listed on the ordinate and adding mention of some specific information
regarding events and dates. Given the brevity of time, the treatment of this topic is
adequate and demonstrates to the investor that the entrepreneur has developed a
detailed plan to communicate with his or her potential customers.
© DAWNBREAKER PRESS, 1998 E Q U I T Y I N V E S T O R S 163

16V I E W G R A P H 16 Viewgraph 16: Objectives - Research and Development
S O A R R E L L M E D I C A L S Y S T E M S
Objectives: R & D
■ Smart card & reader tested to complete specifications — 1st Quarter, 1998
■ Complete compliance with ISO 7816-4 guidelines — 4th Quarter, 1998
What
In parallel with the marketing objectives
mentioned earlier, the research and devel
opment objectives clarify what research
and development will be done in a given
time frame. You will notice that these
objectives are fairly macro in nature, but
still retain elements of specificity.
Why
The reason for expressing your objec
tives on a macro level is limited time.
However, it is still important to mention
research and development and demon
strate to the potential investor that you
have a plan for each functional area, i.e., research and development, engineering,
and manufacturing, as well as sales. Delays in research and development, engineer
ing, or manufacturing affect the rate at which sales can proceed. Therefore, it is
important to demonstrate to your audience that all functional areas are working in
consort to assure timely delivery of product.
Pitfalls to Avoid
The major risk for technology entrepreneurs is spending too much time on the dis
cussion of research and development. If this is the presenter’s area of strength, he
has a natural inclination to focus on it. A benefit of being brief is to minimize the
likelihood of divulging any proprietary information.
E Q U I T Y I N V E S T O R S © DAWNBREAKER PRESS, 1998 164

Variations
If you have selected licensing as your commercialization strategy, it may be appro
priate to include research and development objectives in your presentation. How
you handle this topic depends on your licensing objectives and the stage of devel
opment of the item that you wish to license. For example, if you are looking to
license your technology and also to obtain developmental funds to complete the
final stages of development, it would be important to map out what needs to be
done with these funds. However, if you have a finished product that is ready for
licensing, the research and development plan would be inappropriate.
Narrative
Most of the true research and development has been completed. It focused on the development of
a biometric voice encryption algorithm. Specifications testing with respect to the smart cards
and reader remain to be accomplished. We have developed both of these fully cognizant of the
ISO 7816 guidelines. We do not anticipate any problems—but some could be encountered.
Highlights
The research and development objectives are handled in a simple, straightforward
fashion. The primary message conveyed to the investors is that little research and
development remains to be done. This is important to convey at a time when the
company is seeking funds to gear up for product introduction.
© DAWNBREAKER PRESS, 1998 E Q U I T Y I N V E S T O R S 165

Viewgraph 17: Research and Development Milestones and Timeline
S O A R R E L L M E D I C A L S Y S T E M S
R & D Milestone & Timeline
Smart Card
Reader
ISO compliance
1st Q 2nd Q 3rd Q 4th Q
— --- — --- — --- —
17V I E W G R A P H 17
What
This is a typical milestone and timeline
chart. Again, you will notice that its pur
pose is to be illustrative, rather than
comprehensive. A milestone chart dis
played in your presentation will be much
less detailed than that contained in your
business plan. Simplicity will help the
audience absorb information quickly and
effectively.
Why
Everything that you present about your
research and development is aimed at
building momentum towards a predispo
sition to invest in your opportunity. It is unlikely that potential investors will be
able to retain many details from a brief presentation, so don’t provide them.
Instead, present illustrative information that shows you have a comprehensive plan.
Details can be discussed later in private, and hopefully during site visits which to
follow. This presentation is like your first date. The goal is to have many more so
that you have the opportunity to mutually assess your interest in collaborating. The
presentation is not everything—it is merely the first step!
Pitfalls to Avoid
To be effective in this part of the presentation, you must refrain from becoming too
detailed. Provide specific examples of the degree of accomplishment you have
attained toward research and development objectives. Momentum will be lost if
you provide too much detail. Your goal should be to give your audience a reason to
talk with you individually after your presentation.
E Q U I T Y I N V E S T O R S © DAWNBREAKER PRESS, 1998 166

Variations
The variations to be made in this approach are a function of your technology and
commercialization strategy. If you are seeking a licensing agreement with develop
mental funds to continue work on your product or technology, it would be appropri
ate to provide more details. Some of the other topics, such as marketing and sales
objectives would be omitted.
Narrative
I’ve included a summary milestone and timeline chart to show you some of the specific items
that we are working on. We are ahead of schedule on the evaluation of the smart card circuit
ry and are presently working on a few modifications to the reader. Although we have allowed
ourselves three quarters to finish these tasks, I feel confident that we will complete the work by
the end of the second quarter.
Highlights
Notice that the presenter did not mention each item on the viewgraph. That wasn’t
necessary given that the overall objective was to illustrate the items to be accom
plished and to convey the message that the company was ahead of schedule.
© DAWNBREAKER PRESS, 1998 E Q U I T Y I N V E S T O R S 167

18V I E W G R A P H 18 Viewgraph 18: Objectives - Manufacturing/Production
S O A R R E L L M E D I C A L S Y S T E M S
Objectives: Production
■ Patient education archive
■ Final review by content experts (2nd Quarter, 1998)
■ Completion of manual to accompany Patient Verification Software — 3rd Quarter, 1998
■ Low volume production run (smart cards; reader) — 3rd Quarter, 1998
What
If your firm will be producing a product,
either directly or through suppliers, it is
appropriate to describe briefly your man
ufacturing, production, or service deliv
ery plan. If you will not be producing a
product, skip this section.
Why
There’s a world of difference between
saying that you can produce X and being
able to deliver a high-quality product or
service reliably. If you have not manufac
tured, produced, or provided a product or
service before, this activity poses a high
degree of risk. Investors, customers, and suppliers need to be confident that you
can deliver the volume of a quality product or service stated in your projected sales
goals. Providing insight into your manufacturing or production plans will either fos
ter confidence or engender dismay.
Pitfalls to Avoid
If you are producing only part of the product, don’t skip this section! Even though
you are not manufacturing a product in its entirety, you may still have points to
make. Stakeholders will want to know how quality control will be maintained; if
you have back-up suppliers; how good your suppliers are; and if you are planning to
shift from a “buy” to a “make” strategy over time.
Variations
Use the most appropriate terminology in the title headings; i.e., don’t always use
the word “manufacturing.” If you are producing a widget, manufacturing would be
appropriate. However, if you are talking about software, then “production” is a
E Q U I T Y I N V E S T O R S © DAWNBREAKER PRESS, 1998 168

more appropriate term. If you are delivering training, talk about materials develop
ment and production. When building a plant, a project development plan or a site
plan would be a more appropriate way to refer to the activity.
Narrative
Soarrell will be producing the software containing our proprietary voice encryption algo
rithm, the patient education CD-ROM, and the internet materials. We will have a license
manager associated with the software to prevent its inappropriate proliferation. By contrast,
we have decided that it is more cost-effective to outsource the production of the patient smart
cards to Siemens, under an appropriate secrecy agreement. Siemens is a leader in this field,
and is able to meet our needs reliably at the appropriate quality level. All shipments of
smart cards will be accompanied by a quality control report. All software and hardware will
be shipped from our facility, under our label.
Highlights
What is important to notice is that the presenter uses this viewgraph to mention
positive attributes regarding company activities. He does not merely present a
litany of manufacturing objectives. The viewgraph is clearly laid out in a simple for
mat, consistent with the style used for representing the marketing and research and
development objectives.
If the company will be implementing a complex manufacturing plan, it is
recommended that this viewgraph be followed with a manufacturing milestone and
timeline chart. Since the manufacturing plan is not complex in this example, a
Customer Service viewgraph is substituted.
© DAWNBREAKER PRESS, 1998 E Q U I T Y I N V E S T O R S 169

19V I E W G R A P H 19 Viewgraph 19: Customer Service Objectives and Milestones
S O A R R E L L M E D I C A L S Y S T E M S
Customer Service
■ Attract and retain multi-functional team
■ High quality on-site client orientation
■ Proactively call client
■ Internet support
■ Fill orders within 1 day
Narrative
Customer Service will be a critical element of
Soarrell’s “Annual Physical and Patient
Verification Software.” Up to this point, I
have mentioned production of components
only for sake of clarity. Our Customer Service
is what will make this package acceptable and
will differentiate Soarrell from component
providers.
In pricing Soarrell’s product, our
customers and we have decided to take a risk
by accepting milestone payments. One up-
front fee is followed by milestone payments
during a six-month period, as measured by
minimal disruption to the medical practice
and increased patient satisfaction. In order to be successful with this approach, Customer
Service is pivotal.
Our objectives are to attract and retain paramedics to be a part of a multi-function
al sales and customer service team. Each team will consist of a paramedic and a software
specialist. Other objectives are highlighted on this slide. I would be happy to discuss them in
greater detail following this presentation.
E Q U I T Y I N V E S T O R S © DAWNBREAKER PRESS, 1998 170
Sandy
Text Box
Customer Service ■ Attract and retain multi-functional team ■ High quality on-site client orientation ■ Proactively call client ■ Internet support ■ Fill orders within 1 day

Challenges/Requirements/Opportunities
4
Viewgraph 20: Risks and Contingencies
Viewgraph 21: Constraints
Viewgraph 22: Human Resource Requirements
Viewgraph 23: Financials: Income and Expense
Viewgraph 24: Financials: Cash Flow from Operations
Viewgraph 25: Financing Needs
Viewgraph 26: Investor’s Return

CHALLENGES/REQUIREMENTS/OPPORTUNITIES
■
■
■
■
■
What are the risks of failure? What are your constraints? Use this discussion
as an opportunity to show you are prepared!
What are your human resource requirements? What is your timeline for
acquiring them?
When will you achieve positive cash flow?
How much financing do you need and for what purposes?
What will be the investors’ return on investment?
© DAWNBREAKER PRESS, 1998 E Q U I T Y I N V E S T O R S 173

20V I E W G R A P H 20 Viewgraph 20: Risks and Contingencies
S O A R R E L L M E D I C A L S Y S T E M S
Risks & Contingencies
Event
Failure to have Customer Service Depart-ment trained & in place when needed
Impact
Loss of 30% revenue
Probability
20%
Response
1. Increase recruitment
2. Increase internal training
3. More empha-sis on CD-ROM sales
What
The risks and contingencies section of
business plans and presentations often
differentiates the mediocre from the
excellent. There are always risks associ
ated with business. The goal is to antici
pate and prepare for them in advance, so
that you can forestall many potential
problems. Risks are associated with each
functional area. There could be critical
research and development tests that fail.
Sales could proceed at a slower rate than
predicted. Your competition could launch
an aggressive price war to erode your
market. In business anything is possible.
It is wise to assess the probability of occurrence of various events that could nega
tively impact your business. Prepare, try to forestall the events, or map out alterna
tive plans of action for those situations that are beyond your control.
Why
Investors know that there are risks associated with their investments. It is impor
tant that they be able to assess the risks and determine if they wish to proceed.
The biggest single risk for an investor is management. However, if you have done a
thorough job of planning, you should be able to appropriately convey the strengths
of your management team and minimize concerns about management risk.
Pitfalls to Avoid
To many technology entrepreneurs, sharing information about your risks is counter-
intuitive. In fact, it may not seem beneficial at first blush. However, by sharing
information you convey your degree of preparedness. The discussion of risks and
contingencies has to be presented in a positive light. Assure that your narrative
doesn’t come across as a litany of negatives; that would certainly be harmful!
E Q U I T Y I N V E S T O R S © DAWNBREAKER PRESS, 1998 174

Variations
The nature of the risk that you select to discuss will again vary depending upon
your company’s mission and commercialization strategy. Do not be comprehensive
in your treatment of this topic; use illustrations.
Narrative
When launching a new product, it is of utmost importance to evaluate the risks and contin
gencies relative to this new direction. We have evaluated all of the major foreseeable risks and
have assigned a probability to each of them ranging from 0-100%. For those risks which we
evaluated as having a probability of 20% or greater, we have developed a contingency plan.
As an example, we took a look at the potential risk associated with our Customer Service
Department not being in place on time. We evaluated the probability of occurrence at 20%.
The potential loss to Soarrell would be approximately 30% of our income, given the manner
in which we are sharing risk with the customer. By the way, our pricing method is a new
trend in this field—and one that we have to use in order to break into this market.
We are not waiting, but have implemented three actions. We have (1) accelerated the
rate of recruitment to the Customer Service Department, (2) enhanced internal training of
our staff by Dr. Bolton, and (3) made a stronger thrust into selling CD-ROMs directly to
patients. There is no risk sharing with direct customers of this sort.
Highlights
Notice that the presenter discussed only one risk and used this as an opportunity to
reinforce that the company is prepared. It was clear that the assessment process
used had already resulted in risk reduction; i.e., the three-step program involving
Customer Service.
© DAWNBREAKER PRESS, 1998 E Q U I T Y I N V E S T O R S 175

21V I E W G R A P H 21 Viewgraph 21: Constraints
S O A R R E L L M E D I C A L S Y S T E M S
Constraints
■ Customer Service Ranks
■ Funds for adequate Marketing & Sales
■ NOT all key functional areas are in place
■ Unpredictable sell cycle (1 year)
What
The discussion of constraints is similar to
the topic of risks and contingencies. In
this section you are acknowledging those
factors which could impede the growth
of your firm if not addressed carefully.
Why
By describing constraints on your ability
to meet your goals, you are in essence
saying that you recognize that there are
certain aspects of your firm which need
to be strengthened. Investors will see
this, once they start probing. By raising
the issue, you are acknowledging its
existence and taking the first step to overcome it.
Pitfalls to Avoid
Avoid being negative. Present the information as a sign of your strength and wis
dom. Do not say things like, “We know that we’re lousy with marketing and sales;
that’s why we’re looking for a partner,” or “We’re technical people and we want
someone else to do that other stuff.” This also sends a negative message—and it
doesn’t work! The reason we are belaboring this is we have heard too many people
initially address their constraints in this fashion.
E Q U I T Y I N V E S T O R S © DAWNBREAKER PRESS, 1998 176

Variations
Depending on the audience and the nature of your commercialization strategy, you
may decide to omit this viewgraph. Such frankness is useful when seeking equity
investors, but is not relevant if you are presenting a licensing opportunity. Also, you
could combine the discussion of constraints with the treatment of contingencies and
then eliminate this viewgraph.
Narrative
Realistically, one must look inwardly and evaluate the overt constraints on the success of
Soarrell Medical Systems. The key to our success is that we recruit talented individuals to fill
the positions identified in the organizational structure that I will show you momentarily. We
also recognize that, given the dynamic nature of this field, we could either experience a slow
sell cycle initially or such a fast one that it outstrips our capabilities. Key to our success in
overcoming the constraints is the timely infusion of first-round financing.
Highlights
Note the tone of the narrator and that what he is saying does not exactly dupli
cate the words in the accompanying viewgraph. The messages compliment each
other well.
© DAWNBREAKER PRESS, 1998 E Q U I T Y I N V E S T O R S 177

22V I E W G R A P H 22 Viewgraph 22: Human Resource Requirements
S O A R R E L L M E D I C A L S Y S T E M S
Human Resources Requirements
Tech. Transfer Sales
Customer Service
New Products Distributor
Marketing
Hardware Production
Finance & Administration
President
Suppliers
QC
= 1998
= 1999
= In place
What
The purpose of this particular viewgraph
is to show the human resources that will
be required to attain the goals and objec
tives you have set forth.
Why
It is common for technology entrepre
neurs to underestimate the resources
that will be required to bring products
to market successfully. The reason for
including a phased organizational chart is
to demonstrate that you have anticipated
the resources that will be required to
drive your company. A phased organiza
tional chart allows you to show in one graphic what the company will look like over
the next three to five years. The key, evident in the upper left-hand corner of the
viewgraph, enables you to show when functions will be added. If you wish, you can
place numbers in each box to indicate the number of hires in each functional area at
each point in time.
Pitfalls to Avoid
With the numerous discussions in the popular press about organizations becoming
flatter, some technology entrepreneurs have been representing their organizational
structure in novel ways. They tend to show that there is little differentiation
among people. Such a chart may be useful internally, but for conveying resources
to potential investors, it is better to represent your organizational structure in a
more conventional manner. Your organizational charts should show roles and
responsibilities and a chain of command.
E Q U I T Y I N V E S T O R S © DAWNBREAKER PRESS, 1998 178

Another common error that many entrepreneurs make is to put their name
in all the management positions. Again, this is not viewed favorably. One person
cannot adequately grow all aspects of a company beyond a very limited point. If
you plan on accelerating the growth of your firm, it would be safer to represent
functional areas without names and to seek additional staff promptly.
Variations
Another common way to represent human resource requirements is by
using a table. List years as column headings, and use functional areas as headings
for each row. Then enter the number of people that will be working in each func
tional area by year into each table cell. Be sure to include staff totals at the bottom
of each column.
Narrative
Soarrell Medical Systems has a sound plan for growth. Currently, we have three key people
on the management team in place in Tech Transfer, Finance and Administration, and overall
company management. In order to accelerate the market’s awareness of our products, in 1999
we will be adding people to marketing, customer service, and distribution. We are looking to
expand our cultivation of the market further by teaming with a large CPR provider who has
an existing distribution network in place. Since our near-term focus is product introduction,
we will be adding a fourth party to our management team during the fourth quarter, to head
up the Customer Service Area.
Highlights
Notice that the presenter is beginning to weave in themes that were mentioned at
the outset. Here again, he indicates an interest in teaming with a CPR provider who
has existing distribution networks. At this point in your presentation, begin to add
narrative that relates back to the business opportunity.
© DAWNBREAKER PRESS, 1998 E Q U I T Y I N V E S T O R S 179

Viewgraph 23: Financials - Cash Flow
S O A R R E L L M E D I C A L S Y S T E M S
Cash Flow from Operations
$5 —
$2.5 —
$0 —
-$2.5 — 1998 1999 2000 2001 2002
23V I E W G R A P H 23
What
For emphasis, Cash Flow is represented
graphically, since lack of cash represents
one of the key reasons why companies
fail. Cash flow is an index of your com
pany’s health and is therefore of great
interest to investors. Cash flow is not the
same thing as profit. Profit is calculated
by subtracting expenses from sales,
while cash flow is the difference
between actual cash receipts and cash
payments.
Why
Many companies fail because of the lack
of cash. It is important for investors to see how long the cash flow will be negative
and thus how long outside funding such as loans, venture capital infusions, and the
like will be required. When your company begins to have a positive cash flow,
investors can begin to realize a return on their investment.
Pitfalls to Avoid
This chart is based on the pro forma cash flow analysis made in your business
plan. Financial projections are based on reasonable and clearly articulated
assumptions. Be sure when calculating cash flow that the income is based on
cash receipts and not sales. The reason for this differentiation is that payment for
sales usually lags product delivery by one to three months. Thus, a sale does not
constitute cash on hand until you have received the actual funds for the sale,
reflected in cash receipts.
E Q U I T Y I N V E S T O R S © DAWNBREAKER PRESS, 1998 0 18

The years indicated on the horizontal axis should correspond with the dates when
you anticipate an infusion of funds from your potential funding source.
Narrative
We will need an infusion of funds during each of the next two years to cover the costs associat
ed with product introduction and customer support. In 1999, as our early sales are made
into the markets, we begin to see a positive cash flow. With the development of a teaming rela
tionship with a major player in the CPR industry, our projected sales will accelerate. By
2002, we will have a very healthy cash flow position.
© DAWNBREAKER PRESS, 1998 E Q U I T Y I N V E S T O R S 181

24V I E W G R A P H 24 Viewgraph 24: Financials - Income and Expense
S O A R R E L L M E D I C A L S Y S T E M S
Income and Expense Statement
In $000 Year 1 Year 2 Year 3 Year 4 Year 5
Sales $30 $2000 $6000 $17,500 $35,000
Cost of Sales* 45% 40% 30% 22% 22%
Gross Margin* 55% 60% 70% 78% 78%
Operating Expenses* 65% 55% 59% 58% 56%
Income from Operations* (-20%) 5% 11% 20% 22%
Net Income* (-17%) 3% 10% 18% 20%
*Expressed as %’s of sales
What
The most common elements of an
income and expense statement are listed
below:
SALES
COST OF SALES
Materials
Labor
Overhead
Total
GROSS MARGIN
OPERATING EXPENSES
Marketing
Research and Development
General and Administrative
Total
INCOME (LOSS) FROM OPERATIONS
INTEREST INCOME
INCOME (LOSS) BEFORE TAXES
TAXES ON INCOME
NET INCOME (LOSS)
E Q U I T Y I N V E S T O R S © DAWNBREAKER PRESS, 1998 182

There are many variations on this theme. However, you need to keep things simple
so that the information can be grasped quickly and retained.
Why
This is indeed the bottom line. You must present your financial highlights clearly
and simply.
Pitfalls to Avoid
Avoid presenting too much data. You don’t want to lose your audience. Although
this presentation is simplified, the financials in your business plan should be well
developed and comprehensive.
Variations
You can represent the financial information in absolute numbers and/or percentages.
In the viewgraph presented on the following page, absolute numbers were provided
for the sales forecasts only. Everything else was represented as percentages of sales.
To make the message more salient, some elements of a typical income and expense
report were omitted.
Narrative
In year one, our projected sales will be modest. However, our distribution channel will be in
place and sales volumes will accelerate. By year five, we project sales of $35 million. At the
outset, the cost of sales will be relatively high, as we will be developing a new distribution
channel and selling to a somewhat conservative market. However, a variety of enabling com
plementary technologies that are expected to become available during the next two years will
provide the impetus for more rapid growth. When we finalize our teaming arrangement with
the CPR provider, our cost of sales will decrease. By 2002, the fifth year of operation, our net
income will stabilize. In that year alone, our net income is projected to be $7 million.
Highlights
Notice that the presenter only draws attention to the most salient items in this ver
bal presentation. Details can be addressed individually in one-on-one conversations.
As appropriate, the entrepreneur may want to compare these percentages to indus
try standards.
© DAWNBREAKER PRESS, 1998 E Q U I T Y I N V E S T O R S 183

25V I E W G R A P H 25 Viewgraph 25: Financing Needs
S O A R R E L L M E D I C A L S Y S T E M S
Financing Needs
■ $2 million in two definitive stages:
■ First-round financing $1 million for customer service and product introduction — 3rd Quarter, 1998
■ Expanded Marketing and Sales — 3rd Quarter, 1999
What
You must articulate clearly what your financing needs are. Tell potential investors how much money you need, when you need it, and how it is to be used. Also mention other needs potential investors might help you meet—for example, expertise, contacts within the industries of interest, and the like.
Why
Although it should be obvious why potential investors need to know this, some entrepreneurs refrain from clearly articulating this information in their presentation.
Pitfalls to Avoid
Be careful not to demand financing. Your presentation should be a request. The
manner in which you present your financing need should clearly convey that you
are looking for a partner, not just a backer.
E Q U I T Y I N V E S T O R S © DAWNBREAKER PRESS, 1998 184

Variations
There are many possible financing arrangements. You should explore these options
thoroughly during your business planning.
Narrative
We are seeking a total of $2 million in two rounds of financing. We need $1 million to attract
and retain a multi-functional marketing and sales team, expand the customer support func
tion, and begin the product introduction process. Ideally, we are looking for a venture capital
firm with strong ties to the medical practice management industry to provide this first round
of funding. Our preferred commercialization strategy is ultimately to team with a major
medical practice management software developer and to be acquired by them in year five. We
will seek our second round of financing from a strategic ally who will have the option of pur
chasing Soarrell Medical Systems in year five. The acquisition price would be twice sales OR
at a capitalization rate reflective of this industry. It will be established by an independent
third party at the time of the potential acquisition.
© DAWNBREAKER PRESS, 1998 E Q U I T Y I N V E S T O R S 185

26V I E W G R A P H 26 Viewgraph 26: Investor’s Return
S O A R R E L L M E D I C A L S Y S T E M S
Investors Return
Venture Capitalist
Acquisitions in year 5 at 5-10x on initial investment
Management buy-back
CPR—Open up profitable, new market
Prevent competition from gaining market share
What
This section of your presentation specifi
cally addresses the financial return to the
investor; i.e., the value created. (This is
not the same as the social rate of return
you were required to address in your
ATP proposal.) Value may be expressed
in numerous ways including Return on
Investment (ROI), Return on Assets
(ROI), and Book Value. The level of
return investors seek will vary with the
type of investor. Institutional investors
typically want a minimum return of 5x
on their investment within five years. A
strategic ally will often accept a lower
ROI (15-25%). This may occur when the capabilities of the potential acquisition
enhance the ally’s competitive position or increase its revenue generation capabili
ties through savings or new revenue generation opportunities. The 20% ROI target
ed by the Soarell management team would be acceptable to a potential strategic
ally, but would not hold out much appeal to an institutional investor. Therefore, the
company might want to buy back its stock in the event that the strategic ally does
not acquire the firm, and/or the company might need to reconceptualize its com
mercialization strategy.
The management team has presented a sound plan for growing this market
and has a good intellectual property position. An investor with ties to the CPR mar
ket might see the potential in a different way and ask the management team to
rework their numbers with a different set of assumptions. A more aggressive
approach to the marketplace might result in a higher ROI.
Why
Value creation is at the core of an investor’s business. It must be addressed from the
investor’s perspective.
E Q U I T Y I N V E S T O R S © DAWNBREAKER PRESS, 1998 186

Pitfalls to Avoid
The most common mistakes technology entrepreneurs make are: (1) failing to
address the investor’s return at all in their presentation, or (2) announcing how
much equity they are willing to give up in exchange for financing. Failing to
address an investor’s return reinforces the belief that the technology entrepreneur is
simply looking for a source of capital to continue research and development and is
not interested in creating value. If you are seeking money from the private sector,
approach the search responsibly and knowledgeably.
The amount of equity that will be offered should be negotiated privately,
after further meetings and greater understanding of investor’s requirement. A figure
you pose in your presentation might be much higher than you would need to pro
vide, or so small as to seem ludicrous. However, you should have made some pri
vate decisions about how much equity you are willing to relinquish and checked
with colleagues knowledgeable about the financial community to determine if your
decision is reasonable. Be prepared, but negotiate equity sales privately.
Narrative
As was mentioned earlier, we are looking to provide our investors with a 20% ROI. As this
market continues to evolve, we will have to be a larger company to supply the market.
Therefore, we are growing this business with the intent of being acquired within five years by a
large firm in the practice management arena.
Key to our success is forming a successful strategic alliance with a CPR firm that has
an existing distribution channel. This partnership will bring an additional product to add to
the distribution channel, and enhanced customer satisfaction, and increased market share.
I will be available to talk with any interested parties after this presentation. I have
an executive summary from our business plan and other literature which I will be glad to
share with you. Thank you for your attention.
Highlights
The presenter has woven together a number of the themes and financial highlights
mentioned previously in his presentation and has closed with a clarification of how
value will be created for the equity investor and the strategic alliance partner.
© DAWNBREAKER PRESS, 1998 E Q U I T Y I N V E S T O R S 187

Synthesis
This sample presentation to potential investors or allies marks the end of this
section.
The following collection of activities can be used by the technology entre
preneur with or without the assistance of an experienced guide. The activities
should be completed prior to preparing the viewgraphs or other documents used to
present your business opportunity to others. Completing these activities will help
assure that you are prepared to meet the challenges that lay ahead.
E Q U I T Y I N V E S T O R S © DAWNBREAKER PRESS, 1998 188

Section 3TH
E W
OR
KB
OO
K
Section 3 T H E W O R K B O O K Strategic Planning
Customers/End Users
Market
Competitors

THE WORKBOOK
Prelude
Of the 311 single applicant
awards made since 1990,
212 have been made to
small businesses.
The ATP program is designed to promote U.S. competitiveness by supporting high-
risk research and development in technology areas where there is substantial poten
tial for enhancing U.S. economic growth. The program has been highly successful in
getting small, innovative firms to participate. Companies that receive ATP awards face
many immediate challenges, due to the innovative nature of the technology being fund
ed as well as the increased publicity the firms face after receiving an award. These
challenges include:
◗
◗
◗
◗
◗
Having to deal with many suitors for "hot" technologies
Having to develop more complex commercialization strategies
Learning to focus in the context of a rich technology platform
Having to develop more sophisticated planning
Having to adapt to a more rapid learning curve
The focus of the basic concepts section was to provide information to enhance a
more rapid learning curve and better decision making by small firms. Information,
however, is never enough—it is only the starting point for action.
To facilitate action, the last section of this book contains a collection of
activities to be addressed by the technology entrepreneur, either alone or with the
assistance of an experienced, motivating mentor. As we have said earlier, such assis
tance could come from members of the company’s board of directors, advisors, state
service providers, or consultants. The role of the advisor is to help a company
maintain a delicate balance between keeping these award-generated activities in
the forefront while not distracting its management team from the company’s core
business.
Organization of Workbook
The activities included in the workbook relate to four content areas. Each has a
direct bearing on the commercialization strategies you choose. These content areas
include:
◗
◗
◗
◗
strategic planning
customers/end users
market
competitors
© DAWNBREAKER PRESS, 1998 W O R K B O O K 191
Many of these issues will
have been addressed by ATP
awardees to some degree.
One’s understanding of the
business environment and
the best response to it,
however, is dynamic
and on-going.

Commercialization Toolkit TM
◗
◗ Licensing PackageTM
◗
◗
Strategic plan
Business plan
Presentation
F I G U R E I I I - 1 : A D V A N C E D O R G A N I Z E R
A C T I V I T I E S
C U S T O M E R S / M A R K E T C O M P E T I T O R SS T R AT E G I C P L A N S E N D U S E R S
1. 7. 10. 13.
2. 8. 11. 14.
3. 9. 12.
4.
5.
6.
Who are they?
Implications?
FABs
Customers
Buying decisions
Market segmentation
Market size
Market growth
Intellectual property
Competitive advantage
Vision
Mission
Strategic allies
Commercialization strategy
Do activities and then
package.
Commercialization ToolkitTM
is discussed in Chapter 1.
Figure III-1 is an advanced organizer representing the topics covered in this
chapter. There are fourteen activities in all, relating to strategic planning, cus
tomers, markets, and competitors. It is highly recommended that the reader com
plete all pertinent activities prior to developing the various documents in the
Commercialization ToolkitTM. The activities contained in the Guide will assist in
the development or revision of a strategic plan, licensing package, business plan, or
presentation materials. An additional resource to consult for activities related to the
development of operational plans is Business Planning for Scientists and Engineers
(Servo, 1999).
When confronted with today’s financial imperatives, planning is easily
pushed aside. In order to increase the likelihood that good intentions result in suc
cessful action, start by setting up a schedule for completing the selected tasks. To
obtain an objective assessment of your strengths and weaknesses, it is recommend
ed that you start this process by consulting with a respected advisor. Then, com
plete only those activities that are relevant for you.
A strawman schedule for completion of various commercialization activities
is listed below. This schedule will not meet all company needs.
-
W O R K B O O K © DAWNBREAKER PRESS, 1998 192

193© DAWNBREAKER PRESS, 1998 W O R K B O O K
F I G U R E I I I - 2 : S C H E D U L E F O R D E V E L O P I N G C O M M E R C I A L I Z A T I O N T O O L K I T T M
T I M E
READ
WORKBOOK ACTIVITIES
DOCUMENT ENHANCEMENT
Chapters 1-7
1 - 6
Strategic Plan Licensing Package Business Plan & Presentation
7 - 9 1 0 - 1 4
Chapter 8
ATP Award Announcement Start 6 months 12 months

1 Strategic Planning
Related Activities:
Activity 1:
Intellectual Property
Activity 2: Sustainable Competitve Advantage
Activity 3: Vision
Activity 4:
Mission
Activity 5: Srategic Allies
Activity 6: Commercialization Strategy

STRATEGIC PLANNING
The activities in this area of the Workbook (Activities 1 - 6) are intended to
help management thoroughly consider fundamental issues related to strategic
planning. The greatest headway with these tasks is often made in an off-site
session, where interruptions can be minimized. If you intend to involve your board
of directors in the planning process, an off-site meeting could be held in combina
tion with a board of directors meeting.
To help synthesize the information resulting from these activities, we
recommend that you begin work on a strategic plan for complex technology
platforms (Chapter 4) following your planning sessions. Completion of this
plan will require research on customers, markets, and industry trends.
© DAWNBREAKER PRESS, 1998 W O R K B O O K 197

W O R K B O O K © DAWNBREAKER PRESS, 1998 198
A C T I V I T Y1 Intellectual Property
A recommended low-cost
resource for technology
entrepreneurs is a very read
able magazine entitled
The Law Works:
The Law Works
1935 S. Plum Grove Rd.,
Suite 158
Palatine, Illinois, 60067
(708) 705-7195
The subscription cost is
approximately $45 per year.
Call and ask them to send a
sample so that you can
assess its potential value.
One of the most significant changes during the past four years is the provisional patent application process. According to "Important Notice for Inventors," issued
by the Patent and Trademark Office:
“As of June 8, 1995, inventors will be able to file a provisional application
that will allow them to obtain an early filing date with few formalities and at a lower
cost than filing a non-provisional application. This new application differs from a
non-provisional application because the patent term does not start from this filing
date, the application is not examined, and it cannot issue as a patent. The provi
sional patent application is retained in confidence and is automatically abandoned
12 months after filing. Before the provisional patent application expires, the appli
cant must file a non-provisional application to obtain a patent.
To file for a provisional patent application inventors should include:
◗
◗
◗
◗
a clearly written description of the invention
any drawings needed to understand the invention
the filing fee of $150 ($75 for small entities), and
a cover sheet identifying the inventor(s) name(s), residence(s), invention
title, name and registration of correspondence address, and any U.S.
Government agency that has a property interest in the application.
The inventors now have up to 12 months to file a non-provisional patent
application under 35 US Section 111 (a) and claim the benefit of the provisional
application filing date.”
For specific details about changes in U.S. patent law, please call the
Patent and Trademark Office (PTO) at (703) 305-9300. For questions
concerning any changes in the rules of practice before the Patent and Trademark
Office, call (703) 305-9282.
At first blush, the provisional patent application may seem to bear similari
ties to the disclosure document program. However, the two are significantly differ
ent. The disclosure is used as evidence, whereas a provisional patent application is
indeed an application. The 20-year clock does not start ticking until the formal
application is filed. The major benefit to an inventor is that he can file a provisional
patent application with a $75 fee and receive a patent pending status. This
enhances the inventor’s ability to interact with potential allies. One must then file
the formal patent application within 12 months; otherwise the patent application
will be abandoned. Consult the PTO with any questions.
A recommended book on
intellectual property is Patent
It Yourself, by David
Pressman, Esq. This
extremely readable book con
trasts copyrights, trade
secrets, and patents. It
focuses on helping the read
er understand the process of
conducting a patent search,
as well as filing and prose
cuting patent applications.

Activities
Make a list of the intellectual property your firm has protected, noting the dates
when patents, copyrights and trademarks have been filed or issued. If you find
yourself indicating that your technology is “patentable” but have done nothing
toward that end, start giving serious consideration to how you will protect your
intellectual property.
WORKSHEET: ACTIVITY 1: INTELLECTUAL PROPERTY DATE_________/____________/______________
INSTRUCTIONS: Use this area to generate a list of your current and pending intellectual property. With pending
intellectual property, be sure to take action. You don’t want to revisit this page in six months and find that nothing
has changed.
Title Date Responsible party
Issued Patent
Pending Patent
Unfiled Patent Application
Copyright
Trademark
© DAWNBREAKER PRESS, 1998 W O R K B O O K 199

A C T I V I T Y 2 Sustainable Competitve Advantage
Sustainable competitive advantage is the collection of characteristics which pro
vide your firm and your technology/product with clear advantages in terms of cost,
speed, exclusivity, and effectiveness in meeting genuine customer needs.
Competitive advantage is required for the long-term health of any company.
The types of things that provide a company with a sustainable competitive
advantage include:
◗
◗
◗
◗
◗
◗
◗
intellectual property, e.g., patents, trade secrets, copyrights, trademarks
the uniqueness of the technology and the limited number of people who
have expertise in this area (hopefully many of them are employed by
your company)
cost of entry
other advantages that enable you to be quicker and less expensive
your record with respect to selecting successful new products or
technologies, as well as your ability to keep to development timelines
other organizational strengths such as your marketing and sales capabilities,
access to distribution networks, and the quality of your work
your strategic alliances and champions
Have I answered this question adequately?
Result: Your goal is to develop a list of those characteristics that comprise your
“sustainable competitive advantage” and then to condense this list into a succinct
statement of fewer than 50 words.
W O R K B O O K © DAWNBREAKER PRESS, 1998 200

A C T I V I T Y 2 W O R K S H E E T
WORKSHEET: ACTIVITY 2: SUSTAINABLE COMPETITIVE ADVANTAGE DATE_________/____________/______________
INSTRUCTIONS: Use this area to generate a list of those items that contribute to your sustainable competitive
advantage. Then, generate a succinct statement that clearly expresses the competitive advantages of your company.
INTELLECTUAL PROPERTY: (This is the activity you just completed ((Activity 1)). Be sure to reference the infor
mation in your succinct statement.)
PERSONNEL:
COST OF ENTRY:
TRACK RECORD:
STRATEGIC ALLIES:
OTHER:
50-word statement of sustainable competitive advantage
© DAWNBREAKER PRESS, 1998 W O R K B O O K 201

A C T I V I T Y 3 What is Your Vision?
Management can’t begin to map out financial, marketing, research and development,
and manufacturing strategies until it decides upon a direction for the company’s
future. Many companies approach their growth strictly in an opportunistic fashion.
Although a company should always remain open to opportunities, without a vision for
the future, a company will not be able to propel itself forward in a purposeful way.
Activities and background:
The management team should spend time sharing visions for the future around each
of the items listed below. This requires at least four hours of uninterrupted time. An
off-site meeting may be the best way to make sufficient headway with this activity.
(1) PRODUCTS AND SERVICES
◗
◗
What products and services will your company be providing?
What type of work will you be doing: research, development, marketing,
manufacturing, distribution?
(2) FINANCIAL GOALS
◗
◗
◗
What are your financial goals for five years from now?
What will your company’s (SBUs) revenue stream look like?
What will your profit margin be?
(3) MARKET GOALS
◗
◗
◗
◗
Who will your customers be?
What geographic location will you serve?
What percentage of market share will you possess?
How big a player will your firm be in its defined market niche?
(4) IMAGE
◗
◗
How will your organization be viewed by others?
What will differentiate your firm from other companies?
(5) WHAT WILL YOU LOOK LIKE IN THE FUTURE?
◗
◗
How large do you want to become?
Where will your business be located?
Have I answered this question adequately?
Result: Your goal is to produce a thoughtful, two-to-three-page document. It doesn’t
need to be eloquent, but it does need to capture your vision for the future. Put the
materials in a three-ring notebook and/or in a computer file. When you develop a
commercialization strategy or sales and marketing objectives, check to see whether or
202 W O R K B O O K © DAWNBREAKER PRESS, 1998

A C T I V I T Y 3 W O R K S H E E T
not it coincides with your vision. Let your vision propel you forward, rather than tie
you to the present situation.
The most important elements of the vision are items 1-3. Items 4 and 5 are
secondary items to consider when mapping a path for the future.
WORKSHEET: ACTIVITY 3: VISION DATE_________/____________/______________
INSTRUCTIONS: Your vision for the future is a key element of what propels a company forward. Use the list of
prompts on the previous page as discussion points for an off-site or after hours planning session. Your vision for the
future must be one you have the energy and drive to pursue. For planning purposes, select a five-year horizon and
summarize your conclusions below. Add additional pages as needed.
(1) PRODUCTS AND SERVICES:
(2) FINANCIAL GOALS:
(3) MARKET GOALS:
(4) IMAGE:
© DAWNBREAKER PRESS, 1998 W O R K B O O K 203

A C T I V I T Y 4 Mission Statement
Being able to describe your business in a very succinct fashion is a selling tool. Any
manager should be able to clearly and simply express the essence of the business in
one sentence. In addition to serving as a selling tool, a clear recognition of your
company’s mission helps define the commercialization strategies best suited for
your firm.
Activities and background:
A good mission statement should answer the following questions:
◗
◗
◗
◗
What business are you in? This question is answered by indicating the
types of business functions your company performs, i.e., research and
development, engineering, manufacturing, marketing, custom design,
distribution.
What products and technologies are involved?
What markets do you serve?
What is unique about your company? What differentiates it from others?
Have I answered this question adequately?
Process: Start by addressing the preceding questions. Be thorough and don’t be
concerned about length or style. Once you have addressed all of these issues, try
expressing your mission in a 50-word statement. It will probably sound extremely
dense. However, adding the word “limit” afterwards forces you to single out the
critical elements. The resulting mission statement must pass “The Elevator Test;”
i.e., you should be to be able to tell someone what your company does as the
elevator moves between floors.
Results: Your goal is a pithy statement describing your company’s mission. The
following is a good example:
“Voltec Inc. designs, manufactures, and markets the only U/L-approved, high effi
ciency, computer-controlled power combustion gas fired boilers and heaters to the Real Estate,
Education, Health Care and Service sections of the HVAC market in the commercial and
industrial segments.”
Although this statement is very dense, it contains all the required elements.
One instantly knows what business functions the company performs—it designs,
manufactures, and markets. One knows what products the company produces—gas
fired-boilers and heaters. The listener knows what gives the company a sustainable
competitive advantage—it has the only U/L-approved, high efficiency computer
controlled device—and what markets it serves—the heating, ventilation and air
conditioning market as it pertains to real estate, education, and health care. It
would pass the elevator test.
W O R K B O O K © DAWNBREAKER PRESS, 1998 204

A C T I V I T Y 4 W O R K S H E E T
WORKSHEET: ACTIVITY 4: MISSION DATE_________/____________/______________
INSTRUCTIONS: Listed below are the four key elements of a good mission statement. Carefully consider each of
these and then create a succinct statement. Begin by writing a sentence for each of the following prompts, and then
combine them.
Business Functions:
Products/Technologies:
Markets:
Differentiators:
Succinct Mission Statement
© DAWNBREAKER PRESS, 1998 W O R K B O O K 205

A C T I V I T Y5 Strategic Allies
If the strategic ally or licensee to whom you entrust the future of your
technology/product is not selected with care, your product could fail. Building on
the recommendations of Robert Cooper, look for licensees or other strategic allies
with whom there is market and/or technology synergy.
Cooper, Robert. Winning with
New Products. Reading, MA:
Addison-Wesley, 1993
Background
In order to locate a potential strategic ally, it is vital to know and address the ally’s needs. This is your responsibility, not the ally’s, since you are doing the
courting. In other words, when approaching potential strategic allies, your objective
is to determine how you can enhance their business, NOT how they can enhance
yours. By having your priorities in this order, both businesses will prosper. Suppliers
of technology must be able to reduce their allies’ (customers’) costs or expand their
revenues and earnings. Customers (allies) must help suppliers control the costs of
selling and serving them. Making the customers a part of the process and sharing
more information with them does this. One work that is particularly useful in set
ting the stage for such collaboration is entitled Growth Partnering: How to Build Your
Company’s Profits by Building Customer Profits, by Mack Hanan (1992).
The fundamental premise of Hanan’s work is that successful partnerships
are those in which you as a supplier can clearly demonstrate how you can help build
your customer’s profits. As a result of this focus and careful attention to laying the
ground rules for successful collaboration, your firm will also profit. Hanan’s book is
filled with examples of how Boeing, Xerox, Toyota, and many other large companies
have adopted this approach for mutual benefit. In order for such a relationship to
work, there must be mutual objectives, mutual rewards, and mutual sharing of risk.
What this means is that you need to gather detailed information regarding
potential allies, and determine whether there is the basis for a partnership. Do you
have something to offer a particular customer that results in significant cost reductions or significant revenue enhancement? Of course you can’t address this issue
unless you know your potential allies well.
Hanan identifies many potential benefits from a large company can accrue
from teaming with a small firm. These include:
◗
◗
◗
◗
◗
◗
◗
obtaining a source of new technology and products to supplement core
technologies
developing the ability to extend or round off current lines to markets
gaining access to specialized market niches
gaining new insights about the industry/business
discovering a new training ground for entrepreneurial managers
adding specialized application skills
obtaining a high return on investment
W O R K B O O K © DAWNBREAKER PRESS, 1998 206

In all cases, to sell these potential benefits, you need to know the large company’s
business and look at yours in a different way.
Activities
In order to find a good ally:
(1) define the appropriate domain of potential allies and/or licensees based on the
following:
◗
◗
◗
needs addressed
technology synergy
market synergy
(2) request copies of annual reports and SEC documents if publicly traded
(3) obtain lists of patents and see if they are working in this area
(4) find articles which show what they are doing relative to divestiture, acquisition,
new product introductions, change in management, downsizing, and bankruptcy
(5) obtain product catalogues and pricing information.
Have I answered this question adequately?
Process: Start by developing good intelligence files on potential strategic allies,
reviewing the materials, and completing a partnerability analysis.
Result: The purpose of this exercise is to help clarify to whom your product/service
can be of greatest advantage. Your goal is to prepare a partnerability analysis using
the materials gathered. Develop a matrix—with potential allies listed down the
ordinate and with three columns using the following headings: (1) contribution to
cost reduction/ revenue enhancement, (2) time frame, and (3) partnering strategy.
Complete this matrix to summarize the relative contribution that you could make to
the strategic allies you are considering.
© DAWNBREAKER PRESS, 1998 W O R K B O O K 207

A C T I V I T Y 5W O R K S H E E T
WORKSHEET: ACTIVITY 5: STRATEGIC ALLIES DATE_________/____________/______________
INSTRUCTIONS: Begin this activity once you have developed good intelligence files on potential strategic allies.
Then use the space below to clarify the nature of the synergy between your technology and their needs, technology,
and/or marketing and sales capabilities. Add additional pages for each potential ally.
POTENTIAL ALLY NAME
Evidence of strategic fit:
Evidence of technology synergy:
Evidence of synergy with marketing/sales capability:
Evidence of corporate stability:
W O R K B O O K © DAWNBREAKER PRESS, 1998 208

A C T I V I T Y6 Commercialization Strategy
The commercialization strategy depends upon the vision and mission of your com
pany. It includes an acknowledgment of the business functions that your company
will perform and the financing strategies that you will use to realize your goals. For
example, if the business function your company performs is limited to research and
development, you might choose to bring the product to market through a licensing
strategy. Possible financing strategies that you entertain could include:
◗
◗
Development funds and licensing
Small commitment of development funds and first right of refusal on
licensing option
In other words, you would be looking to finance the latter stages of devel
opment and product introduction by finding a potential licensee who would be will
ing to fund and execute the following stages. Please note that those who entertain a
licensing strategy must pay keen attention to all issues related to intellectual prop
erty protection.
By contrast, if your mission also includes manufacturing, then it would be
reasonable to entertain one or more of the following.
◗
◗
◗
◗
◗
◗
Debt financing
Equity investment in parent company
Equity investment in spin-off
Joint ventures
IPO (Initial Public Offering)
Strategic alliances-marketing and distribution
Activities and background:
A commercialization strategy is an expression of the important milestones involved
with moving a product from concept to product launch, accompanied by a proposed
financing method for each. In preparing this statement, you might find it useful to
think about the list of steps presented by Cooper (1993). Next to each activity, indi
cate how you would fund it. For example:
(1) Initial Screening (1) Bid and Proposal line
of General and
Administrative
(G and A) funds
(2) Preliminary market assessment (2) Sweat equity
© DAWNBREAKER PRESS, 1998 W O R K B O O K 209

(3) Preliminary technical assessment (3) Phase I Small Business
Innovation Research
grant (SBIR)
(4) Detailed market assessment (4) Retained earnings
(5) Predevelopment business/financial analysis (5) Retained earnings
(6) Technology/product development (6) ATP funding
(7) In-house product tests (7) Corporate partner
(8) Customer product tests (8) Beta test at prime
partner site
(9) Trial sell (9) License to distribution
partner
(10) Trial production (10) Equity financing from
angels
(11) Pre-commercialization business analysis (11) Corporate partner
(12) Production start-up (12) Obtain equity capital
(13) Market launch (13) Equity financing
Please note that the milestones listed in the left-hand column come from
Robert Cooper’s work. This list is illustrative. Different steps will be appropriate for
you depending upon the nature of your opportunity. For example, opportunities
related to the pharmaceutical industry are likely to include such milestones as
human trials and FDA approval.
W O R K B O O K © DAWNBREAKER PRESS, 1998 210

A C T I V I T Y 6 W O R K S H E E T
WORKSHEET: ACTIVITY 6: COMMERCIALIZATION STRATEGY DATE_________/____________/______________
INSTRUCTIONS: This is a summary sheet on which to map out factors that affect your strategy, as well as the pre
ferred financing steps to utilize to fund each of the activities associated with bringing your product to market.
MISSION STATEMENT:
Business functions:
Target market(s):
Sustainable competitive advantage:
VISION: Select the descriptor that best fits your vision.
BUSINESS PHILOSOPHY:
PRODUCT OR TECHNOLOGY DESCRIPTION:
STAGE OF DEVELOPMENT:
© DAWNBREAKER PRESS, 1998 W O R K B O O K 211

COMMERCIALIZATION STRATEGY
STEPS FINANCING METHOD
W O R K B O O K © DAWNBREAKER PRESS, 1998 212

Customers/End Users
2
Related Activities:
Activity 7:
Features, Advances, Benefits (FABs)
Activity 8: Contacting Potential Customers
Activity 9: Buying Decisions

CUSTOMERS AND END-USERS
It is important to have direct interaction with potential customers and end-users
throughout the product development process. Such interaction helps verify where
potential interest lies, which in turn affects the strategic decisions you make and
lays the foundation for conducting a market assessment. The activities in this area
of the Workbook (Activities 7 - 9) are intended to help management identify poten
tial customers and end-users and distinguish between them, as well as to identify
customer needs and benefits.
Rather than assigning this task to consultants or junior members of your
staff, reserve interaction with potential customers for yourself. It is important that
you not only hear what potential customers and end-users say, but also that you
gauge their degree of enthusiasm and concern.
Customer feedback should also be used to shape your analysis of potential
licensees and/or partners. This information will be important in completing your
strategic planning process.
Background
Nothing replaces talking with potential end-users and customers. This is vital to
successful commercialization and critical to determining a customer’s genuine
level of interest in what you have to offer. Early contact also helps you determine
if your potential customers have the means to purchase your product. If a compa
ny thinks that your product is the greatest thing since sliced bread but doesn’t
have the funds to purchase it, the company’s interest in your product is of little
value. The activities in this section are all aimed at helping technologists prepare
to talk with potential customers, end-users, and industry experts. Samples are
included throughout.
Customers and end-users are often mentioned in the same breath, often
leading entrepreneurs to the faulty conclusion that these are synonymous. They
are not. An end-user is the entity that utilizes the item produced. A customer is
the party which purchases it. The major difference then between customers and
end-users is purchasing power. Customers make the purchasing decision, but end-users may not. If you reflect upon this for a moment, it soon becomes
apparent that there is often a chain of customers between you and the ultimate
end-user. It is also true that on occasion a customer may also be an end-user.
© DAWNBREAKER PRESS, 1998 W O R K B O O K
End-user needs are
important because they
influence purchase
decisions.
215

Example 1: MRI Components
Assume that your firm manufactures a component for a magnetic resonance imaging
machine (MRI) and that you are contemplating who is your customer and who is
the end-user. It becomes apparent that hospital technicians who use the MRI are
the end-users. How easy or difficult it is for the technicians to use the MRI is
important, and affects the quality of the images produced. However, technicians do
not make the decision to purchase the MRI. A board of hospital administrators
and/or doctors most likely makes the decision. The hospital administrators are cus
tomers, but not your customers. Indeed, if you are the manufacturer of an MRI
component, your customer is the system integrator who makes the decision to pur
chase your component. You need to understand your immediate potential cus
tomers, i.e., the frequency with which they purchase these components, what issues
are important to them, price sensitivities, and the features, advantages, and benefits
they seek. The ultimate customers in the chain (hospital administrators) are also
important in understanding market size and the derived demand for this compo
nent. Problems the technicians have in using the MRI affect the decision makers at
the hospital level. It quickly becomes apparent that understanding the needs and
concerns of the entire customer chain is important.
216 W O R K B O O K © DAWNBREAKER PRESS, 1998
Example 2: Software for Disabled Children
Assume that you design software for disabled children. The end-users are clearly
the children. However, those with purchasing power are parents, teachers, and
librarians. It is unlikely that children will directly purchase the software.
Nevertheless, the children certainly influence the decision makers. If your commer
cialization strategy is to license to a software publisher, then your immediate cus
tomer is the publisher, not the parent, who likely will purchase the software from a
re-seller. In order to understand the size of the market opportunity, you must exam
ine the chain of customers and end-users that exist between you and the end of the
chain. Understanding the needs and limitations of the end-users affects software
design; understanding the purchasing behavior of the ultimate customer effects
your understanding of market size and growth; and understanding the needs of your
immediate customer allows you to position what you have relative to his needs.
Both customers and end-users are important. As you will discover in the
next section, if no qualified customers exist, then you have no market, no matter
how great the need. A qualified customer is one with money, access, and desire. The acronym MAD is sometimes used as shorthand to describe qualified
customers. Your goal is to find customers who have Money, Access, and Desire. This
customer is determined by need and the ability of what you offer to address that
need. Access is determined by the channels that you use for sales and distribution.
MAD
◗
◗
◗
Money
Access
Desire

Money must exist in order for the interested party to qualify as a customer of inter
est to you. This point cannot be underestimated. Often entrepreneurs are blinded
by the issue of need and confuse need with purchasing power—but these are two
separate issues. You must first qualify potential customers on the basis of need and
money, and then design your marketing and sales plan to maximize access.
Example 3: Exporting Rice
Let’s assume that you grow rice and are looking to export to an overseas market.
You know that thousands of individuals die each year from famine. Clearly there is
a need for your agricultural product. However, the starving masses have no purchas
ing power. They are end-users, but, lacking the money to purchase what you have,
they are not customers. If no relief organization steps forward to purchase the food
on their behalf, no customers exist. Without qualified customers, no market exists,
even though there is a need. However, if CARE or another relief organization steps
forward to purchase the rice, a market is born. An absurd example? Not really.
Technologists frequently confound the need of end-users with market
potential. A classic example involves the cleanup of U.S. nuclear sites. Economists
study the problem and conclude that it will cost somewhere between $200 billion
and $1 trillion to clean up these sites. As with the previous example (rice), there is
clearly a need. However, if the federal government does not provide the funds to
clean up the sites, there is no market in the same fashion that there was no market
for selling rice to famine-ridden countries without qualified customers. End-users
AND potential customers are important, but qualified customers that are MAD
are vital!
Objectives, Method, and Questions
Many technology-driven companies fail to talk to potential customers early in the
technology/product development process. The tendency is to assume that many
customers will want the technology and that the technology or product addresses a
real need. The ultimate survival of your business depends upon the purchases
made by customers, and it is vital to ask the customer what he wants early in the development process. For the technology-driven company, the customer must
quickly shift from being a hypothetical construct to a tangible entity. The earlier
you begin discussions with potential customers, the quicker you can begin to articu
late customer specifications and save development time and dollars.
© DAWNBREAKER PRESS, 1998 W O R K B O O K 217

There are many methods you can use to collect information from potential
customers, end-users, and industry experts. You should ultimately use a method
that fits with your planned activities and style. For example, if you plan to attend a
trade show, you could develop a survey form and ask people to complete it. If you
are traveling, you might collect anecdotal, in-depth information through person to
person interviews. Other alternatives include phone interviews and mailed surveys.
Whichever method you use to gather information, you must always begin by clarify
ing your objectives.
Objectives
Prepare for talking with potential customers and end-users by clarifying your objec
tives. For example, if your objective is to determine features that affect a purchase
decision, you might ask:
◗
◗
◗
◗
◗
◗
When buying a solution to Problem Y, what features do you look for?
When comparing similar products, what do you compare?
What are the key criteria you consider when deciding to purchase a solu
tion for problem Y?
How frequently do you purchase X?
What is the average price range of solutions that you entertain?
Who is involved in the decision to purchase X?
Method
The next decisions are how to gather the information needed and how large a sam
ple is needed. As was mentioned earlier, face-to-face interviews can be conducted
at trade shows, conferences, and meetings scheduled for the purpose of exploring
these issues. Telephone interviews can be initiated by a letter advising that you will
call to discuss XYZ or with a “cold” call. In-depth interviews allow you to branch
and explore a range of issues based on the information that surfaces during the
interview process. Once you have determined your objectives, generate questions
that are intended to surface answers addressing your objectives, and then select a
sample to contact.
Listed below are some questions that we generated before contacting
industry experts. Our objective was to gather some useful data points that we could
use in sizing the market for a power cogeneration device. We decided to interview
industry experts instead of customers and end-users because it was most time effi
cient. You might also consider this as a strategy for gathering information.
W O R K B O O K © DAWNBREAKER PRESS, 1998 218

Questions
Objective: To determine how many potential end-users there are in the U.S. for a
cogeneration device in rural residences and remote works-sites.
(1) How many rural residences are there in the U.S. which have inadequate elec
tricity (inadequate = can’t get it there or too expensive to do so)?
(a) What subset of these are in areas which have plenty of biomass (wood
or agricultural waste)?
(b) How much electricity do they need?
(c) What is their reaction to the utility of co-generation from biomass and
the generator output they would require?
(d) Do they keep data on recreational cabins and hunters’ lodges in the
outback? (Ask the same questions a through c)
(2) Paper Industry—How do they define a remote work site?
(a) How many remote work-sites are there?
(b) Would they have use for the cogeneration device?
(c) How much energy would be required to drive X, Y, and Z?
(d) Are there tax or regulatory-driven incentives for getting rid of the waste
that would fuel this cogeneration device?
(3) Forestry—How many outposts are there? How many cabins in parks?
(a) What subset of these are in areas which have plenty of biomass (wood
and agricultural waste)?
(b) How much electricity do they need?
(c) What is their reaction to utility of co-generation from biomass and the
generator output they would require?
Finding Industry Experts
Generating a list of industry experts can be accomplished in a two-to-three-hour
period, using a handful of reference materials available in any public library; for
example:
◗
◗
◗
Encyclopedia of Associations
Gales Directory of Publications and Broadcast Media
U.S. Industrial Outlook
© DAWNBREAKER PRESS, 1998 W O R K B O O K 219

W O R K B O O K © DAWNBREAKER PRESS, 1998 220
Sample Interviews
Once you have developed your objectives, questions, and contact list, the next task
is to conduct the interviews. In all cases you should view the interviews as data-
gathering. This is not a sales call, although the contacts may prove to be very use
ful in a wide variety of ways. Data gathering is something that all scientists and
engineers do; the only difference in this situation is that you are collecting informa
tion from other people.
It is useful during the interviews to take good notes. Be sure to reference
interviews with industry experts in your business plan and other documents that
you generate regarding commercial potential. Listed below are samples of data col
lected in a few interviews with industry experts. The purpose for including this
interview is merely to demonstrate the amount of information that can be obtained
from well-structured phone interviews. The information gathered provided useful
data points that could then be used in sizing a potential market.
Interview #1: Association
1. Logging in the industry is becoming more decentralized, with small contract log
ging firms filling the predominant role over the paper companies. There are far
fewer company-owned centralized logging camps in harvesting sites that are with
out electric power.
2. While the lumber and paper industries (primarily paper) are incredibly energy
intensive, using 12% of all industrial energy, amounting to 2.5-3 quads, or 3% of
total U.S. energy consumption, the harvesting site uses little electricity.
Interview #2: Association
1. There are few remote facilities. Larger independent contract harvesters predomi
nate over smaller players, and they tend to centralize their facilities in locations
with access to power.
2. You might have an application involving powering very small sawmills,
1- to 2-man operations, which cut a customer’s trees to build his log cabin.
3. As a result of environmental efforts, there is a lot more emphasis on leaving the
waste in place. Downed logs provide homes for bugs and a habitat for small ani
mals, which are food for raptors.
4. An exception may be large areas of dead wood, from beetle kill, for example. It is
possible that small trail crews and ranger districts in these areas may have use for
small-scale remote generated electric power. Mr. ABC, the new head of the
Forest Service, is from Eastern Idaho, where there has been a lot of beetle kill.
Discussed biomass utilization at the last industry round-table.

Interview #3: Association
1. Most remote work sites don’t have a need for electricity.
2. You could use your device to turn chipping and debarking devices that require
high torque.
3. There is no need for lighting at the remote sites.
4. I suggest you put together a focus group of loggers and put the issue to them.
What you offer is radical and different from present thinking. It might have strong
potential, but requires use in ways that are different and not readily apparent.
5. You might have an application in a small portable sawmill, but you might be too
small in power.
Interview #4: Editor of a trade journal
1. Our readership is 31,000.
2. I think XYZ technology is a heck of an interesting idea. We put on tech confer
ences around the world, including Europe.
3. I see applications for the technology in Europe and developing nations.
4. There are a tremendous number of emergency loads that require just a fraction
of the power of a household, such as for telecommunications equipment.
5. It is important to realize that there are entire sections of the U.S. where wood
burning is an anathema. Creosote from wood stoves is a highly carcinogenic.
Many ski areas in Colorado and Vermont restrict wood burning, with or without a
catalyzer. This air pollution can be a problem any place, particularly in valleys
with a lot of wood fires. In many of these areas, there are quite a few times a
year when burning of biomass is restricted.
6. This is not a problem outside the U.S. I see thousands of site applications for
your device in the Western Hemisphere.
7. Canada is more spread out; you can do anything you want there. Canada also
allows government bodies to subsidize emergency power. This can work to keep
people in areas or open up new areas for settlement.
8. It might be worthwhile to explore U.S. Government funding for the application
of your device for disaster avoidance and recovery. I don’t know where the funds
are, but they’re there.
© DAWNBREAKER PRESS, 1998 W O R K B O O K 221

A C T I V I T Y 7 Features /Advantages/Benefits
Customers use different criteria in making their purchasing decisions. Sometimes
the decision is based on price and at other times on the features, advantages, and
benefits of the product. It is, therefore, important to know how your
technology/product compares with competing products and services that
are available.
◗
◗
◗
A Feature is an element or property of the product or technology.
An Advantage answers the question “So what?” and indicates the value of this
feature. The advantage is frequently described in technical terms and tends to
describe the competitive advantage from the company’s perspective.
A Benefit describes the value to the end-user as he or she would
perceive it.
Have I answered this question adequately?
Result: The goal is a completed Feature/Advantage/Benefit (FAB) matrix for your
company, listing at least five features for each technology/product. There should be
a corresponding advantage and benefit for each feature.
W O R K B O O K © DAWNBREAKER PRESS, 1998 222

A C T I V I T Y W O R K S H E E T 7WORKSHEET: ACTIVITY 7: FEATURES, ADVANTAGES. BENEFITS (FAB) DATE_________/____________/______________
INSTRUCTIONS: Prior to beginning the process of contacting potential customers, end-users, or industry experts, it
is recommended that you spend time reflecting upon the features, advantages, and benefits of your technology,
product, or service. Part of the interviewing process should include questions designed to surface whether or not
these FABs are important to potential customers and at what price.
© DAWNBREAKER PRESS, 1998 W O R K B O O K 223

A C T I V I T Y 8 Contacting Potential Customers
Activities and background “The relationship between
the man and the customer,
their mutual trust, the impor
tance of reputation, the idea
of putting the customer
first—always. All of these
things, if carried out with
real conviction by the com
pany, can make a great deal
of difference in its destiny.”
Thomas Watson, Jr.,
Chairman, IBM Corporation
The 1962 McKinsey
Lectures, Graduate School of
Business, Columbia
University
For each market you are targeting, interview at least five potential customers or
industry experts to determine their needs relative to your technology/product.
Process: 1. Decide upon your objectives for this outreach initiative and generate questions
that will enable you to gather relevant information.
2. Carefully select the potential customers or industry experts you will approach by:
◗
◗
Determining which companies to approach
Developing a contact list within those organizations by looking for
names in trade journals, trade associations, conference proceedings,
Standard and Poor’s register, local newspaper articles, and/or from
conversations with the public relations department of the organization
in question
3. Before making the initial contact, decide what information about your company
and research you are at liberty to discuss, given the degree of intellectual proper
ty protection you want to maintain for your technology. Keep in mind this is a
data-gathering activity, so the focus is not on your technology—but rather on the
need addressed. However, the opportunity might arise to share some information
regarding your technology/product and you need to determine in advance how
much non-confidential information you will share.
Have I answered this question adequately?
Result: Your goal is a complete set of written notes from the interviews. The
number of people to be interviewed depends upon the financial decisions to be
made based upon these data. Interaction with potential customers is iterative. The
numbers of people included in initial interviews may be quite limited (five to ten
people). However, subsequently larger samples will be required.
W O R K B O O K © DAWNBREAKER PRESS, 1998 224

■
A C T I V I T Y 8 W O R K S H E E T
WORKSHEET: ACTIVITY 8: CONTACTING ENDUSERS, CUSTOMERS, AND INDUSTRY EXPERTS DATE_________/____________/______________
INSTRUCTIONS: Use this section to clarify the process that you will use to gather information.
(1) OBJECTIVES:
(2) GROUP TO APPROACH:
■ ■ Customers ■ ■ End-users ■ Industry Experts ■ ■ Other (name)
Rationale for selection of group:
Sample size with rationale:
How to locate:
Who will collect information?
METHOD FOR GATHERING INFORMATION:
Paper and pencil tasks: ■ ■ mailed survey ■ ■ survey distributed at trade show/conference
Interviews ■ ■ telephone interviews ■ ■ interviews at trade shows/conferences/others
QUESTIONS TO BE ASKED: (Be sure that the questions relate to the objectives.)
Information that you ARE willing to share about your company/technology/product?
Information that should NOT be discussed.
Courtesy to be extended to interviewees: After conducting an interview, it is appropriate to send a thank-you note.
If you are collecting information at a conference, you might hand out a token item of appreciation such as a pen,
small calculator, etc.
© DAWNBREAKER PRESS, 1998 W O R K B O O K 225

A C T I V I T Y 9 Buying Decisions
Your company’s cash flow depends upon your potential customers’ buying behavior.
There may be times during the year when customers are more likely to make pur
chase decisions than others. This will affect your models for predicting revenue. It
is very common for new organizations to give inappropriate consideration to the sell
cycle of potential customers and to how the customers’ buying decisions are made.
However, one quickly learns that adequate cash flow is what keeps a company
going.
Activities and background
Previously, you identified the potential customers for the various applications under
consideration. For each application, list the customers and what you know about
their buying behavior.
Have I answered this question adequately?
Process: Do you have good solid data about each potential customer? The follow
ing is an example of one customer’s process. Company X makes decisions by com
mittee. However, the process begins with a meeting with Mr. John Doe, who acts as
the first level screen. Mr. Doe is very hard to reach by phone or in person. It takes
about a month to set up an initial meeting. The committee meets every two weeks,
but it takes about two months for new items to appear on the docket. Once the
decision is made to buy, processing the paper work takes approximately another two
months. The decision to buy is very much affected by referrals, the state of the art,
and your prestige. After you begin working for Company X, the payments are made
within 90 to 120 days, even though terms are indicated as 30 days. This informa
tion was gathered through a conversation with another vendor who has worked with
this company for over five years.
Results: The goal is a list of the customers (at least at the company level), who
makes the decisions, how long the sell cycle takes, and what types of considerations
affect the decision to buy. Indicate your data source for each customer.
W O R K B O O K © DAWNBREAKER PRESS, 1998 226

A C T I V I T Y 9 W O R K S H E E T
WORKSHEET: ACTIVITY 9: BUYER BEHAVIOR DATE_________/____________/______________
INSTRUCTIONS: Use this activity as a prompt, to determine if you truly understand the buying behavior of
your targeted customers. Often, this type of information is gathered in the execution of the previous activity.
Add additional pages as required.
Customer type_______________________________
Decision-maker:
Sell cycle:
Basis for purchase decision:
Other considerations/observations:
How information gathered:
Customer type_______________________________
Decision-maker:
Sell cycle:
Basis for purchase decision:
Other considerations/observations:
How information gathered:
Customer type_______________________________
Decision-maker:
Sell cycle:
Basis for purchase decision:
Other considerations/observations:
How information gathered:
Customer type_______________________________
Decision-maker:
Sell cycle:
Basis for purchase decision:
Other considerations/observations:
How information gathered:
© DAWNBREAKER PRESS, 1998 W O R K B O O K 227

Market
3
Related Activities:
Activity 10: Market Segmentation
Activity 11: Market Size
Activity 12: Market Growth

MARKETS
The activities in this area of the Workbook (Activities 10 - 12) are designed to
lend greater specificity to your understanding of the markets pursued. You are
encouraged to turn to other sources to help gather the information needed to build
a hypothetical construct of market size. Once this information has been gathered,
include it in items such as your business plan or licensing package.
Background
In this section, we move to a discussion of markets and present a way of
aggregating information about customers. Various dimensions of the market either
contribute heavily to or detract from the commercial potential of the opportunity
at hand. During the past 30 years there has been a steady migration away from the
concept of mass market and toward the concept of niche markets (Webster, 1994). With mass markets, the premise was that one should produce product in large quantities to achieve economies of scale and to provide the mass-produced product to the greatest number of customers. Most customers received a little of what they wanted, and few were totally satisfied. By comparison, the concept of “niche market” focuses on customization and meeting very specific needs of customers.
The shift, then, is away from generic products and toward customer-defined products. The task every company faces is to determine which market niche(s) it will serve. Companies grow their business by focusing on customers and then stepping from one niche to another. Furthermore, “Customer choice shapes the business, which is why customer choice is such a critical strategic decision” (Webster, 1994, p. 96).
Earlier, we spoke about a chain of customers, starting with the entity which purchases directly from you and ending with the customer which makes the ultimate purchase decision. The first question to address is which level of customer do we focus on when sizing the market?
To shed some light on this question, let’s begin by differentiating between consumer and industrial markets (Sandhusen, 1987). Industrial markets consist of all individuals and organizations that acquire good and services used in the production of other products and services supplied to the ultimate customer.
© DAWNBREAKER PRESS, 1998 W O R K B O O K 231

Industrial markets share a number of characteristics. (1) There are fewer buyers than in the consumer market. For example, if you
make a component that can be used in automobiles, there are but a handful of potential direct customers among major automobile manufacturers or automotive assembly manufacturers.
(2) The buyers are larger. The quantity of items that a customer such as Boeing or Motorola might buy could be sizable, i.e., hundreds of thousands of units, versus dozens.
(3) There is a geographical concentration of industrial buyers, with 50% in 10 states. (4) Demand is derived from the purchasing behavior of other customers in the
chain. This is an important point in sizing markets, as you need to size the market from which your immediate customer’s need is derived.
(5) Demand is inelastic, which means that short-term price changes don’t produce disproportionate demand changes.
(6) The demand is more volatile. This means that small changes in consumer demand can result in large changes in industrial demand.
(7) There are professionals involved with purchasing function.
With respect to industrial customer buying behavior, there are three major types of buying situations: (1) a straight rebuy, (2) a modified rebuy, and (3) new tasks. The latter is the arena in which most new technology firms will find their opportunities. A number of decision-makers are involved in such purchase decisions; therefore, it is important to interact with the variety of people that influence such purchase decisions. These include the users of the technology/product, the influencers (such as design engineers, regulators, and the like) and the decision-makers. Factors which are known to affect the ultimate buying decision include product specifications, price, terms and delivery times, service terms, order quantities, payment terms, and whether the suppliers are approved.
If you have a component you wish to license, sell, or distribute to an industrial customer, it is important to understand not only who is involved in the decision-making process, but also what issues are of importance to them. As their demand for what you have will be derived from other customers and end-users in the chain, you will need to size the market as it pertains to the ultimate customer at the end of the chain. In other words, let’s assume that you are looking to sell an MRI component to a company in the manufacturing sector, and you are trying to assess the size of the market opportunity for you. In this case, you will size the market based on the ultimate customer in the chain (the hospital administrators). Likewise, if you sell a software tool that can be used to interface more effectively with the internet, you would size the market opportunity based on the ultimate customer in the chain, i.e., the individuals who make the decision to purchase the software for themselves or their organization. If you sell a device that can be used in clean up of nuclear sites, you size the market based on the ultimate
W O R K B O O K © DAWNBREAKER PRESS, 1998 232

customer in the chain that makes the decision to purchase the technology to be used in the clean up.
Sizing Emerging Markets
Commercial potential increases if one is dealing with emerging or imperfect markets. An emerging market is one which is ready to go through rapid growth in terms of market size; whereas an imperfect market is a pocket of unmet need (niche) within a mature market. Most of you are dealing with emerging markets. One of the dilemmas you will face is estimating your market’s size. Since the market is about to grow, but has not yet grown, how can you size the opportunity? Most technologists, not understanding how to proceed, merely use the most easily defined market and most readily available industry figures and say, “This is the market size.” This is NOT the approach to take, and immediately betrays to a potential investor or ally that you don’t understand what you are doing. Approaching the issue of market size in this fashion often leads to failure because it does not help you understand either the size or the composition of the market niche with sufficient clarity to be able to develop good operational plans for success.
In this section, we will develop an example showing you how to size an emerging market using a market build-up method. Before beginning, though, let’s define a related set of concepts: market, potential market, available market, served available market, penetrated market, and total market demand.
A market is a set of actual and potential buyers. Information about the potential buyer is vital to sizing an emerging market and using the market build-up method.
A potential market is a set of actual and potential buyers who have money and desire to purchase a product with a specific set of price and performance characteristics. Note the relationship between this and the definition of qualified customer.
The concept of available market adds one more descriptor to this definition—access. Access is determined by your marketing communication plan. If there are plenty of fish in pond X, but you fish in dead Pond Y, your catch will be nonexistent, not because there are no fish, but because you have limited access. An available market is a set of actual and potential buyers that have money, desire, and access. It is the set of actual and potential MAD customers.
As indicated by Reis and Trout (1986), “The essence of positioning is sacrifice. You must be willing to give up something in order to establish that unique position.” One of the most difficult things for companies with a rich technology base to do is focus. Technologists tend to be overwhelmed by and sometimes enamored with the possibilities of their technology, and they feel that, by focusing, something will be missed. However, it is important to keep in mind that a niche marketing approach is a sequential process, not a permanently exclusionary one.
© DAWNBREAKER PRESS, 1998 W O R K B O O K 233

The focusing approach leads to better use of resources and greater success. “Just because there are a lot of targets and you’ve got a lot of shot, doesn’t mean that you don’t have to take aim” (Linneman and Stanton, 1991, p. 7).
The concept of penetrated market is different in kind and relates to the extent that you and others have addressed the opportunity.
Total market demand is an expression of the volume that could be purchased by a specified group of real and hypothetical customers within a defined period of time under certain conditions.
If the relationship between these markets is visually represented, you will see the size of the market niche is winnowed down to a more tightly defined and smaller niche. It is represented in dollars or units, on an annualized or total basis. However, annualized figures need to be based on verified data or known trends in that market, rather than as a straight average of the total market demand.
In summary, commercial potential increases with a niche marketing approach if the total market size is above a certain threshold ($100 million or more is a common minimum). You should be cautioned that statements such as “The market is multibillion” make it apparent that you are not using a niche marketing approach. Furthermore, to say that the market is “unknown” betrays that you have not tried to assess the market potential. By contrast, if you have rigorously examined the market potential and it appears that the total market demand is less than a $10 million opportunity, it will be of little interest to most investors and should lead you to re-evaluate the market you are addressing, as well as serve as a catalyst to reexamine the product definition.
Market Segmentation
The process of deciding which market niche(s) to pursue begins with market segmentation. This is a highly dynamic process in which both the features of the product as presently conceptualized and the characteristics of the ultimate buyers are used. The goal is to conceptually define homogeneous groups based on the parameter(s) that you select. The result should be a niche which is substantial in size and can effectively be reached with a designated marketing communications plan.
Segmenting the market appropriately is an art and takes considerable time and effort. Common ways of segmenting market include the following:
◗
◗
◗
◗
◗
◗
◗
Benefits sought Buyer readiness stage Customer size Geography Usage rate Price Type of customer
W O R K B O O K © DAWNBREAKER PRESS, 1998 234

Based on the earlier interaction with potential customers, one begins to segment the market in ways that reflect key features of the interaction; i.e., was price important to the potential customers, and is there a high-end, low-end, and medium group for which various products might be appropriate? Are the more interested customers early adopters and does it make sense to segment one stage of buyer readiness? One segments the markets in various ways, examining homogeneity within the segment, the ability to cost-effectively reach members of that segment, and relative size.
When you segment a market, each segment should be distinct enough that it requires its own marketing communications plan. If you find that one marketing plan would work well with multiple segments, it would be wise to combine them into one segment.
Segmenting the market appropriately is an art, and takes considerable time and effort. Taylor (1986) provides three questions for helping you decide if you have segmented the market appropriately.
(1) Is the segment definable in some operational way? In other words, can you accurately quantify how many customers are in the segment? For example, if you define a market segment by using the following demographic variables (children under five feet tall with freckles), you will probably have difficulty quantifying potential customers in this niche. It is unlikely that you would find any organization sorting data in this fashion, thus making it difficult for me to quantify the size of this market. As a result, this would NOT be a useful segmentation criterion.
(2) Can you reach this segment effectively through affordable advertising? Each segment should be distinct enough that it requires a distinct marketing communications plan. If you find that one marketing plan would work well with multiple segments, it would be wise to combine them into one segment. Keep in mind that affordable advertising can include things such as face to face meetings, conferences, and phone calls. Do not assume that advertising means only print copy.
(3) Is it small enough for you to dominate and large enough to provide good profits? The most common error that companies make is to define their market too broadly. You should aim at specificity and understanding of the market segment you define. Once you have the segment defined appropriately, develop a strategy for becoming a significant player in that niche. Remember that your ability to obtain significant market share begins with your aspirations and operational plans.
© DAWNBREAKER PRESS, 1998 W O R K B O O K 235

W O R K B O O K © DAWNBREAKER PRESS, 1998
Have I answered this question adequately?
Process: Start the segmentation process by looking for commonalities among potential customers. What do they share? Are they all research and development firms? Are they all interested in a specific price range? Are they interested in a specific product characteristic? Are they located in a specific geographic region? Try to be as specific as possible regarding their interests, as expressed to you by these potential customers. Then determine if you can define the market segment in an operational fashion and reach it with cost-effective advertising.
A Market Build-Up Approach: An Example
There are many methods which can be used to derive the size of emerging markets. The method preferred by Dawnbreaker is referred to as a market buildup method. This method yields a hypothetical construct which defines the size of an available market. The data and assumptions used in building the model are clearly articulated, so that anyone can see the method used to derive market size. One starts with commonly available data points and then collects more difficult information to refine the model. In the example which follows, information from the 1994 Statistical Abstract of the United States was used as the starting point and combined with other information gathered from industry experts by phone and from potential end-users (who were also potential customers) in a mall intercept.
One begins the market build-up method with a product concept. In the example which follows, the product is a “warm suit for stranded motorists,” a lightweight piece of outerwear that could be tightly rolled and conveniently stored under one’s car seat in a vacuum sealed bag. The concept is that in a cold weather emergency situation, the driver could pull this out, put it on, and remain warm for an extended period of time. The need addressed was protection from the cold in remote areas. It is assumed that the selling price is $25.95.
The obvious potential market for this product consists of car owners who live in snowy regions. However, after brainstorming regarding other potential end-users, other market segments were suggested, including sports enthusiasts, military, and workers on oil rigs. In most of these cases, the product definition would need to be refined to serve these markets. In our example, the warm suit was designed for one-time use, due to the need to reduce the volume to fit it back into a small, vacuum-sealed bag. The concept would therefore have to be refined to be applicable to other markets.
The decision was made to size the market for automobile use first. The challenge was to define the available market based on money, access, and desire— the criteria mentioned earlier for qualifying potential customers.
236

STEP 1: Determine the size of the market, obtain data from the Statistical Abstract of the United States regarding automobile registration, and tally the number of automobiles registered to people in those states that have considerable snowfall.
Result: 67,611,000 motor vehicle registrations.
STEP 2: Determine what percentage of this group would have a desire for this product. It would be wrong to conclude that by virtue of owning a car and living in a cold climate that one would have a desire for a warm suit. The premise adopted was that those individuals who carry some sort of emergency gear in their car have demonstrated an interest in protection from the cold, and would therefore be potential customers. Various approaches were used to try to get a handle on the size of this subset, including contacting AAA, various other associations, and editors of journals and catalogs that specialize in emergency situations. Ultimately, the decision was to conduct a mall intercept in a number of cities. In the mall intercept, a table was set up at an exhibit and men and women of driving age were asked if they kept cold weather emergency gear in their car. Ten percent of the sample did. Using this data point, we reduced the size of the potential market from 67,611,000 (the registered vehicles in cold climates) to 10% of that, or 6,761,100.
Result: 6,761,000 were inferred to have a desire for product.
STEP 3: Determine what percentage of this group had the money to spend on this product. The Statistical Abstract of the United States includes information on car registration, broken down by age, income, and gender. Given the initial conceptualization of the product—retail price of $25.95—it was assumed that the product would be of greatest interest to those who had an income above $35,000, i.e., others would just use a blanket. Forty-five percent of the sample fit into this category.
The figure obtained previously (6,761,000) was further reduced to reflect income. 6,761,000 x 45% = 3,042,450
Result: 3,042,450 were inferred to have the disposable income to spend. Thus, the potential market size for this niche was 3,042,450 units over the life of the product.
© DAWNBREAKER PRESS, 1998 W O R K B O O K 237

STEP 4: Determine the size of the available market by taking into account access as determined by the marketing communication strategy selected by the company. The firm decided to market this product strictly through catalogs. After talking with industry experts, it was determined that 40% of the relevant income group make purchases from catalogs. The market size was further reduced to take into account the distribution channel selected. 3,042,450 x 40% = 1,216,980 units.
Result: 1,216,980 people were inferred to have access to this product based on their widespread use of catalogs. Thus, the available market size was 1,216,980 units. Translating this number of units into a dollar value was accomplished by multiplying the total number of potential purchasers by the selling price of $25.95 = $31,580,631. Realize that the marketer of this product would then need to determine what might be the annual market for the warm suit and any current or potential competing products. The actual market demand in any given year would be substantially less than $31.5 million, because that figure would exhaust all current, potential buyers in the current U.S. market.
Conclusion
The market build-up method uses a combination of reasonable and clearly articulated data and assumptions to determine the size of a market niche. As you can see, the conclusion is as good as the assumptions made, the product definition, pricing, and the marketing communication plan. A different configuration would yield a different result. In all cases, the conclusion drawn needs to be reasonable, defensible, and clear.
A common mistake that would be made by most entrepreneurs—namely, in sizing the market for warm suits, would be to begin and end with finding the number of people that have cars in areas with heavy snow (67,611,000 ) and falsely conclude that the market size was $25.95 x 67,611,000 = $1,754,505,450. The market build-up method requires that the user examine the issues of desire, money, and access, and size the market in light of those factors.
Common Errors
When sizing markets, a number of common mistakes are made. The most common is to take a dollar value ascribed to an industry and to use that figure to represent the size of your market.
W O R K B O O K © DAWNBREAKER PRESS, 1998 238

Example 1: A company that manufactures a sensor quotes the dollar value of the entire instrumentation market as the size of its market. If you manufacture a component that can only be used in one family of instruments, you must conceptually limit your market to the dollar value associated with the use of that component.
Example 2: If you have a device which can be used to remove heavy metals from a waste stream, the size of your market is that subset of actual and hypothetical customers which have the specific problem that you can address. Do not cite the dollar value for the entire environmental remediation market as your market.
Example 3: If you produce a software package on topic X, your market size is limited by the content scope of the software and the customer it targets. Do not cite the dollar value spent in the U.S. on all software as the size of your market.
Example 4: If you have a combustor that can be used with generators of a certain size, your market is limited to generators of a specific size. Do not indicate that the size of your market is equal to the entire power grid of the U.S. times a certain price per kilowatt.
© DAWNBREAKER PRESS, 1998 W O R K B O O K 239

W O R K B O O K © DAWNBREAKER PRESS, 1998 240
A C T I V I T Y 10 Market Segmentation
The process of segmenting your market provides focus for your marketing commu
nications strategies and also serves as a means of obtaining a clearer understanding
of your market. An excellent resource to examine in this regard is Competitive
Marketing Strategies, by James W. Taylor (1986).
Activities and background:
Using the form on the next page, indicate which descriptor(s) you will use to seg
ment this market, as well as the rationale for segmenting in that fashion.
Have I answered this question adequately?
Results: Your goal is to produce a description of the market segment you will pur
sue. Indicate the approach that you will follow to determine the size of that seg
ment and to locate potential customers. Then, clarify the types of communication
vehicles that can be used to reach this segment cost-effectively.

A C T I V I T Y 10 W O R K S H E E T
WORKSHEET: ACTIVITY 10: MARKET SEGMENTATION DATE_________/____________/______________
INSTRUCTIONS: Use this section to help you think through the best way to segment your market.
1. Segmentation criteria: Based on your interaction with potential customers, end-users, and industry experts, indi
cate the criteria that you will use in segmenting the market, as well as the rationale for segmenting in this fashion.
2. Availability of data in this format? In order for segmentation to be useful, data must be available to support
your segments.
3. Does the method of segmentation appear to result in a market segment that you can dominate within five
years? At this point, you may not have formally addressed the issue of market size. However, you should have an
impression as to whether or not the market is segmented in such a way that you could become familiar enough with
the players and the dynamics to become a dominant player. Justify your answer in the space provided below.
© DAWNBREAKER PRESS, 1998 W O R K B O O K 241

A C T I V I T Y11 Market Size
Market size refers to the potential of a market in dollars, units, or in a specific time
frame. This concept is applied to the segment(s) for which your product is appropri
ate. The appropriate segment was determined from analyzing the feedback you
obtained from talking to potential customers. Keep in mind that market size is not synonymous with sales projections. Market size represents all possible sales that could be made by all suppliers that can address the need of potential and actual customers.
When sizing the market, it is important to differentiate the difference
between the total potential market and the served available market. The served
available market defines the market segment or niche in which your company will
be operating in more precise terms. This precision enables your company to isolate
the market area in which it can aim at becoming a dominant player. By contrast, the
total potential market is the larger, related market in which your company is operat
ing. For example, if a company produces heaters, the total market would be the
heater market, defined in heater units and accompanying dollar value. However, if
the company produces a heater with specific product characteristics, i.e., a small
heater that produces 300 BTUs, those product characteristics come to define the
served available market. In other words, this product competes within a subset of
the total potential market. The company’s product does not compete with all
heaters in the market. The subset defines the served, available market and is the
market niche of interest (small heaters producing 300 BTUs).
W O R K B O O K © DAWNBREAKER PRESS, 1998 242

Activities and background
It is often difficult to obtain exact numbers on the size of the market. This
problem is amplified if the product is new. The first place to start in trying to
determine market size is to contact various sources to see if someone else has
already compiled these statistics. Assuming that they have not, proceed with using
a market build-up method. However, you may initially find it useful to contact
some of the following sources:
Associations: The Encyclopedia of Associations is an extremely valuable resource,
found in most libraries. This three-volume set is produced annually and contains an
index and two accompanying volumes. There are associations for almost every item
imaginable. Every entry provides the name of the association, its services, member
ship, and a contact person. The association will indicate if it collects statistics. If it
does collect statistics, call the contact person and inquire if they cut the data in the
manner of interest to you (your segmentation technique).
Regional Technology Transfer Centers (RTTC): Many of the NASA RTTCs will conduct
on-line searches for you at reduced rates. Searches are done with key words, using
Boolean logic. You could request a search on “market size” of a specific item. Ask
for a price and time of delivery quote.
Journalists and Futurists: Another way to obtain information is to contact journalists
and futurists that have written articles on the industry in question. When you find a
valuable article, contact the editor and ask him to provide you with the phone num
ber of the author. Contact the author and see if he has come across any information
on the “market size.”
© DAWNBREAKER PRESS, 1998 W O R K B O O K 243

Findex—The Directory of Market Research Reports, Studies, and Surveys: This resource
is found in most large libraries and lists published market research reports. For the
most part, the reports are quite expensive. However, if you find the name of a
research report of interest, you can contact specialty libraries in your area and see if
they have a copy that they will let you see. Corporate libraries are the most likely to
have such reports. (Bob Berkman, the author of Find It Fast ((1990)), has various
tips for talking with experts and for gaining access to specialty libraries. These are
described in his book.)
Have I answered this question adequately?
Process: Consult the data sources above to try and obtain published estimates on
the size of the market. If these data are not available, you will have to infer the size
of the market from data you collect on potential customers; for example, informa
tion regarding their buying habits and price point. Markets are ideally expressed as
annual figures indicating the number of units that might be purchased by the cus
tomer base from all sources and the associated dollar value.
Result: The goal is to size the market. Have you defined the following?
(1) The total potential market
(2) The served available market
W O R K B O O K © DAWNBREAKER PRESS, 1998 244

A C T I V I T Y W O R K S H E E T 11WORKSHEET: ACTIVITY 11: MARKET SIZE DATE_________/____________/______________
INSTRUCTIONS: The following is a series of prompts to use in defining the size of a market utilizing a market
build-up method.
(1) Based on the interaction you had with potential customers, define the type of individual or organization
that should have a need for your technology, product, or service. Assure that your definition contains within
it an implicit way of gathering information regarding the number of entities with said characteristic.
(2) What data can you find which indicates the number of entities with that characteristic? Add pages and
provide supporting data.
(3) In addition to the data collected, what assumptions have you made which are not supported by data, but
are necessary to develop your hypothetical construct?
(4) What is the selling price of your product, technology, or service? On what do you base the assumption
that this selling price will be acceptable?
© DAWNBREAKER PRESS, 1998 W O R K B O O K 245

246 W O R K B O O K © DAWNBREAKER PRESS, 1998
A C T I V I T Y12 Market Growth
Conditions that affect the rate of growth in a market change. Such conditions
include changes in demographics, technology, regulations, and other economic con
ditions. In predicting the rate of growth in your company’s business, it is important
to consider the various trends affecting the rate of market growth.
Activities and background
North American Industry
Classification System, United
States Department of
Commerce, 1997.
Industry journals and associations continue to be among the most valuable
resources used to detect market trends in advanced technology. The Encyclopedia of
Associations, a reference found in most libraries, is commonly used to find the names
of many contacts and sources of data.
In seeking market information, one piece of information that will prove
useful is the pertinent Standard Industrial Classification (SIC) codes. In 1997, this
system was replaced by the North American Industrial Classification System
(NAICS). However, as SIC codes are ubiquitous, the Department of Commerce
maintains SIC-NAICS conversion tables on its website. SIC/NAICS codes function
as keys unlocking vast stores of information housed in databases. This numbering
system is referenced widely and provides a fairly easy way to cut through vast
amounts of data. Given that you are working with fairly new technologies, you may
not be able to find a SIC/NAICS code that exactly fits your specialty. You may have
to move up to a broader class. For example, if your product is a warm suit, you
would not expect to find a SIC/NAICS for this one-of-a-kind product. However, a
warm suit is an example of protective clothing, emergency gear, or outerwear. You
could start by looking for a SIC/NAICS code to cover this broader category.

A C T I V I T Y 12 W O R K S H E E T
WORKSHEET: ACTIVITY 12: MARKET GROWTH DATE_________/____________/______________
INSTRUCTIONS:Use the space below to compile information related to the rate of market growth. Add additional
sheets as required.
(1) What is the appropriate SIC/NAICS Code? Verify your selection by comparing it with that used by known
competitors.
(2) Contact industry experts associated with the Department of Commerce and/or with appropriate
Associations to determine if they collect information by that SIC. Ask if they have collected information on
future market projections for the SIC in question.
(3) Find another company that is approximately five years older than yours within the same industry. As a
sensitivity check, benchmark rate of ramp up for them.
© DAWNBREAKER PRESS, 1998 W O R K B O O K 247

Competitors
4
Related Activities:
Activity 13a and 13b: Who are Your Competitors?
Activity 14: Implications of Competitor Information

COMPETITORS
The activities in this area of the Workbook (Activities 13 - 14) are to help you
compile information about your competitors and consider the implications of
this information for your commercialization strategy and business plan.
© DAWNBREAKER PRESS, 1998 W O R K B O O K 251

A C T I V I T Y 13 Who are the competitors in this market?
Every company has competitors that are already operating within the market seg
ment of interest. Your resources and skills relative to the other players will affect
how profitable your business will be.
Activities and background
Various resources can be consulted to determine who your competitors are. The
most common include the following:
1. Industry journals, local newspapers, customers, suppliers, and trade associations.
2. The Thomas Register of American Manufacturers is a large comprehensive set owned
by most major libraries. It is updated annually, and lists manufacturers’ names,
addresses, and phone numbers. Information is organized alphabetically by
product. This is an excellent starting place.
3. Ward’s Business Directory of US Private and Public Companies provides a listing
of the public companies with largest sales sorted by SIC/NAICS code.
4. Dialog: When looking for more obscure information and/or information on a
global basis, Dialog is extremely useful. This searching process can be expensive.
5. High-Tech Directory: This resource lists over 800 publicly-traded companies
specializing in innovative technology. To obtain a list, contact:
Barrington Research Associates
P.O. Box 860
Barrington, IL 60010
(708) 382-7788
Have I answered this question adequately?
Process: Examine the preceding references for information on competitors and
begin to develop competitive files on each.
Results: The goal is a list of major competitors, including company name, address,
and phone number. Group these by SIC/NAICS codes.
W O R K B O O K © DAWNBREAKER PRESS, 1998 252

A C T I V I T Y W O R K S H E E T13A WORKSHEET: ACTIVITY 13A: COMPETITORS DATE_________/____________/______________
INSTRUCTIONS: Use the summary sheet below to compile information on competitors. Add additional pages
as needed.
SIC Competitor’s Name
Address Phone Number
© DAWNBREAKER PRESS, 1998 W O R K B O O K 253

What are the current characteristics of these competitors?
This activity relates to expanding your customer files. In Activity 13a, you were
asked to pinpoint who your competitors are. This activity helps you determine what
types of information you should collect about your competitors. Analyzing your
competitors’ strengths and weaknesses helps you to take a more realistic look at
your own organization and develop sound strategies for success.
Activities and background
The information you can obtain on competitors depends to a large extent on
whether they are privately owned or publicly traded. Considerably more informa
tion is available on publicly traded companies. Leonard Fuld’s book Monitoring the
Competition (1988) provides many helpful hints on how to build up good data files
on your competitors.
If the company is publicly owned, you can request an annual report, 10-K,
8-K, and 10-Q, from the Securities Exchange Commission. If the company is pri
vately owned, the task is more difficult. However, you can develop good data from
news articles, product literature and catalogs, price lists, and market studies, all of
which may be available on the Web.
All of this information should be compiled in competitor files.
Have I answered this question adequately?
Process: Obtain more complete data on your competitors, in accordance with the
suggestions listed above. In subsequent chapters you will be instructed to analyze
the data you are now beginning to collect.
Results: The goal is a list of the competitor files that you have and what data your
files contain: 10-K, 8-K, 10-Q, prospectus, annual reports, news articles, product lit
erature, catalogs, price lists, and market studies.
W O R K B O O K © DAWNBREAKER PRESS, 1998 254

■
■
■
■
■
■
■
■
■
■
■
■
■
■
■
■
■
■
■
■
■
■
■
■
■
■
■
■
■
■
■
■
■
■
■
■
■
■
■
■
■
■
■
■
■
■
■
■
■
■
■
■
■
■
■
■
■
■
■
■
■
■
■
■
■
■
■
■
■
■
■
■
■
■
■
■
■
■
■
■
■
■
■
■
■
■
■
■
■
■
■
■
■
■
■
■
■
■
■
■
■
■
■
■
■
■
■
■
■
■
■
■
■
■
■
■
■
■
■
■
A C T I V I T Y W O R K S H E E T13B WORKSHEET: ACTIVITY 13B: COMPETITORS DATE_________/____________/______________
INSTRUCTIONS: : Use the summary sheet below to act as both a prompt and a place to compile information regard
ing competitors. Much more information is available for publicly traded companies. Add additional pages as needed.
Competitor Name____________________________________________________Public?________ Private?_______
Prospectus
10K
10Q
8K
Annual Report
Price Lists
Market studies
Newspaper clippings
Articles
Catalog
Internet info
Patents
Competitor Name____________________________________________________Public?________ Private?_______
____________________________________________________ ________ _______
______
______
____________________________________________________ _______ _
__________________________________________________ ________ _
© DAWNBREAKER PRESS, 1998 W O R K B O O K 255
Prospectus
10K
10Q
8K
Annual Report
Price Lists
Market studies
Newspaper clippings
Articles
Catalog
Internet info
Patents
Competitor Name Public? Private?
Prospectus
10K
10Q
8K
Annual Report
Price Lists
Market studies
Newspaper clippings
Articles
Catalog
Internet info
Patents
Competitor Name Public?_ Private?
P rospectus
10K
10Q
8K
Annual Report
Price Lists
Market studies
Newspaper clippings
Articles
Catalog
Internet info
Patents
Competitor Name_ _Public? Private?
Prospectus
10K
10Q
8K
Annual Report
Price Lists
Market studies
Newspaper clippings
Articles
Catalog
Internet info
Patents

A C T I V I T Y14 Implications of Competitor Files
The purpose of developing good competitor files is to anticipate what your com
petitors are likely to do when you enter the marketplace with a new product that
eats away at their market share. At the point of market entry, chess or war analogies
are often used. It is important to keep in mind that the purpose of making a prod
uct entry is to gain market share and create value. This is always done at another
company’s expense. Some company will lose market share as you gain. Even in
those instances where you come to market first and are developing a market, your
presence in the marketplace first often makes it more difficult for other companies
to replace you.
Once you have gathered competitor files, review the information looking
specifically at issues such as the following:
◗
◗
◗
◗
◗
how financially stable your competitors are
what their pricing policies have historically been
their research and development plan
strategic alliances formed
distributors used
Then ask yourself what your competitors are likely to do when you enter
the marketplace—drop their price, increase advertising, enhance customer service,
buy a competitor to gain greater access to the marketplace, etc. Use this information
when developing your marketing and sales plans, and your contingencies—all of
which are part of your business plan.
256 W O R K B O O K © DAWNBREAKER PRESS, 1998

A C T I V I T Y 14 W O R K S H E E T
WORKSHEET: ACTIVITY 14: IMPLICATIONS OF COMPETITOR FILES
DATE_________/____________/______________
INSTRUCTIONS: This worksheet contains a list of prompts for you to use when reviewing competitor files. We have seen so many companies just collect information and never do anything with it. Set aside time for your management team to review competitor files and discuss the implications for your evolving strategies and business plan. Add additional pages as needed.
Competitor ________________________________________________________________________________________
Financial stability of competitor:
Pricing policy:
Research and development plan:
Strategic alliances formed:
Distributors used:
Other:
© DAWNBREAKER PRESS, 1998 W O R K B O O K 257

Conclusion
The purpose of the Advanced Technology Program’s Commercialization and
Business Planning Guide for the Post-Award Period is to provide assistance to
new ATP awardees and their advisors. The book is divided into three sections.
Section 1 presents basic concepts concerning financing options, with detailed infor
mation on licensing, corporate partnering, and equity investment. Section 2 is an
annotated sample presentation to investors. Section 3 is a workbook to be used
by the technology entrepreneur on his own or with the guidance of an experienced
advisor. For maximum benefit, it is recommended that you seek the involvement
of an experienced and motivating mentor. The results of the various activities
completed should be synthesized and incorporated into a variety of documents that
become part of your Commercialization ToolkitTM. Suggested outlines for the vari
ous documents that you are likely to need in the commercialization of your technol
ogy are included at the end of various chapters in Section 1 and throughout Section
2. These include:
◗
◗
◗
◗
Strategic plan
Licensing package
Business plan
Presentation
Scientists and engineers who are founders of their own companies can
develop the necessary skills to successfully guide the growth of their firms. This
requires dedication, however, since time for planning must be added to an already
busy schedule. The information and the activities included in this workbook will
assist in this endeavor.
W O R K B O O K © DAWNBREAKER PRESS, 1998 258

Section 4 I N D E X A N D B I B L I O G R A P H Y
Section 4IN
DE
X A
ND
BIB
LIOG
RA
PH
Y

INDEX
A ACE-Net, 95
AdvancedTechnology Program (ATP), 5-7
B Borrowing
- from family and friends, 24
- from banks, 24
Bridge financing, 31
Business angels, 29
Business Opportunity Preview, 79-80
Business plan, 102
- Distribution protocols, 112
- Getting feedback on the draft, 110
- Revising the plan, 111
- Scope, 102
- Difference between business plan
and prospectus, 103
- Using the business plan, 112
Business plan outline (Detailed), 106-109
Business plan outline (General), 105
Buyer behavior, 226
C Cashing out, 33
Commercialization strategy, 37, 209
Corporate partnering, 85
Customers, 224
D Debt financing, 22
Distribution agreement, 86
Downstream applications, 50
E Early stage financing, 31
End-users, 224
Equity financing, 27
Equity investment in parent company, 42
Equity investment in spin-off, 43
Executive summary, 110
Exit scenarios, 33
External value of business plan
F Features, Advantages, & Benefits, 222
Factor, 25
Foundation company, 17
H High-potential venture, 17, 18
I Industry experts, 219
Initial Public Offering (IPO), 27, 30, 45,100
Institutional venture capital, 29, 96
Intellectual property, 198
Internal value of business plan, 114
Interviews, 220
Investment bankers, 27
J Joint ventures, 88
© DAWNBREAKER PRESS, 1998 I N D E X 261

L Leasing, 26
Leveraged buy-out, 32
Licensing, 63
Licensing-in, 64
Hybrid licensing agreement, 71
Multimedia license, 71
Product license, 70
Software license, 72
Licensing with developmental funds, 38
Licensing package, 79
Licensor, 70
Licensor title, 66
Life-style firm, 17
M Manufacturing Agreement, 87
Market build-up method, 236
Market growth, 246
Market segmentation, 234
Market size, 242
Mass markets, 231
Mezzanine financing, 31
Mission, 204
N Negotiation issues, 84
Niche markets, 231
P Personal philosophies, 37
Presentation materials, 117
Private placements, 27
Provisional patent application, 198
R R&D Agreement, 86
Receivable lending institutions, 25
Regulation D, 97
Return on Investment, 33
Royalty rates, 69
S Securities Exchange Act of 1933, 97
Seed financing, 31
Small Business Innovation Research, 21
Start-up financing, 31
Strategic alliances, 40, 86, 206
Strategic fit, 64
Strategic plan, 55
Supplier credit, 27
Sweat equity, 19-20
Sustainable competitive advantage,49,200
T Technology partitioning, 53
U Upstream applications, 50
V Venture capital, 96
Vision, 202
I N D E X © DAWNBREAKER PRESS, 1998 262

BIBLIOGRAPHY
Abernathy, W.J. and Utterback, J.W. Patterns of Industrial Innovation.
Technology Review. January/July 1978. Vol 80, Issue 7, pp. 40-47.
Andonian, Joseph. Environment Changing in Pharmaceuticals. Les Nouvelles, Vol 24,
No 2.
Arkebauer, James. The Entrepreneur’s Guide to Going Public. Dover, New
Hampshire: Upstart Publishing Company, 1991.
Badaracco, Jr., Joseph L. The Knowledge Link:How Firms Compete through Strategic
Alliances, Boston: Harvard Business School Press, 1991, p.4.
Barrett, E. Thorpe. Write Your Own Business Contracts: What Your Attorney Won’t
Tell You. Grants Pass: The Oasis Press, 1994.
Bianchi, Alessandra. Learning to Live with (or Without) Your Banker. Inc, March 1995,
pp. 32-42.
Blechman, Bruce and Levinson, Jay Conrad. Guerrilla Financing: Alternative
Techniques to Finance and Small Business. Boston: Houghton Mifflin Company,
1991.
Epstein, Michael A and Politano, Frank L. Drafting Licensing Agreements.
Englewood Cliffs, NJ: Aspen Publishers, 1995.
Fordis, Jean Burke and Griffen, Susan Heberman. Avoiding Traps in Licensing
Biotechnology . Les Nouvelles. Vol 26 No 2.
Garner, Daniel; Owen, Robert, and Conway, Robert. The Ernst & Young Guide to
Financing for Growth. New York: John Wiley & Sons, 1994.
Goldscheider, Robert. Companion to Licensing Negotiations: Licensing Law
Handbook 1993-94. Deerfield, Il: Clark, Boardman, Callaghan, 1993.
Greeley, Paul D. Effective License Negotiating Techniques. Les Nouvelles. Vol 25 No 1.
© DAWNBREAKER PRESS, 1998 B I B L I O G R A P H Y 263

Hamel, Gary; Doz, Yves, L.; and Prahalad, C.K. “Collaborate with Your
Competitors—and Win,” Harvard Business Review, January-February, 1989,
pp. 133-139.
Hanan, Mack. Growth Partnering: How to build your company’s profits by building
customer profits, Anacom, 1992.
Harrigan, Kathryn Rudie. Strategic Alliances: Their New Role in Global Competition.
Columbia Journal of World Business, 22.2 (Summer, 1987), pp. 67-69.
Hess, Robert P. Desk Book for Setting Up a Closely Held Corporation.
Englewood Cliffs: Institute for Business Planning, 1985.
Heuss, Valentin and Jolly, Vijay. Commercializing Multifaceted Technologies.
Les Nouvelles. Vol 25.No 2.
Hisrich, Robert D. and Peters P., Michael. Entrepreneurship: Starting, Developing,
and Managing a New Enterprise. Homewood, IL: BPI, 1989.
Linneman, Robert E. and Stanton, Jr., John L. Making Niche Marketing Work.
New York: McGraw-Hill, 1991.
Manfroy, Willy, Patterson, William and Staackmann, Joachim. Technology Acquisition
Process. Les Nouvelles. Vol 24 No 4
Ohmae, Kenichi. The Global Logic of Strategic Alliances. Harvard Business Review,
March-April, 1989, pp. 143-155.
Parr, Russell L. Insights Into Royalty Rate Economics. Les Nouvelles, Vol 25.No 2
Poole, Shiela M. New Biotech Venture: Project could spur flow of venture capital incuba
tor’s program part of plan. The Atlanta Constitution; Atlanta, GA, August, 14, 1998.
Radcliffe, Mark F and Clowes, Howard. Issues in Strategic alliances. Les Nouvelles.
Vol 26, No 3.
Raising Capital: How to Borrow from Family and Friends. Inc. July, 1995, p 99.
Ries, Al and Trout, Jack. Positioning: The Battle for Your Mind, New York: Warner
Books, Inc., 1981.
B I B L I O G R A P H Y © DAWNBREAKER PRESS, 1998 264

Sandhusen, Richard L. Marketing. Barron’s Educational Series, Inc.
New York, 1987.
Servo, Jenny. Business Planning for Scientists and Engineers. Rochester, NY,
Dawnbreaker Press, 1999.
Servo, Jenny. Developing Indicators of Commercial Potential. Rochester, NY,
Dawnbreaker Press, December 1995.
Servo, Jenny & Hauler, Paul. Knock their Socks Off: Making Winning
Presentations to Investors. Rochester, NY, Dawnbreaker Press, 1993.
Smedinghoff, Thomas J. Multimedia Legal Handbook: A Guide from the Software
Publishers Association. New York, NY, Aspen Law and Business, 1998.
Swisher, Kara. Venture Capital Investments Surged to High in Quarter. Wall Street
Journal, New York, August 17, 1998.
Taylor, James W. Competitive Marketing Strategies: An action plan for achieving
market leadership. Radnor, PA: Chilton Book Co., 1986.
Teece, David. Capturing value from Innovation . Les Nouvelles. Vol 26, No 1.
Thomsett, Michael C. The Little Black Book of Project Management. Amacom,
1990.
Tuller, Lawrence W. The Small Business Valuation Book. Holbrook, MA: Adams
Media Corporation,1994
U.S. Bureau of the Census, Statistical Abstract of the United States:
1994 (114th edition.) Washington, DC, 1994.
Villeneuve, Thomas F, Gunderson Jr., Robert V., and Kaufman, Daniel M.
Corporate Partnering: Structuring and Negotiating Domestic and International
Strategic Alliances. Aspen Law & Business, 1995.
Webster, Frederick. Market-Driven Management: Using the New Marketing Con
cept to Create a Customer-Oriented Company. New York: John Wiley & Sons, 1994.
Wetzel,William and Hughes, Frank. 1989 SBIR Conference presentation. Washington,
DC, 1989.
© DAWNBREAKER PRESS, 1998 B I B L I O G R A P H Y 265