how industrial-organizational psychologists can contribute to
Upload
independentCategory
view
1download
0
SAGE-Hindawi Access to ResearchInternational Journal of Alzheimer’s DiseaseVolume 2011, Article ID 654794, 9 pagesdoi:10.4061/2011/654794
Research Article
Combining Transcranial Magnetic Stimulation andElectroencephalography May Contribute to Assessthe Severity of Alzheimer’s Disease
Petro Julkunen,1 Anne M. Jauhiainen,2 Mervi Kononen,1, 3 Ari Paakkonen,1
Jari Karhu,4, 5 and Hilkka Soininen2, 6
1 Department of Clinical Neurophysiology, Kuopio University Hospital, POB 1777, 70211 Kuopio, Finland2 Department of Neurology, Institute of Clinical Medicine, University of Eastern Finland, 70211 Kuopio, Finland3 Department of Clinical Radiology, Kuopio University Hospital, 70211 Kuopio, Finland4 Nexstim Ltd, 00510 Helsinki, Finland5 Department of Physiology, Institute of Biomedicine, University of Eastern Finland, 70211 Kuopio, Finland6 Department of Neurology, Kuopio University Hospital, 70211 Kuopio, Finland
Correspondence should be addressed to Petro Julkunen, [email protected]
Received 30 December 2010; Revised 3 March 2011; Accepted 13 March 2011
Academic Editor: Fabio Ferrarelli
Copyright © 2011 Petro Julkunen et al. This is an open access article distributed under the Creative Commons Attribution License,which permits unrestricted use, distribution, and reproduction in any medium, provided the original work is properly cited.
Alzheimer’s disease (AD) is the most common form of old age dementia, and mild cognitive impairment (MCI) often precedesAD. In our previous study (Julkunen et al. 2008), we found that the combination of transcranial magnetic stimulation (TMS) andelectroencephalography (EEG) was able to find distinct differences in AD and MCI patients as compared to controls. Here, wereanalyzed the small sample data from our previous study with the aim to test the sensitivity of the TMS-EEG characteristics todiscriminate control subjects (n = 4) from MCI (n = 5) and AD (n = 5) subjects. Furthermore, we investigated how the TMS-EEGresponse characteristics related to the scores of the dementia rating scales used to evaluate the severity of cognitive decline in thesesubjects. We found that the TMS-EEG response P30 amplitude correlated with cognitive decline and showed good specificity andsensitivity in identifying healthy subjects from those with MCI or AD. Given the small sample size, further studies may be neededto confirm the results.
1. Introduction
Alzheimer’s disease (AD) is a neurodegenerative disorderwhich leads to dementia through a progressive cognitivedecline. In Europe, AD affects over 5% of population agedabove 70 years [1]. This makes it the most common cause ofdementia in old age. It has been postulated that the impair-ment of the lateral cholinergic pathway originating from theMeynert’s nucleus would characterize AD and contributesto its typical symptom of memory loss [2, 3]. AD-relatedpathology leads to the degeneration of the large corticalpyramidal neurons [4], and subsequently impairment offunctional connectivity takes place [5]. Before the diagnosisof AD can be set, subjects often suffer from impaired episodicmemory [6]. The stage characterised by mild memory orother cognitive loss is called mild cognitive impairment
(MCI), and it has been proposed as a prodromal state of AD.Thus, subjects with MCI have an increased risk to developAD [7–9]. Understanding the pathophysiology of MCIwould be essential for predicting and possibly in the futurepreventing the development of AD. It is possible that alteredfunctional connectivity precedes structural changes, andtherefore, a sensitive method to detect those early functionalchanges would be useful in the diagnostics of MCI and AD.Early identification of AD would be desirable, as it could helpaiming the current treatment to the appropriate subjects.With the prospects of obtaining treatments that modify thecourse of AD, accurate identification of subjects who willdevelop AD is essential.
Earlier it has been shown that the primary motor cortexexperiences changes during the development of AD, whichalso relate to the severity of the disease [10]. Structural

2 International Journal of Alzheimer’s Disease
changes in M1 are mild and appear late as compared toother brain areas, and therefore, motor function also appearsintact in early AD [11–14]. Several earlier TMS studieshave found that AD patients have reduced resting motorthreshold (MT) of the primary motor cortex [3, 15–21].Alagona et al. reported that the resting MT correlatesinversely with the disease severity [15]. This implies thatthe inhibitory control is reduced in AD, which is alsosupported by reported shortening of cortical silent period[21]. Additionally, previous studies have reported reductionin short-latency afferent inhibition (SAI) in AD [18, 22–24].SAI has been considered as a marker of central cholinergicactivity [25] and is likely of cortical origin [26, 27]. Hence,motor cortex functions, especially intracortical inhibition,suffer during the development of AD. Earlier, Sakuma et al.[23] showed that SAI is not impaired in MCI, suggesting thatthe cholinergic activity shown to be impaired in AD may stillbe normal in MCI. Several studies have been conducted tosolve this question and supporting as well as contradictingresults have been published [28–31]. Hence, the cholinergicchanges related to MCI should be interpreted carefully, as thecholinergic regulation in MCI is still unclear. Furthermore,in AD, there is a tendency towards a reduced short-latencyintracortical inhibition (SICI), a different form of inhibitionevoked by using paired-pulse TMS [3, 18, 19]. SICI has beenconnected with intracortical GABAA activity [32].
Combining TMS with electroencephalography (EEG)offers a direct noninvasive method to study cortical reactivityand connectivity in physiological and pathological condi-tions [33–38]. Previously, we have shown that TMS-EEG canreveal abnormalities in functional cortical connectivity andreactivity in the AD subjects [39]. Our main finding was thatthe P30 response of TMS-EEG was significantly reduced inAD as compared to controls and MCI, and that the reductionwas localized to the ipsilateral temporoparietal area as wellas contralateral frontocentral area, that is, sensorimotorarea, connected to M1. In the past, TMS-EEG response,when focused on M1, has been shown to exhibit severaldistinguishable peaks: N15, P30, N40, P60, and N100 [33,35, 36, 38, 40–43]. Prior studies have related the early peaksN15 and P30 to the M1 activation. P30 has been suggested toreflect activity around the premotor cortex on the stimulatedside, and it has been reported that P30 may increase dueto long-term potentiation induced by repetitive TMS [41].Furthermore, P30 has been suggested to involve pathwaysbetween subcortical structures such as thalamic nuclei orbasal ganglia and cortex [40]. Also, P30 has been shownto vanish with nonoptimal orientation of the stimulationcoil in respect to the cortical structures [40]. Therefore, theuse of neuronavigation in combination with TMS allowscontrolling of the stimulation direction in respect to thesubject’s brain anatomy and results in optimized motorresponses [44], and likely optimized TMS-EEG responses.
We wanted to investigate subject-specific differences inintracortical connectivity between healthy subjects, and MCIor AD patients. We utilized and reanalyzed our previouslypublished data [39], which indicated that especially the P30amplitude of the TMS-EEG response could be decreasedin AD. We further evaluated the sensitivity of the P30
amplitude changes in discriminating healthy subjects fromthose exhibiting cognitive impairment (MCI and AD). Fur-thermore, we tested whether P30 amplitude would directlyrelate to commonly categorizing scores of dementia ratingscales. On the basis of the findings of our previous study, wehypothesized that P30 amplitude would decline as the diseasebecomes more severe and correlate with the dementia ratingscales.
2. Materials and Methods
2.1. Subjects. In the present study, our previously publisheddata was further analyzed. A small size sample includingfour control subjects (age: 78 ± 3 years, 3 females, 1 male),five MCI subjects (age: 74 ± 8 years, 2 females, 3 males),and five AD subjects (age: 73 ± 8 years, 2 females, 3males) was recruited for the original study. All subjects wereright handed. Each subject gave written informed consent,and the study was approved by the local ethics committee.Categorizing of these subjects to their groups was done basedon a standard rating [45] and is explained in more detailin the original paper [39]. Briefly, the MCI subjects fulfilledthe following characteristics [7]: (1) subjective memoryimpairment corroborated by an informant, (2) objectivememory impairment, that is, a score of 0.5 in the clinicaldementia rating (CDR) scale [45] with at least 0.5 on thememory subscale and a score of 1.5 SD below the averageof a normative age-matched sample group in at least onememory test, (3) normal global cognitive function (Mini-Mental-State Examination score (MMSE) of at least 20[46]), (4) normal activities of daily living, and (5) nodementia according to the NINCDS-ADRDA criteria [11].The MCI subjects were classified as multidomain amnesticMCI [47]. Diagnosis of AD was made according to theNINCDS-ADRDA criteria for probable AD [11]. All theAD patients were on cholinesterase inhibitors, while othersubjects had no medication affecting cognition at the timeof measurements.
2.2. Measurement System and Protocol. Navigated TMS wasused to probe the motor cortex of the subjects (Figure 1),that is, the primary motor cortex (M1) of the subjects wasmapped for the representation area of the thenar mus-culature of both hands. The stimulation system consistedof a Magstim BiStim stimulator (Magstim Ltd., Whit-land, UK) and a 70 mm figure-of-eight TMS coil with mono-phasic pulse form. Stimulation-triggered EEG responseswere recorded with 1450 Hz sampling frequency and 16 bitprecision using a 60-channel TMS-compatible EEG amplifier(Nexstim Ltd., Helsinki, Finland). Navigation of the TMSsystem utilized T1-weighted 3D magnetic resonance images(imaged with Siemens Magnetom Avanto, Siemens, Erlan-gen, Germany). The navigation was conducted using eXimianavigation system (version 2.0, Nexstim Ltd., Helsinki,Finland). Resting state MT at the “hotspot” was deter-mined using a threshold-hunting protocol [48]. For measur-ing TMS-induced muscle responses, electromyography wasrecorded (ME6000, Mega Electronics Inc., Kuopio, Finland)

International Journal of Alzheimer’s Disease 3
Anterior
Posterior
Right Left
Figure 1: Motor cortex representation area of a control patient.TMS was focused at the “hotspot” of thenar muscle representationon the primary motor cortex (M1). The yellow dots presentstimulation locations during the mapping of the hotspot in thevicinity of M1. The red spots indicate the hotspots, which werelocated within normal variation in each group [57].
from the opponens pollicis muscle using pregelled disposableAg-AgCl surface electrodes. TMS-induced EEG responseswere recorded from >50 trials elicited with an interstimulusinterval of 3–5 s with a stimulation intensity of 110% of thedetermined MT. For a more thorough system description, thereader is referred to our previous paper [39]. Both hemi-spheres were separately investigated, and the stimulationorder of the hemispheres was randomized.
2.3. Analysis of TMS-EEG. The offline analysis of EEG wasperformed using Matlab 7.2 (Mathworks Inc., Natick, MA).Zero padding for 10 ms after the TMS pulse was appliedto dampen the TMS-induced artefact. Segmented EEG wasbandpass filtered to 1–50 Hz. Any segments contaminatedby blinks, as observed from vertical electro-oculogram, wereremoved from the analyses. Also, in some cases, a badchannel signal due to poor contact was replaced with a signallinearly interpolated from the neighbouring good channels.Manual artefact removal was conducted, prior to rereferenc-ing all electrodes to common average. Baseline correctionfor 100 ms before each stimulus was conducted prior toaveraging the segments. Averaged TMS-EEG responses overall trials were used in the statistical comparisons (Figure 2).Our interest was in the P30 response, earlier shown to beinfluenced by AD [39]. Analysis of the P30 responses wasconducted from an electrode close to the site of stimu-lation based on the most distinguishable and shortest-latencyresponse, as it has been reported that P30 originates ipsilat-erally to the stimulation at the close proximity of the primarymotor cortex (M1) [33].
2.4. Statistical Analyses. To test how well the P30 amplitudewould be able to discriminate the groups from each other,receiver operating characteristic (ROC) curve analysis wasconducted. Area under the ROC curve (AUC) was computedto determine how well the groups could be discriminatedbased on the P30 amplitude. The asymptotic significance forthe AUC was computed with the null hypothesis of AUC =0.5. The optimal cut-off point for the ROC curve was deter-mined as the closest point to the diagonal line connectingpoints (0, 1) and (1, 0) in the ROC plot.
Differences in P30 amplitude between the groups wereanalysed applying a mixed linear model, and using groupand hemisphere as fixed variables and subject as a randomvariable. Restricted maximum likelihood estimation wasused in the model. Mean effects between the groups wereanalysed using post-hoc analysis with least significant dif-ference adjustment (LSD). Also, individual mean amplitudesfor the P30 (hemispheric values averaged, P30mean) wereused in the comparisons. Then, Mann-Whitney test wasapplied in comparison of the differences between the groups.Correlations between the scores of dementia rating scalesand P30 amplitude were conducted using Spearman’s rankcorrelation (ρ). The tests for correlation significance weretwo tailed. The correlated dementia scores were the globalscore and sum of boxes score of the clinical dementia ratingscale (CDR-SOB) as well as MMSE. Statistical tests wereconducted using SPSS 17 (SPSS Inc., Chicago, IL). Level ofstatistical significance was set at P < .05.
3. Results
The resting MTs (average of both hemispheres) for theopponens pollicis muscle of the control, MCI, and AD groupwere 44±11, 48±12, and 41±4% of the maximum stimulatoroutput, respectively. No significant differences were observedbetween the groups. The hemispheric data and data forpooled samples were presented in our previous study [39],where we found that the MT of the left hemisphere in MCIsubjects (50± 13% of the maximum stimulator output) wassignificantly higher (P < .05) than in AD patients (42 ±4% of the maximum stimulator output). Additionally, onthe right hemisphere, the MT of the controls (40 ± 11%of the maximum stimulator output) was significantly lower(P < .05) than in MCI subjects (48 ± 13% of the maximumstimulator output).
Dementia scales for the subject groups were distinctiveof the different disease conditions. MMSE for control, MCI,and AD group was 27 ± 4, 25 ± 3, and 22 ± 5, respectively.The global CDR values were 0 for controls, 0.5 for MCIsubjects, and 0.5 (n = 4) or 1.0 (n = 1) for AD patients.Corresponding values for the CDR-SOB were 0.0 ± 0.0,1.9 ± 1.1, and 3.2 ± 2.5, respectively. CDR and CDR-SOBvalues in controls were significantly lower (P < .001) thanin MCI and AD subjects, while MMSE was nonsignificantlyhigher (P = .055) in controls as compared to AD group.Also, no significant difference was observed between controlsand MCI subjects in MMSE (P = .437).
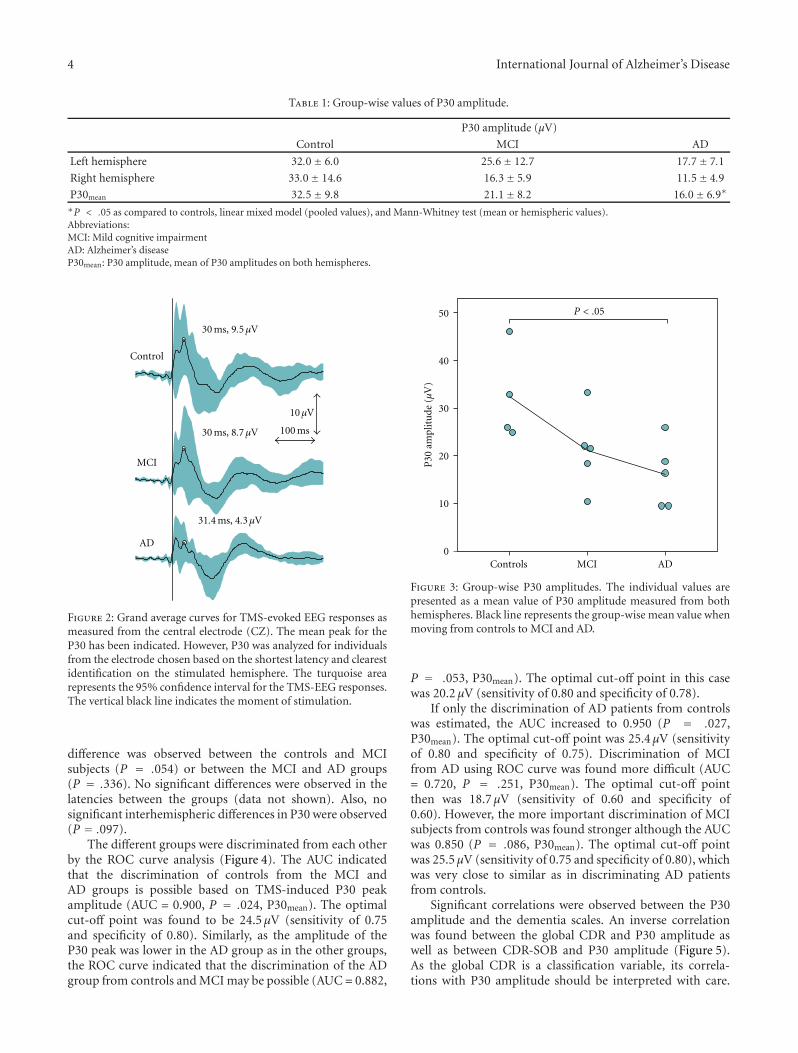
The P30 peak was lower in amplitude in the AD patientsthan in the controls (Figure 3, Table 1). No significant
4 International Journal of Alzheimer’s Disease
Table 1: Group-wise values of P30 amplitude.
P30 amplitude (μV)
Control MCI AD
Left hemisphere 32.0± 6.0 25.6± 12.7 17.7± 7.1
Right hemisphere 33.0± 14.6 16.3± 5.9 11.5± 4.9
P30mean 32.5± 9.8 21.1± 8.2 16.0± 6.9∗
∗P < .05 as compared to controls, linear mixed model (pooled values), and Mann-Whitney test (mean or hemispheric values).Abbreviations:MCI: Mild cognitive impairmentAD: Alzheimer’s diseaseP30mean: P30 amplitude, mean of P30 amplitudes on both hemispheres.
100 ms
10μV
31.4 ms, 4.3μV
30 ms, 8.7μV
30 ms, 9.5μV
MCI
AD
Control
Figure 2: Grand average curves for TMS-evoked EEG responses asmeasured from the central electrode (CZ). The mean peak for theP30 has been indicated. However, P30 was analyzed for individualsfrom the electrode chosen based on the shortest latency and clearestidentification on the stimulated hemisphere. The turquoise arearepresents the 95% confidence interval for the TMS-EEG responses.The vertical black line indicates the moment of stimulation.
difference was observed between the controls and MCIsubjects (P = .054) or between the MCI and AD groups(P = .336). No significant differences were observed in thelatencies between the groups (data not shown). Also, nosignificant interhemispheric differences in P30 were observed(P = .097).
The different groups were discriminated from each otherby the ROC curve analysis (Figure 4). The AUC indicatedthat the discrimination of controls from the MCI andAD groups is possible based on TMS-induced P30 peakamplitude (AUC = 0.900, P = .024, P30mean). The optimalcut-off point was found to be 24.5 μV (sensitivity of 0.75and specificity of 0.80). Similarly, as the amplitude of theP30 peak was lower in the AD group as in the other groups,the ROC curve indicated that the discrimination of the ADgroup from controls and MCI may be possible (AUC = 0.882,
MCI ADControls
P30
ampl
itu
de(μ
V)
50
40
30
20
10
0
P < .05
Figure 3: Group-wise P30 amplitudes. The individual values arepresented as a mean value of P30 amplitude measured from bothhemispheres. Black line represents the group-wise mean value whenmoving from controls to MCI and AD.
P = .053, P30mean). The optimal cut-off point in this casewas 20.2 μV (sensitivity of 0.80 and specificity of 0.78).
If only the discrimination of AD patients from controlswas estimated, the AUC increased to 0.950 (P = .027,P30mean). The optimal cut-off point was 25.4 μV (sensitivityof 0.80 and specificity of 0.75). Discrimination of MCIfrom AD using ROC curve was found more difficult (AUC= 0.720, P = .251, P30mean). The optimal cut-off pointthen was 18.7 μV (sensitivity of 0.60 and specificity of0.60). However, the more important discrimination of MCIsubjects from controls was found stronger although the AUCwas 0.850 (P = .086, P30mean). The optimal cut-off pointwas 25.5 μV (sensitivity of 0.75 and specificity of 0.80), whichwas very close to similar as in discriminating AD patientsfrom controls.
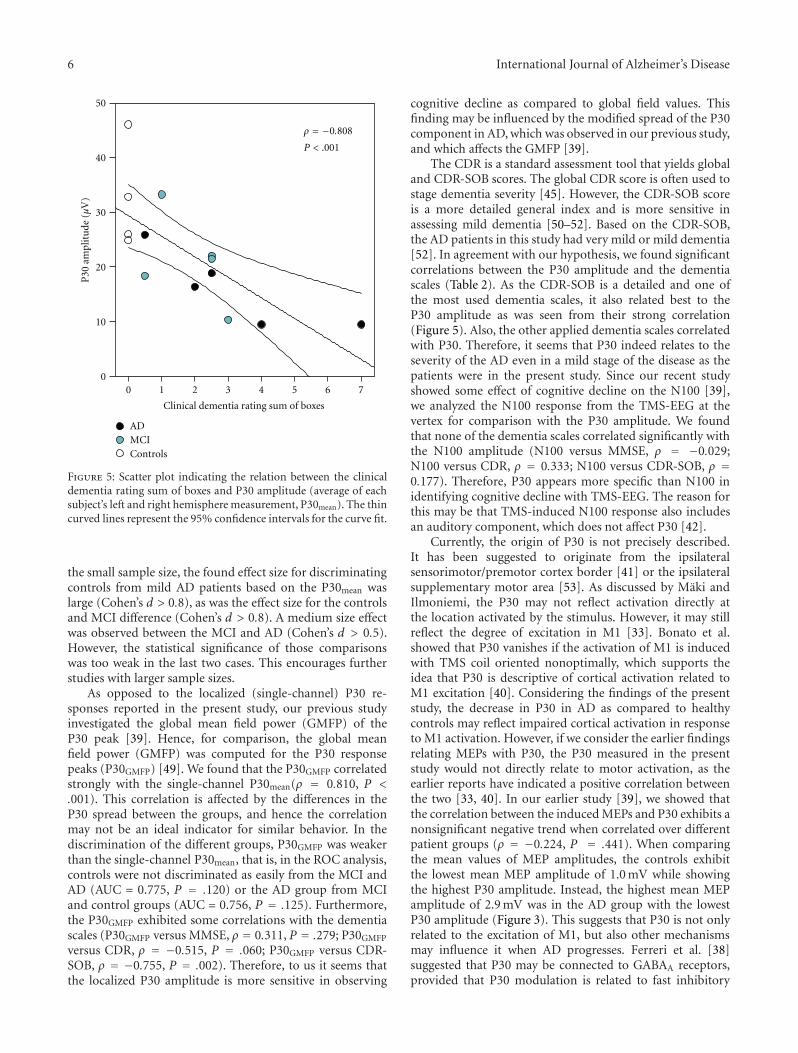
Significant correlations were observed between the P30amplitude and the dementia scales. An inverse correlationwas found between the global CDR and P30 amplitude aswell as between CDR-SOB and P30 amplitude (Figure 5).As the global CDR is a classification variable, its correla-tions with P30 amplitude should be interpreted with care.

International Journal of Alzheimer’s Disease 5
Right hemisphere:AUC = 0.922P = .022
0 0.2 0.4 0.6 0.8 1
0
0.2
0.4
0.6
0.8
1Controls versus MCI and AD
Left hemisphere:AUC = 0.875P = .034
Averaged:AUC = 0.9P = .024
False-positive rate (1-specificity)
Tru
e-po
siti
vera
te(s
ensi
tivi
ty)
(a)
AD versus controls and MCI
0 0.2 0.4 0.6 0.8 1
0
0.2
0.4
0.6
0.8
1
Right hemisphere:AUC = 0.906P = .027
Averaged:AUC = 0.822P = .053
Left hemisphere:AUC = 0.811P = .062
False-positive rate (1-specificity)Tr
ue-
posi
tive
rate
(sen
siti
vity
)(b)
Figure 4: Receiver operating characteristic (ROC) curves for distinguishing (a) controls from MCI and AD, and (b) and AD patients fromMCI and control subjects based on TMS-EEG P30. Turquoise line indicates the ROC curve for averaged data, while the grey and black linesindicate ROC curves for the right and left hemisphere, respectively. The area under the ROC curve (AUC) has been given separately for theaveraged (P30mean) and hemispheric data. The asymptotic significance has been indicated with the null hypothesis of AUC = 0.5 (diagonalline).
Table 2: Correlation coefficients (Spearman’s ρ) between the P30 amplitude and dementia rating scales.
Mini-mental state examination Clinical dementia rating—global† Clinical dementia rating—sum of boxes
Left hemisphere 0.456 −0.678∗∗ −0.788∗∗∗
Right hemisphere 0.631∗ −0.705∗∗ −0.849∗∗∗
P30mean 0.537∗ −0.698∗∗ −0.808∗∗∗
∗P < .05, ∗∗P < .01, ∗∗∗P < .001.†As the global CDR is a classification variable, its correlations with P30 amplitude should be interpreted with care.Abbreviations:P30mean: P30 amplitude, mean of P30 amplitudes on both hemispheres.
A positive correlation was found between the MMSE and P30amplitude (Table 2).
4. Discussion
We have previously shown that TMS-evoked P30 amplitudeis reduced in the AD subjects in the temporoparietal area,ipsilateral to the stimulation side as well as in the contralat-eral frontocentral cortex corresponding to the sensorimotorarea [39]. In the present study, we further investigated ourpreviously published data and found that the discriminationof control subjects from MCI and AD subjects may bepossible with good sensitivity (Figures 3 and 4). Further,consistently with our hypothesis, we found that there is asignificant relation between the commonly used dementiarating scales and the analyzed TMS-EEG response P30 ampli-tude, when TMS is focused on the M1 with suprathresholdintensity (Figure 5). Our results suggest that the use of TMS-EEG in the evaluation of AD and its initial signs could be
feasible as distinct changes occur in the measured responsesduring the development of AD.
The greatest limitation of this study was that the groupsizes were small. In spite of that, the findings of the presentstudy showed clearly significant differences between thegroups. In the future, these results should be further verifiedby other studies with larger group sizes. Nevertheless, it wasclear that the discrimination of probable mild AD patientsand MCI subjects from control subjects seemed feasible.Furthermore, the present study was able to show a correla-tion between the P30 amplitude of the TMS-EEG and thedementia rating scales (Figure 5, Table 2). Such relation hasnot been reported earlier. Therefore, it seems that the P30peak is indeed related to cognitive decline, or perhaps to thedeveloping motor deficits that the AD patients may exhibitin the advanced stage of the disease [11]. Due to the smallsample size, the study may suffer a lack of power to providereliable answers to its aim, that is, some of the intergrouprelations and differences may have been missed. Even with
6 International Journal of Alzheimer’s Disease
50
40
30
20
10
0
P30
ampl
itu
de(μ
V)
ADMCIControls
ρ = −0.808
P < .001
0 1 2 3 4 5 6 7
Clinical dementia rating sum of boxes
Figure 5: Scatter plot indicating the relation between the clinicaldementia rating sum of boxes and P30 amplitude (average of eachsubject’s left and right hemisphere measurement, P30mean). The thincurved lines represent the 95% confidence intervals for the curve fit.
the small sample size, the found effect size for discriminatingcontrols from mild AD patients based on the P30mean waslarge (Cohen’s d > 0.8), as was the effect size for the controlsand MCI difference (Cohen’s d > 0.8). A medium size effectwas observed between the MCI and AD (Cohen’s d > 0.5).However, the statistical significance of those comparisonswas too weak in the last two cases. This encourages furtherstudies with larger sample sizes.
As opposed to the localized (single-channel) P30 re-sponses reported in the present study, our previous studyinvestigated the global mean field power (GMFP) of theP30 peak [39]. Hence, for comparison, the global meanfield power (GMFP) was computed for the P30 responsepeaks (P30GMFP) [49]. We found that the P30GMFP correlatedstrongly with the single-channel P30mean(ρ = 0.810, P <.001). This correlation is affected by the differences in theP30 spread between the groups, and hence the correlationmay not be an ideal indicator for similar behavior. In thediscrimination of the different groups, P30GMFP was weakerthan the single-channel P30mean, that is, in the ROC analysis,controls were not discriminated as easily from the MCI andAD (AUC = 0.775, P = .120) or the AD group from MCIand control groups (AUC = 0.756, P = .125). Furthermore,the P30GMFP exhibited some correlations with the dementiascales (P30GMFP versus MMSE, ρ = 0.311, P = .279; P30GMFP
versus CDR, ρ = −0.515, P = .060; P30GMFP versus CDR-SOB, ρ = −0.755, P = .002). Therefore, to us it seems thatthe localized P30 amplitude is more sensitive in observing
cognitive decline as compared to global field values. Thisfinding may be influenced by the modified spread of the P30component in AD, which was observed in our previous study,and which affects the GMFP [39].
The CDR is a standard assessment tool that yields globaland CDR-SOB scores. The global CDR score is often used tostage dementia severity [45]. However, the CDR-SOB scoreis a more detailed general index and is more sensitive inassessing mild dementia [50–52]. Based on the CDR-SOB,the AD patients in this study had very mild or mild dementia[52]. In agreement with our hypothesis, we found significantcorrelations between the P30 amplitude and the dementiascales (Table 2). As the CDR-SOB is a detailed and one ofthe most used dementia scales, it also related best to theP30 amplitude as was seen from their strong correlation(Figure 5). Also, the other applied dementia scales correlatedwith P30. Therefore, it seems that P30 indeed relates to theseverity of the AD even in a mild stage of the disease as thepatients were in the present study. Since our recent studyshowed some effect of cognitive decline on the N100 [39],we analyzed the N100 response from the TMS-EEG at thevertex for comparison with the P30 amplitude. We foundthat none of the dementia scales correlated significantly withthe N100 amplitude (N100 versus MMSE, ρ = −0.029;N100 versus CDR, ρ = 0.333; N100 versus CDR-SOB, ρ =0.177). Therefore, P30 appears more specific than N100 inidentifying cognitive decline with TMS-EEG. The reason forthis may be that TMS-induced N100 response also includesan auditory component, which does not affect P30 [42].
Currently, the origin of P30 is not precisely described.It has been suggested to originate from the ipsilateralsensorimotor/premotor cortex border [41] or the ipsilateralsupplementary motor area [53]. As discussed by Maki andIlmoniemi, the P30 may not reflect activation directly atthe location activated by the stimulus. However, it may stillreflect the degree of excitation in M1 [33]. Bonato et al.showed that P30 vanishes if the activation of M1 is inducedwith TMS coil oriented nonoptimally, which supports theidea that P30 is descriptive of cortical activation related toM1 excitation [40]. Considering the findings of the presentstudy, the decrease in P30 in AD as compared to healthycontrols may reflect impaired cortical activation in responseto M1 activation. However, if we consider the earlier findingsrelating MEPs with P30, the P30 measured in the presentstudy would not directly relate to motor activation, as theearlier reports have indicated a positive correlation betweenthe two [33, 40]. In our earlier study [39], we showed thatthe correlation between the induced MEPs and P30 exhibits anonsignificant negative trend when correlated over differentpatient groups (ρ = −0.224, P = .441). When comparingthe mean values of MEP amplitudes, the controls exhibitthe lowest mean MEP amplitude of 1.0 mV while showingthe highest P30 amplitude. Instead, the highest mean MEPamplitude of 2.9 mV was in the AD group with the lowestP30 amplitude (Figure 3). This suggests that P30 is not onlyrelated to the excitation of M1, but also other mechanismsmay influence it when AD progresses. Ferreri et al. [38]suggested that P30 may be connected to GABAA receptors,provided that P30 modulation is related to fast inhibitory

International Journal of Alzheimer’s Disease 7
postsynaptic potentials. Hence, considering the earlier find-ings suggesting reduction in GABAA -mediated SICI ofAD patients [3, 18–20], the reduction in P30 amplitude inrelation to cognitive decline could be explained by possiblyaffected GABAA activity in AD patients, even if the effect isnot directly caused by the disease. However, based on thepresent study, we cannot reveal the mechanism affecting P30,and future studies are required.
As the P30 has been suggested to relate to motor fun-ction/control in response to TMS of the M1 [33, 40], it isobvious that it may also be affected by the motor functionimpairment related to the development of AD. Furthermore,as the connectivity of the AD patients is also impaired,the subcortical contributor to the P30 may suffer leadingto a decrease in P30 amplitude (Figure 5). The indicationsof P30 decrease are already present in the MCI subjects(Figure 4) although they are insignificant (P = .054) inthe present study, likely due to the low number of subjects.One possibility is that the P30 decline in AD is a result ofthe missing connections or cortical atrophy, and the actualfunction, which is still unclear, is related to the corticalhyperexcitability [19, 54] or cholinergic dysfunction leadingto disinhibition [17–19, 55]. Hence, we will further study onhow the dementia symptoms relate to the connectivity andthe components of the TMS-EEG in our future studies withlarger material.
We cannot rule out the possible effect of medicationin our findings, as the AD patients were on cholinesteraseinhibitors. However, in our previous study [39], we foundthat the later part of the TMS-EEG response appeared partlysimilar to that of the controls, meaning that not the entireTMS-EEG response is influenced by either the AD or themedication, or that the cholinesterase inhibitors are compen-sating for some of the changes. The effect of cholinesteraseinhibitors on the motor cortex excitability has been studiedearlier. Korchounov et al. [56] found that the MTs or SPswere not affected by the acetylcholinesterase inhibitor inhealthy subjects, while the intracortical inhibition and facili-tation were affected between 2 and 6 hours of the medicationintake. The motor cortex disinhibition in AD has been shownto recover partly by the use of cholinesterase inhibitors [55].Studying the effect of cholinesterase inhibitors on the TMS-EEG response of healthy subjects, possibly in combinationwith paradigms such as SAI or paired-pulse TMS, could helpto understand the origin of P30.
5. Conclusions
We found differences in TMS-induced P30-componentamplitude between the controls and AD patients, indicatingimpaired/altered connectivity in AD. In addition, we foundthat the cognitive decline correlated with the P30 amplitude.Further investigations with larger sample sizes are neededto support our conclusion that TMS-EEG could be apotential noninvasive biomarker for identifying MCI and ADsubjects and separating those from healthy population, andfor identifying connectivity changes occurring during thedevelopment of AD.
Conflict of Interests
Professor J. Karhu works part time as Chief Medical Officerin Nexstim Ltd., the manufacturer of navigated brain stimu-lation instruments.
Acknowledgment
This study was supported by EVO (5772739) Grant fromKuopio University Hospital.
References
[1] W. A. Rocca, A. Hofman, C. Brayne et al., “Frequency anddistribution of Alzheimer’s disease in Europe: a collaborativestudy of 1980–1990 prevalence findings. The EURODEM-Prevalence Research Group,” Annals of Neurology, vol. 30, no.3, pp. 381–390, 1991.
[2] M. M. Mesulam, E. J. Mufson, A. I. Levey, and B. H. Wainer,“Cholinergic innervation of cortex by the basal forebrain:cytochemistry and cortical connections of the septal area,diagonal band nuclei, nucleus basalis (substantia innominata),and hypothalamus in the rhesus monkey,” Journal of Compar-ative Neurology, vol. 214, no. 2, pp. 170–197, 1983.
[3] A. Martorana, A. Stefani, M. G. Palmieri et al., “L-dopamodulates motor cortex excitability in Alzheimer’s diseasepatients,” Journal of Neural Transmission, vol. 115, no. 9, pp.1313–1319, 2008.
[4] J. A. Hardy, D. M. A. Mann, P. Wester, and B. Winblad,“An integrative hypothesis concerning the pathogenesis andprogression of Alzheimer’s disease,” Neurobiology of Aging, vol.7, no. 6, pp. 489–502, 1986.
[5] C. L. Grady, M. L. Furey, P. Pietrini, B. Horwitz, andS. I. Rapoport, “Altered brain functional connectivity andimpaired short-term memory in Alzheimer’s disease,” Brain,vol. 124, no. 4, pp. 739–756, 2001.
[6] J. L. Price and J. C. Morris, “Tangles and plaques in nonde-mented aging and ’preclinical’ alzheimer’s disease,” Annals ofNeurology, vol. 45, no. 3, pp. 358–368, 1999.
[7] R. C. Petersen, G. E. Smith, R. J. Ivnik et al., “Apolipoprotein Estatus as a predictor of the development of Alzheimer’s diseasein memory-impaired individuals,” Journal of the AmericanMedical Association, vol. 273, no. 16, pp. 1274–1278, 1995.
[8] J. C. Morris, M. Storandt, J. P. Miller et al., “Mild cog-nitive impairment represents early-stage Alzheimer disease,”Archives of Neurology, vol. 58, no. 3, pp. 397–405, 2001.
[9] R. C. Petersen, “Mild cognitive impairment: transitionbetween aging and Alzheimer’s disease,” Neurologia, vol. 15,no. 3, pp. 93–101, 2000.
[10] J. Y. Chen, Y. Stern, M. Sano, and R. Mayeux, “Cumula-tive risks of developing extrapyramidal signs, psychosis, ormyoclonus in the course of Alzheimer’s disease,” Archives ofNeurology, vol. 48, no. 11, pp. 1141–1143, 1991.
[11] G. McKhann, D. Drachman, and M. Folstein, “Clinical diag-nosis of Alzheimer’s disease: report of the NINCDS-ADRDAwork group under the auspices of Department of Healthand Human Services Task Force on Alzheimer’s disease,”Neurology, vol. 34, no. 7, pp. 939–944, 1984.
[12] D. S. Knopman, S. T. DeKosky, J. L. Cummings et al., “Practiceparameter: diagnosis of dementia (an evidence-based review):report of the quality standards subcommittee of the americanacademy of neurology,” Neurology, vol. 56, no. 9, pp. 1143–1153, 2001.

8 International Journal of Alzheimer’s Disease
[13] R. C. A. Pearson, M. M. Esiri, and R. W. Hiorns, “Anatomicalcorrelates of the distribution of the pathological changes in theneocortex in Alzheimer disease,” Proceedings of the NationalAcademy of Sciences of the United States of America, vol. 82, no.13, pp. 4531–4534, 1985.
[14] J. Rogers and J. H. Morrison, “Quantitative morphologyand regional and laminar distributions of senile plaques inAlzheimer’s disease,” Journal of Neuroscience, vol. 5, no. 10, pp.2801–2808, 1985.
[15] G. Alagona, R. Bella, R. Ferri et al., “Transcranial magneticstimulation in Alzheimer disease: motor cortex excitabilityand cognitive severity,” Neuroscience Letters, vol. 314, no. 1-2,pp. 57–60, 2001.
[16] M. De Carvalho, A. De Mendonca, P. C. Miranda, C. Garcia,and M. De Lourdes Sales Luıs, “Magnetic stimulation inAlzheimer’s disease,” Journal of Neurology, vol. 244, no. 5, pp.304–307, 1997.
[17] V. Di Lazzaro, F. Pilato, M. Dileone et al., “In vivo cholinergiccircuit evaluation in frontotemporal and Alzheimer demen-tias,” Neurology, vol. 66, no. 7, pp. 1111–1113, 2006.
[18] V. Di Lazzaro, A. Oliviero, P. A. Tonali et al., “Noninvasive invivo assessment of cholinergic cortical circuits in AD usingtranscranial magnetic stimulation,” Neurology, vol. 59, no. 3,pp. 392–397, 2002.
[19] V. Di Lazzaro, A. Oliviero, F. Pilato et al., “Motor cortexhyperexcitability to transcranial magnetic stimulation inAlzheimer’s disease,” Journal of Neurology, Neurosurgery andPsychiatry, vol. 75, no. 4, pp. 555–559, 2004.
[20] A. Martorana, F. Mori, Z. Esposito et al., “Dopamine mod-ulates cholinergic cortical excitability in Alzheimer’s diseasepatients,” Neuropsychopharmacology, vol. 34, no. 10, pp. 2323–2328, 2009.
[21] A. Perretti, D. Grossi, N. Fragassi et al., “Evaluation ofthe motor cortex by magnetic stimulation in patients withAlzheimer disease,” Journal of the Neurological Sciences, vol.135, no. 1, pp. 31–37, 1996.
[22] V. Di Lazzaro, A. Oliviero, F. Pilato et al., “Neurophysiologicalpredictors of long term response to AChE inhibitors in ADpatients,” Journal of Neurology, Neurosurgery and Psychiatry,vol. 76, no. 8, pp. 1064–1069, 2005.
[23] K. Sakuma, T. Murakami, and K. Nakashima, “Short latencyafferent inhibition is not impaired in mild cognitive impair-ment,” Clinical Neurophysiology, vol. 118, no. 7, pp. 1460–1463, 2007.
[24] R. Nardone, J. Bergmann, M. Kronbichler et al., “Abnormalshort latency afferent inhibition in early Alzheimer’s disease:a transcranial magnetic demonstration,” Journal of NeuralTransmission, vol. 115, no. 11, pp. 1557–1562, 2008.
[25] V. Di Lazzaro, A. Oliviero, P. Profice et al., “Muscarinicreceptor blockade has differential effects on the excitability ofintracortical circuits in the human motor cortex,” Experimen-tal Brain Research, vol. 135, no. 4, pp. 455–461, 2000.
[26] H. Tokimura, V. Di Lazzaro, Y. Tokimura et al., “Short latencyinhibition of human hand motor cortex by somatosensoryinput from the hand,” Journal of Physiology, vol. 523, no. 2,pp. 503–513, 2000.
[27] R. Mariorenzi, F. Zarola, M. D. Caramia, C. Paradiso, and P.M. Rossini, “Non-invasive evaluation of central motor tractexcitability changes following peripheral nerve stimulation inhealthy humans,” Electroencephalography and Clinical Neuro-physiology, vol. 81, no. 2, pp. 90–101, 1991.
[28] M. L. Gilmor, J. D. Erickson, H. Varoqui et al., “Preservationof nucleus basalis neurons containing choline acetyltransferase
and the vesicular acetylcholine transporter in the elderly withmild cognitive impairment and early Alzheimer’s disease,”Journal of Comparative Neurology, vol. 411, no. 4, pp. 693–704,1999.
[29] S. Salloway, S. Ferris, A. Kluger et al., “Efficacy of donepezil inmild cognitive impairment: a randomized placebo-controlledtrial,” Neurology, vol. 63, no. 4, pp. 651–657, 2004.
[30] A. J. Saykin, H. A. Wishart, L. A. Rabin et al., “Cholinergicenhancement of frontal lobe activity in mild cognitive impair-ment,” Brain, vol. 127, no. 7, pp. 1574–1583, 2004.
[31] E. J. Mufson, S. Y. Ma, J. Dills et al., “Loss of basal forebrain p75immunoreactivity in subjects with mild cognitive impairmentand Alzheimer’s disease,” Journal of Comparative Neurology,vol. 443, no. 2, pp. 136–153, 2002.
[32] U. Ziemann, S. Lonnecker, B. J. Steinhoff, and W. Paulus,“Effects of antiepileptic drugs on motor cortex excitability inhumans: a transcranial magnetic stimulation study,” Annals ofNeurology, vol. 40, no. 3, pp. 367–378, 1996.
[33] H. Maki and R. J. Ilmoniemi, “The relationship betweenperipheral and early cortical activation induced by transcra-nial magnetic stimulation,” Neuroscience Letters, vol. 478, no.1, pp. 24–28, 2010.
[34] T. Raij, J. Karhu, D. Kicic et al., “Parallel input makes the brainrun faster,” NeuroImage, vol. 40, no. 4, pp. 1792–1797, 2008.
[35] S. Komssi, H. J. Aronen, J. Huttunen et al., “Ipsi- and con-tralateral EEG reactions to transcranial magnetic stimulation,”Clinical Neurophysiology, vol. 113, no. 2, pp. 175–184, 2002.
[36] M. Massimini, F. Ferrarelli, R. Huber, S. K. Esser, H. Singh,and G. Tononi, “Neuroscience: breakdown of cortical effectiveconnectivity during sleep,” Science, vol. 309, no. 5744, pp.2228–2232, 2005.
[37] M. Rosanova, A. Casali, V. Bellina, F. Resta, M. Mariotti, andM. Massimini, “Natural frequencies of human corticothalamiccircuits,” Journal of Neuroscience, vol. 29, no. 24, pp. 7679–7685, 2009.
[38] F. Ferreri, P. Pasqualetti, S. Maatta et al., “Human brainconnectivity during single and paired pulse transcranialmagnetic stimulation,” NeuroImage, vol. 54, no. 1, pp. 90–102,2011.
[39] P. Julkunen, A. M. Jauhiainen, S. Westeren-Punnonen et al.,“Navigated TMS combined with EEG in mild cognitiveimpairment and Alzheimer’s disease: a pilot study,” Journal ofNeuroscience Methods, vol. 172, no. 2, pp. 270–276, 2008.
[40] C. Bonato, C. Miniussi, and P. M. Rossini, “Transcranial mag-netic stimulation and cortical evoked potentials: a TMS/EEGco-registration study,” Clinical Neurophysiology, vol. 117, no.8, pp. 1699–1707, 2006.
[41] S. K. Esser, R. Huber, M. Massimini, M. J. Peterson, F.Ferrarelli, and G. Tononi, “A direct demonstration of corticalLTP in humans: a combined TMS/EEG study,” Brain ResearchBulletin, vol. 69, no. 1, pp. 86–94, 2006.
[42] V. Nikouline, J. Ruohonen, and R. J. Ilmoniemi, “The roleof the coil click in TMS assessed with simultaneous EEG,”Clinical Neurophysiology, vol. 110, no. 8, pp. 1325–1328, 1999.
[43] T. Paus, P. K. Sipila, and A. P. Strafella, “Synchronizationof neuronal activity in the human primary motor cortex bytranscranial magnetic stimulation: an EEG study,” Journal ofNeurophysiology, vol. 86, no. 4, pp. 1983–1990, 2001.
[44] P. Julkunen, L. Saisanen, N. Danner et al., “Comparison ofnavigated and non-navigated transcranial magnetic stimula-tion for motor cortex mapping, motor threshold and motorevoked potentials,” NeuroImage, vol. 44, no. 3, pp. 790–795,2009.

International Journal of Alzheimer’s Disease 9
[45] C. P. Hughes, L. Berg, and W. L. Danziger, “A new clinical scalefor the staging of dementia,” British Journal of Psychiatry, vol.140, no. 6, pp. 566–572, 1982.
[46] M. F. Folstein, S. E. Folstein, and P. R. McHugh, “’Mini mentalstate’. A practical method for grading the cognitive state ofpatients for the clinician,” Journal of Psychiatric Research, vol.12, no. 3, pp. 189–198, 1975.
[47] S. Gauthier, B. Reisberg, M. Zaudig et al., “Mild cognitiveimpairment,” Lancet, vol. 367, no. 9518, pp. 1262–1270, 2006.
[48] F. Awiszus, “Chapter 2 TMS and threshold hunting,” Supple-ments to Clinical Neurophysiology, vol. 56, pp. 13–23, 2003.
[49] D. Lehmann and W. Skrandies, “Reference-free identificationof components of checkerboard-evoked multichannel poten-tial fields,” Electroencephalography and Clinical Neurophysiol-ogy, vol. 48, no. 6, pp. 609–621, 1980.
[50] L. Berg, J. P. Miller, M. Storandt et al., “Mild senile dementiaof the Alzheimer type: 2. Longitudinal assessment,” Annals ofNeurology, vol. 23, no. 5, pp. 477–484, 1988.
[51] C. A. Lynch, C. Walsh, A. Blanco et al., “The clinical dementiarating sum of box score in mild dementia,” Dementia andGeriatric Cognitive Disorders, vol. 21, no. 1, pp. 40–43, 2006.
[52] S. E. O’Bryant, S. C. Waring, C. M. Cullum et al., “Stag-ing dementia using clinical dementia rating scale sum ofboxes scores: a Texas Alzheimer’s research consortium study,”Archives of Neurology, vol. 65, no. 8, pp. 1091–1095, 2008.
[53] V. Litvak, S. Komssi, M. Scherg et al., “Artifact correctionand source analysis of early electroencephalographic responsesevoked by transcranial magnetic stimulation over primarymotor cortex,” NeuroImage, vol. 37, no. 1, pp. 56–70, 2007.
[54] F. Ferreri, F. Pauri, P. Pasqualetti, R. Fini, G. Dal Forno, and P.M. Rossini, “Motor cortex excitability in Alzheimer’s disease: atranscranial magnetic stimulation study,” Annals of Neurology,vol. 53, no. 1, pp. 102–108, 2003.
[55] J. Liepert, K. J. Bar, U. Meske et al., “Motor cortex disinhibitionin Alzheimer’s disease,” Clinical Neurophysiology, vol. 112, no.8, pp. 1436–1441, 2001.
[56] A. Korchounov, T. V. Ilic, T. Schwinge, and U. Ziemann,“Modification of motor cortical excitability by an acetyl-cholinesterase inhibitor,” Experimental Brain Research, vol.164, no. 3, pp. 399–405, 2005.
[57] E. Niskanen, P. Julkunen, L. Saisanen, R. Vanninen, P. Kar-jalainen, and M. Kononen, “Group-level variations in motorrepresentation areas of thenar and anterior tibial muscles:navigated transcranial magnetic stimulation study,” HumanBrain Mapping, vol. 31, no. 8, pp. 1272–1280, 2010.
Copyright © 2022 FDOKUMEN