Estimating Parametric Line-Source Models With Electroencephalography
Upload
independentCategory
view
4download
0
QUANTITATIVE ELECTROENCEPHALOGRAPHY: A METHOD TO ASSESS CEREBRAL IN JURY AFTER HYPOTHERMIC CIRCULATORY ARREST
Although hypothermic eirculatory arrest and low-flow cardiopulmonary bypass are routinely used for surgical correction of congenital cardiac anomalies, use of long durations of arrest, often required for more complex repairs, raises serious concerns about cerebral safety. Searching for an intraoperative assessment that can reliably predict cerebral injury, we have found an excellent correlation between changes in quantitative electroencephalography intraoperatively and immediately postopera- tively after prolonged hypothermic arrest, and neurologic and behavioral evidence of cerebral injury. After epidural placement of four recording electroencephalographic electrodes and baseline neurologic/behavioral and electroencephalographic assess l ment, 32 puppies were randomly assigned to one of four groups: hypothermic controls in which cooling to 18°C was followed immediately by rewarming, 30 minutes of hypothermic circulatory arrest at 18 ° C, 90 minutes of arrest at 18 ° C, and 90 minutes of low-flow cardiopulmonary bypass at 25 ml/kg per minute at 18 ° C. An electroencephalogram was recorded at baseline, after cooling, during rewarming, and at 2, 4, and 8 hours after the start of rewarming, as weil as before the operation and 1 week after the operation. Postoperative neurologic and behavioral outcome was assessed 24 hours after cardiopulmonary bypass and daily for 1 week by means of a graded scale in which 0 is normal and 12 and 13 indicate severe neurologic injury (coma and death). Thirty animals survived the experimental protocoh two animals in the 90-minute hypothermic arrest group died before neurologic evalua- tion could be completed, and the remainder exhibited various degrees of neurologic and behavioral impairment, more severe on day 1 than on day 6. No animal in the remaining groups had a significant neurologic deficit. Quantitative electroencepha- lographic analysis shows marked differences between the 90-minute arrest group and the controls in the percent electroencephalographic silence during rewarming and at 2 hours, and in the percent recovery of baseline power at 2, 4, and 8 hours. At 2 hours after the start of rewarming, a correlation between electroencephalo- graphic amplitude and neurologic/behavioral score on day I was carried out, which predicts with great certainty (p < 0.00001) that if electroencephalographic power at this time is less than 500 /.tV 2, overt neurologic injury will subsequently become apparent. In addition, a significant shift from higher to lower frequency in the day 6 postoperative electroencephalogram compared with baseline occurs only in the 90-minute arrest group. Although clinical neurologic injury was not apparent in any but the 90-minute arrest group, further quantitative electroencephalographic com-
Craig K. Mezrow, MS a (by invitation), Peter S. Midulla, MD a (by invitation), Ali M. Sadeghi, MD a (by invitation), Alejandro Gandsas, MD a (by invitation), Weijia Wang, MD b (by invitation), Howard H. Shiang, DVM a (by invitation), Carol Bodian, PhD c (by invitation), Otto E. Dapunt, MD a (by invitation), Rosario Zappulla, MD, PhD b (by invitation), and Randall B. Griepp, MD, New York, N.Y.
From the Departments of Cardiothoracic Surgery, a Neurosur- gery, b and Biomathematical Sciences, c Mount Sinai Medical Center, New York, N.Y.
Read at the Seventy-fourth Annual Meeting of The American Association for Thoracic Surgery, New York, N.Y., April 24-27, 1994.
Address for reprints: Craig Mezrow, MS, Department of Cardio- thoracic Surgery, Mount Sinai Medical Center, P.O. Box 1028, New York, NY 10029.
Supported by grant HL-45636-02 from the National Heart, Lung, and Blood Institute and in part by the Lapkin Foundation.
J THORAC CARDIOVASC SUNG 1995;109:925-34
Copyright © 1995 by Mosby-Year Book, Inc.
0022-5223/95 $3.00 + 0 12/6/62744
9 2 5

926 Mezrow et al. The Journal of Thoracic and
Cardiovascular Surgery May 1995
parisons of postoperative with baseline power show a much more rapid return of electroencephalographic power in the control than in either the 30-minute hypo- thermic arrest or the low-flow cardiopulmonary bypass group. Between-group comparisons show significant differences between the 90-minute arrest and low-flow cardiopulmonary bypass groups at several time points, and fewer and less marked differences between 90-minute and 30-minute arrest groups. These results demon- strate that quantitative electroencephalographic logic injury after 90 minutes of hypothermic circulatory arrest at 18 ° C. The presence of milder but significant differences from control quantitative electroencephalographic values after 30 min- utes of arrest at 18 ° C suggest that there may be subtle cerebral injury undetected by neurologic/behavioral evaluation in this group, although this interval is clinically accepted as safe. In contrast, no quantitative electroencephalographic evidence of cerebral dysfunction was apparent after 90 minutes of low-flow cardiopulmonary bypass at 18 ° C. The study as a whole suggests that quantitative electroencephalo. graphic is a sensitive indicator of cerebral injury and may prove extremely valuable in future studies of strategies for cerebral protection during cardiac surgery. (J THORAC CARDIOVASC SURG 1995;109:925-34)
I n recent years there has been increasing concern about the possible deleterious effects of neona-
tal cardiac surgery on later intellectual function, especially when prolonged durations of hypother- mic circulatory arrest (HCA) are used. Because of the complexity of assessing what may be relatively subtle cerebral injury in a heterogeneous popula- tion years away from manifesting the conse- quences of a neurologic insult, as well as the many other obstacles in the way of a definitive study of the cerebral consequences of neonatal cardiac surgery in children, we embarked on a systematic exploration of some aspects of this problem in weanling puppies.
One of our aims has been to try to identify intraop- erative parameters that will correlate with later evi- dence of cerebral injury, as determined by neurologic and behavioral evaluation of long-term survivors: this is an essential step toward analyzing the cause of cerebral injury after HCA. Identification of such fac- tors will also prove invaluable for devising and screen- ing strategies to improve cerebral protection during neonatal cardiac surgery, with the ultimate goal of preventing cerebral injury after HCA.
In the course of our studies, we have begun to record quantitative electroencephalography (QEEG) before and after our acute hypothermia protocol, as well as during the operation. We also evaluate cerebral blood flow, cerebral vascular resistance, and cerebral metabolism during and after HCA under a variety of circumstances. During a study in which no overt neu- rologic damage was evident after HCA for 60 minutes
at 18 ° C, we found a postoperative shift of EEG waveforms to slower frequencies, a finding that corre- lates with cerebral injury in a number of other con- texts. 1
In the current study, we extended the interval of HCA at 18°C to 90 minutes, anticipating that we would find both clinical and further EEG evidence of cerebral injury. We report the results of intraoperative QEEG, as well as preoperative and postoperative telemetric QEEG studies, in 32 puppies divided into four groups: a hypothermic control, in which puppies were cooled to 18°C and immediately rewarmed; a group subjected to 30 minutes of HCA at 18 ° C; a group that underwent HCA at 18°C for 90 minutes, and a group subjected to low-flow cardiopulmonary bypass (CPB) at 18 ° C for 90 minutes. The metabolic results from this experiment are found in the accom- panying paper (see page 959).
Our data show clinical evidence of cerebral injury only in the group subjected to 90 minutes of HCA at 18 ° C. The clinical findings in the 90-minute HCA group were accompanied by significant differences from the other groups in intraoperative and postoperative QEEG find- ings, suggesting that QEEG is a sensitive and reliable indicator of cerebral injury. The presence of milder but still statistically significant QEEG changes of a similar character in the 30-minute HCA group, as well as some differences flora con- trol patterns even in the LFCPB group suggest that QEEG may also be a way of detecting subclinical cerebral injury.

The Journal of Thoracic and Cardiovascular Surgery Volume 109, Number 5
Mezrow et aL 9 2 7
Materials and methods Thirty-two weanling beagles (Marshall Farms, North
Rose, N.Y.), 3 months of age, weighing 3.5 to 5 kg, were randomly assigned to one of four groups after CPB cooling:
1. Control group: immediate rewarming after cooling to 18 ° C
2. Thirty-minute HCA at 18 ° C 3. Ninety-minute HCA at 18 ° C 4. Ninety-minute low-flow cardiopulmonary bypass at
18°C
Each animal underwent epidural electrode placement, preoperative E E G monitoring, and neurologic/behav- ioral assessment, intraoperative EEG monitoring, and postoperative EEG and neurologic behavioral examina- tions.
Perioperative management. All animals received hu- mane care in compliance with the "Principles of Labora- tory Animal Care" formulated by the National Society for Medical Research and the "Guide for the Care and Use of Laboratory Animals" published by the National Institutes of Health (NIH Publication No. 85-23, revised 1985). The protocol for these experiments was approved by the Mount Sinai Institutional Animal Care and Use Commit- tee.
Epidural eleetrode implantation. After anesthesia with ketamine (20 mg/kg) and diazepam (Valium, 1 mg/kg), animals were intubated and supported by positive-pres- sure ventilation with halothane anesthesia. A midline scalp incision was made and the underlying periosteum removed to facilitate identification of the coronal and sagittal sutures. Four recording electrodes (left and right frontal and parietal) were positioned epidurally and ce- mented (Durelon cement, ESPE-Premier, Norristown, Pa.) in 2 mm burr drilled holes. The frontal electrodes were implanted 1.5 cm to the left and to the right of the sagittal suture directly behind the coronal suture, and the parietal electrode was placed 1.5 cm caudal to the frontal electrode on each side. The leads ffom the electrodes were passed subcutaneously, externalized, and sutured to the dorsum of the neck.
Neurologic and behavioral evaluation. Puppies were examined before the operation for evaluation of behav- ioral and/of neurologic deficits; although they are re- ported only for postoperative days 1 and 6, these assess- ments were repeated daily after the operation. Each animal was evaluated and scored for abnormalities by a veterinarian unaware of the experimental design. The scores ranged from 0 if no abnormalities were noted to 12 if the animal was comatose and 13 if dead. The following parameters were evaluated:
Behavioral exam MentaI status
Depressed Stuporous Comatose
Gait Unsteady Unable to walk Unable to stand
Appetite Decreased Refuses solids Refuses liquids
Affect Aggressive Indifferent Bizarre
Neurologic exam Posture
Wheelbarrowing reaction Hopping reaction Extensor postural thrust reaction Placing reaction
Reflexes Right and left quadriceps Right and left extensor carpi radialis
Cranial nerves Menace reaction Licking reaction Olfactory reaction Pupillary refex
Telemetrie EEG reeording. After the animals had re- covered from the epidural implantation procedure, two 10-minute recordings of "awake" EEG were acquired in a darkened room before the operation. This was accom- plished via telemetry (Telefactor Corp., West Consho- hocken, Pa.) and transmitted to a Spectrum 32 monitor (Cadwell Laboratories, Kennewick, Wash.), where it was further amplified, filtered, digitized, and stored for subse- quent analysis. On postoperative day 6, awake EEG recordings were again undertaken in the same way as described for the preoperative recordings.
Intraoperative protoeol and monitoring Anesthesia. Animals were pretreated with glycopyrro-
late (0.025 mg/kg), anesthetized with fentanyl (25 to 50 txg/kg per hour) and isoflurane (<1%), and intubated. They were supported by positive-pressure ventilation (in- spired oxygen fraction > 40%; arterial carbon dioxide tension 35 to 40 mm Hg) and paralyzed with pancuronium (0.1 mg/kg). Arterial oxygen tension was maintained above 100 mm Hg. Lead II was used for electrocardio- graphic (ECG) monitoring. Esophageal, rectal, and epi- dural temperature probes were placed and peripheral vessel cannulations were performed for monitoring pur- poses.
CPB, cooling, and rewarming. After heparinization (300 IU/kg), nonpulsatile CPB was instituted with a single cannula in the right atrium with return of the arterial perfusate via the ascending aorta. Membrane oxygenators (VPCML plus, Cobe Laboratories, Inc., Lakewood, Colo.) were primed with a hemodilute solution containing ho- mologous blood (universal donor), 5% albumin, furo- semide (1 mg/kg), heparin (2000 IU), 1% dextrose in 0.9% saline solution, and potassium chloride (1 mEq/kg).
CPB was established at a rate of 100 ml/kg per minute, and hematocrit value was maintained between 22% and 28%. Surface cooling was begun with a cooling blanket. In accordance with the principles of alpha-stat management, pH during cooling was maintained at 7.4 _+ 0.05 and arterial carbon dioxide tension at 35 to 40 mm Hg,
9 2 8 Mezrow et al. The Journal of Thoracic and
Cardiovascular Surgery May 1995
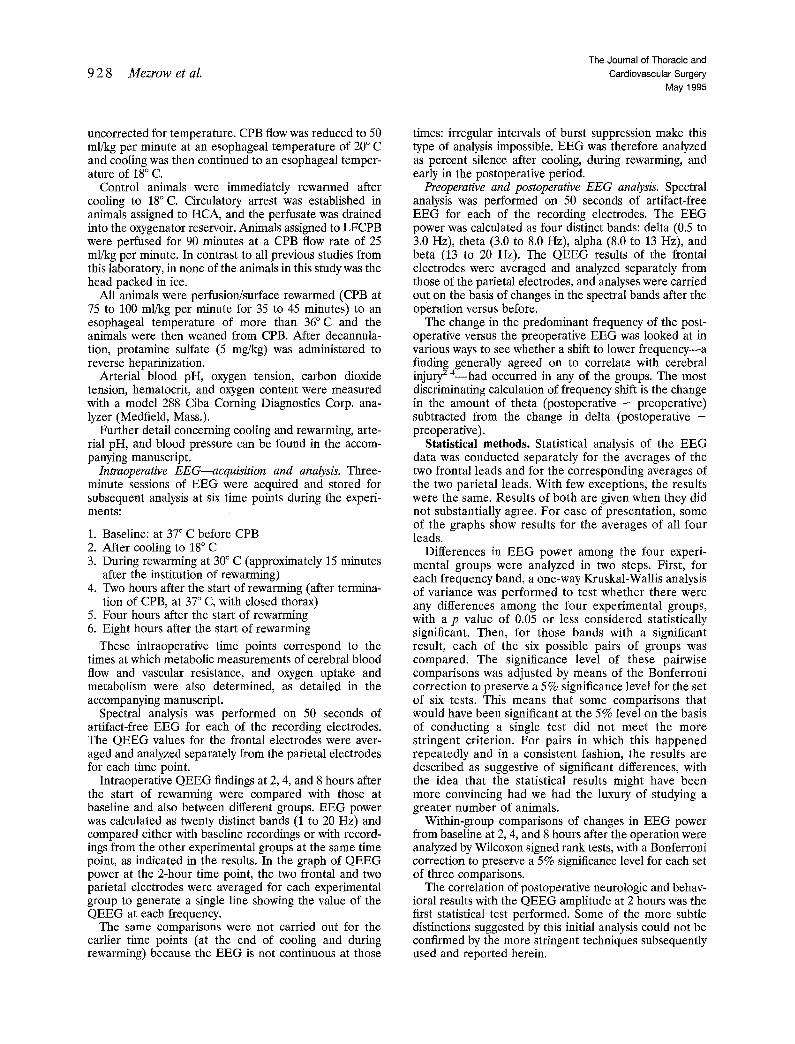
uncorrected for temperature. CPB flow was reduced to 50 tal/kg per minute at an esophageal temperature of 20 ° C and cooling was then continued to an esophageal temper- ature of 18 ° C.
Control animals were immediately rewarmed after cooling to 18 ° C. Circulatory arrest was established in animals assigned to HCA, and the perfusate was drained into the oxygenator reservoir. Animals assigned to LFCPB were perfused for 90 minutes at a CPB flow rate of 25 ml/kg per minute. In contrast to all previous studies from this laboratory, in none of the animals in this study was the head packed in ice.
All animals were perfusion/surface rewarmed (CPB at 75 to 100 ml/kg per minute for 35 to 45 minutes) to an esophageal temperature of more than 36°C and the animals were then weaned from CPB. After decannula- tion, protamine sulfate (5 mg/kg) was administered to reverse heparinization.
Arterial blood pH, oxygen tension, carbon dioxide tension, hematocrit, and oxygen content were measured with a model 288 Ciba Corning Diagnostics Corp. ana- lyzer (Medfield, Mass.).
Further detail concerning cooling and rewarming, arte- rial pH, and blood pressure can be found in the accom- panying manuscript.
Intraoperative EEG--acquisition and analysis. Three- minute sessions of EEG were acquired and stored for subsequent analysis at six time points during the experi- ments:
1. Baseline: at 37 ° C before CPB 2. After cooling to 18 ° C 3. During rewarming at 30 ° C (approximately 15 minutes
after the institution of rewarming) 4. Two hours after the start of rewarming (after termina-
tion of CPB, at 37 ° C, with closed thorax) 5. Four hours after the start of rewarming 6. Eight hours after the start of rewarming
These intraoperative time points correspond to the times at which metabolic measurements of cerebral blood flow and vascular resistance, and oxygen uptake and metabolism were also determined, as detailed in the accompanying manuscript.
Spectral analysis was performed on 50 seconds of artifact-free EEG for each of the recording electrodes. The QEEG values for the frontal electrodes were aver- aged and analyzed separately from the parietal electrodes for each time point.
Intraoperative QEEG findings at 2, 4, and 8 hours after the start of rewarming were compared with those at baseline and also between different groups. EEG power was calculated as twenty distinct bands (1 to 20 Hz) and compared either with baseline recordings or with record- ings from the other experimental groups at the same time point, as indicated in the results. In the graph of QEEG power at the 2-hour time point, the two frontal and two parietal electrodes were averaged for each experimental group to generate a single line showing the value of the QEEG at each frequency.
The same comparisons were not carried out for the earlier time points (at the end of cooling and during rewarming) because the EEG is not continuous at those
times: irregular intervals of burst suppression make this type of analysis impossible. EEG was therefore analyzed as percent silence after cooling, during rewarming, and early in the postoperative period.
Preoperative and postoperative EEG analysis. Spectral analysis was performed on 50 seconds of ärtifact-free EEG for each of the recording electrodes. The EEG power was calculated as four distinct bands: delta (0.5 to 3.0 Hz), theta (3.0 to 8.0 Hz), alpha (8.0 to 13 Hz), and beta (13 to 20 Hz). The QEEG results of the frontal electrodes were averaged and analyzed separately from those of the parietal electrodes, and analyses were carried out on the basis of changes in the spectral bands after the operation versus before.
The change in the predominant frequency of the post- operative versus the preoperative EEG was looked at in various ways to see whether a shift to lower frequency--a finding generally agreed on to correlate with cerebral injury2-4--had occurred in any of the groups. The most discriminating calculation of frequency shift is the change in the amount of theta (postoperative - preoperative) subtracted from the change in delta (postoperative - preoperative).
Statistical methods. Statistical analysis of the EEG data was conducted separately for the averages of the two frontal leads and for the corresponding averages of the two parietal leads. With few exceptions, the results were the same. Results of both are given when they did not substantially agree. For ease of presentation, some of the graphs show results for the averages of all four leads.
Differences in EEG power among the four experi- mental groups were analyzed in two steps. First, for each frequency band, a one-way Kruskal-Wallis analysis of variance was performed to test whether there were any differences among the four experimental groups, with a p value of 0.05 or less considered statistically significant. Then, for those bands with a significant result, each of the six possible pairs of groups was compared. The significance level of these pairwise comparisons was adjusted by means of the Bonferroni correction to preserve a 5% significance level for the set of six tests. This means that some comparisons that would have been significant at the 5% level on the basis of conducting a single test did not meet the more stringent criterion. For pairs in which this happened repeatedly and in a consistent fashion, the results are described as suggestive of significant differences, with the idea that the statistical results might have been more convincing had we had the luxury of studying a greater number of animals.
Within-group comparisons of changes in EEG power from baseline at 2, 4, and 8 hours after the operation were analyzed by Wilcoxon signed rank tests, with a Bonferroni correction to preserve a 5% significance level for each set of three comparisons.
The correlation of postoperative neurologic and behav- ioral results with the QEEG amplitude at 2 hours was the first statistical test performed. Some of the more subtle distinctions suggested by this initial analysis could not be confirmed by the more stringent techniques subsequently used and reported herein.
The Journal of Thoracic and
Cardiovascular Surgery
Volume 109, Number 5
Mezrow et al. 9 2 9
Results
Morbidity, mortality, and neurologic outcome. Of the 32 puppies in the experimental group, only two died, both after 90 minutes of HCA. In one, there was clearly neurologic damage, and in the other, multiorgan failure resulted in death before the possibility of full neurologic evaluation. Because both animals survived the acute experimental pro- tocol, their QEEG data were included in the calcu- lation of intraoperative parameters, and their neu- rologic outcome was scored at the highest possible level throughout the follow-up period, although formal neurologic/behavioral evaluation could not be carried out.
Of the surviving animals, only those in the 90- minute HCA group had clinically evident neurologie or behavioral impairment at the time of initial postoperative evaluation. Most of the animals in the 90-minute HCA group had poor appetite, indiffer- ent affect, and were unable to walk or even stand on the first postoperative day; their average behavioral score was 5.5 _ 0.6; average neurologic score was 10.3 -+ 0.7. By day 6, however, most of the puppies had improved eonsiderably, with only minor residual gait abnormalities and a few abnormal reflexes. After 6 days, average behavioral and neurologic scores were 0.8 +- 0.3 and 4.3 +_ 1.1 for the surviving animals in the 90-minute HCA group. In contrast to the universal evidence of at least transient cerebral injury in the 90-minute HCA group, none of the animals in any of the three other groups had serious neurologic or behavioral sequelae, as doeumented in Table I of the accompanying paper.
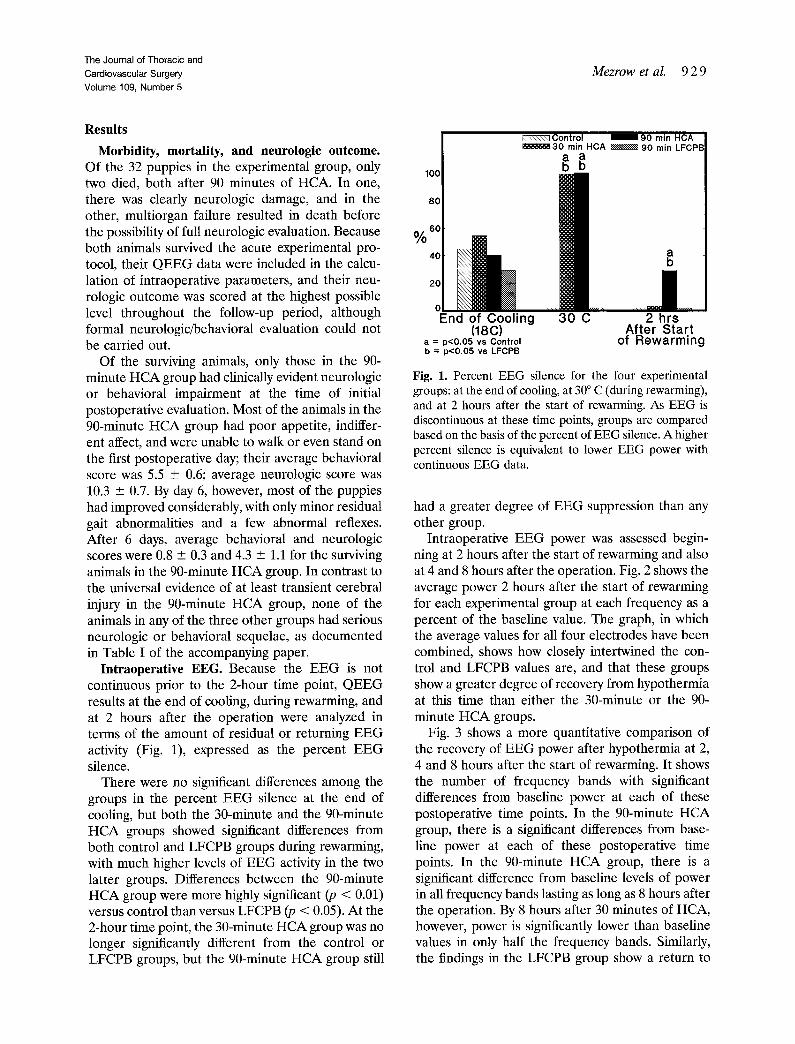
Intraoperative EEG. Beeause the EEG is not continuous prior to the 2-hour time point, QEEG results at the end of eooling, during rewarming, and at 2 hours after the operation were analyzed in terms of the amount of residual or returning EEG activity (Fig. 1), expressed as the percent EEG silence.
There were no significant differences among the groups in the percent EEG silence at the end of cooling, but both the 30-minute and the 90-minute HCA groups showed significant differences from both control and LFCPB groups during rewarming, with much higher levels of EEG activity in the two latter groups. Differences between the 90-minute HCA group were more highly significant (p < 0.01) versus control than versus LFCPB (p < 0.05). At the 2-hour time point, the 30-minute HCA group was no longer significantly different from the control or LFCPB groups, but the 90-minute HCA group still
lOO
8G
6O % ,o~ 2 0
0 End of Cooling
(18C) a = p<O.05 vs Control b = p<0.05 vs LFePB
i::.::--:--.'-:-.:-.:t Control 1 90 min HCA 30 min HCA ~\\\\\\\\\\~ 90 min LFCPE
30 C 1
2 hrs After Start
of Rewarming
Fig. 1. Percent EEG silence for the four experimental groups: at the end of cooling, at 30 ° C (during rewarming), and at 2 hours after the start of rewarrning. As EEG is discontinuous at these time points, groups are compared based on the basis of the percent of EEG silence. A higher percent silence is equivalent to lower EEG power with continuous EEG data.
had a greater degree of EEG suppression than any other group.
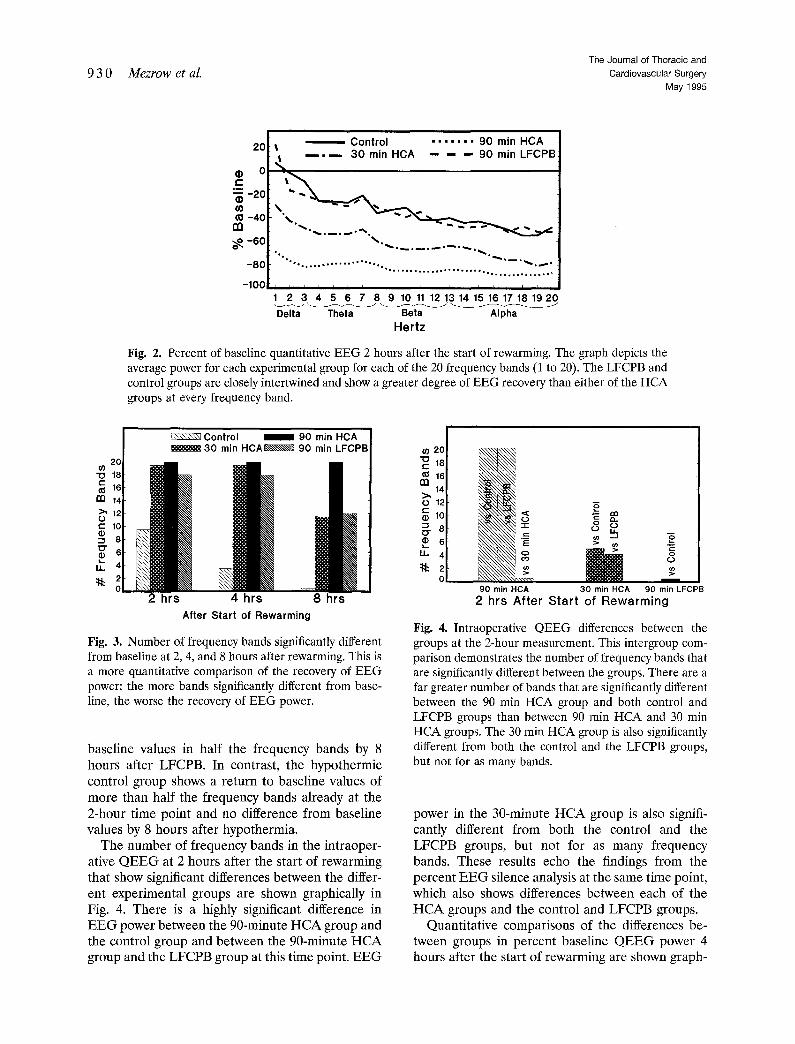
Intraoperative EEG power was assessed begin- ning at 2 hours after the start of rewarming and also at 4 and 8 hours after the operation. Fig. 2 shows the average power 2 hours after the start of rewarming for each experimental group at each frequency as a percent of the baseline value. The graph, in which the average values for all four electrodes have been combined, shows how closely intertwined the con- trol and LFCPB values are, and that these groups show a greater degree of recovery from hypothermia at this time than either the 30-minute or the 90- minute HCA groups.
Fig. 3 shows a more quantitative comparison of the recovery of EEG power after hypothermia at 2, 4 and 8 hours after the start of rewarming. It shows the number of frequency bands with significant differences from baseline power at each of these postoperative time points. In the 90-minute HCA group, there is a significant differences from base- line power at each of these postoperative time points. In the 90-minute HCA group, there is a significant difference from baseline levels of power in all frequency bands lasting as long as 8 hours after the operation. By 8 hours after 30 minutes of HCA, however, power is significantly lower than baseline values in only half the frequency bands. Similarly, the findings in the LFCPB group show a return to
9 3 0 Mezrow et al. The Journal of Thoracic and
Cardiovascular Surgery May 1995
20
.~o "~-20
1~-40
o~ - 6 0
- 8 0
-100
Control . . . . . . . 90 min HCA l ùt . . - - ù m 30 min HCA -- -- - . 90 min LFCPB
° % , . . ~ " m " ~ • m , ~ ,
• , , , , ù , , , . , , , . . . . . . . , , ° . , ° , . ù , . . . . . . . . . .
r I I 1 I I I r I i I i i I ] I I ' I
2 3 4 5 6 7 8 9 10 11 12 13 14 15 16 17 18 19 20 Delta Theta Beta Alpha
Hertz
Fig. 2. Percent of baseline quantitative EEG 2 hours after the start of rewarming. The graph depicts the average power for each experimental group for each of the 20 frequency bands (1 to 20). The LFCPB and control groups are closely intertwined and show a greater degree of EEG recovery than either of the HCA groups at every frequency band.
2c t/) 18
en 14
O
8 ~T ~ e
~ 4
2 ~ 0
::::::::::::::::::::::::::::::: Control I ~ 1 90 min HCA ~ 3 0 min H C A ~ 90 min LFCPB
Jl 2 hrs 4 h rs 8 hrs
After Start of Rewarming
Fig. 3. Number of frequency bands significantly different from baseline at 2, 4, and 8 hours after rewarming. This is a more quantitative comparison of the recovery of EEG power: the more bands significantly different from base- line, the worse the recovery of EEG power.
baseline values in half the frequency bands by 8 hours after LFCPB. In contrast, the hypothermic control group shows a return to baseline values of more than half the frequency bands already at the 2-hour time point and no difference from baseline values by 8 hours after hypothermia.
The number of frequency bands in the intraoper- ative Q E E G at 2 hours after the start of rewarming that show significant differences between the differ- ent experimental groups are shown graphically in Fig. 4. There is a highly significant difference in E E G power between the 90-minute H C A group and the control group and between the 90-minute H C A group and the LFCPB group at this time point. E E G
20[ . . . . . . 18 g 16
14 >, O 12
\x,N,N%\
IJ. o
0 1 . . . . . . . ~
90 min HCA
o Q3 g o_
o ,,o
»
30 min HCA 90 min LFCPB 2 h rs After S tar t of R e w a r m i n g
Fig. 4. Intraoperative QEEG differences between the groups at the 2-hour measurement. Tbis intergroup com- parison demonstrates the number of frequency bands that are significantly different between the groups. There area rar greater number of bands that are significantly different between the 90 min HCA group and both control and LFCPB groups than between 90 min HCA and 30 min HCA groups. The 30 min HCA group is also significantly different from both the control and the LFCPB groups, but not for as many bands.
power in the 30-minute H C A group is also signifi- cantly different from both the control and the LFCPB groups, but not for as many frequency bands. These results echo the findings from the percent E E G silence analysis at the same time point, which also shows differences between each of the H C A groups and the control and LFCPB groups.
Quantitative comparisons of the differences be- tween groups in percent baseline Q E E G power 4 hours after the start of rewarming are shown graph-

The Journal of Thoracic and
Cardiovascular Surgery
Volurne 109, Number 5 Mezrow et al. 9 3 1
2O
m 14
o>, 12 e-- 10
8
~" 6
la. 4
2
90 min HCA 30 min HCA 90 min LFCPB
4 hrs After Start of Rewarming
Fig. 5. Intraoperative QEEG differences between groups at the 4-hour measurement. As in Fig. 4, there remains a large difference between the 90 min HCA and control and LFCPB groups and a smaller difference between 90 min HCA and 30 min HCA groups. There remains a dilterence between 30 min HCA and control groups.
20 o9 18 "10 t-- 16
en 14
>, 12
0=8
4 LI.
2 0
-£=
90 min HCA
8 hrs After Start of Rewarming
m
I L . ¢..) ...a
~ n n n m
30 min HCA 90 min LFCPB
Fig. 6. Intraoperative QEEG differences between groups at the 8-hour measurement. At 8 hours there is a clear difference in EEG power between the 90 min HCA group and all others. By this late time point, there are no differences between the 30 min HCA or the LFCPB and the control groups.
ically in Fig. 5. Again a highly significant difference between the 90-minute HCA and control groups and between the 90-minute HCA and LFCPB groups is evident in most frequency bands, and there is a suggestion in some frequency bands that a significant difference is also present between the results from the 90-minute HCA and the 30-minute HCA groups. There is again a difference in some frequency bands between the 30-minute HCA group and the controls.
At the 8-hour time point (Fig. 6), the results of comparisons between groups show a clear differen- tiation between the 90-minute HCA group and all the others, which corresponds to the results of clinical neurologic/behavioral evaluation. There is a significant difference between the 90-minute H CA group and the control group in most frequency bands and a significant difference between the 90- minute HC A and both the LFCPB and the 30- minute HCA groups in about a third of the frequency bands. Neither the 30-minute HCA nor the LFCPB group shows any significant differences from one an- other or from the control at this late time point.
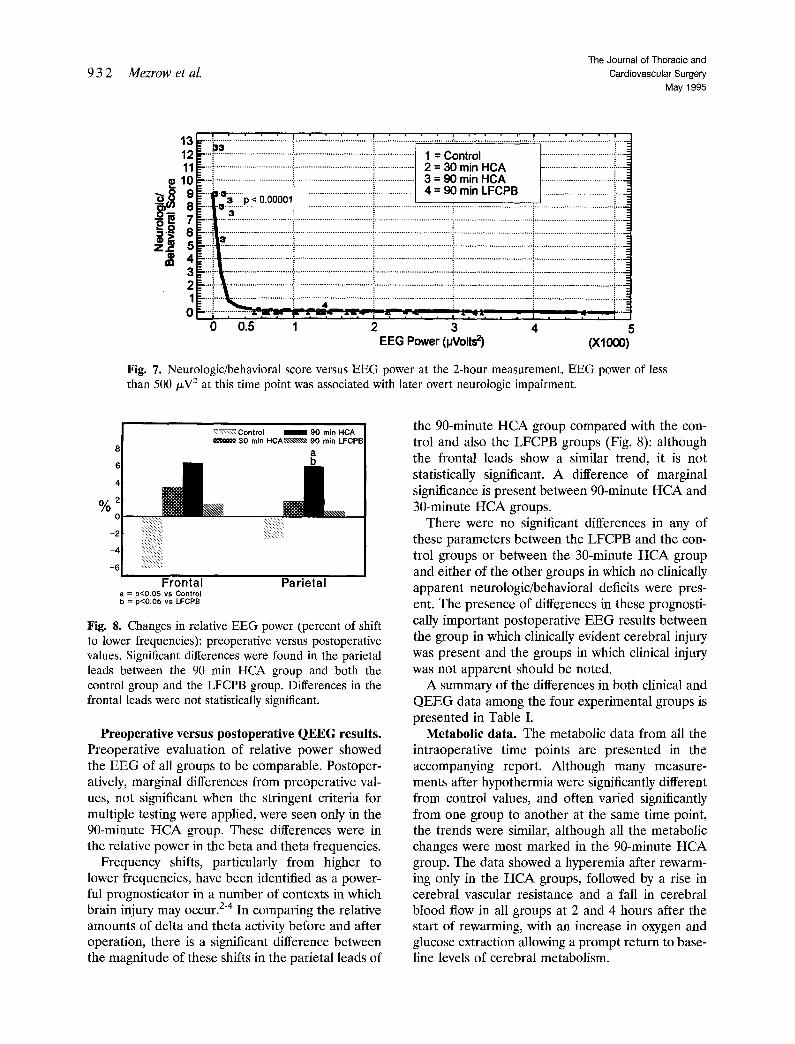
The Q E E G data from the 2-hour time point show a highly significant correlation with the neurologic/ behavioral score, as shown in Fig. 7. This validates the notion that the rate of recovery of E E G power during the operation can be useful in anticipating cerebral injury. In fact, the graph of this correlation indicates that an amplitude below 500/xV 2 2 hours after the start of rewarming predicts development of clinically evident neurologic impairment.
In summary, the return to baseline power in the four groups shows interesting differences, with the expected early re turn of the control group, and the markedly prolonged depression of Q E E G in the 90-minute H C A group. Although the graphs of the intraoperative data appear to show very little difference between the 30-minute H C A and the LFCPB groups, the intergroup comparisons show greater differences f rom the control pat tern of recovery in the 30-minute H C A group than in the LFCPB group and fewer differences f rom the 90-minute H C A group. The more prolonged E E G silence and the less rapid recovery of E E G power in the 30-minute H CA group as compared with the LFCPB group suggest that the 30-minute H CA group may have had a greater cerebral insult than the LFCPB group. The fact that there are significant differences in the data at some time points between the 30-minute H C A group and the 90-minute H C A group is compatible with the idea that the cerebral insult to the 30-minute H C A group is considerably milder than the insult that follows the longer interval of HCA: clearly it is not severe enough to be manifested clinically in the neurologic/behavioral score.
Extending this logic, the failure to find significant differences between the pattern of recovery of the E E G between control and LFCPB groups is predic- tive of the absence of clinically apparent impairment in the LFCPB group which was observed, and suggests even milder subclinical cerebral injury after 90 minutes of LFCPB than after 30 minutes of HCA.
932 Mezrow et al. The Journal of Thoracic and
Cardiovascular Surgery
May 1995
13 12 11
ùe 10
3 2
p < 0.00001
1 = Control 2 = 30 min HCA 3 = 90 min HCA 4 = 90 min LFCPB
0 0.5 1 2 3 4 5 EEG Power (pVolts z) (X1000)
Fig. 7. Neurologic/behavioral score versus EEG power at the 2-hour measurement. EEG power of less than 500/~V 2 at this time point was associated with later overt neurologic impairment.
~ ~ : Control ~ 3 0 min HCA~~~~, 90 min LFCPB
a b
%
iii:iii:iii:ii~!ii:!ii:i
Frontal Par ieta l a = p<0.05 vs Control b = p<0,05 vs LFCPB
Fig. 8. Changes in relative EEG power (percent of shifl to lower frequencies): preoperative versus postoperative values. Significant differences were found in the parietal leads between the 90 min HCA group and both the control group and the LFCPB group. Differences in the frontal leads were not statistically significant.
Preoperative versus postoperative QEEG results. Preoperative evaluation of relative power showed the EEG of all groups to be eomparable. Postoper- atively, marginal differences from preoperative val- ues, not significant when the stringent criteria for multiple testing were applied, were seen only in the 90-minute HCA group. These differences were in the relative power in the beta and theta frequencies.
Frequency shifts, particularly from higher to lower frequencies, have been identified as a power- ful prognosticator in a number of contexts in which brain injury may occur. 2-4 In comparing the relative amounts of delta and theta activity before and after operation, there is a significant difference between the magnitude of these shifts in the parietal leads of
the 90-minute HCA group compared with the con- trol and also the LFCPB groups (Fig. 8): although the frontal leads show a similar trend, it is not statistically significant. A difference of marginal significance is present between 90-minute HCA and 30-minute HCA groups.
There were no significant differences in any of these parameters between the LFCPB and the con- trol groups or between the 30-minute HCA group and either of the other groups in which no clinically apparent neurologic/behavioral deficits were pres- ent. The presence of differences in these prognosti- cally important postoperative EEG results between the group in which clinically evident cerebral injury was present and the groups in which clinical injury was not apparent should be noted.
A summary of the differences in both clinical and QEEG data among the four experimental groups is presented in Table I.
Metabolic data. The metabolic data from all the intraoperative time points are presented in the accompanying report. Although many measure- ments after hypothermia were significantly different from control values, and often varied significantly from one group to another at the same time point, the trends were similar, although all the metabolic changes were most marked in the 90-minute HCA group. The data showed a hyperemia after rewarm- ing only in the HCA groups, followed by a rise in cerebral vascular resistance and a fall in cerebral blood flow in all groups at 2 and 4 hours after the start of rewarming, with an increase in oxygen and glucose extraction allowing a prompt return to base- line levels of cerebral metabolism.

The Journal of Thoracic and Cardiovascular Surgery Volume 109, Number 5
Mezrow et al. 933
Table I. QEEG summary
Percent EEG silence
Frequency fractionated power
30 ° C 2 hr 2 hr 4 hr 8 hr Low.frequency Neurologic behavioral
EEG shift evaluation
Control vs 90 min LFCPB Control vs 30 min HCA X Control vs 90 min HCA X 30 min HCA vs 90 min LFCPB X 90 min HCA vs 90 min LFCPB X 90 min HCA vs 30 min HCA
X
X
X X X X
X X
X X X
X X X X X
X indicates presence of significant differences between the groups.
Discuss ion
The results of this study, in which intraoperative and postoperative QEEG suppression and power data and late postoperative QEEG frequency shifts all correlate with the occurrence of overt neurologic injury in puppies subjected to 90 minutes of HCA at 18 ° C, are convincing evidence that QEEG is a sensitive and reliable tool for the detection of cerebral injury after HCA. The significant differ- ences present in comparisons of the 30-minute HCA group with hypothermic controls, in neither of which clinical evidence of cerebral injury was present, suggest that QEEG may detect subtle subclinical neurologic injury as well as more severe cerebral damage.
A number of investigators have urged the routine use of intraoperative EEG monitoring during car- diac surgical procedures as a means of detecting potentially dangerous situations in time to make modifications and avert neurologic injury. 5"7 This study suggests that intraoperative QEEG is indeed a useful prognosticator of later cerebral injury and that it has potential clinical utility during procedures involving HCA both intraoperatively and in the immediate postoperative period.
The study also suggests that QEEG may be a sensitive tool for the detection of cerebral injury in future experimental studies in which interventions designed to improve cerebral protection are screened. The recognition that specific QEEG changes correlate weil with clinical evidence of cerebral injury and that QEEG may detect even subclinical cerebral insults will greatly simplify the evaluation of pharmacologic and other strategies designed to prevent neurologic damage during car- diac surgery in infants with congenital heart disease.
The presence of postoperative shifts in QEEG to slower frequencies in the puppies after 90 minutes of HCA at 18 ° C, a type of EEG change acknowl-
edged to augur a poor prognosis, a-4 correlates with the presence of at least transient clinical cerebral injury in the puppies in this group and suggests that HCA should not be carried out for such a long interval at this temperature. As discussed in greater detail in the accompanying manuscript, cooling to a lower temperature before the start of HCA would likely confer greater protection because it would reduce the level of residual cerebral metabolism during the interval of circulatory arrest. The pres- ence of bursts of EEG activity at 18 ° C in all groups in this study reinforces the notion that the brain is not completely quiescent at 18 ° C.
The presence of some differences between EEG power intraoperatively in the group undergoing 30 minutes of HCA at 18°C and the control group, despite the absence of clinically evident cerebral injury in this group, suggests that even shorter intervals of HCA at 18°C may not be entirely benign. Again, cooling to a lower temperature be- fore the onset of HCA would theoretically improve cerebral protection during short as well as more prolonged intervals of HCA.
The absence of significant differences between LFCPB QEEG data and that of the controls sug- gests that LFCPB is less worrisome than even short periods of HCA in terms of its potential for cerebral injury. The lack of late QEEG evidence of cerebral injury in the LFCPB group in this study is in contrast to our previous study, in which statistically signifi- cant differences between preoperative and late post- operative QEEG were present not only in the 60-minute HCA group but also in the 60-minute LFCPB group, but not in two groups undergoing HCA at colder temperatures. Subsequent analysis of our earlier data by means of the more stringent techniques used in this study fail to confirm that the differences between the groups in the earlier study are truly significant.
9 3 4 Mezrow et al. The Journal of Thoracic and
Cardiovascular Surgery May 1995
We are disappointed by the difficulty in obtaining clear-cut and consistent differences in late QEEG findings: we attribute this difficulty to the greater variability of awake telemetric EEG recordings when compared with intraoperative EEG data and to the very small number of animals in each group in both studies. We recognize that we are in the early stages of exploring the use of QEEG to detect cerebral injury associated with hypothermia: the absence of clear-cut reproducible changes in the late postoperative record- ings suggests that intraoperative and immediate post- operative QEEG may be more sensitive and reliable than later QEEG measurements in our experimental model. The more abundant evidence of clinical neu- rologic injury on postoperative day 1 compared with day 6 in the 90-minute HCA group parallels the seemingly greater sensitivity of QEEG in detecting cerebral injury at earlier time points.
The presence of some differences from control patterns of recovery of E E G power in the 90-minute LFCPB group and the presence of worrisome rnet- abolic changes similar to those in the 90-minute HCA group (as described in the accompanying manuscript) leave open the possibility that colder temperatures for LFCPB as well as for HCA might improve results. The recognition that even LFCPB may not be entirely free of the potential for unde- sirable cerebral sequelae provides added impetus for continuing to explore ways in which cerebral protection during cardiac surgery could be en- hanced. We believe strongly that Q E E G will prove a valuable tool in this endeavor.
We thank William Brett III and Richard Smith for their technical assistance in the conduct of these experiments.
R E F E R E N C E S 1. Mezrow CK, Midulla P, Sadeghi AM, et al. Evaluation
of cerebral metabolism and quantitative electroen- cephalography after hypothermic circulatory arrest and low-ftow cardiopulmonary bypass at different temper- atures. J THORAC CAROIOVASC SURG 1994;107:1006-19.
2. Jonkman E J, Van Huffelen AC, Pfurtscheller G. Quan- titative EEG in cerebral ischemia. In: Lopes da Silva FH, Storm van Leeuwen W, Remond A, ed. Handbook of electroencephalography and clinical neurophysiol- ogy. Vol. 2. Clinical applications of computer analysis of EEG and other neurophysiological signals. New York: Elsevier, 1986:205-37.
3. Bauer G. Cerebral anoxia. In: Niedermeyer E, Lopes da Silva F, ed. Electroencephalography: Basic princi- ples, clinical applications and related fields. 2nd ed. Baltimore: Urban and Schwarzenberg, 1987:383-9.
4. Richards JE, Parmelee AH, Beckwith L. Spectral analysis of infant EEG and behavioral outcome at age five. Electroencephalogr Clin Neurophysiol 1986;64:1-11.
5. Arom KV, Cohen DE, Strobl FT. Effect of intraoper- ative intervention on neurological outcome based on electroencephalographic monitoring during cardiopul- monary bypass. Ann Thorac Surg 1989;48:476-83.
6. Burrows FA, Volgyesi GA, James PD. Clinical evalu- ation of the augmented delta quotient monitor for intraoperative electroencephalographic monitoring of children during surgery and cardiopulmonary bypass for repair of congeuital cardiac defects. Br J Anaesth 1989;63:565-73.
7. Edmonds HL, Griffiths LK, Van der Laken J, Slater DA, Shields CB. Quantitative electroencephalographic monitoring during myocardial revascularization pre- dicts postoperative disorientation and improves out- come. J THORAC CARDIOVASC SUR~ 1992;103:555-63.
Discussion
Dr. Julie A. Swain (Las Vegas, Ner.). The methods that you used are important to find a screening method that does not require survival studies, both for the manpower required to earry out a survival study, as weil as for animal comfort and the political aspects of postoperative recov- ery studies.
What was your pH method in these animals? You had a scatter plot of the 90-minute HCA group which showed that one animal did very poorly and some of them did rauch better. Have you analyzed what possible differences there were in the animals that did relatively better after 90 minutes of HCA?
Dr. Mezrow. We used alpha-stat blood gas manage- ment during the conduct of the study. With regard to the degree of cerebral injury of the surviving animals after 90 minutes of HCA, because of the small number of animals per group we have no explanation why the outcome of some animals was better than others. It is of interest that the two animals that died after 90 minutes of HCA had high cerebral vascular resistance and oxygen extraction before bypass in comparison with the other animals. This may have predisposed the animals to increased risk for cerebral injury when subjected to 90 minutes of HCA.
Dr. Ralph D. Siewers (Pittsburgh, Pa.). What anesthesia were you using in these animals?
Dr. Mezrow. The anesthetic regimen consisted of fen- tanyl supplemented with isoflurane (<1%).
Dr. Siewers. You anticipate that that did not affect EEG function?
Dr. Mezrow. Anesthetic-induced EEG changes cannot be avoided. We minimized anesthetic-related differences between animal groups by administering a continuous infusion of the same dose of fentanyl per kilogram sup- plemented with isoflurane in each animal.
Dr. Siewers. I wondered about the implication for interpretation of intraoperative EEGs, quantitative mon- itoring of EEGs interoperatively, and how much that would depend on various anesthetic techniques.
Copyright © 2022 FDOKUMEN