
Combined Alcohol Exposure and KRAS Mutation in Human ...
23
Citation: Clement, E.J.; Law, H.C.-H.; Qiao, F.; Noe, D.; Trevino, J.G.; Woods, N.T. Combined Alcohol Exposure and KRAS Mutation in Human Pancreatic Ductal Epithelial Cells Induces Proliferation and Alters Subtype Signatures Determined by Multi-Omics Analysis. Cancers 2022, 14, 1968. https://doi.org/10.3390/ cancers14081968 Academic Editors: Claudio Luparello and Rita Ferreira Received: 11 March 2022 Accepted: 7 April 2022 Published: 13 April 2022 Publisher’s Note: MDPI stays neutral with regard to jurisdictional claims in published maps and institutional affil- iations. Copyright: © 2022 by the authors. Licensee MDPI, Basel, Switzerland. This article is an open access article distributed under the terms and conditions of the Creative Commons Attribution (CC BY) license (https:// creativecommons.org/licenses/by/ 4.0/). cancers Article Combined Alcohol Exposure and KRAS Mutation in Human Pancreatic Ductal Epithelial Cells Induces Proliferation and Alters Subtype Signatures Determined by Multi-Omics Analysis Emalie J. Clement 1 , Henry C.-H. Law 1 , Fangfang Qiao 1 , Dragana Noe 2 , Jose G. Trevino 3 and Nicholas T. Woods 1, * 1 Eppley Institute for Research in Cancer and Allied Diseases, Fred & Pamela Buffett Cancer Center, University of Nebraska Medical Center, Omaha, NE 68198, USA; [email protected] (E.J.C.); [email protected] (H.C.-H.L.); [email protected] (F.Q.) 2 Mass Spectrometry and Proteomics Core Facility, University of Nebraska Medical Center, Omaha, NE 68198, USA; [email protected] 3 Department of Surgery, Virginia Commonwealth University, Richmond, VA 23298, USA; [email protected] * Correspondence: [email protected] Simple Summary: Pancreatic ductal adenocarcinoma is a deadly disease wherein alcohol use in- creases the risk of developing this cancer. Mutations in the KRAS oncogene are required for alcohol to promote pancreatic cancer in mice, but little is known about the molecular events associated with the combined exposure of alcohol and mutant KRAS expression in pancreas cells. In this study, we use pancreas cell models with and without mutant KRAS to evaluate the impact of chronic alcohol exposure on transcription and protein expression. This study identifies numerous differentially expressed transcripts and proteins that could influence the emergence of oncogenic features, such as increased proliferation, in pancreas cells. Abstract: Pancreatic Ductal adenocarcinoma (PDAC) is an aggressive cancer commonly exhibiting KRAS-activating mutations. Alcohol contributes to the risk of developing PDAC in humans, and murine models have shown alcohol consumption in the context of KRAS mutation in the pancreas promotes the development of PDAC. The molecular signatures in pancreas cells altered by alcohol exposure in the context of mutant KRAS could identify pathways related to the etiology of PDAC. In this study, we evaluated the combined effects of alcohol exposure and KRAS mutation status on the transcriptome and proteome of pancreatic HPNE cell models. These analyses identified alterations in transcription and translational processes in mutant KRAS cells exposed to alcohol. In addition, multi-omics analysis suggests an increase in the correlation between mRNA transcript and protein abundance in cells exposed to alcohol with an underlying KRAS mutation. Through differential co-expression, SERPINE1 was found to be influential for PDAC development in the context of mutant KRAS and ethanol. In terms of PDAC subtypes, alcohol conditioning of HPNE cells expressing mutant KRAS decreases the Inflammatory subtype signature and increases the Proliferative and Metabolic signatures, as we previously observed in patient samples. The alterations in molecular subtypes were associated with an increased sensitivity to chemotherapeutic agents gemcitabine, irinotecan, and oxaliplatin. These results provide a framework for distinguishing the molecular dysregulation associated with combined alcohol and mutant KRAS in a pancreatic cell line model. Keywords: alcohol; pancreatic cancer; proteomics; KRAS; SERPINE1 Cancers 2022, 14, 1968. https://doi.org/10.3390/cancers14081968 https://www.mdpi.com/journal/cancers
-
Upload
khangminh22 -
Category
Documents
-
view
0 -
download
0
Transcript of Combined Alcohol Exposure and KRAS Mutation in Human ...

�����������������
Citation: Clement, E.J.; Law, H.C.-H.;
Qiao, F.; Noe, D.; Trevino, J.G.;
Woods, N.T. Combined Alcohol
Exposure and KRAS Mutation in
Human Pancreatic Ductal Epithelial
Cells Induces Proliferation and Alters
Subtype Signatures Determined by
Multi-Omics Analysis. Cancers 2022,
14, 1968. https://doi.org/10.3390/
cancers14081968
Academic Editors: Claudio Luparello
and Rita Ferreira
Received: 11 March 2022
Accepted: 7 April 2022
Published: 13 April 2022
Publisher’s Note: MDPI stays neutral
with regard to jurisdictional claims in
published maps and institutional affil-
iations.
Copyright: © 2022 by the authors.
Licensee MDPI, Basel, Switzerland.
This article is an open access article
distributed under the terms and
conditions of the Creative Commons
Attribution (CC BY) license (https://
creativecommons.org/licenses/by/
4.0/).
cancers
Article
Combined Alcohol Exposure and KRAS Mutation inHuman Pancreatic Ductal Epithelial Cells Induces Proliferationand Alters Subtype Signatures Determined byMulti-Omics AnalysisEmalie J. Clement 1, Henry C.-H. Law 1 , Fangfang Qiao 1 , Dragana Noe 2 , Jose G. Trevino 3
and Nicholas T. Woods 1,*
1 Eppley Institute for Research in Cancer and Allied Diseases, Fred & Pamela Buffett Cancer Center, Universityof Nebraska Medical Center, Omaha, NE 68198, USA; [email protected] (E.J.C.);[email protected] (H.C.-H.L.); [email protected] (F.Q.)
2 Mass Spectrometry and Proteomics Core Facility, University of Nebraska Medical Center, Omaha, NE 68198,USA; [email protected]
3 Department of Surgery, Virginia Commonwealth University, Richmond, VA 23298, USA;[email protected]
* Correspondence: [email protected]
Simple Summary: Pancreatic ductal adenocarcinoma is a deadly disease wherein alcohol use in-creases the risk of developing this cancer. Mutations in the KRAS oncogene are required for alcoholto promote pancreatic cancer in mice, but little is known about the molecular events associated withthe combined exposure of alcohol and mutant KRAS expression in pancreas cells. In this study, weuse pancreas cell models with and without mutant KRAS to evaluate the impact of chronic alcoholexposure on transcription and protein expression. This study identifies numerous differentiallyexpressed transcripts and proteins that could influence the emergence of oncogenic features, such asincreased proliferation, in pancreas cells.
Abstract: Pancreatic Ductal adenocarcinoma (PDAC) is an aggressive cancer commonly exhibitingKRAS-activating mutations. Alcohol contributes to the risk of developing PDAC in humans, andmurine models have shown alcohol consumption in the context of KRAS mutation in the pancreaspromotes the development of PDAC. The molecular signatures in pancreas cells altered by alcoholexposure in the context of mutant KRAS could identify pathways related to the etiology of PDAC. Inthis study, we evaluated the combined effects of alcohol exposure and KRAS mutation status on thetranscriptome and proteome of pancreatic HPNE cell models. These analyses identified alterationsin transcription and translational processes in mutant KRAS cells exposed to alcohol. In addition,multi-omics analysis suggests an increase in the correlation between mRNA transcript and proteinabundance in cells exposed to alcohol with an underlying KRAS mutation. Through differentialco-expression, SERPINE1 was found to be influential for PDAC development in the context of mutantKRAS and ethanol. In terms of PDAC subtypes, alcohol conditioning of HPNE cells expressingmutant KRAS decreases the Inflammatory subtype signature and increases the Proliferative andMetabolic signatures, as we previously observed in patient samples. The alterations in molecularsubtypes were associated with an increased sensitivity to chemotherapeutic agents gemcitabine,irinotecan, and oxaliplatin. These results provide a framework for distinguishing the moleculardysregulation associated with combined alcohol and mutant KRAS in a pancreatic cell line model.
Keywords: alcohol; pancreatic cancer; proteomics; KRAS; SERPINE1
Cancers 2022, 14, 1968. https://doi.org/10.3390/cancers14081968 https://www.mdpi.com/journal/cancers
Cancers 2022, 14, 1968 2 of 23
1. Introduction
Pancreatic ductal adenocarcinoma is currently the 4th leading cause of cancer-relateddeaths in the United States, with a 5-year patient survival rate of only 10% due, in part, toits high rates of metastasis and treatment resistance. By the year 2030, PDAC is projected tobe the 2nd leading cause of all deaths in the United States [1]. Improving the survival ofPDAC patients requires a detailed understanding of the underlying molecular signaturesthat impact disease progression and treatment response. Toward this goal, efforts havedetermined that PDAC is not a singular disease and that it can be more accurately describedaccording to several molecular subtypes described by multivariate transcriptomic, genomic,metabolomic, and proteomic signatures [2–6]. These subtypes are predictive of patientsurvival and response to chemotherapy and have the potential to optimize therapeuticinterventions [5,6]. Proteomic analysis from our group identified four distinct subtypesof PDAC (Metabolic, Progenitor-like, Proliferative, and Inflammatory) utilizing patientsamples with longitudinal clinical metadata [6]. This study is one of the first to identify asubtype-specific survival advantage in response to FOLFIRINOX treatment. This importantdiscovery indicates that molecular subtyping could provide a path toward precision therapyof PDAC because subtype is predictive of therapeutic response. However, the genetic andenvironmental factors influencing the development of the different PDAC subtypes requireadditional evaluation.
The four most frequently mutated genes in PDAC are KRAS, TP53, CDKN2A, andSMAD4. Over 90% of PDACs have an activating mutation in KRAS. The G12D mutationin KRAS is the most common genetic alteration and typically precedes mutations in othergenes, as it is found in early pancreatic intraepithelial neoplasia (PanIN) lesions, andsubsequent mutations in the other three genes occur later in PDAC disease progression [7,8].While KRAS is the most commonly observed mutation in PDAC, dysregulation of andmutations in other RAS/RAF/MAPK pathway members are frequently observed in othercancer types. Wild-type KRAS PDAC tumors often display activation of the MAPK pathwaythrough BRAF mutations, suggesting KRAS and BRAF mutations can compensate for oneanother in the activation of the MAPK pathway [9]. Thus, PDAC is highly reliant on theactivation of the MAPK pathway to drive proliferation and initiate oncogenesis.
There are several underlying causes and risk factors associated with developing PDAC,including familial history of PDAC, chronic pancreatitis, smoking, diabetes, obesity, andalcohol consumption [10], but their associations with the development of certain subtypesof the disease are poorly defined.
Initially recognized as a co-carcinogen [11], more recent research has shown thatethanol and its associated byproducts are carcinogens. Alcohol use is a known risk factorfor several cancers, including breast, stomach, esophageal, colon, liver, and PDAC can-cers [11–15]. Chronic alcohol exposure in cancer cell models have shown that it increasestumor aggressiveness by promoting an invasive and migratory phenotype [16]. Alcoholcan cause liver damage/cirrhosis, immunosuppression, vitamin deficiencies, and enhanceoxidative stress, all of which can contribute to tumorigenesis [11,17].
Recent evidence indicates that alcohol intake promotes PDAC development in thecontext of mutated KRAS [18,19], which suggests that intrinsic and extrinsic factors cooper-atively influence the initiation of PDAC development. Our research suggests that some riskfactors, including alcohol and tobacco use, influence subtype classification [6]. A history ofalcohol use impairs the frequency of presentation of the Inflammatory subtype, suggestingthat alcohol may influence the development of PDAC subtypes. However, the molecularpathways impacted by alcohol use and how these contribute to subtype development re-mains to be determined. Therefore, in this study, we used human non-transformed humanpancreatic nestin expressing (HPNE) and KRAS G12D transformed HPNE (HPNE-KRAS)cells to investigate the effects of alcohol on gene and protein expression signatures in a cellmodel of early PDAC development. This multi-omics study delineates the alcohol-inducedproteomic and transcriptomic changes associated with cell proliferation and PDAC subtypesignatures dependent upon KRAS mutation status.
Cancers 2022, 14, 1968 3 of 23
2. Materials and Methods2.1. Cell Lines and Culture Conditions
HPNE cells were kindly provided by Dr. Ouelette [20]. HPNE-KRAS cells containa constituently active KRAS G12D mutation [20]. HPNE and HPNE-KRAS cells werecultured in Dulbecco’s Modified Eagle Medium (DMEM; Corning, Manassas, VA, USA),supplemented with 25% M3: Base F media (INCELL, San Antonio, TX, USA), 5% FetalBovine Serum (FBS), human Epidermal Growth Factor (hEGF) (SigmaAldrich, St. Louis,MO, USA), penicillin-streptomycin, and Amphotericin B (Corning, Manassas, VA, USA).Cells were incubated at 37 ◦C with 5% CO2. Ethanol (EtOH)-conditioned cells (HPNEEtOH or HPNE-KRAS EtOH) were cultured in 100 mM ethanol (Calbiochem, Milipore,Billerica, MA, USA) for 6 months, as previously described [19]. Fresh ethanol was addedevery 2–3 days following sub culturing.
2.2. Proliferation Assay
Following 6 months of ethanol treatment or untreated control, HPNE, HPNE EtOH,HPNE-KRAS and HPNE-KRAS EtOH cells were seeded at a density of 1000 cells per wellin 6-well plates, for four time points. Cells for three biological replicates for each conditionwere manually counted with a hemocytometer every 48 h for a duration of 8 days. Cellgrowth rate (hour−1) was calculated by growth_rate = ln((N(t)/N(0))/t, where N(t) isthe number of cells at the final time point, N(0) is the number of cells at time 0, and t isthe final time point. The cell doubling time (hours) for each cell line was calculated bydoubling_time = ln(2)/growth_rate.
2.3. Caspase-3 Apoptosis Assay
Cells were lysed in CHAPS lysis buffer (1% CHAPS, 150 mM NaCl, 10 mM HEPESpH 7.4 with protease and phosphatase inhibitors) and spun down at 13,000 rpm for 10 minat 4 ◦C to collect the lysate. The protein concentration of the lysate was quantified andthe Caspase assay buffer (1% CHAPS, 200 mM HEPES pH 7.4, 50 mM DTT, 20 mM EDTA,Caspase Substrate (N-Acetyl-Asp-Glu-Val-Asp-7-amido-4-methylcoumarin; Sigma, A1086)and cell lysates were incubated in the dark and at room temperature for 1 h in 96-wellplates. The fluorescence was read at 360 nm excitation/460 nm emission by FLUOstarOptima (BMG Labtech, Cary, NC, USA). Caspase activity was calculated by subtractingwells excluding the Caspase Substrate, as previously described [21].
2.4. Cell Cycle Analysis
Ethanol-treated and untreated cells were washed 2× in PBS and harvested followingtrypsinization. A total of 1,000,000 cells were aliquoted for each sample condition and fixedin 70% ethanol for 1 h. Cells were washed in PBS and incubated in 1 mL Telford reagent(1 mM EDTA disodium salt, 2.5 U/mL RNAse A, 75 µM propidium iodide, 0.1% TritonX-100 in PBS) for 30 min and analyzed by flow cytometry by FACSCalibur. The data wereanalyzed by ModFit LT (version 4.0.5). The gating strategy can be found in Figure S1.
2.5. Acetaldehyde Assay
Acetaldehyde concentrations were measured by the Acetaldehyde Assay Kit (MAK321;Sigma Aldrich, St. Louis, MO, USA). Ethanol-treated and untreated cells were seeded at1000 cells per well in a 96-well plate and incubated overnight. One hour prior to as-say measurement, 100 mM ethanol was added to selected replicates. Supernatants weretransferred to a new 96-well plate and the assay reaction mixes were added to the appropri-ate wells, following the manual’s instruction. Fluorescence was read at 530 nm/585 nmexcitation/emission by FLUOstar Optima (BMG biotech, Ortenberg, Germany).
2.6. Cellular ROS Measurements
Reactive Oxygen Species (ROS) were measured by the Cellular ROS Assay Kit (AbCam,ab113851). Cells were grown in 10 cm dishes in HPNE media (20,000 cells per condition)
Cancers 2022, 14, 1968 4 of 23
and were aliquoted and incubated in 2′,7′-dichlorofluorescin diacetate (DCFDA) for 30 minat 37 ◦C to stain cellular ROS. Following incubation, cells were treated with or withoutethanol. Positive control cells were treated with tert-butyl hydrogen peroxide (THBP) for 3h to induce ROS production and allow an appropriate time to acquire an optimal signal.DCFDA staining was omitted for the negative control cells. Cellular ROS staining wasanalyzed by flow cytometry (488 nm excitation, 535 nm detection) by FACSCalibur andthe data were analyzed by ModFit LT (version 4.0.5). The gating strategy can be found inFigure S2.
2.7. RNA Sequencing (RNA-Seq)
Ethanol-treated and untreated cells were grown in 10 cm dishes. For each condition,1 × 106 cells were collected following trypsinization. The Qiagen RNeasy Plus Mini kit(Qiagen, Hilden, Germany) was used to extract total cellular RNA via the manual’s instruc-tions. RNA quality was checked with a Fragment Analyzer prior to library preparation andsequencing. Libraries were generated using 1000 ng of total RNA from each sample and theTrueSeq V2 RNA-Seq kit (Illumina Inc., San Diego, CA, USA), following the recommendedprocedure. Libraries were multiplexed and sequenced on the NextSeq550 DNA Analyzer(Illumina) to generate a total of approximately 12 million pairs of 75 bp reads for each sam-ple. FastQC was used to ensure the quality of the reads were adequate for alignment andquantification. STAR was used to align sequencing reads to the human genome primaryassembly (GRCh38) downloaded from Ensembl, with Ensembl annotation. Read countswere determined by HTSeq using the default union parameter. A pseudocount of one wasadded to all raw transcript counts, and normalization factors were calculated and appliedto the data with the size.factor() function through DESeq2 in R (median of ratios method).
2.8. Peptide Preparation
For protein extract preparation, cells were washed with PBS, lysed with RIPA lysisbuffer, and briefly sonicated. Protein concentrations were measured with a BCA proteinassay (Pierce, ThermoFisher Scientific, Rockford, IL, USA, Cat#: 23227) using BSA asa standard. Briefly, protein lysates were reconstituted in 100 mM triethylammoniumbicarbonate (TEAB) and incubated with 100 mM Tris(2-carboxyethyl)phosphine (TCEP)at 55 ◦C for 1 h. The samples were subsequently incubated in 375 mM iodoacetamide for30 min, protected from light, and then acetone precipitated, and trypsin digested (2.5 ugTrypsin) overnight at 37 ◦C, as previously described [22].
2.9. TMT Tagging
Tryptic peptide concentrations were measured with the Thermo Colorimetric PeptideAssay (Pierce, ThermoFisher Scientific, Rockford, IL, USA, Cat#: 23275) and incubatedwith anhydrous acetonitrile-dissolved TMT reagents (ThermoFisher Scientific, Rockford, IL,USA, TMT10 Plex Ref 90309 Lot TE264412) for 1 h at room temperature. After quenchingthe reaction with hydroxylamine, the samples were combined and fractionated with PierceHigh pH Reversed-Phase Peptide Fractionation Kit (ThermoFisher Scientific, Cat#: 84868).
2.10. LC/MS-MS and Protein Identification
Peptides generated by typsin digest were analyzed by LC-MS/MS on a Dionex NanoUltimate 3000 RSLCnano system (ThermoFisher Scientific) coupled to an Orbitrap FusionLumos mass spectrometer (ThermoFisher Scientific). The samples were first injected onto atrap column (Acclaim PepMap™ 100, 75 µm × 2 cm, ThermoFisher Scientific) for 3 min ata flow rate of 4 µL/min before switching in line with the main column. Separation wasperformed on a C18 nano column (EASY-Spray™, 2 µm 75 µm × 500 mm, ThermoFisherScientific) at 300 nL/min with a linear gradient from 0–45% over 120 min. The LC aqueousmobile phase contained 0.1% (v/v) formic acid in water and the organic mobile phasecontained 0.1% (v/v) formic acid in 80% (v/v) acetonitrile. Mass spectra for the elutedpeptides were acquired on a Fusion Lumos mass spectrometer in data-dependent mode
Cancers 2022, 14, 1968 5 of 23
using a mass range of m/z 375–1500, resolution 120,000, AGC target: standard, maximuminjection time: 150 ms. Data-dependent MS2 spectra were acquired by CID, collisionenergy: 35%, AGC target: standard, maximum injection time: auto, isolation window:2 m/z. MS3 spectra were acquired with HCD activation, HCD collision energy: 65%,Orbitrap resolution: 50,000, normalized AGC target: 200%.
Database searching: The mass spectra were extracted using Proteome Discoverer(2.1.1.21). All MS/MS samples were analyzed using Sequest HT. Sequest HT was setup to search the SwissProt database (SwissProt TaxID = 9606 v2017-10-25, 42,252 entries)assuming the digestion enzyme trypsin allowing for up to 2 missed protease cleavagesites. Sequest HT was searched with a fragment ion mass tolerance of 0.60 Da and aparent ion tolerance of up to 10.0 PPM. TMT6plex/+229.163 Da (on any N-Terminus),and carbamidomethyl of cysteine were specified as fixed modifications. Oxidation ofmethionine and TMT6plex/+229.163 Da of Lysine were specified as variable modifications.False discovery rates were determined by searching the decoy database.
2.11. Bioinformatics and Statistical Analysis2.11.1. Differential Expression
Following DESeq2 normalization, RNA-Seq transcripts were categorized by biotype(Ensembl). Transcripts in the EtOH-treated conditions that were±2-fold from the untreatedcontrol cell line were considered differentially expressed to ensure confidence in transcriptexpression changes with single replicates for each condition. For the MA plot, all transcriptbiotypes were included. Log2-fold changes were calculated for EtOH-treated comparedto the untreated control and the average of each transcript was calculated including allconditions. For the Venn diagram, only transcripts that were determined to be protein-coding transcripts were included.
For proteomics values, the median expression values of the ion reporter abundanceratio values were used for comparing the fold change of the EtOH-treated and untreatedcontrol cells. A fold change of ±1.25 between the EtOH-treated and untreated cells wasused to determine differentially expressed proteins. Statistical significance was calculatedby Students T-test and the adjusted p-values (using the false-discovery rate (FDR)) werecalculated in R with the p.adjust() function.
R was used to generate a hierarchical clustering heatmap for the RNA Seq and pro-teomics data set. The Euclidian distance was calculated, and clustering was performedby the hclust function in R (hclust complete clustering). The number of clusters was de-termined from the elbow plots for each data set. For the Principal Components Analysis,HPNE replicate 2 was omitted as an outlier based on falling outside of the Hotelling Ellipse(95% confidence interval).
2.11.2. GO Term Analysis
GO term analysis for RNA Seq and proteomics data was done through DAVID Bioin-formatics using the filtered GO FAT ontology terms (no background set was included).Differentially expressed proteins and genes with a ±1.25 and ±2.0-fold change were usedfor GO term enrichment, respectively, including genes/proteins, regardless of significance.GO bubble plots were generated in R with the GOplot package. The z-score was calculatedby (up/down)/sq(count), where up and down are the number of assigned genes upregu-lated or downregulated in the data, and count is the number of genes assigned to a term.All genes and proteins for the highest transcript changes and SERPINE1 were used as inputfor GO term analysis, through DAVID Bioinformatics using the filtered GO FAT ontologyterms.
2.11.3. Multiple Co-Inertia Analysis
Multiple Co-Inertia Analysis was done in R with the omicade4 package. The 3247unique proteins from the proteomics data were cross referenced with the 23,190 transcripts
Cancers 2022, 14, 1968 6 of 23
from the RNA Seq data set. A total of 3181 proteins matched, with the values found in theRNA Seq data set used for input into omicade4.
2.11.4. Differential CoExpression
To investigate which proteins were coordinately expressed in the HPNE and howethanol and mutant KRAS altered coordinately expressed proteins, we performed a dif-ferential co-expression analysis. Proteins with any missing value were excluded from theanalysis. Pearson correlation coefficients for each protein–protein pair were calculated foreach condition separately using the psych::corr.test in R. Correlations that were greater than0.75 in HPNE, HPNE EtOH, and HPNE-KRAS, but less than −0.75 in HPNE-KRAS EtOHwere considered for the negative correlation network, while correlations that were less than−0.75 in HPNE, HPNE EtOH, and HPNE-KRAS, but greater than 0.75 in HPNE-KRASEtOH were considered for the positive correlation network. Networks were generated inCytoscape 3.7.2.
2.11.5. TCGA Data
SERPINE1 protein expression data from PDAC patients from the TGCA FirehoseLegacy was accessed through the cBioportal [23,24]. Data for the Kaplan Meier sur-vival analysis curves was accessed through the Human Protein Atlas [25] (https://www.proteinatlas.org/ENSG00000106366-SERPINE1/pathology/pancreatic+cancer (accessedon 10 December 2021)) and plotted in R using the survival and survminer packages.
2.12. Quantitative Reverse Transcription Polymerase Chain Reaction (qRT-PCR)
RNA from each cellular condition was extracted with the Qiagen RNeasy Plus Minikit (Qiagen, Hilden, Germany; Cat#: 74134). In addition, 1 µg of RNA was reverse tran-scribed with the iScript cDNA Synthesis Kit (BioRad, Hercules, CA, USA) and 100 ngof cDNA was used with iTaq Universal SYBR Green Supermix for gene quantificationby the CFX96 Real time PCR detection system (BioRad). Experimental procedures wereperformed according to the manufacturer’s instructions. Relative gene expression andCq values were determined by the CFX Manager Software. Values are represented asmean delta Cq to show the relative change across both cell lines and all conditions.GAPDH was used as a control for normalization. Primers (listed 5′-3′): CD81 forward:5′-ATTTCGTCTTCTGGCTGGCTG-3′, CD81 reverse: 5′-TATACACAGGCGGTGATGGC-3′,NT5E forward: 5′-GTATCCGGTCGCCCATTGAT-3′, NT5E reverse: 5′-AAAGGCCTTCTTCAGGGTGG-3′, PRPF19 forward: 5′-TGCCAAGTTCCCAACCAAGT-3′, PRPF19 reverse: 5′-ATTGGGGACCGACCAAATCC-3′, RHOG forward: 5′-GCCTGCTCATCTGCTACACA-3′,RHOG reverse: 5′-CTCTGCGCGCTGTAATTGTC-3′, RUVBL1 forward: 5′-AGAGCACTACGAAGACGCAG-3′, RUVBL1 reverse: 5′-GCGCATTAGCCACATCCAAG-3′, ZPR1 for-ward: 5′-GGAACAACACGGAGATCCAG-3′, ZPR1 reverse: 5′-CTCGCAGTTGGTAGCCATGA-3′.
2.13. Western Blotting
Cells were washed with PBS, lysed with RIPA lysis buffer, and put on ice. Proteinconcentrations were measured with the NanoDrop One Microvolume UV Spectrophotome-ter (ThermoFisher) A280 Protein measurement. Protein lysates were run on SDS-PAGEgels and transferred to PVDF membranes. Membranes were blocked for 30 min withLicor blocking buffer and incubated with 1:1000 primary antibody dilutions in 2.5% BSAovernight. Membranes were washed 3× in TBS-T and incubated with 1:4000 HRP- conju-gated secondary antibodies for 1 h and developed with SuperSignal West Femto MaximumSensitivity Substrate (ThermoFisher, Cat. No. 34096). Blots were scanned with the OdysseyFc imager (Li-Cor) and signal intensity was analyzed with Image Studio (Li-Cor, version5.2). Antibodies used: CD81 (Santa Cruz Biotechnology, Dallas, TX, USA, sc-166029), NT5E(Cell Signaling Technology, Danvers, MA, USA, 13160S), PRPF19 (Santa Cruz Biotechnol-ogy, sc-514338), RHOG (Santa Cruz Biotechnology, sc-80015), RUVBL1 (Cell Signaling
Cancers 2022, 14, 1968 7 of 23
Technology, 12300S), ZPR1 (Santa Cruz Biotechnology, sc-398241), GAPDH (Cell SignalingTechnology, 5174T), HSC70 (Santa Cruz Biotechnology, sc-7298).
2.14. Chemotherapeutic Agent Treatment and Viability Assay
HPNE, HPNE EtOH, and HPNE-KRAS cells were plated at a density of 5000 cells perwell in a 96-well plate. HPNE-KRAS EtOH cells were plated at 1000 cells per well (dueto the high proliferation rate, the wells were 100% confluent by day 2, plated at 5000 cellsper well, and complicated cell viability measurements). Cells were allowed to adhereovernight, and the drug was added at 24 h. Plates were incubated at 37 ◦C, 5% CO2 for3 days. Cell viability was measured by CellTiter-Glo 2.0 (Promega, Madison, WI, USA,G9242), as indicated by the instruction manual. Luminescence was read by the FLUOstarOptima (BMG biotech). Gemcitabine (cat#: S1714), Irinotecan HCl Trihydrate (cat#: S2217),and Oxaliplatin (cat#: S1224) were purchased from Selleckchem (Houston, TX, USA).
3. Results3.1. Chronic Ethanol Treatment Promotes Proliferation in KRAS Mutated HPNE Cells
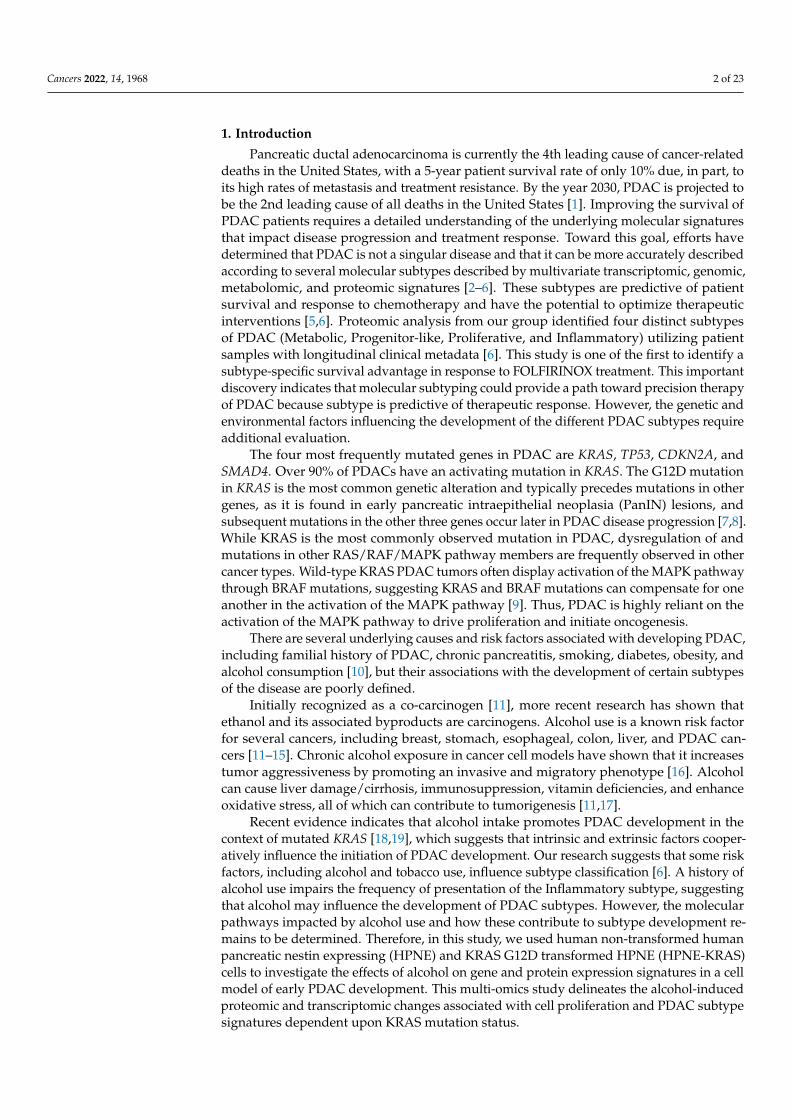
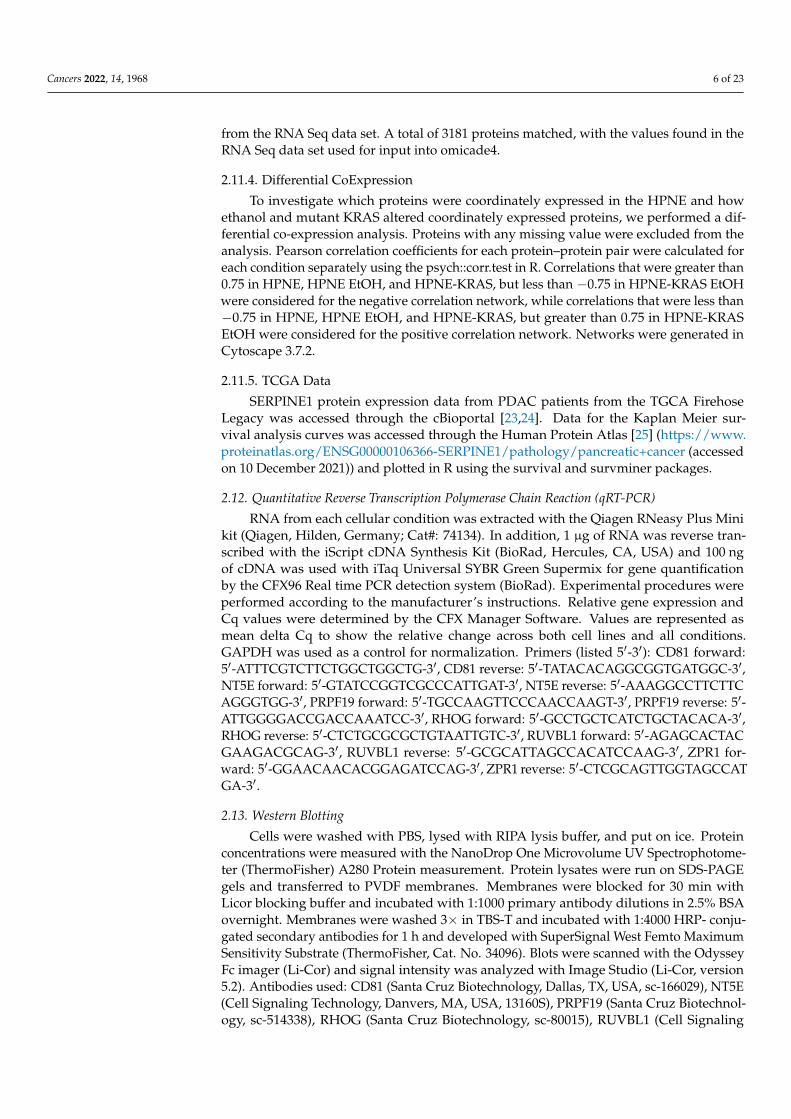
Non-transformed human pancreatic nestin expressing (HPNE) and mutant KRASG12D-transformed HPNE (HPNE-KRAS) cells were used in this study to evaluate theimpact of alcohol in a defined cellular and genetic context relevant to the most commonearly mutation event in pancreatic cancer [20]. Alcohol use by humans is difficult to modelbecause of the variability of behaviors between individuals. Alcohol exposure occurs overthe course years and decades and may affect molecular, cellular, or tissues through eitherchronic and/or acute exposures. To model a lifetime worth of alcohol exposure in a shortperiod of 6 months, we treated the HPNE and HPNE-KRAS cells with 100 mM EtOH every2–3 days as previously described [26]. This allowed us to examine the effect of ethanolexposure on wild-type KRAS and constitutively active KRAS (G12D) expressing pancreascells. After 6 months of EtOH treatment, phenotypic changes in cell proliferation wereevaluated and a multi-omics analysis of the proteome and transcriptome was performed(Figure 1A).
Both HPNE and HPNE-KRAS cells tolerated the ethanol exposure and significant celldeath was not observed during the treatment period. Six months after beginning ethanoltreatment, the HPNE cells did not exhibit any difference in proliferation between the controland EtOH treatment conditions (Figure 1B). However, the HPNE-KRAS cells treated withEtOH displayed a significant increase in their proliferation rate compared to control cells(Figure 1C). Analysis of the doubling times of these cells in culture confirmed EtOHtreatment promotes a faster growth rate in HPNE-KRAS compared to control (Figure 1D).The increased proliferation in EtOH-treated HPNE-KRAS cells was associated with anincrease in the percentage of cells in the G1 phase, with lower numbers in the G2 and Sphases, compared to the un-treated HPNE-KRAS control cells. Whereas, in HPNE cellstreated with EtOH, there is a decrease in cells in G1 phase and an increase in cells in the G2and S phases, compared to the untreated HPNE cells (Figures 1E and S1).
The rapidly expanding cell population observed in the ethanol-conditioned HPNE-KRAS cell culture could also be influenced by changes in the rates of cell death. Chronicethanol treatment has been shown to induce caspase-3 activation and apoptosis in variousnon-transformed cell types, including β-cells and T-cells [27–31]. In our experiments, therewas no difference in caspase-3 activity between control and EtOH-conditioned HPNE cells.However, EtOH-conditioned HPNE-KRAS cells displayed a decrease in caspase-3 activityin steady-state cultures (Figure 1F). Together, these results suggest that changes in the cellcycle and decreased apoptotic rates contribute to the decreased population doubling timeof EtOH-treated HPNE-KRAS cells.
Cancers 2022, 14, 1968 8 of 23Cancers 2022, 14, x FOR PEER REVIEW 8 of 25
Figure 1. Ethanol promotes HPNE cell population expansion in a KRAS-dependent manner. (A)
Schematic of the study design. RNA-Seq and quantitative proteomics were used to characterize the
impact of EtOH conditioning in the context of KRAS mutations in non-transformed pancreatic
HPNE cells. (B,C) Cell population growth curves. In total, 1000 cells were plated per well and
counted every 2 days over an 8-day period for HPNE (B) and HPNE-KRAS (C) cell lines. Mean ±
standard error of the mean (SEM); n = 3; significant p-values determined by Student’s t-test are in-
dicated; NS, not significant; *, p-value ≤ 0.05. (D) Cell population doubling time determined from
the cell counting study depicted in (B,C). (E) Cell cycle profiles were determined by PI staining and
FACs analysis for the indicated cell lines and treatments. Mean ± SEM; n = 3; p-value determined by
Student’s t-test. (F) The steady-state levels of Caspase-3 activity in the indicated cells and treatments
represented as the change in fluorescent units per µg whole protein lysate per 1 h reaction time
(∆FU/µg protein/hr). Mean ± SEM; n = 3.
Both HPNE and HPNE-KRAS cells tolerated the ethanol exposure and significant cell
death was not observed during the treatment period. Six months after beginning ethanol
treatment, the HPNE cells did not exhibit any difference in proliferation between the con-
trol and EtOH treatment conditions (Figure 1B). However, the HPNE-KRAS cells treated
with EtOH displayed a significant increase in their proliferation rate compared to control
cells (Figure 1C). Analysis of the doubling times of these cells in culture confirmed EtOH
Figure 1. Ethanol promotes HPNE cell population expansion in a KRAS-dependent manner.(A) Schematic of the study design. RNA-Seq and quantitative proteomics were used to characterizethe impact of EtOH conditioning in the context of KRAS mutations in non-transformed pancreaticHPNE cells. (B,C) Cell population growth curves. In total, 1000 cells were plated per well andcounted every 2 days over an 8-day period for HPNE (B) and HPNE-KRAS (C) cell lines. Mean± standard error of the mean (SEM); n = 3; significant p-values determined by Student’s t-test areindicated; NS, not significant; *, p-value ≤ 0.05. (D) Cell population doubling time determined fromthe cell counting study depicted in (B,C). (E) Cell cycle profiles were determined by PI staining andFACs analysis for the indicated cell lines and treatments. Mean ± SEM; n = 3; p-value determined byStudent’s t-test. (F) The steady-state levels of Caspase-3 activity in the indicated cells and treatmentsrepresented as the change in fluorescent units per µg whole protein lysate per 1 h reaction time(∆FU/µg protein/h). Mean ± SEM; n = 3.
3.2. Mutant KRAS and Ethanol Treatment Increases Ribosomal and RNA Metabolism GeneExpression
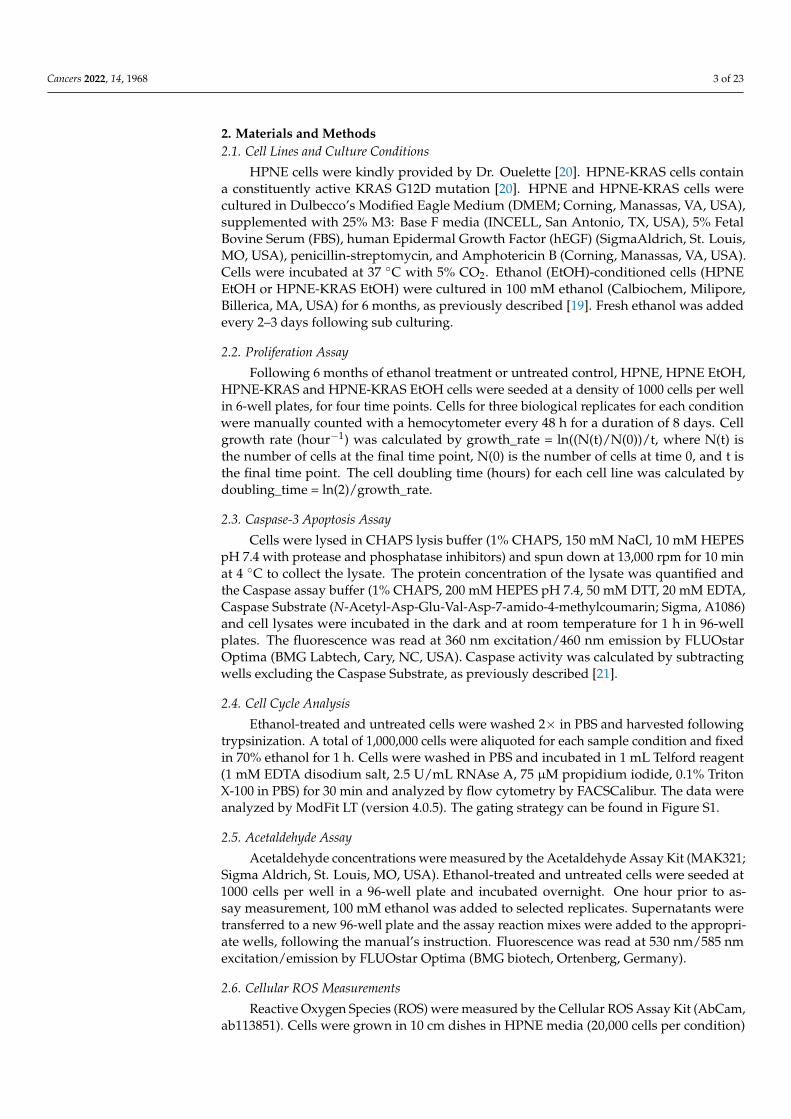
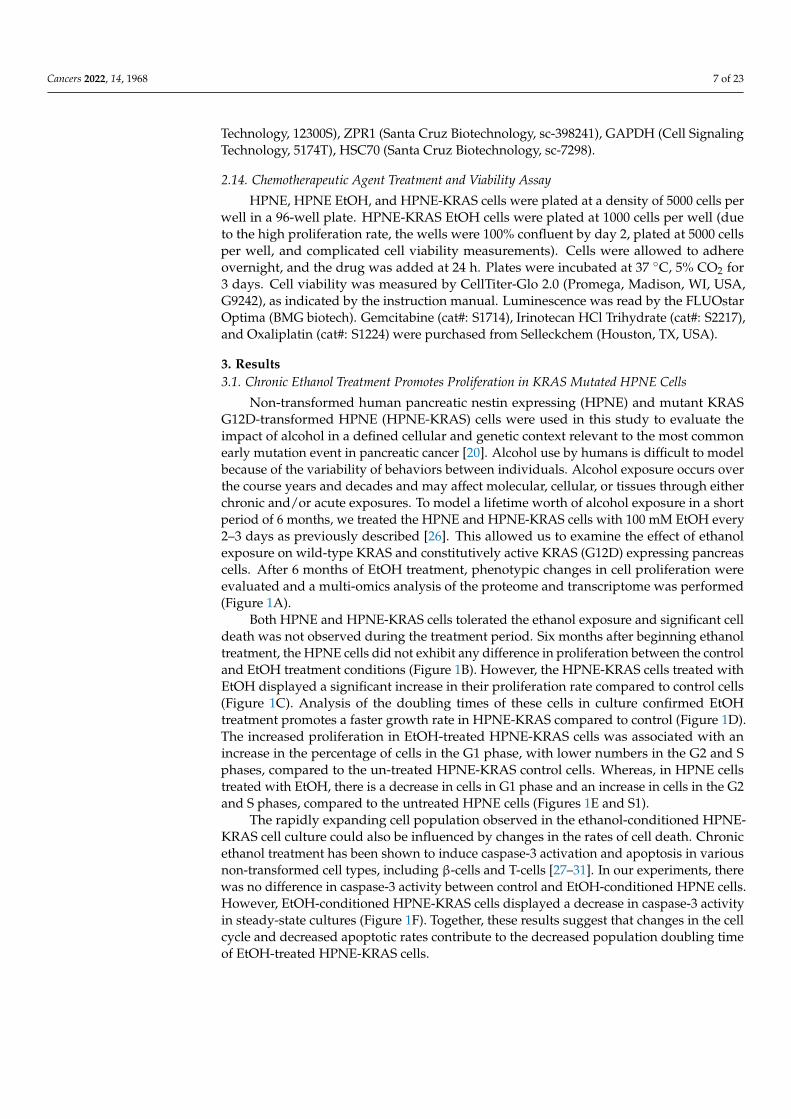
RNA-Seq analysis was performed on the HPNE cell lines to identify gene expressionsignatures affected by mutant KRAS and EtOH exposure, which identified 6 clusters ofsimilarly expressed genes (Figures 2A and S3A; Table S1). Larger fold-change differences
Cancers 2022, 14, 1968 9 of 23
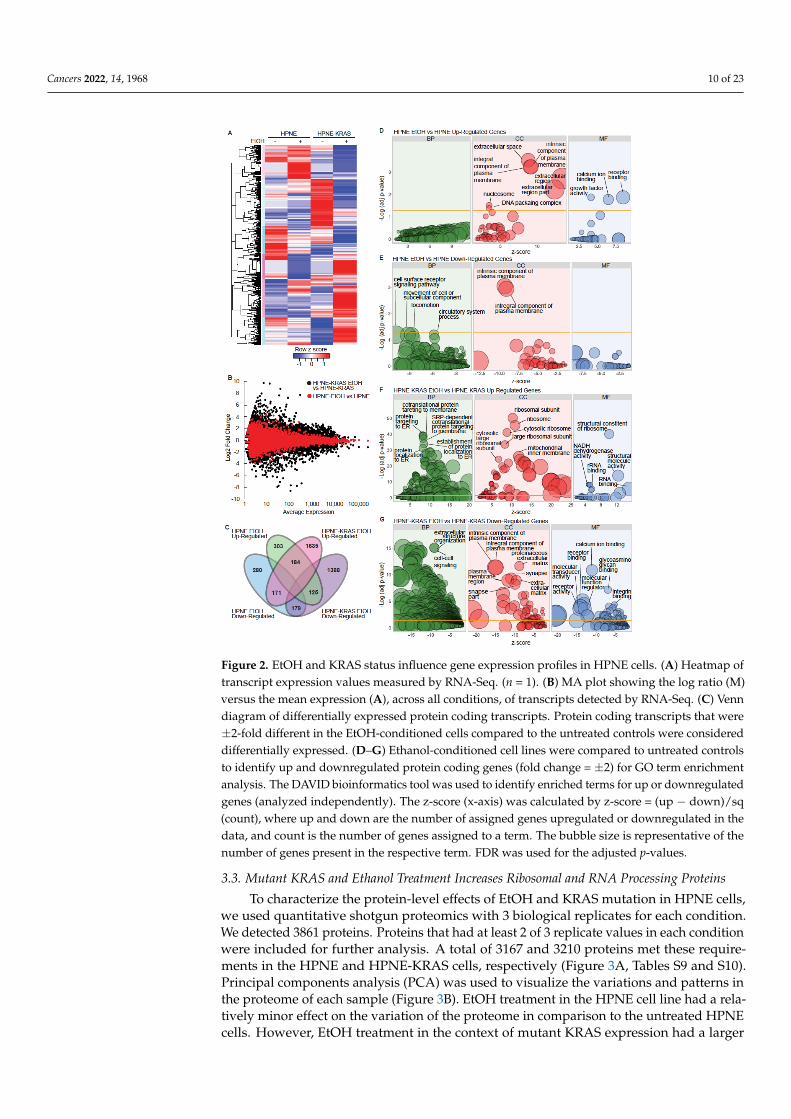
in gene expression due to EtOH conditioning were observed in the context of HPNE-KRASmutant cells in comparison to wild-type HPNE cells (Figure 2B). HPNE-KRAS cells alsoexhibit a larger number of differentially expressed transcripts (±2-fold change) associatedwith EtOH conditioning (7017 transcripts), compared to the HPNE cells (3105 transcripts)(Figure S3B). In protein coding genes only, there were 997 genes with a fold change of2 or greater, while 728 had a fold change of −2 or lower (Table S2). There were 184commonly upregulated genes and 179 commonly downregulated genes (±2-fold changes)in both HPNE EtOH and HPNE-KRAS EtOH cells (Figure 2C), suggesting conservedinfluence of EtOH conditioning on the regulation of these genes independent of KRASmutation status. However, 1635 upregulated (Table S3, Figure 2C) and 1388 downregulated(Table S4, Figure 2C) genes were uniquely associated with EtOH conditioning in HPNE-KRAS cells compared to 303 upregulated and 280 downregulated genes unique to EtOHconditioning in HPNE cells (Figure 2C). Together, these results suggest that an underlyingKRAS mutation in pancreatic cells may exacerbate the dysregulation of gene expressioncaused by prolonged ethanol exposure.
To evaluate the common characteristics of these differentially expressed protein codinggenes, gene ontology (GO) term enrichment analysis was performed using DAVID [32,33]for both the HPNE (Figure 2D,E) and HPNE-KRAS (Figure 2F,G) cell lines. The upregu-lated gene set associated with EtOH conditioning in HPNE cells is enriched for cellularcomponent (CC) terms corresponding to the extracellular region and components of theplasma membrane, while enriched molecular function (MF) terms for receptor binding,calcium ion binding, and growth factor activity were identified (Figure 2D, Table S5). Therewere no significantly enriched biological process (BP) terms for the gene set upregulatedby EtOH in HPNE cells. Enriched GO terms in the downregulated genes associated withEtOH conditioning in HPNE cells were cell surface receptor signaling, movement of cellor subcellular component in the BP category, and plasma membrane components in theCC category (Figure 2E, Table S6), similar to the results observed in the upregulated geneset (Figure 2D). In EtOH-conditioned HPNE-KRAS cells, upregulated genes were enrichedin protein targeting to the plasma membrane and ER terms in the BP category, ribosomalcomponent terms in the CC category, and rRNA metabolism/processing terms in the MFcategory (Figure 2F, Table S7). Genes downregulated in HPNE-KRAS ethanol treated cellswere enriched in extracellular matrix and structure organization and cell–cell signaling (BP);plasma membrane and extracellular matrix components, neuron, and synapse parts (CC);calcium ion binding, receptor binding and activity, and glycosaminoglycan binding (MF)(Figure 2G, Table S8). The combined impact of KRAS mutation and EtOH conditioning onribosomal gene expression suggested that protein expression profiles could be affected.
Cancers 2022, 14, 1968 10 of 23Cancers 2022, 14, x FOR PEER REVIEW 10 of 25
Figure 2. EtOH and KRAS status influence gene expression profiles in HPNE cells. (A) Heatmap of
transcript expression values measured by RNA-Seq. (n = 1). (B) MA plot showing the log ratio (M)
versus the mean expression (A), across all conditions, of transcripts detected by RNA-Seq. (C) Venn
diagram of differentially expressed protein coding transcripts. Protein coding transcripts that were
±2-fold different in the EtOH-conditioned cells compared to the untreated controls were considered
differentially expressed. (D–G) Ethanol-conditioned cell lines were compared to untreated controls
to identify up and downregulated protein coding genes (fold change = ±2) for GO term enrichment
analysis. The DAVID bioinformatics tool was used to identify enriched terms for up or downregu-
lated genes (analyzed independently). The z-score (x-axis) was calculated by z-score = (up −
down)/sq (count), where up and down are the number of assigned genes upregulated or downreg-
ulated in the data, and count is the number of genes assigned to a term. The bubble size is repre-
sentative of the number of genes present in the respective term. FDR was used for the adjusted p-
values.
To evaluate the common characteristics of these differentially expressed protein cod-
ing genes, gene ontology (GO) term enrichment analysis was performed using DAVID
Figure 2. EtOH and KRAS status influence gene expression profiles in HPNE cells. (A) Heatmap oftranscript expression values measured by RNA-Seq. (n = 1). (B) MA plot showing the log ratio (M)versus the mean expression (A), across all conditions, of transcripts detected by RNA-Seq. (C) Venndiagram of differentially expressed protein coding transcripts. Protein coding transcripts that were±2-fold different in the EtOH-conditioned cells compared to the untreated controls were considereddifferentially expressed. (D–G) Ethanol-conditioned cell lines were compared to untreated controlsto identify up and downregulated protein coding genes (fold change = ±2) for GO term enrichmentanalysis. The DAVID bioinformatics tool was used to identify enriched terms for up or downregulatedgenes (analyzed independently). The z-score (x-axis) was calculated by z-score = (up − down)/sq(count), where up and down are the number of assigned genes upregulated or downregulated in thedata, and count is the number of genes assigned to a term. The bubble size is representative of thenumber of genes present in the respective term. FDR was used for the adjusted p-values.
3.3. Mutant KRAS and Ethanol Treatment Increases Ribosomal and RNA Processing Proteins
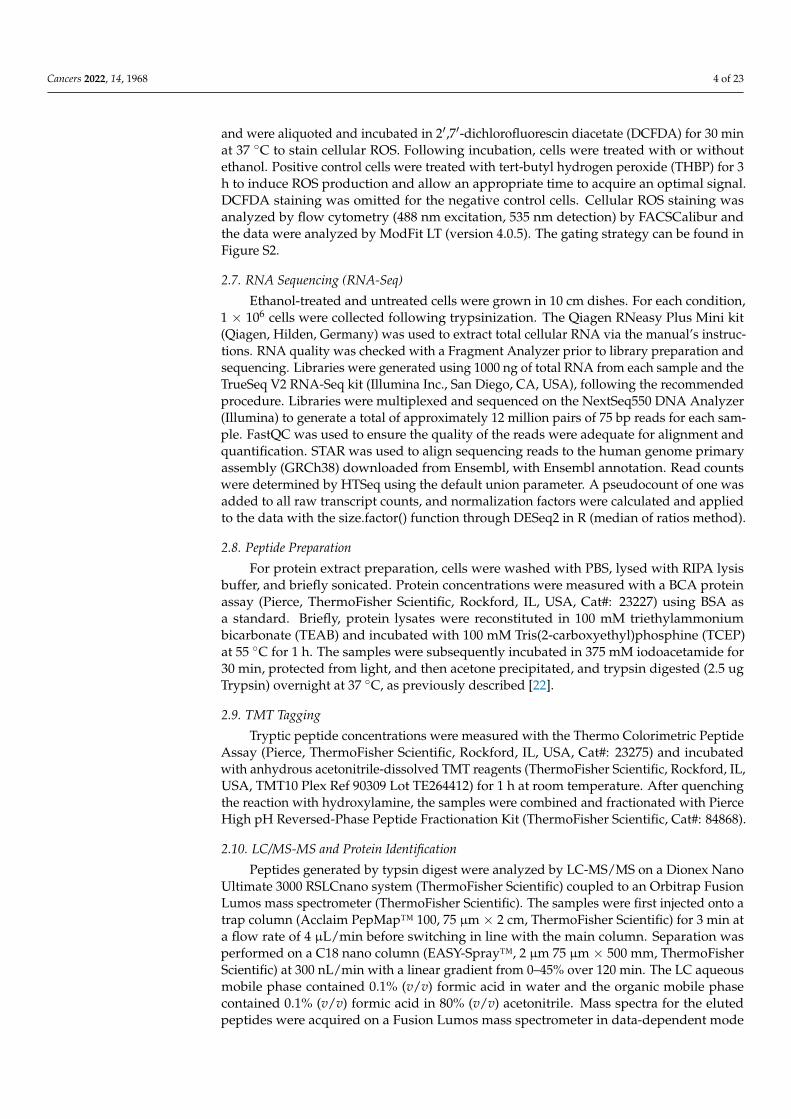
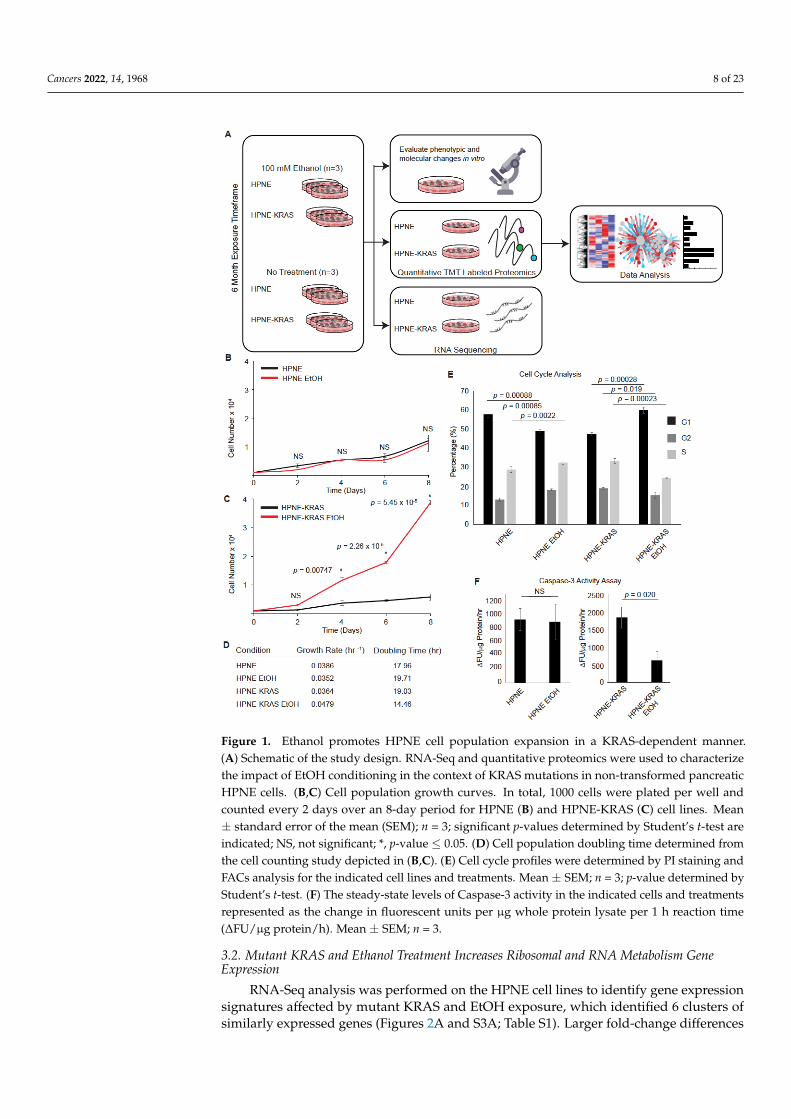
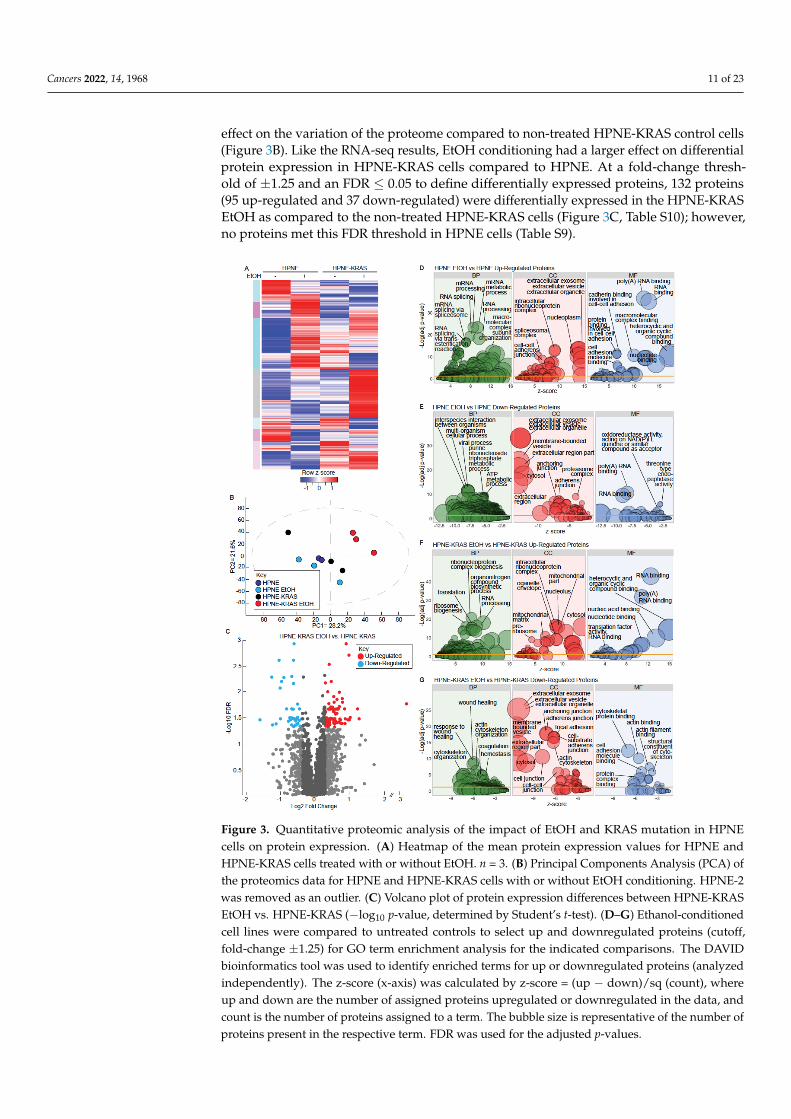
To characterize the protein-level effects of EtOH and KRAS mutation in HPNE cells,we used quantitative shotgun proteomics with 3 biological replicates for each condition.We detected 3861 proteins. Proteins that had at least 2 of 3 replicate values in each conditionwere included for further analysis. A total of 3167 and 3210 proteins met these require-ments in the HPNE and HPNE-KRAS cells, respectively (Figure 3A, Tables S9 and S10).Principal components analysis (PCA) was used to visualize the variations and patterns inthe proteome of each sample (Figure 3B). EtOH treatment in the HPNE cell line had a rela-tively minor effect on the variation of the proteome in comparison to the untreated HPNEcells. However, EtOH treatment in the context of mutant KRAS expression had a larger
Cancers 2022, 14, 1968 11 of 23
effect on the variation of the proteome compared to non-treated HPNE-KRAS control cells(Figure 3B). Like the RNA-seq results, EtOH conditioning had a larger effect on differentialprotein expression in HPNE-KRAS cells compared to HPNE. At a fold-change thresh-old of ±1.25 and an FDR ≤ 0.05 to define differentially expressed proteins, 132 proteins(95 up-regulated and 37 down-regulated) were differentially expressed in the HPNE-KRASEtOH as compared to the non-treated HPNE-KRAS cells (Figure 3C, Table S10); however,no proteins met this FDR threshold in HPNE cells (Table S9).
Cancers 2022, 14, x FOR PEER REVIEW 12 of 25
Figure 3. Quantitative proteomic analysis of the impact of EtOH and KRAS mutation in HPNE cells
on protein expression. (A) Heatmap of the mean protein expression values for HPNE and HPNE-
KRAS cells treated with or without EtOH. n = 3. (B) Principal Components Analysis (PCA) of the
proteomics data for HPNE and HPNE-KRAS cells with or without EtOH conditioning. HPNE-2 was
removed as an outlier. (C) Volcano plot of protein expression differences between HPNE-KRAS
EtOH vs. HPNE-KRAS (−log10 p-value, determined by Student’s t-test). (D–G) Ethanol-conditioned
cell lines were compared to untreated controls to select up and downregulated proteins (cutoff, fold-
change ±1.25) for GO term enrichment analysis for the indicated comparisons. The DAVID bioin-
formatics tool was used to identify enriched terms for up or downregulated proteins (analyzed in-
dependently). The z-score (x-axis) was calculated by z-score = (up − down)/sq (count), where up and
down are the number of assigned proteins upregulated or downregulated in the data, and count is
the number of proteins assigned to a term. The bubble size is representative of the number of pro-
teins present in the respective term. FDR was used for the adjusted p-values.
We performed GO term enrichment analysis through DAVID to determine signifi-
cant terms associated with differentially expressed proteins (±1.25-fold change) in both
the HPNE and HPNE-KRAS cell lines (Figure 3D–G). Biological process (BP) terms en-
riched in HPNE EtOH up-regulated proteins were primarily associated with RNA
Figure 3. Quantitative proteomic analysis of the impact of EtOH and KRAS mutation in HPNEcells on protein expression. (A) Heatmap of the mean protein expression values for HPNE andHPNE-KRAS cells treated with or without EtOH. n = 3. (B) Principal Components Analysis (PCA) ofthe proteomics data for HPNE and HPNE-KRAS cells with or without EtOH conditioning. HPNE-2was removed as an outlier. (C) Volcano plot of protein expression differences between HPNE-KRASEtOH vs. HPNE-KRAS (−log10 p-value, determined by Student’s t-test). (D–G) Ethanol-conditionedcell lines were compared to untreated controls to select up and downregulated proteins (cutoff,fold-change ±1.25) for GO term enrichment analysis for the indicated comparisons. The DAVIDbioinformatics tool was used to identify enriched terms for up or downregulated proteins (analyzedindependently). The z-score (x-axis) was calculated by z-score = (up − down)/sq (count), whereup and down are the number of assigned proteins upregulated or downregulated in the data, andcount is the number of proteins assigned to a term. The bubble size is representative of the number ofproteins present in the respective term. FDR was used for the adjusted p-values.
Cancers 2022, 14, 1968 12 of 23
We performed GO term enrichment analysis through DAVID to determine significantterms associated with differentially expressed proteins (±1.25-fold change) in both theHPNE and HPNE-KRAS cell lines (Figure 3D–G). Biological process (BP) terms enrichedin HPNE EtOH up-regulated proteins were primarily associated with RNA processingand splicing, cellular component (CC) terms included ribonucleoprotein and spliceosomalcomplex, molecular function terms (MF) included cadherin binding involved in cell-celladhesion, and poly(A) and RNA binding (Figure 3D, Table S11). The top terms for with thedown-regulated proteins in HPNE cells treated with EtOH were cell interspecies interactionbetween organisms (BP) extracellular organelle (CC), oxidoreductase, and threonine-typeendopeptidase activity (MF) (Figure 3E, Table S12). Poly(A) and RNA binding were alsosignificant terms associated with both down-regulated proteins and up-regulated proteins.Like the RNA Seq data, we observed more enriched terms in HPNE-KRAS EtOH up- anddown-regulated proteins for all three GO categories (Figure 3F,G). Up-regulated proteinswere enriched in protein targeting to the ER and ribosomes; functions related to translation,rRNA/RNA processing and binding appeared frequently in the GO term results (Figure 3F,Table S13). Downregulated genes were enriched in extracellular structure organization,components of the plasma membrane, and calcium ion binding (Figure 3G, Table S14).
3.4. Ethanol Metabolism Is Marginally Impacted Following Chronic Ethanol Conditioning
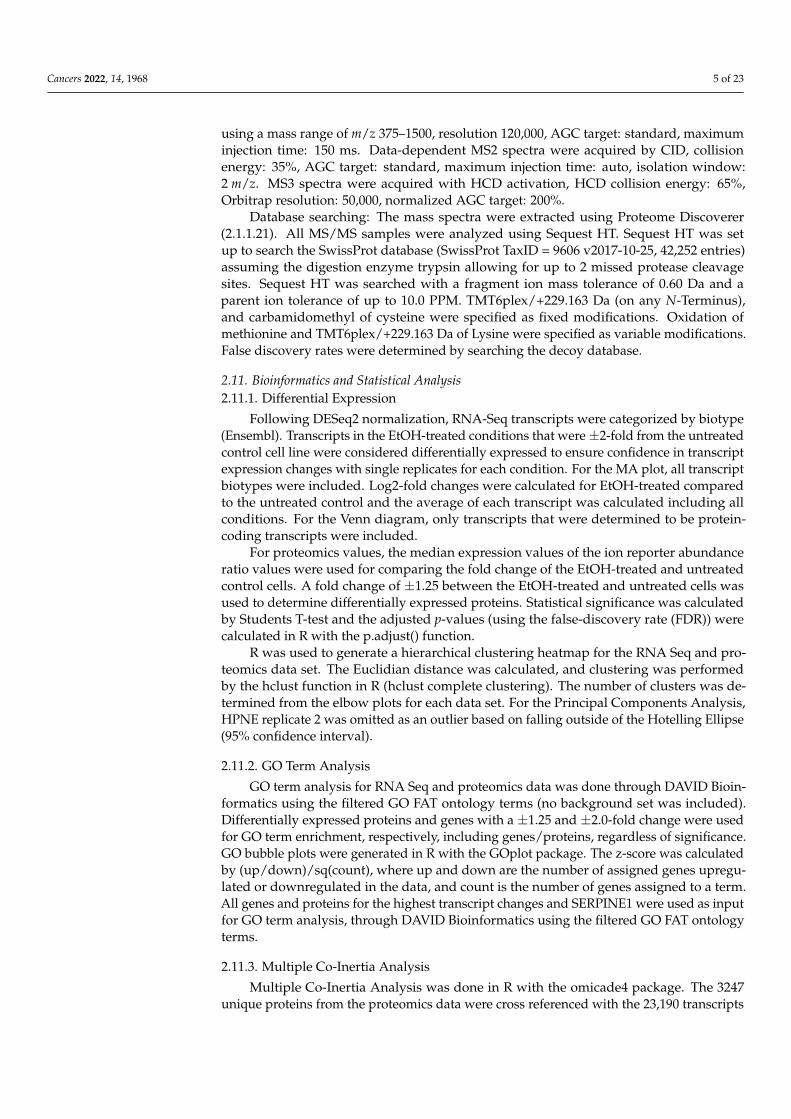
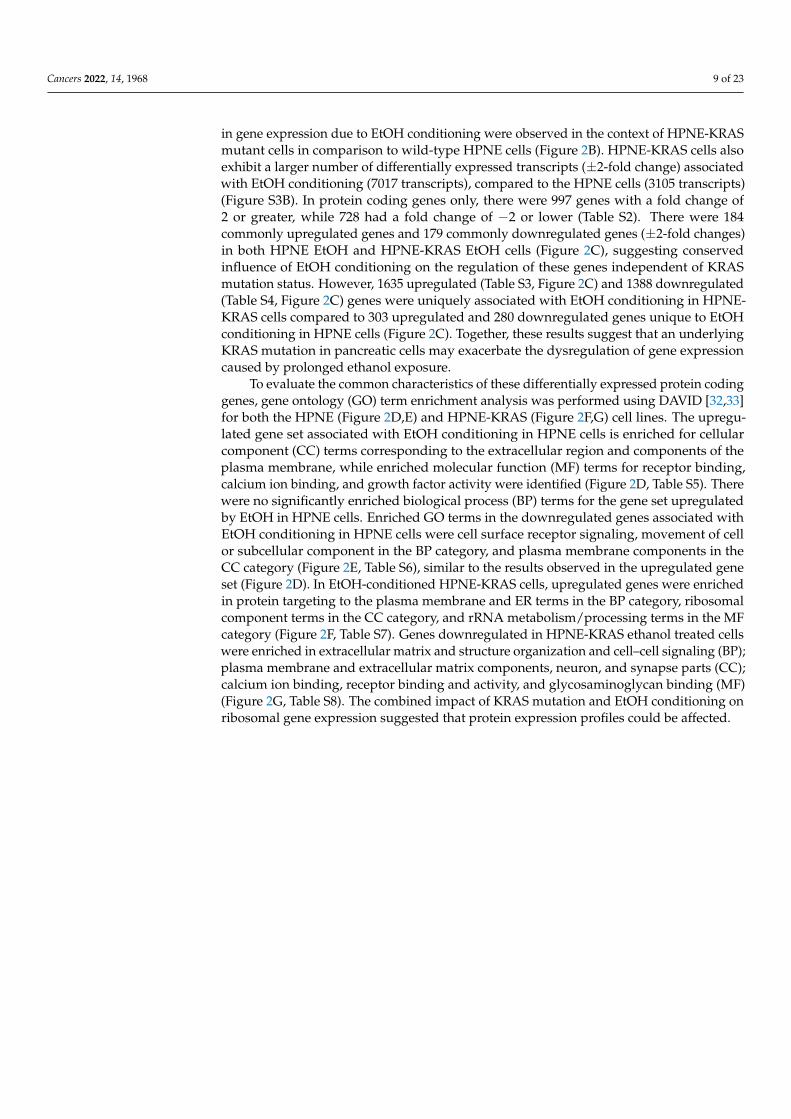
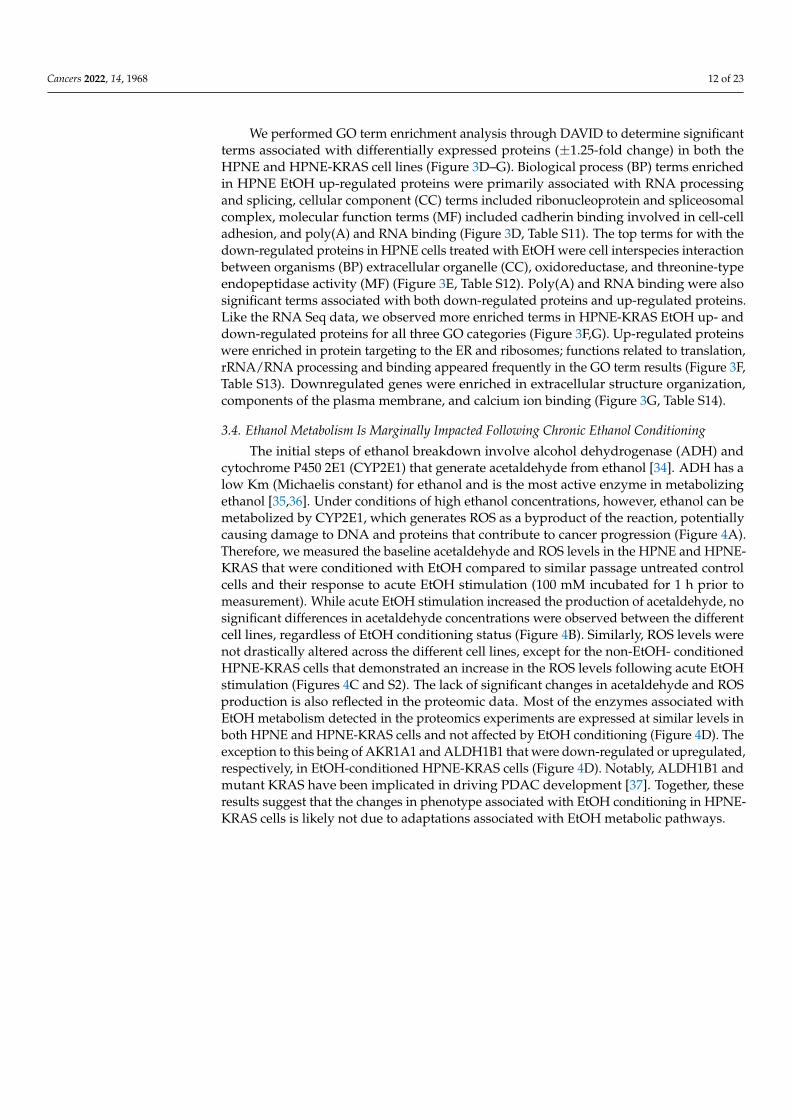
The initial steps of ethanol breakdown involve alcohol dehydrogenase (ADH) andcytochrome P450 2E1 (CYP2E1) that generate acetaldehyde from ethanol [34]. ADH has alow Km (Michaelis constant) for ethanol and is the most active enzyme in metabolizingethanol [35,36]. Under conditions of high ethanol concentrations, however, ethanol can bemetabolized by CYP2E1, which generates ROS as a byproduct of the reaction, potentiallycausing damage to DNA and proteins that contribute to cancer progression (Figure 4A).Therefore, we measured the baseline acetaldehyde and ROS levels in the HPNE and HPNE-KRAS that were conditioned with EtOH compared to similar passage untreated controlcells and their response to acute EtOH stimulation (100 mM incubated for 1 h prior tomeasurement). While acute EtOH stimulation increased the production of acetaldehyde, nosignificant differences in acetaldehyde concentrations were observed between the differentcell lines, regardless of EtOH conditioning status (Figure 4B). Similarly, ROS levels werenot drastically altered across the different cell lines, except for the non-EtOH- conditionedHPNE-KRAS cells that demonstrated an increase in the ROS levels following acute EtOHstimulation (Figures 4C and S2). The lack of significant changes in acetaldehyde and ROSproduction is also reflected in the proteomic data. Most of the enzymes associated withEtOH metabolism detected in the proteomics experiments are expressed at similar levels inboth HPNE and HPNE-KRAS cells and not affected by EtOH conditioning (Figure 4D). Theexception to this being of AKR1A1 and ALDH1B1 that were down-regulated or upregulated,respectively, in EtOH-conditioned HPNE-KRAS cells (Figure 4D). Notably, ALDH1B1 andmutant KRAS have been implicated in driving PDAC development [37]. Together, theseresults suggest that the changes in phenotype associated with EtOH conditioning in HPNE-KRAS cells is likely not due to adaptations associated with EtOH metabolic pathways.
Cancers 2022, 14, 1968 13 of 23Cancers 2022, 14, x FOR PEER REVIEW 14 of 25
Figure 4. The effects of EtOH conditioning on ethanol metabolism in HPNE and HPNE-KRAS cells.
(A) Simplified depiction of the ethanol metabolic pathway. Metabolites are in black text; enzymes
are in blue circles. (B) Measurement of acetaldehyde abundance with and without acute EtOH ex-
posure for 1 h in both the parental- and EtOH-conditioned HPNE and HPNE-KRAS cell lines. Mean
± SEM; n = 3. (C) Cellular Reactive Oxygen Species (ROS) measurements by DCFDA staining for the
indicated cell line and treatment condition. Mean ± SEM; n = 3. (D) Protein expression of ethanol
breakdown metabolism enzymes detected by quantitative TMT labeled proteomics. Mean ± SEM; n
= 3. p-values were determined by Student’s t-test.
3.5. Mutant KRAS Cells Treated with Ethanol Display Increased Correlation between RNA and
Protein Expression through Multi-Omics Comparison
Multiple co-inertia analysis (MCIA) was performed to observe the relationship be-
tween the RNA-Seq and proteomics data for each sample. The RNA-Seq and proteomics
data differ in the HPNE, HPNE EtOH, and HPNE-KRAS conditions, as depicted by an
increased separation of data type points for the similar conditions (Figure 5A). Interest-
ingly, the HPNE-KRAS EtOH RNA Seq and proteomics data exhibited a high level of sim-
ilarity (Figure 5A), suggesting an increased correlation between transcriptional and trans-
lational processes in these cells.
Figure 4. The effects of EtOH conditioning on ethanol metabolism in HPNE and HPNE-KRAS cells.(A) Simplified depiction of the ethanol metabolic pathway. Metabolites are in black text; enzymes arein blue circles. (B) Measurement of acetaldehyde abundance with and without acute EtOH exposurefor 1 h in both the parental- and EtOH-conditioned HPNE and HPNE-KRAS cell lines. Mean ± SEM;n = 3. (C) Cellular Reactive Oxygen Species (ROS) measurements by DCFDA staining for the indicatedcell line and treatment condition. Mean ± SEM; n = 3. (D) Protein expression of ethanol breakdownmetabolism enzymes detected by quantitative TMT labeled proteomics. Mean ± SEM; n = 3. p-valueswere determined by Student’s t-test.
3.5. Mutant KRAS Cells Treated with Ethanol Display Increased Correlation between RNA andProtein Expression through Multi-Omics Comparison
Multiple co-inertia analysis (MCIA) was performed to observe the relationship be-tween the RNA-Seq and proteomics data for each sample. The RNA-Seq and proteomicsdata differ in the HPNE, HPNE EtOH, and HPNE-KRAS conditions, as depicted by anincreased separation of data type points for the similar conditions (Figure 5A). Interestingly,the HPNE-KRAS EtOH RNA Seq and proteomics data exhibited a high level of similarity(Figure 5A), suggesting an increased correlation between transcriptional and translationalprocesses in these cells.
Cancers 2022, 14, 1968 14 of 23Cancers 2022, 14, x FOR PEER REVIEW 15 of 25
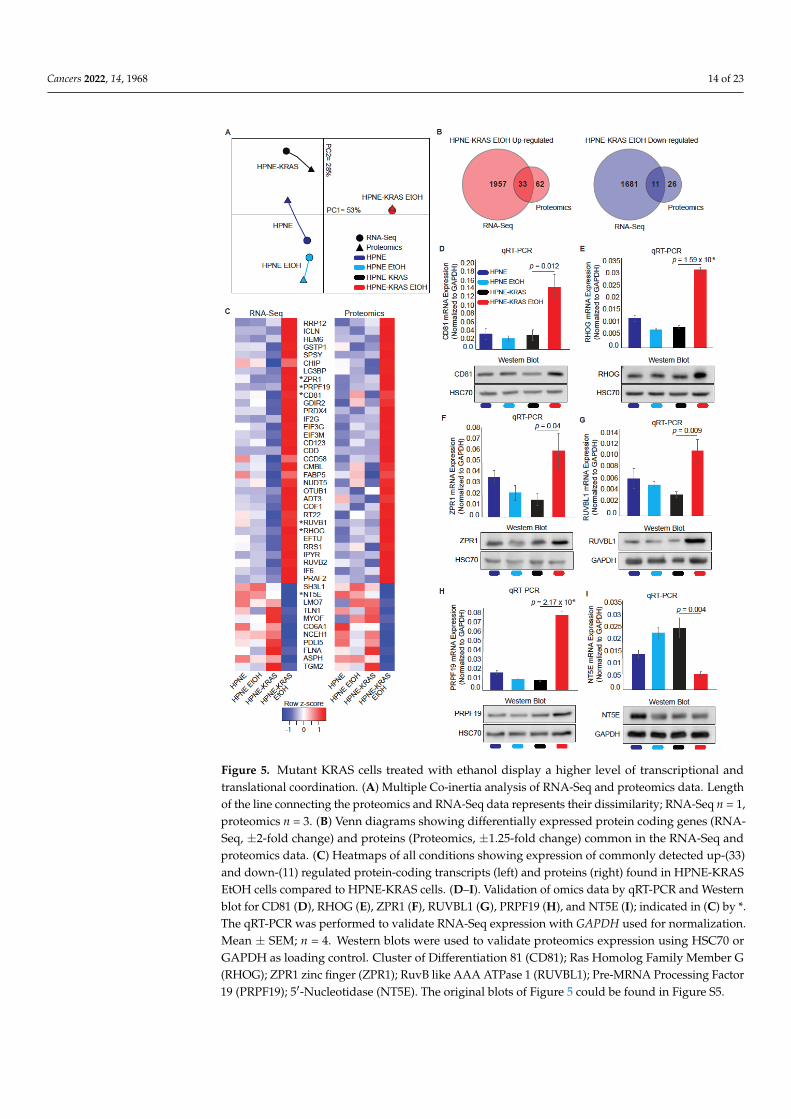
Figure 5. Mutant KRAS cells treated with ethanol display a higher level of transcriptional and trans-
lational coordination. (A) Multiple Co-inertia analysis of RNA-Seq and proteomics data. Length of
the line connecting the proteomics and RNA-Seq data represents their dissimilarity; RNA-Seq n = 1,
proteomics n = 3. (B) Venn diagrams showing differentially expressed protein coding genes (RNA-
Seq, ±2-fold change) and proteins (Proteomics, ±1.25-fold change) common in the RNA-Seq and pro-
teomics data. (C) Heatmaps of all conditions showing expression of commonly detected up-(33) and
down-(11) regulated protein-coding transcripts (left) and proteins (right) found in HPNE-KRAS
EtOH cells compared to HPNE-KRAS cells. (D–I). Validation of omics data by qRT-PCR and West-
ern blot for CD81 (D), RHOG (E), ZPR1 (F), RUVBL1 (G), PRPF19 (H), and NT5E (I); indicated in
(C) by *. The qRT-PCR was performed to validate RNA-Seq expression with GAPDH used for nor-
malization. Mean ± SEM; n = 4. Western blots were used to validate proteomics expression using
HSC70 or GAPDH as loading control. Cluster of Differentiation 81 (CD81); Ras Homolog Family
Member G (RHOG); ZPR1 zinc finger (ZPR1); RuvB like AAA ATPase 1 (RUVBL1); Pre-MRNA
Processing Factor 19 (PRPF19); 5′-Nucleotidase (NT5E). The original blots of Figure 5 could be found
in Figure S5.
Using the HPNE-KRAS EtOH data sets, we identified 44 transcripts and proteins
consistently up- (n = 33) or down-regulated (n = 11) in both the RNA-Seq and proteomics
Figure 5. Mutant KRAS cells treated with ethanol display a higher level of transcriptional andtranslational coordination. (A) Multiple Co-inertia analysis of RNA-Seq and proteomics data. Lengthof the line connecting the proteomics and RNA-Seq data represents their dissimilarity; RNA-Seq n = 1,proteomics n = 3. (B) Venn diagrams showing differentially expressed protein coding genes (RNA-Seq, ±2-fold change) and proteins (Proteomics, ±1.25-fold change) common in the RNA-Seq andproteomics data. (C) Heatmaps of all conditions showing expression of commonly detected up-(33)and down-(11) regulated protein-coding transcripts (left) and proteins (right) found in HPNE-KRASEtOH cells compared to HPNE-KRAS cells. (D–I). Validation of omics data by qRT-PCR and Westernblot for CD81 (D), RHOG (E), ZPR1 (F), RUVBL1 (G), PRPF19 (H), and NT5E (I); indicated in (C) by *.The qRT-PCR was performed to validate RNA-Seq expression with GAPDH used for normalization.Mean ± SEM; n = 4. Western blots were used to validate proteomics expression using HSC70 orGAPDH as loading control. Cluster of Differentiation 81 (CD81); Ras Homolog Family Member G(RHOG); ZPR1 zinc finger (ZPR1); RuvB like AAA ATPase 1 (RUVBL1); Pre-MRNA Processing Factor19 (PRPF19); 5′-Nucleotidase (NT5E). The original blots of Figure 5 could be found in Figure S5.
Cancers 2022, 14, 1968 15 of 23
Using the HPNE-KRAS EtOH data sets, we identified 44 transcripts and proteins con-sistently up- (n = 33) or down-regulated (n = 11) in both the RNA-Seq and proteomics datasets (Figure 5B,C). Genes/proteins with known roles in proliferative processes, includingPRP19, CD81, ZPR1, RUVB1, RHOG, and NT5E were selected to validate the RNA Seqand proteomics data by both q-RT-PCR and western blot analysis (Figure 5D–I). Proteinand mRNA levels of CD81 (Figure 5D), RHOG (Figure 5E), ZPR1 (Figure 5F), RUVBL1(Figure 5G), and PRPF19 (Figure 5H) were increased in response to EtOH conditioning inHPNE-KRAS cells, whereas NT5E (Figure 5I) mRNA was decreased and protein levels wereonly marginally reduced in these cells. These results are mostly consistent with both theproteomics and RNA-Seq data (Figure 5C indicated by asterisks preceding gene/proteinnames).
3.6. Differential Co-Expression Analysis Identifies SERPINE1 as a Highly Correlated ProteinUnique to EtOH Conditioned HPNE-KRAS Cells
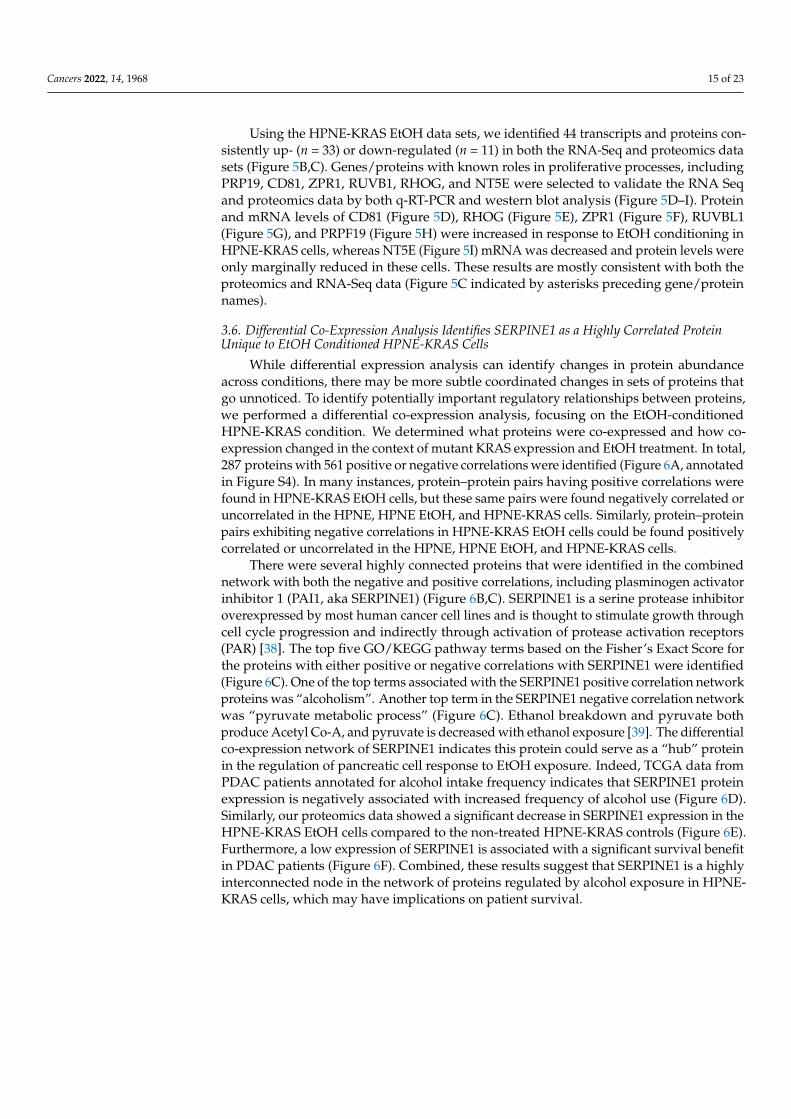
While differential expression analysis can identify changes in protein abundanceacross conditions, there may be more subtle coordinated changes in sets of proteins thatgo unnoticed. To identify potentially important regulatory relationships between proteins,we performed a differential co-expression analysis, focusing on the EtOH-conditionedHPNE-KRAS condition. We determined what proteins were co-expressed and how co-expression changed in the context of mutant KRAS expression and EtOH treatment. In total,287 proteins with 561 positive or negative correlations were identified (Figure 6A, annotatedin Figure S4). In many instances, protein–protein pairs having positive correlations werefound in HPNE-KRAS EtOH cells, but these same pairs were found negatively correlated oruncorrelated in the HPNE, HPNE EtOH, and HPNE-KRAS cells. Similarly, protein–proteinpairs exhibiting negative correlations in HPNE-KRAS EtOH cells could be found positivelycorrelated or uncorrelated in the HPNE, HPNE EtOH, and HPNE-KRAS cells.
There were several highly connected proteins that were identified in the combinednetwork with both the negative and positive correlations, including plasminogen activatorinhibitor 1 (PAI1, aka SERPINE1) (Figure 6B,C). SERPINE1 is a serine protease inhibitoroverexpressed by most human cancer cell lines and is thought to stimulate growth throughcell cycle progression and indirectly through activation of protease activation receptors(PAR) [38]. The top five GO/KEGG pathway terms based on the Fisher’s Exact Score forthe proteins with either positive or negative correlations with SERPINE1 were identified(Figure 6C). One of the top terms associated with the SERPINE1 positive correlation networkproteins was “alcoholism”. Another top term in the SERPINE1 negative correlation networkwas “pyruvate metabolic process” (Figure 6C). Ethanol breakdown and pyruvate bothproduce Acetyl Co-A, and pyruvate is decreased with ethanol exposure [39]. The differentialco-expression network of SERPINE1 indicates this protein could serve as a “hub” proteinin the regulation of pancreatic cell response to EtOH exposure. Indeed, TCGA data fromPDAC patients annotated for alcohol intake frequency indicates that SERPINE1 proteinexpression is negatively associated with increased frequency of alcohol use (Figure 6D).Similarly, our proteomics data showed a significant decrease in SERPINE1 expression in theHPNE-KRAS EtOH cells compared to the non-treated HPNE-KRAS controls (Figure 6E).Furthermore, a low expression of SERPINE1 is associated with a significant survival benefitin PDAC patients (Figure 6F). Combined, these results suggest that SERPINE1 is a highlyinterconnected node in the network of proteins regulated by alcohol exposure in HPNE-KRAS cells, which may have implications on patient survival.
Cancers 2022, 14, 1968 16 of 23Cancers 2022, 14, x FOR PEER REVIEW 17 of 25
Figure 6. Co-expression network analysis identifies SERPINE1 as a highly interconnected protein
involved in alcohol-treated and mutant KRAS HPNE cells. (A) Pearson correlation values for each
protein–protein pair were determined for HPNE, HPNE EtOH, HPNE-KRAS, and HPNE-KRAS
EtOH proteomics expression. Correlations that were ≥ +0.75 in the HPNE-KRAS EtOH and ≤−0.75
in the HPNE, HPNE EtOH, and HPNE-KRAS were considered positive correlations. Correlations
that were ≤−0.75 in the HPNE-KRAS EtOH and ≥ +0.75 in the HPNE, HPNE EtOH, and HPNE-KRAS
were considered negative correlations. Edges represent the presence of a positive (red) or negative
(blue) correlation between connected proteins. Nodes represent proteins that have positive correla-
tions (red), negative correlations (blue), or positive and negative correlations (grey) (n = 3). (B) Pos-
itive and negative correlations found for SERPINE1 from the overview network (A). (C) Proteins
with positive or negative correlations with SERPINE1 were selected for GO term and KEGG path-
way enrichment analysis (analyzed separately). The top four non-redundant terms based on Fisher’s
Exact Score for both positively and negatively correlated proteins are represented with the selected
term and fold enrichment. (D) TCGA protein expression for SERPINE1 in patients with various
alcohol exposure. (E) SERPINE1 protein expression determined by quantitative proteomics. n.s, not
significant. (F) Kaplan–Meier survival probability for patients with high (red) or low (blue) SER-
PINE1 expression.
Figure 6. Co-expression network analysis identifies SERPINE1 as a highly interconnected proteininvolved in alcohol-treated and mutant KRAS HPNE cells. (A) Pearson correlation values for eachprotein–protein pair were determined for HPNE, HPNE EtOH, HPNE-KRAS, and HPNE-KRASEtOH proteomics expression. Correlations that were ≥ +0.75 in the HPNE-KRAS EtOH and ≤−0.75in the HPNE, HPNE EtOH, and HPNE-KRAS were considered positive correlations. Correlationsthat were ≤−0.75 in the HPNE-KRAS EtOH and ≥ +0.75 in the HPNE, HPNE EtOH, and HPNE-KRAS were considered negative correlations. Edges represent the presence of a positive (red)or negative (blue) correlation between connected proteins. Nodes represent proteins that havepositive correlations (red), negative correlations (blue), or positive and negative correlations (grey)(n = 3). (B) Positive and negative correlations found for SERPINE1 from the overview network (A).(C) Proteins with positive or negative correlations with SERPINE1 were selected for GO term andKEGG pathway enrichment analysis (analyzed separately). The top four non-redundant terms basedon Fisher’s Exact Score for both positively and negatively correlated proteins are represented withthe selected term and fold enrichment. (D) TCGA protein expression for SERPINE1 in patients withvarious alcohol exposure. (E) SERPINE1 protein expression determined by quantitative proteomics.n.s, not significant. (F) Kaplan–Meier survival probability for patients with high (red) or low (blue)SERPINE1 expression.

Cancers 2022, 14, 1968 17 of 23
3.7. PDAC Subtypes Are Altered with Ethanol Treatment
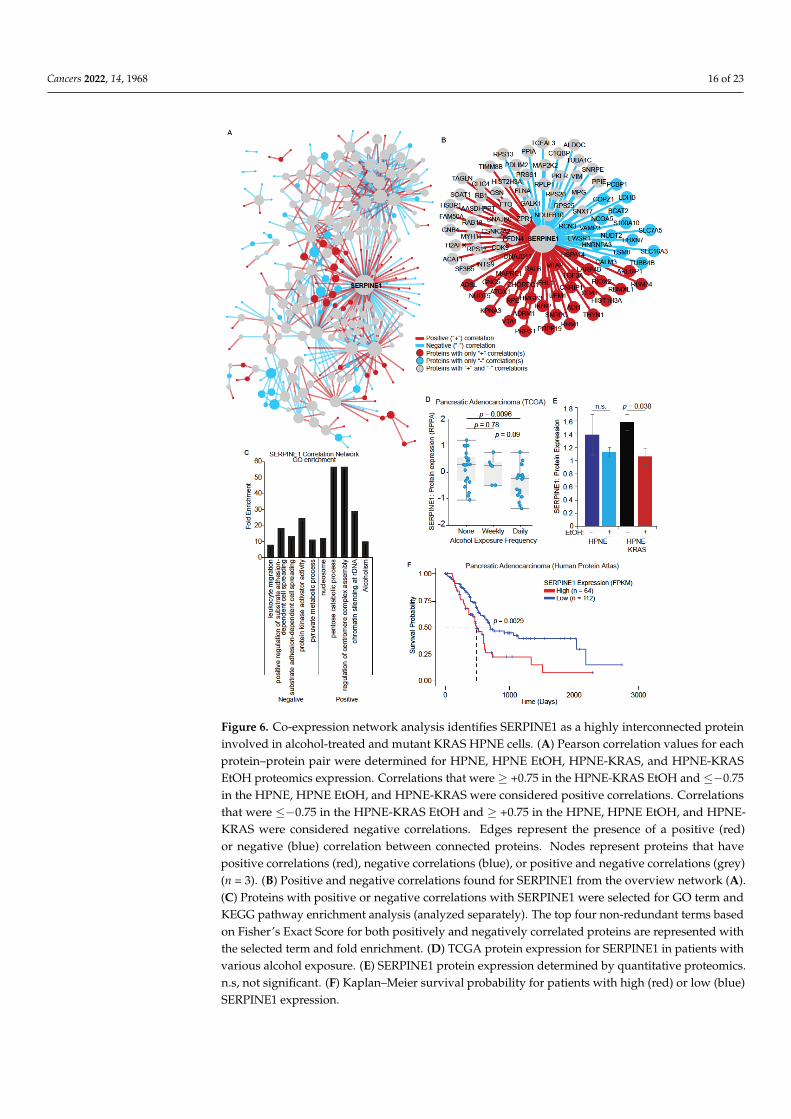
Our previous proteomic observations in metastatic PDAC tissues indicated that alcoholuse in these patients was associated with a decrease in the Inflammatory subtype and anincrease in the Proliferative and Metabolic subtypes [6]. To determine the impacts of EtOHon subtype signatures in the presence and absence of mutant KRAS in the HPNE cell lines,we evaluated the PDAC subtype signatures for each of the HPNE and HPNE-KRAS cellslines with or without EtOH conditioning (Figure 7A–D). EtOH did not significantly impactthe subtype signatures in the HPNE cells. However, the HPNE-KRAS EtOH cells exhibitedsignificant increases in the Proliferative (Figure 7A) and Metabolic (Figure 7C) subtypesignatures and a significant decrease in the Inflammatory subtype signature (Figure 7B).Notably, the change in subtype signatures in response to EtOH conditioning in HPNE-KRAS cells was most evident in the suppression of the Inflammatory signature and anincrease in the Metabolic signature (Figure 7B,C). These trends are largely consistent withwhat we previously observed in clinical PDAC samples [6], suggesting that the impact ofEtOH on PDAC subtype development could be dependent upon the mutational status ofKRAS.
Cancers 2022, 14, x FOR PEER REVIEW 19 of 25
Figure 7. PDAC subtype signatures and chemotherapy sensitivity are associated with ethanol con-
ditioning in mutant KRAS HPNE cells. (A–D) Proteomics expression data were mapped to PDAC
subtype proteomics signatures. The top 60 variable proteins were selected and mapped to the PLS-
DA model from Law et al. ROC curves were used to determine the cutoff scores for the Proliferative
(A), Inflammatory (B), Metabolic (C), and Progenitor-like (D) subtypes. (E–G) Cells were treated
with chemotherapeutic drugs commonly used in PDAC therapy. HPNE, HPNE EtOH, and HPNE-
KRAS cells were plated at a density of 5000 cells per well, HPNE-KRAS EtOH were plated at a
density of 1000 cells per well. Cells were treated with increasing doses of Gemcitabine (E), Irinotecan
(F), or Oxaliplatin (G) for 3 days. Cell viability was assessed by CellTiter-Glo following drug expo-
sure to assess cell viability. Relative luminescence was read on a plate reader and IC50 values were
determined by GraphPad Prism. Mean ± SEM; n = 4.
Furthermore, our previous study determined that clinical response to FOLFIRINOX
is also associated with PDAC subtypes [3,6]. Because a shift in subtype signatures in re-
sponse to EtOH conditioning could also influence response to therapeutic agents, we an-
alyzed the impact of three commonly used pancreatic cancer drugs (gemcitabine, iri-
notecan, and oxaliplatin) on cell viability (Figure 7E–G). EtOH conditioning of HPNE cells
resulted in a lower EC50 in the gemcitabine treatment compared to control HPNE cells,
but no impact on EC50s was observed for the irinotecan or oxaliplatin treatments in this
cell line. However, the EC50s for gemcitabine (Figure 7E), irinotecan (Figure 7F), and ox-
aliplatin (Figure 7G) were significantly lower in HPNE-KRAS EtOH cells in comparison
to the control HPNE-KRAS cells. These results are consistent with expectations that treat-
ment responses would improve as cells acquire the Metabolic signature and lose the In-
flammatory signature.
4. Discussion
Epidemiological studies show a consistent association between heavy alcohol use
and risk of PDAC development [12–15]. Additionally, recent studies have shown that eth-
anol exposure increases PanIN and PDAC development in mutant KRAS murine models
[18,19]. The results suggest that alcohol consumption in the context of an underlying ge-
netic susceptibility, such as KRAS mutation, potentiates PDAC tumorigenesis. In this
study, we observed that ethanol conditioning increased proliferation, a hallmark of can-
cer, in HPNE cells harboring the G12D KRAS mutation, but not in HPNE with wild-type
KRAS. Delineating the molecular signatures associated with alcohol exposure in the con-
text of mutant KRAS is essential to understanding the effects of alcohol on the etiology of
Figure 7. PDAC subtype signatures and chemotherapy sensitivity are associated with ethanolconditioning in mutant KRAS HPNE cells. (A–D) Proteomics expression data were mapped to PDACsubtype proteomics signatures. The top 60 variable proteins were selected and mapped to the PLS-DAmodel from Law et al. ROC curves were used to determine the cutoff scores for the Proliferative (A),Inflammatory (B), Metabolic (C), and Progenitor-like (D) subtypes. (E–G) Cells were treated withchemotherapeutic drugs commonly used in PDAC therapy. HPNE, HPNE EtOH, and HPNE-KRAScells were plated at a density of 5000 cells per well, HPNE-KRAS EtOH were plated at a densityof 1000 cells per well. Cells were treated with increasing doses of Gemcitabine (E), Irinotecan (F),or Oxaliplatin (G) for 3 days. Cell viability was assessed by CellTiter-Glo following drug exposureto assess cell viability. Relative luminescence was read on a plate reader and IC50 values weredetermined by GraphPad Prism. Mean ± SEM; n = 4.
Furthermore, our previous study determined that clinical response to FOLFIRINOX isalso associated with PDAC subtypes [3,6]. Because a shift in subtype signatures in responseto EtOH conditioning could also influence response to therapeutic agents, we analyzedthe impact of three commonly used pancreatic cancer drugs (gemcitabine, irinotecan, andoxaliplatin) on cell viability (Figure 7E–G). EtOH conditioning of HPNE cells resulted in alower EC50 in the gemcitabine treatment compared to control HPNE cells, but no impact on
Cancers 2022, 14, 1968 18 of 23
EC50s was observed for the irinotecan or oxaliplatin treatments in this cell line. However,the EC50s for gemcitabine (Figure 7E), irinotecan (Figure 7F), and oxaliplatin (Figure 7G)were significantly lower in HPNE-KRAS EtOH cells in comparison to the control HPNE-KRAS cells. These results are consistent with expectations that treatment responses wouldimprove as cells acquire the Metabolic signature and lose the Inflammatory signature.
4. Discussion
Epidemiological studies show a consistent association between heavy alcohol use andrisk of PDAC development [12–15]. Additionally, recent studies have shown that ethanolexposure increases PanIN and PDAC development in mutant KRAS murine models [18,19].The results suggest that alcohol consumption in the context of an underlying geneticsusceptibility, such as KRAS mutation, potentiates PDAC tumorigenesis. In this study,we observed that ethanol conditioning increased proliferation, a hallmark of cancer, inHPNE cells harboring the G12D KRAS mutation, but not in HPNE with wild-type KRAS.Delineating the molecular signatures associated with alcohol exposure in the context ofmutant KRAS is essential to understanding the effects of alcohol on the etiology of PDAC.In this study, we utilized a multi-omics approach to identify gene and protein expressionsignatures unique to alcohol conditioning in mutant KRAS-expressing HPNE cells.
Individually, both KRAS mutation and alcohol exposure alter the molecular signaturesof pancreas tissues. KRAS mutation and gene dosage drives tumorigenesis and metastasisassociated with differential gene expression signatures [40]. Patients with an alcoholicetiology of pancreatitis displayed differential gene expression signatures compared tohereditary etiologies of pancreatitis [41]. In our study, the individual variables of eitheralcohol exposure or KRAS mutation status were associated with changes in the transcrip-tome and proteome. Furthermore, a previous analysis using a breast cancer cell line foundthat ethanol-induced activation of the Ras/MEK/MAPK signaling promotes cell growth,suggesting pathway-specific requirements for alcohol-induced proliferation [42]. Indeed,our study has now identified a unique set of genes and proteins that are differentiallyexpressed and dependent upon both alcohol exposure and KRAS mutation status in HPNEcells. Functional analysis of our RNA-seq datasets comparing HPNE-KRAS with andwithout ethanol conditioning identified an enrichment of GO terms for protein translationof differentially upregulated proteins, while downregulated proteins were associated withterms for actin and cytoskeleton arrangement. The downregulation of proteins involved inactin and cytoskeletal organization could be indicative of a migratory phenotype, whichhas been observed in breast cancer cells treated with ethanol [16,43].
In addition, we observed a differential response to combined ethanol conditioningand KRAS mutation status in the proteomics data. In the ethanol-conditioned HPNE-KRAScells, 95 and 37 proteins were differentially up- or down-regulated, respectively, in compar-ison with HPNE-KRAS controls. In agreement with the RNA-Seq data, the up-regulatedproteins were enriched for GO terms associated with transcription and translational pro-cesses, with RNA/poly(A) binding being the top term. The GO terms associated with thedownregulated terms related to cell–cell adhesion and contact, which may be related to thedownregulation and disruption of the actin and cytoskeleton related genes observed in theRNA-Seq results. Notably, ethanol-induced disruption of cell–cell contact has previouslybeen demonstrated in the brain, colon, and pancreas acinar cells [44–48]. These resultsfrom the transcriptomic and proteomic analyses suggest alcohol exposure combined withexpression of mutant KRAS affects a spectrum of cellular functions that could contribute tothe development of tumor phenotypes.
MCIA of the RNA-Seq and Proteomics data sets allows for the evaluation of the differ-ences between gene and protein expression in different treatment and genetic contexts. TheHPNE, HPNE EtOH, and HPNE-KRAS cells display variation between their transcriptomicand proteomic profiles. This is likely attributable to the multiple levels of regulation con-trolling transcriptional, posttranscriptional, translational, and posttranslational processesthat can result in poor correlation between transcript and protein levels. Interestingly, the

Cancers 2022, 14, 1968 19 of 23
ethanol conditioning of HPNE-KRAS appears to promote an increased correlation betweenthe transcriptomic and proteomic profiles, which could be attributable to an increase intranslational processes suggested by the GO term enrichments. Quantitative increasesin protein translation support cell growth and proliferation, while qualitative differencesin translation, such as preferential expression of oncogenes, likely contribute to cancerdevelopment [49,50]. Increased correlation between mRNA transcripts and translatedproteins may indicate the ethanol-conditioned HPNE-KRAS cells are better able to respondto signaling cues affecting transcriptional/translational programs.
The increase in proliferation of the HPNE-KRAS EtOH cells could be, in part, due tothe impact of metabolic byproducts of ethanol causing DNA mutations or protein adductsthat change the proliferation rate of these cells due to the dysregulation of cell cycle-relatedproteins. However, we did not observe significant changes in the acetaldehyde or ROSproduction in the HPNE-KRAS EtOH cells. Acetaldehyde appeared to be metabolized atthe same rate regardless of KRAS status and non-treated versus chronic ethanol- treatedconditions. There is a possibility that additional ethanol breakdown pathways and ethanolusage pathways could be involved in the reduction of chronic ethanol treated cells, howeverthe major byproducts of ethanol metabolism do not show significant alterations depen-dent upon either KRAS or alcohol conditioning. Nevertheless, additional carcinogenicbyproducts, for example lipid peroxides malondialdehyde (MDA) and 4-hydroxyneoneal(4-HNE), could play a role on carcinogenesis and producing a highly proliferative pheno-type [36,51,52]. Alternatively, the changes in the cell cycle in the HPNE-KRAS EtOH cellsindicate the potential dysregulation of the pathways regulating this process.
In a network-based analysis, we generated correlation networks for protein expressionin the different alcohol and KRAS mutation conditions. We aimed to determine whatproteins were coordinately expressed in the HPNE cells and investigated how ethanoland KRAS mutation affects these correlations. We found that SERPINE1 had positive ornegative correlations with 95 proteins, and was the most highly connected protein in thedifferential co-expression network. The correlations identified are either absent by notmeeting the Pearson correlation threshold, or oppositely correlated, making these uniqueto the HPNE-KRAS EtOH-treated cells. “Alcoholism” was the top term found for theupregulated correlations with SERPINE1, suggesting the potential value of this analysisrelevant to the dataset. SERPINE1 is pro-tumorigenic in many types of cancers, promotinggrowth, metastasis, and invasiveness of tumor cells, including PDAC [53]. It has been usedas a mesenchymal marker [54,55], implicated in EMT, metastasis, and angiogenesis [56,57],fibrosis and immunosuppression [58], and increased expression is an indication of poorsurvival [59]. The independent validation that SERPINE1 is down-regulated in clinicalPDAC samples annotated for frequent alcohol use further supports a potential role ofthis protein in alcohol-associated PDAC development. However, further experiments arerequired to understand the mechanistic role of this protein in alcohol associated PDAC.
The HPNE cell culture model used in this study reflects the associations observed inPDAC patients who used alcohol [6], and KRAS mutation was necessary to observe theethanol-induced changes in PDAC subtype signatures in the HPNE cells. These changes insubtype signatures are likely reflective of the altered gene and protein expression caused byethanol conditioning in KRAS mutant HPNE cells. It is likely that gemcitabine, irinotecan,and oxaliplatin demonstrated lower EC50s in mutant KRAS-expressing HPNE cells condi-tioned with ethanol because PDAC subtypes are predictive of response to chemotherapeuticagents [3,6]. However, it is also possible that the link between chemotherapeutic efficacyin the HPNE-KRAS EtOH cells could be attributed to either changes in the expression ofspecific genes/proteins or to a general trait, such as a subtype with increased proliferation.Since each drug tested in our study has a different mechanism of action [60–62], this arguesthat the changes in chemosensitivity is not likely arising from alterations in a single protein,but rather a general trait of the cell population. Based on the changes to subtype signa-tures, our results suggest that alcohol conditioning can promote either clonal outgrowthor subtype plasticity through selective pressure. While this study observed improved
Cancers 2022, 14, 1968 20 of 23
chemosensitivity following EtOH conditioning, the negative impacts of alcohol itself andthe difficulties envisioned with sustaining such a high exposure level over many months toeffect a change in subtype signature likely preclude its clinical application. Rather, targetedstrategies for modulating signaling pathways and networks associated with subtype delin-eation, plasticity, or selection should be explored more broadly to determine their potentialclinical benefits in terms of preventing or overcoming chemoresistance.
5. Conclusions
This study has determined that alcohol preferentially induces and increases in the pro-liferative potential of pancreas HPNE cell that express mutant KRAS. This study indicatesthat the influence of alcohol on pancreas cells is dependent upon the KRAS mutation statusof the cell. Combined, alcohol and mutant KRAS potentiate a proliferative phenotypeand influence subtype delineation associated with alterations in the transcriptome andproteome.
Supplementary Materials: The following supporting information can be downloaded at: https://www.mdpi.com/article/10.3390/cancers14081968/s1, Table S1. RNA-Sequencing gene countsnormalized by DESeq2, Table S2. Differentially Expressed Genes in the HPNE-KRAS EtOH conditioncompared to HPNE-KRAS, Log2 Fold Change ±2, Table S3. 1635 upregulated genes in HPNE-KRASEtOH (compared to HPNE-KRAS) that were identified only in HPNE-KRAS EtOH and absent inHPNE-EtOH vs. HPNE. See Venn diagram in Figure 3C, Table S4. 1388 downregulated genes inHPNE-KRAS EtOH (compared to HPNE-KRAS) identified only in HPNE-KRAS EtOH and absentin HPNE-EtOH vs. HPNE. See Venn diagram in Figure 3C, Table S5. Gene ontology enrichmentanalysis of gene transcripts upregulated in HPNE EtOH treated cells vs HPNE untreated control,Table S6. Gene ontology enrichment analysis of gene transcripts downregulated in HPNE EtOHtreated cells vs. HPNE untreated control, Table S7. Gene ontology enrichment analysis of genetranscripts upregulated in HPNE-KRAS EtOH treated cells vs HPNE-KRAS untreated control, TableS8. Gene ontology enrichment analysis of gene transcripts downregulated in HPNE-KRAS EtOHtreated cells vs. HPNE-KRAS untreated control, Table S9. Proteomics expression values of 3 replicatesin HPNE and ethanol treated HPNE cells including the uncorrected p-value (student’s t-test), FDR,and log2 fold change, Table S10. Proteomics expression values of 3 replicates in HPNE-KRAS andethanol-treated HPNE-KRAS cells, including the uncorrected p-value (student’s t-test), FDR, andlog2 fold change, Table S11. Gene ontology enrichment analysis of proteins upregulated in HPNEEtOH-treated cells vs HPNE untreated control, Table S12. Gene ontology enrichment analysis ofproteins downregulated in HPNE EtOH-treated cells vs. HPNE untreated control, Table S13. Geneontology enrichment analysis of proteins upregulated in HPNE-KRAS EtOH-treated cells vs. HPNE-KRAS untreated control, Table S14. Gene ontology enrichment analysis of proteins downregulated inHPNE-KRAS EtOH-treated cells vs HPNE-KRAS untreated control; Figure S1. The gating strategiesfor the EtOH-treated and untreated cell line cell cycle analysis, Figure S2. The gating strategies forthe EtOH-treated and untreated cell line intra-cellular Reactive Oxygen Species (ROS) measurements,Figure S3. (A) Differentially expressed transcripts quantified by RNA Sequencing with a fold changeof ±2.0 from the untreated control cell lines. (n = 1). (B) The biotypes of all transcripts detectedthrough RNA Seq. Biotypes of each transcript determined by Ensembl. Biotype categories thatdid not fall into protein coding, non-coding RNA, or pseudogenes were categorized as “other”,Figure S4. Differential Co-Expression Network. Pearson correlation values for each protein–proteinpair were determined for HPNE, HPNE EtOH, HPNE-KRAS, and HPNE-KRAS EtOH proteomicsexpression. Correlations that were ≥ +0.75 in the HPNE-KRAS EtOH and ≤−0.75 in the HPNE,HPNE EtOH, and HPNE-KRAS were considered positive correlations. Correlations that were≤−0.75in the HPNE-KRAS EtOH and≥ +0.75 in the HPNE, HPNE EtOH, and HPNE-KRAS were considerednegative correlations. Edges represent the presence of a positive (red) or negative (blue) correlationbetween connected proteins. Nodes represent proteins that have positive correlations (red), negativecorrelations (blue), or positive and negative correlations (grey) (n = 3). Node size corresponds to thenumber of correlations associated with each protein. Figure S5. The original blots of Figure 5.
Author Contributions: Conceptualization, E.J.C. and N.T.W.; Methodology, E.J.C., H.C.-H.L. andN.T.W.; Investigation, E.J.C., D.N. and H.C.-H.L.; Writing—Original Draft, E.J.C., D.N., H.C.-H.L.,F.Q., D.N., J.G.T. and N.T.W.; Visualization, E.J.C. and H.C.-H.L.; Writing—Review & Editing, E.J.C.,
Cancers 2022, 14, 1968 21 of 23
D.N., H.C.-H.L., F.Q., D.N., J.G.T. and N.T.W.; Funding Acquisition, N.T.W.; Resources, N.T.W.;Supervision, H.C.-H.L. and N.T.W. The manuscript was written with contributions from all authors.All authors have read and agreed to the published version of the manuscript.
Funding: This research was funded by the NIH through the awards P20GM121316, P30CA036727,and 1P50CA127297. The UNMC DNA Sequencing Core receives partial support from the NationalInstitute for General Medical Science (NIGMS) INBRE-P20GM103427-19.
Institutional Review Board Statement: Not applicable.
Informed Consent Statement: Not applicable.
Data Availability Statement: All data generated and analyzed in this study are included in thearticle or can be obtained from the authors upon reasonable request. Please direct all requests toN.T.W. ([email protected]). The mass spectrometry proteomics data have been deposited tothe ProteomeXchange Consortium via the PRIDE [63] partner repository with the dataset identifierPXD030180. RNA-Sequencing data have been submitted to NCBI under the BioProject accessionPRJNA784536.
Acknowledgments: We would like to thank the DNA Sequencing Core and the Mass Spectrometryand Proteomics Core Facility at UNMC for their help on this project.
Conflicts of Interest: The authors declare no conflict of interest.
References1. Rahib, L.; Smith, B.D.; Aizenberg, R.; Rosenzweig, A.B.; Fleshman, J.M.; Matrisian, L.M. Projecting cancer incidence and deaths
to 2030: The unexpected burden of thyroid, liver, and pancreas cancers in the United States. Cancer Res. 2014, 74, 2913–2921.[CrossRef] [PubMed]
2. Bailey, P.; Chang, D.K.; Nones, K.; Johns, A.L.; Patch, A.M.; Gingras, M.C.; Miller, D.K.; Christ, A.N.; Bruxner, T.J.; Quinn, M.C.;et al. Genomic analyses identify molecular subtypes of pancreatic cancer. Nature 2016, 531, 47–52. [CrossRef] [PubMed]
3. Collisson, E.A.; Sadanandam, A.; Olson, P.; Gibb, W.J.; Truitt, M.; Gu, S.; Cooc, J.; Weinkle, J.; Kim, G.E.; Jakkula, L.; et al. Subtypesof pancreatic ductal adenocarcinoma and their differing responses to therapy. Nat. Med. 2011, 17, 500–503. [CrossRef] [PubMed]
4. Moffitt, R.A.; Marayati, R.; Flate, E.L.; Volmar, K.E.; Loeza, S.G.; Hoadley, K.A.; Rashid, N.U.; Williams, L.A.; Eaton, S.C.; Chung,A.H.; et al. Virtual microdissection identifies distinct tumor- and stroma-specific subtypes of pancreatic ductal adenocarcinoma.Nat. Genet. 2015, 47, 1168–1178. [CrossRef]
5. Cao, L.; Huang, C.; Cui Zhou, D.; Hu, Y.; Lih, T.M.; Savage, S.R.; Krug, K.; Clark, D.J.; Schnaubelt, M.; Chen, L.; et al.Proteogenomic characterization of pancreatic ductal adenocarcinoma. Cell 2021, 184, 5031–5052.e26. [CrossRef]
6. Law, H.C.; Lagundzin, D.; Clement, E.J.; Qiao, F.; Wagner, Z.S.; Krieger, K.L.; Costanzo-Garvey, D.; Caffrey, T.C.; Grem, J.L.;DiMaio, D.J.; et al. The Proteomic Landscape of Pancreatic Ductal Adenocarcinoma Liver Metastases Identifies MolecularSubtypes and Associations with Clinical Response. Clin. Cancer Res. 2020, 26, 1065–1076. [CrossRef]
7. Hezel, A.F.; Kimmelman, A.C.; Stanger, B.Z.; Bardeesy, N.; Depinho, R.A. Genetics and biology of pancreatic ductal adenocarci-noma. Genes Dev. 2006, 20, 1218–1249. [CrossRef]
8. Hruban, R.H.; Goggins, M.; Parsons, J.; Kern, S.E. Progression model for pancreatic cancer. Clin. Cancer Res. 2000, 6, 2969–2972.9. Luchini, C.; Paolino, G.; Mattiolo, P.; Piredda, M.L.; Cavaliere, A.; Gaule, M.; Melisi, D.; Salvia, R.; Malleo, G.; Shin, J.I.; et al.
KRAS wild-type pancreatic ductal adenocarcinoma: Molecular pathology and therapeutic opportunities. J. Exp. Clin. Cancer Res.2020, 39, 227. [CrossRef]
10. Becker, A.E.; Hernandez, Y.G.; Frucht, H.; Lucas, A.L. Pancreatic ductal adenocarcinoma: Risk factors, screening, and earlydetection. World J. Gastroenterol. 2014, 20, 11182–11198. [CrossRef]
11. Ratna, A.; Mandrekar, P. Alcohol and Cancer: Mechanisms and Therapies. Biomolecules 2017, 7, 61. [CrossRef] [PubMed]12. Longnecker, M.P.; Enger, S.M. Epidemiologic data on alcoholic beverage consumption and risk of cancer. Clin. Chim. Acta 1996,
246, 121–141. [CrossRef]13. Duell, E.J. Epidemiology and potential mechanisms of tobacco smoking and heavy alcohol consumption in pancreatic cancer.
Mol. Carcinog. 2012, 51, 40–52. [CrossRef] [PubMed]14. Gupta, S.; Wang, F.; Holly, E.A.; Bracci, P.M. Risk of pancreatic cancer by alcohol dose, duration, and pattern of consumption,
including binge drinking: A population-based study. Cancer Causes Control 2010, 21, 1047–1059. [CrossRef]15. Michaud, D.S.; Vrieling, A.; Jiao, L.; Mendelsohn, J.B.; Steplowski, E.; Lynch, S.M.; Wactawski-Wende, J.; Arslan, A.A.; Bas
Bueno-de-Mesquita, H.; Fuchs, C.S.; et al. Alcohol intake and pancreatic cancer: A pooled analysis from the pancreatic cancercohort consortium (PanScan). Cancer Causes Control 2010, 21, 1213–1225. [CrossRef]
16. Xu, M.; Wang, S.; Ren, Z.; Frank, J.A.; Yang, X.H.; Zhang, Z.; Ke, Z.J.; Shi, X.; Luo, J. Chronic ethanol exposure enhances theaggressiveness of breast cancer: The role of p38gamma. Oncotarget 2016, 7, 3489–3505. [CrossRef]
17. Testino, G. The burden of cancer attributable to alcohol consumption. Maedica 2011, 6, 313–320.
Cancers 2022, 14, 1968 22 of 23
18. Asahina, K.; Balog, S.; Hwang, E.; Moon, E.; Wan, E.; Skrypek, K.; Chen, Y.; Fernandez, J.; Romo, J.; Yang, Q.; et al. Moderatealcohol intake promotes pancreatic ductal adenocarcinoma development in mice expressing oncogenic Kras. Am. J. Physiol.Gastrointest. Liver Physiol. 2020, 318, G265–G276. [CrossRef]
19. Yu, W.; Ma, Y.; Roy, S.K.; Srivastava, R.; Shankar, S.; Srivastava, R.K. Ethanol exposure of human pancreatic normal ductalepithelial cells induces EMT phenotype and enhances pancreatic cancer development in KC (Pdx1-Cre and LSL-Kras(G12D))mice. J. Cell. Mol. Med. 2022, 26, 399–409. [CrossRef]
20. Campbell, P.M.; Groehler, A.L.; Lee, K.M.; Ouellette, M.M.; Khazak, V.; Der, C.J. K-Ras promotes growth transformation andinvasion of immortalized human pancreatic cells by Raf and phosphatidylinositol 3-kinase signaling. Cancer Res. 2007, 67,2098–2106. [CrossRef]
21. Hu, W.F.; Krieger, K.L.; Lagundzin, D.; Li, X.; Cheung, R.S.; Taniguchi, T.; Johnson, K.R.; Bessho, T.; Monteiro, A.N.A.; Woods,N.T. CTDP1 regulates breast cancer survival and DNA repair through BRCT-specific interactions with FANCI. Cell Death Discov.2019, 5, 105. [CrossRef] [PubMed]
22. Lagundzin, D.; Hu, W.F.; Law, H.C.H.; Krieger, K.L.; Qiao, F.; Clement, E.J.; Drincic, A.T.; Nedic, O.; Naldrett, M.J.; Alvarez, S.;et al. Delineating the role of FANCA in glucose-stimulated insulin secretion in beta cells through its protein interactome. PLoSONE 2019, 14, e0220568. [CrossRef] [PubMed]
23. Cerami, E.; Gao, J.; Dogrusoz, U.; Gross, B.E.; Sumer, S.O.; Aksoy, B.A.; Jacobsen, A.; Byrne, C.J.; Heuer, M.L.; Larsson, E.; et al.The cBio cancer genomics portal: An open platform for exploring multidimensional cancer genomics data. Cancer Discov. 2012, 2,401–404. [CrossRef] [PubMed]
24. Gao, J.; Aksoy, B.A.; Dogrusoz, U.; Dresdner, G.; Gross, B.; Sumer, S.O.; Sun, Y.; Jacobsen, A.; Sinha, R.; Larsson, E.; et al.Integrative analysis of complex cancer genomics and clinical profiles using the cBioPortal. Sci. Signal. 2013, 6, pl1. [CrossRef][PubMed]
25. Uhlen, M.; Fagerberg, L.; Hallstrom, B.M.; Lindskog, C.; Oksvold, P.; Mardinoglu, A.; Sivertsson, A.; Kampf, C.; Sjostedt, E.;Asplund, A.; et al. Proteomics. Tissue-based map of the human proteome. Science 2015, 347, 1260419. [CrossRef] [PubMed]
26. Yu, W.; Ma, Y.; Shankar, S.; Srivastava, R.K. Chronic ethanol exposure of human pancreatic normal ductal epithelial cells inducescancer stem cell phenotype through SATB2. J. Cell. Mol. Med. 2018, 22, 3920–3928. [CrossRef] [PubMed]
27. Castilla, R.; Gonzalez, R.; Fouad, D.; Fraga, E.; Muntane, J. Dual effect of ethanol on cell death in primary culture of human andrat hepatocytes. Alcohol Alcohol. 2004, 39, 290–296. [CrossRef]
28. Gukovskaya, A.S.; Mareninova, O.A.; Odinokova, I.V.; Sung, K.F.; Lugea, A.; Fischer, L.; Wang, Y.L.; Gukovsky, I.; Pandol, S.J. Celldeath in pancreatitis: Effects of alcohol. J. Gastroenterol. Hepatol. 2006, 21 (Suppl. S3), S10–S13. [CrossRef]
29. McVicker, B.L.; Tuma, D.J.; Casey, C.A. Effect of ethanol on pro-apoptotic mechanisms in polarized hepatic cells. World J.Gastroenterol. 2007, 13, 4960–4966. [CrossRef]
30. Dembele, K.; Nguyen, K.H.; Hernandez, T.A.; Nyomba, B.L. Effects of ethanol on pancreatic beta-cell death: Interaction withglucose and fatty acids. Cell Biol. Toxicol. 2009, 25, 141–152. [CrossRef]
31. Kelkar, S.; Dong, Q.; Xiao, Y.; Joshi-Barve, S.; McClain, C.J.; Barve, S.S. Ethanol enhances activation-induced caspase-3 dependentcell death in T lymphocytes. Alcohol. Clin. Exp. Res. 2002, 26, 363–370. [CrossRef] [PubMed]
32. Huang, D.W.; Sherman, B.T.; Lempicki, R.A. Systematic and integrative analysis of large gene lists using DAVID bioinformaticsresources. Nat. Protoc. 2009, 4, 44–57. [CrossRef] [PubMed]
33. Huang, D.W.; Sherman, B.T.; Lempicki, R.A. Bioinformatics enrichment tools: Paths toward the comprehensive functional analysisof large gene lists. Nucleic Acids Res. 2009, 37, 1–13. [CrossRef] [PubMed]
34. Zakhari, S. Overview: How is alcohol metabolized by the body? Alcohol Res. Health 2006, 29, 245–254. [PubMed]35. Cederbaum, A.I. Alcohol metabolism. Clin. Liver Dis. 2012, 16, 667–685. [CrossRef] [PubMed]36. Rodriguez, F.D.; Covenas, R. Biochemical Mechanisms Associating Alcohol Use Disorders with Cancers. Cancers 2021, 13, 3548.
[CrossRef] [PubMed]37. Mameishvili, E.; Serafimidis, I.; Iwaszkiewicz, S.; Lesche, M.; Reinhardt, S.; Bolicke, N.; Buttner, M.; Stellas, D.; Papadimitropoulou,
A.; Szabolcs, M.; et al. Aldh1b1 expression defines progenitor cells in the adult pancreas and is required for Kras-inducedpancreatic cancer. Proc. Natl. Acad. Sci. USA 2019, 116, 20679–20688. [CrossRef]
38. Kubala, M.H.; DeClerck, Y.A. The plasminogen activator inhibitor-1 paradox in cancer: A mechanistic understanding. CancerMetastasis Rev. 2019, 38, 483–492. [CrossRef]
39. Wilson, D.F.; Matschinsky, F.M. Ethanol metabolism: The good, the bad, and the ugly. Med. Hypotheses 2020, 140, 109638.[CrossRef]
40. Mueller, S.; Engleitner, T.; Maresch, R.; Zukowska, M.; Lange, S.; Kaltenbacher, T.; Konukiewitz, B.; Ollinger, R.; Zwiebel, M.;Strong, A.; et al. Evolutionary routes and KRAS dosage define pancreatic cancer phenotypes. Nature 2018, 554, 62–68. [CrossRef]
41. Blobner, B.M.; Bellin, M.D.; Beilman, G.J.; Shelton, C.A.; Park, H.J.; Whitcomb, D.C. Gene Expression Profiling of the Pancreas inPatients Undergoing Total Pancreatectomy with Islet Autotransplant Suggests Unique Features of Alcoholic, Idiopathic, andHereditary Pancreatitis. Pancreas 2020, 49, 1037–1043. [CrossRef] [PubMed]
42. Izevbigie, E.B.; Ekunwe, S.I.; Jordan, J.; Howard, C.B. Ethanol modulates the growth of human breast cancer cells in vitro. Exp.Biol. Med. 2002, 227, 260–265. [CrossRef] [PubMed]
Cancers 2022, 14, 1968 23 of 23
43. Floris, A.; Luo, J.; Frank, J.; Zhou, J.; Orru, S.; Biancolella, M.; Pucci, S.; Orlandi, A.; Campagna, P.; Balzano, A.; et al. Star-relatedlipid transfer protein 10 (STARD10): A novel key player in alcohol-induced breast cancer progression. J. Exp. Clin. Cancer Res.2019, 38, 4. [CrossRef] [PubMed]
44. Charness, M.E.; Safran, R.M.; Perides, G. Ethanol inhibits neural cell-cell adhesion. J. Biol. Chem. 1994, 269, 9304–9309. [CrossRef]45. Elamin, E.; Jonkers, D.; Juuti-Uusitalo, K.; van Ijzendoorn, S.; Troost, F.; Duimel, H.; Broers, J.; Verheyen, F.; Dekker, J.; Masclee,
A. Effects of ethanol and acetaldehyde on tight junction integrity: In vitro study in a three dimensional intestinal epithelial cellculture model. PLoS ONE 2012, 7, e35008. [CrossRef]
46. Elamin, E.; Masclee, A.; Troost, F.; Pieters, H.J.; Keszthelyi, D.; Aleksa, K.; Dekker, J.; Jonkers, D. Ethanol impairs intestinal barrierfunction in humans through mitogen activated protein kinase signaling: A combined in vivo and in vitro approach. PLoS ONE2014, 9, e107421. [CrossRef] [PubMed]
47. Iwata, T.; Nozu, F.; Imawari, M. Ethanol impairs the assembly and disassembly of actin cytoskeleton and cell adhesion via theRhoA signaling pathway, catenin p120 and E-cadherin in CCK-stimulated pancreatic acini. Biochem. Biophys. Res. Commun. 2011,405, 558–563. [CrossRef]
48. Ramanathan, R.; Wilkemeyer, M.F.; Mittal, B.; Perides, G.; Charness, M.E. Alcohol inhibits cell-cell adhesion mediated by humanL1. J. Cell Biol. 1996, 133, 381–390. [CrossRef]
49. Ruggero, D. Translational control in cancer etiology. Cold Spring Harb. Perspect. Biol. 2013, 5, a012336. [CrossRef]50. Minnee, E.; Faller, W.J. Translation initiation and its relevance in colorectal cancer. FEBS J. 2021, 288, 6635–6651. [CrossRef]51. Ayala, A.; Munoz, M.F.; Arguelles, S. Lipid peroxidation: Production, metabolism, and signaling mechanisms of malondialdehyde
and 4-hydroxy-2-nonenal. Oxid. Med. Cell. Longev. 2014, 2014, 360438. [CrossRef] [PubMed]52. Zelner, I.; Matlow, J.N.; Natekar, A.; Koren, G. Synthesis of fatty acid ethyl esters in mammalian tissues after ethanol exposure: A
systematic review of the literature. Drug Metab. Rev. 2013, 45, 277–299. [CrossRef] [PubMed]53. Placencio, V.R.; DeClerck, Y.A. Plasminogen Activator Inhibitor-1 in Cancer: Rationale and Insight for Future Therapeutic Testing.
Cancer Res. 2015, 75, 2969–2974. [CrossRef]54. Gharibi, A.; La Kim, S.; Molnar, J.; Brambilla, D.; Adamian, Y.; Hoover, M.; Hong, J.; Lin, J.; Wolfenden, L.; Kelber, J.A. ITGA1 is a
pre-malignant biomarker that promotes therapy resistance and metastatic potential in pancreatic cancer. Sci. Rep. 2017, 7, 10060.[CrossRef] [PubMed]
55. Porter, R.L.; Magnus, N.K.C.; Thapar, V.; Morris, R.; Szabolcs, A.; Neyaz, A.; Kulkarni, A.S.; Tai, E.; Chougule, A.; Hillis, A.; et al.Epithelial to mesenchymal plasticity and differential response to therapies in pancreatic ductal adenocarcinoma. Proc. Natl. Acad.Sci. USA 2019, 116, 26835–26845. [CrossRef] [PubMed]
56. Liu, F.; Korc, M. Cdk4/6 inhibition induces epithelial-mesenchymal transition and enhances invasiveness in pancreatic cancercells. Mol. Cancer Ther. 2012, 11, 2138–2148. [CrossRef]
57. Lupu-Meiri, M.; Geras-Raaka, E.; Lupu, R.; Shapira, H.; Sandbank, J.; Segal, L.; Gershengorn, M.C.; Oron, Y. Knock-down ofplasminogen-activator inhibitor-1 enhances expression of E-cadherin and promotes epithelial differentiation of human pancreaticadenocarcinoma cells. J. Cell. Physiol. 2012, 227, 3621–3628. [CrossRef]
58. Rossi Sebastiano, M.; Pozzato, C.; Saliakoura, M.; Yang, Z.; Peng, R.W.; Galie, M.; Oberson, K.; Simon, H.U.; Karamitopoulou, E.;Konstantinidou, G. ACSL3-PAI-1 signaling axis mediates tumor-stroma cross-talk promoting pancreatic cancer progression. Sci.Adv. 2020, 6, eabb9200. [CrossRef]
59. Liu, W.J.; Zhou, L.; Liang, Z.Y.; Zhou, W.X.; You, L.; Zhang, T.P.; Zhao, Y.P. Plasminogen Activator Inhibitor 1 as a Poor PrognosticIndicator in Resectable Pancreatic Ductal Adenocarcinoma. Chin. Med. J. 2018, 131, 2947–2952. [CrossRef]
60. Alcindor, T.; Beauger, N. Oxaliplatin: A review in the era of molecularly targeted therapy. Curr. Oncol. 2011, 18, 18–25. [CrossRef]61. De Sousa Cavalcante, L.; Monteiro, G. Gemcitabine: Metabolism and molecular mechanisms of action, sensitivity and chemoresis-
tance in pancreatic cancer. Eur. J. Pharmacol. 2014, 741, 8–16. [CrossRef] [PubMed]62. Kciuk, M.; Marciniak, B.; Kontek, R. Irinotecan-Still an Important Player in Cancer Chemotherapy: A Comprehensive Overview.
Int. J. Mol. Sci. 2020, 21, 4919. [CrossRef] [PubMed]63. Perez-Riverol, Y.; Csordas, A.; Bai, J.; Bernal-Llinares, M.; Hewapathirana, S.; Kundu, D.J.; Inuganti, A.; Griss, J.; Mayer, G.;
Eisenacher, M.; et al. The PRIDE database and related tools and resources in 2019: Improving support for quantification data.Nucleic Acids Res. 2019, 47, D442–D450. [CrossRef] [PubMed]