COMBINE: a novel drug discovery platform designed to ... - arXiv
25
1 COMBINE: a novel drug discovery platform designed to capture insight and experience of users Sung Jin Cho* CimplSoft, Thousand Oaks, CA 91320. *Corresponding author phone: (805) 807-3913; e-mail: [email protected].
-
Upload
khangminh22 -
Category
Documents
-
view
1 -
download
0
Transcript of COMBINE: a novel drug discovery platform designed to ... - arXiv
1
COMBINE: a novel drug discovery platform designed to capture
insight and experience of users
Sung Jin Cho*
CimplSoft, Thousand Oaks, CA 91320.
*Corresponding author phone: (805) 807-3913; e-mail: [email protected].
2
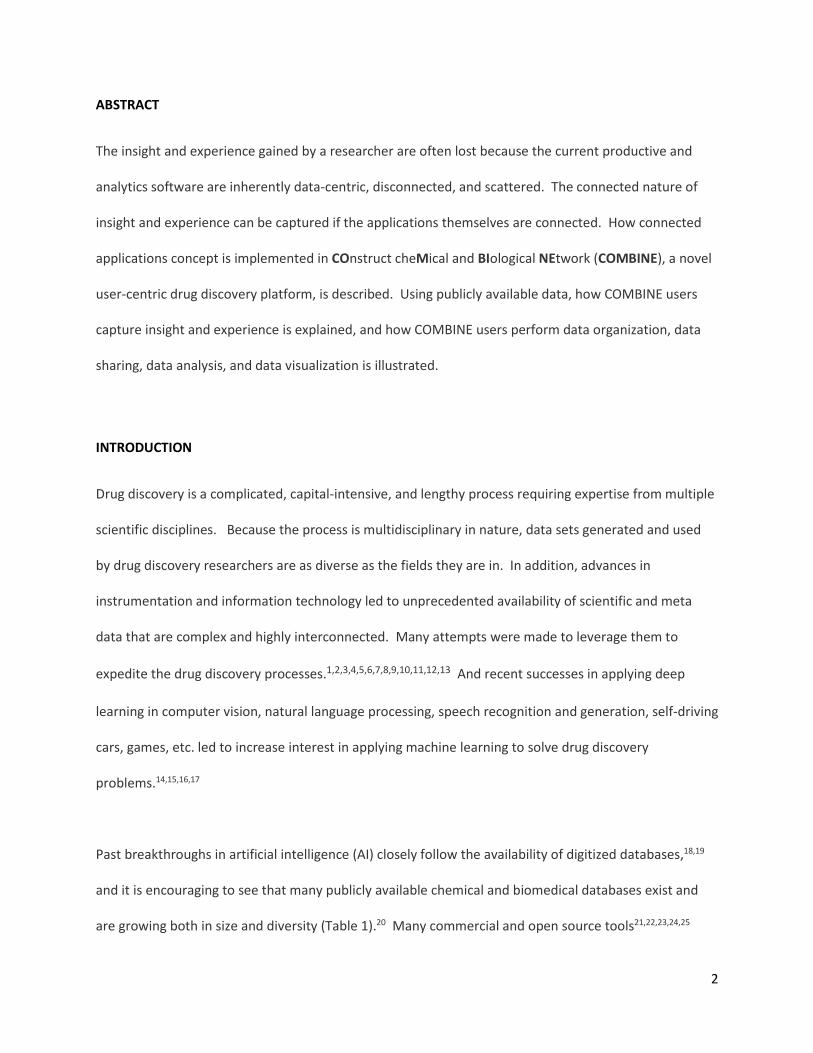
ABSTRACT
The insight and experience gained by a researcher are often lost because the current productive and
analytics software are inherently data-centric, disconnected, and scattered. The connected nature of
insight and experience can be captured if the applications themselves are connected. How connected
applications concept is implemented in COnstruct cheMical and BIological NEtwork (COMBINE), a novel
user-centric drug discovery platform, is described. Using publicly available data, how COMBINE users
capture insight and experience is explained, and how COMBINE users perform data organization, data
sharing, data analysis, and data visualization is illustrated.
INTRODUCTION
Drug discovery is a complicated, capital-intensive, and lengthy process requiring expertise from multiple
scientific disciplines. Because the process is multidisciplinary in nature, data sets generated and used
by drug discovery researchers are as diverse as the fields they are in. In addition, advances in
instrumentation and information technology led to unprecedented availability of scientific and meta
data that are complex and highly interconnected. Many attempts were made to leverage them to
expedite the drug discovery processes.1,2,3,4,5,6,7,8,9,10,11,12,13 And recent successes in applying deep
learning in computer vision, natural language processing, speech recognition and generation, self-driving
cars, games, etc. led to increase interest in applying machine learning to solve drug discovery
problems.14,15,16,17
Past breakthroughs in artificial intelligence (AI) closely follow the availability of digitized databases,18,19
and it is encouraging to see that many publicly available chemical and biomedical databases exist and
are growing both in size and diversity (Table 1).20 Many commercial and open source tools21,22,23,24,25

3
that utilize them are available to drug discovery scientists and are invaluable in data processing, analysis,
and visualization. Many AI experts are also actively exploring ways to apply state-of-art machine
learning methods to expedite the drug discovery process.15,16,17,26 Undoubtedly, drug discovery
researchers will benefit from the current effort and the availability of yet to be created machine learning
approaches.
Common characteristics, found among these tools, are that they are inherently data-centric,
disconnected, and scattered. For example, performing a routine medicinal chemistry task of performing
similarity and substructure searches, followed by looking for pharmacology and protein structure data,
requires juggling multiple tools and resources. Saving the search results is tedious, and often the entire
process needs to be repeated multiple times using different starting or sub structures to explore design
hypotheses (Figure 1). Remarkably, despite the obvious inconvenience frequently experienced by
researchers, there are no tools to address this balancing act of exploring hypotheses and keeping track
of what has been done. The insight and experience gained by researchers are found in their activity
history, which is a valuable information not utilized fully by the current productive and analytics
software.
In this paper, COnstruct cheMical and BIological NEtwork (COMBINE), a novel user-centric drug
discovery platform is described. The connected nature of insight and experience can be captured if the
applications themselves are connected, and how this “connected applications” concept is implemented
in COMBINE is described. How data organization, data sharing, data analysis, and data visualization can
be performed differently compared to traditional approaches are illustrated using publicly available
data.

4
RESULTS and DISCUSSIONS COMBINE COMBINE is a standalone software written using c/c++ and Qt27, a c++ cross-platform application
framework. COMBINE is a data source agnostic and is extremely flexible in dealing with diverse types of
data. Web APIs are used to access various resources described in Table 1. When necessary, web pages
can be parsed, a socket connection to a server can be made to communicate directly over a specified
port, or random accessible binary data files can be generated and used to avoid overhead associated
with relational databases. Every application in COMBINE, called app node, has a data table and a hash
table. Data stored in app node’s tables are used to create an interactive visualization. Figure 2 shows
the screen shot of different app nodes found in COMBINE.
Connected app nodes in COMBINE are represented as directed and undirected graphs, called a
knowledge network where edges describe relationships between app nodes, between a data point in an
app node to another app node, and between a data point in an app node to a data point in another app
node (Figure 3). Each edge is added interactively either by simply double clicking the data specified by a
mouse point or by selecting one of app node specific menus. The double-click action or selecting a
menu also instantiates an appropriate app node, and this interaction-triggered instantiation is how
COMBINE tracks users’ activities and allows users to focus on the current activity without losing the
context. App nodes and edges connecting them can be annotated to describe them further if the
default visualization is not intuitive enough, and tool tips are used to provide help messages.
Dependency OpenSSL28 is used to provide secure communications between COMBINE and different web servers. The
FFmpeg library29 is used to extract frames out of a video file, and the RDKit library24 is used to perform

5
various cheminformatic tasks. In addition, command line programs from Open Babel30, the Indigo
toolkit31, and the OFFIS DICOM toolkit32 are used to convert file formats.
Public Databases & APIs Many public databases and APIs are incorporated into COMBINE (Table 1), and they can be accessed by
creating an app node containing the data or interacting with the app node. An example of how different
resources can be stringed together seamlessly to address a typical medicinal chemist’s workflow is
described in Figure 1. The ChEMBL40 database is a database containing structures and annotations of
over 1.7 million compounds, and it is a database frequently used to explore a design hypothesis. A
similarity searching can be performed against it, or different chemotypes can be used to perform
substructure searches. Once interesting ChEMBL hits are found, Open PHACTS APIs41 can be used to
query various pharmacological data as well as patent data found in the SureChEMBL42 database. Many
different structure identifiers, representing the same structure, are possible, and the UniChem43
database provides a way to cross-reference against 33 data sources currently available. One of the
pharmacological data linked to the ChEMBL compound is the molecular target information, which is
typically determined by examining its activity value and the type of biochemical assays it is active
against. The default pChEMBL33 value of 6 is used to make the determination unless noted otherwise.
The protein sequence and functional information of the molecular target are found in the UniProt44
database. If publicly known, the 3D structure of the protein target can be obtained from the PDB45
database. Like small molecule cross-references provided by the UniChem38 database, the BioDBnet46
database provides molecular target cross-references and is used to convert from gene ID to UniProt ID.
Protein and genetic interactions, chemical interactions, and post translational modifications data are
stored in the BioGRID47 database.

6
Data Organization and Data Sharing Like tables found in a relational database management system, each app node stores and manipulates
the data in tabular form, and the data found in each cell in the table can be of diverse data types. Since
app nodes are connected, carrying all the information all the time is not necessary. Each app node only
needs to keep track of the parent app node where the current app node was generated from and
extract additional information when necessary. Since an edge can also originate from a data point, its
location must be tracked as well. The data stored in each app node can be also transferred from
external data sources via web services. Stored data can be permanently associated with each app node
or, when more convenient, retrieved in real time when a saved knowledge network is loaded. In this
case, the knowledge network contains a list of URLs describing how different data can be retrieved. A
PDB node, for example, retrieves the image of the selected protein when it is loaded.
A knowledge network is generated as users interact with each app node, and edges (either lines or
arrows) describe how different activities are connected (Figure 3). This simple feature allows a user to
visualize the history of how data was transformed and/or analyzed. A typical workflow of medicinal
chemists involves finding similar compounds to the compound they are working on. From hits they
found, they search for any associated pharmacology data. If a connection to a protein target can be
made, other targets, pathways they are in, and diseases they are implicated in are all the information
medicinal chemists are interested in knowing. This workflow is illustrated in Figure 4a. What many
standalone or browser enabled applications typically allow users to do is to save the result or bookmark
the relevant web pages. How users arrive at that position must be described separately or, most of
times, is lost. The knowledge network in COMBINE captures this history automatically, so that users
know exactly how they arrived at the result. Sharing the history improves productivity because seeing
what has been done allows users to minimize the chance of repeating the work, and they can plan

7
things more efficiently. It also promotes a collaboration because other users can follow the history to
better understand what has been done, repeat the work if desired, and build upon the previous work
easily. Continuing the example given earlier, based on literature hits, the medicinal chemist can perform
the structure activity relationship analysis, design a new compound, and search against a patent
database (Figure 4a). A biologist can look for other off target activities of the designed compound and
formulate novel therapeutic uses (Figure 4b). An in vivo pharmacologist can link imaging data to
correlate in vitro assay data or add a short video to show the behavior of an animal.
One common activity most researchers perform is to read scientific papers and try to apply what they
learn in their own research. Writing a research paper to describe positive findings is a typical result.
However, negative findings and other exploratory activities are not captured properly. COMBINE allows
users to capture these activities by linking datasets, performing analyses, and visualizing results. Figure
4b illustrates different user activities stemming from a medicinal chemistry paper. Target information is
added to describe the biology of the capsaicin receptor, and the structure-activity relationship table is
generated using compounds described in the paper. Annotating a research paper with a dataset which a
user can interact in real time is an extremely powerful way to understand and apply their findings.
Data Analysis and Data Visualization Data analysis can be performed locally or remotely. This decision is largely based on the accessibility of
remotely available tools, but an emphasis is given to a design that will improve the user experience.
Generating fragments, calculating properties, performing various clustering, etc. are examples of tasks
that are performed locally because they can be processed relatively fast. The result generated from
executing each task is encapsulated in another app node and connected automatically to the parent app
node. As described previously, this frees up valuable research time, and users can focus more on design

8
and exploring hypotheses. The default visualization produced by each app node is designed carefully
to be intuitive and concise.
An app node can also be configured to act as user interface (UI) to control applications installed
remotely. Figure 5 illustrates a simple app node containing 3 buttons to retrieve three types of data
from Firebrowse34 using their Web APIs. The first button is to access 38 different cohorts, the second
button is to access mRNAseq expression profiles found in different cohorts, and the third button is to
access the copy number variations of participants found in different cohorts. For example, double
clicking the Cohort button creates the “firebrowse cohorts” app node, retrieves the list of 38 cohorts
and their description, populate the app node’s data table, and visualize the list as interactive buttons.
Double clicking the button containing adrenocortical carcinoma retrieves participants belong to the
cohort, and a custom plot, combining box and scatter plots, are created to visualize downloaded data.
Each additional query action, performed by double clicking a data point or a button, adds a connection
to the knowledge network. Once results are stringed together this way, other data, like infographics
describing the disease or the structure of a drug, can be easily added to describe the network further.
Such app nodes are also good branching points to introduce different data.
A more sophisticated UI example is Cas9 gRNA tool (Figure 6). This UI collects an input DNA sequence
and runs server-side programs, including Bowtie35, an ultrafast short sequence alignment program. The
web version of the application is found at https://cheminformatic.com/grna/index.php. It outputs
unique 23mers, corresponding target sequences (reverse complements if the direction shown is “-“), GC
content, the number of off-targets for 1bp and 2bp mismatches, and the sequences of off-targets. A
“grna tool” app node, an interactive DNA sequence viewer, is used to specify locations of target
sequences, and the tabular form of the output which is stored in the data table can be displayed.

9
The Details-on-demand36 (DoD) visualization approach is heavily utilized at the network and app node
level. It is a technique used to free up the computer resource when displaying details is not necessary.
The network level DoD visualization is activated when no app node has been selected, and zoom levels
and the area of network currently displayed in the viewing window are used to determine how the
computer resource should be used. The part of the network outside the viewing window is excluded
from drawing, and app nodes that are too small to see are converted to static images. Static images are
converted to interactive visualizations only when sufficiently zoomed in so that individual components
can be identified. This technique allows users to create a knowledge network containing a large number
of app nodes and to navigate easily regardless of the size of the network. The preview panel is used to
move quickly to the desired area (Figure 7). This feature is especially useful when there are many
disconnected knowledge networks.
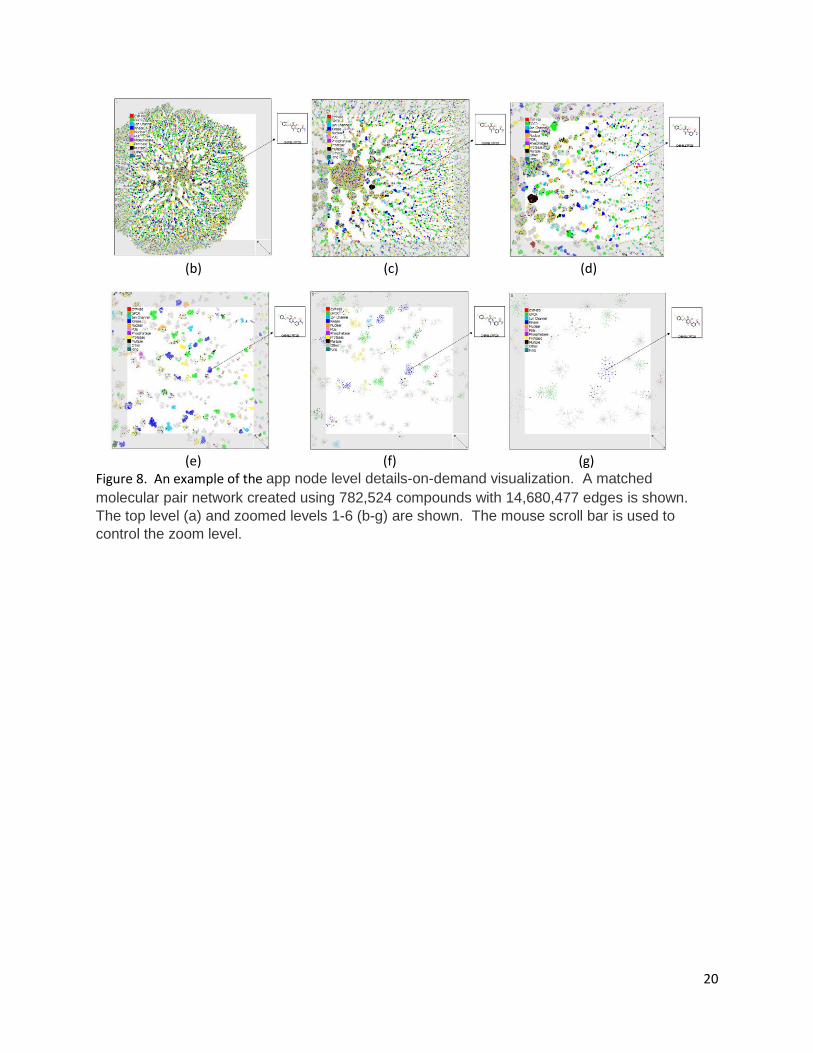
Once an app node is selected, the app node level DoD visualization is activated. Figure 8 shows how the
app node level DoD visualization technique is used to visualize a matched molecular pair (MMP)
network37 created using 782,524 ChEMBL compounds with 14,680,477 edges which represent MMP
pairs. The minimum spanning tree algorithm is used to reduce the number of edges that need to be
drawn. Once a layout was generated using LGL38, seven different size images (256x256, 512x512,
1024x1024, 2048x2048, 4056x4056, 8192x8192, and 16384x16384 pixels) were generated for each
zoom level, and 256x256 pixel size tiles were cut out of each image. This cut out process produces 1, 4,
16, 64, 256, 1024, and 4096 tiles for zoom level 0, 1, 2, 3, 4, 5, 6, respectively. Figure 9 shows cut out
tiles for images generated for zoom levels 0, 1, and 2. By converting a complex network into multiple
tile images and only displaying tiles surrounding the mouse pointer, users can navigate and zoom in &
out extremely fast, and the performance is independent of the number of nodes and edges found in the

10
MMP network. Each node in the MMP network represents a ChEMBL compound and is colored
according to its intended target class. When the node is double clicked, the structure of the ChEMBL
compound is retrieved, and the molecule viewer app node displays the structure. This again could be
used as a starting point to link other app nodes (Figure 10).
CONCLUSION
We use analytics and productive software whether standalone or browser-based to solve specific tasks,
and software programs have evolved to do that job very well. As data that is needed by those programs
move from user’s desktop to the cloud and internet connections are getting faster, software developers
have redesigned their programs to incorporate advantages offered by the change. The current trend is
to port a standalone program to a browser-based application to better utilize data stored in the cloud,
to simplify the installation process, and to improve their revenue stream.
The real opportunity, however, lies within relationships found among diverse data and applications
which use them. As more data are added and their relationships uncovered, it will be easier to exploit
that relationship. Many applications make use of data relationships using relational database
management systems, and low-level sharing of software components between applications can be
achieved using component object model based technologies, which led to MicroSoft’s Object Linking
and Embedding and Active X.39 Interestingly, existing technologies tend to hide relationships from users
unless requested, and, often, dedicated visual and analytics software are required to study them. And
no software exists to understand application relationships and how users use them. Due to the lack of a
standard and a long history of data-centric and task oriented software development, it would be difficult
to change the current trend.

11
The connected applications concept implemented in COMBINE illustrates that many advantages exist if
applications are connected at the higher level and application relationships can be visualized.
Experience is a sequence of events, and this event in COMBINE is an app node. By stringing together
app nodes, COMBINE users can create an experience, a story. A story that can be shared with other
users to impart insight.

12
Table 1. The list of resources that can be accessed from COMBINE.
Resources Description/URL Content (stats can vary as they are updated regularly)
ChEMBL40
Manually curated drug-like bioactive compounds https://www.ebi.ac.uk/chembl
11,538 targets, 1,735,442 compounds, 14,675,320 activities, and 67,722 publications (version 23)
Open PHACTS41 API
API to access datasets integrated in the Open PHACTS Discovery Platform https://www.openphacts.org
API to access data found in ChEBI, ChEMBL, SureChEMBL, ChemSpider, ConceptWiki, DisGeNET, DrugBank, Gene Ontology, neXtProt, UniProt and WikiPathways
SureChEMBL42
Chemically annotated patent document database https://www.surechembl.org
Open patent data containing over 17 million compounds
UniChem43
Unified chemical structure cross-referencing and identifier tracking system https://www.ebi.ac.uk/unichem
Cross-references of over 151 million structures from 33 data sources
UniProt44
Protein knowledgebase http://www.uniprot.org
protein sequence and functional information of reviewed (555,100) and unreviewed (88,032,926) molecular targets
PDB45 Protein data bank https://www.rcsb.org
41,817 distinct protein sequences, 37,068 structures of human sequences, and 9,503 nucleic acid containing structures
BioDBnet46 Biological database network https://biodbnet-abcc.ncifcrf.gov
207 distinct nodes and 738 edges
BioGRID47
Interaction datasets https://thebiogrid.org
63,354 publications, 1,493,749 protein and genetic interactions, 27,785 chemical associations, and 38,559 post translational modifications
LINCS48
The Library of Integrated Network-based Cellular Signatures (LINCS) http://lincsportal.ccs.miami.edu
350 datasets, 41,847 small molecules 1,127 cells, 978 genes, 1,469 proteins, 155 peptide, and 8 antibodies
ZINC49 Purchasable compound database http://zinc15.docking.org
Over 100 million compounds in 3D formats
TCIA50 The cancer imaging archive http://www.cancerimagingarchive.net
72 collections, 36 cancer types, and 34,959 subjects
PepBank51 Peptide database http://pepbank.mgh.harvard.edu
21,691 peptides

13
Metrabase52
Metabolism and transport database http://www-metrabase.ch.cam.ac.uk
20 transporters and 13 CYPs, 3,438 compounds, 11,649 interaction records, and 1,211 literature references
Firebrowse53
Cancer data exploration tool http://firebrowse.org
28 cohorts and 14,729 cases
Human kinome54
Aligned human kinases http://kinase.com/human/kinome/groups/ePK.aln
491 sequences
(a)

14
(b)
Figure 1. Two example workflows described as flowcharts. Colors represent databases. (a) A workflow describing how to find the biological activity of a compound is shown. (b) A workflow describing how to identify a small molecule related to a query is shown.
(a) (b) (c)

15
(d) (e) (f)
(g) (h) (i)
Figure 2. Example app nodes found in COMBINE. (a) An app node containing 58 compounds is shown.
The number at the top left corner represents the current zoom level. The row and column numbers are
also shown. (b) 35 physicochemical properties are represented as radial, pie shaped, bar charts. (c) A
heatmap generated using 58 structures and 13 properties is shown. Colors range from red (low) to
yellow (middle) to green (high). (d) A hierarchical clustering result is visualized using a dendrogram. (e)
The image of 1M63 is displayed. (f) An interactive molecule viewer displaying the structure of 1M63 is
shown. (g) A chord diagram generated using 673 compounds. Curved lines link compounds that have ≥
0.8 similarity. Straight lines surrounding the circle represent activities. (h) An interactive 3D scatter plot
generated using 673 compounds is shown. (g) A protein sequence viewer is used to display the
sequence of P09581.

16
Figure 3. An example of a knowledge network consisting of three app nodes, a structure table, a
structure viewer, and parallel coordinates. Edges describe relationships between app nodes: (a)
between app nodes, (b) between a data point in an app node to another app node, and (c) between a
data point in an app node to a data point in another app node.
(a)

17
(b)
Figure 4. Example knowledge networks describing data organization and data sharing: (a) annotating a
journal of medicinal chemistry paper and (b) linking chemical and biological data.

18
(a) (b)
Figure 5. Three button UI created using Firebrowse’s Web APIs. (a) The UI and (b) a knowledge network
generated are shown.
(a) (b)
Figure 6. gRNA tool app node. (a) The UI and (b) an app node displaying the output are shown.

19
Figure 7. The preview panel is located at the bottom right. The image of a lens is used to indicate the currently focused area.
(a)
20
(b) (c) (d)
(e) (f) (g) Figure 8. An example of the app node level details-on-demand visualization. A matched
molecular pair network created using 782,524 compounds with 14,680,477 edges is shown.
The top level (a) and zoomed levels 1-6 (b-g) are shown. The mouse scroll bar is used to
control the zoom level.

21
(a) (b) (c)
Figure 9. Tiles generated after cutting (a) 256x256, (b) 512x512, and (c) 1024x1024 pixel images
representing zoom levels 0, 1, and 2 respectively.

22
Figure 10. The MMP network viewer is used as a starting app node to generate this knowledge network.
After displaying the structures of three ChEMBL compounds, the pharmacology data of two ChEMBL
compounds were added.

23
1 Hagadone, T. R.; Lajiness, M. S. Integrating Chemical Structures into an Extended Relational Database System.
In Chemical Structures 2; Warr, W. A., Ed.; Springer: Berlin, 1993; 257-269. 2 Ahlberg, C. Visual exploration of HTS databases: bridging the gap between chemistry and biology, Drug
Discovery Today, 1999, 4, 370-376. 3 Trepalin, S. V.; Yarkov, A. V. CheD: Chemical Database Compilation Tool, Internet Server, and Client for SQL
Servers, J. Chem. Inf. Comput. Sci. 2001, 41, 100-107. 4 Ihlenfeldt, W. D.; Voigt, J. H.; Bienfait, B.; Oellien, F.; Nicklaus, M. C. Enhanced CACTVS Browser of the Open
NCI Database, J. Chem. Inf. Comput. Sci., 2002, 42, 46-57. 5 Adams, N.; Schuber, U. S. From Data to Knowledge: Chemical Data Management, Data Mining, and Modeling
in Polymer Science, J. Comb. Chem., 2004, 6, 12-23. 6 Gobbi, A.; Funeriu, S.; Ioannou, J.; Wang, J.; Lee, M. L.; Palmer, C.; Bamford, B.; Hewitt, R. Process-Driven
Information Management System at a Biotech Company: Concept and Implementation, J. Chem. Inf. Comput. Sci.,
2004, 44, 964-975. 7 Ertl, P.; Selzer, P.; Mühlbacher, J. Web-Based Cheminformatics Tools Deployed via Corporate Intranets. Drug
Discovery Today, 2004, 2, 201-207. 8 Rojnuckarin, A.; Gschwend, D. A.; Rotstein, S. H. ArQiologist: An Integrated Decision Support Tool for Lead
Optimization, J. Chem. Inf. Model, 2005, 45, 2-9. 9 Cho, S. J.; Sun, Y.; Harte, W. ADAAPT: Amgen's Data Access, Analysis, and Prediction Tools, Journal of
Comput. Aided Mol. Des., 2006, 20, 249-261. 10 Agrafiotis, D. K.; Alex, S.; Dai, H.; Derkinderen, A.; Farnum, M.; Gates, P.; Izrailev, S.; Jaeger, E. P.; Konstant,
P.; Leung, A.; Lobanov, V. S.; Marichal, P.; Martin, D.; Rassokhin, D. N.; Shemanarev, M.; Skalkin, A.; Stong, J.;
Tabruyn, T.; Vermeiren, M.; Wan, J.; Xu, X. Y.; Yao X. Advanced biological and chemical discovery (ABCD):
Centralizing Discovery Knowledge in an Inherently Decentralized World, J. Chem. Inf. Model., 2007, 6, 1999-2014. 11 Sander, T.; Freyss, J.; von Korff, M.; Reich, J. R.; Rufener, C. OSIRIS, an Entirely In-House Developed Drug
Discovery Informatics System. J. Chem. Inf. Model., 2009, 49, 232-246. 12 Muresan, S.; Petrov, P.; Southan, C.; Kjellberg, M. J.; Kogej, T.; Tyrchan, C.; Varkonyi, P.; Xie, P. H. Making
Every SAR Point Count: The Development of Chemistry Connect for the Large-Scale Integration of Structure and
Bioactivity, Data. Drug Discovery Today, 2011, 16, 1019-1030. 13 de Souza1, A.; Bittker1, J. A.; Lahr1, D. L.; Brudz1, S.; Chatwin1, S.; Oprea, T. I.; Waller, A.; Yang, J. J.;
Southall, N.; Guha, R.; Schurer, S. C.; Vempati, U. D.; Southern, M. R.; Dawson, E. S.; Clemons, P. A.; Chung, T.
D. Y. An Overview of the Challenges in Designing, Integrating, and Delivering BARD: A Public Chemical-
Biology Resource and Query Portal for Multiple Organizations, Locations, and Disciplines, Journal of Biomolecular
Screening, 2014, 19, 614-627. 14 LeCun, Y.; Bengio, Y.; Hinton, G. Deep Learning. Nature, 2015, 521, 436-444. 15 Wallach, I.; Dzamba, M.; Heifets, A. Atomnet: a Deep Convolutional Neural Network for Bioactivity Prediction
in Structure-Based Drug Discovery. arXiv:1510.02855, 2015. 16 Wu, Z.; Ramsundar, B.; Feinberg, E. N.; Gomes, J.; Geniesse, C.; Pappu, A. S.; Leswing, K.; Pande, V.
MoleculeNet: A Benchmark for Molecular Machine Learning. arXiv:1703.00564, 2017. 17 Pereira, J. C.; Caffarena, E. R.; dos Santos, C. N. Boosting Docking-Based Virtual Screening with Deep Learning.
J. Chem. Inf. Model., 2016, 56, 2495-2506. 18 Deng, J.; Dong, W.; Socher, R.; Li, L.-J.; Li, K.; Fei-Fei. L. ImageNet: A Large-Scale Hierarchical Image
Database. In CVPR09, 2009. 19 Silver, D.; Huang, A.; Maddison, C. J.; Guez, A.; Sifre, L.; van den Driessche, G.; Schrittwieser, J.; Antonoglou,
I.; Panneershelvam, V.; Lanctot, M.; Dieleman, S.; Grewe, D.; Nham, J.; Kalchbrenner, N.; Sutskever, I.; Lillicrap,
T.; Leach, M.; Kavukcuoglu, K.; Graepel, T.; Hassabis, D. Mastering the Game of Go with Deep Neural Networks
and Tree Search. Nature, 2016, 529, 484-489. 20 Chen, B.; Butte, A. J. Leveraging Big Data to Transform Target Selection and Drug Discovery. Clin. Pharmacol.
Ther., 2016, 99, 285-297. 21 Berthold M.R.; Cebron, N.; Dill F.; Gabriel, T. R.; Kotter, T.; Meinl, T.; Ohl, P.; Sieb, C.; Thiel, K.;
Wiswedel, B. (2008) KNIME: The Konstanz Information Miner. In: Preisach C., Burkhardt H., Schmidt -
Thieme L., Decker R. (eds) Data Analysis, Machine Learning and Applications. Studies in Classification, Data
Analysis, and Knowledge Organization. Springer, Berlin, Heidelberg 22 Dassault Systèmes BIOVIA, BIOVIA Workbook, Release 2017; BIOVIA Pipeline Pilot, Release 2017, San
Diego: Dassault Systèmes. 23 https://www.dotmatics.com/sites/default/files/literature/datasheets/vortex-a4.pdf
24
24 RDKit: Open-source cheminformatics; http://www.rdkit.org 25 Shannon P.; Markiel, A.; Ozier, O.; Baliga, N. S.; Wang, J. T.; Ramage, D.; Amin, N.; Schwikowski, B.; Ideker,
T. Cytoscape: a Software Environment for Integrated Models of Biomolecular Interaction Networks. Genome
Research 2003, 13, 2498-504 26 Mamoshina, P.; Vieira, A.; Putin, E.; Zhavoronkov, A. Applications of Deep Learning in Biomedicine. Mol.
Pharmaceutics 2016, 13, 1445-1454. 27 https://www.qt.io/ 28 https://www.openssl.org/ 29 https://ffmpeg.org/ 30 O'Boyle, N. M.; Banck, M.; James, C. A.; Morley, C.; Vandermeersch, T.; Hutchison, G. R. Open Babel: An open
chemical toolbox. J. Cheminf. 2011, 3, 33-47. 31 http://lifescience.opensource.epam.com/indigo/ 32 http://dcmtk.org 33 The pChEMBL value is defined as –log (molar IC50, XC50, EC50, AC50, Ki, Kd, or Potency);
https://www.ebi.ac.uk/chembl/faq#faq67 34 The broad institute GDAC Firebrowse is a tool to explore cancer data; http://firebrowse.org/ 35 Langmead, B.; Trapnell, C.; Pop, M.; Salzberg, S. L. Ultrafast and Memory-Efficient Alignment of Short DNA
Sequences to the Human Genome, Genome Biology, 2009, 10, 25-35. 36 Rauschenbach, U. Progressive Image Transmission Using Levels of Detail and Regions of Interest, Proc.
IASTED Conf. on Computer Graphics and Imaging, 1998, June 1-4. 37 Cho, S. J. PRE-render Content Using Tiles (PRECUT). 1. Large-Scale Compound-Target Relationship Analyses.
Manuscript in preparation. 38 Adai, A. T.; Date, S. V.; Wieland, S.; Marcotte, E. M. LGL: Creating a Map of Protein Function with an
Algorithm for Visualizing Very Large Biological Networks, J. Mol. Biol., 2004, 340, 179-190. 39 https://www.microsoft.com/com/default.mspx 40 Gaulton, A.; Bellis, L. J.; Bento, A. P.; Chambers, J.; Davies, M.; Hersey, A.; Light, Y.; McGlinchey, S.;
Michalovich, D.; Al-Lazikani, B.; Overington, J. P. ChEMBL: a Large-scale Bioactivity Database for Drug
Discovery, Nucleic Acids Res. 2012, 40, 1100-1107. 41 Williams, A. J.; Harland, L.; Groth, P.; Pettifer, S.; Chichester, C.; Willighagen, E. J.; Evelo, C. T.; Blomberg, N.;
Ecker, G.; Goble, C.; Mons, B. Open PHACTS: Semantic Interoperability for Drug Discovery, Drug Discovery
Today, 2012, 17, 1188-1198. 42 Papadatos, G.; Davies, M.; Dedman, N.; Chambers, J.; Gaulton, A.; Siddle, J.; Koks, R.; Irvine, S. A.; Pettersson,
J.; Goncharoff, N.; Hersey, A.; Overington, J. P. SureChEMBL: a large-scale, chemically annotated patent
document database, Nucleic Acids Res., 2016, 44, 1220-1228. 43 Chambers, J.; Davies, M.; Gaulton, A.; Hersey, A.; Velankar, S.; Petryszak, R.; Hastings, J.; Bellis, L.;
McGlinchey, S.; Overington, J. P. UniChem: a unified chemical structure cross-referencing and identifier tracking
system, J. Cheminform., 2013, 5, 3-12. 44 The UniProt Consortium. UniProt: the Universal Protein Knowledgebase, Nucleic Acids Res., 2017, 45, 158-169. 45 Berman, H. M.; Westbrook, J.; Feng, Z.; Gilliland, G.; Bhat, T. N.; Weissig, H.; Shindyalov, I. N.; Bourne, P. E.
The Protein Data Bank, Nucleic Acids Research, 2000, 28, 235-242. 46 Mudunuri, U.; Che, A.; Yi, M.; Stephens, R. M. bioDBnet: the Biological Database Network, Bioinformatics,
2009, 25, 555-556. 47 Stark, C.; Breitkreutz, B. J.; Reguly, T.; Boucher, L.; Breitkreutz, A.; Tyers, M. BioGRID: a general repository
for interaction datasets, Nucleic Acids Res., 2006, 34, 535-539. 48 Library of Integrated Network-based Cellular Signatures (LINCS). http://lincsproject.org/. 49 Sterling, T.; Irwin, J. J. ZINC 15 - Ligand Discovery for Everyone, J. Chem. Inf. Model., 2015, 55, 2324-2337. 50 Clark, K.; Vendt, B.; Smith, K.; Freymann, J.; Kirby, J.; Koppel, P.; Moore, S.; Phillips, S.; Maffitt, D.; Pringle,
M.; Tarbox, L.; Prior, F. The Cancer Imaging Archive (TCIA): Maintaining and Operating a Public Information
Repository, Journal of Digital Imaging, 2013, 26, 1045-1057. 51 Shtatland, T.; Guettler, D.; Kossodo, M.; Pivovarov, M.; Weissleder, R. PepBank-a Database of Peptides Based
on Sequence Text Mining and Public Peptide Data Sources, BMC Bioinformatics, 2007, 8, 280-290. 52 Mak, L.; Marcus, D.; Howlett, A.; Yarova, G.; Duchateau, G.; Klaffke, W.; Bender, A.; Glen, R. C. Metrabase: a
Cheminformatics and Bioinformatics Database for Small Molecule Transporter Data Analysis and (Q)SAR
Modeling, Journal of Cheminformatics, 2015, 7, 31-43. 53 The Broad Institute GDAC Firebrowse. http://firebrowse.org/.

25
54 Manning, G.; Whyte, D. B.; Martinez, R.; Hunter, T.; Sudarsanam, S. The Protein Kinase Complement of the
Human Genome, Science, 2002, 298, 1912-1934.