Learning to Combine Local and Global Image Information for ...
26
sensors Article Learning to Combine Local and Global Image Information for Contactless Palmprint Recognition Marjan Stoimchev 1, * ,† , Marija Ivanovska 2,† and Vitomir Štruc 2 Citation: Stoimchev, M.; Ivanovska, M.; Štruc, V. Learning to Combine Local and Global Image Information for Contactless Palmprint Recognition. Sensors 2022, 22, 73. https://doi.org/10.3390/ s22010073 Academic Editors: Dan Istrate, Imad Rida and Lunke Fei Received: 11 November 2021 Accepted: 20 December 2021 Published: 23 December 2021 Publisher’s Note: MDPI stays neutral with regard to jurisdictional claims in published maps and institutional affil- iations. Copyright: © 2021 by the authors. Licensee MDPI, Basel, Switzerland. This article is an open access article distributed under the terms and conditions of the Creative Commons Attribution (CC BY) license (https:// creativecommons.org/licenses/by/ 4.0/). 1 Institut Jožef Stefan, Jamova Cesta 39, 1000 Ljubljana, Slovenia 2 Faculty of Electrical Engineering, University of Ljubljana, Tržaška Cesta 25, 1000 Ljubljana, Slovenia; [email protected] (M.I.), [email protected] (V.Š.) * Correspondence: [email protected] † These authors contributed equally to this work. Abstract: In the past few years, there has been a leap from traditional palmprint recognition method- ologies, which use handcrafted features, to deep-learning approaches that are able to automatically learn feature representations from the input data. However, the information that is extracted from such deep-learning models typically corresponds to the global image appearance, where only the most discriminative cues from the input image are considered. This characteristic is especially problematic when data is acquired in unconstrained settings, as in the case of contactless palmprint recognition systems, where visual artifacts caused by elastic deformations of the palmar surface are typically present in spatially local parts of the captured images. In this study we address the problem of elastic deformations by introducing a new approach to contactless palmprint recognition based on a novel CNN model, designed as a two-path architecture, where one path processes the input in a holistic manner, while the second path extracts local information from smaller image patches sampled from the input image. As elastic deformations can be assumed to most significantly affect the global appearance, while having a lesser impact on spatially local image areas, the local processing path addresses the issues related to elastic deformations thereby supplementing the information from the global processing path. The model is trained with a learning objective that combines the Additive Angular Margin (ArcFace) Loss and the well-known center loss. By using the proposed model design, the discriminative power of the learned image representation is significantly enhanced compared to standard holistic models, which, as we show in the experimental section, leads to state-of-the-art performance for contactless palmprint recognition. Our approach is tested on two publicly available contactless palmprint datasets—namely, IITD and CASIA—and is demonstrated to perform favorably against state-of-the-art methods from the literature. The source code for the proposed model is made publicly available. Keywords: palmprint recognition; contactless palmprint images; elastic deformations; convolutional neural networks; deep learning; ArcFace loss; center loss; discriminative feature learning 1. Introduction The area of palmprint recognition is a well-established subfield of biometrics and has been widely deployed commercially throughout the years [1,2]. Palmprint recognition techniques typically rely on two kinds of features for identity recognition in addition to the obvious principle lines, i.e., palmar friction ridges (the ridge and valley structures like fingerprint) and the palmar flexion creases (discontinuities in the epidermal ridge patterns), as illustrated in Figure 1a,b, respectively [1,3,4]. These characteristics represent rich sources of discriminative information based on which efficient recognition models can be designed. Palmprint-based biometric systems have been increasingly researched recently due to their high recognition accuracy, usability, and acceptability [1,2]. Sensors 2022, 22, 73. https://doi.org/10.3390/s22010073 https://www.mdpi.com/journal/sensors
-
Upload
khangminh22 -
Category
Documents
-
view
1 -
download
0
Transcript of Learning to Combine Local and Global Image Information for ...

sensors
Article
Learning to Combine Local and Global Image Information forContactless Palmprint Recognition
Marjan Stoimchev 1,*,† , Marija Ivanovska 2,† and Vitomir Štruc 2
�����������������
Citation: Stoimchev, M.;
Ivanovska, M.; Štruc, V. Learning to
Combine Local and Global Image
Information for Contactless
Palmprint Recognition. Sensors 2022,
22, 73. https://doi.org/10.3390/
s22010073
Academic Editors: Dan Istrate, Imad
Rida and Lunke Fei
Received: 11 November 2021
Accepted: 20 December 2021
Published: 23 December 2021
Publisher’s Note: MDPI stays neutral
with regard to jurisdictional claims in
published maps and institutional affil-
iations.
Copyright: © 2021 by the authors.
Licensee MDPI, Basel, Switzerland.
This article is an open access article
distributed under the terms and
conditions of the Creative Commons
Attribution (CC BY) license (https://
creativecommons.org/licenses/by/
4.0/).
1 Institut Jožef Stefan, Jamova Cesta 39, 1000 Ljubljana, Slovenia2 Faculty of Electrical Engineering, University of Ljubljana, Tržaška Cesta 25, 1000 Ljubljana, Slovenia;
[email protected] (M.I.), [email protected] (V.Š.)* Correspondence: [email protected]† These authors contributed equally to this work.
Abstract: In the past few years, there has been a leap from traditional palmprint recognition method-ologies, which use handcrafted features, to deep-learning approaches that are able to automaticallylearn feature representations from the input data. However, the information that is extracted fromsuch deep-learning models typically corresponds to the global image appearance, where only themost discriminative cues from the input image are considered. This characteristic is especiallyproblematic when data is acquired in unconstrained settings, as in the case of contactless palmprintrecognition systems, where visual artifacts caused by elastic deformations of the palmar surface aretypically present in spatially local parts of the captured images. In this study we address the problemof elastic deformations by introducing a new approach to contactless palmprint recognition based ona novel CNN model, designed as a two-path architecture, where one path processes the input in aholistic manner, while the second path extracts local information from smaller image patches sampledfrom the input image. As elastic deformations can be assumed to most significantly affect the globalappearance, while having a lesser impact on spatially local image areas, the local processing pathaddresses the issues related to elastic deformations thereby supplementing the information from theglobal processing path. The model is trained with a learning objective that combines the AdditiveAngular Margin (ArcFace) Loss and the well-known center loss. By using the proposed model design,the discriminative power of the learned image representation is significantly enhanced compared tostandard holistic models, which, as we show in the experimental section, leads to state-of-the-artperformance for contactless palmprint recognition. Our approach is tested on two publicly availablecontactless palmprint datasets—namely, IITD and CASIA—and is demonstrated to perform favorablyagainst state-of-the-art methods from the literature. The source code for the proposed model is madepublicly available.
Keywords: palmprint recognition; contactless palmprint images; elastic deformations; convolutionalneural networks; deep learning; ArcFace loss; center loss; discriminative feature learning
1. Introduction
The area of palmprint recognition is a well-established subfield of biometrics and hasbeen widely deployed commercially throughout the years [1,2]. Palmprint recognitiontechniques typically rely on two kinds of features for identity recognition in addition tothe obvious principle lines, i.e., palmar friction ridges (the ridge and valley structures likefingerprint) and the palmar flexion creases (discontinuities in the epidermal ridge patterns),as illustrated in Figure 1a,b, respectively [1,3,4]. These characteristics represent rich sourcesof discriminative information based on which efficient recognition models can be designed.
Palmprint-based biometric systems have been increasingly researched recently due totheir high recognition accuracy, usability, and acceptability [1,2].
Sensors 2022, 22, 73. https://doi.org/10.3390/s22010073 https://www.mdpi.com/journal/sensors

Sensors 2022, 22, 73 2 of 26
(a) Palmar friction ridges
(b) Palmar flexion creases
Principal
lines
Figure 1. Illustration of the main palmprint characteristics/features commonly used for identityinference in palmprint recognition systems: (a) palmar friction ridges and (b) palmar flexion creases.
Over the last few years, there has been a transition from contact-based to contactlesspalmprint recognition approaches with a considerable amount of research focusing onthe latter problem [1,2,4–11]. Different from palmprint images captured with contact-based sensors, palmprint images captured in a contactless manner may be taken withcommercial off-the-shelf cameras and in unconstrained environments [1]. This not onlywidens the range of potential application scenarios where palmprint recognition can beused, but also brings improved convenience to users. Additionally, contactless palmprintacquisition offers many other benefits over contact-based alternatives, such as higher userfriendliness, increased privacy, and better hygiene [4]. Nevertheless, capturing palmprintsin a contactless manner also leads to new challenges related to increased appearancevariability caused by rotations, ambient illumination, translations, different distances fromthe sensor, elastic deformations, as well as by the presence of higher levels of noise [12].Among these, elastic deformations of the palmar surface (originating from the lack ofcontact surface that would constrain the placement of the hand) are one of the biggestissues for the recognition technology. This is illustrated in Figure 2, where a contact-based(shown at the top) as well as a contactless (shown at the bottom) acquisition proceduresare presented. As can be seen, the unconstrained placement of the hand typically results inpalmprint samples that exhibit significant deformations compared to images captured withcontact-based sensors. It has been shown that conventional palmprint recognition methodsoften degrade in performance when applied on such types of data due to the severeinter-class variability induced by the acquisition procedure. To avoid such performancedegradations, more powerful models capable of extracting robust and discriminativeimages representations are needed.
To address the problems encountered in challenging deployment scenarios, researchersare increasingly looking into deep-learning (DL) techniques when designing biometricsolutions. Such techniques are capable of: (i) extracting knowledge and learning discrim-inative representations from (partially noisy) data automatically and in an end-to-endmanner, (ii) adapting to the characteristics of the biometric samples, and (iii) achievingmore accurate recognition performance in less-constrained environments compared withtraditional hand-crafted feature extraction techniques. Several recent solutions, therefore,consider DL techniques for contactless palmprint recognition [1,4,6,13,14].
However, they exhibit at least one (or more) of the following shortcomings. First,the majority of existing techniques process input images in a holistic manner, where thelocal information that is preserved in the computed representation is limited only to themost discriminative parts of the input. In unconstrained settings this can be problematic,since different parts of the input might be elastically deformed, which greatly affects the

Sensors 2022, 22, 73 3 of 26
performance of such methods. Second, deep-learning models are often designed for closed-set recognition tasks (using a softmax over a fixed set of classes), raising questions aboutthe discriminability of the feature representations learned internally for open-set problems.
Moreover, existing (hybrid) methods that utilize both global and local image infor-mation fail to do so in a transparent way, that would allow interpretation of the resultsand lead to explainable decisions. This has implications for the future application of suchmodels and their compliance with existing privacy laws, such as GDPR [15,16].
(a)(a)(a)(a)
Figure 2. Illustrative comparison between a contact-based (at the top) and a contactless acquisitionprocedure used in palmprint recognition systems. Because the placement of the hand is not con-strained by a contact surface, images acquired in a contactless manner exhibit larger variability (alsodue to elastic deformations of the palmar surface) as shown by the example palmprint images on theright. Note that both example palmprints originate from the same subject.
In this work, we aim to address the problems outlined above by presenting a hybrid DLbased technique for contactless palmprint recognition, which: (i) utilizes both global andlocal information, (ii) learns highly discriminative features with considerable generalizationcapability, while not requiring extensive parameter tuning, and (iii) ensures interpretablerecognition results. To the best of our knowledge, the proposed approach represents thefirst hybrid DL technique developed specifically for contactless palmprint recognition.Different from other DL based solutions, our model also exhibits a high-level of robustnessto elastically deformed images and, as we show in the experimental section, ensuresstate-of-the-art recognition performance.
In summary, we make the following contributions in this study:
• We present a hybrid DL approach for contactless palmprint recognition based on anovel two-path network architecture that takes global as well as local image informa-tion into account.
• We propose an attention-based channel pooling operation, which is capable of (adap-tively) extracting the most discriminative (local) information from sampled patches ofthe given input image.
• We introduce thin plate splines (TPS) as an augmentation procedure for explicitlymodeling elastic deformations and demonstrate that the proposed augmentationprocedure is beneficial for recognition performance.
• We show the benefit of combining local and global image information into discrim-inative representations that lead to a state-of-the-art performance for contactlesspalmprint recognition on two publicly available datasets.

Sensors 2022, 22, 73 4 of 26
2. Related Work
In this section we discuss prior work related to this study and cover some of themost important representatives of conventional as well as deep learning-based palmprintrecognition methods. The reader is referred to some of the excellent surveys on palmprintrecognition for a more in-depth coverage of the field [17–19].
2.1. Conventional Methods
Early work on palmprint recognition focused on hand-crafted feature extractiontechniques to encode the palmprint structure. Jia et al. [8], for example, presented a palm-print descriptor, called Histogram of Oriented Lines (HOL) inspired by the establishedHistogram of Oriented Gradients (HOG) descriptor [8] and developed a recognition ap-proach around HOL that also considered subspace learning methods for dimensionalityreduction, i.e., PCA, LDA, and SRDA, as well as their corresponding kernel versionsKPCA, KLDA, and KSRDA. The proposed approach was tested on two palmprint datasets,i.e., PolyU II [20] and PolyU MB [21]. Kumar [2] explored the use of improved align-ment and matching strategies for contactless palmprint recognition using several publiclyavailable contactless palmprint datasets and showed that these lead to state-of-the-artperformance. Wu et al. [22] presented a contactless palmprint verification method thatused an isotropic filter for preprocessing and SIFT based feature extraction and matching.The proposed method utilized a two-stage strategy, i.e., in the first stage, an iterativeRANSAC (I-RANSAC) algorithm was employed to remove the mismatched points, andin the second stage, Local Palmprint Descriptors (LPDs) were extracted at SIFT keypointsand used to further refine the keypoint matching procedure. As a detection score, theauthors used the final number of matched SIFT keypoints.To evaluate the performanceof the proposed approach, two publicly available contactless palmprint databases wereconsidered, i.e., the IIT Delhi (IITD) Touchless Palmprint Database [23], and the CASIApalmprint database [24]. Zheng et al. [11] presented a new descriptor referred to as Differ-ence of Vertex Normal Vectors (DoN) for 2D palmprint matching. The descriptor is basedon the ordinal measure which partially describes the difference of the neighboring points’normal vectors. Using the DoN descriptor, the authors were able to extract 3D informationfrom 2D palmprint images, which was demonstrated to be highly stable under commonlyoccurring illumination variations during contactless imaging. The proposed method wasevaluated on several publicly available 2D palmprint databases in identification as well asverification mode with highly encouraging results.
While the solutions reviewed above achieved impressive performance for palmprintrecognition, they are still limited in the amount of discriminative information they areable to extract from the input images given their hand-crafted design. A richer and moredescriptive set of features can in general be obtained through the use of deep learningmodels, such as the one presented in this work.
2.2. Deep Learning Methods
More recently, the focus in the field of palmprint recognition shifted from tradi-tional feature engineering approaches to the deep learning based solutions [1,13,14,25].Fei et al. [18], for example, evaluated a number of feature extraction methods for contact-less palmprint recognition, including four deep learning architectures, i.e., AlexNet [26],VGG-16 [27], GoogLeNet [28] and Res-Net-50 [29]. These networks were pre-trained onImageNet [30] and then fine tuned using extracted palmprint regions of interest (ROIs). Theauthors concluded that deep learning methods achieve comparable or even higher perfor-mance than conventional palmprint methods. Genovese et al. [6] introduced the PalmNetarchitecture, a novel Convolutional Neural Network (CNN) that is capable of fine tuningspecific palmprint filters through an unsupervised procedure based on Gabor responsesand Principal Component Analysis (PCA), while not requiring class labels during the train-ing process. The authors validated their approach on several publicly available datasets, i.e.,the CASIA palmprint database V1 [24], the IITD database (Version 1.0) [23], the REgim Sfax

Sensors 2022, 22, 73 5 of 26
Tunisia (REST) hand database 2016 [25] and the Tongji Contactless Palmprint Dataset [5]. Inall cases, they obtained recognition accuracies greater than those of the prior methods fromthe literature [6]. Svoboda et al. [1], presented a Siamese-type CNN for palmprint imagerecognition based on a novel loss function related to the d-prime index. Their approachautomatically learns features from the data, thus not requiring extensive parameter tuning.By using their design, the authors achieved greater class separation between the genuineand the impostor score distributions and better scalability than competing methods, whilenot requiring large amounts of training data. The authors also achieved state-of-the-artverification results on the standard IIT Delhi [23] and CASIA palmprint [24] datasets. Liuand Kumar [4], designed a fully convolutional and highly optimized network that useda soft-shifted triplet (SSTL) loss function to learn discriminative palmprint features. Thepresented method was shown to offer superior generalization capability over differentpublicly available contactless palmprint databases, while not requiring database-specificparameter tuning. By using the proposed design, the authors consistently outperformedseveral classical and state-of-the-art palmprint recognition methods in identification, aswell as in verification experiments. Zhu et al. [31] introduced an adversarial metric learningmethodology for palmprint recognition and reported superior performance over competingtechniques on eight different datasets.
The approach in this paper is related to the above methods in that it also uses deeplearning to address the problem of contactless palmprint recognition but differently fromthe existing solutions, it takes not only global image appearance into account, but alsothe most discriminative local image cues that are aggregated through a novel attentionbased channel pooling operation. Moreover, to further boost the verification performancethe proposed model uses a powerful learning objective that allows it to learn highlydiscriminative feature representations.
3. Proposed Method
In this section we present our new DL-based methodology for contactless palmprintrecognition. First, we explain how the model encodes global and local image characteristicsfrom the palmprint images. Next, we introduce the attention mechanism. Finally, weproceed to the learning mechanism used to further enhance the discriminative power andthe quality of the learned deep palmprint features.
3.1. Overview of the Proposed Model
The idea behind our approach is illustrated on Figure 3. Compared to other relevantdeep learning methods, our method relies on a dual-path model architecture, where one pathprocesses the input in a holistic manner through a backbone CNN feature extractor and thesecond path captures local (patch-based) information through a backbone Siamese-basedCNN feature extractor. In the local processing path feature representations are extractedfrom each of the patches sampled from the input image and aggregated by a novel poolingmechanism, called channel-wise attention pooling. At the final stage, the global holistic andthe aggregated local features are combined by using a simple concatenation procedure. Themodel is trained end-to-end with a learning objective that combines the Additive AngularMargin (ArcFace) loss with the center loss. This overall training objective helps the modellearn highly discriminative features, which is crucial for contactless palmprint recognition.The overall idea with our design is that the complementary information is learned withinthe two processing paths, where the local path compensates for the image characteristicsthat are not captured well by the global processing path. Since the presence of elasticdeformations of the palmar surface is a major obstacle for palmprint images acquired ina contactless manner, we designed our model under the assumption that a combinationof such global and local information and joint supervision through the combined loss,would lead to more robust and discriminative image representations. As we show in theexperimental section, the addition of local image representations contributes toward better

Sensors 2022, 22, 73 6 of 26
and more robust overall recognition performance. The following sections provide detailedexplanations of all the building blocks of the proposed method.
Avg Pool
Avg Pool
Avg Pool
F
Attention
Pool
Patch
decomposition
Avg P
ool
Joint
SupervisionF
C
Bn
ReLU
Dropou
t
FC
Bn
ArcFace
head
+
2L
Rectified Linear
Unit (ReLU)
Fully connected
(FC)Batch
normalization (Bn)
Dropout
regularizationConcatenation + Addition
(a)
(b)
(c)
(d) (e)
gfg
1
2
i
Figure 3. Overview of the proposed method for contactless palmprint recognition. Our model isdesigned as a Two-path architecture. The first path of the model, marked (a), extracts holistic imageinformation through a backbone CNN feature extractor. The second path, marked (b), represents thelocal processing path where the sampled patches from a fixed grid are processed through a parallelSiamese-based CNN feature extractor with shared model parameters. The next part of the model,marked (c), extracts the most relevant local information from the local image patches with a newchannel-wise attention pooling mechanism. The global and the aggregated local features are thencombined in (d). The final part of the model, marked (e), is only used during training and representsthe joint supervision with the ArcFace and the center losses.
3.2. The Global Processing Path
The global processing part of the model (shown in Figures 3a and 4) is responsible forcapturing global palmprint characteristics, similarly to standard CNNs used for recognitionpurposes in other areas of biometrics [27,32,33]. The processing path consists of a simpleCNN backbone feature extractor ψg that takes a palmprint ROI x ∈ Rw×h×3 as input, wherew and h denote image dimensions, and generates a global image representation fg as theresults. Formally, this can be written as:
fg = ψg(x, θg) ∈ Rd, (1)
where θg denotes the parameters of the global processing path that need to be learnedduring training. While any backbone CNN can be used in our approach, we select thepopular VGG-16 model [27] in this work because of (i) its competitive performance, and(ii) the fact that an open source implementation is publicly available.
To make the global processing path applicable to differently sized input images, wemake sure the backbone CNN is fully convolutional. Thus, the d-dimensional globalfeatures fg ∈ Rd are generated through an average pooling layer in case of the VGG-16backbone, as also illustrated in Figure 4.

Sensors 2022, 22, 73 7 of 26
Input size
150×150
150×150@642l 75×75@128
3l75×75@128
4l 37×37@256
2×2@2048
1×2048
gf
13l
5l
: Feature maps: Feature maps
: Feature maps : Feature maps
Conv layer3×3
Conv layer3×3
Max pool layer
Conv layer3×3
2×2Max pool layer
Conv layer3×3
2×2Max pool layer
Conv layer3×3
2×2
: Feature maps
Avg Pool
Figure 4. Detailed illustration of the global processing path from Figure 3a, along with the featuremaps extracted at different levels of the model. A fully convolutional VGG-16 backbone is used toextract a global palmprint representation fg from the input image.
3.3. The Local Patch-Based Processing Path
In the second processing path of our model (shown in Figure 3b and in detail inFigure 5), the global palmprint image is first decomposed into N smaller patches—sampledfrom a fixed grid with overlap (Figure 5). Here, N is an open hyper-parameter that can beset depending on the data characteristics. This processing path differs from the global pathin that it represents a Siamese CNN with shared model parameters. Thus, the same featureextractor is used for all image patches. This design is able to process all N patches in asingle shot. By focusing only on a small palmprint area at the time, the local processing pathis able to encode important local image characteristics that are not properly representedin the holistic representation extracted by the global processing path. If we denote the setof sampled local patches as {xi}N
i=1, where xi ∈ Rw′×h′×3 and w′ ≤ w and h′ ≤ h, then thelocal image representations can be described as:
fli = ψli (xi, θl) ∈ Rd, (2)
where ψli denotes the i-th component of the Siamese structure, θl are the shared modelparameters, fli = [ fi1, fi2, . . . , fid]
T is the i-th d-dimensional local feature vector andi = 1, . . . , N.
Input size
75×75
Conv layer3×3
Max pool layer
Conv layer3×3
2×2Conv layer
3×3
Max pool layer
Conv layer3×3
2×2Max pool layer
Conv layer3×3
2×2
1lf
ilf
Avg Pool
Avg Pool
75×75@642l : Feature maps 37×37@128
: Feature maps 37×37@128
: Feature maps18×18@256
: Feature maps
3l4l
2×2@2048
: Feature maps13l
5l
1×2048
Weight
sharing
Figure 5. Detailed illustration of the local processing path from Figure 3b, along with the featuremaps learned at different levels of the model. Image patches, sampled from the input image in agrid-like manner, are processed by a parallel backbone Siamese CNN with shared model parametersresulting in N local image features fli
, where i = 1, . . . , N.

Sensors 2022, 22, 73 8 of 26
Similarly as in the global processing path, the local processing path can be imple-mented with arbitrary backbone CNNs in the Siamese structure. However, we again utilizea fully convolutional VGG-16 model in this work to make our approach more coherent asillustrated in Figure 5. Next, we aggregate all local feature vectors into a N× d dimensionalfeature matrix F as shown in Equation (3), where N denotes the number of patches and d isthe feature dimension, i.e.,
F =
f11 f12 · · · f1df21 f22 · · · f2d...
.... . .
...fN1 fN2 · · · fNd
∈ RN×d (3)
The generated feature matrix then serves as the basis for a novel pooling operationthat is described in depth in the next section.
3.4. The Attention Mechanism
In order to obtain the final most relevant d-dimensional feature representation fromthe local feature matrix F, a novel pooling operation called channel-wise attention-poolingis proposed in this paper. This operation is implemented through a dedicated CNN, asshown in Figure 6, and has its own trainable parameters. Suppose the output of the localprocessing path is the N × d feature matrix F, then the output from the attention-poolinglayer can be calculated as follows:
F = F� (w · 1Td ) ∈ RN×d, (4)
wherew = ζ(y) ∈ RN , (5)
and where F denotes the weighted feature matrix, � represent the element-wise orHadamard product, w is a vector of weights, 1d ∈ Rd is a d-dimensional vector of allones, y is the output from the last fully connected (FC) layer with the number of outputunits equal to the number of patches N, and ζ is the softmax activation function. Afterapplying the softmax activation function, the vector of weights w = [w1, w2, . . . , wN ]
T hasthe following property:
N
∑i=1
wi = 1, (6)
and can be considered as a vector of probabilities. The final local feature vector fl isobtained by averaging the weighted feature matrix over the patch dimension (indicated bythe superscript) as shown in Equation (7), i.e.,
fl =1N
N
∑i=1
F(i) ∈ Rd, (7)
The main idea behind the proposed channel-wise attention-pooling mechanism is toencourage the model to focus on the most discriminative parts of the input, while givingless importance to less discriminative parts. The proposed approach also offers a straight-forward way of exploring the importance of each image part (by examining the weights inw) which contributes towards high explainability of our model. In summary the mappingψa performed by the proposed attention mechanism is formally described as:
F = ψa(F, θa), (8)
where θa stands for the set of parameters of the attention block from Figure 6.

Sensors 2022, 22, 73 9 of 26
FC
ReLu
FC
dN
1N
w
dN
dN
1N
F
Avg
dN
FF~
Figure 6. Illustration of the channel-wise attention-pooling mechanism. The local feature matrix Fis reweighted along the patch dimension to give more importance to more informative local imagepatches. Shown is the architecture, implemented in the model we have used.
3.5. Combining Information
In the next step, the global and local features are concatenated to form the combinedfeature representation fc, i.e.,
fc = fg ⊕ fl ∈ R2d, (9)
where ⊕ is the concatenation operator. This representation is then fed to a series ofadditional processing layers with parameters θ f , as shown in Figure 3d. Various formsof regularizations are also included to prevent overfitting and to enhance the stability ofthe model during the training process. One such form of regularization is the dropoutregularization, which prevents the model from learning interdependent sets of featureweights. The use of the batch normalization as a second form of regularization, increases thestability of the model by normalizing the output of the previous layer, i.e., by subtractingthe batch mean and dividing by the batch standard deviation. This layer has its owntrainable parameters that are learned along with the remaining model parameters. Beforecomputing the loss, the final embeddings are normalized to unit L2 norm, which is acommon strategy that proved beneficial in the open literature when training models withangular margin losses [34,35].
3.6. Discriminative Feature Learning Approach for Deep Palmprint Recognition
The training process for the proposed palmprint recognition model is done by using acombined learning objective of the following form:
L = Laam + λLC , (10)
where
Laam = − 1M
M
∑i=1
loges(cos(Θyi+m)
es(cos(Θyi+m) + ∑nj=1,j 6=yi
es cos Θyj, (11)
and
LC =12
M
∑i=1||xi − cyi ||22. (12)
In the above equations, Laam is the Additive Angular Margin (aam) loss, also knownas the ArcFace loss [34], LC is the center loss [36] and λ is a hyper parameter that balancesthe two [36]. In Equation (11), m denotes the angular margin penalty on angle Θi, s is afeature scale parameter, cos Θyj is the logit for each class yj, while the batch size and the

Sensors 2022, 22, 73 10 of 26
class number are denoted as M and n, respectively. For the center loss in Equation (12), xidenotes the i-th feature vector belonging to the yi-th class, and cyi is the yi-th class center.The center update in the center loss function is done over mini-batches as follows:
ct+1j = cj − α · ∆ct
j, (13)
where
∆ctj =
∑Mi=1 δ(yi = j) · (ci = xi)
1 + ∑Mi=1 δ(yi = j)
. (14)
The hyper parameter α controls the learning rates of the centers and helps to avoidlarge perturbations caused by a few mislabelled samples, ∆ct
j (Equation (14)) denotes thedifference between the current center vector and the individual feature vectors, t standsfor the iteration number, and δ(·) is equal to 1 when the inside condition is satisfied and0 otherwise.
The motivation for using the combined loss is two-fold: (i) the ArcFace loss Laamcontributes towards better separation between classes in the embedding space and ensureshigh discriminability of the learned feature representations, whereas (ii) the center loss LCminimizes intra-class variations and encourages features from the same classes to be pulledcloser to their corresponding class centers [36,37]. While the ArcFace loss was originallydesigned to avoid the need for additional (discriminative) learning objectives (such ascenter loss), we show in the experimental section that the combination of the two lossesstill leads to improved performance.
3.7. Model Implementation
We implement our model in the PyTorch framework (available at: https://pytorch.orglatest accessed on 21 December 2021) and use a built-in implementation of the VGG-16model initialized with weights learned on the ImageNet dataset for all of our backbonefeature extractors. We modify the backbone models in order to accept arbitrary sized inputimages by replacing the last max pooling layer in both processing paths with the averagepooling layer with kernel size of 2, which yields 2048-dimensional embeddings. We setthe number of patches in the local processing path to N = 9 with a size of 75× 75 pixels,which in our preliminary experiments was observed to provide a good trade-off betweenperformance improvement of the overall model and its computational complexity. Boththe global (holistic) and the aggregated local features are then concatenated to form a4096 dimensional feature representation. After that, the combined feature vector is fedto a series of layers as summarized in Table 1 and illustrated in Figure 3d. Additionalimplementation details can be found in the publicly available source code: https://github.com/Marjan1111/tpa-cnn latest accessed on 21 December 2021.
Table 1. Description of the used layers with their corresponding output dimensions after theconcatenation procedure. This part of the model is shown in Figure 3d.
Layer Abbreviation Type of Layer Output Dimensions
fc Input 4096FC Fully Connected 4096Bn Batch Normalization 2048
ReLU Activation Function 2048FC Fully Connected 2048Bn Batch Normalization 1024L2 L2 Normalization 1024

Sensors 2022, 22, 73 11 of 26
Throughout all of our experiments we compare the global processing path (Figure 4) asa standalone CNN feature extractor against the two-path CNN feature extractor (Figure 5) inorder to explore how the model benefits from using both global and local image information.
4. Experiments4.1. Experimental Datasets
Two publicly available contactless palmprint datasets are used to evaluate the per-formance of the proposed method in this study, namely the IITD and CASIA palmprintdatasets. Details on the two datasets are given below.
4.1.1. IITD Palmprint Image Dataset
The IIT Delhi (IITD) Touchless Palmprint Dataset [23], collected by the Indian Instituteof Technology Delhi, provides images from the left and right hands of more than 230 volun-teers in the age group between 14–57 years. Images in the database were collected with asimple touchless imaging setup in an indoor environment and with a circular fluorescent il-lumination around the camera lens. A total of 2601 color hand images from 460 palms with7 samples for each hand of each person were acquired in a single session. The IITD databasealso provides automatically segmented (i.e., extracted Regions-Of-Interests—ROIs) andnormalized images with the size of 150× 150 pixels and at least 5 samples for each of thetwo hands. Some typical example images from the IITD dataset from the left and rightpalmprints with their corresponding ROIs are shown in Figure 7a.
(a) (b)
Figure 7. Samples from the left and right palmprints with their corresponding segmented region ofinterests (ROIs) for: (a) the IITD dataset, and for (b) the CASIA dataset.
4.1.2. CASIA Palmprint Image Dataset
The second palmprint database used in our experiments is the CASIA Palmprint ImageDataset [24] (or CASIA-palmprint for short), collected by the Institute of Automation ofthe Chinese Academy of Sciences, which is one of the largest (to date) palmprint databaseavailable in terms of the number of individuals [24]. It contains 5052 palmprint imagescaptured from 312 individuals, both males and females, with at least 8 samples for eachhand of each individual acquired in a single session. The images were acquired by aself-developed palmprint recognition device with a CMOS imaging sensor fixed on topof it. No pegs were used to restrict postures and positions of the palms. The acquiredimages are in an 8-bit grayscale format with dimensions of 640× 480 pixels. During datacapture, the subjects were required to put their palms into the device and lay them on auniform-colored background, to generate evenly distributed illumination. As explainedin [2], there are several things that need to be considered w.r.t. this database. The individual“101” is the same as individual “19”, and therefore these two classes were merged intoone class. The 11th image from the left hand of individual “270” was misplaced to theright hand, and the 3rd from the left hand of individual “76” represents a distorted samplewith very poor quality. These problematic images were excluded from our experiments.

Sensors 2022, 22, 73 12 of 26
As the CASIA database does not provide segmented palmprint images, we used thesegmentation procedure from [6] to extract the palmprint ROIs. The final dataset adoptedfor our evaluation contained 301 individuals and a total of 5467 palmprint ROIs. A fewillustrative sample images from the dataset are presented in Figure 7b.
4.2. Experimental Setup
To evaluate the performance of the proposed model, verification experiments wereconducted over the two experimental datasets. Every two samples in the datasets arematched. If the two images were from one person (class), the matching is consideredgenuine (a mated comparison), otherwise, it was considered an impostor matching (non-mated comparison). Following the all-vs.-all experimental protocol, the number of genuineverification attempts conducted (Ngenuine) and the number of impostor attempts (Nimpostor)can be computed with Equations (15) and (16), as follows:
Ngenuine = Nhands × Nenroll × Nclass, (15)
Nimpostor = Nhands × Nenroll × Nclass × (Nclass − 1), (16)
where Nhands is the number of hands, Nenroll is the number of enrollment palmprint imagesof the the subjects, and Nclass is the number of unique classes in a given dataset. Thecosine similarity function is used to compute client and impostor matching scores S, asseen in Equation (17), where n′ is the length of the feature vector, fp is the feature vectorextracted from the given probe image, and fe is the feature vector extracted from theenrollment image.
S =fp · fe∥∥ fp∥∥‖ fe‖
=∑n′
i=1 fp,i fe,i√∑n′
i=1 f 2p,i ·√
∑n′i=1 f 2
e,i
, (17)
where · denotes the scalar product, || · || is the L2 norm operator, and f·,i is the i-th elementof vector f·.
For the experiments we partition the image datasets into three disjoint subsets, i.e.,(i) a training set, which is used to learn the model parameters, (ii) a validation set, a subsetof the overall training data, used to monitor the training progress and provide an unbiasedestimate of the model fit when tuning hyperparameters, and (iii) a testing set which isutilized to evaluate the final verification performance.
Since the two datasets contain different numbers of samples per class, we perform asimple undersampling process. This process ensures that each class has as many samplesas the class with the minimum number of samples. The number of samples in the datasetsbefore and after the undersampling are shown in Table 2. By using this process, we balancethe datasets with the goal of removing potential biases for the training procedure. On theother hand, the undersampling discards some potentially valuable sources of information.We address this issue through severe data augmentations that further stimulate trainingand prevent overfitting.
Table 2. The amount of data before and after the application of the undersampling procedure on thetwo experimental datasets.
DatasetPalm
Left Right
IITD (min. samples per class) min = 5 min = 5Initial numbers 1300 1301
After undersampling 1150 1150
CASIA (min. samples per class) min = 6 min = 7Initial numbers 2728 2739
After undersampling 1806 2107

Sensors 2022, 22, 73 13 of 26
4.3. Performance Metrics
Following standard methodology [32,38,39], the following error rates commonly usedfor verification experiments are adopted to evaluate the performance of the tested models:
• Area Under the Curve (AUC): AUC represents a performance metric that measuresthe overall performance of a learned binary model and is typically computed from astandard Receiver Operating Characteristic (ROC) curve. This metric is widely usedto assess performance of biometric systems operating in verification mode. A poormodel fit results in AUC≈ 0.5 which indicates randomness, on the other hand, a goodmodel fit results in AUC ≈ 1.
• Verification Rate at the False Accept Rate of 0.1% ([email protected]): This performancemeasure corresponds to an operating point on the ROC curve and is computedas follows:
[email protected] = 1− FRR(θver01), where (18)
θver01 = arg minθ|FAR(θ)− 0.001|, (19)
where θver01 is the relevant decision threshold, FAR denotes the False Accept Rate,and FRR is the False Reject Rate. FAR corresponds to the percentage/fraction of timesan invalid (impostor) user is accepted by the system and is calculated as follows:
FAR(θk) ={|dimp|dimp ≤ θk|}
{|dimp|}. (20)
Similarly, FRR represents the percentage/fraction of times a valid (genuine) user isrejected by the system and is calculated as follows:
FRR(θk) ={|dgen|dgen ≥ θk|}
{|dgen|}. (21)
In Equations (20) and (21), {dimp} and {dgen} represent sets of impostor and gen-uine scores generated during the experiments, respectively, | · | denotes a cardinalitymeasure, and θk represents the decision threshold.
• Verification Rate at the False Accept Rate of 1% (VER@1FAR): This measure corre-sponds to another operating point on the ROC curve defined as follows:
VER@1FAR = 1− FRR(θver1), where (22)
θver1 = arg minθ|FAR(θ)− 0.01|, (23)
where θver1 denotes the relevant decision threshold.• Equal Error Rate (EER): The last performance measure, EER, is defined with a decision
threshold θeer that ensures equal values of FAR and FRR as follows:
EER =12(FAR(θeer) + FRR(θeer)), with (24)
θeer = arg minθ|FAR(θ)− FRR(θ)|. (25)
Additionally, we also use Receiver Operating Characteristic (ROC) curves to visualizethe performance of the models throughout all experiments. Note that all performancescores defined above are provided in % when reporting results.

Sensors 2022, 22, 73 14 of 26
4.4. Training Details
We train our model(s) with the combined objective function from Equation (10). Dur-ing the training process, some hyperparameters remain fixed, while others are furtheranalyzed in a broader range to study their impact. The parameters that we vary in ourexperiments are the hyper-parameters of the combined objective function, i.e., the λ pa-rameter, which balances the impact of the ArcFace and the center losses, and the parameterα that controls the learning rate of the centers in the center loss function. The optimiza-tion of the base model parameters is done with the Adam optimizer with a learning rateof 1× 10⁻⁴. The channel-wise attention-pooling operation, which has its own trainableparameters, is trained with a learning rate of 1× 10⁻².
To prevent overfitting we use severe data augmentations and modify data on the fly,so that our CNN models is transformation invariant to the maximum possible extent. Theaugmentations are done with the Imgaug (available at: https://github.com/aleju/imgaug,accessed on 12 December 2021) library and the following image transformations:
• Histogram equalization,• Rotations in the range ±10◦,• Random cropping (with a 50% chance), where between 5% and 30% of the original
image is cropped away,• Multiplication of all image pixels with a random value v sampled once per image in
the range (0.9, 1.2),• Application of one of the following:
(1) Random corruption of p percent of all pixels within an image area by salt-and-pepper noise, where p ∈ (1, 10)%. The size of the image area is between 2% and20% of the size of the input image,
(2) Random replacement of a certain fraction of pixels from the image with zero,with a percentage value p ∈ (1, 10)%, with 20% per-channel probability,
(3) Random replacement of rectangular masks from the image with zeros, with apercentage value p ∈ (1, 10)%. The size of the masks is between 2% and 20% ofthe size of the input image,
• Application of one of the following:
(1) Blurring with a Gaussian kernel with a sigma value between (0, 3.0),(2) Blurring using averaging over neighborhoods that have random sizes, which can
vary between 5 and 11 in height and 1 and 3 in width,(3) Application of motion blur with a kernel size of 15× 15 pixels.
Through these data augmentations we ensure that our model sees new variations ofthe data at each and every epoch of the training procedure, and (almost) never sees theexact same image multiple times, which is always beneficial when fine-tuning modelstrained initially on large scale datasets like ImageNet to downstream tasks. By carefullychoosing the image augmentations, we can additionally boost the predictive performanceof the learned model, which further enhances its generalization capability. Another reasonto use data augmentation is because we want to lower the gap between the training andvalidation performance during the training process. All augmentations are performed inrandom order and with 50% probability, which means there is a (small) chance for notperforming augmentations at all.
For illustrative purposes, several image augmentations with the patch decompositionprocedure from a single augmented image are shown in Figure 8a for IITD, and in Figure 8bfor the CASIA dataset. It is important to note that the second input in the proposed Two-Path CNN model (Figure 5), takes the same augmented image as input, but decomposesit into N smaller patches sampled in a grid-like fashion with overlap. By doing this, weensure that the global and the local processing path are looking at the same input dataduring training.

Sensors 2022, 22, 73 15 of 26
(a) (b)
Figure 8. Illustration of different data augmentations as well as the patch decomposition procedurefor sample images from (a) the IITD dataset and (b) the CASIA dataset.
5. Quantitative Results
The main goal of this section is to rigorously evaluate the proposed Two-Path CNNpalmprint recognition model and to compare its performance with competing state-of-the-art methods from the literature. Throughout the experiments, we evaluate all models ondifferent subsets of images by randomly splitting the test data into five equal folds andadopting the all-vs-all experimental protocol in each of the folds. We use this approachto be able to also estimate confidence scores on all reported results in addition to theoverall performance.
For the competing methods we report results for several traditional feature extractionmethods, using the code provided in [37,40]. Furthermore, we also compare our resultsagainst four state-of-the-art methods from the literature, i.e., three DL-based from [4,31,41],and one traditional (non DL-based) solution [11], previously reported to achieve state-of-the-art performance on standard benchmarks.
5.1. Comparison with Competing Methods
For the comparison with traditional feature extraction approaches we consider sevendense-descriptor based methods, i.e., Local Binary Patterns (LBPs) [42], Rotation Invari-ant and Local Phase Quantization (RILPQ [43] and LPQ [44]) features, Histograms ofOriented Gradients (HOG) [8,45], Binarized Statistical Image Features (BSIF) [46], Pat-terns of Oriented Edge Magnitudes (POEM) [47] and features extracted with the help of abank of the Gabor filters [48]. These feature extraction techniques are used (with defaultparameters from [40]) to infer compact representations from the palmprint images formatching. To facilitate a fair comparison, the cosine similarity is again used to produce thecomparison scores.
The results of the comparison are presented in the form of ROC curves in Figure 9and in the form of performance scores in Table 3. We can see that the proposed Two-pathCNN approach clearly outperforms all traditional feature extraction methods at everyevaluated operating point, with BSIF, RILPQ and POEM being the closest competitors.We also observe that the Global-CNN, when used as a standalone feature extractor, isable to outperform the traditional methods in almost all cases except for BSIF, RILPQ andPOEM, when evaluated on the right palmprints from the CASIA dataset. Additionally, wenotice that the local image properties captured by recognition techniques based on HOG,LBP and Gabor features, are not sufficient to extract useful information from contactlesspalmprint images where the presence of elastic deformations is known to be problematic.We can conclude that even though the Global-CNN model processes the input imagein a holistic manner, the very nature of the CNN models helps to extract discriminativelocal information due to the local connectivity of the convolutional kernels. However, theaddition of the local image properties through the local processing path in the proposedTwo-path model boosts the verification performance while making the deeply learned

Sensors 2022, 22, 73 16 of 26
features more discriminative and more resilient to the presence of elastic deformations andother artefacts caused by the contactless acquisition procedure.
10−5 10−4 10−3 10−2 10−1 100
FAR
0.3
0.4
0.5
0.6
0.7
0.8
0.9
1.0
1-F
RR
HOG
LBP
LPQ
RILPQ
GABOR
BSIF
POEM
Global CNN
Two-path CNN
(a)
10−5 10−4 10−3 10−2 10−1 100
FAR
0.3
0.4
0.5
0.6
0.7
0.8
0.9
1.0
1-F
RR
HOG
LBP
LPQ
RILPQ
GABOR
BSIF
POEM
Global CNN
Two-path CNN
(b)
10−5 10−4 10−3 10−2 10−1 100
FAR
0.3
0.4
0.5
0.6
0.7
0.8
0.9
1.0
1-F
RR
HOG
LBP
LPQ
RILPQ
GABOR
BSIF
POEM
Global CNN
Two-path CNN
(c)
10−5 10−4 10−3 10−2 10−1 100
FAR
0.3
0.4
0.5
0.6
0.7
0.8
0.9
1.0
1-F
RR
HOG
LBP
LPQ
RILPQ
GABOR
BSIF
POEM
Global CNN
Two-path CNN
(d)
Figure 9. Comparison between the traditional feature extraction methods and the proposed two-pathmodel evaluated on the (a) left and (b) right palmprints from the IITS dataaset, as well as the (c) leftand (d) right palmprints of the CASIA dataset. The figure shows average ROC curves together withconfidence intervals (in the form µ± σ) on a semilog scale.
Table 3. Comparison against traditional recognition approaches relying on hand-crafted features.Results are reported for left and right palms separately for both datasets. The results are presented inthe form of a µ± σ (and in (%)) computed over five test subsets. The best performance is highlightedin bold.
Method HOG [45] LBP [42] LPQ [44] RILPQ [43] Gabor [48] BSIF [46] POEM [47] Global (Ours) Two-Path (Ours)
Evaluated on the Left Palmprints from IITD Dataset
EER 7.216± 1.519 6.380± 0.577 1.383± 0.578 1.824± 0.508 7.123± 0.744 1.121± 0.431 1.737± 1.014 1.849± 0.641 0.757± 0.212AUC 97.394± 0.690 98.072± 0.437 99.812± 0.133 99.660± 0.289 97.495± 0.694 99.768± 0.142 99.359± 0.442 99.770± 0.127 99.935± 0.065
[email protected] 81.739± 3.049 71.652± 1.272 96.173± 1.006 97.130± 0.650 73.739± 2.730 98.0± 0.976 96.434± 1.516 94.782± 1.099 98.086± 0.347VER@1FAR 88.086± 2.104 81.391± 0.968 98.521± 0.706 98.0± 0.650 85.304± 1.659 98.869± 0.650 97.913± 1.358 97.478± 1.179 99.478± 0.507
Evaluated on the Right Palmprints from IITD Dataset
EER 6.327± 1.041 7.209± 0.488 1.309± 0.266 1.101± 0.428 6.184± 0.866 1.191± 0.453 1.652± 0.426 0.900± 0.421 0.602± 0.234AUC 97.796± 0.691 97.607± 0.496 99.868± 0.090 99.855± 0.123 98.050± 0.335 99.780± 0.121 99.701± 0.191 99.939± 0.056 99.912± 0.102
[email protected] 82.434± 0.706 69.304± 1.307 96.434± 0.886 97.565± 0.706 75.217± 1.760 97.565± 0.706 96.695± 0.806 97.391± 1.626 98.521± 0.589VER@1FAR 88.608± 0.325 77.043± 2.599 98.608± 0.325 99.043± 0.748 87.217± 2.994 98.521± 0.758 98.260± 0.476 99.043± 0.576 99.478± 0.425
Evaluated on the Left Palmprints from CASIA Dataset
EER 5.025± 1.005 5.150± 0.663 0.904± 0.336 0.705± 0.216 7.530± 0.475 0.465± 0.230 0.679± 0.117 0.385± 0.273 0.374± 0.164AUC 98.557± 0.546 98.992± 0.174 99.896± 0.095 99.947± 0.060 96.704± 0.418 99.969± 0.039 99.939± 0.046 99.987± 0.011 99.986± 0.015
[email protected] 86.489± 0.657 64.229± 0.781 92.411± 2.863 98.671± 0.563 61.960± 0.756 99.003± 0.646 98.172± 0.622 99.113± 0.847 99.113± 0.687VER@1FAR 91.861± 1.625 82.889± 2.163 98.836± 0.847 99.501± 0.322 80.011± 2.228 99.723± 0.303 99.501± 0.207 99.722± 0.303 99.778± 0.207
Evaluated on the Right Palmprints from CASIA Dataset
EER 6.691± 0.691 5.577± 0.618 1.533± 0.421 0.949± 0.336 7.677± 0.334 0.981± 0.487 0.997± 0.275 1.208± 0.306 0.553± 0.315AUC 97.756± 0.234 98.725± 0.256 99.659± 0.030 99.885± 0.064 97.065± 0.471 99.770± 0.225 99.695± 0.167 99.801± 0.089 99.917± 0.070
[email protected] 82.631± 1.561 61.652± 1.595 90.792± 4.662 97.436± 0.317 62.938± 5.086 97.864± 1.093 97.959± 0.465 96.583± 0.906 98.625± 0.863VER@1FAR 88.041± 1.516 80.305± 1.449 98.101± 0.721 98.907± 0.512 79.879± 3.645 99.051± 0.541 99.003± 0.274 98.718± 0.439 99.525± 0.299
5.2. Comparison with State-of-the-Art Methods
Next, we compare the proposed method against three state-of-the-art DL-based palm-print recognition techniques and one non DL-based method. To ensure a fair comparison,we either use the evaluation protocol used by the authors of the baseline techniques orutilize the code provided by the authors of the baseline methods (where available), anduse our evaluation protocol for the comparison.
The first state-of-the-art method is a highly optimized DL architecture, referred to asResidual Feature Network (RFN) [4]. RFN is based on a fully convolutional network thatgenerates deeply learned residual features trained with the Soft-Shifted Triplet Loss (SSTL).The key advantage of this method is that it offers superior generalization capabilitiesacross different datasets. FRN-SSTL does not have fully connected layers which results

Sensors 2022, 22, 73 17 of 26
in pure feature map outputs and is beneficial for preserving spatial correspondencesamong the most discriminative palmprint areas. The second method is referred to asDifference of Vertex Normal Vectors (DoN) and represents a non-DL based method [11].The key advantage of DoN lies in the ability to extract 3D information from 2D palmprintimages, which is beneficial when dealing with contactless palmprint images, where thepresence of different variations in illuminations is common. The next method selectedfor the comparison represents a DL approach initially presented in [31] and uses theGoogLeNet DL architecture as a backbone feature extractor. We denote this method asAML_N-Pair in this paper. To obtain discriminative and equidistributed embeddings, theauthors propose a novel optimization objective which consists of a pair of adversarial lossfunctions, specifically, a distance metric term and a confusion term. By using the jointsupervision of those two terms, this method was reported to achieve strong generalizationin cross-dataset contactless palmprint recognition experiments. We also compare the resultsagainst the Weight-based Meta Metric Learning (W2ML) approach proposed in [41]. Thismethod uses metric learning in a meta way to extract discriminative palmprint featuresusing an end-to-end DL network, which was shown to be robust and efficient for diversepalmprint recognition scenarios.
It is important to note that the experimental results are done only on the IITD datasetsince some authors did not provide results for the CASIA dataset. Table 4 summarizes theexperimental results for IITD in terms of EER values. The proposed Two-path model clearlyoutperforms the DoN, AML_N-Pair and W2ML approaches and ensures an EER reductionof around 50% compared to any of these methods. Additionally, it performs comparably tothe recent RFN-SSTL method, where a very similar EER score is achieved by the proposedapproach. The difference in the point estimates of the EER scores of RFN-SSTL and ourapproach is statistically not significant. The reported results point to the discriminativepower of feature representations generated by the proposed Two-path model and theirsuitability of contactless palmprint recognition. Furthermore, we note that we are able tofurther improve on the results reported here by explicitly modeling elastic deformationsusing a Thin Plate Spline (TPS) transformation. We provide detailed information on thisprocess (not yet used for generating results in this section) in Section 5.4.
Table 4. Comparison against state-of-the-art methods from the literature. The comparison is done onthe IITD dataset in terms of EER values. All results are presented in (%).
Setting Method EER (in %)
Protocol from [4,11,41]
DoN [11] 1.391RFN-SSTL [4] 0.600
W2ML [41] 2.330Two-Path CNN (ours) 0.701
Code from [31] AML_N-Pair [31] 1.690Two-Path CNN (ours) 0.910
5.3. Sensitivity Analysis and Ablations
In this section for the ablation study we conduct a wide range of experiments byexamining different parts of our method.
To explore the impact of various model components on performance we conduct asensitivity analysis. Specifically, we investigate the sensitiveness of models to changes ofthe parameters in the combined training objective, i.e., the λ parameter (Equation (10)),which balance the contribution of the two learning objectives, and the α parameter thatcontrols the learning rate of the centers (Equation (13)) in the center loss function. Notethat the experiments also include cases where λ = 0 and, hence, one of the loss termsis ablated. Additionally, we also provide a detailed look into the performance of theglobal and local processing paths and their contributions to the overall performance of thecomplete Two-path model.
Sensors 2022, 22, 73 18 of 26
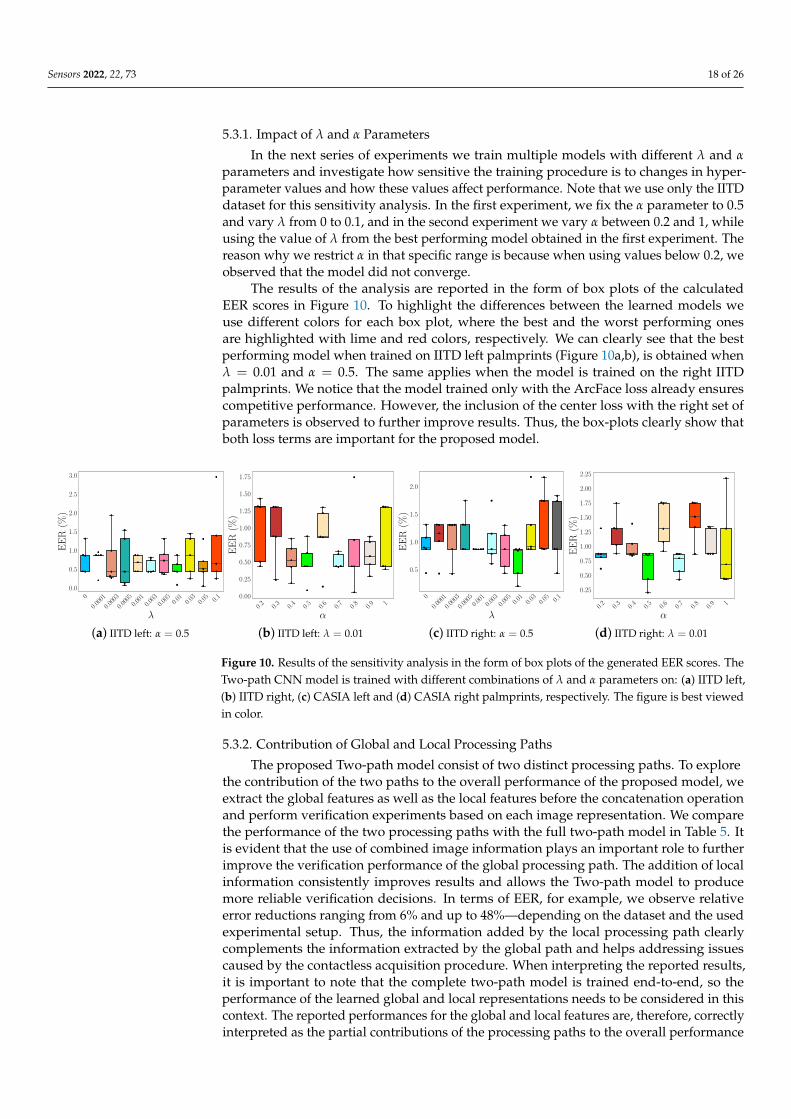
5.3.1. Impact of λ and α Parameters
In the next series of experiments we train multiple models with different λ and αparameters and investigate how sensitive the training procedure is to changes in hyper-parameter values and how these values affect performance. Note that we use only the IITDdataset for this sensitivity analysis. In the first experiment, we fix the α parameter to 0.5and vary λ from 0 to 0.1, and in the second experiment we vary α between 0.2 and 1, whileusing the value of λ from the best performing model obtained in the first experiment. Thereason why we restrict α in that specific range is because when using values below 0.2, weobserved that the model did not converge.
The results of the analysis are reported in the form of box plots of the calculatedEER scores in Figure 10. To highlight the differences between the learned models weuse different colors for each box plot, where the best and the worst performing onesare highlighted with lime and red colors, respectively. We can clearly see that the bestperforming model when trained on IITD left palmprints (Figure 10a,b), is obtained whenλ = 0.01 and α = 0.5. The same applies when the model is trained on the right IITDpalmprints. We notice that the model trained only with the ArcFace loss already ensurescompetitive performance. However, the inclusion of the center loss with the right set ofparameters is observed to further improve results. Thus, the box-plots clearly show thatboth loss terms are important for the proposed model.
0
0.00
01
0.00
03
0.00
050.
001
0.00
30.
005
0.01
0.03
0.05 0.
1
λ
0.0
0.5
1.0
1.5
2.0
2.5
3.0
EE
R(%
)
(a) IITD left: α = 0.5
0.2
0.3
0.4
0.5
0.6
0.7
0.8
0.9 1
α
0.00
0.25
0.50
0.75
1.00
1.25
1.50
1.75
EE
R(%
)
(b) IITD left: λ = 0.01
0
0.00
01
0.00
03
0.00
050.
001
0.00
30.
005
0.01
0.03
0.05 0.
1
λ
0.5
1.0
1.5
2.0
EE
R(%
)
(c) IITD right: α = 0.5
0.2
0.3
0.4
0.5
0.6
0.7
0.8
0.9 1
α
0.25
0.50
0.75
1.00
1.25
1.50
1.75
2.00
2.25
EE
R(%
)
(d) IITD right: λ = 0.01
Figure 10. Results of the sensitivity analysis in the form of box plots of the generated EER scores. TheTwo-path CNN model is trained with different combinations of λ and α parameters on: (a) IITD left,(b) IITD right, (c) CASIA left and (d) CASIA right palmprints, respectively. The figure is best viewedin color.
5.3.2. Contribution of Global and Local Processing Paths
The proposed Two-path model consist of two distinct processing paths. To explorethe contribution of the two paths to the overall performance of the proposed model, weextract the global features as well as the local features before the concatenation operationand perform verification experiments based on each image representation. We comparethe performance of the two processing paths with the full two-path model in Table 5. Itis evident that the use of combined image information plays an important role to furtherimprove the verification performance of the global processing path. The addition of localinformation consistently improves results and allows the Two-path model to producemore reliable verification decisions. In terms of EER, for example, we observe relativeerror reductions ranging from 6% and up to 48%—depending on the dataset and the usedexperimental setup. Thus, the information added by the local processing path clearlycomplements the information extracted by the global path and helps addressing issuescaused by the contactless acquisition procedure. When interpreting the reported results,it is important to note that the complete two-path model is trained end-to-end, so theperformance of the learned global and local representations needs to be considered in thiscontext. The reported performances for the global and local features are, therefore, correctlyinterpreted as the partial contributions of the processing paths to the overall performance

Sensors 2022, 22, 73 19 of 26
of the model and not in terms of capacities of the individual representations for recognition.The performances here would be quite different if the representations would be trainedone without the other.
Table 5. Summary of averaged performance metrics when using different types of learned imagedescriptors. The results are presented in the form of a µ± σ and in (%).
Type of Descriptor Global Local Two-Path (Combined)
Evaluated on the Left Palmprints from IITD Dataset
EER 1.1270± 0.212 10.677± 0.573 1.061± 0.416AUC 99.854± 0.083 95.570± 0.377 99.879± 0.063
[email protected] 96.956± 1.133 75.130± 1.439 96.956± 1.133VER@1FAR 98.035± 0.325 80.173± 1.185 98.869± 0.851
Evaluated on the Right Palmprints from IITD Dataset
EER 0.894± 0.236 15.370± 2.012 0.462± 0.050AUC 99.887± 0.099 92.181± 1.527 99.969± 0.137
VER@01FAR 97.826± 0.991 69.043± 0.902 98.521± 0.589VER@1FAR 99.130± 0.274 72.086± 0.411 99.652± 0.173
Evaluated on the Left Palmprints from CASIA Dataset
EER 0.413± 0.296 18.310± 0.690 0.331± 0.111AUC 99.959± 0.040 91.465± 0.334 99.982± 0.006
[email protected] 99.114± 0.687 62.568± 0.776 99.335± 0.414VER@1FAR 99.723± 0.349 65.115± 0.555 99.778± 0.207
Evaluated on the Right Palmprints from CASIA Dataset
EER 0.930± 0.399 12.483± 1.466 0.643± 0.214AUC 99.861± 0.112 94.527± 0.976 99.900± 0.064
[email protected] 98.434± 0.510 63.549± 1.489 98.481± 0.282VER@1FAR 99.193± 0.440 72.471± 1.422 99.431± 0.320
5.4. Explicit Modeling of Elastic Deformations
In this series of experiments we try to explicitly address the problem of elastic defor-mations which represent one of the major problems with contactless palmprint recogni-tion techniques.
A common way to tackle this problem is to achieve invariance to warping throughsome kind of spatial transformation on the input images. Based on this insight, we use aSpatial Transformer Network (STN) [49,50] to learn a warping procedure based on ThinPlate Splines (TPS). TPS is selected as the basis for warping because it ensures a higherdegree of freedom when modeling deformations compared to other affine transformations.The TPS algorithm has been applied successfully in several computer vision applications,especially in medical image registration [51], as well as a minutiae matching algorithmsthat model the elastic deformations in fingerprint images [52]. For detailed explanationabout the STN and TPS, the reader is referred to [49,50,53], respectively. However, to thebest of our knowledge, it has not yet been applied as a warping technique for modellingelastic deformations in palmprint images acquired in a contactless manner. It is importantto note that we did not integrate the STN directly into our Two-path model. Instead weused it as an external source to generate TPS warped images. This means that in eachiteration we generate an additional batch of warped images which are then combined withthe current batch of images when training the model. With this procedure, we are forcingour augmentations to be TPS warped with 50% chance.
The results before and after the TPS-STN warping applied on sample images from theIITD and CASIA datasets are shown in Figure 11. We can clearly see that the images afterthe warping procedure are somewhat deformed. This effect can be mostly seen around theprincipal lines of the palmprint, which is also the region where elastic deformations aremost prominent. The ROC curves generated with and without data augmentation based

Sensors 2022, 22, 73 20 of 26
on TPS warping are shown in Figure 12, and the respective box-plots of the correspondingEER scores are presented in Figure 13. As can be seen from the results, the TPS warpinghas a significant impact on the verification performance, which results in lower EER valuesand narrower confidence intervals.
Before TPS warping
After TPS warping
(a)
Before TPS warping
After TPS warping
(b)
Figure 11. Visual effect of the TPS-based modeling of elastic deformations. Examples are shownbefore and after the TPS warping on sample images from: (a) the IITD dataset and (b) the CASIAdataset. The biggest differences after TPS warping are seen in the principle lines. The regions wherethe principle lines are affected the most by the warping process are marked with rectangles.
10−5 10−4 10−3 10−2 10−1 100
FAR
0.80
0.85
0.90
0.95
1.00
1-F
RR
Without warping
With warping
(a)
10−5 10−4 10−3 10−2 10−1 100
FAR
0.60
0.65
0.70
0.75
0.80
0.85
0.90
0.95
1.00
1-F
RR
Without warping
With warping
(b)
10−5 10−4 10−3 10−2 10−1 100
FAR
0.80
0.85
0.90
0.95
1.00
1-F
RR
Without warping
With warping
(c)
10−5 10−4 10−3 10−2 10−1 100
FAR
0.80
0.85
0.90
0.95
1.00
1-F
RR
Without warping
With warping
(d)
Figure 12. Impact of using TPS warping as an augmentation technique on the verification per-formance. The results are shown in the form of mean ROC curves with confidence intervalswhen the models are trained on: (a) IITD left, (b) IITD right, (c) CASIA left and (d) CASIA rightpalmprints, respectively.
IITD left IITD right CASIA left CASIA right0.0
0.5
1.0
1.5
EE
R(%
)
Without warping With warping
Figure 13. Equal error rate (EER) box plot visualization showing the effect before and after includ-ing the TPS warping as image transformation in the existing augmentations when the Two-patharchitecture is trained on either left or right palmprints from IITD and CASIA datasets.
6. Qualitative Results
In this section we present different qualitative results related to the Two-path architec-ture. We mainly focus on the following analyses:

Sensors 2022, 22, 73 21 of 26
• Exploring the discriminative power of the deeply learned embeddings through the T-distributed Stochastic Neighbor Embedding (t-SNE) [54] data visualization technique,
• Investigating the feature importance and attention mechanism of the Two-path architecture,
• Qualitative evaluations of edge cases generated in the verification experiments.
6.1. Embedding Visualization with t-SNE
We use t-Distributed Stochastic Neighbor Embedding (t-SNE) [54] to visualize thehigh dimensional embeddings generated by the proposed model from IITD and CASIAimages. t-SNE represents a nonlinear dimensionality reduction technique developed by theauthors in [54], which is suitable for embedding high-dimensional data for visualizationinto a low-dimensional space of two or three dimensions. For a detailed explanation aboutthe t-SNE technique, the reader is referred to [54].
In our case, we use t-SNE to generate 2-D visualizations in order to see the clusteringeffect produced from the joint supervision between ArcFace loss and the center loss. InFigure 14 the learned 2-D embeddings for IITD and CASIA datasets are shown. From the2-D representation, we can clearly see the effect of the center loss which efficiently pullsthe features to their corresponding centers, thus, minimizing the intra-class variations. Onthe other hand, the ArcFace loss helps the embeddings from different classes to spreaduniformly on the hyperspace by maximizing the inter-class variations. We also noticethat the embeddings from the CASIA dataset are less uniformly spread compared to theembeddings from IITD dataset. This effect can be seen from Figure 14c, where we cansee regions of less discriminative embeddings. As seen from Figure 14d, there are alsoregions where the discriminative power between the embeddings is preserved, howeverthese regions suffer from high locality, i.e., there are features located in several small areasof the embedding space isolated from the rest of the embeddings. Such cases where thecombined objective did not produce sufficiently discriminative features can possibly leadto miss-classifications of palmprint images.
(a) (b) (c) (d)
Figure 14. 2-D t-SNE visualization of the learned palmprint embeddings for sample images from the(a) IITD left, (b) IITD right, (c) CASIA left, and (d) CASIA right palmprints. Note that the combinationof the learning objectives results in well separated and compact class clusters. The figure is bestviewed electronically and zoomed-in.
6.2. Feature Importance and the Attention Mechanism
Next, we report qualitative results with respect to the attention mechanism integratedwithin the proposed Two-path architecture. As discussed earlier (in Section 3.4), the socalled channel-wise attention pooling mechanism is a trainable attention operation whichoffers a straight-forward way of exploring the importance of each image part throughthe learned feature vector of weights. This feature vector is then converted to a vector ofprobabilities by using the softmax activation function. To generate interpretable results,we transform the learned vector of probabilities into heatmaps and then superimpose

Sensors 2022, 22, 73 22 of 26
the computed heatmaps over the palmprint images. In Figure 15a,b some qualitativeevaluations for the IITD and CASIA datasets are shown, respectively. We can see howthe attention mechanism selects certain image regions that are not only locally importantbut are also beneficial for the overall image representation. Note how this procedure isadaptive in nature and selects a different area in each palmprint depending on imagecharacteristics. Additionally, the selected areas are also quite localized due to the use of thesoftmax function in the attention mechanism.
0.0
0.1
0.2
0.3
0.4
0.5
0.6
0.7
0.8
0.9
1.0
Fea
ture
Imp
orta
nce
(a)
0.0
0.1
0.2
0.3
0.4
0.5
0.6
0.7
0.8
0.9
1.0
Fea
ture
Imp
orta
nce
(b)
Figure 15. Exploring the feature importance learned from the attention mechanism for the: (a) IITDdataset and (b) CASIA dataset.
6.3. Verification Experiment
Finally, we present qualitative results related to the verification experiments conductedon the IITS and CASIA dataset. Specifically, we are interested in separability of the scoredistributions for the mated and non-mated experiments as well as failure cases generatedby our Two-path model.
In Figure 16 the mated and non-mated score distributions expressed as probability den-sity functions (PDFs) [1] when evaluating on different palmprints from the datasets are shown.It can be observed that the Two-path architecture achieved good separation between thegenuine and impostors score distributions, where the combined learning objective efficientlyminimized the intra-class variations, while maximizing the inter-class variations, which vali-dates our previous analyses. It is also clear that the impostor score distributions are centeredat zero, which points to the fact that inter-class embeddings are well distributed in the hyperfeature space [55]. Here we can also see the presence of the “double-peak” phenomenon [55]—in our case in the mated (genuine) score distributions [55]. This implies that some features ofsame classes exhibit weaker similarities and are therefore harder to recognize.
−0.25 0.00 0.25 0.50 0.75 1.00Matching scores
0.0
0.2
0.4
0.6
0.8
1.0
PD
F
Impostors Genuines
(a)
−0.25 0.00 0.25 0.50 0.75 1.00Matching scores
0.0
0.2
0.4
0.6
0.8
1.0
PD
F
Impostors Genuines
(b)
−0.25 0.00 0.25 0.50 0.75 1.00Matching scores
0.0
0.2
0.4
0.6
0.8
1.0
PD
F
Impostors Genuines
(c)
−0.25 0.00 0.25 0.50 0.75 1.00Matching scores
0.0
0.2
0.4
0.6
0.8
1.0
PD
F
Impostors Genuines
(d)
Figure 16. Genuine-impostor score distributions expressed as probability density functions (PDFs)when evaluating on different palmprints: (a) IITD left palmprints, (b) IITD right palmprints,(c) CASIA left palmprints and (d) CASIA right palmprints.

Sensors 2022, 22, 73 23 of 26
Next, we preform an verification experiment based on the decision threshold θeer,which ensures equal values of the FAR and FRR. Since there is a slight overlap between thescore distributions, we can expect that some of the genuine verification attempts will befalsely rejected, i.e., false negatives (FN), and vice versa, some of the impostor verificationattempts will be falsely accepted i.e., false positives (FP). For illustration purposes, weperform the experiment on the palmprint images from both datasets. We present the resultsin Table 6 by visualizing some of the compared image pairs and their respective cosinesimilarity scores.
Table 6. Verification results based on the decision threshold θeer which ensures equal values of FARand FRR. Image pairs are presented that generated different outcomes in the verification process, i.e.,TP-true positives, FN-false negatives, FP-false positives, and TN-true negatives.
TP FN FP TN TP FN FP TN
IITD right palmprints, θeer = 0.276 CASIA right palmprints, θeer = 0.295
0.5744
1.0000
0.8539
0.6288
-0.0234
0.1057
-0.0069
0.0922
0.3022
0.3242
0.2952
0.3201
0.0271
0.1286
-0.0888
0.2337
0.6970
0.9020
0.8322
0.8949
0.2824
0.2226
-0.0007
0.1386
0.3473
0.4337
0.3588
0.5471
0.0352
0.2482
0.0067
0.0134
IITD left palmprints, θeer = 0.259 CASIA left palmprints, θeer = 0.307
0.4164
1.0000
0.5759
0.6227
0.1902
0.0932
0.1702
0.0428
0.2694
0.2839
0.3056
0.2691
0.1423
-0.0007
0.1150
0.0197
0.8102
0.9316
0.9030
0.5735
0.2677
0.2714
0.1963
0.2533
0.3102
0.3409
0.3117
0.3535
0.1868
0.1862
-0.0883
-0.1604
As can be seen from Table 6, the matching scores between the correctly acceptedmated/genuine attempts, i.e., true positives (TP), are positive and above the decisionthreshold, whereas the matching scores between the correctly rejected impostor attempts,i.e., true negatives (TN), are negative, which indicates opposite feature vectors. The resultsin the overlapping region between the genuine and impostor distribution are also quiteinteresting. As seen from the falsely rejected genuine attempts or FNs, palmprints from thesame subjects share less similarities due to the high appearance variability caused by thepalmprint acquisition process. For example, in CASIA right palmprint images there is anextreme case where one palmprint image between the genuine matches is completely whitedue to high illuminations that happened during the palmprint acquisition process. This

Sensors 2022, 22, 73 24 of 26
means that the Two-path architecture is not able to find any shared patterns between suchimages, which results in lower matching score. On the other hand, there are cases wherethe exact opposite happens. Different palmprints from different individuals share moresimilarities, which results in relatively high scores and above the threshold similarity scores.
7. Conclusions
In this study we introduced a hybrid Two-path DL based model for contactlesspalmprint recognition. Unlike competing hand-crafted feature extraction techniques,our architecture automatically learns discriminative features from the data while notrequiring extensive parameters tuning. Compared to other DL techniques, our model isdesigned as dual path CNN, where one input encodes the input image holistically usinga backbone CNN-based feature extractor, whereas the second path, a parallel Siamesearchitecture with shared model parameters, captures local information from image patchessampled from the input image. Moreover, we showed that the discriminative power ofthe deeply learned features can be highly enhanced by combining the ArcFace loss withthe center loss to jointly supervise the learning of our model. By using this design wewere able to achieve great genuine-impostor score distribution separation which is key inbiometric recognition systems and paramount for achieving state-of-the-art performanceon standard benchmarks.
We also performed extensive experiments related to different parts of the architectureand showed how the addition of local information contributes to enhanced robustness toelastic deformations, as well as, increased generalization capability across different datasets.Furthermore, we showed that our design choices ensure a level of explainability facilitatedby the proposed channel-wise attention pooling mechanism. Given the promising results,further extension of this work will focus on palmprint recognition in the wild and explorehow the model generalizes when images are acquired under complex backgrounds, indifferent environments and with various postures and illuminations. Furthermore, differentfeature pooling strategies and attention mechanisms that could maximize the informationcontent that can be extracted from the local image patches, especially when consideringdetailed image aligned will also be investigated. Particular attention will be payed to theimpact of alignment on the patch generation strategy used.
Author Contributions: Conceptualization, M.S., M.I. and V.Š.; methodology, M.S. and V.Š.; software,M.S.; validation, V.Š. and M.I.; formal analysis, M.S. and M.I.; investigation, M.S., M.I. and V.Š.;resources, M.S.; data curation, M.S. and M.I.; writing—original draft preparation, M.S.; writing—review and editing, M.S., M.I. and V.Š.; visualization, M.S.; supervision, M.I. and V.Š.; projectadministration, V.Š.; funding acquisition, V.Š. All authors have read and agreed to the publishedversion of the manuscript.
Funding: This work was supported in parts by the ARRS Research Program P2-0250 (B) “Metrologyand Biometric Systems”.
Institutional Review Board Statement: Not applicable.
Informed Consent Statement: Not applicable.
Data Availability Statement: The source code and models used in this paper are publicly availablefrom GitHub: https://github.com/Marjan1111/tpa-cnn latest accessed on 21 December 2021.
Acknowledgments: The authors would like to thank the Faculty of Electrical Engineering of theUniversity of Ljubljana, Slovenia, for providing the resources, space and formal setting for conductingthe research presented in this manuscript.
Conflicts of Interest: The authors declare no conflict of interest.

Sensors 2022, 22, 73 25 of 26
References1. Svoboda, J.; Masci, J.; Bronstein, M.M. Palmprint recognition via discriminative index learning. In Proceedings of the IEEE
International Conference on Pattern Recognition (ICPR), Cancun, Mexico, 4–8 December 2016; pp. 4232–4237.2. Kumar, A. Toward More Accurate Matching of Contactless Palmprint Images Under Less Constrained Environments. IEEE Trans.
Inf. Forensics Secur. 2019, 14, 34–47. [CrossRef]3. Štruc, V.; Pavešic, N. Phase Congruency Features for Palm-print Verification. IET Signal Process. 2009, 3, 258–268. [CrossRef]4. Liu, Y.; Kumar, A. Contactless Palmprint Identification Using Deeply Learned Residual Features. IEEE Trans. Biom. Behav.
Identity Sci. 2020, 2, 172–181. [CrossRef]5. Zhang, L.; Li, L.; Yang, A.; Shen, Y.; Yang, M. Towards contactless palmprint recognition: A novel device, a new benchmark, and
a collaborative representation based identification approach. Pattern Recognit. 2017, 69, 199–212. [CrossRef]6. Genovese, A.; Piuri, V.; Plataniotis, K.N.; Scotti, F. PalmNet: Gabor-PCA Convolutional Networks for Touchless Palmprint
Recognition. IEEE Trans. Inf. Forensics Secur. 2019, 14, 3160–3174. [CrossRef]7. Genovese, A.; Piuri, V.; Scotti, F. Touchless Palmprint Recognition Systems; Advances in Information Security; Springer: Cham,
Switzerland, 2014; Volume 60.8. Jia, W.; Hu, R.X.; Lei, Y.K.; Zhao, Y.; Gui, J. Histogram of Oriented Lines for Palmprint Recognition. IEEE Trans. Syst. Man Cybern.
Syst. 2014, 44, 385–395. [CrossRef]9. Kanhangad, V.; Kumar, A.; Zhang, D. A Unified Framework for Contactless Hand Verification. IEEE Trans. Inf. Forensics Secur.
2011, 6, 1014–1027. [CrossRef]10. Michael, G.K.O.; Connie, T.; Teoh Beng Jin, A. Robust Palm Print and Knuckle Print Recognition System Using a Contactless
Approach. In Proceedings of the IEEE Conference on Industrial Electronics and Applications (ICIEA), Taichung, Taiwan, 15–17June 2010; pp. 323–329.
11. Zheng, Q.; Kumar, A.; Pan, G. A 3D Feature Descriptor Recovered from a Single 2D Palmprint Image. IEEE Trans. Pattern Anal.Mach. Intell. 2016, 38, 1272–1279. [CrossRef]
12. Jain, A.K.; Feng, J. Latent Palmprint Matching. IEEE Trans. Pattern Anal. Mach. Intell. 2009, 31, 1032–1047. [CrossRef]13. Ramachandra, R.; Raja, K.B.; Venkatesh, S.; Hegde, S.; D. Dandappanavar, S.; Busch, C. Verifying the Newborns without Infection
Risks Using Contactless Palmprints. In Proceedings of the International Conference on Biometrics (ICB), Gold Coast, Australia,20–23 February 2018; pp. 209–216.
14. Zhao, S.; Zhang, B.; Philip Chen, C. Joint Deep Convolutional Feature Representation for Hyperspectral Palmprint Recognition.Inf. Sci. 2019, 489, 167–181. [CrossRef]
15. Meden, B.; Rot, P.; Terhörst, P.; Damer, N.; Kuijper, A.; Scheirer, W.J.; Ross, A.; Peer, P.; Štruc, V. Privacy-Enhancing Face Biometrics:A Comprehensive Survey. IEEE Trans. Inf. Forensics Secur. 2021, 16, 4147–4183. [CrossRef]
16. Rot, P.; Peer, P.; Štruc, V. PrivacyProber: Assessment and Detection of Soft–Biometric Privacy–Enhancing Techniques. IEEE Trans.Dependable Secur. Comput. 2021, under review.
17. Zhong, D.; Du, X.; Zhong, K. Decade Progress of Palmprint Recognition: A Brief Survey. Neurocomputing 2019, 328, 16–28.[CrossRef]
18. Fei, L.; Lu, G.; Jia, W.; Teng, S.; Zhang, D. Feature extraction methods for palmprint recognition: A survey and evaluation. IEEETrans. Syst. Man Cybern. Syst. 2018, 49, 346–363. [CrossRef]
19. Fei, L.; Zhang, B.; Jia, W.; Wen, J.; Zhang, D. Feature extraction for 3-D palmprint recognition: A survey. IEEE Trans. Instrum.Meas. 2020, 69, 645–656. [CrossRef]
20. Zhang, D.; Kong, W.K.; You, J.; Wong, M. Online palmprint identification. IEEE Trans. Pattern Anal. Mach. Intell. 2003,25, 1041–1050. [CrossRef]
21. Zhang, D.; Guo, Z.; Lu, G.; Zhang, L.; Zuo, W. An Online System of Multispectral Palmprint Verification. IEEE Trans. Instrum.Meas. 2010, 59, 480–490. [CrossRef]
22. Wu, X.; Zhao, Q.; Bu, W. A SIFT-Based Contactless Palmprint Verification Approach Using Iterative RANSAC and Local PalmprintDescriptors. Pattern Recognit. 2014, 47, 3314–3326. [CrossRef]
23. Kumar, A. Incorporating Cohort Information for Reliable Palmprint Authentication. In Proceedings of the Indian Conference onComputer Vision, Graphics and Image Processing (ICVGIP), Bhubaneswar, India, 16–19 December 2008; pp. 583–590.
24. Sun, Z.; Tan, T.; Wang, Y.; Li, S. Ordinal Palmprint Representation for Personal Identification. In Proceedings of the IEEEConference on Computer Vision and Pattern Recognition (CVPR), San Diego, CA, USA, 20–25 June 2005; pp. 279–284.
25. Charfi, N.; Trichili, H.; Alimi, A.M.; Solaiman, B. Local Invariant Representation for Multi-Instance Toucheless PalmprintIdentification. In Proceedings of the IEEE International Conference on Systems, Man, and Cybernetics (SMC), Budapest, Hungary,9–12 October 2016; pp. 3522–3527.
26. Krizhevsky, A.; Sutskever, I.; Hinton, G.E. ImageNet Classification with Deep Convolutional Neural Networks. Adv. Neural Inf.Process. Syst. 2012, 25, 1106–1114. [CrossRef]
27. Simonyan, K.; Zisserman, A. Very Deep Convolutional Networks for Large-Scale Image Recognition. In Proceedings of theInternational Conference on Learning Representations (ICLR), San Diego, CA, USA, 7–9 May 2015.
28. Szegedy, C.; Liu, W.; Jia, Y.; Sermanet, P.; Reed, S.E.; Anguelov, D.; Erhan, D.; Vanhoucke, V.; Rabinovich, A. Going Deeper withConvolutions. In Proceedings of the IEEE Conference on Computer Vision and Pattern Recognition (CVPR), Boston, MA, USA,7–12 June 2015; pp. 1–9.

Sensors 2022, 22, 73 26 of 26
29. He, K.; Zhang, X.; Ren, S.; Sun, J. Deep Residual Learning for Image Recognition. In Proceedings of the IEEE Conference onComputer Vision and Pattern Recognition (CVPR), Las Vegas, NV, USA, 27–30 June 2016.
30. Deng, J.; Dong, W.; Socher, R.; Li, L.J.; Li, K.; Fei-Fei, L. ImageNet: A Large-Scale Hierarchical Image Database. In Proceedings ofthe IEEE Conference on Computer Vision and Pattern Recognition (CVPR), Miami, FL, USA, 20–25 June 2009; pp. 248–255.
31. Zhu, J.; Zhong, D.; Luo, K. Boosting Unconstrained Palmprint Recognition With Adversarial Metric Learning. IEEE Trans. Biom.Behav. Identity Sci. 2020, 2, 388–398. [CrossRef]
32. Emeršic, Ž.; Meden, B.; Peer, P.; Štruc, V. Evaluation and Analysis of Ear Recognition Models: Performance, Complexity andResource Requirements. Neural Comput. Appl. 2020, 32, 15785–15800. [CrossRef]
33. Emeršic, Ž.; Štepec, D.; Štruc, V.; Peer, P. Training Convolutional Neural Networks with Limited Training Data for Ear Recognitionin the Wild. In Proceedings of the IEEE International Conference on Automatic Faceand Gesture Recognition and Workshops(FG), Washington, DC, USA, 30 May–3 June 2017.
34. Deng, J.; Guo, J.; Xue, N.; Zafeiriou, S. ArcFace: Additive Angular Margin Loss for Deep Face Recognition. In Proceedings of theIEEE Conference on Computer Vision and Pattern Recognition (CVPR), Long Beach, CA, USA, 15–20 June 2019; pp. 4685–4694.
35. Wang, H.; Wang, Y.; Zhou, Z.; Ji, X.; Gong, D.; Zhou, J.; Li, Z.; Liu, W. CosFace: Large Margin Cosine Loss for Deep FaceRecognition. In Proceedings of the IEEE Conference on Computer Vision and Pattern Recognition (CVPR), Salt Lake City, UT,USA, 18–23 June 2018; pp. 5265–5274.
36. Wen, Y.; Zhang, K.; Li, Z.; Qiao, Y. A Discriminative Feature Learning Approach for Deep Face Recognition. In Proceedings of theEuropean Conference on Computer Vision (ECCV), Amsterdam, The Netherlands, 11–14 October 2016; pp. 499–515.
37. Štepec, D.; Emeršic, Ž.; Peer, P.; Štruc, V. Constellation-Based Deep Ear Recognition. In Deep Biometrics; Springer: Cham,Switzerland, 2020; pp. 161–190.
38. Rot, P.; Vitek, M.; Grm, K.; Emeršic, Ž.; Peer, P.; Štruc, V. Deep Sclera Segmentation and Recognition. In Handbook of VascularBiometrics; Springer: Cham, Switzerland, 2020; pp. 395–432.
39. Vitek, M.; Rot, P.; Štruc, V.; Peer, P. A Comprehensive Investigation into Sclera Biometrics: A Novel Dataset and PerformanceStudy. Neural Comput. Appl. 2020, 32, 17941–17955. [CrossRef]
40. Emeršic, Ž.; Štruc, V.; Peer, P. Ear Recognition: More Than a Survey. Neurocomputing 2017, 255, 26–39. [CrossRef]41. Shao, H.; Zhong, D. Towards open-set touchless palmprint recognition via weight-based meta metric learning. Pattern Recognit.
2022, 121, 108247. [CrossRef]42. Ojala, T.; Pietikainen, M.; Harwood, D. Performance Evaluation of Texture Measures with Classification Based on Kullback
Discrimination of Distributions. In Proceedings of the IEEE International Conference on Pattern Recognition (ICPR), Jerusalem,Israel, 9–13 October 1994; Volume 1, pp. 582–585.
43. Ojansivu, V.; Rahtu, E.; Heikkila, J. Rotation Invariant Local Phase Quantization for Blur Insensitive Texture Analysis. InProceedings of the IEEE International Conference on Pattern Recognition (ICPR), Tampa, FL, USA, 8–11 December 2008; pp. 1–4.
44. Ojansivu, V.; Heikkilä, J. Blur Insensitive Texture Classification Using Local Phase Quantization. In Proceedings of theInternational Conference on Image and Signal Processing, 3rd International Conference, ICISP 2008, Cherbourg-Octeville, France,1–3 July 2008; pp. 236–243.
45. Dalal, N.; Triggs, B. Histograms of Oriented Gradients for Human Detection. In Proceedings of the IEEE Conference on ComputerVision and Pattern Recognition (CVPR), San Diego, CA, USA, 20–25 June 2005; Volume 1, pp. 886–893.
46. Kannala, J.; Rahtu, E. BSIF: Binarized Statistical Image Features. In Proceedings of the IEEE International Conference on PatternRecognition (ICPR), Tsukuba, Japan, 11–15 November 2012; pp. 1363–1366.
47. Vu, N.S.; Dee, H.; Caplier, A. Face Recognition Using the POEM Descriptor. Pattern Recognit. 2012, 45, 2478–2488. [CrossRef]48. Kin Kong, W.; Zhang, D.; Wenxin, L. Palmprint Feature Extraction Using 2-D Gabor Filters. Pattern Recognit. 2003, 36, 2339–2347.
[CrossRef]49. Jaderberg, M.; Simonyan, K.; Zisserman, A.; Kavukcuoglu, K. Spatial Transformer Networks. In Proceedings of the Interna-
tional Conference on Neural Information Processing Systems (NIPS), Montreal, QC, Canada, 7–12 December 2015; Volume 28,pp. 2017–2025.
50. Dai, J.; Qi, H.; Xiong, Y.; Li, Y.; Zhang, G.; Hu, H.; Wei, Y. Deformable Convolutional Networks. In Proceedings of the IEEEInternational Conference on Computer Vision (ICCV), Venice, Italy, 22–29 October 2017; pp. 764–773.
51. Johnson, H.J.; Christensen, G.E. Landmark and Intensity-Based, Consistent Thin-Plate Spline Image Registration. In Proceedingsof the International Conference on Information Processing in Medical Imaging (IPMI), Davis, CA, USA, 18–22 June 2001;pp. 329–343.
52. Ross, A.; Dass, S.; Jain, A. Fingerprint Warping Using Ridge Curve Correspondences. IEEE Trans. Pattern Anal. Mach. Intell. 2006,28, 19–30. [CrossRef]
53. Babich, G.; Camps, O. Weighted Parzen Windows for Pattern Classification. IEEE Trans. Pattern Anal. Mach. Intell. 1996,18, 567–570. [CrossRef]
54. van der Maaten, L.; Hinton, G. Visualizing Data Using t-SNE. J. Mach. Learn. Res. 2008, 9, 2579–2605.55. Zhong, D.; Zhu, J. Centralized Large Margin Cosine Loss for Open-Set Deep Palmprint Recognition. IEEE Trans. Circuits Syst.
Video Technol. 2020, 30, 1559–1568. [CrossRef]