Collins_phd_2012.pdf - Discovery - the University of Dundee ...
245
University of Dundee DOCTOR OF PHILOSOPHY Characterising homeless people in Scotland can oral health, health and psycho-social wellbeing enhance the ETHOS typology of homelessness? Collins, Jennifer Award date: 2012 Link to publication General rights Copyright and moral rights for the publications made accessible in the public portal are retained by the authors and/or other copyright owners and it is a condition of accessing publications that users recognise and abide by the legal requirements associated with these rights. • Users may download and print one copy of any publication from the public portal for the purpose of private study or research. • You may not further distribute the material or use it for any profit-making activity or commercial gain • You may freely distribute the URL identifying the publication in the public portal Take down policy If you believe that this document breaches copyright please contact us providing details, and we will remove access to the work immediately and investigate your claim. Download date: 06. Feb. 2022
-
Upload
khangminh22 -
Category
Documents
-
view
0 -
download
0
Transcript of Collins_phd_2012.pdf - Discovery - the University of Dundee ...
University of Dundee
DOCTOR OF PHILOSOPHY
Characterising homeless people in Scotland
can oral health, health and psycho-social wellbeing enhance the ETHOS typology ofhomelessness?
Collins, Jennifer
Award date:2012
Link to publication
General rightsCopyright and moral rights for the publications made accessible in the public portal are retained by the authors and/or other copyright ownersand it is a condition of accessing publications that users recognise and abide by the legal requirements associated with these rights.
• Users may download and print one copy of any publication from the public portal for the purpose of private study or research. • You may not further distribute the material or use it for any profit-making activity or commercial gain • You may freely distribute the URL identifying the publication in the public portal
Take down policyIf you believe that this document breaches copyright please contact us providing details, and we will remove access to the work immediatelyand investigate your claim.
Download date: 06. Feb. 2022
DOCTOR OF PHILOSOPHY
Characterising homeless people inScotland: can oral health, health andpsycho-social wellbeing enhance theETHOS typology of homelessness?
Jennifer Collins
2012
University of Dundee
Conditions for Use and DuplicationCopyright of this work belongs to the author unless otherwise identified in the body of the thesis. It is permittedto use and duplicate this work only for personal and non-commercial research, study or criticism/review. Youmust obtain prior written consent from the author for any other use. Any quotation from this thesis must beacknowledged using the normal academic conventions. It is not permitted to supply the whole or part of thisthesis to any other person or to post the same on any website or other online location without the prior writtenconsent of the author. Contact the Discovery team ([email protected]) with any queries about the useor acknowledgement of this work.
CHARACTERISING HOMELESS PEOPLE IN
SCOTLAND: CAN ORAL HEALTH, HEALTH AND
PSYCHO-SOCIAL WELLBEING ENHANCE THE
ETHOS TYPOLOGY OF HOMELESSNESS?
Thesis submitted in accordance with the requirements of
the University Of Dundee for the degree of:
DOCTOR IN PHILOSOPHY
To the Faculty of Medicine, Dentistry and Nursing by
Jennifer Collins BDS (Hons), MSc
October 2012
i
Table of Contents
1.0 Introduction................................................................................................................... 3
2.0 The Literature Review ................................................................................................... 7
2.1 Homeless people: definitions, typologies, incidence and prevalence ........................... 8
2.2 Homeless people, social exclusion and pathways to homelessness ........................... 25
2.3 General health of the homeless populations .............................................................. 46
2.4 The oral health of the homeless ................................................................................ 56
2.5 Conclusions to the literature review........................................................................... 82
3.0 Purpose of the survey: aims and objectives ............................................................. 87
3.1 Introduction............................................................................................................... 88
3.2 Research Question .................................................................................................... 89
3.3 Aim............................................................................................................................ 89
3.4 Objectives.................................................................................................................. 89
4.0 Method......................................................................................................................... 91
4.1 The Sample................................................................................................................ 92
4.2 Ethical considerations................................................................................................ 93
4.3 The questionnaire...................................................................................................... 95
4.4 Oral health examination ............................................................................................ 97
4.5 Statistical analysis.................................................................................................... 100
5.0 Results ....................................................................................................................... 102
5.1 Sample..................................................................................................................... 103
5.2 Demographic profile ................................................................................................ 104
5.3 Health behaviours and health status........................................................................ 115
5.4 Oral health and oral health behaviours .................................................................... 129
5.5 Psycho-social health ............................................................................................... 147
5.6 Categorising types of homelessness: health, oral health and psycho-social
factor descriptors .................................................................................................... 160
ii
6.0 Discussion ................................................................................................................. 167
6.1 Introduction............................................................................................................. 168
6.2 Homelessness in Scotland ....................................................................................... 169
6.3 Demographic profile: is this a representative sample? ............................................. 170
6.4 Health status and health behaviours........................................................................ 174
6.5 Oral health and oral health behaviours .................................................................... 177
6.6 Dental treatment experience and psycho-social factors .......................................... 183
6.7 Limitations............................................................................................................... 186
6.8 Conclusions ............................................................................................................. 187
7.0 Recommendations..................................................................................................... 190
8.0 References ................................................................................................................. 192
9.0 Appendices ................................................................................................................ 208
iii
List of Tables
Table 1: European Typology of HOmelessnesS (ETHOS) ............................................................ 11
Table 2: Typologies of homelessness................................................................................................ 14
Table 3: Descriptors of Homelessness .............................................................................................. 18
Table 4: Households assessed as homeless or in priority need by local authority
1992-95 to 2010-11 ............................................................................................................. 21
Table 5: Key components of proposed review ................................................................................ 61
Table 6: Initial selection of search terms.......................................................................................... 62
Table 7: Data extraction checklist ...................................................................................................... 70
Table 8: Summary of STROBE checklist data .................................................................................. .77
Table 9: Summary of review ................................................................................................................. 78
Table 10: Details of data collection by participating NHS Board ................................................. 94
Table 11: Distribution of participants by NHS Board ....................................................................103
Table 12: Demographic profile: gender by NHS Board .................................................................104
Table 13: Demographic profile: age by NHS Board........................................................................105
Table 14: Demographic profile: by age, gender and NHS Board ...............................................105
Table 15: Demographic profile: stated occupations of participants ........................................107
Table 16: Demographic profile: living arrangements....................................................................108
Table 17: Demographic profile: gender by category of homelessness ...................................108
Table 18: Demographic profile: age by category of homelessness ..........................................109
Table 19: Demographic profile: NHS Health Board by category of homelessness ...............109
Table 20: Demographic profile: comparison of family status by NHS Board .........................111
Table 21: Demographic profile: comparison of family status by category of
homelessness .........................................................................................................................111
Table 22: Characterisation of ‘houseless’, ‘other homeless’ and ‘roofless’ participants
by demography ......................................................................................................................114
Table 23: Health behaviours: comparison of the proportions of smokers by age ...............115
iv
Table 24: Health behaviours: comparison of the average number of cigarettes
reportedly smoked daily by age ......................................................................................116
Table 25: Health behaviours: alcohol consumption: comparisons by age group and
category of homelessness .................................................................................................117
Table 26: Health behaviours: Drug use and age ...........................................................................119
Table 27: Characterisation of ‘houseless’, ‘other homeless’ and ‘roofless’ participants
by health behaviours ............................................................................................................121
Table 28: Health: physical health comparisons by age group ...................................................123
Table 29: Health: physical health comparisons by category of homelessness .....................124
Table 30: Current prescribed medication .........................................................................................125
Table 31: Comparison of prescribed medication: comparison by age group and
category of homelessness ...................................................................................................126
Table 32: Pooled within-groups correlations between discriminating variables and
standardised canonical discriminant functions: health .............................................127
Table 33: Eigenvalues for the 2 canonical discriminant functions: health .............................127
Table 34: Oral health: obvious decay experience ..........................................................................129
Table 35: Oral health: obvious decay experience: comparisons by gender ...........................130
Table 36: Oral health: percentages of participants with obvious decay experience
by age group ..........................................................................................................................131
Table 37: Oral health: obvious decay experience: comparisons by category of
homelessness .........................................................................................................................132
Table 38: Oral health: plaque scores compared with age ...........................................................133
Table 39: Oral health: plaque by category of homelessness ......................................................134
Table 40: Pooled within-groups correlations between discriminating variables and
standardised canonical discriminant functions: oral health ....................................137
Table 41: Eigenvalues for the 2 canonical discriminant functions: oral health.....................137
Table 42: Dental treatment: reported dental treatment ever received ....................................139
Table 43: Dental treatment experiences by gender. .....................................................................140
Table 44: Dental treatment experiences by age group ................................................................141
v
Table 45: Dental treatment experiences by category of homelessness ..................................142
Table 46: Dental treatment access attitudinal scales and attitude items ...............................144
Table 47: Dental treatment access attitudinal scales: comparisons by gender ....................145
Table 48: Dental treatment access attitudes: comparisons by gender....................................145
Table 49: Dental treatment access attitudes: comparisons by age group..............................146
Table 50: Dental treatment access attitudes: comparisons by category of
homelessness .........................................................................................................................146
Table 51: Comparison of mean MDAS scores by age group .......................................................148
Table 52: Comparison of mean MDAS scores by category of homelessness.........................149
Table 53: Frequency of oral health impact in the preceding 12 months;
comparisons with ADHS (SCOTLAND 1998)..................................................................152
Table 54: Oral health-related quality of life: comparison by age group ................................153
Table 55: Oral health-related quality of life: comparisons of mean scores by
category of homelessness ..................................................................................................155
Table 56: Depression: comparisons of mean scores by gender ................................................156
Table 57: Comparison of depression mean scores by category of homelessness. .............158
Table 58: Pooled within-groups correlations between discriminating variables and
standardised canonical discriminant functions: psychosocial health ..................159
Table 59: Eigenvalues for the 2 canonical discriminant functions: psychosocial
health ........................................................................................................................................159
Table 60: Discriminating variables between ‘houseless’, ‘other homeless’ and
‘roofless’ participants ..........................................................................................................162
Table 61: Characterisation of ‘houseless’, ‘other homeless’ and ‘roofless’ participants
by oral health, health and psychosocial factors ..........................................................165
Table 62: Characterisation of homeless people against a framework of typology ..............166
vi
List of Figures
Figure 1: Percentage of homeless applicants 2010-2011 who slept rough
prior to asking for assistance. ........................................................................................... 22
Figure 2: The relationship between social capital and health.................................................... 32
Figure 3: The mechanisms to promote social capital and health. ............................................ 33
Figure 4: A tripartite structure to explain factors affecting access to
health-care for homeless people...................................................................................... 48
Figure 5: Summary of review process. ............................................................................................. 65
Figure 6: Role of the 2nd reviewer ........................................................................................................ 68
Figure 7: NHS Boards which participated. ........................................................................................ 92
Figure 8: The Simplified Oral Hygiene Index. ................................................................................. 99
Figure 9: Category of homelessness: Canonical discriminant functions – health
behaviours ............................................................................................................................128
Figure 10: Category of homelessness: Canonical discriminant functions
- oral health .........................................................................................................................138
Figure 11: Percentage of total sample experiencing oral health impacts. .............................151
Figure 12: Comparison of mean depression scores by age group ...........................................157
Figure 13: Category of homelessness: Canonical discriminant functions
- psycho-social health ......................................................................................................160
vii
List of Appendices
Appendix 9.1a: Oral health promotion initiatives undertaken by selected NHS
Boards .............................................................................................................................209
Appendix 9.1b: Active treatment provision of selected NHS Boards for the
homeless........................................................................................................................211
Appendix 9.1c Action being taken and the progress of selected NHS Boards in
adhering to the standards ........................................................................................213
Appendix 9.2a: Exclusion criteria form design: article exclusion questions ..........................215
Appendix 9.2b: Sample of excluded papers (excluded following examination of full
texts) with reasons for exclusion ...........................................................................216
Appendix 9.2c: STROBE Statement—Checklist of items that should be included in
reports of cross-sectional studies ........................................................................218
Appendix 9.3: The IRAS Judgement. .................................................................................................220
Appendix 9.4: University of Dundee Ethical Approval .................................................................222
Appendix 9.5: The Questionnaire ......................................................................................................223
Appendix 9.6: Access inhibition and access anxiety scale items as compared with
age ...................................................................................................................................231
Appendix 9.7: Access inhibition and access anxiety scale items as compared with
category of homelessness ........................................................................................233

viii
Acknowledgements
I am absolutely indebted to my supervisor Professor Ruth Freeman for her generosity with
her time and expertise, and her kindness. I will never be able to adequately express my
gratitude for her support through this process.
I am also grateful to Gerry Humphris for giving so freely of his time, the staff at DHSRU,
Scottish Community Dental Teams, and Fiona Williams, whose assistance and advice were
invaluable.
Many thanks also to Karen Howard and Fiona McAuley for their support and mentorship in
Belfast.
Finally, I would like to thank my family, especially my parents. For everything.
Declaration
I declare that I am the author of this thesis and have consulted all references cited. I
have carried out the work of which this thesis is a record. This work has not been
previously accepted for a higher degree. The Scotland-wide data gathering was
achieved in collaboration with Salaried Dental Service health professionals and staff at
DHSRU.

1
Summary
The issue of healthcare provision for homeless people provides an ongoing concern
throughout Scotland. Homeless people have been shown to experience high levels of
ill-health, including oral diseases and are disproportionately affected by mental health
problems.
This thesis sought to establish the health, oral health and psychosocial well-being
needs of Scottish homeless people with a view to enhancing understanding, and
providing a basis for improving models of care and service delivery for this group of
vulnerable individuals. Two literature reviews were carried out, a narrative review of the
available literature relevant to concepts of homelessness and relevant to the health of
homeless people, and a structured review which allowed a detailed systematic
examination of the literature specifically pertaining to the oral health of homeless
people.
In order to provide greater context, the information gathered in this survey was
evaluated against a framework of typology; typologies being frequently used to
characterise homelessness. The ETHOS typology, internationally recognised and
considered to be a valid and reliable construct of homelessness, was selected for use in
this context of this thesis. Thus the aim was to investigate if oral health, health and
psycho-social wellbeing could be used as additional descriptors of the ETHOS typology
of homelessness for a Scotland-wide homeless population to inform the development
of a tailored service provision to increase engagement with health services.
In order to achieve this aim, homeless people throughout seven NHS Boards in Scotland
were sampled. Participants were asked to complete a questionnaire which assessed
demography, general health and associated health-related behaviours, psycho-social
wellbeing, oral health and oral health-related attitudes and behaviours. An oral
2
examination was conducted to evaluate the prevalence of obvious decay experience,
levels of plaque present, oral mucosal disease, and denture wear.
Eight hundred and fifty three homeless people participated, 85% of whom had an oral
examination. Using the data obtained it was possible to show that demographic, oral
health, health and psycho-social wellbeing descriptors existed which could characterise
the various dimensions of the ETHOS typology, allowing an enhanced ETHOS typology
to be developed. It is recommended that this enhanced ETHOS typology could act as a
framework against which targeted and tailored health service provision for specific
groups of homeless people could be developed. It is proposed that such a tailored
health service provision is necessary, and would allow health services to improve their
engagement of homeless populations.
3
1.0 Introduction
Homeless people are said to face an everyday struggle to find basic elements of human
necessity and comfort, such as shelter and nourishment [1]. Perhaps as a reaction to
the stressful nature of homeless life, or due to destructive habits already established
prior to their homelessness, many homeless people take refuge in unhealthy lifestyle
choices such as alcohol, smoking and/or drug use [2]. Being homeless is an
impoverishing and isolating experience, which presents those affected with many
issues, which can directly impact upon, and potentially compromise, their health and
oral health [3-11]. The homeless population as a group is often characterised by an
increased prevalence of chaotic itinerant lifestyles [12, 13], deprivation [14], social
exclusion [15], general ill health [1,10], and poor oral health [11].
The exceptional healthcare needs of homeless people in Scotland were recognised by
the Scottish Executive, which in March 2005 produced a set of Health and Homeless
Standards, a set of strategic standards [16], aimed at ensuring that the NHS Boards
within Scotland gave special consideration to improving understanding, planning and
treatment of the homeless within their NHS Board areas. There are six individual
Standards focussed on aspects of service delivery for homeless people in Scotland,
namely corporate planning, partnership working, evidence based service development,
access to healthcare services, positive service response and effective implementation of
the Health and Homelessness Action Plan [16].
The Scottish Executive had also recognised, as part of its ‘Action Plan for Improving
Oral Health and Modernising NHS Dental Services in Scotland’ (Dental Action Plan) in
2005, that it would be desirable for NHS Boards to develop and implement oral health-
care promotion for ‘adults most in need’. Homeless people were categorised as one of
the groups of ‘adults most in need’ in the Dental Action Plan [17].
4
In response to these Government directives, health policies and strategies have been
developed throughout Scotland for homeless populations [16]. Each of the Local
Authorities and National Health Service Boards in Scotland has, therefore, a statutory
duty to implement a strategy for dealing with issues associated with homelessness, and
these strategies include the distribution of advice and information regarding healthcare
and dental services in the local area [16]. Throughout Scotland, access measures have
been put in place to facilitate care for the homeless, with dental services often linked
with medical service provision. These measures are aimed at improving uptake of
dental services amongst homeless people, and run in tandem with the services offered
by other NHS and private dental clinics.
Different NHS Board regions have taken different approaches, with a common aim of
inclusion of homeless people within the context of dental care (see Appendix 9.1a,
9.1b and 9.1c). Many of the NHS Board regions are involved in the Scotland-wide
initiative which is aimed at developing and implementing a novel nationwide dental
service for homeless people.
The policies to promote health-care provision are multi-agency documents, and their
implementation is effectively monitored by Communities Scotland, the Government and
the Homelessness Monitoring Group [16]. The Scottish Government’s acknowledgment
of homeless people as group in need of special attention is a valuable reaction to the
demands of the homeless lifestyle and the detrimental effects this lifestyle has on
health and oral health [18].
In order to address the complexity of issues that provision of oral health services
towards this socially excluded population create, an accurate evaluation of numbers of
those who constitute the ‘homeless’ population and their needs, as related to the
services planned for delivery, is required [18]. In 2004, the British Dental Association
(BDA) published ‘Dental Care for Homeless People’ [18]. This BDA document recognised
5
the need to improve the delivery of dental care to homeless people, and as a first step
it was suggested that a normative needs assessment be conducted in order to provide
tailored dental services to meet the needs of people experiencing homelessness. This
population-based approach is compliant with the British Dental Association’s
recommendations that homeless people be provided with ‘accessible dental services
based on local needs assessments’ [18].
As the aim of this thesis is to characterise homeless people in terms of typology and
health status, the optimum means by which a characterisation may be achieved must
be examined. It has been acknowledged that one of the most apposite methods to
characterise a population is to conduct a cross sectional survey with the largest
possible population size, so that the validity and reliability of the findings are
maximised [19] in order to gain an understanding of any client group. Consequently,
there is a wealth of literature which focuses on homeless populations with a view of
characterising them through description and typology. These characterisations of
homelessness attempt to expose the heterogeneity of the so-called ‘homeless’ and
range from simple descriptions to complex typologies. However, despite this range of
characterisations of homelessness, there is little information which links oral health,
health or psychosocial wellbeing as additional descriptors of typologies of
homelessness. In essence, can oral health, health and/or psychosocial wellbeing be
used as additional descriptors of homelessness typology?
It is proposed that an enhanced typology of homelessness that incorporates oral
health, health and psycho-social factors might inform tailored health service provision
with a view to increasing engagement of homeless people with health services.
The literature review, therefore, will to examine the concepts of homelessness,
illustrate the heterogeneous nature of homeless populations, through an examination
of the prevalence and incidence of homelessness, and explore the various definitions
6
and typologies which are used to characterise homelessness. This exploration will
allow for an improved understanding of who homeless people are, reasons for
homelessness, and the barriers which impede access to healthcare to understand the
increased prevalence of physical and emotional ill-health.
A structured literature review will be conducted to answer the research question ‘Does
the empirical evidence show an association between oral health and homelessness? –
This structured review will examine the literature in detail and critically evaluate it
using a systematic approach in order to determine whether any existing literature
characterises homeless populations in terms of their oral health.
Therefore, the narrative and structured reviews of the literature will provide an overview
of what it means to be homeless in terms of concepts and typologies, pathways to
homelessness, the health risks associated with homelessness and the oral ill-health
suffered by those experiencing homelessness. This will allow a first stage in the
process of the identification of potential and additional oral health, health and/or
psychosocial wellbeing as descriptors of the various typologies of homelessness.
7
2.0 The Literature Review
2.1 Homeless people: definitions, typologies, incidence and prevalence
2.2 Homeless people, social exclusion and pathways to homelessness
2.3 General health of the homeless populations
2.4 The oral health of the homeless
2.5 Conclusions to the literature review
8
2.0 The Literature Review
2.1 Homeless people: definitions, typologies, incidence and prevalence
The definitions of homelessness applied by various local and national organisations
involved with delivering care to homeless people vary in accordance with legislation,
health promotion initiative and common usage. For example the definition of
homelessness, according to Section 24 of the Housing (Scotland) Act, 1987, and
applied for the purpose of the Homeless Persons legislation is that:
‘A person is considered as being homeless if they have no accommodation with
the U.K. or elsewhere, or if they have accommodation, but are unable to occupy
it [9, 14]’.
Whereas, for the purposes of the’ Scottish Rough Sleepers’ [20] Initiative Count’, a
slightly different definition was applied, as a rough sleeper was classed as being
anyone who had slept: ‘Outside in a place not specifically designed for human
habitation at least once in the last seven days [20].
The working party for the Prevention of Social Inclusion of Homeless People in Northern
Ireland, however, defined rough sleeping in the more general terms as a person
‘sleeping in the open air [15]’.
More recently terms such as ‘sofa surfer’ have come into regular use to describe a
homeless person who is:
‘Not quite outcast enough to have resorted to sleeping under bridges,
preferring instead to use up the hospitality of everyone they know in turn’ [21].
The homeless charity, Crisis, considers several further definitions of homelessness as
viable. These include the legally homeless i.e. those without accommodation that they
are entitled to occupy. These homeless people may or may not be included in the
9
official figures, as they may not have applied to be classified as being homeless [22].
The ‘statutory homeless’, are those who have applied for assistance, and have been
assessed as being unintentionally homeless and in priority need. Those who are both
legally homeless and have successfully applied to the local authority to be classified as
such are described as ‘officially recognised as homeless people’ [22].
The EU Social Inclusion Strategy re-defined homelessness examining a group referred
to as ‘rough sleepers’. They suggested that ‘rough sleeping’ or ‘sleeping in
uninhabitable improvised shelters’ should be contained within a category of
‘rooflessness’ [23] who could be thought of in terms of experiencing ‘absolute
homelessness’, i.e. without physical shelter.
Other descriptors have been used to define homelessness, for instance, those
individuals who have been described as ‘houseless’. People who experience
‘houselessness’ are said to be those living in temporary (e.g. ‘sofa surfers’) or sheltered
accommodation, such as short-stay hostels or ‘halfway house’ lodgings, or living in
inadequate, overcrowded or insecure or unfit housing [16].
The vagarities of language used in these definitions and descriptions of homelessness
have created confusion, which has often result from prolonged debates regarding the
nature of homelessness, as well as the people characterised and described as being
homeless. These terms illustrate the heterogeneity of this group of people marginalised
to the edge of society.
2.1.1 Profiles of homeless people: typologies and descriptors
The diverse nature of homeless populations creates a necessity for typologies, or
classifications, of homelessness. These typologies are useful in terms of dividing the
population into subgroups based on epidemiological, psychosocial, and environmental
10
requirements, which in turn function to facilitate service delivery to a difficult to access
people through an improved understanding of the situational and environmental
factors which affect their lifestyles. Typologies, therefore, are useful in recording
diagnostic, prognostic and descriptive information in easily understood and accessible
form [19].
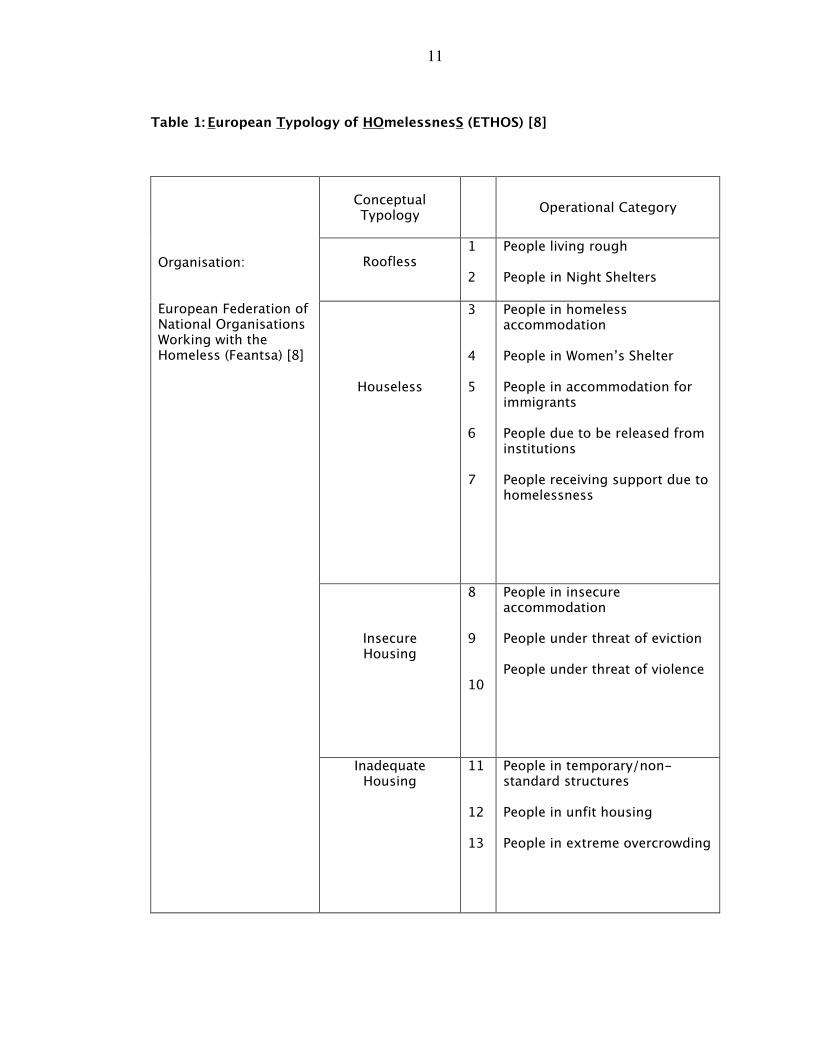
Since different groups or organisations working with homeless people employ a range
of definitions to describe homeless people with subtle differences, pan-national groups
such as the European Federation of National Organisations Working with the Homeless
(Feantsa) have attempted to classify ‘homelessness’. Feantsa consider homelessness
within a broad context encompassing those who are roofless, houseless, living in
insecure accommodation, and those inadequately housed [8]. Feantsa subscribes to the
European Typology of Homeless (ETHOS), as described above, which is thought to be
inclusive, providing a true reflection of modern homelessness [8]. The ETHOS typology
categorises homeless people in accordance with the accommodation-related
descriptions as noted in Table 1.
The homeless experience does not tend to be static and can be conceptualised as a
journey. This is echoed in the ETHOS typology, which may be thought of as a dynamic
characterisation of homelessness. Homeless people have the potential for mobility
between categories of the typology as their homeless experience progresses.
The ETHOS typology provides a useful tool for measuring homelessness and
differentiating between different types of homelessness, and also provides comparable
data, allowing for comparison among the various EU member states.
11
Table 1: European Typology of HOmelessnesS (ETHOS) [8]
Conceptual Typology
Operational Category
Roofless
1 2
People living rough People in Night Shelters
Houseless
3 4 5 6 7
People in homeless accommodation People in Women’s Shelter People in accommodation for immigrants People due to be released from institutions People receiving support due to homelessness
Insecure Housing
8 9 10
People in insecure accommodation People under threat of eviction People under threat of violence
Organisation: European Federation of National Organisations Working with the Homeless (Feantsa) [8]
Inadequate Housing
11 12 13
People in temporary/non-standard structures People in unfit housing People in extreme overcrowding
12
Nevertheless, other typologies of homelessness have been developed, often having a
basis in the causes of homelessness, and are used as descriptors of exclusion from
society and resources (Table 2). These typologies include:
1. The disaffiliation-based typology [24], which refers to the method by which
homelessness has occurred, therefore it describes how an individual can
become detached from society, whether the basis for that detachment is the
withdrawal of the individual from society or vice-versa. In either case society
and the individual become disenfranchised with and disaffiliated from each
other. An example of this is seen in the experience of chronic mental illness;
sometimes this can result in an individual withdrawing from society, and
becoming homeless as a result.
2. The trajectory-based typology [25] describes groups of homeless people in
terms of how they physically entered the realm of homelessness. As a result
there are sub-groups within this typology, such as ‘street people’ and ‘shelter
people’. The typology category is dependent on where the individual spends
time as a homeless person.
3. The dichotomy-based homeless trajectory [26] descriptors are based on the
duration of the homeless experience, splitting homeless people into two main
categories: long term (or malignant) and short term (or benign) homeless.
Describing homelessness in this way can be useful when evaluating the
homeless person’s likelihood of an effective return to the settled population.
4. The preventive-based typology [27] defines homelessness in terms of duration
of homelessness, with the additional consideration of how deeply mired the
individual or family has become in the homeless situation. This typology also is
used with a view to re-homing the houseless, and examines facilitating factors,
and factors acting as barriers to re-homing homeless people.
5. The career-based typology [28] of homelessness, as described by Mackenzie
and Chamberlain [28], provides definition of the homeless experience in terms
13
of the pathways into and through homelessness. This allows examination of the
root causes of homelessness and the effects of societal problems such as drug-
related crime on the homeless population. In examining the cause and effect of
homelessness this typology has elements in common with the trajectory-based
typology [25], this typology focuses on causality, however, as opposed to
descriptors.
6. The resource-based typology [29] of homelessness focuses solely on the effects
of societal issues on homelessness, as opposed to descriptors of homeless
causality, relating homelessness to the impacts of community and
family/individual resources, and the reciprocal relationships between the
homeless person and their surroundings.
14
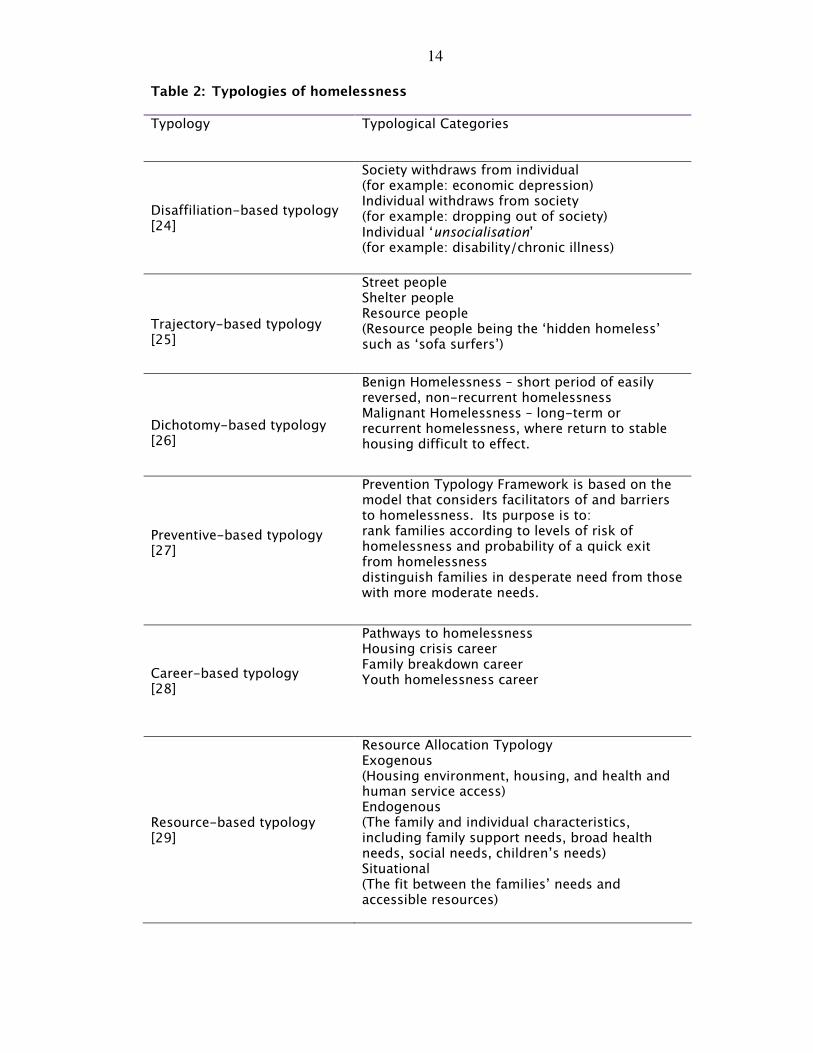
Table 2: Typologies of homelessness
Typology Typological Categories
Disaffiliation-based typology [24]
Society withdraws from individual (for example: economic depression) Individual withdraws from society (for example: dropping out of society) Individual ‘unsocialisation’ (for example: disability/chronic illness)
Trajectory-based typology [25]
Street people Shelter people Resource people (Resource people being the ‘hidden homeless’ such as ‘sofa surfers’)
Dichotomy-based typology [26]
Benign Homelessness – short period of easily reversed, non-recurrent homelessness Malignant Homelessness – long-term or recurrent homelessness, where return to stable housing difficult to effect.
Preventive-based typology [27]
Prevention Typology Framework is based on the model that considers facilitators of and barriers to homelessness. Its purpose is to: rank families according to levels of risk of homelessness and probability of a quick exit from homelessness distinguish families in desperate need from those with more moderate needs.
Career-based typology [28]
Pathways to homelessness Housing crisis career Family breakdown career Youth homelessness career
Resource-based typology [29]
Resource Allocation Typology Exogenous (Housing environment, housing, and health and human service access) Endogenous (The family and individual characteristics, including family support needs, broad health needs, social needs, children’s needs) Situational (The fit between the families’ needs and accessible resources)
15
Therefore, when choosing which typology of homelessness to use, the way in which the
typology is to be used may be directly relevant to the typology choice. For instance,
certain typologies (e.g. the preventive-based typology) are relevant in terms of
planning preventive interventions, while others (e.g. resource-based typology) are more
useful when solving the problems to assist homeless people to find a home.
Some organisations choose to disregard typology descriptors and use broader, more
ambiguous terms when describing homelessness. The United Nations [30, 31], for
example, define homelessness in a holistic context, viewing it, not just from the
perspective of the physical descriptive (e.g. houseless), but from the perspective of its
impacts on the individual and their sense of place within the wider social context. In
essence the United Nations classification takes into account the social isolation and
social exclusion of a homeless individual. Therefore the homeless person is described
as being:
‘[Detached] from society characterised by the lack of affiliative bonds that link
people into their social structures [30, 31]’.
The United Nations’ classification of homelessness [30, 31], therefore takes into
account the social dimension as well as the vulnerable living environment, that many
people and families, whilst not actually roofless, are living in. Thus, it shares
commonalities with the Feantsa-ETHOS definition [8], which considers homelessness
within a tripartite, interactive framework of the physical, social and legal aspects of
having a home - the so-called domains of homelessness:
• The Physical Domain: the individual’s home can be described as being a decent
dwelling or space, adequate to meet the needs of the person
• The Social Domain: the individual’s home is such that the individual can
maintain privacy and enjoy social relations
• The Legal domain: The individual has exclusive possession of the home, and
has security of occupation and possesses the legal title for the home [8].
16
The ETHOS domains of homelessness therefore constitute what is meant by a home in
terms of its physical structure, as a place for social interaction and its legal
requirements. For United Nations and Feantsa-ETHOS, it is the absence of any one of
these domains, which increases the potential to be rendered homeless. The embracing
of the 3 domains of homelessness as an explanatory framework to understand the risks
and outcomes of homelessness also provides a means of identifying the true
prevalence of homelessness. Moreover, It has been proposed that adopting the 3
domains of homelessness allows a clear visualisation of homelessness as an ongoing,
dynamic process, emphasizing the reality that homelessness is not just limited to
physical housing problems [8].
The ‘United States Code’ on homelessness, from America, differs from that of the
United Nations and ETHOS. The United States Code uses an umbrella definition of
homelessness which defines the individual experiencing homelessness as a person
who:
‘lacks a fixed, regular and adequate night time residence’ or someone, whose
night time residence is ‘a shelter, an institution or a public space not designed
for sleeping’ [32].
The United States Code definition, unlike that of United Nations or ETHOS, is one-
dimensional relying on the single issue of ‘being without a home to sleep in’ as being
the demarcation between those who are and those who are not experiencing
homelessness. The United States Code definition, therefore, has the tendency to
exclude those people who are characterised as the hidden homeless and thus reducing
the reporting of the true prevalence of homelessness. The United Nations and ETHOS
definitions implicitly reject a one-dimensional definition of homelessness, which in
their view, implies a stasis in the individual’s homelessness status and ignores the
dynamic quality as well as the understanding inherent within the typologies of
homelessness.
17
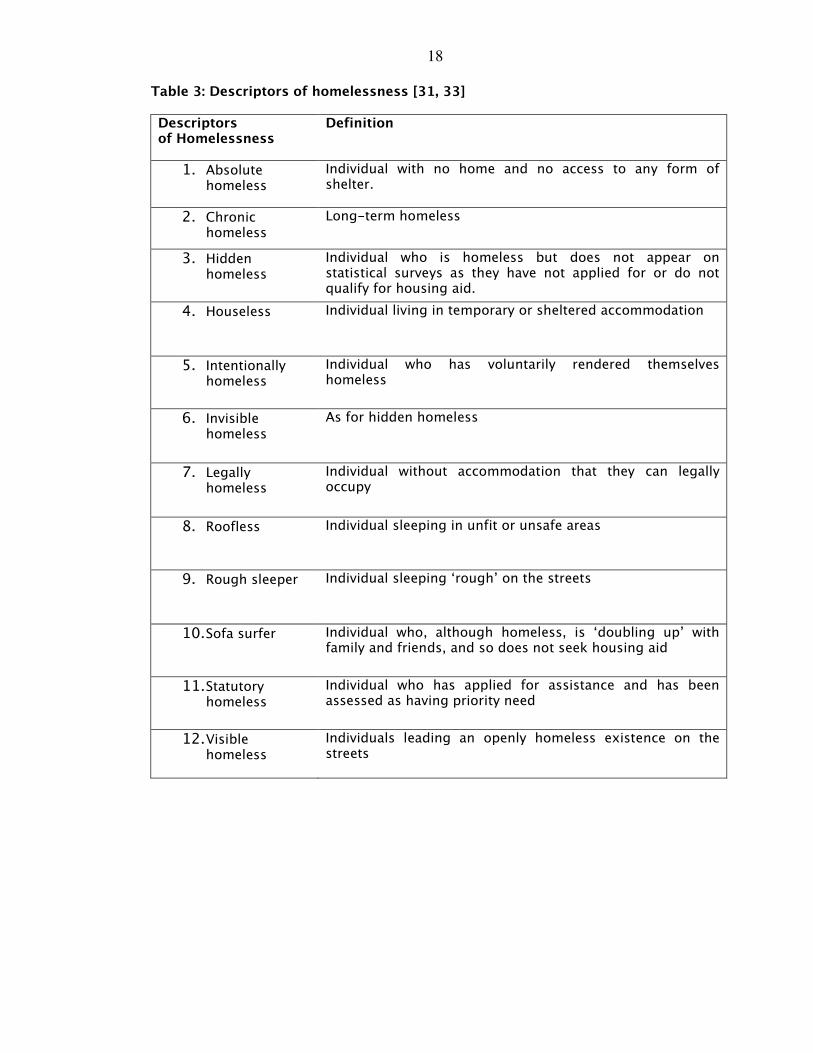
2.1.2 Profile of homeless people: descriptors of homelessness
There exists, therefore, a wide variety of terminologies, typologies and descriptions of
homelessness. Some descriptors are, however, useful as they describe some of the
subgroups common to homeless populations, and are frequently used as a basis for
defining homelessness for the purposes of surveys. Table 3 provides a list of
descriptors and definitions of homelessness ranging from ‘absolute homelessness’
through to ‘statutory homelessness’. The existence of such a multitude of definitions
does not reflect confusion, instead providing acknowledgement that there are a variety
of forms of homelessness that can be experienced, and that the so-called ‘homeless’
are in fact a diverse group of individuals, with homelessness at its most basic being
considered as being ‘without a home’.
Therefore, the way in which homelessness is categorised, can in addition provide
descriptions of sub-groups of the homeless population, which may in turn affect the
eligibility and priority with which homeless people are treated by the local authorities.
This has been noted by the European Union’s (EU) Social Inclusion Strategy, which
comments on the lack of harmonised statistics; a product of the lack of clarity
surrounding the definition of homelessness [23].
18
Table 3: Descriptors of homelessness [31, 33]
Descriptors of Homelessness
Definition
1. Absolute homeless
Individual with no home and no access to any form of shelter.
2. Chronic homeless
Long-term homeless
3. Hidden homeless
Individual who is homeless but does not appear on statistical surveys as they have not applied for or do not qualify for housing aid.
4. Houseless
Individual living in temporary or sheltered accommodation
5. Intentionally homeless
Individual who has voluntarily rendered themselves homeless
6. Invisible homeless
As for hidden homeless
7. Legally homeless
Individual without accommodation that they can legally occupy
8. Roofless
Individual sleeping in unfit or unsafe areas
9. Rough sleeper
Individual sleeping ‘rough’ on the streets
10. Sofa surfer
Individual who, although homeless, is ‘doubling up’ with family and friends, and so does not seek housing aid
11. Statutory homeless
Individual who has applied for assistance and has been assessed as having priority need
12. Visible homeless
Individuals leading an openly homeless existence on the streets
19
2.1.3 Profiles of homeless people: incidence and prevalence in Scotland
This section of the narrative review will focus and describe the incidence and
prevalence of homelessness in the Scotland, demonstrating the effect of definition or
typology upon statistics as an expression of shortcomings within the epidemiological
data described. This will allow understanding of homelessness in the Scottish context.
The definitions, typologies, and descriptors of what constitutes homelessness are
diverse. However, and more worryingly, they have the potential to alter the outcomes
of homelessness surveys or counts, making it difficult to break down statistics into
exact numbers of homeless individuals since there is the tendency to count
‘households’ as opposed to individuals. The agencies and organisations tasked with
gathering statistics regarding numbers of homeless people, present within any given
region, tend to use different descriptors and definitions of homelessness. Therefore,
precise figures for homeless populations in any area are often difficult to ascertain.
2.1.31 Incidence of homelessness in Scotland
Since 2001, the data from applications to the local authorities in Scotland under the
Homeless Persons’ Legislation has been recorded in such a manner as to allow
improved analysis for issues such as repeat applications, reasons for homeless and
analysis of household composition. Prior to 2001 cases were only recorded after the
case was closed, so the data captured was retrospective. Since 2001, a more
continuous approach has been taken, meaning that the data is more up to date.
Dramatic rises in numbers are visible, for example in the year 1989-90 there were
29,068 applications made, almost less than half of 52,120 in 2002-2004 [33]. The
number of applications in 2008-2009 was 57,304 [34].
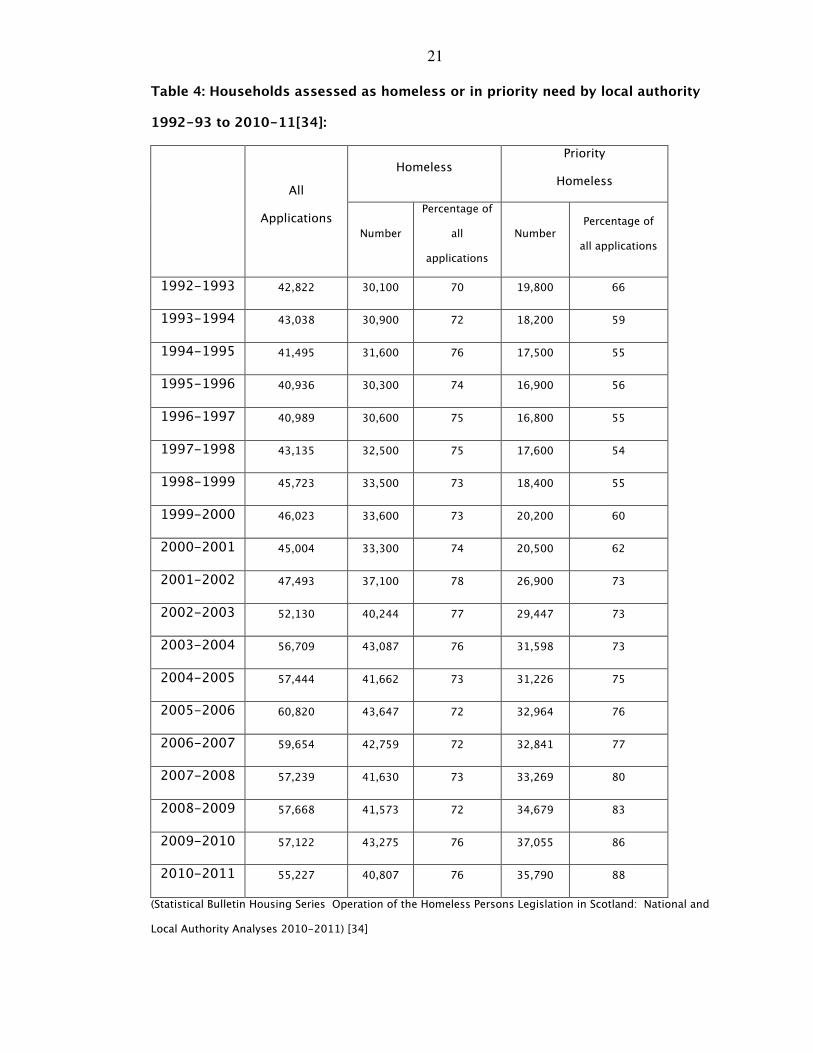
The levels of applications under this legislation are rising, and the statistics provided
by this are one of the better indicators of levels of homelessness in Scotland (Table 4).
20
In the year 2003-2004, 56,696 households made applications to the local authorities in
Scotland under the Homeless Persons legislation [20, 33]. This figure represents a nine
percent increase in the estimated number of homeless in Scotland compared with the
previous year. Glasgow, Edinburgh and Fife had the largest number of applications.
These figures can be compared with 286,849 applications in England and 22,250 in
Wales [33]. This is a particularly pertinent issue for the Scottish Government since it has
been estimated there are growing numbers of homeless people in Scotland [20]. In
2003 it was estimated that there were at least 56,696 homeless people in Scotland
[33]. The most recent figures from the year 2010-2011 show that 55,227 people
applied to be considered as homeless, this in fact represented a small increase
compared with 2009-2010 [34]. The number of households described by the local
authorities as being homeless following assessment was 43,030 in 2003-2004 (Table
4). Households are classified as in priority need either if they have dependent children
or if they are classified as 'vulnerable' [22]. Table 4 shows that the percentage of
priority homeless has increased year on year. Fifty-six percent of people described as
being homeless in 2003-2004 were considered to fall into the category of priority
homeless. By 2010-2011 the number of households assessed as being homeless was
55,227 but those classified as priority homeless had risen to 88% [34].
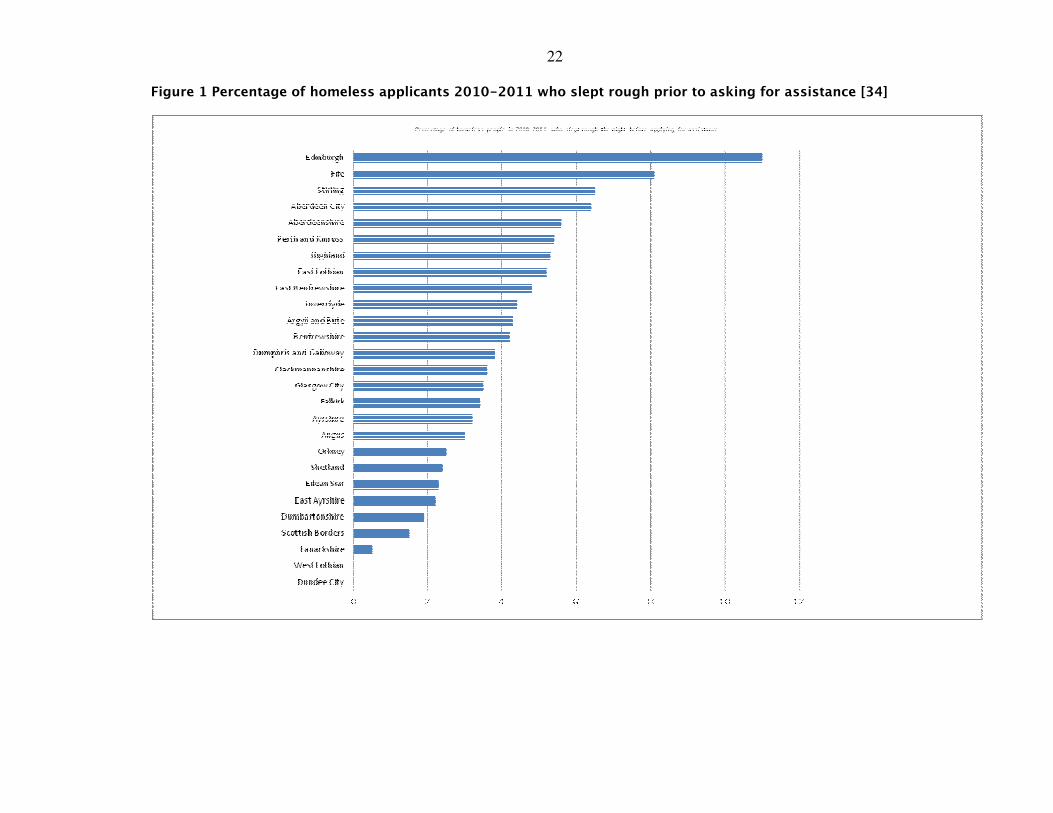
More accurate pictures of homelessness are provided by the kind of statistics provided
by enterprises such as the Rough Sleepers Initiative in Scotland [20]. This scheme
operated a biannual count of homeless in Scotland, since its inception in 1997, until its
completion in 2003. In October 2003, the number of people sleeping rough
throughout Scotland was recorded as 328 individuals, with the greatest concentration
of these being in the cities of Glasgow and Edinburgh [20]. Figure 1 shows the 2010-
2011 data on rough sleeping by council area in Scotland. This data is based on the
number of people rough sleeping before asking for assistance.
21
Table 4: Households assessed as homeless or in priority need by local authority
1992-93 to 2010-11[34]:
Homeless Priority
Homeless
All
Applications
Number
Percentage of
all
applications
Number Percentage of
all applications
1992-1993 42,822 30,100 70 19,800 66
1993-1994 43,038 30,900 72 18,200 59
1994-1995 41,495 31,600 76 17,500 55
1995-1996 40,936 30,300 74 16,900 56
1996-1997 40,989 30,600 75 16,800 55
1997-1998 43,135 32,500 75 17,600 54
1998-1999 45,723 33,500 73 18,400 55
1999-2000 46,023 33,600 73 20,200 60
2000-2001 45,004 33,300 74 20,500 62
2001-2002 47,493 37,100 78 26,900 73
2002-2003 52,130 40,244 77 29,447 73
2003-2004 56,709 43,087 76 31,598 73
2004-2005 57,444 41,662 73 31,226 75
2005-2006 60,820 43,647 72 32,964 76
2006-2007 59,654 42,759 72 32,841 77
2007-2008 57,239 41,630 73 33,269 80
2008-2009 57,668 41,573 72 34,679 83
2009-2010 57,122 43,275 76 37,055 86
2010-2011 55,227 40,807 76 35,790 88
(Statistical Bulletin Housing Series Operation of the Homeless Persons Legislation in Scotland: National and
Local Authority Analyses 2010-2011) [34]
22
Figure 1 Percentage of homeless applicants 2010-2011 who slept rough prior to asking for assistance [34]
23
The proportion of people rough sleeping in Scotland was in total 199 people per month
in 2010-2011. Three hundred and thirty two people, however, in 2008-2009 were
classified as being long-term rough sleepers [34]. These figures do not, of course, take
into accounts forms of homelessness other than rough sleepers. Therefore, by the end
of 2004, the, then, Scottish Executive estimated that 1,624 households were living in
hostel accommodation [33]. Furthermore, 4,238 households were housed in longer
stay temporary accommodation, i.e. temporary accommodation provided by local
authorities, associations and private landlords [33]. By 2008-2009 10,053 households
were in temporary accommodation [34]. This included long-term ‘sofa surfers’, those
residing in hostels, bed and breakfast accommodation and caravans/mobile homes.
Two thousand, three hundred and fifty-nine people leaving prison and 1,078 people
from supported accommodation were homeless and applied for housing [34].
2.1.32 Prevalence of homelessness in Scotland
The charity ‘Crisis’ estimates current numbers of homeless in Scotland to be in the
region of 59,000 [22] but, in common with other methods of estimating homelessness
levels, these figures are likely to represent an estimate short of the true numbers, with
the exact number of homeless people, present at any time in Scotland, being
essentially unknown. The prevalence of homeless people is further elevated by those
homeless living in insecure or inadequate housing. In addition, those who report to the
authorities that they are threatened with homelessness in the near future, i.e. the
potentially homeless, such as people living in women’s refuges, reception centres for
asylum seekers, and (youth) foyers. Furthermore, there is a group of people, whose
numbers are very difficult, if not impossible, to ascertain. These are those without
homes who are sleeping in different places from one night to the next, staying with
friends, and known as sofa surfers for example. This latter group of people are
accurately termed the ‘hidden homeless’.
24
Since there are so many different categories or ‘types’ of homeless people, all living an
alternate lifestyles, either through design or having been driven by circumstances - it
remains impossible to assess the true prevalence of homeless people in Scotland.
2.1.4 In summary
The existence of a variety of definitions and descriptors of homelessness provides
acknowledgement that there exists a diversity of forms of homelessness that can be
experienced, that the homeless are a disparate group of individuals, with the most
common meaning of the homeless experience being considered as being ‘without a
home’.
The technical descriptions are often used by local authorities and charities. It is
increasingly acknowledged, however, that there is more depth to the concept of
homelessness experience than the restrictive descriptors of ‘rough sleeping’ or
‘absolute’ homelessness. For example, the homeless experience can be broken down
further in descriptive terminologies into the ‘potential homeless’, i.e. those threatened
with homelessness within the near future (next two months [9]); the intentional
homeless, who are defined as those who have deliberately rendered themselves
homeless by:
‘doing or failing to do something which led to the loss of accommodation’ [9]
Additionally, the visible homeless [22], are those easily observed by society as they live
an openly homeless existence. The invisible homeless person, or hidden homeless
individual [22] may live a nomadic existence in common with ‘other homeless’ people,
but do so as they move from one type of short-term insecure housing to another. The
number of individuals affected by this type of homelessness is thus impossible to
ascertain, as they avoid ‘the system’ rendering traditional methods of counting
inapplicable. Furthermore, ‘homelessness’ is not always an absolute. It can be a
25
provisional, short-lived, or more long-term. It can be semi-permanent or a transient
arrangement. Individuals can be considered as being ‘new’ homeless or ‘old’ homeless,
depending on the duration of their homeless experience [35].
One of the features of homelessness is that it is not a static experience. Operating
within such a transient framework there can be no single definition of homelessness
applied as being completely apposite, nor can any true count of the homeless be made
as so many disparate, nomadic individuals are affected within a variety of settings. It
would follow therefore that if homelessness is a dynamic experience then people must
experience various forms of homelessness, throughout their lives, as well as having
different experiences of becoming homeless. The need to explore how social factors as
described in the various typologies impact upon people’s experience of social exclusion
and how this affects their pathways to homelessness requires to be examined in order
to appreciate the psycho-social dimensions of being a homeless person.
In summary, it is suggested that for the purposes of this thesis, the ETHOS typology [8]
will be adopted since it provides the most comprehensive characterisation of what it
means to be homeless while reflecting the dynamic nature of homelessness.
2.2 Homeless people, social exclusion and pathways to homelessness
2.2.1 Introduction
The degree to which an individual becomes socially excluded when homeless depends
on the extent, depth and duration of their homeless experience. In addition the lifestyle
context within which the homelessness occurs, along with the individual’s age when
this happens, are important indicators of social exclusion [36].
The links between health, homelessness and social exclusion will be examined in this
section of the narrative review. This will permit an improved understanding of the
26
causes and effects, and impacts of homelessness which in turn will inform the content
of a health descriptor for a typology of homelessness.
2.2.2 Social capital and social exclusion: definitions and concepts
The development of social capital as a concept has provided a means by which to
examine the roots of successful communities, and other partnership working alliances
such as civic programmes. The concept of social capital, where the informal relations or
connections between individuals and people are viewed as being valuable sources of
capital [37] has been advocated by theorists such as Bourdieu [38], Putnam [39, 40] and
Coleman [41].
Bourdieu [38] differentiates between economic, cultural and social forms of capital,
ascribing paramount importance to social capital with networking as its driver.
Recognising the importance of networking, Bourdieu [38] describes creation of
networks in deliberate terms, acknowledging that these valuable networks amongst
families and friends in the community are not automatically created and are often
consciously created or invested in by the members of the community.
Bourdieu [38], therefore, describes social capital in the context of social networks:
‘Social capital is the aggregate of the actual or potential resources which are
linked to possession of a durable network of more or less institutionalised
relationships of mutual acquaintance and recognition – or in other words to
membership of a group – which provides each of its members with the
backing of the collectively owned capital, a ‘credential’ which entitles them to
credit, in various senses of the word’ [38].
27
Putman [40], however, provides an alternative explanation. Putman visualises social
capital as being within the:
‘Features of social organisation that can improve the efficiency of society by
facilitating co-ordinating actions’.
It is here that Putman [40], deviates in his opinion regarding social capital from that
of Bourdieu. Unlike Bourdieu, Putman considers solidarity, equality, reciprocity and
engagement as important constituents of social capital since these factors emphasise
the role of networks in building social capital:
‘Social capital refers to connections among individuals – social networks and
the norms of reciprocity and trustworthiness that arise from them. In that
sense social capital is closely related to what some have called “civic virtue.”
The difference is that “social capital” calls attention to the fact that civic virtue
is most powerful when embedded in a sense network of reciprocal social
relations. A society of many virtuous but isolated individuals is not necessarily
rich in social capital' [40].
A third theorist, Coleman [41] adopts yet another position. Coleman [41],
emphasises the ‘facilitating economic capacity’ of social capital and suggests that
social capital is a tool: ‘For use in the analysis of social systems’
Coleman [41], therefore, defines social capital, not primarily in terms of networks but
in more wide-ranging terms of economic function and structure:
'Social capital is defined by its function. It is not a single entity, but a variety
of different entities, having two characteristics in common: they all consist of
some aspect of a social structure, and they facilitate certain actions of
individuals who are within the structure'.
Although Coleman [41] applies the concept of social capital within an economic
context, he appreciates that social capital is not limited in its use to this setting.
28
Coleman proposes that social capital can act in a variety of physical arenas, with its
actions being channelled through the domains of participation, altruism, trust and
sociability, which he theorises to be main domains of social capital.
Synthesising the views of these three theorists it is possible to consider social capital
as the economic, cultural and social forms of capital which are relevant to the
development of a community. Those communities with high levels of social capital
being perceived as capable communities working well within the context of
development. In this respect it may be postulated that this synthesis of the
theoretical positions of Bourdieu [38], Putnam [39, 40] and Coleman [41], mirror the
physical, social and legal domains of homelessness as described within the ETHOS
typology of homelessness [8].
Islam et al [42] describe social capital in terms of vertical and horizontal parameters.
Within Islam et al’s hegemony, three dimensions of social capital are said to exist,
which conceptualise social capital in terms of vertical and horizontal networks.
These are:
1. Bonding Social Capital:
Bonding social capital is a reflection of the social cohesion within groups
which is essential for getting by. It represents the exclusive networks within
specific groups of people which are horizontal between equals. Therefore,
bonding social capital is a horizontal form of social capital existing as a
marker of family, group or community interaction.
2. Bridging Social Capital:
Bridging social capital is also essential for getting on and reflects the
inclusive social networks across different and distinct groups of people. It is
considered to be a form of vertical social capital and is exemplified by the
formation of networks with people from groups beyond an individual’s
immediate social group.
29
3. Linking Social Capital:
Linking social capital is a subtype of bridging social capital. It is a form of
vertical social capital between groups of people of different socio-economic
groups in which the vertical networks link the powerless to the powerful. In
simple terms it reflects connections between unlike dissimilar people outside
the general community group [43]. Linking social capital has been considered
to be a reflection of the mutual trusting networks which must be in place to
allow those who are socially excluded (powerless) to access health-care from
professionals (powerful) [43].
The existence of social and trusting networks (social capital) within a society does not
necessarily render these social networks accessible to all. In fact it could be argued
that the positive gains advanced towards society by social capital networks, by their
nature lead to increased isolation for those whose community participation is low.
These so-called ‘outsiders’ become more isolated as they are left behind, with ever
changing social networks acting as a constraints for inclusion [41].
Therefore, people who have little access to friends and family (bonding social capital)
and/or who have little interaction with their neighbours or other groups of people
(bridging social capital) and are disempowered with regard to accessing services
(linking social capital) may experience such a degree of social isolation that they are
said to be are affected by social exclusion. Social exclusion is a multi-dimensional
definition of poverty [44], which may be considered the negative of social capital [43].
2.2.3 Social capital, social exclusion and homeless people
Groups of people affected by social exclusion are those who have impoverished social
networks and include people experiencing homelessness. Homeless people, living on
the edges of society, participate little and experience extreme isolation. Their isolated
existence may be enhanced little by the fact that they may have loose ties with the
30
settled population in the area in which they exist. Since there are many aspects of the
homeless person’s life which are transient the opportunity for building mutually
trusting networks with others is limited.
Therefore Burchardt [44], in his description of societal norms of participation in
activities such as consumption of goods and services, saving money and property,
engaging in socially valued activity, political activity, and social interaction with friends
suggests that these actions all, necessarily, undertaken by those well integrated into
society. For homeless people engaged in a daily struggle have little opportunity –
whether in terms of trust or self-esteem – to access services which require
empowerment and the ability to communicate with others or professional groups.
White [45] in an in-depth analysis of the concept of social exclusion identified four
dimensions which illustrated the various aspects of society from which a homeless
person would be excluded. These are:
1. Exclusion from civil society due to legal constraint or regulation e.g. those with
a criminal record experiencing work restrictions.
2. Failure to supply social goods to a group with special needs e.g. appropriate
accommodation for a family experiencing homelessness.
3. Exclusion from social production as a consequence of labelling groups such as
those experiencing homelessness as ‘undesirable’.
4. Economic exclusion from normal consumption, the lack of access to the normal
work routines of life.
These dimensions of social exclusion can all be applied to those experiencing
homelessness but different subgroups of homeless people, may be more affected than
others as described by White’s descriptors of social exclusion [37, 45]. It is likely that
some of the heterogeneity evident within those experiencing homelessness, it may be
proposed, is due to the varying degrees of social exclusion experienced by homeless
31
groups. The individual experiencing long-term or chronic homelessness, for example,
has become increasingly isolated and experiencing a greater degree of social exclusion
than others (e.g. statutory homeless), and will, in addition, be economically excluded
from society. These variations often exist due to the particulars of the homeless
lifestyle, such as described within the various typologies of homelessness, and the
pathways taken into homelessness. The homeless experience therefore should be
conceptualised and evaluated in the context of social exclusion since this will improve
the understanding of what it means to experience homelessness and to be without a
home.
2.2.4 Social capital, social exclusion and health inequalities
Putnam [46] suggested that a relationship existed between social capital, social
exclusion and health inequalities with the degree of social capital experienced by an
individual either ameliorating or exacerbating the individual’s experience of health
and illness.
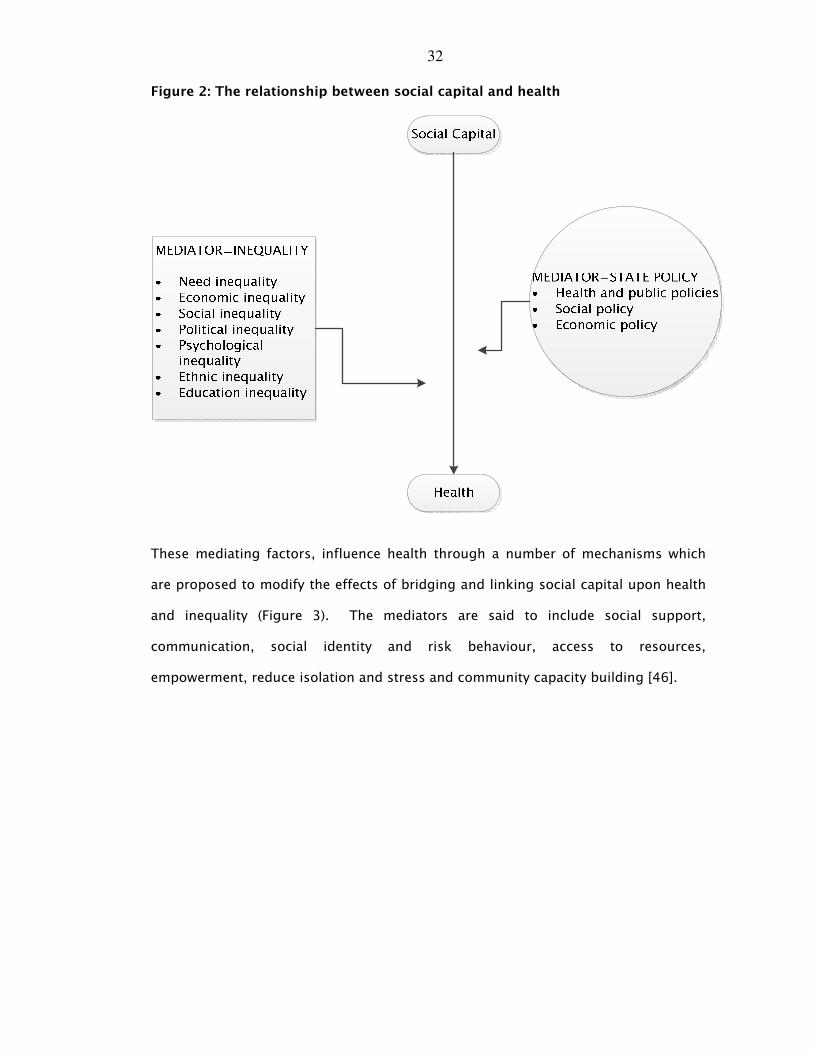
Putnam writing in 2004 [46], attempted to explain this interaction by suggesting
that a complex interaction existed between social capital and health in which the
State (external issues) and Inequality (internal issues) acted as mediators (Figure 2).
These internal and external issues, according to Putnam, have the potential to have
positive or negative impacts on the health of individuals within a community.
32
Figure 2: The relationship between social capital and health
These mediating factors, influence health through a number of mechanisms which
are proposed to modify the effects of bridging and linking social capital upon health
and inequality (Figure 3). The mediators are said to include social support,
communication, social identity and risk behaviour, access to resources,
empowerment, reduce isolation and stress and community capacity building [46].
33
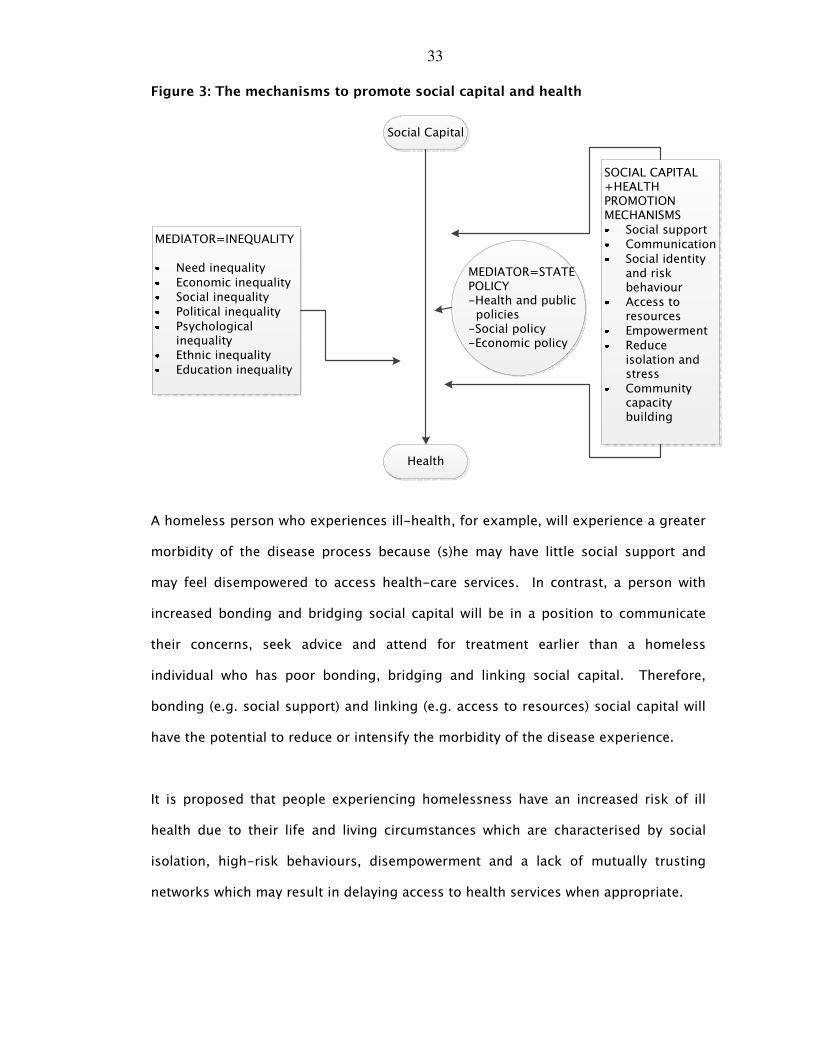
Figure 3 : The mechanisms to promote social capital and health
Social Capital
Health
MEDIATOR=STATE POLICY-Health and public policies
-Social policy -Economic policy
MEDIATOR=INEQUALITY
Need inequality
Economic inequalitySocial inequality
Political inequality
Psychological inequalityEthnic inequality
Education inequality
SOCIAL CAPITAL +HEALTH PROMOTION MECHANISMS
Social supportCommunication
Social identity and risk behaviourAccess to resourcesEmpowerment
Reduce isolation and stressCommunity capacity building
A homeless person who experiences ill-health, for example, will experience a greater
morbidity of the disease process because (s)he may have little social support and
may feel disempowered to access health-care services. In contrast, a person with
increased bonding and bridging social capital will be in a position to communicate
their concerns, seek advice and attend for treatment earlier than a homeless
individual who has poor bonding, bridging and linking social capital. Therefore,
bonding (e.g. social support) and linking (e.g. access to resources) social capital will
have the potential to reduce or intensify the morbidity of the disease experience.
It is proposed that people experiencing homelessness have an increased risk of ill
health due to their life and living circumstances which are characterised by social
isolation, high-risk behaviours, disempowerment and a lack of mutually trusting
networks which may result in delaying access to health services when appropriate.
34
2.2.5 Categorising homeless people in the light of social exclusion
As stated previously, there is the idea that people who experience homelessness have
been considered to be a homogenous group; however, by acknowledging the
heterogeneity inherent within the homelessness experience, the effect and influence of
homelessness within the life course may be examined. The following section examines
the influence of homelessness throughout the life course – from children to older
people and the influence this has upon physical health and psycho-social well-being.
2.2.51 Homeless children
In the homeless setting, the lifestyle experienced by homeless children can be seen as
one of the most isolating and impoverishing. Becoming homeless at a early stage in life
can have a profound impact upon the child’s physical and psychological development
[36].
The child’s physical and emotional development can be significantly affected or
completely disrupted by the impacts of homelessness. Developing against a backdrop
of poverty, instability and deprivation, which characterises the homeless experience,
can destabilise the development of healthy behaviours and habits such as attendance at
vaccination clinics healthy eating and oral hygiene, increasing experience of dental
disease [47-49]. Thus the patterns of development associated with making
relationships are disrupted and the opportunities for the consolidation of societal
norms and values missed. The impoverishing effects of homelessness are magnified
when a child experiences such poverty and instability, whether they are alone, as in the
case of the homeless youth, or as part of a homeless family. Children’s experience of
homelessness contributes to a potential breakdown in the development of mutually
trusting networks and acts to exacerbate the isolating effects of social exclusion.
35
Childhood experience of homelessness, has physical and psychological health
consequences throughout the child’s life [50]. The effect of being young and without a
permanent home may increase the tendency for increased ill-health and the adoption
of risk taking behaviours. Therefore the homeless lifestyle, for younger people will
have consequences for their physical and psychological health as well as the adoption
of health behaviours, all of which are developed during these early, formative years and
retained throughout life, even if the child’s housing situation improves.
2.2.52 Homeless families
The majority of homeless families, within the UK, are single-parent families and
primarily consisting of women and their children fleeing abusive partners as a result of
domestic violence [51]. Women fleeing from an abusive partner with her children
ensure that they will be safe from physical, emotional and/or sexual abuse and enter
women’s refuge or place of safety [52].
Despite the woman’s best intentions she may leave herself open to accusations of
bringing her children into an unstable or unfit living environment of emergency
shelters or bed and breakfast accommodation. The alternative option of leaving
children in the care of relatives or friends brings the equally serious risk of being
accused of abandonment. As a result, and in common with the homeless youths, the
mother at the head of the abused family has often been left with no other option,
effectively voluntarily rendering herself and her dependants into homelessness [50, 51].
Using the ETHOS [8] typologies of homelessness, such a family would be described as
‘houseless’ whereas using the Scottish Government’s [16] descriptors of homelessness
the woman and her children would be described, in addition to being ‘houseless’, as
‘intentionally homeless’.
Perhaps because of the sense of vulnerability of the single-family and/or the decision
to become homeless, this particular pathway into homeless may result in the family
36
being ‘broken-up’ with children forced into care or the family as a whole being re-
housed in an unfamiliar area. With fears of discovery and the feeling of being an
‘outsider’, there is little opportunity for building trusting social networks.
Consequently, there is the potential for social isolation and the detrimental effects of
social exclusion upon the health of the parent and her children [39].
2.2.53 Homeless single people
The vast majority of the homeless people are adult men [53]. Single homeless women,
are not only fewer in numbers, but also less visible on the streets and in hostels.
Whether these findings by Casavant [53] and Tessler et al [54] are an accurate
reflection of the gender difference in the prevalence of homeless people or whether it is
because there are a reduced number of shelters and street services available to single
female homeless, is a matter of some debate and once more raises the question with
regard to the actual number of people who experience homelessness.
Another factor to be taken into consideration is the safety concerns of the single
homeless individual. Single homeless people are frequently the victim of assaults and
the unaccompanied homeless woman is arguably the most vulnerable to attack,
particularly when sleeping rough. Ironically, single women (as mentioned in the
previous section) have often been rendered homeless as a consequence of domestic
violence, however, becoming homeless exposes them to the risk of more violence,
perpetuating their fears and exacerbating their mental-ill health difficulties [55]. These
social and health issues tend to dissuade the single homeless person from integration
into a community, with anxiety and depression acting as significant barriers to
inclusion [55].
A group of single people who are included within those categorised as socially
excluded are migrant workers. The migrant worker often experiences homelessness as
a result of insecure work, paying the gang master and sending large portions of their
37
income home to support relatives. When their employment is terminated, their
accommodation is lost and with little access to money or savings to purchase a ticket
home they become homeless [51].
2.2.54 Homeless ‘older’ people
Older homeless people may be thought of as the public face of homelessness. The
image of the long-term homeless man tends to conform to a national stereotypical
homeless conception. However, this is a misconception. ‘Older’ homeless people are
the most visible group of homeless people, hence the stereotypical ‘bag-lady’ or park
vagrant image, their health and appearance having suffered as a result of their unstable
lifestyle [57]. The majority of ‘older’ homeless people are not new to the homeless life
and have been living a vagrant existence for years. Interestingly, there are now,
sheltered accommodations and care homes specifically available to this group of
people experiencing homelessness [57].
Although many ‘older’ homeless people may be categorised as ‘chronically homeless’
there are a group of older people who despite the apparent abundance of
accommodation options for this age group, are in a vulnerable housing situation, which
is exacerbated by the current economic recession [57]. For instance, with ever-
increasing fuel bills create financial problems for older people who are reliant on their
fairly static pension. The most obvious impact of is the creation of ‘fuel poverty’, and
as with other vulnerable groups, a combination of events can act to destabilise their
housing situation.
‘Older’ homeless people are those most keenly affected by health problems, often
building up at least partly as a result of their chronic vagrancy and long-term smoking
and alcohol-related problems. However, although the ‘bag-lady’ may appear as ‘older’,
she may not be as old as she looks. In chronological and societal terms the so-called
‘older’ homeless person is actually relatively young. The homeless experience is
38
detrimental to both health and life expectancy, with studies showing an average
lifespan of forty-two years [58] for those experiencing homelessness compared with
the normative lifespan for the UK population of 77 years [59]. Therefore the ‘older’
homeless person in terms of society as a whole is in fact entering middle-age.
Chronic homelessness [60] is said to be associated with vagrancy, mental ill-health,
addictions and the experience of such intractable material and emotional poverty
confers the greatest degree of isolation and social exclusion upon this group of
homeless people. Consequently, the impacts of social exclusion on health such as the
ability to access health services are magnified resulting in poor quality of life and
reduced life expectancy.
2.2.55 Categorising homeless people in the light of social exclusion: concluding
comments
The experience of homelessness is, therefore, detrimental to health at every stage
throughout the life course. It may be suggested that in childhood exposure to risk
taking behaviours and instability in family life results in a poverty not just in material
terms but also with regard to the ability to cope with stress and emotional difficulties.
Young people growing in this impoverished world may adopt risk taking behaviours,
increasingly experience society in a cloak of mistrust. This sets the scene for the
young person to become ever-more isolated and excluded as they start on a pathway
into the world of homelessness.
2.2.6 Pathways to homelessness in the light of social exclusion.
Considering the effects of homelessness upon the life course, homelessness has been
described as being a ‘career process’ [28, 61] which is conceptualised as the inevitable
path towards homelessness, but in its correct context this descriptor can be employed
to enable a model of ‘homeless phasing’ to be envisaged where intervention and
39
prevention can be successfully employed during periods of relative stability.
Homelessness, therefore, can be conceptualised in terms of its dynamism; with the
individual’s homeless situation being perceived as being in a state of flux. Mayock
aptly uses the term ‘career’ to describe the turbulent pathways to and through
homelessness taken by the younger homeless people [61].
Therefore, in common with the variety of ways in which the homeless can be defined,
there are said to be a number of ways in which people can be rendered homeless [11].
2.2.61 Pathways to homelessness: mental ill-health
Everyone is vulnerable to homelessness, though undoubtedly some are much closer to
the edge than others. It has been estimated that the average person is only two pay-
cheques away from homelessness [62]. Not everyone however, becomes homeless. An
individual’s psychological coping skills, social contacts, mutually trusting networks and
organisational skills all play a part in preventing them entering a pathway into
homelessness. The possession of emotional strength and social expertise (social
capital) will have a positive effect - in other words the potential for homelessness can
be mediated by the mechanisms known to intervene between social capital, social
exclusion and health. Therefore it may be suggested that a continuum exists between
those who cope in the face of adversity and who do not.
Frequently people who experience social isolation and who are faced with a myriad of
problems lose their accommodation, due to the occurrence of apparent manageable
but additional problems. Unable to cope with the stress of small debts, for example,
they may be left unattended and as the situation becomes unbearable the individual
becomes ever more isolation, adopts risk-taking behaviours and becomes
homelessness. This proposition, that it is an individual’s ability to cope with stressful
life events, is supported by the work of Sullivan et al [63]. They suggest that mental
ill-health increases the risk of someone becoming homeless but it is the combination
40
of risk factors of childhood deprivation and disruption which provide the impetus for
homelessness. Therefore Sullivan et al [63] state that:
‘Taken as a whole, our analyses do not support the notion that mental illness
represents a distinctive pathway to homelessness but rather that the
relationship between mental illness and homelessness is both complex and
dynamic.’
In summary, people with mental ill-health, who have experienced considerable
deprivation and disruption in childhood, are those unable to cope with the daily
struggles of life and may be propelled into homelessness. Their emotional difficulties
when coping with life’s stresses and the adoption of risk-taking behaviours result in
them entering a pathway to homelessness from which it is difficult to escape [64, 65].
2.2.62 Pathways to homelessness: reciprocity.
Reciprocity exists for many of the causes and effects of homelessness such as poverty
and/or involvement with drugs and criminality [66] in the sense that in addition to a
factor being a cause of homelessness it can equally be an effect of homelessness. For
example, criminality can be a pathway into homelessness (e.g. loss of accommodation
following incarceration or homelessness on release from prison [67]). Equally, homeless
people are frequently forced to consider illegal actions as a way of obtaining food or
other resources. In addition, they tend, through their life on the streets, to have contact
with the type of people who conduct their business on the street – such as drug
dealers. This provides the vulnerable homeless person with easy access to drugs and
cheap alcohol, substance abuse being the means by which homeless people cope, and
blunt the pain of a harsh reality [61].
Mayock and O’Sullivan’s [61] conversations with homeless youth in Dublin illustrate the
role of reciprocity as a pathway to homelessness, as these young people describe the
ease with which they slipped into illegal drug dealing whilst homeless. For some,
41
avoidance of these behaviours whilst living on the streets was more difficult than
adopting them, because apart from the usual peer-pressure, threats of violence were
implicit for those who refused involvement [61].
The same reciprocal relationship is true for ill-health, with illness having the potential
to act as an entry point on a route to homelessness as well as being a effect of
homelessness: the health of the homeless person often deteriorating as their living
conditions fall far below the ideal [68, 69].
2.2.63 Pathways to homelessness: relationship breakdown.
A common example of a pathway to homelessness is relationship breakdown [11].
Mayock and O’Sullivan [61], in their work with homeless young people convincingly
showed that although an adolescent has left the family home due to disagreements
(s)he remains in touch with, their parents returning when the conflict is resolved. The
existence of close ties with family members has the potential to alter the outcomes for
the young homeless runaway with many young people vacillating between
homelessness and the family home [61].
The trigger for the shift towards homelessness can be an unsettled home life where
intolerable situations in the home mean that self imposed exile is a better solution. It
may happen as a result of difficulties encountered during the adolescent struggle, or
getting in with a ‘crowd’ who act to encourage the individual to join them in their
homeless lifestyle. This pathway to homelessness is linked with petty crime, drugs or
alcohol. This can be considered as being similar to becoming involved with a gang; in
the same manner that an adolescent who is affected by gang intimidation or violence
can end up joining that gang as a self-protective reaction. Alternatively, those who
observe homelessness can see that as being a ‘cool’ lifestyle to follow [61].
42
Other pathways to homelessness can be less predictable, for example relationship
breakdown can often lead to one of the partners having to leave the shared home [54]
as a result of violent behaviour as mentioned previously in women and their who
become intentionally homeless as a consequence of abusive partners.
2.2.64 Pathways to homelessness: unemployment and financial hardship
Homelessness can conversely be conceived of in terms of being a downward spiral, i.e.
a ‘spiral of descent’ into homelessness from a previously stable settled existence. The
trigger for this pathway can be an external impact, outside the control of the individual
affected. An example of this would be where someone who has held a steady job loses
the job then loses their home shortly afterward as their income dries up. The pathway
to homelessness from this point of unemployment can be a straightforward ‘direct’
consequence of job loss as described above, or it can be a convoluted process with
several progressions and regressions (or recoveries) along the road to homelessness,
mirroring periods of employment and unemployment.
Whilst there are many paths to homelessness there are some commonalities linking
these paths. Intractable poverty offers one of the main threats in this context, with a
number of the followers of pathways into homelessness distinguishable by their
indigenous status [49]. Financial hardship is often a recurring theme in rendering
people homeless [52, 53]. Many people, including families, can be considered as being
at risk of homelessness, by virtue of their circumstances, financial or otherwise, which
leads to them becoming unable to afford to access housing [54].
In the case of older people, in general, and homeless people, in particular, lack of
money in conjunction with the loss of social contacts, and other emotional traumas can
combine with physical factors such as the onset of acute infections, memory loss to
affect their ability to cope [57, 70]. Financial issues, therefore, act in a synergistic
43
manner, with the co-morbidities of older age to hasten a descent towards
homelessness in those vulnerable to emotional distress [43, 44].
2.2.65 Pathways to homelessness: crime and imprisonment.
About a third of prisoners prior to release stated that they had nowhere to live [71].
The pathway to and from crime and prison to homelessness, however, is a complex
journey. Kushel et al [67] suggest that within the prison population there are higher
numbers of people who are experiencing homelessness. Moreover those who have
been in prison have a higher propensity to become homeless on release. In agreement
with Sullivan et al [63], Kushel et al [67] propose that it is the childhood experiences of
‘deprivation and disruption’ and current risk-taking behaviours which act as
precipitants to conviction and custodial sentences. Therefore, on being released from
prison with nowhere to go, the vulnerable individual may return to old ways and
become associated with drugs and/or alcohol misuse, or as a result of other links with
criminality [65], return to prison. To quote Kushel et al [67] there is a ‘revolving door’
between prison and homelessness and prison:
‘The association between homelessness and imprisonment is bidirectional:
imprisonment may precipitate homelessness by disrupting family and
community contacts and by decreasing employment and housing prospects’.
This complex pathway into and out of homelessness has been described by Seymour
[72] as ‘the recurring cycle’ and supporting Kushel et al [67]. Seymour [72] states that a
time in prison increases the probability of entering into a state of chronic homelessness
since time in prison is associated with increased difficulties in reintegrating into society
since the inmate has become more reliant and dependent upon routines during their
time of imprisonment. When this is coupled with difficulties in finding housing and
work, the likelihood for homelessness becomes greatly increased.
44
2.2.66 Pathways to homelessness: gender dimensions.
Patterns can repeat themselves in the various pathways to homelessness with
commonalities evident in the ways that different individuals describe their own journey
into homelessness. When asked to what they attribute their homeless status, male
respondents tended to cite job loss, release from institutions such as prison, mental ill
health and alcohol as the main triggers for homelessness [54]. The men’s answers
tending towards money related or financial factors, with the women more likely to
attribute their homelessness to a breakdown-like schism with those who previously
supported them, i.e. a loss of social support or emotional links [64].
As mentioned previously, and included here for completeness, women tend to attribute
their pathways to homelessness as a result of relationship conflict, and withdrawal of
help from those close to them [54]. Women’s responses provide an interesting insight
into how the homeless themselves perceive their own descent into homelessness [64].
2.2.67 Pathways to homelessness lifestyle choices
There are some homeless people who claim to have chosen their lifestyle [4]. They may
have developed friendships with people who are already homeless and, having become
involved in such a way, developed such strong ties to the homeless community in a
certain area, may elect to render themselves homeless. Those reporting becoming
homeless in this manner describe it in nonchalant terms of a smooth, apparently
inevitable transition into homelessness, where it seemed more sensible to give up their
settled existence and accommodation as they were spending most of their time away
from their home anyway. For these people the links with their homeless friends were
stronger than their connections to family or settled friends, so entry into the homeless
community seems manifest rather than illogical. Their lives already contained such
hardship that the difficulties of a homeless existence did not appear to be any great
sacrifice by comparison [11].
45
However, voluntary homelessness is not the norm and intentionally or willingly making
oneself homeless is rare [28]. It could be possible that some of those who claim to
have become voluntarily homeless had, in reality little choice and elected to describe
themselves in such terms as a way of taking ownership of their lives, or protectively
covering up their true emotions.
The vast majority of homeless people have become so because of changes inflicted
upon them by circumstance [28]. It could be argued that sometimes ill-advised life
choices have consequences, one of which can be homelessness, and people can thus
contribute to their homeless status. In reality, these consequences are not always easily
foreseeable, nor are they always straightforwardly preventable.
2.2.7 Conclusions
Different people are affected by social exclusion in differing ways, dependent on their
individual circumstances. The extent to which they are affected is relevant to their
economic status, health status social relations and other factors such as immigration.
The varying degrees of social exclusion and reduced social capital experienced by these
groups of people have the potential to assist in an improved understanding of the
heterogeneity which exists within homeless populations.
With regard to pathways to homelessness, these should not be regarded as a road to
some inescapable fate, but should be seen as a two way street, where there is potential
for prevention but which is unpredictable, due to the homeless person’s fluctuant
lifestyle. Homelessness is, therefore, not perceived as an inevitable outcome following
a predictable downward descent into homelessness, rather it is perceived as being a
reversible process, with the potential for intervention and change. This new
conceptualisation of homelessness is used to differentiate and categorise homeless
people into those who are ‘chronically homeless’ (for example, older homeless people),
46
the ‘cyclically homeless’ (for example, prisoners) and the ‘temporarily homeless’ (for
example, women escaping abusive relationships) [68].
The existence, therefore, of a variety of pathways to homelessness results in
homelessness affecting a great variety of people, with differing impacts, with the result
being a diverse population of disparate individuals affected by similarly harsh
circumstances. There are themes common to experience of this disparate set of
individuals, which can be seen to contribute to their homeless status. Destitution and
displacement are the main common denominators, but other issues present with great
regularity: a lack of support from family [54], a lack of support from authorities [57],
and a lack of knowledge on how to access available support structures [57]. Pathways
in and out of homelessness have the potential to impact on the homeless person’s
health and health-care provision and an understanding of that homeless individual’s
trajectory through homelessness can help with health-care planning.
2.3 General health of the homeless populations
2.3.1 Introduction
The poorer level of general health which affects homeless people is said to be due to a
factors, which combine and act to form barriers to health care access and provision.
Therefore in order to understand the relationship with regard to accessing health-care
it is necessary to examine the homeless individual’s health as well as their experience
of health-care. This section, therefore, aims to provide an overview of the relationship
between homelessness, health and health-care. A brief synopsis to illustrate the effect
of homelessness upon access to health-care, physical and psychological health and
social well-being will be presented.
47
2.3.2 Access to healthcare
As early as 1990, Weitzman et al [50] proposed that the homeless person who had no
apparent daily routines and little physical comforts, would leave relatively minor
medical problems unattended. The health problem, Weitzman et al [50] suggested,
needed to escalate and the symptoms to become increasingly acute before the
homeless person would be in a position to address it. Consequently, Weitzman et al
[45] proposed that the pain and discomfort threshold was much higher for some who
experienced homelessness than for the housed, settled individual. Cattell [73] agreed
and suggested, that for homeless people the worse their social conditions the greater
the levels of ill-health experienced, and in keeping with and to paraphrase Hart [74] the
treatment received was less and not commensurate with their degree of need. Welsh
and Pringle’s [75] tripartite formulation of social capital further supported the
suggestion that social exclusion acted as a key factor with regard to homeless people
accessing health-care services.
Figure 4 [76] is a modified version of Welsh and Pringle’s [75] framework regarding the
relationship between accessibility factors [77] targeting of health services, social capital
and accessing health-care. Inherent in the structure of social capital with regard to
accessing health services are the key and complementary elements of structure and
process. Since structure provides an opportunity for social networks and process is
related to the health behaviours undertaken by an individual then it is the combination
of structure and process which allows an understanding as to why homeless people do
not access health-care – it is the lack of mutually trusting networks which act as a
profound barrier to accessing and the appropriate use of health services [78].
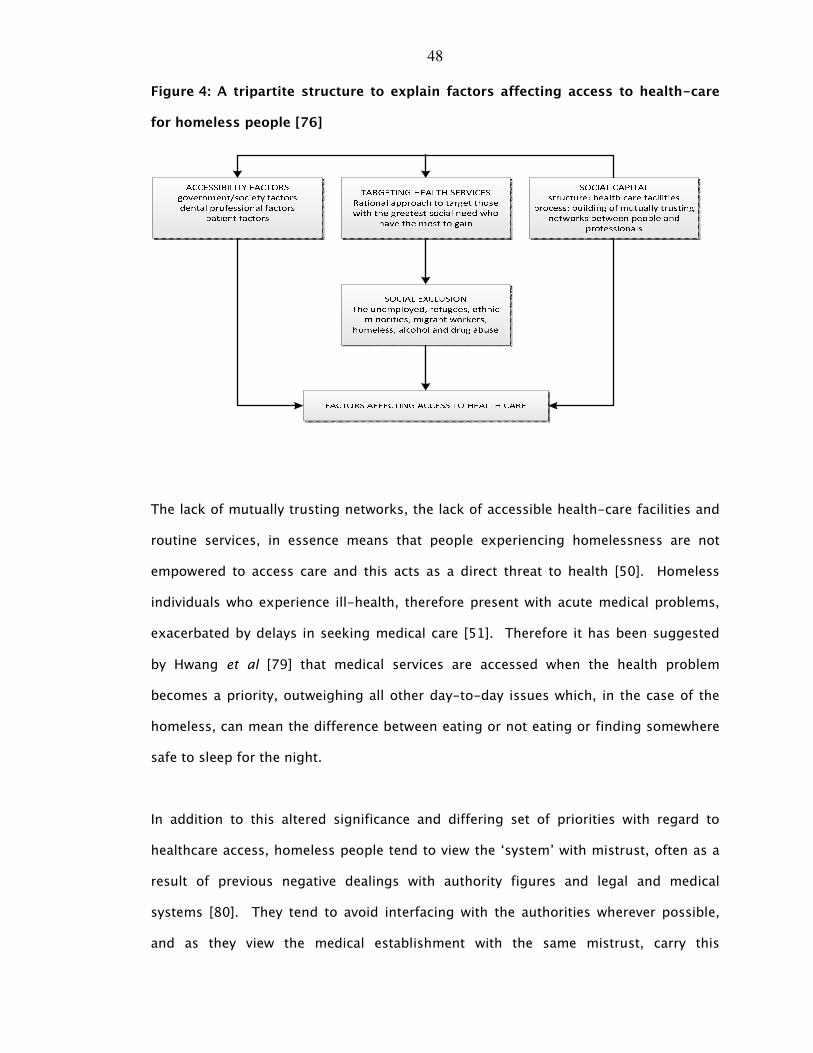
48
Figure 4 : A tripartite structure to explain factors affecting access to health-care
for homeless people [76]
The lack of mutually trusting networks, the lack of accessible health-care facilities and
routine services, in essence means that people experiencing homelessness are not
empowered to access care and this acts as a direct threat to health [50]. Homeless
individuals who experience ill-health, therefore present with acute medical problems,
exacerbated by delays in seeking medical care [51]. Therefore it has been suggested
by Hwang et al [79] that medical services are accessed when the health problem
becomes a priority, outweighing all other day-to-day issues which, in the case of the
homeless, can mean the difference between eating or not eating or finding somewhere
safe to sleep for the night.
In addition to this altered significance and differing set of priorities with regard to
healthcare access, homeless people tend to view the ‘system’ with mistrust, often as a
result of previous negative dealings with authority figures and legal and medical
systems [80]. They tend to avoid interfacing with the authorities wherever possible,
and as they view the medical establishment with the same mistrust, carry this
49
avoidance through to their dealings with health professionals [53]. In the same way,
many homeless people have experienced prejudice in the past when seeking medical
care, both in hospital and general practice settings. They report discriminatory
treatment prompted by such factors as their appearance or medical history details [2]
and concerns regarding confidentiality. Beaulieu et al [78] would perceive this as a lack
of mutually trusting networks as a consequence of a lack of structure and process with
regard to accessing health-care.
Such experiences do not encourage them to seek medical care again, as they have no
desire to repeat such a negative encounter. These experiences act as perceived barriers
to care, where subsequent to such an experience, the homeless individual delays
seeking medical care due to their lack of understanding of systems or their reluctance
to interact with the system [53].
For certain categories of homeless individuals who have become isolated from society,
who live on the margins of that society, with apparent minimum routines and an
absence of trusting social networks the diagnosis of physical ailments may be delayed
and impeded by a lack of health knowledge on the part of the individual [81]. The role
of health literacy is increasingly being shown to act as a barrier to care and conspires
against some homeless people, accessing health-care. Poverty, poor health literacy,
lack of access to accessible health information may have a indirect, detrimental effect
on health [65].
A combination of a number of disadvantageous factors, therefore, conspires and
reduces the quality of life and diminishes life expectancy for those experiencing some
forms of chronic homelessness [82]. The projected lifespan for those experiencing
homelessness is now accepted as being much lower than for the settled population
[83].
50
2.3.3 Physical health
Studies investigating the impact of homelessness on health have shown that the levels
of disease experienced by homeless people reflects the degree to which the individual
is isolated from society [84].
Medical problems experienced by homeless people often occur earlier in the life cycle
when compared with the general population, and this is particularly true for those who
experience childhood and/or adolescent homelessness when deprivation impacts upon
growth and maturational factors which determine long-term health [54, 57]. As
mentioned earlier poor diet, lack of immunisation against childhood infections, and
exposure to a high-stress environment all have consequences for physical health status
in later life [41-43]. Nonetheless, according to Berman et al [52] the increased
prevalence of ill health in young homeless people is a result of the young homeless
person being unable to access information and to use social networks to facilitate
diagnosis, attend health services and recovery from illness [61].
Homeless people have a higher experience of disease compared their settled
counterparts, with some studies showing that over 50 percent of homeless people
suffering from serious health conditions such as asthma or Chronic Obstructive
Pulmonary Disease, and substance abuse-related illnesses [24]. Although, homeless
people are a disparate and heterogeneous group, there are a range of health issues
that have been shown consistently to affect larger numbers of homeless individuals
compared with the population at large. These conditions include cardiovascular
disease and mental illness [2, 13, 18, 85, 86].
The incidence of concomitant illness is also high within homeless populations, with 18
percent of homeless people having been found to be suffering from four or more
serious illnesses at a given time [30].
51
Homeless people typically experience foot problems, such as trench foot, which are not
otherwise common in the general population. This is due to a combination of poor
hygiene, lack of clean clothing and feet, which are continually exposed to damp
conditions [13]. Ill-fitting shoes, combined the fact that they tend to be ambulatory for
long periods during the day, conspire to increase the homeless’ suffering of painful
foot conditions such as blisters or bunions. Further, experience of diabetes and other
illnesses requiring long term management, can render the homeless person susceptible
to sequelae such as tissue necrosis, which arise due to limited self management of
their condition [13].
Outcomes of treatment in disease intervention often depend on awareness, early
intervention, or better still, prevention. These factors, acting as barriers, and working in
tandem with the detrimental effects of social exclusion as described above, can have a
profound impact on treatment outcomes. Homelessness also has an impact upon the
recovery from disease. Thus, acute flare-ups of chronic illnesses are common, leading
to an over-dependence on emergency services [83]. This dependency has a
detrimental effect on health and continuity of care, setting up a vicious circle of
inappropriate healthcare use and acute exacerbations of chronic ill health [36].
Therefore, it may be suggested, that in the same way there is a heterogeneity in those
who experience homelessness, there is also a variation in the degree of ill health
experienced by those characterised as homeless [48]. Not all homeless people
experience social isolation to the same degree as others – there are some who have
poorer bonding (family ties), bridging (community ties) and linking (access to health
services) social capital and are thus more isolated and so have an increased disease
experience [2, 87].
52
As Putnam [46] has proposed it is the mechanisms of isolation, poorer communication,
social identity together with an inability to access health-care, due to feelings of
mistrust and disempowerment, which influence the relationship between homelessness
and physical illness. Consequently, being socially excluded [42,46] means that
homeless individuals’ communications and social interactions with people in their
communities are reduced, and there is an inefficacy or lack mutually trust in any
potential support network. Thus homelessness and the social exclusion and isolation
that comes in its wake, are essential criteria for the homeless person to have an
increased experience of ill health and protracted recovery from disease [79, 88].
Therefore, social exclusion, together with feelings of disempowerment and perceptions
of discrimination [89] means that social networks are impoverishment rendering social
exclusion as an increasingly important factor impacting upon the disease experience of
homeless people [43].
2.3.31 Physical health: environmental impacts
The lack of basic life essentials experienced by homeless people has the potential to
impact upon their health in other more esoteric ways. In describing the needs of the
individual and ranking them in order of the potency, Maslow [90] postulated that these
needs could be placed in a hierarchy, with the more primitive needs, forming the lower
tiers of the hierarchy, requiring fulfilment before other need can be addressed or met.
In this hierarchical view Maslow postulates that basic physiological needs must be met
in order for the individual to be able to focus on other issues, such as security of
resources and needs relevant to health.
Sub-standard living conditions, for instance, where damp and mould breed may lead to
a high incidence of respiratory diseases, particularly in the winter months. Cramped,
unfit for habitation makeshift shelters, or derelict buildings are detrimental to health
and in such conditions, where people are living together in close proximity, infectious
53
diseases, like tuberculosis can spread quickly [91]. The lack of sanitation facilities
results in poor hygiene which may promote the spread of parasites and infections [13].
Therefore the lack of basic resources may assist in further explaining why some
homeless people attribute a low priority to their health needs.
2.3.4 Psychological health and social wellbeing
The impact of stress upon psychological health is well documented and considered as
important in both the incidence of disease and the recovery from illness [92].
Homeless people experience a high degree of stress. One of the factors contributing to
these stress levels is the constant threat of attack from random passers-by or from
‘other homeless’ people in disputes over territory or competition for shared resources
or possessions. This high experience of violent attack is another reason why homeless
people tend to have a high usage of emergency healthcare. It also explains why the
long-term homeless tend to withdraw further and further from society as their negative
experiences render them mistrustful of others and drive them away from society,
contributing to their experience of social exclusion.
Studies have shown that there is a high incidence of mental illness in homeless
populations [61, 65, 86, 93]. It is conceivable that individuals, who in previous years
would have been institutionalised, now live on the streets due to their reduced capacity
to interact with society, and conform to the expected societal norms and standards.
The relationship between mental ill-health and homelessness is a reciprocal affair, with
mental health being related to both the cause and effects of homelessness. In this
context, there are associations to be made to the mental health of those individuals
affected by homelessness. Certainly there is a high degree of reciprocity between
experience of homelessness and experience of mental ill-health [65]. Questions
54
remain, however, as to which is the causal factor and which is the outcome. Does
mental illness predispose to homelessness, or does the homeless experience place
such stress on an individual that their mental health is at risk? Despite clear evidence
of a high incidence of mental disease amongst homeless populations [55, 59, 81, 86],
the exact relationship between these issues remains unresolved.
The symptoms of depressive and psychotic illness have been shown to be linked with
homelessness and quality of life [89]. Improvement in quality of life, as related to a
reduction in the period of time spent as homeless, has been shown to correlate with a
reduction in the symptoms of psychotic and/or depressive illness. The duration of the
homeless experience is considered as being a modifying factor in the extent to which
psychological illness impacts upon homeless people, in particular homeless youths
[95]. It has been estimated that major depressive illness affects up to 42% of the
homeless population [7]
2.3.41 Substance misuse
Homeless people have a high incidence of high risk behaviours, which they may have
adopted as a reaction to emotional difficulties and/or stressful lifestyles which may
have contributed to rendering them homeless in the first instance. Contact with others
in the same situation as themselves can also be damaging to the health of the
homeless person, when this contact exposes or introduces them to drug use, or other
substance misuse behaviours, such as smoking [10]. Drug dependence affects up to
54% of homeless people [7]. Shared needles and other high-risk behaviours, such as
habitual drug use, can lead to transmission of blood-borne viruses such as HIV and
Hepatitis [96]. In common with other factors such as depression and poverty, there is a
reciprocal relationship between substance misuse and homelessness, with some people
finding themselves homeless through drug or alcohol use, and others turning to drugs
or alcohol because of, or as a result of exposure to drugs or alcohol during the
homeless experience.
55
Unfortunately, these behaviours which are frequently used as a coping mechanism can
also lead to reduced life expectancy. Abuse of drugs, alcohol and smoking are
detrimental to health and undoubtedly contribute to the reduced life expectancy
observed in this group of individuals [95, 97].
2.3.5 Conclusion
Therefore, in conclusion, whether or not those affected by homelessness are young,
single or part of a homeless family the homeless lifestyle exacts a price. The impact of
social exclusion on health behaviours, ill-health experience and provision of health-
care for homeless populations is profound and is challenging to overcome. The life
experiences of homeless people and the homeless lifestyle can act as barriers to care.
In provision of health-care to overcome these barriers must be developed. A
knowledge and understanding of the composition, lifestyles and needs of the
population is essential information required in the planning of any models of health-
care delivery for this diverse, yet vulnerable population. Whilst the physical
circumstances of the situation a homeless person is living in has the potential to impact
upon their health, the precise impacts of such diversity of lifestyles and living situations
is not, as yet, quantified.
56
2.4 The oral health of the homeless
2.4.1 Introduction
The oral health of homeless people has been shown to poorer than those of
comparable individuals within the general population in the United Kingdom [11, 70,
98], America [4, 96], and numerous other countries such as Sweden and Hong [6, 49,
99, 100].
As previously described, social exclusion has the same effects on oral health as
described for general health. Similar mechanisms are also suggested by Wolf et al
[101] with regard to the effects of exclusion on oral health. Poor health literacy in
terms of cognitive (e.g. reasoning, numeracy) and psycho-social (e.g. communication)
skills sets together with long-term memory functioning that are necessary for the
adoption of oral health preventive messages may unavailable for some homeless
people who practice high-risk behaviours and have addiction issues [101]. At a
Government level the methods used to provide oral health information using
mainstream advertising media such as radio, television, the internet may be
inaccessible those residing in temporary accommodation or hostel dwellings [102], but
also may prove inappropriate due to poor levels of oral health literacy.
Oral hygiene, and more specifically plaque control is difficult in a homeless setting.
Lack of funds often means that a toothbrush and toothpaste are luxuries rather than
essentials. Factors contributing to poor oral health for those with a vagrant lifestyle,
means that there may be a lack of access to sanitation [11]. Therefore the physical
environment in which some homeless people reside may result in daily tooth brushing
being physically impossible. In addition, however, tooth brushing may also be low in
the list of daily priorities for some homeless people for whom so many other competing
needs exist, and who tend towards disorganisation, rather than having established oral
health routines [11].
57
Healthy eating for oral health also presents a challenge for the homeless individual.
Planning and preparing meals is virtually impossible, and obtaining healthy ingredients
on a low budget is often very difficult. Most meals are ‘fast-food’ or cheap snacks,
which are often high in sugar, rendering them high-risk for dental caries [103].
Freeman [76] suggested that a complex interaction existed regarding access to dental
treatment services for people who experience social exclusion. Using Cohen’s [77]
accessibility factor framework, Freeman [76] suggested that it was the interaction
between dental health professional and socially excluded client within a context of poor
communication and mutually trusting networks which resulted in barriers to accessing
dental care. Homeless people, therefore, while entitled to treatment without financial
costs under the auspices of the National Health Service, do not avail themselves of the
treatment, nor make appropriate use of dental health-care services [14, 104].
As early as 1998, it was proposed that it was the low ranking of healthcare and dental
care in the homeless person’s order of priorities, poor levels of perceived need that
resulted in high unmet oral treatment needs [14]. This lack of service uptake could be
attributed to the range of factors, such as a lack of fixed address for correspondence,
fear, or poor health behaviour routines which act as barriers to healthcare and dental
care [104]. In recognition of the special needs of this group [105], many Community
Medical and Dental Health programmes of care are in existence throughout Scotland
[17], which provide additional services for the homeless in order to try to remove
barriers to care and reduce inequalities.
A structured review of the empirical evidence of the relationship between oral health
and homelessness will be presented. It will examine the literature in detail and critically
evaluate it using a systematic approach in order to determine whether any existing
literature characterises the oral health of homeless populations in terms of typology in
58
order to answer the research question, ‘Does the empirical evidence show an
association between oral health and homelessness?’
2.4.2 Structured review to evaluate the empirical evidence of the association
between oral health and homelessness
Homeless people may require additional support to assist them to access dental health
care and to promote the adoption of dental health behaviours conducive to oral health.
It has been acknowledged that poor health literacy, the adoption of high-risk
behaviours and current life experiences [46] may impede the ability of some homeless
people to have the capacity for health learning [101] and the adoption of self-care
practices. Moreover it been proposed that the combination of the lack of health
learning capacity together with poor social and mutually trusting networks may have a
detrimental effect on the oral health of homeless populations [11]. Nevertheless the
question remains what is the evidence that homeless people have poorer oral health
when compared with the general population [106]?
The aim of this structured review was to evaluate critically all published literature
reporting on the oral health of adult homeless people using a systematic methodology
[107], to answer the research question:
‘Does the empirical evidence show an association between oral health and
homelessness?’
2.4.21 Initial Review of the literature
An initial (or scoping) review of the literature revealed there was a wealth of peer
reviewed and grey literature available which explores the relationships between
homelessness and general health, in contrast, there were fewer studies which report
and focus on the oral health of homeless people. Yet, considering the work of Watt and

59
Sheiham [108], oral ill-health is an important component of general health which
amongst other co-morbidities affect an individual’s oral health related quality of life.
Oral ill-health can negatively impact upon psychosocial health and well-being [11,
109]. If the oral health of homeless populations is poor, and considering the common
risk factor implications [108] then oral health gains could be viewed as a means of
improving the health and the quality of life for homeless individuals. The need for a
rigorous and systematic review of the peer-reviewed and grey literature, it is suggested
would assist an achieving this overall health goal.
2.4.22 Development of the research question
In order to evaluate the literature available in a rigorous manner, a systematic approach
to reviewing the literature pertaining to oral health and homelessness was conducted
[107]. In this review homelessness will be defined as a dynamic experience which may
be of varying forms and typologies throughout an individual’s life. The typology of
homelessness adopted was the ETHOS typology [8] in order to examine the
heterogeneity of homelessness and its relation to oral health status.
If homeless populations are found to have poorer oral health than the general
population [3, 11, 110], it can be reasonably assumed that poor oral health is
associated with homelessness as a consequence of social exclusion as mentioned
earlier. Oral diseases such as dental caries, periodontal disease and soft tissue
pathology all affect quality of life and the oral health status of individuals, and hence
quality of life [111, 112].
A scoping review of the oral health literature revealed that there was evidence
pertaining to the oral health status of homeless individuals; homeless people were
shown to have poorer levels of dental health than the general population [11, 110].
However, the scoping review did not provide sufficient information describing the scale
of the problem of oral health and homelessness; nor did it inform whether homeless
60
people throughout the world experience similarly high levels of oral disease, or which
types of oral disease are most prevalent in homeless populations, or the effects of the
impact of oral disease upon quality of life. Therefore, a structured review, using a
systematic approach, was needed to examine the literature reporting on oral health
status of homeless populations and synthesise the data obtained. This would provide
an evidence-base with regard to the relationship between oral health and
homelessness.
A systematic review approach was selected to allow the evidence to be evaluated in a
methodical manner in order to determine whether the evidence was consistent with the
assumption that, in common with general health, oral health of homeless populations
would be poorer than that of comparable, settled populations [11]. Therefore, this
review was not designed to evaluate the effectiveness of interventions but instead, the
associations between oral disease/ill-health and homelessness were examined. As
such, the types of study design likely to be involved in the review were surveys,
screening, and cross sectional studies and evaluations.
The research question was carefully framed and developed in order that it rigorously
encompassed and identified the target population, outcome and study designs, but
also remained simplistic enough so as not to obscure the aim of the review. Therefore,
the research question addressed by the systematic review was:
‘Does the empirical evidence show an association between oral health and
homelessness?’
2.4.23 Materials and methods: study design
The review protocol was further developed by scrutinising possible study design
components of the review. The key components considered relevant for inclusion in
the review are listed in Table 5. Since this structural review did not seek to evaluate the
effectiveness of interventions, it focused on surveys, cross-sectional or observational
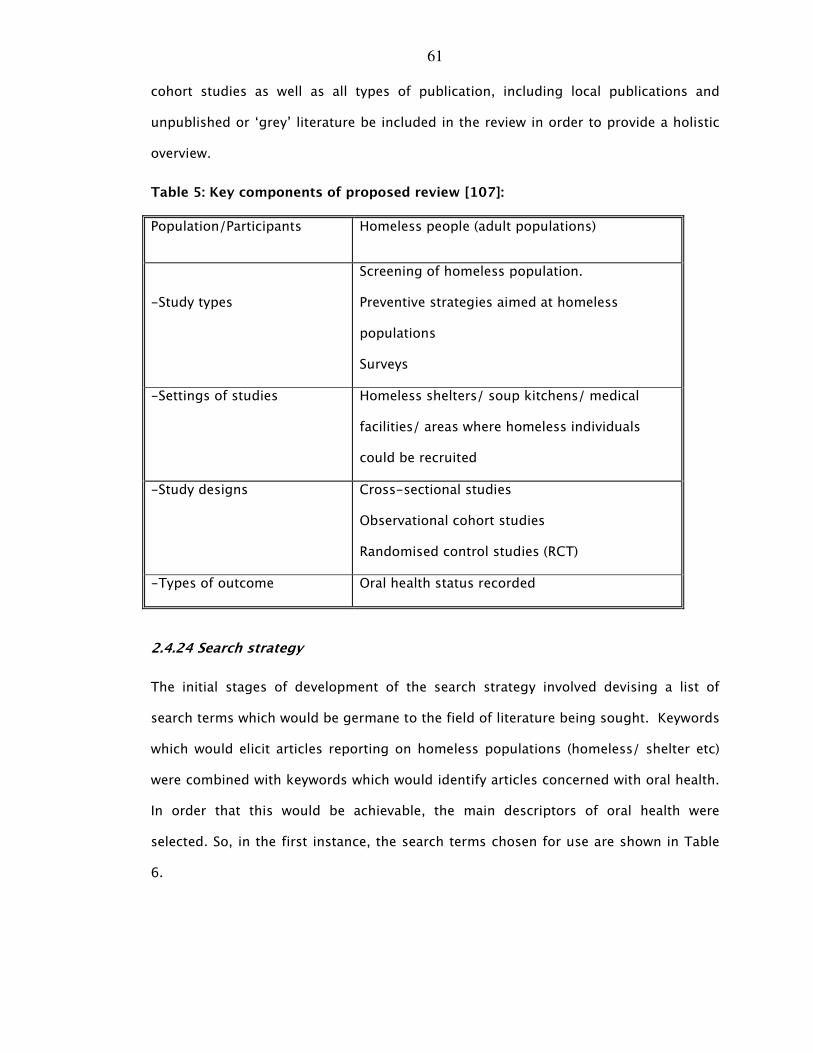
61
cohort studies as well as all types of publication, including local publications and
unpublished or ‘grey’ literature be included in the review in order to provide a holistic
overview.
Table 5: Key components of proposed review [107]:
Population/Participants Homeless people (adult populations)
-Study types
Screening of homeless population.
Preventive strategies aimed at homeless
populations
Surveys
-Settings of studies Homeless shelters/ soup kitchens/ medical
facilities/ areas where homeless individuals
could be recruited
-Study designs Cross-sectional studies
Observational cohort studies
Randomised control studies (RCT)
-Types of outcome Oral health status recorded
2.4.24 Search strategy
The initial stages of development of the search strategy involved devising a list of
search terms which would be germane to the field of literature being sought. Keywords
which would elicit articles reporting on homeless populations (homeless/ shelter etc)
were combined with keywords which would identify articles concerned with oral health.
In order that this would be achievable, the main descriptors of oral health were
selected. So, in the first instance, the search terms chosen for use are shown in Table
6.
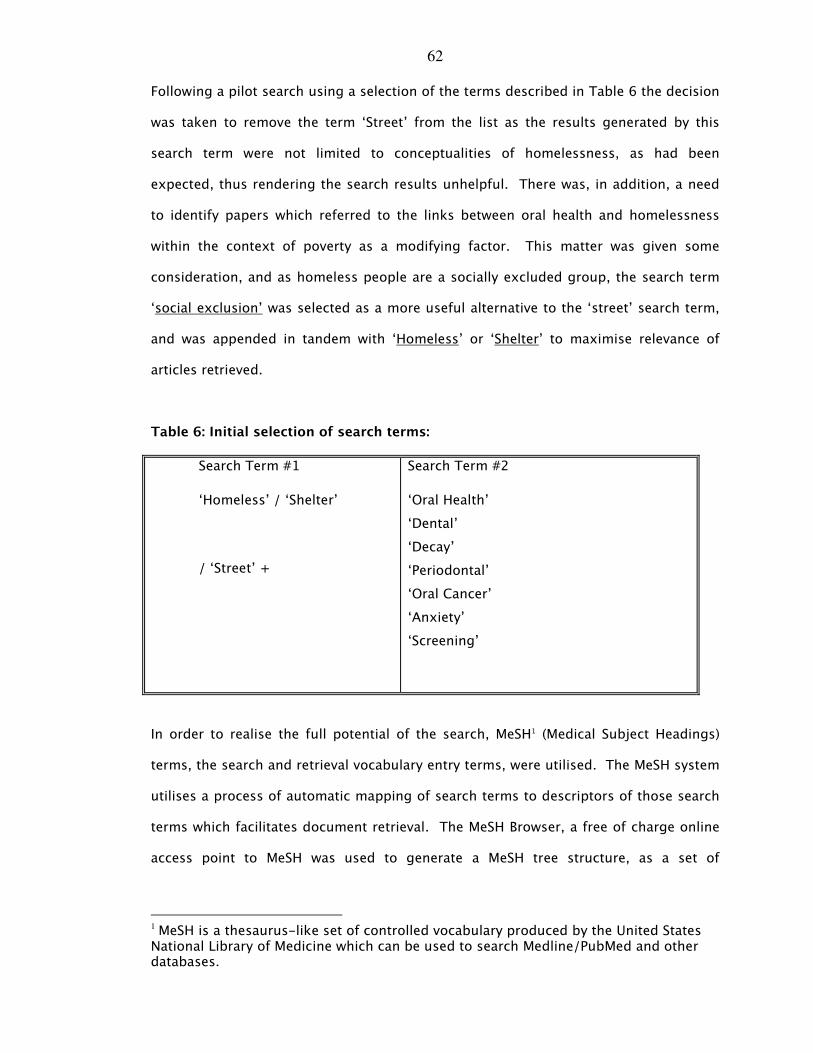
62
Following a pilot search using a selection of the terms described in Table 6 the decision
was taken to remove the term ‘Street’ from the list as the results generated by this
search term were not limited to conceptualities of homelessness, as had been
expected, thus rendering the search results unhelpful. There was, in addition, a need
to identify papers which referred to the links between oral health and homelessness
within the context of poverty as a modifying factor. This matter was given some
consideration, and as homeless people are a socially excluded group, the search term
‘social exclusion’ was selected as a more useful alternative to the ‘street’ search term,
and was appended in tandem with ‘Homeless’ or ‘Shelter’ to maximise relevance of
articles retrieved.
Table 6: Initial selection of search terms:
Search Term #1
‘Homeless’ / ‘Shelter’
/ ‘Street’ +
Search Term #2
‘Oral Health’
‘Dental’
‘Decay’
‘Periodontal’
‘Oral Cancer’
‘Anxiety’
‘Screening’
In order to realise the full potential of the search, MeSH1 (Medical Subject Headings)
terms, the search and retrieval vocabulary entry terms, were utilised. The MeSH system
utilises a process of automatic mapping of search terms to descriptors of those search
terms which facilitates document retrieval. The MeSH Browser, a free of charge online
access point to MeSH was used to generate a MeSH tree structure, as a set of
1 MeSH is a thesaurus-like set of controlled vocabulary produced by the United States National Library of Medicine which can be used to search Medline/PubMed and other databases.
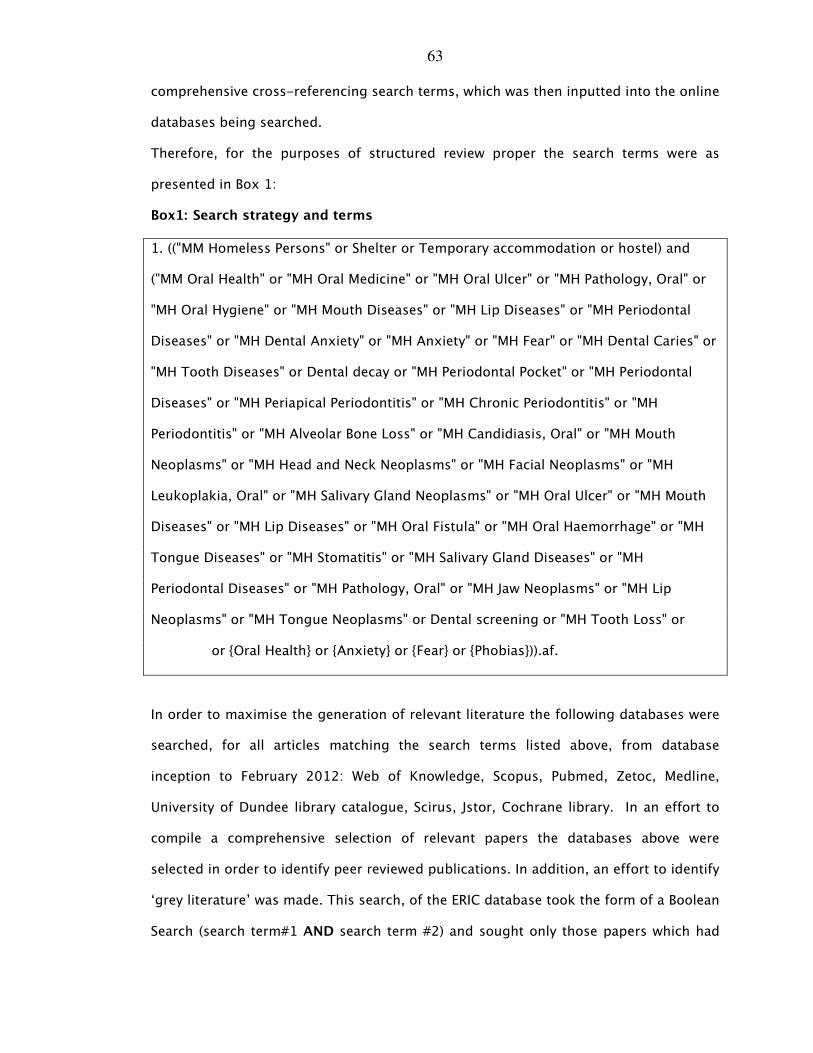
63
comprehensive cross-referencing search terms, which was then inputted into the online
databases being searched.
Therefore, for the purposes of structured review proper the search terms were as
presented in Box 1:
Box1: Search strategy and terms
1. (("MM Homeless Persons" or Shelter or Temporary accommodation or hostel) and
("MM Oral Health" or "MH Oral Medicine" or "MH Oral Ulcer" or "MH Pathology, Oral" or
"MH Oral Hygiene" or "MH Mouth Diseases" or "MH Lip Diseases" or "MH Periodontal
Diseases" or "MH Dental Anxiety" or "MH Anxiety" or "MH Fear" or "MH Dental Caries" or
"MH Tooth Diseases" or Dental decay or "MH Periodontal Pocket" or "MH Periodontal
Diseases" or "MH Periapical Periodontitis" or "MH Chronic Periodontitis" or "MH
Periodontitis" or "MH Alveolar Bone Loss" or "MH Candidiasis, Oral" or "MH Mouth
Neoplasms" or "MH Head and Neck Neoplasms" or "MH Facial Neoplasms" or "MH
Leukoplakia, Oral" or "MH Salivary Gland Neoplasms" or "MH Oral Ulcer" or "MH Mouth
Diseases" or "MH Lip Diseases" or "MH Oral Fistula" or "MH Oral Haemorrhage" or "MH
Tongue Diseases" or "MH Stomatitis" or "MH Salivary Gland Diseases" or "MH
Periodontal Diseases" or "MH Pathology, Oral" or "MH Jaw Neoplasms" or "MH Lip
Neoplasms" or "MH Tongue Neoplasms" or Dental screening or "MH Tooth Loss" or
or {Oral Health} or {Anxiety} or {Fear} or {Phobias})).af.
In order to maximise the generation of relevant literature the following databases were
searched, for all articles matching the search terms listed above, from database
inception to February 2012: Web of Knowledge, Scopus, Pubmed, Zetoc, Medline,
University of Dundee library catalogue, Scirus, Jstor, Cochrane library. In an effort to
compile a comprehensive selection of relevant papers the databases above were
selected in order to identify peer reviewed publications. In addition, an effort to identify
‘grey literature’ was made. This search, of the ERIC database took the form of a Boolean
Search (search term#1 AND search term #2) and sought only those papers which had
64
the search terms contained within the title. For all searches the search limiters were
‘English language’ ‘French language’ and ‘human’.
This search conducted using generated 880 results. Elimination of duplicates and
application of the filter criteria requiring consideration reduced this number to 670. A
cursory examination of the list revealed that some of the papers, although containing
the search terms within their title were unlikely to be relevant. In order to refine the
search, methodically excluding irrelevant papers, a selection criteria procedure was
followed. A flow chart summarising this process is shown in Figure 5.
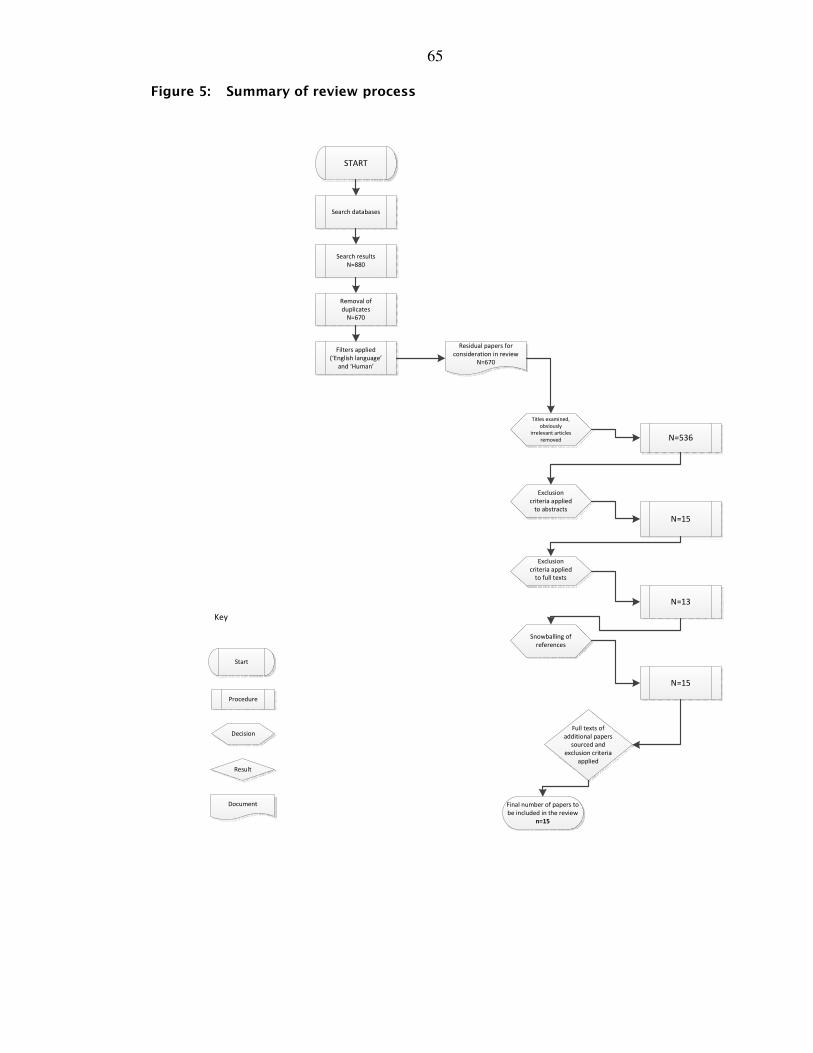
65
Figure 5: Summary of review process
START
Search databases
Search results
N=880
Removal of
duplicates
N=670
Filters applied
(‘English language’
and ‘Human’
Residual papers for
consideration in review
N=670
N=536
N=15
N=13
N=15
Titles examined,
obviously
irrelevant articles
removed
Exclusion
criteria applied
to abstracts
Exclusion
criteria applied
to full texts
Full texts of
additional papers
sourced and
exclusion criteria
applied
Snowballing of
references
Final number of papers to
be included in the review
n=15
Start
Procedure
Decision
Result
Document
Key
66
2.4.25 Study selection criteria
The list of papers generated in this search was recorded and examined. A predefined
set of exclusion criteria was to be applied to the papers in order to ensure quality
control over the papers included in the review (see Appendix 9.2a).
In the first instance, the exclusion criteria were applied to the titles of all the articles
retrieved. This allowed some to be removed immediately, leaving 536 papers.
Following this, abstracts of all the remaining papers generated by the search were
sought. Those papers which were not written in the English or French language were
immediately excluded. The remaining 15 abstracts were evaluated using the next part
of the exclusion criteria.
In some cases the abstracts did not provide enough information to allow the exclusion
criteria to be implemented. The full text versions of all remaining papers were sought
and the exclusion criteria reapplied. At this stage a second reviewer (FMA, a qualified
dentist with suitable knowledge and experience in this field) appraised the full text
documents in isolation from the primary reviewer (JC). There followed a panel
discussion where the results were consolidated. Following on from this process 13
papers remained, to be included in the review. So that all potential sources of
information were explored, the references cited by those full text papers were hand
searched as potential sources of further material.
These papers were evaluated and the exclusion criteria applied including involvement
of the second reviewer as outlined above. Figure 6 illustrates the overall review process
and role of the second reviewer. Appendix 9.2b describes some of the excluded
papers and the logic behind their exclusion. The primary reason for excluding many of
the papers was that the study did not include a dental examination. Further studies
were excluded from this review as they focussed on child or youth homeless
populations [48, 49], whereas this process was focussed on adult homeless
67
populations. The number of papers which remained following this process of retrieval
and exclusion was 15.
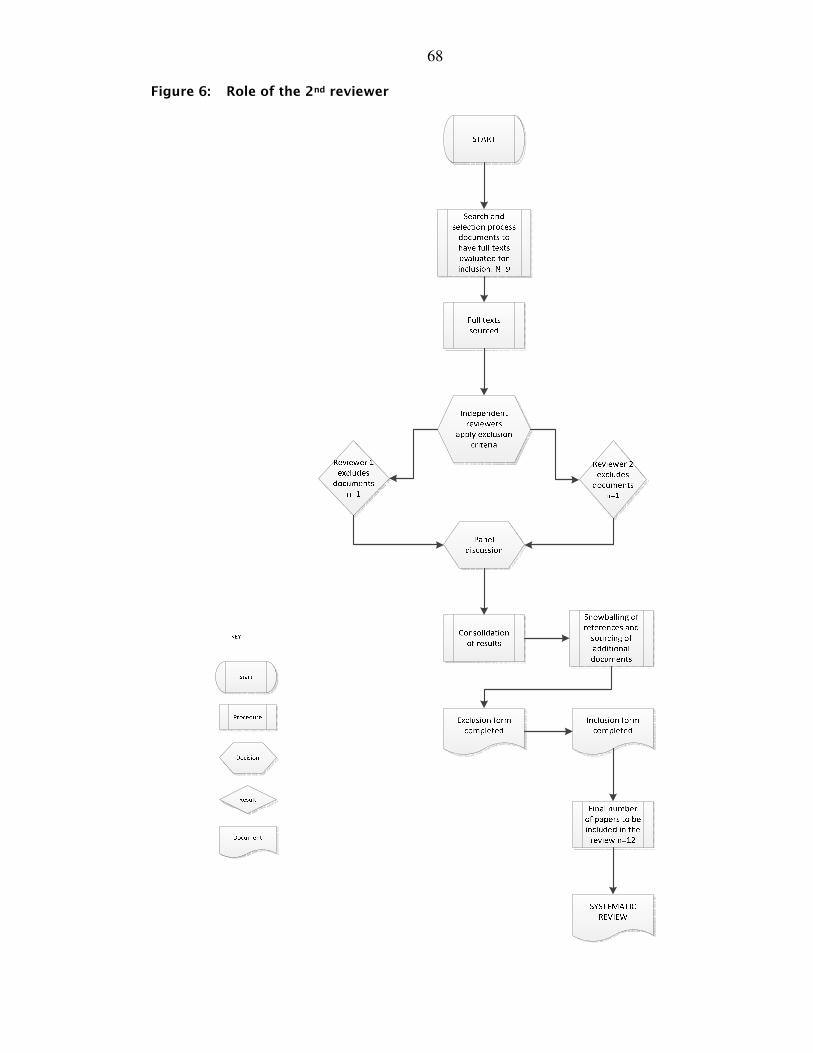
68
Figure 6: Role of the 2nd reviewer
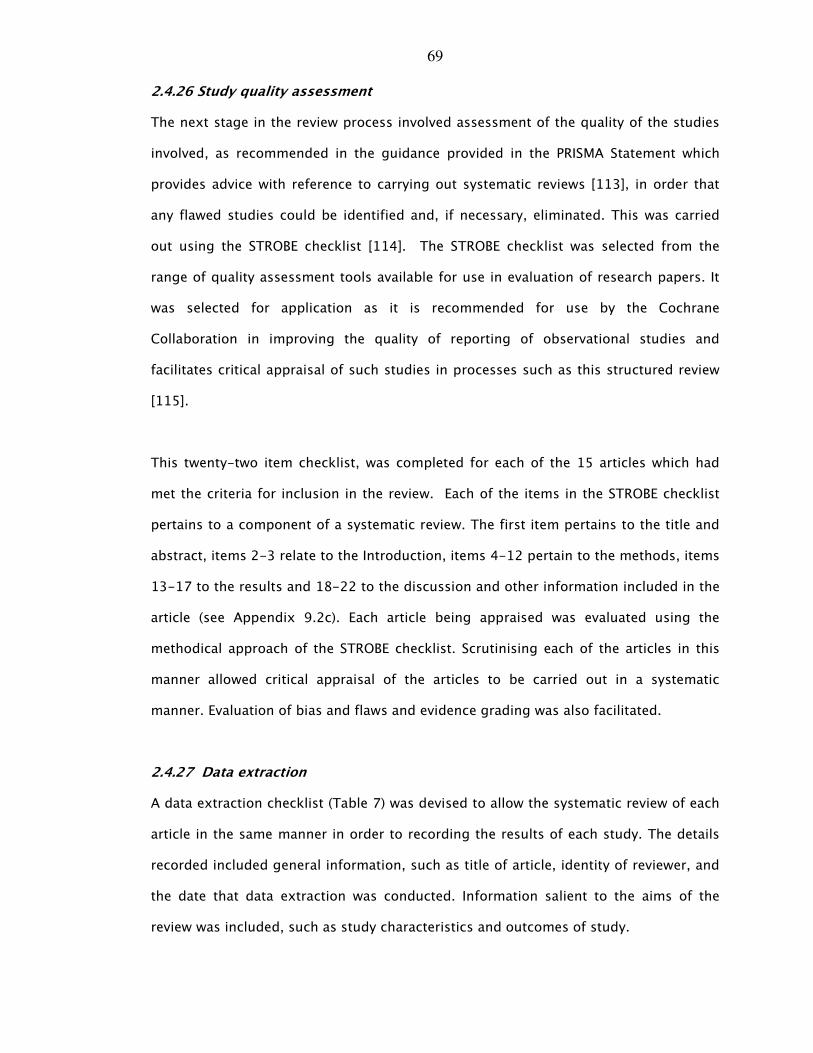
69
2.4.26 Study quality assessment
The next stage in the review process involved assessment of the quality of the studies
involved, as recommended in the guidance provided in the PRISMA Statement which
provides advice with reference to carrying out systematic reviews [113], in order that
any flawed studies could be identified and, if necessary, eliminated. This was carried
out using the STROBE checklist [114]. The STROBE checklist was selected from the
range of quality assessment tools available for use in evaluation of research papers. It
was selected for application as it is recommended for use by the Cochrane
Collaboration in improving the quality of reporting of observational studies and
facilitates critical appraisal of such studies in processes such as this structured review
[115].
This twenty-two item checklist, was completed for each of the 15 articles which had
met the criteria for inclusion in the review. Each of the items in the STROBE checklist
pertains to a component of a systematic review. The first item pertains to the title and
abstract, items 2-3 relate to the Introduction, items 4-12 pertain to the methods, items
13-17 to the results and 18-22 to the discussion and other information included in the
article (see Appendix 9.2c). Each article being appraised was evaluated using the
methodical approach of the STROBE checklist. Scrutinising each of the articles in this
manner allowed critical appraisal of the articles to be carried out in a systematic
manner. Evaluation of bias and flaws and evidence grading was also facilitated.
2.4.27 Data extraction
A data extraction checklist (Table 7) was devised to allow the systematic review of each
article in the same manner in order to recording the results of each study. The details
recorded included general information, such as title of article, identity of reviewer, and
the date that data extraction was conducted. Information salient to the aims of the
review was included, such as study characteristics and outcomes of study.
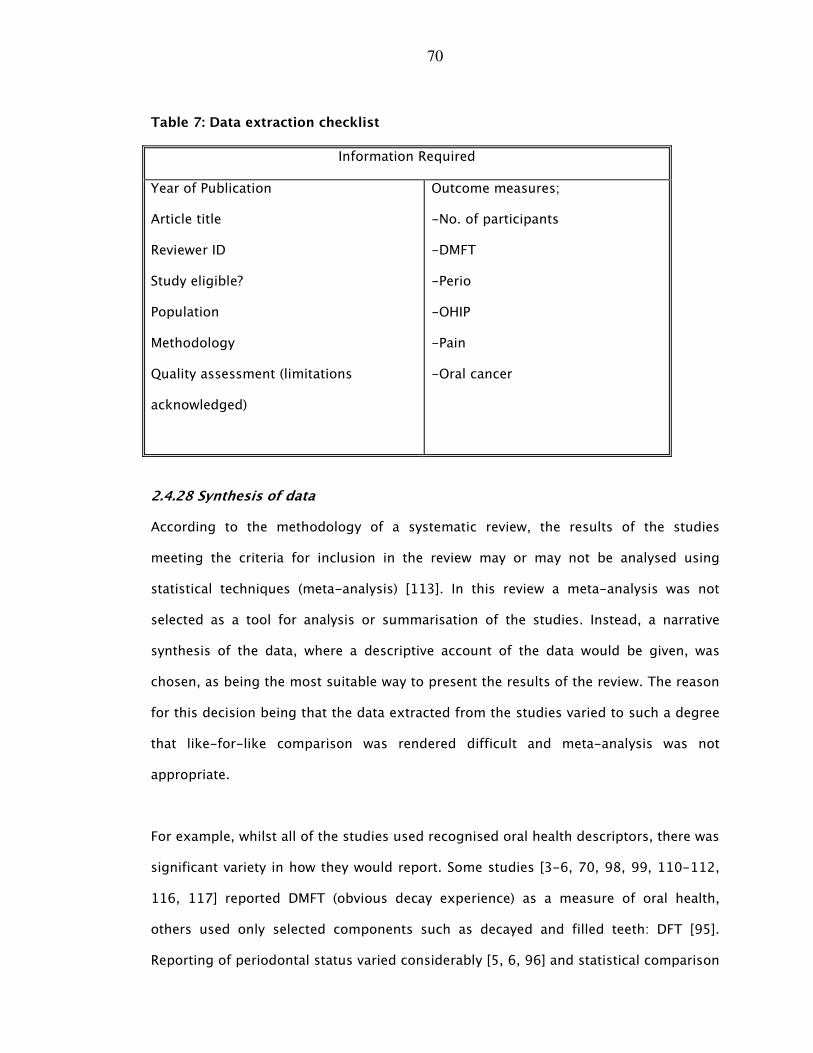
70
Table 7: Data extraction checklist
Information Required
Year of Publication
Article title
Reviewer ID
Study eligible?
Population
Methodology
Quality assessment (limitations
acknowledged)
Outcome measures;
-No. of participants
-DMFT
-Perio
-OHIP
-Pain
-Oral cancer
2.4.28 Synthesis of data
According to the methodology of a systematic review, the results of the studies
meeting the criteria for inclusion in the review may or may not be analysed using
statistical techniques (meta-analysis) [113]. In this review a meta-analysis was not
selected as a tool for analysis or summarisation of the studies. Instead, a narrative
synthesis of the data, where a descriptive account of the data would be given, was
chosen, as being the most suitable way to present the results of the review. The reason
for this decision being that the data extracted from the studies varied to such a degree
that like-for-like comparison was rendered difficult and meta-analysis was not
appropriate.
For example, whilst all of the studies used recognised oral health descriptors, there was
significant variety in how they would report. Some studies [3-6, 70, 98, 99, 110-112,
116, 117] reported DMFT (obvious decay experience) as a measure of oral health,
others used only selected components such as decayed and filled teeth: DFT [95].
Reporting of periodontal status varied considerably [5, 6, 96] and statistical comparison
71
was impossible. Some of the studies reported that a certain percentage of teeth were
found to be affected by periodontal disease [98], others recorded tooth mobility as a
measure of periodontal disease [70].
In some of the studies oral mucosal lesions were recorded, indicating pathology [11,
98, 112], others did not record the presence or absence of pathology. Furthermore, the
studies reported on differing aspects of the links between oral health and other factors
such as age, health behaviours, general health and psychosocial health or oral health-
related quality of life.
Given this level of heterogeneity in reporting indicators of oral health and the different
styles of recording oral health information, it was decided that a meta-analysis would
have limited value and was inappropriate as there was no standardised recording of
means across the studies. As there was no consistency in the comparison group, no
measure of variation was possible.
2.4.3 Results
2.4.31 Study pool characteristics
The publication dates ranged from 1984 to 2011, with a median publication date of
1997. The studies [3-6, 70, 96, 98, 99, 110-112, 116-118] were located in a variety of
major cities throughout the world and focussed on a range of ethnic groups. All of the
participants in the studies were homeless (as a requirement for inclusion in the review).
The studies [3-6, 70, 96, 98, 99, 110-112, 116-118] used non-probability
convenience samples to access homeless populations. The studies [3-6, 70, 96, 98, 99,
110-112, 116-118] were conducted in settings where homeless people tended to
congregate to access other healthcare or welfare service providers.
72
2.4.32 Dental disease: obvious caries experience
As described above the studies all reported decay experience of participants, although
not always in the same manner. For example in Boston, Kaste et al found that 91.4% of
a homeless population had untreated decay [4]. In Hong Kong, Luo and McGrath found
that 90% of a homeless population had dental caries, mostly untreated [99].
Gelberg et al [96], conducting a survey of oral health in homeless people in Los
Angeles, reported similarly high prevalence of dental decay, and higher levels of oral
pathology compared with the general population. Surveys conducted in Belfast [11],
Birmingham [70] and Leeds [98], all demonstrated an increased dental disease
experience. with homeless populations in two of these cities found to have a DMFT
(total number of decayed, missing or filled teeth) of 16.6 (Belfast [11]) and 15.9
(Birmingham [70]). This compares unfavourably with the DMFT scores for the general,
settled population [119].
2.4.33 Collated review data: dental disease experience and impacts
In the Amsterdam-based study [118] there were 124 participants, the age range was
25-84 years. The mean length of homelessness was 7 years. In this population, 20% of
participants reported having experienced toothache within the last three months, 35%
reported fear as the main barrier to dental attendance, and 52% reported that their last
dental attendance had been greater than 3 years previously. This study observed that
there were greater levels of decay in those participants aged younger than 45 years.
The Belfast survey [11] had a sample size of 317 participants. 84% of these were male.
There were low levels of self-reported drug abuse (3%). The mean DMFT was 16.2 (95%
Cl:15.71, 17.46). Two participants were found to have oral cancer. This study reported
that dental anxiety status was linked with dental disease experience.
73
In Birmingham [70], 71 participants were evaluated, with an emphasis on obvious caries
experience. In this group 31% were found to be edentulous, and the mean DMFT was
19.7 (SD=8.57). Fifty percent of the sample population had excessively mobile teeth.
There were low levels of perceived need, despite the high levels of normative need.
For the Boston based survey [4], which comprised of 73 participants, the aim was to
characterise dental caries status in a homeless population. It was found that 66% of
participants were male, the mean age was 36 years, and the mean DMFT was 11.10 (SD
=6.1). Over 90 percent of these participants had untreated dental caries.
In Brisbane [6] 162 participants were examined. Twenty-nine percent of this all-male
sample was edentulous. In terms of periodontal status for the dentate, pocket depth
was found to be age dependent (P<0.01). The mean DMFT was 21.10 (SD=9.6).
Two of the included studies were carried out in Hong Kong by the same authors and
were published in 2006 [99] and 2008 [112]. It was unclear whether the studies which
reported on oral health status [99] and impacts of oral health status on quality of life
[112] respectively were carried out on exactly the same pool of participants, but in any
case the participants were drawn from similar regions of Hong Kong.
In the Luo and McGrath’s first survey report [99], 95% of the participants were male, the
age range was 21-75 years. Some of the participants had been homeless for up to 40
years. Fifty-two percent of participants reported dental pain within the last twelve
months. The mean DMFT was 9.03 (SD=8.68). Those who had been homeless for over
one year had higher DMFT scores.
In the second Hong Kong survey [112], which focussed on quality of life as related to
oral health, Luo and McGrath [112] reported that 70% of the participants said that they
needed to see a dentist, with 46% reporting that their last dental visit was over 3 years
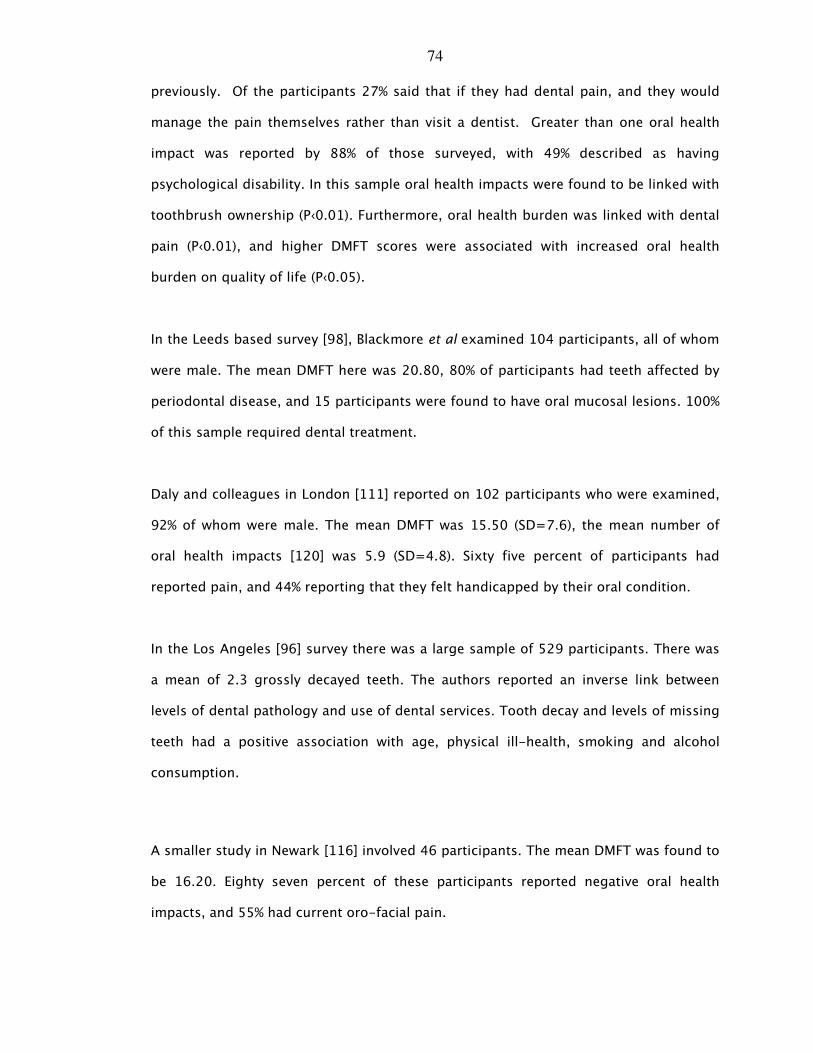
74
previously. Of the participants 27% said that if they had dental pain, and they would
manage the pain themselves rather than visit a dentist. Greater than one oral health
impact was reported by 88% of those surveyed, with 49% described as having
psychological disability. In this sample oral health impacts were found to be linked with
toothbrush ownership (P‹0.01). Furthermore, oral health burden was linked with dental
pain (P‹0.01), and higher DMFT scores were associated with increased oral health
burden on quality of life (P‹0.05).
In the Leeds based survey [98], Blackmore et al examined 104 participants, all of whom
were male. The mean DMFT here was 20.80, 80% of participants had teeth affected by
periodontal disease, and 15 participants were found to have oral mucosal lesions. 100%
of this sample required dental treatment.
Daly and colleagues in London [111] reported on 102 participants who were examined,
92% of whom were male. The mean DMFT was 15.50 (SD=7.6), the mean number of
oral health impacts [120] was 5.9 (SD=4.8). Sixty five percent of participants had
reported pain, and 44% reporting that they felt handicapped by their oral condition.
In the Los Angeles [96] survey there was a large sample of 529 participants. There was
a mean of 2.3 grossly decayed teeth. The authors reported an inverse link between
levels of dental pathology and use of dental services. Tooth decay and levels of missing
teeth had a positive association with age, physical ill-health, smoking and alcohol
consumption.
A smaller study in Newark [116] involved 46 participants. The mean DMFT was found to
be 16.20. Eighty seven percent of these participants reported negative oral health
impacts, and 55% had current oro-facial pain.
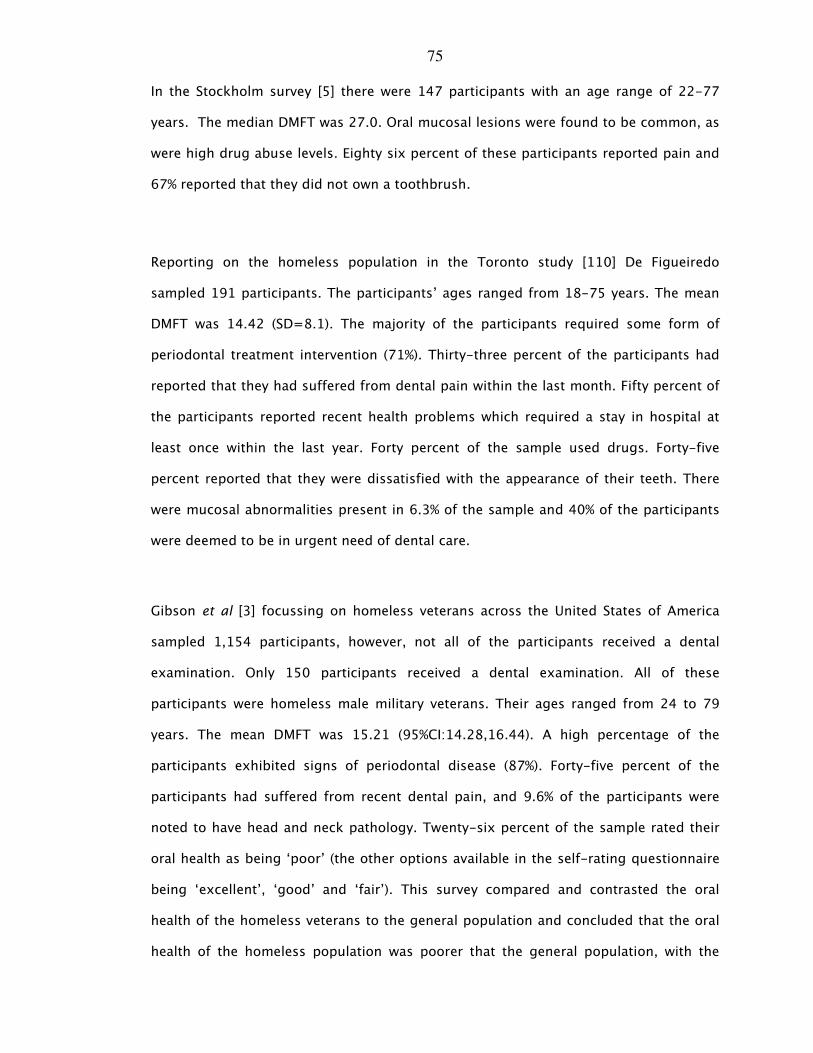
75
In the Stockholm survey [5] there were 147 participants with an age range of 22-77
years. The median DMFT was 27.0. Oral mucosal lesions were found to be common, as
were high drug abuse levels. Eighty six percent of these participants reported pain and
67% reported that they did not own a toothbrush.
Reporting on the homeless population in the Toronto study [110] De Figueiredo
sampled 191 participants. The participants’ ages ranged from 18-75 years. The mean
DMFT was 14.42 (SD=8.1). The majority of the participants required some form of
periodontal treatment intervention (71%). Thirty-three percent of the participants had
reported that they had suffered from dental pain within the last month. Fifty percent of
the participants reported recent health problems which required a stay in hospital at
least once within the last year. Forty percent of the sample used drugs. Forty-five
percent reported that they were dissatisfied with the appearance of their teeth. There
were mucosal abnormalities present in 6.3% of the sample and 40% of the participants
were deemed to be in urgent need of dental care.
Gibson et al [3] focussing on homeless veterans across the United States of America
sampled 1,154 participants, however, not all of the participants received a dental
examination. Only 150 participants received a dental examination. All of these
participants were homeless male military veterans. Their ages ranged from 24 to 79
years. The mean DMFT was 15.21 (95%CI:14.28,16.44). A high percentage of the
participants exhibited signs of periodontal disease (87%). Forty-five percent of the
participants had suffered from recent dental pain, and 9.6% of the participants were
noted to have head and neck pathology. Twenty-six percent of the sample rated their
oral health as being ‘poor’ (the other options available in the self-rating questionnaire
being ‘excellent’, ‘good’ and ‘fair’). This survey compared and contrasted the oral
health of the homeless veterans to the general population and concluded that the oral
health of the homeless population was poorer that the general population, with the
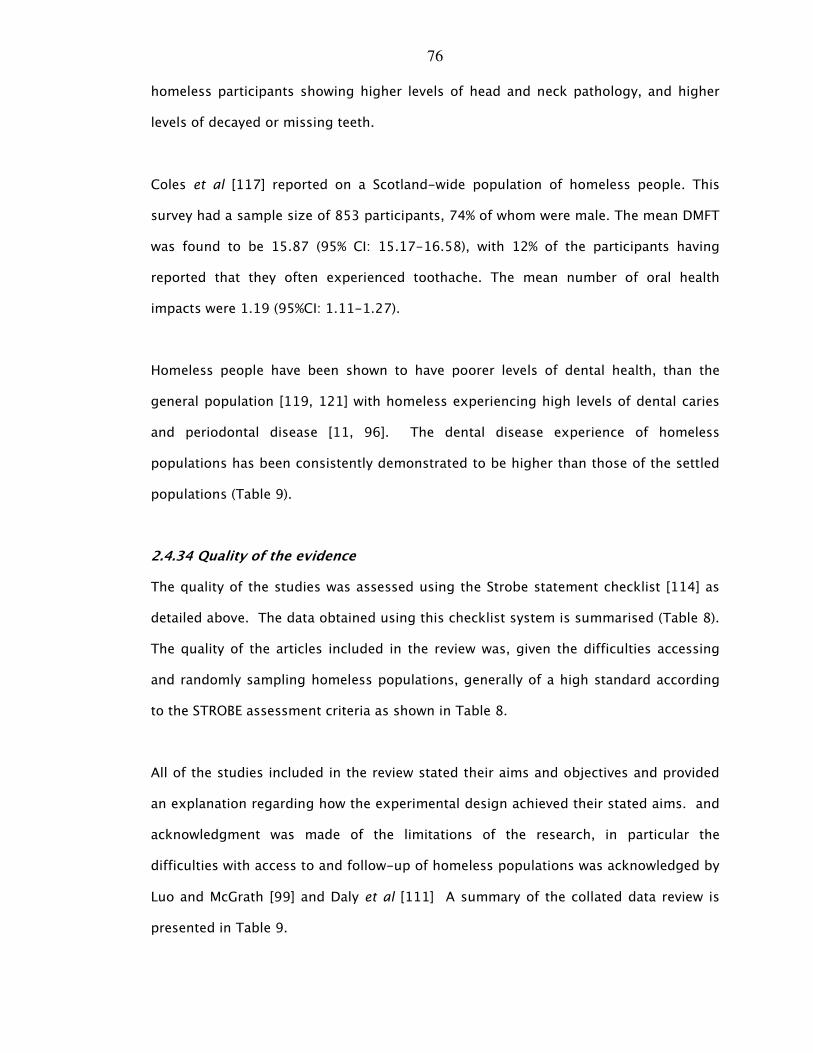
76
homeless participants showing higher levels of head and neck pathology, and higher
levels of decayed or missing teeth.
Coles et al [117] reported on a Scotland-wide population of homeless people. This
survey had a sample size of 853 participants, 74% of whom were male. The mean DMFT
was found to be 15.87 (95% CI: 15.17-16.58), with 12% of the participants having
reported that they often experienced toothache. The mean number of oral health
impacts were 1.19 (95%CI: 1.11-1.27).
Homeless people have been shown to have poorer levels of dental health, than the
general population [119, 121] with homeless experiencing high levels of dental caries
and periodontal disease [11, 96]. The dental disease experience of homeless
populations has been consistently demonstrated to be higher than those of the settled
populations (Table 9).
2.4.34 Quality of the evidence
The quality of the studies was assessed using the Strobe statement checklist [114] as
detailed above. The data obtained using this checklist system is summarised (Table 8).
The quality of the articles included in the review was, given the difficulties accessing
and randomly sampling homeless populations, generally of a high standard according
to the STROBE assessment criteria as shown in Table 8.
All of the studies included in the review stated their aims and objectives and provided
an explanation regarding how the experimental design achieved their stated aims. and
acknowledgment was made of the limitations of the research, in particular the
difficulties with access to and follow-up of homeless populations was acknowledged by
Luo and McGrath [99] and Daly et al [111] A summary of the collated data review is
presented in Table 9.
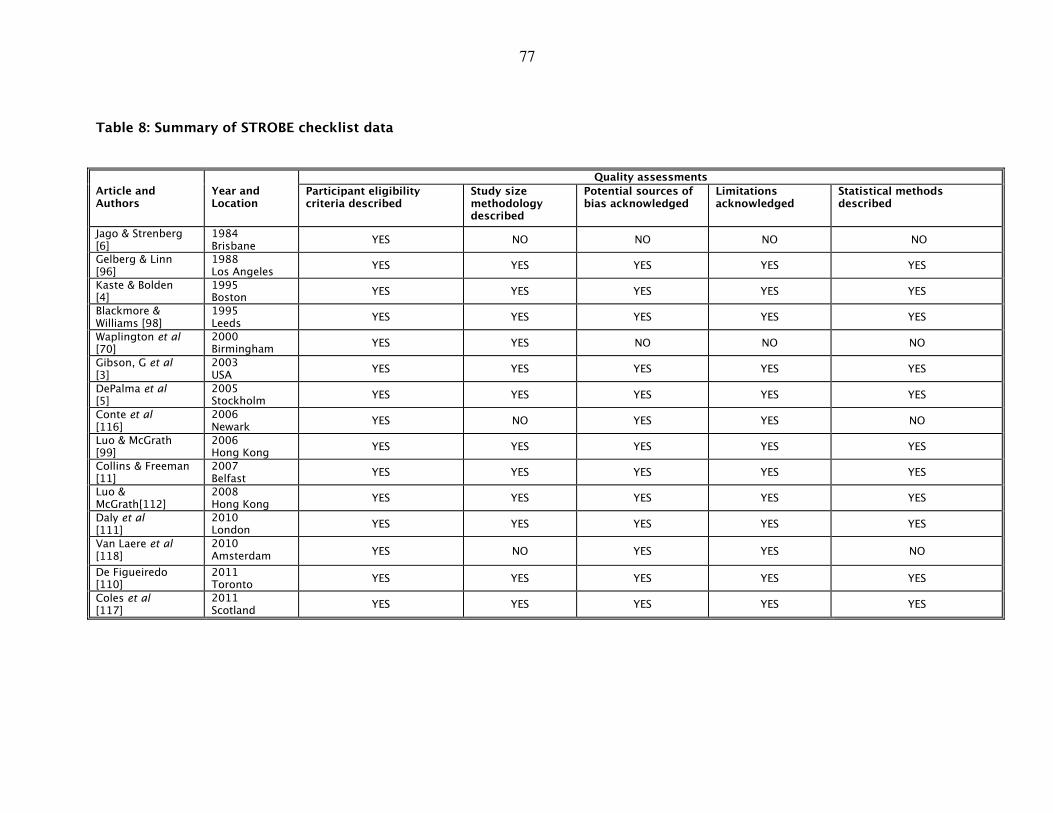
77
Table 8: Summary of STROBE checklist data
Quality assessments
Article and Authors
Year and Location
Participant eligibility criteria described
Study size methodology described
Potential sources of bias acknowledged
Limitations acknowledged
Statistical methods described
Jago & Strenberg [6]
1984 Brisbane
YES NO NO NO NO
Gelberg & Linn [96]
1988 Los Angeles
YES YES YES YES YES
Kaste & Bolden [4]
1995 Boston
YES YES YES YES YES
Blackmore & Williams [98]
1995 Leeds
YES YES YES YES YES
Waplington et al [70]
2000 Birmingham
YES YES NO NO NO
Gibson, G et al [3]
2003 USA
YES YES YES YES YES
DePalma et al [5]
2005 Stockholm
YES YES YES YES YES
Conte et al [116]
2006 Newark
YES NO YES YES NO
Luo & McGrath [99]
2006 Hong Kong
YES YES YES YES YES
Collins & Freeman [11]
2007 Belfast
YES YES YES YES YES
Luo & McGrath[112]
2008 Hong Kong
YES YES YES YES YES
Daly et al [111]
2010 London
YES YES YES YES YES
Van Laere et al [118]
2010 Amsterdam YES NO YES YES NO
De Figueiredo [110]
2011 Toronto
YES YES YES YES YES
Coles et al [117]
2011 Scotland
YES YES YES YES YES
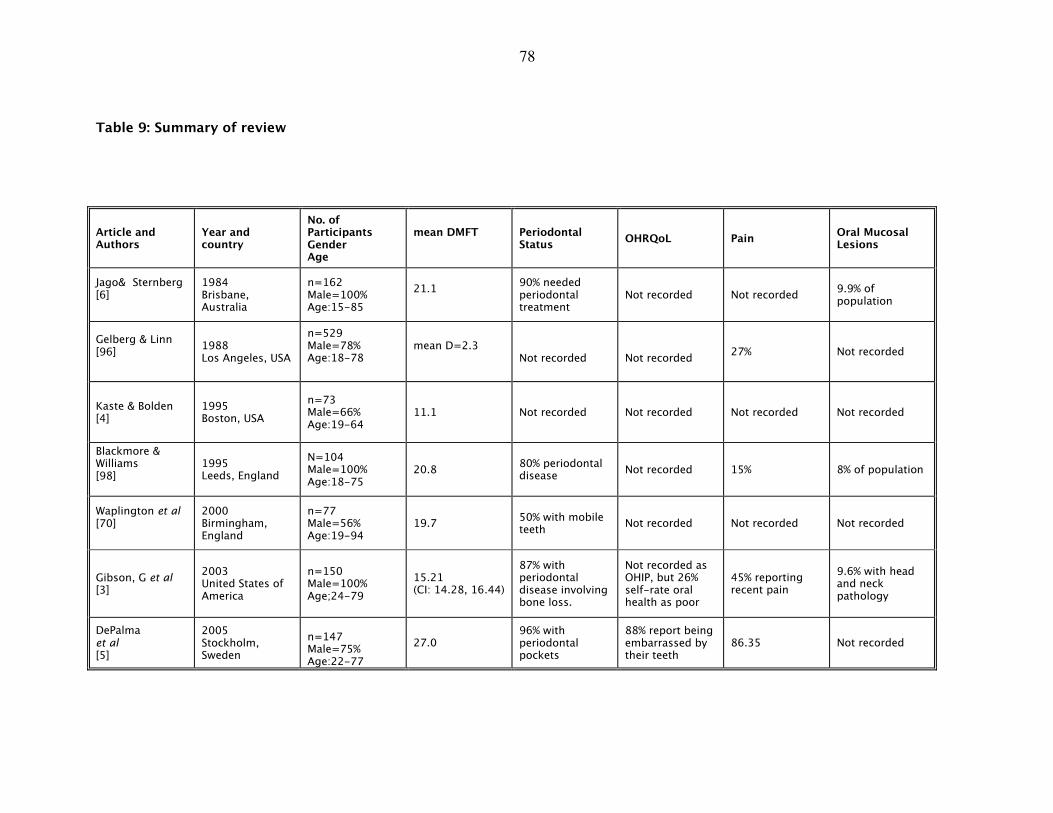
78
Table 9: Summary of review
Article and Authors
Year and country
No. of Participants Gender Age
mean DMFT
Periodontal Status
OHRQoL Pain Oral Mucosal Lesions
Jago& Sternberg [6]
1984 Brisbane, Australia
n=162 Male=100% Age:15-85
21.1
90% needed periodontal treatment
Not recorded Not recorded 9.9% of population
Gelberg & Linn [96]
1988 Los Angeles, USA
n=529 Male=78% Age:18-78
mean D=2.3
Not recorded
Not recorded
27% Not recorded
Kaste & Bolden [4]
1995 Boston, USA
n=73 Male=66% Age:19-64
11.1 Not recorded Not recorded Not recorded Not recorded
Blackmore & Williams [98]
1995 Leeds, England
N=104 Male=100% Age:18-75
20.8 80% periodontal disease
Not recorded 15% 8% of population
Waplington et al [70]
2000 Birmingham, England
n=77 Male=56% Age:19-94
19.7 50% with mobile teeth
Not recorded Not recorded Not recorded
Gibson, G et al [3]
2003 United States of America
n=150 Male=100% Age;24-79
15.21 (CI: 14.28, 16.44)
87% with periodontal disease involving bone loss.
Not recorded as OHIP, but 26% self-rate oral health as poor
45% reporting recent pain
9.6% with head and neck pathology
DePalma et al [5]
2005 Stockholm, Sweden
n=147 Male=75% Age:22-77
27.0 96% with periodontal pockets
88% report being embarrassed by their teeth
86.35 Not recorded
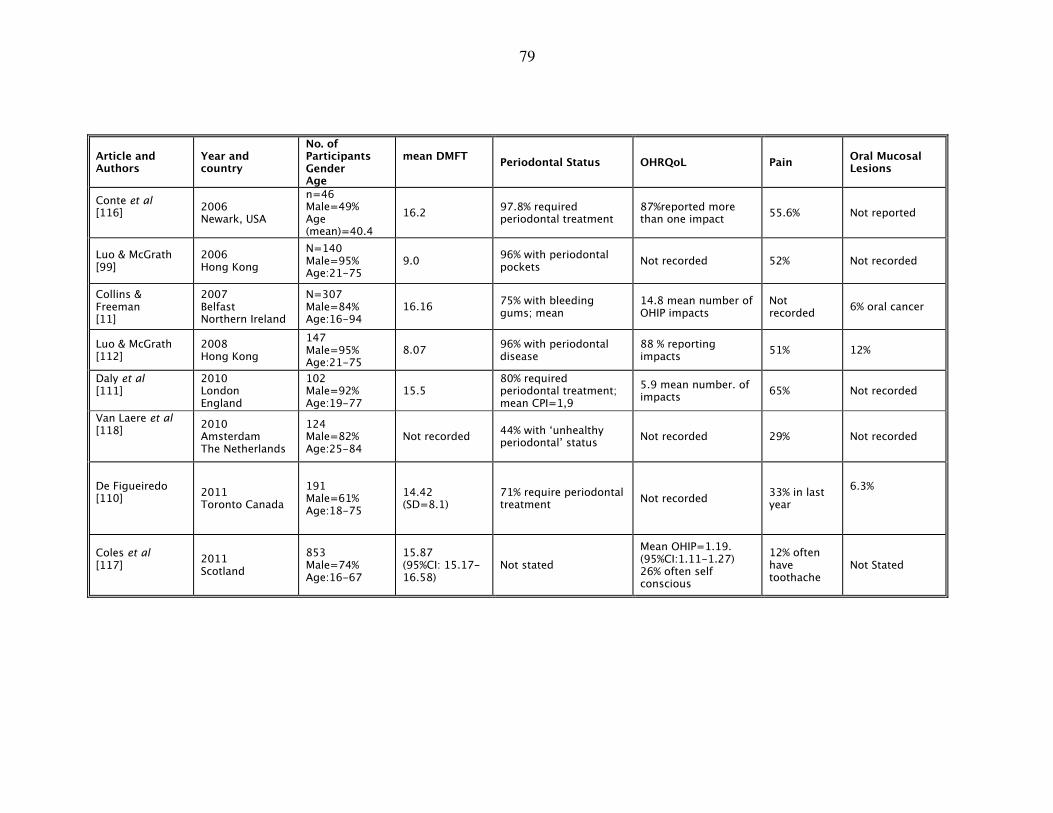
79
Article and Authors
Year and country
No. of Participants Gender Age
mean DMFT
Periodontal Status OHRQoL Pain Oral Mucosal Lesions
Conte et al [116]
2006 Newark, USA
n=46 Male=49% Age (mean)=40.4
16.2 97.8% required periodontal treatment
87%reported more than one impact
55.6% Not reported
Luo & McGrath [99]
2006 Hong Kong
N=140 Male=95% Age:21-75
9.0 96% with periodontal pockets
Not recorded 52% Not recorded
Collins & Freeman [11]
2007 Belfast Northern Ireland
N=307 Male=84% Age:16-94
16.16 75% with bleeding gums; mean
14.8 mean number of OHIP impacts
Not recorded
6% oral cancer
Luo & McGrath [112]
2008 Hong Kong
147 Male=95% Age:21-75
8.07 96% with periodontal disease
88 % reporting impacts
51% 12%
Daly et al [111]
2010 London England
102 Male=92% Age:19-77
15.5 80% required periodontal treatment; mean CPI=1,9
5.9 mean number. of impacts
65% Not recorded
Van Laere et al [118]
2010 Amsterdam The Netherlands
124 Male=82% Age:25-84
Not recorded 44% with ‘unhealthy periodontal’ status
Not recorded 29% Not recorded
De Figueiredo [110]
2011 Toronto Canada
191 Male=61% Age:18-75
14.42 (SD=8.1)
71% require periodontal treatment
Not recorded 33% in last year
6.3%
Coles et al [117]
2011 Scotland
853 Male=74% Age:16-67
15.87 (95%CI: 15.17-16.58)
Not stated
Mean OHIP=1.19. (95%CI:1.11-1.27) 26% often self conscious
12% often have toothache
Not Stated
80
2.4.35 Discussion
The included articles, when critically appraised were found to be of a consistently high
standard as assessed using the STROBE standards [114]. The strength of the evidence
in each of the included studies was also robust. In each of the studies reported the
authors have made efforts to acknowledge potential limitations and sources of bias.
The study sample sizes were large, lending statistical credence to the results.
The included studies drew their participants from convenience samples from localities
where homeless people were known to congregate. Although a randomised control
sampling methodology, which would be most desirable in terms of study design, this
was not realistic for the recruitment of participants who experience social exclusion.
Authors of the various articles acknowledged this constraint as a potential limitation
[3-5, 11, 98, 112, 116, 117] and in some cases attempts were made to overcome the
difficulties in accessing participants for example by employing stratified cluster
sampling techniques [110].
Each of the studies included in this structured review focussed on the oral health of
homeless people. In each case it was reported that the oral health of the individuals
examined was poor. In addition, the impact of oral ill-health experience was found to
be high.
Dental decay was with associated homelessness [3-6, 70, 96, 98, 99, 110-112, 116-
118]. The higher than average level of dental caries experienced by homeless people is
in addition related to a diet high in sugars, oral hygiene behaviours (lack of fluoride
toothpaste use), and health behaviours detrimental to dental health [96]. Homeless
people also experienced high levels of periodontal disease [111, 112], and had an
increased risk of developing oral cancer [11].
81
The homeless populations from which the various study participants were drawn
consisted not only of different nationalities, but also a range of ethnic groups. It is
revealing that the high prevalence of oral diseases experienced by those described as
homeless is not limited to one particular region, but is a worldwide trend. Therefore
this structured review reveals the generalisability of the findings that the oral health of
people experiencing homelessness is poor.
As with all structured reviews there are limitations. The main limitation is the potential
for incomplete retrieval of relevant literature. In order to avoid this, every effort was
made in the design and implementation of this review to ensure that all relevant
articles would be identified and included, thus reducing the risk of inadvertently
omitting relevant articles. Another potential limitation in a review process is the risk of
bias, due to either the reporting author or the reviewer, which can impact upon the
findings of the review. In this process the risk of reporting bias was reduced by the
deployment of a second reviewer who, during the article inclusion/exclusion process
provided an independent opinion. However, despite these potential limitations, this
structured review has answered the research question and has demonstrated an
association between oral health and homelessness. The impacts of dental disease are
serious and have the potential to be life threatening, as in the case of infection
resulting from untreated dental abscess or oral cancer. Experience of dental disease
can lead to pain, swelling, interrupted sleep, reduced ability to eat and other
deleterious effects. The literature supports the assertion that poor oral health is
associated with being homeless. Moreover the high oral disease prevalence is
demonstrated to impact negatively upon homeless people’s quality of life.
Therefore as homeless populations throughout the world experience poor oral health,
it may be suggested that the association between oral health and homelessness is a
generalisable finding. The finding that poor oral health is associated with
homelessness in different countries and societies raises the proposition that oral health
82
may be used as an additional descriptor in such recognised typologies of
homelessness, as ETHOS [8].
2.5 Conclusions to the literature review
People who experience homelessness are now recognised as a diverse and
heterogeneous group. People who experience homelessness include lone children,
single parent families, women residing in refuges, immigrants, two parent families – in
fact anyone ranging from the very young to older people. It is of little surprise that the
disease prevalence experienced by homeless people has been attributed to factors
related to the ‘traditional’ homeless lifestyle, which has been characterised as chaotic,
itinerant and impoverished. Despite the acknowledgement of the various typologies
and descriptors of homelessness, it has been proposed that it may be the stress
associated with insecure housing, difficulties in functioning within society which give
rise to the potential for ill-health and that potency of these factors increase with the
duration of homelessness experienced.
Health inequalities can therefore be defined as differences in health experiences and
health outcomes between different population groups of those who experience
homelessness. The effects of these health inequalities are to be seen throughout
society, where substantial improvements in general and dental health over recent years
are unevenly distributed, with the less well off being left behind [122]. It is becoming
more and more evident that opportunities for good health are linked with the
opportunities afforded by improved socio-economics, and conversely socio-economic
disadvantage has a contribution to poorer health [123].
There are a number of interlinked contributory factors at work in this context. In the
first instance experience of such extreme material and emotional poverty as
encountered by those experiencing homelessness, is linked with experience of disease,
through increased exposure to risk factors for certain diseases – with poverty acting as
83
the driving force behind the development of high-risk health behaviours which act to
increase the risk of diseases. This is true for many diseases such as, for example,
cardiac disease, where the stress associated with extreme poverty can act as a risk
factor, and health behaviours such as poor dietary habits elevate the risk of disease
development [23].
This argument is applicable in the context of oral health where some of the worst levels
of dental decay are observed in those most affected by material poverty. Again this
theme follows through in the context of homelessness, where the homeless are seen to
experience higher levels of oral disease than the general, settled population [11, 106].
These links between poverty and ill-health are increasingly conspicuous in modern
society, and as a result, the causal factors are being examined more closely [122].
There is a heightened recognition of the importance of environment, behaviour, and
other factors such as gender, ethnicity and sexuality within the context of health
experience. For the homeless population, the impacts of environmental factors are
vital. They are also the most problematic to alter or control. Homelessness is likely to
result in increased exposure to the elements, such as cold, damp. Less obvious is the
increased exposure to environmental pollutants and noise, or the impact of shared
unsuitable or unfit housing, which can be overcrowded, have poor sanitation issues.
The homeless may also have difficulty in accessing the very basic provisions like clean
water and food. Every one of these elements can have a clear effect on health, and can
be seen to have immediate impacts on risk of disease experience [124].
Health behaviours are as important in the context of homelessness. As previously
described, for some, the general struggle for daily existence is likely to impact on their
health behaviours. Even if concerned, they may be unable to alter some of their
circumstances. The lack of access to hygiene facilities and the difficulty in carrying
possessions can act as an impediment to routine oral care [4]. Access to food may be
84
sporadic and opportunistic. For example, there are benefits to be had in eating healthy
foods, such as fruit and vegetables [125]. The importance of a balanced diet has been
well advertised. Unfortunately, healthy food costs more than fast food or junk food,
and is less easily obtained in convenience stores. A balanced meal can be difficult to
source and prepare if someone is sleeping rough and has no access to cooking
facilities.
As environment and behaviours which the homeless may share with some of the least
advantaged of the settled population, are important in the framework of health
inequalities, other factors are unique to the homeless experience. The stigma attached
to homelessness [9], and in particular, rough sleeping, can trigger behaviour in others
in the community similar to racism. This leads to ill treatment of the homeless in the
form of violence, abuse and prejudice, which can be very traumatic for the victims
[126]. In some cases this can affect their dental treatment where the perception that
treating such people can be hopeless has been acknowledged as a barrier to care [6].
Homeless people can easily withdraw from society, either on their path towards
homelessness, e.g. becoming distanced from family and friends due to lifestyle
choices, by choice as a reaction to ill treatment by others as described above, or by lack
of opportunity to interact with others. This withdrawal or marginalisation can lead to
socio-economic disadvantage through social exclusion [28]. An individual is considered
as being affected by social exclusion if they have low levels of social capital i.e. if they
have few social support structures to draw upon [127].
If homeless people have lost contact with friends and family, they will engage little with
the community, or have little if any interaction with others within society. Homeless
people are very likely to be affected by social exclusion, albeit to varying degrees. They
do not have a fixed address, and by definition cannot have neighbours. Friends and
family relationships are difficult to maintain, as they have no address or telephone
85
facilities, or direct access to social networking sites on the Internet. All the impetus for
maintaining relationships must come from the homeless person, in that they must
initiate contact. Given that chaos is often a feature of the homeless lifestyle, particularly
if affected by addiction [97], this can be difficult.
Engagement with the community is often unrewarding for the homeless person, with
negative experiences, violence or discrimination likely to provoke a reaction of further
withdrawal. The homeless can undoubtedly become detached from the structures of
society, and can pay the price of this social exclusion in their experience of ill health
and their ability to cope with disease, in terms of recovery, as affected by their inability
to access the familial, and otherwise, support structures which form the fabric of
society. Attendance at routine dental care appointments, for example, is affected with
low attendance rates reported [6, 96, 118]. Even when appointments are facilitated,
attendance is poor [98].
This disadvantaged group of people can experience a compounding disadvantage if the
negative effects of their social position are combined with difficulties in access to
healthcare, propagated by poor service design. There is a need for substantive evidence
which can be used as a platform for care providers and policy makers when planning
services which are designed to overcome barriers to homeless healthcare [116].
Oral healthcare delivery systems have been shown to be ineffective as demonstrated by
the high levels of unmet need within homeless populations throughout the U.K. [11,
70, 98], and elsewhere [4, 6, 96, 99, 116]. Oral health is an important component of
general health [128], and has significant impacts on quality of life and self worth [116,
129]. Furthermore, the causes and effects of oral disease are linked with general health
and there are potential benefits to approaching oral disease prevention and treatment
within the context of a holistic, common risk factor approach [108]. This study seeks
to evaluate homeless populations throughout Scotland, with a view to examining their
86
oral health, psychological and social well-being and the reciprocal relations between
these factors with a view to developing improved oral health delivery systems
throughout Scotland. Homeless dental care services are, therefore, often designed to
minimise the effects of the barriers to care and take into account the effects of social
exclusion and socio-economic disadvantage.
Although all of the articles included in this review examined homeless populations
within specific hostels or ‘other homeless’ contexts, none expressly evaluated the
health, oral health or psycho-social health of the participants within a framework of
context specific location or lifestyle choices. Given the recognised potential impacts of
environmental factors and health behaviours which are in turn influenced by the type of
homelessness experienced by individual homeless people, a typology with additional
oral health, health and psychosocial wellbeing descriptors would be beneficial to tailor
health interventions for the heterogeneous groups of people who have been described,
in the past, as ‘the homeless’.
The various typologies of homelessness while they describe homelessness in terms of
housing, duration of homelessness or factors associated with disaffection of society,
none have incorporated additional oral health, health and/or psychosocial wellbeing as
descriptors of the various typologies of homelessness. This is an important omission,
if those experiencing homelessness are to engage with health and oral health services.
In order to achieve engagement the need for tailoring to the needs of the homeless
individual in terms of typology and associated oral health, health and psychosocial
wellbeing is essential. Therefore there is a need to investigate whether oral health,
health and/or psychosocial wellbeing can be used as additional descriptors of
homelessness typology.
87
3.0 Purpose of the survey: aims and objectives
3.1 Introduction
3.2 Research question
3.3 Aim
3.4 Objectives
88
3.1 Introduction
The narrative literature review examined the various concepts of homelessness and
highlighted the heterogeneous nature of homeless populations, through an
examination of the prevalence and incidence of homelessness, and the definitions and
typologies which are used to characterise homelessness. These typologies were based
on the perceived type of homelessness ranging from absolute homelessness to
statutory homelessness [8]; the ETHOS typology which encompasses an
accommodation-related definition of homelessness [17] to those which provide a most
basic definition with homelessness as being ‘without a home’. [130] In addition the
narrative review demonstrated that those experiencing homelessness also experienced
increased physical ill-health and emotional ill-health (psycho-social impacts).
Within the literature there appeared to be little which related oral health to the
homelessness experience in terms of the typologies of homelessness [11, 111-113,
117]. In order to address this issue a second structured review was conducted. This
structured review examined the research question; ‘Does the empirical evidence show
an association between oral health and homelessness? The review showed an
association between oral health and homelessness. Moreover, since this finding could
be generalised for homeless populations in various countries it seemed reasonable to
suggest that oral health could act as an additional descriptor within a recognised
typology of homelessness such as the ETHOS typology. Therefore, there is a need first,
to examine the prevalence of oral health, health and/or psychosocial wellbeing within a
homeless population and secondly, to investigate whether oral health, health and/or
psychosocial wellbeing factors can discriminate between those who may descriptively
be described as roofless, houseless and other forms of homelessness (insecure and
inadequate housing) [8] and act as additional descriptors for the ETHOS typology of
homelessness.
89
3.2 Research question
Therefore the research question which arose from the literature was:
‘Can oral health, health and psycho-social wellbeing be used as additional descriptors
of a recognised typology of homelessness for a Scotland-wide homeless population to
inform the development of a tailored service provision to increase engagement with
health services?’ To operationalise this research question the decision was made to use
the ETHOS typology of homelessness which was internationally recognised and
considered to be a valid and reliable construct of homelessness. Therefore the ETHOS
typology was adopted to categorise homelessness as (1) ‘Roofless’, (2) ‘Houseless’ and
(3) ‘Other homeless’ (insecure and inadequate housing).
3.3 Aim
The aim was to investigate if oral health, health and psycho-social wellbeing can be
used as additional descriptors of the ETHOS typology of homelessness for a Scotland-
wide homeless population to inform the development of a tailored service provision to
increase engagement with health services.
3.4 Objectives
1. To describe the demographic profile of a Scotland-wide population of homeless
people
2. To examine the general health needs and health-related behaviours of a Scotland-
wide population of homeless people.
3. To examine the oral health needs, including oral health-related attitudes,
behaviours and dental treatment experiences of a Scotland-wide population of
homeless people.
4. To assess the psycho-social health including dental anxiety, oral health related
quality of life and depression of a Scotland-wide population of homeless people
5. To investigate whether oral health, health and/or psychosocial wellbeing factors can
discriminate between those who may be described as roofless, ‘houseless or
90
experiencing other forms of homelessness (insecure and inadequate housing) in a
Scotland -wide population of homeless people.
6. To examine whether oral health, health and/or psycho-social wellbeing factors are
additional descriptors for the ETHOS typology of homelessness in a Scotland-wide
population of homeless people, and may inform health service provision.
91
4.0 Method
4.1 The sample
4.2 Ethical considerations
4.3 The questionnaire
4.4 The oral health examination
4.5 Statistical analysis
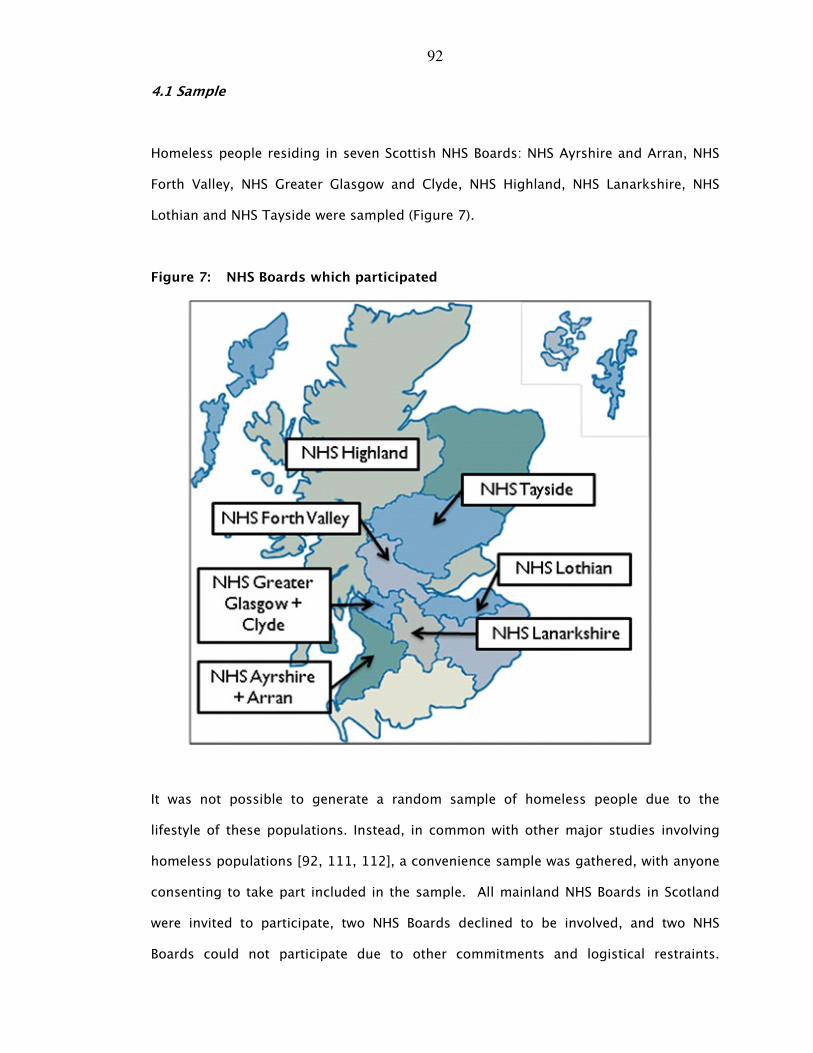
92
4.1 Sample
Homeless people residing in seven Scottish NHS Boards: NHS Ayrshire and Arran, NHS
Forth Valley, NHS Greater Glasgow and Clyde, NHS Highland, NHS Lanarkshire, NHS
Lothian and NHS Tayside were sampled (Figure 7).
Figure 7: NHS Boards which participated
It was not possible to generate a random sample of homeless people due to the
lifestyle of these populations. Instead, in common with other major studies involving
homeless populations [92, 111, 112], a convenience sample was gathered, with anyone
consenting to take part included in the sample. All mainland NHS Boards in Scotland
were invited to participate, two NHS Boards declined to be involved, and two NHS
Boards could not participate due to other commitments and logistical restraints.
93
Throughout the data collection period, homeless people were invited by the dental
team examiners to participate, and those consenting were invited to take part. Various
venues across the seven NHS Boards were visited, with the aim of recruiting
participants, on several occasions and at different times, with a snowball effect
generated, maximising the number of people participating in the survey. Table 10
shows the venues and procedures used to gather the sample of homeless people. The
venues included drop-in centres, shelters, soup kitchens, women’s refuges and night
shelters. In order to gather the sample these venues were visited during the day and, in
some instances, at night.
4.2 Ethical considerations
The National Research Ethics Service was contacted concerning the requirement for
ethical approval. The Integrated Research Application System (IRAS) responded to state
that ethical approval from an NRES was not required (see Appendix 9.3). This
information was provided to each of the NHS Boards and they were asked to liaise with
their relevant local NHS R+D organisations.
Ethical approval was obtained from the University of Dundee Research Ethics
Committee (UREC 9005). Information sheets detailing each aspect of the survey
together with written consent forms were provided to each participant. Informed
consent was sought from each of the participants prior to taking part in the needs
assessment (Appendix 9.4).
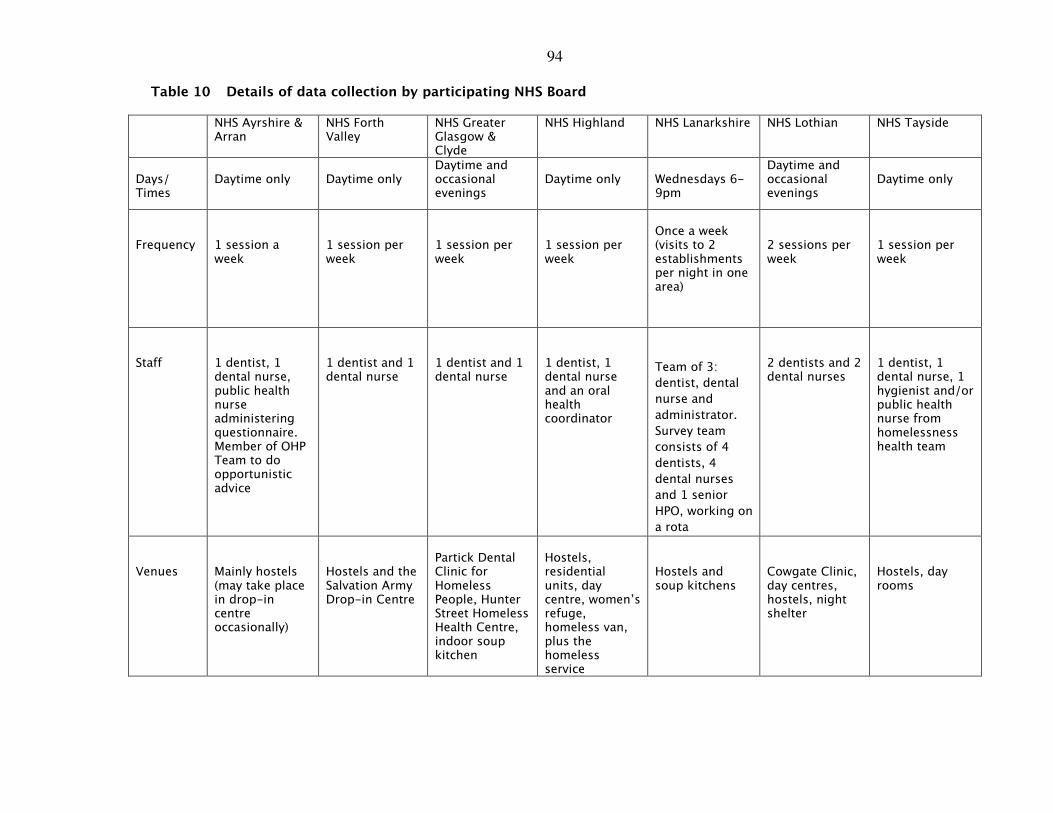
94
Table 10 Details of data collection by participating NHS Board
NHS Ayrshire & Arran
NHS Forth Valley
NHS Greater Glasgow & Clyde
NHS Highland NHS Lanarkshire NHS Lothian NHS Tayside
Days/ Times
Daytime only
Daytime only
Daytime and occasional evenings
Daytime only
Wednesdays 6-9pm
Daytime and occasional evenings
Daytime only
Frequency
1 session a week
1 session per week
1 session per week
1 session per week
Once a week (visits to 2 establishments per night in one area)
2 sessions per week
1 session per week
Staff
1 dentist, 1 dental nurse, public health nurse administering questionnaire. Member of OHP Team to do opportunistic advice
1 dentist and 1 dental nurse
1 dentist and 1 dental nurse
1 dentist, 1 dental nurse and an oral health coordinator
Team of 3:
dentist, dental
nurse and
administrator.
Survey team
consists of 4
dentists, 4
dental nurses
and 1 senior
HPO, working on
a rota
2 dentists and 2 dental nurses
1 dentist, 1 dental nurse, 1 hygienist and/or public health nurse from homelessness health team
Venues
Mainly hostels (may take place in drop-in centre occasionally)
Hostels and the Salvation Army Drop-in Centre
Partick Dental Clinic for Homeless People, Hunter Street Homeless Health Centre, indoor soup kitchen
Hostels, residential units, day centre, women’s refuge, homeless van, plus the homeless service
Hostels and soup kitchens
Cowgate Clinic, day centres, hostels, night shelter
Hostels, day rooms
95
4.3 The questionnaire
The questionnaire administered to participants consisted of six parts (Appendix 9.5)
and assessed demography, general health and related behaviours, psychosocial
wellbeing and oral health and oral health-related attitudes and behaviours.
Section 1: Demographic profile:
Section 1 assessed the participant’s demographic profile. These questions asked about
the participants’ age, gender, marital status, living status, previous employment status
and reasons for homelessness.
Section 2: Health and health-related behaviours
This section assessed the participants’ health. It required the participants to provide
relevant details regarding their medical history. These questions included asking about
heart disease, hypertension, epilepsy etc. The participants were also asked about
prescribed medication and current use of medical services. With regard to their health
behaviours the sample population were asked about their use of tobacco, smoking
habits, alcohol and drug use.
Section 3 Psycho-social well-being
Three aspects of psychosocial wellbeing were assessed. These were dental anxiety,
oral health related quality of life and depression.
• Dental anxiety: Dental anxiety was measured using the Modified Dental Anxiety
Scale (Humphris et al [132]). This is a 5 item inventory which assesses dental
anxiety on a 5-point scale ranging from not anxious (5) to extremely anxious (25).
The participants are asked to rate the level of dental anxiety, when waiting for dental
treatment, waiting for the drill, scale and polish and when receiving a local
anaesthetic injection. Scores over 19 are said to be indicated dental phobia, with
12% of UK adults belong classified as having extreme dental anxiety. Scores of
96
10.50 are considered the normative value for a general practice patient population
[133]. The validity and reliability of this measure has been tested [132].
• Oral health-related quality of life: The Oral Health Impact Profile (OHIP-14) is a
validated, reliable 14-item inventory was used to assess oral health-related quality
of life [120]. It is based on a hierarchy of impacts arising from oral disease, ranging
in severity, and includes questions on functional limitation (e.g. pronouncing words),
physical pain (e.g. painful aching mouth), psychological discomfort (e.g. feeling self-
conscious), physical disability (e.g. interrupted meals), psychological disability (e.g.
feeling embarrassed), social disability (e.g. irritable with others) and handicap (e.g.
life less satisfying). Respondents are asked how frequently they had experienced
each of the 14 impacts, such as ‘painful aching in your mouth’ in the previous 12
months. Responses are made on a five-point Likert scale, with scores ranging from
0 (never) to 4 (very often). Individual item scores are presented individually as well
as overall mean total impact scores across all 14 items.
• Depression status: the Centre for Epidemiological Studies Depression Scale (CES-D)
[134]. Depression was measured using the valid and reliable CES-D. The CES-D is a
self-reported scale consisting of twenty items reflecting dimensions of depression,
such as depressed mood, feelings of hopelessness and interactions with others. This
questionnaire has been demonstrated to have high internal consistency (0.91) [134].
The questions are answered on a four-point Likert scale and the respondents are
asked to rate their experience of each item in the previous week, the responses
ranged from rarely or none of the time (scoring 0) to most or all of the time (scoring
3). Four of the twenty items (e.g. I feel happy) are scored positively i.e. the
responses ranged from 3 (rarely or none of the time) to 0 (most or all of the time).
Total scores range from 0 to 60, with scores of 16 or over indicating depressed
mood. In a survey of people residing in north London the prevalence of depression
as assessed by the CES-D was 38.9%. [134]
97
Section 4 Oral health related attitudes and behaviours
The final part of the questionnaire recorded the reason for last attending the dentist
(e.g. check-up or trouble with teeth) and previous dental treatment experiences (e.g.
fillings and extractions).
Opinions about going to the dentist were also assessed in this section, using measures
from the Adult Dental Health Survey 1998 [135] where nine statements related to
going to the dentist are made. The statements related to attending the dentist with
toothache, waiting to see the dentist, whether drop-in facilities were desirable,
behaviour of the dental receptionist, feelings about the type of treatment desirable and
the accessibility of treatment. Participants are asked to rate their responses on a four-
point Likert scale, ranging from the least weighted item ‘definitely feel like that’
(scoring 0) to the most weighted item ‘don’t feel like that’ (scoring 4).
4.4 Oral health examination
An oral health survey collection form, completed by the examiners, recorded
information regarding the incidence of oral mucosal lesions, and the participants’
obvious decay experience. In addition the amount of plaque present, the number of
standing teeth and the presence or absence of dentures was also collected. The Basic
Inspection protocol from the National Dental Inspection Programme was used for the
clinical examination. The NDIP criteria for obvious decay experience involves ‘visual-
only detection of missing teeth, filled teeth and teeth with obvious dentinal decay’
(D3cvMFT) [106]. The presence and absence of plaque was assessed, using the
Simplified Oral Hygiene Index (OHI-S). Oral mucosal integrity was evaluated by noting
the presence of any mucosal lesion. The protocol described above, was chosen as the
criteria were reliable, tested and robust epidemiological measures.
98
In order to ensure inter-examiner reliability, prior to the survey commencement, the
dentists (dental examiners) and dental health professionals (scribes) who were to be
involved in the clinical data collection were provided with training targeted towards
dental health of homeless people. This training was specifically tailored towards
improving understanding of the procedures and the clinical data collection (including
oral mucosal lesion, obvious decay experience and plaque score analysis). The training
day was designed to standardise dental examiners and ensure fidelity of questionnaire
administration [106].
Calibration of the dental examiners was not carried out as the dentists acting as
examiners were drawn from the Salaried Dental Services and had recent and previous
experience of calibration for the Scottish National Dental Inspection Programme (NDIP).
As mentioned above the criteria, used in the Basic Inspection protocol of NDIP were
used in this survey of homeless people. In order to facilitate standardisation of dental
examiners Professor Gail Douglas, University of Leeds, and Mr Chris Cunningham
provided a workshop on the identification of obvious decay experience using the NDIP
criteria and Dr Anita Nolan, Consultant in Oral Medicine, NHS Tayside provided an
overview of oral mucosal lesions including squamous cell carcinoma.
A number of talks were provided to ensure that all those participating in the data
collection knew about the various psychological inventories (e.g. the Oral Health
Impact Profile (OHIP 14) within the questionnaire. These talks were provided by:
Professor Ruth Freeman, Emma Coles from Dental Health Services Research Unit,
Dundee and Rhona Brown from NHS Highland. In a question and answer session,
conducted by Professor Ruth Freeman, ensured that those dental health professionals
administering the questionnaire did so using standardised procedure (e.g. not
assisting to answer any question for the homeless person participating); that care
pathways were put in place if a respondent became very distressed during the
administration of the questionnaire and required referral to mental health services.
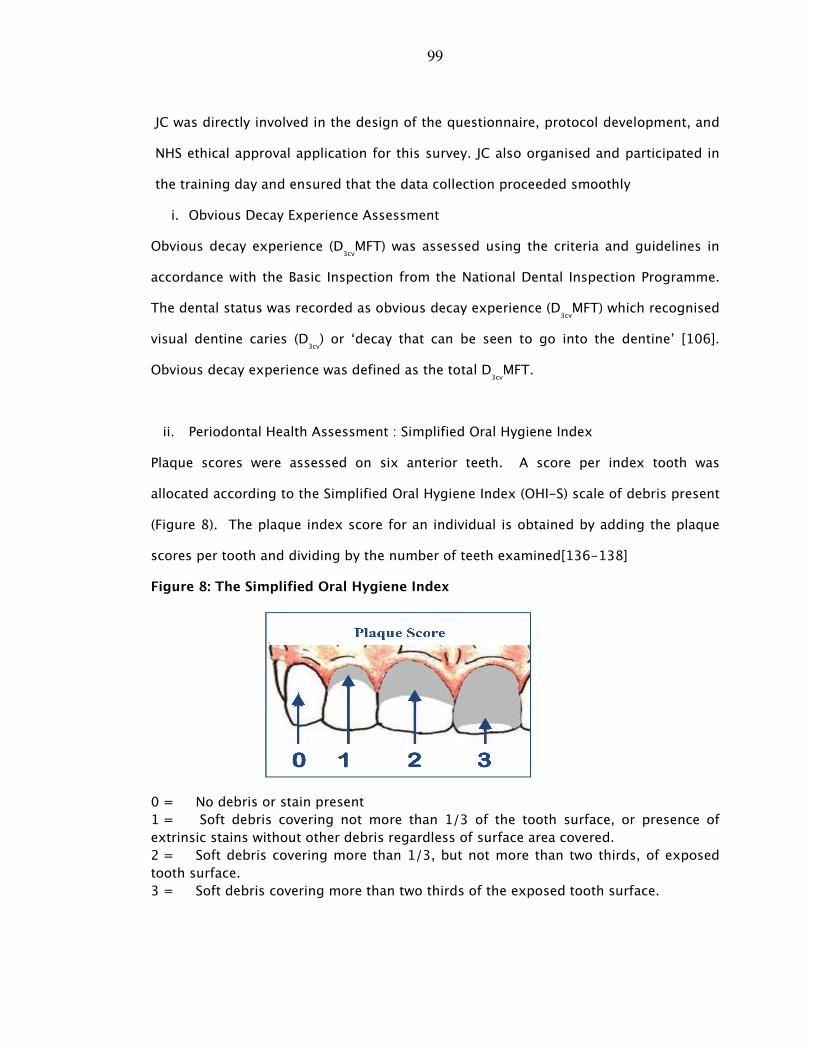
99
JC was directly involved in the design of the questionnaire, protocol development, and
NHS ethical approval application for this survey. JC also organised and participated in
the training day and ensured that the data collection proceeded smoothly
i. Obvious Decay Experience Assessment
Obvious decay experience (D3cvMFT) was assessed using the criteria and guidelines in
accordance with the Basic Inspection from the National Dental Inspection Programme.
The dental status was recorded as obvious decay experience (D3cvMFT) which recognised
visual dentine caries (D3cv) or ‘decay that can be seen to go into the dentine’ [106].
Obvious decay experience was defined as the total D3cvMFT.
ii. Periodontal Health Assessment : Simplified Oral Hygiene Index
Plaque scores were assessed on six anterior teeth. A score per index tooth was
allocated according to the Simplified Oral Hygiene Index (OHI-S) scale of debris present
(Figure 8). The plaque index score for an individual is obtained by adding the plaque
scores per tooth and dividing by the number of teeth examined[136-138]
Figure 8: The Simplified Oral Hygiene Index
0 = No debris or stain present
1 = Soft debris covering not more than 1/3 of the tooth surface, or presence of
extrinsic stains without other debris regardless of surface area covered.
2 = Soft debris covering more than 1/3, but not more than two thirds, of exposed
tooth surface.
3 = Soft debris covering more than two thirds of the exposed tooth surface.
100
iii. Oral Mucosa
Oral mucosa is the primary protective mucous membrane that lines the cavity of the
mouth, including the gums. It covers six areas of the oral cavity: lips, buccal mucosa
(cheeks), and tongue, floor of the mouth, palate and fauces (throat). A score was
allocated per intra-oral mucosal site recording: lesion absent, lesion present (monitor)
or lesion present (refer for specialist opinion).
iv. Denture Assessment
The presence of complete (upper and lower) and partial (upper and lower) dentures was
recorded. All dentures were examined for stability, retention and occlusion to provide
an assessment of overall clinical satisfaction.
4.5 Statistical analysis
The data were returned in the form of completed questionnaires, collated, coded and
entered onto an SPSS data base. It was analysed using SPSS version 18.0. The data
were subjected to basic statistical analysis in the form of frequency distributions, Chi-
squared analysis, t-tests, and Analysis of Variance (ANOVA) with the post hoc Scheffe
test to determine statistical differences between groups. The data were also subjected
to a principal components analysis, where items are transmogrified into factors and
scales which are then subjected to variance analysis, with the internal reliability tested
using Cronbach’s alpha.
In addition canonical discriminate analysis, which allows variance between groups of
cases (in this instance between the groups ‘roofless’, ‘houseless’ and ‘other homeless’)
to be summarised was undertaken, which allowed the characteristic of the three groups
to be realised. A multi-nominal logistic regression analysis was conducted and
included those explanatory factors that were shown to have significant univariate
effects with regard to distinguishing between the dependent variable i.e. the ETHOS
typology of homelessness (‘roofless’, ‘houseless’ and ‘other homeless’ groups). In this
101
multi-nominal logistic regression procedure ‘houseless’ group was used as the
reference category and the ‘roofless’ and ‘other homeless’ were used for comparison
purposes. The statistical procedure allowed characterisation of the ETHOS typology of
homelessness.
102
5.0 Results
5.1 Sample
5.2 Demographic profile
5.3 Health behaviours and health status
5.4 Oral health and oral health behaviours
5.5 Psycho-social health
5.6 Categorising types of homelessness: health, oral health and psycho-
social descriptors
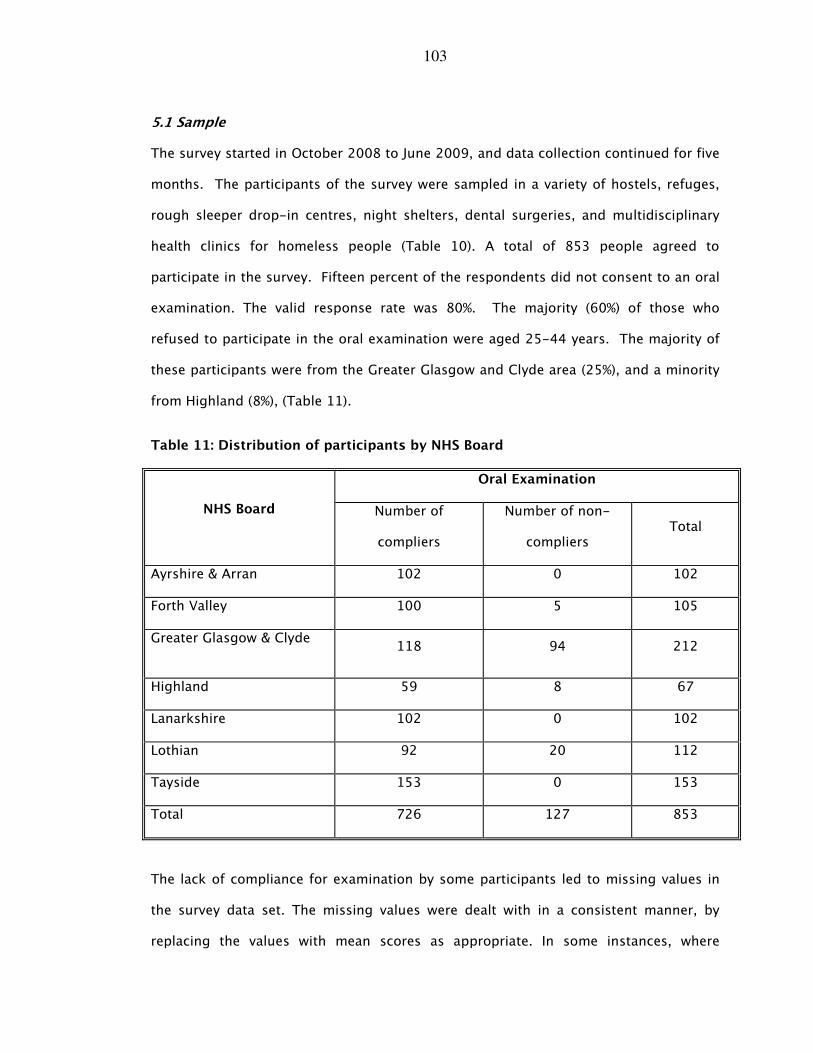
103
5.1 Sample
The survey started in October 2008 to June 2009, and data collection continued for five
months. The participants of the survey were sampled in a variety of hostels, refuges,
rough sleeper drop-in centres, night shelters, dental surgeries, and multidisciplinary
health clinics for homeless people (Table 10). A total of 853 people agreed to
participate in the survey. Fifteen percent of the respondents did not consent to an oral
examination. The valid response rate was 80%. The majority (60%) of those who
refused to participate in the oral examination were aged 25-44 years. The majority of
these participants were from the Greater Glasgow and Clyde area (25%), and a minority
from Highland (8%), (Table 11).
Table 11: Distribution of participants by NHS Board
Oral Examination
NHS Board Number of
compliers
Number of non-
compliers Total
Ayrshire & Arran 102 0 102
Forth Valley 100 5 105
Greater Glasgow & Clyde 118 94 212
Highland 59 8 67
Lanarkshire 102 0 102
Lothian 92 20 112
Tayside 153 0 153
Total 726 127 853
The lack of compliance for examination by some participants led to missing values in
the survey data set. The missing values were dealt with in a consistent manner, by
replacing the values with mean scores as appropriate. In some instances, where
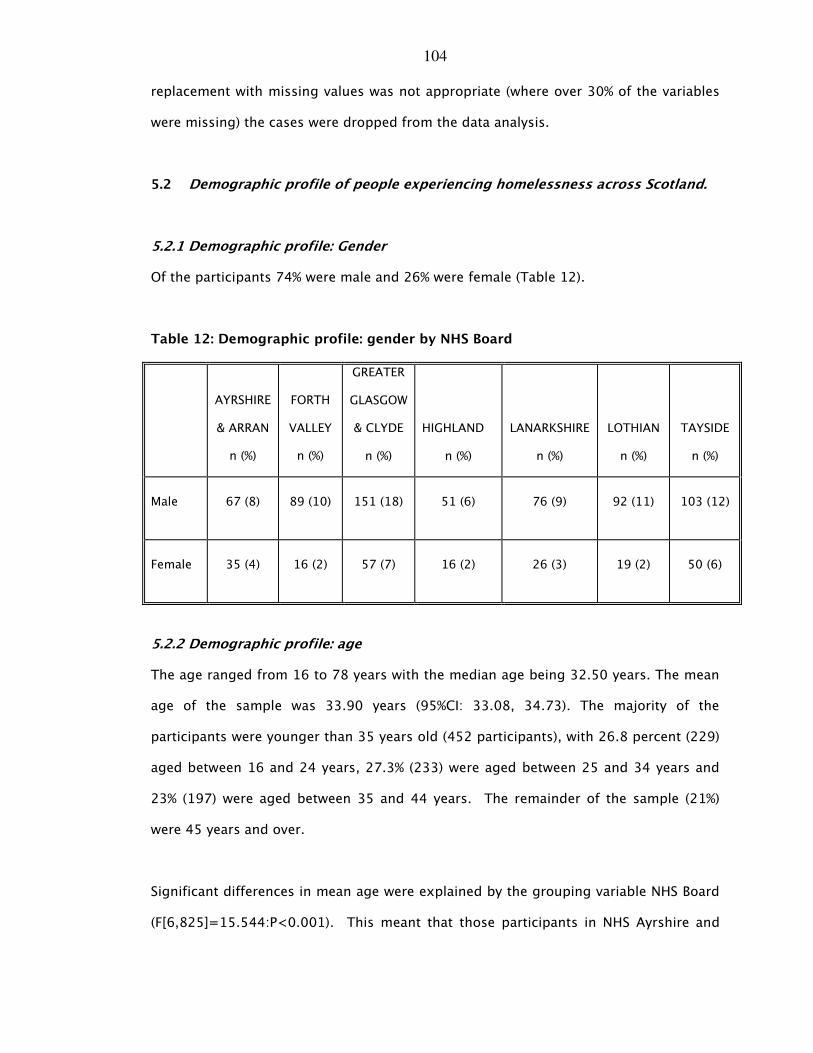
104
replacement with missing values was not appropriate (where over 30% of the variables
were missing) the cases were dropped from the data analysis.
5.2 Demographic profile of people experiencing homelessness across Scotland.
5.2.1 Demographic profile: Gender
Of the participants 74% were male and 26% were female (Table 12).
Table 12: Demographic profile: gender by NHS Board
AYRSHIRE
& ARRAN
n (%)
FORTH
VALLEY
n (%)
GREATER
GLASGOW
& CLYDE
n (%)
HIGHLAND
n (%)
LANARKSHIRE
n (%)
LOTHIAN
n (%)
TAYSIDE
n (%)
Male 67 (8) 89 (10) 151 (18) 51 (6) 76 (9) 92 (11) 103 (12)
Female 35 (4) 16 (2) 57 (7) 16 (2) 26 (3) 19 (2) 50 (6)
5.2.2 Demographic profile: age
The age ranged from 16 to 78 years with the median age being 32.50 years. The mean
age of the sample was 33.90 years (95%CI: 33.08, 34.73). The majority of the
participants were younger than 35 years old (452 participants), with 26.8 percent (229)
aged between 16 and 24 years, 27.3% (233) were aged between 25 and 34 years and
23% (197) were aged between 35 and 44 years. The remainder of the sample (21%)
were 45 years and over.
Significant differences in mean age were explained by the grouping variable NHS Board
(F[6,825]=15.544:P<0.001). This meant that those participants in NHS Ayrshire and
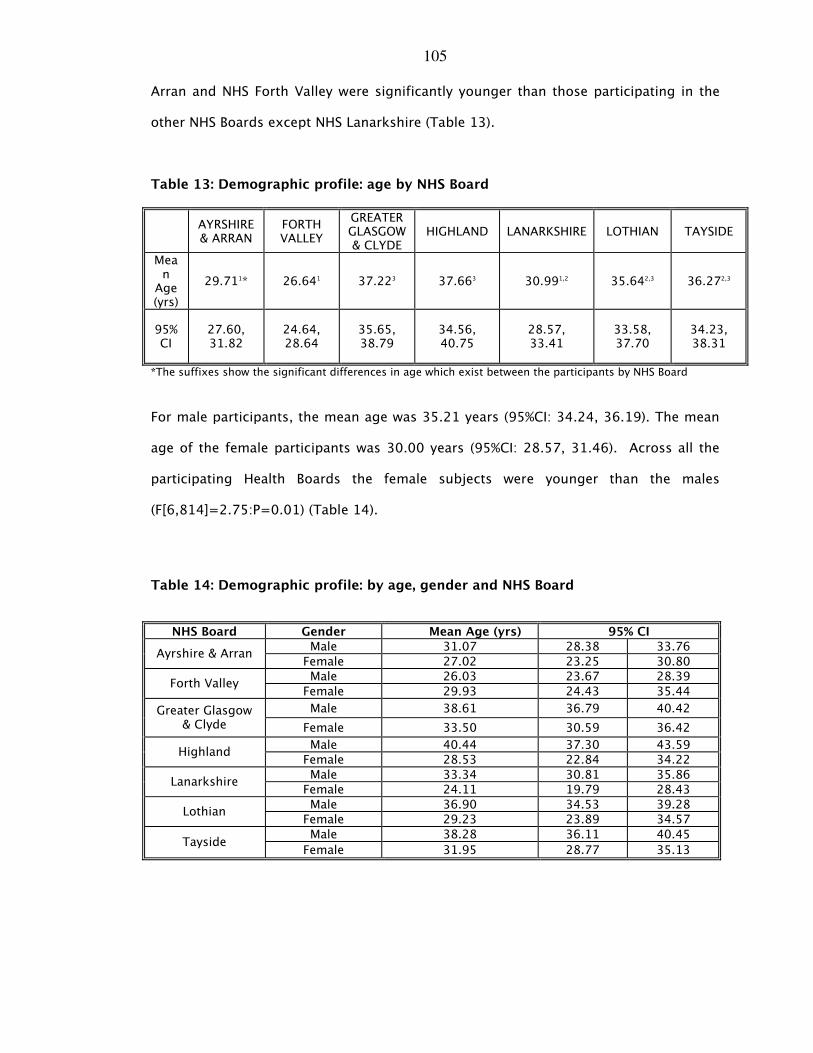
105
Arran and NHS Forth Valley were significantly younger than those participating in the
other NHS Boards except NHS Lanarkshire (Table 13).
Table 13: Demographic profile: age by NHS Board
AYRSHIRE & ARRAN
FORTH VALLEY
GREATER GLASGOW & CLYDE
HIGHLAND LANARKSHIRE LOTHIAN TAYSIDE
Mean Age (yrs)
29.711* 26.641 37.223 37.663 30.991,2 35.642,3 36.272,3
95% CI
27.60, 31.82
24.64, 28.64
35.65, 38.79
34.56, 40.75
28.57, 33.41
33.58, 37.70
34.23, 38.31
*The suffixes show the significant differences in age which exist between the participants by NHS Board
For male participants, the mean age was 35.21 years (95%CI: 34.24, 36.19). The mean
age of the female participants was 30.00 years (95%CI: 28.57, 31.46). Across all the
participating Health Boards the female subjects were younger than the males
(F[6,814]=2.75:P=0.01) (Table 14).
Table 14: Demographic profile: by age, gender and NHS Board
NHS Board Gender Mean Age (yrs) 95% CI
Male 31.07 28.38 33.76 Ayrshire & Arran
Female 27.02 23.25 30.80
Male 26.03 23.67 28.39 Forth Valley
Female 29.93 24.43 35.44
Male 38.61 36.79 40.42 Greater Glasgow & Clyde Female 33.50 30.59 36.42
Male 40.44 37.30 43.59 Highland
Female 28.53 22.84 34.22
Male 33.34 30.81 35.86 Lanarkshire
Female 24.11 19.79 28.43
Male 36.90 34.53 39.28 Lothian
Female 29.23 23.89 34.57
Male 38.28 36.11 40.45 Tayside
Female 31.95 28.77 35.13
106
5.2.3 Demographic profile: ethnicity
Over 90% (779) of the sample was Caucasian, with other ethnic groups being
represented as follows: African/Caribbean (15), asylum seekers (7), Gypsy/travellers
(3), Asian (2) or Chinese (1).
5.2.4 Demographic profile: occupation
The Standard Occupational Classification 2000 (SOC 2000) [138] was used as a
comparator when classifying the stated occupations or previous occupations as
described by the survey participants. This classification system contains nine major
groups. Eight additional occupational categories described those not included in the
Standard Occupational Classification list (Table 15). Forty-five percent of the sample
did not provide information on their current or previous employment and were
assumed to be unemployed. A majority of those participants who did provide
occupation were currently employed or had previously worked in skilled trades (25%) or
unskilled occupations (21.6%).
5.2.5 Demographic profile: living arrangements
Ninety percent (770) provided information on their current living arrangements. Table
16 provides a summary of the current living arrangements of the sample, where the
participants are categorised as ‘roofless’, ‘houseless’ or ‘other homeless’ categories.
Hostel residents (31%) and temporary accommodation (20%) accounted for the living
arrangements for the majority of participants. Two percent of those interviewed
described themselves as rough sleepers. Nine percent of participants stated that they
had been recently released from prison or Young Offenders Institute.

107
Table 15: Demographic profile: stated occupations of participants
Stated occupation Number Percentage
Managers & Senior Officials 8 1.7
Professional Occupations 8 1.7
Associate Professional & Technical Occupations 20 4.3
Administrative and Secretarial Occupations 9 1.9
Skilled Trades Occupations 117 25.0
Personal Service Occupations 14 3.0
Sales & Customer Service Occupations 20 4.3
Process, Plant & Machine Operatives 39 8.3
Unskilled Occupations 101 21.6
Unemployed 83 17.7
In Education 13 2.8
Homemaker 6 1.3
Sick/Disabled 8 1.7
Ex-Armed Forces 9 1.9
Ex-prisoner 1 0.2
Occupation not stated or inadequately described 10 2.1
Not classifiable for other reasons 2 0.4
The participants living status was divided into three groups based on ETHOS typological
classification [17]. Table 16 shows the number and proportions of the sample who
were characterised as ‘roofless’ (6%); ‘houseless’ (73%) and ‘other homeless’ (21%).
Eighty-three participants did not reply and were omitted from the statistical analysis.
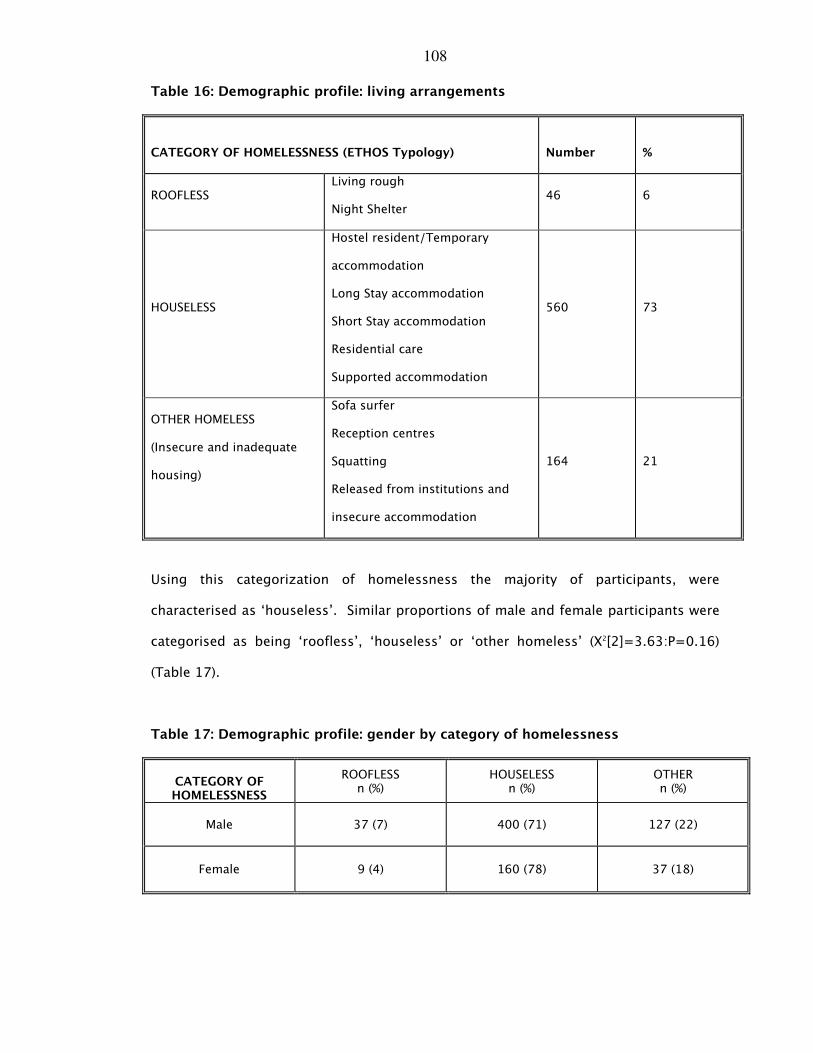
108
Table 16: Demographic profile: living arrangements
CATEGORY OF HOMELESSNESS (ETHOS Typology)
Number
%
ROOFLESS Living rough
Night Shelter 46 6
HOUSELESS
Hostel resident/Temporary
accommodation
Long Stay accommodation
Short Stay accommodation
Residential care
Supported accommodation
560 73
OTHER HOMELESS
(Insecure and inadequate
housing)
Sofa surfer
Reception centres
Squatting
Released from institutions and
insecure accommodation
164 21
Using this categorization of homelessness the majority of participants, were
characterised as ‘houseless’. Similar proportions of male and female participants were
categorised as being ‘roofless’, ‘houseless’ or ‘other homeless’ (X2[2]=3.63:P=0.16)
(Table 17).
Table 17: Demographic profile: gender by category of homelessness
CATEGORY OF HOMELESSNESS
ROOFLESS n (%)
HOUSELESS n (%)
OTHER n (%)
Male 37 (7) 400 (71) 127 (22)
Female 9 (4) 160 (78) 37 (18)
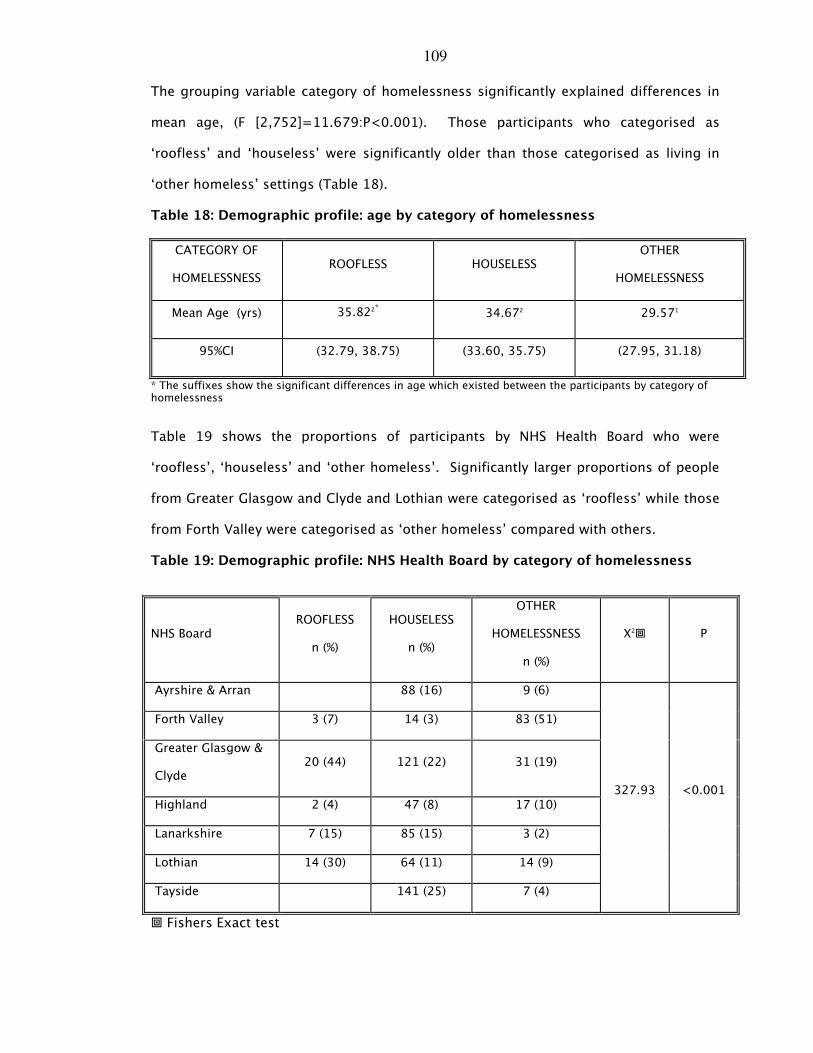
109
The grouping variable category of homelessness significantly explained differences in
mean age, (F [2,752]=11.679:P<0.001). Those participants who categorised as
‘roofless’ and ‘houseless’ were significantly older than those categorised as living in
‘other homeless’ settings (Table 18).
Table 18: Demographic profile: age by category of homelessness
CATEGORY OF
HOMELESSNESS ROOFLESS HOUSELESS
OTHER
HOMELESSNESS
Mean Age (yrs) 35.822* 34.672 29.571
95%CI (32.79, 38.75) (33.60, 35.75) (27.95, 31.18)
* The suffixes show the significant differences in age which existed between the participants by category of homelessness
Table 19 shows the proportions of participants by NHS Health Board who were
‘roofless’, ‘houseless’ and ‘other homeless’. Significantly larger proportions of people
from Greater Glasgow and Clyde and Lothian were categorised as ‘roofless’ while those
from Forth Valley were categorised as ‘other homeless’ compared with others.
Table 19: Demographic profile: NHS Health Board by category of homelessness
� Fishers Exact test
NHS Board ROOFLESS
n (%)
HOUSELESS
n (%)
OTHER
HOMELESSNESS
n (%)
X2� P
Ayrshire & Arran 88 (16) 9 (6)
Forth Valley 3 (7) 14 (3) 83 (51)
Greater Glasgow &
Clyde 20 (44) 121 (22) 31 (19)
Highland 2 (4) 47 (8) 17 (10)
Lanarkshire 7 (15) 85 (15) 3 (2)
Lothian 14 (30) 64 (11) 14 (9)
Tayside 141 (25) 7 (4)
327.93 <0.001
110
5.2.6 Demographic profile: family status
Seventy-seven percent (622) of the sample were single. Twelve percent (103) stated
that they lived with a partner. Ten percent of the participants described themselves as
living in one-parent (33) or two-parent (47) families. One hundred and five
participants stated that they had children of which 44% (46) had one child, 30% (31) had
two children, 12% (13) had three children and 14% (15) had four or more children.
One hundred and five of the participants stated they had children. Of these, 80% (87)
had children were aged between 16 and 44 years of age. A high number of 16-24 year
olds (42%) were living with a partner and significantly larger proportions of those aged
55+ (85%) were single compared with others (X2[12]=34.17:P=0.001). Significantly
larger proportions of women (56%) compared with men (35%) lived in families with their
children (X2[2]=72.57:P<0.001). However significantly larger proportions of female
(79%) compared with male (21%) participants described themselves as 1 parent families
(X2[3]=87.28:P<0.001).
Table 20 shows the family status of participants by NHS Board. The majority of
participants with children resided in NHS Forth Valley (28%), NHS Greater Glasgow and
Clyde (21%) and in NHS Tayside (26%). Significantly larger proportions of participants
from NHS Forth Valley were living in two-parent families (X2[18]=73.97:P<0.001).

111
Table 20: Demographic profile: comparison of family status by NHS Board
There was an association between categorisation of homelessness and family type.
Significantly larger proportions of people categorised as being ‘houseless’ were single
or lived with their partners compared to ‘other homeless’ categories (Table 21).
Table 21: Demographic profile: comparison of family status by category of homelessness
CATEGORY OF HOMELESSNESS
ROOFLESS n (%)
HOUSELESS n (%)
OTHER HOMELESS
n (%) X2� P
Single 36 (6) 443(75) 103 (18)
With partner 1 (1) 71 (13) 22 (23)
1 parent family 3 (10) 20 (3) 8 (25)
2 parent family 4 (10) 17 (3) 20 (48)
28.95 <0.001
� Fisher’s exact test
Family type
NHS Board Single n (%)
With Partner n (%)
1 Parent Family n (%)
2 Parent Family n (%)
Ayrshire & Arran 78 (13) 17(17) 5(16) 0
Forth Valley 59 (10) 19 (18) 3 (9) 22 (47)
Greater Glasgow & Clyde 152 (24) 23 (22) 9 (27) 12 (26)
Highland 51 (8) 10 (10) 3 (9) 1(2)
Lanarkshire 88 (14) 6 (6) 3 (9) 2 (4)
Lothian 82 (13) 11 (11) 2 (6) 2 (4)
Tayside 112 (18) 17 (16) 8 (24) 8 (17)
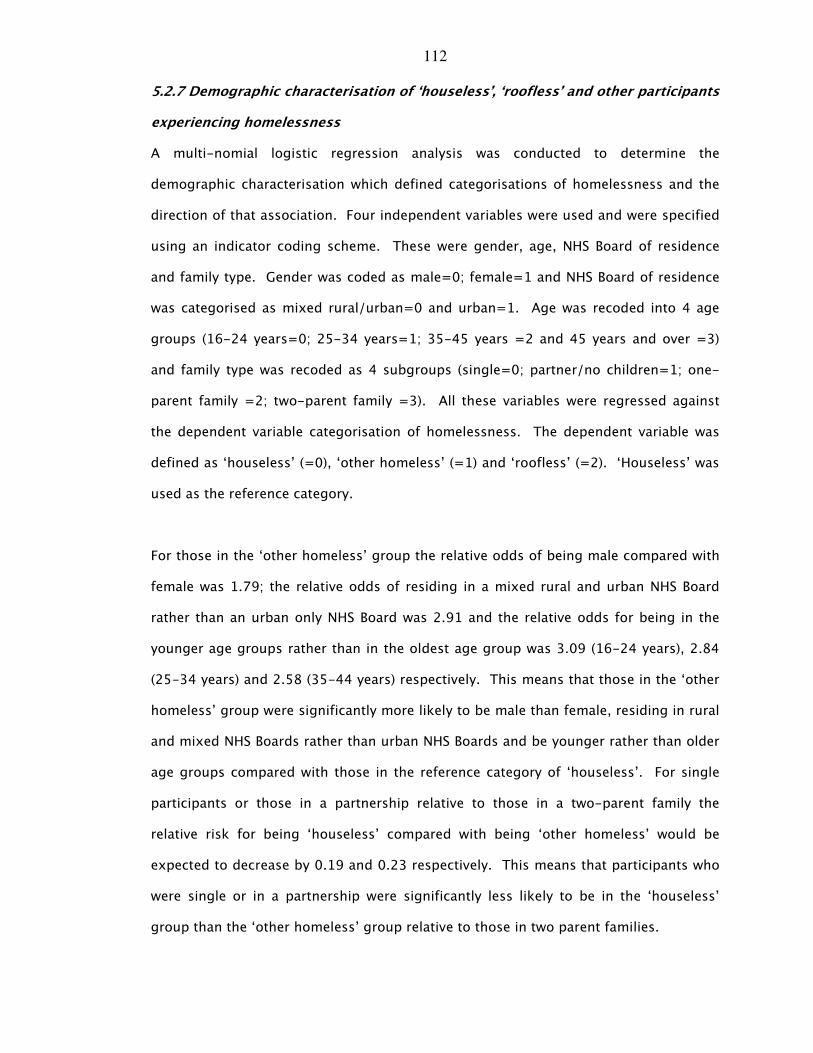
112
5.2.7 Demographic characterisation of ‘houseless’, ‘roofless’ and other participants
experiencing homelessness
A multi-nomial logistic regression analysis was conducted to determine the
demographic characterisation which defined categorisations of homelessness and the
direction of that association. Four independent variables were used and were specified
using an indicator coding scheme. These were gender, age, NHS Board of residence
and family type. Gender was coded as male=0; female=1 and NHS Board of residence
was categorised as mixed rural/urban=0 and urban=1. Age was recoded into 4 age
groups (16-24 years=0; 25-34 years=1; 35-45 years =2 and 45 years and over =3)
and family type was recoded as 4 subgroups (single=0; partner/no children=1; one-
parent family =2; two-parent family =3). All these variables were regressed against
the dependent variable categorisation of homelessness. The dependent variable was
defined as ‘houseless’ (=0), ‘other homeless’ (=1) and ‘roofless’ (=2). ‘Houseless’ was
used as the reference category.
For those in the ‘other homeless’ group the relative odds of being male compared with
female was 1.79; the relative odds of residing in a mixed rural and urban NHS Board
rather than an urban only NHS Board was 2.91 and the relative odds for being in the
younger age groups rather than in the oldest age group was 3.09 (16-24 years), 2.84
(25-34 years) and 2.58 (35-44 years) respectively. This means that those in the ‘other
homeless’ group were significantly more likely to be male than female, residing in rural
and mixed NHS Boards rather than urban NHS Boards and be younger rather than older
age groups compared with those in the reference category of ‘houseless’. For single
participants or those in a partnership relative to those in a two-parent family the
relative risk for being ‘houseless’ compared with being ‘other homeless’ would be
expected to decrease by 0.19 and 0.23 respectively. This means that participants who
were single or in a partnership were significantly less likely to be in the ‘houseless’
group than the ‘other homeless’ group relative to those in two parent families.
113
For single participants or those in a partnership relative to those in a two-parent family
the relative risk for being ‘houseless’ compared with being ‘roofless’ would be
expected to decrease by 0.29 and 0.06 respectively. This means that participants who
were single were significantly less likely to be in the ‘houseless’ group than in the
‘roofless’ group, relative to those in two-parent families. Also, participants who were
in a partnership were less likely to be in the ‘houseless’ group than in the ‘roofless’
group. No other significant effects were shown (Table 22).
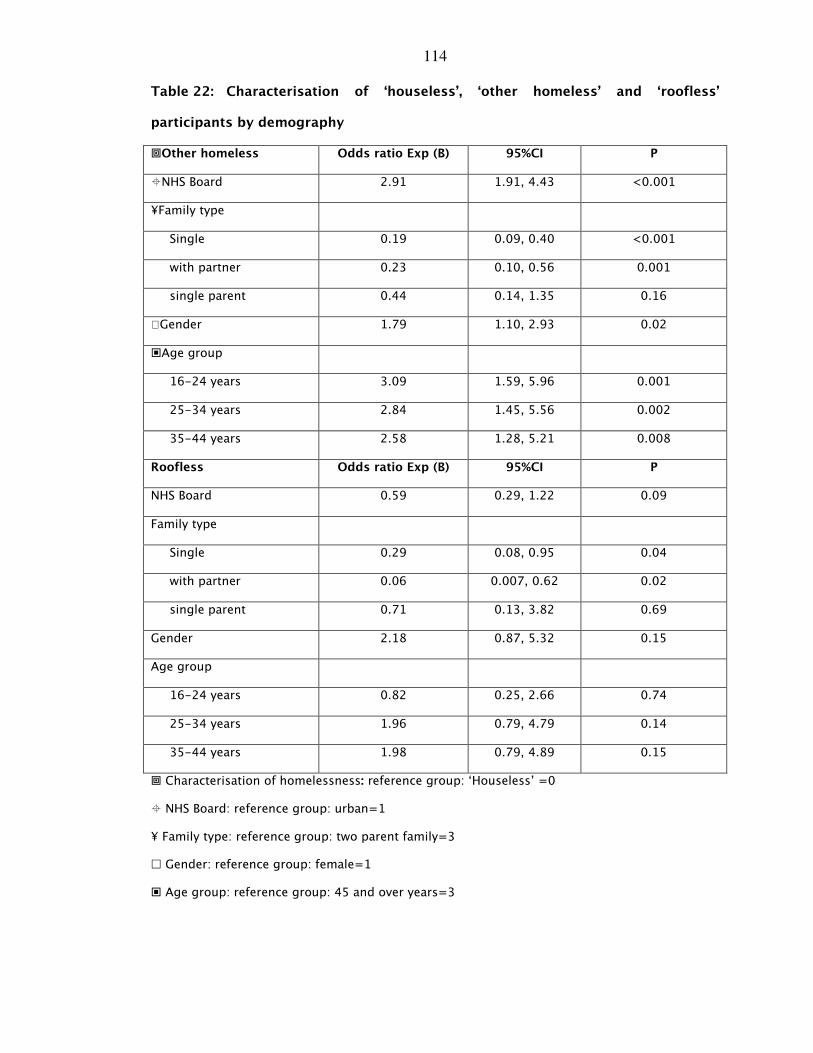
114
Table 22: Characterisation of ‘houseless’, ‘other homeless’ and ‘roofless’
participants by demography
�Other homeless Odds ratio Exp (B) 95%CI P
�NHS Board 2.91 1.91, 4.43 <0.001
¥Family type
Single 0.19 0.09, 0.40 <0.001
with partner 0.23 0.10, 0.56 0.001
single parent 0.44 0.14, 1.35 0.16
Gender 1.79 1.10, 2.93 0.02
�Age group
16-24 years 3.09 1.59, 5.96 0.001
25-34 years 2.84 1.45, 5.56 0.002
35-44 years 2.58 1.28, 5.21 0.008
Roofless Odds ratio Exp (B) 95%CI P
NHS Board 0.59 0.29, 1.22 0.09
Family type
Single 0.29 0.08, 0.95 0.04
with partner 0.06 0.007, 0.62 0.02
single parent 0.71 0.13, 3.82 0.69
Gender 2.18 0.87, 5.32 0.15
Age group
16-24 years 0.82 0.25, 2.66 0.74
25-34 years 1.96 0.79, 4.79 0.14
35-44 years 1.98 0.79, 4.89 0.15
� Characterisation of homelessness: reference group: ‘Houseless’ =0
� NHS Board: reference group: urban=1
¥ Family type: reference group: two parent family=3
� Gender: reference group: female=1
� Age group: reference group: 45 and over years=3
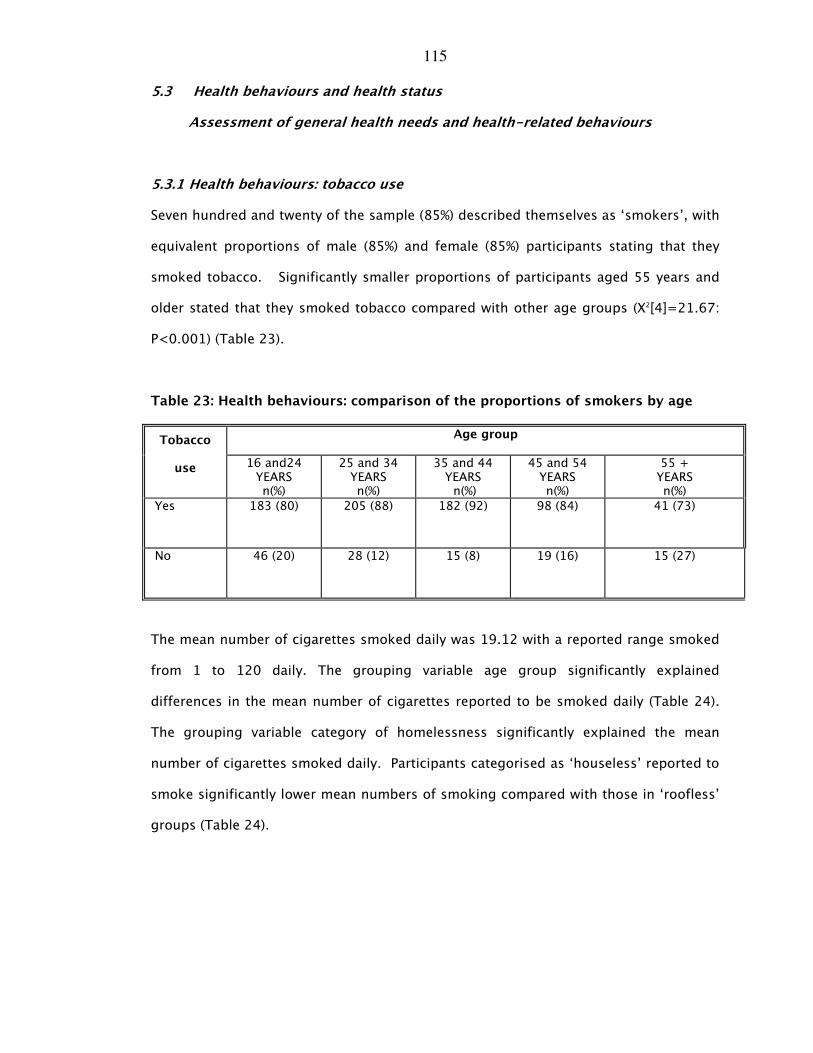
115
5.3 Health behaviours and health status
Assessment of general health needs and health-related behaviours
5.3.1 Health behaviours: tobacco use
Seven hundred and twenty of the sample (85%) described themselves as ‘smokers’, with
equivalent proportions of male (85%) and female (85%) participants stating that they
smoked tobacco. Significantly smaller proportions of participants aged 55 years and
older stated that they smoked tobacco compared with other age groups (X2[4]=21.67:
P<0.001) (Table 23).
Table 23: Health behaviours: comparison of the proportions of smokers by age
Age group Tobacco
use 16 and24 YEARS n(%)
25 and 34 YEARS n(%)
35 and 44 YEARS
n(%)
45 and 54 YEARS n(%)
55 + YEARS n(%)
Yes 183 (80) 205 (88) 182 (92) 98 (84) 41 (73)
No 46 (20) 28 (12) 15 (8) 19 (16) 15 (27)
The mean number of cigarettes smoked daily was 19.12 with a reported range smoked
from 1 to 120 daily. The grouping variable age group significantly explained
differences in the mean number of cigarettes reported to be smoked daily (Table 24).
The grouping variable category of homelessness significantly explained the mean
number of cigarettes smoked daily. Participants categorised as ‘houseless’ reported to
smoke significantly lower mean numbers of smoking compared with those in ‘roofless’
groups (Table 24).

116
Table 24: Health behaviours: comparison of the average number of cigarettes
reportedly smoked daily by age
AGE
GROUP MEAN CIGARETTES SMOKED
MEAN (95% CI) F (df) P
16-24 YRS 17.05 (15.06,19.83)
25-34 YRS 18.38 (16.64,20.11
35-44 YRS 20.30 (18.35,22.25)
45-54YRS 21.58 (18.32,24.85)
55+ YRS 22.18 (17.20,27.15)
2.78 (4,646) 0.03
CATEGORY OF
HOMELESSNESS
MEAN CIGARETTES SMOKED
MEAN (95% CI) F (df) P
ROOFLESS 24.322 �(18.10, 30.54)
HOUSELESS 18.491(17.40, 19.58)
OTHER 20.05,1,2 (17.23, 22.87)
3.45 (2,612)* 0.02
*The suffixes show the significant differences in mean number of cigarettes smoked which existed between the participants’ category of homelessness grouping.
5.3.2 Health behaviours: alcohol use
Thirty-one percent (254) of the participants stated that they drank alcohol at least
daily. Significantly lower proportions of female (19%) participants reported to drink
alcohol at least daily compared with male (35%) participants (X2[1]=18.74:P<0.001).
Significantly lower proportions of participants aged between 25-34 years reported to
drink alcohol compared with participants in the other age groups (Table 25).
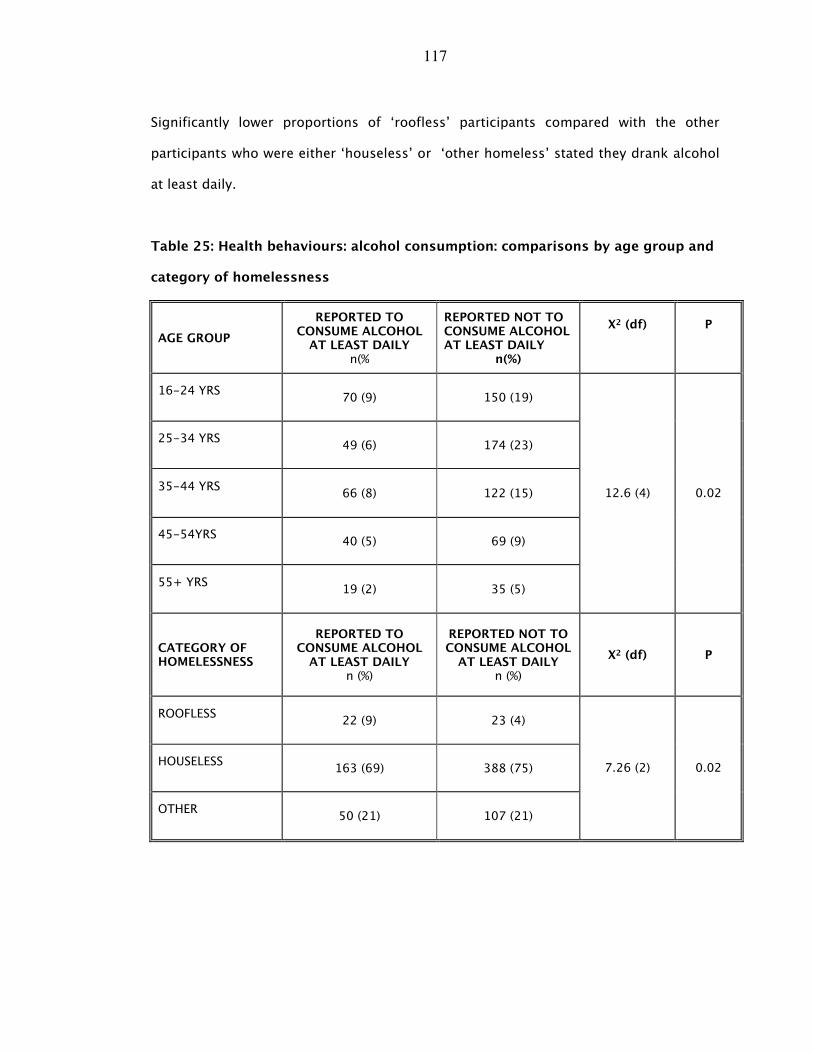
117
Significantly lower proportions of ‘roofless’ participants compared with the other
participants who were either ‘houseless’ or ‘other homeless’ stated they drank alcohol
at least daily.
Table 25: Health behaviours: alcohol consumption: comparisons by age group and
category of homelessness
AGE GROUP
REPORTED TO CONSUME ALCOHOL
AT LEAST DAILY n(%
REPORTED NOT TO CONSUME ALCOHOL AT LEAST DAILY
n(%)
X2 (df)
P
16-24 YRS
70 (9) 150 (19)
25-34 YRS
49 (6) 174 (23)
35-44 YRS
66 (8) 122 (15)
45-54YRS
40 (5) 69 (9)
55+ YRS
19 (2) 35 (5)
12.6 (4) 0.02
CATEGORY OF HOMELESSNESS
REPORTED TO CONSUME ALCOHOL
AT LEAST DAILY n (%)
REPORTED NOT TO CONSUME ALCOHOL
AT LEAST DAILY n (%)
X2 (df) P
ROOFLESS
22 (9) 23 (4)
HOUSELESS
163 (69) 388 (75)
OTHER
50 (21) 107 (21)
7.26 (2) 0.02
118
5.3.3 Health behaviours: drug use
A total of 564 participants (68%) stated that they had used drugs at some time in their
lives. Two hundred and thirty-six participants (29%) stated that they were current drug
users at the time of the survey. One hundred and ninety-one participants (24%) who
currently stated that they were current drug users stated that they were injecting drug
users at the time of the survey. Sixty-eight percent of men (419) and 66% of women
(144) reported to have used drugs in the past with equivalent proportions of men (30%)
and women (26%) stated that they continued to take drugs. Twenty-three percent of
men and 29% of women stated that they were injecting drug users at the time of the
survey.
There was a significant association between ever having used drugs and age group with
significantly lower proportions of older participants stating that they had previously
used drugs compared with those in other age groups (Table 26). There was an
associated between injecting drug use and age. Significantly larger proportions of
participants aged between 25-34 years (40%) and between 35-44 years (32%)
compared with those in the 16-24 years (15%), 45 years and over (19%) age groups
(X2[3]=39.17:P<0.001), stating that they had injected drugs.
There was a significant association between previously having used drugs and
categorisation of homelessness. Significantly greater proportions of participants in the
‘other homeless’ group, compared with those categorised as ‘houseless’ or ‘roofless’
groups, stated that they had previously used drugs (Table 26). Significantly larger
proportions of those categorised as ‘houseless’ (68%) reported to be injecting drug
users compared with those who were categorised as ‘other homeless’ (21%) and
‘roofless’ (11%) (X2[2]=9.45:P=0.009).
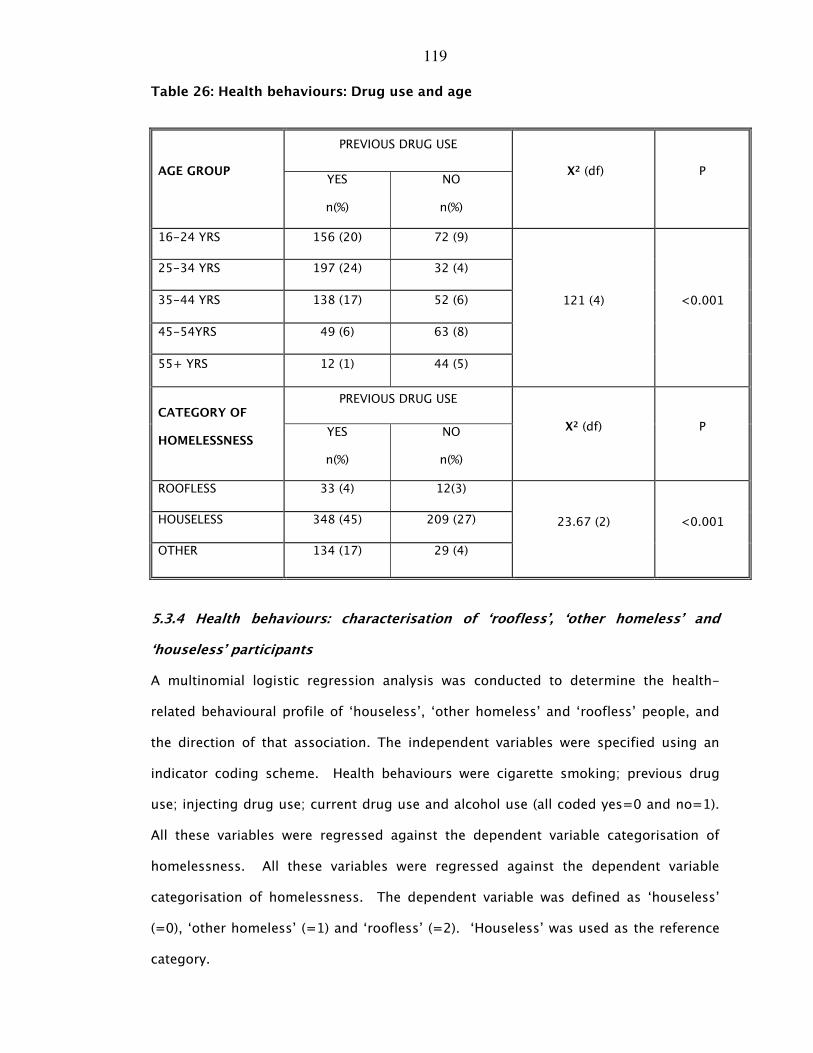
119
Table 26: Health behaviours: Drug use and age
PREVIOUS DRUG USE
AGE GROUP YES
n(%)
NO
n(%)
X2 (df) P
16-24 YRS 156 (20) 72 (9)
25-34 YRS 197 (24) 32 (4)
35-44 YRS 138 (17) 52 (6)
45-54YRS 49 (6) 63 (8)
55+ YRS 12 (1) 44 (5)
121 (4) <0.001
PREVIOUS DRUG USE CATEGORY OF
HOMELESSNESS YES
n(%)
NO
n(%)
X2 (df) P
ROOFLESS 33 (4) 12(3)
HOUSELESS 348 (45) 209 (27)
OTHER 134 (17) 29 (4)
23.67 (2) <0.001
5.3.4 Health behaviours: characterisation of ‘roofless’, ‘other homeless’ and
‘houseless’ participants
A multinomial logistic regression analysis was conducted to determine the health-
related behavioural profile of ‘houseless’, ‘other homeless’ and ‘roofless’ people, and
the direction of that association. The independent variables were specified using an
indicator coding scheme. Health behaviours were cigarette smoking; previous drug
use; injecting drug use; current drug use and alcohol use (all coded yes=0 and no=1).
All these variables were regressed against the dependent variable categorisation of
homelessness. All these variables were regressed against the dependent variable
categorisation of homelessness. The dependent variable was defined as ‘houseless’
(=0), ‘other homeless’ (=1) and ‘roofless’ (=2). ‘Houseless’ was used as the reference
category.
120
For previous drug users compared to those with no history of previous drug use the
relative risk for being ‘other homeless’ relative to the reference category ‘houseless’
would be expected to increase by a factor of 3.69 given that all other factors in the
model are kept constant. This means that previous drug users are significantly more
likely than non-previous drug users to be ‘other homeless’ than ‘houseless’. For
smokers relative to non-smokers the relative risk for being ‘other homeless’ relative to
the reference category ‘houseless’ would be expected to decrease by a factor of 0.49
given that the other variables in the model are kept constant. This means that smokers
are significantly less likely than non-smokers to be categorised as ‘houseless’.
For those who were injecting drug users compared with non-injecting drug users the
relative risk for being ‘roofless’ relative to the referent category ‘houseless’ would
expect to increase by a factor of 2.42 given that all other factors in the model are kept
constant. This means that injecting drug users were significantly more likely than non-
injecting drug users to be ‘roofless’ than houseless. For those who used alcohol
relative to non-alcohol users the relative risk for being ‘roofless’ relative to the referent
category ‘houseless’ would be expected to increase by a factor of 2.21 given that all
other factors in the model are kept constant. In other words, injecting drug users and
smokers would be significantly more likely than non-injecting drug users and non-
alcohol users to be ‘roofless’ rather than ‘houseless’ (Table 27).
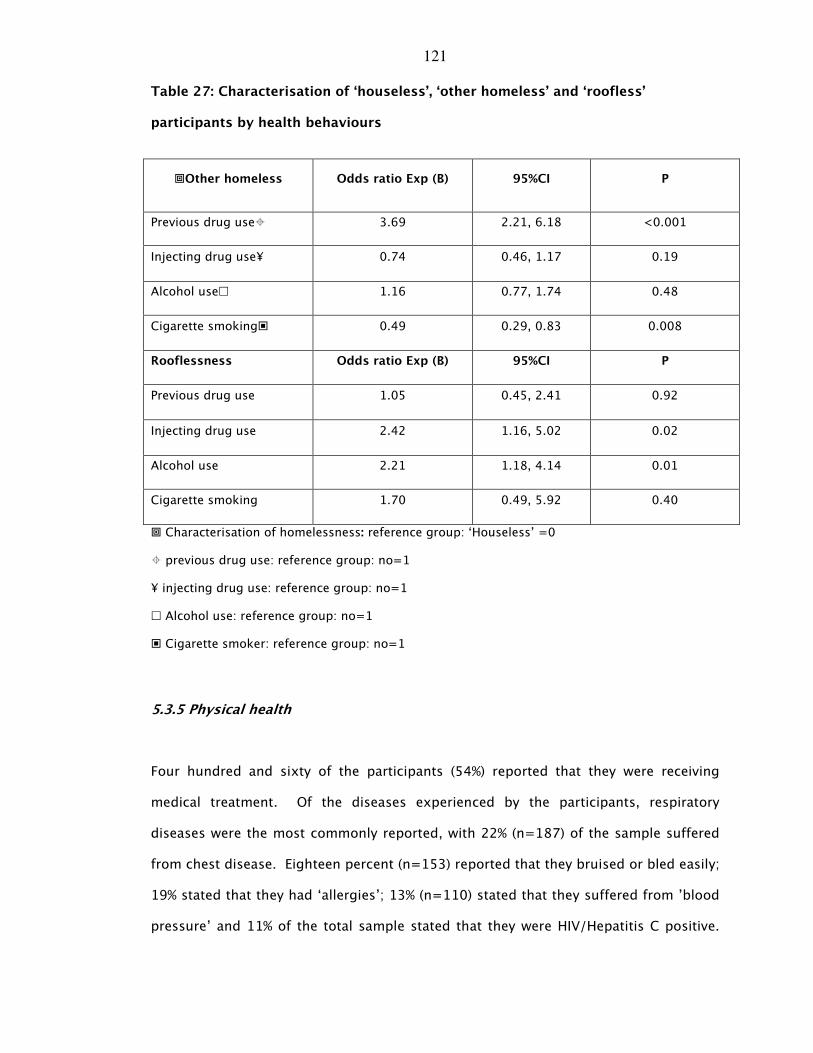
121
Table 27: Characterisation of ‘houseless’, ‘other homeless’ and ‘roofless’
participants by health behaviours
�Other homeless Odds ratio Exp (B) 95%CI P
Previous drug use� 3.69 2.21, 6.18 <0.001
Injecting drug use¥ 0.74 0.46, 1.17 0.19
Alcohol use� 1.16 0.77, 1.74 0.48
Cigarette smoking� 0.49 0.29, 0.83 0.008
Rooflessness Odds ratio Exp (B) 95%CI P
Previous drug use 1.05 0.45, 2.41 0.92
Injecting drug use 2.42 1.16, 5.02 0.02
Alcohol use 2.21 1.18, 4.14 0.01
Cigarette smoking 1.70 0.49, 5.92 0.40
� Characterisation of homelessness: reference group: ‘Houseless’ =0
� previous drug use: reference group: no=1
¥ injecting drug use: reference group: no=1
� Alcohol use: reference group: no=1
� Cigarette smoker: reference group: no=1
5.3.5 Physical health
Four hundred and sixty of the participants (54%) reported that they were receiving
medical treatment. Of the diseases experienced by the participants, respiratory
diseases were the most commonly reported, with 22% (n=187) of the sample suffered
from chest disease. Eighteen percent (n=153) reported that they bruised or bled easily;
19% stated that they had ‘allergies’; 13% (n=110) stated that they suffered from ’blood
pressure’ and 11% of the total sample stated that they were HIV/Hepatitis C positive.
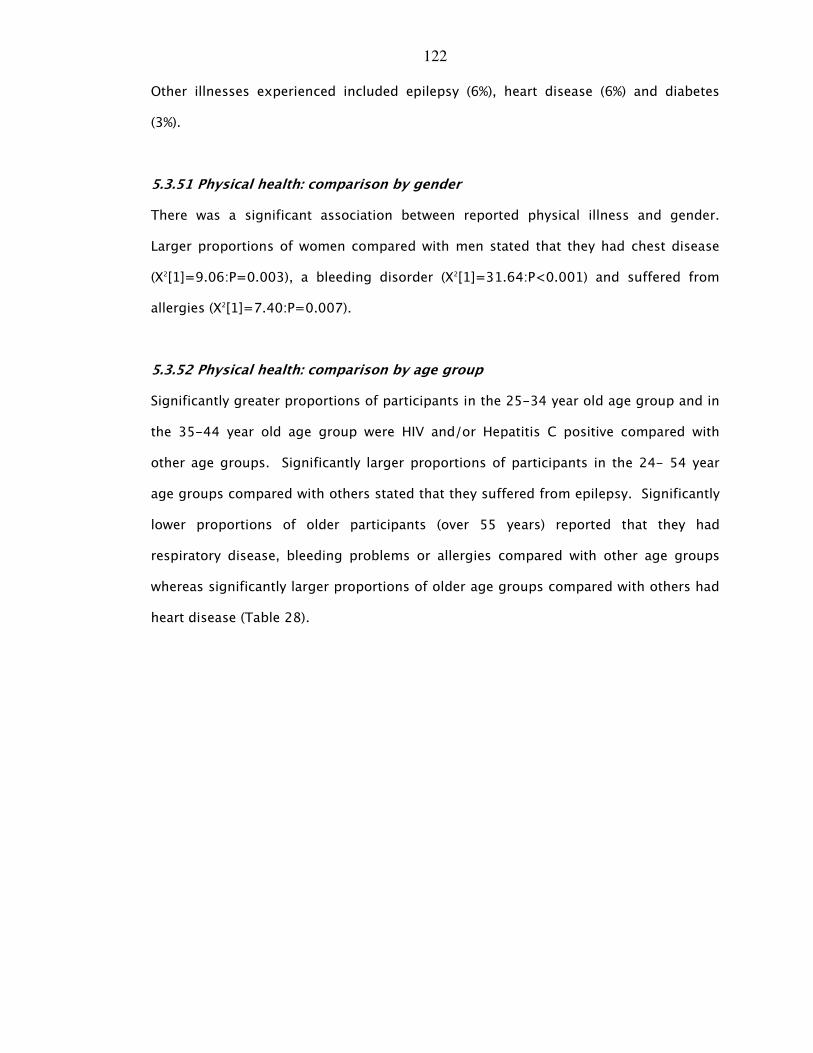
122
Other illnesses experienced included epilepsy (6%), heart disease (6%) and diabetes
(3%).
5.3.51 Physical health: comparison by gender
There was a significant association between reported physical illness and gender.
Larger proportions of women compared with men stated that they had chest disease
(X2[1]=9.06:P=0.003), a bleeding disorder (X2[1]=31.64:P<0.001) and suffered from
allergies (X2[1]=7.40:P=0.007).
5.3.52 Physical health: comparison by age group
Significantly greater proportions of participants in the 25-34 year old age group and in
the 35-44 year old age group were HIV and/or Hepatitis C positive compared with
other age groups. Significantly larger proportions of participants in the 24- 54 year
age groups compared with others stated that they suffered from epilepsy. Significantly
lower proportions of older participants (over 55 years) reported that they had
respiratory disease, bleeding problems or allergies compared with other age groups
whereas significantly larger proportions of older age groups compared with others had
heart disease (Table 28).
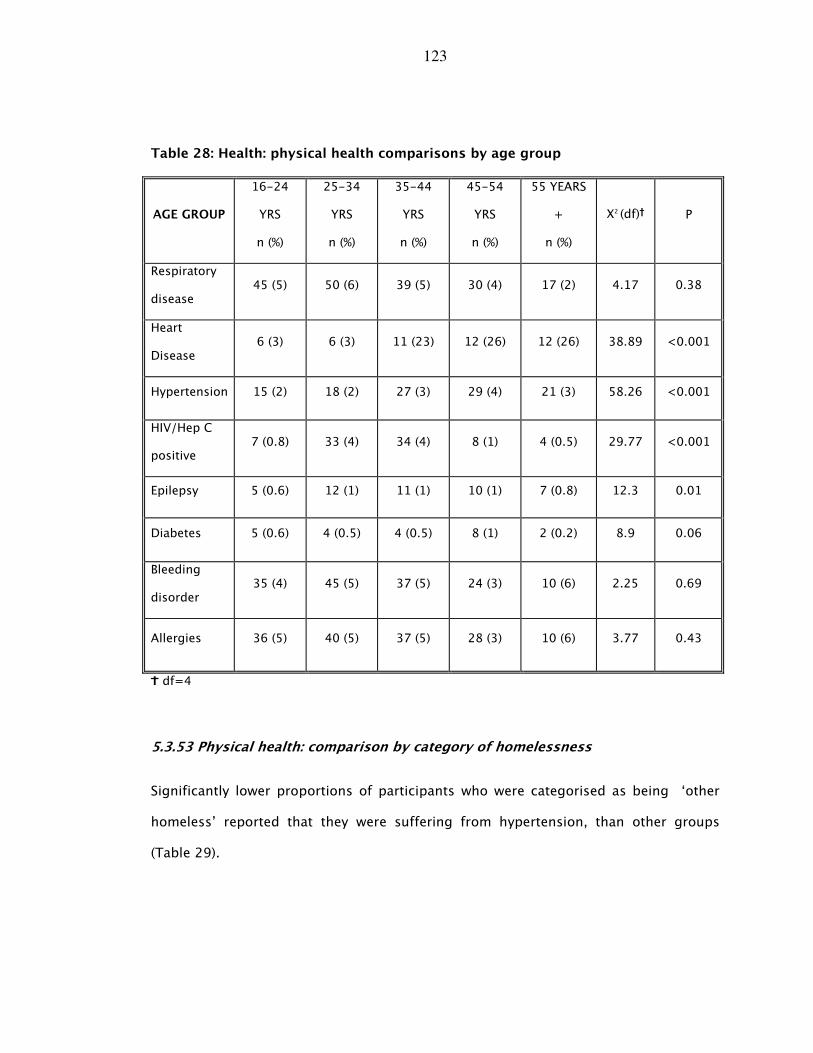
123
Table 28: Health: physical health comparisons by age group
AGE GROUP
16-24
YRS
n (%)
25-34
YRS
n (%)
35-44
YRS
n (%)
45-54
YRS
n (%)
55 YEARS
+
n (%)
X2 (df)K P
Respiratory
disease 45 (5) 50 (6) 39 (5) 30 (4) 17 (2) 4.17 0.38
Heart
Disease 6 (3) 6 (3) 11 (23) 12 (26) 12 (26) 38.89 <0.001
Hypertension 15 (2) 18 (2) 27 (3) 29 (4) 21 (3) 58.26 <0.001
HIV/Hep C
positive 7 (0.8) 33 (4) 34 (4) 8 (1) 4 (0.5) 29.77 <0.001
Epilepsy 5 (0.6) 12 (1) 11 (1) 10 (1) 7 (0.8) 12.3 0.01
Diabetes 5 (0.6) 4 (0.5) 4 (0.5) 8 (1) 2 (0.2) 8.9 0.06
Bleeding
disorder 35 (4) 45 (5) 37 (5) 24 (3) 10 (6) 2.25 0.69
Allergies 36 (5) 40 (5) 37 (5) 28 (3) 10 (6) 3.77 0.43
L df=4
5.3.53 Physical health: comparison by category of homelessness
Significantly lower proportions of participants who were categorised as being ‘other
homeless’ reported that they were suffering from hypertension, than other groups
(Table 29).
124
Table 29: Health: physical health comparisons by category of homelessness
ROOFLESS n (%)
HOUSELESS n (%)
OTHER HOMELESS
n (%) X2 (df)K K P
Respiratory
disease 8 (1) 132 (17) 32 (4) 3.10 0.78
Heart Disease 4 (9) 33 (6) 9 (4) 2.09 0.35
Hypertension 6 (14) 85 (15) 11(7) 8.21 0.02
HIV/Hep C
positive 5 (11) 60 (11) 16 (10) 0.14 0.93
Epilepsy 6 (1) 30 (4) 4 (1) 9.21 0.06
Diabetes� 0 (0) 21 (3) 1(0.1) 0.11
Bleeding
disorder 8 (17) 108 (19) 27 (16) 2.14 0.34
Allergies 7 (1) 108 (14) 28 (4) 3.12 0.78
� Fishers’ exact probability test used here �� df=2
5.3.54 Physical health: prescribed drugs
A large proportion (63%) of the sample (496 people) stated that they were taking
prescribed medication. Analysis across the whole study sample (853 total participants)
meant that 35% of the population was taking medication aimed at treating mental ill-
health.
Four hundred and seventy-two participants provided details of the type of medication
they were currently taking. The largest proportions of prescribed medication were
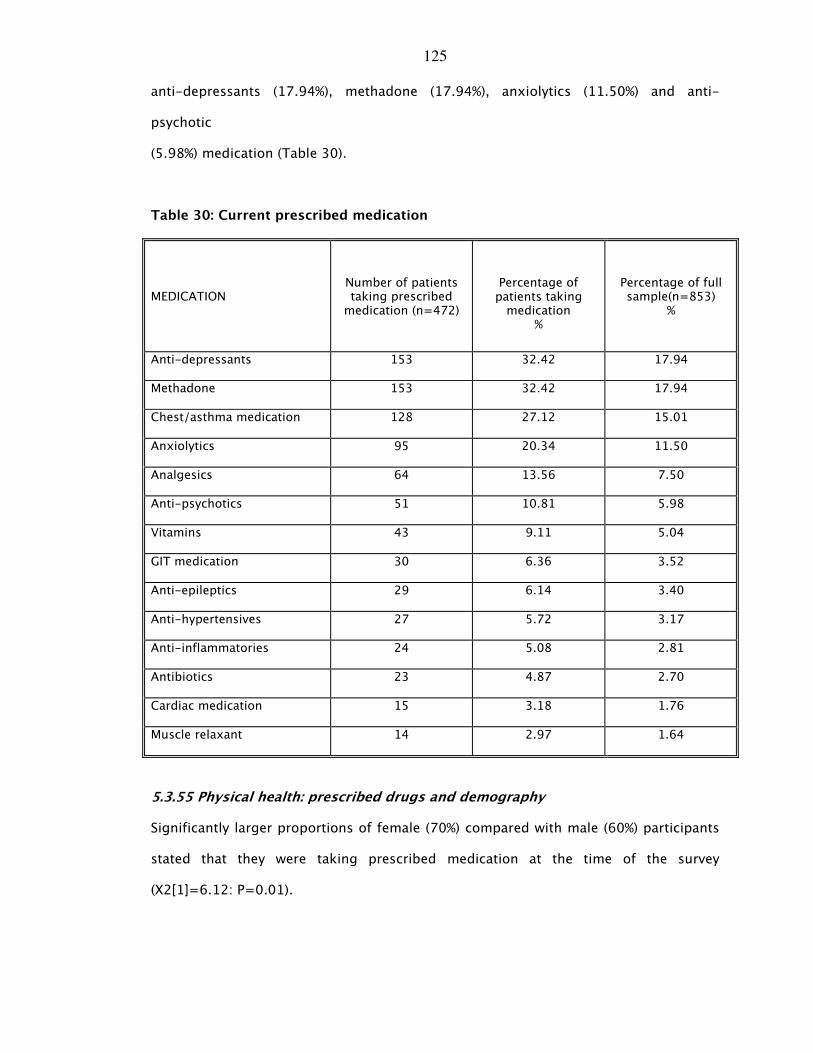
125
anti-depressants (17.94%), methadone (17.94%), anxiolytics (11.50%) and anti-
psychotic
(5.98%) medication (Table 30).
Table 30: Current prescribed medication
5.3.55 Physical health: prescribed drugs and demography
Significantly larger proportions of female (70%) compared with male (60%) participants
stated that they were taking prescribed medication at the time of the survey
(X2[1]=6.12: P=0.01).
MEDICATION Number of patients taking prescribed medication (n=472)
Percentage of patients taking medication
%
Percentage of full sample(n=853)
%
Anti-depressants 153 32.42 17.94
Methadone 153 32.42 17.94
Chest/asthma medication 128 27.12 15.01
Anxiolytics 95 20.34 11.50
Analgesics 64 13.56 7.50
Anti-psychotics 51 10.81 5.98
Vitamins 43 9.11 5.04
GIT medication 30 6.36 3.52
Anti-epileptics 29 6.14 3.40
Anti-hypertensives 27 5.72 3.17
Anti-inflammatories 24 5.08 2.81
Antibiotics 23 4.87 2.70
Cardiac medication 15 3.18 1.76
Muscle relaxant 14 2.97 1.64
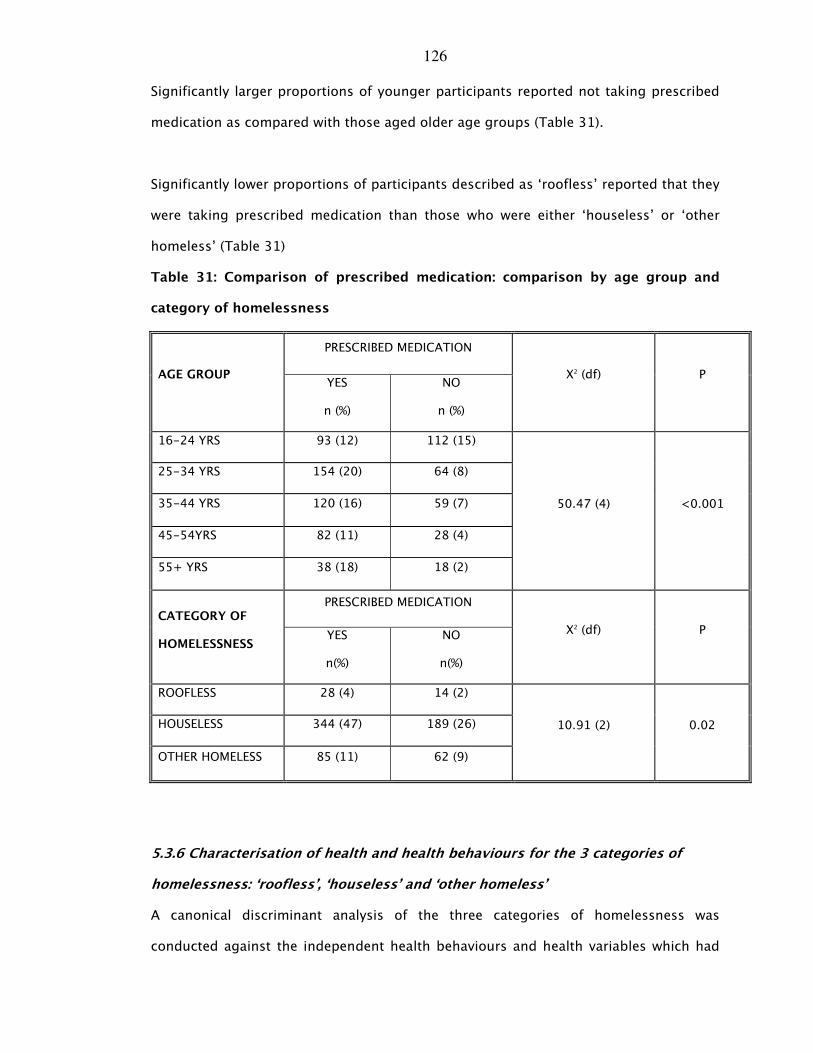
126
Significantly larger proportions of younger participants reported not taking prescribed
medication as compared with those aged older age groups (Table 31).
Significantly lower proportions of participants described as ‘roofless’ reported that they
were taking prescribed medication than those who were either ‘houseless’ or ‘other
homeless’ (Table 31)
Table 31: Comparison of prescribed medication: comparison by age group and
category of homelessness
PRESCRIBED MEDICATION
AGE GROUP YES
n (%)
NO
n (%)
X2 (df) P
16-24 YRS 93 (12) 112 (15)
25-34 YRS 154 (20) 64 (8)
35-44 YRS 120 (16) 59 (7)
45-54YRS 82 (11) 28 (4)
55+ YRS 38 (18) 18 (2)
50.47 (4) <0.001
PRESCRIBED MEDICATION CATEGORY OF
HOMELESSNESS YES
n(%)
NO
n(%)
X2 (df) P
ROOFLESS 28 (4) 14 (2)
HOUSELESS 344 (47) 189 (26)
OTHER HOMELESS 85 (11) 62 (9)
10.91 (2) 0.02
5.3.6 Characterisation of health and health behaviours for the 3 categories of
homelessness: ‘roofless’, ‘houseless’ and ‘other homeless’
A canonical discriminant analysis of the three categories of homelessness was
conducted against the independent health behaviours and health variables which had
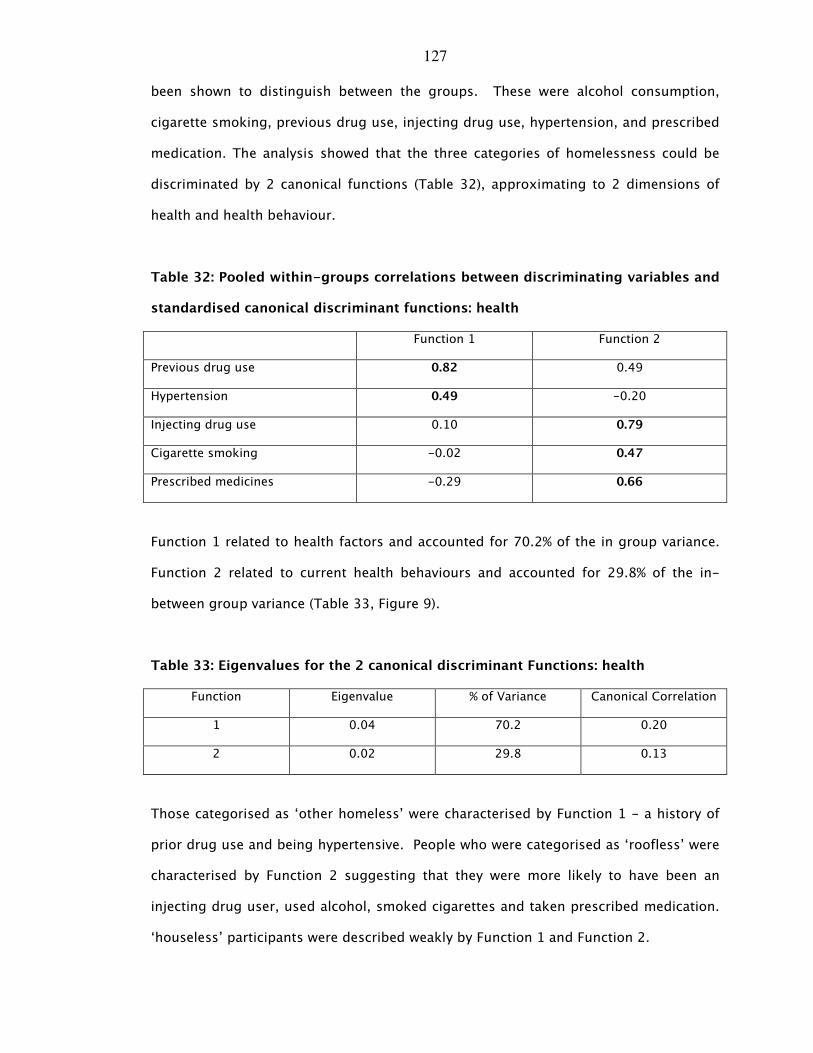
127
been shown to distinguish between the groups. These were alcohol consumption,
cigarette smoking, previous drug use, injecting drug use, hypertension, and prescribed
medication. The analysis showed that the three categories of homelessness could be
discriminated by 2 canonical functions (Table 32), approximating to 2 dimensions of
health and health behaviour.
Table 32: Pooled within-groups correlations between discriminating variables and
standardised canonical discriminant functions: health
Function 1 Function 2
Previous drug use 0.82 0.49
Hypertension 0.49 -0.20
Injecting drug use 0.10 0.79
Cigarette smoking -0.02 0.47
Prescribed medicines -0.29 0.66
Function 1 related to health factors and accounted for 70.2% of the in group variance.
Function 2 related to current health behaviours and accounted for 29.8% of the in-
between group variance (Table 33, Figure 9).
Table 33: Eigenvalues for the 2 canonical discriminant Functions: health
Function Eigenvalue % of Variance Canonical Correlation
1 0.04 70.2 0.20
2 0.02 29.8 0.13
Those categorised as ‘other homeless’ were characterised by Function 1 - a history of
prior drug use and being hypertensive. People who were categorised as ‘roofless’ were
characterised by Function 2 suggesting that they were more likely to have been an
injecting drug user, used alcohol, smoked cigarettes and taken prescribed medication.
‘houseless’ participants were described weakly by Function 1 and Function 2.
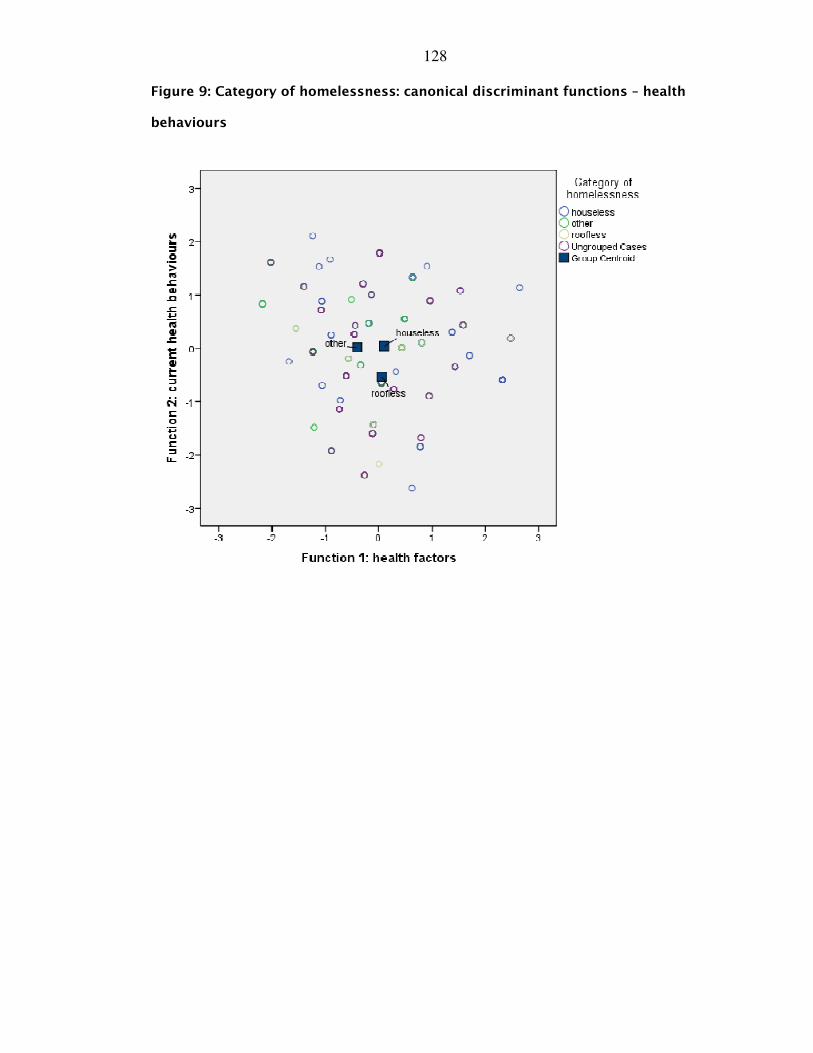
128
Figure 9 : Category of homelessness: canonical discriminant functions – health
behaviours
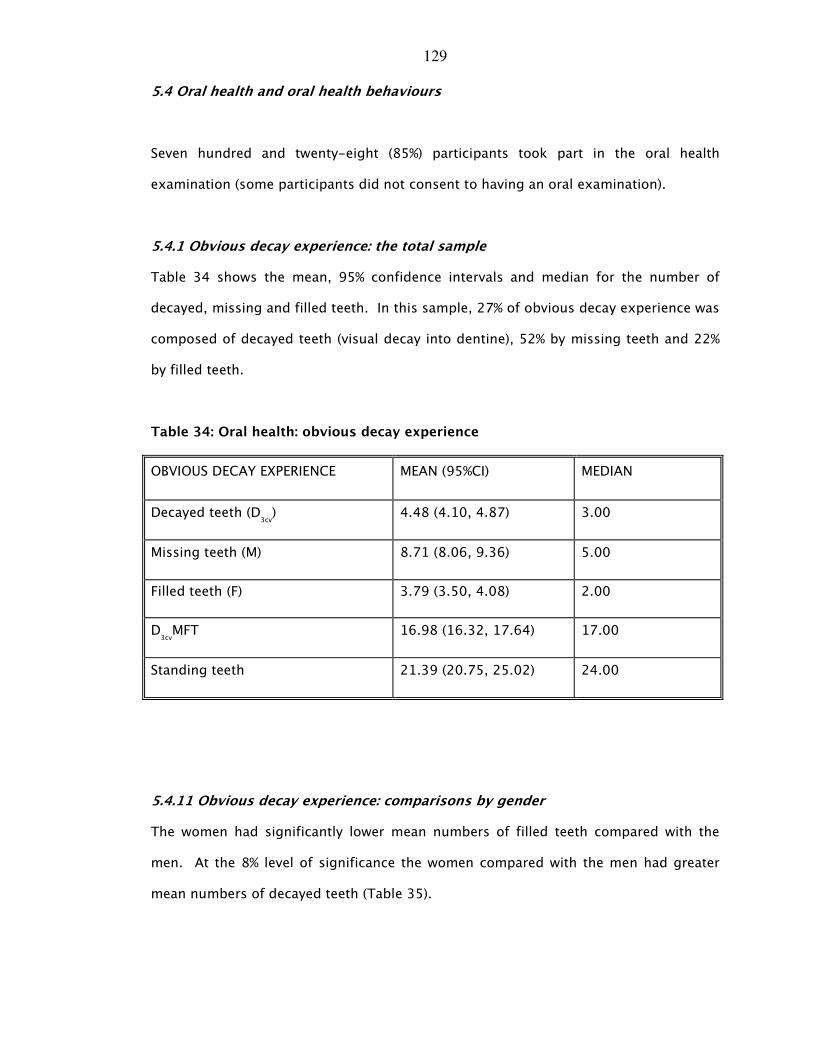
129
5.4 Oral health and oral health behaviours
Seven hundred and twenty-eight (85%) participants took part in the oral health
examination (some participants did not consent to having an oral examination).
5.4.1 Obvious decay experience: the total sample
Table 34 shows the mean, 95% confidence intervals and median for the number of
decayed, missing and filled teeth. In this sample, 27% of obvious decay experience was
composed of decayed teeth (visual decay into dentine), 52% by missing teeth and 22%
by filled teeth.
Table 34: Oral health: obvious decay experience
OBVIOUS DECAY EXPERIENCE MEAN (95%CI) MEDIAN
Decayed teeth (D3cv) 4.48 (4.10, 4.87) 3.00
Missing teeth (M) 8.71 (8.06, 9.36) 5.00
Filled teeth (F) 3.79 (3.50, 4.08) 2.00
D3cvMFT 16.98 (16.32, 17.64) 17.00
Standing teeth 21.39 (20.75, 25.02) 24.00
5.4.11 Obvious decay experience: comparisons by gender
The women had significantly lower mean numbers of filled teeth compared with the
men. At the 8% level of significance the women compared with the men had greater
mean numbers of decayed teeth (Table 35).
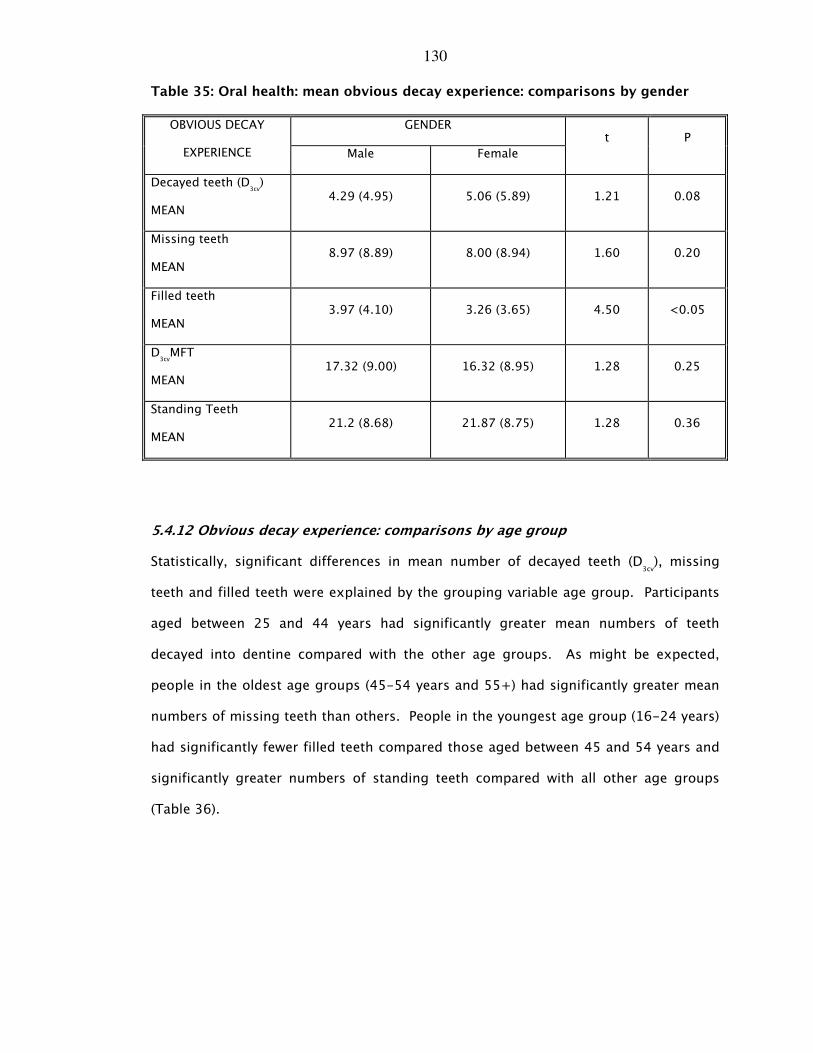
130
Table 35: Oral health: mean obvious decay experience: comparisons by gender
GENDER OBVIOUS DECAY
EXPERIENCE Male Female
t P
Decayed teeth (D3cv)
MEAN 4.29 (4.95) 5.06 (5.89) 1.21 0.08
Missing teeth
MEAN 8.97 (8.89) 8.00 (8.94) 1.60 0.20
Filled teeth
MEAN 3.97 (4.10) 3.26 (3.65) 4.50 <0.05
D3cvMFT
MEAN 17.32 (9.00) 16.32 (8.95) 1.28 0.25
Standing Teeth
MEAN 21.2 (8.68) 21.87 (8.75) 1.28 0.36
5.4.12 Obvious decay experience: comparisons by age group
Statistically, significant differences in mean number of decayed teeth (D3cv), missing
teeth and filled teeth were explained by the grouping variable age group. Participants
aged between 25 and 44 years had significantly greater mean numbers of teeth
decayed into dentine compared with the other age groups. As might be expected,
people in the oldest age groups (45-54 years and 55+) had significantly greater mean
numbers of missing teeth than others. People in the youngest age group (16-24 years)
had significantly fewer filled teeth compared those aged between 45 and 54 years and
significantly greater numbers of standing teeth compared with all other age groups
(Table 36).
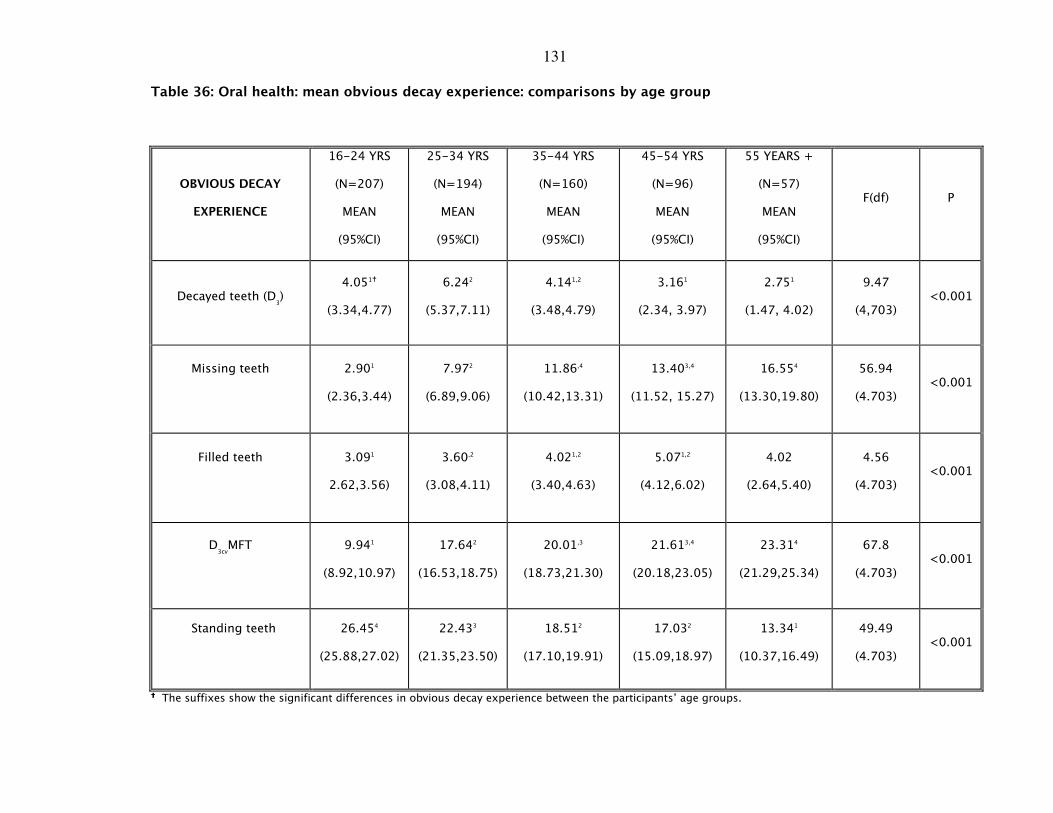
131
Table 36: Oral health: mean obvious decay experience: comparisons by age group
OBVIOUS DECAY
EXPERIENCE
16-24 YRS
(N=207)
MEAN
(95%CI)
25-34 YRS
(N=194)
MEAN
(95%CI)
35-44 YRS
(N=160)
MEAN
(95%CI)
45-54 YRS
(N=96)
MEAN
(95%CI)
55 YEARS +
(N=57)
MEAN
(95%CI)
F(df) P
Decayed teeth (D3)
4.051�
(3.34,4.77)
6.242
(5.37,7.11)
4.141,2
(3.48,4.79)
3.161
(2.34, 3.97)
2.751
(1.47, 4.02)
9.47
(4,703) <0.001
Missing teeth
2.901
(2.36,3.44)
7.972
(6.89,9.06)
11.86,4
(10.42,13.31)
13.403,4
(11.52, 15.27)
16.554
(13.30,19.80)
56.94
(4.703) <0.001
Filled teeth
3.091
2.62,3.56)
3.60,2
(3.08,4.11)
4.021,2
(3.40,4.63)
5.071,2
(4.12,6.02)
4.02
(2.64,5.40)
4.56
(4.703) <0.001
D3cvMFT
9.941
(8.92,10.97)
17.642
(16.53,18.75)
20.01,3
(18.73,21.30)
21.613,4
(20.18,23.05)
23.314
(21.29,25.34)
67.8
(4.703) <0.001
Standing teeth
26.454
(25.88,27.02)
22.433
(21.35,23.50)
18.512
(17.10,19.91)
17.032
(15.09,18.97)
13.341
(10.37,16.49)
49.49
(4.703) <0.001
���� The suffixes show the significant differences in obvious decay experience between the participants’ age groups.
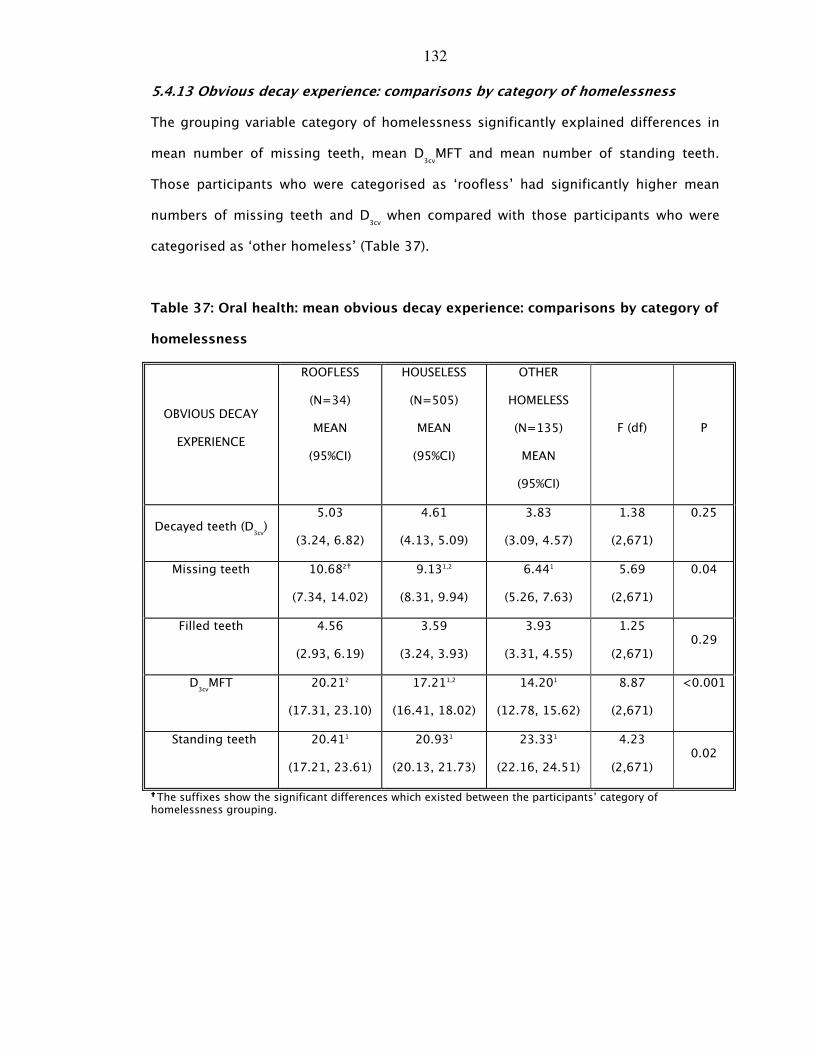
132
5.4.13 Obvious decay experience: comparisons by category of homelessness
The grouping variable category of homelessness significantly explained differences in
mean number of missing teeth, mean D3cvMFT and mean number of standing teeth.
Those participants who were categorised as ‘roofless’ had significantly higher mean
numbers of missing teeth and D3cv when compared with those participants who were
categorised as ‘other homeless’ (Table 37).
Table 37: Oral health: mean obvious decay experience: comparisons by category of
homelessness
OBVIOUS DECAY
EXPERIENCE
ROOFLESS
(N=34)
MEAN
(95%CI)
HOUSELESS
(N=505)
MEAN
(95%CI)
OTHER
HOMELESS
(N=135)
MEAN
(95%CI)
F (df) P
Decayed teeth (D3cv)
5.03
(3.24, 6.82)
4.61
(4.13, 5.09)
3.83
(3.09, 4.57)
1.38
(2,671)
0.25
Missing teeth
10.682�
(7.34, 14.02)
9.131,2
(8.31, 9.94)
6.441
(5.26, 7.63)
5.69
(2,671)
0.04
Filled teeth
4.56
(2.93, 6.19)
3.59
(3.24, 3.93)
3.93
(3.31, 4.55)
1.25
(2,671) 0.29
D3cvMFT
20.212
(17.31, 23.10)
17.211,2
(16.41, 18.02)
14.201
(12.78, 15.62)
8.87
(2,671)
<0.001
Standing teeth
20.411
(17.21, 23.61)
20.931
(20.13, 21.73)
23.331
(22.16, 24.51)
4.23
(2,671) 0.02
���� The suffixes show the significant differences which existed between the participants’ category of homelessness grouping.
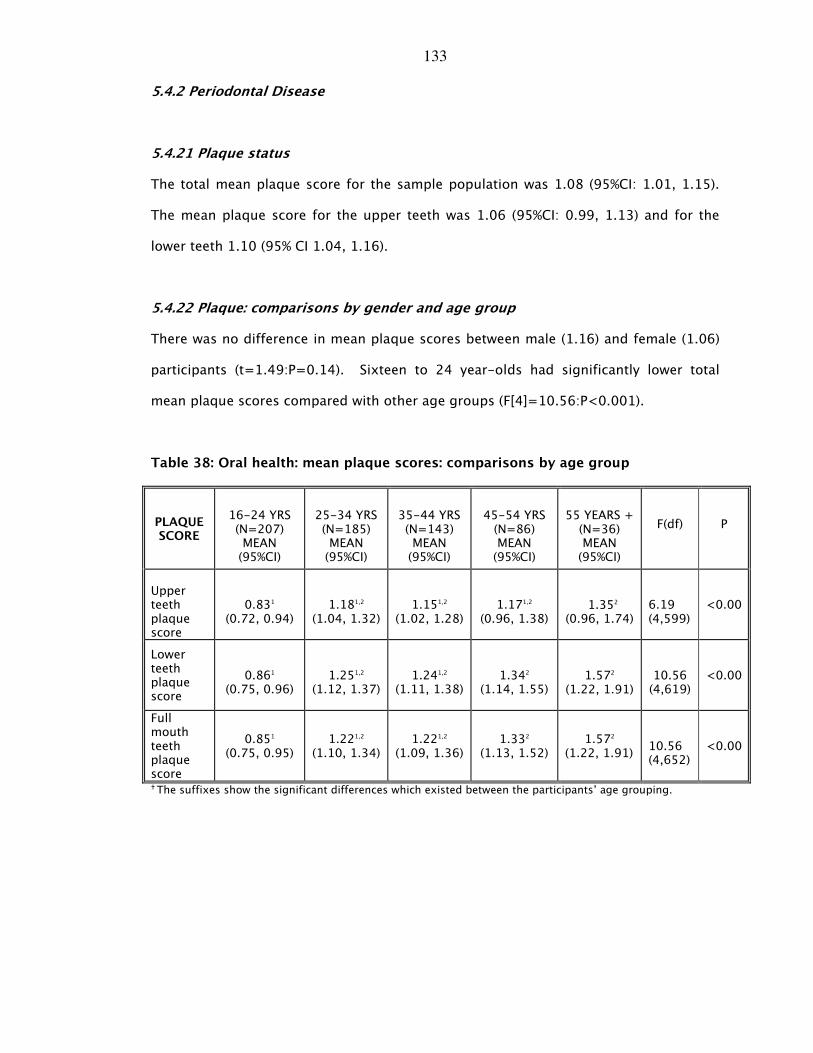
133
5.4.2 Periodontal Disease
5.4.21 Plaque status
The total mean plaque score for the sample population was 1.08 (95%CI: 1.01, 1.15).
The mean plaque score for the upper teeth was 1.06 (95%CI: 0.99, 1.13) and for the
lower teeth 1.10 (95% CI 1.04, 1.16).
5.4.22 Plaque: comparisons by gender and age group
There was no difference in mean plaque scores between male (1.16) and female (1.06)
participants (t=1.49:P=0.14). Sixteen to 24 year-olds had significantly lower total
mean plaque scores compared with other age groups (F[4]=10.56:P<0.001).
Table 38: Oral health: mean plaque scores: comparisons by age group
PLAQUE SCORE
16-24 YRS (N=207) MEAN (95%CI)
25-34 YRS (N=185) MEAN (95%CI)
35-44 YRS (N=143) MEAN (95%CI)
45-54 YRS (N=86) MEAN (95%CI)
55 YEARS + (N=36) MEAN (95%CI)
F(df)
P
Upper teeth plaque score
0.831
(0.72, 0.94)
1.181,2
(1.04, 1.32)
1.151,2
(1.02, 1.28)
1.171,2
(0.96, 1.38)
1.352
(0.96, 1.74)
6.19 (4,599)
<0.00
Lower teeth plaque score
0.861
(0.75, 0.96)
1.251,2
(1.12, 1.37)
1.241,2
(1.11, 1.38)
1.342
(1.14, 1.55)
1.572
(1.22, 1.91)
10.56 (4,619)
<0.00
Full mouth teeth plaque score
0.851
(0.75, 0.95)
1.221,2
(1.10, 1.34)
1.221,2
(1.09, 1.36)
1.332
(1.13, 1.52)
1.572
(1.22, 1.91)
10.56 (4,652)
<0.00
� The suffixes show the significant differences which existed between the participants’ age grouping.
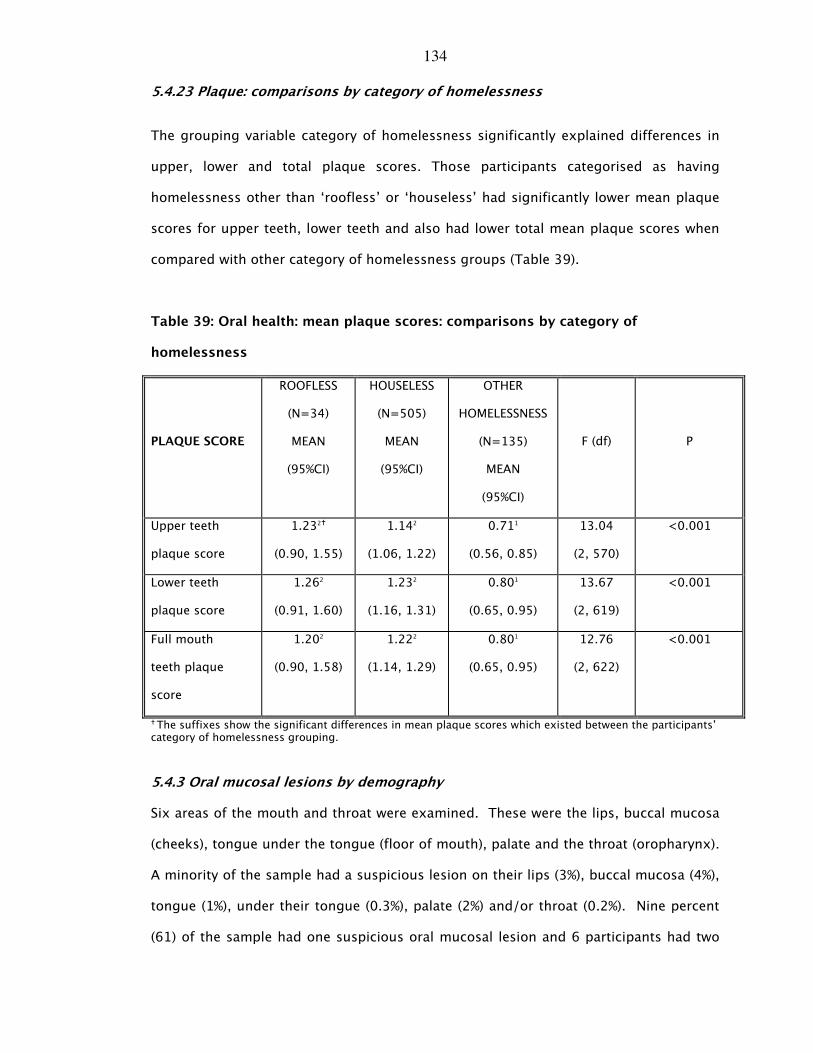
134
5.4.23 Plaque: comparisons by category of homelessness
The grouping variable category of homelessness significantly explained differences in
upper, lower and total plaque scores. Those participants categorised as having
homelessness other than ‘roofless’ or ‘houseless’ had significantly lower mean plaque
scores for upper teeth, lower teeth and also had lower total mean plaque scores when
compared with other category of homelessness groups (Table 39).
Table 39: Oral health: mean plaque scores: comparisons by category of
homelessness
PLAQUE SCORE
ROOFLESS
(N=34)
MEAN
(95%CI)
HOUSELESS
(N=505)
MEAN
(95%CI)
OTHER
HOMELESSNESS
(N=135)
MEAN
(95%CI)
F (df) P
Upper teeth
plaque score
1.232�
(0.90, 1.55)
1.142
(1.06, 1.22)
0.711
(0.56, 0.85)
13.04
(2, 570)
<0.001
Lower teeth
plaque score
1.262
(0.91, 1.60)
1.232
(1.16, 1.31)
0.801
(0.65, 0.95)
13.67
(2, 619)
<0.001
Full mouth
teeth plaque
score
1.202
(0.90, 1.58)
1.222
(1.14, 1.29)
0.801
(0.65, 0.95)
12.76
(2, 622)
<0.001
� The suffixes show the significant differences in mean plaque scores which existed between the participants’ category of homelessness grouping.
5.4.3 Oral mucosal lesions by demography
Six areas of the mouth and throat were examined. These were the lips, buccal mucosa
(cheeks), tongue under the tongue (floor of mouth), palate and the throat (oropharynx).
A minority of the sample had a suspicious lesion on their lips (3%), buccal mucosa (4%),
tongue (1%), under their tongue (0.3%), palate (2%) and/or throat (0.2%). Nine percent
(61) of the sample had one suspicious oral mucosal lesion and 6 participants had two
135
suspicious lesions. Male participants had a higher incidence of suspicious oral lesions
affecting the lips (X2[2]= 1.073:P<0.585), the buccal mucosa (X2[2]= 4.752:P<0.093),
the floor of mouth region (X2[1]= 0.701:P<0.402) and the palate (X2[1]=
0.543:P<0.703).
Participants aged between 45 and 54 years (27%) and those aged 55 and over (46%) had
greater experience of suspicious lesions on the palate compared with other age groups
(X2[4]= 27.82:P<0.001). No other differences between age groups were shown for
suspicious lesions of the lips, buccal mucosa, tongue, under the tongue or throat.
The majority of suspicious mucosal lesions were found in participants who were
categorised as ‘houseless’, with 47 hostel residents having up to 2 suspicious lesions
compared with 2 participants categorised as ‘roofless’ and 7 ‘other homeless’
participants. Five participants with suspicious lesions were referred to secondary
services.
5.4.4 Oral health status: edentulousness and demography
Forty-six people were edentulous. This represented only 6% of the sample population.
The greatest proportion of participants with no natural teeth was aged between 35 and
44 years of age. Thirty-seven percent of this age group were edentulous. Six percent
(33) of men and 7% (13) of women were edentulous (X2[1]=0.16: P=0.69). Significantly
greater proportions of participants categorised as ‘roofless’ (11%) were edentulous
compared with those participants categorised as ‘houseless’ (7%) and ‘other homeless’
(2%) (X2[2]=6.16:P=0.46).
5.4.5 Oral health status: dentures worn by demography
A total of 139 people in the sample were noted as wearing some type of denture at the
time of the survey. Seventy-one of the participants wore complete upper dentures and
28 wore complete lower dentures. Seventy-one of the participants wore upper partial
136
dentures and 18 wore partial lower dentures. Forty-four participants had both upper
and lower full dentures and 7 had upper and lower partial dentures. Four dentures (1
complete upper denture and 3 partial lower dentures) were lost. Fifty percent of upper
complete and partial dentures were judged to be clinically satisfactory. One-third of
those with lower dentures had partial dentures.
Of the denture wearers, larger proportions of male participants wore complete upper
(36%) and partial (43%) dentures compared with the female participants who wore
complete (14%) and partial (11%) dentures (X2[2]=4.39:P=0.11).
Of the 139 people who wore partial and complete upper dentures at the time of the
survey, A significantly larger proportion were aged between 35 and 44 years of age
(X2[4]=19.08:P=0.01) compared with other age groups. A larger percentage of
participants aged between 45 and 54 years of age wore partial lower dentures (44%),
whereas a larger proportion of participants aged 55 years and over (36%) wore
complete lower dentures (X2[4]=9.22:P=0.16).
5.4.6 Characterisation of oral health for the 3 categories of homelessness:
‘roofless’, ‘houseless’ and ‘other homeless’
A canonical discriminant analysis of the three categories of homelessness was
conducted against the independent oral health factors which had been shown to
distinguish between the groups. These were obvious decay experience (D3cvMFT),
missing teeth, standing teeth, total plaque scores, upper plaque scores, lower plaque
scores, oral mucosal lesions, edentulousness.
The analysis showed that the three categories of homelessness could be discriminated
by 2 canonical functions (Table 40), approximating to 2 dimensions of oral health.
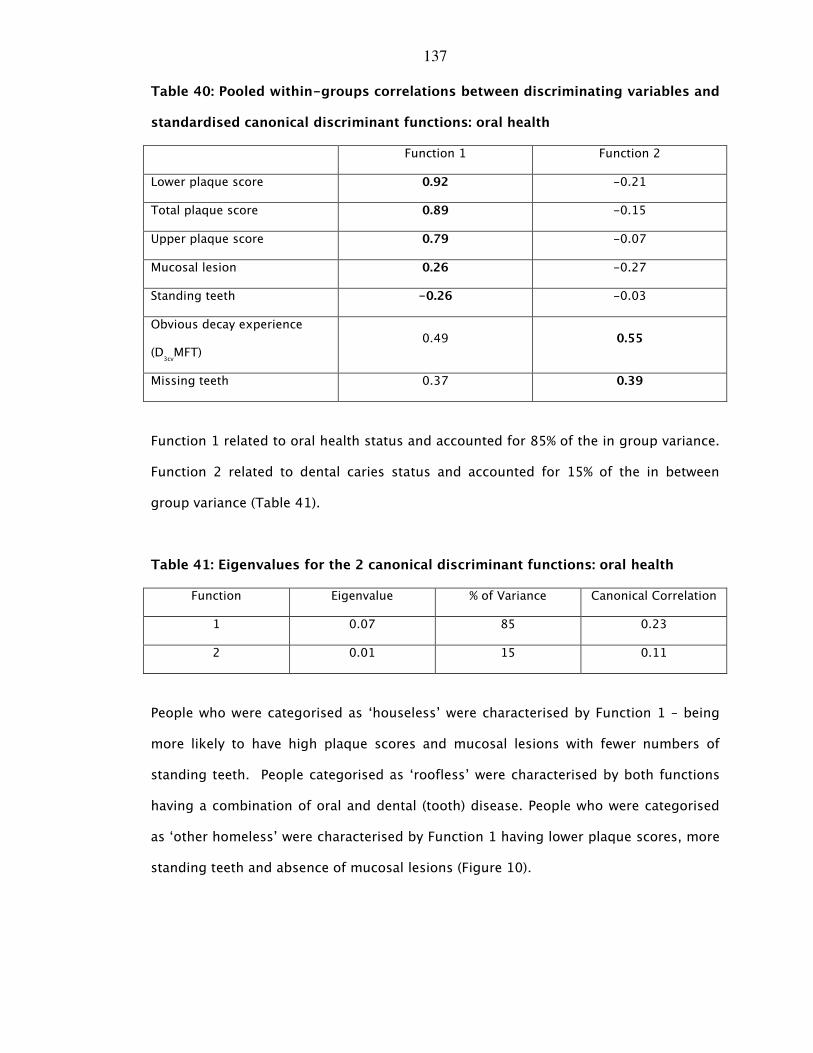
137
Table 40: Pooled within-groups correlations between discriminating variables and
standardised canonical discriminant functions: oral health
Function 1 Function 2
Lower plaque score 0.92 -0.21
Total plaque score 0.89 -0.15
Upper plaque score 0.79 -0.07
Mucosal lesion 0.26 -0.27
Standing teeth -0.26 -0.03
Obvious decay experience
(D3cvMFT)
0.49 0.55
Missing teeth 0.37 0.39
Function 1 related to oral health status and accounted for 85% of the in group variance.
Function 2 related to dental caries status and accounted for 15% of the in between
group variance (Table 41).
Table 41: Eigenvalues for the 2 canonical discriminant functions: oral health
Function Eigenvalue % of Variance Canonical Correlation
1 0.07 85 0.23
2 0.01 15 0.11
People who were categorised as ‘houseless’ were characterised by Function 1 – being
more likely to have high plaque scores and mucosal lesions with fewer numbers of
standing teeth. People categorised as ‘roofless’ were characterised by both functions
having a combination of oral and dental (tooth) disease. People who were categorised
as ‘other homeless’ were characterised by Function 1 having lower plaque scores, more
standing teeth and absence of mucosal lesions (Figure 10).
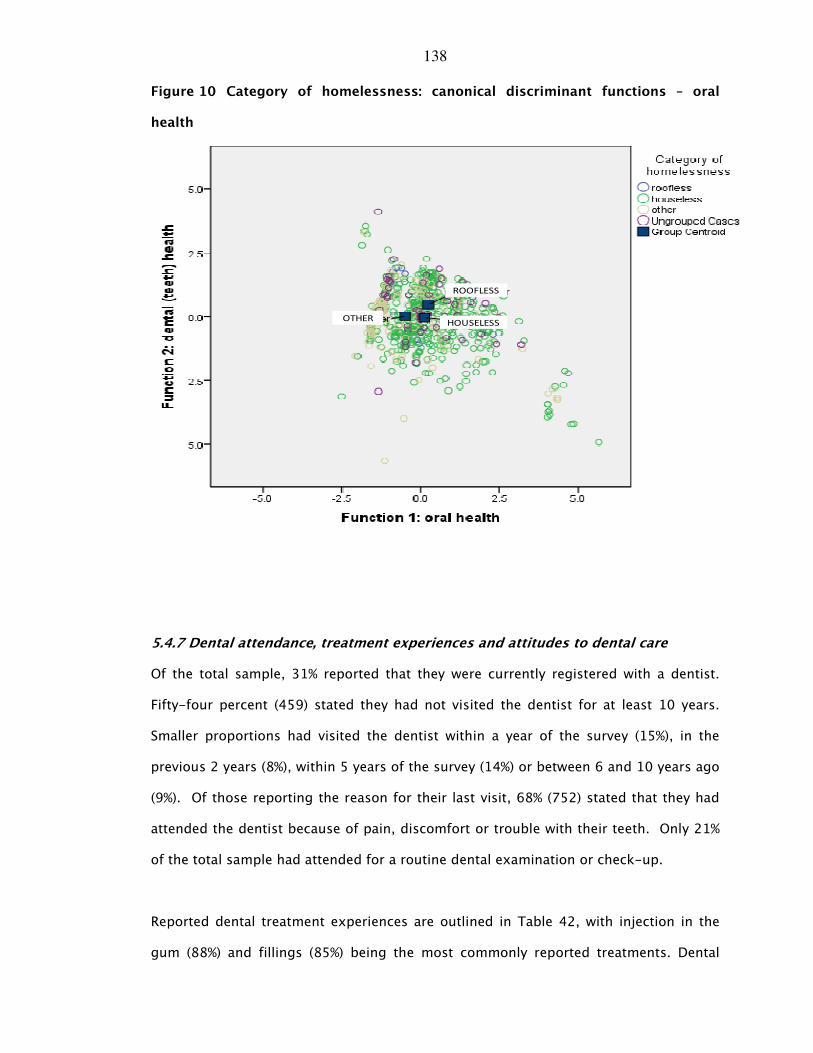
138
Figure 10 Category of homelessness: canonical discriminant functions – oral
health
ROOFLESS
HOUSELESSOTHER
5.4.7 Dental attendance, treatment experiences and attitudes to dental care
Of the total sample, 31% reported that they were currently registered with a dentist.
Fifty-four percent (459) stated they had not visited the dentist for at least 10 years.
Smaller proportions had visited the dentist within a year of the survey (15%), in the
previous 2 years (8%), within 5 years of the survey (14%) or between 6 and 10 years ago
(9%). Of those reporting the reason for their last visit, 68% (752) stated that they had
attended the dentist because of pain, discomfort or trouble with their teeth. Only 21%
of the total sample had attended for a routine dental examination or check-up.
Reported dental treatment experiences are outlined in Table 42, with injection in the
gum (88%) and fillings (85%) being the most commonly reported treatments. Dental
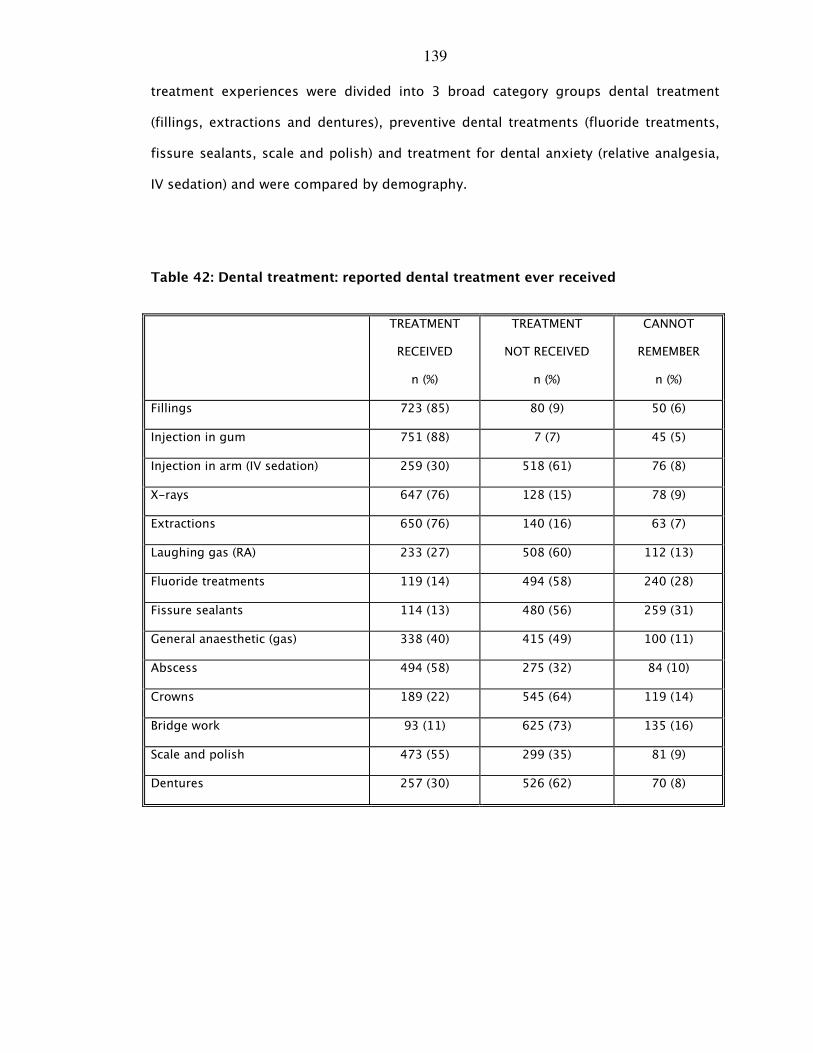
139
treatment experiences were divided into 3 broad category groups dental treatment
(fillings, extractions and dentures), preventive dental treatments (fluoride treatments,
fissure sealants, scale and polish) and treatment for dental anxiety (relative analgesia,
IV sedation) and were compared by demography.
Table 42: Dental treatment: reported dental treatment ever received
TREATMENT
RECEIVED
n (%)
TREATMENT
NOT RECEIVED
n (%)
CANNOT
REMEMBER
n (%)
Fillings 723 (85) 80 (9) 50 (6)
Injection in gum 751 (88) 7 (7) 45 (5)
Injection in arm (IV sedation) 259 (30) 518 (61) 76 (8)
X-rays 647 (76) 128 (15) 78 (9)
Extractions 650 (76) 140 (16) 63 (7)
Laughing gas (RA) 233 (27) 508 (60) 112 (13)
Fluoride treatments 119 (14) 494 (58) 240 (28)
Fissure sealants 114 (13) 480 (56) 259 (31)
General anaesthetic (gas) 338 (40) 415 (49) 100 (11)
Abscess 494 (58) 275 (32) 84 (10)
Crowns 189 (22) 545 (64) 119 (14)
Bridge work 93 (11) 625 (73) 135 (16)
Scale and polish 473 (55) 299 (35) 81 (9)
Dentures 257 (30) 526 (62) 70 (8)
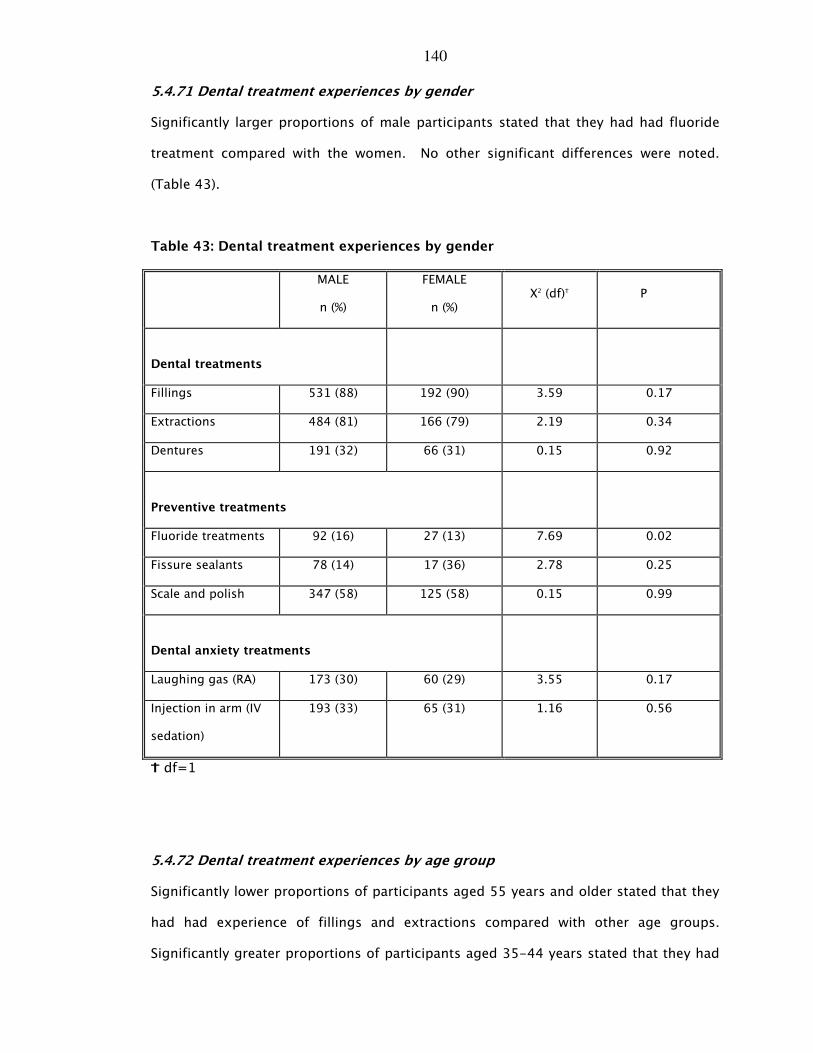
140
5.4.71 Dental treatment experiences by gender
Significantly larger proportions of male participants stated that they had had fluoride
treatment compared with the women. No other significant differences were noted.
(Table 43).
Table 43: Dental treatment experiences by gender
MALE
n (%)
FEMALE
n (%) X2 (df)_ P
Dental treatments
Fillings 531 (88) 192 (90) 3.59 0.17
Extractions 484 (81) 166 (79) 2.19 0.34
Dentures 191 (32) 66 (31) 0.15 0.92
Preventive treatments
Fluoride treatments 92 (16) 27 (13) 7.69 0.02
Fissure sealants 78 (14) 17 (36) 2.78 0.25
Scale and polish 347 (58) 125 (58) 0.15 0.99
Dental anxiety treatments
Laughing gas (RA) 173 (30) 60 (29) 3.55 0.17
Injection in arm (IV
sedation)
193 (33) 65 (31) 1.16 0.56
L df=1
5.4.72 Dental treatment experiences by age group
Significantly lower proportions of participants aged 55 years and older stated that they
had had experience of fillings and extractions compared with other age groups.
Significantly greater proportions of participants aged 35-44 years stated that they had
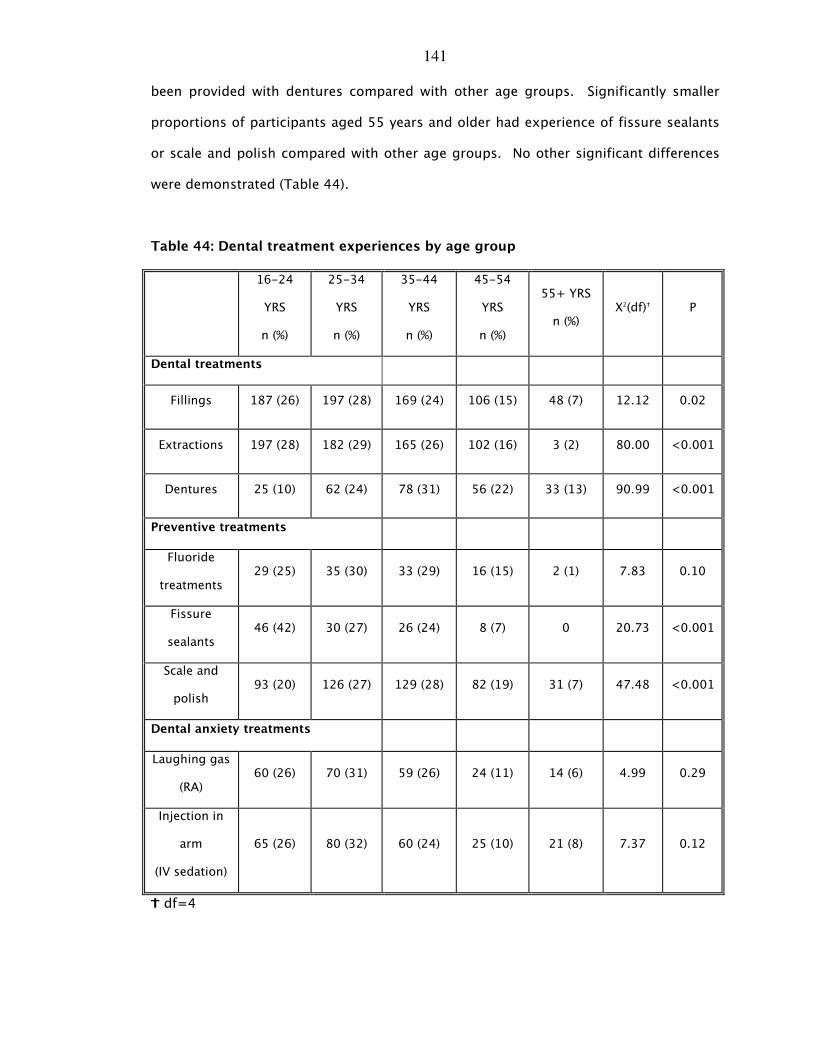
141
been provided with dentures compared with other age groups. Significantly smaller
proportions of participants aged 55 years and older had experience of fissure sealants
or scale and polish compared with other age groups. No other significant differences
were demonstrated (Table 44).
Table 44: Dental treatment experiences by age group
16-24
YRS
n (%)
25-34
YRS
n (%)
35-44
YRS
n (%)
45-54
YRS
n (%)
55+ YRS
n (%) X2(df)_ P
Dental treatments
Fillings 187 (26) 197 (28) 169 (24) 106 (15) 48 (7) 12.12 0.02
Extractions 197 (28) 182 (29) 165 (26) 102 (16) 3 (2) 80.00 <0.001
Dentures 25 (10) 62 (24) 78 (31) 56 (22) 33 (13) 90.99 <0.001
Preventive treatments
Fluoride
treatments 29 (25) 35 (30) 33 (29) 16 (15) 2 (1) 7.83 0.10
Fissure
sealants 46 (42) 30 (27) 26 (24) 8 (7) 0 20.73 <0.001
Scale and
polish 93 (20) 126 (27) 129 (28) 82 (19) 31 (7) 47.48 <0.001
Dental anxiety treatments
Laughing gas
(RA) 60 (26) 70 (31) 59 (26) 24 (11) 14 (6) 4.99 0.29
Injection in
arm
(IV sedation)
65 (26) 80 (32) 60 (24) 25 (10) 21 (8) 7.37 0.12
L df=4
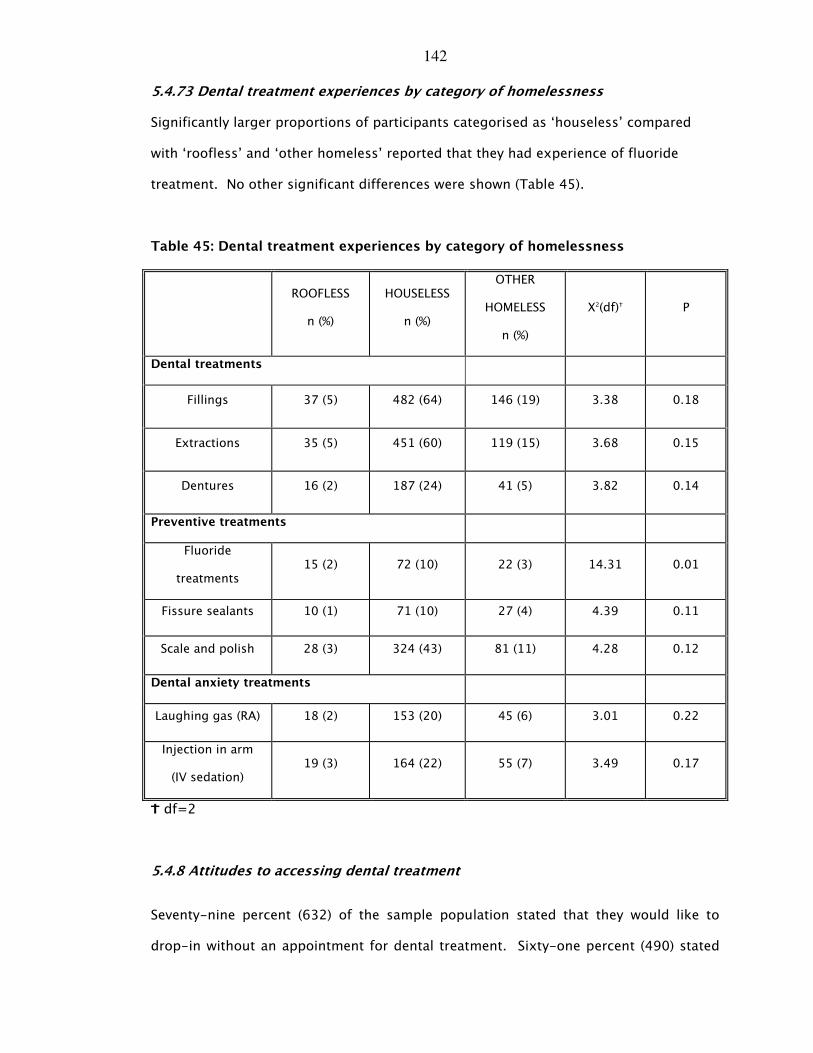
142
5.4.73 Dental treatment experiences by category of homelessness
Significantly larger proportions of participants categorised as ‘houseless’ compared
with ‘roofless’ and ‘other homeless’ reported that they had experience of fluoride
treatment. No other significant differences were shown (Table 45).
Table 45: Dental treatment experiences by category of homelessness
ROOFLESS
n (%)
HOUSELESS
n (%)
OTHER
HOMELESS
n (%)
X2(df)_ P
Dental treatments
Fillings 37 (5) 482 (64) 146 (19) 3.38 0.18
Extractions 35 (5) 451 (60) 119 (15) 3.68 0.15
Dentures 16 (2) 187 (24) 41 (5) 3.82 0.14
Preventive treatments
Fluoride
treatments 15 (2) 72 (10) 22 (3) 14.31 0.01
Fissure sealants 10 (1) 71 (10) 27 (4) 4.39 0.11
Scale and polish 28 (3) 324 (43) 81 (11) 4.28 0.12
Dental anxiety treatments
Laughing gas (RA) 18 (2) 153 (20) 45 (6) 3.01 0.22
Injection in arm
(IV sedation) 19 (3) 164 (22) 55 (7) 3.49 0.17
L df=2
5.4.8 Attitudes to accessing dental treatment
Seventy-nine percent (632) of the sample population stated that they would like to
drop-in without an appointment for dental treatment. Sixty-one percent (490) stated
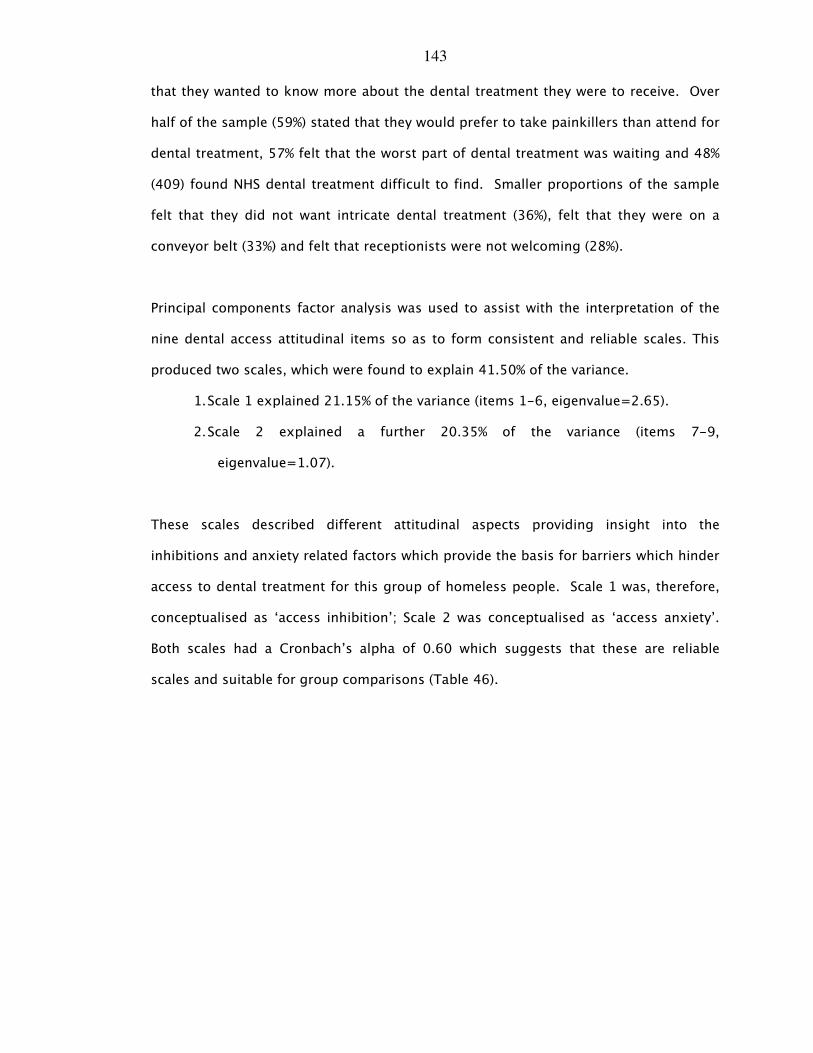
143
that they wanted to know more about the dental treatment they were to receive. Over
half of the sample (59%) stated that they would prefer to take painkillers than attend for
dental treatment, 57% felt that the worst part of dental treatment was waiting and 48%
(409) found NHS dental treatment difficult to find. Smaller proportions of the sample
felt that they did not want intricate dental treatment (36%), felt that they were on a
conveyor belt (33%) and felt that receptionists were not welcoming (28%).
Principal components factor analysis was used to assist with the interpretation of the
nine dental access attitudinal items so as to form consistent and reliable scales. This
produced two scales, which were found to explain 41.50% of the variance.
1. Scale 1 explained 21.15% of the variance (items 1-6, eigenvalue=2.65).
2. Scale 2 explained a further 20.35% of the variance (items 7-9,
eigenvalue=1.07).
These scales described different attitudinal aspects providing insight into the
inhibitions and anxiety related factors which provide the basis for barriers which hinder
access to dental treatment for this group of homeless people. Scale 1 was, therefore,
conceptualised as ‘access inhibition’; Scale 2 was conceptualised as ‘access anxiety’.
Both scales had a Cronbach’s alpha of 0.60 which suggests that these are reliable
scales and suitable for group comparisons (Table 46).
144
Table 46: Dental treatment access attitudinal scales and attitude items
Attitudinal
Item
Cronbach’s
alpha
Factor
loading
Mean
(95%CI)
Scale 1: access inhibition 0.6 14.65
(14.35, 14.94)
AI 1 I’d like to know more about what the dentist
is going to do and why
0.70 2.68
(2.59, 2.77)
AI 2 Dental receptionists not very helpful or
welcoming
0.62 1.84
(1.76, 1.92)
AI 3 I find NHS treatment difficult to find 0.52 2.51
(2.42, 2.61)
AI 4 Going to the dentist is like being processed
on a conveyer belt
0.50 2.02
(1.94, 2.10)
AI 5 I’d like to be able to drop in at the dentist
without an appointment
0.48 3.26
(3.18, 3.34)
AI 6 I don’t want intricate dental treatment 0.39 2.34
(2.25, 2.43)
Scale 2: access anxiety 0.6 7.06
(6.86,7.25)
AA 1 If I had toothache I’d rather take painkillers
than go to the dentist
0.78 2.65
(2.56, 2.74)
AA 2 The worst part of going to the dentist is
waiting for treatment
0.76 2.52
(2.43, 2.61)
AA 3 I don’t like lying flat in the dental chair 0.49 1.89
(1.80, 1.97)
5.4.81 Dental treatment access attitudes and scales: comparisons by gender
Woman had significantly greater mean scores for the access inhibition and for access
anxiety attitudinal scales compared with the men (Table 47).
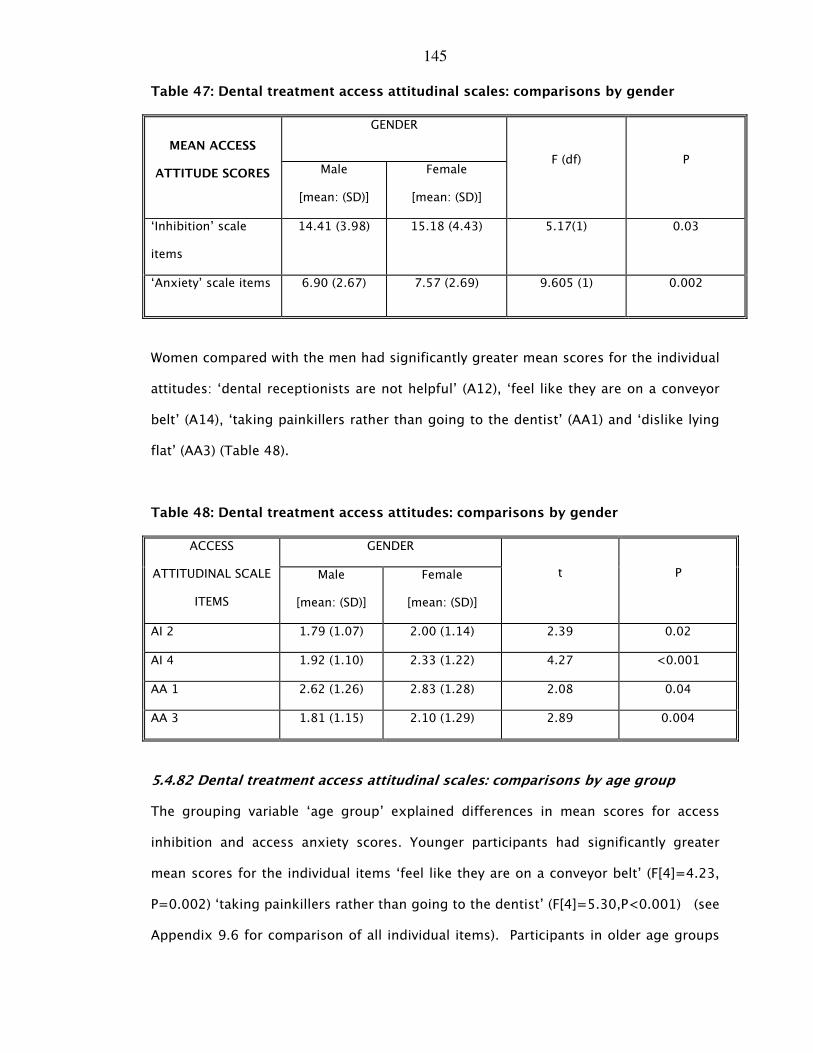
145
Table 47: Dental treatment access attitudinal scales: comparisons by gender
GENDER
MEAN ACCESS
ATTITUDE SCORES Male
[mean: (SD)]
Female
[mean: (SD)]
F (df) P
‘Inhibition’ scale
items
14.41 (3.98) 15.18 (4.43) 5.17(1) 0.03
‘Anxiety’ scale items 6.90 (2.67) 7.57 (2.69) 9.605 (1) 0.002
Women compared with the men had significantly greater mean scores for the individual
attitudes: ‘dental receptionists are not helpful’ (A12), ‘feel like they are on a conveyor
belt’ (A14), ‘taking painkillers rather than going to the dentist’ (AA1) and ‘dislike lying
flat’ (AA3) (Table 48).
Table 48: Dental treatment access attitudes: comparisons by gender
GENDER ACCESS
ATTITUDINAL SCALE
ITEMS
Male
[mean: (SD)]
Female
[mean: (SD)]
t P
AI 2 1.79 (1.07) 2.00 (1.14) 2.39 0.02
AI 4 1.92 (1.10) 2.33 (1.22) 4.27 <0.001
AA 1 2.62 (1.26) 2.83 (1.28) 2.08 0.04
AA 3 1.81 (1.15) 2.10 (1.29) 2.89 0.004
5.4.82 Dental treatment access attitudinal scales: comparisons by age group
The grouping variable ‘age group’ explained differences in mean scores for access
inhibition and access anxiety scores. Younger participants had significantly greater
mean scores for the individual items ‘feel like they are on a conveyor belt’ (F[4]=4.23,
P=0.002) ‘taking painkillers rather than going to the dentist’ (F[4]=5.30,P<0.001) (see
Appendix 9.6 for comparison of all individual items). Participants in older age groups
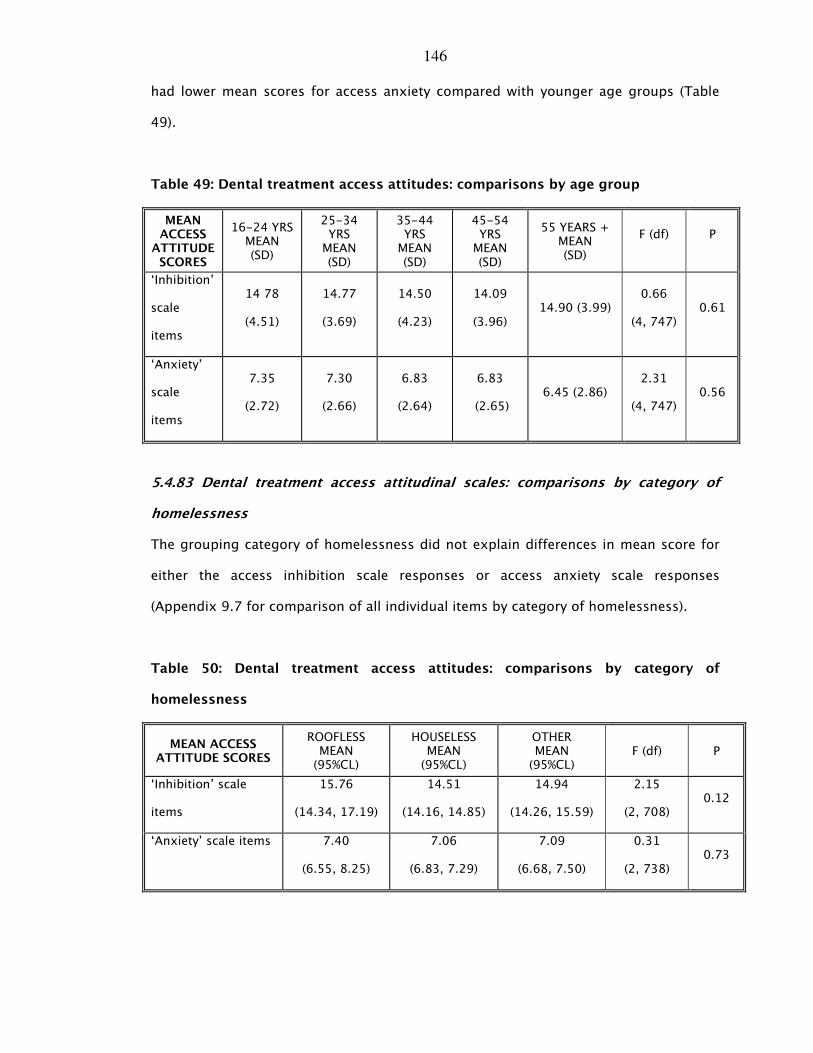
146
had lower mean scores for access anxiety compared with younger age groups (Table
49).
Table 49: Dental treatment access attitudes: comparisons by age group
MEAN ACCESS
ATTITUDE SCORES
16-24 YRS MEAN (SD)
25-34 YRS MEAN (SD)
35-44 YRS MEAN (SD)
45-54 YRS MEAN (SD)
55 YEARS + MEAN (SD)
F (df)
P
‘Inhibition’
scale
items
14 78
(4.51)
14.77
(3.69)
14.50
(4.23)
14.09
(3.96) 14.90 (3.99)
0.66
(4, 747) 0.61
‘Anxiety’
scale
items
7.35
(2.72)
7.30
(2.66)
6.83
(2.64)
6.83
(2.65) 6.45 (2.86)
2.31
(4, 747) 0.56
5.4.83 Dental treatment access attitudinal scales: comparisons by category of
homelessness
The grouping category of homelessness did not explain differences in mean score for
either the access inhibition scale responses or access anxiety scale responses
(Appendix 9.7 for comparison of all individual items by category of homelessness).
Table 50: Dental treatment access attitudes: comparisons by category of
homelessness
MEAN ACCESS ATTITUDE SCORES
ROOFLESS MEAN (95%CL)
HOUSELESS MEAN (95%CL)
OTHER MEAN (95%CL)
F (df) P
‘Inhibition’ scale
items
15.76
(14.34, 17.19)
14.51
(14.16, 14.85)
14.94
(14.26, 15.59)
2.15
(2, 708) 0.12
‘Anxiety’ scale items 7.40
(6.55, 8.25)
7.06
(6.83, 7.29)
7.09
(6.68, 7.50)
0.31
(2, 738) 0.73
147
5.5 Psycho-social health
5.5.1 Dental anxiety
The mean modified dental anxiety scale (MDAS) score for the sample was 11.7 [95% CI:
11.21, 12.25]. Twenty percent (170) of participants scored 19 or over, suggesting that
one-fifth of the sample were categorised as dentally phobic. Larger proportions of
participants reported that they were extremely anxious about having their teeth drilled
(24%) and having a local anaesthetic (22%). The least feared item was a scale and
polish with only 11% scoring 5.
5.5.12 Dental anxiety: comparison of mean MDAS scores by gender
Women (14.42 [6.86]) compared with men (11.26 [6.29]) had significantly higher mean
scores for dental anxiety (t=5.85:P<0.001). Seventeen percent of men (101) and 32%
(69) of women scored 19. Women had significantly higher mean scores for anxiety
associated with ‘treatment tomorrow’ (t=4.84:P<0.001), ‘waiting room’
(t=5.45:P<0.001), ‘teeth drilled’ (t=5.53:P<0.001), ‘teeth scaled and polished
(t=4.08:P<0.001) and local anaesthetic injection than men (t=5.97:P<0.001).
5.5.13 Dental anxiety: comparison of mean MDAS scores by age group
The grouping variable ‘age group’ significantly explained differences in mean total
MDAS scores (F[4,778]=6.49:P<0.001). Participants aged between 45-54 years and
from 55 years and older had significantly lower mean scores for dental anxiety
compared with those aged between 25 and 34 years. The grouping variable age group
significantly explained differences in the individual mean MDAS item scores.
Participants aged between 45-54 years and from 55 years and older had significantly
lower mean scores for dental anxiety compared with those in younger age groups
(Table 51).
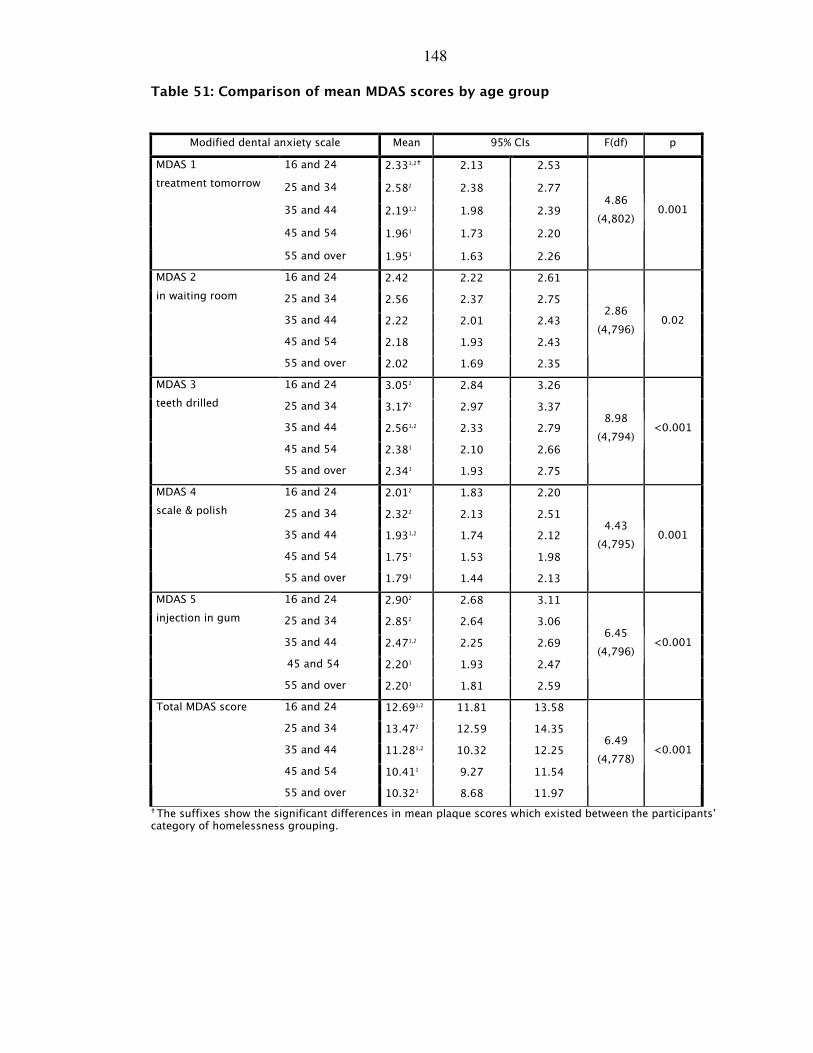
148
Table 51: Comparison of mean MDAS scores by age group
� The suffixes show the significant differences in mean plaque scores which existed between the participants’ category of homelessness grouping.
Modified dental anxiety scale Mean 95% CIs F(df) p
16 and 24 2.331,2� 2.13 2.53
25 and 34 2.582 2.38 2.77
35 and 44 2.191,2 1.98 2.39
45 and 54 1.961 1.73 2.20
MDAS 1
treatment tomorrow
55 and over 1.951 1.63 2.26
4.86
(4,802) 0.001
16 and 24 2.42 2.22 2.61
25 and 34 2.56 2.37 2.75
35 and 44 2.22 2.01 2.43
45 and 54 2.18 1.93 2.43
MDAS 2
in waiting room
55 and over 2.02 1.69 2.35
2.86
(4,796) 0.02
16 and 24 3.052 2.84 3.26
25 and 34 3.172 2.97 3.37
35 and 44 2.561,2 2.33 2.79
45 and 54 2.381 2.10 2.66
MDAS 3
teeth drilled
55 and over 2.341 1.93 2.75
8.98
(4,794) <0.001
16 and 24 2.012 1.83 2.20
25 and 34 2.322 2.13 2.51
35 and 44 1.931,2 1.74 2.12
45 and 54 1.751 1.53 1.98
MDAS 4
scale & polish
55 and over 1.791 1.44 2.13
4.43
(4,795) 0.001
16 and 24 2.902 2.68 3.11
25 and 34 2.852 2.64 3.06
35 and 44 2.471,2 2.25 2.69
45 and 54 2.201 1.93 2.47
MDAS 5
injection in gum
55 and over 2.201 1.81 2.59
6.45
(4,796) <0.001
16 and 24 12.691,2 11.81 13.58
25 and 34 13.472 12.59 14.35
35 and 44 11.281,2 10.32 12.25
45 and 54 10.411 9.27 11.54
Total MDAS score
55 and over 10.321 8.68 11.97
6.49
(4,778) <0.001
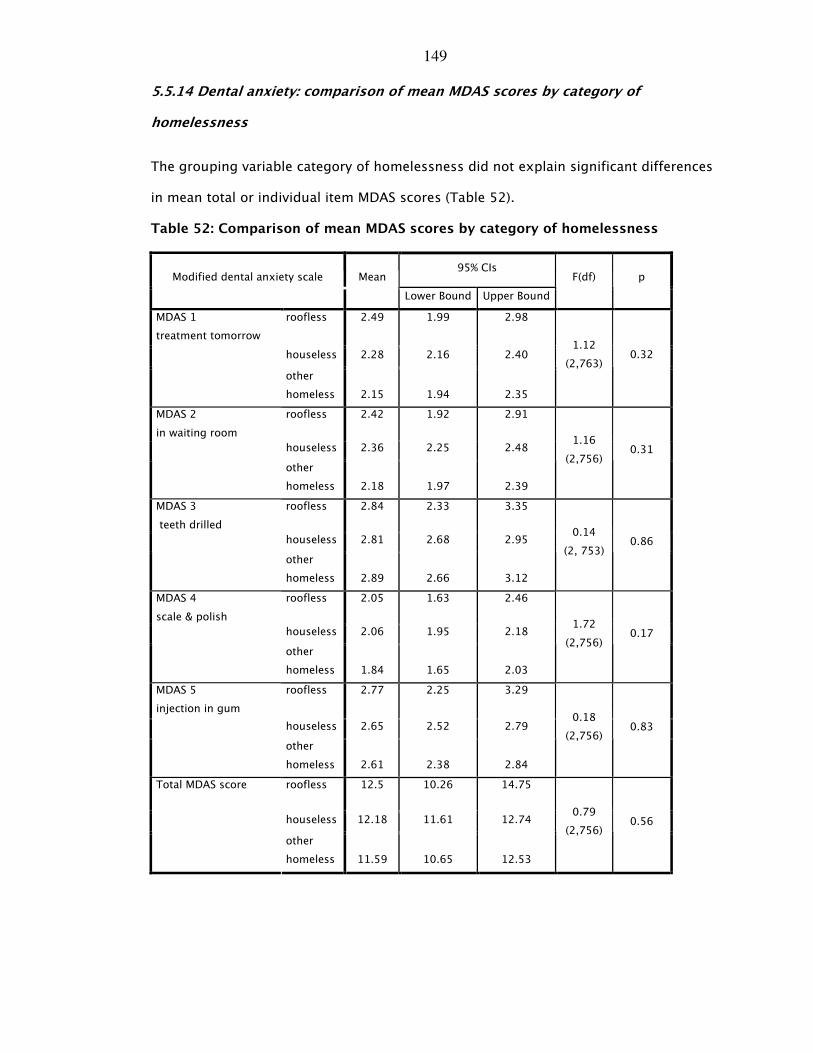
149
5.5.14 Dental anxiety: comparison of mean MDAS scores by category of
homelessness
The grouping variable category of homelessness did not explain significant differences
in mean total or individual item MDAS scores (Table 52).
Table 52: Comparison of mean MDAS scores by category of homelessness
95% CIs Modified dental anxiety scale Mean
Lower Bound Upper Bound
F(df) p
roofless 2.49 1.99 2.98
houseless 2.28 2.16 2.40
MDAS 1
treatment tomorrow
other
homeless
2.15
1.94
2.35
1.12
(2,763) 0.32
roofless 2.42 1.92 2.91
houseless 2.36 2.25 2.48
MDAS 2
in waiting room
other
homeless
2.18
1.97
2.39
1.16
(2,756) 0.31
roofless 2.84 2.33 3.35
houseless 2.81 2.68 2.95
MDAS 3
teeth drilled
other
homeless
2.89
2.66
3.12
0.14
(2, 753) 0.86
roofless 2.05 1.63 2.46
houseless 2.06 1.95 2.18
MDAS 4
scale & polish
other
homeless
1.84
1.65
2.03
1.72
(2,756) 0.17
roofless 2.77 2.25 3.29
houseless 2.65 2.52 2.79
MDAS 5
injection in gum
other
homeless
2.61
2.38
2.84
0.18
(2,756) 0.83
roofless 12.5 10.26 14.75
houseless 12.18 11.61 12.74
Total MDAS score
other
homeless
11.59
10.65
12.53
0.79
(2,756) 0.56
150
5.5.2 Oral health-related quality of life (OHIP-14)
The mean OHIP-14 total score was 1.22 [95%CI: 1.14,1.29]. Figure 11 and Table 53
show the frequency of oral health impacts experienced by this sample of homeless
people in the last 12 months. Twenty-five percent of the sample reported feeling self-
conscious very often, and 23% reported feeling embarrassed very often about the
appearance of their mouth and teeth. In addition, 13% stated that very often they
found their lives less satisfying because of problems with their mouth and teeth. As
expected, many respondents occasionally experienced painful aching (31%), discomfort
when eating (28%), and interruptions during meals (21%).
For this population of homeless people, oral health impacted upon their psychological
functioning with regard to psychological discomfort and disability. In comparison with
the Scottish sample from the Adult Dental Health Survey 1998 [135], larger proportions
of participants in the homeless sample experienced greater numbers of impacts
compared with the UK population.
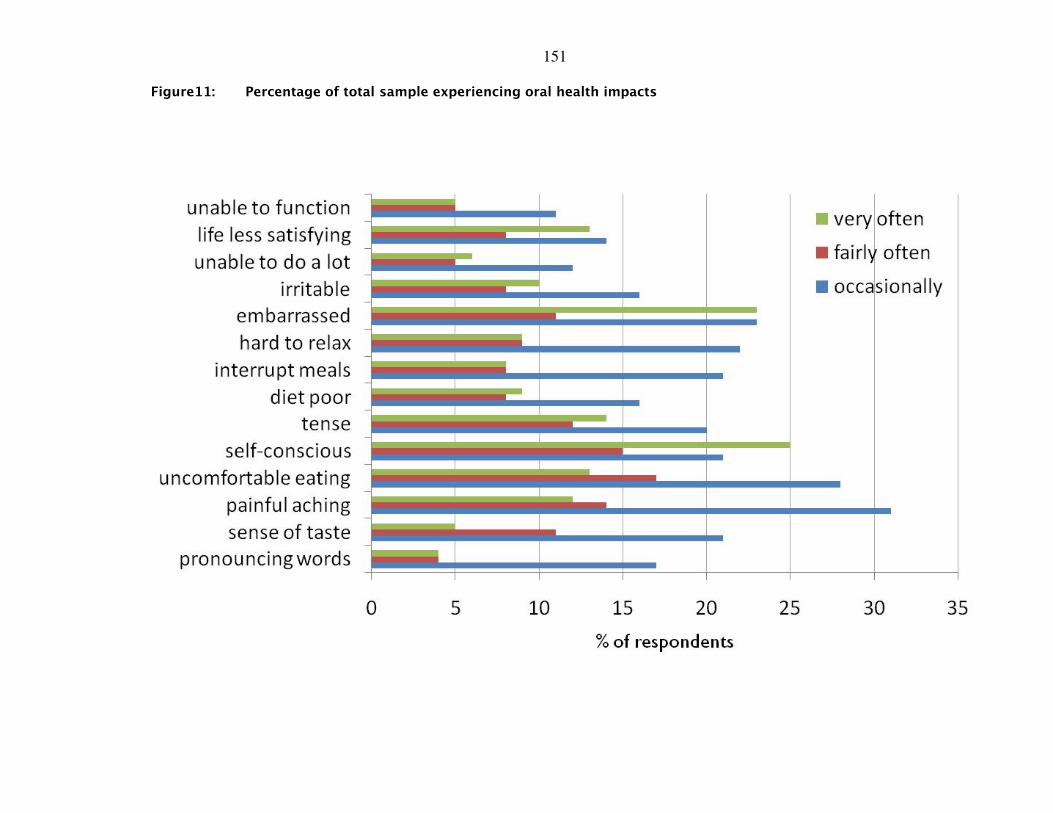
151
Figure11: Percentage of total sample experiencing oral health impacts
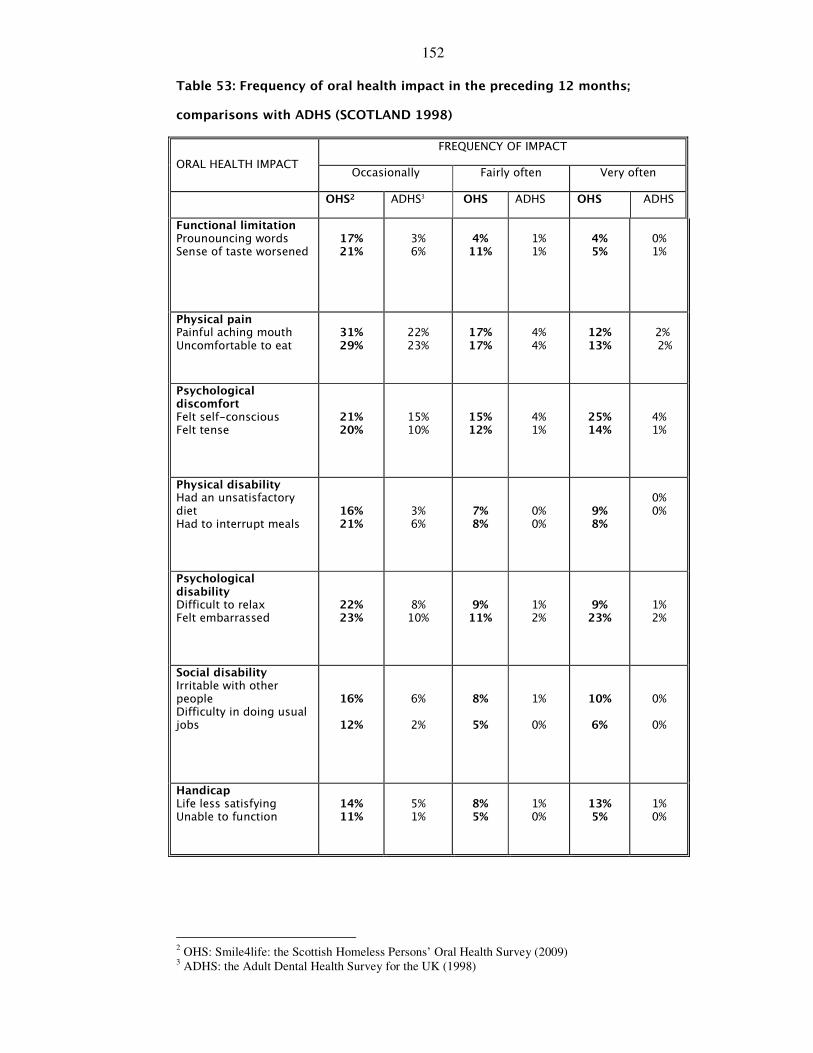
152
Table 53: Frequency of oral health impact in the preceding 12 months;
comparisons with ADHS (SCOTLAND 1998)
FREQUENCY OF IMPACT
ORAL HEALTH IMPACT Occasionally Fairly often Very often
OHS2 ADHS3 OHS ADHS OHS ADHS
Functional limitation Prounouncing words Sense of taste worsened
17% 21%
3% 6%
4%
11%
1% 1%
4% 5%
0% 1%
Physical pain Painful aching mouth Uncomfortable to eat
31% 29%
22% 23%
17% 17%
4% 4%
12% 13%
2% 2%
Psychological discomfort Felt self-conscious Felt tense
21% 20%
15% 10%
15% 12%
4% 1%
25% 14%
4% 1%
Physical disability Had an unsatisfactory diet Had to interrupt meals
16% 21%
3% 6%
7% 8%
0% 0%
9% 8%
0% 0%
Psychological disability Difficult to relax Felt embarrassed
22% 23%
8% 10%
9% 11%
1% 2%
9% 23%
1% 2%
Social disability Irritable with other people Difficulty in doing usual jobs
16%
12%
6%
2%
8%
5%
1%
0%
10%
6%
0%
0%
Handicap Life less satisfying Unable to function
14% 11%
5% 1%
8% 5%
1% 0%
13% 5%
1% 0%
2 OHS: Smile4life: the Scottish Homeless Persons’ Oral Health Survey (2009)
3 ADHS: the Adult Dental Health Survey for the UK (1998)
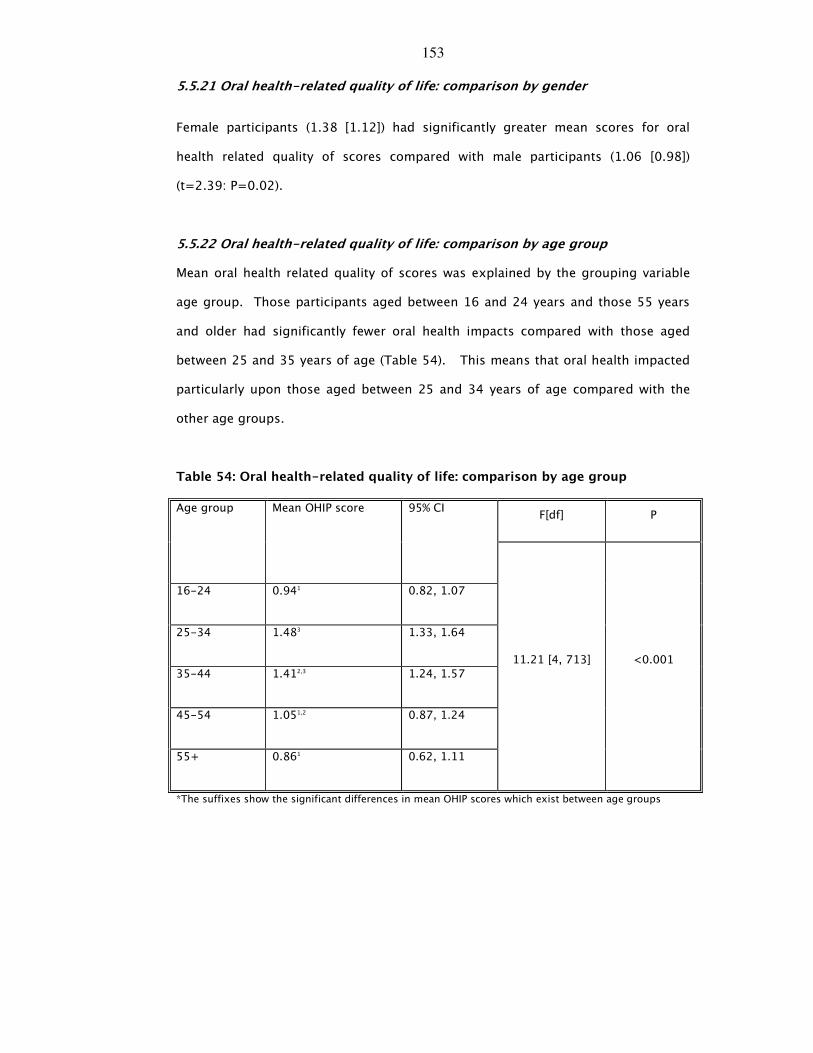
153
5.5.21 Oral health-related quality of life: comparison by gender
Female participants (1.38 [1.12]) had significantly greater mean scores for oral
health related quality of scores compared with male participants (1.06 [0.98])
(t=2.39: P=0.02).
5.5.22 Oral health-related quality of life: comparison by age group
Mean oral health related quality of scores was explained by the grouping variable
age group. Those participants aged between 16 and 24 years and those 55 years
and older had significantly fewer oral health impacts compared with those aged
between 25 and 35 years of age (Table 54). This means that oral health impacted
particularly upon those aged between 25 and 34 years of age compared with the
other age groups.
Table 54: Oral health-related quality of life: comparison by age group
F[df] P Age group Mean OHIP score 95% CI
16-24 0.941 0.82, 1.07
25-34 1.483 1.33, 1.64
35-44 1.412,3 1.24, 1.57
45-54 1.051,2 0.87, 1.24
55+ 0.861 0.62, 1.11
11.21 [4, 713] <0.001
*The suffixes show the significant differences in mean OHIP scores which exist between age groups
154
5.5.23 Oral health-related quality of life: comparison by category of
homelessness
The grouping variable category of homelessness did not explain differences in total
mean OHIP scales (F[2,679]=1.78:P=0.12). However, people who were categorised
as ‘roofless’ had significantly higher mean scores compared with those categorised
as ‘houseless’ and ‘other homeless’ for ‘difficulty in pronouncing words’, ‘difficulty
in relaxing’, ‘life less satisfying’ and ‘being unable to function’. Differences in mean
oral health impact scores were noted between those participants categorised as
‘roofless’ compared with the ‘other homeless’ for ‘sense of smell’ (P=0.06) and
‘difficulties during the usual jobs’ (P=0.07) (Table 55).

155
Table 55: Oral health-related quality of life: comparisons of mean scores by
category of homelessness
ORAL HEALTH IMPACT Mean 95% Confidence Intervals Lower Upper
F (df) p
roofless 1.052 0.63 1.47
houseless 0.79 1,2 0.70 0.89
OHIP 1 pronouncing words
other 0.571 0.41 0.72
3.85 (2,753)
0.02
roofless 1.422 0.99 1.85
houseless 1.021,2 0.91 1.13
OHIP 2 sense of taste
other 0.911, 0.74 1.09
2.72 (2,751)
0.06
roofless 1.79 1.32 2.25
houseless 1.73 1.62 1.85
OHIP 3 painful aching
other 1.76 1.57 1.95
0.05 (2,747)
0.94
roofless 2.10 1.62 2.57
houseless 1.73 1.61 1.85
OHIP 4 uncomfortable to eat
other 1.63 1.44 1.82
1.88 (2,749)
0.15
roofless 1.95 1.46 2.44
houseless 1.95 1.81 2.08
OHIP 5 self-conscious
other 1.82 1.57 2.06
0.42 (2,744)
0.65
roofless 1.71 1.23 2.19
houseless 1.41 1.29 1.54
OHIP 6 Tense
other 1.42 1.19 1.65
0.75 (2,749)
0.46
roofless 1.12 0.69 1.55
houseless 1.01 0.90 1.13
OHIP 7 diet unsatisfactory
other 0.97 0.77 1.18
0.19 (2,748)
0.82
roofless 1.28 0.87 1.69
houseless 1.13 1.01 1.24
other 1.01 0.82 1.20
OHIP 8 interrupt meals
Total 1.11 1.02 1.21
0.83 (2,751)
0.43
roofless 1.91,2 1.43 2.39
houseless 1.171 1.05 1.28
OHIP 9 difficult to relax
other 1.161 0.97 1.36
6.15 (2,747)
0.002
roofless 2.07 1.57 2.57
houseless 1.82 1.68 1.95
OHIP 10 embarrassed
other 1.73 1.50 1.96
0.78 (2,749)
0.45
roofless 1.53 1.06 2.01
houseless 1.08 0.96 1.20
OHIP 11 irritable
other 1.09 0.89 1.30
2.16 (2,744)
0.11
roofless 1.142 0.66 1.62
houseless 0.741,2 0.64 0.84
OHIP 12 difficulties doing usual jobs
other 0.671, 0.51 0.83
2.64 (2,749)
0.07
roofless 1.702 1.22 2.18
houseless 1.121 0.99 1.24
OHIP 13 life less satisfying
other 0.991 0.78 1.19
4.20 (2,748)
0.01
roofless 1.14,2 0.71 1.57
houseless 0.611,2 0.52 0.71
OHIP 14 unable to function
other 0.561 0.41 0.71
4.96 (2,750)
0.007
*The suffixes show the significant differences in mean OHIP scores which exist between category of homeless groups.
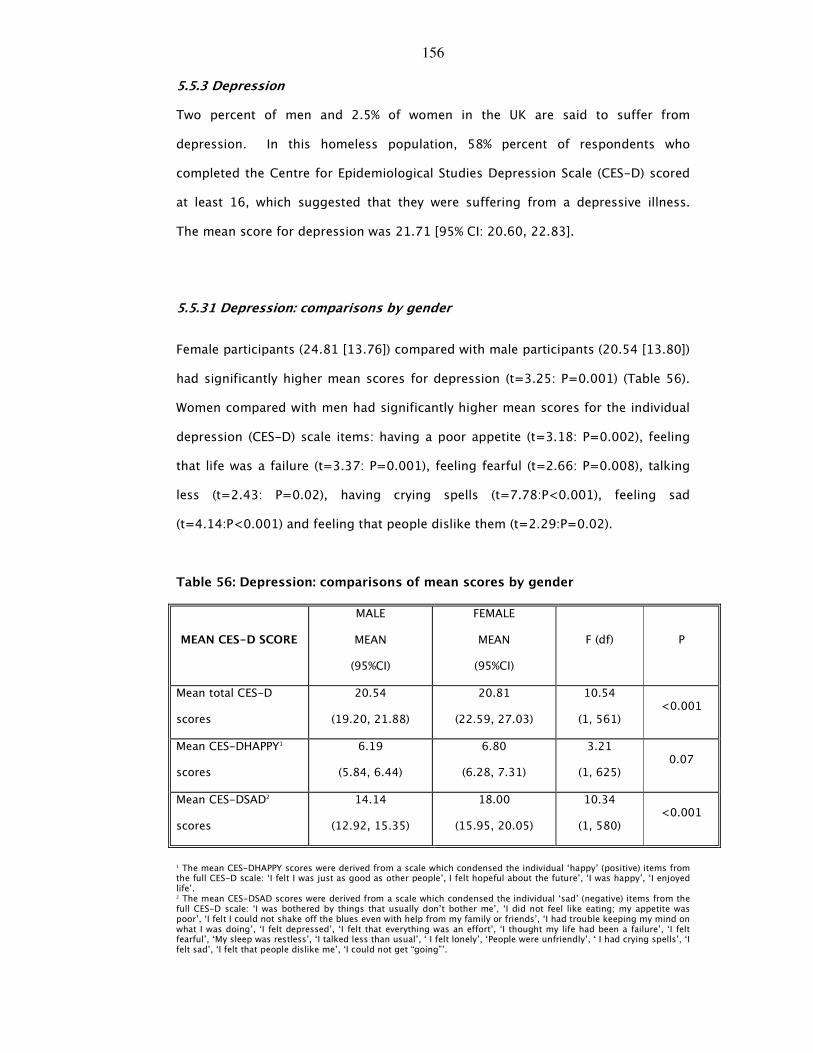
156
5.5.3 Depression
Two percent of men and 2.5% of women in the UK are said to suffer from
depression. In this homeless population, 58% percent of respondents who
completed the Centre for Epidemiological Studies Depression Scale (CES-D) scored
at least 16, which suggested that they were suffering from a depressive illness.
The mean score for depression was 21.71 [95% CI: 20.60, 22.83].
5.5.31 Depression: comparisons by gender
Female participants (24.81 [13.76]) compared with male participants (20.54 [13.80])
had significantly higher mean scores for depression (t=3.25: P=0.001) (Table 56).
Women compared with men had significantly higher mean scores for the individual
depression (CES-D) scale items: having a poor appetite (t=3.18: P=0.002), feeling
that life was a failure (t=3.37: P=0.001), feeling fearful (t=2.66: P=0.008), talking
less (t=2.43: P=0.02), having crying spells (t=7.78:P<0.001), feeling sad
(t=4.14:P<0.001) and feeling that people dislike them (t=2.29:P=0.02).
Table 56: Depression: comparisons of mean scores by gender
MEAN CES-D SCORE
MALE
MEAN
(95%CI)
FEMALE
MEAN
(95%CI)
F (df) P
Mean total CES-D
scores
20.54
(19.20, 21.88)
20.81
(22.59, 27.03)
10.54
(1, 561) <0.001
Mean CES-DHAPPY1
scores
6.19
(5.84, 6.44)
6.80
(6.28, 7.31)
3.21
(1, 625) 0.07
Mean CES-DSAD2
scores
14.14
(12.92, 15.35)
18.00
(15.95, 20.05)
10.34
(1, 580) <0.001
1 The mean CES-DHAPPY scores were derived from a scale which condensed the individual ‘happy’ (positive) items from the full CES-D scale: ‘I felt I was just as good as other people’, I felt hopeful about the future’, ‘I was happy’, ‘I enjoyed life’. 2 The mean CES-DSAD scores were derived from a scale which condensed the individual ‘sad’ (negative) items from the full CES-D scale: ‘I was bothered by things that usually don’t bother me’, ‘I did not feel like eating; my appetite was poor’, ‘I felt I could not shake off the blues even with help from my family or friends’, ‘I had trouble keeping my mind on what I was doing’, ‘I felt depressed’, ‘I felt that everything was an effort’, ‘I thought my life had been a failure’, ‘I felt fearful’, ‘My sleep was restless’, ‘I talked less than usual’, ‘ I felt lonely’, ‘People were unfriendly’, ‘ I had crying spells’, ‘I felt sad’, ‘I felt that people dislike me’, ‘I could not get “going”’.
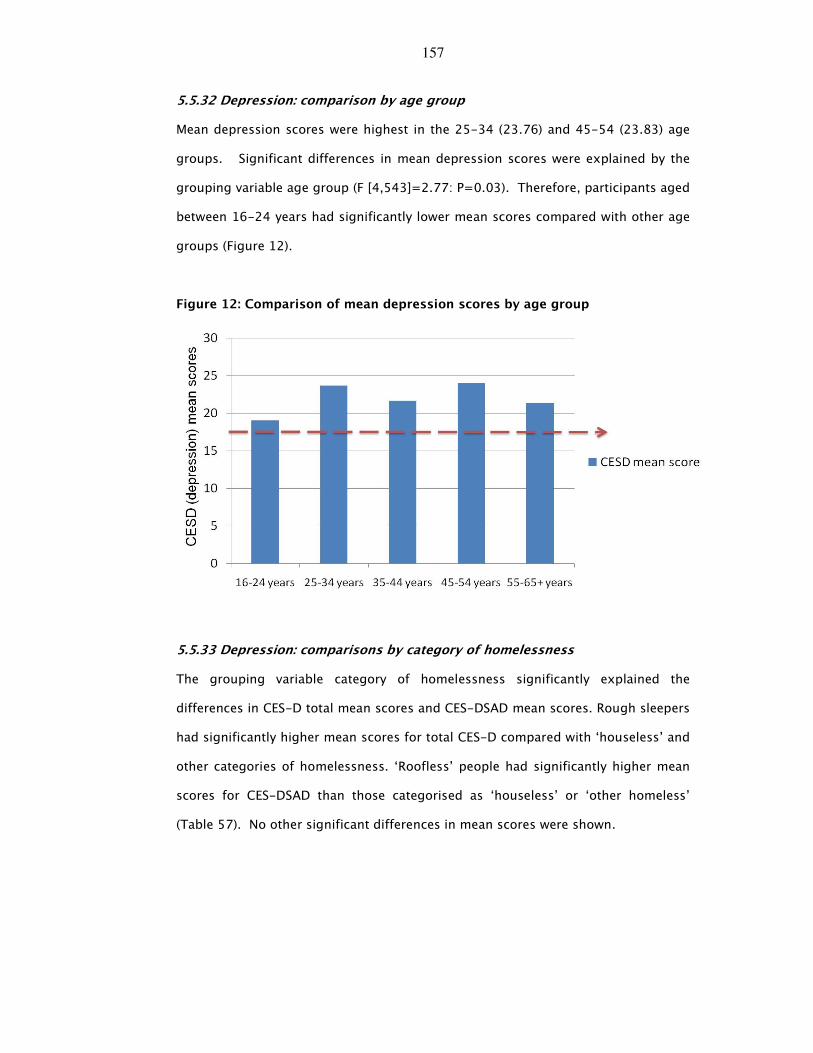
157
5.5.32 Depression: comparison by age group
Mean depression scores were highest in the 25-34 (23.76) and 45-54 (23.83) age
groups. Significant differences in mean depression scores were explained by the
grouping variable age group (F [4,543]=2.77: P=0.03). Therefore, participants aged
between 16-24 years had significantly lower mean scores compared with other age
groups (Figure 12).
Figure 12: Comparison of mean depression scores by age group
5.5.33 Depression: comparisons by category of homelessness
The grouping variable category of homelessness significantly explained the
differences in CES-D total mean scores and CES-DSAD mean scores. Rough sleepers
had significantly higher mean scores for total CES-D compared with ‘houseless’ and
other categories of homelessness. ‘Roofless’ people had significantly higher mean
scores for CES-DSAD than those categorised as ‘houseless’ or ‘other homeless’
(Table 57). No other significant differences in mean scores were shown.
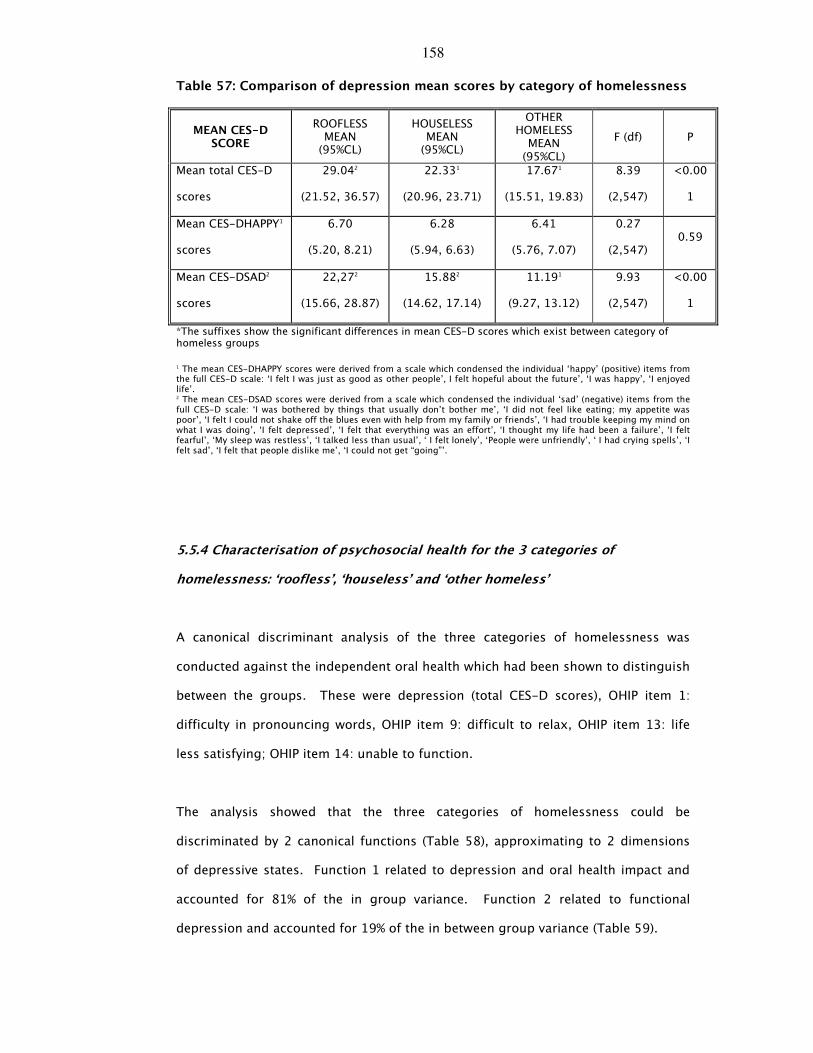
158
Table 57: Comparison of depression mean scores by category of homelessness
MEAN CES-D SCORE
ROOFLESS MEAN (95%CL)
HOUSELESS MEAN (95%CL)
OTHER HOMELESS MEAN (95%CL)
F (df) P
Mean total CES-D
scores
29.042
(21.52, 36.57)
22.331
(20.96, 23.71)
17.671
(15.51, 19.83)
8.39
(2,547)
<0.00
1
Mean CES-DHAPPY1
scores
6.70
(5.20, 8.21)
6.28
(5.94, 6.63)
6.41
(5.76, 7.07)
0.27
(2,547) 0.59
Mean CES-DSAD2
scores
22,272
(15.66, 28.87)
15.882
(14.62, 17.14)
11.191
(9.27, 13.12)
9.93
(2,547)
<0.00
1
*The suffixes show the significant differences in mean CES-D scores which exist between category of homeless groups
1 The mean CES-DHAPPY scores were derived from a scale which condensed the individual ‘happy’ (positive) items from the full CES-D scale: ‘I felt I was just as good as other people’, I felt hopeful about the future’, ‘I was happy’, ‘I enjoyed life’. 2 The mean CES-DSAD scores were derived from a scale which condensed the individual ‘sad’ (negative) items from the full CES-D scale: ‘I was bothered by things that usually don’t bother me’, ‘I did not feel like eating; my appetite was poor’, ‘I felt I could not shake off the blues even with help from my family or friends’, ‘I had trouble keeping my mind on what I was doing’, ‘I felt depressed’, ‘I felt that everything was an effort’, ‘I thought my life had been a failure’, ‘I felt fearful’, ‘My sleep was restless’, ‘I talked less than usual’, ‘ I felt lonely’, ‘People were unfriendly’, ‘ I had crying spells’, ‘I felt sad’, ‘I felt that people dislike me’, ‘I could not get “going”’.
5.5.4 Characterisation of psychosocial health for the 3 categories of
homelessness: ‘roofless’, ‘houseless’ and ‘other homeless’
A canonical discriminant analysis of the three categories of homelessness was
conducted against the independent oral health which had been shown to distinguish
between the groups. These were depression (total CES-D scores), OHIP item 1:
difficulty in pronouncing words, OHIP item 9: difficult to relax, OHIP item 13: life
less satisfying; OHIP item 14: unable to function.
The analysis showed that the three categories of homelessness could be
discriminated by 2 canonical functions (Table 58), approximating to 2 dimensions
of depressive states. Function 1 related to depression and oral health impact and
accounted for 81% of the in group variance. Function 2 related to functional
depression and accounted for 19% of the in between group variance (Table 59).
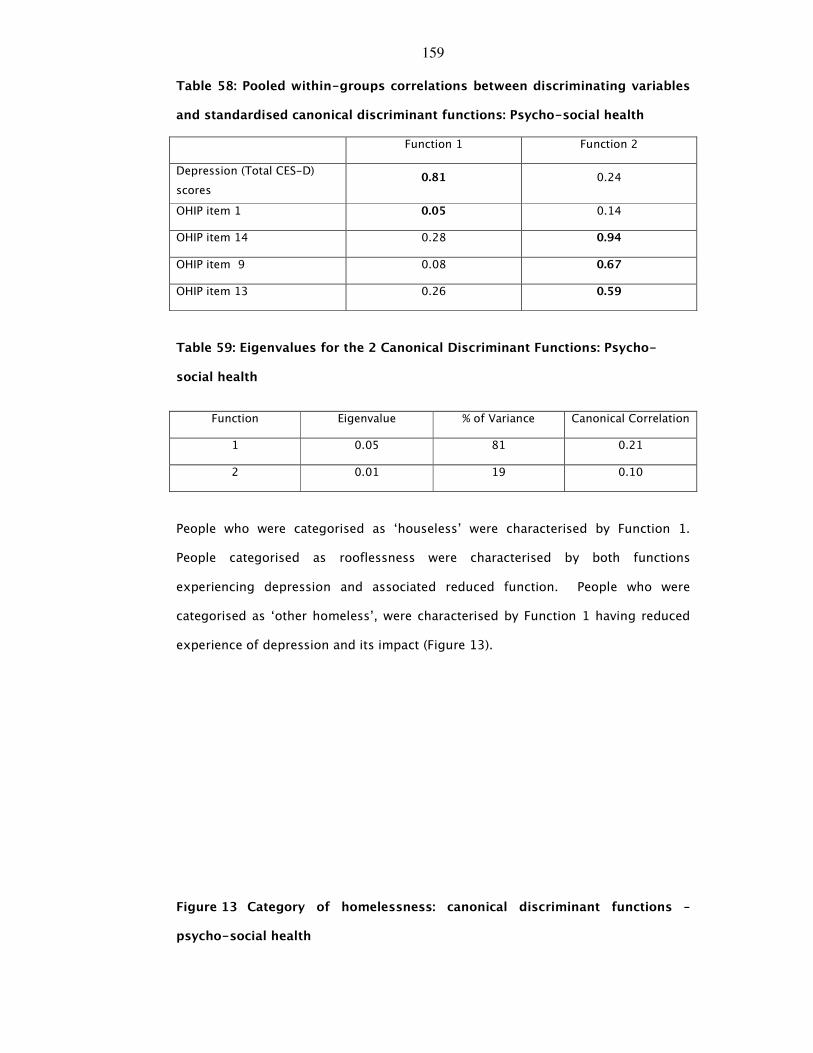
159
Table 58: Pooled within-groups correlations between discriminating variables
and standardised canonical discriminant functions: Psycho-social health
Function 1 Function 2
Depression (Total CES-D)
scores 0.81 0.24
OHIP item 1 0.05 0.14
OHIP item 14 0.28 0.94
OHIP item 9 0.08 0.67
OHIP item 13 0.26 0.59
Table 59: Eigenvalues for the 2 Canonical Discriminant Functions: Psycho-
social health
Function Eigenvalue % of Variance Canonical Correlation
1 0.05 81 0.21
2 0.01 19 0.10
People who were categorised as ‘houseless’ were characterised by Function 1.
People categorised as rooflessness were characterised by both functions
experiencing depression and associated reduced function. People who were
categorised as ‘other homeless’, were characterised by Function 1 having reduced
experience of depression and its impact (Figure 13).
Figure 13 Category of homelessness: canonical discriminant functions –
psycho-social health
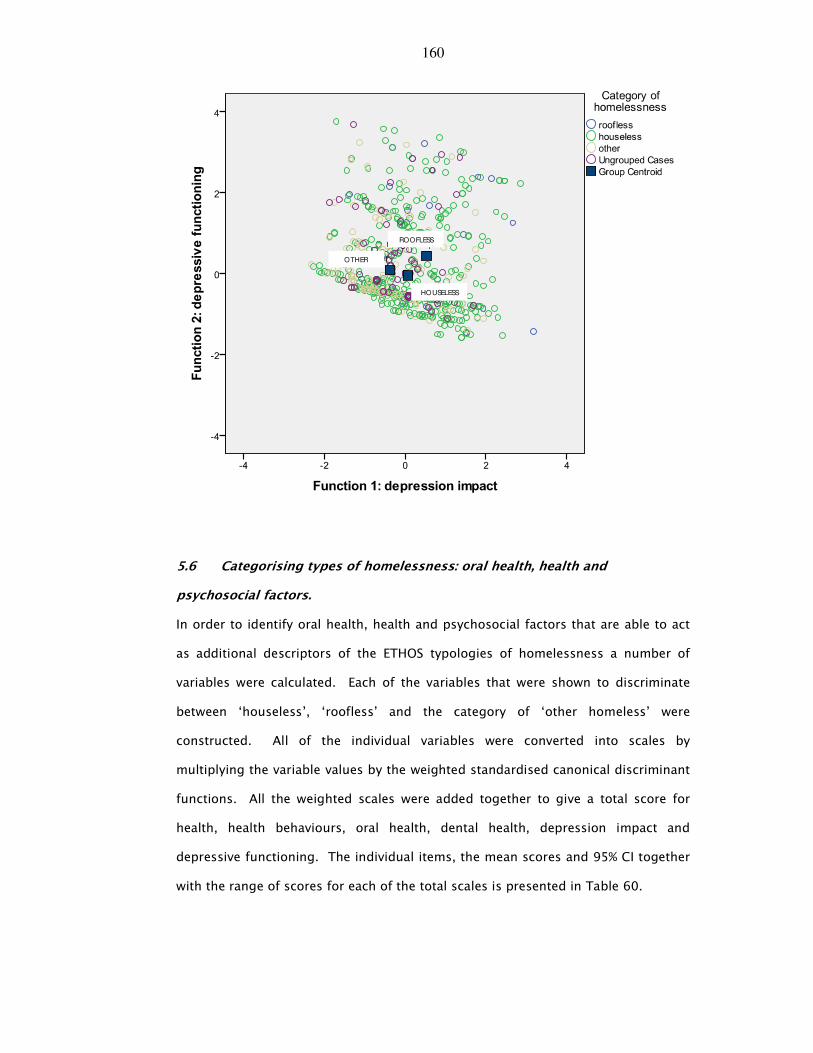
160
ROOFLESS
HOUSELESS
OTHER
5.6 Categorising types of homelessness: oral health, health and
psychosocial factors.
In order to identify oral health, health and psychosocial factors that are able to act
as additional descriptors of the ETHOS typologies of homelessness a number of
variables were calculated. Each of the variables that were shown to discriminate
between ‘houseless’, ‘roofless’ and the category of ‘other homeless’ were
constructed. All of the individual variables were converted into scales by
multiplying the variable values by the weighted standardised canonical discriminant
functions. All the weighted scales were added together to give a total score for
health, health behaviours, oral health, dental health, depression impact and
depressive functioning. The individual items, the mean scores and 95% CI together
with the range of scores for each of the total scales is presented in Table 60.
161
A multi-nomial logistic regression analysis was conducted to determine the
characterisation which defined the ETHOS categorisations of homelessness and the
direction of that association. Three independent variables were used and were
specified using an indicator coding scheme. These were, age, NHS Board of
residence and family type. NHS Board of residence was categorised as mixed
rural/urban=0 and urban=1. Age was recoded into 4 age groups (16-24 years=0;
25-34 years=1; 35-45 years =2 and 45 years and over =3) and family type was
recoded as 4 subgroups (single=0; partner/no children=1; one parent family =2;
two parent family =3). These demographic factors were entered into the analysis as
fixed factors using the forced entry method.
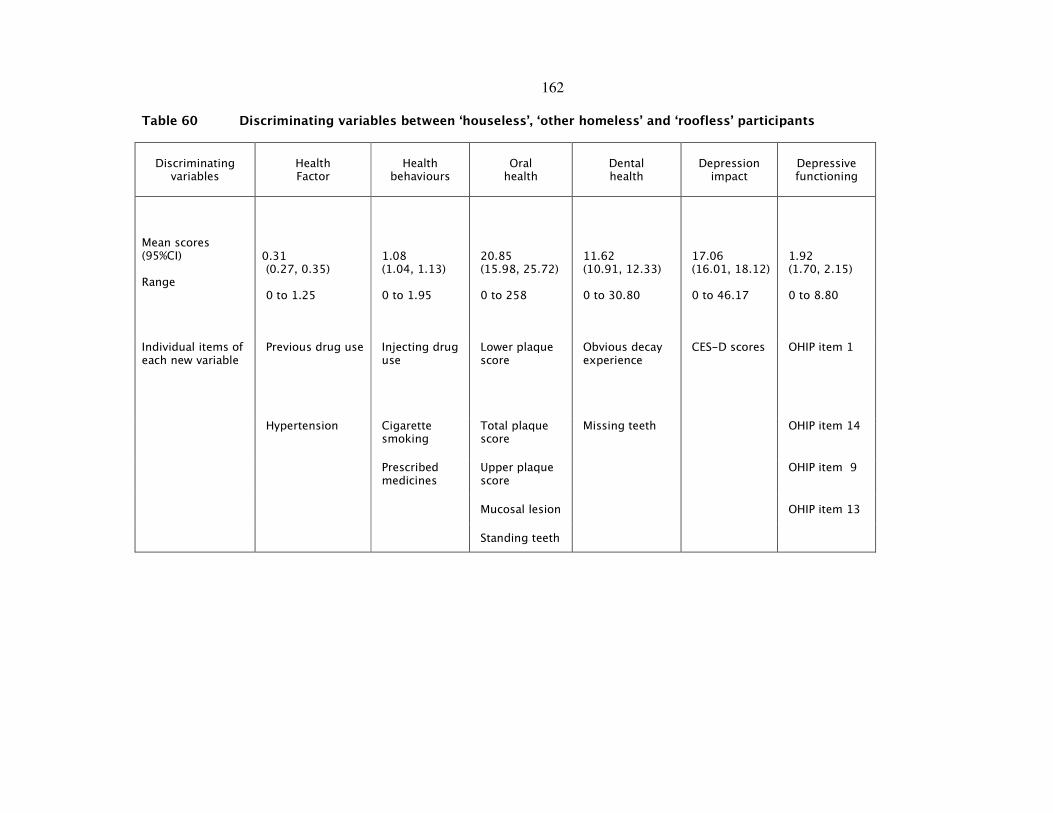
162
Table 60 Discriminating variables between ‘houseless’, ‘other homeless’ and ‘roofless’ participants
Discriminating variables
Health Factor
Health behaviours
Oral health
Dental health
Depression impact
Depressive functioning
Mean scores (95%CI) Range
0.31 (0.27, 0.35) 0 to 1.25
1.08 (1.04, 1.13) 0 to 1.95
20.85 (15.98, 25.72) 0 to 258
11.62 (10.91, 12.33) 0 to 30.80
17.06 (16.01, 18.12) 0 to 46.17
1.92 (1.70, 2.15) 0 to 8.80
Previous drug use Injecting drug use
Lower plaque score
Obvious decay experience
CES-D scores OHIP item 1
Hypertension Cigarette smoking
Total plaque score
Missing teeth OHIP item 14
Prescribed medicines
Upper plaque score
OHIP item 9
Mucosal lesion OHIP item 13
Individual items of each new variable
Standing teeth
163
The above additional new independent variables of oral health, dental health, health,
health behaviours, depression impact and depressive functioning (Table 60) were
entered as covariates using a backward stepwise procedure. All independent variables
were regressed against the dependent variable categorisation of homelessness. The
dependent variable was defined as ‘houseless’ (=0), ‘other homeless’ (=1) and
‘roofless’ (=2). ‘Houseless’ was used as the reference category.
5.6.1 Categorising ‘other homeless’ participants relative to ‘houseless’
participants
Participants residing in a mixed rural-urban NHS Board compared to those residing in
an urban NHS Board the relative risk for being ‘other homeless’ relative to the reference
category ‘houseless’ would be expected to increase by a factor of 5.87 given that all
other factors in the model are kept constant. This means that participants residing in a
mixed rural-urban NHS Board are significantly more likely than those residing in an
urban NHS Board to be ‘other homeless’ than houseless. For those participants who
were single relative to those who were in two-parent families the relative risk for being
‘other homeless’ relative to the reference category ‘houseless’ would be expected to
decrease by a factor of 0.19 given that the other variables in the model are kept
constant. For those participants who were in a partnership relative to those who were
in two-parent families the relative risk for being ‘other homeless’ relative to the
reference category ‘houseless’ would be expected to decrease by a factor of 0.08 given
that the other variables in the model are kept constant. This means that participants
who were single or in a partnership with no children were significantly less likely than
two-parent families to be categorised as ‘houseless’ (Table 61).
For one unit increase in health score, the relative risk of being ‘houseless’ relative to
‘other homeless’ would be 0.31 times more likely when the other variables in the model
are held constant. In other words if ‘other homeless’ participants were to increase their
164
health scores, they would significantly be more likely to be in the ‘houseless’ group
rather than the ‘other homeless’ group. Similarly for one unit increase in depression
impact score, the relative risk of being ‘houseless’ over ‘other homeless’ would be 0.97
times more likely when the other variables in the model are held constant. This means
that if ‘other homeless’ group members were to increase their depression impact
scores they would significantly be more likely to be in the ‘houseless’ group than the
‘other homeless’ group. No other significant effects were shown (Table 61).
5.6.2 Categorising ‘roofless’ participants relative to ‘houseless’ participants
For one unit increase in depression impact score, the relative risk of being ‘roofless’
over ‘houseless’ would be 1.61 times more likely when the other variables in the model
are held constant. This means that if ‘roofless’ group members were to increase their
depression impact scores they would significantly be more likely to be in the ‘roofless’
group than the ‘houseless’ group. No other significant effects were shown (Table 61).
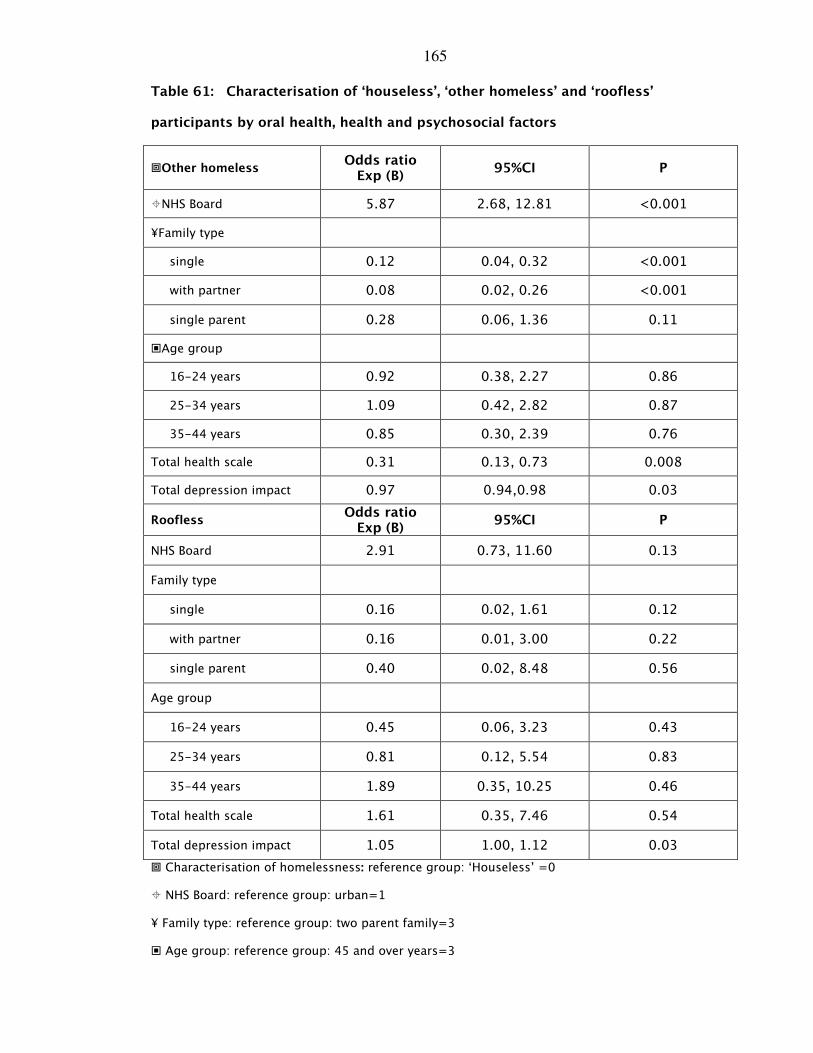
165
Table 61: Characterisation of ‘houseless’, ‘other homeless’ and ‘roofless’
participants by oral health, health and psychosocial factors
�Other homeless Odds ratio
Exp (B) 95%CI P
�NHS Board 5.87 2.68, 12.81 <0.001
¥Family type
single 0.12 0.04, 0.32 <0.001
with partner 0.08 0.02, 0.26 <0.001
single parent 0.28 0.06, 1.36 0.11
�Age group
16-24 years 0.92 0.38, 2.27 0.86
25-34 years 1.09 0.42, 2.82 0.87
35-44 years 0.85 0.30, 2.39 0.76
Total health scale 0.31 0.13, 0.73 0.008
Total depression impact 0.97 0.94,0.98 0.03
Roofless Odds ratio
Exp (B) 95%CI P
NHS Board 2.91 0.73, 11.60 0.13
Family type
single 0.16 0.02, 1.61 0.12
with partner 0.16 0.01, 3.00 0.22
single parent 0.40 0.02, 8.48 0.56
Age group
16-24 years 0.45 0.06, 3.23 0.43
25-34 years 0.81 0.12, 5.54 0.83
35-44 years 1.89 0.35, 10.25 0.46
Total health scale 1.61 0.35, 7.46 0.54
Total depression impact 1.05 1.00, 1.12 0.03
� Characterisation of homelessness: reference group: ‘Houseless’ =0
� NHS Board: reference group: urban=1
¥ Family type: reference group: two parent family=3
� Age group: reference group: 45 and over years=3
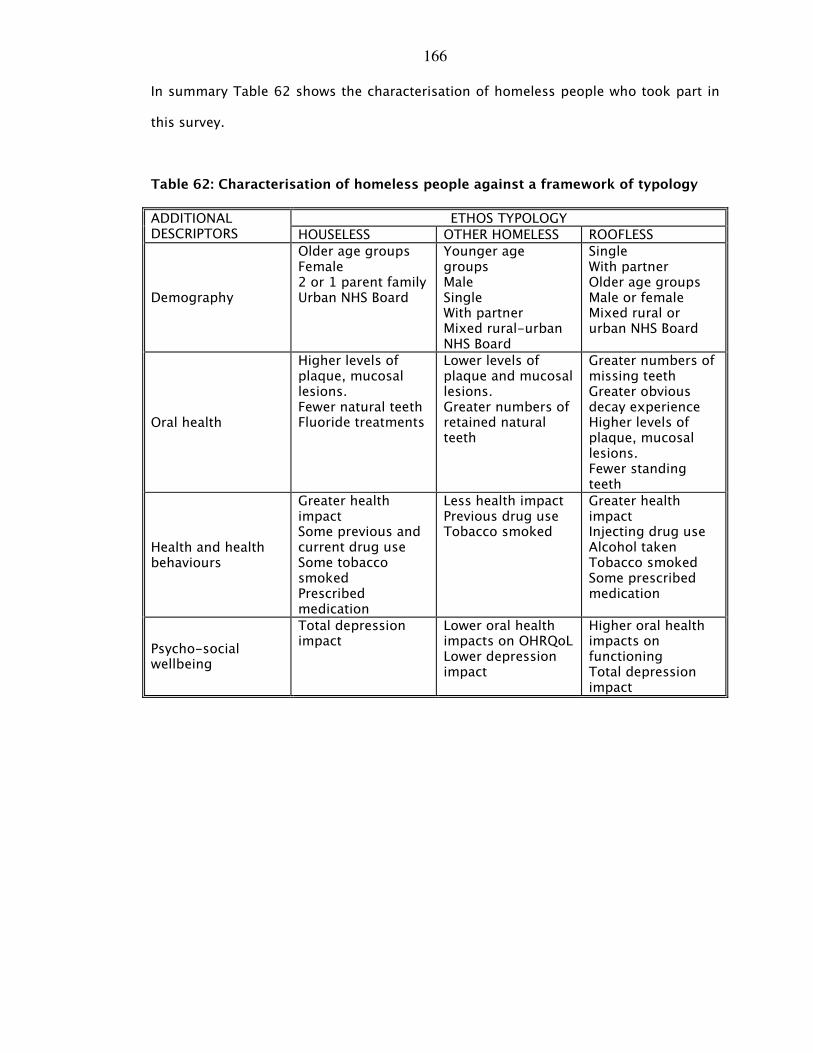
166
In summary Table 62 shows the characterisation of homeless people who took part in
this survey.
Table 62: Characterisation of homeless people against a framework of typology
ETHOS TYPOLOGY ADDITIONAL DESCRIPTORS HOUSELESS OTHER HOMELESS ROOFLESS
Demography
Older age groups Female 2 or 1 parent family Urban NHS Board
Younger age groups Male Single With partner Mixed rural-urban NHS Board
Single With partner Older age groups Male or female Mixed rural or urban NHS Board
Oral health
Higher levels of plaque, mucosal lesions. Fewer natural teeth Fluoride treatments
Lower levels of plaque and mucosal lesions. Greater numbers of retained natural teeth
Greater numbers of missing teeth Greater obvious decay experience Higher levels of plaque, mucosal lesions. Fewer standing teeth
Health and health behaviours
Greater health impact Some previous and current drug use Some tobacco smoked Prescribed medication
Less health impact Previous drug use Tobacco smoked
Greater health impact Injecting drug use Alcohol taken Tobacco smoked Some prescribed medication
Psycho-social wellbeing
Total depression impact
Lower oral health impacts on OHRQoL Lower depression impact
Higher oral health impacts on functioning Total depression impact
167
6.0 Discussion
6.1 Introduction
6.2 Homelessness in Scotland
6.3 Demographic profile: is this a representative sample?
6.4 Health status and health behaviours
6.5 Oral health and oral health behaviours
6.6 Dental treatment experience and psycho-social factors
6.7 Limitations
6.8 Conclusions

168
6.1 Introduction
In the sphere of research within the context of homeless populations there has been
much focus on improving the understanding of the causes and effects of
homelessness, preventing homelessness and developing a knowledge base with regard
to health of homeless individuals. This has resulted in an extensive awareness of the
homeless community and those individuals relevant to their lifestyle choices, pathways
in and out of homelessness and the health of homeless individuals which is reflected in
the availability of literature pertaining to these factors. There is in comparison,
however, a relative paucity of literature available linking the oral health and health
behaviours and other factors such as psycho-social wellbeing of homeless people.
Consequently there is little literature which links homeless people’s oral health, health
and psycho-social wellbeing with a recognised typological categorisation of their
homelessness status.
Nonetheless the literature does provide information which supports the view that it is
the type of homelessness experienced which affects health in its widest context.
Therefore, it is the quality of the homelessness experience which results in increased
oral health and health risk and this risk is based on homelessness-related factors. In
other words there is the need to develop a health-related typology of homelessness to
reflect the heterogeneity of those who are homeless. In order to capture the
heterogeneity of homelessness several frameworks of categorising homeless
populations have been proposed and developed, whereby the various groups of
homeless experiences have been drawn together in descriptive typological groups.
Using the framework of the operational-based ETHOS typology, the work presented in
this thesis seeks to characterise Scottish homeless people in terms of their oral health,
health and psycho-social wellbeing, since, it seemed reasonable to propose that a
greater understanding of the position of oral health, health and psycho-social
wellbeing within the ETHOS typology might inform a tailored intervention [140] to
169
increase engagement with health services. Therefore the aim of the thesis was to
investigate if oral health, health and psycho-social well-being could act as additional
descriptors of the ETHOS typology of homelessness for a Scotland-wide population of
homeless people in order to inform a tailored intervention to increase engagement with
health services.
6.2 Homelessness in Scotland
There are growing numbers of homeless people in Scotland, particularly in urban areas.
In 2004 it was estimated that there were at least 54,829 homeless people in Scotland,
and that this figure was rising from year to year [141]. In 2011 the number of homeless
people in Scotland was estimated to be 55,227 [34].
This survey involved 853 homeless participants throughout Scotland. This is a very
large sample population when compared with other surveys which have sought to
investigate oral health of homeless populations. One of the reasons that sample sizes
in homeless population surveys tend to be small is that it can be extremely challenging
to locate, recruit and gain consent from homeless people for the purposes of
participating in health surveys. Access to homeless populations is acknowledged as
being complicated due to the disparate, transient nature of homeless people and their
lifestyles, which makes it difficult to track down locations where homeless people
might congregate in numbers. Furthermore, homeless people are often reluctant to
participate in surveys as many have a mistrust of authority, based on previous negative
experiences. Additional challenges such as low literacy levels and other competing
priorities make it very time-consuming to analyse any homeless population.
This survey was designed to overcome some of these obstacles. Seven NHS Health
Boards across Scotland agreed to participate in this survey maximising the potential
numbers of participants. The participants were recruited from a wide variety of
170
locations where homeless people were known to access services, using a snowball
technique, whereby the same venue was visited several times over the duration of the
project. This ensured that as many people who wished to take part were sampled.
6.3 Demographic profile: is this a representative sample?
This survey employed a non-probability convenience sampling technique to recruit
participants. This technique and method of recruitment while appropriate for accessing
socially excluded groups, has recognised shortcomings such as the sample is not a
randomised sample. Therefore it may not be representative since there may be groups
of homeless people who were not included. Therefore does this sample of 853
participants constitute a representative group of those experiencing homelessness
across Scotland? One way of answering this question is to examine the demographic
profile of the sample and compare this sample’s demography with others within the
literature.
As mentioned above this survey comprised of 853 homeless participants, throughout
Scotland. The majority of participants were male (74%), which is in keeping with the
composition of the Scottish homeless population as a whole, and also other similar
surveys [11, 70]. Moreover adult homeless populations, particularly adult single
homeless populations, tend to be comprised of a higher number of males than females
[3, 70, 141].
The age range of the participants in the survey was 16 to 78 years, with the majority of
the participants (53%) being younger than 35-years-old. This finding is similar to other
surveys of homeless populations where the majority of participants were found to be
younger [11]. In contrast, the general population of Scotland is aging, with people
living longer than in previous generations [142], partly due to improvements in
healthcare. This improvement in life expectancy phenomenon does not seem to extend
171
to the homeless population [143], thus suggesting that the participants in the sample
were distinct from those in the wider Scottish population.
The older participants in the sample were more likely to be male, than female. This
contrasts, again, with the demographic profile of the settled Scottish population where
females tend to live longer than males [142]. It is reasonable to speculate that this
dissimilarity is perhaps a result of the heterogeneity of homelessness, in which women
who experience homelessness constitute a different subpopulation. The findings from
the multinomial regression analysis would support this conjecture since women
compared with men were significantly more likely to be categorised as ‘houseless’
whereas as male participants were categorised as residing in insecure or inadequate
housing. It is possible that housing policy ensures that women with or without families
will be provided with more secure housing, as they age, being re-categorised in terms
of priority need for housing.
The overwhelming majority of the participants in this survey described themselves as
being ‘single’. The remainder of the participants were either in a relationship with
children, not in a relationship but living with their children, or had children with whom
they were not living. When the age of the participants was compared with relationship
status, it was found that significantly larger proportions of the oldest participants were
single. In contrast the youngest age group of participants stated that they were in a
relationship. This finding with regard to relationship status reflects the Scottish
Statistics with regard to applications for housing in 2008-2009 [141].
The vast majority (91%) of the participants stated they were Caucasian. Small
minorities stated that they were African/Caribbean, asylum seekers or
Gypsy/Travellers, Asian or Chinese. When compared with the composition of the settled
population of the U.K./Scotland, ethnic groups other than Caucasians were under-
represented in this homeless population, however, when compared with the Operation
172
of the Homeless Persons Legislation in Scotland: 2010-11 [34], 93% of respondents
stated they were Caucasian (White) with between 1% to 2% stating they were
African/Caribbean or Asian. This suggested that the ethnic profile of this sample of
homeless people reflected that for Scotland as a whole.
Moreover, this ethnic imbalance has been demonstrated in other surveys of homeless
populations, where, a minority of the participants are from ethnic groups [95]. This is
quite distinct from surveys of homelessness in American inner-city areas where
minority ethnic groups are over-represented [3]. It may be suggested that those who
comprise homeless populations reflect the ethnic-related social disparities within the
general population of the specific country in which the survey took place. Therefore it
may be proposed that the sample of homeless people who took part in this survey are
representative with regards to ethnicity of those experiencing homelessness in
Scotland.
However, there is an alternative explanation. It is possible that the survey was not able
to access people from ethnic minority groups who were experiencing insecure and
inadequate housing and so could be described as the ‘hidden homeless’. It may be the
case that in Scotland, levels of homelessness in certain ethnic groups are concealed
(hidden homelessness), with the nature of some people’s living arrangements
camouflaging the real extent of homelessness within that ethnic group. This
suggestion is supported by a study in Northern Ireland conducted within the Chinese
population of Belfast. Yuan and Freeman [144] found that many families were living
within single overcrowded dwellings which being unfit accommodation would be
classified as inadequate housing [34]. These families were not accessing services for
homeless families, nor were they applying for housing, so would not be counted in any
statistics enumerating the levels of homelessness in that area.
173
Fifty-five percent of the participants answered the question regarding occupation. Of
the 468 participants who did reply to the question a quarter was skilled tradesmen with
a further fifth being in unskilled occupations. Smaller percentages of the sample had
been white collar workers which included professional occupations, associate
professional occupations, secretarial work and so forth. The responses to this question
highlighted the heterogeneity of this sample of homeless people reflecting national
statistics [8].
The fact that many of the homeless people surveyed here reported having held
unskilled or tradesman types of employment is probably not co-incidental. It is likely
that the scope of employment available for these people was limited in the first
instance by a lack of education, which leads to a lack of opportunities. The low levels of
employment reported in this survey may be a reflection of the dearth of options
available to homeless people before, during and after their experience of
homelessness. However, only 18% of the sample stated that they had been
economically inactive and unemployed. A variety of factors may have contributed to
this low response rate, including issues relating to a suspicion of authority,
concealment of current employment, combined with the erroneous assumption of
collusion or information sharing amongst various authorities.
Using the ETHOS typology participants who were, for example living rough or accessing
night shelters were categorised as ‘roofless’; hostel residents, those in long or short
stay accommodation or supported accommodation and so forth were categorised as
‘houseless’ and those living in inadequate (e.g. squatting) or insecure (e.g. sofa surfing)
were classified as ‘other homeless’. This method of grouping the living arrangements
together using the ETHOS typology allowed the demographic data to be interpreted in
such a way to assist in further characterising those experiencing rooflessness,
houselessness and other homelessness.
174
A careful examination of the demographic profile of the sample therefore provided
additional descriptors for the ETHOS classification [8]. The multi-nomial logistic
regression analysis demonstrated that demographic factors could act as descriptors for
rooflessness, houselessness and other homelessness. For instance, those who were
categorised as ‘roofless’ compared with those categorised as ‘houseless’, they were
more likely to be single or be in a relationship. For those participants who were
categorised as ‘other homeless’ in relation to those categorised as ‘houseless’ they
were more likely to be younger, to be male, to be single and to reside in a rural/rural-
urban NHS Board. Therefore people experiencing houselessness were older, female,
with partner, with/without children and living within an urban NHS Board.
In 2008-2009, the year in which the survey was undertaken, the applications for
housing in Scotland reflected the demographic profile of those who participated in the
survey [141]. In view of the supporting evidence regarding the demography of
populations of homeless people and the Scotland-wide statistics it would seem
reasonable to suggest that this sample of 853 participants is representative of those
experiencing homelessness.
6.4 Health status and health behaviours
It is widely acknowledged that homeless people tend to have high levels of ill-health
[2]. Furthermore, homeless people have been reported as being unable to make
informed choices in terms of their health behaviours , resulting in the tendency for
risky behaviours which culminate in ill-health [65, 145-147].
Consequently and in common with other surveys [65, 104, 145-147] of similar
homeless populations, the participants in this survey were found to have high levels of
physical ill-health. The types of illness reported included, respiratory disease, chest
disease, blood dyscrasias, and high blood pressure all of which could be associated
with increased alcohol and tobacco usage.
175
The findings of this survey would support these other surveys [65, 145, 147], since 85%
of the sample stated that they smoked cigarettes and over 30% stated that they drank
alcohol at least daily. Moreover, the smoking behaviours of this sample compares
unfavourably with the Scottish population as a whole. In Scotland in 2008, the
percentage of people who smoked cigarettes was 25.2%, of whom 26% were men and
25% were women [148]. The proportion of men compared with women in this sample
who stated that they smoked tobacco varied with age and reflected the findings of the
Scottish Household Survey of 2007-2008 [149] which showed that that the highest
proportions of people who smoked were men and were in older age groups. With
regard to alcohol consumption, older age groups and men compared with women
stated that they drank alcohol at least daily reflecting the national figures with regard
to alcohol consumption, where 35% of men and 26% of women in Scotland consumed
alcohol in excess of the recommended number of units/week in 2009 [150].
While these findings are consistent with the current health behaviours evident in the
general population [150, 151] it is interesting to note that older participants smoked
greater numbers of cigarettes. However, with regard to alcohol consumption, age
group seemed unable to differentiate between those who admitted and those who did
not admit to consuming alcohol on a daily basis. It is interesting to note that those
categorised as ‘houseless’ compared with ‘roofless’ and other homelessness stated that
they smoked less but consumed alcohol more frequently.
One in nine participants stated that were HIV+ and/or Hepatitis C+. This compares
unfavourably with the prevalence of HIV (1 in 1,315) and Hepatitis C (1 in 220) in the
general population of Scotland [152]. It may be proposed that this increased
prevalence of HIV/Hepatitis C was associated with the 68% of participants who stated
they had used street drugs and with the 24% of participants who were injecting drug
users at the time of the survey. This compares unfavourably with the Scottish
176
population where problematic drug use was estimated to be 1.84% in 2003 for people
aged between 15 and 54 years of age [153].
In conclusion, it seemed that a close association existed between health status and
health behaviours. Findings here suggest that health behaviours could act as a means
of characterising those who experienced rooflessness and other homelessness
compared with those who were categorised as houseless. For instance, those who were
injecting drug users and who consumed alcohol were more likely to be ‘roofless’ than
‘houseless’ and those who were previous drug users were more likely to be categorised
as ‘other homeless’ than houseless. This suggests that differences in health
behaviours could be used as additional descriptors of the ETHOS typology.
In general, the experience of physical ill-health was unevenly distributed between the
genders with larger proportions of women compared with men stating that they had
chest disease, bleeding disorders, or suffered from ‘allergies’. This was supported by
the finding that greater numbers of females as compared with males were taking
prescribed medication.
It was notable that older compared with younger participants had greater ill-health.
Again this is in keeping with the reported health behaviours, with the older
participants, with smoking being linked with respiratory disease [147]. Additionally,
sizeable proportions of older age groups compared with others had heart disease, and
as reported earlier, this age group was more likely to have high levels of alcohol
consumption, again demonstrating the documented link between excessive alcohol
consumption and hypertension related ill-health [154] Larger proportions of older
participants were prescribed medication. A possible explanation for this observation is
the high levels of disease experienced by this group of homeless people. Another
possible explanation is that many of the reported diseases while progressing with age
177
are observed in relatively younger age groups of people who experience homelessness
with varying degrees of symptom severity.
Therefore it was of interest that the largest group of drugs prescribed were
psychotropic in nature. Of those who stated the name of their prescribed medication
over 30% had been prescribed anti-depressants, 20% anxiolytics and nearly 11%
antipsychotics. This suggested that there was a high prevalence of mental ill-health in
this population of homeless people compared with the Scottish population as a whole,
where 10.4% of the population are prescribed anti-depressant drugs for daily use
[155]. Moreover, when prescribed medication was compared across accommodation
status, greater proportions of those who were categorised as ‘houseless’ stated they
had prescribed medication compared with those who were ‘roofless’ or other homeless.
It may be proposed that those who were ‘houseless’ had greater access to health
services. There is support for this proposition since it was found that participants who
were categorised as ‘houseless’ were characterised as being more likely to have health
risks associated with being homeless in the past and present and hence may have
accessed health and homelessness services as required. Participants who were
categorised as being ‘other homeless’ were more likely to have a history of prior drug
use and to be hypertensive whereas those who were currently ‘roofless’ were
characterised by health risks associated with current health behaviours.
6.5 Oral health and oral health behaviours
Oral health is an important component of general health, which has the potential to
impact upon physical and psychosocial wellbeing [109]. With this in mind, an
exploration of the links between homelessness and oral health were considered as
valuable, since homeless people have poor general health, and improving oral health
together with access to services could be proposed as a method of making health gains
for this disadvantaged population.
178
In agreement with other surveys which have shown that homeless people have poorer
levels of dental health, than the general population [11, 96] the dental health of this
population of homeless people was poor. The mean D3cvMFT was 16.98, with the mean
number of decayed teeth being 4.48. The mean number of missing teeth was 8.71 and
the mean number of restored teeth was 3.79. This suggested that decayed teeth had
been extracted rather than restored. This compares poorly with the mean DMFT of the
general population, whilst being consistent with findings of other oral health surveys of
homeless populations [11]. In terms of age, the highest levels of untreated decay were
seen in the 24-44 years age groups. In common with other similar surveys [6], which
report an increase in edentulousness with age [6], the older participants (55+) in this
survey also were noted to have significantly greater mean numbers of missing teeth
than other age groups.
Poor plaque control, associated with not regularly brushing teeth, can lead to the
development of periodontal disease. If left unchecked plaque, a soft, bacteria-filled
biofilm derived from foodstuffs, forms around the surfaces of teeth and soft tissues in
the mouth. The long-term presence of plaque, and calcified plaque, or calculus, on the
surface where the tooth meets the gum – the gingival margin – can lead to the
development of gingivitis or periodontitis [103], forms of periodontal disease. For the
participants in this study, levels of mean plaque scores were high (1.08). There were no
differences observed between the genders. The youngest participants (16-24 years)
had lower mean plaque scores as compared with other age groups. Younger homeless
people, therefore, had better oral hygiene levels and it may be suggested that this was
linked with their oral ill-health experience as this group was also found to have higher
mean numbers of standing teeth.
Oral cancer often presents as a painless ulcer in its early stages. These ulcers which are
described as suspicious lesions, are frequently noted by a dentist at a routine dental
179
examination, when the patient themselves has either not noticed the lesion, or failed to
attach the appropriate significance to the lesion [156].
Erratic dental attendance, poor oral hygiene, poor diet and indulgence in habitual
behaviours such as immoderate alcohol consumption, smoking and drug taking are all
risk factors for oral cancer [156]. Some homeless people, with their high risk lifestyles
and low levels of dental attendance are a high risk category for oral cancer and have
been found to be 95 times more likely, than the general population, to experience oral
cancer [11].
In this survey, 15% of the participants were noted to have suspicious oral mucosal
lesions, with male participants having a higher incidence of suspicious oral lesions
affecting the lips, the buccal mucosa, the floor of mouth region and the palate. Older
participants (45 years and above) had greater experience of suspicious oral mucosal
lesions on the palate compared with other age groups. This high incidence of
suspicious oral mucosal lesions has impacts for the provision of oral care for certain
homeless sub-groups. In addition to lending credence to the argument that such
groups of homeless people should be regularly screened for oral cancer, there is a
requirement for both review of suspicious lesions and in some cases onward referral to
specialist services. This presents a challenge to dental service providers as it can be
very difficult to locate homeless people for review at an appropriate interval, due to
unstable lifestyles. Many of this group of homeless people are extremely vulnerable
and unable to take the initiative themselves in scheduling review appointments. This
finding supports the view that there is a requirement for tailoring of healthcare and
dental services for this population.
In the UK as a whole, the general population has seen a trend towards retention of the
natural dentition, with the Adult Dental Health Survey [119], which is carried out every
ten years to provide a snapshot of oral health within the UK showing reduced levels of
180
edentulousness in the general population. This trend does not extend to the homeless
population. In this survey in Scotland, levels of total edentulousness were quite low
(6%). In common with the reported levels in the general adult population in the UK
[119], levels of edentulousness were found to rise with increased age. This
phenomenon has also been observed in ‘other homeless’ populations [6].
As with the level of obvious caries experience, the incidence of edentulousness in the
homeless population is likely to be explained by some of the impacts of the homeless
lifestyle. Whereas the high levels of decay experienced by homeless people is related to
the poor diet and low oral hygiene levels which often accompany the homeless lifestyle,
the levels of edentulousness are related to the transient nature of the homeless
lifestyle, which impacts on treatment provision and continuity of dental care.
The oral disease experience of this homeless population reflects that found elsewhere
in the literature, for example in Boston, Kaste et al [4] found that 91.4% of a homeless
population had untreated decay [4]. In Hong Kong, Luo and McGrath found that 90% of
a homeless population had dental caries, mostly untreated [99]. Gelberg et al [96],
conducting a study of oral health in the homeless in Los Angeles reported similarly
elevated levels of decay, and higher levels of dental pathosis than the general
population. In the U.K. homeless populations’ experience of dental disease is also
high. Studies in Leeds [98], Belfast [11] and Birmingham [70] have all demonstrated this
increased dental disease experience, with homeless population in two of these cities
found to have a DMFT (total number of decayed, missing or filled teeth) of 16.6 (Belfast
[11]) and 15.9 (Birmingham [70]). This compares unfavourably with the DMFT scores for
the general, settled population [106].
In addition to having high levels of untreated oral disease, the homeless people in this
survey were shown to have relatively few dental restorations [11], as, where treatment
is provided extractions are more frequently provided as a treatment option as opposed
181
to restorative interventions resulting in fewer homeless people retaining their natural
teeth [157]. This combination of raised disease incidence, and low intervention levels
are indicative of high levels of unmet dental treatment needs within homeless
populations [11]. Homeless individuals are prone to development of periodontal
disease as they tend to brush their teeth infrequently, and attend the dentist
sporadically, therefore missing out on the preventive measures commonly instigated in
the prevention of this disease.
The prevalence of periodontal disease in homeless populations has been shown to be
high as compared with the general population [5, 11]. One study of the dental health of
a homeless population in Birmingham [70] found that over 50% of the participants had
excessively mobile (periodontally involved) teeth. One of the consequences of
periodontal disease is tooth loss, which occurs when soft tissue and bony structures
supporting the tooth recede due to the inflammatory process triggered by the actions
of certain types of bacteria in the oral cavity [103]. In addition to having undesirable
effects in the oral cavity, periodontal disease is also linked with concomitant medical
problems, such as heart disease [128, 158]. In common illnesses such as diabetes
periodontal disease requires long-term monitoring in order to prevent disease
progression, and to ensure that potentially damaging disease sequelae are avoided.
Prevention of periodontal disease is, therefore, important. Measures such as tooth
brushing and professional plaque and calculus removal in the dental surgery are
recommended in the prevention of this disease [103].
Alarmingly, homeless people experience an extremely high incidence of oral cancer,
the most common of which is squamous cell carcinoma. Homeless people are ninety-
five times more likely to experience oral cancer than the general population [11]. Oral
cancer is treatable in its early stages. For the homeless, few of whom attend regularly
for routine dental examination, detection of oral cancer often occurs at later stages of
the disease, when disease progression has led to impaired function, which acts as a
182
prompt to seeking medical intervention. As early detection is beneficial for the
prognosis of oral cancer, with effective treatment available, screening and preventive
advice are priorities for this group. Dentists provide these vital interventions for the
general population; this research has demonstrated that the homeless are not,
however, accessing these conventional dental service arrangements, and within the
general context of dental neglect are suffering as a consequence.
When the oral health data were analysed against a background of the ETHOS typology,
it was found that oral disease experience was unequally distributed amongst the
typological groups. Those participants who were categorised as ‘other homeless’ were
found to have lower plaque scores, more standing teeth and absence of mucosal
lesions. This group of people had the best cared for teeth and bore the lowest burden
of oral ill-health. When this is considered in the light of the demography of those who
constitute the ‘other homeless’ group, then it may be suggested that this is related to
their younger age, and therefore shorter life experience of homelessness. This is of
importance with regard to the tailoring of preventive dental care. It may be suggested
that those who are categorised as ‘other homeless’ require dental health services which
predominately have a primary preventive focus.
Participants who were categorised as ‘houseless’, had different treatment requirements.
They were shown to have high plaque scores and mucosal lesions with fewer numbers
of standing teeth. In other words this group, whilst retaining some teeth, had greater
oral disease experience, including mucosal lesions and increased plaque scores. This
suggests the need to tailor prevention and treatment to improve oral health status and,
in this respect suggests a tertiary preventive strategy (i.e. a strategy which is aimed at
reducing oral disease impacts for those who are already affected by oral disease, and to
put in place interventions to prevent further disease) to restore oral health functioning
and prevent further oral disease.
183
Participants categorised as ‘roofless’ were found to have high levels of plaque, high
incidence of oral mucosal lesions, fewer standing teeth together with high levels of
dental caries. This group of people had the most neglected dentitions and the highest
levels of oral ill-health so there is a need to provide oral health treatment to restore
function within a tailored preventive programme. Thus, from a viewpoint of oral
disease, this sample of homeless participants’ oral health can be used as additional
descriptors to characterise the ETHOS typology and allow suggestions to be made for a
tailored approach for oral health care.
6.6 Dental treatment experience and psycho-social factors
With regard to accessing dental services less than one third of this sample reported
that they were registered with a dentist and over half of the sample had not attended a
dentist in the last ten years. For those that had attended the main driver for
attendance was pain. Less than a quarter of those who reported that they had attended
a dentist recently, stated that had attending for routine dental examination. It would
seem that although dental services for those experiencing homeless exist within
Scotland, they are not being routinely accessed, therefore it seemed necessary to
understand the barriers and enablers as experienced by those who participated in the
survey.
The participants in this survey were asked to state how they would prefer to access
dental services. In response to this nearly 80% stated that they would like to access
drop-in dental services. Whilst such a service would be an ideal solution for providing
care for a group of people who have attendance issues, this may present a problem
with scheduling both routine care and review of existing and potentially progressive
dental diseases.
Upon being asked to report the barriers which prevent them from attending for dental
care the participants reported that stated that they found NHS dental treatment difficult
184
to find, they did not like waiting for treatment, and they wanted to know more about
the dental treatment they were to receive. These findings are best viewed against a
backdrop of competing priorities in which homeless people often find themselves
trapped. Very often the reality of the homeless existence is such that homeless people
find it very difficult to plan ahead, and thus routine appointments are often missed.
Nearly 60% of the sample stated that they would prefer to take painkillers than attend
for dental treatment. This finding suggests that oral health and attendance for pain
relief is of a lower priority than trying to find, for example somewhere to live. Previous
research has reported that so many factors in the lives of homeless people are beyond
their control that they tend to neglect themselves to the point where they only attend
healthcare services when a problem reaches an acute level beyond which it cannot be
ignored any longer [87].
Given that the responses of the participants with regard to the barriers to accessing
dental care it became apparent that two attitudes-‘access inhibition’ and ‘access
anxiety’ affected their resolve to attend for dental treatment. The analysis showed that
females in particular were more affected by these two attitudes which acted as barriers
to dental care, whereas older participants were less anxious about accessing dental
care.
When the barrier of dental anxiety was more carefully examined using the modified
dental anxiety scale (MDAS), the mean score for the sample was 11.7 suggesting that
as a whole they experienced an equivalent level of dental anxiety compared with the
general population [133]. However unlike the general population 20% of the sample
(compared with 12% of the general population) were categorised as dentally phobic.
The participants’ greatest fears were having their teeth drilled and receiving local
anaesthetic.
185
Reflecting the attitudinal findings, females compared with males had significantly
higher mean scores for dental anxiety with participants aged between 45 years and
older having lower mean scores for dental anxiety compared with those in younger age
groups. This is similar to the reported UK general population norms [133] where dental
anxiety levels were reported to be higher in younger age groups.
The impacts of dental disease are serious and have the potential to be life threatening,
as in the case of infection resulting from untreated dental abscess. Experience of
dental disease can lead to pain, swelling interrupted sleep, reduced ability to eat and
other deleterious effects. Furthermore, dental disease experience can impact upon the
appearance of the sufferer and affect the way in which others perceive them and
negatively impact their self-worth [159]. Higher levels of dental disease experience
have been linked with reduced oral health related quality of life [11], and these impacts
can be substantial [112]. Previous research has also shown severe oral health
impairment as well as high prevalence, extent and severity of oral health impacts in
homeless people [160].
In order to examine the effect of oral disease on the oral health-related quality of life
of this sample of homeless people the OHIP-14 was used. Oral health-related quality of
life impacts were found to be high amongst the participants in this survey. Twenty-five
percent of the sample reported feeling self-conscious very often, and 23% reported
feeling embarrassed very often about the appearance of their mouth and teeth [11,
116]. Those participants with greater numbers of decayed teeth, increased experience
of periodontal disease had significantly higher oral health impacts mean scores [11]. In
addition, participants reported that they found their lives less satisfying because of
problems with their mouth and teeth. Reported levels of dental pain were high.
For this population of homeless people, women and younger people their oral health
impacted upon their psychological functioning with regard to psychological discomfort
186
and disability. In comparison with the Scottish sample from the Adult Dental Health
Survey 1998 [135], larger proportions of participants in the homeless sample
experienced greater numbers of impacts compared with the UK population. Therefore,
although this group of people were not routinely accessing care, their dental ill-health
negatively impacted on their quality of life. This is likely to have an effect on their
reliance on medication, prescribed or otherwise, thus affecting levels of addiction and
having a deleterious effect on their general health.
A very high number of participants (68%) were described as suffering from depression –
a higher prevalence than found in the general population [161]. Female participants
those in older age groups had significantly higher mean scores for depression, this is in
keeping with rates of depression in the general Scottish population [161].
Using a discriminant analytic approach it was possible to differentiate between the 3
categories of the ETHOS typology using measures of psycho-social wellbeing. People
who were categorised as ‘other homeless’ were characterised as being able to function
in terms of quality of life and social interaction. This may have been related to being
young and not having experienced the physical and emotional impoverishments of
long-term homelessness. In contrast people categorised as ‘roofless’, who tended to
be older with greater experience of homelessness were depressed with greater impacts
of the depression upon their daily routines and psycho-social functioning. For those
who were ‘houseless’ the burden of the homeless lifestyle had taken its toll as reflected
in the impact of their depressive state upon their psycho-social wellbeing.
6.7 Limitations
Working with homeless populations is acknowledged as being challenging, particularly
in terms of recruiting participants into a study such as this. This potentially impacts on
the study design, in this case influencing the way in which sampling was carried out. It
was decided to gather a sample using a convenience sampling method where a
187
snowball effect was generated in order to minimise the impacts of lack of
randomisation on the sample. Whilst this has the potential to lead to bias, a large
sample size was generated in order to counteract this.
Obvious decay experience was assessed using visual dentinal caries (D3cv) [106]. It is
likely that the levels of dental caries produced were an underestimate, as enamel-only
lesions were not recorded.
Another limitation of this survey was the use of ‘self-report’ methodology in the
survey. This is a potential area for bias, where participants may not answer fully
truthfully leading to skewing of the data. This method of data collection is well
recognised within the fields of social and behavioural sciences and organisational
research [162], and realistically there is no viable alternative method by which to gather
this type of data within the structures of a homeless population. Nevertheless and
taking these limitations into account this survey has been concerned with the homeless
population in Scotland, the findings of this survey have been consistent with other
similar surveys in other countries suggesting that the results are reliable and valid.
6.8 Conclusions
The use of a proposed enhanced ETHOS typology as a means of tailoring health service
provision to permit engagement is of central importance in improving oral health. It is
considered as an essential function of restoring dignity and is considered part of a
holistic recovery for those experiencing homelessness. This is in consistent with a
comprehensive, common risk factor approach where all aspects of health are addressed
in order to promote integrated healthcare services [108]. Jago et al [6], whilst working
with a group of homeless men in Australia, noted that ‘amongst themselves it is
acceptable to have broken teeth’. Indeed the publicly recognised face of homelessness
is one with poor dental health. However, this research, has shown that the high levels
of oral health impacts on physical and psychological functioning, demonstrating that
188
although they may not overly demonstrate it, or indeed access treatment homeless
people feel the pain of their disease. Consequently, if as DePalma et al [158] have
reported, oral health has an increasingly higher priority for those homeless seeking to
rehabilitate themselves then such strategies to inform the engagement process with
health services by tailoring to the specific needs using the expanded ETHOS typology
must be considered.
Using the data obtained was possible to show that additional demographic, oral
health, health and psycho-social wellbeing descriptors existed which could characterise
the various dimensions of the ETHOS [8] typology. Accordingly, the ‘houseless’ people
were characterised as being older, female, living within a one or two-parent family and
within an urban NHS Board area. With regard to their oral health they had higher levels
of dental plaque, higher experience of mucosal lesions, and had retained fewer of their
own natural teeth. In terms of their health status they were characterised as having
increased physical and emotional health impacts as reflected in their taking prescribed
medication and some high risk behaviours. The ‘other homeless’ group were
characterised as having lower physical and psychological health impacts and health
risks which were conceptualised as being similar to those within the general
population. They had lower levels of plaque and mucosal lesions and retained greater
numbers of their own natural teeth. Finally, the ‘roofless’ group of homeless people
were characterised in terms of having increased health risks being affected by
depression and associated reduced function. They had higher levels of dental plaque,
and higher levels of dental caries experience and more missing teeth.
One way of supporting the aim of this thesis is to examine the pathways towards
homelessness which are often linked with the individual ability of a person to cope
when placed in a set of circumstances rendering them vulnerable to homelessness.
Each person reacts differently to the various demands of their lifestyle, and it could be
argued that those with less well developed coping skills may have mental health issues
189
and/or intellectual disabilities together with development needs. This combination of
need acts in tandem with destabilising factors such as financial issues and creates an
unstable environment predisposing the individual to homelessness. It is proposed
therefore that the oral health, health and psycho-social well-being factors are related
to the ETHOS typology and assist in understanding people’s experience of
homelessness. Moreover it is suggested that the inclusion of demographic and
psycho-social factors within the ETHOS typology may act as a first step in the process
of tailoring health care interventions to the specific needs of the homeless person as
characterised with this proposed enhanced typology.
This work demonstrates the importance of adopting a common risk factor type of
approach [108] to healthcare provision for homeless people, whereby all facets of
healthcare are considered in an integrated process. The additional descriptors of oral
health, health and psycho-social wellbeing within an expanded ETHOS typology will
provide an opportunity for this type of integrated strategy for the tailoring of health
care provision to the specific needs of homeless people to be considered. The
proposed enhanced ETHOS typology would be of value to inform the tailoring of health
service provision and to enable effective and multidisciplinary working to promote the
health and psycho-social wellbeing of people experiencing homelessness.

190
7.0 Recommendations
191
It is recommended that:
1. The additional health, oral health and psycho-social well-being descriptors which
were found to characterise homeless people may be used as a method by which to
enhance the ETHOS typology to include health dimension characterisation to permit
engagement with health services. This enhanced ETHOS typology could be used to
facilitate the provision of more accessible, healthcare systems, where homeless
populations are viewed within the context of typology when planning service delivery.
2. An enhanced ETHOS typology will allow the development of tailored health service
provision, specifically directed towards the needs of those experiencing homelessness.
3. Multi-disciplinary approach to the healthcare provision for homeless people based
on the categorisation of homelessness is necessary in order to promote direct
engagement with health services.

192
8.0 References
193
[1] Phelan J. The stigma of homelessness: the impact of the label 'homeless' on
attitudes towards poor persons. Social Psychology Quarterly. 1997; 60:323-337.
[2] Hwang S. Homelessness and Health. Canadian Medical Association Journal.
2001;164:229-32.
[3] Gibson G, Rosenheck R, Tullner JB, Grimes RM, Seibyl CL, Rivera-Torres A, et al. A
national survey of the oral health status of homeless veterans. Journal of Public
Health Dentistry. 2003;63:30-7.
[4] Kaste LM, Bolden AJ. Dental caries in homeless adults in Boston. Journal of Public
Health Dentistry. 1995;55:34-6.
[5] De Palma P, Frithiof L, Persson L, Klinge B, Halldin J, Beijer U. Oral health of
homeless adults in Stockholm, Sweden. Acta Odontologica Scandinavica.
2005;63:50-5.
[6] Jago JD, Sternberg GS, Westerman B. Oral health status of homeless men in
Brisbane. Australian Dental Journal. 1984;29:184-8.
[7] Fazel S, Khosla V, Doll H, Geddes J. The prevalence of mental disorders among
the homeless in western countries: systematic review and meta-regression
analysis. Public Library of Service Medicine. 2008;5:e225.
[8] Edgar B, Meert H. Fourth Review of Statistics on Homelessness in Europe:
European Observatory on Homelessness. FEANTSA. Brussels; 2005.60:323-38
[9] A National Statistics Publication for Scotland. Operation of the Homeless Persons
Legislation in Scotland: National and Local Authority Analyses 2003-2004.
Edinburgh: The Scottish Government; 2004.
[10] Health Development Agency. Homelessness, smoking and health. London: HDA;
2004.
Available from: https://www.nice.org.uk/nicemedia/documents/homelessness_
smoking.pdf. Accessed August 2012.
[11] Collins J, Freeman R. Homeless in North and West Belfast: an oral health needs
assessment. British Dental Journal. 2007;.doi:10,1038/bdj.2007.473.
194
[12] Robinson P, Acquah S, Gibson B. Entangled identities and psychotropic substance
use. Sociology of Health and Illness. 2004;26:597-616.
[13] Ekeman E. Street Life. Student British Medical Journal. 2004;12:177-220.
[14] McLaren G, Bain M. Deprivation and health in Scotland: Insights from NHS Data.
Edinburgh: Information and Statistics Division National Health Service in Scotland
Publications. 1998.
[15] Addressing the causes and effects of homelessness in Northern Ireland:
Prevention of Social Exclusion Working Group on Homelessness. Belfast; 2004.
Available from: http://www.dsdni.gov.uk/consultation-zone/Forum.asp
[16] Scottish Executive. Health and Homelessness Standards. Edinburgh: Scottish
Executive; 2005.
[17] Scottish Executive. An action plan for improving oral health and modernising
dental services in Scotland. Edinburgh; 2005.
[18] British Dental Association. Dental Care for Homeless People. London. BDA; 2004.
[19] Rog DR, Holupka CS, Patton LC. Characteristics and dynamics of homeless
families with children. Final Report: Office of the Assistant Secretary for Planning
and Evaluation. Office of Human Services Policy. U.S. Department of Health and
Social Services; 2007.
[20] Fitzpatrick S, Pleace, N, Bevan, M. The Final Evaluation of the Rough Sleepers'
Initiative Edinburgh: Scottish Executive Social Research; 2005.
[21] Definition of ‘sofa surfer’. Available from:
http://www.urbandictionary.com. Accessed June 2010.
[22] Crisis. About Homelessness. Available from:
http://www.crisis.org.uk/policywatch/pages/about_homelessness.html.
Accessed Feb 2011.
[23] European Commission. Joint Report Social Protection and Social Inclusion.
Brussels: European Commission; 2007.
[24] Bahr H, Caplow T. Old men drunk and sober. New York: New York University
Press; 1970.
195
[25] Roth D, Bean J, Lust N, Saveneau T. Homelessness in Ohio. A study of people in
need. Columbus, OH: Department of Mental Health; 1985.
[26] Jahiel, R. The situation of homelessness. In Bingham, R. Green, R. White, S. Eds.
The homeless in contemporary society: Newbury Park Publications1987:99-118.
[27] Jahiel RI. Homelessness. A prevention oriented approach. Baltimore: The John
Hopkins University Press; 1992.
[28] MacKenzie D, Chamberlain C. Homeless careers: Pathways in and out of
homelessness. Australia: Swinburne and RMIT Universities; 2003.
[29] Rog D, McCombs-Thornton KL, Gilbert-Mongelli AM, Brito MC, Holupa CS.
Implementation of the Homeless Families Program: 2. Characteristics, strengths
and needs of participant families. American Journal of Orthopsychiatry.
1995;65:514-27.
[30] Homeless Hub Canadian Research Library. Available from: http:/homelesshubca.
Accessed July 2010.
[31] Casavant L. Defiinitions of homelessness. Available from:
http://dsp-psd.tpsgc.gc.ca. [accessed July 2010]
[32] U.S Government. Federal Definition of Homelessness U.S. Department of Housing
and Urban Development. Washington; 2009.
[33] A National Statistics Publication for Scotland. Operation of the Homeless Persons
Legislation in Scotland: National and Local Authority Analyses 2006-2007.
Edinburgh: The Scottish Government; 2007.
[34] A National Statistics Publication for Scotland. Operation of the Homeless Persons
Legislation in Scotland: National and Local Authority Analyses 2010-2011.
Edinburgh: The Scottish Government; 2011.
Available from:
www.scotland.gov.uk/resource/Doc/356601/0120522.2011 Accessed June 2012.
[35] Minnery J, Greenhalgh E. Approaches to homeless policy in Europe, the United
States and Australia. Journal of Social Issues.2007;63:641-55.
196
[36] Graham H, Power C. Childhood disadvantage and adult health: a lifecourse
framework: HDA. London; 2004.
[37] Coates A, Farnsworth K, Zulauf M. Social exclusion and inclusion: Partnerships for
neighbourhood regeneration in London: London South Bank University Faculty of
Arts and Human Sciences; 2001.
[38] Bourdieu P. Forms of capital. In: Richards JC, ed. Handbook of theory and research
for the sociology of education. New York: Greenwood Press 1983.
[39] Li Y, Savage M, Pickles A, Social capital and social exclusion in England and Wales
(1972-1999). The British journal of sociology. 2003;54:497-526.
[40] Putnam RD. Bowling Alone: America's declining social capital. Journal of
Democracy. 1995;6:65-78.
[41] Coleman JC. Social capital in the creation of human capital. American Journal of
Sociology. 1988;94:S95-S120.
[42] Islam MK, Merlo J, Kawachi I, Lindstrom M, Gerdman U-G. Social Capital and
Health: Does egalitarianism matter? A literature review. International Journal for
Equity in Health. 2006;5:doi:10.1186/475-9276-5-3.
Available from:
http://www.equityhealthj.com/content/pdf/1475-9276-5-3.pdf.
Accessed July 2010
[43] Woolcock M. The place of social capital in understanding social and economic
outcomes Isuma: Canadian Journal of Policy Research. 2001;2:1-17.
[44] Burchardt T, LeGrand J, Piachaud D. Social policy and administration 33.
1999;3:227-244.
[45] White P. Urban life and social stress. In: Pinder D, ed. The New Europe: economy,
society and environment. Chichester: Whiley 1988.
[46] Putnam RD. Health by association: some comments. International Journal for
Epidemiology. 2004;33:667-71.
[47] Page AJ, Ainsworth AD, Pett MA. Homeless families and their children's health
problems. A Utah urban experience. Western Journal of Medicine. 1993;158:30-5.
197
[48] Lee J, Gaetz S, Goettler F. The oral health of Toronto's street youth. Journal of
Canadian Dental Association. 1994;60:545-8.
[49] Clarke M, Locker D, Murray H, Payne B. The oral health of disadvantaged
adolescents in North York, Ontario. Canadian Journal of Public Health.
1996;87:261-3.
[50] Weitzman BC, Knickman JR, Shinn M. Pathways to homelessness among New York
City families. Journal of Social Issues. 1990;46:125-40.
[51] Shinn M, Weitzman BC, Stojanovic D, Knickman JR, Jimenez L, Duchon L, James S,
Krantz DH. Predictors of homelessness among families in New York City: From
shelter request to housing stability. American Journal of Public Health.
1998;88:1651-7.
[52] Berman H, Mulcahy GA, Forchuk C, Edmunds KA, Haldenby A, Lopez R. Uprooted
and displaced: a critical narrative study of homeless, aboriginal, and newcomer
girls in Canada. Issues in Mental Health Nursing. 2009;30:418-30.
[53] Casavant L. Composition of the homeless population.
Available from: http://dsp-psd.tpsgc.gc.ca Accessed July 2010.
[54] Tessler R, et al. Gender differences in self-reported reasons for homelessness.
Journal of Social Distress and the Homeless. 2001;10:243-54.
[55] Saias T, Greacen T, Brengard D, Lejoyeux M, Bourdais M. [Mental health disorders,
medical care and social support in a vulnerable population: the example of the
maternal centres in Paris]. Encephale. 2008;34:584-8.
[56] van Laere IR, de Wit MA, Klazinga NS. Pathways into homelessness: recently
homeless adults problems and service use before and after becoming homeless
in Amsterdam. BMC Public Health. 2009;9:3. doi:10.1186/1471-2458-9-3.
[57] Morris A, Judd BH, Kavanagh K. Marginality amongst plenty: Pathways into
homelessness for older Australians. Australian Journal of Social Issues.
2005;40:242-51.
[58] Homelessness: It makes you sick. St Mungo's: 2005. Available from:
http://www.mungos.org/campaigns/homelessness_it_makes_you_sick.
198
St Mungo's: 2005. Accessed March 2012.
[59] US Census Bureau. Available from: http://www.census.gov/ipc/www/idb/faq.php.
US Census Bureau. Accessed March 2011.
[60] Lincoln AK, Plachta-Elliott S, Espejo D. Coming in: an examination of people with
co-occurring substance use and serious mental illness exiting chronic
homelessness. American Journal of Orthopsychiatry. 2009;79:236-43.
[61] Mayock P, O'Sullivan E. Lives in Crisis: Homeless Young People in Dublin. Dublin:
Liffey Press 2007.
[62] National Council for Homelessness. Fact Sheet 12. Available from:
http://www.nationalhomeless.org/publications/facts/families.html Accessed June
2012.
[63] Sullivan G, Burnan A, Koegal P. Pathways to homelessness amongst the mentally
ill. Social Psychiatry and Psychiatric Epidemiology. 2000;35:444-50.
[64] Tam TW, Zlotnick C, Bradley K. The link between homeless women's mental
health and service system use. Psychiatric Services. 2008;59:1004-10.
[65] Fischer P, Breakley R. The epidemiology of alcohol, drug and mental disorders
among homeless people. American Psychologist. 1991;46:11.
[66] Vangeest J, Johnston T. Substance abuse and homelessness: Direct or indirect
effects. Annals of Epidemiology. 2002;12:455-61.
[67] Kushel M, Han J, Evans J, Bangsberg D, Moss A. Revolving doors: imprisonment
among homeless and marginally housed populations. American Journal of Public
Health 2005;95:1747-52.
[68] Khandor E, Mason K. The Street Health Report; Street Health. Toronto: 2007. p
44.
[69] Miller N. Health and Homelessness. Available from: http://dsp-psd.tpsgc.gc.ca
Accessed Feb 2011.
[70] Waplington J, Morris J, Bradnock G. The dental needs, demands and attitudes of a
group of homeless people with mental health problems. Community Dent Health.
2000;17:134-7.
199
[71] Crisis. About homelessness: causes and consequences. Available from:
www.crisis.org.uk/pages/causes-consequences.html Accessed Feb 2011.
[72] Seymour M. The recurring cycle: pathways of homelessness, crime and
imprisonment. Prison Service Journal. 2006;166:17-21
[73] Cattell V. Poor people, poor places and poor health: themedicating role of social
networks and social capital. Journal of Social Science and Medicine.
2001;52:1501-16.
[74] Tudor-Hart J. The inverse care law. Lancet. 1972;1:405-12.
[75] Welsh T, Pringle M. Social Capital. British Medical Journal. 2001;323:177.
[76] Freeman R. Social exclusion, barriers and accessing dental care: thoughts on
planning responsive dental services. Brazilian Journal of Oral Science. 2002;:34-
9.
[77] Cohen L. Converting unmet need for care to effective demand. International
Dental Journal. 1987;37:114-6.
[78] Beaulieu L, Israel G, Hartless G, Dyk P. For whom does the school bell toll? Multi-
contextual presence of social capital and student educational achievement.
Journal of Social Economics. 2001;30:121-7.
[79] Hwang S, Tolomiczenko G, Kouyoumdijan F, Garner R. Interventions to improve
the health of homeless: a systematic review. American Journal of Preventive
Medicine. 2005;29:311e1-e9.
[80] Martins DC. Experiences of homeless people in the health care delivery system: a
descriptive phenomenological study. Public Health Nursing. 2008;25:420-30.
[81] Reid KW, Vittinghoff E, Kushel MB. Association between the level of housing
instability, economic standing and health care access: a meta-regression. Journal
of Health Care for the Poor and Underserved. 2008;19:1212-28.
[82] Morrison DS. Homelessness as an independent risk factor for mortality: results
from a retrospective cohort study. International Journal of Epidemiology.
2009;38:877-83.
200
[83] Rubio M. Perverse social capital - some evidence from Columbia. Journal of
Economic Issues. 1997;31:805-16.
[84] Santana, P. Poverty, social exclusion and health in Portugal. Social Science
medicine. 2002;55:33-45
[85] Maxwell J, Lie J. Cardiovascular disease risk of homeless patients. British Journal
of General Practice. 2008;58:648-9.
[86] Breakey WR. Mental illness in homeless people. Maryland Medical Journal.
2008;9:31-4.
[87] Nickasch B, Marnocha SK. Healthcare experiences of the homeless. Journal of
American Academy of Nurse Practitioners. 2009;21:39-46.
[88] Del Rey Calero J. Poverty, social exclusion, social capital and health. Anales de la
Real Academia Nacional de Medicina. 2004;121:57-72; discussion -6.
[89] Martijn C. Pathways to Youth Homelessness. Social Science and Medicine.
2006;62:1-12.
[90] Maslow AA. A theory of human motivation Psychological Review.50:370-96.
[91] Storey A. Tuberculosis and social exclusion. British Medical Journal.
2006;333:57-8.
[92] Frankish CJ, Hwang SW, Quantz D. Homelessness and health in Canada: Research
lessons and priorities. Canadian Journal of Public Health. 2005;96:S23.
[93] Herrman H. Mental disorders among homeless people in western countries. Public
Library of Service Medicine. 2008;5:e237.
[94] Parizot I, Chauvin P, Paugam S. The complex self perceptions and relationships of
patients who attended free clinics affected their attendance and ability to benefit
from care. Evidence Based Nursing. 2006;9:61.
[95] Murray R. Stressors and coping strategies of homeless men. Journal of
Psychosocial Nursing and Mental Health. 1996;34:16-22.
[96] Gelberg L, Linn LS, Rosenberg DJ. Dental health of homeless adults. Special Care
Dentist. 1988;8:167-72.
201
[97] Drug and Alcohol Information and Research Unit, Department of health, Social
Services and Public Safety (Deloitte MCS). Research into homelessness and
substance misuse. 2004. Available from:
http://www.dhsspsni.gov.uk/homelessness_substance_misuse1.pdf. Accessed
September 2011.
[98] Blackmore T, Williams SA, Prendergast MJ, Pope JE. The dental health of single
male hostel dwellers in Leeds. Community Dental Health. 1995;12:104-9.
[99] Luo Y, McGrath C. Oral health status of homeless people in Hong Kong. Spec Care
Dentist. 2006;26:150-4.
[100] Kahabuka FK, Mbawalla HS. Oral health knowledge and practices among Dar es
Salaam institutionalized former street children aged 7-16 years. International
Journal of Dental Hygienists. 2006;4:174-8.
[101] Wolf M. Literacy and learning in health care. Pediatrics. 2009.
doi: 10.1542/peds2009-162C.
[102] Shelter Scotland Statistics. Available from:
http:/scotland.shelter.org/housing_issues/research_and_statistics/key_statistics/
homelessness. Accessed Feb 2011;
[103] Levine RS, Stillman-Lowe CR. The scientific basis of oral health education: BDJ
Books London: 2004.
[104] O'Carroll A, O'Reilly F. Health of the homeless in Dublin: has anything changed in
the context of Ireland's economic boom? European Journal of Public Health.
2008;18:448-53.
[105] Olszyk MD, Goodell M. Homelessness and our most vulnerable patients. Maryland
Medical Journal. 2008;9:20-5, 34, 40.
[106] Pitts NB, Evans JD. British Association for the Study of Community Dentistry
(BASCD) Co-ordinated National Health Service Survey of Caries Prevalence.
Community Dental Health. 1997:1-5.
202
[107] Davis J. Guidance for undertaking a systematic review as a dissertation project for
the Masters in Public Health. University of Dundee Division of Population Sciences
and Education 2009.
[108] Sheiham A, Watts RG. The Common Risk Factor Approach: a rational basis for
promotion oral health. Community Dentistry and Oral Epidemiology.
2000;28:399-406.
[109] Locker D. Measuring oral health: A conceptual framework. Community Dental
Health. 1988;5:5-13.
[110] de Figueiredo R. Homelessness and Oral Health in Toronto. Toronto: University of
Toronto; 2011.
[111] Daly B, Newton T, Batchelor P, Jones K. Oral health care needs and oral health-
related quality of life (OHIP-14) in homeless people. Community Dental and Oral
Epidemiology. 2010;38:136-44.
[112] Luo Y, McGrath C. Oral health and its impact on the life quality of homeless
people in Hong Kong. Community Dental Health. 2008;25:137-42.
[113] Moher D, Liberati A, Tetzlaff J, Altman D, Group TP. Preferred Reporting Items for
Systematic Reviews and Meta-Analyses: The PRISMA Statement. PLoS Medicine.
2009;6:1-6.
[114] Strobe Initiative. Strobe statements checklist of items that should be included in
reports of observational studies. International Journal of Public Health.
2008;53:3-4.
[115] Cochrane Collaboration. Reporting guidelines. Available from:
http://www.cochrane.org. Accessed April 2011.
[116] Conte M, Broder HL, Jenkins G, Reed R, Janal MN. Oral health, related behaviors
and oral health impacts among homeless adults. Journal of Public Health
Dentistry. 2006;66:276-8.
[117] Coles E, Chan K, Collins J, Humphris GM, Richards D, Williams B, et al. Decayed
and missing teeth and oral health-related factors: Predicting depression in
homeless people. Journal of Psychosomatic Research. 2011;71:108-12.
203
[118] van Laere I, de Wit M, Klazinga W. Long term homeless adults in Amsterdam,
social medical problems and mortality between 1997-2008. In van Laere I. Social
medical care and during homelessness in Amsterdam. Dissertation. 2010.
Chapter 5, p49-63. Available from: http://dare.uva.nl/record/325935. Accessed
June 2011.
[119] Steele J, O'Sullivan I. Adult dental health survey: National Statistics Office; 2009
Available from
http://www.ic.nhs.uk/webfiles/publications/007_Primary_Care/Dentistry/dentals
urvey09/AdultDentalHealthSurvey_2009_ExecutiveSummary.pdf Accessed June
2011.
[120] Slade DE. Derivation and validation of a short form oral health impact profile
Community Dentistry and Oral Epidemiology. 1997;25:284-90
[121] Drury T, Winn D, Snowden C, A K, Kleinman D, Lewis B, et al. An overview of the
oral health component of the 1988-1991National Health and Nutrition
Examination Survey (NHANES III-Phase 1). Journal of Dental Research.
1996;75(Special Issue):620-30.
[122] Health Development Agency. Social capital for health: issues of definition,
measurement and links to health; London. HDA; 2004.
[123] Health Development Agency. Health inequalities: concepts, frameworks and
policy; London. HDA; 2004.
[124] World Health Organisation. Social determinants of health. Geneva: World Health
Organisation; 2008.
[125] Dammann KW, Smith C. Factors affecting low-income women's food choices and
the perceived impact of dietary intake and socioeconomic status on their health
and weight. Journal of Nutritional Education Behaviour. 2009;41:242-53.
[126] Ballintyne S. Unsafe streets. New Economy. 1996;6:94-8.
[127] Bonner A. Coming in from the cold: A review of the screening and assessment
strategies for working with the socially excluded. Clinical Effectiveness in
Nursing. 2006;953:e243-52.
204
[128] Campbell E. It's more than the mouth: the effects of periodontal disease on
systemic health. Dental Assistant. 2007;76:26-8, 30-1.
[129] Gibson G, Reifenstahl EF, Wehler CJ, Rich SE, Kressin NR, King TB. Dental
treatment improves self-rated oral health in homeless veterans--a brief
communication. Journal of Public Health Dentistry. 2008;68:111-5.
[130] Definition of typology. Available from:
http://oxforddictionaries.com/definition/typology . Accessed August 2011.
[131] Richards W, Keauffling J. Homeless who accessed a healthy living centre in
Swansea, South Wales: An Assessment of the impact of oral ill-health. Prim Dent
Care. 2009;16:94-8.
[132] Humphris GM, Morrison T, Lindsay SJE. The Modified Dental Anxiety Scale:
Validation and United kingdom Norms. Community Dental Health. 1995;12:143-
50.
[133] Humphris G, Dyer T, Robinson P. The modified dental anxiety scale: UK general
population norms in 2008 with further psychometrics and effects of age. BMC
Oral Health. 2009;26 9:20. doi:10.1186/1472-6831-9-20.
[134] Radloff LS. The CES-D Scale: A self-report depression scale for research in the
general population.Applied Psychological Measurement. 1977;1:385-401.
[135] Walker A, Cooper I. Adult Dental Health Survey: Oral Health in the United
Kingdom 1998; The Stationary Office. London; 2000
[136] Reddy S. Essentials of clinical periodontology and periodontics, 2nd Edition. India:
Jaypee Brothers; 2008.
[137] Crippen DJ, Wood AF, Chambers DW. Initial plaque score as an indicator of patient
appointment compliance. Journal Californian Dental Association. 2003;31:621-5.
[138] Loe H. The gingival index, the plaque index and the retention index systems.
Journal of Periodontology. 1967;38:610-6.
[139] Standard Occupation Classification 2000 (SOC 2000). Available from:
www.statistics.gov.uk/methods_quality/ns_sec/downloads.SOC2000.doc
Accessed Feb 2011.
205
[140] Wanyonyi K, Themessl-Huber M, Humphris G, Freeman R. A systematic review
and meta-analysis of face-to-face communication of tailored health messages:
implications for practice. Patient Education and Counselling. 2011;85:348-55.
[141] A National Statistics Publication for Scotland. Operation of the Homeless Persons
Legislation in Scotland: National and Local Authority Analyses 2008-2009.
Edinburgh: The Scottish Government; 2009.
[142] A National Statistics Publication for Scotland. Mid-2010 Population Estimates
Scotland. Edinburgh: The Scottish Government; 2011. Available from:
http://www.gro-scotland.gov.uk/files2/stats/population-estimates/mid-
2010/mid-year-pop-est-2010.pdf; 2011. Accessed June 2012.
[143] Crisis. Homelessness: A silent killer. A research briefing on mortality amongst
homeless people. Available from:
http://wwwcrisisorguk/data/files/publications/Homelessness%20-
%20a%20silent%20killerpdf. Accessed June 2011.
[144] Yuan S, Freeman R. Can social support in the guise of an oral health education
intervention promote mother-infant bonding in Chinese mothers and their
infants? Health Education Journal. 2011;70:57-66.
[145] Kertesz SG, Hwang SW, Irwin J, Ritchey FJ, Lagory ME. Rising inability to obtain
needed health care among homeless persons in Birmingham, Alabama (1995-
2005). Journal of General Internal Medicine. 2009;24:841-7.
[146] Boyce DE, Tice AD, Ona FV, Akinaka KT, Lusk H. Viral hepatitis in a homeless
shelter in Hawai'i. Hawaii Medical Journal. 2009;68:113-5.
[147] Yanbaeva DG, Dentener MA, Creutzberg EC, Wesseling G, Wouters EF. Systemic
effects of smoking. Chest. 2007;131:1557-66.
[148] ASH Scotland. Smoking and Tobacco Statistics Fact Sheet. Update 1.3. Available
from: http://ashsoctland.org.uk/ash/files/ASHS_smokingstate_1.3.pdf. Accessed
Feb 2010.
[149] Scottish Government. Scotland's People Annual Report: Results from 2007/2008
Scottish Household Survey. Edinburgh Information Services Division. 2009.
206
[150] ISD Scotland. Alcohol Statistics Scotland 2009. Edinburgh: Information Services
Division; 2009.
[151] Robinson S, Bugler C. Smoking and drinking among adults. General Lifestyle
Survey 2008, Office of National Statistics. 2010.
[152] HIV Scotland. Promoting Positive Change.
Available from: http://www.hivscotland.com/data_and_research/fast_facts/.
Accessed June 2012;
[153] Scottish Public Health Observatory. Drug Misuse:Key Points.Available from:
http://www.scotpho.org.uk/behaviour/drugs/key-points AccessedMarch 2010.
[154] O'Keefe J, Bybee K, Lavie C. Alcohol and cardiovascular health. Journal of
American College of Cardiology. 2007;50:1009-14.
[155] Scottish Government Statistics. Available from:
www.scotland.gov.uk/topics/statistics/browse/Health/TrendMentalHealth.
Accessed September 2012
[156] Zakrzewska JM. Oral cancer. British Medical Journal. 1999;38:1051-4.
[157] De Palma P, Nordenram G. The perceptions of homeless people in Stockholm
concerning oral health and consequences of dental treatment: a qualitative study.
Special Care Dentist. 2005;25:289-295.
[158] Anil S, Al-Ghamdi HS. The impact of periodontal infections on systemic diseases.
An update for medical practitioners. Saudi Medical Journal. 2006;27:767-776.
[159] Gregory J, Gibson BW, Robinson PG. Variation and change in the meaning of oral
health-related quality of life: a grounded systems approach. Social Science and
Medicine. 2005;60:1859-68.
[160] Parker EJ, Jamieson L, Steffens M, Cathro P, Logan RM. Oral health-related quality
of life of homeless adults. 88th General session and Exhibition of the IADR
Barcelona, Spain. 2010;14-17.
[161] ISD Scotland Publication Report. Practice Team Information Annual Update
2010/11. p.30-32. Available from:

207
www.isdscotland.org/Health-Topics/General-Practice/Publications/2011-11-
29/2011-11-29-PTI-Report.pdf. Accessed December 2011.
[162] Razavi T. Self-report measures: an overview of concerns and limitations of
questionnaire use in occupational stress research. University of Southampton, UK.
2001.

208
9.0 Appendices
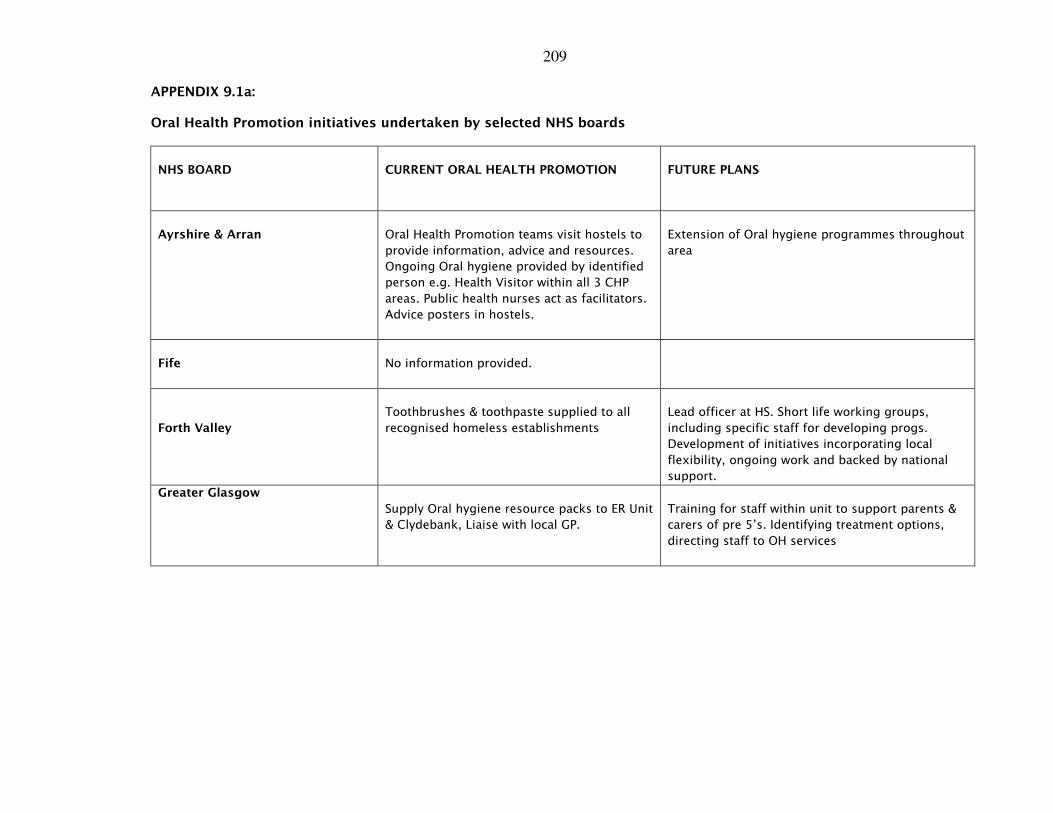
209
APPENDIX 9.1a:
Oral Health Promotion initiatives undertaken by selected NHS boards
NHS BOARD
CURRENT ORAL HEALTH PROMOTION
FUTURE PLANS
Ayrshire & Arran
Oral Health Promotion teams visit hostels to
provide information, advice and resources.
Ongoing Oral hygiene provided by identified
person e.g. Health Visitor within all 3 CHP
areas. Public health nurses act as facilitators.
Advice posters in hostels.
Extension of Oral hygiene programmes throughout
area
Fife
No information provided.
Forth Valley
Toothbrushes & toothpaste supplied to all
recognised homeless establishments
Lead officer at HS. Short life working groups,
including specific staff for developing progs.
Development of initiatives incorporating local
flexibility, ongoing work and backed by national
support.
Greater Glasgow
Supply Oral hygiene resource packs to ER Unit
& Clydebank, Liaise with local GP.
Training for staff within unit to support parents &
carers of pre 5’s. Identifying treatment options,
directing staff to OH services
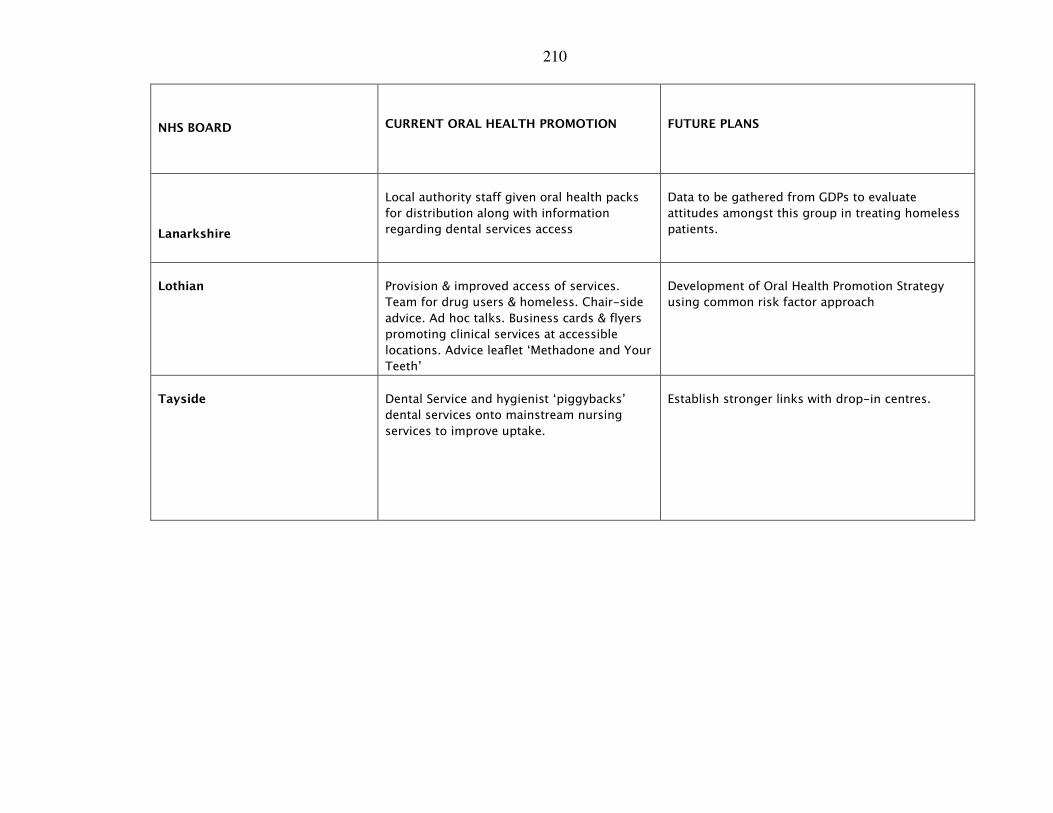
210
NHS BOARD
CURRENT ORAL HEALTH PROMOTION
FUTURE PLANS
Lanarkshire
Local authority staff given oral health packs
for distribution along with information
regarding dental services access
Data to be gathered from GDPs to evaluate
attitudes amongst this group in treating homeless
patients.
Lothian
Provision & improved access of services.
Team for drug users & homeless. Chair-side
advice. Ad hoc talks. Business cards & flyers
promoting clinical services at accessible
locations. Advice leaflet ‘Methadone and Your
Teeth’
Development of Oral Health Promotion Strategy
using common risk factor approach
Tayside
Dental Service and hygienist ‘piggybacks’
dental services onto mainstream nursing
services to improve uptake.
Establish stronger links with drop-in centres.
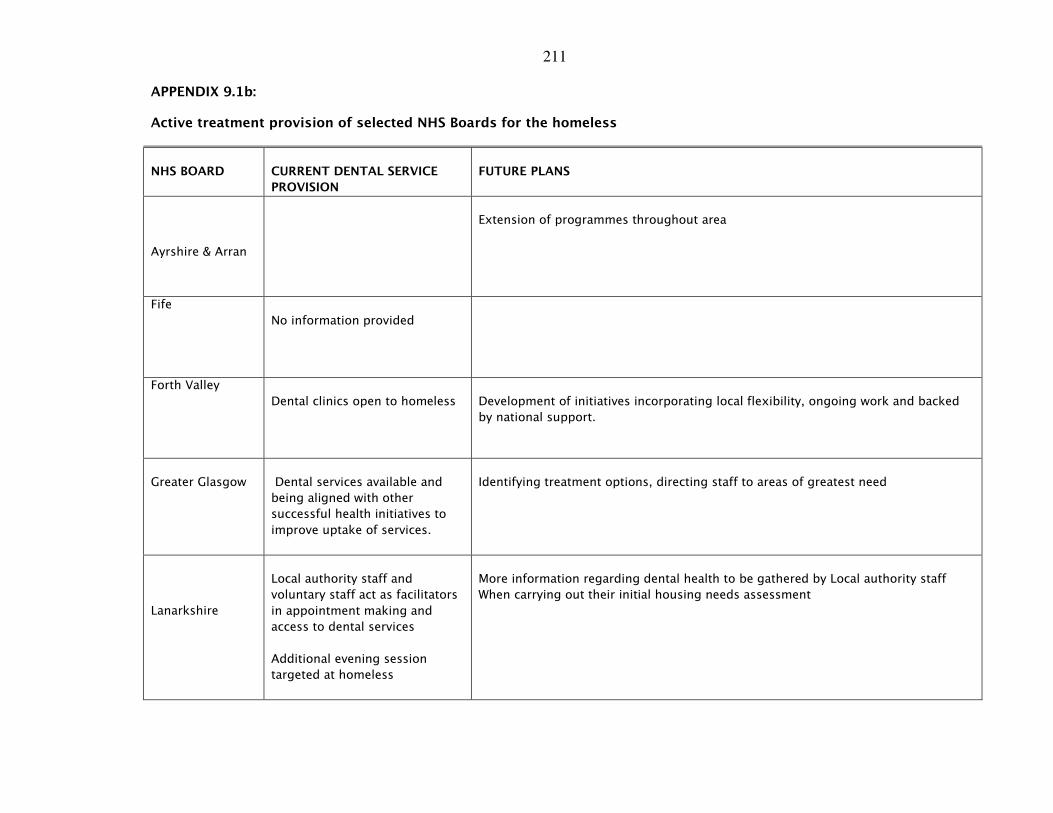
211
APPENDIX 9.1b:
Active treatment provision of selected NHS Boards for the homeless
NHS BOARD
CURRENT DENTAL SERVICE
PROVISION
FUTURE PLANS
Ayrshire & Arran
Extension of programmes throughout area
Fife
No information provided
Forth Valley
Dental clinics open to homeless
Development of initiatives incorporating local flexibility, ongoing work and backed
by national support.
Greater Glasgow
Dental services available and
being aligned with other
successful health initiatives to
improve uptake of services.
Identifying treatment options, directing staff to areas of greatest need
Lanarkshire
Local authority staff and
voluntary staff act as facilitators
in appointment making and
access to dental services
Additional evening session
targeted at homeless
More information regarding dental health to be gathered by Local authority staff
When carrying out their initial housing needs assessment
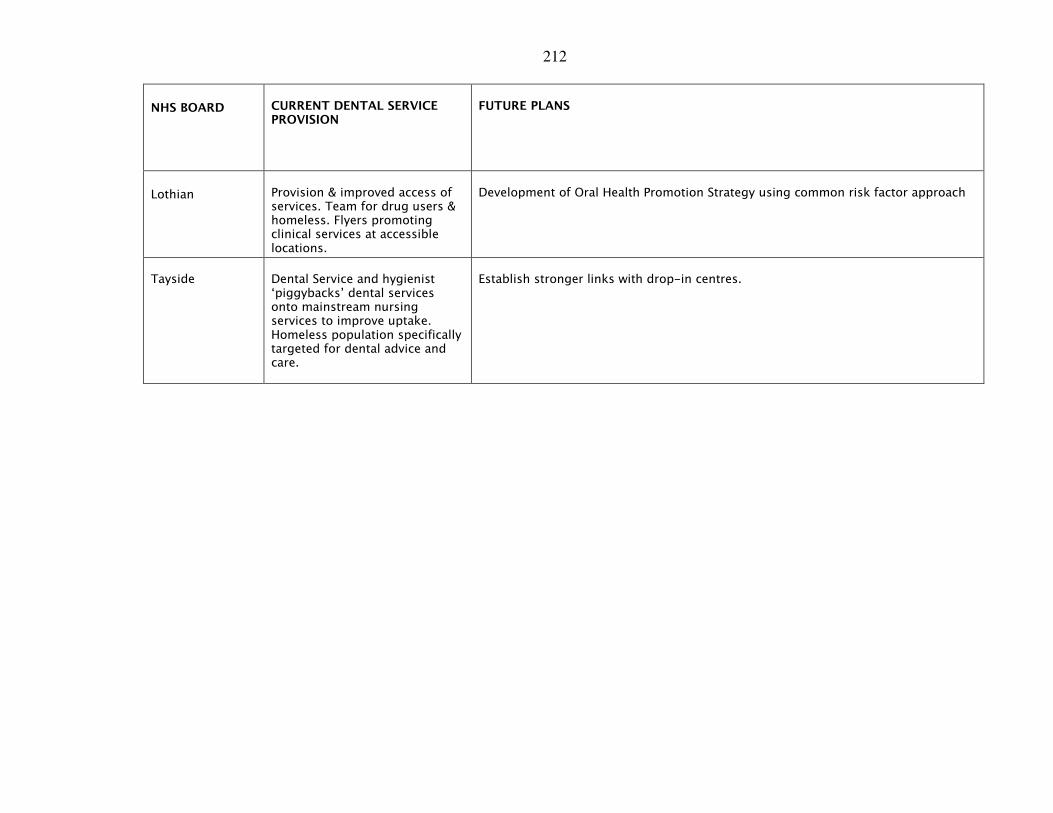
212
NHS BOARD
CURRENT DENTAL SERVICE PROVISION
FUTURE PLANS
Lothian
Provision & improved access of services. Team for drug users & homeless. Flyers promoting clinical services at accessible locations.
Development of Oral Health Promotion Strategy using common risk factor approach
Tayside
Dental Service and hygienist ‘piggybacks’ dental services onto mainstream nursing services to improve uptake. Homeless population specifically targeted for dental advice and care.
Establish stronger links with drop-in centres.
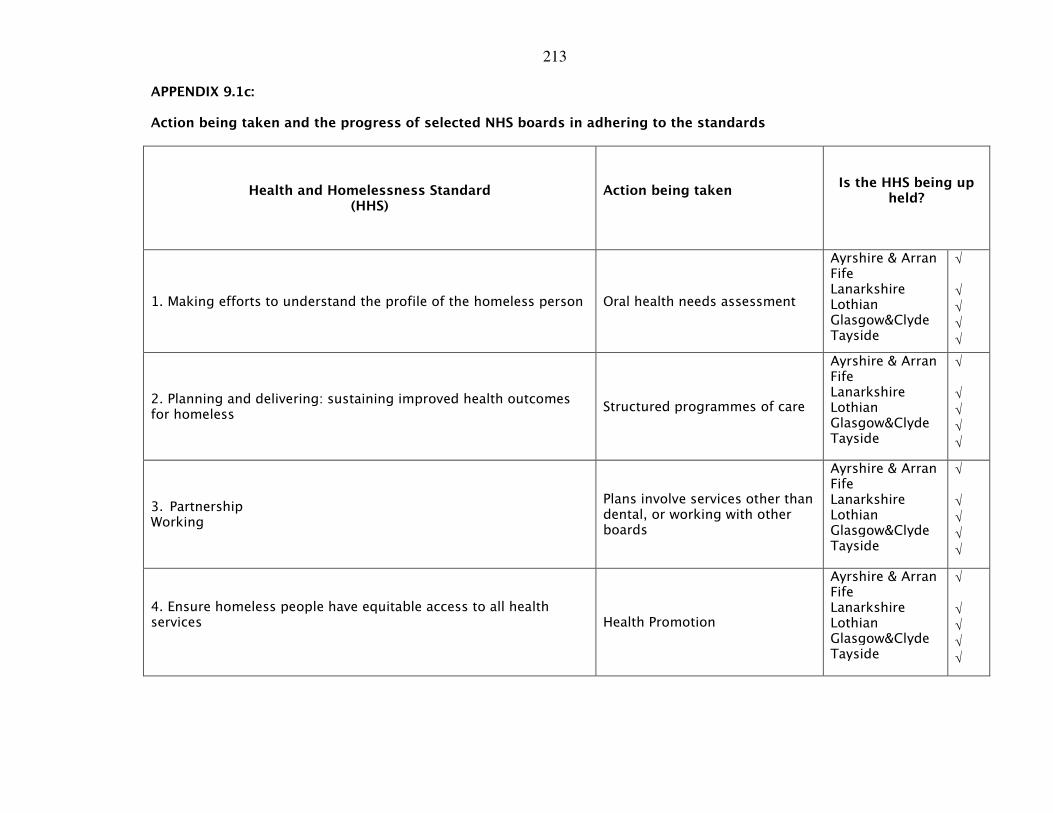
213
APPENDIX 9.1c:
Action being taken and the progress of selected NHS boards in adhering to the standards
Health and Homelessness Standard (HHS)
Action being taken
Is the HHS being up held?
1. Making efforts to understand the profile of the homeless person Oral health needs assessment
Ayrshire & Arran Fife Lanarkshire Lothian Glasgow&Clyde Tayside
√
√ √ √
√
2. Planning and delivering: sustaining improved health outcomes for homeless
Structured programmes of care
Ayrshire & Arran Fife Lanarkshire Lothian Glasgow&Clyde Tayside
√
√ √ √
√
3. Partnership Working
Plans involve services other than dental, or working with other boards
Ayrshire & Arran Fife Lanarkshire Lothian Glasgow&Clyde Tayside
√
√ √ √
√
4. Ensure homeless people have equitable access to all health services
Health Promotion
Ayrshire & Arran Fife Lanarkshire Lothian Glasgow&Clyde Tayside
√
√ √ √
√
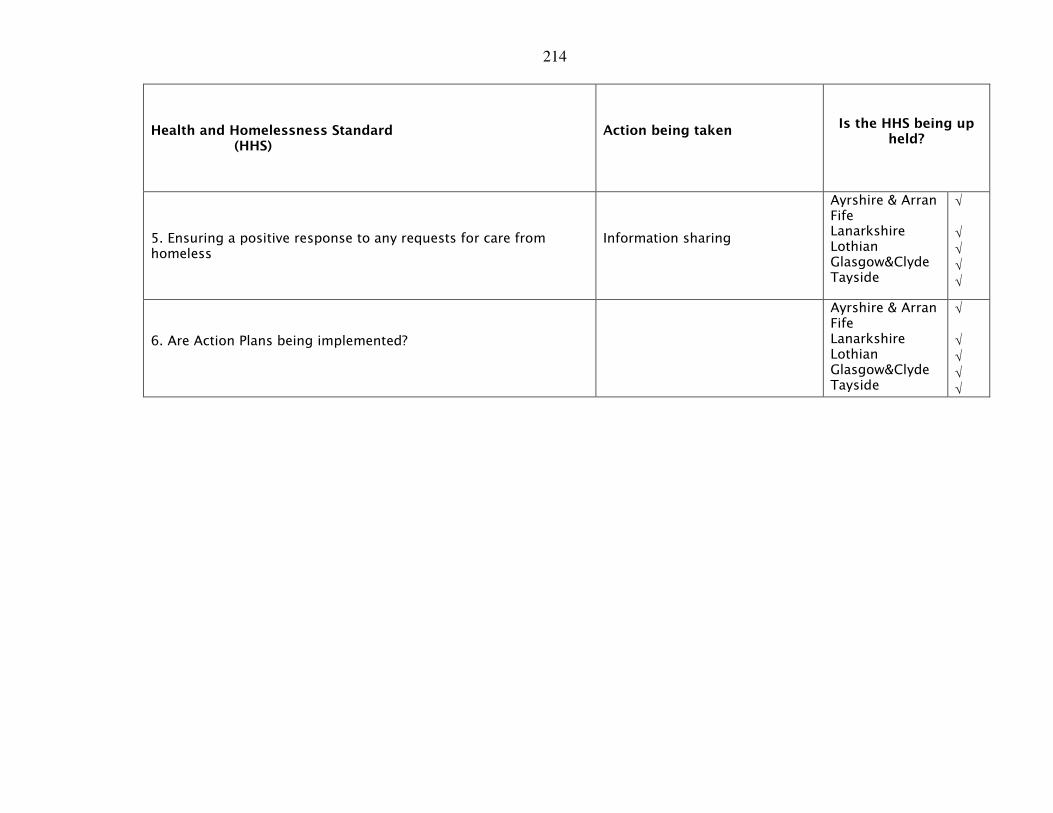
214
Health and Homelessness Standard (HHS)
Action being taken
Is the HHS being up held?
5. Ensuring a positive response to any requests for care from homeless
Information sharing
Ayrshire & Arran Fife Lanarkshire Lothian Glasgow&Clyde Tayside
√
√ √ √ √
6. Are Action Plans being implemented?
Ayrshire & Arran Fife Lanarkshire Lothian Glasgow&Clyde Tayside
√
√ √ √ √
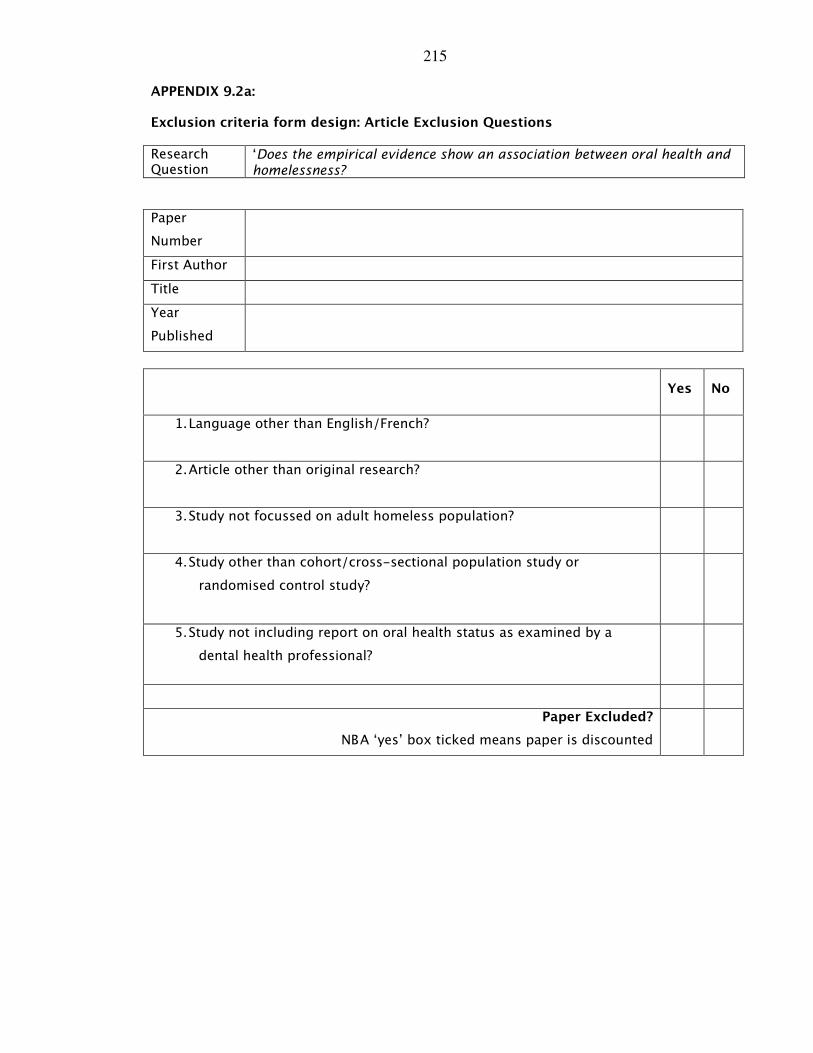
215
APPENDIX 9.2a:
Exclusion criteria form design: Article Exclusion Questions
Research Question
‘Does the empirical evidence show an association between oral health and homelessness?
Paper
Number
First Author
Title
Year
Published
Yes No
1. Language other than English/French?
2. Article other than original research?
3. Study not focussed on adult homeless population?
4. Study other than cohort/cross-sectional population study or
randomised control study?
5. Study not including report on oral health status as examined by a
dental health professional?
Paper Excluded?
NB A ‘yes’ box ticked means paper is discounted
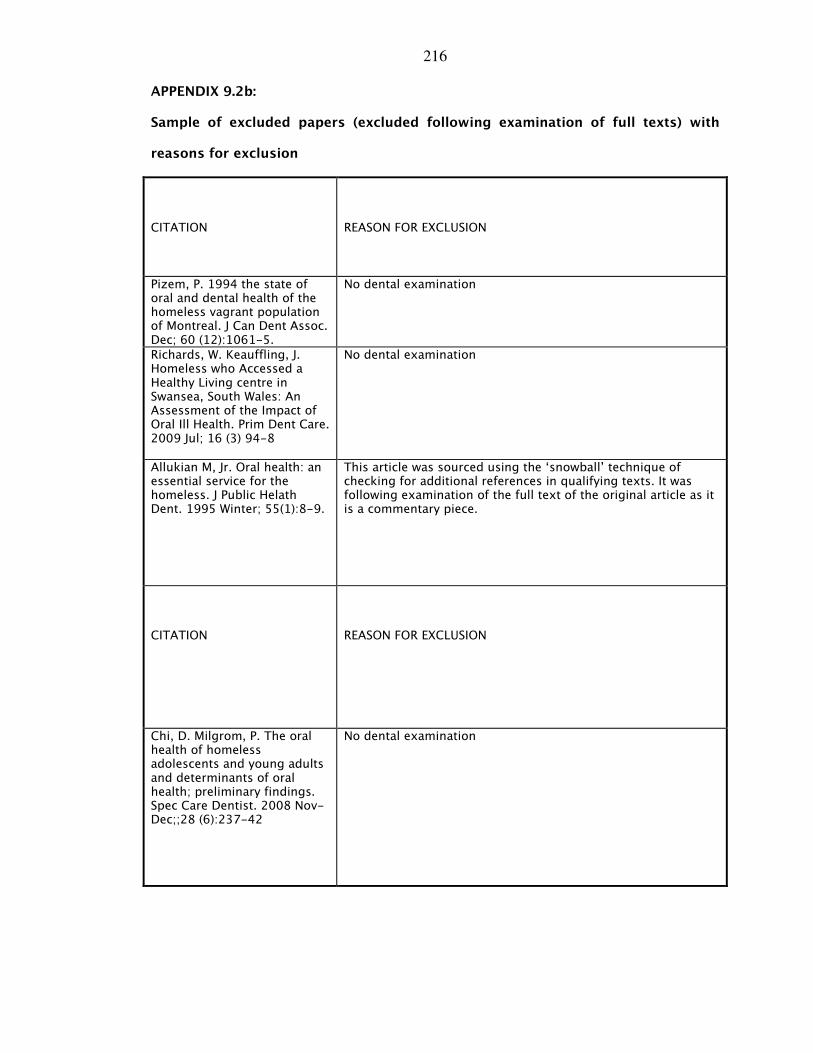
216
APPENDIX 9.2b:
Sample of excluded papers (excluded following examination of full texts) with
reasons for exclusion
CITATION
REASON FOR EXCLUSION
Pizem, P. 1994 the state of oral and dental health of the homeless vagrant population of Montreal. J Can Dent Assoc. Dec; 60 (12):1061-5.
No dental examination
Richards, W. Keauffling, J. Homeless who Accessed a Healthy Living centre in Swansea, South Wales: An Assessment of the Impact of Oral Ill Health. Prim Dent Care. 2009 Jul; 16 (3) 94-8
No dental examination
Allukian M, Jr. Oral health: an essential service for the homeless. J Public Helath Dent. 1995 Winter; 55(1):8-9.
This article was sourced using the ‘snowball’ technique of checking for additional references in qualifying texts. It was following examination of the full text of the original article as it is a commentary piece.
CITATION
REASON FOR EXCLUSION
Chi, D. Milgrom, P. The oral health of homeless adolescents and young adults and determinants of oral health; preliminary findings. Spec Care Dentist. 2008 Nov-Dec;;28 (6):237-42
No dental examination

217
Visvanathan, R. Good oral health, adequate nutrient consumption and family support are associated with a reduced risk of being underweight amongst older Malaysian residents of publicly funded shelter homes. 2006. asia Pacific Journal of Clinical Nutrition 15(3):400-405
Excluded as relies on self-reported data, no dental examination
Di Marco, MA et al The pediatric nurse practitioner’s role in reducing oral health disparities in homeless children. J. Peditr Health Care. 2009. Mar-Apr;23(2):109-16
No dental examination
Daly, B, Newton, T. Patterns of dental service use among homeless people using a targeted service. J Pub Dent Health. 2010. 70 (1):45-51
This was a study carried out using case note reviews, there was no dental examination of participants
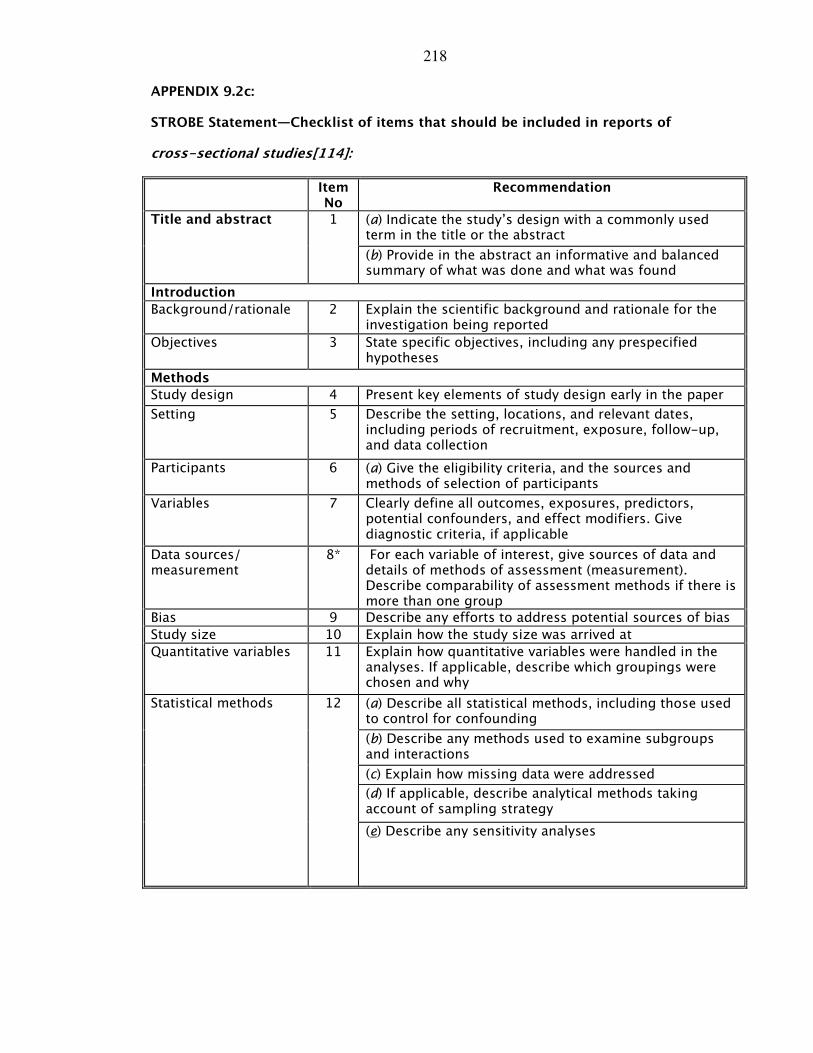
218
APPENDIX 9.2c:
STROBE Statement—Checklist of items that should be included in reports of
cross-sectional studies[114]:
Item No
Recommendation
(a) Indicate the study’s design with a commonly used term in the title or the abstract
Title and abstract 1
(b) Provide in the abstract an informative and balanced summary of what was done and what was found
Introduction
Background/rationale 2 Explain the scientific background and rationale for the investigation being reported
Objectives 3 State specific objectives, including any prespecified hypotheses
Methods
Study design 4 Present key elements of study design early in the paper
Setting 5 Describe the setting, locations, and relevant dates, including periods of recruitment, exposure, follow-up, and data collection
Participants 6 (a) Give the eligibility criteria, and the sources and methods of selection of participants
Variables 7 Clearly define all outcomes, exposures, predictors, potential confounders, and effect modifiers. Give diagnostic criteria, if applicable
Data sources/ measurement
8* For each variable of interest, give sources of data and details of methods of assessment (measurement). Describe comparability of assessment methods if there is more than one group
Bias 9 Describe any efforts to address potential sources of bias
Study size 10 Explain how the study size was arrived at
Quantitative variables 11 Explain how quantitative variables were handled in the analyses. If applicable, describe which groupings were chosen and why
(a) Describe all statistical methods, including those used to control for confounding
(b) Describe any methods used to examine subgroups and interactions
(c) Explain how missing data were addressed
(d) If applicable, describe analytical methods taking account of sampling strategy
Statistical methods 12
(e) Describe any sensitivity analyses

219
Results
(a) Report numbers of individuals at each stage of study—eg numbers potentially eligible, examined for eligibility, confirmed eligible, included in the study, completing follow-up, and analysed
(b) Give reasons for non-participation at each stage
Participants 13*
(c) Consider use of a flow diagram
(a) Give characteristics of study participants (eg demographic, clinical, social) and information on exposures and potential confounders
Descriptive data
14*
(b) Indicate number of participants with missing data for each variable of interest
Outcome data 15* Report numbers of outcome events or summary measures
(a) Give unadjusted estimates and, if applicable, confounder-adjusted estimates and their precision (eg, 95% confidence interval). Make clear which confounders were adjusted for and why they were included
(b) Report category boundaries when continuous variables were categorised
Main results 16
(c) If relevant, consider translating estimates of relative risk into absolute risk for a meaningful time period
Other analyses 17 Report other analyses done—eg analyses of subgroups and interactions, and sensitivity analyses
Discussion
Key results 18 Summarise key results with reference to study objectives
Limitations 19 Discuss limitations of the study, taking into account sources of potential bias or imprecision. Discuss both direction and magnitude of any potential bias
Interpretation 20 Give a cautious overall interpretation of results considering objectives, limitations, multiplicity of analyses, results from similar studies, and other relevant evidence
Generalisability 21 Discuss the generalisability (external validity) of the study results
Other information
Funding 22 Give the source of funding and the role of the funders for the present study and, if applicable, for the original study on which the present article is based
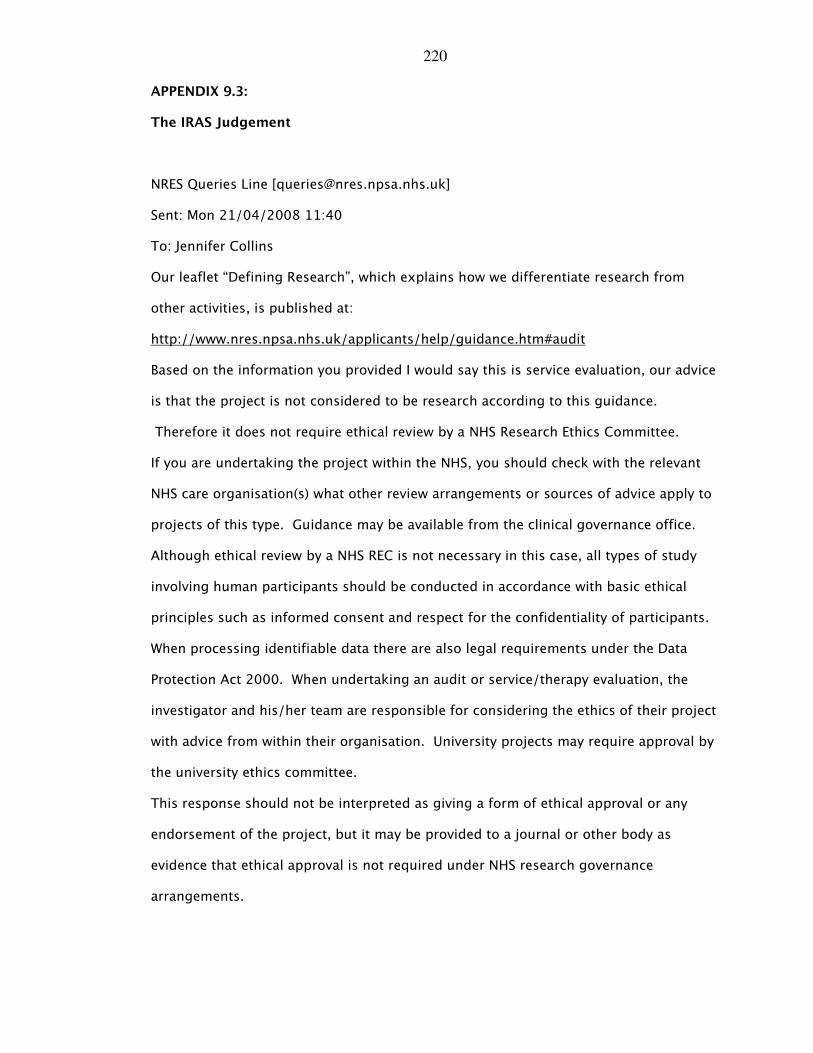
220
APPENDIX 9.3:
The IRAS Judgement
NRES Queries Line [[email protected]]
Sent: Mon 21/04/2008 11:40
To: Jennifer Collins
Our leaflet “Defining Research”, which explains how we differentiate research from
other activities, is published at:
http://www.nres.npsa.nhs.uk/applicants/help/guidance.htm#audit
Based on the information you provided I would say this is service evaluation, our advice
is that the project is not considered to be research according to this guidance.
Therefore it does not require ethical review by a NHS Research Ethics Committee.
If you are undertaking the project within the NHS, you should check with the relevant
NHS care organisation(s) what other review arrangements or sources of advice apply to
projects of this type. Guidance may be available from the clinical governance office.
Although ethical review by a NHS REC is not necessary in this case, all types of study
involving human participants should be conducted in accordance with basic ethical
principles such as informed consent and respect for the confidentiality of participants.
When processing identifiable data there are also legal requirements under the Data
Protection Act 2000. When undertaking an audit or service/therapy evaluation, the
investigator and his/her team are responsible for considering the ethics of their project
with advice from within their organisation. University projects may require approval by
the university ethics committee.
This response should not be interpreted as giving a form of ethical approval or any
endorsement of the project, but it may be provided to a journal or other body as
evidence that ethical approval is not required under NHS research governance
arrangements.
221
However, if you, your sponsor/funder or any NHS organisation feel that the project
should be managed as research and/or that ethical review by a NHS REC is essential,
please write setting out your reasons and we will be pleased to consider further.
Where NHS organisations have clarified that a project is not to be managed as research,
the Research Governance Framework states that it should not be presented as research
within the NHS.
Regards
IRAS (Integrated Research Application System) is now available for use and
consultation. To view IRAS and for further information visit
www.myresearchproject.org.uk
Queries Line
National Research Ethics Service
National Patient Safety Agency
4-8 Maple Steet
London
W1T 5HD
Website: www.nres.npsa.nhs.uk
Email: [email protected]
Ref: 04/01
**
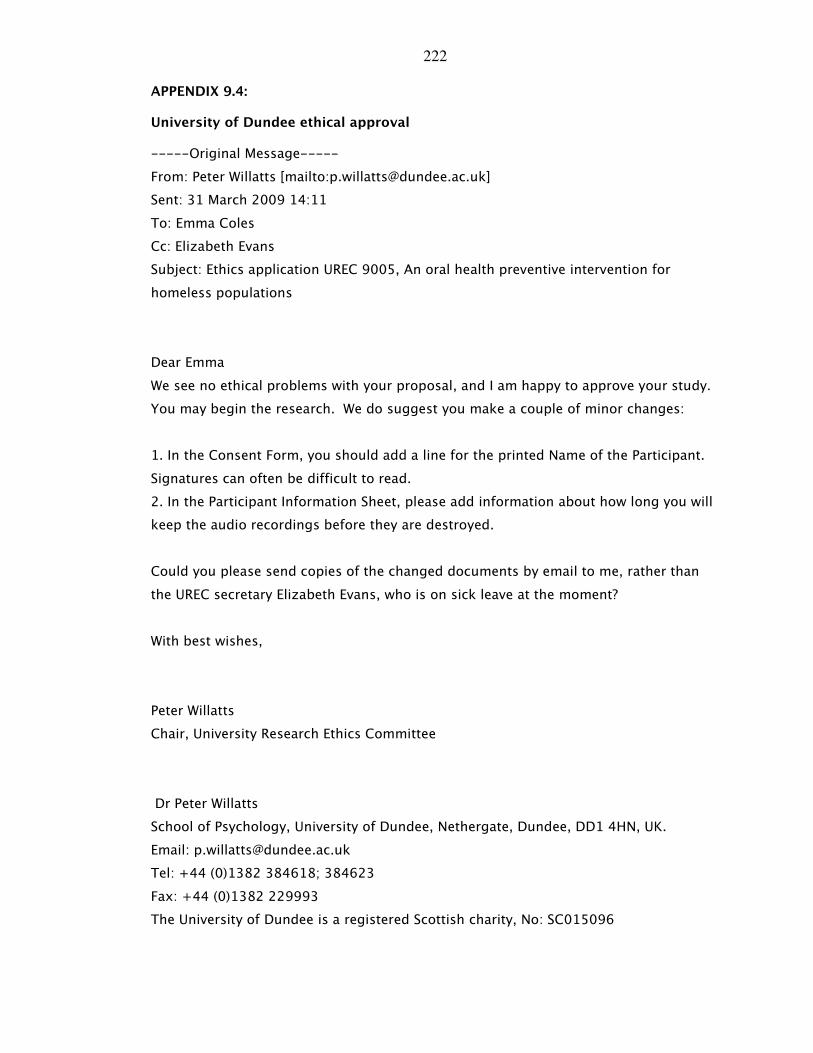
222
APPENDIX 9.4:
University of Dundee ethical approval
-----Original Message-----
From: Peter Willatts [mailto:[email protected]]
Sent: 31 March 2009 14:11
To: Emma Coles
Cc: Elizabeth Evans
Subject: Ethics application UREC 9005, An oral health preventive intervention for
homeless populations
Dear Emma
We see no ethical problems with your proposal, and I am happy to approve your study.
You may begin the research. We do suggest you make a couple of minor changes:
1. In the Consent Form, you should add a line for the printed Name of the Participant.
Signatures can often be difficult to read.
2. In the Participant Information Sheet, please add information about how long you will
keep the audio recordings before they are destroyed.
Could you please send copies of the changed documents by email to me, rather than
the UREC secretary Elizabeth Evans, who is on sick leave at the moment?
With best wishes,
Peter Willatts
Chair, University Research Ethics Committee
Dr Peter Willatts
School of Psychology, University of Dundee, Nethergate, Dundee, DD1 4HN, UK.
Email: [email protected]
Tel: +44 (0)1382 384618; 384623
Fax: +44 (0)1382 229993
The University of Dundee is a registered Scottish charity, No: SC015096
223
APPENDIX 9.5:
The Questionnaire
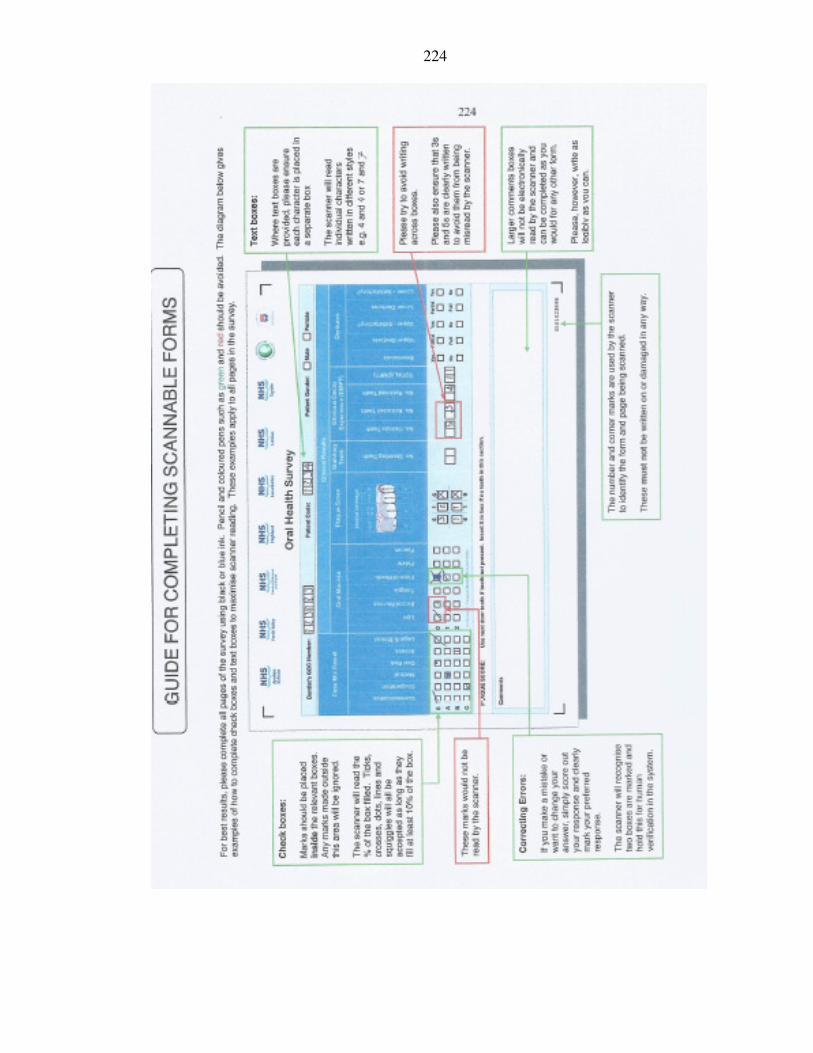
224
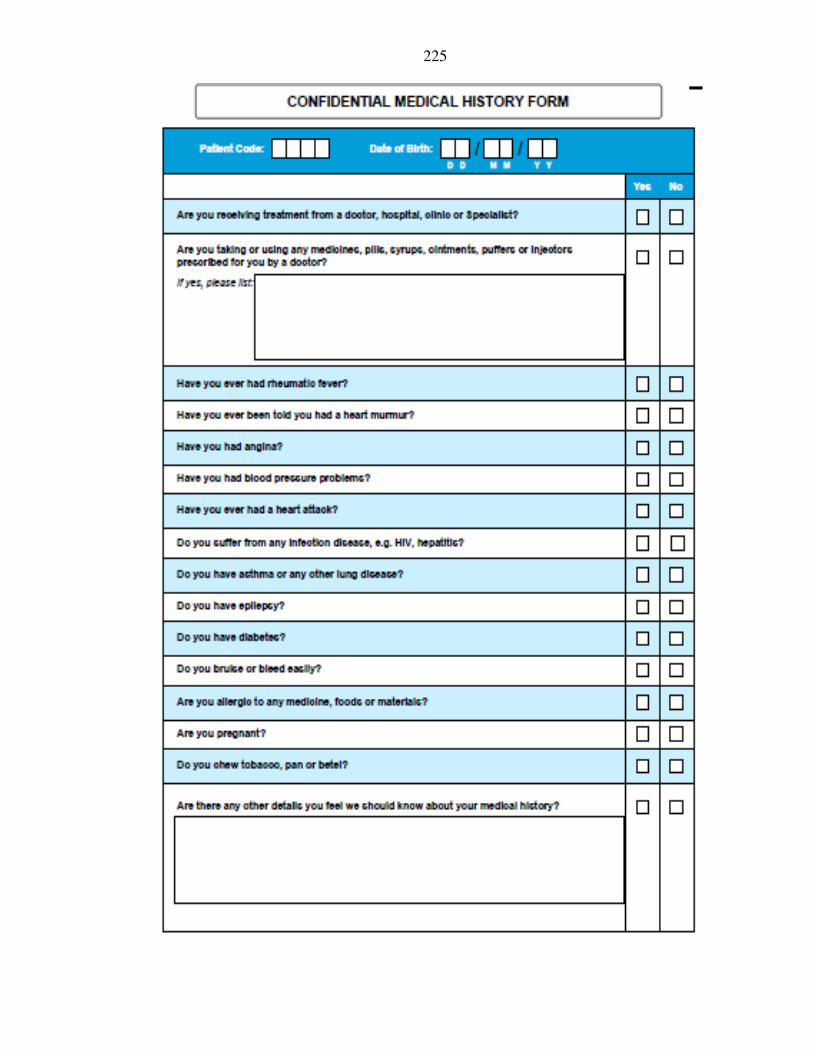
225
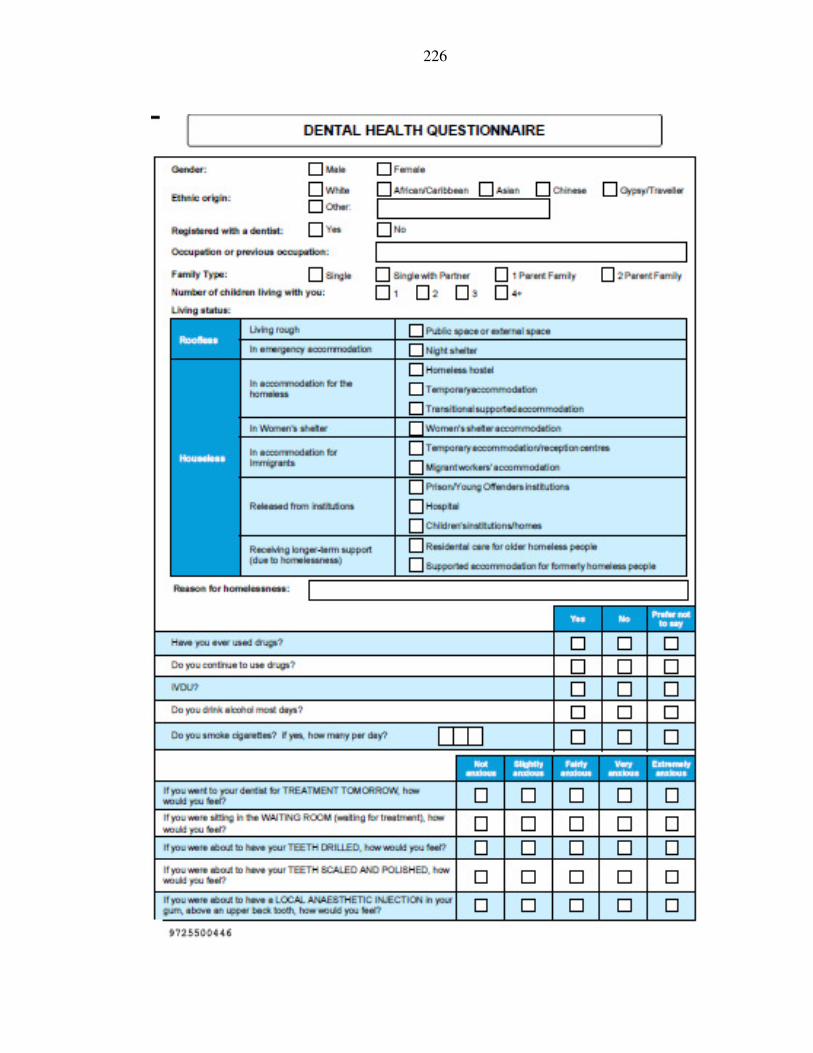
226
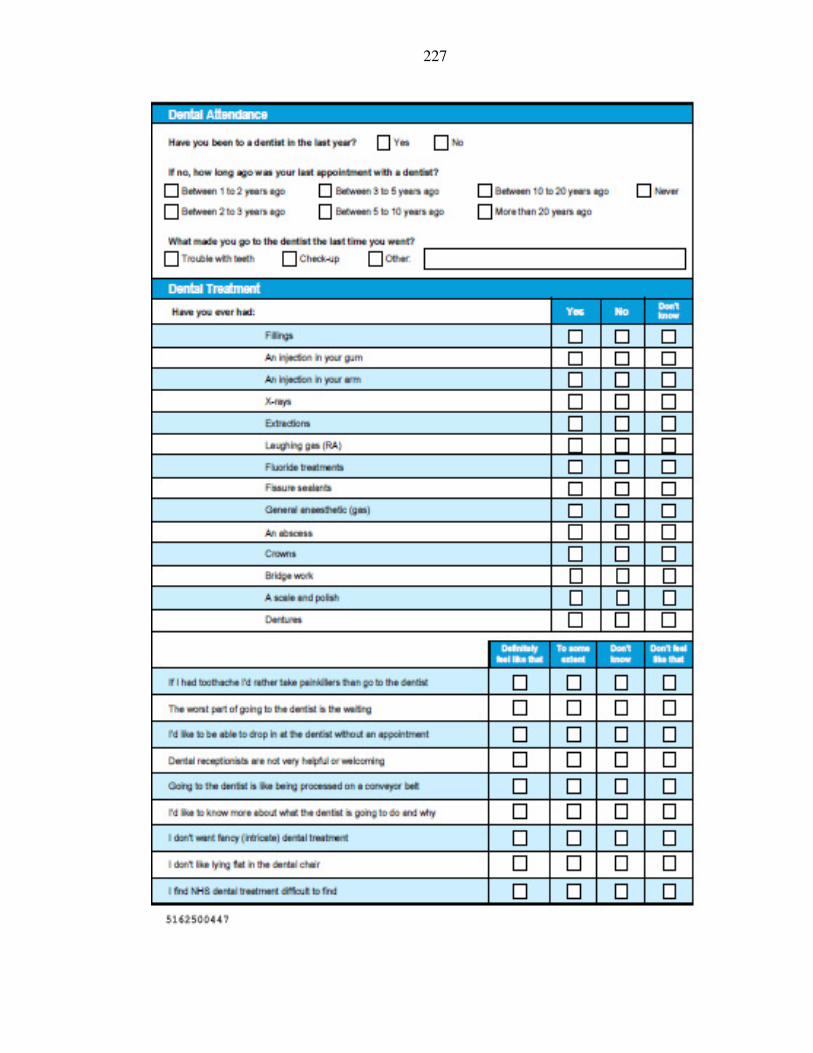
227
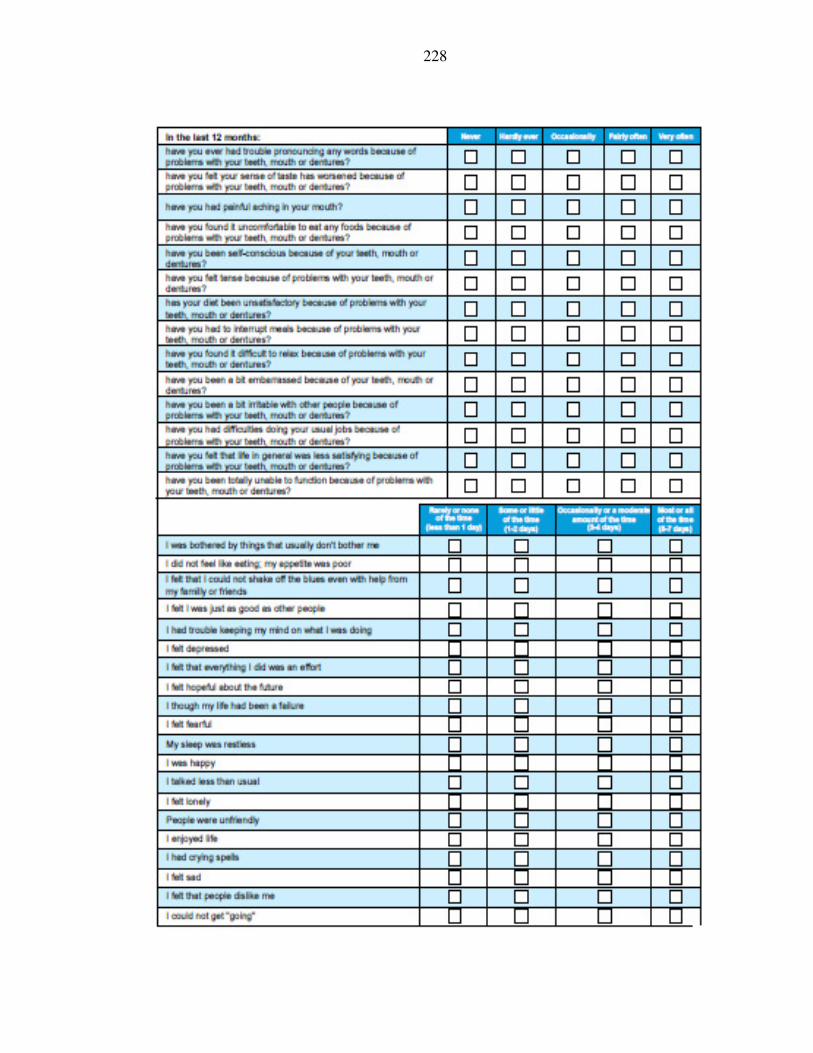
228
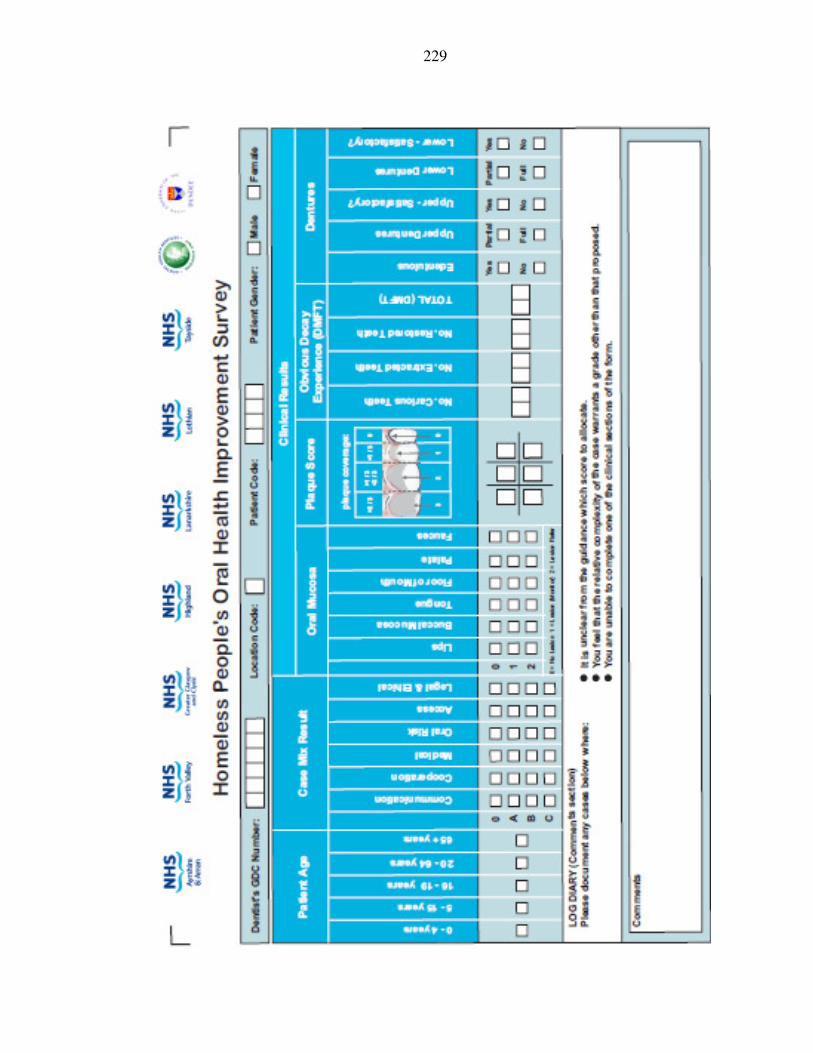
229
230
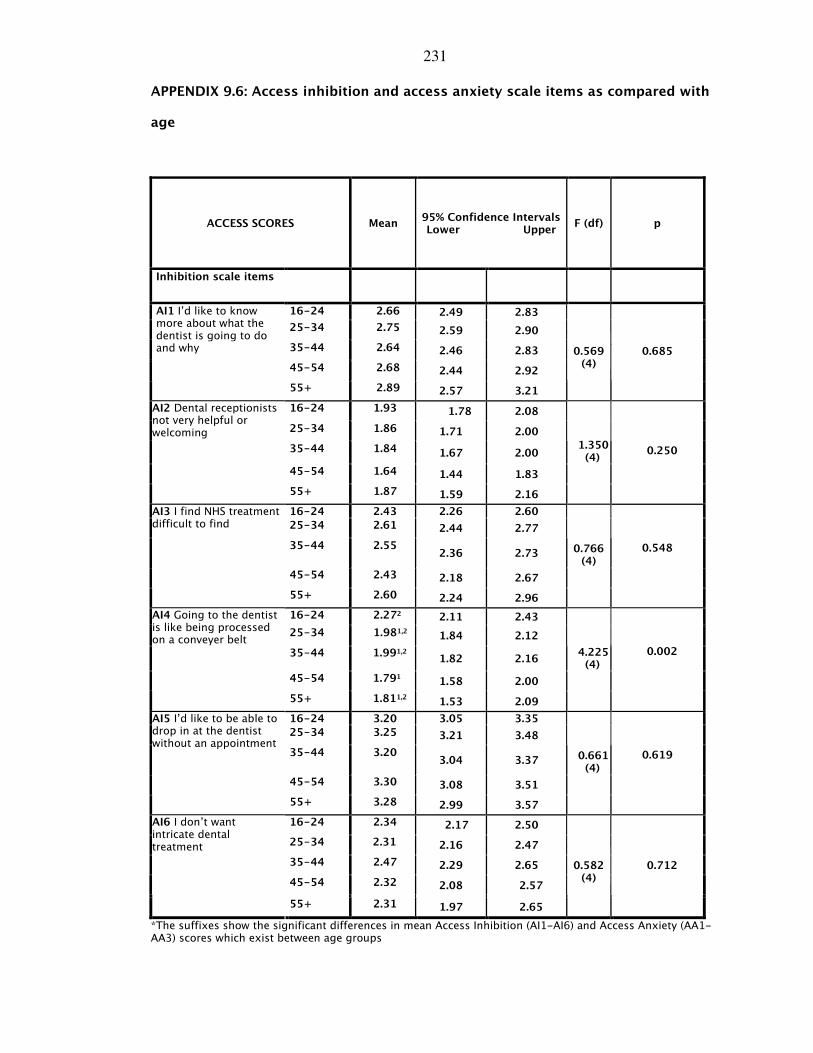
231
APPENDIX 9.6: Access inhibition and access anxiety scale items as compared with
age
ACCESS SCORES Mean 95% Confidence Intervals Lower Upper
F (df) p
Inhibition scale items
16-24 2.66 2.49 2.83
25-34 2.75 2.59 2.90
35-44 2.64 2.46 2.83
45-54 2.68 2.44 2.92
AI1 I’d like to know more about what the dentist is going to do and why
55+ 2.89 2.57 3.21
0.569
(4) 0.685
16-24 1.93 1.78 2.08
25-34 1.86 1.71 2.00
35-44 1.84 1.67 2.00
1.350 (4)
0.250
45-54 1.64 1.44 1.83
AI2 Dental receptionists not very helpful or welcoming
55+ 1.87 1.59 2.16
16-24 2.43 2.26 2.60
25-34 2.61 2.44 2.77
35-44 2.55 2.36 2.73
0.766 (4)
0.548
45-54 2.43 2.18 2.67
AI3 I find NHS treatment difficult to find
55+ 2.60 2.24 2.96
16-24 2.272 2.11 2.43
25-34 1.981,2 1.84 2.12
35-44 1.991,2
1.82 2.16
4.225 (4)
0.002
45-54 1.791 1.58 2.00
AI4 Going to the dentist is like being processed on a conveyer belt
55+ 1.811,2 1.53 2.09
16-24 3.20 3.05 3.35
25-34 3.25 3.21 3.48
35-44 3.20 3.04 3.37
0.661 (4)
0.619
45-54 3.30 3.08 3.51
AI5 I’d like to be able to drop in at the dentist without an appointment
55+ 3.28 2.99 3.57
16-24 2.34 2.17 2.50
25-34 2.31 2.16 2.47
35-44 2.47 2.29 2.65
45-54 2.32 2.08 2.57
AI6 I don’t want intricate dental treatment
55+ 2.31 1.97 2.65
0.582
(4) 0.712
*The suffixes show the significant differences in mean Access Inhibition (AI1-AI6) and Access Anxiety (AA1-AA3) scores which exist between age groups
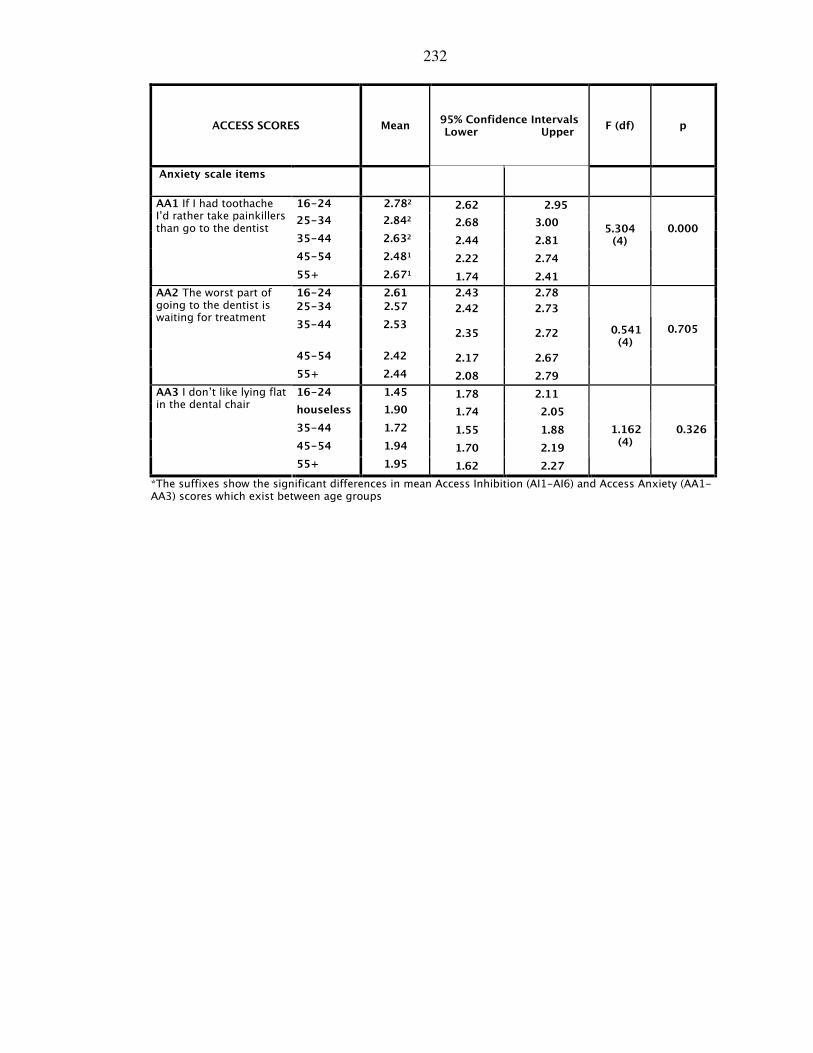
232
ACCESS SCORES Mean 95% Confidence Intervals Lower Upper
F (df) p
Anxiety scale items
16-24 2.782 2.62 2.95
25-34 2.842 2.68 3.00
35-44 2.632 2.44 2.81
5.304 (4)
0.000
45-54 2.481 2.22 2.74
AA1 If I had toothache I’d rather take painkillers than go to the dentist
55+ 2.671 1.74 2.41
16-24 2.61 2.43 2.78
25-34 2.57 2.42 2.73
35-44 2.53 2.35 2.72
0.541 (4)
0.705
45-54 2.42 2.17 2.67
AA2 The worst part of going to the dentist is waiting for treatment
55+ 2.44 2.08 2.79
16-24 1.45 1.78 2.11
houseless 1.90 1.74 2.05
35-44 1.72 1.55 1.88
45-54 1.94 1.70 2.19
AA3 I don’t like lying flat in the dental chair
55+ 1.95 1.62 2.27
1.162 (4)
0.326
*The suffixes show the significant differences in mean Access Inhibition (AI1-AI6) and Access Anxiety (AA1-AA3) scores which exist between age groups
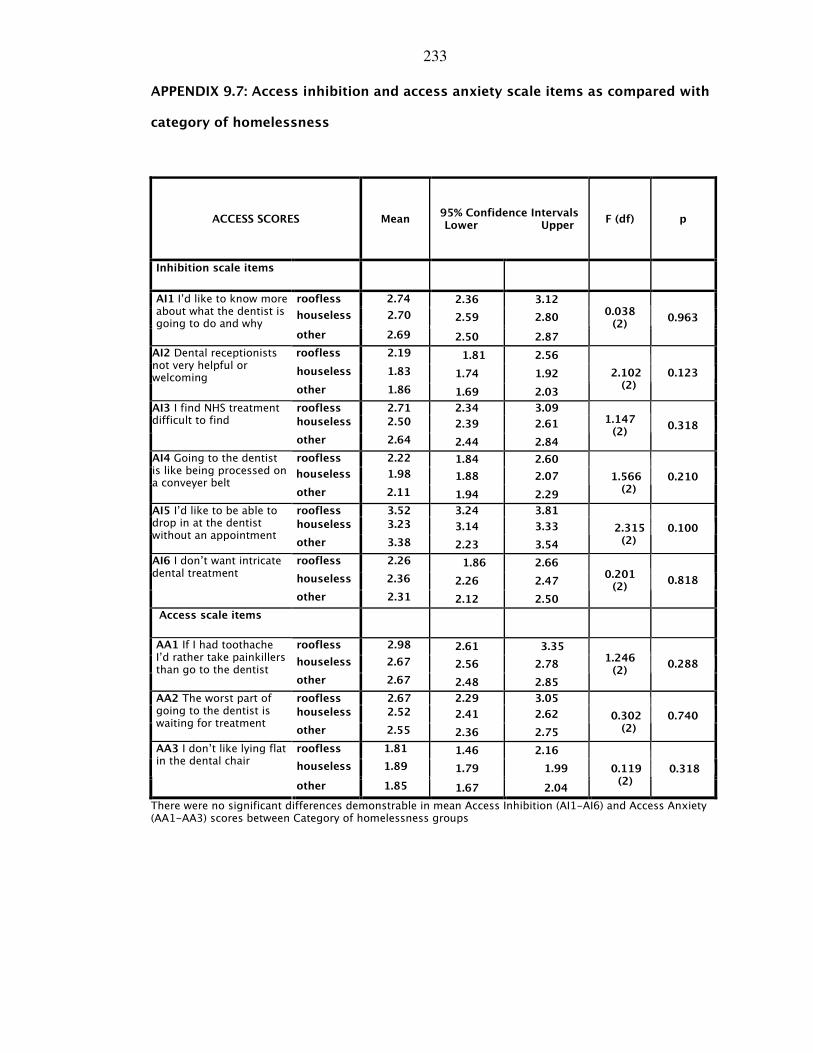
233
APPENDIX 9.7: Access inhibition and access anxiety scale items as compared with
category of homelessness
ACCESS SCORES Mean 95% Confidence Intervals Lower Upper
F (df) p
Inhibition scale items
roofless 2.74 2.36 3.12
houseless 2.70 2.59 2.80
AI1 I’d like to know more about what the dentist is going to do and why
other 2.69 2.50 2.87
0.038 (2)
0.963
roofless 2.19 1.81 2.56
houseless 1.83 1.74 1.92
AI2 Dental receptionists not very helpful or welcoming
other 1.86 1.69 2.03
2.102 (2)
0.123
roofless 2.71 2.34 3.09
houseless 2.50 2.39 2.61
AI3 I find NHS treatment difficult to find
other 2.64 2.44 2.84
1.147 (2)
0.318
roofless 2.22 1.84 2.60
houseless 1.98 1.88 2.07
AI4 Going to the dentist is like being processed on a conveyer belt
other 2.11 1.94 2.29
1.566 (2)
0.210
roofless 3.52 3.24 3.81
houseless 3.23 3.14 3.33
AI5 I’d like to be able to drop in at the dentist without an appointment
other 3.38 2.23 3.54
2.315 (2)
0.100
roofless 2.26 1.86 2.66
houseless 2.36 2.26 2.47
AI6 I don’t want intricate dental treatment
other 2.31 2.12 2.50
0.201 (2)
0.818
Access scale items
roofless 2.98 2.61 3.35
houseless 2.67 2.56 2.78
AA1 If I had toothache I’d rather take painkillers than go to the dentist
other 2.67 2.48 2.85
1.246 (2)
0.288
roofless 2.67 2.29 3.05
houseless 2.52 2.41 2.62
AA2 The worst part of going to the dentist is waiting for treatment
other 2.55 2.36 2.75
0.302 (2)
0.740
roofless 1.81 1.46 2.16
houseless 1.89 1.79 1.99
AA3 I don’t like lying flat in the dental chair
other 1.85 1.67 2.04
0.119 (2)
0.318
There were no significant differences demonstrable in mean Access Inhibition (AI1-AI6) and Access Anxiety (AA1-AA3) scores between Category of homelessness groups