
Choosing an organisational form: the case of collaborative procurement initiatives
Upload
khangminh22Category
view
0download
0
COLLABORATIVE PUBLIC PROCUREMENT AND
PERFORMANCE AMONG STATE CORPORATIONS IN
KENYA
BY:
NYANGWESO WILLIAM BORAYA
A Management Research Project submitted in partial fulfilment of the degree
of Master of Business Administration of the School of Business, University of
Nairobi.
NOVEMBER, 2013

ii
DECLARATION
This management research project is my original work and has not been presented for any
academic credit in this or any other university.
NYANGWESO WILLIAM BORAYA D61/63890/2011
Signed………………………………….. Date…………………….
This management research project has been submitted for examination with my approval as a
University Supervisor.
Signed………………………Date………… Signed…………………… Date…………
MR. P. MAGUTU AKELO E. O
Lecturer, Lecturer,
Department of Management Science, Department of Management Science,
School of Business, University of Nairobi. School of Business, University of Nairobi.

iii
ACKNOWLEDGEMENTS
I owe my gratitude to all the people who contributed tremendously towards the completion of
this Research Project. Special thanks go to my supervisors, Mr. P. Magutu and Akelo E.O for
their material and moral support. They are outstanding, easy to work with lectures with whom I
shared a fundamental outlook rather than differ considerably in their approach from the
beginning up to the end of the project.
It is a pleasure to acknowledge my elder brother, Fredrick Nyamweya for financing the entire
MBA program. In the same breadth, I appreciate the input of the rest of the Maisha Family.
Special thanks to my wife, Gladys Mumbi, for her patience, understanding and support during
the whole period of my studies. I extend my gratitude to my loyal friend and colleague, Mr. John
Mose for his material and moral support during the period. Special appreciation to Obat and
family for their encouragement and material support in the final stages of this paper.
Lastly to God for his love that endures forever.

iv
DEDICATION
This project is dedicated to my ailing mother, Philomena Osebe. Thank you for your prayers,
love and constant encouragement throughout the time. To my little angels; Melissa, Bridget and
Redemptor.

v
ABSTRACT
Against the backdrop of the immense challenges that have been facing state corporations since
independency, the government is pushing for public procurement reforms in a bid to ameliorate
their competitiveness. The study sought to establish the relationship between collaborative public
procurement and performance among state corporations in Kenya. A descriptive survey was used
to answer the research questions on the current status of the subject of the study and in reference
to the objectives of the study. The target population of the study was all the state corporations in
Kenya totaling two hundred and ten (210). A sample of 45 state corporations was taken out of
this sampling frame. Questionnaires were used to collect primary data from the respondents. The
data was quantitatively and qualitatively analyzed and presented as frequency and percentage
tables. The study found out that state corporations have adopted various collaborative public
procurement practices to enhance their competitiveness. This response has been necessitated by
the dynamic nature of the now liberalized market. The study focused on the following
collaborative public procurement practices: the agency’s involvement in information flow along
the supply chain; the agency’s is involvement in the exploitation of complementary skills; the
agency’s involvement in sharing in design process collaboratively; and the agency’s endeavor to
access capabilities crucial to its competitiveness. According to the study 78.9% of state
corporations have adopted collaborative public procurement strategies in tandem with the
government’s procurement policy. The regression analysis conducted revealed that various
collaborative public procurement strategies adopted by state corporations have not had a
significant impact on their performance over the last five years as indicated by the low
coefficient of multiple regression (0.200). This postulates that only 20% of the procurement
performance of the state corporations can be attributed to the collaborative public procurement
practices they have adopted. The study recommends that relevant authorities provide impetus to
encourage all the state corporations to participate in collaborative public procurement to tap into
the economies associated with collaborative procurement. According to the research there is
need for more investments into research in challenges facing collaborative public procurement
among state corporations in Kenya. The study was limited by cost and time.

vi
TABLE OF CONTENTS
DECLARATION......................................................................................................................................... ii
ACKNOWLEDGEMENTS ...................................................................................................................... iii
DEDICATION............................................................................................................................................ iv
ABSTRACT ................................................................................................................................................. v
TABLE OF CONTENTS .......................................................................................................................... vi
LIST OF TABLES ..................................................................................................................................... ix
LIST OF FIGURES .................................................................................................................................... x
CHAPTER ONE: INTRODUCTION ....................................................................................................... 1
1.1 Background ....................................................................................................................................... 1
1.1.1 Public Collaborative Procurement ............................................................................................... 2
1.1.2 Procurement Performance .......................................................................................................... 3
1.1.3 State Corporations in Kenya ........................................................................................................ 4
1.2 Statement of the Problem .................................................................................................................... 5
1.3 Research Objectives ............................................................................................................................ 7
1.4 Value of the study ............................................................................................................................... 7
CHAPTER TWO: LITERATURE REVIEW ...................................................................................... 8
2.1 Introduction ....................................................................................................................................... 8
2.2 Public Collaborative Procurement .................................................................................................. 8
2.3 Benefits of Collaborative Public Procurement ............................................................................... 9
2.3.1 Increased Procurement effectiveness in the Supply chain .......................................................... 9
2.3.2 Increased Efficiency in the Procurement Process ...................................................................... 10
2.3.3 Access to Resources in the Supply Chain ................................................................................... 10
2.3.4 Coordination and Seamless learning along the Supply Chain.................................................... 11
2.4 Critical Success Factors in the Implementation of Public Collaborative Procurement ........... 11
2.4.1 Investments in Relation-Specific Assets ..................................................................................... 12
2.4.2 Knowledge-Sharing Routines ..................................................................................................... 13

vii
2.4.3 Complementary Resources/ Capabilities ................................................................................... 13
2.4.4 Effective Governance ................................................................................................................. 14
2.5 Procurement Performance ............................................................................................................. 15
2.5.1 Measures of Procurement performance ................................................................................... 16
2.6 Summary of Literature Review ..................................................................................................... 17
2.6.1 Conceptual Frame work of the study ......................................................................................... 18
CHAPTER THREE: RESEARCH METHODOLOGY........................................................................ 20
3.1 Introduction ....................................................................................................................................... 20
3.2 Research Design ................................................................................................................................ 20
3.3 Population and Sample Size .............................................................................................................. 20
3.4 Data Collection ................................................................................................................................. 20
3.5 Data Analysis .................................................................................................................................... 21
CHAPTER FOUR: DATA ANALYSIS, FINDINGS AND DISCUSSIONS ....................................... 22
4.1 Introduction ..................................................................................................................................... 22
4.2 Demographic Information .............................................................................................................. 22
4.2.1 The age of the state corporations .............................................................................................. 22
4.2.2 The Ministry/Sector under which the state corporations fall ................................................... 23
4.2.3 Participation in Collaborative Procurement .............................................................................. 24
4.3 Collaborative Public Procurement ................................................................................................ 25
4.3.1 Collaborative Practices ............................................................................................................... 26
4.3.2 Benefits of Collaborative Procurement ..................................................................................... 31
4.3.3 Critical success Factors in the implementation of Collaborative Public Procurement .............. 35
4.3.4 Procurement Performance of State Corporations ..................................................................... 40
4.4 The relationship between Collaborative Public Procurement and performance ...................... 43
4.4.1 Establishing the link between collaborative procurement and performance ........................... 43
CHAPTER FIVE : SUMMARY, CONCLUSIONS AND RECOMMENDATIONS ......................... 48
5.1 Introduction ....................................................................................................................................... 48
5.2 Summary of the findings ................................................................................................................... 48
viii
5.3 Conclusion ........................................................................................................................................ 49
5.4 Recommendations ............................................................................................................................. 50
5.5 Limitations of the study .................................................................................................................... 50
5.6 Suggestions for further Research ...................................................................................................... 50
REFERENCES .......................................................................................................................................... 51
APPENDIX I: Letter of Introduction .................................................................................................... 53
APPENDIX – II: The Questionnaire ...................................................................................................... 54
APPENDIX- III: State Corporations in Kenya ..................................................................................... 59

ix
LIST OF TABLES
Table 4.1 The age of the state corporations ................................................................................... 22
Table4.2 Distribution of the state corporations ............................................................................. 24
Table 4.3 Participation in Collaborative Procurement .................................................................... 25
Table 4.4 Collaborative practices .................................................................................................... 26
Table 4.5 Collaborative practices standard variances .................................................................... 28
Table 4.6 Collaborative practices - Principal Component Analysis ................................................. 29
Table 4.7 Benefits of collaborative practices .................................................................................. 31
Table 4.8 Benefits of collaborative public procurement - Component Matrixa ............................. 33
Table 4.9: Benefits of Collaborative procurement - Variance ........................................................ 34
Table 4.10 Critical success factors – Descriptive analysis ............................................................... 36
Table 4.11 Critical success factors - Component Matrixa................................................................ 38
Table 4.12 Critical success factors -Total Variance ......................................................................... 39
Table 4.13 Average Procurement Performance ............................................................................. 41
Table 4.14 Model Summaryb ........................................................................................................... 44
Table 4.15 ANOVAb ........................................................................................................................ 44
Table 4.16 Collaborative procurement – model Coefficientsa ........................................................ 45

x
LIST OF FIGURES
Figure 1: Conceptual model of the study ...................................................................................... 19
Figure 2 Scree plot ........................................................................................................................ 30
Figure 3 Average Procurement Performance……………………………………………….…....42
1
CHAPTER ONE:
INTRODUCTION
1.1 Background
The procurement function directly affects corporate competitiveness and the company’s ability
to innovate and develop competitive advantages. The purchasing function contributes in a
significant way to company performance and competitive advantage, not only due to its capacity
to reduce costs, but also as a tactical function that needs to adjust itself to changes in the market
and to contribute to innovation (Albrecht et al., 2005). An efficient procurement process is
essential to the success of government’s programmes; it provides the link between policy and
delivery. Thus, getting procurement right is a greater priority now for government than it has
been in the past.
Forming collaborative procurement arrangements is an increasing trend in purchasing and supply
(Carter et al., 2000; Walker et al., 2003). As the number of purchasing departments increases
more information becomes available which help reduce uncertainty. Thus the degree of lateral
involvement in purchasing increases, as the purchase process becomes less uncertain and risky
(Dawes et al., 1992). Firms working together in a supply chain pool their talents, skills, and
resources to achieve higher levels of market and financial performance than possible without
such unity in their actions (Kim et al., 2006; Wu et al., 2006).
Lack of collaborative supply chains and mechanisms for supply chain performance improvement
has been the main obstacle in public procurement in Kenya and the developing world at large.
One of the ways in which governments try to reduce system inefficiencies is by stimulating
and/or enforcing more collaborative public procurement. This means that many public
organizations are increasingly encouraged to pool or share purchasing volumes, information,
and/ or resources (Schotanus et al., 2011). In this context collaborative and integrated supply
chain practices in public procurement has provided the main avenue for procurement reforms
over the last two decades. This explains the emergence of a new organizational structure for
public procurement; that of procurement as a shared service.

2
1.1.1 Public Collaborative Procurement
According to Weele (2010), procurement is the acquisition of goods or services. It entails the
steps that are used in the acquisition of goods and services and it is the most significant aspect
characterizing an organization’s supply chain as well as the aspect of supply chain management
which provides some of the most value-added benefits to the organization. Collaborative public
procurement is about achieving value for money for the public sector through partnership
working between buying organisations, Centres of Expertise (CoEs) and suppliers. Collaborative
procurement draws on expertise across the public sector to leverage volumes and secure benefits
from economies of scale through harnessing combined sector purchasing power (Scottish
Government, 2013).
Dyer and Singh (1998) adopts a relational perspective which assumes that the sources of
competitive advantage may span firm boundaries, just as interdisciplinary and cross-functional
strengths lead to a competitive advantage within the firm. They further argue that inter-firm
networks may be more efficient arrangements for achieving a resource-based advantage than
single firms. In public collaborative procurement, the concept of competitive advantage is
substituted with that of relational rent. The concept of relational rent is defined as an advantage
generated collaboratively in an exchange relationship that cannot be generated by either
organization in isolation and can be created only through the joint idiosyncratic contributions of
the specific collaborating organizations (Walker et al., 2013).
According to Dyer and Singh (1998), Critical Success Factors (enablers) in the implementation
of collaborative public procurement include: Investments in relation-specific assets; Substantial
knowledge exchange including exchange that results in joint learning; Combining
complementary but scarce resources or capabilities, which results in the joint creation of unique
new products, services, and/or technologies; and Effective governance mechanisms resulting in
lower transaction Costs. Walker et al., (2013) argue that organizations may benefit more by
collaboration than by acting alone because of economies of scale, process, and/or information.
Collaboration may reduce waste in the procurement system, achieve better outcomes for
taxpayers, and, hence, improve the overall socioeconomic position. Specific benefits of

3
Collaborative public procurement include: increased efficiency (Parker and Hartley, 1997);
access to resources (Al-Kahlifa et.al, 1999) and coordination and seamless learning (Greer,
2002).
Two primary motives for collaboration have been recognized: the improvement of effectiveness
and efficiency (Jost et al., 2005). For the first, collaboration is sought when single organizations
do not have the knowledge, resources or capabilities. The second is about realizing economies of
scale, reduced transaction costs, better development of products/services, or accessing markets
and/or technologies, etc (Leenders and Fearon , 1997; Johnson, 1999).
1.1.2 Procurement Performance
Procurement performance involves measuring and evaluating: quality, effectiveness, and
efficiency by using output and outcome indicators. Purchasing performance can be considered as
the extent to which the purchasing function is able to realize its predetermined goals at the
sacrifice of a minimum of the organization’s resources. Hence, the four dimensions which
measurement and evaluation of purchasing activities can be based on are: a price/cost dimension;
a product/quality dimension; a logistics dimension and an organization dimension (Cavinato and
Kauffman, 1999).
In order for an organization to achieve its goals to satisfy its customers, the two most
fundamental dimensions of performance are efficiency and effectiveness. According to them,
efficiency measures how successfully the inputs have been transformed into outputs while,
effectiveness measures how successfully the system achieves its desired output (Kotter, 1978).
Measurement areas of purchasing Efficiency include: Purchasing organization structure e.g.
personnel, management, procedures and policies and information system. In order to measure
procurement performance, three main considerations are proposed: representation of the supply
link; efficiency of the supply link and effectiveness of the supply link. The representation of the
supply link is described in terms of its environment and structure, and what activities and flows
take place in the supply link. Finally, generic performance indicators of the supply link in terms

4
of time, quality, flexibility and cost are used to measure efficiency and effectiveness. The
efficiency in the supply link explains how well the resources are utilized. The effectiveness of
the supply link explains how well the objectives are achieved (Kumar et al., 2005).
1.1.3 State Corporations in Kenya
A State Corporation is a legal entity created by the government to undertake commercial
activities on its behalf. In Kenya there are two hundred and ten state corporations which fall
under established ministries in which they work collaboratively to achieve the overall goals of
the respective ministries. The volume of public procurement was established at 3.64 billion USD
which was approximately 9% of the GDP (Independent Procurement Review Kenya, May 2005).
Procurement in the state corporations is governed by the Public Procurement and Disposal Act
2005 and the Public Procurement and Disposal Regulations 2006 which facilitates the
standardization of procurement practices across all procuring entities in Kenya (Public
Procurement and Disposal General Manual, 2009).
The Public Procurement Oversight Authority (PPOA) is charged with the responsibility of
oversight and regulation of public procurement. According to Erridge and Greer (2002), pursuit
of regulatory goals is directed towards ensuring that procurement activities and contracts meet
the requirements of propriety and transparency thus encouraging a risk avoidance culture in
respect of transparency. Procurement in Kenya’s State corporations has been dogged by;
corruption, political patronage, procurement system inefficiency, lack of sound procurement
policy guidelines and lack of a genuinely open and competitive system of procurement amongst
other shortcomings.
Collaborative public procurement among state corporations may encounter significant barriers.
Two categories of organizational integration barriers: specialization barriers; and political
barriers. Specialization may be a barrier due to different perspectives concerning goals or frame
of reference differences among organizational units, and political barriers can create conflicts

5
and power misaligned goals and objectives, poor information systems, short-term as opposed to
long-term focus, and supply chain complexity issues (Barki and Pinsonneault, 2005).
A collaborative approach in public procurement will address the following key issues: promotion
of sound public finance management in general and sound procurement practice in particular;
promotion of transparency and accountability and the reduction of corruption incidences in
public procurement practices; encourage the embracing of planning in public procurement and
budgeting; selection of the correct method of procurement and adherence to the prerequisite
control procedures (Public Procurement and Disposal General Manual,2009).
1.2 Statement of the Problem
The focus of the collaborative public procurement reforms in tandem with project management
practice has traditionally been to identify and search for new and better methods for fulfilling
two primary objectives: to meet specified performance within cost and on time (Meredith and
Mantel, 2002) and achieve one contentious objective of eradicating corruption in procurement
process (Mawenya, 2008).
State corporations play a critical role in service delivery. They are both service and commercial
agencies through which the government delivers certain services and generate revenues. Cost
effectiveness through public procurement is important in this endeavor and their operations. The
Public Procurement and Disposal Act, 2005 is a new phenomenon hence the need to check on
how collaborative procurement can be used to improve the agencies ‘procurement performance.
A number of studies have been carried out on collaborative public procurement. Murray and
Geere (2008), in their study found out that; procurement as a shared service is an additional
structural option for public procurement. They further argue that procurement as a shared service
has the potential to maximize the benefits of both the intra-organizational hard core/soft core
model and inter- organizational consortia participation. Their study however, falls short of
establishing the link between collaborative public procurement and performance hence the
current study.

6
Schotanus et al. (2011) in their study found out that many public organizations are increasingly
encouraged to pool or share purchasing volumes, information, and/ or resources. However, while
there is a policy imperative for collaborative Procurement, public organizations often experience
difficulties in forging and sustaining inter-organizational relationships in the form of purchasing
collaborations. While they appreciate the presence of barriers to collaborative procurement, they
fail to establish any solutions to overcoming the barriers. By establishing the impact of
collaborative public procurement, this study will provide a vital approach to eradicating barriers
to procurement integration hence procurement performance.
Simiyu (2011) in his study found out that lack of inbuilt incentive mechanisms for procurement
officials has increased the divergence between the interests of procurement officials (as agents of
government) and the goals of the government (the principal). The study therefore does not offer
any option to mitigate the said problem. The current studies postulate the option of collaborative
public procurement as a remedy to narrowing the gap between the goals of government and
procuring entities and ultimately enhance procurement performance.
Hassan (2012) found out that while state corporations have put significant efforts in
implementing public procurement reforms, they are unable to address the issue of risk
management in the procurement process. His study thus fails to explore ways of managing risk in
the public procurement process. This study will use risk management as an indicator in
collaborative public procurement while testing its effects on procurement performance.
While past studies have unraveled the impact of sound public procurement policy, most of them
have not exhaustively investigated the impact of collaborative public procurement on public
procurement performance improvement. It is against this backdrop that this study set to establish
the link between collaborative public procurement and performance among state corporations in
Kenya.

7
The study sought to answer the following questions: What are the benefits of using public
collaborative procurement among state corporations in Kenya?; What are the critical success
factors in the implementation of public collaborative procurement in state corporations in
Kenya?; What is the relationship between collaborative public procurement and performance
among state corporations in Kenya?
1.3 Research Objectives
The objectives of the study were;
1. To determine the benefits of Collaborative public procurement among state corporations
in Kenya.
2. To determine the critical success factors in the implementation of collaborative public
procurement among state corporations in Kenya; and
3. To establish the relationship between collaborative public procurement and performance
among state corporations in Kenya
1.4 Value of the study
The findings of the study will be of importance to policy makers and stakeholders in the public
procurement supply chain in Kenya. By establishing the relationship between collaborative
public procurement and performance, the findings of the study will be a key ingredient in the;
planning, designing and implementation of a sound public procurement system that will align
itself to the overall economic strategy.
The study addressed output indicators that can be used in measuring and evaluating the quality,
efficiency, and effectiveness of the award and administration activities of a procuring entity both
in public or private. In this context it will equally benefit private enterprises that are interested in
building sound procurement practices. The study will fill the existing literature gap on the impact
of collaborative public procurement on performance among state corporations in Kenya. Thus
the findings of the study will be beneficial to future researchers.

8
CHAPTER TWO:
LITERATURE REVIEW
2.1 Introduction
This chapter reviews theoretical and empirical literature from past studies on the subject of
collaborative public procurement. The chapter focuses on the following issues: collaborative
public procurement; benefits of collaborative public procurement; critical success factors in the
implementation of collaborative public procurement and procurement performance.
2.2 Public Collaborative Procurement
McClellan (2003) refers to supply chain collaboration as a win-win arrangement that is likely to
provide improved business success for both parties. It may even be considered a pre-requisite for
future competitive performance. Through the governance of integration, the supply chain
becomes a network where a series of relationships form to ensure that the end customer receives
value from efficient and effective processes that deliver the best products and service to market
(Fawcett and Magnan, 2004).
The objective of integration is to achieve operational efficiencies and strategic effectiveness in
the supply chain through collaboration. Achieving this objective requires purposeful
commitment and coordination with another firm’s functional areas and processes (Stank et al.,
2001). In other words, external interdependencies must be realized while, at the same time, firms
strive to protect internal self-interest.
Supply chain collaboration involves integrating cross-functional business processes within a
firm, as well as integrating processes among key members of the supply chain (Lambert et al.,
2005).Selenandand Soliman (2002); and Langabeer (2001), argue that Procurement collaboration
is considered an essential part of demand chain management. Supply chain collaboration calls for
an extension of the view of operations from a single business unit or a company to the whole
chain (Vollmann et al., 2000). Thus from this perspective, supply chain collaboration involves

9
integrating the real demand or customer perspective into supply chain thinking and requires a
more holistic approach.
2.3 Benefits of Collaborative Public Procurement
According to Jost et al. (2005), there are two main advantages to collaboration. The first is
increased effectiveness through learning from each other and a better use of resources. As
purchasing is evolving into a more strategic function (Reck and Long, 1988) and demands more
strategic skills, collaboration can be a way of accessing these skills or freeing up resources to
develop them. The second main advantage is an improved efficiency through reduction of
transaction costs and increased economies of scale through bundling of purchasing volumes
(Leenders and Fearon, 1997; Johnson, 1999).
2.3.1 Increased Procurement effectiveness in the Supply chain
Effectiveness measures how successfully the system achieves its desired output. Effectiveness
can be achieved through learning from each other and sharing of skills which leads to rational
use of resources. Macbeth and Ferguson (1994) empirically examined partnering by associating
with a number of collaborative activities such as shared design processes, open book costing,
interchange of staff and involvement in joint improvement projects. Cannon and Perrault (1999)
provide a descriptive categorization of such collaborative activities, including information
exchange on products and processes, the creation of operational linkages, the development of
cooperative norms through trust-building events, and investments in relationship-specific
adaptations to products and processes.
Bounded rationality is rational decision making by buyers and sellers, but under conditions of
uncertainty and therefore imperfect or asymmetric information. Opportunism is the incomplete
or distorted disclosure of information and self-interest seeking with guile (Williamson1983). A
combination of bounded rationality, uncertainty, and opportunism can result in a situation in
which one party has more complete information than their opposite number about the nature of
an exchange and is able to exploit that information advantage to earn a greater share of the gains

10
from trade. Collaboration is deemed to be the most cost efficient solution in these circumstances.
It gives the buyer access to the economies of scale and scope associated with external supplier
selection, but not available under hierarchy (Williamson 1985).
2.3.2 Increased Efficiency in the Procurement Process
Efficiency measures how successfully the inputs have been transformed into outputs. According
to the empirical findings of Parker and Hartley (1997), the concept of surplus value, is
synonymous with the notion of welfare gains from trade. In an arm’s length relationship the
available surplus value is fixed, but in a collaborative arrangement there is an expectation that
the surplus will increase, either through a reduction in the supplier’s costs or an increase in the
buyer’s utility function.
Discussions of the benefits of partnering are often framed in terms of transaction cost reasoning.
Powell (1990); Williamson and Winters (1993) asserts that, partnering provides the best means
of economizing on transaction costs. Sharing tasks in the form of lead-buying or sharing
resources in the form of shared services can be chosen when uncertainty is low (dealing with
standard products), frequency of demand is high and benefits are unclear. Setting up a separate
organization would be inappropriate due to costs. Maloni and Benton,2000; Richey et al.(2007)
empirically found that: Collaborative planning, reduced inventories, lower distribution and
transportation costs, improved cycle times, and customer service levels, are positive outcomes of
properly governed relational integration.
2.3.3 Access to Resources in the Supply Chain
Forging external collaborations becomes a viable strategy to compete in a dynamic global
environment (Al-Khalifa and Peterson, 1999; Morgan and Hunt, 1994; Simonin and Ruth, 1998)
as it can increase a firm’s capability-based efficiency through resource pooling, exploitation of
complementary skills, and information sharing.
Previous empirical research shows that external integration has positive impact on supply chain
performance. Kraljic (1983) argues from a Resource based view of the firm perspective.

11
According to him, third parties can be used for routine and leverage items. In this case a third
party can be used when at a local level skills and capabilities do not need to be developed for that
specific category of products or services.
(Walker and Weber, 1984; Parker and Hartley, 2003) suggests that organizations make sourcing
decisions both on the basis of their capability endowments and needs and on transaction cost and
scale considerations. Foss and Robertson (2000) concur by introducing the notion of capabilities,
drawn from the resource-based view of strategy. According to them, partnering can be driven as
much by a desire to gain privileged access to capabilities crucial to organizational performance
or competitiveness as by a concern to economize on transaction costs.
2.3.4 Coordination and Seamless learning along the Supply Chain
Collaborative procurement facilitates the development of reputation and trust, which allow a
more effective flow of information between buyer and supplier and act as a form of social capital
(Sako, 1992; Erridge and Greer, 2002).Coordination and seamless learning leads to faster and
better targeted product innovation driven by more effective learning and more extensive
knowledge sharing at the design stage (Boddyet al., 1998; Dyer and Nobeoka, 2000; Bessant,
2004).Coordination equally leads to enhanced flexibility and responsiveness to changes in
customer demand through a reduction in production and distribution lead times (Towill, 1996;
Mason-Jones and Towill, 1999; Christopher, 2000).
2.4 Critical Success Factors in the Implementation of Public Collaborative
Procurement
According to Dyer and Singh (1998), Critical Success Factors (enablers) in the implementation
of collaborative public procurement include: Investments in relation-specific assets; Substantial
knowledge exchange including exchange that results in joint learning; Combining
complementary but scarce resources or capabilities, which results in the joint creation of unique

12
new products, services, and/or technologies; and Effective governance mechanisms resulting in
lower transaction Costs.
The facilitators of integration embody governance mechanisms that allow partners to
communicate operational and strategic needs in order to ensure consistent supply chain
efficiency while satisfying customers’ needs at a high level. Empirical findings by Frazier,
(1999); and Heide, (1994) postulate Facilitators of Integration as having five organizational
Dimensions: Aligned; Communicative; Structured; Quantified; and Interdependent
2.4.1 Investments in Relation-Specific Assets
Effective collaboration requires a high degree of commitment and trust between members
(Doucette, 1997; Schotanus et al., 2010).At the organizational level, trust refers to the extent to
which organizational members have a collectively held trust orientation towards the partner firm
(Zaheer et al., 1998). This construct is regarded as more important than the other forms of trust
(e.g. interpersonal trust) as a salient factor for the success of supply chain relationships.
In inter-firm exchanges, trust creates an environment where firms strive to exceed the minimum
requirements of a relationship to increase the likelihood of mutual benefits (Panayides and Lun,
2009).
Being Interdependent is normally referred to as having a degree of influence on the other partner
firm’s attitudes and behavior (Frazier, 1999; Heide, 1994). Researchers in strategy and inter-
organizational relationships have provided extensive study of interdependence as a way of
fostering and maintaining relationships (Anderson and Narus, 1990; O’Donnell, 2000).
Interdependent strategy and processes make activities more efficient and effective and spread
risks across firms. Here the goal is to create a win-win relationship. Indicators of being
interdependent suggest the importance of the implementation of cross functional processes, the
spending of resources to train employees regarding supply chain practices, the development of

13
cross-functional teams, and the inclusion of software to formalize interdependence. The
inclusion of these issues may assist in increasing the strength of the firms’ interdependence, and
thus foster better relational integration (Golicic and Mentzer, 2005).
2.4.2 Knowledge-Sharing Routines
Cooperation and communication is critical in collaborative procurement. This approach leads to
better understanding through collective learning (Tella and Virolainen, 2005; Schotanus et al.,
and Boer, 2010).Being Communicative represents the degree to which the organizations expect
and engage in information sharing. A communicative approach strongly supports inter-firm
relationships in supply chains and the growth of technological tools has increased the importance
of being communicative (Jap and Mohr, 2002).
Effective communication fosters the flow of information between channel partners and
counteracts the potential negative impacts of information safeguarding. For information to be
communicated effectively across business partners, firms must formally recognize the
importance of sharing technical expertise with customers and suppliers. This expertise represents
a capability that can be transferred across firms, forming a transaction-specific resource
investment that helps foster a relational governance bond (Barney, 1991; Olavarrieta and
Ellinger, 1997).At a structural level, information exchange is embedded in standardized systems
geared towards process integration. Ultimately, Proactive collaboration is achieved through joint
planning and synchronization of business processes (Jagdev and Thoben, 2001).
2.4.3 Complementary Resources/ Capabilities
Organizations involved in collaborative procurement need to acquire and maintain appropriate
resources like; training, IT, etc. (Erridge and Greer, 2002). Another key undertaking is the
sharing of Complementary expertise, skills, and resources. I addition the members should
establish standardized procedures and processes while encouraging joint selection of goods and
services (Erridge and Greer, 2002; Essig, 2000).

14
Structured is examined in Transaction Cost Economics as an attempt to create a firm-specific
linkage with the hope of buying market based capabilities (Williamson, 1981). Formation of
relationships foster resource and process complementarity (Mouritsen and Thrane, 2006). In a
supply chain perspective, firms must find ways to share risks and rewards, develop strategies to
reduce the costs of interactivity, and develop normative guidelines for managing and selecting
their partners (Mentzer et al., 2001; Sha and Che, 2006).
2.4.4 Effective Governance
Effective governance calls for top management support from each of the stakeholders. The
members must also operate on agreed goals and performance measures while implementing
appropriate structures to foster collaboration (Nollet and Beaulieu, 2003; Telgen and Boer,
2010). Thus, the members need to be aligned. Being aligned refers to the development and
governance of roles and responsibilities across supply chain members (Simatupang and
Sridharan, 2005). Alignments manifest in strategic initiatives like co-managed inventory and
vendor managed inventory (VMI) (Holmstrom, 1998; Lee et al., 1997). In a strategic sense,
alignment includes the development of goals directing co-performance evaluation, process
improvement, and incentive sharing (Simatupang and Sridharan, 2005).
Such initiatives require a clear mission statement, common goals among supply chain members,
and common operating procedures among supply chain members. The importance of being
aligned is evident in the growth of collaborative planning systems or specifically, Collaborative
Planning for Forecasting and Replenishment (CPFR). Being aligned is essential to relational
collaboration as it creates system interconnectivity that fosters cohesion between the supply
chain members (Piplani and Fu, 2005).
Quantified is referred to as expressing a numerical amount for a given task or process (Massy
and Frank, 1965; Metters, 1997). Metrics related to this quantifying dimension are associated
with the adoption of consistent performance measures, as well as the involvement of cross
channel teams in moving from internal to supply chain perspectives (Lambert and Pohlen, 2001).

15
Swink, 2004).Halal (1977)suggests that Quantified outcomes let partner firms know where they
stand, helps foster responsibility, and make it easier to assign equitable rewards across the
extended enterprise. Lusch and Brown (1996) concur with the above notion by arguing that
being quantified can help foster the governance of integration.
2.5 Procurement Performance
Kotter, (1978); Neely, (1999) argues that, in order for an organization to achieve its goals to
satisfy its customer, the two most fundamental dimensions of performance are efficiency and
effectiveness. Efficiency measures how successfully the inputs have been transformed into
outputs while, Effectiveness measures how successfully the system achieves its desired output.
According to Van Weele (2000) and Knudsen (1999), the performance measurement system
must span the same part of the supply chain that the purchasing department has control over.
This part of the supply chain, spanning from suppliers to internal customers, is labeled the supply
link. The supply link consists of three main actors: Suppliers, the purchasing department and the
internal customer / users.
Van Weele (2000) and Knudsen (1999) categorize purchasing measurement areas into two: those
that are derived from purchasing effectiveness; and purchasing efficiency. Measurement areas of
purchasing Effectiveness include: Purchasing material cost/prices e.g. material price/cost;
Quality measures e.g. purchasing pre-design involvement and purchasing post-design measures;
Purchasing Logistics measures e.g. adequate requisitioning, order inventory policy, and supplier
delivery reliability.
Measurement areas of purchasing Efficiency include: Purchasing organization structure e.g.
personnel, management, procedures and policies and information system. In order to measure
procurement performance, three main considerations are proposed: representation of the supply
link; efficiency of the supply link and effectiveness of the supply link. The representation of the
supply link is described in terms of its environment and structure, and what activities and flows
take place in the supply link. Finally, generic performance indicators of the supply link in terms

16
of time, quality, flexibility and cost are used to measure efficiency and effectiveness. The
efficiency in the supply link explains how well the resources are utilized. The effectiveness of
the supply link explains how well the objectives are achieved (Kumar et al., 2005).
2.5.1 Measures of Procurement performance
Kumal et al., (2005) combines the three components in the supply link collectively with the
resources, procedures and output, to develop a procurement performance measurement model.
The Components of measurement model include: Generic measures like: - the measurements of
resources utilization (efficiency) and the degree of fulfilled objectives (effectiveness) are carried
out in areas like time, quality, costs and flexibility; Environment & structure: - which has to do
with the description of internal customer, suppliers and the purchasing department; and
Procedures: - Which measures activities and objective flows of processes. Objectives must be
closely aligned with the strategies of the organizations.
This model allows a study of the interactions among the measures and ensures that a minimum
level of performance is achieved in the different areas. The measurement dimensions can be
divided into: a description of the structure of the individual components in the supply link; a
description of the guidelines to collect the data and the activities and flow of the purchasing
department; and a measurement part comprising the generic measures to measure the varying
dimensions of the procedures and their output. The relationships between the individual
components of the supply links are also taken into consideration through measurement of the
purchasing process and activities.
Kumar et al. (2005) proposes an expanded balanced scorecard model in establishing a set of the
specific generic measures. The Proposed balanced scorecard has six perspectives including:
customer; supplier; Process; IT system; learning & growth; and Overall. In the Customer
perspective the outcome includes: Percentage of line items on back order to total line items
(Average number of items on backorder/total number of line items); Cost per order per customer;
and effectiveness of ordering time (Total expenditure of the department/Total IRF received);

17
Effectiveness of ordering time (Actual average cycle time/targeted average cycle time).The
outcomes in Supplier perspective Include: Quality of delivery (Number of reject or early or late
shipments/Total number of items delivered); Cost per order to suppliers (total expenditure of the
department/ Total number of purchases); Effectiveness of delivery time (Actual average cycle
time/Targeted cycle time); supplier evaluation (Number of supplier evaluations that meet
objectives/ Total number of evaluations).
In the Process perspective the outcomes include: Solvability rate (No. of cases solved within 6o
days/No. of cases reported); Stock take discrepancy (Total variance / total stock value); Supply
chain costs (Total expenditure of department / Total purchase value); Effectiveness of process
time (Actual average of cycle time / Targeted average cycle time); GPO participation rate (No. of
items under GPO/Total No. of items); requisition completion rate (No. of IRFs completed/ No.
of IRFs received). Outcomes in the IT perspective include: Efficiency of IT system (No. of IRFs
/ No of employees handling the system); Effectiveness of the IT system (Total number of
projects, policies or procedures / no. of hours in operation).In the Learning and growth
Perspective the outcomes include: Training utilization rate (No. of places utilized / Number of
planned training); employee engagement index (No. of participants in the engagement survey/
Total No. of employees in the department).Outcomes in the overall perspective include:
Effectiveness of the department (Total expenditure of the department/ Total budget of the
department).
2.6 Summary of Literature Review
The ensuing research is based on a summary of the literature thus presented. Much of the review
considers empirical works published in academic journals from 1990 to 2013. The review started
by looking at the theoretical perspective of Collaborative Public Procurement and the benefits of
Collaborative public procurement based on past empirical studies. It then presented divergent
Critical Success Factors in the implementation of Collaborative public procurement and finally
provided an overview of the empirical findings on the impact of collaborative public
procurement on performance.

18
Empirical outcomes of past studies support the idea that public organizations can enhance their
procurement performance through collaborative procurement under the governance of facilitators
to integration, in spite of the realization that barriers to integration also exist. Most of the studies
have however not exhaustively investigated the relationship between Collaborative public
procurement and performance. The study therefore aimed at filling this literature gap by
establishing the link between collaborative public procurement and performance among state
corporations in Kenya.
2.6.1 Conceptual Frame work of the study
The figure below is a conceptual framework showing the relationship between independent
variables and the dependent variable. The independent variables in the model included the
following collaborative public procurement practices: The agency’s involvement in sharing of
design process collaboratively; the agency’s is involvement in the exploitation of complementary
skills; the agency’s endeavor to access capabilities crucial to its competitiveness; and the
agency’s involvement in information flow along the supply chain. The dependent variable was
procurement performance. The conceptual model of the study is shown in Figure 1.0 below

19
Figure 1: Conceptual model of the study
Source: Researcher (2013)
The agency’s
involvement in
sharing of design
processes
collaboratively
The agency’s is
involvement in the
exploitation of
complementary
skills
complementary
skills The agency’s
endeavor to access
capabilities crucial to
its competitiveness
The agency’s
involvement in
information flow along
the supply chain.
Public Procurement
Performance

20
CHAPTER THREE:
RESEARCH METHODOLOGY
3.1 Introduction
This chapter introduces the logical framework followed in the process of conducting the study. It
is divided into: research design, population and sample, data collection and data analysis.
3.2 Research Design
The study adopted a descriptive survey design. A descriptive survey enabled the researcher to
obtain large amounts of data from a sizable population in a highly effective, easy and in an
economical way using questionnaires. In addition, a descriptive survey enabled the researcher
obtain quantitative data which he can analyse using descriptive and inferential statistics
(Saunders et al., 2002).
3.3 Population and Sample Size
The target population included all the state corporations in Kenya. There are 210 state
corporations in Kenya out of which a purposive sample of 18% was be taken for the study based
on time and cost considerations. Thus out of the 210 state corporations, a sample of 45
corporations was taken for the study. According to Mugenda and Mugenda (2003), a
representative sample is one which is at least 10% of the population thus the choice of 21.4% is
considered as representative.The respondents in the study were the procurement managers of the
state corporations.
3.4 Data Collection
Primary data was used in this study. The primary data was collected using a semi-structured
questionnaire subdivided into two parts. Part 1 consisted of open-ended questions aimed at
obtaining general information on the corporation while Part 2 consisted of questions aimed at
obtaining data on procurement performance.

21
3.5 Data Analysis
Descriptive statistics was used to describe (and analyse) the variables numerically. These
included: simple means; standard deviations regression and correlation analysis by use of SPSS
version 22 while factor analysis was applied to check on the categorization of the collaborative
practices in state corporations. A multivariate regression model was used to analyse the
relationship between collaborative public procurement and performance.
The multiple regression model was computed as follows;
Y = β0 + β1X1 + β2X2 + β3X3 + β4X4 + ε
Where;
Y = Procurement Performance
β0= Constant
β1, β2, β3, β4 = Coefficients of determination
X1 = Sharing in the design process collaboratively
X2 = Involvement in exploitation of complementary skills
X3 = Endeavor to Access capabilities crucial to competitiveness
X4 = Involvement in information flow along the supply chain
ε = Random error

22
CHAPTER FOUR:
DATA ANALYSIS, FINDINGS AND DISCUSSIONS
4.1 Introduction
Data on the collaborative procurement practices adopted by state corporations in Kenya in their
quest to enhance performance was analysed. The demographic data was examined using
descriptive statistics and summarized in various frequency tables. With the help of SPSS
statistical software, data on the collaborative public procurement practices adopted and their
impact on the performance of the respective state corporations was analysed using; mean scores,
standard deviations, coefficients of variation and regression analysis. The factors were ranked in
order of importance, the correlation between them yielded the key factors that loaded most on the
components and therefore had the greatest impact on procurement performance. Forty-five (45)
questionnaires were administered to the selected commercial state corporations in Nairobi. Thirty
eight (38) of these questionnaires were returned representing a response rate of 84.4 per cent.
The analysis, findings, and discussion are presented below.
4.2 Demographic Information
The demographic characteristics of the respondents that were tested include age and sector under
which the state corporations fall and whether the respective corporations have participated in
collaborative public procurement.
4.2.1 The age of the state corporations
The number of years an organization has been operating determines its readiness to participate
collaborative public procurement. The study sought to determine the number of years that the
various commercial state corporations have been in existence, the results are shown in Table 4.1
Table 4.1 The age of the state corporations

23
Age Frequency Percentage
Less than 10 years 3 9.375
11 - 20 years 5 15.625
21 - 30 years 11 34.375
31 - 40 years 7 21.875
over 50 years 6 18.75
Total 32 100
Source: Author (2013)
It is shown in Table 4.1 that over 80% of state corporations in Kenya have been in existence for
over 10 years with only 9.4 % being in existence for less than ten years. This implies that most
of the state corporations that participate in collaborative public procurement have enough
experience in collaborative public procurement and other related issues under study. This is in
support of Hassan (2012) who conducted a study on public procurement practices among state
corporations. He found out that there exists a near perfect positive correlation between the age of
state corporations and their tendency to adopt competitive strategies including collaborative
procurement.
4.2.2 The Ministry/Sector under which the state corporations fall
The distribution of state corporations in Kenya has been traditionally influenced by the economic
potential of the various sectors of the economy. Thus different sectors contribute to the National
gross domestic product proportionate to their economic potential. The study sought to determine
the spread of state corporations across the sectors in Kenya. The respondents were required to
indicate the economic sector under which their corporations fall. The results are shown in Table
4.2.
24
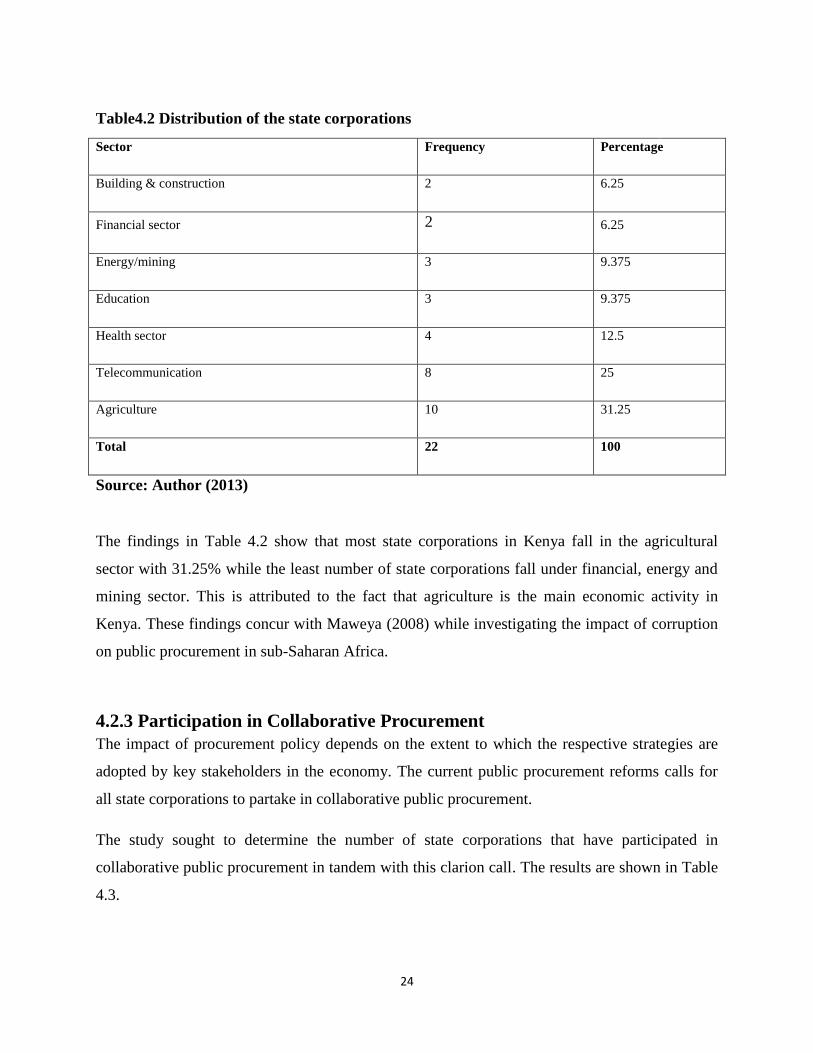
Table4.2 Distribution of the state corporations
Sector Frequency Percentage
Building & construction 2 6.25
Financial sector 2 6.25
Energy/mining 3 9.375
Education 3 9.375
Health sector 4 12.5
Telecommunication 8 25
Agriculture 10 31.25
Total 22 100
Source: Author (2013)
The findings in Table 4.2 show that most state corporations in Kenya fall in the agricultural
sector with 31.25% while the least number of state corporations fall under financial, energy and
mining sector. This is attributed to the fact that agriculture is the main economic activity in
Kenya. These findings concur with Maweya (2008) while investigating the impact of corruption
on public procurement in sub-Saharan Africa.
4.2.3 Participation in Collaborative Procurement
The impact of procurement policy depends on the extent to which the respective strategies are
adopted by key stakeholders in the economy. The current public procurement reforms calls for
all state corporations to partake in collaborative public procurement.
The study sought to determine the number of state corporations that have participated in
collaborative public procurement in tandem with this clarion call. The results are shown in Table
4.3.

25
Table 4.3 Participation in Collaborative Procurement
Participation level Frequency Percentage
Corporation has not participated in
Collaborative Public Procurement
8 21.1
Corporation has participated in
Collaborative Public Procurement
30 78.9
Total 38.0 100.0
Source: Author (2013)
The results in Table 4.3 indicate that 78.9% of state corporations in Kenya participate in
collaborative public procurement. This is tandem with the government’s quest to reform public
procurement to enhance the performance of state corporations in Kenya. However, the fact that
21.1% of state corporations have not participated in collaborative public procurement raises an
alarm as this contravenes the government’s public procurement policy as enshrined in the Public
Procurement and Disposal Act of 2005. These findings are in line with Simiyu (2011) who found
that state corporations lack inbuilt mechanisms for procurement thus reinstating the need for
collaborative public procurement practices.
4.3 Collaborative Public Procurement
Collaborative public procurement is a relatively new approach in public supply chain
management. Unlike the classical functional approach, collaborative public procurement is
process oriented. The study sought to determine; the benefits of collaborative public
procurement, the critical success factor the implementation of collaborative public procurement,
and to establish the relationship between collaborative public procurement and performance
among state corporations in Kenya.

26
4.3.1 Collaborative Practices
The effectiveness of collaborative procurement policy lies in the implementation of specific
collaborative practices in the context of a given policy. The study sought to determine the
various collaborative procurement activities undertaken by the state corporations. In the initial
step, a correlation matrix was generated to identify any significant relation between the items
Descriptive statistics were used to determine the variance of the collaborative procurement
practices as shown in Table 4.4 below.
Table 4.4 Collaborative practices
Mean
Std.
Deviation
Analysis
N
The agency shares in design process collaboratively 4.158 1.1514 38
The agency shares open book costing 3.105 1.1807 38
The Agency interchanges staff in joint projects 3.895 1.4292 38
The agency is involved in joint projects 3.763 1.6995 38
The agency is involved in collaborative planning 4.026 1.5332 38
The agency is involved in seamless sharing of information 2.921 1.4023 38
The agency is involved in Shared tasks in Lead - buying 2.526 1.6723 38
The agency is involved in sharing of resources in form of shared services 4.211 1.1427 38
The agency is committed to improved cycle times 3.105 1.5385 38
The agency is involved in activities leading to low transport and distribution costs 4.184 1.2489 38
The agency is involved in exploitation of complementary skills 3.921 1.4023 38
The agency is involved in resource pooling 4.421 1.0035 38
The agency is involved in third party sourcing to economize on costs 3.605 1.6030 38
The agency endeavors to access capabilities crucial to its competitiveness 4.184 1.2704 38
The agency is involved in information flow along the supply chain 3.974 1.3653 38
The agency is involved in knowledge sharing in the design stage 4.342 1.0469 38
The agency is involved in enhancing flexibility & responsiveness to changes in
customer demand 4.289 1.2282 38
Source: Researcher (2013)

27
The findings in Table 4.4 above indicate that over 50% state corporations have adopted
collaborative practices to a large extent with eight of them having a mean of over 4.00. The
agency’s involvement in knowledge sharing in the design stage has the highest mean of 4.342
meaning that most corporations have adopted this practice to a large extent. The agency’s
involvement in Shared tasks in Lead – buying is adopted to low extent with a mean value of
2.526. The findings above support the fact that many state corporations are now responding to
the current public procurement policy that calls for collaborative procurement strategies to make
public procurement more competitive. The findings concur with Simiyu (2011) who found that
state corporations are gradually adopting procurement to enhance their performance.
Before factor extraction, there were seventeen eigenvectors which corresponded to the number of
factors. Four principal components were extracted for Collaborative public procurement
practices Observation indicated that the four decision factors accounted for 97.755%of the total
variation as illustrated in Table 4.5 below.

28
Table 4.5 Collaborative practices standard variances
Component
Initial Eigenvalues
Extraction Sums of Squared
Loadings
Rotation Sums of Squared
Loadings
Total
% of
Variance
Cumulative
% Total
% of
Variance
Cumulative
% Total
% of
Variance
Cumulative
%
1 14.732 86.662 86.662 14.732 86.662 86.662 7.907 46.514 46.514
2 1.254 7.374 94.036 1.254 7.374 94.036 5.136 30.214 76.728
3 .403 2.373 96.409 .403 2.373 96.409 2.907 17.102 93.830
4 .229 1.347 97.755 .229 1.347 97.755 .667 3.925 97.755
5 .100 .586 98.342
6 .062 .363 98.704
7 .050 .292 98.997
8 .044 .262 99.258
9 .032 .189 99.448
10 .027 .158 99.606
11 .019 .114 99.720
12 .016 .094 99.815
13 .011 .064 99.879
14 .009 .055 99.934
15 .005 .028 99.962
16 .004 .023 99.985
17 .003 .015 100.000
Extraction Method: Principal Component
Analysis.
Source: Researcher (2013)
The results in Table 4.5 above indicate that, four collaborative practices account for 97.755 of
the total standard variances.

29
Table 4.6 Collaborative practices - Principal Component Analysis
Collaborative practice Component
1 2 3 4
The agency is involved in information flow along the supply chain .976 -.082 -.057 -.152
The agency is involved in exploitation of complementary skills .970 -.066 -.099 -.174
The agency shares in design process collaboratively .968 -.117 .117 -.086
The agency endeavors to access capabilities crucial to its
competitiveness .967 -.201 .023 .007
The agency is involved in activities leading to low transport and
distribution costs .965 -.163 -.038 .136
The agency is involved in sharing of resources in form of shared
services .963 -.156 .151 -.084
The Agency interchanges staff in joint projects .955 -.058 -.122 -.228
The agency is involved in collaborative planning .953 -.152 -.223 .052
The agency is involved in third party sourcing to economize on costs .951 .108 -.231 .074
The agency is involved in enhancing flexibility & responsiveness to
changes in customer demand .946 -.281 .055 .024
The agency is involved in joint projects .943 .012 -.242 .193
The agency is involved in resource pooling .927 -.276 .136 .131
The agency is committed to improved cycle times .916 .351 -.059 .028
The agency is involved in knowledge sharing in the design stage .908 -.204 .339 .060
The agency is involved in seamless sharing of information .877 .438 .054 -.050
The agency shares open book costing .858 .431 .145 .135
The agency is involved in Shared tasks in Lead - buying .754 .633 .108 -.048
Extraction Method: Principal Component Analysis.
a. 4 components extracted.
Source: Author (2013)
The results in Table 4.6 indicate that four collaborative practices that have the greatest impact on
the procurement performance of state corporations. These collaborative practices include: The

30
agency is involved in information flow along the supply chain; the agency is involved in
exploitation of complementary skills; the agency shares in design process collaboratively; and
the agency endeavors to access capabilities crucial to its competitiveness. The findings support
Walker et al., (2013) in his study of the benefits of collaborative procurement in Europe. His
findings indicated that, collaborative practices more generate economies of scale than if state
corporations acted alone.
Table 4.6 shows that involvement in information flow along the supply chain is having the
greatest influence on the performance of state corporations since it accounts for 46.514% of the
performance variation followed by involvement in exploitation of complementary skills (at
30.214). Sharing of design process collaboratively accounts for 17.102% of the variation while
the corporation’s endeavor to access capabilities crucial to its competitiveness accounts for
3.925% of the variance. This implies that state corporations should invest more in management
information systems to enhance the seamless sharing of real - time information with the rest of
the members of their supply chains. The scree plot is as shown in figure 2 below;
Figure 2 Scree plot
Source: Researcher (2013)

31
4.3.2 Benefits of Collaborative Procurement
The objective of collaborative procurement is to achieve operational efficiencies and strategic
effectiveness in the supply chain. To achieve these objective members of the supply chain need a
purposeful coordination between themselves. The study sought to determine the benefits of
collaborative public procurement among state corporations in Kenya. The respondents were
asked questions on the extent to which they benefit from fifteen benefits of collaborative public
procurement on a likert scale of 1-5 where: 1 = very small extent; 2= small extent; 3= moderate
extent; 4= large extent; and 5= Very Large extent.
Table 4.7 Benefits of collaborative practices
Mean
Std. Deviation
a
Analysis N
a
Missing N
The agency is able to share the design process collaboratively 4.237 1.1954 38 0
The agency is able to collaboratively share open book costing 3.500 1.2466 38 0
The agency is able to interchange staff in joint projects 3.368 1.4963 38 0
The agency is able to undertake joint projects 3.632 1.5320 38 0
The agency is able to undertake collaborative planning 4.368 1.0246 38 0
The agency is able to share tasks in form of lead buying 4.211 .9630 38 0
The agency is able to share resources in form of shared services 3.789 1.3786 38 0
The agency is able to lower transport & distribution costs 4.395 1.1977 38 0
The agency is able to benefit from exploitation of complementary
resources 4.421 .9482 38 0
The agency is able to undertake resource pooling 3.816 1.4492 38 0
The agency is able to engage third party for sourcing routine and leverage
items 3.947 1.1377 38 0
The agency is able to gain privileged access to capabilities crucial to its
competitiveness 4.132 1.1664 38 0
The agency enjoys the benefits of effective information flow along the
supply chain 3.316 1.6457 38 0
The agency is able to benefit from knowledge sharing in the designed
stage 4.368 .9130 38 0
The agency is able to enhance its flexibility and responsiveness to
changes in customer demand 4.211 .9907 38 0
a. For each variable, missing values are replaced with the variable mean.
Source: Researcher (2013)

32
According to Table 4.7 above, all the state corporation benefit from collaborative procurement at
least to a moderate extent with all of them has a mean value of over 3.0. The agency’s ability to
benefit from exploitation of complementary resources is the main benefit with a mean of 4.421
while the least benefit is the agency’s gain from effective information flow along the supply
chain with a mean of 3.316. The findings above imply that state corporations in Kenya have
started to gain operations economies as a result of collaborative procurement practices. This is in
line with Hassan (2012) who established that t state corporations have benefited significantly
since the introduction of procurement reforms of 2007.
The benefits were reduced by Principal Component Analysis from thirteen to five key benefits
which account for 98.035% of the variance. The results are shown in Table 4.8 below.

33
Table 4.8 Benefits of collaborative public procurement - Component
Matrixa
Component
1 2 3 4 5
The agency is able to gain privileged access to capabilities crucial to its competitiveness
.977 -.055 .024 -.100 -.078
The agency is able to enhance its flexibility and responsiveness to changes in customer demand
.967 -.070 .113 -.147 -.011
The agency is able to share resources in form of shared services
.967 .113 -.171 -.014 -.074
The agency is able to share tasks in form of lead buying
.962 .011 .169 -.170 -.065
The agency is able to share the design process collaboratively
.960 -.203 -.026 .063 .049
The agency is able to undertake collaborative planning
.956 -.218 -.003 .114 -.073
The agency is able to undertake resource pooling
.952 .145 -.193 -.034 -.088
The agency is able to undertake joint projects
.952 .232 -.010 .139 -.089
The agency is able to engage third party for sourcing routine and leverage items
.950 -.056 -.146 -.140 .200
The agency is able to collaboratively share open book costing
.941 .175 -.005 .157 .197
The agency is able to benefit from exploitation of complementary resources
.940 -.253 .079 .119 -.085
The agency is able to benefit from knowledge sharing in the designed stage
.932 -.205 .243 .020 .098
The agency is able to interchange staff in joint projects
.928 .344 -.033 -.057 .026
The agency is able to lower transport & distribution costs
.915 -.324 -.198 .009 .004
The agency enjoys the benefits of effective information flow along the supply chain
.900 .379 .160 .051 -.003
Extraction Method: Principal Component Analysis.
a. 5 components extracted.
Source: Researcher (2013)
34
Table 4.9: Benefits of Collaborative procurement - Variance
Compo
nent
Initial Eigenvalues Extraction Sums of Squared Loadings
Total % of Variance Cumulative % Total % of Variance Cumulative %
1 13.454 89.693 89.693 13.454 89.693 89.693
2 .691 4.605 94.298 .691 4.605 94.298
3 .262 1.746 96.044 .262 1.746 96.044
4 .163 1.086 97.130 .163 1.086 97.130
5 .136 .905 98.035 .136 .905 98.035
6 .077 .511 98.545
7 .059 .391 98.936
8 .044 .296 99.233
9 .037 .244 99.476
10 .032 .210 99.687
11 .018 .119 99.805
12 .011 .074 99.880
13 .007 .048 99.928
14 .006 .043 99.971
15 .004 .029 100.000
Extraction Method: Principal Component Analysis.
Source: Author (2013)
It is clear from Table 4.8 & 4.9 that, the main benefit of collaborative public procurement is the
agency‘s ability to gain privileged access to capabilities crucial to its competitiveness based on
the fact that it explains 89.693% of the variance. Next most important benefit of collaborative
procurement is the agency’s ability to enhance its flexibility and responsiveness to changes in
customer demand accounting for 4.605% of the variation. The third most important benefit is the
agency’s ability to share tasks in form lead buying (1.746%). This is followed by the agency’s
ability to share design processes collaboratively (1.0860 and the agency’s ability to undertake
collaborative planning accounting for 0.95% of the variation. The findings above concur with
Richey et al., (2007) who found out that collaborative planning, reduced inventories, lower
transportation costs and improved cycle times are positive outcomes of relational integration.

35
From the forgone results it is clear that the main benefit of collaborative public procurement is
the ability of the state corporations to gain privileged access to capabilities crucial to its
competitiveness. This implies that state corporations should enhance the flow of shared
knowledge among their staff to utilize this opportunity. The least benefit gained from
collaborative procurement is the agency’s ability to undertake collaborative planning which
accounts for merely 0.905% of the variations. This calls for more research to unravel the
potential of this competitive avenue by the key policy makers in the state corporations.
4.3.3 Critical success Factors in the implementation of Collaborative Public
Procurement
Critical success factors are the enablers in the implementation of collaborative public
procurement. The facilitators embody governance mechanisms that enable partners to
communicate operational and strategic needs in order to ensure consistency in the supply chain.
The study investigated factors that that facilitate collaborative public procurement among state
corporations in Kenya. Respondents were required to indicate the extent to which the various
enabling factors have facilitated collaborative public procurement in their respective state
corporations on a likert scale of 1-5 where; 1 = very small extent; 2= small extent; 3= moderate
extent; 4= large extent; and 5= Very Large extent . The study posed twenty questions on the
critical success factors in the implementation of collaborative public procurement.

36
Table 4.10 Critical success factors – Descriptive analysis
Mean Std. Deviation
Analysis N
The agency has cultivated commitment and trust between itself and other members of
the supply chain 4.184 1.4305 38
The agency has inter organizational relationship and interdependency in the supply
chain 4.500 .8929 38
The agency has implemented cross --functional processes among members of the
supply chain 4.053 1.3141 38
The agency has developed cross-functional teams among partners in the supply
chain 3.526 1.3098 38
The agency has established software to enhance inter-dependency 4.000 1.4332 38
The agency maintains cooperation and effective communication mechanisms 4.368 1.0246 38
The agency undertakes information sharing among the partners 3.842 1.2418 38
The agency is involved in sharing of technical expertise 4.132 1.2557 38
The agency has formed transaction-specific resource investment to foster relational
governance bond 4.105 1.1807 38
The agency applies standard procedures geared towards process integration in the
supply chain 3.921 1.4404 38
The agency acquires and maintains appropriate resources like; IT, training etc 4.421 1.0560 38
The agency undertakes joint selection of goods and services 3.474 1.4092 38
The agency undertakes resources and process complementarity among the supply
chain members 3.842 1.4242 38
The agency shares risks and rewards with the supply chain members 4.395 1.0537 38
The agency follows normative guidelines in managing and selecting partners in the
supply chain 4.026 1.2189 38
The agency has effective governance through top management support 4.368 .9979 38
The agency has adopted consistent performance measures with the rest of the supply
chain members 3.395 1.4433 38
The agency fulfills the roles and responsibilities set out among the supply chain
members 4.053 1.2509 38
The agency maintains co-managed inventories and vendor managed inventories 4.105 1.2034 38
The agency submits to clear mission statements and common goals among the
supply chain members 4.079 1.3024 38
Source: Author (2013)

37
The results in Table 4.10 indicate that the agency‘s inter organizational relationship and
interdependency in the supply chain has been adopted to the largest extent with a mean value of
4.500 while; the state corporations adoption of consistent performance measures to a moderate
extent with a mean of 3.395. The findings above imply that the level of investment in enabling
factors in the implementation of collaborative public procurement varies considerably form one
organization to another. This supports Schotanus et al. (2011) who concluded that enabling
factors are crucial state agencies need to benefit from integrated procurement.
For easy analyzability the data was reduced by Principal Component Analysis from twenty to
four major critical success factors for analysis as shown in Table 4.11 below.

38
Table 4.11 Critical success factors - Component Matrixa
Component
1 2 3 4
The agency is involved in sharing of technical expertise .983 -.038 -.046 -.093
The agnecy fulfills the roles and responsibilities set out among the supply chain members .981 -.063 -.022 -.048
The agency has implemented cross --functional processes among members of the supply chain .976 -.073 -.110 -.014
The agency follows normative guidelines in managing and selecting partners in the supply chain .976 -.081 -.094 .058
The agency has formed transaction-specific resource investment to foster relational governance bond .976 .027 .057 -.032
The agency has established software to enhance inter-dependency .974 -.098 -.004 -.154
The agency maintains cooperation and effective communication mechanisms .967 .189 -.040 -.022
The agency undertakes information sharing among the partners .961 .001 .136 .162
The agency applies standard procedures geared towards process integration in the supply chain .957 -.184 -.198 .045
The agency has effective governance through top management support .956 .222 .028 .027
The agency undertakes resources and process complementarity among the supply chain members .956 -.201 -.147 .052
The agency maintains co-managed inventories and vendor managed inventories .955 .051 -.133 .239
The agency has cultivated commitment and trust between itself and other members of the supply chain .953 -.034 -.205 -.084
The agency submits to clear mission statements and common goals among the supply chain members .952 -.103 .063 -.247
The agency has developed cross-functional teams among partners in the supply chain .948 -.201 .123 .131
The agency has adopted consistent performance measures with the rest of the supply chain members .936 -.282 .174 -.025
The agency shares risks and rewards with the supply chain members .931 .341 .037 .020
The agency acquires and maintains appropriate resources like; IT, training etc .928 .350 .016 .007
The agency undertakes joint selection of goods and services .924 -.167 .314 .047
The agency has inter-organizational relationship and interdependency in the supply chain .908 .372 .078 -.062
Extraction Method: Principal Component Analysis.
a. 4 components extracted.
Source: Author (2013)
The results in Table 4.11 indicate that; sharing of sharing of technical expertise, the fulfillment
of the roles and responsibilities set out among the supply chain members, implementation of
cross --functional processes among members of the supply chain, following of normative
guidelines in managing and selecting partners in the supply chain, and are the main critical
success factors in the implementation of collaborative public procurement. The findings affirm
the results of (Golicic and Menzer, 2005) who found out that performance in public procurement
depend on the infrastructure and investments in critical success factors

39
Table 4.12 Critical success factors -Total Variance
Component
Initial Eigen values Extraction Sums of Squared Loadings
Rotation Sums of Squared
Loadings
Total
% of
Variance
Cumulative
% Total
% of
Variance
Cumulative
% Total
% of
Variance
Cumulative
%
1 18.247 91.236 91.236 18.247 91.236 91.236 7.285 36.424 36.424
2 .727 3.633 94.868 .727 3.633 94.868 6.336 31.678 68.102
3 .323 1.617 96.486 .323 1.617 96.486 5.562 27.809 95.911
4 .221 1.105 97.591 .221 1.105 97.591 .336 1.680 97.591
5 .117 .586 98.177
6 .076 .379 98.557
7 .063 .316 98.872
8 .054 .271 99.143
9 .042 .210 99.353
10 .031 .153 99.506
11 .026 .131 99.638
12 .024 .122 99.759
13 .018 .089 99.849
14 .012 .059 99.907
15 .008 .042 99.949
16 .003 .017 99.967
17 .003 .017 99.983
18 .002 .010 99.993
19 .001 .006 99.999
20 .000 .001 100.000
Extraction Method: Principal Component
Analysis.
Source : Author (2013)

40
The results in Table 4.12 indicate the strength of the influence of the critical success factors on
the total variation. Sharing of sharing of technical expertise is the most critical success factor
accounting for 36.424% of the total variation. Fulfillment of the roles and responsibilities set out
among the supply chain members the next most critical success factor accounting for 31.678% of
the variation. Implementation of cross -functional processes among members of the supply chain
is the third most important success factor at (27.809%) while, following of normative guidelines
in managing and selecting partners in the supply chain is the least critical success factor
accounting for only 1.680% of the total variation. The forgone results imply that the success of
collaborative public procurement in Kenya lies in the investment they make in establishing
critical enabling structures.
4.3.4 Procurement Performance of State Corporations
A performance measurement system must span the same part of the supply chain that the
purchasing department has control over. Several performance indicators are used to determine
the procurement performance of an organization. The study focused on the level of procurement
performance among sate corporations. Respondents were required to provide information
regarding the procurement performance of their agencies. The respondents were required to
respond to nine questions on various performance indicators.
An average performance of each performance indicator for all the state corporations was was
determined for analysis as indicated in Table 4.13

41
Table 4.13 Average Procurement Performance
CORPORATION 2008 2009 2010 2011 2012 APP
X1 X2 X3 X4 X5
F1 35.8 50.6 56.2 51.2 47.6
48.28
F2 45.3 74.2 74.2 51.2 28.2
54.62
F3 28.2 65.7 51.6 77.6 66.11
57.842
F4 33.1 83.5 45.1 74.2 74.2
62.02
F5 45.2 33.1 56.2 47.1 69.2
50.16
F6 45.2 65.2 74.2 66.2 77.6
65.68
F7 69.5 62.1 36.5 41.2 75.2
56.9
F8 56.2 47.1 25.7 74.2 83.5
57.34
F9 47.1 74.2 78.2 74.2 83.5
71.44
F10 51.2 83.5 74.2 51.2 77.6
67.54
F11 83.5 69.5 56.2 69.5 69.5
69.64
F12 69.5 58.5 83.5 65.1 69.5
69.22
F13 74.2 74.2 51.2 75.2 83.5
71.66
F14 36.5 56.2 75.4 69.5 59.6
59.44
F15 36.2 69.5 69.5 75.2 33.8
56.84
F16 74.2 62.8 62.8 77.6 83.5
72.18
F17 25.3 75.8 26.1 62.8 62.8
50.56
F18 69.5 62.8 68.9 83.5 28.2
62.58
F19 13.6 35.9 75.4 74.2 77.6
55.34
F20 74.2 74.2 74.2 74.2 62.8
71.92
F21 74.2 51.2 83.5 33.5 51.2
58.72
F22 47.6 42.3 81.2 62.8 83.5
63.48
F23 83.5 83.5 77.6 51.2 23.2
63.8
F24 51.2 28.2 69.5 83.5 74.2
61.32
F25 51.2 83.5 74.2 51.2 19.5
55.92
F26 69.5 66.2 77.6 75.2 56.8
69.06
F27 15.9 74.5 22.1 66.1 83.5
52.42
F28 69.5 41.2 83.5 62.8 83.5
68.1
F29 10.22 74.2 77.8 51.2 62.8
55.244
F30 51.2 75.4 67.8 51.2 77.6
64.64
F31 13.5 77.6 69.5 41.2 83.5
57.06
F32 62.8 83.5 68.7 74.2 77.6
73.36
F33 74.3 72.8 83.5 68.7 62.8
72.42
F34 51.2 66.5 19.8 55.8 62.8
51.22
F35 35.2 83.5 75.4 83.5 83.5
72.22
F36 51.2 74.2 83.5 51.2 74.2
66.86
F37 62.8 62.8 68.7 75.2 62.8
66.46
F38 51.2 86.4 74.2 75.4 74.2
72.28
Average performance 51.04526 65.95 65.08947 64.44737 66.07132
62.5206

42
APP –Average Procurement Performance RU - Resource utilization
CR - cost reduction RCT - reduction in cycle time
LO - Line on back order ACT - Average cycle time to target time
RE - Rejects or late delivery SV - Stock variance
TU - Training utilization TE - Total expenditure to total budget
Source: Researcher (2013).
Results in Table 4.13 above indicate the Average procurement performance of the state
corporations improved over the period though at a slow rate.
Based on the findings in Table 4.13 above, the trend in the procurement performance of the state
corporations was determined as indicated by Figure 3 below,
Figure 3: Average Procurement Performance
Source: Researcher (2013)
According to Figure 3 above, there was a moderate growth rate in procurement performance
between 2008 and 2009 followed by a slight decline in the next three years. The trend in Figure 3
0
10
20
30
40
50
60
70
2008 2009 2010 2011 2012
Average Procurement Performance
Average Procurement Performance

43
above shows that procurement performance has been increasing at a decreasing rate among state
corporations. This implies that, collaborative procurement has had a less than significant impact
on procurement performance among state corporations in Kenya.
4.4 The relationship between Collaborative Public Procurement and
performance
Integration along the supply chain coupled by collaborative procurement strategies play a pivotal
role in enhancing procurement performance in any organization. To establish the relationship
between collaborative public procurement and performance among state corporations a
regression analysis was done using SPSS version 22 statistical package. The independent
variables included: the agency’s is involvement in information flow along the supply chain; the
agency’s is involvement in exploitation of complementary skills; the agency’s involvement in
shares the design process collaboratively; and the agency’s endeavor to access capabilities
crucial to its competitiveness. The dependent variable was procurement performance. The
performance indices for the state corporations indicated in Table 4.13 above were used as the
dependent variable in the regression analysis.
4.4.1 Establishing the link between collaborative procurement and
performance
With the help of SPSS version 22 package the above data was analyzed to establish the
relationship between collaborative public procurement practices (Independent variables) and the
procurement performance .A multiple regression model was used in this analysis. The resulting
regression coefficients have been used to interpret the direction and magnitude of the
relationship. The βeta coefficients show the responsiveness of the dependent variable as a result
of unit change in each of the independent variables (Collaborative public procurement practices).
The error term ε captures the variations that cannot be explained by the model.

44
Table 4.14 Model Summaryb
Model R R Square
Adjusted R
Square
Std. Error of the
Estimate
Change Statistics
Durbin-
Watson
R Square
Change F Change df1 df2
Sig. F
Change
1 .447a .200 .103 7.2639 .200 2.064 4 33 .108 2.209
a. Predictors: (Constant), The agency is involved in information flow along the supply chain, The agency endeavors
to access capabilities crucial to its competitiveness, The agency shares in design process collaboratively, The
agency is involved in exploitation of complementary skills
b. Dependent Variable: Procurement Performance
Source: Author (2013)
From Table 4.14 above, the Coefficient of Multiple Determination (R2) is 0.20 which implies
that the model is of low ‘goodness of fit’. This means that the regression line explains only
20.0% of the variation in Procurement performance.
Table 4.15 ANOVAb
Model Sum of Squares df Mean Square F Sig.
1 Regression 435.550 4 108.887 2.064 .108a
Residual 1741.224 33 52.764
Total 2176.774 37
a. Predictors: (Constant), The agency is involved in information flow along the supply chain, The agency endeavors
to access capabilities crucial to its competitiveness, The agency shares in design process collaboratively, The
agency is involved in exploitation of complementary skills
b. Dependent Variable: Procurement Performance
Source: Author (2013)
Table 4.15 above indicted that the F static was 2.064 with a significant change of 0.108%. This
s implies that the impact of collaborative practice on performance is insignificant at 5%
confidence level.

45
Table 4.16 Collaborative procurement – model Coefficientsa
Model
Unstandardized
Coefficients
Standardized
Coefficients
t Sig.
95%
Confidence
Interval for B Correlations
Collinearity
Statistics
B
Std.
Error Beta
Lower
Bound
Upper
Bound
Zero-
order Partial Part Tolerance VIF
1 (Constant) 72.826 5.200
14.004 .000 62.245 83.406
The agency
shares in design
process
collaboratively
-2.325 4.792 -.349 -.485 .631 -
12.074 7.424 -.405 -.084
-
.076 .047 21.346
The agency is
involved in
exploitation of
complementary
skills
-6.382 5.638 -1.167 -1.132 .266 -
17.853 5.089 -.430 -.193
-
.176 .023 43.837
The agency
endeavors to
access
capabilities
crucial to its
competitiveness
.718 3.739 .119 .192 .849 -6.888 8.324 -.401 .033 .030 .063 15.817
The agency is
involved in
information flow
along the supply
chain
5.430 6.943 .967 .782 .440 -8.695 19.555 -.409 .135 .122 .016 63.006
a. Dependent Variable: Procurement
Performance
Source: Researcher (2013)
The results in Table 4.16 above show that only two of the four collaborative public procurement
practices had a positive effect on procurement performance. The most influential collaborative
practice is the agency’s is involved in information flow along the supply chain with a regression
coefficient of 5.430 and a P- value of 0.440. The agency’s endeavor to access capabilities crucial

46
to its competitiveness has the greatest influence with a regression coefficient of 0.718 and P-
value of 0.849 is the only other collaborative practice that has a positive impact on procurement
of the state corporations. The agency’s sharing in design process collaboratively has a negative
impact on performance with a regression coefficient of -2.35 and P-value of 0.631. The agency’s
is involvement in exploitation of complementary skills has the most negative effect on
collaborative procurement with a regression coefficient of -6.382 and P-value of 0.266.
From Table 4.14 the Coefficient of multiple Determination (R2 Square) is 0.20 shows that the
regression line explains only 20.0% of the variation in procurement performance.
As per the SPSS generated results shown in Table 4.16, the Equation Y = β0 + β1X1 + β2X2 +
β3X3 + β4X4 + ε becomes;
Y = 72.826 – 2.325X1 – 6.382X2 +0.718X3 + 5.430X4 + ε
Where;
Y = Procurement Performance
X1 = Sharing in the design process collaboratively
X2 = Involvement in exploitation of complementary skills
X3 = Endeavor to Access capabilities crucial to competitiveness
X4 = Involvement in information flow along the supply chain
ε = Random error
According to the regression equation established, taking all other independent variables at zero,
the procurement performance of state corporations will be 72.826. The data findings analyzed
also shows that holding all other independent variables constant, a unit increase in the agency’s
involvement in exploitation of complementary skills will lead to a -6.382 decrease in the
procurement performance of state corporations. Keeping all other variables constant, a unit
increase in the agency’s endeavor to access capabilities crucial to its competitiveness will lead
to an increase of 0.718 in the procurement performance of the state corporations. Taking all other
independent variable constant, a unit increase in the agency’s involvement in information flow

47
along the supply chain will lead to a 5.430 increase the procurement performance of state
corporations. On the other hand, taking all other independent variables constant, a unit increase
in the agency’s sharing in design processes collaboratively will lead to a -2.325 decrease in the
procurement performance of the state corporations. The results above show that collaborative
public procurement practices have had an insignificant influence on the procurement
performance among state corporations in Kenya during the period under study. This is supported
by the low Coefficient of Multiple Determination of 0.20 and significance change of 0.108 (refer
to Table 4.14: Model Summary).

48
CHAPTER FIVE:
SUMMARY, CONCLUSIONS AND RECOMMENDATIONS
5.1 Introduction
The study sought to determine; the benefits of collaborative public procurement, the critical
success factors in the implementation of collaborative public procurement; and to establish the
relationship between collaborative public procurement and performance among state
corporations in Kenya. This chapter presents; the summary of the findings, conclusions and
recommendations of the study.
5.2 Summary of the findings
The study revealed that 78.9% of state corporations in Kenya participate in collaborative public
procurement. This is tandem with the government’s quest to reform public procurement to
enhance the performance of state corporations in Kenya. However, the fact that 21.1% of state
corporations have not participated in collaborative public procurement raises an alarm as this
contravenes the government’s public procurement policy as enshrined in the Public Procurement
and Disposal Act of 2005. According to the study, over 80% of state corporations in Kenya have
been in existence for over 10 years with only 9.4 % being in existence for less than ten years.
The findings further indicate that most of the state corporations fall under the agricultural sector
(31.25%).
The outcome of the regression analysis (see table 4.14) show a low Coefficient of Multiple
Determination (R2) at 0.20. This implies that the model is of low ‘goodness of fit’. This means
that the regression line explains 20.0% of the variation of procurement performance. The results
also indicate that the significance change is at 0.108 implying that at 5% confidence level, the
impact of collaborative public procurement is insignificant.

49
5.3 Conclusion
The outcome of the study revealed that the changes in external environment coupled by the
liberalization affect the procurement performance of state corporations in Kenya now more than
before. To overcome the immense challenges the corporations have adopted various
collaborative procurement strategies to enhance their adaptability and responsiveness to the
macro-environment. The study reveals that most of the state corporations (78.9%) are
undertaking collaborative public procurement in line with the government’s procurement and
economic policy.
The first objective of the study was to determine the benefits of collaborative public procurement
among state corporations in Kenya. The outcome of the analysis outlines four major benefits of
collaborative procurement which are: the agency’s ability to access capabilities crucial to its
competitiveness; the agency’s ability to enhance its flexibility and responsiveness to changes in
customer demands; the ability to share tasks in form of lead buying; and the ability to share
design processes collaboratively.
The second objective was to determine the critical success factors in the implementation of
collaborative public procurement among state corporations in Kenya. The results in Appendix IV
indicate that; sharing of sharing of technical expertise, the fulfillment of the roles and
responsibilities set out among the supply chain members, implementation of cross -functional
processes among members of the supply chain, following of normative guidelines in managing
and selecting partners in the supply chain, and are the main critical success factors in the
implementation of collaborative public procurement. The findings affirm the results of (Golicic
and Menzer, 2005).
The third objective of the study was to establish the relationship between collaborative public
procurement and performance among state corporations in Kenya. The Coefficient of Multiple
Determination of 0.20 (see Table 4.14: The regression model summary), implies that only 20.0%
of the procurement performance of state corporations can be attributed to the collaborative
procurement practices adopted by the state corporations. Thus to enhance their procurement
performance state corporations need to undertake more research and development in
collaborative public procurement practices to identify opportunities they can tap from this
process oriented approach as competitive strategy.

50
5.4 Recommendations
The study found that 21.1% of the state corporations are yet to adopt collaborative public
procurement practices. There is need for relevant authorities to provide impetus for these
corporations to undertake collaborative public procurement and earn the economies associated
with collaborative procurement.
The fact that most of the collaborative procurement practices have a near perfect positive
influence on the procurement performance underpins the need for the corporations to increase
investment in these collaborative practices and intensify research and development in the
respective strategies to optimize the gains of collaborative public procurement.
5.5 Limitations of the study
The focus of the study was to establish the relationship between the various collaborative public
practices undertaken by state corporations in Kenya and their procurement performance. It is
clear that a study of this magnitude should include a survey of sizeable number of corporations.
However time and material resources did not make this feasible and for this reason the study
concentrated on just 45 of the state corporations. The re-organization of ministries also limited
the amount and quality of the data collected since many state corporations had recent information
leaving lots of gaps and blanks in the questionnaires. Despite these challenges the validity of the
findings emanating from this study cannot be compromised.
5.6 Suggestions for further Research
This study focused on the relationship between collaborative public procurement practices and
procurement performance among state corporations in Kenya. There is need for future studies to
determine the challenges facing collaborative public procurement among state corporations in
Kenya. Further studies should consider how variables like; capacity optimization, privatization,
and capitation impact on collaborative public procurement. Future researchers should investigate
the optimal level of investment in collaborative public procurement strategies.

51
REFERENCES
Walker, H., Schotanus, F., Bakker, E., & Harland, C. (2013). Collaborative Procurement: A
Relational View of Buyer–Buyer Relationships.Public Administration Review, 73 (4),
588 598.doi: 10.1111/puar.12048.
Hassan, A. (2012). Procurement practices in Kenya's Public Corporations. Unpublished MBA
project, University of Nairobi.
Ngari, M. (2012). The Effects of public procurement and disposal act on procurement in
parastatals in Kenya. Unpublished MBA project, University of Nairobi.
Simiyu, I. (2011). Regulation of discretion in Public Procurement in Kenya.Unpublished
MBAproject, University of Nairobi.
Delbufalo, E. (2011). Outcomes of inter-organizational trust in Supply chain Relationships.
Supply Chain Management: An International Journal, 17(4), 377 – 402. DOI
10.1108/13598541211246549
Richey, R., Roath, A., Whipple, J., & Fawcett, S. (2010).Exploring a Governance Theory of
Supply Chain Management: Barriers and facilitators to Integration. Journal of Business
logistics, 31(1), 237 – 246.doi: 10.1002/j.2158-1592.2010.tb00137.x
Erridge, A. (2007). Public Procurement; Public procurement, public value and the Northern
Ireland unemployment pilot Project. Public Administration, 85(4), 1023 – 1043.
doi: 10.1111/j.1467-9299.2007.00674.x
Maira, S. and Che, O. (2011).Collaboration as an anti-crisis solution: The Role of the
Procurement function.International Journal of Physical Distribution & Logistics
Management, 41(9), 860-877. doi: 10.1108/09600031111175825.
52
J. Gordon Murray, J. &Rentell, G. and Geer, D. (2008). Procurement as a shared service in
English Local Government.International Journal of Public Sector Management, 21(5),
540-555. doi: 10.1108/09513550810885822.
Tutu, O. Badu, E. &Manu,. O (2010).Exploring corruption practices in public procurement of.
infrastructural projects in Ghana. International Journal of Managing Projects in Business
3(2), 236-256.Doi: 10.1108/17538371011036563.
Kumar, A., Ozdamar, L., and Ng, C.P (2005). Procurement Performance Measurement
System in the Health care industry.International Journal of Health Care Quality
Assurance, 18 (2),152-166. Doi: 10.1108/09526860510588179.
Public Procurement Oversight Authority- Kenya (2009) The public Procurement and Disposal
General Manual 1st edition.
Walker, H., Schotanus, F., Bakker, E., & Harland, C.(2008).Choosing A Collaborative
Organization: the case of Collaborative initiatives. International Journal of
ProcurementManagement, 1 (3), 297 – 317.Retrieved from
http://www.emeraldinsight.com/
Kestenbaun, M. and Straight, R. (1995).Procurement Performance: Measuring Quality,
Effectiveness, and Efficiency. Public Productivity & Management Review, 19, (2), 200-
215. retrieved from: http://www.jstor.org/stable/3380498 .Accessed: 14/08/2013 06:44.
Scottish Government official website, (2013).What is collaborative procurement? Retrieved
from:http//www.scotland.gov.uk/Topics/government/Procurement/directory/collaborative
Procurement. Accessed on 14/08/2013 04:10.
Karuna, J. and Ashis, D. (2005). Supply Cahin Collaboration: A Governance Perspective.
International journal: Supply chain forum, 6(2),50-54.Retrieved from
http//www.emeradinsight.com/.10/08/2013 011/045.

53
APPENDIX I: Letter of Introduction
Nyangweso William B.
School of Business,
University of Nairobi
P. O. Box 30197
NAIROBI
September, 2007
Dear Respondent,
RE: COLLECTION OF SURVEY DATA
I am a postgraduate student of the University of Nairobi, School of Business, Nairobi campus. In
order to fulfill the degree requirement, I am undertaking the above project as part of the
academic requirements towards completion of the course. You have been selected to form part of
this study. This is to kindly request you to assist me collect the data by filing out the
accompanying questionnaire, which I will collect from you personally. The information that you
are going to provide will be used exclusively for academic purposes and will be treated with
strict confidence. At no time will your name appear in my report. A copy of the final paper will
be availed to you upon request.
Your co-operation will be highly appreciated.
Thank you in advance.
Yours faithfully,
NYANGWESO WILLIAM B. P. MAGUTU
MBA STUDENT LECTURER/SUPERVISOR
SCHOOL OF BUSINESS SCHOOL OF
BUSINESS, UNIVERSITY OF NAIROBI

54
APPENDIX – II: The Questionnaire Part 2: General Information
i. Name of your Corporation …………………………………………… (Optional)
ii. Your position in the company.………………………………................(Optional)
iii. In which ministry does your corporation fall?.......................................................
iv. For how long has your corporation been in existence?…………………..............
v. For how long have you been working with this corporation? …….…...(Optional)
Part 2: Public Collaborative Procurement
I. Has your state corporation participated in public collaborative procurement?
Yes No
Please tick where appropriate
II. To what extent has your agency participated in the following Collaborative
activities? Please indicate on a Scale of 1 – 5 where: 1 = To Avery Small Extent; 2 =
Small extent; 3 = Moderate Extent; 4 = Large Extent; 5 = Very Large Extent
No Issue (1)
(2)
(3)
(4)
(5)
A. COLLABORATVE ACTIVITIES
i. The agency shares the design of process collaboratively
ii. The agency collaboratively share Open book costing
iii. The agency interchanges staff in joint Projects
iv. The agency is involved in joint projects
v. The agency is involved in Collaborative planning
vi. The agency is involved in seamless
vii. The agency is involved in sharing tasks in form of lead-buying

55
viii. The agency is involved in sharing resources in the form of shared
services
ix. The agency is committed to improved cycle times
x. The agency is engaged in activities that lead to low transport and
distribution costs
xi. The agency is involved in exploitation of complementary skills
xii. The agency is involved in resource pooling
xiii. The agency engages third party for sourcing routine and leverage items in
order to economize on costs
xiv. The agency endeavors to gain privileged access to capabilities crucial to
its competitiveness
xv. The agency is involved in effective information flow along the supply
chain
xvi. The agency is engaged in knowledge sharing in the design stage
xvii. The agency is involved in enhancing flexibility and responsiveness to
changes in customer demand
III. To what extent has your agency benefited from Collaborative public Procurement
in relation to increased efficiency? Please indicate on a Scale of 1 – 5 where: 1 = To
Avery Small Extent; 2 = Small extent; 3 = Moderate Extent; 4 = Large Extent; 5 =
Very Large Extent
No
A. BENEFITS OF COLLABORATIVE PROCUREMENT
(1)
(2)
(3)
(4)
(5)
1. Increased Procurement Effectiveness in the Supply chain
i. The agency is able to share the design of process collaboratively
ii. The agency is able to collaboratively share Open book costing (1)
(2)
(3)
(4)
(5)

56
iii. The agency is able to interchange staff in joint Projects
iv. The agency is able to undertake joint projects
v. The agency is able to undertake collaborative planning
2. Increased Efficiency in the procurement process
(1)
(2)
(3)
(4)
(5)
i. The agency is able to share tasks in form of lead-buying
ii. The agency is able share resources in the form of shared services.
iii. The agency is has improved its cycle times
iv. The agency is able to lower transport and distribution costs
3. Access to Resources in the Supply chain (1)
(2)
(3)
(4)
(5)
i. The agency is able to benefit from the exploitation of complementary
skills
ii. The agency is able to undertake resource pooling.
iii. The agency engages is able to engage third party for sourcing routine
and leverage items in order to economize on transaction and distribution
costs
iv. The agency is able to gain privileged access to capabilities crucial to
organizational competitiveness
4. Coordination and Seamless Learning (1)
(2)
(3)
(4)
(5)
i. The agency is able to enjoy the benefits of effective information flow
along the supply chain
ii. The agency is able to benefit from knowledge sharing in the design stage
iii. The agency is able to enhance its flexibility and responsiveness to
changes in customer demand
IV. To what extent have the following factors facilitated collaborative procurement in
your agency? Please indicate on a Scale of 1 – 5 where: 1 = To Avery Small Extent;
2 = Small extent; 3 = Moderate Extent; 4 = Large Extent; 5 = Very Large Extent
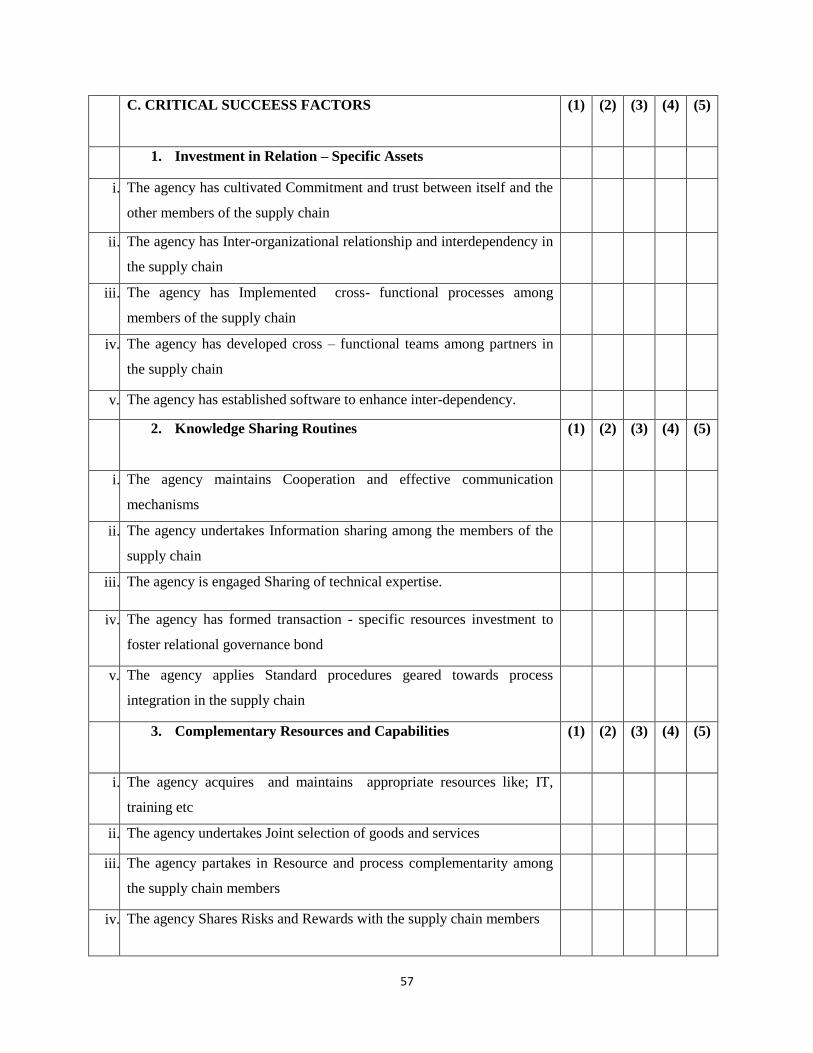
57
C. CRITICAL SUCCEESS FACTORS (1)
(2)
(3)
(4)
(5)
1. Investment in Relation – Specific Assets
i. The agency has cultivated Commitment and trust between itself and the
other members of the supply chain
ii. The agency has Inter-organizational relationship and interdependency in
the supply chain
iii. The agency has Implemented cross- functional processes among
members of the supply chain
iv. The agency has developed cross – functional teams among partners in
the supply chain
v. The agency has established software to enhance inter-dependency.
2. Knowledge Sharing Routines (1)
(2)
(3)
(4)
(5)
i. The agency maintains Cooperation and effective communication
mechanisms
ii. The agency undertakes Information sharing among the members of the
supply chain
iii. The agency is engaged Sharing of technical expertise.
iv. The agency has formed transaction - specific resources investment to
foster relational governance bond
v. The agency applies Standard procedures geared towards process
integration in the supply chain
3. Complementary Resources and Capabilities (1)
(2)
(3)
(4)
(5)
i. The agency acquires and maintains appropriate resources like; IT,
training etc
ii. The agency undertakes Joint selection of goods and services
iii. The agency partakes in Resource and process complementarity among
the supply chain members
iv. The agency Shares Risks and Rewards with the supply chain members

58
v. The agency follows Normative guidelines in managing and selecting
partners in the supply chain
4. Effective Governance (1)
(2)
(3)
(4)
(5)
i. The agency has Effective governance through top management support
ii. The agency has adapted consistent performance measures with the rest
of the supply chain members
iii. The agency fulfills the roles and responsibilities set out among the
supply chain members
iv. The agency maintains Co-managed inventories and Vendor Managed
Inventories (VIM)
v. The agency submits to Clear mission statements and common goals
among the supply chain members.
V. Please provide us with the following information regarding the procurement
performance of your agency for the last five years.
B. MEASURES OF PROCUREMENT
PERFORMANCE
2008 2009
2010 2011
2012
Resource utilization %
Cost reduction%
Reduction in cycle time%
Line items on back Order to total line items%
Average cycle time to targeted average cycle time%
Rejects early or late delivery to total number of items
delivered %
Stock variance to total stock value%
Training utilization%
Total expenditure of the department to total budget of
the department%
Thank you very much for your valuable time.

59
APPENDIX- III: State Corporations in Kenya
Ministry of Agriculture
1. Kenya sugar research foundation
2. Pyrethrum board of Kenya
3. Kenya plant health inspectorate service (KEPHIS)
4. South Nyanza sugar company
5. Agricultural development company ltd
6. Agricultural finance corporation
7. Kenya sugar board
8. Agricultural information resource center
9. Bukura agricultural college
10. Coffee board of Kenya
11. Chemelil sugar company
12. Coffee development fund
13. Coffee research foundation
14. Horticultural crops development authority
15. Kenya agricultural research institute
16. Kenya coconut development authority
17. Kenya seed company
18. Kenya sisal board
19. National cereals and produce board
20. Nzoia sugar company
21. Pest control products board
22. Tea board of Kenya
23. Tea research foundation of Kenya
24. Muhoroni sugar company (in receivership)
25. Miwani sugar company (in receivership)
26. Agro- chemical and food company
27. Nyayo tea zones development authority

60
Ministry of co – operative development and marketing
28. Co-operative college of Kenya
29. New Kenya co-operative creameries
30. The Sacco regulatory authority
Ministry of Education
31. Kenya literature bureau
32. Jomo Kenyatta foundation
33. Kenya school equipment production unit
34. Kenya institute of special education
35. Teachers service commission
36. Kenya institute of education
37. Kenya national examination council
38. Kenya education management unit
39. Center for mathematics and science teachers in Africa
Ministry of State / office of the president /Justice / state law office
40. National drought management authority
41. Kenya school of law
42. Council for legal education
43. National campaign against drug abuse
44. National AIDS control council
45. Kenya school of government
46. Kenya copy right board
47. National crime research centre
48. Witness protection agency
49. Transitional authority
50. CIC
51. Kenya Anti-corruption Authority
52. Kenya Ordinance Factories Corporation
Ministry of Environment & Natural resources / Forestry and wildlife / fisheries
53. National Environment management authority
54. Kenya forest service

61
55. Kenya forestry research institute
56. Kenya wild life service
57. Kenya marine fisheries research institute
Ministry of Energy
58. Kenya power
59. Kenya electricity generating company
60. Kenya electricity transmission company
61. National oil corporation of Kenya
62. Kenya electricity transmission board
63. Kenya pipeline company
64. Energy regulatory commission
65. Kenya petroleum refineries
66. Rural electrification authority
67. Geothermal development company
Ministry of Finance
68. Capital markets authority
69. Consolidated bank of Kenya
70. Public procurement oversight authority
71. Registration of certified public secretaries
72. Insurance regulatory authority
73. Kenya revenue authority
74. Kenya post office savings bank
75. Kenya investments authority
76. KASNEB
77. Privatization commission
78. Kenya reinsurance corporation
79. Policy holders compensation trust fund
80. Kenya national assurance company
81. Kenya trade agency network
82. Competition authority of Kenya
83. State corporations appeal tribunal
62
84. Kenya commercial bank
85. National bank of Kenya
86. Office of the controller of budgets
87. Office of the auditor general
88. Uchumi supermarkets
89. Central bank of Kenya
Ministry of Housing
90. National Housing corporation
Ministry of Higher education
91. University of Nairobi
92. National bio-safety authority
93. Higher education loans borad
94. Commission for higher education
95. Kenyatta University
96. Moi University
97. Egerton university
98. Maseno university
99. Masinde Muliro university
100. JKUAT
101. Technical university of Kenya
102. Multimedia University of Kenya
103. Mombasa technical university
104. Kimathi university
105. Kisii University college
106. Narok university college
107. Chuka university college
108. South Eastern university college
109. Laikipia university college
110. Kabianga university college
111. Likipia university college
112. Pwani university college

63
113. Bondo university college
114. Chepkoilel university college
115. Karatina university college
116. National council for science and technology
117. University Of Nairobi Enterprises & Services Ltd
Ministry of Information & communication
118. Kenya communications commission
119. Kenya year book editorial board
120. Media council of Kenya
121. Kenya film classification board
122. Kenya film commission
123. KBC
124. Brand Kenya board
125. Postal corporation of Kenya
126. Kenya information & communication board
127. Kenya College of Communication and Technology
Ministry of livestock
128. Kenya meat commission
129. Kenya dairy board
130. Kenya animal genetic resource centre
131. Kenya veterinary vaccines production institute
132. Kenya leather development authority
Ministry of Planning & Vision 2030
133. Kenya National bureau of statistics
134. Kenya Vision 2030 delivery secretariat
135. Constituencies development fund
136. National coordinating agency for population and development
137. Kenya institute of public policy research & analysis (KIPPRA)
Ministry of Roads
138. Kenya national highways authority

64
139. Kenya roads board
140. Kenya urban roads authority
141. Kenya rural roads authority
Ministry of Labor
142. NSSF
143. National industrial training authority
Ministry of local government
144. Local Authorities provident fund.
Ministry of Health
145. Kenya medical research institute
146. Kenya medical training college
147. Kenyatta National hospital
148. Moi teaching & referral hospital
149. NHIF
150. Pharmacy & poisons board
151. Kenya medical supplies agency
152. Kenya medical practitioners & dentists board
153. National quality control laboratory
Ministry of tourism / National heritage & culture
154. Kenya tourist board
155. Bomas of Kenya
156. Catering and tourism development levy trustee
157. Kenya tourist development corporation
158. Kenya utalii college
159. Kenya safari Lodges & Hotels
160. Kenyatta international conference centre
161. Sports stadia management board
162. Youth enterprises development board
163. Kenya national library service
164. NGOs coordination board
65
165. Kenya cultural centre
166. National museums of Kenya
Ministry of Transport
167. Kenya airports authority
168. Kenya national shipping line ltd
169. Kenya ferry services
170. Kenya maritime authority
171. Kenya civil aviation authority
172. Kenya ports authority
173. Kenya railways corporation
Ministry of regional development
174. Ewaso Ngiro South development authority
175. Ewaso Ngiro North development authority
176. Coast development authority
177. Kerio valley development authority
178. Lake basin development authority
179. Tana and Athi rivers development authority
Ministry of Trade / Industrialization
180. Kenya national trading corporation
182. Kenya wine agencies ltd
183. Kenya export processing zone
184. Export processing zones authority
185. Industrial & commercial evaluation corporation
186. Numerical machining complex
187. Kenya accreditation service
188. Kenya bureau of standards
189. East African Portland cement
190. IDB capital ltd
191. Kenya industrial estates ltd
192. Kenya industrial property institute (KIPI)
Ministry of Water & irrigation

66
193. Water resources management authority
194. The water services regulatory board
195. Athi water services board
196. Tanathi water services board
197. Coats water services board
198. Lake Victoria North water services board
199. National irrigation board
200. Northern water services board
201. National water conservation & Pipeline Corporation
202. Rift Valley water services board
203. Tana water services board
204. Lake Victoria South water services board
205. Kenya water institute
206. Water appeals board
207. National drought management authority
Ministry of Devolution / Transition
208. The government press
209. Commission on Revenue Allocation
2010. Parliamentary service commission

67
APPENDIX IV: Principal Component Analysis of collaborative
Procurement practices Critical Success Factor Component
1 2 3 4
The agency is involved in sharing of technical expertise .983
-
.038
-
.046
-
.093
The agency fulfills the roles and responsibilities set out among the supply chain
members .981
-
.063
-
.022
-
.048
The agency has implemented cross --functional processes among members of the
supply chain .976
-
.073
-
.110
-
.014
The agency follows normative guidelines in managing and selecting partners in the
supply chain .976
-
.081
-
.094 .058
The agency has formed transaction-specific resource investment to foster relational
governance bond .976 .027 .057
-
.032
The agency has established software to enhance inter-dependency .974
-
.098
-
.004
-
.154
The agency maintains cooperation and effective communication mechanisms .967 .189
-
.040
-
.022
The agency undertakes information sharing among the partners .961 .001 .136 .162
The agency applies standard procedures geared towards process integration in the
supply chain .957
-
.184
-
.198 .045
The agency has effective governance through top management support .956 .222 .028 .027
The agency undertakes resources and process complementarity among the supply
chain members .956
-
.201
-
.147 .052
The agency maintains co-managed inventories and vendor managed inventories .955 .051
-
.133 .239
The agency has cultivated commitment and trust between itself and other members of .953 - - -

68
the supply chain .034 .205 .084
The agency submits to clear mission statements and common goals among the supply
chain members .952
-
.103 .063
-
.247
The agency has developed cross-functional teams among partners in the supply chain .948
-
.201 .123 .131
The agency has adopted consistent performance measures with the rest of the supply
chain members .936
-
.282 .174
-
.025
The agency shares risks and rewards with the supply chain members .931 .341 .037 .020
The agency acquires and maintains appropriate resources like; IT, training etc .928 .350 .016 .007
The agency undertakes joint selection of goods and services .924
-
.167 .314 .047
The agency has inter- organizational relationship and interdependency in the supply
chain .908 .372 .078
-
.062
Extraction Method: Principal Component Analysis.
a. 4 components extracted
Source : Author (2013)
Copyright © 2022 FDOKUMEN