Coherent risk measures assessment based on the coupled analysis of multivariate distributions of...
10
Novák and Vořechovský: Proceedings of the 11 th International Probabilistic Workshop, Brno 2013 Coherent risk measures assessment based on the coupled analysis of multivariate distributions of multisource observation data Yuriy V. Kostyuchenko 1,2 , Yulia Bilous 1 , Ivan Kopachevsky 1 , Dmytro Solovyov 3 1 Scientific Centre for Aerospace Research of the Earth of National Academy of Sciences of Ukraine, [email protected] ; 2 Shevchenko Kiev National University, Faculty of Geography, Geomorphology and Soil Sciences Department, [email protected] ; 3 Marine Hydro-physical Institute of National Academy of Sciences of Ukraine, [email protected] Abstract: Long-term regional statistics of meteorological measurements and disasters distributions have been analyzed. The spatially and temporally normalized and regularized distributions of the parameters investigated have been obtained. Further analysis of regional climatic parameters distribution allows to estimate the probability of extremes (both on seasonal and annual scales) toward mean climatic values change. Therefore the most probable distributions of extreme values of climate parameters toward the mean values change have been calculated on regional scale. Using the method of assessment of complex risk measures on the base of coupled analysis of multidimensional multivariate distributions of data the regional risk of climatic, meteorological and hydrological disasters were estimated basing on kernel copula semi- parametric algorithm. Keywords: multisource statistics, regularization, regional climate distribution, kernel copulas, coherent risk measures, disasters 1 Introduction The main task of local and regional climate analysis and predictions is to define clearly the type of correlation between mean and extreme values of climate parameters. Is it possible to develop a correct algorithm to calculate the most probable local extreme variations toward the distribution of mean values known from climate models, and based on geo- referred long-term observations? What is real correlation between mean and extreme distributions? Deterministic approach based on climate models requires huge sets of heterogeneous data about climate system on regional scale. This data usually is unavailable and these types of models usually characterizes by high uncertainties. Our understanding 183
Transcript of Coherent risk measures assessment based on the coupled analysis of multivariate distributions of...
Novák and Vořechovský: Proceedings of the 11th International Probabilistic Workshop, Brno 2013
Coherent risk measures assessment based on the coupled analysis of multivariate distributions of multisource observation
data
Yuriy V. Kostyuchenko1,2, Yulia Bilous1, Ivan Kopachevsky1, Dmytro Solovyov3
1 Scientific Centre for Aerospace Research of the Earth of National Academy of Sciences of Ukraine, [email protected];
2 Shevchenko Kiev National University, Faculty of Geography, Geomorphology and Soil Sciences Department, [email protected];
3 Marine Hydro-physical Institute of National Academy of Sciences of Ukraine, [email protected]
Abstract: Long-term regional statistics of meteorological measurements and disasters distributions have been analyzed. The spatially and temporally normalized and regularized distributions of the parameters investigated have been obtained. Further analysis of regional climatic parameters distribution allows to estimate the probability of extremes (both on seasonal and annual scales) toward mean climatic values change. Therefore the most probable distributions of extreme values of climate parameters toward the mean values change have been calculated on regional scale. Using the method of assessment of complex risk measures on the base of coupled analysis of multidimensional multivariate distributions of data the regional risk of climatic, meteorological and hydrological disasters were estimated basing on kernel copula semi-parametric algorithm.
Keywords: multisource statistics, regularization, regional climate distribution, kernel copulas, coherent risk measures, disasters
1 Introduction The main task of local and regional climate analysis and predictions is to define clearly the type of correlation between mean and extreme values of climate parameters. Is it possible to develop a correct algorithm to calculate the most probable local extreme variations toward the distribution of mean values known from climate models, and based on geo-referred long-term observations? What is real correlation between mean and extreme distributions? Deterministic approach based on climate models requires huge sets of heterogeneous data about climate system on regional scale. This data usually is unavailable and these types of models usually characterizes by high uncertainties. Our understanding
183
Yuriy Kostyuchenko, Yu. Bilous, I. Kopachevsky, D. Solovyov: Coherent risk measures assessment based on the coupled analysis of multivariate distributions of multisource observation data
of climate system and its local features is incomplete, so it is possible to calculate only the mean values distributions with low spatial resolution [13].
Long and mid-term variations of mean values of climatic parameters (first of all, the mean air temperature) can be calculated with sufficient confidence using multi-scale climate models and multidimensional sets of observation data (meteorological measurements, satellite observations) [13, 10]. At the same time regional disaster risk depends on extreme values distribution. Therefore the analysis of stable correlations between well calculated mean values distributions and extreme values is necessary for regional disaster risk analysis. So, regional and local analysis of behavior of extreme climatic values distributions is one of core elements of climate-related disaster risk analysis.
Multivariate character of multidimensional distributions of climate parameters generates high uncertainties, which makes a deterministic models unmanageable. The system is not ergodic in rigorous sense. So the use of parametric methods is also limited.
To estimate a regional risk measure we need an approach to understand the complex systemic interrelations between distributions of mean and extreme values of climatic parameters and disasters frequency and intensity. Therefore development of alternative ways of analysis of multivariate distributions is the next core element of regional climate-related disaster risk analysis.
In this paper we propose to calculate the most probable distributions of extreme values of climate parameters toward the mean values change on regional scale using modified kernel-based nonlinear principal component analysis (KPCA) algorithm [15, 11]. Further, using the method of assessment of complex risk measures on the base of coupled analysis of multidimensional multivariate distributions of data, we try to estimate the regional risk of climatic, meteorological and hydrological disasters basing on kernel copula semi-parametric algorithm.
2 Extreme distribution assessment based on analysis of meteorological measurements
Existing climate models, including reanalysis, has a spatial resolution 300 – 500 km [13, 10]. However for regional and local risk analysis we need resolution higher than 100 km: about 40 – 70 km [14]. Downscaling algorithms allow to obtain correct mean values distribution with necessary spatial grid, but not extreme values distributions. At the same time the density of meteorological stations and measurement points is about 30 – 50 km in developed regions and populated areas. So we have enough data for correct analysis. The problem is to construct a correct approach directed not to global but to regional and local analysis of data.
So this consideration directed to determination of explicit form of corresponding between known mean and studied extreme values of climatic parameters. In this case we should analyze probability distribution of set of data of meteorological measurements. So for every interval [a, b] should be assessed probability Pr [a ≤ X ≤ b] of random value X will be belong to [a, b]. Let use the non-descending probability function F(x) of simple event p (xi):
184
Novák and Vořechovský: Proceedings of the 11th International Probabilistic Workshop, Brno 2013
∑ ≤=≤=
xx ii
xpxXxF )(]Pr[)( , (1)
0)(lim =−∞→
xFx
, 1)(lim =∞→
xFx
. (2)
The task in this case may be formulated as determination of probability distribution:
)Pr()( xXxP >= , (3)
And the corresponding probability distribution function F(x), with х →∞.
For this purpose the distributions of meteorological measurements have been analyzed using the KPCA algorithm [11]. Analysis was directed to determination of relationships between mean and extreme values distributions.
The area studied includes 15 meteorological stations in the site 250 x250 km with center on 50,5N, 26E (Northern-West part of Ukraine, Ukrainian Polissya: Prypiat River basin), for the period 1979 – 2010. Mean max and min detected values of daily air temperature have been analyzed, as well as the monthly distributions of precipitation.
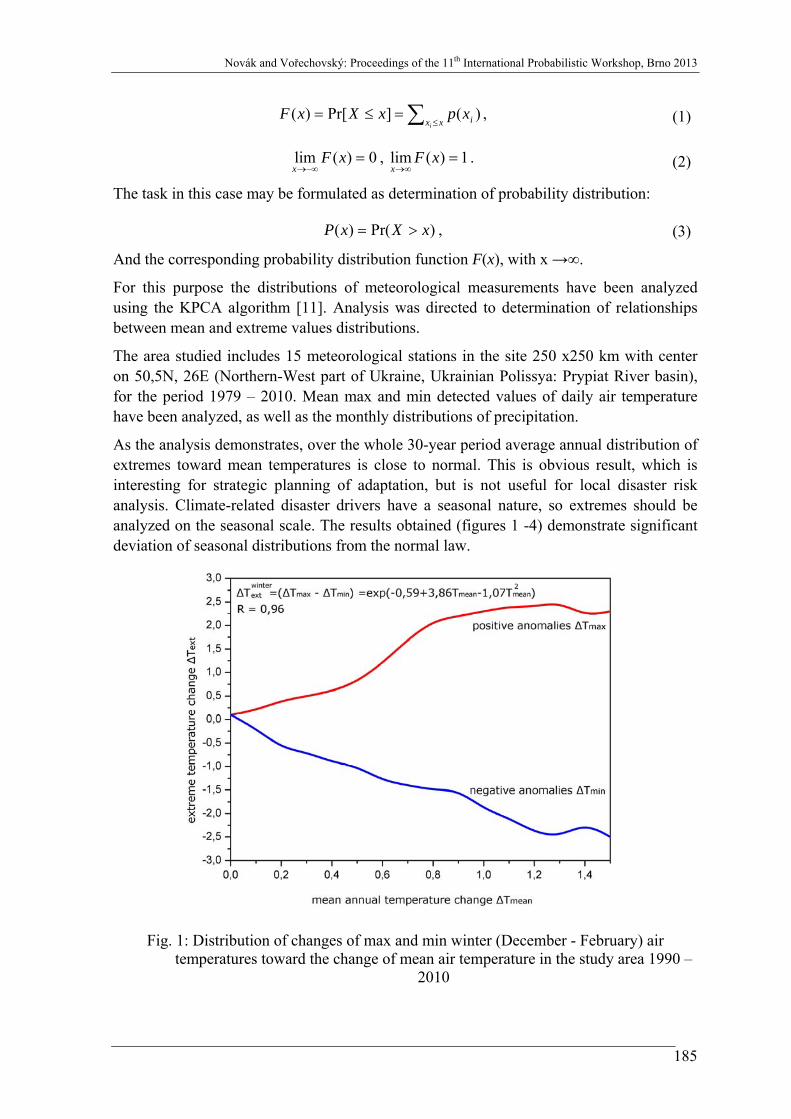
As the analysis demonstrates, over the whole 30-year period average annual distribution of extremes toward mean temperatures is close to normal. This is obvious result, which is interesting for strategic planning of adaptation, but is not useful for local disaster risk analysis. Climate-related disaster drivers have a seasonal nature, so extremes should be analyzed on the seasonal scale. The results obtained (figures 1 -4) demonstrate significant deviation of seasonal distributions from the normal law.
Fig. 1: Distribution of changes of max and min winter (December - February) air temperatures toward the change of mean air temperature in the study area 1990 –
2010
185
Yuriy Kostyuchenko, Yu. Bilous, I. Kopachevsky, D. Solovyov: Coherent risk measures assessment based on the coupled analysis of multivariate distributions of multisource observation data
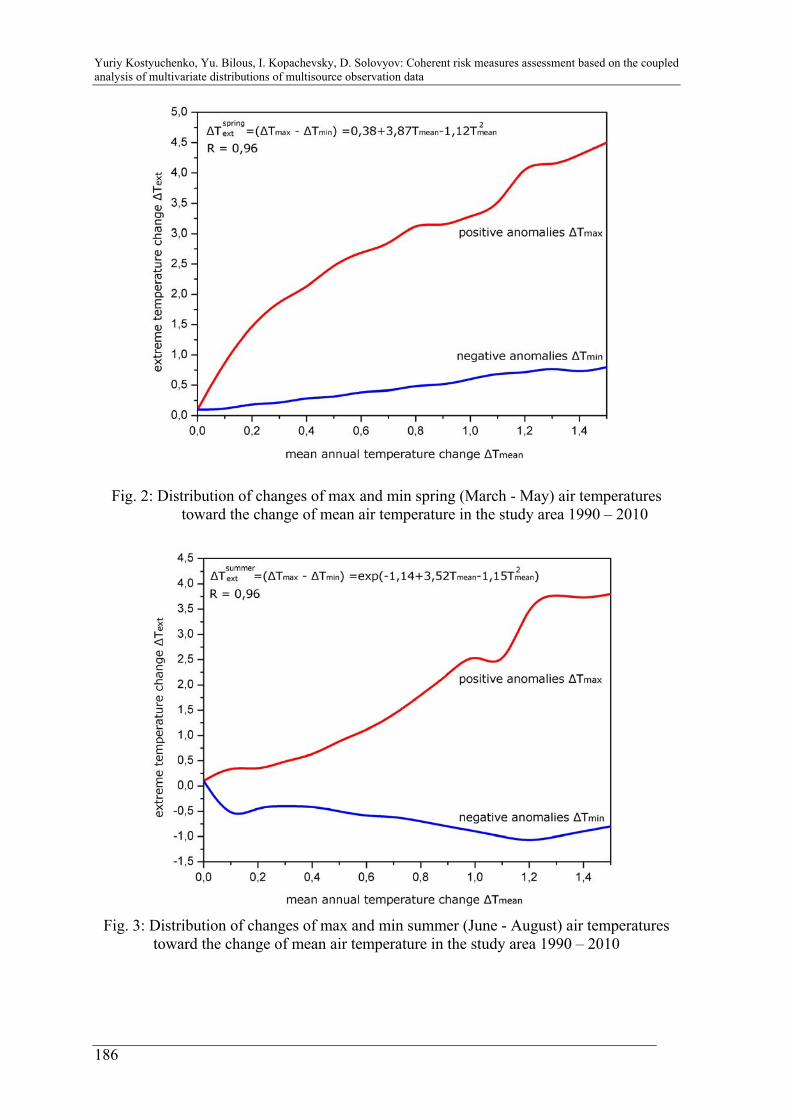
Fig. 2: Distribution of changes of max and min spring (March - May) air temperatures toward the change of mean air temperature in the study area 1990 – 2010
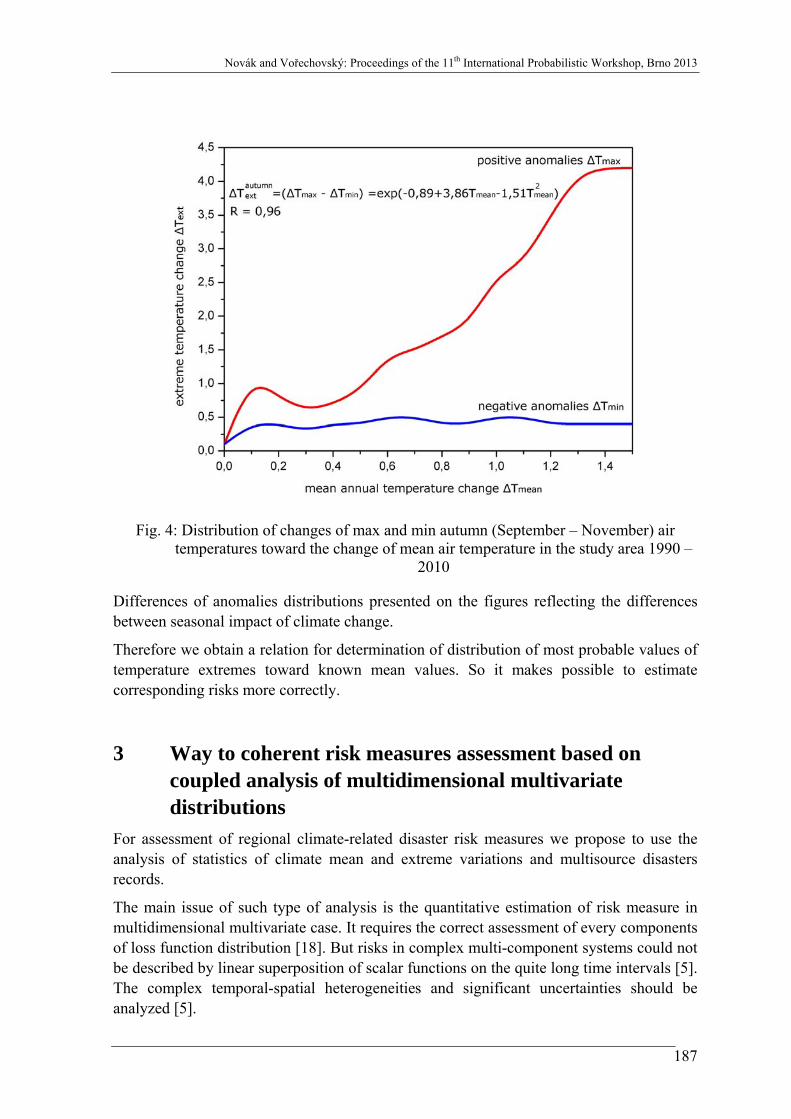
Fig. 3: Distribution of changes of max and min summer (June - August) air temperatures
toward the change of mean air temperature in the study area 1990 – 2010
186
Novák and Vořechovský: Proceedings of the 11th International Probabilistic Workshop, Brno 2013
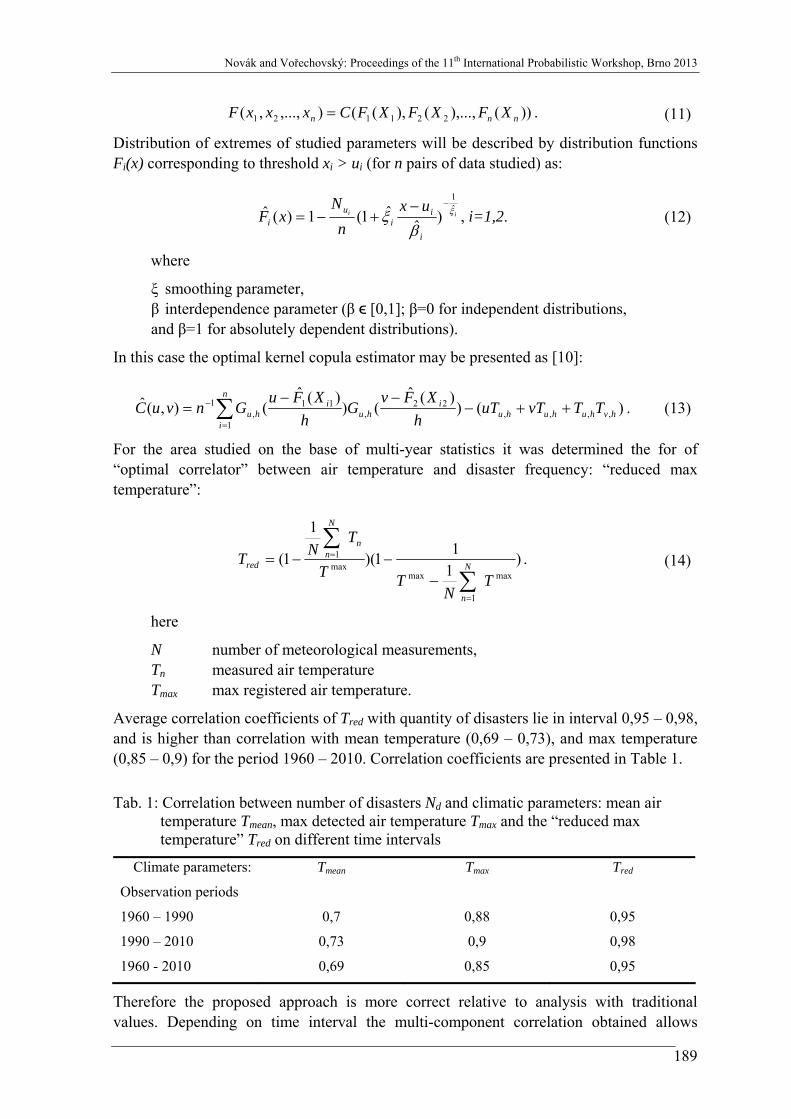
Fig. 4: Distribution of changes of max and min autumn (September – November) air temperatures toward the change of mean air temperature in the study area 1990 –
2010
Differences of anomalies distributions presented on the figures reflecting the differences between seasonal impact of climate change.
Therefore we obtain a relation for determination of distribution of most probable values of temperature extremes toward known mean values. So it makes possible to estimate corresponding risks more correctly.
3 Way to coherent risk measures assessment based on coupled analysis of multidimensional multivariate distributions
For assessment of regional climate-related disaster risk measures we propose to use the analysis of statistics of climate mean and extreme variations and multisource disasters records.
The main issue of such type of analysis is the quantitative estimation of risk measure in multidimensional multivariate case. It requires the correct assessment of every components of loss function distribution [18]. But risks in complex multi-component systems could not be described by linear superposition of scalar functions on the quite long time intervals [5]. The complex temporal-spatial heterogeneities and significant uncertainties should be analyzed [5].
187

Yuriy Kostyuchenko, Yu. Bilous, I. Kopachevsky, D. Solovyov: Coherent risk measures assessment based on the coupled analysis of multivariate distributions of multisource observation data
For analysis of the studied phenomena on intervals, in which its behavior is differs essentially from normal, we propose to use a following copula for tails u [6]:
))log
1,log
1(exp(),(21
21 uuVuuC −−−= , (4)
)()1,max(),(1
0
ωωω dHyx
yxV ∫−
= , where: (5)
⎪⎪⎩
⎪⎪⎨
⎧
≥<≤−−
<
= −−−−−
1,1;10,))1(())1((2/1
;0,0
)( 21
1
ωωωωωωω
ω
ω αααα dH (6)
For analysis of interdependent (or weak dependent) phenomenon, for example hydrological disasters, we can use form 0 ≤ ω < 1. Parameter α defines the form of dependences: independence copula is obtained in the limit as α → 1, and perfect positive dependence is obtained in the limit as α → ∞ [6].
This formalization allows better understand interdependencies between climatic parameters and disaster distribution on regional scale, and additionally allows to integrate regularization algorithms for uncertainty reducing [9].
For further analysis of behavior of risk measure dependent of number of climatic, ecological etc., independent heterogeneous parameters we propose other algorithm. This method based on approach to coupled nonparametric analysis of multidimensional multivariate distributions by kernel copulas [3]. Using this approach it is possible to reduce uncertainties and errors connected with differences of measurement intervals, and to smooth gaps in data distributions [4].
If Ku,h(x) is kernel-vector for u ϵ [0;1] on interval h > 0 we can propose according [3]:
),(),(),()),(),()(()( 2
120
12, huahuahua
xhuahuaxKxK hu −−
= , (7)
∫−
=hu
hu
ll dttKthua
1
)(),( , l=0,1,2. (8)
Also in this case can be defined functions Gu,h(t) and Tu,h:
∫∞−
=t
huhu dxxKtG )()( ,, , (9)
)1(,, huGT huhu−
= . (10)
Distribution function of the complex parameter will be determined by distribution functions of studied parameters X1, X2, …, Xn using copula C:
188
Novák and Vořechovský: Proceedings of the 11th International Probabilistic Workshop, Brno 2013
))(),...,(),((),...,,( 221121 nnn XFXFXFCxxxF = . (11)
Distribution of extremes of studied parameters will be described by distribution functions Fi(x) corresponding to threshold xi > ui (for n pairs of data studied) as:
ii
i
ii
ui
uxn
NxF ξ
βξ ˆ
1
)ˆˆ1(1)(ˆ
−−+−= , i=1,2. (12)
where
ξ smoothing parameter, β interdependence parameter (β ϵ [0,1]; β=0 for independent distributions, and β=1 for absolutely dependent distributions).
In this case the optimal kernel copula estimator may be presented as [10]:
∑=
− ++−−−
=n
ihvhuhuhu
ihu
ihu TTvTuT
hXFv
Gh
XFuGnvuC
1,,,,
22,
11,
1 )())(ˆ
())(ˆ
(),(ˆ . (13)
For the area studied on the base of multi-year statistics it was determined the for of “optimal correlator” between air temperature and disaster frequency: “reduced max temperature”:
)111)(
1
1(max
1
maxmax1
TN
TT
TNT N
n
n
N
nred
∑
∑
=
=
−−−= . (14)
here
N number of meteorological measurements, Tn measured air temperature Tmax max registered air temperature.
Average correlation coefficients of Tred with quantity of disasters lie in interval 0,95 – 0,98, and is higher than correlation with mean temperature (0,69 – 0,73), and max temperature (0,85 – 0,9) for the period 1960 – 2010. Correlation coefficients are presented in Table 1.
Tab. 1: Correlation between number of disasters Nd and climatic parameters: mean air temperature Tmean, max detected air temperature Tmax and the “reduced max temperature” Tred on different time intervals
Climate parameters: Tmean Tmax Tred
Observation periods
1960 – 1990 0,7 0,88 0,95
1990 – 2010 0,73 0,9 0,98
1960 - 2010 0,69 0,85 0,95
Therefore the proposed approach is more correct relative to analysis with traditional values. Depending on time interval the multi-component correlation obtained allows
189
Yuriy Kostyuchenko, Yu. Bilous, I. Kopachevsky, D. Solovyov: Coherent risk measures assessment based on the coupled analysis of multivariate distributions of multisource observation data
increase accuracy of assessment of disasters frequency up to 22% (11-34%). This is essential value for mid- and long-term regional forecasting.
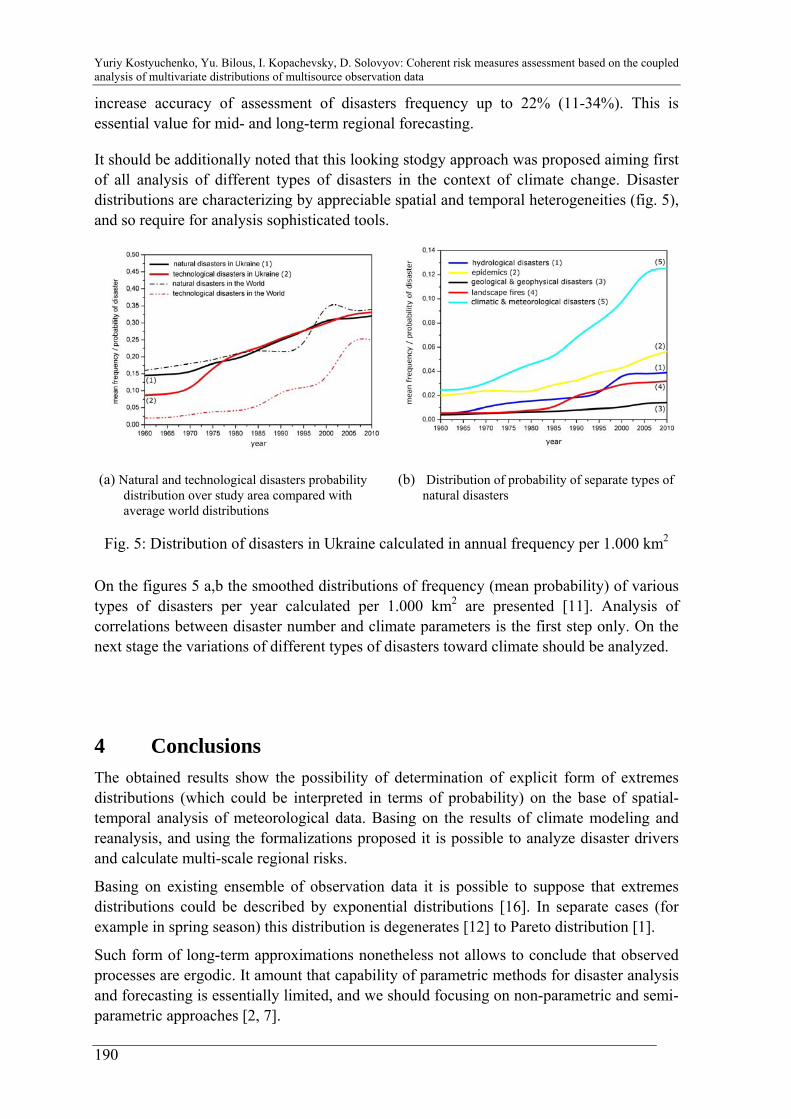
It should be additionally noted that this looking stodgy approach was proposed aiming first of all analysis of different types of disasters in the context of climate change. Disaster distributions are characterizing by appreciable spatial and temporal heterogeneities (fig. 5), and so require for analysis sophisticated tools.
(a) Natural and technological disasters probability distribution over study area compared with average world distributions
(b) Distribution of probability of separate types of natural disasters
Fig. 5: Distribution of disasters in Ukraine calculated in annual frequency per 1.000 km2
On the figures 5 a,b the smoothed distributions of frequency (mean probability) of various types of disasters per year calculated per 1.000 km2 are presented [11]. Analysis of correlations between disaster number and climate parameters is the first step only. On the next stage the variations of different types of disasters toward climate should be analyzed.
4 Conclusions The obtained results show the possibility of determination of explicit form of extremes distributions (which could be interpreted in terms of probability) on the base of spatial-temporal analysis of meteorological data. Basing on the results of climate modeling and reanalysis, and using the formalizations proposed it is possible to analyze disaster drivers and calculate multi-scale regional risks.
Basing on existing ensemble of observation data it is possible to suppose that extremes distributions could be described by exponential distributions [16]. In separate cases (for example in spring season) this distribution is degenerates [12] to Pareto distribution [1].
Such form of long-term approximations nonetheless not allows to conclude that observed processes are ergodic. It amount that capability of parametric methods for disaster analysis and forecasting is essentially limited, and we should focusing on non-parametric and semi-parametric approaches [2, 7].
190
Novák and Vořechovský: Proceedings of the 11th International Probabilistic Workshop, Brno 2013
The studied shifts of extreme values distribution toward mean values change is not linear and non-normal on regional scale. For example, increasing of mean air temperature to 10C leads to increasing of max temperature to 2,5 – 40C correspondingly. This is essential driver for disasters [13]. Besides, this is important factor of environmental and socio-ecological security [17, 8].
It is important to note that in view of current regional temperature change about 0,91 ± 0,27 С, we entering to zone of risk increasing: we still are in period of high risk of spring season, entering into high risks of autumn and winter seasons, and closely to zone of max risk of summer season. It should be considered in policy making.
Literature [1] Arnold B.C. Pareto Distributions. International Co-operative Publishing House, 1983,
216p., ISBN 0-89974-012
[2] Buhlmann H. Mathematical Methods in Risk Theory. Springer-Verlag, Berlin, 1970, 214p.
[3] Chen S.X. and Huang T. Nonparametric Estimation of Copula Functions For Dependence Modeling // Technical Report, Department of Statistics, Iowa State University, Ames, IA 50011-2008, USA, 2010, 20 p.
[4] Embrechts P., Lindskog F., and McNeil A. Modelling Dependence with Copulas and Applications to Risk Management // in: Handbook of Heavy Tailed Distributions in Finance, ed. S. Rachev, Elsevier, 2003, pp. 329-384
[5] Ermoliev Y., Hordijk L. Global Changes: Facets of Robust Decisions // in: K. Marti, Y. Ermoliev, M. Makowski, G. Pflug, (eds.): Coping with Uncertainty, Modeling and Policy Issues. 2006, Springer-Verlag, Berlin, Germany, pp. 4-28
[6] Genest Ch., Ghoudi K., and Rivest L.-P. Discussion of ‘‘Understanding Relationships Using Copulas’’ by Edward Frees and Emiliano Valdez // North American Actuarial Journal 1998, 2(3): 143–149
[7] Goovaerts M.J., Kaas R.J. and Tang Q. A Unified Approach to Generate Risk Measures // ASTIN Bulletin, 33 (2), 2003, Leuven Univ. Press, Leuven, Belgium, pp.173-191
[8] Grigorieva E. and Matzarakis A. Physiologically equivalent temperature as a factor for tourism in extreme climate regions in the Russian Far East: preliminary results. European Journal of Tourism, Hospitality and Recreation 2011, 2: 127-142
[9] Juri A. and Wuthrich M.V. Copula Convergence Theorems for Tail Events // Insurance: Mathematics and Economics 2002, 30: pp. 405–420
[10] Kalnay E., Kanamitsu M., Kistler R., Collins W., Deaven D., Gandin L., Iredell M., Saha S., White G., Woollen J., Zhu Y., Leetmaa A., Reynolds R., Chelliah M., Ebisuzaki W., Higgins W., Janowiak J., Mo K. C., Ropelewski C., Wang J., Roy J., Dennis J. The NCEP/NCAR 40-year reanalysis project // Bull. Amer. Meteor. Soc., 1996, 77, pp. 437-470
191
Yuriy Kostyuchenko, Yu. Bilous, I. Kopachevsky, D. Solovyov: Coherent risk measures assessment based on the coupled analysis of multivariate distributions of multisource observation data
192
[11] Kostyuchenko Yu.V., Yuschenko M., Movchan D. Regional risk analysis based on multisource data statistics of natural disasters // in: Integrated modeling of food, energy and water security management for sustainable social, economic and environmental developments. ed. by Zagorodny A.G., Yermoliev Yu.M. – Kyiv, 2013. –pp.229-238, ISBN 978-966-02-6824-1
[12] Lawless J.F., Fredette M. Frequentist predictions intervals and predictive distributions // Biometrika, 2005, Vol 92, Issue 3, pp 529–542
[13] Parry M.L., Canziani O.F., Palutikof J.P., van der Linden P.J. and Hanson C.E. Contribution of Working Group II to the Fourth Assessment Report of the Intergovernmental Panel on Climate Change // IPCC, Cambridge University Press, Cambridge, UK and New York, NY, USA, 2007, рр. 987
[14] Pflug G., Roemisch W. Modeling, measuring, and managing risk. World Scientific Publishing Co. Pte. Ltd., Singapore, 2007, - 303 p.
[15] Scheolkopf B., Smola A.J., Muller K. Nonlinear component analysis as a kernel eigenvalue problem // Neural Computation, 10, #5, 1998, pp. 1299–1399
[16] Schmidt D. F. and Makalic E. Universal Models for the Exponential Distribution // IEEE Transactions on Information Theory, 2009, Volume 55, Number 7, pp. 3087–3090, doi:10.1109/TIT.2009.2018331
[17] Schneider A., Panagiotakos D., Picciotto S., Katsouyanni K., Lowel H., Jacquemin B., Lanki T., Stafoggia M., Bellander T., Koenig W., Peters A. and AIRGENE Study Group. Air temperature and inflammatory responses in myocardial infarction survivors // Epidemiology 2008, 19: 391-400
[18] Venter G.G. Tails of Copulas // Proceedings of the Casualty Actuarial Society 2002, 89: pp. 68–113