Coherent electrical activity between vibrissa sensory areas of cerebellum and neocortex is enhanced...
12
Coherent Electrical Activity Between Vibrissa Sensory Areas of Cerebellum and Neocortex Is Enhanced During Free Whisking SEAN M. O’CONNOR, 1 RUNE W. BERG, 1 AND DAVID KLEINFELD 1,2 1 Department of Physics and 2 Neurosciences Graduate Program, University of California at San Diego, La Jolla, California 92093 Received 19 March 2001; accepted in final form 6 December 2001 O’Connor, Sean M., Rune W. Berg, and David Kleinfeld. Coherent electrical activity between vibrissa sensory areas of cerebellum and neocortex is enhanced during free whisking. J Neurophysiol 87: 2137–2148, 2002; 10.1152/jn.00229.2001. We tested if coherent sig- naling between the sensory vibrissa areas of cerebellum and neocortex in rats was enhanced as they whisked in air. Whisking was accom- panied by 5- to 15-Hz oscillations in the mystatial electromyogram, a measure of vibrissa position, and by 5- to 20-Hz oscillations in the differentially recorded local field potential (LFP) within the vibrissa area of cerebellum and within the LFP of primary sensory cortex. We observed that only 10% of the activity in either cerebellum or sensory neocortex was significantly phase-locked to rhythmic motion of the vibrissae; the extent of this modulation is in agreement with the results from previous single-unit measurements in sensory neocortex. In addition, we found that 40% of the activity in the vibrissa areas of cerebellum and neocortex was significantly coherent during periods of whisking. The relatively high level of coherence between these two brain areas, in comparison with their relatively low coherence with whisking per se, implies that the vibrissa areas of cerebellum and neocortex communicate in a manner that is incommensurate with whisking. To the extent that the vibrissa areas of cerebellum and neocortex communicate over the same frequency band as that used by whisking, these areas must multiplex electrical activity that is internal to the brain with activity that is that phase-locked to vibrissa sensory input. INTRODUCTION The operation of a sensorimotor system may involve signals that are directly locked to sensory input or motor output as well as signals that are used solely for internal communication between different brain areas. In principal, these two types of signals may be coded so that they share the same frequency bands yet remain incoherent with each other (Izhikevich 1999; Viterbi 1995). Precedence for inter- nal signaling that is incommensurate with the stimulus oc- curs in the visuomotor systems of cat (Eckhorn et al. 1988; Gray et al. 1989; Roelfsema et al. 1997), monkey (Fried- man-Hill et al. 2000; Fries et al. 2001; Kreiter and Singer 1996), and turtle (Prechtl 1994; Prechtl et al. 1997). How- ever, there is apparently no precedence for internal signaling that shares the same frequency band as the stimulus. To address this possibility, we focus on the nature of electrical signaling within different brain areas of the vibrissa senso- rimotor system of rat (for review, see Kleinfeld et al. 1999). The vibrissae are tactile sensors whose angular position is controlled by the follicles in the mystatial pad. Each follicle is innervated by neurons from the trigeminal sensory ganglion, while motion of the follicles is under control of intrinsic and extrinsic mystatial muscles, both of which receive input from the facial motor nucleus (Dorfl 1982, 1985) (Fig. 1). These sensory and motor structures are linked via the trigeminal nuclei and form a closed loop at the level of the hindbrain (hindbrain loop, Fig. 1). The hindbrain loop is nested within a loop that encompasses the pontine- and olivocerebellar nuclei and integrates input from the trigeminal nuclei as well as higher brain areas. The cerebellar nuclei project to the superior colliculus and subsequently to the facial motor nucleus to form a closed loop at the level of the midbrain (midbrain loop, Fig. 1). The highest level feedback loop in the vibrissa sensorimotor system involves structures at the level of the forebrain. Sensory projections from the trigeminal nuclei travel up through dorsal thalamus and primary sensory (S1) and motor areas of cortex and then down to both the colliculus and directly to reticular nuclei (Miyashita et al. 1994) to close the loop (forebrain loop, Fig. 1). Here we ask: what is the extent of coherent electrical activity between individual vibrissa sensory areas and vibrissa motion during whisking? How does this stimulus-locked coherence compare with the internal coherence between the different brain areas? As a means to address these questions, we recorded the mystatial electromyogram (EMG; Fig. 1), which reports the output of vibrissa motoneurons in the facial nucleus (Carvell et al. 1991; Klein and Rhoades 1985), along with the spatially localized field potential from the vibrissa sensitive region of the cerebellum (cerebellar LFP; Fig. 1) and the spatially localized field potential from the vibrissa sensitive region of S1 cortex (cortical LFP; Fig. 1). A crucial aspect of our exper- iments was the use of animals that were trained to whisk in air for extended periods (Fee et al. 1997). This provided a high fidelity and unambiguous behavioral reference signal, particularly because the phase of whisking may drift over successive cycles. METHODS Animals Seven female Long Evans rats (Charles River, ME), 270 –300 g initial weight, served as subjects. Four animals provided data for our Address for reprint requests: D. Kleinfeld, Dept. of Physics 0319, University of California, 9500 Gilman Dr., La Jolla, CA 92093 (E-mail: dk@physics. ucsd.edu). The costs of publication of this article were defrayed in part by the payment of page charges. The article must therefore be hereby marked ‘‘advertisement’’ in accordance with 18 U.S.C. Section 1734 solely to indicate this fact. J Neurophysiol 87: 2137–2148, 2002; 10.1152/jn.00229.2001. 2137 0022-3077/02 $5.00 Copyright © 2002 The American Physiological Society www.jn.org
-
Upload
independent -
Category
Documents
-
view
0 -
download
0
Transcript of Coherent electrical activity between vibrissa sensory areas of cerebellum and neocortex is enhanced...

Coherent Electrical Activity Between Vibrissa Sensory Areas ofCerebellum and Neocortex Is Enhanced During Free Whisking
SEAN M. O’CONNOR,1 RUNE W. BERG,1 AND DAVID KLEINFELD 1,2
1Department of Physics and 2Neurosciences Graduate Program, University of California at San Diego,La Jolla, California 92093
Received 19 March 2001; accepted in final form 6 December 2001
O’Connor, Sean M., Rune W. Berg, and David Kleinfeld. Coherentelectrical activity between vibrissa sensory areas of cerebellum andneocortex is enhanced during free whisking.J Neurophysiol 87:2137–2148, 2002; 10.1152/jn.00229.2001. We tested if coherent sig-naling between the sensory vibrissa areas of cerebellum and neocortexin rats was enhanced as they whisked in air. Whisking was accom-panied by 5- to 15-Hz oscillations in the mystatial electromyogram, ameasure of vibrissa position, and by 5- to 20-Hz oscillations in thedifferentially recorded local field potential (�LFP) within the vibrissaarea of cerebellum and within the�LFP of primary sensory cortex.We observed that only 10% of the activity in either cerebellum orsensory neocortex was significantly phase-locked to rhythmic motionof the vibrissae; the extent of this modulation is in agreement with theresults from previous single-unit measurements in sensory neocortex.In addition, we found that 40% of the activity in the vibrissa areas ofcerebellum and neocortex was significantly coherent during periods ofwhisking. The relatively high level of coherence between these twobrain areas, in comparison with their relatively low coherence withwhisking per se, implies that the vibrissa areas of cerebellum andneocortex communicate in a manner that is incommensurate withwhisking. To the extent that the vibrissa areas of cerebellum andneocortex communicate over the same frequency band as that used bywhisking, these areas must multiplex electrical activity that is internalto the brain with activity that is that phase-locked to vibrissa sensoryinput.
I N T R O D U C T I O N
The operation of a sensorimotor system may involvesignals that are directly locked to sensory input or motoroutput as well as signals that are used solely for internalcommunication between different brain areas. In principal,these two types of signals may be coded so that they sharethe same frequency bands yet remain incoherent with eachother (Izhikevich 1999; Viterbi 1995). Precedence for inter-nal signaling that is incommensurate with the stimulus oc-curs in the visuomotor systems of cat (Eckhorn et al. 1988;Gray et al. 1989; Roelfsema et al. 1997), monkey (Fried-man-Hill et al. 2000; Fries et al. 2001; Kreiter and Singer1996), and turtle (Prechtl 1994; Prechtl et al. 1997). How-ever, there is apparently no precedence for internal signalingthat shares the same frequency band as the stimulus. Toaddress this possibility, we focus on the nature of electricalsignaling within different brain areas of the vibrissa senso-rimotor system of rat (for review, see Kleinfeld et al. 1999).
The vibrissae are tactile sensors whose angular position iscontrolled by the follicles in the mystatial pad. Each follicle isinnervated by neurons from the trigeminal sensory ganglion,while motion of the follicles is under control of intrinsic andextrinsic mystatial muscles, both of which receive input fromthe facial motor nucleus (Dorfl 1982, 1985) (Fig. 1). Thesesensory and motor structures are linked via the trigeminalnuclei and form a closed loop at the level of the hindbrain(hindbrain loop, Fig. 1). The hindbrain loop is nested within aloop that encompasses the pontine- and olivocerebellar nucleiand integrates input from the trigeminal nuclei as well ashigher brain areas. The cerebellar nuclei project to the superiorcolliculus and subsequently to the facial motor nucleus to forma closed loop at the level of the midbrain (midbrain loop, Fig.1). The highest level feedback loop in the vibrissa sensorimotorsystem involves structures at the level of the forebrain. Sensoryprojections from the trigeminal nuclei travel up through dorsalthalamus and primary sensory (S1) and motor areas of cortexand then down to both the colliculus and directly to reticularnuclei (Miyashita et al. 1994) to close the loop (forebrain loop,Fig. 1).
Here we ask: what is the extent of coherent electrical activitybetween individual vibrissa sensory areas and vibrissa motionduring whisking? How does this stimulus-locked coherencecompare with the internal coherence between the differentbrain areas? As a means to address these questions, we recordedthe mystatial electromyogram (EMG; Fig. 1), which reports theoutput of vibrissa motoneurons in the facial nucleus (Carvell etal. 1991; Klein and Rhoades 1985), along with the spatiallylocalized field potential from the vibrissa sensitive region ofthe cerebellum (cerebellar�LFP; Fig. 1) and the spatiallylocalized field potential from the vibrissa sensitive region of S1cortex (cortical�LFP; Fig. 1). A crucial aspect of our exper-iments was the use of animals that were trained to whisk in airfor extended periods (Fee et al. 1997). This provided a highfidelity and unambiguous behavioral reference signal, particularlybecause the phase of whisking may drift over successive cycles.
M E T H O D S
Animals
Seven female Long Evans rats (Charles River, ME), 270–300 ginitial weight, served as subjects. Four animals provided data for our
Address for reprint requests: D. Kleinfeld, Dept. of Physics 0319, Universityof California, 9500 Gilman Dr., La Jolla, CA 92093 (E-mail: [email protected]).
The costs of publication of this article were defrayed in part by the paymentof page charges. The article must therefore be hereby marked ‘‘advertisement’’in accordance with 18 U.S.C. Section 1734 solely to indicate this fact.
J Neurophysiol87: 2137–2148, 2002; 10.1152/jn.00229.2001.
21370022-3077/02 $5.00 Copyright © 2002 The American Physiological Societywww.jn.org
mapping studies, and three animals provided data for our extracellularmeasurements on behaving animals. The care and experimental ma-nipulation of our animals were in strict accord with guidelines fromthe National Institutes of Health (1985) and have been reviewed andapproved by the Institutional Animal Care Committee at UCSD.
Mapping the cerebellar response
The rat was placed under halothane anesthesia [1–2% (vol/vol) inO2 at a flow rate of 500–1,000 SCCM], and a craniotomy wasperformed to expose an �4 � 6-mm region of cerebellar cortex thatincorporated crus 1 and 2. Maps of the electrical response, obtainedwith etched Tungsten microelectrodes (�Z(f � 1 kHz)� � 1 M�;WE300325A, Micro Probe), were obtained in response to repeatedmanual taps to one or two vibrissae. Responses were characterized as“strong,” “ weak,” or absent based on the relative amplitude of theaudible spike signal.
Behavioral training and chronic recording
Rats were habituated to human touch and the behavioral apparatus.After several weeks, both extracellular cortical and EMG electrodeswere surgically implanted with the rat under halothane anesthesia[2–3% (vol/vol) in O2]. In brief, the skull above the vibrissa areas ofcerebellar and parietal cortex in both hemispheres was exposed andcleared of soft tissue. Thin cement (Superbonder 49550; Loctite) wasspread across the remaining skull surface, and small bolts (No. 00-90)were implanted into the skull to act as anchors for the electrodes.Microwire electrodes were prepared from Teflon-coated tungsten wire(0.002-in; No. 7955, A-M Systems) that was cut and polished on thediagonal. Individual microwires were implanted stereotaxically in thecerebellum (Fig. 2A), as delineated from our mapping studies, inparietal cortex to record from the part of the vibrissa area of S1 thatis sensitive to the central, rostral vibrissae (e.g., vibrissae C1–C3)(Chapin and Lin 1984). Two or three electrodes were implanted in the
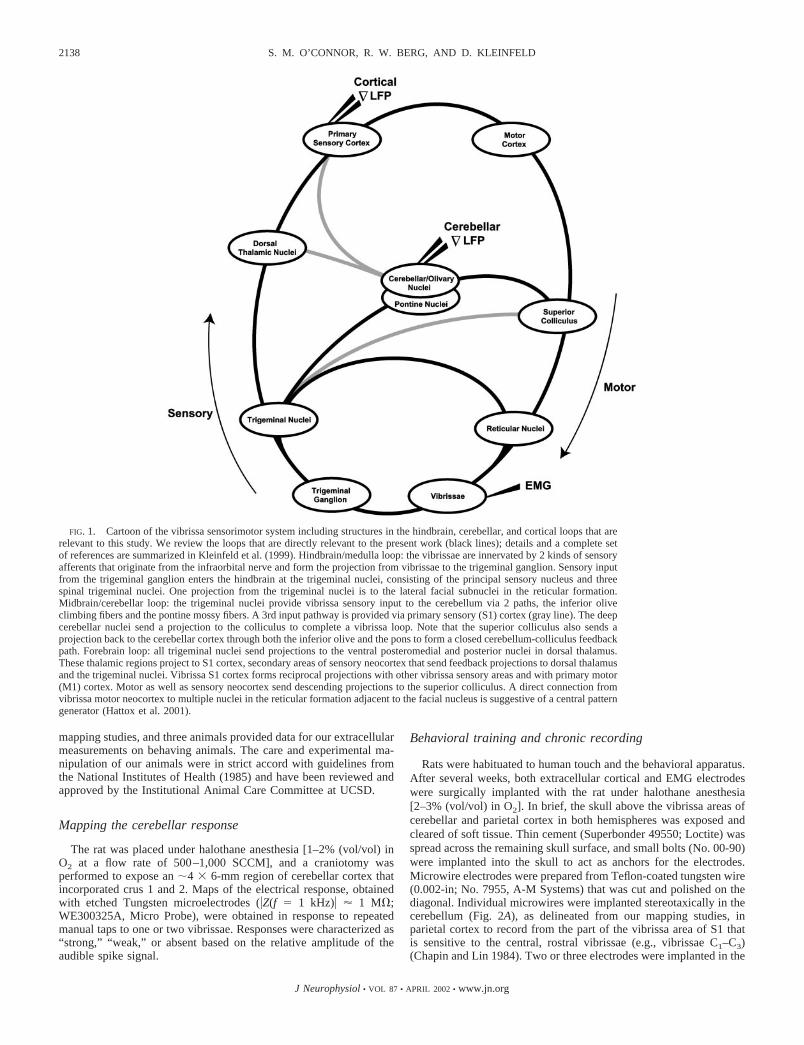
FIG. 1. Cartoon of the vibrissa sensorimotor system including structures in the hindbrain, cerebellar, and cortical loops that arerelevant to this study. We review the loops that are directly relevant to the present work (black lines); details and a complete setof references are summarized in Kleinfeld et al. (1999). Hindbrain/medulla loop: the vibrissae are innervated by 2 kinds of sensoryafferents that originate from the infraorbital nerve and form the projection from vibrissae to the trigeminal ganglion. Sensory inputfrom the trigeminal ganglion enters the hindbrain at the trigeminal nuclei, consisting of the principal sensory nucleus and threespinal trigeminal nuclei. One projection from the trigeminal nuclei is to the lateral facial subnuclei in the reticular formation.Midbrain/cerebellar loop: the trigeminal nuclei provide vibrissa sensory input to the cerebellum via 2 paths, the inferior oliveclimbing fibers and the pontine mossy fibers. A 3rd input pathway is provided via primary sensory (S1) cortex (gray line). The deepcerebellar nuclei send a projection to the colliculus to complete a vibrissa loop. Note that the superior colliculus also sends aprojection back to the cerebellar cortex through both the inferior olive and the pons to form a closed cerebellum-colliculus feedbackpath. Forebrain loop: all trigeminal nuclei send projections to the ventral posteromedial and posterior nuclei in dorsal thalamus.These thalamic regions project to S1 cortex, secondary areas of sensory neocortex that send feedback projections to dorsal thalamusand the trigeminal nuclei. Vibrissa S1 cortex forms reciprocal projections with other vibrissa sensory areas and with primary motor(M1) cortex. Motor as well as sensory neocortex send descending projections to the superior colliculus. A direct connection fromvibrissa motor neocortex to multiple nuclei in the reticular formation adjacent to the facial nucleus is suggestive of a central patterngenerator (Hattox et al. 2001).
2138 S. M. O’CONNOR, R. W. BERG, AND D. KLEINFELD
J Neurophysiol • VOL 87 • APRIL 2002 • www.jn.org

ipsilateral and contralateral aspects of each area, placed through0.5-mm holes that were drilled through the skull at a nominal spacingof 1 mm. The final depth of each electrode was guided by theelectrical signal measured in response to manual vibrissa deflection.Last, single microwires were implanted above occipital cortex and intemporal cortex; the latter served as a cortical reference site.
Vibrissa motion was inferred from the rectified EMG. Teflon-
insulated tungsten wire (0.002-in diam), with 1 mm of insulationstripped from the end, was threaded into the mystatial pad and set tolie about halfway through the whisker field. The same type of wire,with 5 mm of insulation stripped from the end, was implanted alongthe top surface of the nose to serve as an EMG reference site.
After a 10-day recovery from surgery, rats were trained to wait andthen perch on the edge of a platform, while blindfolded, as a means togain access to a food tube through which they received liquid food(0.5 ml/trial; LD-100; PMI Feeds) (Fee et al. 1997). Each trial wasinitiated when the rat approached the edge of the platform; after �5s, the tube was placed within reach of the rat. The behavioral state ofthe animal, e.g., whisking in air versus grooming the vibrissae, wasinferred from concurrent video recordings in which the vibrissae werehighlighted by darkfield illumination. Motion of the vibrissae wasmeasured via the mystatial EMG (Carvell et al. 1991), the local fieldpotential was measured at multiple neighboring locations (see follow-ing text) within the vibrissa areas of the cerebellum and S1 cortex.Upward of 50 trials were run per day.
The data for each animal were recorded over an �2-mo period aftersurgery. At the end of this period, we verified the electrode placementby measuring the response at each electrode to deflection of vibrissae.The rats were placed under halothane anesthesia, as in the precedingtext, and a clump of vibrissae were trapped in the openings of a finemesh screen and deflected by a piezoelectric driver (Simons 1983)that delivered taps at 5-s intervals. The neuronal response was re-corded and displayed as a trial average.
Recording and analysis
All electrical signals were buffered near the head of the animal withfield effect transistors (NB Labs, Denville, TX). The signals from thecerebellum and parietal cortex were differentially amplified(�12,800) relative to the cortical reference, band-pass filtered be-tween 0.1 Hz (RC high-pass filter) and 10 kHz (8-pole constant-phaselow-pass filter; Frequency Devices), and digitized at 25 kHz with a12-bit D/A converter (No. AT-MIO-16E-1, National Instruments).The difference between any two brain signals, low-pass filtering of thedifference, and subsampling of the difference were performed numer-ically (Interactive Display Language; Research Systems). The EMGsignals were differentially amplified relative to the nose reference,band-pass filtered between 200 Hz (4-pole Bessel high-pass filter) and10 kHz (8-pole constant-phase low-pass filter; Frequency Devices),and digitized as in the preceding text. Rectification, low-pass filtering,and subsampling of the EMG data were performed numerically.
Differential local field potentials, denoted �LFP, were calculated asthe difference between pairs of LFPs that were measured from neigh-boring electrodes in the same area of the brain. The separation of theelectrodes was �500 �m in the tangental plane. These measurementsreport the spatially averaged electrical activity in a volume of order
FIG. 2. Mapping and control experiments that relate to the proper place-ment of recording electrodes. A: maps of the electrical response in differentareas of crus 1 and crus 2 to stimulation of 1 or multiple vibrissae. Therecording electrode was lowered by �2 mm or until a response was apparent.Note the �2 mm (A-P) � 1.5 mm (M-L) region over which a strong responsewas obtained; this region was probed in the chronic measurements. B: sche-matic of the placement of extracellular electrodes. Two to 3 wires were placedin each mystatial pad to record the electromyogram (EMG); the reference wasin the nose. Similarly, 2–3 microwires were placed in the vibrissa area ofparietal cortex and in the vibrissa area of cerebellum; a low-impedanceelectrode in temporal cortex acted as the reference. All brain signals, �LFP,refer to the numerical difference of the signals measured across 2 wires in thesame brain area. C: stimulus-triggered average (n � 500) of the response of 1cerebellar wire to a tap stimulus delivered either to contralateral vs. ipsilateralvibrissae (METHODS). Note the dominant ipsilateral response. D: stimulus-triggered average (n � 500) of the response of one neocortical wire to a tapstimulus delivered either to contralateral versus ipsilateral vibrissae (METH-ODS). Note the dominant contralateral response.
2139INTERNAL SIGNALING IN THE VIBRISSA SYSTEM
J Neurophysiol • VOL 87 • APRIL 2002 • www.jn.org

0.1 mm3, similar to that of a cortical column and estimated to containon the order of 104 neurons (Braitenberg and Schuz 1991).
Spectra power densities of individual time series, denoted Sxx(f) inthe following text, spectral coherence between different signals, de-noted Cxx(f) in the following text, and the SD of these measures, werecalculated with the direct multi-taper spectral estimation techniques ofThomson (1982); see Cacciatore et al. (1999) for implementation. Inbrief, the spectral measures are defined by
Sxx� f � � �Vx�2
and
Cxy� f � �VxV*y
��Vx�2�Vy�2
where � � � denotes an average over all instances and tapers, i.e.
VU �1
N
1
K�n�1
N �k�1
K
V�n,k�U�n,k�
and
V�n,k� � �V�n,k��f��f�0fN � �
t�0
T
ei2�ftw�k��t�V�n��t�
is the discrete Fourier transform of the time series, V(n) {V(n)(t)}t�0T ,
multiplied by the kth taper, w(k) {w(k)(t)}t�0T . The parameter N is the
number of instances of the waveform (�102 in the present work), Kis the number of tapers or degrees of freedom in the spectral estimate(typically 5 in the present work), T is duration of the data trace (2 s inthe present case), and fN � (2tS)�1 is the Nyquist frequency where tSis the time per point of the subsampled data (5 ms in the presentwork). In this procedure, the spectrum is averaged over a half-bandwidth �f, which satisfies
�f � �K � 1
2� 1
T
A special aspect of this spectral estimation techniques is that itminimizes the leakage between neighboring frequency bands. Addi-tional smoothing, but no change in bandwidth, is obtained by aver-aging the spectra from multiple instances.
Standard deviations of the power spectra and the coherence arereported as jackknife estimates across trials (Thomson and Chave1991). The confidence intervals for coherence were further com-puted for the multitaper estimates, as described (Jarvis and Mitra2001), where the magnitude of the coherence will exceed �C� ��1 � P1/(NK�1) in P � 100% of measurements, where NK is the totalnumber of degrees of freedom. For a 95% confidence interval, whichnominally corresponds to 2 SDs above chance in the limit of largenumbers of independent samples, P � 0.05.
R E S U L T S
Maps and recording sites
The spatial localization of the stimulus-induced response invibrissa S1 cortex is well described and, as a consequence ofthe lissencephalic structure of neocortex, is easily localized(Welker 1971; Woolsey et al. 1974). In contrast, the responsein the cerebellum is more difficult to localize due to theconvoluted nature of this cortex. As a means to verify theposition of the sensory vibrissa representation, we measuredthe multi-unit response with Tungsten microelectrodes (METH-ODS) at a spatial resolution of �300 �m (n � 4 animals). Wepresent the data for the two most extensive maps (Fig. 2A).
These show a strong response that is spread over many squaremillimeters of crus 1 and crus 2, similar in size and location toprevious reports (Bower et al. 1981; Shambes et al. 1978).
Fidelity of the sensory signal in the LFPs
Chronic electrodes were placed in the center of the vibrissaarea of crus 2 in cerebellum and in the vibrissa area in S1cortex (Fig. 2B). We verified the position of the electrodes atthe time of placement, as well as at the end of the data trials byrecording the stimulus-induced response in the halothane-anes-thetized animal. The result for a single cerebellar LFP elec-trode shows a trial-averaged response that is significantlygreater for ipsilateral versus contralateral stimulation (Fig. 2C).Contrarywise, the cortical response is strong for contralateralstimulation but essentially unobservable for ipsilateral stimu-lation, consistent with previous reports for anesthetized ani-mals (Armstrong-James and George 1988a,b).
Organization of behavioral states
Data were obtained from three animals. They performedtheir task with peak-to-peak whisking amplitudes typically�20°. The electrophysiological data were sorted based on twostereotypical behavioral states that were associated with explo-ration. These were “paused,” a state of apparent transientimmobility of the vibrissae as the animals maintained positionon the perch, and “whisking.” The whisking state was furtherdivided into a state with relatively small-amplitude whisking(�10°) and head movements, denoted small whisking, and astate usually associated with searching for the food tube withwhisking amplitudes of 10 to �20°, denoted medium whisk-ing. The angle of 10° corresponds to the mode observed in anunconditioned whisking task using the head-fixed preparationof Zeigler (Sachdev et al. 2000). It is important not to confuseour definition of small whisking with twitching, in which theanimal remains immobile and the thalamocortical electricalactivity is highly synchronized (Nicolelis et al. 1995; Sembaand Komisaruk 1984).
In addition to behavioral states during exploration, we iden-tified a state that did not involve exploration, i.e., chewing, inwhich the animals made rhythmic jaw movements in associa-tion with eating. Chewing and other nonexploratory states wereexcluded from further analysis except for purposes of controlmeasurements.
Cerebellar and neocortical responses
We consider the simultaneous electrical activity in thevibrissa sensory areas of cerebellum and S1 cortex with themotion of the vibrissae. We focus on the results from theanimal with the correspondingly largest data set. The spectralcoherence between the EMG and each brain response, as wellas between the two brain areas, varied considerably betweentrials. Two examples, with spectral estimators computed in asliding 2-s window, serve to illustrate the typical responsesseen across all data sets. The first example contains two suc-cessive bouts of whisking (medium whisking, Fig. 3, A and B).The cerebellar �LFP showed no remarkable change in ampli-tude during whisking (Fig. 3C), yet is clearly coherent with thefirst bout of whisking but only weakly coherent with the secondbout (Fig. 3E). The neocortical �LFP also appeared unremark-
2140 S. M. O’CONNOR, R. W. BERG, AND D. KLEINFELD
J Neurophysiol • VOL 87 • APRIL 2002 • www.jn.org

FIG. 3. Example of a single trial response of the relation between the mystatial EMG and the cerebellar and cortical responsesduring epochs of sustained whisking. A: the rectified and filtered EMG, which reports vibrissa movement. The behavioral state ofthe animal, determined from video clips of the animal in the vicinity of the perch, is indicated by the gray bars. Note the changein frequency of whisking between successive bouts of medium whisking. B: the spectral power in the EMG as a function of time.A 2-s sliding window and a bandwidth of 2 Hz were used. The color white codes the highest magnitude and deep red the lowest.C: the spatially localized cerebellar response. D: the spatially localized cortical response. E: the magnitude of the coherencebetween the rectified EMG and the cerebellar response. Note that the coherence during the 1st whisking bout is stronger than thatduring the 2nd bout. A 2-s sliding window and a bandwidth of 2 Hz were used. White corresponds to 1 and deep red to 0. F: themagnitude of the coherence between the rectified EMG and the neocortical response. G: the magnitude of the coherence betweenthe cerebellar and the neocortical responses.
2141INTERNAL SIGNALING IN THE VIBRISSA SYSTEM
J Neurophysiol • VOL 87 • APRIL 2002 • www.jn.org

able (Fig. 3D) and is less obviously modulated by whisking(Fig. 3F). Interestingly, the cerebellar and neocortical re-sponses are partially coherent during both whisking bouts. Forthe first bout, there was weak but significant coherence at the�10-Hz fundamental frequency of the whisking (Fig. 3G),while for the second bout, with an �5-Hz fundamental fre-quency, the coherence lies at higher frequencies (Fig. 3G).
In the second example, we consider an epoch that containedstrong bursts of �7 Hz oscillatory activity in the S1 corticaland, over a more limited period, in the cerebellar recordings(Fig. 4, C and D). The latter burst overlaps with a bout ofwhisking (small whisking, Fig. 4, A and B). In this and relatedexamples, the spectral coherence between the EMG and eitherthe cerebellar or neocortical �LFP was relatively high during
FIG. 4. Example of a single trial response of whisking and associated brain rhythms during an epoch of strong rhythmic activityinternal to the brain. All spectral measures are as in Fig. 3. A: the rectified and filtered EMG. The behavioral state of the animalchanges from pause to small whisking to medium whisking. Note that none of the whisking epochs contains a whisking “bout” byour definitions. B: the spectral power in the EMG as a function of time. Note the 2 strong peaks during the pause behavioral epoch.C: the spatially localized cerebellar response. Note the burst of oscillatory that occurs during small whisking. D: the spatiallylocalized cortical response. Note the 2 bursts of oscillatory that occurs during small whisking. E: the magnitude of the coherencebetween the rectified EMG and the cerebellar response. Note the epoch of near unity coherence. F: the magnitude of thecoherence between the rectified EMG and the neocortical response. Note the epoch of near unity coherence. G: the magnitude ofthe coherence between the cerebellar and the neocortical responses. Note the epoch of near unity coherence; the phase of thecoherence during this epoch was nearly 0.
2142 S. M. O’CONNOR, R. W. BERG, AND D. KLEINFELD
J Neurophysiol • VOL 87 • APRIL 2002 • www.jn.org

the burst (Fig. 4, E and F). Further, in this example there wassignificant coherence between the two vibrissa brain areasduring both the pause and small whisking states (Fig. 4G), witha particularly large value during whisking. Collectively, thedata of Figs. 3 and 4 illustrate the variability of the cerebellarand neocortical �LFP responses between different whiskingbouts.
In light of the substantial variability of the brain responsesbetween whisking bouts (Figs. 3 and 4), we formed the com-posite response as a means to gain insight into the typicalelectrical behavior. We averaged the spectral power and thecoherence across all trials of a given behavior (Fig. 5; n � 120for pause; n � 250 for small whisking; and n � 240 formedium whisking). The change from pause to either whiskingstate was accompanied by the onset of a broad peak in theEMG that was centered near 7–8 Hz (Fig. 3A). There was abroad peak in the power spectrum of the cerebellar �LFPduring the pause state that was centered near 8–9 Hz. Theamplitude of this peak was diminished by nearly two orders ofmagnitude in the whisking states; this corresponded to an orderof magnitude drop in the amplitude of the �LFP itself. Incontrast to the severe drop in cerebellar oscillatory power onthe onset of whisking, there was a strong increase in theamplitude of the spectral power in vibrissa S1 cortex with abroad peak centered near 8 Hz and a second peak centered near16 Hz. Thus, on average, rhythmic whisking was accompaniedby a decrease in cerebellar broadband oscillations but an in-crease in neocortical broadband oscillations at frequencies thatoverlapped with those involved with whisking.
Although cerebellar oscillations are observed during whisk-ing (Fig. 5, H and N), the spectral coherence among thecerebellar �LFP and the EMG was small, with �C( f )� � 0.2,where �C� is the magnitude of the coherence with 0 � �C� � 1(Fig. 5, J and P). A similar situation occurred with the neo-cortical �LFP and the EMG (Fig. 5, I and O), for which�C( f )� � 0.15 (Fig. 5, K and Q). In both cases, the magnitudeof the coherence was significant (P � 0.05) at the peak fre-quencies of the EMG. Thus for example, only 0.1 of the localelectrical activity in the vibrissa areas of the cerebellum or S1cortex, as reported by the differential LFP, is phase-locked torhythmic motion of the vibrissa when the animal whisks witha frequency of 8 Hz.
In contrast to the relatively low coherence between whiskingand rhythmic electrical activation of cerebellum or neocortex,the coherence between the cerebellar �LFP and the neocortical�LFP was relatively high during epochs of whisking. Whenthe animal was in the pause state, there was significant (P �0.01) but small coherence between the cerebellum and S1cortex, with �C( f � 8 Hz)� � 0.1 (Fig. 5F). This coherenceincreased for either small or medium whisking to �C( f � 8 Hz)�� 0.3 (Fig. 5L) and �C( f � 16 Hz)� � 0.4 (Fig. 5R). These datashow that there is a relatively high level of synchronous sig-naling between the cerebellar and neocortical brain loops. Thissynchrony appears to be at most only partially locked to theoccurrence of whisking.
Our data show that whisking spans a broad range of fre-quencies, from �5 to 15 Hz (Fig. 3, G and M), as animalswhisk freely in air. We emphasize that the relatively low-frequency EMG signals, such as that in the medium whiskingbout shown in Fig. 3A, are true whisker movements. In partic-
ular, these signals are not, per se, related to chewing, for whichthe EMG has a substantially reduced amplitude (Fig. 5A, inset).
Global coherence
The preceding results show that the coherence between thecerebellar and neocortical �LFP was relatively high duringepochs of whisking in both low- and high-frequency bands.The high-frequency (15–20 Hz) band is poorly represented inthe EMG (Fig. 5, G and M). Thus one possibility is that thespectral power and internal coherence associated with this bandis a general feature of arousal and is not specific to eitherwhisking or vibrissa areas in the brain. To test this possibility,we calculated two measures of field potential, denoted the�LFP, that spanned the brain and encompassed multiple sen-sory modalities. The first measure of the �LFP spanned theparietal to the occipital areas of the neocortex (Fig. 6A). Wefound that the high-frequency component was essentially ab-sent in the spectral power of the global �LFP signal for any ofthe exploratory states, i.e., paused (Fig. 6B), small whisking(Fig. 6C), or medium whisking (Fig. 6C). The second measureof the �LFP spanned parietal cortex to the cerebellum (Fig.6D). We again found that the high-frequency component wasessentially absent in the spectral power of the global �LFPsignal for the exploratory states (Fig. 6, E–G). These dataimply that the power in the local cerebellar and neocortical�LFP signals at high frequencies, and, by inference, the co-herence between these signals at high frequencies, is specifi-cally related to whisking.
Dominant pattern of spectral coherence during whisking
Our analysis so far concerned the magnitude of the pair-wisecoherence among the three recording sites (Fig. 1). We nowconsider the spatial distribution of the phase as well as themagnitude across all sites as a means to gain insight into thepatterns of coherence that emerge when animals whisk freelyin air. The set of coherences between all pair-wise combina-tions of recording sites at a particular frequency, f, can beexpressed in the form of a 3 � 3 Hermitian matrix whoseelements are the values of the coherence, Cxy( f ). We denotethis complex matrix C( f ), which can formally be expanded asC( f ) � U( f ) �( f ) [U(f )] †, where the columns of U( f ), denotedUi( f ), are the eigenmodes, the diagonal elements of �( f ),denoted ��( f ), are the eigenvalues, and “†” signifies Hermetianconjugation. The dominant mode at each frequency was foundas the leading eigenvalue of the matrix of coherences.
For the spectral bands from 6 to 10 Hz and from 15 to 19 Hz,the leading eigenmode captured �75% of the total variance.These frequency bands correspond to peaks in the two inde-pendent coherence spectra (Fig. 5, L and R). The leadingcomponent of the eigenmodes was averaged within a frequencyband, and the average modes are shown in Fig. 7, A and B,respectively (the length of the arrow is proportional to themagnitude of the response and the direction of the arrow isproportional to the relative phase-angle). The essential result isthat the phase of the vibrissa rhythm substantially lags that ofthe brain areas for the 6- to 10-Hz band, with a phase differ-ence of 0.55 � rad (Fig. 7A). The difference corresponds to apeak in the brain signals when the whiskers begin to protract
2143INTERNAL SIGNALING IN THE VIBRISSA SYSTEM
J Neurophysiol • VOL 87 • APRIL 2002 • www.jn.org

from the retracted position. In contrast, the phase of the vibris-sae are nearly commensurate with that of the brain areas for the15- to 19-Hz band, with a phase difference of �0.03 � rad
(Fig. 7B). These phase relations, near synchronous electricalactivity in vibrissa areas of cerebellum and neocortex in bothfrequency bands with a phase lag between brain activity and
FIG. 5. The trial-averaged spectral power in vibrissa movement (rectified EMG) and in the cerebellar and neocortical responses,�LFP, during different behaviors along with the magnitude of the spectral coherence among these measures. The error bars are �1SD, computed as jackknife estimates over all trails. The 95% confidence intervals were computed under the assumption ofindependent events. Note the agreement among the 2 statistics, i.e., 95% confidence is approximately equal to 2�. A–F: epochsduring which the animal pauses, and stays essentially immobile, during exploration (n � 259). The essentially flat EMG confirmsthe absence of whisking. Note also the strong spectral peak in the cerebellar response. Inset: the EMG response during chewingas a control to show that it does not contribute to the vibrissa response. G–L: epochs associated with small whisking movementsduring exploration (n � 134). Note the severe drop in cerebellar spectral power and the increase in neocortical power betweenpaused and small whisking. M–R: epochs associated with medium whisking movements during exploration (n � 357). The responseis qualitatively similar to that during small whisking.
2144 S. M. O’CONNOR, R. W. BERG, AND D. KLEINFELD
J Neurophysiol • VOL 87 • APRIL 2002 • www.jn.org

vibrissa motion only for the low frequency band, were ob-served in all three animals.
D I S C U S S I O N
We observed that the internal coherence among the fieldpotential activity of vibrissa sensory areas in the brain isrelatively high as the animals whisks in search of a target.Thirty to 40% of the activity between vibrissa cerebellum andneocortex is correlated during such whisking (Fig. 4, L and R).In contrast to the high internal coherence, there was significantyet small coherence between the rhythmic activity in eithervibrissa cerebellum or vibrissa S1 cortex and rhythmic whisk-ing (Fig. 5, J and P, and K and Q, respectively). These dataimply that the major fraction of coherent signaling betweenvibrissa cerebellum and vibrissa S1 cortex is incoherent withwhisking, even though signaling among the brain regions andwhisking share common frequency bands (Fig. 7, A and B).
Relation to previous cerebellar studies
The participation of the cerebellum in vibrissa somatosen-sation was highlighted by Welker and colleagues (Shambes etal. 1978; see also Bower et al. 1981; Kennedy et al. 1966;Morisette and Bower 1996), and the role of signaling withinthe vibrissa sensory area of the cerebellum was addressed inthe awake animal studies of Hartmann and Bower (1998).
Here, we find that the vibrissa areas of cerebellum exhibitedbroadband oscillations, i.e., in the 5- to 10-Hz and 15- to 20-Hzranges, in both the pause state, during which the rat is immo-bile for a period of 1 s during exploration, as well as in thetwo whisking states (Fig. 5, B, H, and N). Critically, thecerebellar oscillation in the whisking states is significantlymodulated in phase with both rhythmic whisking and electricaloscillations in vibrissa neocortex (Fig. 5, L and R).
Our observation of spectral power in the �6- to 10-Hzfrequency range (Fig. 5, B, H, and N) is consistent with thatfound in recordings from semi-intact or anesthetized prepara-tions from a variety of species (Bell and Kawasaki 1972;Bloedel and Ebner 1984; Llinas and Sasaki 1989; Llinas andYarom 1986) as well as the awake behaving rat (Hartmann andBower 1998; Lang et al. 1999; Welsh et al. 1995). In agree-ment with the conclusions from the studies of Hartmann andBower (1998), we found that oscillatory activity in the pausestate was particularly strong (Fig. 5B). However, in contrast tothe claims by these authors, we found that such activity persistswhen the animals are mobile and whisking, albeit at an ampli-tude that is reduced by a factor of 7–8 from that in the pausestate (cf. Fig. 5, B with H and N). This difference in conclu-sions appears to result from the increased instrumental sensi-tivity in the present study.
Strong rhythmic cerebellar activity is present in the pausestate, while cortical activity is both weak and spectrally flat(Fig. 5). This result supports the conclusion of Llinas andWelsh (Lang et al. 1999; Welsh et al. 1995) that was derived
FIG. 6. The magnitude of the trial-averaged spectral power of the global LFP recorded across brain areas. This differential signalis denoted as the �LFP. A: schematic of the placement of extracellular electrodes for recording the �LFP between parietal andoccipital cortex. The parietal signal was an average of 3 microwires that were placed in the vibrissa area of parietal cortex (Fig.3B) and the occipital signal was from a single microwire. B: the spectral power for epochs during which the animal is paused (n �259). C: the spectral power for epochs associated with small whisking during exploration (n � 134). D: the spectral power forepochs associated with medium whisking during exploration (n � 357). E: schematic of the placement of extracellular electrodesfor recording the �LFP between parietal cortex and the cerebellum. The parietal signal was an average of 3 microwires, as in A,and the cerebellar signal was an average of 3 microwires in the vibrissa are of the cerebellum (Fig. 3B). F: the spectral power forepochs during which the animal is paused. G: the spectral power for epochs associated with small whisking. H: the spectral powerfor epochs associated with medium whisking.
2145INTERNAL SIGNALING IN THE VIBRISSA SYSTEM
J Neurophysiol • VOL 87 • APRIL 2002 • www.jn.org

from studies on cerebellar activity in animals trained in atongue licking task. In particular, we echo their conclusion that“ the olivocerebellar system is capable of generating periodicpatterns of synchronous activity in the awake animal.” Wecannot, however, rule out the possibility that the rhythmic driveto the cerebellum lies outside this hindbrain system, although amore likely scenario is that a olivocerebellar oscillator simplylocks with other oscillators in the vibrissa sensorimotor system.
Relation to past work on unit recording from vibrissa S1cortex
The relationship between the EMG and the spike outputfrom units in vibrissa S1 cortex for rats trained to perform thesame task as used in the present work has been reported (Feeet al. 1997). In that study, the electrodes were lowered andsignals were collected and stored without bias as to the re-sponse properties of the units. The final single-unit responsesexhibited a wide distribution of responses to changes invibrissa position. A significant correlation between the spikearrival times and the peaks of the EMG was observed for 57%of the single units (n � 107). The magnitude of the coherenceat the whisking frequency varied between units and rangedfrom undetectable, �C� � 0.02, to a value of �C� � 0.65. Thephase of the coherence was distributed among all angles butbiased between ��/2 and � rad (Fig. 7C). For some units, thecombination of spike rate and correlation were high enough sothat the output of a single unit could reliably predict theposition of the vibrissae.
The mean phase between the vibrissa position and the cor-tical single-unit response was determined from the publisheddata (Fee et al. 1997) to compute the vector average of thecoherence between the EMG and unit response. We found thatthe magnitude of the average coherence was 0.05 at the �8-Hzwhisking frequency in that experiment (Fig. 7C), equal to thesame value for the �LFP data at 8 Hz (Fig. 5Q). We furtherfound that the phase-angle between the EMG and the spikedata were 0.72 � rad, close to the value 0.55 � rad that foundfor the LFP data (cf. Fig. 7A). We conclude that the �LFP datafaithfully reports a signal given by the average unit responseand that the average modulation of the electrical activity invibrissa S1 cortex by whisking is �0.1. It remains to bedetermined if the modulation in spike rate is increased oncontinual contact during whisking, as occurs, e.g., in a rough-ness discrimination task (Carvell and Simons 1990; Guic-Robles et al. 1989).
The relatively small coherence between whisking in air andthe electrical response in vibrissa S1 cortex (Fig. 3Q) mayappear paradoxical in light of the large, punctate response thatis reported for stimulus-induced activity in S1 cortex withanesthetized animals (Armstrong-James and Fox 1987; Arm-strong-James et al. 1992; Simons 1978, 1985; Welker et al.1993), sessile animals (Nicolelis et al. 1995), and awake butimmobilized animals (Kleinfeld et al. 2000; Sachdev et al.1998). We note only that the cortical response during activemovement of the vibrissae need not be the same as the responseto direct stimulation.
Functional role of the intrinsic oscillations
Our results indicate that there is substantial internal signal-ing between the vibrissa areas of cerebellum and S1 cortexwithin the 5- to 10-Hz and 15- to 20-Hz frequency bands. Themagnitude of this signaling is tied to the presence of whiskingalthough it is not phase locked to the whisking motion. Thecoexistence of broadband signals that share the same frequencyband is a common feature of modern communication systems(Viterbi 1995). However, we can only speculate about thenature of the signaling between these areas in the sensorimotor
FIG. 7. Summary of strength and relative phase between the vibrissae,the vibrissa area of cerebellum, and the vibrissa area of S1 cortex. A: themagnitudes and phases of the dominant mode of the coherence between 6and 10 Hz. The 3 elements of U1( f ) are plotted as phasors as a function offrequency; the length of each arrow is the magnitude of the coherence andthe direction refers to the relative phase. Note that different brain areas aresynchronized among each other but out of phase with whisking. The lightgray arrow for the vibrissa area of S1 cortex represents the phase derivedfrom the spike data in C. B: the magnitudes and phases of the dominantmode between 15 and 19 Hz. Note that different brain areas are essentiallysynchronized among each other. C: reevaluation of the single unit data ofFee et al. (1997), obtained during a whisking task similar to that in thepresent study. The magnitude and phase of the coherence between the spikesignal and the peak of the EMG is plotted on polar coordinates. There are107 units in this average, of which 61 had values of coherence that weresignificantly larger than 0. The average coherence had a magnitude of 0.049with a phase of � � �0.74 rad.
2146 S. M. O’CONNOR, R. W. BERG, AND D. KLEINFELD
J Neurophysiol • VOL 87 • APRIL 2002 • www.jn.org

loops. One possibility is that the internal signal may be areference signal that is part of a phase-sensitive detectionscheme to report vibrissa position (Ahissar and Kleinfeld 2002;Ahissar et al. 1997; Kleinfeld et al. 1999; Marr 1969). In thisscheme, the internal signal is used to demodulate an incomingrhythmic input such that an error signal is generated when thevibrissa change their motion, as occurs on contact with anobject.
We thank T. H. Bullock and F. F. Ebner for comments on early aspects ofthis work, E. Brown and M. R. Jarvis for introducing us to asymptoticestimates of confidence intervals, S. Hefler for assistance with the animalhusbandry and histology, and B. Friedman for comments on the manuscript.
This work was supported by the Whitehall Foundation, the National Instituteof Mental Health, and a National Institutes of Health predoctoral training grantto S. M. O’Connor.
Present address of S. M. O’Connor: Science Applications InternationalCorp., San Diego, CA 92037.
REFERENCES
AHISSAR E, HAIDARLIU S, AND ZACKENHOUSE M. Decoding temporally encodedsensory input by cortical oscillators and thalamic phase comparators. ProcNatl Acad Sci USA 94: 11633–11638, 1997.
AHISSAR E AND KLEINFELD D. Closed loop neuronal computations: focus onvibrissa somatosensation in rat. Cerebral Cortex. In press.
ARMSTRONG-JAMES M AND FOX K. Spatiotemporal convergence and diver-gence in the rat S1 “barrel” cortex. J Comp Neurol 263: 265–281, 1987.
ARMSTRONG-JAMES M, FOX K, AND DAS-GUPTA A. Flow of excitability withinbarrel cortex on striking a single vibrissa. J Neurophysiol 68: 1345–1356,1992.
ARMSTRONG-JAMES M AND GEORGE MJ. Bilateral receptive fields in rat Sm1cortex. Exp Brain Res 70: 155–165, 1988a.
ARMSTRONG-JAMES M AND GEORGE MJ. Influence of anesthesia on spontane-ous activity and receptive field size of single units in rat Sm1 neocortex. ExpNeurol 99: 369–387, 1988b.
BELL CC AND KAWASAKI T. Relations among climbing fiber responses ofnearby Purkinje cells. J Neurophysiol 35: 155–169, 1972.
BLOEDEL JR AND EBNER TJ. Rhythmic discharge of climbing fiber afferents inresponse to natural peripheral stimuli in the cat. J Physiol (Lond) 352:129–146, 1984.
BOWER JM, BEERMAN DH, GIBSON JM, SHAMBES GM, AND WELKER W.Principles of organization of a cerebro-cerebellar circuit. Micromapping theproections from cerebral (SI) to cerebellar (granule cell layer) tactile areasof rats. Brain Behav Evol 18: 1–18, 1981.
BRAITENBERG V AND SCHUZ A. Anatony of the Cortex: Statistics and Geometry.Berlin: Springer-Verlag, 1991.
CACCIATORE TW, BRODFUEHER PD, GONZALEZ JE, JIANG T, ADAMS SR, TSIEN
RY, KRISTAN WB JR, AND KLEINFELD D. Identification of neural circuits byimaging coherent electrical activity with FRET-based dyes. Neuron 23:449–459, 1999.
CARVELL GE AND SIMONS DJ. Biometric analyses of vibrissal tactile discrim-ination in the rat. J Neurosci 10: 2638–2648, 1990.
CARVELL GE, SIMONS DJ, LICHTENSTEIN SH, AND BRYANT P. Electromyo-graphic activity of mystacial pad musculature during whisking behavior inthe rat. Somatosens Mot Res 8: 159–164, 1991.
CHAPIN JK AND LIN C-S. Mapping the body representation in the SI cortex ofanesthetized and awake rats. J Comp Neurol 229: 199–213, 1984.
DORFL J. The musculature of the mystacial vibrissae of the white mouse. J Anat135: 147–154, 1982.
DORFL J. The innervation of the mystacial region of the white mouse. Atopographical study. J Anat 142: 173–184, 1985.
ECKHORN R, BAUER R, JORDAN W, BRROSCH M, KRUSE W, MUNK M, AND
REITBOECK HJ. Coherent oscillations: a mechanism of feature linking in thevisual cortex? Biol Cybern 60: 121–130, 1988.
FEE MS, MITRA PP, AND KLEINFELD D. Central versus peripheral determinatesof patterned spike activity in rat vibrissa cortex during whisking. J Neuro-physiol 78: 1144–1149, 1997.
FRIEDMAN-HILL S, MALDONADO PE, AND GRAY CM. Dynamics of striatecortical activity in the alert macaque. I. Incidence and stimulus dependenceof gamma-band neuronal oscillations. Cereb Cortex 10: 1105–1116, 2000.
FRIES P, REYNOLDS JH, RORIE AE, AND DESIMONE R. Modulation of oscillatoryneuronal synchronization by selective attention. Science 291: 1560–1563,2001.
GRAY CM, KONIG P, ENGEL AK, AND SINGER W. Oscillatory responses in catvisual cortex exhibit inter-columnar synchronization which reflects globalstimulus properties. Nature 338: 334–337, 1989.
GUIC-ROBLES E, VALDIVIESO C, AND GUAJARDO G. Rats can learn a roughnessdiscrimination using only their vibrissal system. Behav Brain Res 31:285–289, 1989.
HARTMANN MJ AND BOWER JM. Oscillatory activity in the cerebellar hemi-spheres of unrestrained rats. J Neurophysiol 80: 1598–1604, 1998.
HATTOX AM, PRIEST CA, AND KELLER A. Functional circuitry involved in theregulation of whisker movements. J Comp Neurol 442: 266–276, 2001.
IZHIKEVICH EM. Weakly connected quasi-periodic oscillations, FM interac-tions, and multiplexing in the brain. SIAM J App Math 59: 2193–2223, 1999.
JARVIS MR AND MITRA PP. Sampling properties of the spectrum and coherencyof sequences of action potentials. Neural Computat 13: 717–749, 2001.
KENNEDY TT, GRIMM RJ, AND TOWE AL. The role of cerebral cortex in evokedsomatosensory activity in cat cerebellum. Exp Neurol 14: 13–32, 1966.
KLEIN B AND RHOADES R. The representation of whisker follicle intrinsicmusculature in the facial motor nucleus of the rat. J Comp Neurol 232:55–69, 1985.
KLEINFELD D, BERG RW, AND O’CONNOR SM. Anatomical loops and theirrelation to electrical dynamics in relation to whisking by rat. SomatosensMot Res 16: 69–88, 1999.
KLEINFELD D, SACHDEV RNS, AND EBNER FF. Rhythmic stimulation of thevibrissae modulates the spike rate of units in primary motor cortex of awakerat. In: Society for Neuroscience Annual Meeting, New Orleans, LA, 2000.
KREITER AK AND SINGER W. Stimulus-dependent synchronization of neuronalresponses in the visual cortex of the awake macaque monkey. J Neurosci 16:2381–2396, 1996.
LANG EJ, SUGIHARA I, WELSH JP, AND LLINAS R. Patterns of spontaneousPurkinje cell complex spike activity in the awake rat. J Neurosci 27:2718–2739, 1999.
LLINAS R AND SASAKI K. The functional organization of the olivo-cerebellarsystem as examined by multiple Purkinje cell recordings. Eur J Neurosci 1:587–602, 1989.
LLINAS R AND YAROM Y. Oscillatory properties of guinea pig inferior olivaryneurons and their pharmacological modulation: an in vitro study. J Physiol(Lond) 376: 163–182, 1986.
MARR D. A theory of cerebral cortex. J Physiol (Lond) 202: 437–470, 1969.MIYASHITA E, KELLER A, AND ASANUMA H. Input-output organization of the rat
vibrissal motor cortex. Exp Brain Res 99: 223–232, 1994.MORISETTE J AND BOWER JM. Contribution of somatosensory cortex to re-
sponses in the rat cerebellum granule cell layer following peripheral tactilestimulation. Exp Brain Res 109: 240–250, 1996.
NATIONAL INSTITUTES OF HEALTH. Guide for the Care and Use of LaboratoryAnimals. Bethesda: National Institutes of Health, 1985, NIH Publication85-23.
NICOLELIS MAL, BACCALA LA, LIN RCS, AND CHAPIN JK. Sensorimotorencoding by synchronous neural ensemble activity at multiple levels of thesomatosensory system. Science 268: 1353–1358, 1995.
PRECHTL JC. Visual motion induces synchronous oscillations in turtle visualcortex. Proc Natl Acad Sci USA 91: 12467–12471, 1994.
PRECHTL JC, COHEN LB, MITRA PP, PESARAN B, AND KLEINFELD D. Visualstimuli induce waves of electrical activity in turtle cortex. Proc Natl AcadSci USA 94: 7621–7626, 1997.
ROELFSEMA PR, ENGEL AK, KONIG P, AND SINGER W. Visuomotor integrationis associated with zero time-lag synchronization among cortical areas.Nature 385: 157–161, 1997.
SACHDEV RNS, JENKINSON EW, AND EBNER FF. Response properties of barrelfield neurons in awake, behaving rat. In: Society for Neuroscience AnnualMeeting, Los Angeles, CA, 1998.
SACHDEV RNS, JENKINSON E, ZEIGLER HP, AND EBNER FF. Sensorimotorplasticity in the rodent vibrissa system. In: The Mutable Brain, edited byKass J. San Diego: Academic, 2000, p. 123–164.
SEMBA K AND KOMISARUK BR. Neural substrates of two different rhythmicalvibrissal movements in the rat. Neuroscience 12: 761–774, 1984.
SHAMBES GM, GIBSON JM, AND WELKER W. Fractured somatotopy in granulecell tactile areas of rat cerebellar hemispheres revealed by micromapping.Brain Behav Evol 15: 94–140, 1978.
SIMONS DJ. Response properties of vibrissal units in rat S1 somatosensoryneocortex. J Neurophysiol 41: 798–820, 1978.
2147INTERNAL SIGNALING IN THE VIBRISSA SYSTEM
J Neurophysiol • VOL 87 • APRIL 2002 • www.jn.org

SIMONS DJ. Multi-whisker stimulation and its effects on vibrissa units in ratSmI barrel cortex. Brain Res 276: 178–182, 1983.
SIMONS DJ. Temporal and spatial integration in the rat SI vibrissa cortex.J Neurophysiol 54: 615–635, 1985.
THOMSON DJ. Spectral estimation and harmonic analysis. Proc IEEE 70:1055–1096, 1982.
THOMSON DJ AND CHAVE AD. Jackknifed error estimates for spectra, coher-ences, and transfer functions. In: Advances in Spectrum Analysis and ArrayProcessing, edited by Shykin S. Englewood Cliffs, NJ: Prentice Hall, 1991,p. 58–113.
VITERBI AJ. CDMA: Principles of Spread Spectrum Communication. NewYork: Addison Wesley Longman, 1995.
WELKER C. Microelectrode delineartion of fine grain somatotopic neocortex ofthe rat. Brain Res 26: 259–275, 1971.
WELKER E, ARMSTRONG-JAMES M, VAN DER LOOS H, AND KRAFTSIK R. Themode of activation of a barrel column: response properties of single units inthe somatosensory cortex of the mouse upon whisker deflection. Eur J Neu-rosci 5: 691–712, 1993.
WELSH JP, LANG EJ, SUGIHARA I, AND LLINAS R. Dynamic organization ofmotor control within the olivocerebellar system. Nature 374: 453–457,1995.
WOOLSEY TA, WELKER C, AND SCHWARTZ RH. Comparative anatomical stud-ies of the SmI face cortex with special reference to the occurrence of“barrels” in layer IV. J Comp Neurol 164: 79–94, 1974.
2148 S. M. O’CONNOR, R. W. BERG, AND D. KLEINFELD
J Neurophysiol • VOL 87 • APRIL 2002 • www.jn.org