Cognitive and emotional mathematics learning problems in ...
248
Cognitive and emotional mathematics learning problems in primary and secondary school students Amy Jane Devine Darwin College Department of Psychology This dissertation is submitted to the University of Cambridge for the degree of Doctor of Philosophy. October 2017
-
Upload
khangminh22 -
Category
Documents
-
view
4 -
download
0
Transcript of Cognitive and emotional mathematics learning problems in ...

Cognitive and emotional mathematics learning problems in primary and secondary school students
Amy Jane Devine
Darwin College
Department of Psychology
This dissertation is submitted to the University of Cambridge for the degree of Doctor of Philosophy.
October 2017

i
Cognitive and emotional mathematics learning problems in primary and secondary school students.
Amy Devine
This thesis systematically examined the link between developmental dyscalculia, a specific learning difficulty of mathematics, and mathematics anxiety, a negative emotional reaction to mathematics tasks. The link between these maths learning issues was examined by measuring their prevalence in large samples of English primary (N = 1004; N= 830) and secondary school (N = 927) students. Gender differences were also explored.
Systematically varying diagnostic criteria for dyscalculia revealed that its prevalence ranged between 0.89-17.23 percent. When absolute performance thresholds were used, there was no gender difference in dyscalculia prevalence.
The association of mathematics performance with other cognitive skills and mathematics anxiety was investigated longitudinally in subsamples of children with dyscalculia (n =10), typical mathematics performance (n=10) and high maths ability (n = 11). 80 percent of the children in the dyscalculia group still met the criteria for diagnosis at the final time point. Mathematics performance was positively associated with working memory performance and negatively associated with mathematics anxiety. Furthermore, children with dyscalculia had higher maths anxiety than the other two groups.
The relationship between dyscalculia and high maths anxiety was estimated in a larger sample (N = 1757). Relatively few children with dyscalculia had high maths anxiety and the majority of students with high maths anxiety in fact had mathematics performance within or above the average range. Girls had higher maths anxiety than boys, and more girls had both dyscalculia and maths anxiety than boys. There was an expected negative correlation between maths anxiety and maths performance in the total sample, but this correlation was negligible in the children with dyscalculia.
Collectively, these results suggest that cognitive and emotional mathematics problems are dissociable, and indicate that children with dyscalculia and maths anxiety likely require different types of intervention. Furthermore there appears to be no gender difference in maths performance or in the prevalence of dyscalculia. However, girls have higher maths anxiety than boys, and are more likely to be affected by maths anxiety alongside developmental dyscalculia. Maths anxiety may be a potential explanation for the underrepresentation of females in careers involving mathematics.

ii
Preface
• This dissertation is the result of my own work and includes nothing which is the
outcome of work done in collaboration except as declared in the Preface and specified
in the text.
• The data analysed in Chapters Two and Three was published in:
o Devine, A., Soltész, F., Nobes, A., Goswami, U., & Szűcs, D. (2013). Gender
differences in developmental dyscalculia depend on diagnostic criteria.
Learning and Instruction, 27, 31–39. doi:10.1016/j.learninstruc.2013.02.004.
As a journal author, I retain rights to include the above article in full or part in a thesis
(provided that this is not to be published commercially), without needing to obtain
specific permission from Elsevier.
• Chapter Four includes data from previously published work:
o Szűcs, D., Devine, A., Soltesz, F., Nobes, A., & Gabriel, F. (2013).
Developmental dyscalculia is related to visuo-spatial memory and inhibition
impairment. Cortex, 49, 2674–2688. doi:10.1016/j.cortex.2013.06.007
o Szűcs, D., Devine, A., Soltesz, F., Nobes, A., & Gabriel, F. (2014). Cognitive
components of a mathematical processing network in 9‐year‐old children.
Developmental Science, 17, 506–524. doi:10.1111/desc.12144.
However, Chapter Four only includes a small portion of the previously published data
as part of a longitudinal analysis and contains no third-party copyright material.
Moreover, the analysis and research questions in Chapter Four differ to the previously
published work.

iii
• Some of the findings, figures, tables and text presented in Chapters Five and Six have
been published previously and require the following credit line which is also provided
in footnotes on the first pages of these chapters:
Copyright © 2017 by the American Psychological Association. Reproduced with
permission. The official citation that should be used in referencing this material is
Devine, A., Hill, F., Carey, E., & Szűcs, D. Cognitive and emotional math problems
largely dissociate: Prevalence of developmental dyscalculia and mathematics anxiety,
Journal of Educational Psychology. Advance online publication.
doi: http://dx.doi.org/10.1037/edu0000222. The use of APA information does not
imply endorsement by APA. No further reproduction or distribution is permitted
without written permission from the American Psychological Association.
• It is not substantially the same as any that I have submitted, or, is being concurrently
submitted for a degree or diploma or other qualification at the University of
Cambridge or any other University or similar institution except as declared in the
Preface and specified in the text. I further state that no substantial part of my
dissertation has already been submitted, or, is being concurrently submitted for any
such degree, diploma or other qualification at the University of Cambridge or any
other University of similar institution except as declared in the Preface and specified
in the text.
• It does not exceed the prescribed word limit of 60 000 words for the Biological
Sciences Degree Committee.

iv
Acknowledgements
Firstly, I would like to thank my supervisor Dr Dénes Szűcs for seeing my academic potential and encouraging me to take on a part-time PhD while working on his funded research. Of course, I also am extremely grateful to Dénes for providing his expertise and guidance throughout the course of this research, particularly an emphasis on rigorous methodology, data analysis, and critique of extant work in the field. These skills have been invaluable in my development as a researcher.
I also express sincere gratitude to my advisor Prof. Usha Goswami for her additional encouragement, and constructive feedback on my work and research presentations. I am also grateful to my examiners Prof. Melissa Hines and Dr Ann Dowker for their invaluable input for improving this thesis.
I thank the Medical Research Council and Nuffield Foundation for providing the funding for the projects and my research assistantship which enabled me to collect the data for this thesis. I hope these funding bodies are happy with our research output! (12 papers and counting…)
I also extend my thanks to the schools and families that took part in the research, all of whom were very accommodating in allowing me into their classes/ homes for “just one more testing session”. Their interest and enthusiasm enabled things to run smoothly and made working with them a real joy.
Special thanks to the Centre for Neuroscience in Education researchers and students who helped with the data collection: Alison Nobes, Florence Gabriel, Francesca Hill, Emma Carey, Jack Clearman, Timothy Myers, and Swiya Nath; and to CNE secretary Nichola Daily for her continuous support (professionally and personally!). I thank all the CNE members (past and present), for their moral support and for their helpful feedback on my project during lab presentations.
I also thank my friends and colleagues near and far for their support and patience over the years while I completed this work. In particular, I thank my friends who have put up with my sporadic contact in recent years, as well as those that completed their doctoral work several years prior to me, namely, Drs Stacey Gutkowski, Clare Killikelly, Sean McConnell, Natalie Renney, Karen Tustin– these people were a real inspiration.
Special thanks to Dr Fruzsina Soltész for believing in me from the very beginning. I really could not have got through this project without her boundless support, including the Matlab lessons, theoretical discussions, and strong espressos. I know it sounds cheesy but I’m also very grateful for those puns.
Finally, I would like to thank my family for their love and support, especially my parents Richard and Carol Devine, and my aunts Sharon and Alayne Wright.

v
Table of Contents Abstract.......................................................................................................................................... i
Preface .......................................................................................................................................... ii
Acknowledgements ........................................................................................................................ iv
List of Figures ................................................................................................................................ x
List of Tables ...............................................................................................................................xii
List of Appendices ...................................................................................................................... xiii
1. Chapter One. Introduction ............................................................................................................. 1
1.1 Developmental Dyscalculia......................................................................................................... 2
1.1.1 Definitions ........................................................................................................................... 2
1.1.2 Prevalence ............................................................................................................................ 3
1.1.3 Theories of DD ...................................................................................................................17
1.2 Mathematics Anxiety .................................................................................................................20
1.2.1 Definitions ..........................................................................................................................20
1.2.2 Prevalence ...........................................................................................................................23
1.2.3 MA and performance/achievement .....................................................................................24
1.2.4 Theories of MA ...................................................................................................................27
1.3 Gender differences .....................................................................................................................33
1.3.1 Mathematics and reading performance ...............................................................................33
1.3.2 DD ......................................................................................................................................36
1.3.3 MA ......................................................................................................................................37
1.3.4 Theories of gender differences ............................................................................................41
1.4 Current study and outline of thesis .............................................................................................43
2. Chapter Two. Prevalence of DD in the United Kingdom. ...........................................................46
2.1.1 The current study ................................................................................................................48
2.2 Method .......................................................................................................................................48
2.2.1 Participants .........................................................................................................................48
2.2.2 Measures .............................................................................................................................50
2.2.3 Procedure ............................................................................................................................50

vi
2.2.4 Data analysis .......................................................................................................................51
2.3 Results........................................................................................................................................52
2.3.1 Analysis of distributions .....................................................................................................52
2.3.2 The effect of criterion levels on the identified prevalence of DD ........................................54
2.4 Discussion ..................................................................................................................................58
2.4.1 Mathematics and reading performance ...............................................................................58
2.4.2 Prevalence of DD ................................................................................................................59
2.5 Summary ....................................................................................................................................62
3. Chapter Three. Gender differences in DD ...................................................................................63
3.1.1 The current study ................................................................................................................64
3.2 Method .......................................................................................................................................65
3.2.1 Participants .........................................................................................................................65
3.2.2 Measures .............................................................................................................................65
3.2.3 Procedure ............................................................................................................................65
3.2.4 Data analysis .......................................................................................................................65
3.3 Results........................................................................................................................................66
3.3.1 Analysis of distributions .....................................................................................................66
3.3.2 Comparison of means..........................................................................................................72
3.3.3 The effect of criterion levels on the gender ratio of DD. .....................................................72
3.4 Discussion ..................................................................................................................................76
3.4.1 Gender ratio of DD: The impact of mathematics and control variable cut-offs. ..................76
3.4.2 Mathematics/ reading performance and gender ..................................................................77
3.5 Summary ....................................................................................................................................79
4. Chapter Four Persistence of developmental dyscalculia and associated cognitive deficits.. ....81
4.1.1 Longitudinal studies of DD .................................................................................................81
4.1.2 Cognitive skills associated with mathematical processing ..................................................84
4.1.3 The current study ................................................................................................................86
4.2 Method .......................................................................................................................................87
4.2.1 Screening ............................................................................................................................87

vii
4.2.2 Individual assessment .........................................................................................................88
4.2.2.1 Measures .....................................................................................................................88
4.2.3 Participants .........................................................................................................................93
4.2.4 Data analysis .......................................................................................................................93
4.3 Results........................................................................................................................................94
4.3.1 Age, SES, and IQ ................................................................................................................94
4.3.2 Group membership over time ..............................................................................................97
4.3.3 Correlations. ......................................................................................................................100
4.3.4 Repeated measures ANOVAs. ..........................................................................................103
4.3.5 Maths anxiety. ...................................................................................................................106
4.3.6 Alternative analyses. .........................................................................................................109
4.4 Discussion ................................................................................................................................111
4.5 Summary ..................................................................................................................................116
5. Chapter Five. The relationship between developmental dyscalculia and maths anxiety ........117
5.1.1 The current study ..............................................................................................................118
5.2 Method .....................................................................................................................................119
5.2.1 Participants .......................................................................................................................119
5.2.2 Measures ...........................................................................................................................120
5.2.3 Procedure ..........................................................................................................................120
5.2.4 Grouping of children .........................................................................................................121
5.2.5 Data analysis .....................................................................................................................121
5.3 Results......................................................................................................................................122
5.3.1 Prevalence of high MA .....................................................................................................122
5.3.2 Prevalence of DD ..............................................................................................................126
5.3.3 Relation between DD and MA. .........................................................................................128
5.4 Discussion ................................................................................................................................133
5.4.1 Prevalence of high MA and DD. .......................................................................................133
5.4.2 Relationship between DD and MA ..................................................................................134
5.5 Summary ..................................................................................................................................136

viii
6. Chapter Six. Gender differences in MA and DD .......................................................................137
6.1.1 The current study ..............................................................................................................138
6.2 Method .....................................................................................................................................139
6.2.1 Participants .......................................................................................................................139
6.2.2 Measures ...........................................................................................................................139
6.2.3 Procedure ..........................................................................................................................140
6.2.4 Grouping of children .........................................................................................................140
6.2.5 Data analysis .....................................................................................................................140
6.3 Results......................................................................................................................................141
6.3.1 Reading and mathematics performance.............................................................................141
6.3.2 MA ....................................................................................................................................146
6.3.3 DD prevalence. .................................................................................................................148
6.3.4 DD and MA comorbidity. .................................................................................................150
6.3.5 MA and maths performance relationship. .........................................................................152
6.4 Discussion ................................................................................................................................154
6.5 Summary ..................................................................................................................................156
7. Chapter Seven. General Discussion ............................................................................................157
7.1 Main findings ...........................................................................................................................157
7.1.1 DD definitions, prevalence, and gender ratio ....................................................................157
7.1.2 DD stability .......................................................................................................................158
7.1.3 Cognitive skills associated with maths performance .........................................................159
7.1.4 MA definitions, prevalence, and gender differences .........................................................160
7.1.5 Relationship between DD and MA, and gender ratio ........................................................162
7.1.6 Gender – integration of findings .......................................................................................163
7.2 Implications for research and education ...................................................................................167
7.2.1 Definitions of DD and MA ...............................................................................................168
7.2.1 Gender differences in mathematics learning problems ......................................................169
7.2.3 The link between cognitive and emotional mathematics learning problems ....................170
7.2.3.1 Model of MA development .......................................................................................170

ix
7.2.3.2 Implications for the classroom ..................................................................................176
7.3 Research limitations .................................................................................................................179
7.4 Directions for future research ...................................................................................................180
7.5 Conclusions ..............................................................................................................................183
References.........................................................................................................................................186
Appendices .......................................................................................................................................221

x
List of Figures Figure 1. The range of cut-off scores used in experimental DD studies illustrated on the normal
distribution. .............................................................................................................................. 4
Figure 2. The cut-offs used in DD prevalence studies illustrated on the normal distribution. ..............15
Figure 3. Ashcraft, Krause & Hopko’s (2007) proposed framework situating mathematics anxiety
amongst etiological, developmental and educational factors. ..................................................32
Figure 4. Correlation of mathematics and reading performance. .........................................................53
Figure 5. Distributions of mathematics and reading performance ........................................................53
Figure 6. The effect of different reading and maths cut-offs on the number of children diagnosed with
DD ..........................................................................................................................................55
Figure 7. The percentage and number of children in given cut-off cells (A) and the percentage and
number of children in given discrepancy score (mathematics – reading) cut-off cells (B) ......57
Figure 8.The correlation of mathematics and reading standardised scores by gender. .........................67
Figure 9. Frequency (%) histograms for maths and reading, separately ...............................................69
Figure 10. Reading and maths score distributions separately for boys and for girls. ............................69
Figure 11 The distribution of discrepancy scores (maths minus reading scores) (A). The interaction of
gender and domain (B). ...........................................................................................................71
Figure 12. The percentage and number of children in given cut-off cells (A) and the percentage and
number of children in given discrepancy score (mathematics – reading) cut-off cells (B) ......73
Figure 13. Individuals' performance across the three time points in mathematics (A) and reading (B).
Mean performance in mathematics (C) and reading (D) for the three groups. ........................98
Figure 14 Mean mathematics and reading performance for DD, CON and HM children over the three
time points. .............................................................................................................................99
Figure 15. Mean scores in verbal working memory (A) and visuo-spatial working memory (B) for the
three groups. .........................................................................................................................105
Figure 16. Mean spatial orientation (A) and maths anxiety (B) scores for the three groups. ..............107
Figure 17. The relationship between maths anxiety and mathematics performance at the three time
points, shown by group. ........................................................................................................108

xi
Figure 18. The distribution of raw MA scores (A) and the cumulative distribution function of MA
scores (B). ............................................................................................................................124
Figure 19. A normal q-q plot of the mAMAS data, showing the deviation from a normal distribution.
..............................................................................................................................................125
Figure 20. The percentage of DD children with high MA using different DD diagnostic criteria (A)
The correlation between MA and mathematics performance in the whole sample(B). .........131
Figure 21 The probability of having mathematics performance above a certain threshold with different
maths anxiety scores. ............................................................................................................132
Figure 22. Reading performance distributions of primary (A) and secondary (B) students ...............143
Figure 23. Mathematics performance distributions of primary (A) and secondary (B) students ........145
Figure 24. Maths anxiety score distributions for primary students (A) and secondary students (B)...147
Figure 25. Distribution of mathematics anxiety scores for the DD group by gender across both school
levels. ....................................................................................................................................151
Figure 26. Distribution of mathematics anxiety scores for the DD group by gender for primary
students (A) and secondary students (B). ..............................................................................151
Figure 27. Correlation of MA and maths performance for primary school girls (A); primary school
boys (B); secondary school girls (C); and secondary school boys (D) ..................................153
Figure 28. Theoretical model of MA development showing different paths to MA and maths
performance deficits. .............................................................................................................172

xii
List of tables
Table 1. Summary of DD prevalence studies. ...................................................................................... 6
Table 2. Demographic features of the sample. ....................................................................................49
Table 3. Number of children with DD using a certain discrepancy definition, per gender ..................75
Table 4. Design of longitudinal study .................................................................................................92
Table 5. Mean age and ranges (in months) of the groups at the different assessment points ................96
Table 6. Means and standard errors for the IQ measures taken at Time 2 ............................................96
Table 7. Pearson’s correlations between the variables at different time points. .................................102
Table 8. Summary of the alternative ANOVAs excluding different participants. .............................110
Table 9. Frequency of children with DD using different definitions. .................................................127
Table 10. Maths anxiety scores in different groups. ...........................................................................129
Table 11. Number and percentage of children in DD group by gender and year group. ....................149

xiii
List of Appendices Appendix A. Consent form for Project 1. ..........................................................................................220
Appendix B. SES questionnaire for Project 1. ...................................................................................223
Appendix C. mAMAS ......................................................................................................................224
Appendix D. Spatial Orientation Task. ..............................................................................................225
Appendix E. Partial correlations from 4.3.3 .......................................................................................227
Appendix F. Consent form for Project 2 ............................................................................................229
Appendix G Percentiles for each raw score of the mAMAS. .............................................................232

1
1. Chapter One: Introduction
In today's information age, mathematical skills are becoming as important for
everyday life and employment as literacy. However, cross-national research has
suggested that a significant proportion of children and adults have problems acquiring
mathematical skills. This can have large-scale implications, for example, National
Numeracy UK has reported that only 22% of working-age people have functional
maths skills equivalent to a GCSE grade C or above, which suggests that four in every
five people have a low level of numeracy. Higher levels of numeracy are linked to
better health and well-being, higher wages, and better employment opportunities.
Thus, low numeracy in a large proportion of the population results in large monetary
costs to the government, individuals, and employers (National Numeracy, n.d.). Fewer
girls take mathematics beyond GCSE than boys (Smithers, 2014), and women are less
likely to undertake degrees or careers in mathematically-related subjects (OECD,
2014). Hence, research investigating the barriers to the acquisition of mathematical
skills and the uptake of mathematical careers is of great significance.
Mathematical learning impairments of developmental origin are usually
termed mathematical learning disability (MLD) or developmental dyscalculia (DD).
Mathematics anxiety (MA), on the other hand, refers to a debilitating negative
emotional reaction to mathematical tasks, which may occur in children and adults
with and without mathematics learning disabilities (LDs) (Ashcraft, 2002).
Importantly, MA has been linked to an avoidance of careers involving quantitative
skills (Ashcraft, 2002; Ma, 1999).The cognitive and affective factors underpinning
mathematical learning problems are currently hot topics in education, psychology, and
neuroscience research fields, hence the body of published work in these areas is
growing rapidly. Despite this mounting research, there is little agreement on how to
define or diagnose these mathematics learning problems. Furthermore, the causal
origins of both DD and MA remain unclear as prior research findings have supported
competing theories. International research has also revealed inconsistencies with
regard to gender differences in mathematics performance, DD prevalence, and MA.
The current thesis aims to investigate the diagnosis and prevalence of DD and MA,
and gender differences in large samples of UK primary and secondary school
students.

2
Furthermore, the current thesis aims to investigate the link between cognitive
and emotional mathematics problems. It may be commonly thought by people
unfamiliar with MA research that only children and adults who struggle with
mathematics may be anxious about it, however, research to date has not provided
adequate evidence that MA is exclusively linked to poor performance /MLD.
Although much research has focused on the correlation of MA and mathematics
performance across the ability spectrum, little research has specifically investigated
the association between MA and performance within mathematical disability
subgroups or the prevalence of co-occurrence of cognitive and emotional mathematics
problems. The current thesis investigates the association of MA and DD in a large
sample of school students to elucidate whether these cognitive and emotional
mathematics learning problems are closely linked or whether they are in fact
dissociable issues.
1.1 Developmental dyscalculia
1.1.1 Definitions.
Developmental dyscalculia (DD) is a learning difficulty highly specific to
mathematics. Children with DD lag behind their peers in mathematics performance
but otherwise, their general cognitive ability, reading, and writing skills are normal
(Butterworth, 2005). International research has indicated that DD affects between 1.3
and 13% of the population (see section 1.1.2). Surprisingly, research into DD has been
relatively neglected compared to other developmental LDs such as reading disability
(Hanich, Jordan, Kaplan, & Dick, 2001; Mazzocco & Myers, 2003). Consequently,
there is no consensus with regard to how DD should be defined or measured; the
selection criteria and tests used in different studies have varied greatly.
One possible reason for the lack of consensus regarding the definition of DD is
the use of different terminology in the literature. Other common terms include
mathematics/ mathematical/ arithmetic learning disability (MLD or ALD), and
mathematics /arithmetic difficulties. These terms are used interchangeably but often
describe different groups of children (Szűcs & Goswami, 2013). Some researchers
argue that MLD and DD refer to the same population: children with a specific,
biologically-based disorder of mathematical skills, whereas the terms mathematics/
arithmetic difficulties and low achievement are used to refer to a larger group of

3
children (up to the lowest 25-30%) who underperform in mathematics for any of a
number of reasons, including environmental factors (Butterworth & Reigosa-Crespo,
2007; Mazzocco, 2007). However, this distinction is not universally adopted
(Kaufmann et al., 2013). In the current work, we define DD as a specific, severe
deficit of mathematical skills. This is a strictly operational definition of DD which
does not make any theoretical assumptions about its causes.
1.1.2 Prevalence.
In order to estimate the prevalence of DD in the current work, it was necessary
to first review the diagnostic criteria and prevalence rates reported in previous
research. For the purposes of the following review, I discriminated two different kinds
of studies. Firstly, the majority of DD research involves experimental studies, in
which specific hypotheses related to the causal factors and characteristics of DD are
tested in a controlled environment. Secondly, demographic studies measure the
prevalence of DD in a particular population at a particular point in time.
In general, experimental studies have used broad selection criteria for DD,
usually in order to boost samples sizes and to increase the chances of detecting group
differences (Murphy, Mazzocco, Hanich, & Early, 2007). These studies have used
performance cut-offs ranging from the 10th to the 45th percentile (that is, performance
ranging from 1.3 standard deviations, SD, below the mean, up to very near the mean
performance score; Murphy et al. 2007). The range of cut-offs used in experimental
studies is represented in Figure 1. A percentile score represents the value below which
a certain percentage of cases fall (i.e., a cut-off at the 45th percentile would represent
the lowest performing 45% of the sample). Therefore, studies using cut-offs of 10 –
45% are inconsistent with the estimated prevalence of DD of between 1.3 and 13%.
Furthermore, using broader selection criteria increases the likelihood of including
children who show lower than average mathematics performance but do not have
clinical MLD or whose mathematics performance is, in fact, within the average range.
Problems with lenient cut-offs are further exacerbated by the fact that children's
mathematical performance can naturally fluctuate in the normal range around the
mean (e.g. in a ±0.5 or ±1 SD range).

4
Figure 1. The range of cut-off scores used in experimental DD studies illustrated on
the normal distribution.

5
For these reasons, experimental studies cannot provide accurate prevalence
estimates for DD and most experimental studies probably substantially inflate DD
prevalence estimates. Therefore, it is questionable whether findings can be considered
to characterise DD adequately. For more accurate estimates of DD frequency, it is
necessary to examine prevalence studies, that is, studies that measure the number of
cases of DD in a particular (sufficiently large) population at a particular point in time.
In general, prevalence studies tend to use more conservative diagnostic criteria than
experimental studies. The following section provides a survey of all the published
prevalence studies relating to DD, followed by a critique of the studies as a whole. As
we have defined DD as a selective impairment of mathematical skills, where possible,
prevalence estimates for mathematics disability only are reported.
Kosc (1974) is the first reported prevalence study of DD, in which a multi-step
screening procedure was used to identify children with DD in Slovakia. 199 boys and
176 girls in fifth grade undertook two sets of group tests. The first set included a dot
calculation and geometrical figures task. The second set of assessments tested
knowledge of numerical operations, sequences, and mathematical symbols. Children
who received scores at or below the 10th percentile underwent further testing to rule
out other comorbid neurological or developmental deficits. Children with an IQ lower
than 90, as tested with three measures of general mental ability, were excluded.
Although the exact criteria were not reported in this paper, out of the 375 children
studied, 24 children (6.4 %) were identified as having DD (no gender ratio was
reported). It is important to note that although Kosc used some standardised tests in
the study, some of the tests used were not standardised until after data collection, and
some were not standardised at all. Therefore it is unknown whether the tests used in
Kosc’s study were at an appropriate level for the sample or whether the tests assessed
a comprehensive range of mathematical skills.
Since Kosc’s seminal study, other epidemiological studies have reported
similar prevalence estimates for DD in Europe, the Americas, and Asia. These studies
are discussed in detail in the following section and are summarised in Table 1.

6
Table 1.
Summary of DD prevalence studies.
First author Country Sample Prevalence Criteria
Kosc (1974) Slovakia 375 6.4% ≤ 10% + control
Badian (1983) US 1476 3.6 % ≤ 20%
Klauer (1992) Germany 546 4.4% < 2 SD
Lewis et al (1994) UK 1056 1.3% 1 SD + control
Gross-Tsur et al (1996) Israel 3029 6.5 % 2 year lag + control
Badian (1999) US 1075 3.9% < 25a
Hein et al (2000)
% + control
Germany 181/182 6.6 % < 17 % / 25% +
control
Ramaa et al (2002)
India 251/
1408
5.98% /
5.54%
Exclusionary criteria /
2 year performance
lag
a
Mazzocco et al (2003) US 210 9.6% < 1 SD / < 10 % b
Desoete et al (2004)
Belgium 3978 2.27% / 7.7%
/ 6.59%
≤ 2 SD + control +
RTI c
Koumoula et al (2004) Greece 240 6.3% < 1.5 SD + control
Barbaresi et al (2005)
US 5718 5.9% / 9.8% /
13.8%
Minnesota Regression
Formula; discrepancy
formula; < 90 +
control
b

7
Table 1. Cont’d
First author Country Sample Prevalence Criteria
Barahmand (2008) Iran 1171 3.8% ≤ 2 SD + control
Dirks et al (2008) Netherlands 799 10.3 % /
5.6%
≤ 25% / ≤ 10% +
control b
Geary et al (2007; 2010;
2011; 2012)
US 238 5.4% ≤ 15% + control
Landerl et al (2010) Germany 2586 3.2 <1.5 SD %
Reigosa-Crespo et al
(2012)
Cuba 11,652/ 3.4%
1966
<15%/ <2 SD
Notes. Where possible, reported prevalence estimates are for mathematics disability
only. RTI = resistance to intervention. a Prevalence estimates when using the different
criteria. b Prevalence for persistent DD. c Prevalence estimates for the Second, Third
and Fourth grades respectively.

8
Lewis, Hitch, and Walker (1994) administered standardised reading and
spelling tests, a mathematics test (Young's Group Mathematics Test; Young, 1971)
and a non-verbal reasoning test on 1,056 children (497 girls) aged 9- to 10-years old
in England. Children who had a standardised mathematics score below 85 (equivalent
to the 16th percentile) as well as reading and nonverbal reasoning scores above 90,
were classified as having DD. 1.3% of the sample had DD using these selection
criteria. The prevalence of children with combined mathematics and reading
difficulties was 3.6%. Although the achievement tests used by Lewis et al. were
standardised, ceiling effects emerged for both of the achievement tests. The tests were
standardised 14 to 20 years prior to data collection, so standard norms were likely
outdated. Given that many children reached ceiling on the tests and that
standardisation was based on outdated norms, it is likely that these tests did not detect
all children with DD.
Landerl and Moll (2010) screened 2,586 Austrian children in Grades 2 to 4 for
LDs. Children completed standardised tests of arithmetic, reading, and spelling.
Children who spoke German as a second language, had a diagnosis of AD(H)D, or a
formal diagnosis of general learning problems were excluded from the study. In the
screening phase, arithmetic disability was defined as mathematics performance below
1 or 1.5 SD below the mean and the authors reported that 15.4% and 6.3% of the
cohort met these criteria respectively. However, around 25- 40% of the children
meeting these criteria had comorbid reading and spelling difficulties; the percentage
of children with 'specific arithmetic disability' using the mean–1.5 SD criterion was
3.2%.
Klauer conducted a similar prevalence study in Germany, using a battery of
tests including assessments of reading, spelling, and mathematics (Klauer, 1992).
Klauer used a performance cut-off of 2 SD below the mean score on the mathematics
test to define DD and found 4.4% of the total sample (546 children) met this criterion.
In another German study, Hein and colleagues aimed to diagnose children
with 'specific disorder in arithmetic' according to the ICD-10 criteria and to compare
children from rural and urban areas (Hein, Bzufka, & Neumärker, 2000). The rural
study included 181 children in 2nd Grade; the urban study involved 182 children in
3rd Grade. Hein and colleagues used a multi-step screening and validation process

9
for each study. For the screening phase, standardised mathematics, reading or spelling
assessments were administered, appropriate for the grade level of each sample. The
results from the rural study adhered to the standardisation norms which allowed Hein
et al. to use the criteria specified by the tests to define discrepancies between reading
and mathematics performance. Children with a score lower than the 17th percentile on
the mathematics assessment and a score above the 34th percentile on the reading
assessment were classified as having ‘suspected’ DD; 6.6% of the sample met these
criteria. Grade 3 mathematics and spelling tests were used for the urban sample, but
these tests were administered slightly earlier in the academic year than the tests were
designed to be administered. Thus, the results did not correspond with the
standardisation norms; performance on both tests was significantly lower than the
standardisation mean. Hein et al. suggested that this was in part due to administering
the Grade 3 tests too early, but also because the tests used for the urban sample were
standardised many years earlier. Consequently, the test criteria could not be used to
define DD. Hein et al. selected children who performed above the 50th percentile on
the spelling test and below the 25th percentile on the maths assessment, which resulted
in 6.6% of the sample meeting the criteria for suspected DD. A subset of children
completed a battery of follow-up assessments. Only one-fifth of these children met the
diagnosis criteria of the ICD-10 for 'specific disorder of arithmetic skills', however,
many more showed significant difficulties in their mathematics performance.
Dirks, Spyer, van Lieshout, and de Sonneville (2008) compared mathematics
performance cut-offs at the 25th and 10th percentiles to identify children with LDs in
The Netherlands. 799 Fourth and Fifth grade children were administered arithmetic,
word recognition, reading comprehension, and spelling tests. 10.3% of the children
met the criteria for DD when a cut-off at the 25th percentile was used (that is, a
mathematics score below the 25th percentile and a word recognition score above the
25th percentile). Regardless of which language measure was used as a control variable,
approximately 9-10% of the sample met the criteria for DD diagnosis. The Dutch
school system uses a cut-off at the 10th percentile to identify children at risk of having
LDs; using this more conservative cut-off reduced the DD prevalence rate to 5.6%.
In the largest European study conducted to date, Desoete and colleagues found
the prevalence of DD to be between 2.27 and 7.7% (Desoete, Roeyers, & De Clercq,
2004). 3,978 second, third and fourth grade children, from the Flemish community in

10
Belgium, participated in the study. The children completed a battery of mathematical
tests including standardised tests of number fact knowledge (The Arithmetic Number
Facts Test, Tempotest Rekenen, TTR, De Vos, 1992) geometry (leerlingvolgsysteem,
LVS), and mental computation (The Kortrijk Arithmetic Test- Revised, De Kortrijkse
Rekentest Revision KRT-R, Baudonck et al, 2006). The children were identified as
having DD based on three different criteria: severity (mathematics performance equal
to or lower than 2 SD below the mean), discrepancy (mathematics performance
significantly lower than performance in other school subjects), and resistance to
intervention (as indicated by teacher reports).
A similar study was conducted in Greece by Koumoula et al (2004) with 240
children attending grades two to five of primary school. All children in the study were
individually assessed using a battery of tests including the Neuropsychological test
battery of Numerical Processing and Calculation in Children (NUCALC; von Aster,
2001; von Aster, Weinghold Zulauf, & Horn, 2006), the digit span subtest of the
Wechsler Intelligence Scale for Children – Third edition (Wechsler, 1974) and a
reading test. 6.3% of the cohort was found to have DD, which was defined as
mathematics performance lower than 1.5 SD below the mean and reading
performance within one SD of the mean.
Badian has published twice on the prevalence of mathematics disability in the
US (Badian, 1983, 1999). The 1983 study involved a city-wide assessment of the
reading and calculation skills of 1,476 children in grades 1-8. The children were
assessed using the Stanford Achievement Test (Gardner, Rudman, Karlsen, &
Merwin, 1982) and arithmetic difficulty was defined as a score below the 20th
percentile in arithmetic. 3.6% of the cohort met this criterion. Badian’s 1999 study
was longitudinal and involved all children from a school district (N = 1,075) who
began kindergarten during 1976-1989. The Stanford Achievement Test was
administered to the children each year from grades 1– 8. Low achievement was
defined as performance below the 20th percentile. Averaged over all grade levels,
3.9% of the sample had low arithmetic achievement. Persistent low arithmetic
achievement was defined as a mean standard score (for the 7-to-8-year period) below
the 25th percentile in arithmetic. The prevalence of persistent low achievement in
arithmetic was 5.7% (including children with co-occurring reading difficulties) or
2.3% (arithmetic only).

11
In Mazzocco and Myers’ (2003) longitudinal study, 209 US school children
were followed from Kindergarten to Grade 3. The children were tested individually
with standardised tests of intelligence (Stanford-Binet-IV; Thorndike, Hagen &
Sattler, 1986; Wechsler Abbreviated Scale of Intelligence; WASI; Wechsler 1999)
and mathematics, (Key-Math revised, Connolly, 1998, Test of Early Math Ability-
second edition; Ginsburg & Baroody, 1990; Woodcock-Johnson- Revised, WJ-R,
Math Calculations Subtest; Woodcock & Johnson, 1989). Tests of visual spatial/
perceptual performance and reading were also administered during the study;
however, these tests were included to dissociate potential DD subtypes rather than to
form part of the diagnostic criteria. Mazzocco and Myers compared different
diagnostic criteria for DD: Key-Math revised score below 7; TEMA-2 score below 86
or below the 10th percentile; WJ-R score below 86; and a discrepancy between IQ
score and the mathematics test of more than 14 points. They found that different
groups of children met the criteria for DD depending on which diagnostic criteria
were used for selection. Mazzocco and Myers also compared the number of children
meeting the different criteria across the different years of the study and found that
individuals did not necessarily meet the criteria every year, even if the same
assessment measures were used. However, the authors found that using a TEMA-2
score below the 10th percentile for DD diagnosis was reasonably stable over time.
This criterion was used to define persistent DD (that is, children who met this
criterion for more than one school year) which included 9.6% of the sample. As
mentioned above, children with low reading ability were not excluded from the
persistent DD group, nor were children with low IQ which may explain why this
prevalence estimate is greater than the estimates provided by other studies.
Barbaresi and colleagues conducted a retrospective investigation of
mathematics learning disorder in a population-based cohort in Rochester, Minnesota,
US (Barbaresi, Katusic, Colligan, Weaver, & Jacobsen, 2005). The cohort involved
5,718 children born in the town between 1976 and 1982. Barbaresi and colleagues
used school and medical records to identify children at risk for having MLD. These
children were then diagnosed with DD according to three different definitions: a
regression-based discrepancy formula, a non-regression-based discrepancy formula
and a low achievement definition (achievement score below 25th percentile; IQ score
above 80). For each of these methods Barbaresi et al. calculated the cumulative

12
incidence rates of DD. In contrast to prevalence rate, which refers to the number of
cases of DD at one point in time, incidence rate refers to the number of new cases that
occur during a specific period. In Barbaresi et al’s study, the cumulative incidence rate
represented the likelihood that the children who remained in the study for its duration,
i.e., until they were 19-years-old, met the criteria for DD. The IQ-achievement
discrepancy formulas resulted in cumulative incidence by age 19 of 5.9% and 9.8%
for the regression-based formula and the non-regression-based formula respectively.
The low achievement definition resulted in a cumulative incidence by age 19 of
13.8%. The authors did not believe any one definition was more reliable or valid than
the others; however, they did highlight that the low achievement definition identified
more children with DD than the two discrepancy based formulas.
Geary and colleagues have conducted a prospective longitudinal study in
Missouri, US (Geary, Hoard, Nugent & Bailey, 2011; Geary, 2010; Geary, Hoard,
Byrd-Craven, Nugent, & Numtee, 2007; Geary et al., 2012). The study followed over
200 children from kindergarten to ninth grade. The Numerical Operations and Word
reading subtests of the Wechsler Individual Achievement Test-II (WIAT-II, Wechsler,
2005a) were administered at the end of each academic year. IQ was measured using
the mean score from Raven’s coloured progressive matrices (Raven, 1965),
administered at the end of kindergarten, and the vocabulary and matrix reasoning
subtests of the WASI (Wechsler, 1999) administered at the end of the first grade. The
children were identified as having MLD if their mathematics achievement score was
less than or equal to the 15th percentile in both kindergarten and first grade and their
IQ was between 80 and 130. 5.4% of the sample was identified as having MLD
according to these criteria.
In the largest prevalence study included in this review, Reigosa-Crespo et al.
(2012) screened children in Havana, Cuba, for DD. The cohort consisted of 11,652
children in second to ninth grades in an urban school municipality. All children
completed a group administered, curriculum-based test of mathematics attainment.
The mathematics test was non-standardised but developed by researchers at the Cuban
ministry of Education, and consisted of eight computational problems appropriate for
each grade level. In the first stage, children were selected for the study if their
mathematics scores fell within the lowest 15% (for each grade level). In a second step,
children completed tests of mental arithmetic and basic numerical abilities

13
(Butterworth, 2003). DD was defined as performance below 2 SD on these follow-up
mathematics tests and 3.4% of the sample met these criteria for DD.
In Israel, Gross-Tsur, Manor, and Shalev also conducted a city-wide
assessment of mathematics ability in order to estimate the prevalence of DD (Gross-
Tsur, Manor, & Shalev, 1996). 3,029 fourth grade children completed a group
administered mathematics achievement test (Shalev, Manor, Amir & Gross-Tsur,
1993). The children scoring in the lowest 20% of each class were selected for further
assessment. 555 children were tested using an individually administered standardised
arithmetic battery. 188 children were classified as having DD, which was defined as
maths scores equal to or below the mean score for normal children two grades
younger. 140 of the identified children underwent further testing including
standardised assessments of reading, writing, and intelligence (WISC-R; Wechsler,
1974). Gross-Tsur and colleagues found that the prevalence of DD was 6.5%. Of
these children, 17% also had dyslexia and, and 26% had ADHD-like symptoms.
Barahmand (2008) measured the prevalence of DD in a sample of 1,171
children in Grades 2–5 in Iran. Children completed Shalev's standardised arithmetic
battery (Shalev et al., 1993) and 46 children whose performance was lower than 2 SD
below the mean performance for children of their age were selected for further
assessment. Two children were excluded on the basis of IQ scores below 90, resulting
in 44 children (3.75% of the sample) being diagnosed with DD.
Ramaa and Gowramma (2002) estimated the prevalence of DD in Indian
children using two different approaches: 1) as an isolated LD and 2) as a LD with
comorbid reading or writing difficulties. Only the first approach is relevant to this
review and is described here. 251 children completed an individually administered,
standardised arithmetic test. The researchers observed the children’s strategies during
completion. Identification of DD was based on exclusionary criteria including:
unfamiliarity of the tasks; lack of practice; lack of exposure to mathematics content;
carelessness and lack of perseverance. 15 children (5.98%) met the criteria for a
diagnosis of DD as an isolated LD.
As the above review shows, the ways in which DD has been defined and
measured in prevalence studies has varied greatly. In accordance with the DSM-IV
criteria (American Psychiatric Association, 2000), which was the relevant diagnostic

14
manual at the time that most of the reviewed studies were conducted, some
researchers (e.g., Barbaresi et al., 2005; Lewis et al., 1994; Mazzocco & Myers, 2003)
defined DD using an IQ-achievement discrepancy, that is, mathematics performance
substantially below what would be expected given an individual’s general
intelligence. However, the IQ-achievement discrepancy definition has been criticised
for being imprecise as different researchers calculate the discrepancy using different
methods, (e.g., expectancy formulas, regression adjusted comparisons of test scores or
by simply comparing standardised achievement and IQ scores; reviewed in Francis et
al., 2005). Furthermore, research suggests that the IQ-achievement discrepancy is an
unreliable method of identifying children with LDs as some children with LDs may
not present with a discrepancy (Badian, 1999; Francis et al., 2005). Indeed, Mazzocco
and Myers (2003) found that the majority of the children with poor mathematics
achievement (performance below the 10th percentile) did not show an IQ-
mathematics discrepancy. Similarly, in their rural study, Hein et al (2000) found that
four out of the nine children with DD who participated in follow-up assessments did
not show an IQ-mathematics discrepancy. Barbaresi and colleagues also found that
fewer cases of DD were identified using the two discrepancy based formulas than
when they used a low achievement definition of DD. Therefore, the IQ-achievement
discrepancy does not appear to be a suitable method for identifying children with DD.
Nevertheless, IQ measures may be useful for ensuring that LDs are not a result of low
general intelligence, and several of the reviewed studies included average IQ as a
diagnostic criterion for DD (e.g., Barahmand, 2008; Barbaresi et al., 2005 [low
achievement definition]; Geary, 2010; Gross-Tsur et al., 1996; Kosc, 1974).
Other studies defined DD by the severity of mathematics impairment using
performance cut-offs on standardised tests; the range of cut-offs used in the
prevalence studies are represented in Figure 2. As illustrated in the review above and
in Figure 2, the cut-offs are not used with any consistency across studies. Similar to
experimental studies of DD, the definitions of poor mathematics performance used in
the prevalence studies ranged from performance below the 3rd percentile to the 25th
percentile (2 SD to 0.68 SD below the mean).

15
Figure 2. The cut-offs used in DD prevalence studies illustrated on the normal distribution.
The percentile scale runs from 0 to 100. Percentile values are shown on top of the normal
distribution curve.

16
Another way in which DD was defined was using a two year achievement delay as a
diagnostic criterion, that is, children were categorised as having DD if their mathematics
performance was equal to or below the average level of children two years younger (e.g.,
Gross-Tsur et al., 1996; Ramaa & Gowramma, 2002). Similarly, Desoete and colleagues
defined DD as children showing a resistance to mathematics intervention (Desoete et al.,
2004).
As mentioned earlier, there is disagreement over whether DD should be defined as an
isolated learning disability or considered as a disorder co-occurring with other learning
problems. This may be because researchers have referred to the different definitions offered
by the ICD-10 and DSM diagnostic manuals. The ICD-10 diagnostic criteria for DD specify
that reading and spelling skills must be within the average range whereas the DSM manuals
acknowledge that DD can occur alongside other LDs (American Psychiatric Association,
2000; World Health Organisation, 1994). The reviewed studies differ with respect to how
control variables were used in the diagnosis of DD. Some did not include a control variable in
their definitions of DD (Barbaresi et al., 2005; Geary, 2010; Kosc, 1974; Reigosa-Crespo et
al., 2012). Some studies included children with other learning disorders in the DD groups
(Gross-Tsur et al., 1996; Mazzocco & Myers, 2003; Ramaa & Gowramma, 2002 [second
diagnosis approach]), whereas others defined DD as an isolated LD and specified average
performance for control measures in their definitions of DD (Desoete et al., 2004; Dirks et
al., 2008; Hein et al., 2000; Koumoula et al., 2004; Lewis et al., 1994; Ramaa & Gowramma,
2002). Some studies combined both approaches and reported separate prevalence estimates
for isolated DD and those with co-occuring reading difficulties (Badian, 1983, 1999; Dirks.,
et al., 2008; Landerl & Moll, 2010; Lewis et al., 1994).
The above review also highlights the considerable variability in the number and type
of tests used to measure mathematics performance. The choice of mathematics test can have
a significant impact on the percentage of children identified as having DD. In his seminal
study, Kosc (1978) used a composite test battery in which some of the tests were not
standardised, meaning that it was unknown how the normal population would perform on the
tests and it was not adjusted for the age of the participants. Yet, many cite this research when
providing DD prevalence estimates. Similarly, Reigosa-Crespo et al. (2012) used a non-
standardised test of mathematical attainment in their screening stage; however, these tests
were tailored for the different grade levels of their sample. Nonetheless, the use of non-

17
standardised tests raises concerns about the validity of these tests as diagnostic tools for DD.
All of the other reviewed studies measured mathematics performance using standardised
tests, but even standardised tests are not without their problems. For example, in two of the
reviewed studies, test results did not adhere to standardisation norms which made it difficult
to define DD using the usual test criteria (Hein et al., 2000) or may have resulted in some
cases of DD not being identified (Lewis et al., 1994). These issues highlight the importance
of using tests that have been standardised close to the time of testing. Furthermore, a
particular standardised test may overestimate abilities in some areas and underestimate
abilities in other areas (Geary, 2004), which highlights the need for multiple tests covering a
wide range of mathematical domains. As Desoete and Roeyers (2000) and Mazzocco and
Myers (2003) found, several mathematics tests may be required to identify all children with
mathematics difficulties.
Overall, the above review suggests that the difficulties in establishing prevalence
estimates may in part be due to methodological problems, yet it is important to note that
prevalence estimates may also be difficult to establish because of the lack of an objective and
universally adopted definition of DD for research (Kaufmann et al., 2013).
Nonetheless, with this background in mind, the current thesis aims to estimate the
prevalence of DD in large samples of English primary and secondary school students,
comparing different diagnostic criteria (Chapters Two and Five) and examines the stability of
DD diagnosis over time (Chapter Four).
1.1.3 Theories of DD.
Similar to the inconsistencies regarding diagnosis and prevalence of DD, the causal
origins of DD are also highly contested in the field. Several theories of DD exist, which
suggest that it is caused by an impairment of one or many possible cognitive functions/
representations. A dominant theory in both behavioural and neuroscience research is the
deficient number module theory, which argues that DD is caused by an impairment in
magnitude representation (Landerl, Bevan, & Butterworth, 2004; Piazza et al., 2010), which
may represent exact and approximate numerical magnitudes (Iuculano, Tang, Hall &
Butterworth, 2008). The horizontal intraparietal sulci (IPS) of the human brain are thought to
be responsible for the core number module or 'number sense' (Butterworth, 1999, Dehaene et
al, 2004). Numerical magnitude representation is typically assessed by measuring
participants’ accuracy and reaction times on non-symbolic and symbolic comparison tasks

18
(e.g., comparing two sets of dots [non-symbolic numerosity comparison] or two Arabic digits
[symbolic comparison]).Whereas the former task is thought to measure the representation of
magnitudes, the latter task is thought to measure the link between magnitude representation
and numerical symbols (Szűcs, Devine, Soltesz, Nobes, & Gabriel, 2013). Some believe that
DD is caused by deficient automatic activation of magnitude representation (Rubinsten &
Henik, 2005), whereas others believe that a defective link between magnitude representation
and numerical symbols is problematic in DD (De Smedt, Noël, Gilmore, & Ansari, 2013;
Rousselle & Noël, 2007). However, research supporting a causal link between IPS
dysfunction and DD is weak due to inconsistent findings and methodological limitations.
Brain imaging studies have suggested reduced grey matter density in the parietal cortex of
DD compared to controls, and in some cases, reduced parietal activation in DD (Isaacs,
Edmonds, Lucas, & Gadian, 2001; Rotzer et al., 2008; Rykhlevskaia, Uddin, Kondos, &
Menon, 2009). However, several neuroscience studies have failed to show neuro-imaging or
behavioural evidence of differences in magnitude processing in DD (e.g., Davis et al., 2009;
Kovas et al., 2009; Kucian et al., 2006; Kucian, Loenneker, Martin, & von Aster, 2011;
Mussolin et al., 2010). Other studies have not included appropriate control tasks (Price,
Holloway, Rasanen, Vesterinen, & Ansari, 2007). Thus, it is unclear whether the IPS
differences are in fact related to impairments in magnitude representation or impairments in
other cognitive functions also associated with the IPS such as working memory, inhibition
and attention (Cieslik, Zilles, Grefkes, & Eickhoff, 2011; Coull & Frith, 1998; Culham &
Kanwisher, 2001; Davranche, Nazarian, Vidal, & Coull, 2011; Yang, Han, Chui, Shen, &
Wu, 2012). These ideas are discussed in more detail in Szűcs, et al., (2013) and Szűcs &
Goswami (2013).
Similarly, behavioural studies claiming to support the deficient number module theory
have not provided clear evidence for deficient magnitude representation in DD either. For
example, Landerl and colleagues reported contradictory findings in their studies (Landerl et
al., 2004; Landerl & Kölle, 2009). Iuculano and colleagues (Iuculano et al., 2008)
investigated approximate and exact numerical representation in 8- to 9- year-old children and
found that one child diagnosed as having DD appeared to have intact approximate and exact
magnitude comparison performance, in spite of failing the exact approximation component of
a diagnostic test. On the other hand, a second child diagnosed with DD performed poorly on a
non-symbolic measure of exact enumeration, as well as approximate addition and subtraction
tasks. The authors suggested that a deficient link between non-symbolic and symbolic

19
processing was the cause of DD in the first case study, but deficient analogue representation
may have been the cause of approximate and exact calculation difficulties in the second case
study. Thus, these results suggest there may be a variety of domain-specific causes of DD.
Nonetheless, similar to neuroscience studies, some behavioural studies have also failed to
include non-numerical control tasks and have relied on magnitude comparison tasks which
did not control for non-numerical parameters (Mazzocco, Feigenson, & Halberda, 2011;
Mussolin, Mejias, & Noël, 2010; Piazza et al., 2010). Thus, it is difficult to draw number-
specific conclusions from some of these studies (Szűcs et al., 2013; Szűcs & Goswami,
2013).
On the other hand, behavioural research has provided stronger support for theories
linking MLD to impairments in domain-general cognitive functions. For example, several
studies have found that MLD children have poorer verbal and/ or visuo-spatial working
memory (Bull, Espy, & Wiebe, 2008; Geary, 2004; Hitch & McAuley, 1991; Keeler &
Swanson, 2001; Passolunghi & Siegel, 2001, 2004). Furthermore, the role of working
memory in the development of mathematical skills has been confirmed by longitudinal
studies (Bailey, Watts, Littlefield, & Geary, 2014; Geary, 2011; Passolunghi & Lanfranchi,
2012; Swanson, 2011). Other studies have linked mathematical development to spatial
processing (Rourke, 1993; Rourke & Conway, 1997), inhibitory function (Bull, Johnston, &
Roy, 1999; Passolunghi, Cornoldi, & De Liberto, 1999), and attentional function (Askenazi
& Henik, 2010; Hannula, Lepola, & Lehtinen, 2010; Swanson, 2011). However, it should be
noted that some researchers distinguish between mathematical difficulties linked to domain-
general deficits and domain-specific deficits, and reserve the term DD only for domain-
specific deficits (e.g., Rubinsten & Henik, 2009, but also see Kaufmann et al., 2013).
Nonetheless, impairments in one or more of the abovementioned domain-general functions
could result in mathematical learning problems, and few DD studies have systematically
controlled for all domain-general skills or systematically contrasted different theories of DD
within the same sample (Szűcs et al., 2013).
Although testing the different theories of DD is not the aim of this thesis, the
abovementioned background is necessary to set the context for Chapter Four which describes
the longitudinal findings of a project comparing different theories of DD (Szűcs et al., 2013).
A summary of the results of this larger study is provided in the introduction to Chapter Four,

20
however, the data reported in Chapter Four itself focuses on longitudinal stability of DD and
cognitive performance, rather than contrasting the theories of DD per se (also see section 1.4)
1.2 Mathematics anxiety
Importantly, not all mathematics problems stem from cognitive difficulties. Children
and adults' mathematical development can also be hindered by negative attitudes and
affective reactions to mathematics. Mathematics anxiety (MA) is one negative affective
reaction to mathematics which has received a lot of attention in educational psychology
research.
1.2.1 Definitions.
MA is broadly defined as a state of discomfort caused by performing mathematical
tasks (Ma & Xu, 2004). MA can be manifested in many different ways, for example as
feelings of apprehension, dislike, tension, worry, frustration, and fear (Ashcraft & Ridley,
2005; Ma & Xu 2004; Wigfield & Meece, 1998). MA affects wellbeing and may have a
detrimental effect on mathematics performance, as indicated by the moderate negative
correlations (approximately r =-.30) that have been reported between MA and mathematics
performance (Hembree, 1990; Ma, 1999). Importantly, children affected by MA throughout
their school education may come to develop negative attitudes towards mathematics, avoid or
drop out of mathematics classes, or stay away from careers involving quantitative skills
(Ashcraft, 2002; Ma, 1999).
Many different self-report questionnaires have been developed over the years to
measure trait-like MA in children of different ages/ school levels and in adults. These
questionnaires typically use numerical or pictorial rating scales to describe the level of
anxiety experienced in different maths situations. The most frequently used scale is the
Mathematics Anxiety Rating Scale (MARS) which has 98 items (Richardson & Suinn, 1972).
However, with such a large number of items, the administration of the MARS is long and
several shorter questionnaires have been developed (Alexander & Martray, 1989; Fennema &
Sherman, 1976; Hopko, Mahadevan, Bare, & Hunt, 2003; Plake & Parker, 1982; Suinn &
Winston, 2003). Although these scales have generally proven to be reliable, the construct
validity of some of these scales has been questioned (Hopko, 2003; Hopko et al., 2003). Most
MA scales have been developed for use with secondary school and college students/adults.
However, a few MA scales have been developed specifically for use with primary school
children including: The MARS- Elementary Edition (Suinn, Taylor, & Edwards, 1988); The

21
Mathematics anxiety scale for elementary school students (Bindak, 2005; Yuskel-Sahin,
2008); The Mathematics Anxiety Scale for Children (Chiu & Henry, 1990); The
Mathematics Attitude and Anxiety Questionnaire (Thomas & Dowker, 2000; Krinzinger et
al., 2007, Dowker et al, 2012); the Children's Attitude in Math Scale (Jameson, 2013), and
the Math Anxiety Scale for Young Children (MASYC) developed by Vukovic and colleagues
(Harari, Vukovic, & Bailey, 2013; Vukovic, Kieffer, Bailey, & Harari, 2013) and the recent
revision of the MASYC developed by Ganley and McGraw (2016). In work conducted in our
lab previously, we modified Hopko and colleagues' 9-item Abbreviated Mathematics Anxiety
Scale (AMAS; Hopko et al., 2003) for use with early secondary and primary school students.
The modified AMAS (hereafter: mAMAS), has proven to be reliable and has good construct
validity (Carey, Hill, Devine & Szűcs, 2017b; Zirk-Sadowski, Lamptey, Devine, Haggard, &
Szűcs, 2014). Further details about the mAMAS are provided in Chapter Four.
Studies have suggested that MA is multidimensional. For example, Wigfield and
Meece (1988) identified two dimensions which correspond to those identified for a related
type of academic anxiety: test anxiety (TA) (Liebert & Morris, 1967). These dimensions
consist of a cognitive component (usually referred to as "worry") which concerns worries
about performance/ failure, and an affective component ("emotionality"), which refers to
nervousness/ tension and associated physiological reactions felt in evaluative settings
(Dowker, Sarkar, & Looi, 2016). Some MA scales separate MA elicited by testing situations
from other types of MA (e.g., manipulating numbers, doing arithmetic or using maths in
everyday life; Pletzer, Wood, Scherndl, Kerschbaum, & Nuerk, 2016). The AMAS, for
example, consists of two subscales measuring: MA felt when learning maths in the classroom
("Learning MA"), and MA felt in testing situations ("Evaluation MA", Hopko et al., 2003).
Although the majority of MA research has used trait measures (such as the scales
described above), some researchers have recently focused on state measures of MA (Goetz,
Bieg, Lüdtke, Pekrun, & Hall, 2013). Trait MA questionnaires are thought to measure
"(mentally) generalised levels of anxiety across different time points in math-related
situations. In contrast, reports of state math anxiety reflect levels of momentary anxiety in
real-life math-related situations" (Bieg, Goetz, Wolter, & Hall, 2015, p2). State MA is
normally also assessed by self-report rating scales which are administered during
mathematics activities, and ask students how anxious they feel in the moment. Children
typically report higher levels of trait MA than they do state MA (Bieg et al., 2015; Goetz et

22
al., 2013), and children's mathematical self-concept (i.e., representation of mathematical
abilities and competencies) may contribute to the state-trait MA discrepancy (Bieg, Goetz, &
Lipnevich, 2014).
Some have questioned whether MA is distinct from other forms of anxiety. Another
type of academic anxiety is test anxiety (TA) which refers to emotional discomfort elicited by
evaluative settings (Brown et al., 2011). Some have stated that “mathematics anxiety can be
viewed as a form of test anxiety” (Richardson & Woolfolk, 1980, p.271) and that TA “may
be ‘‘hidden’’ under names related to more specific forms of test anxiety - [such as] maths
anxiety” (Stöber and Pekrun, 2004, p.206). Studies have reported moderate, positive
correlations between MA and TA (Devine, Fawcett, Szűcs & Dowker, 2012; Dew & Galassi,
1983; Hembree, 1990; Kazelskis et al., 2000). One study suggested that the correlations
between TA and MA were nearly as high as those reported between different measures of
MA (Kazelskis et al., 2000) which raises the question of whether these anxiety types can be
differentiated.
Nevertheless, it appears unlikely that MA is completely accounted for by TA. Whilst
the correlations between MA and TA are notable (Hembree, 1990 = .52; Kazelskis et al.,
2000 =.50 for males, = .52 for females), they do indicate some degree of independence, at
least in adults. Furthermore, our previous work emphasised the importance of controlling for
TA when measuring the correlation between MA and performance (Devine et al., 2012). We
found a negative correlation between MA and maths performance in both boys and girls, but
once TA was controlled for, the negative relation remained for girls only and became only
marginally significant for boys (and this difference in strength of correlation was significant
according to a difference test). When we controlled for MA, the previously significant
relations between TA and maths performance became non-significant in both genders. These
data strongly suggest some differentiation between MA and TA.
General anxiety (GA) refers to an individual's general tendency to feel anxious about
events, behaviours, and competence (Baloglu, 1999) and moderate positive correlations have
also been found between MA and GA (Hembree, 1990, MA and GA = .35; MA and trait
anxiety =.38). These correlations indicate that MA and GA are related, but the percent of
shared variance between these two anxiety types is even less than the shared variance
between MA and TA. One study which investigated the genetic variance of MA suggested
that MA was influenced by genetic and non-shared environmental factors associated with

23
GA, therefore suggesting that GA may be implicated in the aetiology of MA (Wang et al.,
2014).
Recent work in our lab has indicated that MA is distinct from both TA and GA in
primary and secondary school children (Carey et al., 2017b). Using Exploratory and
Confirmatory factor analysis, we found that the MA items on the mAMAS all loaded onto a
unique MA factor indicating that MA has divergent validity from both TA and GA. Thus,
MA, at least when measured using the mAMAS, does not appear to be explained by other
anxiety forms.
1.2.2 Prevalence.
Although MA is present in younger school children (Aarnos & Perkkilä, 2012; Chiu
& Henry, 1990; Newstead, 1998; Ramirez, Gunderson, Levine, & Beilock, 2013), negative
attitudes towards mathematics and MA appear to increase at the secondary school level
(Blatchford, 1996; Dowker, 2005) and persist into post-secondary education and adulthood
(Betz, 1978; Jameson & Fusco, 2014).
However, few researchers have systematically estimated the prevalence of MA. One
possible reason for this may be because MA is typically measured by self-report scales, for
which there exists no obvious cut-point to demarcate high MA from moderate or low levels
of MA (Ashcraft & Ridley, 2005). Thus, similar to the variability in DD diagnostic criteria,
MA researchers have used varying definitions of high MA. For example, Ashcraft and
colleagues have used a statistical definition, defining high MA as scores falling above 1 SD
above the mean MA level, which, if MA scores are normally distributed, would indicate that
approximately 17% of the population would be diagnosed as being highly maths anxious
(Ashcraft & Kirk, 2001; Ashcraft, Krause, & Hopko, 2007). However, this estimate is based
on the assumption that MA scores are in fact normally distributed, yet studies rarely report
evidence of normality (this issue is discussed further in Chapter Five). According to other
definitions, the prevalence of high MA could be much lower than the 17% estimated by
Ashcraft and colleagues. For example, Chinn defined high MA as scores at or above a score
of 60 on Chinn’s mathematics anxiety survey which corresponded to 'often anxious' in maths
situations and found that between 2 and 6% of secondary school students were affected by
high anxiety (Chinn, 2009). Differences in the scales used to measure MA and the observed
distribution of MA scores may contribute to this variation in prevalence estimates.

24
1.2.3 MA and performance/achievement.
The relationship between MA and mathematics performance has been studied
extensively. Past research has reported moderate negative correlations between mathematics
performance and MA (average correlations of -.27. and -.34 in two meta-analyses) (Ashcraft
& Kirk, 2001; Bai, 2011; Hembree, 1990; Hopko et al., 2003; Khatoon & Mahmood, 2010;
Ma, 1999; Miller & Bichsel, 2004) indicating that those with high MA show poorer
mathematics achievement. Meta-analytic research also confirms this negative association
exists across many nations and cultures (Lee, 2009).
Although significant correlations between MA and performance /achievement have
been consistently reported in adult and secondary school samples (Ashcraft & Kirk, 2001;
Bai, 2010; Hembree, 1990; Hopko et al., 2003; Khatoon & Mahmood, 2010; Ma, 1999;
Miller & Bichsel, 2004; Resnick, Viehe, & Segal, 1982; Richardson & Suinn, 1972; Wigfield
& Meece, 1988) significant correlations in younger children have not always emerged. For
example, Thomas and Dowker (2000), found no association between MA and performance in
six- to nine-year-old children. Krinzinger and colleagues reported a null finding in their
longitudinal study of young children too (Krinzinger, Kaufmann, & Willmes, 2009).
However, some studies have found that an association between anxiety and mathematics
performance exists at the primary school level, for example between worry ratings and
mathematics problem-solving in nine-year-old children (Punaro & Reeve, 2012) and between
MA and maths achievement in 2nd and 3rd grade students (Wu, Barth, Amin, Malcarne, &
Menon, 2012).
It is important to note that it has been argued that the strength of the MA/ performance
relationship is probably exaggerated because mathematics achievement, when measured in
test situations, is always confounded with MA (Ashcraft & Ridley, 2005; Hopko, McNeil,
Zvolensky, & Eifert, 2001). That is, the “online emotional reaction to the testing situation”
(Ashcraft & Ridley, 2005, p.320) leads to maths performance deficits in highly maths anxious
individuals. Consequently, their performance may appear lower when measured using a test
compared to when performance is measured using, for example, formative assessments.
Therefore, the depressed performance associated with high MA and the reported negative
correlations between MA and performance may be exaggerated because of the context in
which mathematics performance is measured. Nonetheless, the effect of MA on ‘online’

25
mathematics performance is still pertinent, as mathematics achievement is often measured
using time-limited tests and formal examinations.
The relationship between anxiety and performance is also likely to be mediated or
moderated by other factors such as self-concept, self-efficacy, and mastery approach (Ahmed
et al., 2012; Erturan & Jansen, 2015; Galla & Wood, 2012; Luo et al 2014).
Further research has explored the direction of the MA and maths performance
relationship. Emotional and cognitive components of mathematical development are likely to
interact over time, i.e., function as a dynamic system (Thelen & Smith, 1994). Although some
researchers have recognised that MA and maths performance may relate this way, for
example via a reciprocal relationship or vicious circle (reviewed in Carey, Hill, Devine, &
Szucs, 2016), the MA literature has traditionally focussed on contrasting two directional
models: The Deficit Theory and the Debilitating Anxiety Model (ibid). Thus, I will review
the research supporting these competing models first, followed by the research providing
support for the factors interacting in a dynamic system. The Deficit Theory claims that
anxiety emerges a result of an awareness of poor mathematics performance in the past
(Tobias, 1986). In contrast, the Debilitating Anxiety model posits that high levels of anxiety
interfere with performance due to a disruption in pre-processing, processing and retrieval of
information (Carey et al., 2016; Tobias, 1986; Wine, 1980). This model also argues that "MA
may influence learning by disposing individuals to avoid mathematics-related situations"
(Carey et al., 2016, p.2; Chinn, 2009; Hembree, 1990).
The Deficit Theory is supported by research suggesting that children with MLD report
higher levels of MA (Lai, Zhu, Chen, & Li, 2015; Passolunghi, 2011; Wu, Willcutt, Escovar,
& Menon, 2014). Furthermore, Birgin and colleagues found that the highest unique
contribution to children’s MA was from the children’s mathematics performance (Birgin,
Baloğlu, Çatlıoğlu, & Gürbüz, 2010). In one of the few longitudinal investigations, Ma and
Xu (2004) found that correlations between maths performance in one year and MA in the
following year were stronger than the correlations found between MA in one year and maths
performance in the following year. The authors took these results to suggest that poor
performance may cause high MA rather than the other way round. Thus, these results appear
to support the Deficit Theory over the Debilitating Anxiety Model. However, as the effects of
MA on performance proposed by the Debilitating Anxiety Model are likely to be more
immediate than from one academic year to the next, this study cannot address whether this

26
model was also in operation (these ideas are discussed further in Carey et al., 2016). Other
research has suggested that highly maths anxious adults have deficits in basic numerical
processing (Maloney, Ansari, & Fugelsang, 2011; Maloney, Risko, Ansari, & Fugelsang,
2010), however, it is unclear whether these deficits are a cause or are a consequence of MA.
That is, highly maths anxious adults' basic numerical abilities may be impaired because they
have avoided mathematical tasks throughout their education and adulthood due to their high
levels of MA, which would be more in line with the Debilitating Anxiety Model. This idea is
discussed further in section 1.2.4, and in Carey et al. (2016).
Support for the Debilitating Anxiety Model comes from studies which have suggested
that adults and adolescents with high MA tend to avoid maths-related situations, avoid
enrolling in mathematics classes or taking up careers involving mathematics (Hembree,
1990). Adults with high MA have been shown to have decreased reaction times and increased
error rates (Ashcraft & Faust, 1994) and decreased cognitive reflection during mathematical
problem solving (Morsanyi, Busdraghi, & Primi, 2014), suggesting that maths anxious adults
tend to avoid processing mathematical problems. Further support for the Debilitating Anxiety
model comes from studies indicating that processing resources used for mathematics problem
solving are taxed by MA. For example, negative relationships have been found between MA
and working memory span (Ashcraft & Kirk, 2001) and the effects of high MA on
performance appear to be more marked for maths problems with a high working memory
load (Ashcraft & Krause, 2007). The Debilitating Anxiety model is also supported by studies
which have suggested that performance is affected when MA is manipulated. For example,
performance has been shown to improve when maths anxious individuals are allowed the
opportunity to offload their anxieties via a writing exercise before completing a test (Park,
Ramirez, & Beilock, 2014) and the association between MA and performance is reduced
when tests are administered in a more relaxed format (Faust, Ashcraft, & Fleck, 1996). The
Debilitating Anxiety model is also supported by studies that have manipulated stereotype
threat (thought to increase anxiety in girls and females) and found effects on performance,
and neuroimaging studies also suggest links between MA, performance, and different brain
regions involved in both numerical and emotional processing (see Carey et al. 2016 for a
review and further discussion of these studies).
Thus, the evidence supporting the two models is in conflict. The reason for this may
be that, in some individuals, experiences of failure or negative evaluations in mathematics

27
lead to an increase in MA, possibly resulting in a vicious circle, which also leads to an ever-
increasing MA/performance relationship (Carey et al., 2016; Devine, Fawcett, Szűcs, &
Dowker, 2012; Jansen et al., 2013). This bidirectional relationship between MA and
performance has been labelled the Reciprocal Theory (Carey et al., 2016). Indeed,
longitudinal data suggest that the MA and maths performance relationship functions
reciprocally. Luo and colleagues found that MA levels were linked to a student's prior
achievement and that MA, in turn, was linked to future performance (Luo et al., 2014).
Similarly, Cargnelutti and colleagues found similar evidence for a bidirectional relationship
between MA and performance in young children (Cargnelutti, Tomasetto, & Passolunghi,
2017).
1.2.4 Theories of MA.
Due to the paucity of research investigating the origins of MA, particularly the lack of
longitudinal studies in the field, it is not currently clear what leads to the development of MA.
Nevertheless, research has suggested that environmental factors (e.g., negative experiences in
the classroom, teacher and parent characteristics), personality variables (e.g., attitude,
confidence, learning style and self-esteem) and cognitive variables (e.g., spatial and
mathematical abilities, working memory, and self-regulation) may play a role (Devine et al.,
2012; Eden, Heine, & Jacobs, 2013).
A common assumption is that MA has its roots in early school experiences, however,
there is little research that has directly investigated the experiences of MA in young children.
Retrospective reports from maths anxious pre-service teachers suggested that their MA was
linked to the instructional practices used by their own maths teachers during schooling.
Examples of anxiety-inducing instructional practices cited by these teachers include: a focus
on drill and practice, memorisation, wrote learning, emphasis on finding the correct solution,
timed testing and rule application (Bekdemir, 2010; Harper & Daane, 1998, Jackson &
Leffingwell, 1999; Reyes, 1984). Other research has suggested that unsupportive forms of
instructional and motivational discourse used by maths teachers are associated with
avoidance strategies in children (Turner et al., 2002), which may be indicative of anxiety
towards mathematics. Some children's MA may stem from the social aspects of mathematics
learning. Newstead (1998) found that social aspects of mathematics performance e.g.,
explaining a maths problem to the class or teacher, or having a peer watch while solving a

28
problem, were rated as highly anxiety inducing compared to other learning activities. Thus it
is possible that the social aspects of mathematics learning may lead to MA in some cases.
As well as potentially being triggered by unsupportive teaching practices, MA may
also be influenced by teachers' attitudes and beliefs regarding mathematics. As mentioned
above, studies have suggested that many pre-service school teachers suffer from high levels
of MA, which can lead to the development of negative attitudes towards mathematics (Harper
& Daane, 1998; Hembree, 1990; Kelly & Tomhave, 1985). Furthermore, MA in school
teachers is negatively related to their confidence in teaching maths (Bursal & Paznokas,
2006). It is possible that teachers may transmit their anxieties, negative attitudes, and lack of
confidence about mathematics to their students. Indeed, research has suggested that children's
maths attitudes and achievement are influenced by teachers' gender-stereotyped beliefs about
boys' and girls' mathematics achievement (reviewed in Gunderson, Ramirez, Levine, &
Beilock, 2012). Furthermore, female teachers' MA has been found to influence girls'
mathematics achievement via the endorsement of gender-stereotyped beliefs about maths
ability (Beilock, Gunderson, Ramirez, & Levine, 2010). However, there is no research
suggesting the direct transmission of maths anxiety from teachers to students as yet.
On the other hand, there is evidence to suggest that MA is directly transmitted to
children from their parents. Maloney and colleagues found that children whose parents were
highly maths anxious had lower maths achievement and higher MA at the end of the
academic year, but only if their parents had been more involved in maths homework activities
throughout the school year (Maloney, Ramirez, Gunderson, Levine, & Beilock, 2015).
Although the processes of anxiety transmission were not measured in this study, the authors
surmised that parents may convey MA to their children by expressing their own negative
attitudes about mathematics or by showing frustration when helping children with their
homework. The authors also thought that parents may induce MA in their children by
introducing novel problem-solving strategies which conflict with those taught by the
children's teachers, thus causing confusion. Indeed, prior research has suggested that parental
attitudes and beliefs influence children's maths achievement and mathematics related
attitudes (reviewed in Eccles, 1994). However, further research is needed to establish whether
the instructional practices used by maths anxious parents when helping with children's maths
homework could be triggers of MA in children.

29
Personality variables are also thought to play a role in the development of MA. In
particular, a lack of confidence in mathematics is thought to contribute to MA in some cases
(Stuart, 2000). Mathematics competence beliefs such as self-concept and self-efficacy are
also related to MA. Self-efficacy concerns context-specific beliefs about one's ability to
execute a course of action, whereas self-concept is not context-specific and "includes beliefs
of self-worth associated with one's perceived competence" (Pajares & Miller, 1994, p.194).
Moderate to strong negative correlations have been reported between MA and both maths
self-concept and maths self-efficacy (Hembree, 1990; Meece, Wigfield, & Eccles, 1990;
Pajares & Miller, 1994). In a structural equation modelling study, Jain and Dowson found
that self-efficacy beliefs mediated the link between cognitive self-regulation abilities and
MA, which suggests a complex interplay between personality/motivational variables and
cognitive variables in the development of MA (Jain & Dowson, 2009).
MA appears to be only weakly negatively correlated with general intelligence (e.g., r
= -.17, Hembree, 1990) and the relationship between MA and performance remains when
controlling for IQ (Wu et al., 2012), thus differences in general cognitive ability do not
appear to account for MA or its relationship with maths performance. However, MA has been
linked to performance in several other cognitive abilities such as spatial skills and, as
described above, mathematics ability and working memory/attention. Most studies that have
indicated a link between MA and deficits in WM or attentional processing have interpreted
these results as demonstrating the debilitating effect of MA on performance; nonetheless,
some explanations also suggest that WM deficits may lead to MA, although this pathway has
yet to be determined (e.g., Ashcraft, Krause & Hopko, 2007, and see Figure 3 below).
Maloney and colleagues suggested that adults with high MA have numerical
processing deficits compared to adults with low MA (Maloney, et al., 2010; 2011).
Specifically, the authors found that adults with high MA were slower in comparing numerical
magnitudes and showed greater numerical distance effects than adults with low MA.
Furthermore, adults with high MA were slower at enumerating sets of objects within the
counting range than those with low MA. These tasks are thought to gauge magnitude
representation abilities (see section 1.1.3). The authors tentatively stated that the findings
from these studies indicate that “MA may result from a basic low-level deficit in numerical
processing that compromises the development of higher level mathematical skills” (Maloney
et al., 2011, p. 14).

30
Subsequent research found that non-symbolic number comparison processes were
intact in high MA adults, yet impairments in symbolic comparison processes were seen in
high MA adults compared to low MA adults (Dietrich, Huber, Moeller & Klein, 2015). The
authors suggested that these results may reflect impairments in the link between the
magnitude representation and symbols rather than problems with magnitude representation
per se.
However, as these studies did not follow the developmental trajectory of MA or the
acquisition of mathematics skills in their participants, the authors could not determine
whether deficits in magnitude representation preceded the development of MA or whether
these differences in basic numerical processing are the consequence of having had MA for a
number of years. Importantly, these results do not preclude the possibility that highly maths
anxious adults’ basic numerical abilities were impaired because they have avoided
mathematical tasks throughout their education and in adulthood due to their high levels of
MA. Indeed, Dietrich and colleagues suggested that the impairments in symbolic number
comparison in high MA adults suggested by their findings could reflect that “the connection
between the representation and the “which numeral is larger” response might be weaker due
to less training of this connection, for example, when math anxious children are not
motivated to operate with numbers or avoid working with numbers” (Dietrich et al., 2015, p.
8).
Similarly, perceived or actual spatial ability is predictive of MA in adults (Ferguson,
Maloney, Fugelsang, & Risko, 2015). More specifically, Ferguson et al found that a
participants' self-rated sense of direction and spatial anxiety predicted their levels of MA
above and beyond the effects of general anxiety and gender. In two other experiments, these
authors found that small-scale spatial ability was predictive of MA as well and that spatial
ability mediated the relationship between gender and MA. These results were taken to
suggest that spatial deficits may underlie MA. However, the same limitations raised about the
studies of basic numerical ability also apply to these investigations. The causal direction of
the link between (perceived or actual) spatial abilities and MA cannot be determined, again,
because the participants in these studies were not followed longitudinally. Spatial skills are
thought to precede the development of numerical abilities, and thus, it is likely that spatial
skills come prior to MA in the causal chain (Gunderson, Ramirez, Beilock & Levine, 2012).
Nonetheless, it is also possible that the association between spatial performance and MA is

31
bidirectional or functions as a vicious circle in the same manner that has been suggested for
the MA and maths performance relationship. Furthermore, two of the experiments in
Ferguson and colleagues' study used self-reports rather than actual measures of the
participants' spatial ability, thus the association between MA and these self-report scales may
simply reflect some academic anxieties or gender-stereotype effects rather than spatial ability
per se (this is discussed further in section 7.1.6). Although the authors controlled for general
anxiety, they did not measure test anxiety or other academic anxieties. Other research has
suggested a link between children's spatial anxiety and mathematics performance
(Gunderson, Ramirez, Beilock et al. 2012), but it is unclear whether spatial anxieties or
spatial performance relates to MA in children.
In summary, research to date has indicated the factors that are likely implicated in the
development of MA, although no study can say definitively that one factor or the other
certainly causes it. Further longitudinal research, with appropriate control measures, is
necessary to shed light on which variables are the strongest predictors of MA, yet, it seems
probable that MA develops as a result of a combination of interacting variables.
Indeed, Ashcraft, Krause, and Hopko (2007) have proposed a theoretical framework
which places MA in the context of etiological, developmental and educational factors such as
the ones described above. This framework is depicted in Figure 3. This theoretical framework
predicts that MA can develop from non-performance factors such as biological
predisposition, learning history, and cognitive biases, or from performance-related factors
such as deficits in working memory, mathematical skill, or lack of motivation. The model
also depicts the complex interrelationship of MA and performance, predicting that
mathematics performance deficits may be related to anxiety interference (akin to the
Debilitating Anxiety model described in section 1.2.3), or cognitive impairments may
increase the likelihood of developing MA via cognitive biases, leading to further performance
deficits and avoidance (similar to the Reciprocal theory described in section 1.2.3). The
model also predicts that inadequate mathematical skill can lead to further performance
deficits independent of MA. Finally, the model predicts that those with adequate
mathematical skill, motivation, and working memory would be less likely to be affected by
cognitive biases or anxiety, and performance would remain unaffected (Ashcraft et al., 2007).

32
Figure 3. Ashcraft, Krause & Hopko’s (2007) proposed framework situating mathematics
anxiety amongst etiological, developmental and educational factors. Permissions granted for
reproduction of this figure in print version of thesis only.
Figure withheld due to
permissions for republication
being granted for print version of
thesis only.

33
Although testing the various theories of MA is outside the scope of the current thesis,
Chapter Five evaluates some of the predictions of Ashcraft and colleagues' abovementioned
MA model. For example, by measuring MA and mathematics performance in large
representative samples of primary and secondary school children, the current thesis
investigates whether MA is closely linked to maths performance deficits, whether some
children have maths performance deficits in the absence of MA and whether children with
adequate mathematical skills are unaffected by MA as predicted by the above model.
1.3 Gender differences
An abundance of research has investigated gender differences in virtually all areas of
psychology (Halpern, 1997; Hyde, 2014). For the purposes of this review, in the following
section, I will summarise research within the domains most relevant to this thesis: maths and
reading performance, DD and MA.
1.3.1 Mathematics and reading performance.
Research conducted in the 1970s and 1980s suggested that girls and boys have
comparable mathematics performance at the primary school level, but by secondary school,
boys begin to outperform girls in mathematics (e.g., Halpern 1986). Benbow and Stanley
(1980) generated a lot of attention when they reported a large advantage for boys on the
mathematics portion of the Scholastic Aptitude Test. They found that boys were
overrepresented among the highest performing children (upper 2-5% of the distribution).
Furthermore, this trend was stronger towards the higher end of the distribution. This finding,
along with other research, suggested that males may show greater performance variability
than females across a range of cognitive skills including IQ, spatial abilities, non-verbal
reasoning and mathematics (reviewed in Hedges & Nowell, 1996).
Subsequent meta-analyses have suggested that average gender differences in maths
performance may be quite small. In Hyde and colleagues' meta-analysis of gender differences
across 100 different studies, the average gender difference in mathematics performance was
actually negligible (e.g., Cohen's d = -0.05, Hyde, Fennema, & Lamon, 1990), yet boys
outperformed girls in complex mathematical problem-solving at the secondary school level (d
= 0.29). A later meta-analysis confirmed that the average gender difference was small (d =

34
0.05) but that the gender difference in complex problem solving had also decreased (d =
0.16), at least in US samples (Lindberg, Hyde, Petersen, & Linn, 2010).
Cross-national meta-analytic work has also established that average gender
differences in mathematics performance are fairly negligible in many countries. Else-Quest
and colleagues' study analysing national gender differences in mathematics in the 2003 PISA
and TIMSS data sets (involving over 40 countries and 200,000 students in each data set)
found that mean effect sizes were d < 0.15 (Else-Quest, Hyde, & Linn, 2010). However, the
study revealed a large amount of variance in the magnitude and direction of the mathematics
performance gender difference across nations. This study also indicated a link between the
magnitude of the gender difference and indicators of gender equality of the countries. The
authors posited that gender differences in mathematics are diminishing or have disappeared
altogether in more gender equal countries, which has been supported by others analysing the
PISA 2003 data set (e.g., Guiso, Monte, & Sapienza, 2008). However, this hypothesis has
been challenged recently.
Stoet and Geary (2013) conducted a more up-to-date analysis of the PISA data
collected over four assessments (1.5 million students) and confirmed that the average gender
difference in maths is small (but some larger differences emerged in non-OECD countries).
They also found that although the gender difference at the lower end of the mathematics
performance distribution was negligible, the gender difference at the top end of the
distribution was actually quite large. For example, the ratio of male to female students
performing above the 95th percentile in mathematics was 1.7 – 1.9:1 and the ratio for
students performing above the 99th percentile was 2.3 –2.7:1. The authors suggested these
results offer a potential explanation for the underrepresentation of women in most STEM1
1 It should be noted that whilst females are generally underrepresented in technology, engineering and mathematics courses, in several scientific disciplines, particularly those involving the study of people or living things, females are over-represented in university courses or industries (WISE, 2015).
courses, as students entering such courses are likely to be within the top performing students.
Stoet and Geary also found, in contrast to the earlier studies by Else-Quest et al. (2010) and
Guiso et al., (2008), that gender differences in mathematics (and reading) were not
consistently related to indices of gender equality over the four PISA assessments, which they
confirmed in subsequent work (Stoet & Geary, 2015). Furthermore, they found that the size

35
of the gender difference in maths was inversely related to the gender difference in reading,
that is, the countries with the largest gender difference in mathematics had the smallest
gender difference in reading and vice versa. Thus, these findings were interpreted as showing
that gender differences were not related to a nation's gender equality and no nation had
successfully reduced gender differences in both mathematics and reading performance (Stoet
& Geary, 2013). However, it should be noted that Stoet and Geary analysed a smaller sample
of nations in these studies compared to the previous meta-analyses (Else-Quest et al., 2010;
Guiso et al., 2008). Moreover, the authors specifically excluded several Nordic countries
from the analyses which they believed to be driving the correlation between gender
differences and gender equality reported in the previous meta-analyses. Thus, further research
across a wider sample of nations is needed in order to confirm whether a relationship between
gender differences and gender equality indices exists.
In terms of mathematics performance in the UK, the Department for Education (DfE)
reported that for children in Key Stage 2 (KS2: Years 3 – 6 in English primary schools), a
higher percentage of boys than girls achieved Level 5 and above in mathematics
(corresponding to the upper end of the mathematics performance distribution, DfE, 2014). In
secondary students, the UK Department for Education and Skills (DfES) reported that more
females gained A*–C grade in GSCE in England and that there was a small female advantage
in GCSE mathematics (DfES, 2006). A more recent study of gender differences in GCSEs
indicated that boys outnumbered girls in GCSE mathematics entries, but that gender
differences in performance depended on the precise mathematics GCSE examination
(Bramley, Vidal Rodeiro & Vitello, 2015). Girls tended to do better than boys on most STEM
subject examinations, with the exception of an applied mathematics GCSE specification.
Girls were overrepresented at the top end of the distribution compared to boys in most STEM
specifications, with the exception of 'Maths B, 'Physics B', 'Applications of maths' and
'Methods in Maths'. However, girls were overrepresented at the top end of the distribution in
alternative specifications offered for maths and physics ('Maths A' and 'Physics A'). In
contrast, boys were consistently overrepresented in the bottom 5% of the distribution for all
STEM specifications.
In contrast to the controversies surrounding gender differences in mathematics,
gender differences in reading abilities are more consistent. Myriad studies, including
international meta-analyses, have shown that girls outperform boys in reading at both the

36
primary and secondary school level (Logan & Johnson, 2010, Stoet & Geary, 2013). Stoet
and Geary suggested in their recent analysis of four years of PISA data that the gender
difference in reading performance is much larger than the gender difference in mathematics
performance, and may have increased over time (Stoet & Geary, 2013). Moreover, girls are
overrepresented at the top end of the reading performance distribution, whereas boys are
overrepresented at the lower end of the distribution (ibid). Similar findings have emerged in
UK primary school samples (DfE, 2014). At the secondary level Sammons, Sylva and
Melhuish (2014) found the difference between males' and females' attainment in GCSE
English was, on average, approximately half a grade level.
1.3.2 Developmental Dyscalculia.
Similar to the conflicting gender differences that have been reported in studies
measuring mathematics performance, DD studies also show no consistency in terms of
gender ratio. The prevalence studies described earlier in section 1.2.2 reported widely varying
gender ratios which I summarise here.
Several studies found that the prevalence of DD was higher in girls than in boys
(Dirks, et al., 2008; Hein et al., 2000; Lander & Moll, 2010). In contrast, Reigosa-Crespo
and colleagues (2011) and Barahmand (2008) found the opposite pattern, reporting male to
female gender ratios of 4:1 and 1.75:1.0 respectively. Barbaresi et al. (2005) found that the
cumulative incidence of DD was higher for boys than girls regardless of the age of the
children or how DD was defined (see Table 1 for the three definitions they compared).
Badian (1983; 1999) found that when DD was defined using performance below the 20th or
25th percentile on the SAT maths, the gender ratio was equal for children in lower
elementary grades, but the prevalence of DD was higher in boys than girls in Grade 4 and
above. Similarly, Mazzocco and Myers (2003) found an equal prevalence of girls and boys
with DD in young children (kindergarten to second grade). Desoete and colleagues (2004)
also reported similar percentages of Flemish boys and girls meeting criteria for DD in Grades
two to four.
Other studies reported an equal prevalence of girls and boys with DD in older
elementary school children (e.g., Gross-Tsur et al.,1996; Koumoula et al., 2004; Lewis et al.,
1994; see Table 1 for definitions used).

37
Exceptionally, Ramaa and Gowramma (2002) found that the gender ratio of DD
depended on the diagnostic criteria. When a diagnostic test was administered, the prevalence
of DD was higher in boys than girls. On the other hand, when teachers were asked to identify
children with DD the prevalence was higher in girls than in boys. When exclusionary criteria
were applied, DD was equally prevalent in girls and boys.
Collectively, these results suggest that the gender ratio of DD does not systematically
relate to the age of the sample, although it is important to note that several studies did not
report/ measure separate gender ratios for different age groups. Importantly, these findings
also suggest that, for the most part, the gender ratio does not appear to relate to how DD is
diagnosed, however, several studies did not report/ measure separate gender ratios for
different diagnostic criteria.
Chapters Three and Six of the current thesis examine gender differences in DD. In
particular, Chapter Three investigates the effects of different diagnostic criteria on the gender
ratio of DD. Chapter Six focuses on the gender ratio of DD and co-occuring MA.
1.3.3 MA.
Boys report higher levels of mathematics self-confidence, mathematics self-efficacy,
and self-concept than do girls (Else-Quest et al., 2010; Huang, 2013; OECD 2015).
Furthermore, boys are more motivated in mathematics than girls (Middleton & Spanias,
1999). However, gender differences in MA are not as clear cut.
Although adult studies have suggested that women tend to report higher MA levels
than men (Ashcraft & Faust, 1994; Betz, 1978; Chang & Cho, 2013; Ferguson et al., 2015;
Miller & Bichsel, 2004), MA gender differences in childhood and adolescence are not as
consistent. Recently, attention has turned towards investigating MA in primary samples (e.g.
Aarnos & Perkkila, 2012; Galla & Wood, 2012; Karasel & Ayda, 2010; Vukovic, et al.,
2013; Wu et al., 2012), however, these studies rarely report gender differences. In addition,
due to the lack of consistency relating to the measure of MA used, meaningful gender
patterns have been difficult to extract.
Several studies measuring MA in primary samples have found no difference between
girls’ and boys’ MA levels (Gierl & Bisanz, 1995; Newstead, 1998; Young, Wu & Menon,
2012). Similar null findings have even been reported in 1st and 2nd graders (Harari et al.,

38
2013; Ramirez et al., 2013). Likewise, Punaro and Reeve (2012) found no relationship
between maths worry and gender in a cohort of 9-year-olds.
Conversely, some studies have reported MA gender differences in primary samples.
Griggs and colleagues, for instance, found that 5th-grade girls reported higher MA compared
to boys (Griggs Rimm-Kaufman, Merritt & Patton, 2013) and Yuksel-Sahin (2008) reported
an equivalent finding in a cohort of 4th and 5th-grade students. Similarly, Krinzinger and
colleagues found that boys had more positive attitudes towards maths compared to girls from
the end of the 1st grade through to the end of the 2nd grade (Krinzinger, Wood & Willmes,
2012). Further, Satake and Amato (1995) reported higher levels of ‘maths test anxiety’ in
girls than boys in 5th and 6th Grade. Recently, Hill, Mammarella, Devine, Caviola,
Passolunghi and Szűcs (2016) found that Italian girls reported higher MA than boys at both
primary and secondary school levels. Thus, although sparse, there is some evidence to
support the existence of a MA gender difference in primary education and more specifically,
girls appear to experience higher levels of MA compared to boys. In general, the studies
reporting null findings tend to involve younger primary students whereas the studies
reporting higher MA in girls than boys tend to involve older primary students. Thus,
collectively these studies suggest that gender differences in students’ MA levels may only
begin to emerge during the later stages of primary education, however, further research
investigating gender differences in MA in primary students is necessary to evaluate this
possibility.
Similar to the primary level findings, several studies of MA in adolescents have found
no gender differences in girls’ and boys’ MA levels. For example, studies conducted in
Finland (Kyttälä & Björn, 2014), New Zealand (Sepie & Keeling, 1978), Turkey (Birgin et
al., 2010; Dede, 2008) and the US (Chiu & Henry, 1990; Hadfield, Martin, & Wooden, 1992;
Joannon-Bellows, 1992) have found no differences in the mean level of MA reported by boys
and girls across all secondary school grades. However, many more studies have found MA
gender differences in secondary school participants.
Gender differences in relationship between MA and mathematics performance were
investigated in two studies of data collected longitudinally from students in the US in the
1980s: the Longitudinal Study of American Youth (LSAY; Ma & Cartwright, 2003; Ma &
Xu, 2004) and Childhood and Beyond study (CAB) (Eccles & Jacobs, 1986; Meece et al.,
1990; Wigfield & Meece, 1988). Both studies followed children from middle school until the

39
senior high school grades. The LSAY reported mixed results with respect to gender
differences in MA: while they found no overall gender difference in MA, girls’ MA grew
faster and remained more stable than boys’ MA. Furthermore, whilst boys’ prior low maths
achievement predicted later high MA at all grade levels, girls’ prior low maths achievement
only predicted later high MA at critical transition points during schooling (for example,
transferring from middle school to secondary school; Ma & Cartwright; 2003; Ma & Xu,
2004). On the other hand, the CAB study found that girls reported higher MA than boys,
particularly for the subscale of MA measuring negative affective reactions, however, they
found the relationship between MA and maths performance was the same for both genders
(Meece et al., 1990; Wigfield & Meece, 1988).
Cross-sectional studies of American high school students have found differing
patterns of gender differences. Bernstein, Reilly, and Cote-Bonnano (1992) found that mean
MA was not significantly different for girls and boys up to age 13, but that from age 14 to 19,
girls were more anxious about mathematics than boys. Similarly, a Canadian study found that
MA was higher in girls than boys in a co-educational school (Shapka & Keating, 2003).
The gender differences reported in studies conducted in Europe appear to be more
consistent, with the majority of studies finding that girls have higher MA than boys. This was
found in German (Frenzel, Pekrun & Goetz, 2007; Goetz et al., 2013); Italian (Primi,
Busdraghi, Tomasetto, Morsanyi, & Chiesi, 2014); Latvian (Kvedere, 2012); and English
secondary school students (Chinn, 2009; NB: MA tended to be higher in girls than boys
although statistical comparisons were not run; Devine et al., 2012). Goetz and colleagues
found that only trait MA was higher in girls than boys in their sample, but there were no
gender differences in state anxiety (Goetz, Bieg, Lüdtke, Pekrun, & Hall, 2013). Although
Kyttälä and Björn found no gender difference in mean level of MA in their study of Finnish
students, they found that the relationship between MA and math word problem solving was
significant for girls but not for boys, however this difference in the strength of the correlation
in girls and boys was not statistically tested (Kyttälä & Björn, 2014). Similarly, as mentioned
earlier, we found that when the effects of test anxiety were controlled, the negative
correlation between MA and maths performance remained significant for girls but not for
boys, and a difference test confirmed the difference in correlation strength between genders
(Devine et al., 2012).

40
In Asian countries, secondary school girls have also been found to have higher MA
than boys (Baya’a, 1990; Saigh & Khouri, 1983), however, another study has suggested the
opposite result (Abed & Alkhateeb, 2001). More recently, Keshavarzi and Ahmad (2013)
found no overall gender difference in the MA of 12- to 14-year-old Iranian students but found
gender differences emerged when they conducted separate comparisons for the different
subscales of the MA scale they used (the Mathematics Anxiety Scale for Children, Chiu &
Henry, 1990). More specifically, girls reported higher MA than boys on the problem solving
and evaluation anxiety subscales whereas boys reported higher anxiety than girls on the
teacher anxiety subscale. Conversely, no gender difference emerged for the learning math
anxiety subscale. These findings highlight the importance of analysing gender differences
separately by subscale for multidimensional MA scales, as reporting overall levels may
average out any gender differences.
Ho et al. (2000) found no gender difference in cognitive or affective dimensions of
MA in Chinese students using a translation of Wigfield and Meece’s (1988) Math Anxiety
Questionnaire (MAQ), however, they also found that girls from Taiwan had higher affective
and cognitive MA than boys. More recent findings have reported gender differences in
Chinese students with Luo, Wang, and Luo (2009) reporting higher MA for girls than boys
on both the affective and cognitive dimensions of the MAQ. Two studies conducted in India
also reported higher levels of MA in secondary school girls than in boys (Jain & Dowson,
2009; Khatoon & Mahmood, 2010); furthermore, the latter study found that gender interacted
with school type, wherein females’ MA was especially high in particular types of managed
schools.
Although there are a few exceptions, there appears to be more evidence that, cross-
nationally, secondary school girls have higher levels of MA than secondary school boys. Two
major meta-analyses of cross-national data also support this. The meta-analysis of 151 studies
by Hembree (1990) reported that girls reported higher MA than boys across all high school
grades. The more recent analysis of PISA data reported that 94.9% of the countries included
in the 2003 assessment reported higher MA in girls than boys, with the remaining 5.1%
countries reporting negligible effect sizes (Else-Quest et al., 2010).
Collectively these results suggest that MA is higher in secondary school girls than
boys. Furthermore, MA appears to be more stable in secondary school girls than boys (Ma &
Xu, 2004) and, given that girls appear to have higher MA across a range of anxiety subtypes,

41
MA also appears to be more pervasive in secondary school girls. However gender differences
in the relationship between MA and maths performance seem mixed with some studies
reporting that this relationship is stronger in girls than in boys (e.g., Devine et al., 2012);
others suggesting that performance may be more predictive of MA in boys than girls (Ma &
Xu, 2004) or finding no gender difference in the relationship between MA and maths
performance (Meece et al., 1990; Wigfield & Meece, 1988).
The current thesis examines gender differences in MA in primary and secondary
school samples to address some of the abovementioned research gaps. In particular, the
current thesis examines whether gender differences in MA exist at the primary school level
and whether any gender difference exists in the relationship between mathematics
performance and MA. Further, the current thesis tests whether a gender difference exists in
the gender ratio of co-occurring MA and DD.
1.3.4 Theories of gender differences.
Many theoretical models have been proposed to attempt to explain gender differences
in various psychological and performance variables, for instance: biological theories,
evolutionary theories, and social cognitive and socio-cultural theories (Halpern, 1997; Hyde,
2014). In short, evolutionary theories hypothesise that different psychological mechanisms
have evolved in males in females (Buss & Schmitt, 1993). On the other hand, Cognitive
Social Learning Theory posits that gender effects are the result of behaviour shaped by
rewards and punishments, or learnt via imitation and modelling of others (Bussey & Bandura,
1999). Socio-Cultural Theory postulates that society's gendered division of labour is
responsible for the formation of social roles which leads to sex-differentiated behaviour and
psychological gender differences (Eagly & Wood, 1999). While there is mixed support for
evolutionary theories, there is more evidence to support the mechanisms proposed by
Cognitive Social learning theory and mounting evidence to support Socio-Cultural Theory
(Hyde, 2014). Other theories have been more explicitly linked to gender differences in
mathematics performance.
Benbow and Stanley (1980), in their famous study suggesting a male advantage in
performance on the SAT mathematics, gave a (partly) biological explanation of their
findings. They stated that “male superiority [in mathematics] is probably an expression of a
combination of both endogenous and exogenous variables” (p. 1264). Benbow and Stanley
did not go so far as to suggest precisely what these endogenous variables were, but possible

42
genetic explanations of MLD/ gender differences have been suggested by studies linking
specific genetic disorders to MLD. For example, Fragile X syndrome and Turner Syndrome
are more frequent in girls than in boys (see Gross-Tsur et al., 1996).
Sex hormones have also been suggested as biological sources of cognitive gender
differences, as hormones influence prenatal brain development and organisation (Collins &
Kimura, 1997). However, the evidence supporting the role of prenatal sex hormones in later
cognitive gender differences (such as mental rotation ability and verbal fluency) is
inconclusive, particularly due to lack of replication and the limited reliability of different
measures of prenatal hormone levels (Hines, 2011, Hines, Constantinescu & Spencer, 2015).
Similarly, research linking prenatal sex hormone exposure to gender differences in
mathematics ability has revealed inconsistencies (Hines, 2011). Recent work has focussed on
the role of early postnatal testosterone levels on the development of cognitive and
behavioural gender differences. Although a link between postnatal testosterone and
expressive vocabulary (at ages 18 – 30 months) has been found by one study, this finding has
not been replicated (reviewed in Hines, et al., 2016). As yet, no studies appear to have
investigated the influence of postnatal testosterone on gender differences in mathematics
(ibid). Similarly, although sex differences in brain volume and function have been identified
(reviewed in Halpern et al., 2007), research attempting to link these neural differences to
cognitive gender differences has also not yielded many conclusive findings (Hines, 2011).
Some have recognised that neither biological nor social factors alone can explain
gender differences, particularly as biological and environmental influences are thought to
function reciprocally (Halpern, et al., 2007, Wood & Eagly, 2013). Halpern's,
biopsychosocial model of sex differences conceptualises nature and nurture as elements of a
continuous loop. This model portrays the influence of biological factors such as genes and
hormones on brain development and their reciprocal relation with environments/ experiences.
Importantly, a more specific theory may contribute to gender differences in
mathematics performance, affect, and subsequent subject choice, namely, Expectancy-Value
theory (Eccles, 1994). This theory links two sets of beliefs to academic choices: an
individual's expectancies (e.g., expectations for success) and their subjective task values (e.g.,
interest in a task, perceived usefulness). However, an individual's beliefs are influenced by
various other factors including the cultural milieu (e.g., gender role stereotypes), the
individual's aptitude and previous educational experiences, their interpretation of these

43
experiences including affective memories, the individual's goals and self-schemata (e.g., self-
concept), as well as socialisers' beliefs and expectations. Primarily, this model has been used
to understand gender differences in STEM course uptake (Eccles, 1994); but it may also
contribute to gender differences in many of the abovementioned mathematics learning related
variables. For example, gender differences in mathematics self-concept/ self-efficacy,
motivation, and MA could be included in this model. Furthermore, gender differences in
performance under stereotype threat (Huguet & Regner, 2007) and the differential effects of
parents' and teachers' beliefs and expectations on girls' and boys' maths performance (Eccles,
1994; Gunderson, Ramirez, Levine et al., 2012) may also be predicted by this model.
Testing different theories of gender differences in mathematics performance and
affect is, again, outside of the scope of the current thesis. However, an understanding of the
possible cultural, personal, and social factors involved in psychological gender differences is
relevant as the current thesis investigates gender differences in reading and mathematics
performance, DD, and mathematics affect.
1.4 Current study and outline of thesis
The overarching aim of this thesis is to examine the link between cognitive and
emotional mathematics learning problems. This dissertation focuses on DD, a specific
learning difficulty of mathematics, and MA, a negative emotional reaction to mathematics
tasks. The current thesis examines the link between MA and DD by measuring the prevalence
of each of these maths learning problems individually, and as co-occurring conditions. The
stability of DD diagnosis and its associated cognitive deficits is also investigated. Further,
gender differences will also be inspected in DD and MA. The data analysed in this
dissertation was collected during two funded research projects. Chapters Two to Four include
data from the ‘Cognitive neuroscience of Developmental Dyscalculia’ project (Medical
Research Council, UK), and Chapters Five and Six include data from the ‘Understanding
Mathematics Anxiety’ project (Nuffield Foundation). Hereafter, these projects shall be
referred to as Project 1 and Project 2 respectively.
In spite of a growing research base, there is currently no agreed upon functional
definition of DD and diagnostic criteria have varied widely, particularly in experimental
studies. Prevalence studies tend to use more conservative thresholds to define poor
mathematics performance, however, even the diagnostic criteria employed in prevalence
studies have varied widely. Furthermore, past studies have used various tests of mathematical

44
skills and some issues have arisen from the use of non-standardised tests or tests with
outdated norms. Researchers have also differed on their use of discrepancy definitions, which
define DD as a certain discrepancy (e.g., 1 or 1.5 SD) between maths performance and IQ or
language abilities. The use of a control variable in DD diagnosis is also not consistent,
however, a control variable is necessary in order to determine the specificity of the
mathematics learning problem. The study described in Chapter Two uses reading
performance as a control variable and will investigate the impact of varying DD diagnostic
criteria and performance thresholds on the prevalence of DD in a sample of 1004 primary
school children. Age-standardised tests linked to the National Curriculum are used to
measure mathematics and reading performance and the correlation between these two
variables is investigated.
Inspection of the previous literature also revealed inconsistencies in terms of gender
differences in mathematics performance and DD. Classic studies reported a male advantage
in mathematics, however, more recent work suggests that the gender gap in mathematics is
decreasing (Else-Quest et al., 2010). Boys may still outnumber girls at the upper end of the
mathematics performance distribution (Stoet & Geary, 2013). DD prevalence studies have
also reported different gender ratios, however, the last UK study reported an equal prevalence
of girls and boys with DD (Lewis et al., 1993). Gender differences in reading performance
are more consistent, with girls typically outperforming boys, and girls are over-represented at
the top end of the reading performance distribution, whilst boys are overrepresented at the
lower end of the distribution (Stoet & Geary, 2013). Chapter Three examines gender
differences in the same sample described in Chapter Two. More specifically, gender
differences are inspected in mathematics and reading performance, and in the prevalence of
DD, contrasting the diagnostic criteria explored in Chapter Two.
Chapter Four reports the longitudinal measurements (taken over three time points) of
a subsample of the children tested in Chapters Two and Three. More specifically, subgroups
of children with DD, high mathematics performance, and a control group were tested in
several sessions on a wide range of cognitive skills, including IQ measures, working memory,
spatial skills and MA. In order to set the context for the longitudinal analysis, the introduction
to Chapter Four describes the outcome of our previously published study (Szűcs et al., 2013)
which tested different theories of DD in the same sample tested in Chapter Four. Our
previous work contrasted the deficient number module theory of DD against alternative

45
theories of deficits in working memory, attention and inhibitory function (reviewed in section
1.1.3). Chapter Four continues this work by investigating the stability of the associated
performance deficits in DD, and the stability of the performance advantages in control
children and gifted mathematicians. Chapter Four also explores the link between DD and
MA.
Chapter Five investigates this link further by examining the prevalence of MA and the
relationship between MA and performance in a large sample of children. Similar to DD
research, MA researchers have also disagreed on how to define high MA, because the point at
which moderate levels of MA becomes high MA is difficult to pinpoint when using self-
report scales. Some have estimated the prevalence of MA statistically (e.g., using a mean+ 1
SD threshold, Ashcraft et al., 2007), however, this definition assumes that the distribution of
MA scores is normal, and normality of MA scores is rarely reported. Thus, in Chapter Five,
the prevalence of high MA is estimated by inspecting the MA performance distribution in a
sample of 1757 primary and secondary students. The relationship between MA and
performance is also measured in this large sample and also in a subsample of children with
DD. Finally, the prevalence of co-occurring MA and DD is also measured, to explore
whether MA and DD are one and the same or whether they are dissociable mathematics
learning problems.
Prior research has also indicated inconsistencies in MA gender differences. While
studies employing adult populations have consistently found that MA is higher in females
than in males, MA gender differences in school children are not as straightforward. In sum,
evidence suggests that secondary school girls have higher MA than boys, a pattern which is
also seen in older primary school children. Chapter Six investigates gender differences in
maths and reading performance, and DD and MA and in comorbid DD and MA in both
primary and secondary school samples.
Finally, Chapter Seven discusses the implications of the findings for research and
education as well as the limitations of the current research and directions for future study.

46
2. Chapter Two. Prevalence of DD in the United Kingdom2
The majority of DD research involves experimental studies, which test causal
theories of DD or measure the characteristics of DD in a controlled environment. In
general, experimental studies have used broad selection criteria, for example, defining
DD using performance cut-offs ranging from the 10th to the 45th percentile (Murphy
et al. 2007). These cut-offs are illustrated in Figure 1. These broad selection criteria
likely substantially inflate DD prevalence estimates. Prevalence studies, that is,
studies that measure the number of cases of DD in a particular (sufficiently large),
population at a particular point in time, are likely to reveal more accurate prevalence
estimates. In general, prevalence studies tend to use more conservative diagnostic
criteria than experimental studies. My review of prior research revealed that the
prevalence estimates provided by different demographic studies vary between 1.3%
and 10.3% (the mean estimate is about 5.6%). These prevalence estimates are shown
in Table 1.
There are some obvious reasons for this broad range of estimates. First, some
prevalence studies defined DD using an IQ-achievement discrepancy (e.g.,
Barahmand, 2008; Barbaresi et al, 2005; Lewis et al., 1994; Mazzocco & Myers,
2003), that is, mathematics performance that is substantially below what would be
expected given general intelligence. Similarly, Barbaresi et al. (2005) estimated the
prevalence of DD using a regression-based discrepancy definition, in which maths
performance scores were predicted by a sum of a constant (i.e. a ‘discrepancy’ value)
and a weighted sum of the IQ score. Second, others defined DD by the severity of the
mathematics impairment using performance cut-offs on standardised tests; the range
of cut-offs used in the prevalence studies is represented in Figure 2. These cut-offs
varied broadly, from performance below the 3rd percentile to performance below the
25th percentile (2 SD to 0.68 SD below the mean). Third, DD has also been defined
using a two-year achievement delay as a diagnostic criterion, that is, DD was defined
2 This chapter is an expanded version of data presented in Devine et al. (2013).

47
as mathematics performance equal to or below the average level of children two years
younger (e.g., Barahmand, 2008; Gross-Tsur et al., 1996; Ramaa & Gowramma.)
Some demographic studies use control variables in their definitions of DD,
such as IQ and/or language abilities. A control variable is necessary to determine
whether disability is general to several domains (e.g., it is a general learning
disability), or whether it is specific only to mathematics. The use of an IQ-
achievement discrepancy definition has been questioned in dyslexia research (Francis
et al., 2005) and also represents an important disagreement in DD research. Research
has suggested that some children with DD may not show an IQ-achievement
discrepancy (e.g., Mazzocco & Myers, 2003). Some definitions of DD used in
previous studies specified average performance in a control measure (Desoete et al.,
2004; Dirks et al., 2008; Hein et al., 2000; Koumoula et al., 2004; Lewis et al., 1994;
Ramaa & Gowramma, 2002). Some prevalence studies measured abilities in other
domains but included children with comorbid learning disorders in the DD groups
(e.g., Gross-Tsur et al., 1996; Mazzocco & Myers, 2003; Ramaa & Gowramma,
2002). Others reported separate prevalence estimates for children with MD only and
those with co-occurring reading difficulties (e.g., Badian, 1983, 1999; Landerl &
Moll, 2010; Lewis et al., 1994). Several prevalence studies did not include a control
variable at all in their definitions of DD, that is, they just defined DD/MLD on the
basis of low mathematics scores and thus did not differentiate between specific and
comorbid learning disabilities (e.g., Barbaresi et al., 2005; Geary, 2010; Kosc, 1974;
Reigosa-Crespo et al., 2012).
It is important to note that empirical prevalence studies are important because
prevalence estimates based on control variables do not simply identify the tail of the
normal distribution along a single variable. Rather, because a population is defined on
the basis of multiple variables, prevalence values depend on the strength of the inter-
correlation of the variable of interest (e.g., mathematics in the case of DD) and the
control variable(s) (i.e. on the distribution of two or more variables). For example, if
DD is defined not only on the basis of mathematics scores but simultaneously on the
basis of a control variable like reading achievement, the correlation between
mathematics performance and reading achievement must be determined empirically.

48
2.1.1 The current study.
Given that the last prevalence study in the UK was 22 years ago (Lewis et al.,
1994), and that the prevalence estimates reported in that study were based on scores
from outdated standardised tests, there is a need for a more recent epidemiological
investigation in the UK. The current chapter reports findings from Project 1 and
investigates the prevalence of DD in the UK (published in Devine, Soltész, Nobes,
Goswami & Szűcs, 2013). The study involved 1,004 children from 22 schools located
in the east of England. Age-standardised tests of mathematics and reading (the control
measure), were administered to all children in the cohort. The tests used in the current
chapter were developed and normed only a few years prior to test administration.
The aim of the current chapter was to estimate the prevalence of DD, to
describe features of the distribution of scores and to demonstrate the effects of using
the different performance cut-offs on the prevalence estimate. My research questions
were the following: (1) how is the prevalence of DD affected by the inclusion of a
control variable? (2) How is the prevalence of DD affected by varying the
mathematics and reading performance cut-offs? Because previous demographic
studies have found different prevalence estimates we did not have specific hypotheses
about the prevalence of DD.
2.2 Method
2.2.1 Participants.
The sample comprised 1,004 children (526 boys and 478 girls) ages 7 years 4
months to 10 years 1 month attending Year 3 (N = 806 mean age = 8:1) and Year 4 (N
= 198, mean age = 9:1) of primary school. The participating schools were state
primary schools located in Cambridgeshire (12 schools), Hertfordshire (8 schools) and
Essex (2 schools), England. The schools comprised a mix of urban schools and
outlying rural schools and the catchment populations of the schools were
predominantly lower-middle class. Year groups ranged in size from 9 pupils to 79
pupils. Table 2 shows the age and gender distribution for the two year groups. The
study received ethical permission from the Psychology Research Ethics Committee of
the University of Cambridge. The information sheet and consent form can be found in
Appendix A.

49
Table 2.
Demographic features of the sample. 1,004 children were tested in total.
Year 3 Year 4
N Mean age
(in months)
SD N Mean age
(in months)
SD
Females 413 97.47 3.89 113 109.47 4.48
Males 393 97.60 3.80 85 109.18 4.02
Total 806 97.53 3.84 198 109.34 4.28

50
2.2.2 Measures.
Mathematics test. The mathematics tests used were the Mathematics
Assessment for Learning and Teaching tests (MaLT) (Williams, 2005). The MaLT
tests are group-administered written tests. The MaLT tests were developed in
accordance with the National Curriculum and National Numeracy Strategy for
England and Wales. Test items cover the following mathematics topics: counting and
understanding number; knowing and using number facts; calculating; understanding
shape; and measuring and handling data. The MaLT tests were standardised in 2005
with children from 120 schools throughout England and Wales (MaLT 8: N = 1,358
children, standardised for children aged 7:0 to 9:5, α= 0.91; MaLT 9: N = 1,238,
standardised for children aged 8:0 to 10:5, α=0.93). Both MaLT tests allow a
maximum of 45 minutes for completion and scores are calculated out of a total of 45
points. Raw scores can be converted to standardised scores and national curriculum
levels.
Reading test. The reading test used was the Hodder Group Reading Test II
(HGRT-II) (Vincent & Crumpler, 2007). The HGRT II level 1 was used for Year 3
pupils, and the HGRT II level 2 was used for Year 4 pupils. These multi-choice tests
assess children’s comprehension of words, sentences and passages. The tests were
standardised in 2005 with children from 111 schools throughout England and Wales
(HGRT II level 1 is standardised for children aged 5:0 to 9:0, α = 0.96; HGRT II level
2 is standardised for children aged 7:0 to 12:0, α = 0.95). Each test has two parallel
forms which were used in the present study to minimise copying. Both HGRTII tests
allow a maximum of 30 minutes for completion, with the exception of children who
would normally require additional time on National Curriculum assessments. For
these children, the HRGT level 1 allows for an additional 5 minutes for completion.
The raw score (out of 40 points for the level 1 test and 53 points for the level 2 test)
can be converted to standardised scores, reading ages and national curriculum levels.
2.2.3 Procedure.
The tests were administered to the children between March and December
2010. The tests were administered to whole classes. Classes typically completed both

51
tests in one day, with a break between the two tests. Usually, the break coincided with
morning or lunch break or other school activities (e.g., school assembly). As far as
was possible, the order of test administration was counterbalanced across the different
classes.
All children completed the tests under test-like conditions: the children’s
tables were separated and children were discouraged from speaking or colluding with
neighbouring children. At the beginning of the reading test, the researchers explained
the test instructions and ran through two practice questions with the class before the
test began. The children worked through the reading test without any input from the
researchers or teachers except for explaining the test instructions again where
required.
The mathematics assessments do not include practice questions, however, the
tests allow for invigilators to read the questions to the children if required because the
test items require a fair amount of reading and test performance should reflect
mathematics ability rather than reading proficiency. Reading questions is also the
convention for the administration of National Curriculum mathematics assessments in
England and Wales. The test instructions were explained to the children before the
test began and children were asked to raise their hands if they required help with
reading, in which case the researchers or supervising teachers read the MaLT
questions to the children. Some schools preferred to separate low ability readers from
the rest of the class and have a teaching assistant read the MaLT to the group in a
separate room or another part of the classroom. In other cases, teaching assistants
worked one-on-one with children with low reading abilities or other special
educational needs. Two children with special education needs were excluded from
testing because their teachers believed that the tests would cause the children distress.
2.2.4 Data analysis.
Maths and reading raw scores were converted to age-standardised scores for
analysis. The relationship of mathematics and reading performance was tested by
correlational analysis (Pearsons’s r). The distributions of maths and reading scores,
for all children, were tested for normality using the Kolmogorov-Smirnov test.

52
The distribution of reading and maths scores was cut into two halves in the
following way. Children with maths scores from 70 to 104 composed the lower half of
the distribution. Children with maths scores from 105 to 140 belonged to the upper
half of the distribution. The correlation between maths and reading scores were
computed for both halves, separately. The strength of the correlations between the two
halves was compared by the difference test for r values. Furthermore, five bins were
also created (70-84, 85-98, 99-112, 113-126, 127-140) from the distribution in order
to ensure that any changes in the strength between the two halves of the distribution
are due to gradual changes and not to one or two bins of the distribution having outlier
r values.
2.3 Results
2.3.1 Analysis of distributions.
As can be seen in Figure 4, mathematics scores were positively correlated with
reading scores (r = .626, p < .001). Figure 4 shows the correlation of mathematics and
reading scores across the sample. Figure 5 also shows the individual distributions of
mathematics and reading scores. Neither distribution differed from normal (p > .1 for
all).

53
Figure 4. Correlation of mathematics and reading performance.
Figure 5. Distributions of mathematics and reading performance. Neither of these
distributions was significantly different from normal.

54
2.3.2 The effect of criterion levels on the identified prevalence of DD.
The relationship of reading and math abilities is clear from their significant
correlation. However, the strength of this correlation changes across the distribution.
The correlation between reading and maths is r = .57 (N = 544) in the lower half of
the distribution and it is r =.21 (N = 440) in the upper half of the distribution, which is
a significant difference in correlation strength according to the difference test (p
<.001). The gradual weakening of the correlation is also reflected by the decaying r
values when the distribution is divided into 5 bins (in steps of 14 scores): .27, .20, .18,
.14, -.15, from the lowest bin to the highest bin, respectively.
In order to gain further understanding of the relationship between reading and
maths abilities with regard to defining DD, we investigated the effects of using
different mathematics and reading cut-offs to define DD. Figure 6 shows the number
of children defined as having DD using different reading and mathematics
performance cut-offs.

55
Figure 6: The effect of different reading and maths cut-offs on the number of children
diagnosed with DD.

56
As can be seen in Figure 6, the number of children defined as having DD at a
particular mathematics cut-off score also depends on the cut-off score used to define
good reading performance. Several different arbitrary thresholds could be defined.
The most likely ones are illustrated in Figure 7A. A potential scenario would be to not
control for an impairment in another domain or for a potential domain general
problem and include all children regardless of their reading ability when diagnosing
DD. This scenario is represented by the continuous line in Figure 6 (‘no reading cut-
off’). For example, if DD is defined using a mathematics score cut-off of <1 SD below
the mean (a standardised score of 85) then 131 children (13.04% of the cohort) can be
categorised as having DD. If a more conservative cut-off of <1.5 SD below the mean
(a standardised score of 78) is used, the number of children categorised as having DD
more than halves and drops to 53 children (5.3% of the cohort). An alternative
scenario is to exclude all children with a reading score worse than 1.5 SD below the
mean (i.e., standardised reading scores below 78) from the DD diagnosis. This
scenario is shown by the dashed line in Figure 6. If we again define DD by using a
mathematics score cut-off of <1.5 SD below the mean we can categorise 24 children
(2.4% of the cohort) as having DD. If, in a third, more conservative scenario, we
introduce a stricter reading cut-off at <1 SD below the mean (standardised reading
scores below 85) and still use a <1.5 SD cut-off on maths scores to diagnose DD, the
number of children with DD reduces further to 9 (0.89%). If we define poor
mathematics performance using a less conservative cut-off (<1 SD below the mean),
with a reading cut-off of <1.5 SD below the mean, 85 children are defined as having
DD (8.86%); with a reading cut-off of <1 SD below the mean, 56 children are defined
as having DD (5.58%).
The frequencies of children for different combinations of maths and reading
thresholds are also illustrated in Figure 7A.

57
Figure 7. The percentage and number of children in given cut-off cells (A) and the
percentage and number of children in given discrepancy score (mathematics –
reading) cut-off cells (B). The x-axis shows the combined mathematics and reading
cut-off cells (A) and mathematics – reading discrepancy cut-off cells (B) (the
corresponding standard deviation values are in brackets). A: *No reading cut-off.

58
Figure 7B shows the distribution of the sample as a function of discrepancy
scores (maths minus reading scores). The two leftmost bars represent higher reading
performance than maths and the two rightmost bars represent higher maths
performance than reading. Most children fell within ±1 SD difference between maths
and reading scores (see also Figure 7A). The prevalence of DD using these
discrepancy definitions ranged from 7.47% (1.5 SD between maths and reading
performance) and 17.23 % (1 SD between maths and reading performance).
2.4 Discussion
2.4.1 Mathematics and Reading performance.
The current study found that mathematics and reading performance was
positively correlated and that the correlation was stronger in the lower half of the
distribution than in the upper half. The stronger relationship between maths and
reading performance at the lower end of the distribution could be interpreted to
suggest that perhaps domain general factors (e.g., IQ) influence performance more at
the low than at the high end and domain-specific differences are more evident at the
higher end. However, we cannot conclude about the causes of DD from this
observation because such potential causes were not measured here. For example, it
may be that maths performance is related to several different causal factors in
different children at the lower end of the distribution and these causal factors also
have a variable impact on reading performance (because r <1). Similarly, we cannot
conclude clearly about the reasons for specificity at the higher end because
outstanding performance in maths and reading can, for example, be strongly
influenced by motivational factors and competence beliefs. Hence, it is not clear
whether increased specificity at the high end can be attributed to specific cognitive
variables. However, the change in the strength of the correlation across the
distribution has implications for defining DD if good reading performance is to be
included in the definition alongside poor mathematics performance.

59
2.4.2 Prevalence of DD.
The empirically measured prevalence of DD depends on both a mathematical
criterion variable and on a control variable used to assess the specificity of the
weakness. Here reading performance served as a control variable. We found that DD
prevalence is seriously affected by the cut-off score used to define good reading
performance. In summary, even when shifting cut-off scores in reading and maths
between <1 SD and <1.5 SD there is considerable variation in the number of children
diagnosed with DD, the frequency of diagnosis ranges from 9–131 (0.89% - 13.04%)
in a sample of 1004 children (illustrated in Figure 6 and Figure 7A). If we use a <1.5
SD cut-off for both reading and maths then 2.39% of the sample (24 out of 1004
children) can be diagnosed to have DD. If both cut-offs are <1 SD, the prevalence of
DD is 5.58% (56 out of 1004).
If discrepancy thresholds are used to define DD (1 SD or 1.5 SD between
reading and maths performance) then 7.6 to 17.23% of the sample (79 to 188 out of
1004 children) can be diagnosed with DD (See Figure 7B). However, some of the
children who would be defined as having DD using a discrepancy of 1 – 1.5 SD
between mathematics and reading performance, in fact, had mathematics performance
which fell within the average range and high reading performance. This profile does
not fit a severe impairment of mathematics skills. Rather, these children would be
typically regarded as gifted readers rather than weak in mathematics. Furthermore,
such discrepancy definitions exclude children who show a discrepancy between their
mathematics and reading performance but who do not quite reach the discrepancy
threshold of 1 or 1.5 SD. Inspecting the frequency of children with low mathematics
performance and average (e.g., 0.5 SD discrepancy between reading and maths) or
high reading performance (e.g., 1.0 to 1.5 SD discrepancy between reading and maths)
are more sensible discrepancy definitions of DD. These relative discrepancy
definitions are compared in Chapter Three.
Although the current study has suggested different ways of defining DD using
different maths and reading performance cut-offs and discrepancy definitions, it has
not necessarily resolved how DD should be defined. In the current study performance
on the standardised tests was normally distributed, thus, no natural breaking point

60
existed to differentiate individuals with DD/ MLD from children with typical
mathematics performance. Therefore, the mathematics and control variable
performance cut-offs used by DD researchers may be chosen somewhat arbitrarily. If
broad cut-offs are used, like those used in many experimental studies of DD, this
increases the risk of identifying false positives. However, using a more conservative
performance cut-off runs the risk of missing some cases of DD. Indeed, twin studies
have suggested that the genetic (and environmental) factors that are associated with
mathematical learning disabilities are the same genetic (and environmental) factors
that are responsible for normal variation in abilities, that is, mathematical learning
disabilities are “just the low end of the normal distribution of ability” (Plomin and
Kovas, 2005 p. 592; Kovas, Haworth, Petrill & Plomin, 2007).
One potential solution may be to use several different tests to diagnose DD,
which has been recommended by other researchers (Desoete & Roeyers, 2000;
Mazzocco & Myers, 2003; Silver, Pennett, Black, Fair & Balise, 1999) and is
typically recommended for clinical diagnoses of LDs (American Psychiatric
Association, 2016). As noted in the introduction, Mazzocco and Myers (2003) found
that measuring mathematics performance using different tests identified different
groups of children with DD. Similarly, Desoete and colleagues reported that three
different mathematics assessments (tests of number knowledge and mental arithmetic,
mathematics word problems, and number facts) were needed to identify all 85
children in their DD group (Desoete & Roeyers, 2000). Measuring mathematics
performance across several time points also helps control for factors other than poor
mathematics ability that could result in a child underperforming on a test (e.g.,
situational factors, test anxiety). Although using different measures of maths
performance was not possible here, this study reports the first phase of a multi-step
screening procedure for identifying a sample of children with DD for detailed
investigation. The identification of DD children and the stability of DD using multiple
mathematics and control measures is described in Chapter Four of this thesis.
It is important to note that it is possible that the prevalence of DD may have
been different if we had used different control measures. For example, the Hodder
Group Reading Test is a test of reading comprehension and does not assess decoding

61
ability. Prior work has reported that these reading abilities are differentially related to
components of mathematics (e.g., word problem solving or arithmetical fluency,
reviewed in Dowker, 2016). Thus, including a measure of decoding ability may have
had an impact on the prevalence of DD. However, due to time and cost constraints
related to the large sample size, we could not include additional language measures or
include additional control measures such as IQ during the screening phase. However,
the majority of DD demographic studies used only one control variable (eight studies)
and several did not include performance on a control variable in their diagnostic
criteria (five studies). Only one study determined DD prevalence using two control
variables (Lewis et al., 1994). In addition, of the DD demographic studies with large
sample sizes in which IQ was measured, several only administered individual IQ
assessments to a subset of their original samples (e.g., Barahmand, 2008; Gross-Tsur
et al, 1996; Ramaa & Gowramma, 2002), whereas others accessed IQ information
from educational records (Barbaresi, et al., 2005) or used a group-administered IQ
test. For example, Lewis et al. (1994) used the Raven’s coloured progressive matrices
(Raven, Court & Raven, 1984) which were group administered. However, the updated
version of Raven’s coloured progressive matrices (Raven, 2008) is now administered
individually or in smaller groups, however, this was not possible with our large
sample. Ethical guidelines prevented us from accessing educational records, so we
could not access further information about the children’s general abilities or other
language skills such as spelling. As this was a prevalence study, rather than a detailed
assessment of DD characteristics or an investigation of the causal theories of DD, we
believe that reading ability served as a sufficient control measure in our study
according to the procedures adopted by past prevalence studies.
It should also be noted that the tests used in the current study may not be
considered sufficient to diagnose DD according to recent conceptualisations of DD
(reviewed in Kaufmann et al., 2013). Those authors distinguished between primary
and secondary forms of DD; primary DD is thought to be characterised by numerical
or arithmetic deficits at the behavioural, cognitive/neuropsychological and neuronal
levels, whereas secondary DD is hypothesised to have non-numerical/domain-general
causes (ibid). National-curriculum based assessments are not thought to assess core
mathematical abilities in detail and are thus not considered sufficient for DD

62
diagnosis (Kaufmann et al., 2013). However, it should be emphasised that this study
functioned as a screening phase of a larger project which investigated the causal
theories of DD and included additional assessments of basic numerical abilities, as
well as several additional control measures in later phases of the project (described in
Chapter Four). Moreover, we used an operational definition of DD for screening for
research purposes and defined DD as a specific learning disorder of mathematics.
Finally, it is important to note that because the age of our sample was
restricted to children between 7 and 10 years of age, our results may not generalise to
other age groups. The prevalence of DD in secondary school children is also
inspected in Chapters Five and Six.
2.5 Summary
The current study investigated the prevalence of DD in a sample of 1004 (7- to
10-year-old) primary school children. Prevalence estimates for DD are strongly
affected by the inter-correlation between mathematics and the control variable used to
determine the specificity of the mathematics impairment. We used reading
performance as a control variable and found that the prevalence of DD ranged
between 0.89% and 17.23% of the sample depending on the definition used. Absolute
threshold and discrepancy definitions were compared, as were mathematics and
reading performance cut-offs of 1 SD and 1.5 SD below the mean. Absolute threshold
definitions proved to be more meaningful to diagnose DD than discrepancy thresholds
as the latter did not discriminate between children with specific mathematics
performance deficits (DD) and children with relatively high reading compared to
average mathematics performance. Using an absolute threshold definition of
mathematics performance below 1 SD below the mean and reading performance
above 1 SD below the mean resulted in 5.6% of the sample being diagnosed with DD.

63
3. Chapter Three. Gender differences in mathematics and reading performance and the
prevalence of DD3
Classic research suggested that boys outperform girls in mathematics and that boys
outnumber girls at the high end of the mathematics performance distribution, suggesting that
boys show greater performance variability than girls (Benbow & Stanley, 1980; Halpern
1986; Hedges & Nowell, 1996). Subsequent meta-analytic research suggested that average
gender differences in mathematics performance are quite small (Hyde, 1990; Lindberg et al.,
2010), but also vary across nations (Else-Quest et al., 2010; Stoet & Geary, 2013). However,
a recent meta-analysis of four PISA assessments suggested that boys are overrepresented at
the top end of the mathematics performance distribution compared to girls by a ratio of 1.7 -
2.7:1 (Stoet & Geary, 2013). In the UK, primary school boys are more likely to achieve the
top levels in maths than are girls (DfE, 2014).
The gender gap in reading performance appears to be more consistent, with many
studies, including international meta-analyses, reporting that girls outperform boys in reading
at both the primary and secondary school level (Logan & Johnson, 2010, Stoet & Geary,
2013). Furthermore, the gender difference in reading performance is much larger than the
gender difference in mathematics performance and this gender gap may have increased over
time (Stoet & Geary, 2013). In addition, girls are overrepresented at the top end of the
reading performance distribution, whereas boys are overrepresented at the lower end (ibid).
UK primary school children also show this pattern of gender differences in reading
performance (DfE, 2014).
Similarly, the gender ratio of DD has also varied across demographic studies. Some
have reported a greater prevalence in girls than in boys (Hein et al., 2000; Lander & Moll,
2010), and Dirks et al. (2008) found that more girls met the criteria for DD than boys
regardless of whether a strict or more lenient maths performance criterion was used. Others
reported that DD was more prevalent in boys than girls (Barahmand, 2008; Reigosa-Crespo et
al., 2012). Barbaresi et al (2005) found that boys outnumbered girls with DD regardless of
whether DD was diagnosed using discrepancy formulas or a low achievement criterion.
3This chapter is an expanded version of data presented in Devine et al. (2013).

64
Badian's studies found no gender difference in younger elementary school children but that
more boys than girls were diagnosed with DD in the higher elementary school grades
(Badian, 1983; 1999). Several other studies reported an equal prevalence of girls and boys
with DD (Desoete et al., 2004; Gross-Tsur et al., 1996; Koumoula et al., 2004; Lewis et al.,
1994; Mazzocco & Myers, 2003). Ramaa and Gowramma (2002) found that the gender ratio
depended on whether DD was identified using a diagnostic test (prevalence higher in boys
than girls), teacher identification (higher prevalence in girls than boys); or if exclusionary
criteria were applied (equal prevalence). Some of the studies that varied DD diagnostic
criteria did not report the gender ratio separately for each DD definition used (e.g.,
Barahmand, 2008; Lander & Moll, 2010) or comparisons were not possible due to small
sample sizes (e.g., Mazzocco & Myers, 2003; Desoete et al., 2004) or other methodological
issues (e.g., Hein et al., 2000, varied diagnostic criteria but these were for two separate
samples and used different assessments).
Thus, although it is apparent that the gender ratio of DD varies across different
studies, it is not clear whether the gender ratio systematically varies depending on the
diagnostic criteria used because only a few previous studies have reported this. The current
study aims to investigate whether the gender ratio of DD does systematically vary depending
on the diagnostic criteria applied. Absolute thresholds and discrepancy definitions of DD are
compared. Given that prior research has suggested a potential male advantage in mathematics
at the top end of the performance distribution, and a female advantage at the top end of the
reading distribution, it is plausible that varying maths and reading performance thresholds/
discrepancies may have an effect on the gender ratio of DD.
3.1.1 The current study.
The current chapter analyses gender differences in the same sample described in
Chapter Two (i.e., the screening data from Project 1). The research questions of this analysis
are: (1) Are there gender differences in mathematics and reading performance? (2) Does the
gender ratio of DD vary according to the diagnostic criteria used?
With regard to research question (1) we predicted that, in line with earlier research
(Benbow & Stanley, 1980; Halpern 1986; Hedges & Nowell, 1996), and the results of recent
reports from the Department for Education (DfE, 2014), boys may outperform girls in
mathematics. Specifically, we predicted that boys may be over- represented at the upper end
of the mathematics performance distribution compared to girls (Hypothesis 1). In line with an

65
abundance of research showing that girls consistently outperform boys in reading (e.g., DfE,
2014; Logan & Johnston, 2010), we predicted that girls’ reading performance would be
greater than boys’ reading performance. Specifically, girls would be overrepresented at the
upper end of the reading performance distribution compared to boys, who would be
overrepresented at the lower end of the reading performance distribution (Hypothesis 2).
With regard to research question 2, we hypothesised that, in accordance with previous
UK research (Lewis et al., 1994), the prevalence of DD would be the same for girls and boys,
when absolute performance thresholds are used for diagnosis (Hypothesis 3). Following from
the gender differences predicted in hypotheses 1 and 2, we predicted that more girls would be
categorised as having DD using a discrepancy definition specifying higher performance in
reading than in mathematics (Hypothesis 4).
3.2 Method
3.2.1 Participants.
The sample comprised the 1,004 children (526 boys and 478 girls) analysed in
Chapter Two. These children were aged 7 years 4 months to 10 years 1 month and attended
Year 3 (N =806 mean age = 8:1) and Year 4 (N = 198, mean age = 9:1) of primary school
(see section 2.2.1 for further details).
3.2.2 Measures.
Mathematics test. The mathematics tests used were the Mathematics Assessment for
Learning and Teaching tests (MaLT) (Williams, 2005).
Reading test. The reading test used was the Hodder Group Reading Test II (HGRT-II)
(Vincent & Crumpler, 2007). The HGRT II level 1 was used for Year 3 pupils, and the
HGRT II level 2 was used for Year 4 pupils.
3.2.3 Procedure.
For details of the procedure see section 2.2.3.
3.2.4 Data analysis.
The relationship of mathematics and reading performance was tested by correlational
analysis (Pearsons’s r). Gender was controlled for in two separate tests in order to ensure that
the correlation of mathematics and reading scores were not due to gender. The distribution of
reading and maths scores was cut into two halves in the following way. Children with maths

66
scores from 70 to 104 composed the lower half of the distribution. Children with maths
scores from 105 to 140 belonged to the upper half of the distribution. The correlation between
maths and reading scores were computed for both halves, separately. The strength of the
correlations between the two halves was compared by the difference test for r values.
Furthermore, five bins were also created (70-84, 85-98, 99-112, 113-126, 127-140) from the
distribution in order to ensure that any changes in the strength between the two halves of the
distribution are due to gradual changes and not to one or two bins of the distribution having
outlier r values.
The distributions of maths and reading scores, for boys and girls, were tested against
normality using the Kolmogorov-Smirnov test. The distributions of maths and reading scores
were also compared to each other by the Mann-Whitney U test. If distributions differed,
detailed comparisons of the distributions were also performed in the following way. Scores
along the distributions were sorted into seven bins, and then the bin counts were compared by
two-sample chi-square tests. The tests were adjusted for unequal sample sizes between boys
and girls.
The two-dimensional (maths × reading) distributions of scores were also compared
between the two genders. In this analysis, 7×7 bins (with all the combinations of the bins
along math and reading distributions) were compared between boys and girls. The
discrepancy between reading and maths was also tested, within each gender. Discrepancy
scores were calculated by subtracting maths scores from reading scores.
Mathematics and reading scores as dependent variables were entered into a repeated
measures analysis of variance (ANOVA) with gender (boy or girl), as the between-subject
factor and with domain (maths and reading) as the within-subject factor. Significant
interactions were followed up by Tukey-Cramer post hoc tests. To compare the discrepancy
scores between genders the discrepancy scores (maths–reading) were entered into an
ANOVA with gender as the between-subject factor.
3.3 Results
3.3.1 Analysis of distributions.
As reported in Chapter Two (see section 2.3), mathematics scores were positively
correlated with reading scores (r = .63, p <.001) and this correlation remained when
controlling for gender (r = .63, p <.001). Figure 8 shows the correlations by gender.

67
Figure 8. The correlation of mathematics and reading standardised scores by gender.

68
The correlation between reading and maths was r =.57 (n = 544) in the lower half of
the distribution and it was r =.21 (n = 440) in the upper half of the distribution, which is a
significant difference in correlation strength according to the difference test (p <.001). The
weakening correlation was found in both genders separately, as well (boys: r =.59 [n =304]; r
=.16 [n = 211], p <.001; girls: r =.55 [n = 240], and r = .28 [n = 229], p <.001).
The distributions of maths and reading scores tested separately for boys (n = 526) and
for girls (n = 468) were also not different from normal (p = .21 for both). However, the
distribution of reading scores differed significantly between boys and girls (Z= -3.31, p
<.001), and the distribution of maths scores differed marginally significantly between boys
and girls (Z = 1.95, p =.05; the test was adjusted for unequal sample sizes between boys and
girls) (Figure 9). According to the follow-up comparisons, the lower and upper extreme bins
in girls and boys were significantly different for the reading scores: there were more boys
than girls at the lower end of the reading distribution and more girls than boys at the upper
end of the reading distribution (χ2 = 5.6, p = .036 and χ2 = 5, p = .051). None of the bins
differed significantly between boys and girls in mathematics performance.
Figure 10 shows the outcome of the two-dimensional distribution comparisons
between genders: there was a trend for more girls with average mathematics (90-100, 100-
110) and with high reading scores (130-140) (χ2 = 4.7, p = 0.06; χ2 = 7.6 p = 0.002) and there
was a trend for more boys with slightly higher than average (110-120) reading and high
mathematics scores (130-140) (χ2 = 4.5; p = .068)

69
Figure 9. Frequency (%) histograms for maths and reading, separately. Frequency bins with
significant gender differences are marked (*: p < .05).
Figure 10. Reading and maths score distributions separately for boys and for girls. The colour
scale represents % of boys and girls (% of children within boys and girls, separately).
Frequency bins with significant gender differences are marked (p < .05) and the percentage of
boys and of girls (relative to the maximum of boys and girls, separately) are indicated within
these bins.

70
The maths – reading discrepancy scores did not differ from the normal distribution
(Figure 11A, p= .20 for both). However, the distribution of discrepancy scores differed
significantly between boys and girls (Z = 5.71, p <.001). According to the follow-up tests,
girls’ distribution is shifted to the left, and boys’ distribution is shifted to the right which
means that more girls have higher reading than maths scores while more boys have higher
maths scores than reading scores) (χ2 = 6.81 and 6.82; p = .018 for both).

71
Figure 11. The distribution of discrepancy scores (maths minus reading scores) (A). The
interaction of gender and domain (B). Bars represent standard error.

72
3.3.2 Comparisons of means.
As depicted in Figure 11B, the domain × gender interaction was significant (F (1,
998) = 25.2, p <.001).
Girls’ reading score differed significantly from all other domain × gender cells (p =
0.005, p = 0.002 and p = <0.001 for boys’ maths, boys’ reading and girls’ maths
respectively), including that girls showed a significant difference between maths and reading
abilities. In contrast, boys’ reading and maths scores were not different from each other.
Furthermore, there was no significant difference in girls’ and boys’ mathematics
performance. The effect size of the gender difference in reading performance was small (d = -
.22).
The analysis of the maths minus reading discrepancy scores support the above results.
The mean of maths-reading discrepancy between girls and boys differed significantly (girls: -
4.98(0.7), boys: 0.29(0.7); F (1, 998) = 25.2, p <.001; see 11A).
Gender differences in the scores for the different subtests of the MaLT tests were also
tested using independent samples t-tests. There were no significant gender differences in
performance on any of the subtests.
3.3.3. The effect of criterion levels on the gender ratio of DD.
As described in Chapter Two and shown again in Figure 12A the number of children
defined as having DD at a particular mathematics cut-off score also depends on the cut-off
score used to define good reading performance. Several different arbitrary thresholds could
be defined, and likely ones are shown Figure 12A with frequencies for each illustrated for
each gender separately. Although it appears that girls outnumber boys using several of these
combinations of cut-offs, none of the comparisons between genders was significant when
adjusting for the uneven sample size of the genders (p >.05 for all χ2 comparisons).

73
Figure 12. The percentage and number of children in given cut-off cells (A) and the
percentage and number of children in given discrepancy score (mathematics – reading) cut-
off cells (B). X-axis shows the combined mathematics and reading cut-off cells (A) and
mathematics – reading discrepancy cut-off cells (B) (the corresponding standard deviation
values are in brackets). M= Mathematics; R= Reading. 5A: * no reading cut-off. 5B: **p
<.01; and *p <.05.

74
Figure 12B shows the distribution of the sample as a function of discrepancy scores
(maths minus reading scores). Most children fell within ±1 SD difference between maths and
reading scores. As can be seen in Figure 12B, comparisons between genders were significant
for all cut-off combinations of the discrepancy scores (χ2: 11.7, p = .0012; 4.8, p = .046; 24.6,
p < .001) except for a discrepancy of maths-reading of 1.5 SD which approached significance
(χ2: 4.2, p= .081). These findings suggest that there are more girls with better reading than
maths performance than boys, while there are more boys who have better scores in maths
than in reading, than girls (see also Figure 11A). However, as explained in Chapter Two, if
we were to define DD as reading performance 1 or 1.5 SD higher than mathematics
performance (corresponding to the right two bars in Figure 12B) these definitions would also
include children with average maths performance and high reading performance which does
not fit the typical profile of DD. Thus, other discrepancy definitions were inspected instead.
Table 3 shows the frequency of girls and boys defined as having DD using different
discrepancies between mathematics performance (maths performance < 1 vs. < 1.5 SD below
the mean) and reading performance (reading performance ± 0.5 SD of the mean vs. > 1 SD
above the mean). As can be seen in Table 3, the frequency of girls and boys showing
particular discrepancies between reading and maths performance was similar. Chi-square
analyses confirmed that there were no significant differences between the number of girls and
boys identified as having DD using these different discrepancy definitions. Using these
discrepancy definitions, the overall prevalence of DD ranged between 0 and 5.3%.
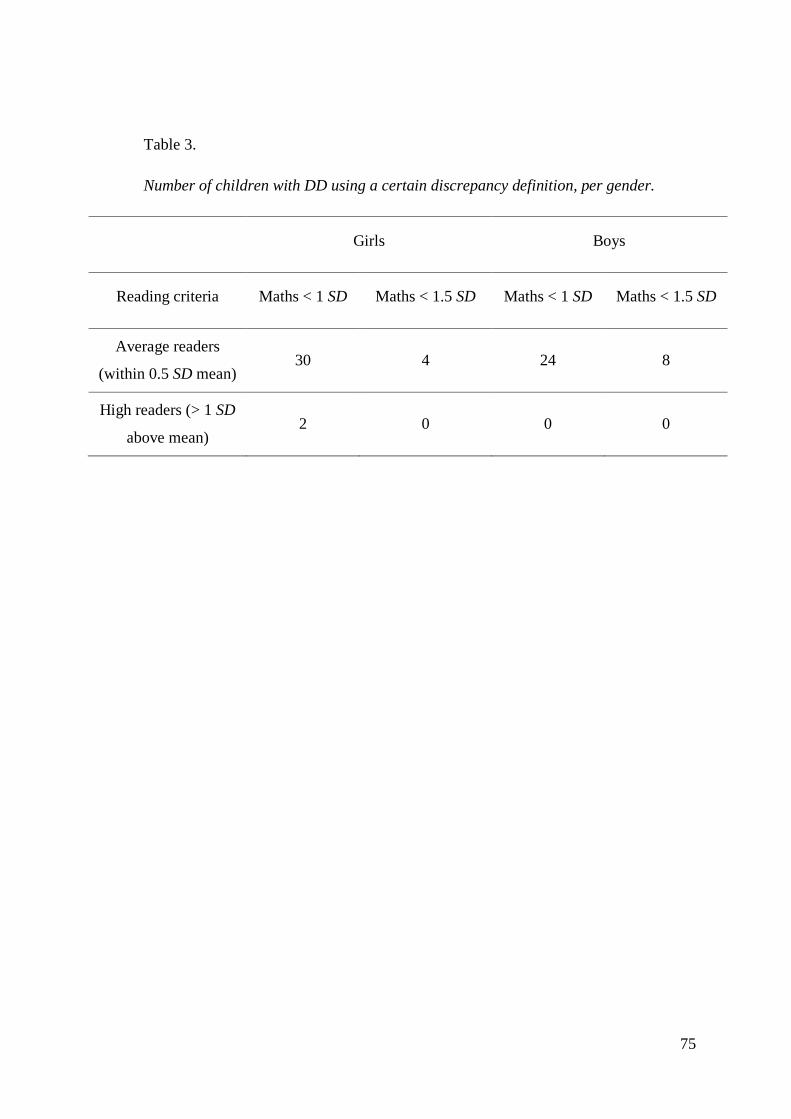
75
Table 3.
Number of children with DD using a certain discrepancy definition, per gender.
Girls Boys
Reading criteria Maths < 1 SD Maths < 1.5 SD Maths < 1 SD Maths < 1.5 SD
Average readers
(within 0.5 SD mean) 30 4 24 8
High readers (> 1 SD
above mean) 2 0 0 0

76
3.4. Discussion
3.4.1. Gender ratio of DD: The impact of mathematics and control variable cut-
offs.
If DD is a learning difficulty specific to mathematics, then the control variables used
to establish the presence of DD should not affect the gender ratio. Here reading performance
served as a control variable. Chapter Two suggested that DD prevalence is affected by the
cut-off score used to define good reading performance. This chapter suggests that the
prevalence of DD using absolute thresholds was the same for girls and boys, regardless of the
cut-off criteria used (illustrated in Figure 12A). Chi-square analyses suggested no significant
difference in the frequency of girls and boys for the different absolute threshold definitions
(supporting Hypothesis 3 which predicted that the gender ratio would be 1:1).
On the other hand, when discrepancy thresholds were used to define DD (as
illustrated in Figure 12B) gender differences were evident; significantly more girls than boys
were defined as having DD using a discrepancy threshold of 1 SD (55 girls vs. 24 boys) or
1.5 SD (110 girls vs. 78 boys). These frequencies correspond to a gender ratio of 1.4 – 2.3
girls to every boy. However, some of the children who would be defined as having DD using
a discrepancy of 1 - 1.5 SD between mathematics and reading performance, in fact, had
mathematics performance which fell within the average range and high reading performance.
This profile does not fit a severe impairment of mathematics skills. Rather, these children
would be typically regarded as gifted readers rather than weak in mathematics. Furthermore,
such discrepancy definitions exclude children who show a discrepancy between their
mathematics and reading performance but who do not quite reach the discrepancy threshold
of 1 or 1.5 SD. Therefore we assessed discrepancy in relative terms, that is, we assessed the
number of children who had average or above average reading performance and mathematics
performance below 1 SD or 1.5 SD below the mean (frequencies illustrated in Table 3).
Regardless of the relative discrepancy criteria used, there were no significant differences in
the frequency of girls and boys defined as having DD, which shows no support for
Hypothesis 4 which predicted that more girls would be categorised as having DD using a
discrepancy definition specifying higher performance in reading than in mathematics
Collectively, these findings suggest that there is no gender difference in the
prevalence of DD; we found an equal gender ratio when DD was defined using absolute

77
thresholds and relative discrepancy definitions. These findings contrast with other studies
which reported that the prevalence of DD was slightly higher for girls than boys (e.g., Dirks
et al. 2008; Gross-Tsur et al. 1996) or that the prevalence of DD was higher for boys than
girls (e.g., Badian 1983; 1999; Barbaresi et al., 2005; Ramaa & Gowramma, 2002). However,
our findings are in line with other studies that reported an equal prevalence of girls and boys
with DD (e.g., Koumoula et al., 2010; Lewis, et al., 1994; Mazzocco & Myers, 2003). It is
unclear why some studies have shown gender differences and others, including the current
study, have not, but it is possible that the factors contributing to differences in prevalence
estimates, (e.g., different diagnostic criteria and measurements), may also contribute to the
inconsistencies in gender differences.
Boys are overrepresented in other learning disabilities (e.g., reading disability,
dyslexia, ADHD and autistic spectrum disorders; Bauermeister, et al., 2007; Rutter et al.,
2004; Scott, Baron-Cohen, Bolton & Brayne, 2002), however, our data suggest that boys are
not under- nor over-represented in DD. The lack of gender difference in DD is problematic
for some current genetic theories of DD which suggest a possible role for x-linked genes.
However, most of these proposals rely on studies of highly atypical individuals with Fragile
X syndrome and Turner syndrome (Kemper et al., 1986; also see Gross-Tsur, Manor, &
Shalev, 1993). In fact, a large-scale study of mathematical skill in 10-year-old children which
using twin data also observed no gender differences (Kovas, Haworth, Petrill, & Plomin,
2007). Hence, we suggest that there is a good chance that gender-related observations from
highly special populations are not valid for more typically developing children.
3.4.2. Mathematics/ reading performance and gender.
The strength of the correlation of reading and mathematics abilities varied across the
distribution. The correlation between reading and mathematics was stronger in the lower half
of the mathematics distribution than in the upper half of the mathematics distribution and the
change in correlation strength was present in both genders (illustrated in Figure 8).
The distributions of mathematics scores were the same for girls and boys. Similarly,
mean mathematics scores and maths subtest scores did not differ between boys and girls
(showing no support for Hypothesis 1, which predicted that boys would be over-represented
at the upper end of the maths performance distribution). These findings also contrast with
Benbow and Stanley’s (1980) findings that boys were overrepresented at the higher end of
the mathematics performance distribution and recent reports from the DfE which reported

78
that for children in Key Stage 2 (KS2: Years 3 – 6 in English primary schools), more boys
than girls achieved the highest levels in mathematics (corresponding to the upper end of the
mathematics performance distribution, DfE, 2014). However, it is not possible to compare
national curriculum statistics directly with the data from the current study because the
children tested here were younger than the age at which KS2 assessments are administered
(Year 6). It is possible that a gender difference in the upper end of the mathematics
performance distribution is not evident at Years 3 and 4 but emerges at some point between
Year 4 and Year 6.
There are several possibilities for why we did not find a gender difference in
mathematics performance here. First, our findings are in line with other research showing that
average gender differences in mathematics performance are declining (Else-Quest, Hyde, &
Linn, 2010; Stoet & Geary, 2013). Second, the content of the mathematics test used in our
study may have differed from the tests used in other studies. However, the mathematics tests
used in past DD studies varied widely due to the fact that the studies were carried out in
different countries and in different decades. The maths tests used included standardised
assessments (e.g., Stanford Achievement Test-Mathematics, Woodcock-Johnson, Wide
Range Achievement Test, Young’s Group Mathematics test, Key Math- Revised, Test of
Early Math Ability-second edition, the NUCALC, and the Cito Rekenene Wiskunde test) as
well as customised test batteries (e.g., those used by Kosc, 1974; Ramaa & Gowramma,
2002). These tests included assessment of numerical operations, conceptual understanding,
mathematical reasoning as well as basic number processing. The MaLT mathematics tests
include items assessing all of these different areas, therefore the content of the MaLT appears
to be similar to the content of tests used in previous studies. Furthermore, the test is also
matched to the National Curriculum for England, meaning that the test scores are meaningful
in the UK educational context. Third, as suggested above, it is possible that a gender
difference in the upper end of the mathematics performance distribution is not evident in
Years 3 and 4 (tested here) but emerges at some point between Year 4 and Year 6 (DfE,
2014), that is, gender differences in maths performance may emerge towards the end of
primary school.
Significant gender differences in the distribution of reading scores emerged: there
were more girls at the upper end of the distribution than boys, and more boys in the lower end
of the distribution than girls. Moreover, girls’ mean reading score was significantly higher
than boys’ mean reading score. These findings support Hypothesis 2 (which predicted girls

79
would outperform boys in mathematics) and are in line with the results of national
assessments, which show that girls are overrepresented at the upper end of the reading
distribution whereas boys are overrepresented at the lower end of the distribution in Key
Stages 1 – 3 (Key Stage 1: Years 1 and 2 in English primary schools; Key Stage 3: Years 7 –
9 in English secondary schools; DfE 2014).
There were also gender differences in the distributions of discrepancy scores; that is,
the difference between the children’s mathematics and reading scores (mathematics minus
reading). Girls' discrepancy distribution was shifted into the negative direction, reflecting that
girls’ performance was better in reading than in mathematics, whereas boys’ discrepancy
distribution was shifted into the positive direction, reflecting that boys’ performance was
better in mathematics than reading. These results reinforce the abovementioned gender
differences in the reading performance distribution. Although boys' performance was better
in mathematics than in reading, the performance advantage in mathematics did not result in
boys outperforming girls in mathematics.
3.5 Summary.
The current chapter investigated gender differences in the prevalence of DD in a
sample of 1004 (7- to 10-year-old) primary school children. Absolute threshold and
discrepancy definitions were compared, as were mathematics and reading performance cut-
offs between 1 SD and 1.5 SD below the mean. When absolute thresholds were used to define
DD, no gender difference emerged in the prevalence of DD. However, when DD was defined
as a discrepancy between reading performance and mathematics performance of 1 or 1.5 SD,
more girls than boys met the criteria for DD diagnosis. Absolute threshold definitions proved
to be more meaningful to diagnose DD than discrepancy thresholds as the latter did not
discriminate between children with specific mathematics performance deficits (DD) and
children with relatively high reading compared to average mathematics performance. Thus
relative discrepancy definitions were compared which used different combinations of low
maths performance (e.g., <1 or <1.5 SD below the mean) and adequate reading performance
(e.g., either within or above the average range). Using these types of discrepancy definitions
to define DD suggested no significant gender differences in DD prevalence. Collectively,
these results suggest that there was no gender difference in the prevalence of DD regardless
of the diagnostic criteria used. Similarly, the current chapter suggested that boys and girls had
equal performance in mathematics. Girls did outperform boys in reading and were

80
overrepresented at the upper end of the performance distribution, whereas boys were
overrepresented at the lower tail of the distribution.

81
4. Chapter Four. Persistence of developmental dyscalculia and associated cognitive
deficits.
The previous chapters demonstrate the variability in DD prevalence estimates when
using different diagnostic criteria. However, as noted there, the choice of mathematics
performance cut-off for defining poor performance in DD is essentially arbitrary. Broad
mathematics performance thresholds, like those used in many experimental studies of DD,
likely increase the chance of identifying false positives. Yet, using more conservative criteria
may result in missing some cases of DD. Longitudinal studies, which measure mathematics
performance with different maths tests over several time points offer a potential solution to
this problem because longitudinal assessment makes it possible to distinguish between
children who have transient poor maths performance from those with persistent low
performance.
4.1.1. Longitudinal studies of DD stability.
Longitudinal investigations of MLD have slightly nuanced and overlapping research
foci, for example, identifying potential precursors of DD/ predictors of mathematics
performance (e.g., Desoete, Cuelemans, DeWeerdt, & Pieters, 2012, Mazzocco & Thompson,
2005), modelling mathematics performance over time (e.g., Kohli, Sullivan, Sadeh, &
Zopluoglu, 2015), or examining the cognitive profile of different achievement groups
(including DD) at different stages of educational development (e.g., Geary et al., 2012;
Mazzocco & Räsänen, 2013). Despite a mounting body of longitudinal research into MLD,
only a few studies have investigated the stability of DD diagnosis over time (Mazzocco &
Räsänen, 2013).
Four longitudinal studies conducted in the US, one study conducted in Israel and
another in Flanders, Belgium, have examined the prevalence of persistent DD. Some of these
studies were reviewed in Chapter One, but I will revisit these studies in the following review.
In a large US study, Badian followed 1075 children who began kindergarten between
1976-1989 until Grade 7/ 8 and estimated the prevalence and persistence of DD, reading
disability and combined reading and arithmetic disability (Badian, 1999). Children were
assessed with the Reading Comprehension, Mathematics Computation and Concepts of
Number, Spelling, and Listening Comprehension components of the Stanford Achievement
Test (Gardner et al., 1982) each year of the study. The criterion for DD diagnosis was

82
arithmetic performance below the 20th percentile and reading performance above the 20th
percentile. 3.9% of the children were diagnosed with DD. Children whose mean arithmetic
performance score across the years of the study fell below the 25th percentile were diagnosed
with persistent DD. 25 children (2.3%) from the sample of 1075 met the criterion for
persistent DD diagnosis.
Mazzocco and Myers’ (2003) study, also conducted in the US, compared different DD
diagnostic criteria in 209 children followed from Kindergarten to Grade 3. The children were
tested individually with standardised tests of intelligence, mathematics, visual spatial/
perceptual performance and reading, however, all tests other than the mathematics tests were
included to dissociate potential DD subtypes rather than to form part of the diagnostic
criteria. Mazzocco and Myers compared several different mathematics performance cut-offs
(absolute thresholds and discrepancy definitions - further details can be found in section
1.1.2). The percentage of children meeting these different criteria over the years of the study
ranged from 0 to 45% of the sample. Importantly, they found that children who met DD
diagnostic criteria in one year did not necessarily meet the DD diagnostic criteria in other
years of the study, even when the same test was used for diagnosis. Persistent DD was
defined as a TEMA-2 score falling below the 10th percentile for the study sample for two or
more school years and 9.6% of the sample met this criterion. Children with low reading
ability or low IQ were not excluded from the persistent DD group which may explain why
this prevalence estimate is greater than the estimates provided by other studies.
Another study conducted in the US examined the persistence of different
mathematical disability subtypes in a cohort of 80 American children over a 19 month period
(Silver et al., 1999). Children were identified for the study from an initial review of 1650 files
available at a learning disability clinic. Eligibility criteria for the study included: full-scale IQ
score above 90; arithmetic score on the Wide Range Achievement Test-Revised or
Woodcock Johnson-R below 90 and a discrepancy of 15 or more standard score points
between IQ and arithmetic performance. Of the 80 children whose families provided consent
for participation in the longitudinal study, 26 children met the criteria for DD (i.e., specific
mathematics difficulty), with the other 54 children falling into other mathematical disability
groups (arithmetic disability with disability in reading, spelling or both). Only 8 (30%) of the
children in the initial DD group met the criteria for isolated mathematics disability at retest
19 months later; 7 children had an additional learning disability at retest and 11 children no
longer met the criteria for any learning disability.

83
Morgan and colleagues modelled mathematics growth trajectories of more than 7,000
American children with and without DD from Kindergarten to 5th Grade (Morgan, Farkas, &
Wu, 2009). Children were categorised into four groups based on the presence of DD at
different stages during Kindergarten (DD at Fall, DD at Spring, DD at both Fall and Spring
and DD at neither time point). DD was defined as scores on the Early Childhood
Longitudinal Study–Kindergarten Cohort (ECLS-K) maths test within the lowest 10% of the
sample. Reading skill was also measured but reading was not included as a control variable
for DD diagnosis. Children who showed signs of DD during both Fall and Spring of
Kindergarten were identified as having persistent DD. About 70% of the persistent DD group
also showed DD during 1st, 3rd or 5th Grade and 65% of the children with persistent DD had
DD at 5th Grade (NB. Percentages are of the children remaining in the persistent DD group at
Grade 5 not of the original sample assessed at Kindergarten). Furthermore, in 5th Grade, the
maths performance of the persistent DD group was more than 2 SD lower than children who
did not have DD during Kindergarten.
Shalev and colleagues followed children with DD in Israel from 5th to 11th Grade
(Shalev, Manor, Auerbach, & Gross-Tsur, 1998; Shalev, Manor, & Gross-Tsur, 2005).
Children were initially screened for DD via a city-wide assessment of mathematics ability
(described in section 1.1.2). More than 3,000 children completed a group administered
mathematics achievement test and those scoring in the lowest 20% of each class were
selected for further assessment of arithmetic, reading, writing and intelligence. 140 children
were diagnosed as having DD in 5th grade using a threshold of arithmetic performance below
the 5th percentile. 123 of these children were assessed again at 8th grade and 104 at 11th
grade. At 8th grade, 57 (47%) children diagnosed with DD at 5th grade continued to meet the
diagnostic criterion. Of the 104 children followed until 11th grade, 42 children (40%)
remained in the DD group. Of the children whose arithmetic performance was above the cut-
off criterion, 92% had arithmetic performance within the lowest quartile. In comparison to a
control group, the children who remained in the DD group at 11th grade had significantly
lower language abilities and general cognitive abilities.
Stock, Desoete & Roeyers (2010) investigated the Kindergarten predictors of MLD
status at second grade in 471 Flemish children. This study identified groups of children with
persistent DD, persistent low achievement (LA) in maths, as well as inconsistent DD and LA,
and typical performance in mathematics. Several measures of preparatory arithmetic skills
were taken at Kindergarten, and two standardised tests of arithmetic ability were measured in

84
first and second grade (KRT-R, Baudonck et al., 2006 and TTR, De Vos, 1992). Children’s
IQ was measured using a short form of the Wechsler Intelligence Scale for Children – Third
Edition (WISC-III; Wechsler, 1991), and children with lower than average general abilities
were excluded from the study, resulting in 319 children remaining in the analysis. Persistent
DD was defined as scores ≤ 10th percentile on at least one of the arithmetic tests both in first
and second grade and 16 children (5% of the sample) met these criteria. 65 children (20.4%
of the sample) met the criteria for DD at one school year but not the other. The authors
emphasised the importance of defining DD using more restrictive cut-off criteria and
fulfilling the resistance-to-intervention criterion (discussed previously in section 1.1.2) by
measuring mathematics/arithmetic performance at several time points.
In summary, studies investigating the stability of DD report a wide range of
prevalence estimates for persistent DD. Of the studies that reported the prevalence of
persistent DD in relation to a screening sample, the prevalence rates range from 2.3% to 9.6%
(Badian, 1999; Stock et al., 2010; Mazzocco & Myers, 2003). In studies that instead focused
on the relative proportion of DD children with persistent deficits, 30 to 65% of children
initially diagnosed with DD had persistent DD at follow-up (Morgan et al., 2009; Shalev et
al., 1998; 2005; Silver et al., 1999). Again, these differing results are likely due to studies
using different measures and different definitions of DD which included various performance
thresholds and exclusion criteria/ control measures. The current study follows a subsample of
children diagnosed with DD in the screening phase described in Chapters Two and Three and
aims to measure the proportion of these children with mathematics deficits approximately
two and a half years after the first diagnosis.
4.1.2. Cognitive skills associated with mathematical processing.
As described in section 1.1.3, the underlying cause of DD is a highly contentious
issue. Several neuroscience and behavioural studies have pointed towards magnitude
representation as being the core deficit of DD. However, evidence for the deficient number
module theory is weak due to inconsistent results and methodological problems (Szűcs et al.,
2013; Szűcs & Goswami, 2013). Moreover, behavioural DD research has provided much
stronger evidence for deficits in several general cognitive abilities such as working memory,
spatial abilities, inhibition and attentional function. Furthermore, until recently, no study had
systematically contrasted the deficient number module theory against other theories of DD.

85
Project 1 was one of the first studies to test several theories of DD in the same sample
(Szűcs et al., 2013; 2014). In our previously published research, a subsample of
approximately 100 children from the screening sample described in Chapters Two and Three,
completed 16 tests and nine experiments which assessed magnitude representation, working
memory, inhibition, attention and spatial processing abilities among other skills. In one
analysis, 12 children with DD were matched to 12 control children on measures of verbal and
non-verbal IQ, age, socio-economic status and general processing speed (Szűcs et al., 2013).
DD children had significantly lower mathematics performance than controls on two measures
of mathematics performance (the MaLT [Williams, 2007] described in Chapter Two, and the
Numerical Operations subtest of the Wechsler Individual Achievement Test- UK edition
[WIAT-II UK; Wechsler, 2005b]). The DD and control group did not differ significantly on
two measures of reading performance (the HGRT [Vincent & Crumpler, 2007], described in
Chapter Two, and the vocabulary subtest of the WIAT-II UK, [Wechsler, 2005b]). Reading
performance was within the average range in both groups. Thus, this study controlled for a
large number of variables: reading, verbal and non-verbal IQ, SES, age and processing speed.
DD children showed significantly lower visuo-spatial short-term and working memory
performance than the control group, but both groups showed similar performance on verbal
short-term and verbal working memory measures. Furthermore, DD children showed
impairments in inhibition skills (as evidenced by larger congruency effects in numerical and
non-numerical comparison tasks, and lower accuracy in correctly-rejecting incorrect trials of
a stop-signal task) as well as slower spatial skills (slower solution times for a trail making
task and a mental rotation task). However, DD children showed no differences from controls
on measures of magnitude representation; the expected ratio and congruency effects in
symbolic and non-symbolic magnitude comparison tasks emerged in both groups. These
results are described in more detail in Szűcs et al, (2013).
In another analysis of data from Project 1, we used correlational and regression
analyses to explore the relationships between mathematics performance and other cognitive
skills in 98 children with varying mathematics abilities and normal reading abilities (Szűcs,
Devine, Soltész, Nobes & Gabriel,2014). These children completed the above-mentioned
tests among other measures. This analysis confirmed the roles of visuo-spatial short-term and
working memory, and spatial abilities, in mathematical processing. However, other important
skills included phonological processing, verbal knowledge and general executive functioning
(ibid). Collectively, the findings from our previous research indicate strong links between

86
mathematical skills and visuo-spatial short-term and working memory, spatial skills, and
executive functioning, which mirrors the findings of other studies (e.g., Bailey et al.,2014;
Bull et al., 2008; Geary, 2011; Passolunghi & Lanfranchi, 2012; Rourke & Conway, 1997;
Rourke, 1993; Swanson, 2011; Van der Ven, Kroesbergen, Boom & Leseman, 2012).
4.1.3. Overview of the current study.
The current chapter reports the longitudinal follow-up of the DD and control children
assessed in Project 1 (Szűcs et al., 2013), and aims to examine the stability of DD diagnosis,
as well as the stability of cognitive performance exhibited by DD and control children.
Children were tested on a subset of tests approximately 20 months after the individual
assessment described in Szűcs et al (2013). See Table 4 for the design of the longitudinal
study and the timings of the different measures. The test battery included measures of
mathematics, reading, verbal IQ, verbal short-term and working memory, visuo-spatial short-
term and working memory, and spatial skills. In addition to comparing the cognitive skills of
children with DD and intact mathematics performance, we were also interested in the
cognitive profile of children with high mathematics performance. Mathematical excellence
has been linked to superior visuo-spatial working memory, general cognitive ability and
spatial skills (M. Leikin, Paz-Baruch & Leikin, 2013; R. Leikin, Paz-Baruch & Leikin, 2014;
Ruthsatz, Ruthsatz-Stephens & Ruthsatz, 2014; van Garderen, 2006). Thus, it was expected
that a group of children who excel in mathematics would show superior performance
compared to control children and DD children in these domains, but it is unknown whether
these advantages would remain stable over time. Thus, the current chapter aimed to compare
the cognitive profiles of DD, control children and mathematically high performing students
longitudinally. Finally, the current chapter aimed to measure the link between DD/ maths
performance and emotional reactions to mathematics (MA). Thus, MA was measured in the
three groups, however, MA levels were only measured at the final assessment and were not
followed longitudinally.
The current chapter had the following research questions: (1).What proportion of the
DD sample have persistent DD? (2). More generally, what is the stability of group
membership over time? (3). How is mathematical performance related to different cognitive
skills over time? (4). Is DD related to impairments in visuo-spatial memory and spatial
performance in late primary school? (5). Is mathematical excellence associated with superior
performance in any other cognitive domain(s) and if so, are these advantages stable over
time? (6). Is DD associated with MA?

87
Because previous studies have reported varying prevalence estimates for persistent
DD, we did not have any specific hypotheses with respect to the precise prevalence of
persistent DD (research question 1). As previous research has also shown that MLD status
can change over time (e.g., Mazzocco & Myers, 2003) it was predicted that some children
might move between achievement groups over time, e.g., some children who initially met the
diagnostic criteria for DD may later have performance within the average range or vice versa
(Hypothesis 1). Our previous research indicated that DD children showed impairments in
visuo-spatial short-term and working memory and spatial skills compared to control children
(Szűcs et al., 2013). Longitudinal research has confirmed the importance of these skills to
mathematics development (Geary et al., 2012; LeFevre et al., 2010). Thus, it was predicted
that relationships between these skills and mathematics would remain over time (Hypothesis
2) and impairments in these skills would still be seen in DD children approximately 20
months later (Hypothesis 3). As our own research has shown that visuo-spatial short-term and
working memory, and spatial abilities are associated with mathematical processing (Szűcs et
al 2013; 2014), it was predicted mathematically high-performing students would show
superior performance in these domains (Hypothesis 4). Finally, research has shown that
children with MLD show higher levels of MA than children without MLD (e.g., Lai et al,
2015; Passolunghi, 2011; Wu et al., 2014) and that MA is moderately negatively correlated
with mathematic performance (e.g., Hembree, 1990), thus, it was predicted that the DD group
would have higher levels of MA than the other two groups (Hypothesis 5) and that MA
would have a significant negative correlation with maths performance across the three groups
(Hypothesis 6).
4.2 Method
Due to the complexity of the longitudinal design, it is necessary to describe the
different phases of the study and measures used to select the participants prior to describing
the participants.
4.2.1 Screening.
In a first step, which took place in 2010 (hereafter: Time 1), 1004 children were
screened for DD with age-standardised English National Curriculum-based maths and
reading tests: the MaLT (Williams, 2005), and the HGRT-II, levels 1 and 2 (Vincent and
Crumpler, 2007), which were administered to whole classes. The full description of the
screening procedure is described in section 2.2.

88
In a second step, all children were invited to participate in the follow-up assessments.
Approximately 250 children consented and a subgroup of 115 children representing the
distribution of mathematics and reading scores took part in further individual assessment and
testing over several sessions (described in detail in Szűcs et al., 2014). The children's SES
was estimated from parental occupations and education levels which were obtained via a
questionnaire included with the consent form and information pack which was sent out at
invite (details of this questionnaire are provided below).
4.2.2 Individual assessment.
In the first individual testing session, which took place approximately 10 months after
screening (Time 2: Dec 2010- March 2011), children were administered an additional
standardised measure of mathematical ability (the Numerical Operations subtest of WIAT-II,
Wechsler, 2005b), two additional standardised measures of reading ability (WIAT-II Word
Reading and Pseudoword Decoding subtests), a measure of verbal IQ (the Vocabulary subtest
of the WISC-III, Wechsler, 1991) and non-verbal IQ (Raven's Coloured progressive matrices,
Raven, 2008). Furthermore, children completed four subtests of the Automated Working
Memory Assessment (AWMA; Alloway, 2007), which included two measures of verbal
short-term memory (STM): Digit Span and Word Recall; one measure of visuo-spatial STM:
Dot Matrix; and one measure of visuo-spatial working memory: Odd One Out (OOO).
Children also completed a spatial orientation measure. Except for the Raven's CPM, all of
these tests were administered a second time, approximately 20 months later (Time 3: Oct -
Nov 2012) with 41 children from the sample of 115 children. At Time 3 children also
completed a modified version of the Abbreviated Mathematics Anxiety Scale (mAMAS).
Details of these measures are provided below.
4.2.2.1 Measures.
SES. The children's SES was estimated from parental occupations and education
levels which were obtained via a questionnaire included with the consent form and
information pack. The questionnaire asked parents for the highest level of education
completed. Education levels were classified on a 7 point scale: 1. Doctorate Degree, 2.
Master's Degree, 3. Bachelor's Degree, 4. Some University, 5. A Level or equivalent, 6.
GCSE or equivalent and 7. Less than secondary school. Professional diplomas were also
coded as 4. and postgraduate qualifications other than Master's degrees were coded as 3.

89
Parents' occupations were scored according to the Standard Occupational
Classification (Office for National Statistics, 2010). Occupations were coded according to
this classification scheme: 1. Managers, Directors and Senior Officials, 2. Professional
Occupations, 3. Associate Professional and Technical Occupations, 4. Administrative and
Secretarial Occupations, 5. Skilled Trades Occupations, 6. Caring, Leisure and Other Service
Occupations, 7. Sales and Customer Service Occupations, 8. Process, Plant and Machine
Operatives, 9. Elementary Occupations. We included an additional category (0) to classify
parents that were unemployed. The SES questionnaire is provided in Appendix B.
IQ. In order to estimate IQ, we administered the Vocabulary subtest of the WISC-III
(Wechsler, 1991). We also measured children’s non-verbal IQ using Raven’s Coloured
Progressive Matrices (Raven’s – Educational: CPM, Raven, 2008).
Mathematics and Reading. Mathematics and reading achievement was measured
using the standardised group tests described in Chapters Two and Three and well as the
Numerical Operations, Word Reading and Pseudoword Decoding subtests of the WIAT-II
UK (Wechsler, 2005). The Numerical Operations subtest includes assessment of counting,
one to one correspondence, numerical identification and writing, calculation (addition,
subtraction, multiplication, division) fractions, decimals and algebra. The Word Reading
subtest assesses letter identification, phonological awareness, letter-sound awareness and the
accuracy and automaticity of word recognition. Pseudoword decoding assesses phonological
awareness and accuracy of word attack.
Working memory. We assessed working memory using five subtests from the AWMA
(Alloway, 2007). The AWMA is a computer-administered battery of tests which assess verbal
short-term memory (STM) and visuo-spatial STM and working memory (corresponding to
the phonological loop, visuo-spatial sketch pad and central executive components of
Baddeley and Hitch’s [1974] model of working memory, respectively).
Verbal working memory. Short-term memory (STM): Phonological Loop: The Digit
Recall subtest requires children to listen to a sequence of digits and recall them. Because we
did not want to confound STM performance with a general difficulty with mathematical
information in our weaker maths group we also measured verbal STM using the Word Recall
subtest. This subtest requires children to listen to a series of real words and to recall them. In
both verbal STM subtests, the item is scored as correct if the child recalls the series in the
correct order.

90
Visual spatial working memory. Short-term memory (STM; Visuo-spatial sketchpad):
The Dot Matrix subtest requires children to view the position of a red dot in a series of four
by four matrices and to repeat the sequence by tapping on the computer screen. An item is
scored as correct if the child recalls the sequence in the correct order.
Central executive: Odd-one-out (OOO). In the OOO task, three abstract shapes are
presented on the computer screen. One of the shapes differs from the other two shapes and
children must identify the odd shape by tapping it on a computer screen. The shapes then
disappear and the child must recall where the odd shape was located by tapping one of three
empty boxes on the computer screen. Where two or more sets of shapes occur in the same
trial, the children must identify the odd shape in the first set, then in the subsequent set(s). At
the end of the final set of shapes, the shapes disappear and the children must recall the
locations of the odd shapes in the same order as presented. An item is scored as being
correctly processed if the child correctly identifies the odd shape. A set is scored as being
correctly recalled if the child recalls the locations of the odd shapes in the correct order. A set
is also scored as being correctly recalled if the child misidentifies the odd shape but correctly
recalls the location of the misidentified shape during recall.
Standardised recall scores were measured for all subtests ('Digit Recall', 'Word
Recall', 'Dot Matrix', and 'OOO Recall' in Analysis) and standardised processing scores were
measured for OOO and Listening Recall ('OOO Processing' in Analysis). Raw scores were
also measured for OOO processing/ recall and Dot Matrix.
Maths anxiety. MA was measured using a modified version of the AMAS ( Hopko et
al., 2003); a self-report questionnaire with a total of 9 items. Although it is a short scale,
research indicates that the AMAS is as effective as the longer MARS ( Hopko, 2003) (e.g.
internal consistency: Cronbach’s α = .90; two-week test-retest reliability: r = .85; convergent
validity of AMAS and MARS-R: r = .85). Participants use a 5-point Likert scale to indicate
how anxious they would feel during certain situations involving maths (e.g. 1 = low anxiety;
5 = high anxiety). The maximum score is 45.
The modified version used in the current study, (hereafter: mAMAS), was used
previously with a large sample of British primary school children (Zirk-Sadowski et al.,
2014). The modifications involved minor adjustments to British English and terminology and
the replacement of items as some of the AMAS items referred to advanced topics which
would not be meaningful to primary or lower secondary school children (Ashcraft & Moore,

91
2009). For example, “Checking the tables in the back of a textbook” was changed to
“Completing a worksheet by yourself”. The mAMAS can be found in Appendix C. The
mAMAS has been found to have good reliability and validity (Carey et al., 2017b).
Spatial Orientation Task. We used six items from the Object Perspective Test
(Kozhevnikov & Hegarty, 2001). In this task, children were presented with a map containing
different items such as a tree, car, cat and traffic light. Children were required to imagine
themselves in this space, and to imagine they were standing next to one object, and facing
another object. The children were then required to estimate the direction of a third object
(e.g., "Imagine you are standing next to the cat and facing the house. Point to the traffic
light"). Children were given a page containing a circle which was blank except for a line
oriented north indicating the location of the object the child was to imagine facing. The centre
point of the circle indicated the object that the children were to imagine standing next to.
Children were required to indicate the direction of the third object by drawing a line from the
centre of the circle to its edge. Children completed a practice question before six
experimental questions. Responses were measured using a protractor and responses were
recorded as correct if they fell within ±20 degrees of the correct location. We used this range
because the location at which the child imagined they were next to the object was subjective,
for example, children may have imagined themselves standing to the left or right of the object
or at the centre of the object, which consequently affects the angle at which they would have
located the third object. Correct responses received a score of 1, with a maximum of 6 points
available. An example problem from this task and the accompanying map is presented in
Appendix D.
Table 4 summarises the measures that were taken at each time point.

92
Table 4.
The design of the longitudinal study.
Screening
(Time 1)
Individual
Assessment 1
(Time 2)
Individual Assessment
2
(Time 3)
Measure Mar- Oct 2010 Dec 2010 - Mar 2011 Oct- Dec 2012
Mathematics X X X
Reading X X X
SES X
Nonverbal IQ X
Verbal IQ X X
Verbal STM X X
Visuo-spatial
STM/WM X X
Spatial
Orientation X X
Maths Anxiety X

93
4.2.3 Participants.
As described previously (Szűcs et al., 2013) children were defined to have DD if their
mean performance on the Time 1 and 2 mathematics tests was worse than mean-1SD (<16th
percentile) and their performance on the Time 1 and 2 reading and IQ tests, was in the
mean±1SD range. The performance of children in a control group (CON) was within the
mean±1SD range for all measures at Time 1 and 2. The high mathematics performing group
(HM) had mathematics performance greater than mean+1SD on at least one of the
mathematics tests administered at Time 1 or 2 (NB. mean performance for the Time 1 and 2
mathematics tests was better than mean+1 SD for all but two HM children. The mean
performance of these two children fell just on the mean+1SD cut off). There was no IQ or
reading criterion for the HM group as scores were within the mean range or above for all
measures. Together, these criteria resulted in the selection of 12 children in each group at
Time 2. Ten DD (2 girls), 10 CON (6 girls), and 11 HM (2 girls) children remained in the
study at Time 3. These 31 children composed the current sample.
4.2.4 Data Analysis.
First, one-way ANOVAs were used to test for differences in the mean age of each
group at the different time points (Time 1, Time 2 and Time 3). A one-way ANOVA was also
used to test for group differences in IQ at Time 2. ANOVAs were followed up with Tukey
post-hoc tests. Pearson chi-square analyses were used to test for relationships between group
and the SES measures (parent occupation and education levels).Participants' mathematics and
reading scores were inspected at each time point to determine changes in achievement group
membership across time.
Pearson correlations were calculated between the measures taken at all time points.
The subtests measuring the same construct at Time 2 or Time 3 (e.g., reading, VSWM,
Verbal WM) were highly correlated. Word reading and pseudoword decoding revealed
correlations of r =.76/ .71 for time 2 and time 3 respectively; Digit recall and Word recall r
=.58/ .68 for time 2 and time 3 respectively; and Dot Matrix and OOO r = .60/.59 for time 2
and time 3 respectively, p <.001 for all correlations). Thus, these measures were averaged to
create composite scores at each time point. WIAT-II word reading and pseudoword decoding
scores within each time point were averaged to create two composite reading scores: Reading
Time 2 and Reading Time 3. Digit recall and Word recall scores of the AWMA within each
time point were averaged to create composite verbal STM scores: Verbal STM Time 2 and
Verbal STM Time 3. The Dot Matrix recall and OOO recall scores at each time point were

94
averaged to create composite visuo-spatial working memory scores: VSWM Time 2 and
VSWM Time 3.
Mathematics measures included: MaLT (Maths Time 1), Numerical Operations at
Time 2 (Maths Time 2), and Numerical Operations at Time 3 (Maths Time 3). Reading
measures included: HGRT (Reading Time 1), and the abovementioned composite scores
(Reading Time 2 and Reading Time 3). Working memory measures included the
abovementioned composite scores: Verbal STM Time 2, Verbal STM Time 3, VSWM Time
2 and VSWM Time 3. Spatial Orientation included the measures: Spatial Orientation at Time
2 (SpatialO Time 2) and Time 3 (SpatialO Time 3). MA included the mAMAS score taken at
Time 3 (MA Time 3). Verbal IQ included the vocabulary score at Time 2 (Vocab Time 2)
and Time 3 (Vocab Time 3). Non-verbal IQ included Raven's CPM at Time 2 only (Raven
Time 2). P-values were corrected for multiple comparisons using Bonferroni correction (p-
value divided by the total number of comparisons- this is described in each correlation
matrix).
As the total sample was not large enough to carry out regression analysis, repeated
measures ANOVAs were conducted on the variables measured at more than one time point,
with time point as the within-subjects variable and group (DD, CON, HM) as the between-
subjects variable. Mathematics and reading measures were analysed across three time points,
and vocabulary, working memory, and spatial orientation scores were analysed across two
time points (see Table 4). Finally, a one-way ANOVA was used to test for group differences
in MA at Time 3. ANOVAs were followed up with Tukey post-hoc tests.
4.3 Results
4.3.1 Age, SES and IQ.
As there was some variation in the timing of the assessments for children within and
possibly between groups, it was possible that there may have been differences in the ages of
the three groups at the different assessment points. However, the one-way ANOVA indicated
there were no significant differences in the mean age of the three groups at any of the
assessment points (p > .05 for all, see Table 5).
Chi-square analysis revealed no significant relationship between group and SES
measures (p > .05 for both).

95
One-way ANOVAs of Raven's CPM and WISC vocabulary scores at Time 2 found
significant effects of group (Raven's: F (2, 28) = 19.27, p <.001; Vocabulary: F (2, 28) =
4.71, p=.017). Table 6 shows the means and standard errors for these measures for the three
groups. Tukey post-hoc tests confirmed that IQ was matched for DD and CON (p >.05 for
all), but HM had significantly higher Raven's CPM and WISC vocabulary scores than DD
(Raven's CPM: p < .001; WISC vocabulary: p =.018). HM had significantly higher Raven's
CPM scores than CON (p <.001).

96
Table 5.
Mean age and ranges (in months) of the groups at the different assessment points.
Time 1 Time 2 Time 3
Group M Min Max M Min Max M Min Max
DD 102.5 93.0 115.0 112.0 103.0 125.0 132.5 123.0 145.0
CON 99.2 92.0 113.0 109.3 103.0 123.0 129.0 123.0 143.0
HM 98.8 91.0 106.0 108.9 101.0 116.0 128.6 122.0 136.0
Table 6.
Means and standard errors for the IQ measures taken at Time 2.
DD CON HM
M SE M SE M SE
Raven's CPM Time
2 103.0 2.9 98.0 2.9 121.8 2.8
Vocabulary Time 2 9.3 0.8 10.1 0.8 12.6 0.8

97
4.3.2 Group membership over time.
Figure 13A depicts the maths scores for each individual over time. At Time 3, several
participants' maths scores no longer met the maths performance criterion used for group
selection. Specifically, two participants in the DD group had maths performance within 1 SD
of the mean, one CON participant had performance below 1 SD below the mean, one CON
participant had performance above 1 SD above the mean, and two HM participants had maths
performance within 1 SD of the mean. Figure 13B shows the reading scores for each
individual over time. Every participant had reading scores within or above the average range
at Time 3. The lower half of Figure 13 shows the mean maths performance (C) and reading
performance (D) for each of the groups at each time point. Bars represent standard errors.
Figure 14 shows the movement of the means for each group across the three time
points, with vertical bars representing standard errors for mathematics and horizontal bars
representing standard errors for reading. This figure illustrates that at all three time points,
DD children were at the bottom of the maths performance distribution and within the average
reading performance range. CON children consistently fell within the average range for
mathematics and reading, but it is important to note that there was a moderate amount of
variability in reading scores in this group. The HM children remained above average in
mathematics performance across the three time points, and their reading performance was
also slightly above the average range.

98
Figure 13. Individuals' performance across the three time points in mathematics (A) and reading (B). Mean performance in mathematics (C) and
reading (D) for the three groups. Bars in C and D represent standard errors.

99
Figure 14. Mean mathematics and reading performance for DD, CON and HM children over the three time points. Vertical bars represent
mathematics standard errors and horizontal bars represent reading standard errors.

100
4.3.3 Correlations
The zero-order correlations between all the variables are presented in Table 7. Not
surprisingly, measurements of the same construct taken at different time points were highly
correlated with one another. Mathematics scores measured at the different time points were
highly correlated. Time 2 and Time 3 reading scores were also highly correlated. Time 2 and
Time 3 Verbal STM scores were also highly correlated, as were Time 2 and Time 3 VSWM
scores. Verbal STM at Time 3 also correlated with VSWM at Times 2 and 3. Vocabulary
scores at Time 2 and Time 3 were also highly correlated. Raven's Time 2 also correlated with
the other IQ measures and SpatialO at Time 3. SpatialO Time 3 was also correlated with
Vocabulary at Time 3 and VSWM at Time 2 and Time 3.
We were particularly interested in which variables correlated with mathematics
performance at the different time points. Maths Time 1 and Reading Time 1 were correlated
which approximates the correlation reported between these measures in Chapter Two in the
larger screening sample. IQ measures were strongly correlated with mathematics
performance: Raven’s CPM correlated with Maths at Time 1 and Time 3, whereas Vocab
Time 3 was correlated with Maths at Time 1.Verbal STM correlated with Maths at Times 2
and 3 only, however, VSWM at Time 2 correlated with all three maths measures and VSWM
Time 3 correlated with Maths at Time 1 and Time 3. SpatialO Time 3 correlated only with
Maths Time 1. Finally, MA was strongly negatively correlated with maths performance at
every time point. No other correlations were significant after correction for multiple
comparisons. Power for all significant correlations was high and ranged between 0.98 and
0.99.
As IQ was strongly correlated with the maths measures, correlations were also run
between the maths measures and the other variables while controlling for IQ. These
correlations are reported in Appendix E and show a reduction in the correlation coefficients
between maths and VSWM measures. However, statistically controlling for IQ is not
necessarily appropriate in cognitive studies of developmental disorders, particularly when
there is an overlap between IQ and the variables of interest (Dennis et al., 2009). Intelligence
develops in concert with working memory and other skills such as processing speed (Fry &
Hale, 2000). Moreover, many IQ tests assess WM skills. Indeed, the Raven’s CPM correlated
with VSWM Time 3 score, and Spatial Time 3. Thus, the correlations in Appendix E are
difficult to interpret as the reduction in correlation strength also reflects the removal of the

101
shared variance between IQ and WM (and between IQ and the other variables which
presumably develop together with IQ).

102
Table 7.
Pearson’s correlations between the variables at different time points. P-values were corrected for multiple comparisons using Bonferroni
correction (p-value divided by the number of correlations: 120). Significant correlations are shown in bold (p <.001 in all cases).
Measure 1 2 3 4 5 6 7 8 9 10 11 12 13 14 15 16
1. Maths Time 1 - 0.79 0.87 0.62 0.41 0.36 0.36 0.52 0.76 0.73 -0.72 0.57 0.67 0.59 0.63 0.66
2. Maths Time 2 - 0.85 0.46 0.54 0.49 0.62 0.65 0.73 0.58 -0.60 0.53 0.43 0.44 0.45 0.49
3. Maths Time 3 - 0.45 0.55 0.50 0.46 0.60 0.70 0.67 -0.77 0.50 0.59 0.57 0.51 0.64
4. Reading Time 1 - 0.42 0.47 0.33 0.45 0.59 0.49 -0.37 0.46 0.53 0.54 0.56 0.56
5. Reading Time 2 - 0.83 0.54 0.48 0.29 0.37 -0.33 0.15 0.28 0.39 0.26 0.41
6. Reading Time 3 - 0.52 0.51 0.28 0.41 -0.28 0.08 0.31 0.48 0.34 0.41
7. Verbal STM Time 2 - 0.74 0.41 0.41 -0.23 0.50 0.32 0.20 0.12 0.35
8. Verbal STM Time 3 - 0.60 0.61 -0.51 0.33 0.42 0.28 0.28 0.48
9. VSWM Time 2 - 0.81 -0.55 0.40 0.60 0.33 0.49 0.51
10. VSWM Time 3 - -0.54 0.37 0.78 0.43 0.43 0.64
11. MA Time 3 - -0.46 -0.46 -0.48 -0.42 -0.37
12. SpatialO Time 2 - 0.47 0.26 0.12 0.29
13. SpatialO Time 3 - 0.57 0.61 0.75
14. Vocab Time 2 - 0.74 0.65
15. Vocab Time 3 - 0.61
16. Raven's Time 2 -

103
4.3.4 Repeated measures ANOVAs.
Mathematics.
The ANOVA revealed a significant main effect of Group (F (2, 28) = 79.69, p <
.001), and post-hoc tests confirmed that DD had significantly lower maths scores than CON
and HM (p <.001 for both), and CON had significantly lower maths scores than HM (p
<.001). There was no main effect of time point and there was no interaction of group by time
point, meaning that the group differences in mathematics performance remained stable over
time (see Figure 13C).
Reading.
The ANOVA revealed a significant main effect of Group (F (2, 28) = 9.52 p < .001),
and post-hoc tests confirmed that HM had significantly higher reading scores than DD
(p=.005) and CON (p = .001). An effect of time point emerged (F (2, 56) = 8.84, p < .001)
and post-hoc tests revealed that Reading Time 3 was higher than Reading Time 1 (p =.016)
and Reading Time 2 (p < .001). Similar to the mathematics scores, there was no interaction
of group by time point, in this case meaning that all groups had average reading performance
at all time points (see Figure 13D).
Verbal STM.
The ANOVA revealed a significant effect of Group (F (2, 28) = 5.25, p = .011) and
post-hoc tests revealed that HM had significantly higher verbal STM than DD (p = .012). The
difference between HM and CON was non-significant. No main effect of time point or
interaction of group by time point emerged. Verbal STM scores are shown in Figure 15A.
VSWM.
The ANOVA revealed a significant effect of Group (F (2, 28) = 15.12, p < .001) and
post-hoc tests revealed that HM had significantly higher VSWM than DD (p< .001) and CON
(p = .008). There was no main effect of time point but there was a strong trend for an
interaction of group by time point (F (2, 28) = 2.77, p = .08). VSWM scores are shown in
Figure 15B.
There was no significant difference between the VSWM performance of CON and
DD in this analysis which appears to contradict the findings of our previous analysis reported
in Szűcs et al. (2013) (also described in the introduction to this chapter) which tested the

104
same sample as reported here. However, there are several ways in which the current analysis
differs to that reported in the previously published study which may contribute to the
differing results. Firstly, in the analysis reported in Szűcs et al. (2013), there were 12
participants in each of the DD and CON groups but some participants dropped out of the
longitudinal follow-up, thus, only 10 participants in each group with complete data were
analysed in the current analysis. The smaller sample size contributed to a loss of statistical
power. Secondly, the previous study compared the VSWM of DD and CON at time 2 using
non-parametric permutation testing and an independent samples t-test, whereas the current
analysis used a repeated measures ANOVA, analysed VSWM performance over two time
points, and included an additional group of participants (HM) which were not included in the
previously published analysis. Thus, these different analyses are not directly comparable.
However, it was possible to inspect the post-hoc tests for the trend for the interaction between
Group and Time in VSWM performance and this revealed that the (uncorrected) comparison
between DD and CON at Time 2 (equivalent to the independent samples t-test used in the
Szűcs et al., 2013 analysis) was, in fact, significant (p = .008). Therefore, the current results
do not contradict the results reported in Szűcs et al (2013), but the results of this study shall,
nonetheless, be interpreted cautiously.

105
Figure 15. Mean scores in verbal working memory (A) and visuo-spatial working memory
(B) for the three groups. Bars represent standard errors.

106
Spatial Orientation.
A main effect of Group emerged (F (2, 28) = 11.04 p < .001), and post-hoc tests
confirmed that HM had significantly higher mean Spatial Orientation scores than DD (p
<.001) and CON (p = .005). The ANOVA revealed a significant effect of time point (F (1,
28) = 11.20, p = .002) and post-hoc tests revealed that SpatialO Time 3 was higher than
SpatialO Time 2 (p = .002). The interaction of time point and group was marginally
significant (F (2, 28) = 3.32, p = .05) and post-hoc tests revealed that Spatial Orientation
score was higher at Time 3 than Time 2 for the HM group (p = .006), and the SpatialO Time
3 score for HM was also higher than the Spatial Orientation scores for the other groups at all
time points (DD Time 2: p <.001; DD Time 3: p <.001; CON Time 2 p <.001; CON Time 3:
p =.0012). Spatial orientation scores are depicted in Figure 16A.
Vocabulary.
The ANOVA revealed a significant effect of Group only (F (2, 28) = 7.41, p = .003)
and post-hoc tests revealed that HM had significantly higher Vocabulary scores than DD (p =
.003) and CON (p = .02). No main effect of time point or interaction of time point by group
emerged.
4.3.5 Maths Anxiety.
The one-way ANOVA revealed a significant effect of group (F (2, 28) = 13.02, p
<.001). Post-hoc tests revealed that MA was significantly higher in the DD group than the
CON group (p = .007) and the HM group (p <.001) but CON and HM were not significantly
different. The mean MA score for each group is shown in Figure 16B. The relationship of
mathematics performance and MA scores is shown in Figure 17. Inspection of Figure 16B
and Figure 17 shows that although the mean MA level may be higher for DD than the other
groups, the DD group have a wide range of MA scores, that is, they are not all clustered at the
high end of the MA distribution.

107
Figure 16. Mean spatial orientation (A) and maths anxiety (B) scores for the three groups.
Bars represent standard errors.

108
Figure 17. The relationship between maths anxiety and mathematics performance at the three time points, shown by group.

109
4.3.6 Alternative analyses.
Additional analyses were conducted to check that certain individuals' scores were not
affecting the findings. Firstly, as one participant in the HM group had maximum scores on all
the mathematics assessments, I re-ran all repeated-measures ANOVAs and the one-way
ANOVA on MA scores excluding this outlier. Secondly, because six participants no longer
met the mathematics performance criterion used for their original groupings at Time 3, I re-
ran all repeated-measures ANOVAs and the one-way ANOVA on MA scores excluding these
participants.
Table 8 shows a comparison of the effects, interactions and post-hoc test outcomes for
the ANOVAs described in section 4.3.4 (column 1) and the analyses excluding the HM
outlier (column 2) and the those excluding the six participants who no longer met the maths
performance criterion at Time 3 (column 3). As can be seen in Table 8, these alternative
analyses revealed very similar results to the analyses described in section 4.3.4. The only
major difference was that in the ANOVAs with the HM outlier removed, there was a main
effect of Time point for maths performance (revealing higher maths performance at Time 1
compared to Time 2 across all groups) and verbal STM (revealing higher verbal STM scores
at Time 3 compared to Time 2 across all groups). As these additional effects were not
particularly strong (significant at p < .05 only), and were not of particular relevance to the
research questions of this chapter, I did not consider that the inclusion of the HM outlier to
have altered the results markedly and thus favoured the original ANOVAs.

110
Table 8.
Summary of the alternative ANOVAs excluding different participants. Effects emerging
which did not emerge in the original analyses are marked in bold.
Analysis - All children Analysis -removing HM outlier
Analysis- removing six children who no longer met grouping criterion at Time 3
Variable Effect Post-hoc Effect Post-hoc Effect Post-hoc Maths Group*** HM>CON>DD
*** Group*** HM>CON>DD
*** Group*** HM>CON>DD
*** Time* Time 1> Time
2*
Reading Time*** Time3>Time2 *** Time3> Time1 **
Time*** Time3>Time2 *** Time3> Time1 *
Time** Time3>Time2 ** Time3> Time1 *
Group*** HM>CON**; HM>DD **
Group*** HM>CON**; HM>DD *
Group*** HM>CON**; HM>DD **
Verbal STM Group* HM>DD* Group* HM>DD* Group* HM>DD* Time* Time 3>Time
2*
VSWM Group*** HM>CON**; HM>DD*** (DD vs. CON NS)
Group*** HM>CON*; HM>DD*** (DD vs. CON NS)
Group*** HM>DD***
Group x Time Trend p=.08
Group x Time Trend p=.08
Spatial orientation
Time** Time 3>Time 2**
Time** Time 3>Time 2**
Time* Time 3>Time 2**
Group*** HM>CON**; HM>DD***
Group*** HM>CON*; HM>DD***
Group*** HM>CON*; HM>DD***
Group x Time p=.05
HM Time 3 greater than all other measures/ groups**
Group x Time*
HM Time 3 greater than all other measures/ groups**
Vocabulary Group** HM>CON* HM>DD**
Group** HM>CON* HM>DD**
Group*** HM>DD**
Maths anxiety Group*** DD>CON** DD>HM***
Group*** DD>CON** DD>HM***
Group*** DD>CON*** DD>HM***
Note that significance is summarised by following: * = p <.05; ** = p <.01; *** = p <.001.

111
4.4 Discussion
The current chapter describes the longitudinal follow-up of a subsample of
participants from the screening sample explored in the preceding chapters. The aims of the
current chapter were to investigate the prevalence of persistent DD and to examine the
stability of cognitive performance exhibited by DD and control children in comparison to a
group of children who perform highly in mathematics. These children underwent detailed
assessment in previously published studies (Szűcs et al., 2013; 2014) and the current chapter
reports their performance approximately 20 months later on a selection of cognitive tasks.
The current chapter also aimed to measure the link between DD/ maths performance and
mathematics anxiety.
With regard to the prevalence of persistent DD (research question 1), all but two
participants diagnosed with DD at Time 1 and Time 2 met the maths performance criterion
for DD diagnosis at Time 3, meaning that eight (80%) of the DD children followed in this
study had persistent DD. It is important to note, however, that two DD children who
participated in our previously published study (Szűcs et al., 2013) were unavailable at Time
3, thus it is unknown what proportion of the total DD sample had persistent DD at Time 3. As
a conservative estimate, if these two children no longer met the diagnostic criteria, the
percentage of children with persistent DD would still be 66% (eight out of the 12 original
children). These estimates (66/80%) are slightly higher than the prevalence rates for
persistent DD reported by other studies, which ranged from 30 to 65% (Morgan et al., 2009;
Shalev et al., 1998; 2005; Silver et al., 1999). The reason for the higher prevalence of
persistent DD in the current study may be because we had a relatively small sample size
compared to previous studies. However, we also used several control criteria to ensure the
specificity of the mathematical deficit at diagnosis: average reading performance across two
tests, and average verbal and non-verbal IQ. Thus, it seems that using a large number of
control variables to ensure specificity of the mathematical learning problem indeed identifies
a sample of children with a specific and persistent deficit. Another reason for the stability of
DD diagnosis in the majority of the DD sample may be because two different tests of maths
performance were used for DD diagnosis, and measurement took place at different time
points and in different contexts (group vs. individual assessment). Several other MLD
researchers have recommended diagnosing MLD using different measures at different time
points to reduce the risk of identifying false positive cases (Mazzocco & Myers, 2003;
Mazzocco & Räsänen, 2013; Stock et al., 2010).

112
It was predicted that some children might move between achievement groups over
time (Hypothesis 1). At Time 3, several participants' maths scores no longer met the maths
performance criterion used for group selection, supporting this hypothesis. Specifically, two
participants in the DD group had maths performance within 1 SD of the mean, one CON
participant had performance below 1SD below the mean, one CON participant had
performance above 1SD above the mean, and two HM participants had maths performance
within 1 SD of the mean. These movements reflect a natural fluctuation of performance
above and below performance cut-offs. Closer inspection of the performance of these
children shows that four of these children also had inconsistent mathematics performance
across the Time 1 and Time 2 measures (as average performance on Time 1 and Time 2
measures was used to form the achievement groups). It is therefore not particularly surprising
that these children's performance changed again at Time 3. Mazzocco & Myers (2003) also
found that children who met DD diagnostic criteria at one assessment did not necessarily
meet the criteria in following assessments. Thus, these findings lend further support to the
suggestion that at least two assessments are needed to come to a diagnosis of DD (or
categorisation into other achievement groups).
Nonetheless, inspection of Figure 14 reveals that over time, the groups more or less
stayed within the performance ranges expected. That is, Figure 14 shows that DD children's
performance fell within the lower mathematics performance range (and average reading
performance range). CON children, on the other hand, had performance within the average
performance range on both mathematics and reading measures. Finally, the HM group's
performance was consistently higher than the average performance range for mathematics
and slightly higher than average for reading.
It was predicted that relationships between VSWM and spatial skills and mathematics
would remain over time (Hypothesis 2). Mathematics performance was correlated with
VSWM at several time points and SpatialO Time 3 was correlated with Maths Time 1,
however, after correction for multiple comparisons, some of the correlations between VSWM
or SpatialO and maths were not significant. In our previous study, spatial orientation was
correlated with and was a significant predictor of maths performance (Szűcs, et al., 2014)
however, this was not the case for all time points in the current study. As the content and
level of mathematics taught varies across schooling, it is possible that the type of spatial skills
tapped by our spatial orientation task may relate more to the mathematics taught in the first
half of Key Stage 2 (Time 1) but were not as strongly related to mathematics by the end of

113
primary school (Time 2 and Time 3). In addition, maths performance correlated with reading
performance, verbal WM and IQ measures. Unfortunately, due to the small sample size, it
was not possible to run regression analysis to look at the relative contribution of these
different skills to mathematical performance, as in our previous study (Szűcs et al., 2014).
It was predicted that impairments in VSWM and spatial skills would still be seen in
DD children late primary school (Hypothesis 3). The ANOVA of VSWM skills over time
revealed a main effect of group, but post-hoc tests revealed that superior performance of HM
was driving this effect and CON and DD had similar performance. Although DD had lower
VSWM performance than CON at Time 2 (published by Szűcs et al., 2013; and confirmed in
the uncorrected post-hoc tests, and shown in Figure 15), DD and CON children had similar
performance at Time 3. The ANOVA of spatial skills also revealed a main effect of group,
and post-hoc tests revealed no significant differences between DD and CON on this measure.
Thus, the current study found no support for Hypothesis 3.
This longitudinal analysis indicated that VSWM impairment exhibited in DD children
at 8 years of age is not stable over time and is no longer shown almost two years later. This
finding may suggest that DD children's VSWM skills were simply delayed compared to CON
children. However, inspection of Figure 15 reveals that both DD and CON children show
some fluctuation of working memory performance over time in both verbal and VSWM. In
terms of VSWM performance, CON children showed a slight drop in performance (of
approximately 4 standard score points) from Time 2 to Time 3, whereas DD showed a slight
improvement (of approximately 5 standard score points). This resulted in a change from a
significant to a non-significant difference in VSWM performance between these groups over
time. In terms of verbal WM performance, these groups show the opposite pattern, that is,
DD show a slight decrease in verbal WM performance from Time 2 to Time 3, whereas CON
children show a slight improvement, however, these differences were not significant at either
time point. Indeed, other studies have reported differing relationships between maths and the
components of working memory in older and younger children. For example, some have
found that VSWM is more closely related to mathematics in younger children (e.g., Bull,
Espy & Wiebe, 2008), yet others have found that verbal working memory is a significant
predictor of mathematics performance in older children (e.g., Swanson & Sachse-Lee, 2001).
Thus, the current results may reflect these developmental changes.

114
It was predicted that mathematically high-performing students would show superior
performance in VSWM and Spatial skills (Hypothesis 4). Indeed, HM had significantly
higher VSWM performance than CON and DD participants at all time points. Furthermore,
HM children had significantly higher performance on the spatial orientation task than DD and
CON, particularly at Time 3, for which HM had superior performance to the other groups at
all time points. While these results indicate that mathematically high performing children
may have advantages in spatial processing compared to children with average or low
performance in mathematics, it is important to note that the HM children also had
significantly higher verbal STM, verbal IQ and non-verbal IQ than the other two groups.
Thus, this group of children appear to be high performing across a range of cognitive skills,
rather than showing academic excellence specifically in mathematics. Four children in our
HM group also had reading performance above the average range at Time 3, indicating that
the HM group indeed included gifted students (that is, children who have significantly higher
than average IQ and excel academically across the board), and included specifically
mathematically high performing students. Nonetheless, the current findings are in line with
previous research showing that gifted children have superior working memory skills (verbal
and central executive), and children who excel in mathematics have high VSWM skills in
particular (Leikin et al., 2013). It is also important to note that because the spatial orientation
task was highly correlated with both non-verbal and verbal IQ measures at various time
points, as well as with VSWM, there is a possibility that the spatial orientation task measured
general cognitive abilities as well as spatial processing. Therefore, the elevated spatial
orientation performance in the HM group compared to the other two groups may partly
reflect their higher general cognitive ability as well as superior spatial abilities.
It was predicted that the DD group would have higher levels of MA than the other two
groups (Hypothesis 5) and that MA would have a significant negative correlation with maths
performance across the three groups (Hypothesis 6). Indeed, the study revealed that MA was
significantly higher in the DD group than in the CON and HM children (shown in Figure
16B). These findings support Hypothesis 5 and prior research showing that MA is higher in
children with MLD (e.g., Lai et al, 2015; Passolunghi, 2011; Wu et al., 2014). Furthermore,
significant associations emerged between MA measured at Time 3 and mathematics
performance at every time point (see Figure 17). Although these findings are notable, they
must be interpreted with two caveats in mind. Firstly, as the sample was made up of groups
of children selected on the basis of maths performance within discrete ranges, the sample is

115
not representative of the normal population. Hence, the correlations between MA and maths
performance may be stronger than they would be in a representative sample which would
include children across the entire mathematics performance distribution. Secondly, it is also
important to highlight that although MA was higher in DD than in CON and HM children,
the distribution of MA scores shown in Figure 17 reveal that DD children had a wide range of
MA scores (e.g., ranging from 14 to 33 out of 45), thus the DD group were not all clustered at
the upper end of the MA score range. Exploration of the correlation between maths
performance and MA in a larger sample would likely enable stronger conclusions to be
drawn.
A couple of additional findings emerged which were not predicted, namely the main
effect of time point for both Reading and Spatial Orientation. As the reading tests were all
age-standardised, it was not expected that there would be an increase in reading standard
scores over time. It is interesting that the children in the current sample apparently improved
in reading performance above and beyond what would be expected for their age. A likely
explanation is that the current sample was very small and highly selected (e.g., all children
were required to have average reading performance for selection), thus the sample was not
representative of the much larger samples for which the standard norms of the tests were
based. On the other hand, the improvement with time on the Spatial Orientation was less
surprising as this task was not age-standardised and also tapped skills that could plausibly
improve with age (e.g., spatial skills and interpreting the task instructions).
There are a few limitations to the study described in this chapter. Firstly, matching the
DD and control groups on several variables (e.g., average performance on verbal, nonverbal
IQ and reading performance, similar SES) resulted in only 12 children being selected into
each group at the beginning of the study. Similarly, only 12 children met the criteria for high
maths performance. As several children dropped out of the study prior to the final
measurement, only ten children in the DD and CON groups and 11 children in the HM group
were followed longitudinally. However, the focus of the linked Project 1 (reported in Szűcs et
al., 2013) was to contrast several theories of DD; thus, importance was placed on matching
the groups on a large number of variables which were not always controlled in previous
studies, rather than on maximising the sample size. It should also be noted that gender was
not matched between the groups because it was not possible to match on gender as well as the
other variables and obtain sufficient sample sizes. Thus, the DD group and HM groups had
very few girls compared to boys, and it is possible that the differing gender ratios in the

116
groups may have had an impact on the results. Finally, it should be mentioned that
mathematics was studied as a single entity in this study when evidence suggests that
mathematics performance is made up of many dissociable arithmetical abilities (Dowker,
2005). Indeed, the MaLT assesses factual, procedural and conceptual knowledge of several
content areas linked to the national curriculum and includes words problems and pictorial
information. Similarly, the WIAT Numerical Operations subtest assesses many different
arithmetical abilities depending on the age/ ability of the child, which range from number
identification to arithmetic calculations, and knowledge of decimals and fractions. However,
the Numerical Operations subtest does not contain any written instructions, word problems or
diagrams. Studies have suggested that verbal working memory is important for arithmetic
fact retrieval and solving word problems, whereas visuo-spatial processing is important for a
broader range of arithmetical abilities including number line performance and converting
word problems to mathematical equations (Geary, 2011). Thus, the relationships between the
components of WM and mathematics may have differed if mathematics was subdivided into
different abilities assessed by each of the mathematics tests.
4.5 Summary
The current chapter investigated the longitudinal performance of a group of children
with DD in comparison to children with average mathematics performance and children with
relatively high mathematics performance. Mathematics, reading, verbal and non-verbal IQ,
verbal working memory, and VSWM were measured across two or three time points and
relationships were measured between these variables. MA was also measured at the final time
point. Whilst our earlier study revealed VSWM deficits in DD compared to control children,
the current study revealed that DD children's VSWM performance appeared to have caught
up with control children's performance almost two years later. HM children showed superior
VSWM and spatial orientation performance compared to the other two groups. Furthermore,
DD children had significantly higher levels of MA than the other two groups and MA was
strongly negatively correlated with maths performance across the whole sample. However, as
the children in this sample were not representative of the normal population, inspection of
this correlation in a larger, more representative sample is necessary. Chapter Five investigates
the association between DD/maths performance and MA in representative samples of primary
and secondary school children.

117
5. Chapter Five. The relationship between developmental dyscalculia and
mathematics anxiety4
Anxiety has been linked to poorer academic achievement but the direction of this
association is not well understood. Evidence suggests that depressive symptoms and anxiety
are predictive of later school achievement (e.g., Riglin, Frederickson, Shelton, & Rice, 2013;
Rothon et al., 2009). At the same time, poor academic achievement appears to lead to poorer
mental health outcomes (e.g., Herman, Lambert, Reinke, & Ialongo, 2008). Meta-analytic
findings suggest that levels of trait and general anxiety are higher in students with than
without learning disabilities (Nelson & Harwood, 2011). Similarly, there is a higher
prevalence of test anxiety in students with learning disabilities (Bryan, Sonnefeld, &
Grabowski, 1983; Strumpf & Fodor, 1993; Wachelka & Katz, 1999).
.
As outlined in Chapter One, the relationship between MA and maths performance
across the ability spectrum has also received a lot of attention in the field. Moderate negative
correlations have been found between MA and performance (r ~ -.30, Hembree, 1990; Lee,
2009; Ma, 1999) indicating that as MA levels increase, performance tends to decrease. Much
research has focussed on the direction of the relationship, with the aim of determining
whether MA has debilitating effects on performance or whether prior poor performance leads
to the development of MA. The former direction has been labelled the Debilitating Anxiety
model, whereas the latter is referred to as the Deficit Model (Carey et al., 2016). Although
both models have received support, collectively the prior research suggests that the MA-
performance relationship functions reciprocally and/or as a vicious circle (ibid; Cargnelutti et
al., 2017).
There may be a common assumption that MA may only be present in children who
struggle with maths, i.e., maths anxiety is just another name for low maths performance
(Beilock & Willingham, 2009). Indeed, there is evidence to suggest that MA (or subtypes of
MA) may be more likely in children with mathematical learning disabilities. Children with
4 This chapter is an extended version of a material published previously. Copyright © 2017 by the American Psychological Association. Reproduced with permission. The official citation that should be used in referencing this material is Devine, A., Hill, F., Carey, E., & Szűcs, D. Cognitive and emotional math problems largely dissociate: Prevalence of developmental dyscalculia and mathematics anxiety, Journal of Educational Psychology. Advance online publication. doi: http://dx.doi.org/10.1037/edu0000222. The use of APA information does not imply endorsement by APA. No further reproduction or distribution is permitted without written permission from the American Psychological Association.

118
DD, non-specific mathematics learning disabilities, or who are low achieving in maths (but
do not meet the severity criteria for maths disability diagnosis), all show higher levels of MA
compared to typically achieving children (Lai et al., 2015; Passolunghi, 2011; Wu et al.,
2014). Furthermore, in a study which employed an affective priming task as an implicit
measure of MA, Rubinsten and Tannock (2010) found that children with DD were more
affected than a control group by negative affective primes and maths related primes during
arithmetic problem-solving. The authors suggested that these findings show a greater link
between MA and arithmetic problem-solving in DD (Rubinsten & Tannock, 2010). Studies of
adults with high MA have also suggested that deficits in basic numerical processing may
underlie MA (Maloney et al., 2010; 2011). However, it is not clear from these studies
whether these deficits are a cause or a consequence of MA in these maths anxious adults.
Chapter Four suggested that the mean MA level was higher for children with DD than
children with average or above average mathematics performance. However, children with
DD had a wide range of MA scores, suggesting that not all children with DD have high levels
of MA. Additionally, Figure 17 illustrated that a couple of CON and HM children had
moderate to high levels of MA which were on a par with the MA levels of some of the DD
children. Thus, these results suggest that there may not be a complete overlap between DD
and high MA levels and that some children with typical mathematics performance may be
affected by high MA as well. However, to investigate this fully, it is necessary to measure the
association between MA and DD in a larger sample of children. Although MA has certainly
been investigated in DD in the past, crucially no prior research has investigated the
prevalence of comorbidity of these two mathematics learning problems in a large sample,
thus, the assumption that MA is just another label for low maths performance is currently
unfounded. Furthermore, research investigating the link between MA and performance in
children with DD is sparse.
5.1.1 The current study.
The current chapter aims to investigate the link between MA and DD in a very large
sample of primary and secondary school children (the screening sample from Project 2). I
used the absolute threshold definition of DD (used in Chapter Two) and, thus expected to
replicate the prevalence rate of 5.58% reported there (Hypothesis 1). Others have used
various definitions of high MA, for example, Ashcraft and colleagues (2007) defined high
MA as scores 1 SD above the mean, which would suggest around 17% of the population are
affected, whereas Chinn (2009) defined high MA as all scores above a certain raw score on

119
his scale, and found only 4% of this sample had high MA. Thus, I had no a priori definition
of high MA and derived the estimate of high MA prevalence from observation of the MA
score distribution. I used the resultant definition of high MA to establish the prevalence of
comorbid DD and high MA in the sample. Furthermore, I compared the proportion of high
MA children falling in different mathematics performance groups (those with typical
mathematics performance, DD, and comorbid mathematics and reading difficulties).
Informed by previous research (Lai et al, 2015; Passolunghi, 2011; Wu et al., 2014) I
hypothesised that children with DD would be more likely to have high MA than children with
typical mathematics performance (Hypothesis 2).
I also measured the correlation between MA and performance in the total sample, in
each year group separately, and in children with DD. I predicted that a negative correlation
would emerge in the total sample (Hypothesis 3). Prior studies have reported mixed findings
regarding the existence of the MA-performance relationship in primary students, thus, I did
not make any predictions about whether this negative correlation would emerge in primary
students. However, because this relationship has emerged more consistently in studies of
secondary school students, I predicted that the negative relationship between MA and
performance would emerge in secondary students (Hypothesis 4). As there is a lack of
research investigating the link between MA and performance within children with
mathematical learning disabilities I did not make any predictions about the MA-performance
relationship in DD children.
5.2 Method
5.2.1 Participants.
The sample consisted of 1757 children and adolescents attending primary and
secondary schools in Cambridgeshire (8 schools), Hertfordshire (7 schools), Suffolk (7
schools), Norfolk (2 schools) and Bedfordshire (1 school) of England, UK. The primary
school sample (N = 830) consisted of 408 girls and 422 boys from Year 4 (mean age =109.4
months SD = 3.73). The secondary school sample (N = 927) consisted of 340 girls and 349
boys from Year 7 (mean age = 146.93 months; SD = 3.54) and 120 girls and 118 boys from
Year 8 (mean age = 151.26 months; SD = 3.45). School demographics varied widely, with
locations being both urban and rural. The percentage of students receiving Free School Meals
(FSM) was used as an indicator of SES because a child's entitlement to FSM is determined
from consistent economic criteria (Gorard, 2012). The national average percentage of

120
students receiving FSM is 20.9% (calculated from a sample of 11-year-olds in 2014, from
figures in DfE, 2015a) and the percentage of students receiving FSM in the current sample
varied from 2.9% to 36.5% (DfE, 2015b). The percentage of students with special
educational needs (SEN) and who had English as an additional language (EAL) also varied
by school. In order to maintain a representative sample, students were not excluded from the
study on the basis of SEN or EAL. Parental consent was received for all children before
testing. The study received ethical permission from the Psychology Research Ethics
Committee of the University of Cambridge. The information sheet and consent form can be
found in Appendix F.
5.2.2 Measures.
5.2.2.1 Maths Anxiety.
Maths anxiety was measured using the mAMAS (described in Chapter Four). The
mAMAS can be found in Appendix C. Details of the specific administration procedure
regarding using the mAMAS with primary level children is outlined in 5.2.3 below.
5.2.2.2 Mathematics performance.
Students’ maths performance was assessed using the MaLT tests (Williams, 2005).
See Chapter Two for further details about the MaLT tests. In accordance with their schooling
level, Year 4 students completed the MaLT 9, Year 7 students completed the MaLT 12 and
Year 8 students completed the MaLT 13. Students had 45 minutes to complete the tests.
5.2.2.3 Reading performance.
The HGRT II (Vincent & Crumpler, 2007) was used to assess students' reading
performance. See Chapter Two for further details about the HGRT. In accordance with their
schooling level, Year 4 students completed HGRT level 2 and Year 7 and 8 students
completed HGRT level 3.
5.2.3 Procedure.
Researchers went to schools to administer the tests and questionnaires. Children were
assessed in group settings (either as a class or whole year group) with sessions lasting
approximately 2 hours. The order in which the mAMAS, MaLT and HGRT were
administered was counterbalanced between schools.
Given the young age of the primary students, the testing material was presented in a
child-friendly and accessible manner. Practice questionnaire items (e.g., "Rate how anxious

121
you would feel climbing a tree") were presented alongside a colourful PowerPoint slideshow.
Furthermore, any difficult words or terms were explained (e.g. “anxiety” was defined as
"nervousness" and "worry") and researchers checked that children understood how to
complete the practice items before proceeding with the mAMAS. All mAMAS items were
read out loud. The questionnaire was formatted so that it was more readable for young
children and included sad and happy emoticons at the end points of the Likert-scale to aid
students in their responses. However, the researchers emphasised that the questionnaire was
assessing anxiety and that the faces in this context were meant to indicate feeling less and
more anxious, not happiness and sadness.
5.2.4 Grouping of children.
Hereafter, when I use the term 'all children' I refer to the whole sample. In line with
the absolute threshold definition used in Chapter Two, DD was defined as mathematics
performance below 1 SD below the mean and reading performance above 1 SD below the
mean. Different discrepancy definitions of DD were compared (see Table 9B), but these
groupings were not used in later analyses. For analysis of co-occurrence of DD and MA, I
primarily used the DD-A criteria described above, but in Figure 20A I also inspected a DD
group with maths performance below 1.5 SD below the mean and reading above 1 SD below
the mean. Comorbid mathematics and reading difficulties (hereafter: DD+RD), was defined
as mathematics and reading performance below 1 SD below the mean.
5.2.5 Data analysis.
The normality of the distribution of MA scores for all children was tested using the
Shapiro-Wilk test. Chi-square analysis was used to compare the frequency of DD in the three
year groups. The association between MA and performance in the whole sample, for the three
year groups separately, and in students with DD, was measured using Spearman's rank
correlation. In order to further assess the robustness of correlations, I also constructed bias
corrected and accelerated 95% bootstrap confidence intervals for correlations (hereafter:
BcaCI).
The normality of the MA distribution in DD children was tested using the Shapiro-
Wilk test. Internal consistency of the mAMAS was estimated using Cronbach’s alpha
coefficient and ordinal Alpha coefficients. MA raw scores were sorted into 5 bins (0-9, 10-
19, 20-29. 30-39, 40-45). Chi-square analyses were used to compare the frequency of
children with high MA in different mathematics ability groups. Analyses were done in

122
MATLAB (R2015a) and in R (R Core Team, 2016) using the "GPArotation", "psych" and
"Rcmdr" packages (Bernaards & Jennrich, 2005; Fox, 2005; Revelle, 2013). Power
calculations were done in G*Power 3.1 (Faul, Erdfelder, Buchner, & Lang, 2009)
5.3 Results
5.3.1 Prevalence of high MA.
The distribution of raw MA scores across the whole sample is shown in Figure 18A.
The distribution of mAMAS scores in the current study was significantly different from
normal (N=1757, W = .95, p <.001, skewness =.70; Kurtosis = -.006). The non-normality of
the mAMAS is also illustrated in the q-q plot shown below in Figure 19. The distribution of
scores was also significantly different from normal when tested separately by year group
(Year 4: N = 830, W = .93, p <.001; Year 7: N = 689, W = .95, p <.001; Year 8: N = 238, W =
.96, p <.001). See 5.4 for further details about non-normality of the mAMAS.
High MA was defined as scores at or above the 90th percentile, which corresponded
to raw scores of 30 and above (an average score above 'Moderate amount of anxiety' on the
scale). Figure 18B shows the empirical cumulative distribution function with the score
corresponding to the 90th percentile marked. These percentiles are also presented in tabular
format in Appendix G. I note that the actual percentage of children diagnosed as having high
MA was 11% of the total sample, as the precise location of the 90th percentile fell somewhere
within several children with scores of 30. Rather than arbitrarily including some of the
children with scores of 30 in order to get a high MA group of exactly 10% of the sample, I
included all children with scores of 30 in the high MA group and thus, the resulting
percentage was 11%.
Cronbach’s alpha for the mAMAS was .85 (primary sample α = .85; secondary
sample α = .86) and split-half reliability was .84 (primary sample .85; secondary sample .86).
Cronbach’s alpha tends to underestimate reliability in cases where data are not continuous
(e.g., Likert-type scales), when there are few items in a scale, and when scores are not
normally distributed (these issues are discussed in Cipora, Szczygiel, Willmes, & Nuerk,
2015). Therefore, in line with Cipora and colleagues, I estimated the reliability of the
mAMAS further using ordinal Alpha coefficients (Gadermann, Guhn, & Zumbo, 2012).
Ordinal Alpha for the mAMAS was 0.89 (0.89 for primary students and 0.89 for secondary

123
students). Ordinal alpha did not increase if any item was dropped. Thus, the mAMAS
demonstrated good reliability at both school levels.

124
Figure 18. The distribution of raw MA scores (A) and the cumulative distribution function of
MA scores (B). The 90th
percentile (denoting high MA cut-off) is shown by the dashed line.

125
Figure 19. A normal q-q plot of the mAMAS data, showing the deviation from a normal
distribution.

126
5.3.2 Prevalence of DD.
5.3.2.1 Absolute thresholds.
Using the DD-A criteria, 99 children (5.6%) were diagnosed as having DD. The
number and percentage of children in the DD-A group by year group are presented in Table
9A. Chi-square analyses were used to compare the number of DD-A children in each year
group. There were significantly more children with DD in Year 4 than in Year 7 (χ2 = 6.52, p
=.012; two-tailed); however the number of children with DD was not significantly different
between Year 4 and Year 8 (χ2 = .046, p =.831; two-tailed), nor between Year 7 and Year 8
(χ2 = 4.54, p =.033; two-tailed) after correction for multiple comparisons (p-value divided by
the number of comparisons: 3).
5.3.2.2 Discrepancy (relative) thresholds.
DD was also diagnosed using different discrepancy thresholds, that is, different
discrepancies between maths and reading performance. The numbers of children meeting the
DD discrepancy criteria are shown in Table 9B. Note that in contrast to Chapter Two, there
were no children with DD and high reading performance (see Discussion 5.4.1). Discrepancy
thresholds were mainly inspected here as a comparison to Chapter Two. Hereafter, the
absolute threshold definition of DD (maths < 1 SD below the mean with reading above 1 SD
below the mean) is used for the remaining analyses in this chapter and in Chapter Six.

127
Table 9.
The frequency of children with DD using different definitions. (A) Number and percentage of
children in DD group in each year group. (B) Number of children with DD using a certain
discrepancy definition.
A. DD
N %
Year 4 56* 6.7
Year 7 26* 3.8
Year 8 17 7.1
Total 99 5.6
* Comparisons significant at p <.05.
B. Discrepancy
Reading criteria Maths < Mean –1
SD
Maths < Mean–1.5
SD
Average readers (within
0.5 SD mean) 49 10
Above average readers (>
0.5 SD above mean) 3 2
High readers (> 1 SD
above mean) 0 0

128
5.3.3 Relation between DD and MA.
Table 10A shows the percentage of students with high MA in the different
mathematics performance groups. When using a threshold of high MA at or above the 90th
percentile, 10% of students with mathematics at or above 1 SD below the mean had high MA;
however, 22% percent of students in the DD group had high MA. Note that this percentage is
of the children who met the DD criteria, not the percentage of all children with maths scores
falling below 1 SD below the mean. The frequency of children with high MA was
significantly different between the DD group and the students with mathematics at or above 1
SD below the mean (typical mathematics group; TM; χ2 = 14.42, p < 001; two-tailed). The
frequency of children with high MA was also significantly different between the children
with comorbid reading and maths difficulties (DD+RD) and the TM group (χ2 = 6.86, p
=.008; two-tailed), however, the frequency of children with high MA was not significantly
different between the DD group and DD+RD (χ2 = .96, p =.32, two-tailed).

129
Table 10.
Maths anxiety scores in different groups.
(A) Number and percentage of children with high MA falling within different mathematics
achievement groups (DD: Developmental Dyscalculia; DD+RD: DD with Reading Deficit;
TM: Typical Maths). Row 1 shows the proportions of high MA children in a group relative to
the number of children in that group (e.g. there were 198 high MA children in the whole
sample of 1757 children). Row 2 shows proportions relative to all 198 children with high MA
(198 = 24+22+152). (B) Median MA scores and 95% bootstrap confidence intervals for
medians in different groups.
A. DD+RD DD TM Whole sample
N % N % N % N %
Proportion
with high
MA in each
group
24/140 17 22/99 22 152/1518 10 198/1757 11
Proportion
relative to all
high MA
children
24/198 12 22/198 11 152/198 77 - -
B. DD+RD DD-A TM Whole sample
Mdn BcaCI Mdn BcaCI Mdn BcaCI Mdn BcaCI
23 21/24 22 20/26 18 17/18.67 18 18/19

130
Figure 20A confirms that only a relatively small proportion of DD children can be
categorised to have high MA independent of the DD and MA diagnosis criteria used. When
DD is defined as maths performance 1.5 SD below the mean, the percentage with high MA is
25%, slightly higher than the mean–1 SD definition (note that this percentage is calculated
out of the total number of DD children meeting the mean–1.5 SD criterion: 32 children).
Thus, as the definition of DD did not make a difference to the prevalence of co-occurrence of
MA and DD, the remainder of my analyses refer to the original DD and high MA definitions.
Importantly, of the students with high MA across the whole sample, only 11% fell in
the DD group and 12% had below average maths performance but did not meet criteria for
DD (i.e. had comorbid reading difficulty). Thus, the majority of students with high MA
(77%) had average or above average mathematics performance (see Table 10A). The
proportion of typically performing and high performing children with different maths anxiety
scores is also illustrated Figure 21. Table 10B shows the median MA scores and BcaCI for
median MA scores. rs
In the total sample of 1757 children, MA was significantly and negatively correlated
with mathematics performance (rs = -.30, p < .001, BcaCI: -.34, -.25). The correlation
between MA and mathematics performance is shown in Figure 20B. The correlations were
also significant when tested separately by year group (Year 4: rs = -.29, p < .001, BcaCI: -.35,
-.23; Year 7: rs = -.32, p < .001, BcaCI: -.38, -.24; Year 8: rs = -.15, p < .05, BcaCI: -.27, -
.02). In contrast, the correlation between MA and mathematics performance within the DD
group was not significant (rs = -.09, p = .38; BcaCI: -.29, .12). Note that the lack of
correlation in such a sub-sample can also be expected because of the narrow range of maths
scores in the DD group. The DD group amongst the whole sample is also shown in Figure
20B and the lack of correlation between MA and maths performance in this group can be
seen. Note that the spread of MA scores has about the same range in the DD group as in the
whole sample.

131
Figure 20. The percentage of DD children with high MA using different DD diagnostic
criteria (A) (maths performance below 1 SD below the mean vs. 1.5 SD below the mean) and
different MA cut-offs (raw scores between 27 and 45: the maximum MA raw score). (B) The
correlation between MA and mathematics performance in the whole sample. Filled circles
show children in the DD group (mean–1 SD definition).

132
Figure 21. The probability of having mathematics performance above a certain threshold
with different maths anxiety scores.

133
5.4 Discussion
The current study aimed to investigate the relation between DD and MA. To my
knowledge, this study is the first to estimate the prevalence of comorbidity of DD and MA in
a large, nationally-representative cohort of primary and secondary school children.
5.4.1 Prevalence of high MA and DD.
Whereas Hopko et al (2003) reported that AMAS scores were normally distributed in
their scale development study (N = 815, Shapiro-Wilk W = .98, p = ns; skewnesss = .32;
kurtosis = –.31), I found that scores on the mAMAS were not normally distributed (N =1757,
W = .95, p <.001, skewness =.70; Kurtosis = -.006). Importantly, none of the analyses
conducted in the current study required normality of MA. That is, rather than defining high
MA using a cut-off such as 1 SD above the mean (as used by Ashcraft et al (2007), I defined
high MA as raw mAMAS scores at or above the 90th percentile (raw scores of 30 and above).
This is lower than the 17% proposed by Ashcraft et al. which would result from using a cut-
off of 1 SD above the mean score of a normal distribution if MA scores were normally
distributed, however, as scores on the mAMAS were not normally distributed it was not
appropriate to use a SD definition of high MA, and thus, the high MA prevalence estimate
was lower using our more conservative definition.
Other recent studies employing translated versions of the AMAS have also shown that
MA scores were not normally distributed. For example, Cipora et al. (2015) found that total
scores on their Polish translation of the AMAS, and scores on two AMAS subscales were
significantly different from normal. Likewise, Primi et al., (2014) found that some items of
their Italian translation of the AMAS did not satisfy normality criteria when administered to
samples of adults and secondary school students. Using another shortened version of the
MARS (the MARS30-brief) Pletzer et al. (2016), found that neither the total score nor the
items of the scale were normally distributed in adults. It is possible that the positive skew of
the MA distribution in our study is because our sample included children rather than adults,
however, as mentioned above, recent studies did not find MA was normally distributed in
adults and high school students either.
I estimated the prevalence of DD using the different diagnostic criteria used in
Chapter Two. When DD was defined using mathematics performance below 1 SD below the
mean and reading performance above 1 SD below the mean, 5.6% of the sample met the

134
criteria for DD. This prevalence estimate is very similar to international estimates reported
previously (Gross-Tsur et al., 1996; Koumoula et al., 2004). Somewhat surprisingly, the
average prevalence estimate across year groups reported in this study is exactly equal to the
prevalence I reported in Chapter Two using these same criteria (5.58%), which supports
Hypothesis 1 which predicted that the prevalence of DD found in Chapter Two would be
replicated. Note, however, that there was some variation in prevalence by year group, with a
higher prevalence in Year 4 than Year 7. Again, the prevalence estimate of 5.6% reported
here is higher than the prevalence of 1.3% reported previously for UK school children by
Lewis et al. (1994). However, Lewis and colleagues' DD selection criteria included two
control measures (IQ and reading) which would naturally increase the specificity of DD and
accordingly decrease the percentage of children meeting the selection criteria.
When I used a discrepancy definition of DD, that is, mathematics performance below
1 SD below the mean and reading performance within 0.5 SD of the mean, the prevalence of
DD reduced to 2.8%. However, in contrast to Chapter Two, I found that no children met the
DD discrepancy criteria of mathematics performance below 1 SD below the mean and high
reading performance (>1 SD above the mean). This difference may simply reflect the fact that
mathematics and reading performance were highly correlated in the total sample (rs =.72, p <
.001 - a higher correlation than the correlation reported between maths and reading in
Chapter Two: r=.63, p < .001), and accordingly, no children in the current sample had
extremely discrepant performance in these two academic domains.
5.4.2 Relationship between DD and MA.
In the whole sample, MA and mathematics performance were moderately negatively
correlated (rs = -.30), supporting Hypothesis 3 which predicted a negative correlation
between MA and performance. This correlation is about the same effect size as that reported
in previous meta-analyses (Hembree, 1990; Ma, 1999). The similarity between the current
data and results from the 1990s is remarkable: MA seems to be a highly persistent factor in
mathematical development. Analysis by year group revealed that the correlations were
significant and negative for all three year groups, supporting Hypothesis 4 which predicted
that a significant relationship would be found in secondary students. The fact that a
significant negative correlation between MA and maths performance also emerged in primary
school children supports the few studies that have also shown this association (e.g., Punaro &
Reeve, 2012; Wu et al., 2012). But our finding contrasts with studies that have not found an
association between MA and performance in young primary children (Krinzinger et al., 2009;

135
Thomas & Dowker, 2000). It is unclear why there are differences across studies but it is
possible that differences in the age of the samples (e.g., the latter studies' samples were
younger than the sample tested in the current chapter). Alternatively, the differences between
the current and prior findings may reflect differences in how MA has been operationalised by
different researchers and the components of MA measured by the different scales (Sorvo et
al., 2017). Indeed, Wigfield & Meece (1988) reported a stronger relationship between the
emotionality component of MA and performance than between worry and performance.
Similarly, Sorvo and colleagues reported a stronger relationship between anxiety about
mathematics situations and maths performance than the relationship between anxiety about
mathematics failure and maths performance (Sorvo, et al., 2017). It was not possible to
separate these components of MA in the current study because the mAMAS measures the
amount of anxiety elicited by mathematical situations and items were not worded to
specifically assess worry, emotionality, or anxiety related to failure. For example, mAMAS
item 4, which gauges the amount of anxiety felt when 'Taking a maths test', potentially
assesses one or all of these components.
In contrast to the moderate negative correlation that emerged in the whole sample, the
correlation between MA and maths performance was not significant in children with DD.
Most notably, children with DD had a similar range of MA levels to the typically developing
children and 78% of DD children did not have high MA. While 11% of the whole sample had
high MA, and 10% of the children with at least average mathematics performance had high
MA, 22% of the DD group had high MA. Hence, high MA appears to be twice as likely in
children with DD as in children with mathematics performance at or above the average range.
On the one hand, this finding supports previous studies which have shown higher levels of
MA in children with DD/MLD (Lai et al., 2015; Passolunghi, 2011; Wu et al., 2014) and
supports Hypothesis 2 which predicted that high MA would be more likely in children with
DD than in children with typical maths performance. However, on the other hand, of the
students with high MA across the whole sample, only 11% fell in the DD group and 12%
were in the DD+RD group. Thus, the majority of students with high MA (77%) had average
or above average mathematics performance, demonstrating that high MA is not exclusive to
children with MLD or DD.
In contrast to the idea that MA may simply equate to low maths performance, the
results of the current study suggest that many children with DD do not report high levels of
MA. These findings challenge the hypothesis that deficits in basic numerical processing

136
underlie MA (e.g., Maloney et al., 2010; 2011), as here the results suggest that although there
is some degree of overlap between them, MA and numerical deficits (characteristic of DD)
are dissociable. Hence MA and DD are likely to require different types of intervention. The
implications of these findings are discussed in greater detail in the General Discussion.
5.5 Summary
The current chapter found that the prevalence of DD averaging across year groups
was 5.6%, using the criteria from Chapter Two (maths performance < 1 SD below the mean
with reading performance above 1 SD below the mean). However, there was some variability
in DD prevalence when inspected in each year group separately. MA was found not to be
normally distributed, thus, high MA was defined as scores above the 90th percentile for the
sample, which corresponded to raw scores of 30 and above. Using these definitions I found
that there was some degree of overlap between DD and MA in school children. However, not
all children with DD reported high levels of MA and likewise, not all children with high MA
had poor mathematics performance. In fact, the majority of highly maths anxious children
had mathematics performance within or above the average range. Furthermore, whilst the
correlation between MA and performance was significant in the total sample (and in each of
the year groups separately), it was negligible in children with DD. These findings call into
question the idea that MA is only present in children who struggle with mathematics.

137
6. Chapter Six. Gender differences in MA and DD.5
The previous chapters have established that the prevalence of DD is approximately
6% in UK school children and that no gender difference exists in the prevalence of DD at the
primary school level. However, it is unclear whether a gender difference in DD prevalence
exists at the secondary school level. Given that other research has revealed small to moderate
gender differences in mathematics performance during the secondary school years favouring
boys, and that boys are overrepresented at the upper end of the performance distribution (e.g.,
Else-Quest et al., 2010; Stoet & Geary, 2013), it is possible that more girls than boys may
meet the diagnostic criteria for DD in secondary school.
With regard to MA gender differences, prior literature has revealed mixed results in
young children, with some reporting higher levels of MA in primary school girls than boys
(e.g., Griggs et al., 2013, Hill et al., 2016; Satake & Amato, 1995; Yüksel-Şahin, 2008).
However, this finding is not universal and several studies of younger children have reported
null findings (e.g., Gierl & Bisanz, 1995; Harari, et al, 2013; Newstead, 1998; Punaro &
Reeve, 2012; Ramirez, et al., 2013; Young et al, 2012).
The pattern of MA gender differences appears to be more consistent in secondary
school samples. Although some have reported no MA gender differences (e.g., Birgin et al,
2010; Dede, 2008; Hadfield et al, 1992; Kyttälä & Björn, 2014; Sepie & Keeling, 1978), the
majority of studies have shown increased levels of MA (or MA subtypes) in girls compared
to boys (e.g., Baya'a, 1990; Chinn, 2009; Devine, et al., 2012; Frenzel et al, 2007; Goetz et
al., 2013; Hill et al., 2016; Ho et al. 2000; Jain & Dowson, 2009; Khatoon & Mahmood,
2010; Kvedere, 2012; Luo et al, 2009; Primi et al., 2014; Saigh & Khouri, 1983). Two major
meta-analyses of cross-national data also support this finding (Hembree, 1990; Else-Quest et
al. 2010).
In contrast, gender differences in the relationship between MA and maths
performance seem to vary between studies. For example, our previous study found that the
5 This chapter is an extended version of a material published previously. Copyright © 2017 by the
American Psychological Association. Reproduced with permission. The official citation that should be used in referencing this material is Devine, A., Hill, F., Carey, E., & Szűcs, D. Cognitive and emotional math problems largely dissociate: Prevalence of developmental dyscalculia and mathematics anxiety, Journal of Educational Psychology. Advance online publication. doi: http://dx.doi.org/10.1037/edu0000222. The use of APA information does not imply endorsement by APA. No further reproduction or distribution is permitted without written permission from the American Psychological Association.

138
relationship between MA and math performance is stronger in girls than in boys (Devine et
al., 2012), but Ma & Xu (2004) found that maths performance may be more predictive of MA
in boys than girls. Yet other studies have found no gender difference in the relationship
between MA and maths performance (e.g., Meece et al., 1990; Wigfield & Meece, 1988).
Collectively, the literature suggests that girls may have higher MA than boys,
particularly at the secondary school level, however, there appears to be no consistency
regarding gender differences in the relationship between MA and maths performance.
As mentioned in the introduction to Chapter Five, although the MA and maths
performance relationship has been studied extensively, there is no research systematically
investigating the prevalence of comorbidity of MA and DD. As such, there is also no research
investigating gender differences in children with these co-occurring mathematics learning
problems. The current chapter addresses this research gap.
6.1.1 Current Study.
The aims of the current study were to inspect gender differences in maths and reading
performance, DD, MA and co-occurring DD and MA in the sample described in Chapter
Five.
In keeping with the findings of Chapter Three, and previous UK research showing
that girls outperform boys in reading at both the primary school (e.g., DfE, 2014) and
secondary school level (Sammons et al., 2014), it was predicted that girls would outperform
boys in reading at both school levels (Hypothesis 1).
Also in keeping with the results of Chapter Three, it was predicted that girls and boys
would show equivalent mathematics performance at the primary school level (Hypothesis 2).
Although international research has indicated small to moderate gender differences at the
secondary school level, recent UK research has not revealed gender differences in maths
performance at GCSE level (Bramley et al., 2015). Thus, it was also predicted that there
would be no gender difference in maths performance at the secondary school level
(Hypothesis 3).
Chapter Three and other UK research (Lewis et al., 1994) found the gender ratio of
DD was 1:1, thus, it was predicted that there would be no gender difference in DD prevalence
at the primary school level (Hypothesis 4). However, as previous studies have not
investigated the prevalence of DD in secondary school samples it was unknown whether

139
there would be a gender difference in DD at the secondary school level, and I made no
hypothesis regarding this.
In line with the research cited above, I predicted that girls would show higher levels
of MA than boys in primary school (Hypothesis 5) and at the secondary school level
(Hypothesis 6). However, due to the lack of prior research investigating the prevalence of
comorbidity of MA and DD, I had no firm hypothesis regarding a gender difference in the
prevalence of co-occurring MA and DD.
In line with the findings of our previous study (Devine et al., 2012), it was predicted
that girls would show a stronger correlation between MA and performance than boys in
secondary school students (Hypothesis 7). However, due to the scarcity of prior research in
gender differences at the primary school level, I had no predictions regarding gender
differences in the MA-maths performance correlation in primary students.
6.2 Method
6.2.1 Participants.
The sample consisted of 1757 children and adolescents attending primary and
secondary schools described in Chapter Five. The primary school sample (N = 830) consisted
of 408 girls and 422 boys from Year 4 (mean age =109.4 months SD = 3.73). The secondary
school sample (N = 927) consisted of 340 girls and 349 boys from Year 7 (mean age =
146.93 months; SD = 3.54) and 120 girls and 118 boys from Year 8 (mean age = 151.26
months; SD = 3.45).
6.2.2 Measures.
6.2.2.1 Maths Anxiety.
Maths anxiety was measured using the mAMAS (described in Chapters Four and
Five).
6.2.2.2 Mathematics performance.
Students’ maths performance was assessed using the MaLT (Williams, 2005). In
accordance with their schooling level, Year 4 students completed the MaLT 9, Year 7
students completed the MaLT 12 and Year 8 students completed the MaLT 13.

140
6.2.2.3 Reading performance.
The HGRT-II (Vincent & Crumpler, 2007) was used to assess students' reading
performance. In accordance with their schooling level, Year 4 students completed HGRT
level 2 and Year 7 and 8 students completed HGRT level 3.
6.2.3 Procedure.
The procedure is described fully in 5.2.3.
6.2.4 Grouping of children.
When I use the term 'all children' I refer to the whole sample. In line with the absolute
threshold definition used in Chapters Two, Three and Five, DD was defined as mathematics
performance below 1 SD below the mean and reading performance above 1 SD below the
mean.
6.2.5 Data analysis.
The current chapter collapsed the Year 7 and 8 data in order to compare across
school level (primary vs. secondary students). The normality of the distributions of maths,
reading and MA scores were tested separately by school level, using the Shapiro-Wilk test.
The distributions of reading, maths, and MA scores were compared for each gender using the
Mann-Whitney U test. Maths and reading standard scores were sorted into 9 bins (<70, 70-
79, 80-89, 90-99, 100-109, 110-119, 120-129, 130-139, 140 and above). MA raw scores were
sorted into 5 bins (0-9, 10-19, 20-29, 30-39, 40-45). Where distributions differed, the cell
counts of girls and boys were compared using Chi-square analyses. Chi-square analysis was
also used to compare the frequency of girls and boys with DD.
Girls' and boys' mean reading, maths and MA scores were also compared using bias
corrected and accelerated 95% bootstrap confidence intervals (hereafter: BcaCI). Effect sizes
reported are Cohen’s d.
The distribution of MA scores in children with DD was also compared for each
gender using the Mann-Whitney U test and binning and post-hoc tests were carried out as
described above. Chi-square analysis was also used to compare the frequency of girls and
boys with high MA and DD. In comparisons with sample sizes of less than 5, Fisher’s exact p
is reported.

141
Post-hoc tests were corrected for multiple comparisons (p-value divided by the
number of comparisons: 9 for the reading and maths distribution comparisons, 5 for the MA/
DD+MA distribution comparisons).
The association between MA and performance for each gender, for primary and
secondary students separately, was measured using Spearman's rank correlation. In order to
further assess the robustness of correlations I also constructed BcaCI for correlations.
Analyses were done in MATLAB (R2015a).
6.3 Results.
6.3.1 Reading and mathematics performance.
Shapiro-Wilk tests revealed that reading and mathematics distributions were
significantly different from normal, in the total sample (Reading: N = 1757 W = .99, p <.001,
skewness =.07; kurtosis = -.43; Maths: N = 1757 W = .99, p <.001, skewness =-.07; kurtosis
= -.55). The distributions were also significantly different from normal when tested for each
school level separately (primary reading: N = 830 W = .99, p <.001, skewness = .09; kurtosis
= -.48; secondary reading: N = 927 W = .99, p <.001, skewness = -.01; kurtosis = -.53;
primary maths: N = 830 W = .99, p <.001, skewness =-.19; kurtosis = -.64; secondary maths:
N = 927,W = .99, p <.001, skewness =.03; kurtosis = -.40). These findings contrast with
Chapter Two which found that maths and reading distributions were not significantly
different from normal. However, the standardisation of the HGRT and MaLT tests was
conducted on a nationally-representative sample which was much larger than the current
study, thus, the distributions of scores in the current sample may not precisely match those of
the standardisation sample. Crucially, none of the subsequent analyses required normality of
the distributions.
The Mann-Whitney U comparisons revealed that the reading performance distribution
was significantly different for girls and boys at the primary school level (Z = 2.03, p = .04;
girls' mean = 106.83; BcaCI: 105.34, 108.33; boys' mean = 104.51; BcaCI: 102.91, 106.09).
The effect size of the difference in means was d = -.15 Figure 22A shows the reading
performance distribution for primary students by gender. Chi-square analyses suggested that
there was a greater number of boys than girls at the lower end of the distribution (specifically
for standardised scores 70-79 and 80-89) and a greater number of girls at the upper end of the
performance distribution than boys (specifically scores 130-139), however, these
comparisons were not significant after correction for multiple comparisons (all were

142
significant at p <.05). Girls' and boys’ reading performance was also significantly different in
secondary school students (Z = 3.34, p <.001; girls' mean = 102.06, BcaCI: 100.68, 103.48;
boys' mean = 98.65, BcaCI: 97.24, 99.93). The effect size of the difference in means was d =
-.23. Figure 22B shows the reading performance distribution for secondary students by
gender. Chi-square analyses suggested there were more boys than girls at the lower end of the
distribution (specifically for standardised scores 70-79) and more girls than boys performing
above the average range (specifically scores 120-129), however, these comparisons were not
significant after correction for multiple comparisons (both were significant at p <.05).

143
Figure 22. Reading performance distributions of primary (A) and secondary (B) students.

144
The Mann-Whitney U comparisons revealed that the maths performance distribution
was significantly different for girls and boys at the primary school level only (Z = -2.16, p
=.03; girls' mean = 102.14, BcaCI: 100.70; 103.59; Boys' mean = 104.06; BcaCI: 102.49,
105.54). The effect size of the difference between the means was d =.12. Chi-square analyses
revealed there were more girls than boys with standardised scores 90-99 (χ2 = 12.93, p
<.001). Chi-square analyses also suggested there were more boys than girls with standardised
scores 110-119, but this comparison was not significant after correction for multiple
comparisons (significant at p <.05). Figure 23 shows the maths performance distribution for
primary students (A) and secondary students (B).

145
Figure 23. Mathematics performance distributions of primary (A) and secondary (B)
students.

146
6.3.2 MA.
As reported in Chapter Five, the Shapiro-Wilk test revealed that the MA distribution
was significantly different from normal, when collapsed across school level (N = 1757 W =
.95, p <.001, skewness =.70; kurtosis = -.006). The current analyses revealed the MA
distribution was also significantly different when tested separately by school level (primary:
N = 830 W = .94, p <.001, skewness =.81; kurtosis = .30; secondary: N = 927 W = .95, p
<.001, skewness =.61; kurtosis = -.27).
The Mann-Whitney U comparisons revealed that the MA distribution was
significantly different for girls and boys at the primary school level, indicating that girls had
higher levels of MA than boys (Z = 6.26, p <.001; girls' mean = 20.71, BcaCI: 19.98; 21.46;
Boys' mean = 17.83; BcaCI: 17.12; 18.62). The effect size for the mean difference was small
to moderate (d = -.38). Chi-square analyses revealed that there were more boys than girls
with MA scores at the lower end of the MA distribution (scores 0-9: χ2 = 17.00, p <.001) and
more girls than boys with moderate to high levels of MA (scores 20-29: χ2 = 9.03, p =.003;
scores 30-39: χ2 = 7.85, p =.005). All other comparisons were not significant. Figure 24A
shows the MA performance distributions for each gender in primary school students.
The MA distribution was also significantly different for secondary school girls and
boys, suggesting that girls had higher MA than boys (Z = 4.97, p <.001; girls' mean = 21.27,
BcaCI: 20.60; 22.03; Boys' mean = 18.81; BcaCI: 18.19; 19.48). The effect size for the mean
difference was small to moderate (d = -.33). Chi-square analyses revealed that there were
more boys than girls with MA scores at the lower end of the MA distribution (scores 0-9: χ2 =
7.54, p <.001; scores 10-19: χ2 = 12.81, p <.001) and more girls than boys with high levels of
MA (scores 30-39: χ2 = 16.12, p <.001). All other comparisons were not significant. Figure
24B shows the MA performance distributions for each gender in secondary school students.

147
Figure 24. Maths anxiety score distributions for primary students (A) and secondary students
(B).

148
6.3.3 DD prevalence.
Table 11 shows the prevalence of DD by gender. Chi-square analysis confirmed that
the number of girls and boys in the DD group was not significantly different at any of the
school levels.

149
Table 11.
Number and percentage of children in DD group by gender and year group.
Girls Boys Total
N % N % N %
Primary 31 7.6 25 5.9 56 6.7
Secondary 26 5.6 17 3.6 43 4.6
Total 57 6.5 42 4.7 99 5.6

150
6.3.4 DD and MA comorbidity.
The distributions of MA scores in the DD group for girls and boys are shown in
Figure 25. The Mann-Whitney U test confirmed that girls' and boys' distributions were
significantly different from one another (Z = -2.50, p =.013, girls’ mean = 24.15, BcaCI:
22.12; 26.15; boys’ mean = 20.19; BcaCI: 17.86; 22.78, Cohen’s d = 0.5). Chi-square
analysis confirmed that there were more girls with scores in the 30-39 range than boys
(Fisher’s exact p =.007). The gender differences for the other cells did not reach statistical
significance. When the high MA cells (scores above 30) were collapsed, chi-square analysis
confirmed that there were more girls with high MA (18) than boys with high MA (4) in the
DD group (Fisher's exact p = .013; two-tailed). The distribution of MA scores in the DD
group for each school level is shown in Figure 26. Where sample sizes allowed chi-square
comparisons to be made separately for each school level, none of the gender comparisons
was significant after correcting for multiple comparisons.

151
Figure 25. Distribution of mathematics anxiety scores for the DD group by gender across
both school levels.
Figure 26. Distribution of mathematics anxiety scores for the DD group by gender for
primary students (A) and secondary students (B).

152
6.3.5 MA and maths performance relationship.
MA was significantly and negatively correlated with mathematics performance in
girls (rs = -.25, p < .001, BcaCI: -.31, -.18) and boys (rs = -.33, p < .001, BcaCI: -.39, -.26).
Significant negative correlations also emerged when the correlations for each gender were
tested separately by school level (primary girls: rs = -.27, p < .001, BcaCI: -.36, -.18; primary
boys: rs = -.29, p < .001, BcaCI: -.38, -.19; secondary girls: rs = -.22, p < .001, BcaCI: -.31, -
.13; secondary boys: rs = -.35, p < .001, BcaCI: -.43, -.27). According to difference tests, the
strength of the correlation was the same for boys and girls, whether tested across the whole
sample, or within school levels (p >. 05 for all). The correlations between MA and
performance in girls and boys at both school levels is shown in Figure 27.

153
Figure 27. Correlation of MA and maths performance for primary school girls (A); primary school boys (B); secondary school girls (C); and
secondary school boys (D).

154
6.4 Discussion
The current study aimed to investigate gender differences in maths and reading
performance, MA, DD prevalence, and the prevalence of comorbid DD and MA in the
sample investigated in Chapter Five.
Gender differences in the reading performance distribution emerged suggesting
slightly higher performance in girls than boys at both school levels (small effect sizes) and
also suggesting an overrepresentation of boys at the lower end of the distribution and an
overrepresentation of girls at the upper end of the distribution. Thus, these results provided
partial support for Hypothesis 1 (that girls would show higher reading performance than boys
at both school levels). The effect size of the difference in mean reading performance of
primary school girls and boys was smaller than the effect reported in Chapter Three,
nonetheless, these results corroborate the gender differences in Year 3 and 4 children’s
reading performance found in Chapter Three.
There was also a gender difference in the maths performance distribution of primary
level students, suggesting that more girls than boys had standardised scores in the lower
average range (scores in the 90-99 range). However, the gender difference in mean
performance was of negligible effect size and there was no evidence that boys were
overrepresented at the upper end of the distribution at either school level. These findings
support Hypotheses 2 and 3 which predicted equal performance in girls and boys at both the
primary and secondary school level. The results also agree with recent UK research at the
secondary level which reported that boys were not consistently overrepresented at the upper
end of the maths performance distribution at GCSE level (Bramley et al., 2015). However,
the lack of a gender difference in the mathematics distributions contrasts with international
findings (Stoet & Geary, 2013) and primary level research in the UK (DfE, 2014) showing a
preponderance of boys at the upper end of the maths performance distribution.
DD prevalence was the same for boys and girls at the primary school level, which
supported Hypothesis 4 (predicting a gender ratio of 1:1) and the results of Chapter Three.
These findings are commensurate with three other studies that have found no gender
differences in DD prevalence (Gross-Tsur et al., 1996; Koumoula et al., 2004; Lewis et al.,
1994). Interestingly, the prevalence of DD was equal in secondary school girls and boys as
well.

155
MA distributions were significantly different in boys and girls. The distribution
comparisons suggested higher mean maths anxiety in girls than boys at both the primary and
secondary school level. The effect sizes were still fairly small (d = .33/.38), but were double
the size of the gender difference in mathematics performance and effects of this magnitude
are considered clinically relevant according to Wolf's (1986) interpretation. Furthermore,
more boys than girls had MA scores towards the lower end of the distribution whereas more
girls than boys had moderate to high levels of anxiety. This finding emerged at both school
levels, supporting Hypotheses 5 and 6 which predicted girls would report higher MA at in
primary school as well as secondary school. Thus, these findings support some studies which
found higher levels of MA in girls in the primary school years (Griggs, et al., 2013, Hill et al.,
2016; Satake & Amato, 1995; Yüksel-Şahin, 2008) and the many studies cited earlier that
found significantly higher MA in secondary school girls than boys (see Devine et al., 2012
and Hill et al., 2016 for a review)
When MA scores were inspected in the children with DD, the distributions also
differed significantly for girls and boys. Post-hoc tests revealed there were more girls with
high MA scores than boys. These results suggest that girls are more susceptible to negative
affective reactions to mathematics alongside performance deficits in the subject. The
implications of these findings with regard to girls' uptake of mathematics courses in higher
education and participation in STEM careers are discussed in detail in the General
Discussion.
MA was significantly and negatively correlated with performance in boys and girls at
both school levels. The strength of correlation did not differ between boys and girls,
providing no support for Hypothesis 7 which predicted that the correlation would be stronger
in secondary school girls than in secondary school boys. These results also contrasted with
the results of our previous study, which found a stronger MA-performance relationship in
girls than in boys (Devine et al., 2012). There are a few potential reasons why the current
study may have revealed different results. Firstly, our previously published study measured
performance on a mental arithmetic test, whereas the current study used a more holistic maths
test, which assessed a wider range of mathematical skills. The mental arithmetic tests used in
our previous study had a greater time pressure (20/25 problems in 5 min) than the MaLT tests
(around 45 questions in 45 min); and probably also had a higher working memory load than
the MaLT tests, as the children were not allowed to do working out on paper during the
mental maths test, whereas the MaLT includes blank space on each question for working out.

156
Thus, the debilitating effects of MA may have influenced girls' mathematics performance
more in the mental mathematics context whereas boys and girls were affected equally in the
standardised test. However, given the results were correlational in nature, I cannot infer the
direction of the relationship between MA and performance, as it is equally possible that MA
was a consequence of prior poor performance, which manifested to a larger extent in girls
than boys in the mental maths context than in the national curriculum test. The previous
study also included slightly older children (Year 10 pupils as well as pupils in Year 7 and 8).
It is possible that the gender difference in the strength of the relationship between MA and
performance only emerges later in schooling, however, it was not possible to test this
conjecture with the age range of the current sample and the previously published findings
were not reported separately by year level.
6.5 Summary
The current chapter largely corroborated the findings of previous chapters. Firstly,
girls outperformed boys in reading. In contrast, mathematics performance was similar for
girls and boys. Furthermore, there was no evidence of boys outperforming girls at the top end
of the maths performance distribution. The current chapter confirmed that there was no
gender difference in DD prevalence, yet found that girls reported higher levels of MA than
boys and there were more girls than boys with comorbid DD and MA. The gender difference
is in line with the many studies that have suggested that girls have higher levels of MA than
boys and this study suggests that girls may be particularly susceptible to comorbid cognitive
and emotional difficulties in maths. These results have important implications for STEM
subject uptake in girls and boys, which are discussed in the next chapter.

157
7. Chapter Seven. General Discussion
The overarching aim of the current thesis was to explore the relationship between
cognitive and emotional mathematics learning problems and the role of gender. To this end,
this thesis systematically measured the prevalence of DD, MA, and the prevalence of overlap
of these mathematics learning problems in large samples of primary and secondary school
children. The current thesis also investigated gender differences in mathematics and reading
performance, DD, and MA. The associations between mathematics performance, other
cognitive skills, and MA, were investigated in a comprehensive longitudinal analysis of
children with DD, typical maths performance and high mathematics abilities. The main
findings are now discussed with regard to main research themes.
7.1 Main findings
7.1.1 DD definitions, prevalence, and gender ratio.
Inspection of the prior DD research literature revealed a large amount of variability in
the criteria used to define DD. Experimental studies have tended to use broader performance
thresholds than prevalence studies. However, prevalence studies have also varied in their use
of performance thresholds and the inclusion of control variables in DD diagnostic criteria.
The current thesis screened for DD by measuring mathematics and reading performance in
large samples of primary and secondary school children using standardised, national
curriculum-based assessments. Chapter Two revealed a moderate positive correlation
between mathematics and reading performance, but the correlation was stronger in the lower
half of the distribution than in the upper half. This change in the strength of the correlation
had important implications for the definition of DD, as a reading performance criterion was
included in the DD definition.
In Chapter Two, we systematically varied the reading and mathematics performance
thresholds and found that DD prevalence was affected by the cut-off score used to define
good reading performance due to the intercorrelation of maths and reading performance. In
summary, even when shifting cut-off scores in reading and maths between <1 SD and <1.5
SD below the mean, there was considerable variation in the number of children diagnosed
with DD; the frequency of diagnosis ranged from 9–173 (0.89% - 17.23%) in a sample of
1004 primary school children. When both cut-offs were set at <1 SD below the mean, the

158
prevalence of DD was 5.6%. Interestingly, when using these same criteria to define DD in the
data set analysed in Chapter Five (primary and secondary school children), DD prevalence
was also 5.6% when averaged across the three year groups (Years 4, 7 and 8). However, there
was some variability in prevalence by year group, which suggested that there were fewer
children with DD in Year 7 than in Year 4 which may be due to differences between the Year
7 sample and the sample used to standardise the MaLT.
In both Chapter Three and Chapter Five, the girl-to-boy gender ratio of DD was 1:1.
Chapter Three revealed this gender ratio was the same regardless of the absolute performance
thresholds used to define DD. However when a discrepancy between maths and reading
performance of 1 or 1.5 SD was used to define DD, significantly more girls than boys met the
DD criteria (gender ratio was 1.4 - 2.3 girls to every boy). But it was noted that these criteria
did not discriminate between children who had DD (poor maths performance compared to
reading performance) and high readers (children with relatively high reading performance
and average maths performance). Thus, different discrepancies were compared which
specified at least average performance in reading and revealed that an equal number of girls
and boys could be classified as having DD using these discrepancy criteria.
7.1.2 DD Stability.
Although Chapter Two illustrated alternative ways of defining DD using different
maths and reading performance cut-offs, it did not resolve how DD should be defined. As
mathematics performance was measured using an age-standardised test for which
performance scores were normally distributed, no natural cut-point existed with which to
differentiate individuals with DD/ MLD from children with typical mathematics
performance. Thus cut-offs were chosen arbitrarily which may have resulted in Type I errors
if the performance threshold was too lenient (i.e., identifying false positive cases of DD) or
Type II errors if the performance thresholds were too strict (i.e., missing true cases of DD)
Several researchers have emphasised diagnosing DD using multiple measurements
and different assessment instruments (Desoete & Roeyers, 2000; Mazzocco & Myers, 2003;
Silver et al., 1999), which has also been recommended for clinical diagnoses of LDs
(American Psychiatric Association, 2016). Measuring mathematics performance across
several time points allows to capture the natural fluctuation of performance above and below
performance cut-offs, and may help control for factors other than poor mathematics ability
that could result in a child underperforming on any one particular assessment (e.g., situational

159
factors, test anxiety; Mazzocco & Myers, 2003; Mazzocco & Räsänen, 2013; Stock et al.,
2010).
Indeed, this approach was used to identify a group of children with DD, described in
Chapter Four, who participated in the detailed longitudinal assessment. DD was defined as
maths below 1 SD the mean on two assessments of mathematics, and average performance in
reading and IQ. This study found that 80% of the children who initially met the criteria for
DD also met the criteria 20 months later (not taking into account participant attrition). This
prevalence of persistent DD was higher than reported previously (Morgan et al., 2009; Shalev
et al., 1998; 2005; Silver et al., 1999). The higher prevalence of persistent DD in the current
study may be due to the use of several control criteria to ensure the specificity of the
mathematical deficit at diagnosis: average reading performance across two tests, and average
verbal and non-verbal IQ. Thus, using a large number of control variables to ensure
specificity of the mathematical learning problem reliably identified a sample of children with
a specific and persistent deficit. Another reason for the stability of DD diagnosis in the
majority of the DD sample may be because two different tests of maths performance were
used for DD diagnosis, and measurement took place at different time points and in different
contexts (group vs. individual assessment).
Two control participants and two participants with high maths performance also no
longer met the criteria for categorisation into their group at the final time point. This
movement into other achievement groups reflected the natural fluctuation of performance
above and below performance cut-offs.
7.1.3 Cognitive skills associated with maths performance.
Chapter Four examined the stability of cognitive performance exhibited by children
with DD, a control group of children with average performance across a range of cognitive
skills, and a group of children who performed highly in mathematics. The link between maths
performance and MA was also inspected in these children. Correlations between mathematics
and other cognitive skills were measured over two or three time-points. In line with our
previous research (Szűcs, et al., 2014), mathematics performance was correlated with VSWM
at several time points and with spatial skills, but maths was also correlated with verbal WM,
intelligence and reading. However, due to the small sample size, it was not possible to run
regression analysis to inspect the relative contribution of these skills to mathematical
performance.

160
The cognitive performance of the three achievement groups was also compared over
time. In contrast to our previous work (Szűcs et al., 2013) the control children and children
with DD had similar VSWM performance at Time 3, suggesting that the VSWM impairment
exhibited in DD children at 8 years of age was not stable over time and was no longer shown
almost two years later. As predicted, mathematically high performing students exhibited
superior performance in VSWM and Spatial skills compared to the other two groups. These
results suggest that mathematical excellence is associated with advantages in spatial
processing compared to children with average or low performance in mathematics. However,
it is important to remember that the children in this group also had superior general cognitive
abilities and also had above average reading performance. Therefore, the elevated spatial
orientation performance in the HM group compared to the other two groups likely partly
reflected their higher general cognitive ability as well as superior spatial abilities.
In line with previous research, MA was significantly higher in the DD group than in
the control and high performing children and significant correlations emerged between MA
measured at Time 3 and mathematics performance at every time point. However, the sample
analysed in Chapter Four included selected groups which were not representative of the
normal population, thus the correlations between MA and maths performance were likely to
have been stronger than they would have been in a sample including children across the
entire mathematics performance distribution. Moreover, the DD children had a wide range of
MA scores and did not have scores clustered at the upper end of the MA score range. Thus,
these findings do not necessarily support the theory that MA is exclusively linked to
numerical deficits, as not all children with DD had very high levels of MA, and in fact, some
CON and HM children had MA levels on a par with some of the DD children. In order to
systematically investigate the link between DD and MA, the prevalence of co-occurrence of
DD and MA was inspected in large representative samples.
7.1.4 MA definitions, prevalence, and gender differences.
I found that scores on our modified version of the AMAS (mAMAS) were not
normally distributed, in contrast to the original study published by Hopko et al. (2003) which
reported that AMAS scores were normally distributed in an adult sample. The lack of
normality was demonstrated in all year groups and in both genders in the current study.
Importantly, none of the analyses conducted in the current study required normality of MA. I
defined high MA based on the MA score distribution of the sample rather than using a cut-off

161
such as 1 SD above the mean (as used by Ashcraft et al., 2007). I defined high MA as raw
mAMAS scores at or above the 90th percentile for the sample (raw scores of 30 and above).
11% of the sample had scores of 30 and above which is lower than the 17% of the population
that would meet the criteria for high MA if scores were normally distributed and a cut-off of
1 SD above the mean score was used (as suggested by Ashcraft et al., 2007). Because scores
on the mAMAS were not normally distributed in this study, it was not appropriate to use a SD
definition of high MA, and thus, our more conservative definition resulted in a lower
prevalence estimate for high MA.
It is possible that the positive skew of the MA distribution in our study in comparison
to the study of Hopko et al (2003) is because our sample encompassed children rather than
adults, however, recent studies did not find MA was normally distributed in adults and high
school students either. Recent studies which used translated versions of the AMAS have
shown that MA scores were not normally distributed in their samples (e.g., the Polish
translation of the AMAS used by Cipora et al., 2015; and an Italian version used by Primi et
al., 2014). Using the MARS30-brief (which is another shortened variation of the MARS,
similar to the AMAS), Pletzer et al., (2016) found that neither the total score nor the
individual items of the scale were normally distributed in adults. Thus, it seems that MA
scores are not normally distributed in some adult samples either.
Girls’ and boys’ MA score distributions were significantly different at both the
primary and secondary school level. The distribution comparisons revealed higher mean
maths anxiety in girls than boys and more boys than girls had MA scores towards the lower
end of the distribution whereas more girls than boys had moderate to high levels of anxiety.
These findings support a few studies which found higher levels of MA in primary school
aged girls compared to boys (Griggs et al., 2013; Hill et al., 2016; Krinzinger et al., 2012;
Satake & Amato, 1995; Yüksel-Şahin, 2008) and the many studies that found significantly
higher MA in girls than boys at the secondary school level (e.g., Baya'a, 1990; Chinn, 2009;
Devine, et al., 2012; Frenzel, et al., 2007; Goetz, et al, 2013; Hill et al., 2016; Ho et al. 2000;
Jain & Dowson, 2009; Khatoon & Mahmood, 2010; Kvedere, 2012; Luo et al., 2009; Primi,
et al., 2014; Saigh & Khouri, 1983).

162
7.1.5 Relationship between DD and MA, and gender ratio.
Chapter Five measured MA and DD in large samples of primary and secondary
school children. Correlations between MA and mathematics performance were measured in
the whole sample and in children with DD. Furthermore, the prevalence of comorbidity of
DD and high MA was inspected. This study revealed that MA and mathematics performance
were moderately negatively correlated (rs = -.30) in the whole sample. Interestingly, this
correlation is about the same effect size as that reported in previous meta-analyses from the
1990s (Hembree, 1990; Ma, 1999) suggesting that MA is a highly pertinent factor in
mathematical development. The correlation between MA and performance was significant
and negative for all three year groups, suggesting a link between MA and performance exists
at the primary school level as well as in secondary students. Although this correlation has
emerged in many studies involving secondary school students, it has only been shown in a
few studies of primary school students previously (Hill et al., 2016 [primary girls only]
Punaro & Reeve, 2012; Wu et al., 2012).
In contrast, the correlation between MA and maths performance was not significant in
children with DD. Inspection of the distribution of scores revealed that children with DD had
a very similar range of MA levels as the typically developing children and the majority (78%)
of children with DD did not have high MA. High MA appears to be twice as likely in
children with DD (22% of DD children affected) than in children with mathematics
performance at or above the average range (10%). On the one hand, this finding supports
previous studies which have shown that DD/MLD children report higher levels of MA than
children without MLD (Lai et al., 2015; Passolunghi, 2011; Wu et al., 2014). On the other
hand, the majority of students with high MA across the sample had average or above average
mathematics performance (77%), demonstrating that high MA is not exclusive to children
with MLD or DD. In Chapter Five, DD was only defined from assessments taken at one time-
point, rather than defined using two different measurements of maths. Chapter Four did
diagnose DD using two maths measurements and revealed that a much smaller proportion of
the sample met the criteria for DD (partly due to the use of several control measures, as well
as self-selection of the sample opting into the longitudinal study). Nonetheless, this suggests
that if DD had been defined using additional measurements (for example if all the children in
the sample analysed in Chapters Five and Six had taken part in follow-up assessments of
mathematics and reading a few months later) a smaller sample of DD children would likely
have been identified, suggesting even less overlap between high MA and persistent DD.

163
Unfortunately, without taking further measures it was not possible to test this claim.
Importantly, in line with the finding of higher MA in girls compared to boys, Chapter Six
revealed that more girls had comorbid DD and high MA than boys. These findings have
important implications for the model proposed by Ashcraft et al. (2007), as well as for
educational practice. These implications are discussed in section 7.2.
7.1.6 Gender – integration of findings.
Gender differences were inspected in the reading and mathematics performance of
primary school children (Chapters Three and Six) and secondary school students (Chapter
Six). Small gender differences (d = -.15 to -.23) emerged in reading performance at both
school levels. More primary school girls than boys had high reading performance and average
mathematics performance (Chapter Three). Furthermore, girls were overrepresented at the
upper end of the performance distribution compared to boys, and boys were overrepresented
at the lower end of the performance distribution at the primary school level (Chapter Three),
however, there was only a trend for this pattern in the samples analysed in Chapter Six.
Nonetheless, these findings are concordant with myriad studies which demonstrated that girls
outperform boys in reading and other language abilities at the primary school level and
beyond (e.g., Logan & Johnson, 2010, Stoet & Geary, 2013).
While Chapter Three revealed no gender difference in mean mathematics
performance of primary school girls and boys, nor in the distribution of mathematics scores,
there were more boys than girls with high maths scores and slightly above average reading
performance. Furthermore, a gender difference in mathematics performance did emerge in
the primary school sample analysed in Chapter Six. The gender difference in mean maths
performance in Chapter Six was of negligible effect size (d =.12) and analysis of the
distribution showed that more girls than boys had standardised scores in the lower average
range (scores in the 90-99 range). However, there was no evidence that boys were
overrepresented at the upper end of the distribution at either school level in Chapter Six. The
results are in agreement with recent UK research at the secondary school level which
revealed that boys were not consistently overrepresented at the upper end of the maths
performance distribution at GCSE level (Bramley et al., 2015). However, the current findings
contrast with international findings (Stoet & Geary, 2013) and primary level research in the
UK (DfE, 2014) showing a preponderance of boys at the upper end of the maths performance
distribution.

164
The reasons why the current results differ from these other studies are not clear but
may be due to differences in the age and size of the samples. The primary students analysed
in this chapter were approximately two years younger than the sample reported in the DfE
reports; likewise, the secondary students were about two years younger than the age at which
students participate in the PISA assessments analysed in Stoet and Geary’s (2013) study.
Furthermore, the samples analysed in both the DfE and PISA assessments were much larger:
approximately 557,000 in the DfE report and approximately 510,000 (over 12,000 UK
students) in the 2012 PISA assessment (OECD, 2015), thus, the larger sample sizes would
have led to increased statistical power for detecting gender differences in mean maths
performance and at the upper end of the distribution.
Another reason for the differences between the current results and those of national
and international assessments may be due to differences in the content of the maths
assessments. Whereas the MaLT tests are linked to the national curriculum in England and
Wales, the PISA mathematics assessments are not linked to any specific curriculum and are
intended to measure general mathematical competencies and the application of mathematical
skills and knowledge to real-life problems. Thus, it is possible that girls may match (or
outperform) boys when assessed on their knowledge of the national curriculum (e.g., in the
MaLT tests here, and in GCSE performance: Bramley et al., 2015); but when asked to apply
their mathematical knowledge to novel or real-life situations (i.e., in PISA maths) girls may
lag behind boys. Indeed, OECD reported that there were some gender differences within
different problem types included in the mathematics and science assessments. For example,
they noted that "girls’ performance tends to be better in areas where they are required to
apply mathematics concepts, facts, procedures and reasoning, and to recognise scientific
issues. However, girls appear to underperform considerably when they are required to think
like scientists – meaning when they are asked to formulate problems mathematically,
interpret phenomena scientifically and predict changes, solve interactive problems, or
understand and solve problems where the way of solving the problem is not immediately
obvious and the problem evolves over time." (OECD, 2015, p 89.) However, these
conclusions may paint girls' scientific and mathematical aptitude with too broad a brush;
indeed, some researchers have inspected the OECD data more closely and found that girls
outperformed boys on some questions which required scientific interpretation and
mathematical formulation and noted that the specifics of what was being tested likely had an
impact on whether gender differences emerged (Benton, 2015). Moreover, OECD themselves

165
noted that large gender differences in mathematical or scientific self-efficacy emerged for
problems that included gender stereotypical content. Thus, girls’ problem-solving
performance may have been influenced by their self-efficacy for particular problems in the
PISA assessments.
As well as mathematics performance being similar between girls and boys in the
current studies, DD prevalence was also the same for boys and girls when absolute
performance thresholds were used (in primary school children in Chapter Three and Chapter
Six, and in secondary school children in Chapter Six).
In contrast, Chapter Six revealed that MA distributions were significantly different in
boys and girls at both school levels, indicating higher levels of MA in girls than boys, and an
overrepresentation of boys at the lower end of the MA score distribution compared to girls,
and the opposite pattern at the upper end of the performance distribution. Furthermore, there
were more girls with comorbid DD and high MA than boys.
The reasons why females frequently report higher MA than males are not well
understood but several explanations have been offered. These explanations mainly involve
the same biological, individual, social, and environmental factors or theories that I described
in Chapter One with relation to the causes of MA and gender differences in mathematics.
Biological links to MA have been suggested by the study of MA in monozygotic and
same-sex dizygotic twins by Wang et al (2014) which revealed that around 40% of the
variation in MA could be explained by genetic factors. Nonetheless, environmental and social
factors play some part in the development of MA gender differences.
For example, some have proposed that the different ways in which boys and girls are
socialised during childhood may differentially affect the anxiety experienced by males and
females in certain situations (Bander & Betz, 1981). This hypothesis, known as the sex-role
socialisation hypothesis, argues that because mathematics was traditionally viewed as a male
domain, girls may be socialised to think of themselves as mathematically incompetent and
therefore girls may be more likely to avoid mathematics and experience more anxiety during
mathematics than boys (ibid; Sherman, 1976). Maths-gender stereotypes do have a
detrimental effect on girls performance (Appel, Kronberger, & Aronson, 2011; Flore &
Wicherts, 2014) and other work has suggested that parents' and teachers' gender-stereotyped

166
beliefs influence children's attainment, and indirectly affect children's academic choices
(Eccles, 1994; Gunderson, Ramirez, Levine et al., 2012).
Females are also more likely to report higher levels of both TA and GA than males
(Hembree, 1988; Wren & Benson, 2004; Vesga-Lopez et al., 2008); thus, it is possible that
females’ general propensity for anxiety may contribute to girls' higher levels of MA.
Although these other anxiety forms were not investigated in the analysis reported in this
thesis, GA and TA were measured in Project 2 (i.e., the same sample investigated in Chapters
Five and Six). Our analysis of the dataset including these other anxiety measures suggested
that girls were more likely than boys to fall within a high GA profile (high GA compared to
the other anxiety subtypes) or a high anxiety profile, for which levels of GA, TA and MA are
all high (Carey, Devine, Hill & Szűcs, 2017a). In contrast, within the secondary school
sample, boys were more likely than girls to fall within a high academic anxiety profile, for
which levels of TA and MA were high relative to GA levels. Thus, it appears that girls'
general propensity towards anxiety may contribute to the girls' higher MA levels reported in
the current studies. However, it is not clear from the analyses reported in Carey et al. (2017a)
how these anxiety types develop with respect to one another. Longitudinal studies of the
development of different anxiety forms would enable these relationships to be investigated
more clearly.
An alternative explanation is that the gender difference in MA may be due to a
general response bias in females (Hunsley & Flessati, 1991). Research has shown that
females/ feminine individuals are more likely to express feelings of anxiety or psychological
distress than males/masculine individuals (Biaggio & Nielsen, 1976).
Another view, the maths experiences hypothesis (Richardson & Woolfolk, 1980)
claims that gender differences in MA disappear when individuals' mathematical background
is taken into account (e.g., the amount of interaction with mathematics and the number of
positive/negative experiences). Whilst this has been supported in one study with an adult
sample (Brush, 1978), other studies have shown that even though maths experience is related
to levels of MA, maths experience does not account for the gender difference in MA (Flessati
& Jamieson 1991; Hunsley, 1988).
More recently, Maloney and colleagues suggested that cognitive factors may explain
gender differences in MA. They found that the relationship between gender and MA was

167
mediated by self-rated spatial abilities (Maloney et al., 2015). However, as in their other
study mentioned in Chapter One (Ferguson, et al., 2015), spatial abilities were measured
using a self-report questionnaire (the Object Spatial Imagery Questionnaire, OSIQ;
Blajenkova, Kozhevnikov,& Motes, 2006) and, thus, reflected perceived aptitude and
preference for spatial processing rather than actual spatial ability. Although the OSIQ has
been shown to be correlated (fairly weakly) with several measures of spatial ability
(Blajenkova et al, 2006), actual spatial abilities were not measured in the experiments of
Maloney et al. Moreover, the relationship between perceived spatial abilities and MA could
potentially be explained by gender-stereotyped beliefs about spatial abilities. Past research
has shown a male advantage in some types of spatial abilities (e.g., mental rotation of 3D
figures), although there are inconsistencies in spatial gender differences across different
paradigms and age groups (reviewed in Halpern et al., 2007). Nonetheless, the stereotype of
male superiority in spatial abilities is fairly ubiquitous (e.g., views such as males being better
at reading maps or females being terrible at parallel parking are common). Thus, similar to
maths gender stereotypes, females may hold the view that their spatial abilities are inferior to
males (even if their individual abilities may not be poor) and may provide lower ratings in
confidence and aptitude for spatial tasks. A relationship between MA and perceived spatial
abilities is therefore not that surprising. Again, because this study assessed adults and did not
follow the development of MA and spatial abilities (and perceptions of spatial abilities)
longitudinally, it could not be determined whether spatial abilities or MA comes first in the
causal chain. Moreover, measuring actual spatial abilities, rather than perceptions of spatial
abilities would provide a clearer picture.
Other variables that may account for the gender difference in MA are mathematics
confidence/self-concept and mathematics self-efficacy. Several studies have shown that boys
report greater confidence in mathematics and higher mathematics self-efficacy than girls
(Pajares, 2005; Huang, 2013; Wigfield, Eccles, MacIver, Reuman, & Midgley, 1991). As
mentioned previously, mathematics self-efficacy has been shown to be related to MA
(Meece, et al., 1990; Jain & Dowson, 2009) thus, maths competency beliefs may indeed
contribute to MA gender differences.
7.2 Implications for Research and Education
The results of the current thesis have important implications for research in
mathematical learning problems and for educational practice. Here I focus on the

168
implications pertaining to the main themes of the thesis: defining DD and MA, gender
differences in mathematics performance and affect, and the link between cognitive and
emotional maths learning problems.
7.2.1 Definitions of DD and MA.
First, the literature review in Chapter One revealed that both experimental and
prevalence studies of DD use wide-ranging criteria for DD diagnosis. As well as resulting in
a wide range of prevalence estimates (between 1.3 and 13.8% in DD prevalence studies), the
variable diagnostic criteria employed by DD researchers have likely resulted in conclusions
being drawn about very different samples of children. For example, Desoete et al (2007)
defined DD as mathematics performance below 2 SD below the mean, a discrepancy between
maths performance and other skills, and impairments showing resistance to intervention. This
is likely to have identified a more select group of children than for example, Badian’s (1983)
study, which defined MLD only on the basis of maths performance below the 20th percentile.
Therefore, the conclusions that each piece of research draws are specific to the sample and
diagnostic criteria used in that study. The results of Chapter Two revealed that the cut-off
criteria used to define good reading performance notably affected the prevalence of DD.
Furthermore, Chapter Three illustrated that the way in which the control variable was used
(absolute thresholds vs. discrepancy definition) also affected whether a gender difference in
DD prevalence emerged. Moreover, Chapter Four revealed that measuring maths
performance over several assessments and time points, and controlling for skills in other
domains (such as reading and IQ), identified a sample of DD children who showed severe,
specific, and persistent deficits in mathematical skills. These results suggest that control
variables should be included in DD diagnosis and that mathematics should be measured over
several time points and with different measurements. DD researchers should agree upon
standardised diagnostic criteria for DD in order to synthesise the findings from different
studies and to allow stronger, generalizable conclusions to be drawn. As DD is recognised as
a heterogeneous learning disability (Kaufmann et al., 2013), agreeing upon a definition of DD
would not necessarily require agreement on the theoretical origins of DD. However, a
consensus on its definition and standardised diagnostic criteria for research would enable a
clearer comparison of DD prevalence rates across different countries, but would also be
relevant for the comparison of experimental studies testing causal theories of DD or the
outcomes of intervention studies.

169
The current research also revealed that scores on the mAMAS were not normally
distributed in primary and secondary students. This contrasts with the original study reported
by Hopko et al (2003). In fact, MA researchers have rarely reported formal tests of normality.
For example, the original MARS study by Richardson & Suinn (1972), and several studies by
Ashcraft and colleagues (e.g., Ashcraft & Faust, 1994; Ashcraft & Kirk, 2001; Hopko,
Ashcraft, Gute, Ruggiero, & Lewis, 1998; Kellogg, Hopko, & Ashcraft, 1999) present means,
SDs or percentile ranks but these descriptive statistics do not demonstrate normality in and of
themselves. Moreover, recent research using translated versions of the AMAS also revealed
skewed distributions in adult and secondary school samples (Cipora et al., 2015; Pletzer et al.,
2016; Primi et al., 2014). Collectively, these results suggest that MA may not be normally
distributed. Therefore it is not appropriate to use SD definitions to define high MA or to split
the sample into low, medium and high MA groups as is often done in experimental studies.
MA researchers need to present the distribution of scores in their work and conduct statistical
tests of normality before employing SD cut-offs. Similar to DD research, it would also be
helpful to integrate MA research findings across studies if researchers were able to come to a
consensus on a definition for high MA. If a SD definition is preferred then only scales which
result in a normal distribution of scores should be used.
7.2.2 Gender differences in mathematics learning problems.
The current data suggest that boys are not under- nor over-represented in DD, unlike
several other learning disabilities for which there are a preponderance of boys (e.g., reading
disability, dyslexia, ADHD and autistic spectrum disorders; Bauermeister, et al., 2007; Rutter
et al., 2004; Scott et al., 2002). The lack of gender difference in DD in our study is
problematic for some current genetic theories of DD which suggest a possible role for x-
linked genes. However, most of these proposals rely on studies of highly atypical individuals
with Fragile X syndrome and Turner syndrome (Kemper et al., 1986; Gross-Tsur et al., 1993;
Shalev, 2004). Moreover, large-scale twin research revealed no gender differences in the
aetiology of MLD (Kovas, et al., 2007). Hence, gender-related observations from highly
special populations are not likely to be valid for more typically developing children.
Moreover, throughout this thesis, there was little evidence for gender differences in
mathematics learning, with the exception of higher levels of MA in girls than boys. These
findings accord with our previously published research involving adolescents (Devine et al.,
2012) and primary level children (Hill et al., 2016). These findings suggest that because girls
performed on a par with boys, despite reporting greater anxiety towards mathematics, girls

170
may have had the potential to outperform boys in mathematics, but their performance may
have been attenuated by anxiety (Devine et al., 2012). However, this conclusion is
speculative and further research is needed to test whether a gender difference emerges
(favouring girls) if MA is treated.
Importantly, because MA has been linked to avoidance of mathematics, as well as
drop out from elective mathematics classes (Ashcraft, 2002; Ma, 1999), MA could plausibly
contribute to the large gender disparities seen in the uptake of STEM professions (OECD,
2014). Firstly, higher levels of MA in girls could lead to more girls dropping out of
mathematics courses after compulsory education. Secondly, the debilitating effect of MA
could also explain the gender gaps seen in performance at the upper end of the mathematics
distribution in the students who take mathematics beyond GCSE level (Smithers, 2014). That
is, MA may not only cause many high-performing girls to choose other academic subjects
and career paths, it may also impair the performance of the girls who do continue with the
subject. It is important to note, however, that MA is likely to be one of many factors
contributing to the lack of females in most STEM fields (Eccles, 1994), including
mathematics ability beliefs (Perez-Felkner, Nix & Thomas, 2017).
Even if girls and boys appear to be performing similarly in mathematics, the
development of negative emotional reactions to mathematics warrants attention in the
classroom. Educators need to be aware of the ways in which girls and boys differ in terms of
the motivational, cognitive and emotional factors associated with learning mathematics.
Moreover, teachers and parents need to be especially aware of how their own beliefs and
emotions regarding mathematics can differentially influence the attitudes, performance, and
career choices of girls and boys (Beilock, et al, 2010 Eccles, 1994; Gunderson, Ramirez,
Levine et al., 2012).
7.2.3 The link between cognitive and emotional mathematics learning problems.
7.2.3.1 Model of MA development.
The current work allowed me to test some of the predictions of the MA model
proposed by Ashcraft et al (2007) described in 1.2.4. As MA and mathematics performance
were measured in the longitudinally followed sample in Chapter Four and in the large
representative samples of primary and secondary school children in Chapter Five, I could
examine whether MA was closely linked to maths performance deficits, whether some

171
children had maths performance deficits in the absence of MA, and whether children with
adequate mathematical skills were largely unaffected by MA as predicted by the model.
In the current study, children with adequate (at least average) mathematics
performance had lower levels of MA than children with DD (shown in Chapter Four), and
were more likely than children with average performance to have high MA (Chapter Five
revealed that 22% of DD with high MA compared to 11% of typically achieving children).
These results suggest that children with adequate mathematics performance were less
affected by MA than children with DD. These findings more or less accord with Ashcraft et
al's predictions that 1) adequate performance would be related to adequate skill and lower
levels of anxiety and 2) children with deficient skills would be more likely to experience MA.
However, other findings in this thesis suggest that this model oversimplifies the relationships
between mathematical aptitude, MA, and maths performance deficits. Importantly, a
dissociation between MA and maths performance deficits was evident in Chapter Five, which
is not apparent in Ashcraft et al's MA model. That is, in the current work, only one-fifth of
the children with DD actually had high MA as well, and, across the whole sample, the
majority of the children with high MA, in fact, had average or above average performance in
mathematics, suggesting that high MA is common in the absence of mathematics
performance deficits. In Figure 28 I depict an alternative to Ashcraft et al's MA model,
proposing separate paths for children with different skill levels, and showing several potential
pathways to mathematics performance deficits and avoidance. This model is described citing
evidence from the current thesis for the existence of these pathways.
Firstly, for simplicity and to relate the model to the current results, unless otherwise
stated, the MA variable in Figure 28 refers to high levels of MA rather than moderate or low
levels. Furthermore, this modified model makes assumptions about the underlying ability of
the children based on their performance on the measures taken in the current studies. This
model also assumes that MA is the result of cognitive biases, in accord with Ashcraft et al’s
(1997) model.

172
Figure 28. A theoretical model of MA development showing different paths to MA and
maths performance deficits. Pathways of children with average and high maths performance
are also included in this model.

173
In Figure 28 the yellow line shows the likely pathway of children with adequate
(average) mathematics performance, for whom a positive learning history, adequate
motivation levels and WM skills, but no MA, leads to adequate mastery and performance.
This pathway is supported by the finding that nine out of ten control children in Chapter Four
(selected for a control group on the basis of average performance across a range of skills) had
low levels of MA. Furthermore, in Chapter Five, a large proportion of children with average
maths performance had MA below the high MA threshold (this proportion was not reported
in Chapter Five, but the percentage of average performers in mathematics with MA scores
below 30 was 88% [984/1118] of average performing students). The WM findings from
Chapter Four (and the previously published findings in Szűcs et al., 2013) also support the
conjecture that children with average mathematics performance have average WM skills, as
predicted by this model.
Similarly, the green line shows the path of children with high mathematical skill,
WM and motivation, and no MA, leading to excellent mastery of mathematics and
performance. This pathway is supported by the fact that the majority of HM children in
Chapter Four had MA scores at the lower end of the distribution, as did the majority of high-
performing children in Chapter Five (this proportion was not reported in Chapter Five, but
the percentage of high performers in mathematics with MA lower than the high MA threshold
was 96% [334/347] of high performing students). Furthermore, Chapter Four revealed that
the HM children had superior WM and general cognitive abilities. It is also likely that these
children had high levels of motivation, as the majority of the HM children showed
consistently high performance across the longitudinal measures. Importantly, although this
model does not link average and high mathematics performance to high MA, this does not
preclude the development of MA and subsequent performance deficits in some children with
average or high maths abilities. Indeed, inspection of Figure 17 in Chapter Four shows that
one HM and one CON child had moderately higher MA than the rest of their group.
Interestingly, these two children had fairly variable performance over the longitudinal
mathematics measures and they no longer met the performance criteria for their group at
Time 3 (that is, the CON child fell within the DD performance range and the HM child fell
within the CON performance range at Time 3). Thus, it is possible that a reciprocal
relationship between MA and performance existed in these two children, that is, their

174
performance might have been influenced by their moderate levels of MA, and/or an
awareness of their variable performance might have led to higher than expected levels of MA
in these children. Similarly, the results of Chapter Five reveal that 134 children with average
performance and 13 children with high maths performance also had high levels of MA and
many more had moderate levels of MA (see Figure 20B in Chapter Five). Although I cannot
test the direction of these relationships, these results provide evidence for links between MA
and performance in a minority of the average and high performing children.
The solid red line depicts the children with inadequate skill, working memory and/or
motivation (but who do not have high MA) and who have mathematics performance deficits
and a tendency to avoid mathematics. This is path would represent DD children who do not
have high MA, and is supported by finding that 70% of the DD children in Chapter Four and
78% of DD children in Chapter Five did not report high MA. Chapter Four (and the
previously published findings of Szűcs et al., 2013) indicated a link between lower maths
performance and lower working memory performance (however, WM deficits may not be
evident in ALL children with inadequate mathematics skills: Chapter Four suggested that the
average WM performance of DD and control children was comparable). An equal proportion
of girls and boys make up children in this path (evidenced by the equal gender ratio of DD
reported in Chapter Three and Chapter Six). Again, this model does not intend to preclude the
development of MA in children with DD, as maths performance deficits may lead to MA at
some stage or under certain circumstances in DD children, thus a dashed line links maths
performance deficits and avoidance and high MA.
The purple line depicts the children with adequate (at least average) mathematical
skill, WM and motivation, who do report high levels of MA, but who also have adequate
mathematical mastery and performance. Importantly, these children are likely to have
cognitive biases which led to the development of MA. This path is supported by finding that,
in Chapter Five, 10% of the children with at least average mathematics performance also
reported high levels of MA. As girls had higher maths anxiety overall than boys, more girls
make up this group than boys (indeed 62% of the children with at least average maths
performance and high MA in Chapter Five were girls). Although these children did not show
performance deficits on the maths measures in the current study, in line with Ashcraft et al's
predictions, I believe that this group would be at a greater risk of developing mathematics
deficits in the future due to the potential for MA to lead to maths avoidance or interference

175
with performance during mathematical tasks. Thus, a dashed line links MA and maths
performance deficits and avoidance in this group.
Finally, the solid orange line depicts the pathway of children with comorbid DD and
high MA. These children have inadequate mathematical skills, WM and motivation, and have
negative cognitive biases which have jointly led to the development of high MA, resulting in
mathematics performance deficits (and potential avoidance). These children could be referred
to as skills deficit anxious. A dashed line depicts the likely reciprocal relation between MA
and maths performance deficits in this group. Evidence for this path is supported by finding
that 11% of children with DD in Chapter Five also reported high MA and that lower
mathematics performance was associated with lower WM performance (Chapter Four and the
findings of Szűcs et al., 2013). Furthermore, girls were overrepresented in this group
compared to boys. However, I have mapped out an alternative path for these children marked
with the dotted line passing through the adequate skills box. This pathway accounts for the
possibility that my assumption about the underlying ability of the children with DD and MA
is incorrect, and that some children with co-occurring mathematical deficits and MA may
actually have adequate mathematical skills (or may have had adequate skills in the past).
However, this group’s cognitive biases and MA led them to perform more poorly at the time
of assessment either due to maths avoidance (prior to or during the test) or due to cognitive
interference during the test. While this scenario is possible in some of the children in Chapter
Five, it is less likely to have been the case in the longitudinally followed children with DD in
Chapter Four, as these children's mathematical deficits were confirmed across several
measures and time points, thus, we know they had persistent skill deficits. However,
mathematics performance was measured at just one time-point in Chapter Five, and I did not
follow the development of MA or mathematical skills in these children, thus, I cannot know
whether MA or performance deficits occurred first in the causal chain. Nonetheless, the two
orange pathways cover both possibilities, in line with a dynamic systems model (Thelen &
Smith, 1994).
In summary, this model illustrates that the development of MA and associated
performance deficits can take many routes. Furthermore, although MA and performance are
likely to relate reciprocally (e.g., Carey et al., 2016), the results of this thesis have revealed
that MA is not synonymous with poor performance in mathematics, thus different paths are
necessary to depict this dissociation.

176
7.2.3.2. Implications for the classroom.
In contrast to the idea that MA may simply equate to low maths performance, the
results of the current study suggested that many children with DD did not have high levels of
MA. It is not clear why many children with DD are not highly anxious about mathematics,
but it may be related to expectations or the value attached to mathematics (Eccles, 1994).That
is, MA may be related to children's worries about not meeting their own or their socialisers'
expectations (Ho et al., 2000; Wigfield & Meece, 1988). Children with DD may not have
high expectations of themselves with regard to their mathematics performance (or their
socialisers may not have high expectations of them), therefore, some DD children may not
develop anxiety towards mathematics. Similarly, mathematics may not be viewed as
important by children with DD (and/or their parents/peers), thus, they may not get anxious
about poor performance in the subject (Wigfield & Meece, 1988). However, an alternative
explanation could be that some children with DD may not possess the metacognitive skills
necessary to accurately evaluate their mathematics abilities and consequently, they may not
perceive mathematics as anxiety inducing. Past research has revealed metacognitive deficits
in MLD. More specifically, younger children with MLD are less accurate than typically
achieving children in evaluating and predicting their mathematical performance (Garrett,
Mazzocco, & Baker, 2007) and adolescents with learning disabilities are more likely to
overestimate their mathematics performance compared to typically achieving children
(Heath, Roberts, & Toste, 2013). Therefore it is possible that the link between MA and
mathematics performance may be moderated by DD children’s self-perceptions of their
mathematics performance/ability. However, children’s self-perceptions were not measured in
the current work, so I could not test these relationships. Yet, research has suggested that the
relationship between mathematics self-ratings and performance may develop prior to the
relationship between MA and performance in primary school children (Dowker, Bennett &
Smith, 2012); thus, maths self-ratings are important to consider. Further research is needed to
investigate the link between self-perceptions of mathematics ability and MA in children with
DD.
However, the current work revealed that approximately one-fifth of the children with
DD report high levels of MA. As children’s mathematics performance is likely to be
influenced by anxiety during assessment (Ashcraft et al., 2007; Ashcraft & Ridley, 2005),
there is the possibility that highly maths anxious children may have the potential to improve
their mathematics performance, if they are able to combat their MA. Indeed, research has

177
shown that interventions which specifically address MA (rather than mathematics
knowledge) have resulted in mathematics performance benefits (Hembree, 1990; Ramirez &
Beilock, 2011). For example, Hembree (1990) reported that interventions which focussed on
systematic desensitisation or cognitive restructuring resulted in improvements in mathematics
performance. More recently, Ramirez and Beilock also found performance benefits when
participants wrote about their anxieties before an examination. The authors theorised that
writing about one's anxieties before a test reduces the need to worry during the test, which
decreases rumination and frees up working memory resources, thereby improving
performance on the test. Mindfulness is thought to function similarly, in that mindful
individuals are more able to attend to a test because they devote less attention and WM
resources to focusing on negative anxieties (Bellinger, DeCaro & Ralston, 2015). Although
mindfulness training has not been trialled as an intervention for MA yet, Bellinger et al
(2015) found that dispositional mindfulness indirectly improved arithmetic performance both
in the classroom and in a high stakes test simulation, via the reduction of state anxiety during
the assessments. The results of intervention studies suggest that test performance can be
improved by reductions in maths and/or test anxiety, thus, is it possible that some of the DD
children with comorbid high MA may be able to improve their performance by overcoming
or reducing MA, to the point that they may no longer meet DD diagnostic criteria. Therefore,
identifying MA in the classroom is essential so that children can be equipped with
appropriate coping strategies for dealing with anxious reactions towards mathematics,
particularly around assessment.
The current findings challenge the suggestion that deficits in basic numerical
processing underlie MA (e.g., Maloney et al., 2010; 2011), as here the current results suggest
that although there is some degree of overlap between them, MA and numerical deficits
(characteristic of DD) are dissociable and are likely to require different types of intervention.
Children affected by MA, or co-occurring MA and DD are likely to benefit from the types of
interventions outlined above, rather than interventions focusing on the improvement of
mathematical skills. Indeed, Hembree’s (1990) meta-analysis of MA studies revealed that
interventions for MA that focus on the cognitive aspects of anxiety were more effective than
interventions that attempted to reduce MA through maths tuition or curricular changes.
Moreover, the abovementioned interventions which focussed on relieving the cognitive
symptoms of anxiety, particularly those which are purported to free up WM resources, have
shown promising results for the relief of anxiety and improvement of performance. On the

178
other hand, children with DD who do not have negative emotional reactions towards
mathematics are likely to benefit from interventions that target the development of
mathematical skills, working memory and visuo-spatial processing. Indeed, several
intervention studies targeting these skills have shown improvements in mathematics (e.g.,
Holmes & Dowker, 2013; Holmes, Gathercole & Dunning, 2009; Wißmann, Heine, Handl, &
Jacobs, 2013). Nonetheless, children with DD are also likely to benefit from the
encouragement of positive attitudes towards mathematics, which may, for example, foster
engagement with maths, or encourage children to persist with maths in spite of difficulty with
the subject and may even mitigate the development of anxiety towards maths in the future.
However, it should be noted that the majority of the studies investigating the abovementioned
interventions (for MA and cognitive skills) have measured the immediate or short-term
effects of the interventions for alleviating anxiety and improving mathematics performance;
thus, it remains to be seen whether these interventions also show long-term effects. Further
research is needed to investigate whether a discrete course of intervention is sufficient or
whether on-going intervention is necessary to see improvement in anxiety symptoms and
mathematics performance across the school years.
Although it is likely that MA is triggered by past poor performance in some cases
(for example, potentially in some children with DD and high MA), the current research shows
that a much greater proportion of children with high MA have typical mathematical
performance. This is also apparent in the observation that the most conspicuous feature of the
correlation between MA and mathematics performance seems to be a drop in the number of
mathematically high achieving children rather than an increase in the number of very poor
achievers. These findings suggest that many children who are performing adequately in
maths may, in fact, be struggling with MA. These children may “slip under the radar” if
teachers and parents/caregivers rely on mathematics achievement as a measure of children’s
mathematical wellbeing. Competent mathematicians with high MA still run the risk of
developing further negative attitudes towards mathematics, potentially leading to maths
avoidance and drop-out from mathematics classes in the future (Ashcraft, 2002; Hembree,
1990; Ma, 1999). Evidence also suggests that the MA-performance association may function
reciprocally or as a vicious circle (Carey et al., 2016, Cargnelutti et al., 2017). Thus, even if
students with high MA are performing within the average range at one time-point, MA may
lead to poorer educational outcomes in the future. The current findings, therefore, emphasise
the importance of identifying MA in children of all ability levels and I suggest that

179
attendance to children’s affective reactions during mathematics learning should be considered
an essential element of educational provision.
7.3 Research limitations
There are several limitations to the studies included in this thesis, several of which
have already been mentioned in the discussions of Chapters Two to Six. Here I will address
the limitations of the research as a whole. Firstly, although the sample sizes in the screening
datasets included 839-1004 students, caution must be exercised when making claims about
the general population based on studies with samples of this size. It is possible that the
prevalence estimates (for DD and comorbid DD and MA), and patterns of gender differences,
would differ in larger samples, or in different age groups. Although we aimed for nationally-
representative samples of students at both school levels, the samples were still dependent on
schools that were located within a reasonable travel radius of Cambridge opting into the
projects. Consequently, the schools involved in both projects were mainly located in the East
of England. Indeed the DfE reported some regional variability in performance on the national
curriculum assessments at Key Stage 2 and at GCSE level in England and Wales (DfE, 2014;
DfE, 2016), thus, the prevalence of DD, comorbid DD and MA, and gender differences found
in the current studies may not extend to other regions of the UK.
As mentioned previously, another limitation of the testing procedure employed during
the screening phase of both Project 1 and Project 2 was that we could not measure other skills
such as IQ, spelling abilities, or phonological decoding, due to time and cost constraints
related to the large sample sizes. This meant that DD was defined based on only one control
measure (reading). However, as noted earlier, most of the previous DD demographic studies
used only one control variable and only one study included more than one control variable
(Lewis et al., 1994), yet some did not include a control measure at all. It is likely that if we
had included an additional control measure, such as IQ, or a different control measure, such
as decoding ability, in our DD diagnostic criteria at screening, the prevalence of DD may
have differed (Lewis et al., 1994). Similarly, the proportion of children with persistent DD
was defined on the basis of reading and mathematics performance at Time 3. If an additional
control variable such as IQ was also taken into account at Time 3, then the prevalence of
persistent DD might have been lower than the 66/80% estimated in Chapter Four.
Another limitation of the DD prevalence analysis (Chapters Two and Three) is that
there was no longitudinal follow-up of the whole screening sample, which would have

180
enabled an analysis of DD stability across the whole sample (similar to the analysis of
Mazzocco and Myers, 2003) rather than the analysis of DD stability within a smaller, selected
sample. Again, this was due to time and cost restraints of the project. Similarly, it was
unfortunate that MA was not measured longitudinally in the sample analysed in Chapter
Four. It was originally planned that MA would be measured during the screening phase of
Project 1, however some schools objected to us introducing the concept of anxiety towards
mathematics and testing situations at such a young age (the majority of the children in Project
1 were in Year 3 at the outset of the study and had not participated in many tests by that age)
thus, the MA measures were dropped from this phase of Project 1.
Although the current results showed that MA is not always associated with maths
learning problems, the pathways outlined in the theoretical model shown in Figure 28 are
purely speculative. The study described in Chapter Five was not longitudinal, thus I could not
determine the direction of the relationship between mathematics performance deficits and
MA in the children with comorbid maths problems, nor was I able to make any claims about
development with the cross-sectional design. Similarly, the current work did not measure
other variables which potentially cause or interact with MA, nor did it assess other variables
influencing the development of gender differences in mathematics. Such variables include
liking of mathematics, ability self-ratings, self-efficacy, confidence and value students attach
to mathematics (Dowker et al., 2012; Eccles, 1994; Wigfield & Meece, 1988). Longitudinal
studies would enable these relationships to be tested, however, such a design was outside of
the scope of the current work.
7.4 Directions for future research
The results of the current thesis suggest several lines of future research, the most
obvious being the longitudinal investigation of the development of mathematical skills and
anxiety as mentioned above. If a large sample of children was followed, techniques such as
Structural Equation Modeling (SEM) could be used to investigate likely causal pathways
between variables. SEM has previously proven to be useful in elucidating the likely causal
pathways between MA, performance, gender, and other factors, such as perception of
controllability, in child samples (Zirk-Sadowski et al., 2014). Moreover, if the development
of mathematical skills and attitudes was followed from a relatively young age up until GCSE
level, then it would be possible to see the development and nature of MA at different ages

181
and in response to experiences such as the transition from primary to secondary school or
high-stakes examinations.
As mentioned in the discussion of Chapter Four, mathematics was assessed as a single
entity, which was the case for all of the studies described in the current thesis. Investigating
mathematics as a constellation of abilities rather than a single ability would enable many
other research questions to be investigated. For example, possible avenues of research include
investigating whether differential relationships exist between MA and different mathematical
abilities (Dowker, 2005). Importantly, children with mathematical difficulties have shown
strengths and weaknesses in different mathematical skills (Russell & Ginsburg, 1984). For
example, fourth-grade children with MD have been shown to perform similarly to age-
matched control children on some tasks assessing estimation and base-ten knowledge, yet
these MD children were impaired in some arithmetic operations, retrieval of arithmetic facts
and tasks involving larger numbers (ibid). Similarly, research comparing the mathematics
performance of children with and without phonological difficulties has revealed that
phonological difficulties are associated with impairments in some formal mathematical
abilities, but are not as likely to be associated with impairments in informal mathematical
skills (Jordan, Wylie & Mulhern, 2010). As mentioned in the discussion of Chapter Two,
measures of phonological decoding were not administered in the current studies, thus, other
important areas of investigation include measuring the relationships between different
mathematical abilities and MA in children with different MD subtypes (including those with
comorbid phonological processing or reading difficulties).
Qualitative research in MA (and MLD) is relatively lacking, however qualitative
work is important as it may reveal more detailed information about the relationship between
MA and performance which may not be apparent in path analysis methods like SEM. For
example, it is possible that some individuals may develop MA in response to past
performance deficits and some may perform poorly in mathematics due to MA interference,
whereas other children may develop MA and maths performance deficits at the same time.
When additional factors are taken into account, the potential causal pathways would likely
become even more complex (Ahmed et al., 2012; Jain & Dowson, 2009). Therefore,
complementing quantitative measures with qualitative ones such as interviews or classroom
observations, and conducting quantitative analysis at the level of the individual may allow for
a more detailed understanding of individual differences in the MA-performance relationship,

182
the origins of MA, and potential mediating variables. The current results suggested that some
children did not experience anxiety about their mathematics problems, thus, evaluation of
children's self-competence beliefs (e.g., self-concept, self-efficacy) may clarify why this is
the case. Indeed the work of Eccles and colleagues has shown that a child's self-concept of
ability and their interpretations of their achievement- related experiences are important
factors in the development of a child's subjective task value, expectation of success and
achievement-related choices (Eccles, 1994). Thus the relation of these factors to MA is of
interest. Recent qualitative research has suggested that MA develops in response to early
classroom experiences, manifesting as numeracy apprehension in the early school years
(Petronzi, 2016). Observations from teachers and parents collected in that study suggest that
the current testing culture in the UK may be contributing to the onset of the development of
numeracy apprehension in young children, among other factors (ibid). Indeed, one of the
aims of the linked funded project (Project 2) was to investigate the potential causal origins of
MA by conducting qualitative interviews in selected samples of children from the screening
sample in Chapters Five and Six; however, at the time of writing this thesis, the qualitative
analysis was still in progress and the findings were yet to be published.
As mentioned previously, DD has been linked to WM deficits, particularly in VSWM
(e.g., Bull et al., 2008; Geary, 2004; Hitch & McAuley; 1991; Keeler & Swanson, 2001;
Passolunghi & Siegel, 2001, 2004). Similarly, MA is thought to interfere with WM processes
during mathematics performance (Ashcraft & Krause, 2007; Ashcraft, Krause, & Hopko,
2007). Prior research has investigated WM deficits in children with MA and DD and revealed
a dissociation in the type of WM deficit present in each group (Mammarella, Hill, Devine,
Caviola, & Szűcs, 2015). Compared to typically developing children, DD children
specifically showed VSWM deficits, whereas children with MA showed verbal WM deficits.
A closer analysis of children with DD who also had high MA revealed that this group showed
poorer verbal and VSWM performance than typically developing children. However, this
analysis was conducted on fairly small samples (N = 11 in the group with DD and MA).
Further research could investigate WM deficits in a larger group of children with comorbid
DD and MA and also investigate whether WM training, in combination with interventions
that focus on the treatment of the anxiety (such as the ones described earlier in section
7.2.3.3) improves the mathematics performance of children with comorbid DD and MA.

183
MA is probably more likely to be alleviated if it is identified early before negative
attitudes have begun to influence performance or set off a vicious cycle. Although several
scales have been developed for use with young children, there is a lack of research
investigating the utility of such measures for the identification of MA in the classroom so that
teachers can begin to address it. Future work could investigate how teachers could use these
scales and whether they provide more information than teachers’ own observations of the
children’s behaviours and attitudes. It is possible that self-report scales may reveal underlying
attitudes that teachers are not normally privy to, however, teachers’ observations are also
likely to pick up on more subtle behavioural manifestations of anxiety in young children that
may not be covered by self-report scales, for example, off-task behaviours and other maths
avoidance strategies. Thus these diagnostic approaches are likely to complement one another.
7.5 Conclusions
The primary goal of this thesis was to examine the link between cognitive and
emotional mathematics learning problems. The work in this thesis is unique in that it is the
first study to systematically measure the relation between mathematics learning problems and
MA in large samples of school children. The secondary goal of the current thesis was to
investigate gender differences in DD and MA.
Systematic variation of maths and reading performance thresholds revealed that the
prevalence of DD ranged between 0.89-17.23% depending on the mathematics performance
threshold used. We used an operational definition of DD, setting reading and maths
performance thresholds at 1 SD below the mean, and found that 5.6% of children were
affected. This prevalence rate was confirmed in separate samples and suggests that
approximately 6% of UK school children are affected by DD. Longitudinal follow-up of a
smaller sample of children with DD showed that including additional measures of
mathematics, reading and IQ in the diagnostic criteria identified a group of children with
severe and persistent DD. Approximately 80% of these children met the criteria for DD
approximately two years after diagnosis. In the context of the wider DD literature, these
results suggest that researchers should come to an agreement about the diagnostic criteria for
DD in order to ensure that they are studying similar samples so that findings can be integrated
across studies. Agreeing upon a definition of DD would not necessarily require agreement on
the theoretical origins of DD, as DD could merely be defined operationally, as we did in the

184
current work. These results also suggest that DD should be measured using several
assessments of mathematics as well as multiple control measures.
MA scores were not normally distributed, thus, high MA was defined as scores at or
above the 90th percentile for the sample, rather than using SD definitions as other researchers
have done in previous studies. The finding that MA scores were not normally distributed
coincides with several recent studies showing that MA is not normally distributed in adults
and secondary school samples. These results suggest that MA may not, in fact, be normally
distributed, at least using the scales currently used in the field, thus, SD definitions should not
be used to define discrete groups of children with differing MA levels.
MA levels were higher in children with DD than in children with average or above
average mathematics performance; however, these results were restricted to small, selected
samples. The prevalence of co-occurrence of DD and high maths anxiety was estimated in a
larger sample using the abovementioned definitions. Relatively few children with DD had
high maths anxiety and the majority of students with high maths anxiety, in fact, had
mathematics performance within or above the average range, suggesting that MA is not just
restricted to children with poor maths performance. Moreover, these results suggest several
different potential pathways to MA and maths performance deficits. Furthermore, because
cognitive and emotional mathematics problems are dissociable, they likely require different
types of intervention. Whereas DD children would likely benefit from interventions which
focus on the improvement of mathematical skills, WM or spatial skills, previous research has
suggested that children with MA may benefit from interventions that focus on alleviating
anxiety rather than targeting cognitive skills. Future studies could further test this possibility.
Throughout this thesis, there was little evidence of gender differences in mathematics
performance at the primary or secondary school level. Moreover, when absolute performance
thresholds were used to define DD, there was no gender difference in DD prevalence. These
results suggest that gender differences in maths performance are non-existent at the primary
and early secondary school level. However at both school levels, girls had higher MA than
boys, and more girls were affected by co-occurring DD and MA than were boys. Higher MA
in girls may be a potential explanation for the underrepresentation of females in careers
involving mathematics.

185
Collectively, the results of the current thesis contribute to the existing body of
mathematical cognition research suggesting a complex interaction between the motivational,
cognitive and emotional factors associated with learning mathematics. To ensure
mathematical well-being in all children, educators must pay attention to all facets of
mathematics learning.

186
References
Aarnos, E., & Perkkilä, P. (2012). Early signs of mathematics anxiety? Procedia - Social and
Behavioral Sciences, 46, 1495–1499. doi:10.1016/j.sbspro.2012.05.328
Abed, A. S., & Alkhateeb, H. M. (2001). Mathematics anxiety among eighth-grade students
of the United Arab Emirates. Psychological Reports, 89, 65–66.
doi:10.2466/pr0.2001.89.1.65
Ahmed, W., Minnaert, A., Kuyper, H., & van der Werf, G. (2012). Reciprocal relationships
between math self-concept and math anxiety. Learning and Individual Differences,
22, 385–389. doi:10.1016/j.lindif.2011.12.004
Alexander, L., & Martray, C. (1989). The development of an abbreviated version of the
Mathematics Anxiety Rating Scale. Measurement and Evaluation in Counselling and
Development, 22, 143–50.
Alloway, T. P. (2007). Automated Working Memory Assessment (AWMA), First Edition.
Pearson Assessment.
American Psychiatric Association. (2000). Diagnostic and statistical manual of mental
disorders DSM-IV-TR fourth edition (text revision).
American Psychiatric Association (2016). https://www.psychiatry.org/patients-
families/specific-learning-disorder/what-is-specific-learning-disorder
Appel, M., Kronberger, N., & Aronson, J. (2011). Stereotype threat impedes ability building:
Effects on test preparation among women in science and technology. European
Journal of Social Psychology, 41(January), 904–913. doi:10.1002/ejsp.835
Ashcraft, M. H. (2002). Math anxiety: Personal, educational, and cognitive consequences.
Current Directions in Psychological Science, 11, 181–185. doi:10.1111/1467-
8721.00196
Ashcraft, M. H., & Faust, M. (1994). Mathematics anxiety and mental arithmetic
performance: An exploratory investigation. Cognition & Emotion, 8, 97–125.
doi:10.1080/02699939408408931

187
Ashcraft, M. H., & Kirk, E. P. (2001). The relationships among working memory, math
anxiety, and performance. Journal of Experimental Psychology General, 130, 224–
237. doi:10.1037/0096-3445.130.2.224
Ashcraft, M. H., & Krause, J. A. (2007). Working memory, math performance, and math
anxiety. Psychonomic Bulletin & Review, 14, 243–248. doi:10.3758/BF03194059
Ashcraft, M. H., Krause, J. A., & Hopko, D. R. (2007). Is math anxiety a mathematical
learning disability? In D. B. Berch & M. M. M. Mazzocco (Eds.), Why is math so
hard for some children? The nature and origins of mathematical learning difficulties
and disabilities. (pp. 329–348). Baltimore, MD: Paul H. Brookes Publishing.
Ashcraft, M. H., & Moore, A. M. (2009). Mathematics anxiety and the affective drop in
performance. Journal of Psychoeducational Assessment, 27, 197–205.
doi:10.1177/0734282908330580
Ashcraft, M. H., & Ridley, K. S. (2005). Math anxiety and its cognitive consequences: A
tutorial review. In J. I. D. Campbell (Ed.), Handbook of Mathematical Cognition (pp.
315– 327). New York, NY: Psychology Press.
Askenazi, S., & Henik, A. (2010). Attentional networks in developmental dyscalculia.
Behavioral and Brain Functions: BBF, 6, 2. doi:10.1186/1744-9081-6-2
Baddeley, A. D., & Hitch, G. J. (1974). Working memory. The psychology of learning and
motivation, 8, 47–89. New York, NY: Academic Press
Badian, N. (1983). Dyscalculia and nonverbal disorders of learning. Progress in Learning
Disabilities, Vol. 5, (pp. 235–264). New York: Grune & Stratton.
Badian, N. (1999). Persistent arithmetic, reading, or arithmetic and reading disability. Annals
of Dyslexia, 49, 43–70. doi:10.1007/s11881-999-0019-8
Bai, H. (2011). Cross-Validating a Bidimensional Mathematics Anxiety Scale. Assessment,
18, 115–122. doi:10.1177/1073191110364312
Bailey, D. H., Watts, T. W., Littlefield, A. K., & Geary, D. C. (2014). State and trait effects
on individual differences in children’s mathematical development. Psychological
Science, 25, 2017–2026. doi:10.1177/0956797614547539

188
Baloglu, M. (1999). A Comparison of mathematics anxiety and statistics anxiety in relation to
general anxiety. Eric Document Reproduction Service No. 436703. Retrieved from
papers3://publication/uuid/3A1F8705-83C9-4A83-8D8F-6810047527E7
Bander, R. S., & Betz, N. E. (1981). The relationship of sex and sex role to trait and
situationally specific anxiety types. Journal of Research in Personality, 15, 312–322.
doi: 10.1016/0092-6566(81)90029-5
Barahmand, U. (2008). Arithmetic disabilities: Training in attention and memory enhances
arithmetic ability. Research Journal of Biological Sciences, 3, 1305–1312.
Barbaresi, W. J., Katusic, S. K., Colligan, R. C., Weaver, A. L., & Jacobsen, S. J. (2005).
Math learning disorder: incidence in a population-based birth cohort, 1976-82,
Rochester, Minn. Ambulatory Pediatrics: The Official Journal of the Ambulatory
Pediatric Association, 5, 281–289. doi:10.1367/A04-209R.1
Baudonck, M., Debusschere, A., Dewulf, B., Samyn, F., Vercaemst, V., & Desoete, A.
(2006). De Kortrijkse rekentest revision KRT-R. Kortrijk: CAR Overleie.
Bauermeister, J. J., Shrout, P. E., Chávez, L., Rubio-Stipec, M., Ramírez, R., Padilla, L., …
Canino, G. (2007). ADHD and gender: are risks and sequela of ADHD the same for
boys and girls? Journal of Child Psychology and Psychiatry, and Allied Disciplines,
48, 831–839. doi:10.1111/j.1469-7610.2007.01750.x
Baya’a, N. F. (1990). Mathematics anxiety, mathematics achievement, gender, and socio-
economic status among Arab secondary students in Israel. International Journal of
Mathematical Education in Science and Technology, 21, 319–324.
doi:10.1080/0020739900210221
Beilock, S. L., Gunderson, E. A, Ramirez, G., & Levine, S. C. (2010). Female teachers’ math
anxiety affects girls' math achievement. Proceedings of the National Academy of
Sciences of the United States of America, 107, 1860–1863.
doi:10.1073/pnas.0910967107
Bekdemir, M. (2010). The pre-service teachers’ mathematics anxiety related to depth of
negative experiences in mathematics classroom while they were students. Educational
Studies in Mathematics, 75, 311–328. doi:10.1007/s10649-010-9260-7

189
Bellinger, D. B., Decaro, M. S., & Ralston, P. A. S. (2015). Mindfulness, anxiety, and high-
stakes mathematics performance in the laboratory and classroom. Consciousness and
Cognition, 37, 123–132. doi:10.1016/j.concog.2015.09.001
Benbow, C. P., & Stanley, J. C. C. (1980). Sex differences in mathematical ability: Fact or
artifact? Science, 210, 1262–1264. doi:10.1126/science.7434028
Benton, T. (2015, October). Research: Attitudes to learning - questioning the PISA data.
Paper presented at Gender differences – the impact of secondary schooling - boys or
girls, who’s winning? Cambridge Assessment Conference, London. Retrieved from:
http://www.cambridgeassessment.org.uk/events/gender-differences-conference-2015/
Bernaards, C. A., & Jennrich, R. I. (2005). Gradient projection algorithms and software for
arbitrary rotation criteria in factor analysis. Educational and Psychological
Measurement, 65, 676–696. doi:10.1177/0013164404272507
Bernstein, J. D., Reilly, L. B., & Cote-Bonanno, J. F. (1992). Barriers to women entering the
workforce: Math anxiety. New Jersey Equity Research Bulletin, 3, 3–6. Retrieved
from http://eric.ed.gov/ERICWebPortal/recordDetail?accno=ED359381
Betz, N. E. (1978). Prevalence, distribution, and correlates of math anxiety in college
students. Journal of Counseling Psychology, 25, 441–448. doi:10.1037/0022-
0167.25.5.441
Biaggio, M. K., & Nielsen, E. C. (1976). Anxiety correlates of sex-role identity. Journal of
Clinical Psychology, 32, 619–623. doi: 10.1002/1097-4679(197607)32:3<619::AID-
JCLP2270320329>3.0.CO;2-G
Bieg, M., Goetz, T., & Lipnevich, A. A. (2014). What students think they feel differs from
what they really feel - Academic self-concept moderates the discrepancy between
students’ trait and state emotional self-reports. PLoS ONE, 9, e92563.
doi:10.1371/journal.pone.0092563
Bieg, M., Goetz, T., Wolter, I., & Hall, N. C. (2015). Gender stereotype endorsement
differentially predicts girls’ and boys' trait-state discrepancy in math anxiety.
Frontiers in Psychology, 6, 1404. doi:10.3389/fpsyg.2015.01404

190
Bindak, R. (2005). İlköğretim Öğrencileri için Matematik Kaygı Ölçeği. [Mathematics
anxiety scale for elementary school students]. Fırat Ün. Fen ve Mühendislik Bilimleri
Dergisi, 17, 442-448. Retrieved from: http://docplayer.biz.tr/8468225-Ilkogretim-
ogrencileri-icin-matematik-kaygi-olcegi-math-anxiety-scale-for-elementary-school-
students.html
Birgin, O., Baloğlu, M., Çatlıoğlu, H., & Gürbüz, R. (2010). An investigation of mathematics
anxiety among sixth through eighth grade students in Turkey. Learning and
Individual Differences, 20, 654–658. doi:10.1016/j.lindif.2010.04.006
Blajenkova, O., Kozhevnikov, M., & Motes, M. a. (2006). Object-spatial imagery: A new
self-report imagery questionnaire. Applied Cognitive Psychology, 20, 239–263.
doi:10.1002/acp.1182
Blatchford, P. (1996). Pupils’ views on school work and school from 7 to 16 years. Research
Papers in Education, 11, 263–288. doi:10.1080/026715296011030
Bramley, T., Rodeiro, C. V., & Vitello, S. (2015). Gender Differences in GCSE. Cambridge
Assessment Research Report. Cambridge, UK: Cambridge Assessment. Retrieved
from: http://www.cambridgeassessment.org.uk/our-research/all-published-
resources/research-reports/
Brown, L. A., Forman, E. M., Herbert, J. D., Hoffman, K. L., Yuen, E. K., & Goetter, E. M.
(2011). A randomized controlled trial of acceptance-based behavior therapy and
cognitive therapy for test anxiety: A pilot study. Behavior Modification, 35, 31–53.
doi:10.1177/0145445510390930.
Brush, L. R. (1978). A validation study of the mathematics anxiety rating scale (MARS).
Educational and Psychological Measurement, 38, 485–490.
Bull, R., Espy, K. A., & Wiebe, S. A. (2008). Short-term memory, working memory, and
executive functioning in preschoolers: Longitudinal predictors of mathematical
achievement at age 7 years. Developmental Neuropsychology, 33, 205–228.
doi:10.1080/87565640801982312
Bull, R., Johnston, R. S., & Roy, J. A. (1999). Exploring the roles of the visual‐spatial sketch
pad and central executive in children’s arithmetical skills: Views from cognition and

191
developmental neuropsychology. Developmental Neuropsychology, 15, 421–442.
doi:10.1080/87565649909540759
Bursal, M., & Paznokas, L. (2006). Mathematics anxiety and preservice elementary teachers’
confidence to teach mathematics and science. School Science and Mathematics, 104,
173–180. doi:10.1111/j.1949-8594.2006.tb18073.x
Buss, D. M., & Schmitt, D. P. (1993). Sexual strategies theory: an evolutionary perspective
on human mating. Psychological Review, 100, 204–232.
Bussey, K., & Bandura, A. (1999). Social cognitive theory of gender development and
differentiation. Psychological Review, 106, 676–713. doi:10.1037/0033-
295X.106.4.676
Butterworth, B. (1999). The Mathematical Brain. London: MacMillan.
Butterworth, B. (2003). Dyscalculia screener. London, England: NferNelson.
Butterworth, B. (2005). Developmental dyscalculia. In J. I. D. Campbell (Ed.), Handbook of
Mathematical Cognition (Vol. 93, pp. 455 – 467). New York, NY: Psychology Press.
Butterworth, B., & Reigosa-Crespo, V. (2007). Information processing deficits dyscalculia.
In D. B. Berch & M. M. M. Mazzocco (Eds.), Why is math so hard for some children?
The nature and origins of mathematical learning difficulties and disabilities. (pp. 65–
81). Baltimore, MD: Paul H. Brookes Publishing.
Carey, E., Hill, F., Devine, A., & Szűcs, D. (2016). The chicken or the egg? The direction of
the relationship between mathematics anxiety and mathematics performance.
Frontiers in Psychology, 6, 1987. doi:10.3389/fpsyg.2015.01987
Carey, E., Devine, A., Hill, F., & Szűcs, D. (2017a). Differentiating anxiety forms and their
role in academic performance from primary to secondary school. PLoSONE, 12:
e0174418. doi:10.1371/journal.pone.0174418
Carey, E., Hill, F., Devine, A., & Szűcs, D. (2017b). The modified abbreviated math anxiety
scale: a valid and reliable instrument for use with children. Frontiers in Psychology,
8: 11. doi: 10.3389/fpsyg.2017.00011

192
Cargnelutti, E., Tomasetto, C., & Passolunghi, M. C. (2017). How is anxiety related to math
performance in young students? A longitudinal study of Grade 2 to Grade 3 children.
Cognition and Emotion. doi:10.1080/02699931.2016.1147421
Chang, S., & Cho, S. (2013). Development and validation of the Korean mathematics anxiety
rating scale for college students. Journal of the Korean Data Analysis Society, 15,
1955–1969.
Chinn, S. (2009). Mathematics anxiety in secondary students in England. Dyslexia, 68, 61–
68. doi:10.1002/dys.381
Chiu, L., & Henry, L. L. (1990). Development and validation of the mathematics anxiety
scale for children. Measurement and Evaluation in Counseling and Development, 23,
121–127.
Cieslik, E. C., Zilles, K., Grefkes, C., & Eickhoff, S. B. (2011). Dynamic interactions in the
fronto-parietal network during a manual stimulus-response compatibility task.
NeuroImage, 58, 860–869. doi:10.1016/j.neuroimage.2011.05.089
Cipora, K., Szczygiel, M., Willmes, K., & Nuerk, H.-C. (2015). Math anxiety assessment
with the abbreviated math anxiety scale: Applicability and usefulness: Insights from
the Polish adaptation. Frontiers in Psychology, 6.
http://doi.org/10.3389/fpsyg.2015.01833
Collins, D. W., & Kimura, D. (1997). A large sex difference on a two- dimensional mental
rotation task. Behavioral Neuroscience, 111, 845– 849. doi:10.1037/0735-
7044.111.4.845
Connolly, A. J. (1998). The key math revised: A diagnostic inventory of essential
mathematics manual. Circle Pines, MN: American Guidance Service.
Coull, J. T., & Frith, C. D. (1998). Differential activation of right superior parietal cortex and
intraparietal sulcus by spatial and nonspatial attention. NeuroImage, 8, 176–187.
doi:10.1006/nimg.1998.0354
Culham, J. C., & Kanwisher, N. G. (2001). Neuroimaging of cognitive functions in human
parietal cortex. Current Opinion in Neurobiology, 11, 157–163.

193
Davis, N., Cannistraci, C. J., Rogers, B. P., Gatenby, J. C., Fuchs, L. S., Anderson, A. W., &
Gore, J. C. (2009). Aberrant functional activation in school age children at-risk for
mathematical disability: A functional imaging study of simple arithmetic skill.
Neuropsychologia, 47, 2470–2479. doi:10.1016/j.neuropsychologia.2009.04.024
Davranche, K., Nazarian, B., Vidal, F., & Coull, J. (2011). Orienting attention in time
activates left intraparietal sulcus for both perceptual and motor task goals. Journal of
Cognitive Neuroscience, 23, 3318–3330. doi:10.1162/jocn_a_00030
Dede, Y. (2008). Mathematics anxiety questionnaire: Development and validation. Essays in
Education, 23.
Dehaene, S., Molko, N., Cohen, L., & Wilson, A. J. (2004). Arithmetic and the brain. Current
Opinion in Neurobiology, 14, 218–224. doi:10.1016/j.conb.2004.03.008
Dennis, M., Francis, D., Cirino, P., Barnes, M., & Fletcher, J. (2009). Why IQ is not a
covariate in cognitive studies of neurodevelopmental disorders. Journal of International
Neuropsychological Society, 15(3), 331–343. doi:10.1017/S1355617709090481
Department for Education (2014). National Statistics Publication. Statistical First Release.
Early Years Foundation Stage Profile results England, 2013/14, 1–14 (2014).
Department for Education. (2015a). Impact Indicator 7: Attainment gap at age 11 between
free school meal pupils and their peers. Retrieved January 13, 2016, from
https://www.gov.uk/government/uploads/system/uploads/attachment_data/file/404714
/KS2_Impact_indicator_7.pdf
Department for Education. (2015b). School and college performance tables. Retrieved from
http://www.education.gov.uk/schools/performance/index.html
Department for Education (2016). https://www.compare-school-performance.service.gov.uk/
Department for Education and Skills. (2006). Gender and education: the evidence on pupils
in England. Nottingham, UK: DfES Publications.
De Smedt, B., Noël, M.-P., Gilmore, C., & Ansari, D. (2013). How do symbolic and non-
symbolic numerical magnitude processing skills relate to individual differences in

194
children’s mathematical skills? A review of evidence from brain and behavior. Trends
in Neuroscience and Education, 2, 48–55. doi:10.1016/j.tine.2013.06.001
Desoete, A., & Roeyers, H. (2000). Rekenstoornissen bij negenjarigen: Bepalen de tests de
diagnose? [Mathematics learning disabilities in nine- year-olds: Does the chosen test
determine the diagnosis?]. Diagnostiekwijzer, 4, 3-16
Desoete, A., Roeyers, H., & De Clercq, A. (2004). Children with mathematics learning
disabilities in Belgium. Journal of Learning Disabilities, 37, 50–61.
Desoete, A., Ceulemans, A., De Weerdt, F., & Pieters, S. (2012). Can we predict
mathematical learning disabilities from symbolic and non-symbolic comparison tasks
in kindergarten? Findings from a longitudinal study. The British Journal of
Educational Psychology, 82, 64–81. doi:10.1348/2044-8279.002002
Devine, A., Fawcett, K., Szűcs, D., & Dowker, A. (2012). Gender differences in mathematics
anxiety and the relation to mathematics performance while controlling for test
anxiety. Behavioral and Brain Functions : BBF, 8, 33. doi:10.1186/1744-9081-8-33
Devine, A., Soltész, F., Nobes, A., Goswami, U., & Szűcs, D. (2013). Gender differences in
developmental dyscalculia depend on diagnostic criteria. Learning and Instruction,
27, 31–39. doi:10.1016/j.learninstruc.2013.02.004
De Vos, T. (1992). TTR: Tempotest rekenen [Arithmetic number facts test]. Lisse,
Netherlands: Swets & Zeitlinger.
Dew, K. H., & Galassi, J. P. (1983). Mathematics anxiety: Some basic issues. Journal of
Counseling Psychology, 30, 443–446. doi:10.1037/0022-0167.30.3.443
Dietrich, J. F., Huber, S., Moeller, K., & Klein, E. (2015). The influence of math anxiety on
symbolic and non-symbolic magnitude processing. Frontiers in Psychology, 6, 1621.
doi:10.3389/fpsyg.2015.01621
Dirks, E., Spyer, G., van Lieshout, E. C. D. M., & de Sonneville, L. (2008). Prevalence of
combined reading and arithmetic disabilities. Journal of Learning Disabilities, 4,
460–73. doi:10.1177/0022219408321128
Dowker, A. (2005). Individual Differences in Arithmetic: Implications for Psychology,
Neuroscience and Education. Hove: Psychology Press.

195
Dowker, A. (2016). Factors that influence improvement in numeracy, reading, and
comprehension in the context of a numeracy intervention. Frontiers in Psychology, 7.
doi:10.3389/fpsyg.2016.01929
Dowker, A., Bennett, K., & Smith, L. (2012). Attitudes to mathematics in primary school
children. Child Development Research, 2012, 124939. doi:10.1155/2012/124939
Dowker, A., Sarkar, A., & Looi, C. Y. (2016). Mathematics anxiety: what have we learned in
60 Years? Frontiers in Psychology, 7, 508. doi:10.3389/fpsyg.2016.00508
Eagly, A. H., & Wood, W. (1999). The origins of sex differences in human behavior: evolved
dispositions versus social roles. American Psychologist, 54, 408–23
Eccles, J. S. (1994). Understanding women’s educational and occupational choices: Applying
the Eccles et al. model of achievement-related choices. Psychology of Women
Quarterly, 18, 585–609. doi:10.1111/j.1540-4560.2011.01718.x
Eccles, J. S., & Jacobs, J. E. (1986). Social forces shape math attitudes and performance.
Signs: Journal of Women in Culture and Society, 11, 367–380. doi:10.1086/494229
Eden, C., Heine, A., & Jacobs, A. M. (2013). Mathematics anxiety and its development in the
course of formal schooling — A review. Psychology, 4, 27–35.
doi:10.4236/psych.2013.46A2005
Else-Quest, N. M., Hyde, J. S., & Linn, M. C. (2010). Cross-national patterns of gender
differences in mathematics: a meta-analysis. Psychological Bulletin, 136, 103–127.
doi:10.1037/a0018053
Erturan, S., & Jansen, B. (2015). An investigation of boys’ and girls’ emotional experience of
math, their math performance, and the relation between these variables, European
Journal of Psychology of Education, 30, 421–435. doi:10.1007/s10212-015-0248-7
Faul, F., Erdfelder, E., Buchner, A., & Lang, A.-G. (2009). Statistical power analyses using
G*Power 3.1: tests for correlation and regression analyses. Behavior Research
Methods, 41, 1149–60. doi:10.3758/BRM.41.4.1149
Faust, M. W., Ashcraft, M. H., & Fleck, D. E. (1996). Mathematics anxiety effects in simple
and complex addition. Mathematical Cognition, 2, 25–62.
doi:10.1080/135467996387534

196
Fennema, E., & Sherman, J. A. (1976). Fennema-Sherman mathematics attitudes scales:
Instruments designed to measure attitudes toward the learning of mathematics by
females and males. Journal for Research in Mathematics Education, 7, 324–326. doi:
10.2307/748467
Ferguson, A. M., Maloney, E. A., Fugelsang, J., & Risko, E. F. (2015). On the relation
between math and spatial ability: The case of math anxiety. Learning and Individual
Differences, 39, 1–12. doi:10.1016/j.lindif.2015.02.007
Flessati, S. L., & Jamieson, J. (1991). Gender differences in mathematics anxiety: An artifact
of response bias? Anxiety, Stress & Coping, 3, 303–312.
Flore, P. C., & Wicherts, J. M. (2015). Does stereotype threat influence performance of girls
in stereotyped domains? A meta-analysis. Journal of School Psychology, 53, 25–44.
http://doi.org/10.1016/j.jsp.2014.10.002
Fox, J. (2005). Getting started with the R commander: A basic-statistics graphical user
interface to R. Journal of Statistical Software, 14, 1–42. Retrieved from
http://www.mendeley.com/research-papers/search/?query=R+development+team
Francis, D. J., Fletcher, J. M., Stuebing, K., Lyon, G. R, Shaywitz, B, A., & Shaywitz, S. E.
(2005). Psychometric approaches to the identification of LD: IQ and achievement
scores are not sufficient. Journal of Learning Disabilities, 38, 98-108.
Frenzel, A. C., Pekrun, R., & Goetz, T. (2007). Girls and mathematics —A “hopeless” issue?
A control-value approach to gender differences in emotions towards mathematics.
European Journal of Psychology of Education, 22, 497–514.
doi:10.1007/BF03173468
Fry, A. F., & Hale, S. (2000). Relationships among processing speed, working memory, and
fluid intelligence in children. Biological Psychology, 54, 1–34. doi:10.1016/S0301-
0511(00)00051-X
Gadermann, A. M., Guhn, M., & Zumbo, B. D. (2012). Estimating ordinal reliability for
likert-type and ordinal item response data: a conceptual, empirical, and practical
guide. Practical Assessment, Research & Evaluation, 17, 1–13. Retrieved from
http://pareonline.net/getvn.asp?v=17&n=3

197
Galla, B. M., & Wood, J. J. (2012). Emotional self-efficacy moderates anxiety-related
impairments in math performance in elementary school-age youth. Personality and
Individual Differences, 52, 118–122. doi:10.1016/j.paid.2011.09.012
Ganley, C. M., & McGraw, A. (2016). The development and validation of a revised version
of the mathematics anxiety scale for young children. Frontiers in Psychology, 7,
1181. doi:10.3389/fpsyg.2016.01181
Gardner, E. F., Rudman, H. C., Karlsen, B., & Merwin, J. C. (1982). Stanford Achievement
Test. New York: Psychological Corporation.
Garrett, A. J., Mazzocco, M. M. M., & Baker, L. (2006). Development of the metacognitive
skills of prediction and evaluation in children with or without math disability.
Learning Disabilities Research & Practice, 21, 77–88. doi:10.1111/j.1540-
5826.2006.00208.x.Development
Geary, D. C. (2004). Mathematics and learning disabilities. Journal of Learning Disabilities,
37, 4–15. doi:10.1177/00222194040370010201
Geary, D. C. (2010). Missouri longitudinal study of mathematical development and disability.
BJEP Monograph Series II, Number 7 - Understanding Number Development and
Difficulties, 1, 31–49.
Geary, D. C. (2011). Cognitive predictors of achievement growth in mathematics: A 5-year
longitudinal study. Developmental Psychology, 47, 1539–1552. doi:
10.1037/a0025510
Geary, D. C., Hoard, M. K. M. K., Byrd-Craven, J., Nugent, L., & Numtee, C. (2007).
Cognitive mechanisms underlying achievement deficits in children with mathematical
learning disability. Child Development, 78, 1343–1359. doi:10.1111/j.1467-
8624.2007.01069.x
Geary, D. C., Hoard, M. K., Nugent, L., & Bailey, D. H. (2012). Mathematical cognition
deficits in children with learning disabilities and persistent low achievement: A five-
year prospective study. Journal of Educational Psychology, 104, 206–223.
doi:10.1037/a0025398

198
Gierl, M. J. M. J., & Bisanz, J. (1995). Anxieties and attitudes related to mathematics in
grades 3 and 6. The Journal of Experimental Education, 63, 139–158.
Ginsburg, H. P. & Baroody, A. J. (1990). Test of early mathematics ability (TEMA-2) (2nd
ed.). Austin, TX, US: Pro-Ed.
Goetz, T., Bieg, M., Lüdtke, O., Pekrun, R., & Hall, N. C. (2013). Do girls really experience
more anxiety in mathematics? Psychological Science, 24, 2079–2087.
doi:10.1177/0956797613486989
Gorard, S. (2012). Who is eligible for free school meals? Characterising free school meals as
a measure of disadvantage in England. British Educational Research Journal, 38,
1003–1017. doi:10.1080/01411926.2011.608118
Griggs, M. S., Rimm-Kaufman, S. E., Merritt, E. G., & Patton, C. L. (2013). The Responsive
Classroom approach and fifth grade students’ math and science anxiety and self-
efficacy. School Psychology Quarterly:The Official Journal of the Division of School
Psychology, American Psychological Association, 28, 360–73.
doi:10.1037/spq0000026
Gross-Tsur, V., Manor, O., & Shalev, R. S. (1993). Developmental dyscalculia, gender, and
the brain. Archives of Disease in Childhood, 68, 510–2.
Gross-Tsur, V., Manor, O., & Shalev, R. S. (1996). Developmental dyscalculia: prevalence
and demographic features. Developmental Medicine and Child Neurology, 38, 25–33.
Guiso, L., Monte, F., & Sapienza, P. (2008). Differences in Test Scores Correlated with
Indicators of Gender Equality. Science, 320, 1164-1165. doi:
10.1126/science.1154094
Gunderson, E. A., Ramirez, G., Beilock, S. L., & Levine, S. C. (2012). The relation between
spatial skill and early number knowledge: the role of the linear number line.
Developmental Psychology, 48, 1229–1241. doi:10.1037/a0027433
Gunderson, E. A., Ramirez, G., Levine, S. C., & Beilock, S. L. (2012). The role of parents
and teachers in the development of gender-related math attitudes. Sex Roles, 66, 153–
166. doi:10.1007/s11199-011-9996-2

199
Hadfield, O. D., Martin, J. V., & Wooden, S. (1992). Mathematics anxiety and learning Style
of the Navajo middle school student. School Science and Mathematics, 92, 171–176.
doi:10.1111/j.1949-8594.1992.tb12167.x
Halpern, D. F. (1986). Sex differences in Cognitive Abilities. Hillsdale, NJ: Erlbaum.
Halpern, D. F. (1997). Sex differences in intelligence. Implications for education. The
American Psychologist, 52, 1091–102. Retrieved from
http://www.ncbi.nlm.nih.gov/pubmed/9329293.
Halpern, D. F., Benbow, C. P., Geary, D. C., Gur, R. C., Hyde, J. S., & Gernsbache, M. A.
(2007). The science of sex differences in science and mathematics. Psychological
Science in the Public Interest, 8, 1–51. doi:10.1111/j.1529-1006.2007.00032.x
Hanich, L. B., Jordan, N. C., Kaplan, D., & Dick, J. (2001). Performance across different
areas of mathematical cognition in children with learning difficulties. Journal of
Educational Psychology, 93, 615–626. doi:10.1037/0022-0663.93.3.615
Hannula, M. M., Lepola, J., & Lehtinen, E. (2010). Spontaneous focusing on numerosity as a
domain-specific predictor of arithmetical skills. Journal of Experimental Child
Psychology, 107, 394–406. doi:10.1016/j.jecp.2010.06.004
Harari, R. R., Vukovic, R. K., & Bailey, S. P. (2013). Mathematics anxiety in young children:
an exploratory study. The Journal of Experimental Education, 81, 538–555.
doi:10.1080/00220973.2012.727888
Harper, N. W., & Daane, C. J. (1998). Causes and reduction of math anxiety in preservice
elementary teachers. Action in Teacher Education, 19, 29–38.
doi:10.1080/01626620.1998.10462889
Heath, N., Roberts, E., & Toste, J. R. (2013). Perceptions of academic performance: positive
illusions in adolescents with and without learning disabilities. Journal of Learning
Disabilities, 46, 402–12. doi:10.1177/0022219411428807
Hedges, L., & Nowell, A. (1995). Sex differences in mental test scores, variability, and
numbers of high-scoring individuals. Science, 269, 41–45.
doi:10.1126/science.7604277

200
Hein, J., Bzufka, M. W., & Neumärker, K. J. (2000). The specific disorder of arithmetic
skills. Prevalence studies in a rural and an urban population sample and their clinico-
neuropsychological validation. European Child & Adolescent Psychiatry, 9,
Supplement 2, II87–101.
Hembree, R. (1988). Correlates, causes, effects and treatment of test anxiety. Review of
Educational Research, 58,47–77. doi: 10.3102/00346543058001047
Hembree, R. (1990). The nature, effects, and relief of mathematics anxiety. Journal for
Research in Mathematics Education, 21, 33–46. doi:10.2307/749455
Herman, K. C., Lambert, S. F., Reinke, W. M., & Ialongo, N. S. (2008). Low academic
competence in first grade as a risk factor for depressive cognitions and symptoms in
middle school. Journal of Counseling Psychology, 55, 400–410.
doi:10.1037/a0012654
Hill, F., Mammarella, I. C., Devine, A., Caviola, S., Passolunghi, M. C., & Szűcs, D. (2016).
Maths anxiety in primary and secondary school students: Gender differences,
developmental changes and anxiety specificity. Learning and Individual Differences
(2016). doi:10.1016/j.lindif.2016.02.006
Hines, M. (2011). Gender development and the human brain. Annual Review of
Neuroscience, 34, 69–88. doi:10.1146/annurev-neuro-061010-113654
Hines, M., Constantinescu, M., & Spencer, D. (2015). Early androgen exposure and human
gender development. Biology of Sex Differences, 6, 3. doi:10.1186/s13293-015-0022-
1
Hines, M., Spencer, D., Kung, K. T. F., Browne, W. V., Constantinescu, M., &
Noorderhaven, R. M. (2016). The early postnatal period, mini-puberty, provides a
window on the role of testosterone in human neurobehavioural development. Current
Opinion in Neurobiology, 38, 69–73. doi:10.1016/j.conb.2016.02.008
Hitch, J. G., & McAuley, E. (1991). Working memory in children with specific arithmetical
learning difficulties. British Journal of Psychology, 82, 3, 375–386.
doi:10.1111/j.2044-8295.1991.tb02406.x

201
Ho, H.-Z., Senturk, D., Lam, A. G., Zimmer, J. M., Hong, S., Okamoto, Y., … Wang, C.-P.
(2000). The affective and cognitive dimensions of math anxiety: A cross-national
study. Journal for Research in Mathematics Education, 31, 362–379.
doi:10.2307/749811
Holmes, W., & Dowker, A. (2013). Catch Up Numeracy: a targeted intervention for children
who are low-attaining in mathematics. Research in Mathematics Education, 15, 249–
265. doi:10.1080/14794802.2013.803779
Holmes, J., Gathercole, S. E., & Dunning, D. L. (2009). Adaptive training leads to sustained
enhancement of poor working memory in children. Developmental Science, 12, F9-
F15. doi:10.1111/j.1467-7687.2009.00848.x
Hopko, D. R. (2003). Confirmatory factor analysis of the math anxiety rating scale–revised.
Educational and Psychological Measurement, 63, 336–351.
doi:10.1177/0013164402251041
Hopko, D. R., Ashcraft, M. H., Gute, J., Ruggiero, K. J., & Lewis, C. (1998). Mathematics
anxiety and working memory: support for the existence of a deficient inhibition
mechanism. Journal of Anxiety Disorders, 12, 343–355. doi: 10.1016/S0887-
6185(98)00019-X
Hopko, D. R., Mahadevan, R., Bare, R. L., & Hunt, M. K. (2003). The abbreviated math
anxiety scale (AMAS): Construction, validity, and reliability. Assessment, 10, 178–
182. doi:10.1177/1073191103010002008
Hopko, D. R., McNeil, D. W., Zvolensky, M. J., & Eifert, G. H. (2001). The relation between
anxiety and skill in performance-based anxiety disorders: A behavioral formulation of
social phobia. Behavior Therapy, 32, 185–207.
Huang, C. (2013). Gender differences in academic self-efficacy: A meta-analysis. European
Journal of Psychology of Education, 28, 1–35. doi:10.1007/s10212-011-0097-y
Huguet, P., & Régner, I. (2007). Stereotype threat among schoolgirls in quasi-ordinary
classroom circumstances. Journal of Educational Psychology, 99, 545–560.
doi:10.1037/0022-0663.99.3.545

202
Hunsley, J. (1987). Cognitive processes in mathematics anxiety and test anxiety: The role of
appraisals, internal dialogue, and attributions. Journal of Educational Psychology, 79,
388–392. doi:10.1037/0022-0663.79.4.388
Hyde, J. S. (2014) Gender Similarities and Differences. Annual Review of Psychology, 65,
373–398. doi: 10.1146/annurev-psych-010213-115057
Hyde, J. S., Fennema, E., & Lamon, S. J. (1990). Gender differences in mathematics
performance: a meta-analysis. Psychological Bulletin, 107, 139–55.
Iuculano, T., Tang, J., Hall, C. W. B., & Butterworth, B. (2008). Core information processing
deficits in developmental dyscalculia and low numeracy. Developmental Science, 11,
669–680. doi:10.1111/j.1467-7687.2008.00716.x
Isaacs, E. B., Edmonds, C. J., Lucas, A., & Gadian, D. G. (2001). Calculation difficulties in
children of very low birthweight: a neural correlate. Brain : A Journal of Neurology,
124, 1701–7077. doi:11522573
Jackson, C. D., & Leffingwell, R. J. (1999). The role of instructions in creating math anxiety
in students from kindergarten through college. The Mathematics Teacher, 92, 583–
586.
Jain, S., & Dowson, M. (2009). Mathematics anxiety as a function of multidimensional self-
regulation and self-efficacy. Contemporary Educational Psychology, 34, 240–249.
doi:10.1016/j.cedpsych.2009.05.004
Jameson, M. M. (2013). The development and validation of the children’s anxiety in math
scale. Journal of Psychoeducational Assessment, 31, 391–395.
doi:10.1177/0734282912470131
Jameson, M. M., & Fusco, B. R. (2014). Math anxiety, math self-concept, and math self-
efficacy in adult learners compared to traditional undergraduate students. Adult
Education Quarterly, 64, 306–322. doi:10.1177/0741713614541461
Jansen, B. R. J., Louwerse, J., Straatemeier, M., Van der Ven, S. H. G., Klinkenberg, S., &
Van der Maas, H. L. J. (2013). The influence of experiencing success in math on math
anxiety, perceived math competence, and math performance. Learning and Individual
Differences, 24, 190–197. doi:10.1016/j.lindif.2012.12.014

203
Joannon-Bellows, F. J. (1992). The relationship between high school mathematics teachers’
leadership behaviour and students' mathematics anxiety. Reports-Research, 85. ERIC
Document Reproduction Service No. 431628
Jordan, J.-A., Wylie, J., & Mulhern, G. (2010). Phonological awareness and mathematical
difficulty: A longitudinal perspective. The British Journal of Developmental
Psychology, 28, 89–107. doi:10.1348/02651010X485197
Karasel, N., & Ayda, O. (2010). The relationship between mathematics anxiety and
mathematical problem solving skills among primary school students. Procedia-Social
and Behavioral Sciences, 2, 5804–5807. doi:10.1016/j.sbspro.2010.03.946
Kaufmann, L., Mazzocco, M. M., Dowker, A., von Aster, M., Göbel, S. M., Grabner, R. H.,
… Nuerk, H.-C. (2013). Dyscalculia from a developmental and differential
perspective. Frontiers in Psychology, 4, 516. doi:10.3389/fpsyg.2013.00516
Kazelskis, R., Reeves, C., Kersh, M. E., Bailey, G., Cole, K., Larmon, M., … Holliday, D. C.
(2000). Mathematics anxiety and test anxiety: separate constructs? The Journal of
Experimental Education, 68, 137–146. doi:10.1080/00220970009598499
Keeler, M., & Swanson, H. L. (2001). Does strategy knowledge influence working memory
in children with mathematical disabilities? Journal of Learning Disabilities, 34, 418–
434.
Kelly, W. P., and Tomhave, W. K. (1985). A study of math anxiety/math avoidance in
preservice elementary school teachers. The Arithmetic Teacher, 32, 51–53.
Kellogg, J. S., Hopko, D. R., & Ashcraft, M. H. (1999). The effects of time pressure on
arithmetic performance. Journal of Anxiety Disorders, 13, 592–600.
doi:10.1016/S0887-6185(99)00025-0
Kemper, M. B., Hagerman, R. J., Ahmad, R. S., Mariner, R., Opitz, J. M., & Reynolds, J. F.
(1986). Cognitive profiles and the spectrum of clinical manifestations in heterozygous
fra(X) females. American Journal of Medical Genetics, 23, 139–156.
doi:10.1002/ajmg.1320230109

204
Keshavarzi, A., & Ahmadi, S. (2013). A comparison of mathematics anxiety among students
by gender. Procedia - Social and Behavioral Sciences, 83, 542–546.
doi:10.1016/j.sbspro.2013.06.103
Khatoon, T., & Mahmood, S. (2010). Mathematics anxiety among secondary school students
in India and its relationship to achievement in mathematics. European Journal of
Social Sciences, 16, 75–86.
Klauer, K. (1992). In Mathematik mehr leistungddchwache Madchen, im Lessen und
Rechshreiben mehr leitungsscwache Junden? [More girls with poor math skills and
more boys with poor reading and writing skills- diagnosis of dyscalculia and
dyslexia]. Seitschrif F. Entwicklungpsychologie U. Padagogische Psychologie, 26,
48–65.
Kohli, N., Sullivan, A. L., Sadeh, S. & Zopluoglu, C. (2015). Longitudinal mathematics
development of students with learning disabilities and students without disabilities: A
comparison of linear, quadratic, and piecewise linear mixed effects models. Journal of
School Psychology, 53, 105–120. doi:10.1016/j.jsp.2014.12.002
Kosc, L. (1974). Developmental Dyscalculia. Journal of Learning Disabilities, 7, 164–177.
doi:10.1177/002221947400700309
Koumoula, A., Tsironi, V., Stamouli, V., Bardani, I., Siapati, S., Graham, A., … von Aster,
M. (2004). An epidemiological study of number processing and mental calculation in
Greek school children. Journal of Learning Disabilities, 37, 377–388.
doi:10.1177/00222194040370050201
Kovas, Y., Haworth, C. M. A., Petrill, S. A., & Plomin, R. (2007). Mathematical ability of
10-year-old boys and girls: genetic and environmental etiology of typical and low
performance. Journal of Learning Disabilities, 40, 554–567.
doi:10.1177/00222194070400060601
Kovas, Y., Giampietro, V., Viding, E., Ng, V., Brammer, M., Barker, G. J., … Plomin, R.
(2009). Brain correlates of non-symbolic numerosity estimation in low and high
mathematical ability children. PLoS ONE, 4. doi:10.1371/journal.pone.0004587
Kozhevnikov, M., & Hegarty, M. (2001). A dissociation between object manipulation spatial
ability and spatial orientation ability. Memory & Cognition, 29, 745-756.

205
Krinzinger, H., Kaufmann, L., & Willmes, K. (2009). Math anxiety and math ability in early
primary school years. Journal of Psychoeducational Assessment, 27, 206–225.
doi:10.1177/0734282908330583
Krinzinger, H., Kaufmann, L., Dowker, A., Thomas, G., Graf, M., Nuerk, H.-C., & Willmes,
K. (2007). Deutschsprachige Version des Fragebogens für Rechenangst (FRA) für 6-
bis 9-jährige Kinder. [German version of the math anxiety questionnaire (FRA) for 6-
to 9-year-old children.] Zeitschrift Für Kinder- Und Jugendpsychiatrie Und
Psychotherapie, 35, 341–367. http://doi.org/10.1024/1422-4917.35.5.341
Krinzinger, H., Wood, G., & Willmes, K. (2012). What accounts for individual and gender
differences in the multi-digit number processing of primary school children?
Zeitschrift Für Psychologie, 220, 78–89. doi:10.1027/2151-2604/a000099
Kucian, K., Loenneker, T., Dietrich, T., Dosch, M., Martin, E., & von Aster, M. (2006).
Impaired neural networks for approximate calculation in dyscalculic children: a
functional MRI study. Behavioral and Brain Functions: BBF, 2, 31.
doi:10.1186/1744-9081-2-31
Kucian, K., Loenneker, T., Martin, E., & von Aster, M. (2011). Non-symbolic numerical
distance effect in children with and without developmental dyscalculia: a parametric
fMRI study. Developmental Neuropsychology, 36, 741–762.
doi:10.1080/87565641.2010.549867
Kvedere, L. (2012). Mathematics self-concept of the 9th grade students in Latvia. Procedia -
Social and Behavioral Sciences, 46, 3380–3384. doi:10.1016/j.sbspro.2012.06.070
Kyttälä, M., & Björn, P. M. (2014). The role of literacy skills in adolescents’ mathematics
word problem performance: Controlling for visuo-spatial ability and mathematics
anxiety. Learning and Individual Differences, 29, 59–66.
doi:10.1016/j.lindif.2013.10.010
Lai, Y., Zhu, X., Chen, Y., & Li, Y. (2015). Effects of mathematics anxiety and mathematical
metacognition on word problem solving in children with and without mathematical
learning difficulties. Plos One, 10, e0130570. doi:10.1371/journal.pone.0130570

206
Landerl, K., Bevan, A., & Butterworth, B. (2004). Developmental dyscalculia and basic
numerical capacities: a study of 8-9-year-old students. Cognition, 93, 99–125.
doi:10.1016/j.cognition.2003.11.004
Landerl, K., & Kölle, C. (2009). Typical and atypical development of basic numerical skills
in elementary school. Journal of Experimental Child Psychology, 103, 546–65.
doi:10.1016/j.jecp.2008.12.006
Landerl, K., & Moll, K. (2010). Comorbidity of learning disorders: prevalence and familial
transmission. Journal of Child Psychology and Psychiatry, and Allied Disciplines, 51,
287–294. doi:10.1111/j.1469-7610.2009.02164.x
Lee, J. (2009). Universals and specifics of math self-concept, math self-efficacy, and math
anxiety across 41 PISA 2003 participating countries. Learning and Individual
Differences, 19, 355–365. doi:10.1016/j.lindif.2008.10.009
LeFevre, J.-A., Fast, L., Skwarchuk, S.-L., Smith-Chant, B. L., Bisanz, J., Kamawar, D., &
Penner-Wilger, M. (2010). Pathways to mathematics: longitudinal predictors of
performance. Child Development, 81, 1753–67. doi:10.1111/j.1467-
8624.2010.01508.x
Leikin, M., Paz-Baruch, N., & Leikin, R. (2013). Memory abilities in generally gifted and
excelling-in-mathematics adolescents. Intelligence, 41, 566–578.
doi:10.1016/j.intell.2013.07.018
Leikin, R., Paz-Baruch, N., & Leikin, M. (2014). Cognitive Characteristics of Students with
Superior Performance in Mathematics. Journal of Individual Differences, 35, 119–
129. doi:10.1027/1614-0001/a000140
Lewis, C., Hitch, G. J., & Walker, P. (1994). The prevalence of specific arithmetic difficulties
and specific reading difficulties in 9-to 10-year-old boys and girls. Journal of Child
Psychology and Psychiatry, 35, 283–292. doi:10.1111/j.1469-7610.1994.tb01162.x
Liebert, R. M., & Morris, L. W. (1967). Cognitive and emotional components of test anxiety:
a distinction and some initial data. Psychological Reports, 20, 975–978.
doi:10.2466/pr0.1967.20.3.975

207
Lindberg, S. M., Hyde, J. S., Petersen, J. L., & Linn, M. C. (2010). New trends in gender and
mathematics performance: A meta-analysis. Psychological Bulletin, 136, 1123–1135.
doi:10.1037/a0021276
Logan, S., & Johnston, R. (2010). Investigating gender differences in reading. Educational
Review, 62, 175–187. doi:10.1080/00131911003637006
Luo, W., Hogan, D., Tan, L. S., Kaur, B., Ng, P. T., & Chan, M. (2014). Self-construal and
students’ math self-concept, anxiety and achievement: An examination of
achievement goals as mediators. Asian Journal of Social Psychology, 17, 184–195.
doi:10.1111/ajsp.12058
Luo, X., Wang, F., & Luo, Z. (2009). Investigation and Analysis of Mathematics Anxiety in
Middle School Students. Journal of Mathematics Education, 2, 12–19.
Ma, X. (1999). A meta-analysis of the relationship between anxiety toward mathematics and
achievement in mathematics. Journal for Research in Mathematics Education, 30,
520–540. doi:10.2307/749772
Ma, X., & Cartwright, F. (2003). A longitudinal analysis of gender differences in affective
outcomes in mathematics during middle and high school. School Effectiveness and
School Improvement, 14, 413–439. doi:10.1076/sesi.14.4.413.17155
Ma, X., & Xu, J. (2004). The causal ordering of mathematics anxiety and mathematics
achievement: a longitudinal panel analysis. Journal of Adolescence, 27, 165–179.
doi:10.1016/j.adolescence.2003.11.003
Maloney, E. A., Ansari, D., & Fugelsang, J. A. (2011). The effect of mathematics anxiety on
the processing of numerical magnitude. Quarterly Journal of Experimental
Psychology, 64, 10–16. doi:10.1080/17470218.2010.533278
Maloney, E. A., Ramirez, G., Gunderson, E. A, Levine, S. C., & Beilock, S. L. (2015).
Intergenerational effects of parents’ math anxiety on children’s math achievement and
anxiety. Psychological Science, 26, 1480–1488. doi:10.1177/0956797615592630
Maloney, E. A., Risko, E. F., Ansari, D., & Fugelsang, J. (2010). Mathematics anxiety affects
counting but not subitizing during visual enumeration. Cognition, 114, 293–297.
doi:10.1016/j.cognition.2009.09.013

208
Mammarella, I. C., Hill, F., Devine, A., Caviola, S., & Szűcs, D. (2015). Math anxiety and
developmental dyscalculia: A study on working memory processes. Journal of
Clinical and Experimental Neuropsychology, 37, 878–887.
doi:10.1080/13803395.2015.1066759
Mazzocco, M. M. M. (2007). Defining and differentiating mathematical learning disabilities
and difficulties. In D. B. Berch & M. M. M. Mazzocco (Eds.), Why is math so hard
for some children? The nature and origins of mathematical learning difficulties and
disabilities. (pp.29–47). Baltimore, MD: Paul H. Brookes Publishing.
Mazzocco, M. M. M., Feigenson, L., & Halberda, J. (2011). Impaired acuity of the
approximate number system underlies mathematical learning disability (dyscalculia).
Child Development, 82, 1224–1237. doi:10.1111/j.1467-8624.2011.01608.x
Mazzocco, M. M. M., & Myers, G. F. (2003). Complexities in identifying and defining
mathematics learning disability in the primary school-age years. Annals of Dyslexia,
53, 218–253. doi:10.1007/s11881-003-0011-7
Mazzocco, M. M. M. & Räsänen, P. (2013). Contributions of longitudinal studies to evolving
definitions and knowledge of developmental dyscalculia. Trends in Neuroscience and
Education, 2, 65–73. doi: 10.1016/j.tine.2013.05.001
Mazzocco, M. M. M. & Thompson, R. E. (2005). Kindergarten predictors of math learning
disability. Learning Disabilities Research and Practice, 20, 142–155.
doi:10.1111/j.1540-5826.2005.00129x
Meece, J. L., Wigfield, A., & Eccles, J. S. (1990). Predictors of math anxiety and its
influence on young adolescents’ course enrolment intentions and performance in
mathematics. Journal of Educational Psychology, 82, 60–70. doi:10.1037/0022-
0663.82.1.60
Middleton, J. A., & Spanias, P. A. (1999). Motivation for achievement in mathematics:
findings, generalizations, and criticisms of the research. Journal for Research in
Mathematics Education, 30, 65–88.
Miller, H., & Bichsel, J. (2004). Anxiety, working memory, gender, and math performance.
Personality and Individual Differences, 37, 591–606. doi:10.1016/j.paid.2003.09.029

209
Morgan, P. L., Farkas, G. & Wu, Q. (2009). Five-year growth trajectories of kindergarten
children with learning difficulties in mathematics. Journal of Learning Disabilities.
42, 306–321. doi:10.1177/0022219408331037
Morsanyi, K., Busdraghi, C., & Primi, C. (2014). Mathematical anxiety is linked to reduced
cognitive reflection: a potential road from discomfort in the mathematics classroom to
susceptibility to biases. Behavioral and Brain Functions : BBF, 10, 31.
doi:10.1186/1744-9081-10-31
Murphy, M. M., Mazzocco, M. M. M., Hanich, L. B., & Early, M. C. (2007). Children With
Mathematics Learning Disability (MLD) Vary as a Function of the Cutoff Criterion
Used to Define MLD. Journal of Learning Disabilities, 40, 458–478.
Mussolin, C., De Volder, A., Grandin, C., Schlögel, X., Nassogne, M.-C., & Noël, M.-P.
(2010). Neural correlates of symbolic number comparison in developmental
dyscalculia. Journal of Cognitive Neuroscience, 22, 860–874.
doi:10.1162/jocn.2009.21237
Mussolin, C., Mejias, S., & Noël, M.-P. (2010). Symbolic and nonsymbolic number
comparison in children with and without dyscalculia. Cognition, 115, 10–25.
doi:10.1016/j.cognition.2009.10.006
National Numeracy. (n.d.). What is the issue? Retrieved May 14, 2016, from
http://www.nationalnumeracy.org.uk/what-issue
Nelson, J. M., & Harwood, H. (2011). Learning disabilities and anxiety: A meta-analysis.
Journal of Learning Disabilities, 44, 3–17. doi:10.1177/0022219409359939
Newstead, K. (1998). Aspects of children’s mathematics anxiety. Educational Studies in
Mathematics, 36, 53–71. doi:10.1023/A:1003177809664
Office for National Statistics (2010). Standard Occupational Classification. Retrieved from:
http://www.ons.gov.uk/ons/guide-method/classifications/current-standard-
classifications/soc2010/index.html
OECD (2014), Education at a Glance 2014: OECD Indicators, OECD Publishing, Paris.
doi:10.1787/eag-2014-en

210
OECD. (2015). The ABC of gender equality in education. OECD Publishing (Vol. PISA).
doi:10.1787/9789264229945-en
Pajares, F. (2005). Gender differences in mathematics self-efficacy beliefs. In A. M.
Gallagher & J. C. Kaufmann (Eds.), Gender differences in mathematics: An
integrative psychological approach (pp. 294–315). New York: Cambridge University
Press.
Pajares, F., & Miller, M. D. (1994). Role of self-efficacy and self-concept beliefs in
mathematical problem solving: A path analysis. Journal of Educational Psychology,
86, 193–203. doi:10.1037/0022-0663.86.2.193
Park, D., Ramirez, G., & Beilock, S. L. (2014). The role of expressive writing in math
anxiety. Journal of Experimental Psychology. Applied, 20, 103–111.
doi:10.1037/xap0000013
Passolunghi, M. C. (2011). Cognitive and emotional factors in children with mathematical
learning disabilities. International Journal of Disability, Development and Education,
58, 61–63. doi:10.1080/1034912X.2011.547351
Passolunghi, M. C., Cornoldi, C., & De Liberto, S. (1999). Working memory and intrusions
of irrelevant information in a group of specific poor problem solvers. Memory &
Cognition, 27, 779–790. doi:10.3758/BF03198531
Passolunghi, M. C., & Lanfranchi, S. (2012). Domain-specific and domain-general precursors
of mathematical achievement: A longitudinal study from kindergarten to first grade.
British Journal of Educational Psychology, 82, 42–63. doi:10.1111/j.2044-
8279.2011.02039.x
Passolunghi, M. C., & Siegel, L. S. (2001). Short-term memory, working memory, and
inhibitory control in children with difficulties in arithmetic problem solving. Journal
of Experimental Child Psychology, 80, 44–57. doi:10.1006/jecp.2000.2626
Passolunghi, M. C., & Siegel, L. S. (2004). Working memory and access to numerical
information in children with disability in mathematics. Journal of Experimental Child
Psychology, 88, 348–367. doi:10.1016/j.jecp.2004.04.002

211
Perez-Felkner, L., Nix, S., & Thomas, K. (2017). Gendered pathways: How mathematics
ability beliefs shape secondary and postsecondary course and degree field choices.
Frontiers in Psychology, 8. doi:10.3389/FPSYG.2017.00386
Petronzi, D. (2016). The development of the numeracy apprehension scale for children aged
4-7 years: Qualitative exploration of associated factors and quantitative testing.
University of Derby: Ph.D. Thesis.
Piazza, M., Facoetti, A., Trussardi, A. N., Berteletti, I., Conte, S., Lucangeli, D., … Zorzi, M.
(2010). Developmental trajectory of number acuity reveals a severe impairment in
developmental dyscalculia. Cognition, 116, 33–41.
doi:10.1016/j.cognition.2010.03.012
Plake, B. S., & Parker, C. S. (1982). The development and validation of a revised version of
the mathematics anxiety rating scale. Educational and Psychological measurement,
42, 551–557.
Pletzer, B., Wood, G., Scherndl, T., Kerschbaum, H. H., & Nuerk, H.-C. (2016). Components
of mathematics anxiety: factor modeling of the MARS30-Brief. Frontiers in
Psychology, 7, 1–14. doi:10.3389/fpsyg.2016.00091
Plomin, R., & Kovas, Y. (2005). Generalist genes and learning disabilities. Psychological
Bulletin, 131, 592–617. doi:10.1037/0033-2909.131.4.592
Price, G. R., Holloway, I., Rasanen, P., Vesterinen, M., & Ansari, D. (2007). Impaired
parietal magnitude processing in developmental dyscalculia. Current Biology, 17,
1042–1043. doi:10.1016/j.cub.2007.10.013
Primi, C., Busdraghi, C., Tomasetto, C., Morsanyi, K., & Chiesi, F. (2014). Measuring math
anxiety in Italian college and high school students: Validity, reliability and gender
invariance of the Abbreviated Math Anxiety Scale (AMAS). Learning and Individual
Differences, 34, 51–56. doi:10.1016/j.lindif.2014.05.012
Punaro, L., & Reeve, R. (2012). Relationships between 9-Year-Olds’ Math and Literacy
Worries and Academic Abilities. Child Development Research, 2012, 1–11.
doi:10.1155/2012/359089

212
Ramirez, G., & Beilock, S. L. (2011). Writing about testing worries boosts exam performance
in the classroom. Science, 331, 211–213. doi:10.1126/science.1199427
Ramirez, G., Gunderson, E. A., Levine, S. C., & Beilock, S. L. (2013). Math anxiety,
working memory, and math achievement in early elementary school. Journal of
Cognition and Development, 14, 187–202. doi:10.1080/15248372.2012.664593
Ramaa, S., & Gowramma, I. P. (2002). A systematic procedure for identifying and
classifying children with dyscalculia among primary school children in India.
Dyslexia, 8, 67–85. doi:10.1002/dys.214
Raven, J. (1965). Raven’s coloured and standard progressive matrices. San Antonio, TX:
Harcourt Assessment.
Raven, J. (2008) Raven’s - Educational: Coloured Progressive Matrices (CPM). Pearson
Assessment.
Raven, J. C, Court, J. H. & Raven, J. (1984). Manual for Raven's Progressive Matrices and
Vocabulary Scales. London: H. K. Lewis.
R Core Team. (2016). R: A language and environment for statistical computing. Vienna: R
Foundation for Statistical Computing. Retrieved from https://www.r-project.org/
Reigosa-Crespo, V., Valdés-Sosa, M., Butterworth, B., Estévez, N., Rodriguez, M., Santos,
E., … Rodríguez, M. (2012). Basic numerical capacities and prevalence of
developmental dyscalculia: The Havana survey. Developmental Psychology, 48, 123–
135. doi: 10.1037/a0025356
Resnick, H., Viehe, J., & Segal, S. (1982). Is math anxiety a local phenomenon? A study of
prevalence and dimensionality. Journal of Counseling Psychology, 29, 39–47.
doi:10.1037/0022-0167.29.1.39
Revelle, W. (2013). psych:Procedures for Personality and Psychological Research (R
Package Version 1.3.2). Available at http://personality-project.org/r.
Reyes, L. H. (1984). Affective variables and mathematics education. The Elementary School
Journal, 84, 558–581. doi:10.1086/461384

213
Richardson, F. C., & Suinn, R. M. (1972). The mathematics anxiety rating scale:
psychometric data. Journal of Counseling Psychology, 19, 551–554.
doi:10.1037/h0033456
Richardson F. C., & Woolfolk, R. L (1980). Mathematics Anxiety. In Sarason I. G (Ed), Test
Anxiety: Theory, Research and Application. (pp 275–288). Hillsdale, NJ: Erlbaum.
Riglin, L., Frederickson, N., Shelton, K. H., & Rice, F. (2013). A longitudinal study of
psychological functioning and academic attainment at the transition to secondary
school. Journal of Adolescence, 36, 507–517. doi:10.1016/j.adolescence.2013.03.002
Rothon, C., Head, J., Clark, C., Klineberg, E., Cattell, V., & Stansfeld, S. (2009). The impact
of psychological distress on the educational achievement of adolescents at the end of
compulsory education. Social Psychiatry and Psychiatric Epidemiology, 44, 421–427.
doi:10.1007/s00127-008-0452-8
Rotzer, S., Kucian, K., Martin, E., Aster, M. von, Klaver, P., & Loenneker, T. (2008).
Optimized voxel-based morphometry in children with developmental dyscalculia.
NeuroImage, 39, 417–422. doi:10.1016/j.neuroimage.2007.08.045
Rourke, B. P. (1993). Arithmetic disabilities, specific and otherwise: A neuropsychological
perspective. Journal of Learning Disabilities, 26, 214–226.
doi:10.1177/002221949302600402
Rourke, B. P., & Conway, J. A. (1997). Disabilities of arithmetic and mathematical
reasoning: perspectives from neurology and neuropsychology. Journal of Learning
Disabilities, 30, 34–46.
Rousselle, L., & Noël, M.-P. (2007). Basic numerical skills in children with mathematics
learning disabilities: a comparison of symbolic vs non-symbolic number magnitude
processing. Cognition, 102, 361–395. doi: 10.1016/j.cognition.2006.01.005
Rubinsten, O., & Henik, A. (2005). Automatic activation of internal magnitudes: a study of
developmental dyscalculia. Neuropsychology, 19, 641–648. doi:10.1037/0894-
4105.19.5.641

214
Rubinsten, O., & Henik, A. (2009). Developmental dyscalculia: heterogeneity might not
mean different mechanisms. Trends in Cognitive Sciences, 13, 92–99.
doi:10.1016/j.tics.2008.11.002
Rubinsten, O., & Tannock, R. (2010). Mathematics anxiety in children with developmental
dyscalculia. Behavioral and Brain Functions: BBF, 6, 46. doi:10.1186/1744-9081-6-
46
Russell, R. L., & Ginsburg, H. P. (1984). Cognitive analysis of children’s mathematics
difficulties. Cognition and Instruction, 1, 217–244. doi:10.1207/s1532690xci0102_3
Ruthsatz, J., Ruthsatz-Stephens, K., & Ruthsatz, K. (2014). The cognitive bases of
exceptional abilities in child prodigies by domain: similarities and differences.
Intelligence, 44, 11–14. doi:10.1016/j.intell.2014.01.010
Rutter, M., Caspi, A., Fergusson, D., Horwood, L. J., Goodman, R., Maughan, B., … Carroll,
J. (2004). Sex differences in developmental reading disability: new findings from 4
epidemiological studies. JAMA: The Journal of the American Medical Association,
291, 2007–2012. doi:10.1001/jama.291.16.2007
Rykhlevskaia, E., Uddin, L. Q., Kondos, L., & Menon, V. (2009). Neuroanatomical
correlates of developmental dyscalculia: combined evidence from morphometry and
tractography. Frontiers in Human Neuroscience, 3, 51.
doi:10.3389/neuro.09.051.2009
Saigh, P. A., & Khouri, A. (1983). The concurrent validity of the mathematics anxiety rating
scale for adolescents (MARS-A) in relation to the academic achievement of Lebanese
students. Educational and Psychological Measurement, 43, 633–637.
doi:10.1177/001316448304300237
Sammons, P., Sylva, K., & Melhuish, E. (2014). Influences on students’ GCSE attainment
and progress at age 16: Effective pre-school, primary & secondary education project
(EPPSE). Department for Education. Retrieved from:
https://www.gov.uk/government/publications
Satake, E., & Amato, P. P. (1995). Mathematics anxiety and achievement among Japanese
elementary school students. Educational and Psychological Measurement, 55, 1000–
1007.

215
Scott, F. J., Baron-Cohen, S., Bolton, P., & Brayne, C. (2002). Prevalence of autism spectrum
conditions in children Aged 5-11 years in Cambridgeshire, UK. Autism, 6, 231–237.
doi:10.1177/1362361302006003002
Sepie, A., & Keeling, B. (1978). The relationship between types of anxiety and under-
achievement in mathematics. The Journal of Educational Research, 72, 15–19.
Shalev. R. S.. Manor, O.. Amir, N.. Gross-Tsur. V. (1993) Acquisition of arithmetic in
normal children: assessment by a cognitive model of dyscalculia. Developmental
Medicine and Child Neurology, 35, 593–560.
Shalev, R. S., Manor, O. & Gross-Tsur, V. (2005). Developmental dyscalculia: a prospective
six-year follow-up. Developmental Medicine and Child Neurology, 47, 121–125. doi:
10.1017/S0012162205000216
Shalev, R. S., Manor, O., Auerbach, J. & Gross-Tsur, V. (1998). Persistence of
developmental dyscalculia: what counts? Results from a 3-year prospective follow-up
study. Journal of Pediatics, 133, 358–362. doi: 10.1016/S0022-3476(98)70269-0
Shapka, J. D., & Keating, D. P. (2003). Effects of a girls-only curriculum during adolescence:
performance, persistence, and engagement in mathematics and science. Engagement
in Mathematics and Science, 40, 929–960. doi: 10.3102/00028312040004929
Silver, C. H., Pennett, H. D., Black, J. L., Fair, G. W. & Balise, R. R. (1999). Stability of
arithmetic disability subtypes. Journal of Learning Disabilities, 32, 108–119. doi:
10.1177/002221949903200202
Smithers, A. (2014). A-levels 1951-2014. University of Buckingham: Centre for Education
and Employment Research. Retrieved from:
http://www.alansmithers.com/reports/AL2014.pdf
Sorvo, R., Koponen, T., Viholainen, H., Aro, T., Räikkönen, E., Peura, P., … Aro, M. (2017).
Math anxiety and its relationship with basic arithmetic skills among primary school
children. British Journal of Educational Psychology. doi:10.1111/bjep.12151
Stöber, J., & Pekrun, R. (2004). Advances in test anxiety research. Anxiety Stress Coping, 17,
205–211. doi:10.1080/1061580412331303225

216
Stock, P., Desoete, A., & Roeyers, H. (2010). Detecting children with arithmetic disabilities
from kindergarten: evidence from a 3-year longitudinal study on the role of
preparatory arithmetic abilities. Journal of Learning Disabilities, 43, 250–268.
doi:10.1177/0022219409345011
Stoet, G., & Geary, D. C. (2013). Sex differences in mathematics and reading achievement
are inversely related: within- and across-nation assessment of 10 years of PISA data.
PLoS ONE, 8, e57988. doi:10.1371/journal.pone.0057988
Stoet, G., & Geary, D. C. (2015). Sex differences in academic achievement are not related to
political, economic, or social equality. Intelligence, 48, 137–151.
doi:10.1016/j.intell.2014.11.006
Stuart, V. B. (2000). Math curse or math anxiety? Teaching Children Mathematics, 6, 330.
Suinn, R. M., Taylor, S., & Edwards, R. W. (1988). Suinn mathematics anxiety rating scale
for elementary school students (MARS-E): psychometric and normative data.
Educational and Psychological Measurement, 48, 979–986.
doi:10.1177/0013164488484013
Suinn, R. M., & Winston, E. H. (2003). The mathematics anxiety rating scale, a brief version:
psychometric data. Psychological Reports, 92, 167–173. doi:
10.2466/pr0.2003.92.1.167
Swanson, H. L. (2011). Working memory, attention, and mathematical problem solving: A
longitudinal study of elementary school children. Journal of Educational Psychology,
103, 821–837. doi:10.1037/a0025114
Swanson, H. L., & Sachse-Lee, C. (2001). Mathematical problem solving and working
memory in children with learning disabilities: both executive and phonological
processes are important. Journal of Experimental Child Psychology, 79, 294–321.
doi:10.1006/jecp.2000.2587
Szűcs, D., Devine, A., Soltesz, F., Nobes, A., & Gabriel, F. (2013). Developmental
dyscalculia is related to visuo-spatial memory and inhibition impairment. Cortex, 49,
2674–2688. doi:10.1016/j.cortex.2013.06.007

217
Szűcs, D., Devine, A., Soltesz, F., Nobes, A., & Gabriel, F. (2014). Cognitive components of
a mathematical processing network in 9‐year‐old children. Developmental Science,
17, 506–524. doi:10.1111/desc.12144
Szűcs, D., & Goswami, U. (2013). Developmental dyscalculia: Fresh perspectives. Trends in
Neuroscience and Education, 2, 33–37. doi:10.1016/j.tine.2013.06.004
Thelen, E., & Smith, L. B. (1994). A dynamic systems approach to the development of
cognition and action. Cambridge, MA: MIT Press
Tobias, S. (1986). Anxiety and cognitive processing of instruction. In R. Schwarzer (Ed.),
Self-related Cognitions in Anxiety and Motivation (pp. 35–54). Hillsdale, NJ:
Lawrence Erlbaum Associates.
Thomas, G., and Dowker, A. (2000). Mathematics anxiety and related factors in young
children, Paper Presented at British Psychological Society Developmental Section
Conference (Bristol).
Thorndike, R. L., Hagen, E. P., & Sattler, J. M. (1986). The Stanford Binet intelligence scale:
Guide for administering and scoring (4th ed.). Chicago: The Riverside Publishing.
Turner, J. C., Midgley, C., Meyer, D. K., Gheen, M., Anderman, E. M., Kang, Y., & Patrick,
H. (2002). The classroom environment and students’ reports of avoidance strategies in
mathematics: A multimethod study. Journal of Educational Psychology, 94, 88–106.
doi:10.1037/0022-0663.94.1.88
van Garderen, D. V. (2006). Spatial visualization, visual imagery, and mathematical problem
solving of students with varying abilities. Journal of Learning Disabilities, 39, 496–
506. doi: 10.1177/00222194060390060201
Van der Ven, S. H. G., Kroesbergen, E. H., Boom, J. & Leseman, P. P. M. (2012). The
development of executive functions and early mathematics: A dynamic relationship.
British Journal of Educational Psychology, 82, 100–119. doi: 10.1111/j.2044-
8279.2011.02035.x
Vesga-López, O., Schneier, F. R.,Wang, S., Heimberg, R. G., Liu, S. M., Hasin, DS, &
Blanco, C. (2008). Gender differences in generalized anxiety disorder: results from

218
the national epidemiologic survey on alcohol and related conditions (NESARC).
Journal of Clinical Psychiatry, 69,1606-1616.
Vincent, D., & Crumpler, M. (2007). Hodder Group Reading Tests 1–3 (II.). London, UK:
Hodder Education.
von Aster, M. (2001). ZAREKI-Neuropsychologische Testbatterie fur Zahlenvararbeitung
und Rechen bei Kindern. [Neuropsychological test battery for number processing and
calculation in children]. Lisse: Swets Test Services.
von Aster, M., Weinghold Zulauf, M., & Horn, R. (2006). Die Neuropsychologische
Testbatterie fur Zahlenverarbeitung und Rechen bei Kindern, Revidierte Version
(ZAREKI-R) [Neuropsychological test battery for number processing and calculation
in children, revised version]. Frankfurt: Harcourt Test Services.
Vukovic, R. K., Kieffer, M. J., Bailey, S. P., & Harari, R. R. (2013). Mathematics anxiety in
young children: Concurrent and longitudinal associations with mathematical
performance. Contemporary Educational Psychology, 38, 1–10.
doi:10.1016/j.cedpsych.2012.09.001
Wachelka, D., & Katz, R. C. (1999). Reducing test anxiety and improving academic self-
esteem in high school and college students with learning disabilities. Journal of
Behavior Therapy and Experimental Psychiatry, 30, 191–198. doi:10.1016/s0005-
7916(99)00024-5
Wang, Z., Hart, S. A., Kovas, Y., Lukowski, S., Soden, B., Thompson, L. A.,… Petrill, S. A.
(2014). Who is afraid of math? Two sources of genetic variance for mathematical
anxiety. Journal of Child Psychology and Psychiatry 55, 1056–1064. doi:
10.1111/jcpp.12224
Wechsler, D. (1974). Wechsler Intelligence Scale for Children-Revised. New York, US:
Harcourt Assessment.
Wechsler, D. (1991). Wechsler Intelligence Scale for Children -Third Edition (WISC-III).
San Antonio, TX, US: Psychological Corporation.
Wechsler, D. (1999). Wechsler Abbreviated Scale of Intelligence (WASI). San Antonio,
TX, US: Harcourt Assessment.

219
Wechsler, D. (2005a). Wechsler Individual Achievement Test 2nd Edition (WIAT II).
London, UK: The Psychological Corp.
Wechsler, D. (2005b) Wechsler Individual Achievement Test - Second UK Edition (WIAT-II
UK). Harcourt Assessment, 2005.
Wigfield, A., Eccles, J. S., Mac Iver, D., Reuman, D. A., & Midgley, C. (1991). Transitions
during early adolescence: Changes in children’s domain-specific self-perceptions and
general self-esteem across the transition to junior high school. Developmental
Psychology, 27, 552–565. doi: 10.1037/0012-1649.27.4.552
Wigfield, A., & Meece, J. L. (1988). Math anxiety in elementary and secondary school
students. Journal of Educational Psychology, 80, 210–216. doi:10.1037/0022-
0663.80.2.210
Williams, J. (2005). Mathematics Assessment for Learning and Teaching. London, UK:
Hodder Education.
Wißmann, J., Heine, A., Handl, P., & Jacobs, A. M. (2013). Förderung von Kindern mit
isolierter Rechenschwäche und kombinierter Rechen- und Leseschwäche: Evaluation
eines numerischen Förderprogramms für Grundschüler. [Remediation for children
with mathematical difficulties: evaluation of a numerical intervention program for
primary school children.]. Lernen Und Lernstörungen, 2, 91–109. doi:10.1024/2235-
0977/a000033
Wine, J. (1980). Cognitive-attentional theory of test anxiety. In I. G. Sarason (Ed.), Test
Anxiety: Theory, Research and Application (pp. 349–385). Hillsdale, NJ: Erlbaum.
WISE. (2015). Women in science, technology, engineering and mathematics: The talent
pipeline from classroom to boardroom, UK Statistics 2014. Retrieved from
https://www.wisecampaign.org.uk/uploads/wise/files/WISE_UK_Statistics_2014.pdf
Wood, W., & Eagly, A. (2013). Biology or culture alone cannot account for human sex
differences and similarities. Psychological Inquiry, 24, 241–247.
doi:10.1080/1047840X.2013.815034
Woodcock, R.W., & Johnson, M.B. (1989). Woodcock-Johnson Psycho-educational Battery–
Revised. Chicago, IL, US: Riverside.

220
Wolf, F. M. (1986). Meta-Analysis: Quantitative methods for research synthesis. US: SAGE
Publications.
World Health Organisation. (1992). ICD-10 classifications of mental and behavioural
disorder: clinical descriptions and diagnostic guidelines. Geneva, Switzerland: World
Health Organisation.
Wren, D. G., & Benson, J. (2004). Measuring test anxiety in children: Scale development and
internal construct validation. Anxiety, Stress & Coping, 17, 227–240. doi:
10.1080/10615800412331292606
Wu, S. S., Barth, M., Amin, H., Malcarne, V., & Menon, V. (2012). Math anxiety in second
and third graders and its relation to mathematics achievement. Frontiers in
Psychology, 3, 162. doi:10.3389/fpsyg.2012.00162
Wu, S. S., Willcutt, E. G., Escovar, E., & Menon, V. (2014). Mathematics achievement and
anxiety and their relation to internalizing and externalizing behaviors. Journal of
Learning Disabilities 47, 503-514. doi:10.1177/0022219412473154
Yang, J., Han, H., Chui, D., Shen, Y., & Wu, J. (2012). Prominent activation of the
intraparietal and somatosensory areas during angle discrimination by intra-active
touch. Human Brain Mapping, 33, 2957–2970. doi:10.1002/hbm.21419
Young, D. (1971). Group Mathematics Test. London, UK: Sevenoaks: Hodder & Stoughton.
Young, C. B., Wu, S. S., & Menon, V. (2012). The neurodevelopmental basis of math
anxiety. Psychological Science, 23, 492–501. doi:10.1177/0956797611429134
Yüksel-Şahin, F. (2008). Mathematics anxiety among 4th and 5th grade Turkish elementary
school students. International Electronic Journal of Mathematics Education, 3, 179–
192. doi:10.1126/science.318.5856.1534
Zirk-Sadowski, J., Lamptey, C., Devine, A., Haggard, M., & Szűcs, D. (2014). Young-age
gender differences in mathematics mediated by independent control or
uncontrollability. Developmental Science, 17, 366–375. doi:10.1111/desc.12126

221
Appendix A. Consent form for Project 1.
Department of Experimental Psychology Craik Marshall Building, Downing Street, Cambridge, CB2 3EB
[Date] Dear Parent/ Guardian, [School name] has given us permission to write to you to ask whether you would permit your child to be included in a research project examining mathematics skills and developmental dyscalculia. Children with developmental dyscalculia lag behind their peers in mathematics performance but otherwise their performance (general cognitive ability, reading, writing) is typical for their age. In particular, the project will examine which current theory of developmental dyscalculia has more explanatory power. We hope that the outcomes of the project will help us to design prevention and intervention methods for children and adults with severe problems in mathematics. We will be testing children over the whole range of mathematical abilities in the hope of identifying the specific areas in which mathematical difficulties might arise. However, because very little is currently known about developmental dyscalculia and there is no agreed definition, we cannot make any kind of diagnosis with regard to development or attainment based on your child’s performance in our study. We can however provide you with your child’s raw scores and details of who to contact should you wish to discuss your child’s progress further. During this phase of the project each participating child will be given a set of tasks involving solving a mathematics test, a reading test, an attention and memory test, a test of general cognitive ability, and some additional computerized mathematics tasks where we measure your child’s reaction times. It is expected that all tasks can be completed in 3 – 4 short sessions of approximately 25 – 40 minutes, to be given at convenient times during the school day. All tasks will be administered by Amy Devine and Alison Nobes. If you prefer we can also arrange for your child to complete the tasks as a home visit or at our lab at the Department of Experimental Psychology in Cambridge during the holidays or weekends. Ideally we would like to follow the development of these skills over time, so we would like to come back in future years to document your child’s progress. At a later stage we would also like to measure the brain’s activity while solving simple arithmetic-related tasks in some of the participating children. You may be sent a separate letter about these brain measurements if you decided to permit your child to participate in the first phase of the study. This research project may not bring any immediate benefits to your child. Rather, we hope that in due course the information that we obtain will help children’s and adults’ educational development and quality of life.

222
Confidentiality/Ethical Approval All data will be identified by a code, with names kept in a locked file. Results are normally presented in terms of anonymised groups and will be presented at conferences and written up in journals. If any individual data were to be presented, the data would be totally anonymous, without any means of identifying the individuals involved. This project has received ethical approval from the Cambridge Psychology Research Ethics Committee. Participation/Withdrawal A consent form is attached to this letter. If you are willing for your child to take part in this study, please complete it and return it to Amy Devine using the provided freepost envelope as soon as possible. There is of course no obligation to participate, and if you decide against it there is no need to provide any information or return the forms at all, although the option is there if you want to confirm receipt of the information so that we do not contact you again, or if you have any comments. Please note that you may withdraw from the project at any stage without explanation. Yours sincerely, Dr Dénes Szucs Amy Devine Alison Nobes

223
Consent Form Cognitive performance in mathematics development: behavioural tasks Dr Dénes Szucs, Amy Devine, Alison Nobes Department of Experimental Psychology, University of Cambridge Craik Marshall Building, Downing Street, Cambridge, CB2 3EB Contact: Amy Devine Tel: 01223 767549; Email: [email protected]
Have you read the information sheet about the study? YES/NO
Have you received sufficient information about the study? YES/NO
Do you understand that you are free to withdraw from the study at any time and without giving a reason for withdrawing?
YES/NO
Do you agree to your child taking part in this study? YES/NO • All data analysis is completely anonymous. Each participant will be given a code for
identification. • Results will be presented at conferences and written up in journals. Results are normally
presented in terms of groups of individuals. If any individual data is presented, the data would be totally anonymous, without any means of identifying the individuals involved.
• You are free to withdraw from the study at any time, without explanation. • This project has received ethical approval from the University of Cambridge
Psychology Research Ethics Committee.
Signed Date
Parent’s name in block letters
Address
Telephone number
Email address
Child’s name in block letters
School Date of birth
Please turn over

224
Appendix B. SES questionnaire for Project 1.
It would be useful for our research if you could also answer the following questions
What is your occupation?
What is the highest level of education you have completed? (tick one)
Less than secondary school
GCSE or equivalent
A Level or equivalent
Some University
Bachelor’s Degree
Master’s Degree
Doctorate Degree
Other (please specify):
Many thanks for taking the time to complete this form and for helping with our research.

225
Appendix C. mAMAS
A modified version of the Abbreviated Mathematics Anxiety Scale 1.
Instructions: Please give each sentence a score in terms of how anxious you would feel during each situation. Use the scale at the right side and circle the number which you think best describes how you feel.
Low anxiety
Some anxiety
Moderate anxiety
Quite a bit of
anxiety
High anxiety
1. Having to complete a worksheet by yourself.
1 2 3 4 5
2. Thinking about a maths test the day before you take it.
1 2 3 4 5
3. Watching the teacher work out a maths problem on the board.
1 2 3 4 5
4. Taking a maths test. 1 2 3 4 5
5. Being given maths homework with lots of difficult questions that you have to hand in the next day.
1 2 3 4 5
6. Listening to the teacher talk for a long time in maths.
1 2 3 4 5
7. Listening to another child in your class explain a maths problem.
1 2 3 4 5
8. Finding out you are going to have a surprise maths quiz when you start your maths lesson.
1 2 3 4 5
9. Starting a new topic in maths. 1 2 3 4 5

226
Appendix D. Spatial Orientation Task. (adapted from Kozhevnikov & Hegarty, 2001)
Map from the Spatial orientation task
Test redacted from electronic version of thesis. See original test in the above reference.

227
Appendix D continued
Test redacted from electronic version of thesis

228
Appendix E. Partial correlations from 4.3.3 (interpretation given on next page).
Table E. Partial correlations controlling for IQ (Raven's CPM) are shown for the relationships between the maths measures and the other
variables. P values were corrected for multiple comparisons using Bonferroni correction (p value divided by the number of comparisons: 39.
Significant correlations are shown in bold (p <.001 in all cases).
Measure 1. Maths Time 1
2. Maths Time 2
3. Maths Time 3
4. Reading Time 1
5. Reading Time 2
6. Reading Time 3
7. Verbal STM Time 2
8. Verbal STM Time 3
9. VSWM Time 2
10. VSWM Time 3
11. MA Time 3
12. SpatialO Time 2
13. SpatialO Time 3
14. Vocab Time 2
15. Vocab Time 3
1. Maths Time 1 - 0.72 0.77 0.40 0.21 0.13 0.19 0.30 0.66 0.53 -0.69 0.52 0.36 0.27 0.38
2. Maths Time 2 - 0.80 0.26 0.42 0.36 0.55 0.55 0.64 0.40 -0.51 0.47 0.12 0.19 0.22
3. Maths Time 3 - 0.15 0.42 0.34 0.33 0.43 0.56 0.45 -0.74 0.43 0.21 0.26 0.19

229
Appendix E continued
After controlling for non-verbal IQ, Maths at Time 1 and Time 2 were significantly
correlated with VSWM at Time 2 (r=.66 and r = .64). However, after controlling for IQ, and
correcting for multiple comparisons, none of the Maths measures were significantly
correlated with VSWM at Time 3. It is important to note that these correlations are still
within the moderate to large range, despite not being significant after correction (r = .40 –
.53). SpatialO Time 3 measures were not correlated with mathematics performance at any of
the time points. Maths at Time 1 and Time 3 were strongly negatively correlated with MA at
Time 3 (r = -.69 and r= -.74 respectively).
However, as noted in section 4.3.3, the correlations in Table E are difficult to interpret
because intelligence develops in concert with working memory (Fry & Hale, 2000).
Moreover, others have noted that controlling for intelligence in cognitive studies of
developmental disorders is not appropriate (Dennis et al., 2009).

230
Appendix F. Consent form for Project 2.
Dear Parent/Guardian, [School name] has expressed an interest in taking part in a new University of Cambridge research study about learning mathematics. Your child’s class will be undertaking some short maths and reading tests as well as some questionnaires about attitudes towards mathematics, the results of which will be useful for the school as well as for the beginning stages of our research. Further information is provided below. If you would prefer that your child did not participate in the whole class standardised tests/ questionnaires then please return the attached form to your school or contact your child's teacher before the date indicated on the form. At a later stage, some children may be asked to do some further individual testing at school, but you will be sent an information pack and consent form beforehand if your child is involved. What is the project about? We are conducting a study examining the development of numerical abilities and attitudes towards mathematics in primary and secondary school children. What will my child be asked to do? Your child will complete standardised mathematics and reading tests. The tests would be administered by our researchers to the whole class and take 30- 45 min each. Furthermore your child will complete three short questionnaires about attitudes towards mathematics. What will happen with the results? All data will be identified by a code, with names kept in a locked file and we shall not be identifying either the children or the school by name in any reports that we make about the study. We will provide anonymised results to the school. At your request, we are able to provide the children’s raw scores from the tests, however, it is not possible to make any formal diagnosis with regard to development or attainment based on these scores. Centre for Neuroscience in Education
Department of Psychology
University of Cambridge, Downing Street, Cambridge CB2 3EB
Tel: +44 (0)1223 333550 Fax: +44 (0)1223 333564
http://www.cne.psychol.cam.ac.uk/
Department of Psychology

231
What if I do not want my child to participate? Participation in this study is entirely voluntary and the children are free to withdraw their participation from the study at any time. If you would prefer that your child did not participate in the whole class tests then please complete the attached form and return it to your child's teacher before the date indicated. This project has received ethical approval from the Cambridge Psychology Research Ethics Committee. If you would like further information please Amy Devine by telephone: 01223 767549 or email: [email protected]. Yours sincerely,
Dr. Dénes Szucs, Amy Devine and Francesca Hill. Centre for Neuroscience in Education
Department of Psychology
University of Cambridge, Downing Street, Cambridge CB2 3EB
Tel: +44 (0)1223 333550 Fax: +44 (0)1223 333564
http://www.cne.psychol.cam.ac.uk/
Department of Psychology

232
Opt-out Form Mathematics attitudes project Dr Dénes Szucs, Amy Devine, Francesca Hill Department of Psychology, University of Cambridge Craik Marshall Building, Downing Street, Cambridge, CB2 3EB Contact: Amy Devine Tel: 01223 767549; Email: [email protected] I would prefer that my child did not participate in the whole class standardised tests.
Signed Date
Parent’s name in block letters
Name of child Class
Please return this letter to your child's teacher by ____________________
Centre for Neuroscience in Education
Department of Psychology
University of Cambridge, Downing Street, Cambridge CB2 3EB
Tel: +44 (0)1223 333550 Fax: +44 (0)1223 333564
http://www.cne.psychol.cam.ac.uk/
Department of Psychology

233
Appendix G Table G. Percentiles for each raw score of the mAMAS.
MA raw score Percentile MA raw score Percentile
9 4.7 29 88.6
10 9.7 30 90.2
11 14.6 31 92.0
12 19.9 32 92.8
13 25.3 33 94.4
14 31.1 34 95.8
15 35.2 35 96.7
16 40.5 36 97.4
17 46.2 37 97.9
18 50.5 38 98.2
19 54.7 39 98.5
20 58.9 40 99.0
21 63.4 41 99.2
22 67.2 42 99.3
23 70.2 43 99.5
24 73.8 44 99.7
25 77.9 45 100
26 81.2
27 83.8
28 86.2

234