
Cofiring coal and dairy biomass in a 29 kW t furnace
14
Cofiring coal and dairy biomass in a 29 kW t furnace Ben Lawrence a , Kalyan Annamalai a, * , John M. Sweeten b , Kevin Heflin b a MS 3123 TAMU, Texas A&M University, College Station, TX 77843, United States b Texas AgrLife Research, TAMU System, 6500 Amarillo Blvd. West, Amarillo, TX 79106, United States article info Article history: Received 17 October 2008 Received in revised form 2 February 2009 Accepted 3 February 2009 Available online 11 April 2009 Keywords: Cofiring Coal Dairy biomass Combustion Emissions abstract Cofiring biomass with fossil fuels is emerging as a viable option for promoting the use of low quality renewable biomass fuels including energy crops. In the current work, dairy biomass (DB) is evaluated as a cofiring fuel with coal in a small scale 29 kW t boiler burner facility. Two types of coal (Texas lignite, TXL and Wyoming Powder River Basin coal, WYO) and two forms of partially composted DB fuels were investigated (low ash separated solids LA-PC-SepSol-DB and high ash soil surface HA-PC-SoilSurf-DB). Proximate and ultimate analyses performed on both coals and both DBs reveal the following: higher heat- ing value (HHV) of 28,460–29,590 kJ/kg for dry ash free (DAF) coals and 21,450 kJ/kg for DB; nitrogen loading of 0.36 and 0.48 kg/GJ for WYO and TXL, respectively and 1.50 and 2.67 kg/GJ for the LA-PC-Sep- Sol-DB and the HA-PC-SoilSurf-DB respectively; sulfur loading of 0.15 and 0.42 kg/GJ WYO and TXL, respectively and 0.33 and 0.43 kg/GJ for the LA-PC-SepSol-DB and the HA-PC-SoilSurf-DB respectively; ash loading from 3.10 to 8.02 kg/GJ for the coals and from 11.57 to 139 kg/GJ for the DB fuels. The cofiring experiments were performed with 90:10 and 80:20 and 100:00 (mass%) coal:DB blend (96:4, 92:8, 100:00 – % on heat basis). The results revealed that the blend burns more completely in the boiler, due to the earlier release of biomass volatiles and higher amount of volatile matter. Results were obtained for burnt fraction, NO x and CO emission. Pure TXL produced 1505 ppm of CO at an equivalence ratio of 1.1. An 80:20 blend of TXL:LA-PC-SepSol-DB produced 4084 ppm of CO at the same equivalence ratio. The NO x emissions for equivalence ratio varying from 0.9 to 1.2 ranged from 0.4 to 0.13 kg/GJ for pure TXL coal. The corresponding NO x emissions are 0.8–0.10 kg/GJ for pure WYO coal. For 80:20 TXL:LA-SepS-DB blend they ranged from 0.375 to 0.05 kg/GJ over the same range. In gen- eral, the blends produced less NO x than pure coal under rich conditions even though the DB contained more nitrogen. This result is probably due to the fuel bound nitrogen in dairy biomass is mostly in the form of urea which reduces NO x to N 2 . Ó 2009 Elsevier Ltd. All rights reserved. 1. Introduction Large coal fired plants produce almost 310 GW of electricity requiring almost 930 GW of thermal energy input. Cofiring, a cost effective method in reducing fossil fuel costs and in promoting the use of alternate fuels, is defined as combustion of two dissimilar fuels. The cofiring which can provide up to 15% of heat input has been successfully demonstrated over 150 installations world wide [1]. Boiler efficiency has not suffered when the share of cofired fuel is of the order 5–10%. The biomass fuels can be fired by (i) premix- ing of the two solid fuels (such as done in these experiments) when biomass contributes <10% of the total heat input (ii) by firing coal in central fuel nozzle with biomass in the coaxial nozzle) and (iii) firing biomass separately (a single boiler when heat input is more than 10% but less desirable because of complexities in tuning up the air) in a single boiler [2]. The biomass, a renewable fuel supple- ment to coal in boilers, can be classified as: agriculture based bio- mass (AgB) and animal waste based biomass fuels (AnB). Typically coal is milled to a fine powder and fired in a suspension fired boiler and hence there is expectation by the utilities that the biomass needs to be ground to similar size. It is noted that the use of bio- mass itself directly does not reduce CO 2 per MJ as seen in Fig. 1 constructed with use of Boie equation (see Table 1 footnote) [1]; the direct emissions of CO 2 in g/MJ (or kg/GJ) from coal and bio- mass are similar even though the H/C ratio is higher for biomass than that for coal. CO 2 emissions are the same for coal and biomass because both have similar carbon loading on per unit heat basis. Higher H/C implies lower C and hence lower CO 2 on a mass basis. However, it is seen that biomass has a higher O/C ratio which low- ers the heat value. Hence, the emission of CO 2 on a heat basis is normally similar. The advantages of cofiring with biomass are reduction of fuel and capital cost, CO 2 reduction due to renewable nature of fuel and NO x reduction when low nitrogen AgB fuels 0306-2619/$ - see front matter Ó 2009 Elsevier Ltd. All rights reserved. doi:10.1016/j.apenergy.2009.02.003 * Corresponding author. Tel.: +1 979 845 2562; fax: +1 979 845 3081. E-mail addresses: [email protected] (B. Lawrence), kannamalai@ tamu.edu (K. Annamalai), [email protected] (J.M. Sweeten), k-hefl[email protected] (K. Heflin). Applied Energy 86 (2009) 2359–2372 Contents lists available at ScienceDirect Applied Energy journal homepage: www.elsevier.com/locate/apenergy
-
Upload
independent -
Category
Documents
-
view
0 -
download
0
Transcript of Cofiring coal and dairy biomass in a 29 kW t furnace

Applied Energy 86 (2009) 2359–2372
Contents lists available at ScienceDirect
Applied Energy
journal homepage: www.elsevier .com/locate /apenergy
Cofiring coal and dairy biomass in a 29 kWt furnace
Ben Lawrence a, Kalyan Annamalai a,*, John M. Sweeten b, Kevin Heflin b
a MS 3123 TAMU, Texas A&M University, College Station, TX 77843, United Statesb Texas AgrLife Research, TAMU System, 6500 Amarillo Blvd. West, Amarillo, TX 79106, United States
a r t i c l e i n f o
Article history:Received 17 October 2008Received in revised form 2 February 2009Accepted 3 February 2009Available online 11 April 2009
Keywords:CofiringCoalDairy biomassCombustionEmissions
0306-2619/$ - see front matter � 2009 Elsevier Ltd. Adoi:10.1016/j.apenergy.2009.02.003
* Corresponding author. Tel.: +1 979 845 2562; faxE-mail addresses: [email protected] (B
tamu.edu (K. Annamalai), [email protected] (J.M.(K. Heflin).
a b s t r a c t
Cofiring biomass with fossil fuels is emerging as a viable option for promoting the use of low qualityrenewable biomass fuels including energy crops. In the current work, dairy biomass (DB) is evaluatedas a cofiring fuel with coal in a small scale 29 kWt boiler burner facility. Two types of coal (Texas lignite,TXL and Wyoming Powder River Basin coal, WYO) and two forms of partially composted DB fuels wereinvestigated (low ash separated solids LA-PC-SepSol-DB and high ash soil surface HA-PC-SoilSurf-DB).Proximate and ultimate analyses performed on both coals and both DBs reveal the following: higher heat-ing value (HHV) of 28,460–29,590 kJ/kg for dry ash free (DAF) coals and 21,450 kJ/kg for DB; nitrogenloading of 0.36 and 0.48 kg/GJ for WYO and TXL, respectively and 1.50 and 2.67 kg/GJ for the LA-PC-Sep-Sol-DB and the HA-PC-SoilSurf-DB respectively; sulfur loading of 0.15 and 0.42 kg/GJ WYO and TXL,respectively and 0.33 and 0.43 kg/GJ for the LA-PC-SepSol-DB and the HA-PC-SoilSurf-DB respectively;ash loading from 3.10 to 8.02 kg/GJ for the coals and from 11.57 to 139 kg/GJ for the DB fuels.
The cofiring experiments were performed with 90:10 and 80:20 and 100:00 (mass%) coal:DB blend(96:4, 92:8, 100:00 – % on heat basis). The results revealed that the blend burns more completely inthe boiler, due to the earlier release of biomass volatiles and higher amount of volatile matter.
Results were obtained for burnt fraction, NOx and CO emission. Pure TXL produced 1505 ppm of CO atan equivalence ratio of 1.1. An 80:20 blend of TXL:LA-PC-SepSol-DB produced 4084 ppm of CO at thesame equivalence ratio. The NOx emissions for equivalence ratio varying from 0.9 to 1.2 ranged from0.4 to 0.13 kg/GJ for pure TXL coal. The corresponding NOx emissions are 0.8–0.10 kg/GJ for pure WYOcoal. For 80:20 TXL:LA-SepS-DB blend they ranged from 0.375 to 0.05 kg/GJ over the same range. In gen-eral, the blends produced less NOx than pure coal under rich conditions even though the DB containedmore nitrogen. This result is probably due to the fuel bound nitrogen in dairy biomass is mostly in theform of urea which reduces NOx to N2.
� 2009 Elsevier Ltd. All rights reserved.
1. Introduction
Large coal fired plants produce almost 310 GW of electricityrequiring almost 930 GW of thermal energy input. Cofiring, a costeffective method in reducing fossil fuel costs and in promoting theuse of alternate fuels, is defined as combustion of two dissimilarfuels. The cofiring which can provide up to 15% of heat input hasbeen successfully demonstrated over 150 installations world wide[1]. Boiler efficiency has not suffered when the share of cofired fuelis of the order 5–10%. The biomass fuels can be fired by (i) premix-ing of the two solid fuels (such as done in these experiments) whenbiomass contributes <10% of the total heat input (ii) by firing coalin central fuel nozzle with biomass in the coaxial nozzle) and (iii)firing biomass separately (a single boiler when heat input is more
ll rights reserved.
: +1 979 845 3081.. Lawrence), kannamalai@
Sweeten), [email protected]
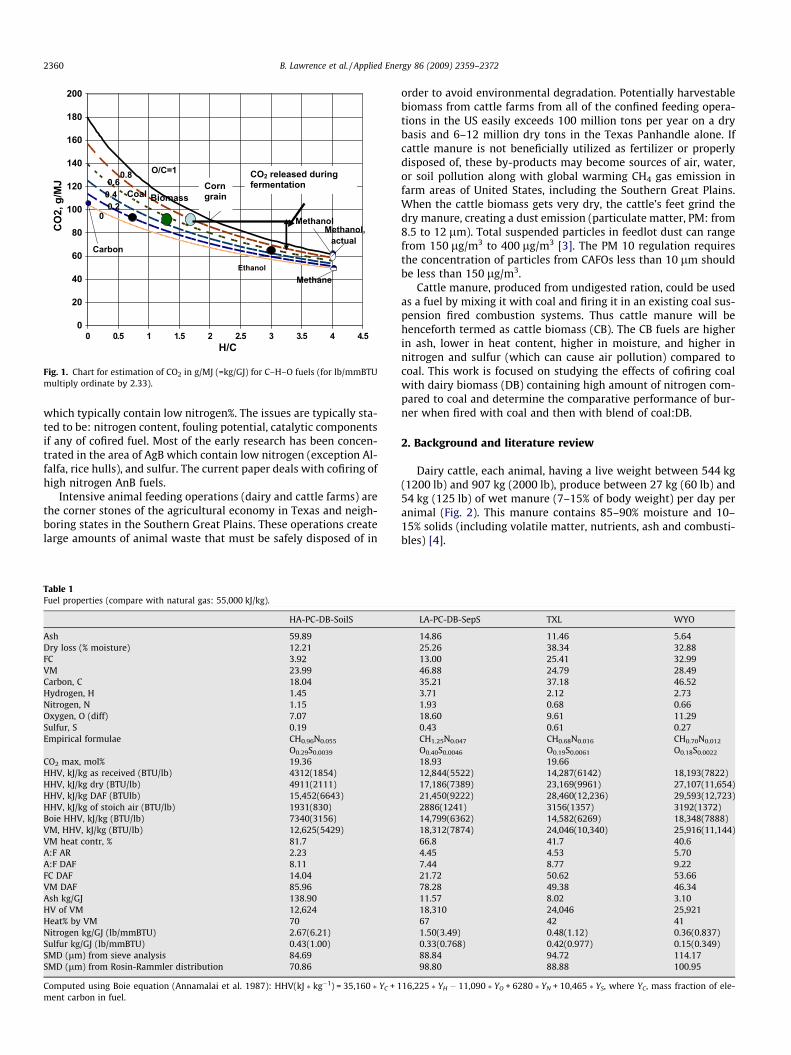
than 10% but less desirable because of complexities in tuning upthe air) in a single boiler [2]. The biomass, a renewable fuel supple-ment to coal in boilers, can be classified as: agriculture based bio-mass (AgB) and animal waste based biomass fuels (AnB). Typicallycoal is milled to a fine powder and fired in a suspension fired boilerand hence there is expectation by the utilities that the biomassneeds to be ground to similar size. It is noted that the use of bio-mass itself directly does not reduce CO2 per MJ as seen in Fig. 1constructed with use of Boie equation (see Table 1 footnote) [1];the direct emissions of CO2 in g/MJ (or kg/GJ) from coal and bio-mass are similar even though the H/C ratio is higher for biomassthan that for coal. CO2 emissions are the same for coal and biomassbecause both have similar carbon loading on per unit heat basis.Higher H/C implies lower C and hence lower CO2 on a mass basis.However, it is seen that biomass has a higher O/C ratio which low-ers the heat value. Hence, the emission of CO2 on a heat basis isnormally similar. The advantages of cofiring with biomass arereduction of fuel and capital cost, CO2 reduction due to renewablenature of fuel and NOx reduction when low nitrogen AgB fuels
0
20
40
60
80
100
120
140
160
180
200
0 0.5 1 1.5 2 2.5 3 3.5 4 4.5H/C
CO
2, g
/MJ
O/C=10.80.6
0.40.2
0
Carbon
Methane
MethanolMethanol,
actual
Coal
Ethanol
Corn grain Biomass
CO2 released during fermentation
Fig. 1. Chart for estimation of CO2 in g/MJ (=kg/GJ) for C–H–O fuels (for lb/mmBTUmultiply ordinate by 2.33).
2360 B. Lawrence et al. / Applied Energy 86 (2009) 2359–2372
which typically contain low nitrogen%. The issues are typically sta-ted to be: nitrogen content, fouling potential, catalytic componentsif any of cofired fuel. Most of the early research has been concen-trated in the area of AgB which contain low nitrogen (exception Al-falfa, rice hulls), and sulfur. The current paper deals with cofiring ofhigh nitrogen AnB fuels.
Intensive animal feeding operations (dairy and cattle farms) arethe corner stones of the agricultural economy in Texas and neigh-boring states in the Southern Great Plains. These operations createlarge amounts of animal waste that must be safely disposed of in
Table 1Fuel properties (compare with natural gas: 55,000 kJ/kg).
HA-PC-DB-SoilS
Ash 59.89Dry loss (% moisture) 12.21FC 3.92VM 23.99Carbon, C 18.04Hydrogen, H 1.45Nitrogen, N 1.15Oxygen, O (diff) 7.07Sulfur, S 0.19Empirical formulae CH0.96N0.055
O0.29S0.0039
CO2 max, mol% 19.36HHV, kJ/kg as received (BTU/lb) 4312(1854)HHV, kJ/kg dry (BTU/lb) 4911(2111)HHV, kJ/kg DAF (BTUlb) 15,452(6643)HHV, kJ/kg of stoich air (BTU/lb) 1931(830)Boie HHV, kJ/kg (BTU/lb) 7340(3156)VM, HHV, kJ/kg (BTU/lb) 12,625(5429)VM heat contr, % 81.7A:F AR 2.23A:F DAF 8.11FC DAF 14.04VM DAF 85.96Ash kg/GJ 138.90HV of VM 12,624Heat% by VM 70Nitrogen kg/GJ (lb/mmBTU) 2.67(6.21)Sulfur kg/GJ (lb/mmBTU) 0.43(1.00)SMD (lm) from sieve analysis 84.69SMD (lm) from Rosin-Rammler distribution 70.86
Computed using Boie equation (Annamalai et al. 1987): HHV(kJ � kg�1) = 35,160 � YC + 1ment carbon in fuel.
order to avoid environmental degradation. Potentially harvestablebiomass from cattle farms from all of the confined feeding opera-tions in the US easily exceeds 100 million tons per year on a drybasis and 6–12 million dry tons in the Texas Panhandle alone. Ifcattle manure is not beneficially utilized as fertilizer or properlydisposed of, these by-products may become sources of air, water,or soil pollution along with global warming CH4 gas emission infarm areas of United States, including the Southern Great Plains.When the cattle biomass gets very dry, the cattle’s feet grind thedry manure, creating a dust emission (particulate matter, PM: from8.5 to 12 lm). Total suspended particles in feedlot dust can rangefrom 150 lg/m3 to 400 lg/m3 [3]. The PM 10 regulation requiresthe concentration of particles from CAFOs less than 10 lm shouldbe less than 150 lg/m3.
Cattle manure, produced from undigested ration, could be usedas a fuel by mixing it with coal and firing it in an existing coal sus-pension fired combustion systems. Thus cattle manure will behenceforth termed as cattle biomass (CB). The CB fuels are higherin ash, lower in heat content, higher in moisture, and higher innitrogen and sulfur (which can cause air pollution) compared tocoal. This work is focused on studying the effects of cofiring coalwith dairy biomass (DB) containing high amount of nitrogen com-pared to coal and determine the comparative performance of bur-ner when fired with coal and then with blend of coal:DB.
2. Background and literature review
Dairy cattle, each animal, having a live weight between 544 kg(1200 lb) and 907 kg (2000 lb), produce between 27 kg (60 lb) and54 kg (125 lb) of wet manure (7–15% of body weight) per day peranimal (Fig. 2). This manure contains 85–90% moisture and 10–15% solids (including volatile matter, nutrients, ash and combusti-bles) [4].
LA-PC-DB-SepS TXL WYO
14.86 11.46 5.6425.26 38.34 32.8813.00 25.41 32.9946.88 24.79 28.4935.21 37.18 46.523.71 2.12 2.731.93 0.68 0.6618.60 9.61 11.290.43 0.61 0.27CH1.25N0.047 CH0.68N0.016 CH0.70N0.012
O0.40S0.0046 O0.19S0.0061 O0.18S0.0022
18.93 19.6612,844(5522) 14,287(6142) 18,193(7822)17,186(7389) 23,169(9961) 27,107(11,654)21,450(9222) 28,460(12,236) 29,593(12,723)2886(1241) 3156(1357) 3192(1372)14,799(6362) 14,582(6269) 18,348(7888)18,312(7874) 24,046(10,340) 25,916(11,144)66.8 41.7 40.64.45 4.53 5.707.44 8.77 9.2221.72 50.62 53.6678.28 49.38 46.3411.57 8.02 3.1018,310 24,046 25,92167 42 411.50(3.49) 0.48(1.12) 0.36(0.837)0.33(0.768) 0.42(0.977) 0.15(0.349)88.84 94.72 114.1798.80 88.88 100.95
16,225 � YH � 11,090 � YO + 6280 � YN + 10,465 � YS, where YC, mass fraction of ele-

Fig. 2. Cattle feed life cycle (adapted from www.dpi.qld.gov.au/environment/5166.html).
B. Lawrence et al. / Applied Energy 86 (2009) 2359–2372 2361
The DB fuel properties (chiefly ash content) depend greatly onthe collection technique used when the manure is gathered fromthe dairy. Most dairies have a soil base with an interfacial layerwhich consists of mixed soil and manure. If the manure is not har-vested carefully some of the interfacial layer will be disturbed andcollected with the manure as in the case of FB. This leads to higherash content in the manure. Collection techniques for DB are similarto FB when one of the following methods is used: wheel loaderalone, chisel-plow followed by wheel loader, or box scraper [4].
For dairy cattle (milking herd) housed on concrete-floored milk-ing house, fresh manure is collected by flushing the milking housefloor with water or scraping the manure or using a vacuumingtechnique. This manure does not contain soil. The flushed solids–water slurry (95% water, 5% solids containing combustibles ash)is then passed through a mechanical separator to separate the sol-ids (called separated solids, SS) and liquids. This separated liquidcontaining approximately 3–6% solids can then be used as lagoonwater. The SS, still containing 80% water, can be used as a fuel [5].
Tillman [6] cofired coal with low nitrogen AgB and showed thatNOx can be reduced by cofiring; thus NOx was reduced simply byreducing the nitrogen loading to the furnace. However reportedthe amount of NOx reduction (measured trend line) was greaterthan expected based on theoretical data from the authors. TheNOx reduction cannot be explained solely by reduced nitrogenloading (Fig. 3). It is hypothesized by the current authors that theincreased volatile matter of AgB under cofiring conditions resultedin increased volatiles release and hence rapid reduction of O2
which reduces the rate of formation of NOx from fuel nitrogen.Lundgren [7] studied using horse manure from ranches for on
site heat production. He found that the horse manure could beeffectively disposed of through firing in a small stoker burnerand the heat released could be used for on site applications. Lund-
gren reported 370 mg/m3 of NOx (approximately 324 ppm assum-ing that 370 mg refers to NO) at 10% excess O2. However no datawas presented under slightly rich combustion conditions. Milleret al. [8] showed that dairy biomass had 14 times more moisturecompared to coal on an as received basis. On a dry basis, the dairybiomass had 1.25 times more volatile matter and 4.25 times moreash than coal. The coal had 8 times more fixed carbon than thedairy biomass on an as received basis.
Di Nola [9] used an FTIR instrument to measure the concentra-tions of HCN and NH3 in the early flame stages of coal and coal:-litter biomass blends. His work showed that coal alone canproduce upwards of 700 ppm of HCN and approximately80 ppm of NH3. The results show that when 20% by mass litterbiomass by mass was blended with the coal, HCN decreased toapproximately 250 ppm and NH3 increased to approximately200 ppm. However no data on HCN and NH3 were presented forpure litter biomass (LB). Using the linearity rule, the presentauthors estimate that the LB can produce no HCN and 680 ppmNH3. So, it is apparent that LB fuel contains more nitrogen inthe form of NH3 (which is a good agent for reducing NOx) and lessnitrogen in the form of HCN. The nitrogen in animal waste origi-nates from urea. Thus, cofiring coal with DB has the potential toreduce the formation of NOx. A comprehensive literature reviewon cofiring of coal with agricultural and animal waste based bio-mass fuels was undertaken earlier and the review article waspublished in 2001 [10]; Previous work [11–17] was concernedwith cofiring coal with feedlot biomass (FB). However informa-tion about cofiring coal with dairy biomass is relatively sparsein the current literature. The specific topic of cofiring coal withDB is relatively sparse in the current literature. The diet fed todairy animals is different compared to feedlot animals to enhancethe milk production over beef production.

Fig. 3. Synergistic NOx reduction from cofiring biomass. Adapted from [6].
2362 B. Lawrence et al. / Applied Energy 86 (2009) 2359–2372
3. Objective
It is apparent from literature review that there is no prior dataon the effect of cofiring low quality and high nitrogen DB on thecombustion and emission characteristics. Hence, the objective ofthe current work is to determine the combustion and emission per-formance of pure coal and coal:DB blends using a small scale boiler(29 kWt) burner facility.
4. Experiments
4.1. Experiment facility
The current boiler burner facility (Texas A&M University, ther-mal rating of 29 kWt (100,000 Btu/h)) for firing either coal orcoal:feedlot biomass fuel blends is shown in Fig. 4. The main fur-nace is 0.1524 m (6 in.) in diameter, and is made of a 0.0508 m(2 in.) silica ceramic shell surrounded by a 0.0508 m (2 in.) thicksilica fiber blanket and a 6.35 mm (0.25 in.) steel shell. Along thewalls of the furnace there were several gas sampling ports andtemperature measurements ports located 15.24 cm (6 in.) apart.Dual water jets (8) injected water into the boiler to catch particu-lates and to cool hot gas stream and then the colder exhaust gasesvented out through an exhaust system. The cooling water isdrained off into a sump.
The combustion air was supplied to the boiler burner by a sec-ondary air compressor. The secondary air (80–90% of total air) waspreheated to a minimum of 473.15 K (392 �F) with the use of a cir-culation heater (720 W (2456.7 Btu/h)) before it entered the boilerthrough a swirler. The pre-heat temperature was varied to bettercontrol the maximum furnace temperature. Secondary air is in-jected co-axially with the primary air and the fuel but with a swirlmotion. The formula suggested by [16] was used to obtain a swirlnumber of 0.7 for this burner. In addition to the swirler, a ceramicdiffuser, or quarl is used to stabilize the flame. The quarl is made ofsilica ceramic and has an l/d ratio of 1.8 and a half angle of 24�.
The fuel feed system is a commercial volumetric feeding sys-tem, accurate to within 2% for samples taken over a 1-min interval.The primary air transports the fine fuel suspension injected
through a Venturi valve into the quarl of the boiler burner. The en-tire facility was operated from a central control panel.
The burner was fitted with two propane torches, which serve topreheat the boiler and initiate combustion. Once the coal flowstarted, the torch was turned off.
Primary air was provided from a compressed air line and wasused to carry solid fuel to the burner nozzle. The amount of pri-mary air was dictated by the feeder and was constant at 5.95 m3/h (15–25% of total air). However, secondary air (75–85% of totalair) was provider by a separate compressed air line and could beadjusted to change the equivalence ratio at constant fuel feed rateso that the thermal rating is kept constant. Combustion any leanerthan equivalence ratio of 0.8 created a heavy strain on the com-pressor and hence lowest equivalence ratio was set at 0.8.
4.2. Procedure
The secondary air heater was run for an hour before the exper-iment was started. Once the secondary air reached a steady tem-perature approximately 500 K (440.33 �F) the propane torcheswere ignited. Natural gas and propane were used to preheat thefurnace to operating temperatures. Approximately 40 L/min of nat-ural gas were fired for about 180 min in the furnace with the flamekept near stoichiometric. Once the furnace reached 1366 K(2000 �F), the natural gas was turned off and the natural gas linewas closed. The solid feeder line was opened and the solid feederwas turned on and set to the desired fuel flow rate. The primaryand secondary air lines were set to the appropriate flow rates toobtain the desired equivalence ratio. The furnace was allowed torun for 30 min before the first readings were taken. After 75 minof firing fuel, additional fuel was added to the hopper. The mea-surement was taken at the last sampling port just before thequenching water sprays and the wet flue gases were ducted tothe atmosphere. After taking a measurement at this equivalenceratio, the secondary air could be adjusted to a different equivalenceratio. After taking measurements at all desired equivalence ratios,the furnace was turned off. To turn of the furnace, the fuel feederwas turned off and the primary air line was closed. The secondaryair was cut back to 200 L/min and the view port windows were

Fig. 4. Experimental facility.
B. Lawrence et al. / Applied Energy 86 (2009) 2359–2372 2363
opened to cool the furnace. Cooling the furnace required approxi-mately 4 h.
4.3. Diagnostics
Primary air flow measurements were made using volumetricflow meters. Two flow meters were used, one for motive air andone for eductor air. Each flow meter was calibrated to be accuratein the range of 20–200 SCFH of air with an accuracy of ±5 SCFH.Secondary air was measured using a digital gas mass flow control-ler. The flow meter was calibrated to be accurate in the range of 0–1000 SLPM of air with an accuracy of ±1.5% FS of the flow. The tem-perature profile along the axial length of the furnace was measuredby 12 type K (shielded, ungrounded) thermocouples in the boilerand type S thermocouples in the secondary air stream. Flue gasconcentrations were measured using an portable flue gas analyzercapable of measuring CO, CO2, NOx, SO2, and O2 in a flue gasstream. The analyzer uses electrochemical cells to detect flue gasesin low range applications and NDIR in middle range applications.The probe also contained a type K thermocouple mounted at thetip for temperature measurements.
5. Results and discussion
5.1. Fuels
TXL was used as the base case fuel. TXL and WYO were firedalone and as blends with two DB fuels. Each coal was blended witheach DB fuel in 100–0, 95–5, 90–10, and 80–20 blends on a massbasis. This created 14 different fuel blends. For each blended fuel,the equivalence ratio was varied from 0.8 to 1.2 in 0.1 increments.
The 80–20 blends were too rich in DB to be used in industrial appli-cations, but were used in order to get more data points for thestudy. In the rich regime (equivalence ratio > 1.0) the high ash soilsurface dairy biomass quickly clogged the sampling port due tohigh ash content. Thus, a full set of data points could not be gener-ated. In order to compare the performance at same thermal output,the coal: biomass blends needed to be fired at higher feed rate dueto lower heat value of DB.
5.1.1. Fuel preparationThe cofiring approach in existing suspension fired burners re-
quires grinding of high ash, high moisture, and heterogeneous bio-mass almost to the same fineness as coal. High moisture andfibrous nature of biomass created grinding difficulties. Thus thebiomass fuels were composted for 90 days in a greenhouse [17]to provide more homogeneity and to reduce the moisture. Henceboth of the biomass fuels had less moisture than either of the coals.
5.1.2. Fuel propertiesAll fuel samples used in cofiring tests were analyzed by Hazen
Laboratories in Colorado for ultimate, proximate, and heat analy-ses. Table 1 presents the results of fuel analyses and derived fuelproperties. Note that the DB fuels are much higher in nitrogen thancoal fuels. This is different from most AgB fuels (e.g. saw dust, cornstalks, switch grass, nut shells, rice hulls, etc.) which are lower innitrogen than coal. Manure based biomass is the exception to thisgenerality. The ash in high ash, partially composted, soil surface,dairy biomass (HA-PC-SoilSurf-DB) was more than 10 times thatof Wyoming Powder River Basin coal. The heat values of HA-PC-SoilSurf–DB are unreliable due to very high ash content. The exper-iments with coal (Texas lignite and Wyoming coal): high ash soil

2364 B. Lawrence et al. / Applied Energy 86 (2009) 2359–2372
surface dairy biomass blends were mostly unsuccessful due toexcessive amounts of particulate matter (mostly ash) cloggingthe flue gas analyzer. The SMD’s were calculated based on the sieveanalyses as well as using a Rosin-Rammler plot and they are pre-sented in Table 1.
Low ash, partially composted, separated solids, dairy biomass(LA-PC-SepSol-DB) was almost three times richer in nitrogen thanWyoming Powder River Basin coal. Although, low ash separatedsolids dairy biomass was more than four times lower in ash thanhigh ash soil surface dairy biomass, it was still higher in ash thaneither coal. On a dry ash free basis, the dairy biomass fuels con-tained almost twice the volatile matter of coal, and hence less fixedcarbon. Since HHV of DAF fuel is approximately given as:
HHVDAF � VMDAF � HHVVM þ FCDAF � HVFC
where HHV DAF is the dry ash free higher heating value,FCDAF = 1 � VMDAF, HVFC = 32,806 kJ/kg of C, the HVVM can be esti-mated; the% heat contribution by VM is then computed using therelation:% heat by
VM ¼ HHVDAF ¼ fVMDAF � HHVVMg � 100=HHVDAF
It is seen from Table 1 that even though the VM% is higher bytwice the amount of VM of coal, the heat% contribution is not twicethat of coal due to lower HV of VM from DB. On a heat basis, the DBfuels had higher nitrogen contents than coal.
The TGA experiments revealed that 10% mass loss rate for dryDB occurs at 553 K while it occurs at 685 K for WYC indicating thatpyrolysis occurs at lower temperature compared to coal [18]. It isapparent that the DB released VM at lower temperature comparedto TXL and WYO.
5.2. Exhaust O2 analysis
The air fuel ratio (A:F), and hence the equivalence ratio (/), canbe estimated from measured flow rates of air ( _mA) and the cali-brated fuel flow rate ( _mF). Equivalence ratio can also be computedusing the measured O2 or CO2% in the exhaust for lean mixtures.For any C–H–O fuel, the equivalence ratio based on flue gas analy-sis can be derived to be [19,20]
/fuel ¼ 1� XO2 ðN2=O2ÞAXN2
ð1aÞ
y =
0
0.1
0.2
0.3
0.4
0.5
0.6
0.7
0.8
0.9
1
0 0.5 1 1.5H/C a
CO
2/(p
i*CO
2max
)
O/C=0,pi=0.9O/C=1,pi=0.8
CoalBiomass
Fig. 5. The CO2, CO2 max and / (inverse of stoi
where Xk, mole fraction of species k in dry products under completecombustion and (N2/O2)A the N2:O2 mole ratio in supplied gas. Eq.(1a) is also applicable to CHNOS fuels as long as N in fuel exists intrace amounts (ex. coal, DB). If XN2 � XN2 ;A, ambient air mole frac-tion and with
XO2 ;A
XN2 ;A¼ O2
N2
� �A
uflue � 1� XO2
XO2 ;A; / < 1:0 ð1bÞ
where XO2 is the measured mole fraction of oxygen in the flue gases(dry basis), and XO2 ;A is the mole fraction of oxygen in the ambientair (dry basis). XO2 ;A is typically 0.21. Eq. (1) states that when XO2 ismaintained same when switching fuels, the equivalence ratio andhence excess air% remains the same. Similar derivation can be per-formed for any CHOS and shown that
XCO2=XCO2 max ¼ ½1� XO2f1þ ðN2=O2ÞAg�¼ ½1� ð1� /ÞXN2fðO2=N2ÞA þ 1g� ð2Þ
where XCO2 max is maximum CO2 dry mole fraction under stoichi-ometric condition. Note that the use of Eq. (2) requires aknowledge of composition of fuel for calculating XCO2 ;max whileO2% method does not. The above equations (Eqs. (1a) and (2))are also applicable to CHNOS fuels when N is in trace amountsin the fuel (e.g. coal, DB, etc.). It is seen that use of (1b) reducesto (2).
The above approximation has been checked C–H–O fuels for 0,10%, 20% excess air and the fit for ½XCO2=fXCO2 � /g� is almost inde-pendent of O/C and H/C and ½XCO2=fXCO2 � /g� � 1 for O/C rangingfrom 0 to 1 and H/C ranging from 0 to 4 (Fig. 5).
Eq. (1b) is used to estimate /flue rather than Eq. (2) since it doesnot require a knowledge of fuel composition. When burnt fractionless than 1, the measured O2 percentage will increase which willcause the equivalence ratio based on flue gases to be artificiallylean. Fig. 6 plots the /flue computed from flue gas analysis versusthe /flow computed from measured air and fuel flow rates. For bothTXL and WYC. Ideally, the data points would follow a 45 degreeline (solid line in Fig. 6, indicating /flue and /flow were in perfectagreement. If data points fall below the indicated line, this willindicate burnt fraction <1; however, figure shows that data pointsfall on both sides.
In all future plots, unless otherwise indicated, the subscript‘‘flow” will be omitted and hence / represents the equivalence ra-
-0.0084x + 1.0119R2 = 0.9602
2 2.5 3 3.5 4tom Ratio
Methane
chiometric ratio) relation for various fuels.

A:F φ vs. Exhaust φ
0.7
0.8
0.9
1
1.1
0.7 0.8 0.9 1 1.1φ Flow
φ Fl
ue
TXL 90-10 TXL:LA-PC-DB-SepS80-20 TXL:LA-PC-DB-SepS Ideal LineWYO 90-10 WYO:LA-PC-DB-SepS80-20 WYO:LA-PC-DB-SepS
Fig. 6. Equivalence ratio based on air flow rates and the calibrated fuel flow rate vs.equivalence ratio based on O2% in exhaust.
B. Lawrence et al. / Applied Energy 86 (2009) 2359–2372 2365
tio based on measured air flow rates and the calibrated fuelflow rate. Due to limitations of the feeder, only average flowrates could be measured. The next section computes the burntfraction (BF) using flue gas analysis and supplied equivalenceratio.
Burnt/Gasification Fraction vs. Equivalence R
0.00
0.20
0.40
0.60
0.80
1.00
1.20
0.7 0.8 0.9
Bur
nt/G
asifi
catio
n Fr
actio
n
TXL 90-10 TXL:LA-PC-DB-S
Fig. 7. Effect of fuel on BF for TXL and TXL:DB blended fuels. Note that in the rich regimeburnt.
5.3. Burnt fraction
Eq. (1a) assumes complete combustion or BF being equal to 1. Ifburnt fraction is less than 1, then /flue based on exhaust gas anal-ysis will be lower than the true value since less O2 is used by lesseramount of fuel being burnt. When BF < 1 (ex: rich mixtures), thenone can modify expression (1a) for any C–H–O–S fuel as
/flue ¼Oxygen stoich for burnt fuel
Oxygen sup p
¼ Oxygen stoich for sup p fuel � BFOxygen sup p
¼ / � BF
¼ 1�XO2 ðN2=O2ÞGas sup p
XN2
/ ¼1� XO2
XN2
� �N2O2
� �Gas sup p
BFð3aÞ
where BF is the burnt fraction, / is the measured equivalence ratiofrom flow rates. The above equation is equally applicable for C–H–N–O–S fuels when nitrogen is in trace amounts. As before
BF � 1/� 1� XO2
XO2;A
!ð3bÞ
When mixture is rich, there should be no oxygen left inproducts if fuel is burnt completely; but oxygen could be stillpresent when the fuel is not burnt completely. Figs. 7 and 8present the BF for TXL and DB blended fuels and WYO andDB blended fuels, respectively. Even in the very rich combus-tion (/ = 1.2), approximately 83% of the fuel was burnt. Eventhough DB is a low quality fuel, the VM is almost 80% onDAF (Table 1) and hence BF is comparable to pure coal. It is
atio for TXL and TXL:DB Blended Fuels
1 1.1 1.2 1.3φ
epS 80-20 TXL:LA-PC-DB-SepS
, the BF overlaps for all fuels. This indicates that the same percentage of all fuels was

Burnt/Gasification Fraction vs. Equivalence Ratio for WYO and WYO:DB Blended Fuels
0.00
0.20
0.40
0.60
0.80
1.00
1.20
0.7 0.8 0.9 1 1.1 1.2 1.3φ
Bur
nt/G
asifi
catio
n Fr
actio
nWYO 90-10 WYO:LA-PC-DB-SepS 80-20 WYO:LA-PC-DB-SepS
Fig. 8. Effect of fuel on BF for WYO and WYO:DB blended fuels. Note that the data points come close to overlapping for all equivalence ratios. Thus, BF was independent of fueltype.
2366 B. Lawrence et al. / Applied Energy 86 (2009) 2359–2372
seen that BF is larger than 1 for a few extremely lean exper-iments. These values demonstrate the limitations of Eq. (3) aswell as experimental uncertainties including fuel compositionssince / requires prior knowledge of stoichiometry of the burnt
Effect of Fuel on NOx (ppm) for T
0
100
200
300
400
500
600
700
800
900
0.7 0.8 0.9
NOx (
ppm
)
TXL 95-5 TXL:LA-PC-DB-SepS 90-10 T
Fig. 9. Effect of fuel on NOx for TXL and TXL:DB fuels. Note that blended f
fuel and hence on the average fuel composition. But the gen-eral trend shows decreasing burnt fraction with increase inequivalence ratio.
XL and TXL:DB Blended Fuels
1 1.1 1.2 1.3
φ
XL:LA-PC-DB-SepS 80-20 TXL:LA-PC-DB-SepS
uels have lower NOx values at stoichiometric and in rich combustion.

B. Lawrence et al. / Applied Energy 86 (2009) 2359–2372 2367
5.4. NOx emissions
Figs. 9 and 10 present the NOx emissions for TXL and DBblended fuels in ppm and on a heat basis (kg of NO2/GJ). Allof the blended fuels produced more NOx in the lean region thanthe pure TXL in kg/GJ. This is due to the higher amount of fuel
Effect of Fuel on NOx for TXL a
0.0
0.1
0.1
0.2
0.2
0.3
0.3
0.4
0.4
0.5
0.5
0.7 0.8 0.9
NO
x (kg
/GJ)
TXL 95-5 TXL:LA-PC-DB-SepS 90-10 TX
Fig. 10. Effect of fuel on NOx for TXL a
Effect of Fuel on NOx for WYO a
0
200
400
600
800
1000
1200
0.7 0.8 0.9
NO
x (pp
m)
WYO 95-5 WYO:LA-PC-DB-SepS 90-10 W
Fig. 11. Effect of fuel on NOx for WYO and WYO:DB fuels. Note h
bound nitrogen present in the biomass binding with the excessoxygen to form NOx. But, in the slightly rich region, the blendedfuels produced less NOx than the pure TXL. This is due to thefuel bound nitrogen being forced to form molecularnitrogen compounds due to the deficiency in oxygen and highamount of volatile matter in DB oxidizing rapidly in reducing
nd TXL:DB Blended Fuels
1 1.1 1.2 1.3φ
L:LA-PC-DB-SepS 80-20 TXL:LA-PC-DB-SepS
nd TXL:DB blended fuels in kg/GJ.
nd WYO:DB Blended Fuels
1 1.1 1.2 1.3φ
YO:LA-PC-DB-SepS 80-20 WYO:LA-PC-DB-SepS
ow NOx decreases in the near lean region for blended fuels.

Effect of Fuel on NOx for WYO and WYO:DB Blended Fuels
0.0
0.2
0.4
0.6
0.8
1.0
1.2
1.4
0.7 0.8 0.9 1 1.1 1.2 1.3
φ
NO
x (kg
/GJ)
WYO 95-5 WYO:LA-PC-DB-SepS 90-10 WYO:LA-PC-DB-SepS 80-20 WYO:LA-PC-DB-SepS
Fig. 12. Effect of fuel on NOx for WYO and WYO:DB blended fuels in kg/GJ.
2368 B. Lawrence et al. / Applied Energy 86 (2009) 2359–2372
available oxygen which otherwise the might bind with nitrogento NOx.
Figs. 11 and 12 present the NOx emissions from WYO coaland DB blended fuels in ppm and in kg/GJ based on the mass ofNO2.
Fuel Nitrogen Conversion Efficiency fo
0
5
10
15
20
25
0.7 0.8 0.9 1
Con
vers
ion
Effic
ienc
y (%
)
TXL 95-5 TXL:LA-PC-DBSepS 90-10 TX
Fig. 13. Effect of fuel on nitrogen conversion for TXL and TXL:DB blended fuels. Note t
5.5. Fuel nitrogen conversion efficiency
The nitrogen conversion efficiency is defined as the amount offuel nitrogen that gets converted to NOx. Overall fuel nitrogen con-version efficiency can be approximated by [19]:
r TXL and TXL:DB Blended Fuels
1.1 1.2 1.3φ
L:LA-PC-DBSepS 80-20 TXL:LA-PC-DBSepS
hat the conversion efficiency is less than coal for almost all TXL:DB blended fuels.

Fuel Nitrogen Conversion Efficiency for WYO and WYO:DB Blended Fuels
0
5
10
15
20
25
30
35
0.7 0.8 0.9 1.11.0 1.2 1.3
φ
Con
vers
ion
Effic
ienc
y (%
)WYO 95-5 WYO:LA-PC-DBSepS 90-10 WYO:LA-PC-DBSepS 80-20 WYO:LA-PC-DBSepS
Fig. 14. Effect of fuel on nitrogen conversion efficiency for WYO and WYO:DB blended fuels. Note that the conversion efficiency is less than coal for almost all WYO:DBblended fuels.
Effect of Fuel on CO2 for TXL and TXL:DB Blended Fuels
15
16
17
18
19
20
21
22
23
0.7 0.8 0.9 1 1.1 1.2 1.3φ
CO
2 (%
)
TXL 90-10 TXL:LA-PC-DB-SepS 80-20 TXL:LA-PC-DB-SepS
Fig. 15. Effect of fuel on CO2 for TXL and TXL:DB blended fuels.
B. Lawrence et al. / Applied Energy 86 (2009) 2359–2372 2369
NCONV �ðc=nÞ � XNO
XCO2 þ XCOð4Þ
where c/n is the atom ratio of the carbon to nitrogen (see Table 1),XNO is the mole fraction of NOx, XCO2 is the mole fraction of CO2, andXCO is the mole fraction of CO. Typically in coal fired boilers, fuelNOx forms more than 80% of NOx. Thus the Eq. (4) assumes thatall NOx originates from fuel nitrogen and hence it presents an upperbound on fuel nitrogen conversion efficiency. This approximation is
justified in view of the fact that the furnace temperatures are lessthan the temperature (�1500 K) above which thermal NOx becomessignificant. Figs. 13 and 14 show the results for TXL:DB andWYO:DB blends. As equivalence ratio increased, less nitrogen wasconverted to NOx. Further the dairy biomass blended fuels con-verted less nitrogen to NOx compared to coal.
It is noted that the nitrogen percentage increased from 0.66% forpure WYO to 0.91% for 80:20 WYO:DB blend. The NOx does not in-crease by same% as revealed by lower conversion efficiency; partic-

2370 B. Lawrence et al. / Applied Energy 86 (2009) 2359–2372
ularly the conversion efficiency for the 80:20 blends is the lowest.There are two effects. The blend has higher amount of VM whichreduces the local oxygen concentration and lowers the NOX whilefuel N is increased in the blend. It is well known that the oxygeneffect on fuel NOx is dominant and hence the nitrogen conversionefficiency is lowered.
Effect of Fuel on CO for TXL an
0
2000
4000
6000
8000
10000
12000
14000
0.7 0.8 0.9
CO
(ppm
)
TXL 90-10 TXL:LA-PC-DB-S
Fig. 16. Effect of fuel on CO f
CO2 for WYO and WYO
15
16
17
18
19
20
21
22
23
0.7 0.8 0.9 1
CO
2 (%
)
WYO 90-10 WYO:LA-PC-DB-S
Fig. 17. Effect of fuel on CO2 for WY
In nitrogen containing solid fuel combustion, the majority ofNOx comes from fuel bound nitrogen bonding with availableoxygen to form NOx, called fuel NOx. The NOx reaction rate is re-duced when carbon radicals bond with available oxygen to formCO and CO2. The largest decrease in conversion occurred when
d TXL:DB Blended Fuels
1.0 1.1 1.2 1.3φ
epS 80-20 TXL:LA-PC-DB-SepS
or TXL and TXL:DB fuels.
:DB Blended Fuels
.0 1.1 1.2 1.3φ
epS 80-20 WYO:LA-PC-DB-SepS
O and WYO:DB blended fuels.

Effect of Fuel on CO for WYO and WYO:DB Blended Fuels
0
2000
4000
6000
8000
10000
12000
14000
0.7 0.8 0.9 1.0 1.1 1.2 1.3φ
CO
(ppm
)WYO 90-10 WYO:LA-PC-DB-SepS 80-20 WYO:LA-PC-DB-SepS
Fig. 18. Effect of fuel on CO for WYO and WYO:DB fuels.
B. Lawrence et al. / Applied Energy 86 (2009) 2359–2372 2371
the furnace operation went from stoichiometric to rich with con-version efficiency as low as 2%.
5.6. CO2 and CO emissions
Recall that the BF relations presume that CO% is negligible com-pared to CO2% when computing the BF in the lean regime. Figs. 15and 16 show the results for CO2 and CO% for pure TXL and TXL:DB blends while Figs. 17 and 18 show the results for pure WYOand WYO:DB blends. In general the WYO had higher CO comparedto the TXL essentially due to the larger SMD for WYO (114 lm)compared to TXL (95 lm) and as such the CO from the TXL releasedmuch earlier and had time to oxidize. At almost identical sizes (TXLand LA-PC-DB), the blends of TXL:DB produced more CO comparedto pure TXL. The CO is less than 5000 ppm (0.5%) while CO2 is of theorder of 19.5–21.0%, and hence the assumption of negligible CO isjustified. The trends for CO and CO2 are similar for both fuel blends.
In lean combustion, there is sufficient oxygen for all the carbon tofully oxidize to CO2 and hence very little CO was formed in the leanregime. However, once combustion became oxygen deficient (rich)CO begins to be formed. In general, the blended fuels produced moreCO because the dairy biomass fuels contained more oxygen (see Ta-ble 1).
It is apparent that CO2 peaked at approximately the stoichiom-etric condition. As air flow was increased from the stoichiometricpoint, the excess air in the lean regime resulting in decreased theCO2%. On the other hand, if air flow was decreased below the stoi-chiometric air flow rate, less CO2 was formed due to insufficient O2
to fully oxidize fuel bound carbon and hence more CO was formed(Figs. 16 and 18). This explains why the peak in CO2 was at approx-imately stoichiometric.
6. Summary and conclusions
1. Dairy biomass had lower heat value due to less fixed carbon,more oxygen, more fuel bound nitrogen, and more ash. OnDAF basis, the dairy biomass has 60% of the heat value of coal.
2. The dairy biomass contained higher VM (46.88%) compared tocoal (28.49%), but the VM from dairy biomass contributes 65%of heat while coals contributes 40% heat. Hence dairy biomasscan be successfully blended with coal and cofired in a furnaceeven though the heat value of fuel is lower.
3. Burnt fraction was independent of fuel type. Burnt fraction wasalmost unity when operating near stoichiometric.
4. Cofiring increased NOx in lean combustion, however; NOx wasreduced to a very low value by blending coal with dairy biomassin rich combustion due to a lower percentage of fuel boundnitrogen to convert to NOx.
5. Blending of fuel by more than 90–10 was beyond practical lim-itations imposed by the high ash percentage in dairy biomassfuel since ash output per GJ becomes significant and as wellas the higher Cl content in dairy biomass compared to coals.
Acknowledgements
This work was supported by Department of Energy (DOE) –Golden, CO, Grant Number: DE-FG36-05GO85003 and Texas Com-mission on Environmental Quality (TCEQ) Grant No.: NTRD 582-5-65591-0015.
References
[1] Baxter Larry. Biomass cofiring overview. Second world conference on biomassfor energy, industry, and world climate protection, Rome, Italy, May 10–14;2004.
[2] Laux S, Grusha J, Tillman DA. Co-firing of biomass and opportunity fuels in lowNOx burners. 25th Intl Tech conf on coal utilization and fuel Systems,Clearwater, FL, March 6–9; 2000.
[3] Sweeten JM. Texas agricultural extension service publication L-1094. CollegeStation, Texas: Texas Agricultural Extension Service, Texas A&M University;1979.
[4] Carlin N, Annamalai K, Sweeten J, Mukhtar S. Thermo-chemical conversionanalysis on dairy manure-based biomass through direct combustion. Int JGreen Energy 2007;4:133–59.
[5] Sweeten JM. Texas agricultural extension service publication B-1671. CollegeStation, Texas: Texas Agricultural Extension Service, Texas A&M University;1990.

2372 B. Lawrence et al. / Applied Energy 86 (2009) 2359–2372
[6] Tillman DA. Biomass cofiring: the technology, the experience, the combustionconsequences. Biomass Bioenergy 2000;19:365–84.
[7] Lundgren J, Pettersson E. Combustion of horse manure for heat production.Technical report, NIFES; 2002.
[8] Miller BG, Miller SF, Scaroni AW. Utilizing agricultural by-products inindustrial boilers: Penn State’s experience and coal’s role in providingsecurity for our nation’s food supply. In: Proceedings of the nineteenthannual international Pittsburgh coal conference; 2002.
[9] Di Nola G. Biomass fuel characterization for NOx emissions in co-firingapplications. Doctoral thesis, Delft University of Technology, Delft, TheNetherlands; 2007.
[10] Sami M, Annamalai K, Wooldridge M. A review of co-firing of coal: bio-solidfuels cofiring. Prog Energy Combus Sci 2001;27:171–214.
[11] Frazzitta S, Annamalai K, Sweeten J. Performance of a burner with coal andcoal–bio-solid fuel blends. J Propul Power 1999;15(2):181–6.
[12] Arumugam S, Annamalai K, Thien B, Sweeten J. Int J Green Energy2005;2:409–19.
[13] Annamalai K, Sweeten J, Ramalingam SC. Estimation of the gross heatingvalues of biomass fuels. Trans Soc Agr Eng 1987;30:1205–8.
[14] Annamalai K, Sweeten J, Priyadarsan S, Arumugam S. Energy conversion. In:Capehart B, editor. The encyclopedia of energy engineering andtechnology. Boca Raton, FL: Taylor and Francis Group; 2006.
[15] Annamalai K, Sweeten J, Mukhtar S, Thien B, Wei G, Priyadarsan S, et al. Co-firing coal: feedlot and litter biomass (CFB and CLB) fuels in pulverized fueland fixed bed burners. Final DOE report. DOE-Pittsburgh Contract # 40810;2003.
[16] Sweeten JM, Annamalai K, Thien B, McDonald L. Fuel 2003;10:1167–82.[17] Annamalai K, Thien B, Sweeten J. Co-firing of coal and cattle feedlot biomass
(FB) fuels. Part II. Performance results from 30 kWt (100,000) BTU/h laboratoryscale boiler burner. Fuel 2003;82(10):1183–93.
[18] Heflin K, Sweeten J. Preliminary interpretation of data from proximate,ultimate and ash analysis, results of June 7, 2006 samples taken from feedlotand dairy biomass biofuel feedstocks at TAES/USDA-ARS, Bushland, TX TexasAgricultural Experiment Station, Texas A&M Agricultural Research & ExtensionCenter Amarillo/Bushland/Etter; 2006.
[19] Lawrence B. Cofiring coal and dairy biomass in a 100,000 BTU/h Burner boilerfacility. Master Thesis, Texas A&M University, College Station, Texas; 2007.
[20] Annamalai K, Puri IK. Combustion science and engineering. Boca Raton,FL: CRC Press, Taylor and Francis Group; 2007.


![KW[from 1994]wac_c.pdf](https://static.fdokumen.com/doc/165x107/6314afe3c72bc2f2dd0476e0/kwfrom-1994waccpdf.jpg)