COFFEE POWDER REUSED AS A COMPOSITE MATERIAL
134
COFFEE POWDER REUSED AS A COMPOSITE MATERIAL A STEP IN THE RIGHT DIRECTION PORTO, 30 th SEPTEMBER, 2016 VASCO JOSÉ GUIMARÃES CANAVARRO DISSERTATION FOR MASTER’S DEGREE IN PRODUCT AND INDUSTRIAL DESIGN
-
Upload
khangminh22 -
Category
Documents
-
view
3 -
download
0
Transcript of COFFEE POWDER REUSED AS A COMPOSITE MATERIAL

COFFEE POWDER REUSED AS A COMPOSITE MATERIAL
A STEP IN THE RIGHT DIRECTION
PORTO, 30th SEPTEMBER, 2016
VASCO JOSÉ GUIMARÃES CANAVARRO
DISSERTATION FOR MASTER’S DEGREE IN PRODUCT AND INDUSTRIAL DESIGN


COFFEE POWDER REUSED AS A COMPOSITE MATERIAL
A STEP IN THE RIGHT DIRECTION
DISSERTATION ADVISED BY
DOCTOR BÁRBARA RANGEL
DISSERTATION CO-ADVISED BY
DOCTOR JORGE LINO
VASCO CANAVARRO


O JÚRI
PRESIDENTE
Doutora Teresa Duarte
PROFESSORA AUXILIAR DA FACULDADE DE ENGENHARIA DA UNIVERSIDADE DO PORTO
ORIENTADOR
Doutora Bárbara Rangel
PROFESSORA AUXILIAR DA FACULDADE DE ENGENHARIA DA UNIVERSIDADE DO PORTO
ARGUENTE
Doutor Demétrio Ferreira Matos
P RO F E S SO R A D J U N TO D O I N S T I T U TO P O L I T É C N I CO D O C ÁVA D O E D O AV E
19 08.11.2016


I dedicate this work to my Father, who passed away in 2015, during my first year as a student at this Master’s Degree and one of his last wishes was that I completed the course. Esta é para ti, Pai.
José Júlio Xavier Canavarro [1948 – 2015]


RESUMO | 9
RESUMO
Este estudo tem como objetivo confirmar a possibilidade de utilização de resíduos de café na criação de objetos de Design, bem como documentar e descrever o tipo de aplicações que existem hoje, em diferentes áreas, para a reutilização desta substância e que estratégias são praticadas atualmente na produção de materiais criados com base no pó de café, com a capacidade de serem usados por meio de moldagem ou fabrico aditivo. A relevância deste estudo é justificada pelas características sui generis do café, tais como odor, aparência visual ou textura, assim como pela enorme abundância desta matéria-prima em potencialidade que é, normalmente, descartada após cumprir a sua principal função. Portanto, aqui são apresentados dados estatísticos relativamente aos resíduos em geral, com foco especial no café. Esta informação destina-se a mostrar a sua evidente abundância. Também é demonstrado por trabalho experimental, qual o aglutinante ideal para a criação do material desejado e que métodos foram utilizados na execução desta tarefa. Com base na pesquisa feita, são apresentadas algumas propostas de Design com base no material desenvolvido ao longo deste estudo, com aplicações em diferentes áreas e uma proposta de fabrico por moldagem das peças desenvolvidas.
Palavras-chave
Borra de café, resíduos, reutilização, design, fabrico aditivo.


ABSTRACT | 11
ABSTRACT
This study aims to confirm the possibility of using coffee waste to create design objects as well as to document and describe the type of applications that exist today, in different areas, for re-use of this substance and what strategies are carried out currently in the production of materials created based on coffee grounds, with the ability to be used by means of moulding or additive manufacture. The relevance of this study is justified by the coffee sui generis characteristics, such as odor, visual appearance or texture, as well as the huge abundance of this raw material in capability, which is normally discarded after serving its primary function. Therefore, here is presented statistical data regarding the waste in general, with special focus on coffee. This information is intended to show its obvious affluence. It is also demonstrated by experimental work, which is the ideal binder for the creation of the desired material and which methods were used in performing this task. Based on the research done, some design proposals based on the material developed throughout this study are presented, with applications in different areas and a manufacturing proposal by moulding of the developed parts.
Keywords
Coffee grounds, waste, reuse, design, additive manufacturing.


ACKNOWLEDGEMENTS | 13
ACKNOWLEDGEMENTS
With the completion of this stage of my life, I want to thank the contributions that allowed this study to take place. I want to thank first of all to the classmates, whom in one way or another supported me, especially the two that started this project with me, Ricardo Pinto and José Pedro Ferreira. I gratefully acknowledge the funding of Project NORTE-01-0145-FEDER-000022 - SciTech - Science and Technology for Competitive and Sustainable Industries, co-financed by Programa Operacional Regional do Norte (NORTE2020), through Fundo Europeu de Desenvolvimento Regional (FEDER). I would also like to thank my Advisor, Doctor Barbara Rangel and my Co-adviser, Doctor Jorge Lino, for their contribution to this work in several areas and also by the support they have given me over the two-year course. Without them, the realization of this thesis would not be possible. I cannot help but show my gratitude for the INEGI staff, Mister Sertório and Engineer Bártolo for the assistance provided in the construction of moulds and for sharing with me some of their precious knowledge. Finally I would like to thank my mother, for the support given to me throughout this whole adventure. In short, I thank everyone that somehow was available to assist me in any way and turned this project into what it is. To all, thank you very much.


TABLE OF CONTENTS
RESUMO ............................................................................................................................................. 9
ABSTRACT ........................................................................................................................................ 11
ACKNOWLEDGEMENTS ................................................................................................................. 13
TABLE OF CONTENTS ..................................................................................................................... 15
LIST OF FIGURES ............................................................................................................................ 17
LIST OF TABLES .............................................................................................................................. 19
SYMBOLS AND ABBREVIATIONS................................................................................................ 20
CHAPTER I / INTRODUCTION ...................................................................................................... 23
1.1. Background ......................................................................................................................... 23
1.2. Goals ..................................................................................................................................... 24
1.3. Methodology ....................................................................................................................... 24
1.4. Dissertation’s Structure ................................................................................................... 25
CHAPTER II / STATISTICAL DATA ............................................................................................... 27
2.1. Waste .................................................................................................................................... 28
2.2. Coffee Statistics and Data .............................................................................................. 39
CHAPTER III / STATE OF THE ART .............................................................................................. 47
3.1. Reuse Strategies for Coffee............................................................................................ 49
3.2. Reuse Solutions for Coffee in Additive Manufacturing ............................................ 53
3.3. Design Applications for Coffee Waste ......................................................................... 59
3.4. PLA + Spent Coffee Grounds Tests ................................................................................ 63
CHAPTER IV / EXPERIMENTAL WORK ....................................................................................... 69
4.1. Epoxy Resin ..........................................................................................................................72
4.2. Starch ....................................................................................................................................75
4.3. Pine Resin .............................................................................................................................79
4.4. Pine Resin and Wax .......................................................................................................... 80
4.5. PLA (Polylactide) ................................................................................................................ 81
CHAPTER V / DESIGN PROPOSAL .............................................................................................. 91

5.1. Main Project ........................................................................................................................ 92
5.2. Prototype ............................................................................................................................. 95
5.3. Other Design Possibilities ............................................................................................. 100
5.4. Construction Proposal .................................................................................................... 107
CHAPTER VI / CLOSING REMARKS......................................................................................... 110
6.1. Conclusions ....................................................................................................................... 110
6.2. Future Perspectives .........................................................................................................111
REFERENCES ................................................................................................................................. 112
APPENDIX I / BIRESIN CR83 DATA SHEET ........................................................................... 116
APPENDIX II / PINE RESIN YT321 DATA SHEET .................................................................. 120
APPENDIX III / PLA INGEO 3251D DATA SHEET .................................................................. 121
APPENDIX IV / PLA DESCRIPTION CES EDUPACK 2016 ................................................... 125
APPENDIX V / SILICONE RUBBER VTX 950 DATA SHEET .................................................. 127
APPENDIX VI / COST REPORT SIMULATION ......................................................................... 129
APPENDIX VII / ICO DATA TABLES ..........................................................................................131

LIST OF FIGURES | 17
LIST OF FIGURES
01. Projected waste generation by region (millions of tonnes per day) up to the year 2100 ...................... 29
02. Total agricultural production vs. food wastage volumes (million tonnes) in 2007 .................................. 30
03. Food wastage volumes, at world level by phase of the food supply chain (million tonnes) ..................... 31
04. Development of waste treatment in the EU-28 (million tonnes) .................................................................. 34
05. Municipal waste generation and treatment in the EU (refers to EU27, excluding Croatia, for the years 1995 to 2006 and to EU28 from 2007 onwards) in kg per person ................................... 35
06. Number of dumpsites accepting different combinations of waste types.................................................... 36
07. Average annual growth rate (million bags) in global coffee consumption since 2011 ........................... 39
08. Coffee production by continent in million bags ................................................................................................. 40
09. Composition of world consumption .......................................................................................................................41
10. Top 5 Countries by Sheer Tonne Coffee Consumption ..................................................................................... 43
11. Source of caffeine for individuals 22 years and over in milligrams. Daily intake: 300.7 milligrams.................................................................................................................................................................... 44
12. Daily consumption of coffee by the U.S. population in 2009 ........................................................................ 44
13. Graphical Abstract .................................................................................................................................................... 50
14. Salt ................................................................................................................................................................................ 53
15. The Utah Tea Set........................................................................................................................................................ 54
16. Sawdust Screen ......................................................................................................................................................... 54
17. Agridust ....................................................................................................................................................................... 55
18. Hoop by Francesco Pacelli ...................................................................................................................................... 56
19. Wound Up .................................................................................................................................................................... 56
20. 3D Printer, property of FEUP (left). 3D printed octopus using 3Dom coffee filament .............................57
21. HIFA Coffee System .................................................................................................................................................. 59
22. GroCycle ...................................................................................................................................................................... 60
23. Kaffeeform .................................................................................................................................................................. 60
24. Eco Sleeve Maker .......................................................................................................................................................61
25. decafé by Raúl Laurí ................................................................................................................................................. 62
26. Mass loss of PLA, PLA/20%SCG and PLA/40%SCG as a function of incubation time in soil ................................................................................................................................................................................. 64
18 | LIST OF FIGURES
27. Percent mass gain due to the absorption of water for PLA, PLA/20%SCG and PLA/40%SCG ............................................................................................................................................................ 64
28. Torque values as a function of mixing time for the PLA/SCG composite ................................................... 66
29. The effects of SCG content on the tensile strength at failure are shown for the PLA/SCG composites ............................................................................................................................................... 66
30. PLA food packaging (Mathilde 2013). .................................................................................................................. 70
31. Starch experiments showing signs of moisture with the appearance of mold. .......................................... 78
32. Deteriorated coffee/starch mixture after being submerged in cold water. ................................................ 78
33. Pine resin experiment results. ................................................................................................................................ 79
34. Pine resin and wax experiment results. ............................................................................................................... 80
35. Initial PLA experiment results. ................................................................................................................................ 83
36. Experiments with PLA/coffee on a silicone mould. .......................................................................................... 84
37. Sample after being machine washed. ...................................................................................................................85
38. Sample with hot coffee. ............................................................................................................................................85
39. Creation of a second, bigger mould for the cups. ..............................................................................................88
40. Explanatory sketch for the main design project. ............................................................................................... 92
41. 3D renderization of the main project. Proposed use. ........................................................................................93
42. 3D renderization of the main project. .................................................................................................................. 94
43. Prototype parts. .......................................................................................................................................................... 97
44. Prototype ...................................................................................................................................................................... 97
45. General dimensions for the cup and legs/handles parts. ................................................................................ 98
46. General dimensions for the wooden tray............................................................................................................. 99
47. Other design possibilities creative sketch. ....................................................................................................... 100
48. Plant pots possibility. ............................................................................................................................................. 102
49. Plant pots possibility with plants. ...................................................................................................................... 102
50. Containers for appetizers and cup for cold beverages. ................................................................................. 103
51. Different sized bowls and plates for various purposes. ................................................................................. 103
52. Proposal for the plates........................................................................................................................................... 104
53. Possibility for using the material as a shade. .................................................................................................. 105
54. Aspect of the shade against a light source. ...................................................................................................... 105
55. Set of all the design proposals for the developed material. ......................................................................... 106
56. Injection Moulding Machine .................................................................................................................................. 107
57. Tooling for a plastic cup ........................................................................................................................................ 108

LIST OF TABLES | 19
LIST OF TABLES
01. Global waste generation .......................................................................................................................................... 28
02. Examples of potential impacts of food losses and waste on the sustainability of food systems ........................................................................................................................................................................ 32
03. Costs of inaction towards waste management. .................................................................................................. 37
04. 12 Principles of Green Engineering ....................................................................................................................... 37
05. Total production by all exporting countries in thousand 60kg bags ............................................................ 40
06. Disappearance (consumption) in selected importing countries in thousand 60kg bags .........................41
07. World coffee consumption in thousand 60kg bags .......................................................................................... 42
08. 14 Genius Ways To Recycle Used Coffee Grounds. .......................................................................................... 49
09. Microscopic analysis from 3Dom coffee filament. ........................................................................................... 58
10. Degradation of PLA and PLA/20%SCG as a function of incubation time in soil ...................................... 63
11. The effects of SCG content on the thermal properties of PLA/SCG composites ...................................... 65
12. Method of experimentation with the epoxy resin. ..............................................................................................72
13. Epoxy resin experiments results. ............................................................................................................................ 73
14. Method of experimentation with starch. ..............................................................................................................75
15. Starch experiments results. ..................................................................................................................................... 77
16. Method of experimentation with PLA. ................................................................................................................... 81
17. Moulded samples with formulas. ........................................................................................................................... 84
18. Samples of various formulas PLA/coffee without being moulded. ............................................................... 85
19. Samples of various formulas of PLA/coffee using a mould. ........................................................................... 88
20. Samples with high transparency. .......................................................................................................................... 90
21. Prototype creation description. ............................................................................................................................. 95
22. Plastic industrial Colour Mixer 300kg Blender Machine .............................................................................. 108
23. Cost Simulation ........................................................................................................................................................ 109
20 | SYMBOLS AND ABREVIATIONS
SYMBOLS AND ABBREVIATIONS
Abbreviations
2D Two-Dimensional 3D Three-Dimensional AM Additive Manufacturing CAD Computer Aided Design CAGR Compound Annual Growth Rate COL I Type I Collagen DGEBA Diglycidyl Ether Of Bisphenol A DSC Differential Scanning Calorimetry DWG Drawing File format ESCG Extract Of Spent Coffee Grounds EU European Union Eurostat Statistical Office of the European Union E-Waste Electronic Waste FAEE Fatty Acid Ethyl Ester FAME Fatty Acid Methyl Ester FAO Food and Agriculture Organization of the United Nations FBAUP Faculdade de Belas Artes da Universidade do Porto FDA Food and Drug Administration FDM Fused Deposition Modelling FEUP Faculdade de Engenharia da Universidade do Porto FFAs Free Fatty Acids FLW Food Loss And Waste GHG Greenhouse Gas HLPE Panel of Experts on Food Security and Nutrition ICO International Coffee Organization IHC Immunohistochemistry INEGI Institute of Science and Innovation in Mechanical and Industrial Engineering ISWA International Solid Waste Association LED Light-Emitting Diode

SYMBOLS AND ABREVIATIONS | 21
MDIP Master’s Degree in Product and Industrial Design MMPs Matrix Metalloproteinase MSW Municipal Solid Waste PLA Polylactic Acid / Polylactide PMHS Polymethylhydrosiloxane SCAA Specialty Coffee Association of America SCG Spent Coffee Grounds SOFC Solid Oxide Fuel Cell STL Stereolithography U.S. United States of America UK United Kingdom UNEP United Nations Environment Programme USA United States of America UV Ultra-Violet WM Waste Management
Symbols
% Percent CO2 Carbon Dioxide g Gram Hf Heat of Fusion kg Kilogram km3 Cubic Kilometre mg Milligram ml Millilitre mm millimetre MPa Megapascal Nm Newton Metre ºC Centigrade Degree oz. Ounce Tg Glass transition Temperature Tm Melting Point x Times (mathematics)


CHAPTER I / INTRODUCTION | 23
CHAPTER I / INTRODUCTION
INTRODUCTION
1.1. Background
This work is carried out within the structure of the Master’s Degree in Product and Industrial Design (MDIP),
at the Faculty of Engineering (FEUP) and Faculty of Fine Arts (FBAUP) from the University of Porto.
This chapter aims at presenting the Master's thesis titled "Coffee Reused as a Composite Material – A Step
in the Right Direction". Here is a brief introduction to the subject’s framework done within this project and
the goals to be achieved, the methodology used and a description of the dissertation’s structure.
With the technological and industrial development, many products have toxicity problems and the rate at
which people consume new raw materials has become unsustainable. The markets have been undergoing
changes and manufacturing materials tends to be more affordable, but they still have problems related with
pollution and other ecological concerns. The impact that mankind’s hunger for consumption, has upon nature
and how that contributes to the slow end of natural resources, is well known. For this reason, alternative
processes concentrate upon the reuse of waste.
This theme has emerged as a way to combat this problem of great environmental impact through design.
From this point of view, this thesis aims to present a composite material from reused ground coffee
leftovers. Because at the moment it is treated mostly as junk, it may therefore be used as an innovative
material for the production of several objects.

24 | CHAPTER I / INTRODUCTION
1.2. Goals
The main goal to be achieved within this research is to obtain a mouldable material, formed by the coffee
grounds and a suitable binder found through experimentation and study. It is also intended that the material
created is both durable and washable, with prospects of extending the number of ways in which it can be
used.
To validate this, it is intended the creation of a set of products made from the developed material, which can
be extended to numerous areas of Design, from simple kitchen utensils to la mps.
From the point of view of sustainability the idea is to extend the life cycle of coffee, eliminating the waste
phase, to which it is largely subjected nowadays, after consumption.
1.3. Methodology
During the course of this work, an in-depth research was done on the type of use that is given today to this
type of waste, from furniture applications, fertilizer, fuel, or even materials with 3D printing capabilities.
This research focused on scientific articles, books and even dissertations, as well as websites related to the
objectives of this work. At the same time, a study has been done to try to understand the statistical data of
waste, with a special focus on coffee.
In a more detailed way and trying to direct the research towards this thesis, it was tried to realize in which
stage is the evolution of coffee grounds as a material with the ability to be moulded or extruded through 3D
printing and what kind of progress, if any, is being made in that direction.
Completed the research phase, all the relevant information was analysed to allow for knowledge
development and broaden understanding about the chosen topic.

CHAPTER I / INTRODUCTION | 25
During the entire process of knowledge gathering and information collection, some experiments with
mixtures between the coffee waste, and a variety of binders were made, both biological and man-made, to
realize what could work best for achieving the desired, physical and visual characteristics, thus reaching the
expected and wanted material.
Later, from the standpoint of design, some products were developed with the aid of CAD software and the
respective prototypes were created, with the ability to be tested in real circumstances in order to finally be
validated.
So, in order to summarize this study, it is divided into three major parts. The first one being the investigation
work, the second is the experimentation and finally the Design process.
1.4. Dissertation’s Structure
This dissertation is divided into six chapters.
The first chapter concerns the introduction, which in turn is divided into four parts. Here can be found the
historical justification and framework of this study, the objectives intended to be achieved, the adopted
methodology and the structure of the dissertation.
In the second chapter there is access to statistical data that provides information relative to waste in
general and coffee in particular, as global or specific countries consumptions with relevance to the study.
The state of the art is presented in chapter three and is divided into four sections. The first is on the coffee
reuse strategies, the second deals with the theme of coffee reuse solutions in additive manufacturing , the
third section shows the kind of products that are being created based on this reuse in the area of Design and
last some tests made to a composite material made between PLA and spent coffee grounds are presented.
Chapter four shows all the experimental work done within the development of this thesis. It is divided by the
materials used and describes them as well as the procedures used in each experiment. It also shows the

26 | CHAPTER I / INTRODUCTION
results of those experiments and an analytical description of them, with a greater emphasis on the chosen
binder.
The Design proposal appears in the sixth chapter with a main project, from which a prototype was made.
Then, other design possibilities for the developed material appear and finally a production proposal is
presented.
In the seventh and final chapter of this document, conclusions are taken from what has been done and what
kind of future prospects exist in this area of study, for the developed material.

CHAPTER II / STATISTICAL DATA | 27
CHAPTER II / STATISTICAL DATA
STATISTICAL DATA
For further understanding on the grandiosity of the problem faced with material waste, biological or
artificial and to contextualize this study, this chapter will focus on showing some data relative to this issue.
It is intended to demonstrate waste numbers, regarding waste in general, food waste (from which coffee is a
part of) and what type of treatment is given to it, in an attempt to show why this is a problem and that many
wasted substances can and should be reused at the end of their life cycle.
Additionally, it tries to confirm through statistical data, that coffee is one of the best substances to be
reused, by its sheer abundance and characteristics.

28 | CHAPTER II / STATISTICAL DATA
2.1. Waste
According to Eurostat (Statistical Office of the European Union), Portugal generated in 2012, 14.184.456
tons of waste (Eurostat 2015b). On the other hand, Europe (28 Countries) ended the same year with
2.514.220.000 tons and in the United States are generated daily 624.700 tons of solid waste and the
forecast made by The World Bank Organization through the document "What a Waste" (Bhada-Tata 2012,
83) is that by 2025 it will be 701.709 tons.
Table 1 - Global waste generation. Adapted from "Global Waste Generation Clock” (Atlas 2016).
On Table 1, the global waste generation by hour, day,
month and year is shown and we are told by the same
source that the current annual Municipal Solid Waste
(MSW) generation is estimated to 1.9 billion tonnes
with almost the 30% of it to remain uncollected. As for
the collected MSW, 70% is led to landfills and
dumpsites, 19% is recycled or recovered and 11% is led to energy recovery facilities. The number of people
that lacks access even to the most elementary Waste Management (WM) services is estimated to at least
3.5 billion. If we continue with a “Business as Usual” practice, the situation seems to worsen significantly,
with forecasts to estimate that the population that will have no access to WM services in 2050 will be
around 5.6 billion (Atlas 2016).
As further demonstrated by Daniel Hoornweg, Perinaz Bhada-Tata and Chris Kennedy in their publication for
Nature magazine, "Waste production must peak this century", the amount of waste generated globally
shows a growth tendency up to the year 2100 (Figure 1), with Sub-Saharan African countries taking the
leadership (Daniel Hoornweg 2013, 616). It can, therefore, be recognized that waste generation by the
human being will hardly decrease in the next years and one of the solutions to this decrease might be in its
reuse or recycling.
Quantity
Tons/hour 182.65 – 228.31
Tons/day 4.38 – 5.48 million
Tons/month 133.33 – 166.67 million
Tons/year 1.6 – 2.0 billion

CHAPTER II / STATISTICAL DATA | 29
Figure 1 - Projected waste generation by region (millions of tonnes per day) up to the year 2100. Adapted from "Waste production must peak this century" (Daniel Hoornweg 2013).
Food Waste
In their article, “Determinants of consumer food waste behaviour: Two routes to food Waste”, Violeta
Stancu, Pernille Haugaard and Liisa Lahteenmaki conclude that there are two routes to food waste
behaviour, the intentional one and the routinized one. Their findings suggest that food-related routines (i.e.
planning, shopping and leftovers reuse) are main drivers of food waste in addition to perceived behavioural
control. Among the routines, the leftovers reuse routines were the most important contributors to food
waste but were closely followed by shopping routines. Planning routines contributed only indirectly through
shopping routines (Violeta Stancu 2016).
In regards to food waste, which coffee is a part of, the Food and Agriculture Organization of the United
Nations (FAO) says that the global volume of food wastage is estimated at 1.6 billion tonnes of "primary
product equivalents". Total food wastage for the edible part of this, amounts to 1.3 billion tonnes. Food
wastage's carbon footprint is estimated at 3.3 billion tonnes of CO2 equivalent of greenhouse gas (GHG)
released into the atmosphere per year. The total volume of water used each year to produce food that is lost
or wasted (250km3) is equivalent to the annual flow of Russia's Volga River, or three times the volume of
Lake Geneva. Similarly, 1.4 billion hectares of land - 28 percent of the world's agricultural area - is used
0
1
2
3
2010 2040 2070 2100
Sub-Saharan Africa East Asia ans Pacific
Europe and Central Asia South Asia
Latin America and the Caribbean Middle East and North Africa
High-income and OECD countries Linear (Sub-Saharan Africa)
30 | CHAPTER II / STATISTICAL DATA
annually to produce food that is lost or wasted. A low percentage of all food wastage is composted: much of
it ends up in landfills, and represents a large part of municipal solid waste. Methane emissions from landfills
represent one of the largest sources of GHG emissions from the waste sector. Home comp osting can
potentially divert up to 150 kg of food waste per household per year from local collection authorities.
Developing countries suffer more food losses during agricultural production, while in middle - and high-
income regions, food waste at the retail and consumer level tends to be higher. The direct economic
consequences of food wastage (excluding fish and seafood) run to the tune of $750 billion annually (Nations
2016).
Next, some food wastage volumes, provided by FAO in their 2013 report “Food Wastage Footprint – Impact
on Natural Resources”, will be shown and interpreted.
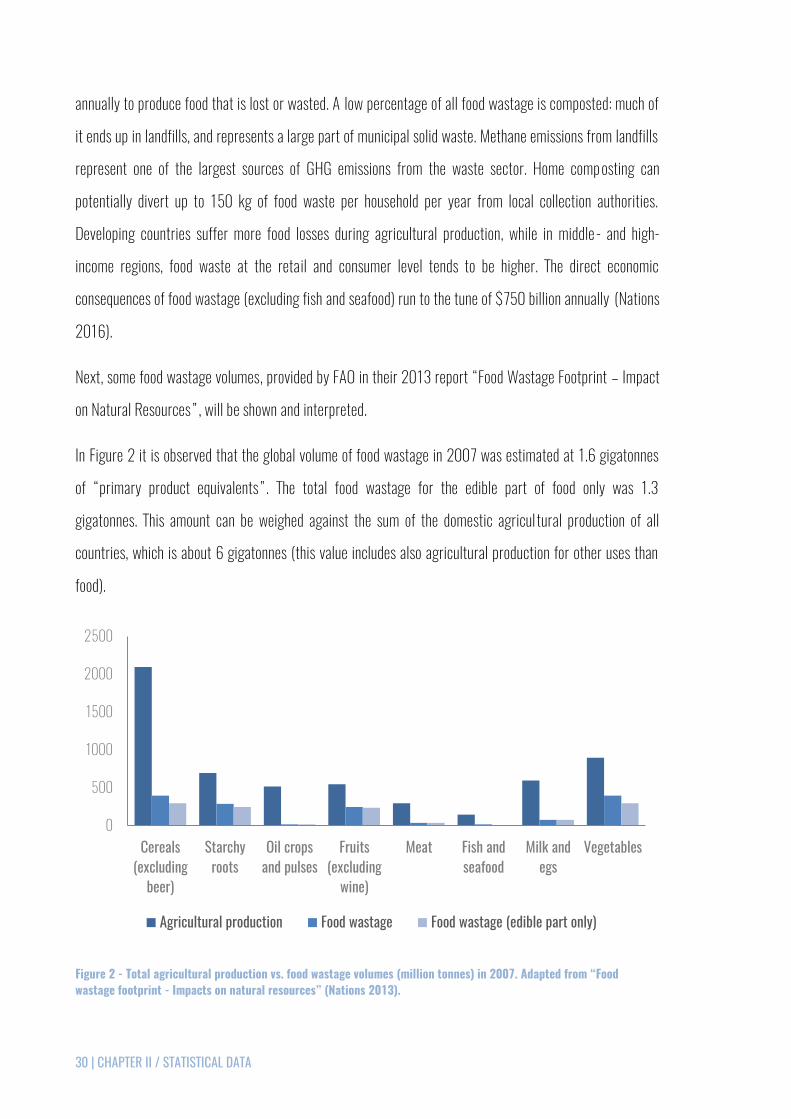
In Figure 2 it is observed that the global volume of food wastage in 2007 was estimated at 1.6 gigatonnes
of “primary product equivalents”. The total food wastage for the edible part of food only was 1.3
gigatonnes. This amount can be weighed against the sum of the domestic agricul tural production of all
countries, which is about 6 gigatonnes (this value includes also agricultural production for other uses than
food).
Figure 2 - Total agricultural production vs. food wastage volumes (million tonnes) in 2007. Adapted from “Food wastage footprint - Impacts on natural resources” (Nations 2013).
0
500
1000
1500
2000
2500
Cereals(excluding
beer)
Starchyroots
Oil cropsand pulses
Fruits(excluding
wine)
Meat Fish andseafood
Milk andegs
Vegetables
Agricultural production Food wastage Food wastage (edible part only)

CHAPTER II / STATISTICAL DATA | 31
The same report shows the amounts of food wastage along the food supply chain. Agricultural production, at
33%, is responsible for the greatest amount of total food wastage volumes. Upstream wastage volumes,
including production, post-harvest handling and storage, represent 54% of total wastage, while downstream
wastage volumes, including processing, distribution and consumption, are 46%. Thus, on average, food
wastage is balanced between the upstream and downstream of the supply chain (Figure 3).
Figure 3 - Food wastage volumes, at world level by phase of the food supply chain (million tonnes). Adapted “Food wastage footprint - Impacts on natural resources” (Nations 2013).
On the other hand, the High Level Panel of Experts on Food Security and Nutrition (HLPE) tries to
demonstrate the potential impacts of food losses and waste on the sustainability of food systems (Table 2).
Regarding economic impacts to food chain actors and to consumers, different actors/agents suffer different
economic impacts and net costs (or even gains), which depend on their position in the food system. Any
effect of price increase, due to food loss and waste (FLW), is different for net sellers versus net buyers of
food. Also, depending on their market or purchasing power, and/or on their position and capacity of
coordination in the production chain, some agents may suffer less from FLW and “push” the co sts of
inefficiency to less well-positioned agents. In non-competitive markets, most likely the consumer ultimately
pays for the inefficiency and economic losses in the production process. In markets where there is greater
competition, economic losses can be assumed by subaltern agents that under contract must submit to the
510
360
185 195
340
0
100
200
300
400
500
600
AgriculturalProduction
Postharvesthandling and
storage
Processing Distribution Consumption
Food wastage

32 | CHAPTER II / STATISTICAL DATA
standards imposed by the "chain coordinator" (often a major supermarket company, a trader or even a
processing industry). However, even in those cases where there is competition, the ine fficiency of the food
systems always translates into a higher price of food for consumers, everything else being equal. Large
amounts of FLW lead, everything else being equal, to proportionally less efficient outcomes of public
resources used for productive programmes for agriculture, capacity building, training and subsidies.
Table 2 - Examples of potential impacts of food losses and waste on the sustainability of food systems. Adapted from “Food losses and waste in the context of sustainable food systems” (Security 2014).
Level/Dimension Economic Social Environmental
Micro (household or
individual enterprise)
Businesses and consumers spend a larger portion of their budget on foods that will not be sold or consumed.
Lower wages. Consumers with fewer resources for purchase. Lack of products.
Amount of garbage and waste. Contamination of individuals in rural and urban areas.
Meso (food chain)
Imbalance in production flows and need for more investments such as construction of silos and warehouses for intermediate stocks. Profit reduction. Inefficiencies in supply chain. Costs of disposal and treatment of waste.
Low labour productivity. Difficulties for companies to make their planning.
Multiplication of landfills.
Macro (food system and
beyond)
Unrealized economic effort. Public investment in agriculture and infrastructure being less productive and turning into an opportunity cost. Reduction in financial resources for investment in other areas.
Higher level of food prices and difficulties in access to food. Larger number of people below the poverty line.
Pressure on natural resources: water and soil. Emission of greenhouse gases. Occupation of forests and conservation areas. Depletion of fishery resources. Pressure on wildlife. Greater spending on non-renewable energy.

CHAPTER II / STATISTICAL DATA | 33
With regards to social impacts, the high volume of losses in agriculture in developing countries ends up
impacting also on labour productivity (marketable output per worker) and therefore on wages, which in turn
can slow down the expansion of the consumer market, which would have boosted the producers for the
acquisition of new technologies. From the social point of view, this is a vicious cycle that reduces the
availability of resources both in the hands of producers and consumers. It is challenging to exit this cycle .
Production cost is an important decision element at micro level.
Relatively to environmental impacts, FLW entails both a needless use of resources used to produce the food
lost and wasted, and the impact of putting waste at disposal, with emissions of me thane, a potent GHG
(Security 2014).
Waste treatment
Some of the conclusions from the paper “Waste – Investing in energy and resource efficiency” (Modak
2011), written for Green Economy magazine, are that the increasing volume and complexity of waste is
posing threats to ecosystems and human health, but opportunities do exist to green the waste sector. These
opportunities come from the growing demand for improved waste management and for resource and energy
recovery from waste. This change in demand is driven by cost savings, increased environmental awareness
and increasing scarcity of natural resources.
The growth of the waste market is a reflection of the underlying demand for greening the sector , especially
the new paradigm of linking waste to resource use across the life-cycle of products. Different countries face
different waste related challenges, but the path to greening the waste sector shares common milestones.
Prevention and reduction of waste at source is essential for all countries, although this is particularly
important in developing countries given their higher level of population growth and increasing material and
resource consumption. The absolute growth of population and income implies that the absolute volume of
waste is unlikely to decline. Greening the sector is therefore the only way to go.
34 | CHAPTER II / STATISTICAL DATA
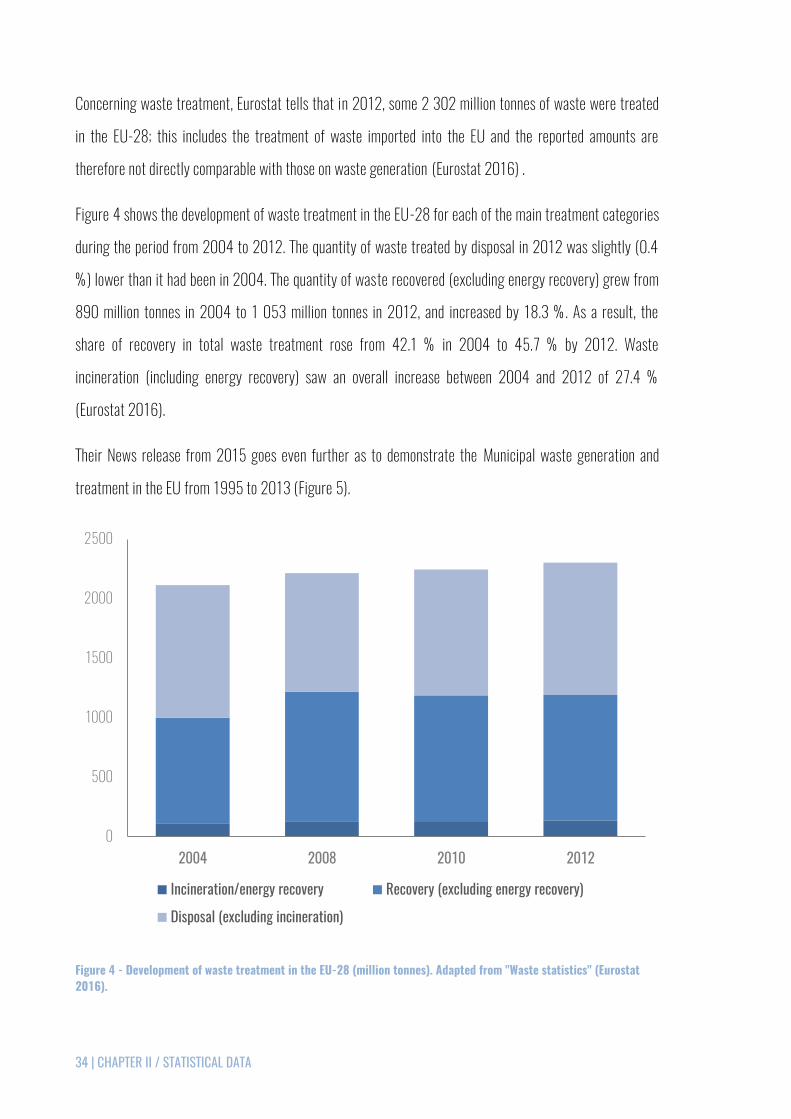
Concerning waste treatment, Eurostat tells that in 2012, some 2 302 million tonnes of waste were treated
in the EU-28; this includes the treatment of waste imported into the EU and the reported amounts are
therefore not directly comparable with those on waste generation (Eurostat 2016) .
Figure 4 shows the development of waste treatment in the EU-28 for each of the main treatment categories
during the period from 2004 to 2012. The quantity of waste treated by disposal in 2012 was slightly (0.4
%) lower than it had been in 2004. The quantity of waste recovered (excluding energy recovery) grew from
890 million tonnes in 2004 to 1 053 million tonnes in 2012, and increased by 18.3 %. As a result, the
share of recovery in total waste treatment rose from 42.1 % in 2004 to 45.7 % by 2012. Waste
incineration (including energy recovery) saw an overall increase between 2004 and 2012 of 27.4 %
(Eurostat 2016).
Their News release from 2015 goes even further as to demonstrate the Municipal waste generation and
treatment in the EU from 1995 to 2013 (Figure 5).
Figure 4 - Development of waste treatment in the EU-28 (million tonnes). Adapted from "Waste statistics" (Eurostat 2016).
0
500
1000
1500
2000
2500
2004 2008 2010 2012
Incineration/energy recovery Recovery (excluding energy recovery)
Disposal (excluding incineration)

CHAPTER II / STATISTICAL DATA | 35
Figure 5 - Municipal waste generation and treatment in the EU (refers to EU27, excluding Croatia, for the years 1995 to 2006 and to EU28 from 2007 onwards) in kg per person. Adapted from "Generation of waste by economic activity" (Eurostat 2015a).
“In the European Union (EU), the amount of municipal waste generated per person in 2013 amounted to 481
kg, down by 8.7% compared with its peak of 527 kg per person in 2002. Since 2007, the generation of
municipal waste per person has constantly decreased in the EU to below its mid-1990s level. Of the 481 kg
of municipal waste generated per person in the EU in 2013, 470 kg per person were treated. This treatment
followed different methods: 31% was landfilled, 28% recycled, 26% incinerated and 15% composted. The
share of municipal waste recycled or composted in the EU has steadily increased over the time period, from
18% in 1995 to 43% in 2013” (Eurostat 2015a). It is possible to see an obvious increase in recycled or
composted waste from 1995 to 2013 and can only hope that it continues like this.
Figure 6 displays the number of dumpsites accepting different combinations of waste types around the
world, as can be found on the 2014 report “Waste Atlas – The World’s 50 Biggest Dumpsites” (Atlas
2014). Almost all cases accept mixed municipal solid waste (MSW); and in almost half (24 out of 50) co -
disposal of hazardous waste is practiced. Co-disposal of E-Waste is also common (6 out of 50), whereas in a
few cases indescribable (other waste) find their way there.
0
100
200
300
400
500
600
95 96 97 98 99 00 01 02 03 04 05 06 07 08 09 10 11 12 12
Recycled or composted Landfilled or incinerated Other

36 | CHAPTER II / STATISTICAL DATA
Figure 6 - Number of dumpsites accepting different combinations of waste types. Adapted from “Waste Atlas - The World's 50 Biggest Dumpsites” (Atlas 2014).
So, there is undoubtedly action, towards waste management, being taken around the world. However, there
is still a long road for it to be perfect or even positive in a noticeable way.
Table 3 shows a glimpse at what the costs of this inaction can be, based the document from 2012, “Global
Waste Management Outlook - Summary for Decision-Makers”, by David C. Wilson and others, integrated in
the United Nations Environment Programme (UNEP) and with the cooperation of the International Solid
Waste Association (ISWA)
The same source alerts for the fact that proper waste management makes economic sense but still has a
financial cost, since affordability is a major challenge in developing countries, even the poorest will pay
something when they can see and raising finance for investment in modern facilities continues to be a
challenge in all countries.
The benefits are, nevertheless, substantial. Making less that goes to waste saves business money on raw
material, energy and labour costs and the estimated savings to business worldwide are in the hundreds of
billions of dollars per year (David C. Wilson 2012).
20 17
6 4
2 1 0
5
10
15
20
25
MSW +Hazardous
Waste
MSW MSW + OtherWaste
MSW +Hazardous
Waste + OtherWaste
MSW + E-waste E-waste
Number of dumpsites

CHAPTER II / STATISTICAL DATA | 37
Table 3 - Costs of inaction towards waste management. Adapted from “Global Waste Management Outlook - Summary for Decision-Makers” (David C. Wilson 2012).
Areas of Impact Costs of Inaction
Public health impacts of uncollected waste
Gastrointestinal and respiratory infections, particularly in children. Blocked drains aggravate floods and spread infectious disease.
Environmental impacts of open dumping and burning
Severe land pollution and freshwater, groundwater and sea pollution. Local air pollution and climate change.
Costs to society exceed the financial costs per capita of proper waste management by a factor
of 5-10
Health care. Lost productivity. Flood damage. Damage to businesses and tourism.
Because this dissertation is directed towards Product and Industrial Design , these 12 principles of green
engineering are presented (Table 4) from the authors Paul Anastas and Julie Zimmerman (2003). It is
sometimes said that small steps can be giant leaps in the direction of achieving greater things. Maybe these
twelve steps can be the beginning of something in the right direction.
Table 4 - 12 Principles of Green Engineering. Adapted from "Through the 12 Principles - Green Engineering." (Paul T. Anastas 2003).
Principles Description
1 Designers need to strive to ensure that all material and energy inputs and outputs are as inherently non-hazardous as possible.
2 It is better to prevent waste than to treat or clean up waste after it is formed.
3 Separation and purification operations should be designed to minimize energy consumption and materials use.
4 Products, processes, and systems should be designed to maximize mass, energy, space, and time efficiency.
5 Products, processes, and systems should be “output pulled” rather than “input pushed” through the use of energy and materials.

38 | CHAPTER II / STATISTICAL DATA
6 Embedded entropy and complexity must be viewed as an investment when making design choices on recycle, reuse, or beneficial disposition.
7 Targeted durability, not immortality, should be a design goal.
8 Design for unnecessary capacity or capability (e.g., “one size fits all”) solutions should be considered a design flaw.
9 Material diversity in multicomponent products should be minimized to promote disassembly and value retention.
10 Design of products, processes, and systems must include integration and interconnectivity with available energy and materials flows.
11 Products, processes, and systems should be designed for performance in a commercial “afterlife”.
12 Material and energy inputs should be renewable rather than depleting.
CHAPTER II / STATISTICAL DATA | 39
2.2. Coffee Statistics and Data
Having in mind that coffee becomes a waste at the end of its life cycle and trying to contextualize this study
even further, some figures are presented next.
According to data from the International Coffee Organization (ICO), it’s estimated that its global
consumption in 2014 was 149.8 million 60 kg bags (Organization 2015b).
In Portugal, in the same period, the consumption amounted to 823.000 bags and the consumption per
capita was around 4.7 kg (Organization 2015d).
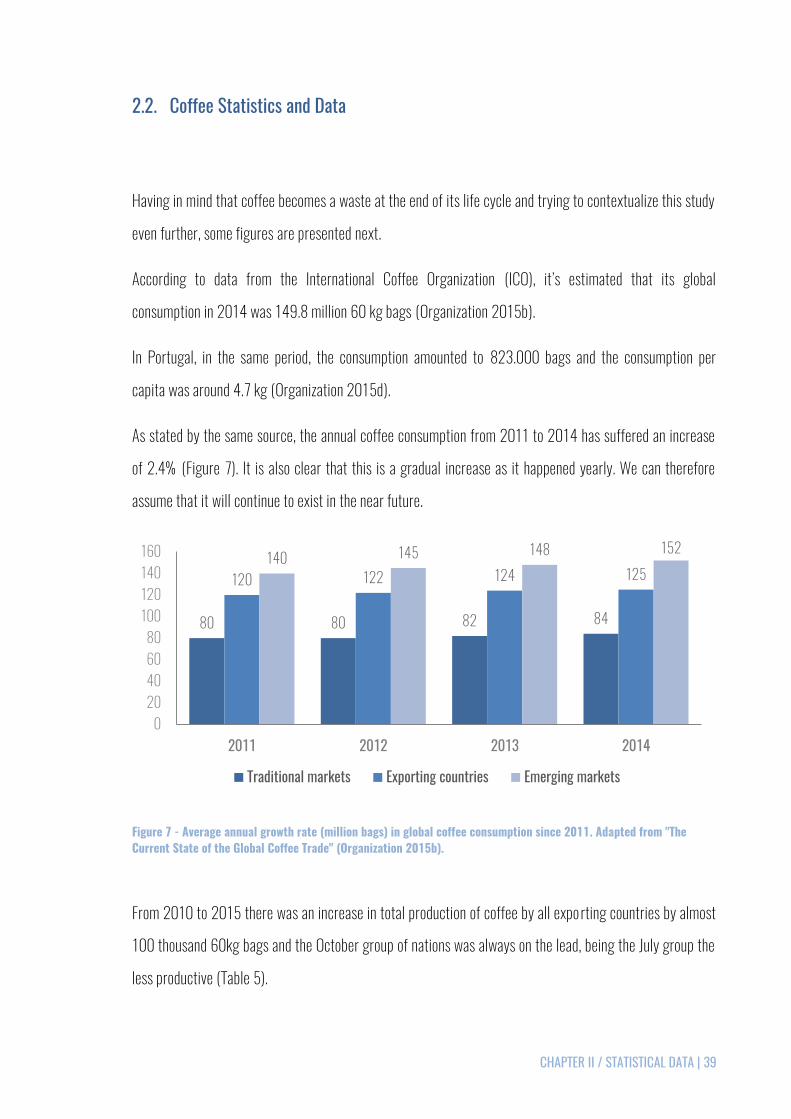
As stated by the same source, the annual coffee consumption from 2011 to 2014 has suffered an increase
of 2.4% (Figure 7). It is also clear that this is a gradual increase as it happened yearly. We can therefore
assume that it will continue to exist in the near future.
Figure 7 - Average annual growth rate (million bags) in global coffee consumption since 2011. Adapted from "The Current State of the Global Coffee Trade" (Organization 2015b).
From 2010 to 2015 there was an increase in total production of coffee by all exporting countries by almost
100 thousand 60kg bags and the October group of nations was always on the lead, being the July group the
less productive (Table 5).
80 80 82 84
120 122 124 125 140 145 148 152
020406080
100120140160
2011 2012 2013 2014
Traditional markets Exporting countries Emerging markets

40 | CHAPTER II / STATISTICAL DATA
Table 5 - Total production by all exporting countries in thousand 60kg bags. Adapted from “Total production by all exporting countries” (Organization 2015e).
Crop Year 2010/11 2011/12 2012/13 2013/14 2014/15
April Group 64 494 59 701 71 294 67 953 60 342
July Group 1 887 1 678 2 222 1 886 2 086
October Group 67 258 75 192 74 077 76 963 78 753
Total 133 640 136 572 147 593 146 801 141 732
Figure 8 provides information on coffee production by continent from 2012 to 2014. The values remain
similar from one crop year to the other, but there is, however, an evident aggrandizement from South
America where production achieves greater numbers.
Figure 8 - Coffee production by continent in million bags. Adapted from “Annual Review 2013-2014 Strengthening the global coffee sector through international cooperation” (Organization 2015a).
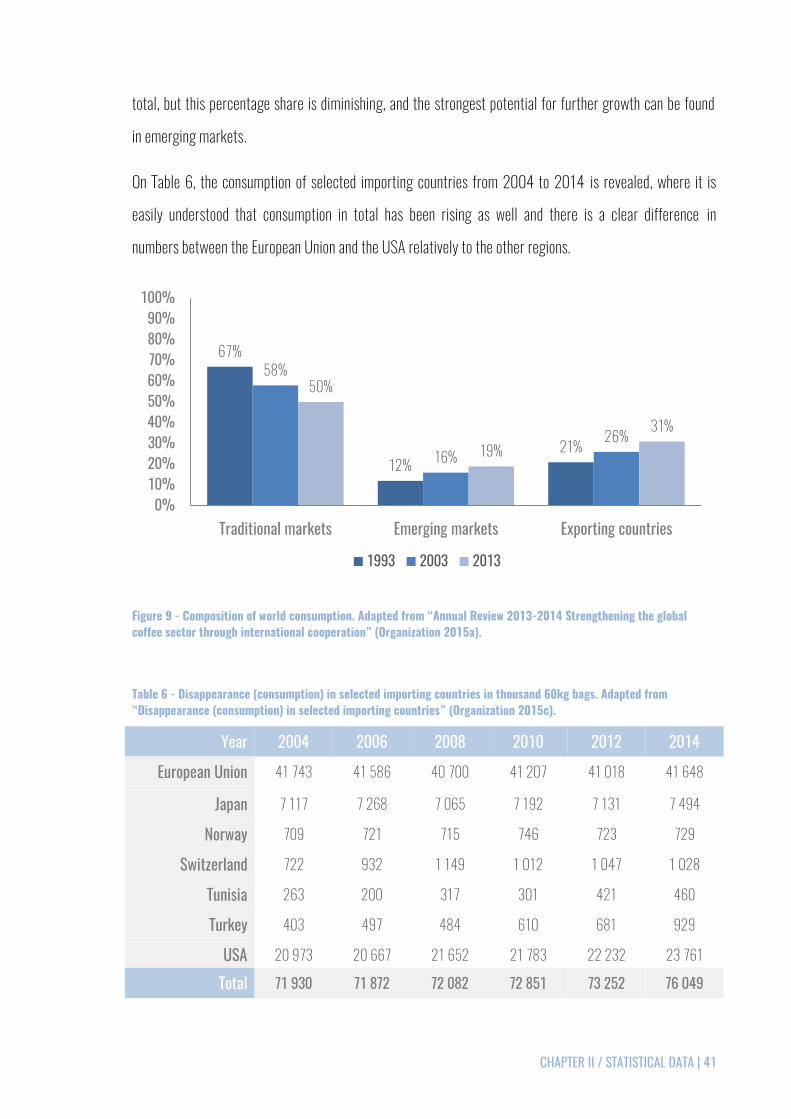
By analysing the composition of world consumption (Figure 9), it becomes evident that although the
traditional markets are still on the lead, their leadership is also decreasing while emerging markets kept
growing for the last 20 years and as ICO explains in their annual review 2013/14 (Organization 2015a), a
particularly strong growth has been observed in East and Southeast Asia, such as Indonesia, Vietnam and
South Korea. Traditional consuming markets have registered more modest growth rates of around 1.3% per
annum. Coffee demand in the European Union has stagnated somewhat recently, although consumption in
the USA has shown some resurgence. Traditional consuming markets account for over 50% of the world
16,5
45,3
18,5
67,1
16,2
46,6
16,8
67,2
0
20
40
60
Africa Asia & Oceania Mexico & CentralAmerica
South America
2012/13 2013/14
CHAPTER II / STATISTICAL DATA | 41
total, but this percentage share is diminishing, and the strongest potential for further growth can be found
in emerging markets.
On Table 6, the consumption of selected importing countries from 2004 to 2014 is revealed, where it is
easily understood that consumption in total has been rising as well and there is a clear difference in
numbers between the European Union and the USA relatively to the other regions.
Figure 9 - Composition of world consumption. Adapted from “Annual Review 2013-2014 Strengthening the global coffee sector through international cooperation” (Organization 2015a).
Table 6 - Disappearance (consumption) in selected importing countries in thousand 60kg bags. Adapted from “Disappearance (consumption) in selected importing countries” (Organization 2015c).
Year 2004 2006 2008 2010 2012 2014
European Union 41 743 41 586 40 700 41 207 41 018 41 648
Japan 7 117 7 268 7 065 7 192 7 131 7 494
Norway 709 721 715 746 723 729
Switzerland 722 932 1 149 1 012 1 047 1 028
Tunisia 263 200 317 301 421 460
Turkey 403 497 484 610 681 929
USA 20 973 20 667 21 652 21 783 22 232 23 761
Total 71 930 71 872 72 082 72 851 73 252 76 049
67%
12% 21%
58%
16% 26%
50%
19% 31%
0%10%20%30%40%50%60%70%80%90%
100%
Traditional markets Emerging markets Exporting countries
1993 2003 2013

42 | CHAPTER II / STATISTICAL DATA
If, on the other hand, one wants to see how coffee consumption has been between continents from 2011 to
2014, Table 7 displays exactly this. On the right column is the compound growth rate (constant rate of
return over a time period) where there is an obvious raise in consumption all over, except for Central
America and Mexico, with the most apparent rise coming from Africa.
Table 7 - World coffee consumption in thousand 60kg bags. Adapted from “World coffee consumption” (Organization 2015f)
Year 2011 2012 2013 2014 CAGR
World Total 139 483 143 140 147 113 149 823 2.4%
Africa 9 170 10 081 10 624 10 809 5.6%
Asia & Oceania
26 452 28 014 29 159 30 446 4.8%
Central America &
Mexico 4 974 5 035 5 030 4 979 0.0%
Europe 49 311 49 461 50 493 51 109 1.2%
North America 25 618 25 730 26 931 27 674 2.6%
South America 23 958 24 820 24 875 24 807 1.2%
Specialty Coffee Association of America (SCAA) also affirms that the consumption in the five leading
importing countries (France, Germany, Italy, Japan, and the United States) bounced to about 37.3 million
bags during the period January to September 2010, as compared to with 36.5 million bags for the same
period the previous year. While traditionally viewed as an export crop, coffee consumption in coffee
producing countries on the rise, increased by 3.9% between 2004 and 2008. Many experts predict that
Brazil will displace the United States as the single largest coffee consuming market in the world within the
next few years, somewhere from 2014 to 2016. Emerging markets (considered those outside of the EU, US,
and Japan) are another source of growth, with consumption increasing 4.7% between 2004 and 2008. The
United States imported more than 21.5 million bags during the 2008/09 coffee year, accounting for more
than one quarter of global coffee (un-roasted) imports, making it the world’s largest single buyer. Brazil,
Colombia, and Vietnam account for 21%, 19%, and 11% of those imports, respectively. Drip coffee sales

CHAPTER II / STATISTICAL DATA | 43
improved to 4.7% in the 4th quarter of 2010 compared to up 3.5% in the 3rd quarter. Espresso grew 4.1%
in the 4th quarter, fairly similar to the 3rd quarter. In recent years, there has been a huge surge in Arabica
coffee demand from large, emerging markets including Brazil, India, and China. These countries have
growing middle classes which been providing high demand for good coffee and they are competing with the
United States to purchase these gourmet coffee beans. Coffee preparation at home is up 4 percentage
points with 86% of past-day coffee drinkers reporting that they made coffee at home (America 2012).
As can be seen by the information provided on Figure 10, the USA is still the top coffee consuming country,
followed closely only by Brazil. For this reason, the next two figures show data only relative to the United
States of America.
Figure 10 - Top 5 Countries by Sheer Tonne Coffee Consumption. Adapted from "Caffeine (Coffee) Consumption by Country" (Foster 2016).
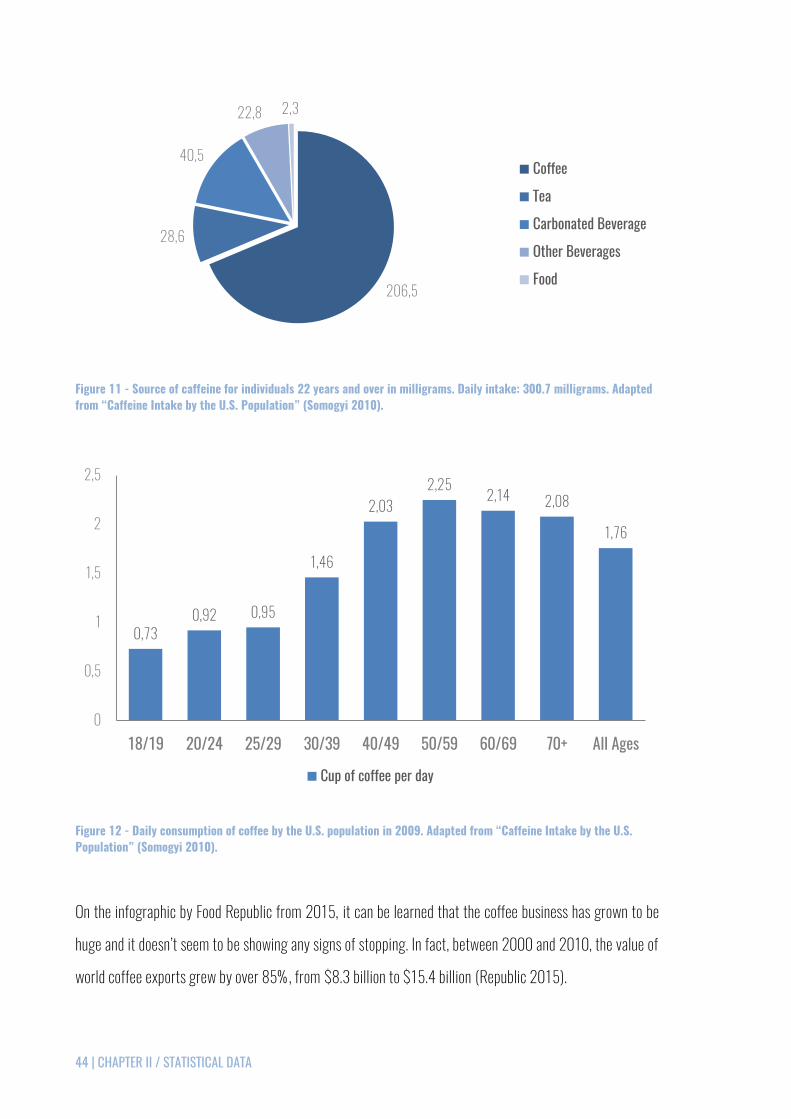
Figure 11 represents the source of caffeine for individuals (Americans) 22 years old and over, just so we can
comprehend how much more of it is consumed through coffee, relatively to other sources of caffeine and is,
therefore, coffee such a good choice for reuse as a material.
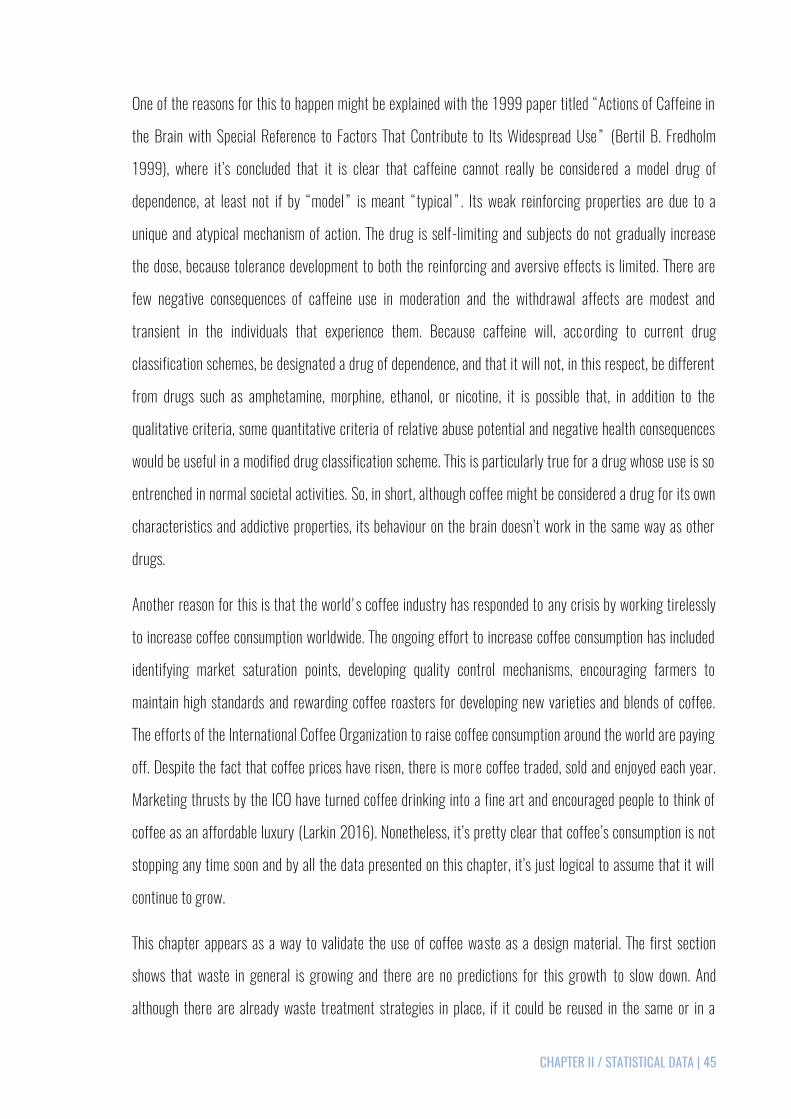
The graph on Figure 12 gives an idea of the range of ages that consume the most coffee daily and these are,
in fact, the ones that have the financial condition to buy it regularly.
971 969
425
211 202
0100200300400500600700800900
1000
USA Brazil Germany Italy France
Thousands of tonnes
44 | CHAPTER II / STATISTICAL DATA
Figure 11 - Source of caffeine for individuals 22 years and over in milligrams. Daily intake: 300.7 milligrams. Adapted from “Caffeine Intake by the U.S. Population” (Somogyi 2010).
Figure 12 - Daily consumption of coffee by the U.S. population in 2009. Adapted from “Caffeine Intake by the U.S. Population” (Somogyi 2010).
On the infographic by Food Republic from 2015, it can be learned that the coffee business has grown to be
huge and it doesn’t seem to be showing any signs of stopping. In fact, between 2000 and 2010, the value of
world coffee exports grew by over 85%, from $8.3 billion to $15.4 billion (Republic 2015).
206,5
28,6
40,5
22,8 2,3
Coffee
Tea
Carbonated Beverage
Other Beverages
Food
0,73 0,92 0,95
1,46
2,03 2,25
2,14 2,08
1,76
0
0,5
1
1,5
2
2,5
18/19 20/24 25/29 30/39 40/49 50/59 60/69 70+ All Ages
Cup of coffee per day
CHAPTER II / STATISTICAL DATA | 45
One of the reasons for this to happen might be explained with the 1999 paper titled “Actions of Caffeine in
the Brain with Special Reference to Factors That Contribute to Its Widespread Use” (Bertil B. Fredholm
1999), where it’s concluded that it is clear that caffeine cannot really be considered a model drug of
dependence, at least not if by “model” is meant “typical”. Its weak reinforcing properties are due to a
unique and atypical mechanism of action. The drug is self-limiting and subjects do not gradually increase
the dose, because tolerance development to both the reinforcing and aversive effects is limited. There are
few negative consequences of caffeine use in moderation and the withdrawal affects are modest and
transient in the individuals that experience them. Because caffeine will, according to current drug
classification schemes, be designated a drug of dependence, and that it will not, in this respect, be different
from drugs such as amphetamine, morphine, ethanol, or nicotine, it is possible that, in addition to the
qualitative criteria, some quantitative criteria of relative abuse potential and negative health consequences
would be useful in a modified drug classification scheme. This is particularly true for a drug whose use is so
entrenched in normal societal activities. So, in short, although coffee might be considered a drug for its own
characteristics and addictive properties, its behaviour on the brain doesn’t work in the same way as other
drugs.
Another reason for this is that the world's coffee industry has responded to any crisis by working tirelessly
to increase coffee consumption worldwide. The ongoing effort to increase coffee consumption has included
identifying market saturation points, developing quality control mechanisms, encouraging farmers to
maintain high standards and rewarding coffee roasters for developing new varieties and blends of coffee.
The efforts of the International Coffee Organization to raise coffee consumption around the world are paying
off. Despite the fact that coffee prices have risen, there is more coffee traded, sold and enjoyed each year.
Marketing thrusts by the ICO have turned coffee drinking into a fine art and encouraged people to think of
coffee as an affordable luxury (Larkin 2016). Nonetheless, it’s pretty clear that coffee’s consumption is not
stopping any time soon and by all the data presented on this chapter, it’s just logical to assume that it will
continue to grow.
This chapter appears as a way to validate the use of coffee waste as a design material. The first section
shows that waste in general is growing and there are no predictions for this growth to slow down. And
although there are already waste treatment strategies in place, if it could be reused in the same or in a

46 | CHAPTER II / STATISTICAL DATA
similar way that this study is trying to demonstrate for spent coffee grounds, this problem might not exist in
a near future.
Section two focuses on coffee because it is the base material for this thesis and to further demonstrate that
if nothing is done regarding its reuse, its consumption will still continue to grow as it is such an intrinsic
part of our society and it would be a shame to let such a substance, with so many interesting characteristics
go to waste.
Furthermore, for the time being, the use of most wastage materials allow for a no cost approach, making
this an unrivalled advantage. For all these reasons, it becomes apparent on this chapter that coffee waste
really is a good choice for a substance to be reused as a material on the creation of desi gn products. It is
also obvious that its abundance will continue to exist and designers should see this as an opportunity.

CHAPTER III / STATE OF THE ART | 47
CHAPTER III / STATE OF THE ART
STATE OF THE ART
On this chapter is presented the state of the art, regarding coffee reuse strategies. Some simpler than
others, but their goal remains the same. It is also intended to exhibit the type of solutions for coffee waste in
additive manufacturing, as well as some design applications for the same purpose.
The last section focuses on the characteristics of the material symbiosis between coffee waste and PLA
(polylactic acid), through testing. These tests are justified and an integral part of this study, as will be
demonstrated further on this document, on chapter four.
The obvious reason for this, is to understand if there is already action being taken towards the reuse of the
chosen substance or not, and if more could be done.
In order to give some context to the theme, coffee’s historical background and origins are provided next.
Coffee’s beans, from which coffee is brewed, constitute the primary source of caffeine. The caffeine content
in coffee varies widely, depending on the type of coffee bean and the method of preparation; even beans
from a given coffee bush can vary in their caffeine concentration. Roasted coffee beans contain 0.8–2.5%
caffeine. Generally, dark-roast coffee has less caffeine than lighter roasts because the roasting process
reduces the bean's caffeine content. Arabica coffee normally contains less caffeine than the Robusta
variety. In general, one serving of coffee ranges from 64 mg for a single cup (30 ml) of espresso to about
145 mg for an 8 oz. (ounce) cup (237 ml) of automatic drip coffee (Somogyi 2010).
All commercial coffee species originate from Africa and belong to the genus Coffea. The high quality Coffea
Arabica species originates from the rainforests in the southwestern highlands of Ethiopia. One theory
suggests that the Ethiopians took it to Yemen when they conquered the country by AD 500. Another

48 | CHAPTER III / STATE OF THE ART
hypothesis says that Arab merchants brought it initially to Yemen and the Arabian Peninsula, where it was
cultivated and has contributed to the prosperity of the seaport of Mocca. This explains why Arabica coffee is
associated with the name Mocca, although the prime centre of origin and diversity is on the African
continent (Hermann A. Jurgen Pohlan).
Pecevi, an Ottoman historian of the early seventeenth century, writes: “Until the year 962 (1554-55), in the
High, God-Guarded city of Constantinople, as well as in Ottoman lands generally, coffee and coffeehouses
did not exist. About that year, a fellow called Hakam from Aleppo and a wag called Shams from Damascus
came to the city: they each opened a large shop in the district called Tahtalkala, and began to purvey coffee.
These shops became meeting places of a circle of pleasure seekers and idlers, and also of some wits from
among the men of letters and literati, and they used to meet in groups of 20 or 30” (Kafadar 2016).

CHAPTER III / STATE OF THE ART | 49
3.1. Reuse Strategies for Coffee
In the particular case of coffee, there are already reuse strategies in several areas, from agriculture to fuel
and to begin with, next are displayed 14 genius ways to recycle used coffee grounds, by Natural Living Ideas
(Table 8).
Table 8 - 14 Genius Ways To Recycle Used Coffee Grounds. Adapted from "14 Genius Ways To Recycle Used Coffee Grounds" (Ideas 2014).
This list is divided by areas of interest such as garden,
around the house and health and beauty and the author
presents some pretty ingenious ways for coffee
grounds waste reuse.
Regarding the garden area, it’s already we ll known that
coffee has particularities that might be of interest. On
the around the house area we can see five inventive
ways of reusing coffee, like absorbing food odours or
making homemade candles. There are even solutions
for it on health and beauty like making creams for the
skin or even treatments for hair. Another good solution
is the caffeinated soap.
These are the simpler solutions for which coffee waste
can be reused by anyone. Next we will be looking at
some more serious answers for this problem, also in different areas of interest.
Coffee waste has been consolidating itself as one of the most abundant biological resources of th e world for
use as green energy (Gómez-de la Cruz 2015). There are several investigators, from different parts of the
planet, already studying the possibility of transforming coffee waste as a biofuel.
Area of Interest
Garden
Pest Repellent
Fertilize Your Garden
Compost it for Later
Caffeine for Carrots
Around the House
Absorb Food Odours
Natural Abrasive
Beautiful Golden Dye
Homemade Candles
Clean Out the Fireplace
Health and Beauty
Exfoliate Skin
Rejuvenating Facial
Caffeinated Soap
Coffee for Your Hair
Cellulite Treatment
50 | CHAPTER III / STATE OF THE ART
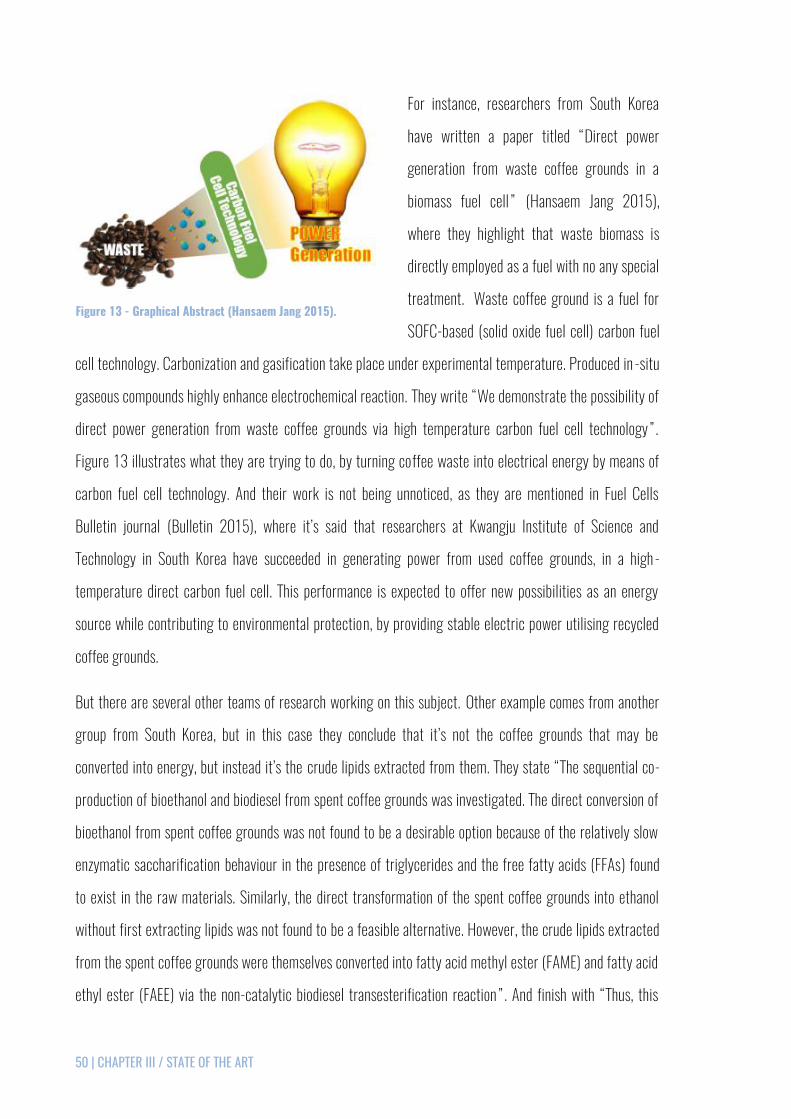
For instance, researchers from South Korea
have written a paper titled “Direct power
generation from waste coffee grounds in a
biomass fuel cell” (Hansaem Jang 2015),
where they highlight that waste biomass is
directly employed as a fuel with no any special
treatment. Waste coffee ground is a fuel for
SOFC-based (solid oxide fuel cell) carbon fuel
cell technology. Carbonization and gasification take place under experimental temperature. Produced in -situ
gaseous compounds highly enhance electrochemical reaction. They write “We demonstrate the possibility of
direct power generation from waste coffee grounds via high temperature carbon fuel cell technology”.
Figure 13 illustrates what they are trying to do, by turning coffee waste into electrical energy by means of
carbon fuel cell technology. And their work is not being unnoticed, as they are mentioned in Fuel Cells
Bulletin journal (Bulletin 2015), where it’s said that researchers at Kwangju Institute of Science and
Technology in South Korea have succeeded in generating power from used coffee grounds, in a high -
temperature direct carbon fuel cell. This performance is expected to offer new possibilities as an energy
source while contributing to environmental protection, by providing stable electric power utilising recycled
coffee grounds.
But there are several other teams of research working on this subject. Other example comes from another
group from South Korea, but in this case they conclude that it’s not the coffee grounds that may be
converted into energy, but instead it’s the crude lipids extracted from them. They state “The sequential co-
production of bioethanol and biodiesel from spent coffee grounds was investigated. The direct conversion of
bioethanol from spent coffee grounds was not found to be a desirable option because of the relatively slow
enzymatic saccharification behaviour in the presence of triglycerides and the free fatty acids (FFAs) found
to exist in the raw materials. Similarly, the direct transformation of the spent coffee grounds into ethanol
without first extracting lipids was not found to be a feasible alternative. However, the crude lipids extracted
from the spent coffee grounds were themselves converted into fatty acid methyl ester (FAME) and fatty acid
ethyl ester (FAEE) via the non-catalytic biodiesel transesterification reaction”. And finish with “Thus, this
Figure 13 - Graphical Abstract (Hansaem Jang 2015).

CHAPTER III / STATE OF THE ART | 51
study clearly validated our theory that spent coffee grounds could be a strong candidate for the product ion
of bioethanol and biodiesel” (Eilhann E. Kwon 2013), concluding that it is in fact possible to use the waste
from coffee grounds and turn it into bioethanol and biodiesel.
And it doesn’t end here, as a team in Germany wrote an article for the Journal of Energy Chemistry in 2015
titled “Spent coffee ground as source for hydrocarbon fuels” (Peter Dohlert 2015), where can be learned
that the conversion of triglycerides (coffee oil) obtained from spent coffee ground to produce hydrocarbon
fuel (diesel) was studied. They finish by saying that it was established a protocol for the conversion of coffee
oil (triglycerides) derived from spent coffee ground to hydrocarbons, which can be applied as diesel fuel.
With tris-(pentafluorophenyl)-borane as catalyst the coffee oil was hydro-deoxygenated applying
polymethylhydrosiloxane (PMHS) as cheap reductant under mild reaction conditions. For instance , from 1 kg
spent coffee ground potentially 77 g of hydrocarbons can be produced.
As in almost every area of interest and progress, the United States are always present and this couldn’t be
different. Researchers from the University of Nevada have also written a paper in 2008 (Narasimharao
Kondamudi 2008), which describes an approach to extract oil from spent coffee grounds and to further
transesterify the processed oil to convert it into biodiesel. It continues by saying that this process yields 10 -
15% oil depending on the coffee species (Arabica or Robusta). The biodiesel derived from the coffee
grounds (100% conversion of oil to biodiesel) was found to be stable for more than 1 month under ambient
conditions. It is projected that 340 million gallons of biodiesel can be produced from the waste coffee
grounds around the world. The coffee grounds after oil extraction are ideal materials for garden fertilizer,
feedstock for ethanol, and as fuel pellets.
However, there are other completely different areas that are studying possibilities for reusing coffee waste.
In Japan, scholars have shown that it can be used in adsorption of dyes onto carbonaceous materials
produced from coffee grounds by microwave treatment. They say that “organic wastes have been burned for
reclamation. However, they have to be recycled and reused for industrial sustainable development.
Carbonaceous materials were produced from coffee grounds by microwave treatment. There are many
phenolic hydroxyl and carboxyl groups on the surface of carbonaceous materials. The base consumption of
the carbonaceous materials was larger than that of the commercially activated carbon. The carbonaceous
52 | CHAPTER III / STATE OF THE ART
materials produced from coffee grounds were applied to the adsorbates for the removal of basic dyes
(methylene blue and gentian violet) in wastewater” (Mizuho Hirata 2002).
On the other hand, from Seoul comes a study with the title “Spent coffee ground extract suppresses
ultraviolet B-induced photoaging in hairless mice” (Hyeon-Son Choi 2015), from 2015 which showed that
extract of spent coffee grounds (ESCG) inhibited UV-derived photoaging of skin in a hairless mouse model.
The protective effect of ESCG administration in mice exhibiting skin photoaging was supported by the down -
regulation of matrix metalloproteinase (MMPs), which are responsible for the degradation of collagen, and
evidenced by the increase in type I collagen (COL I), observed via immunohistochemistry (IHC) analysis.
Therefore, they propose that spent coffee grounds, which are generally thrown away as a by-product, could
be used as a protective agent for skin health.
To finalize this section of the chapter, an article in Bioresource Technology journal in 2009 (A.J. Adi 2009),
concluded that the study definitely reveals that coffee grounds can be decomposed through
vermicomposting by using L. rubellus (species of earthworm) va lue-added material. Coffee grounds can also
play a role in stabilizing kitchen waste condition that indirectly provides a better environment for fostering
population growth of earthworms and produces a high quality vermicompost as end product.
So, it is definitely safe to recognize that coffee grounds waste is and has been studied for its characteristics
in order for it to be reused in the most various ways and on different areas of interest.

CHAPTER III / STATE OF THE ART | 53
3.2. Reuse Solutions for Coffee in Additive Manufacturing
Additive manufacturing (AM), or three-dimensional (3D) printing, is receiving unprecedented attention. AM
is a suite of emerging technologies that fabricates three-dimensional objects directly from digital models
through an additive process, typically by depositing and “curing in place” successive layers of polymers,
ceramics, or metals (Ford 2014).
“There is a growing consensus that 3D printing technologies will be one of the next major technological
revolutions” (Thierry Rayna 2015).
The first three examples presented here are not made with coffee grounds left -overs, but they have been
chosen because of the similarities they have with coffee, since they are all dusty or granulated materials and
the same result could probably be achieved using coffee waste.
Salt
The first example can be seen on Figure 14,
and the material used here is salt. The type of
binders the authors have used to create these
objects are not known, but they seem stable
and as Ronald Rael states, this material is
strong and even waterproof. “Salt for 3D
printing uses salt harvested from the San
Francisco Bay. The salt is harvested from 109-
year-old salt crystallization ponds in Redwood City. These ponds are the final stop in a five -year salt-making
process that involves moving bay water through a series of evaporation ponds. In these ponds the highly
saline water completes evaporation, leaving 8-12 inches of solid crystallized salt that is then harvested for
industrial use. The material is strong, waterproof and translucent” (Ronald Rael).
Figure 14 - Salt (Ronald Rael).

54 | CHAPTER III / STATE OF THE ART
The Utah Tea Set
Another example (Figure 15) is called “The
Utah Tea Set” and is based on a very well-
known computer aided design (CAD) model,
the Newell Teapot. Not only are the creators of
the object trying to demonstrate new
materials for 3D printing, they are also
creating a semantic cycle by making a tea set,
out of tea. “With the advent of 3D printing
users are able to materialize digital designs. While one might consider ceramic the obvious material for 3D
printing the Utah Teapot, we have chosen instead to 3D print it out of actual tea. This means the Utah Tea
Set, which includes tea cups also 3D printed out of tea, is doubly, characteristically self-referential meta
and then meta again” (Virginia San Fratello 2015).
Sawdust Screen
“The Sawdust Screen is fabricated from 3D
printed walnut and the surface retains the
layering effect from the additive
manufacturing process, which simulates
natural wood grain. The screen is comprised of
individual 3D printed wood components which
are affixed together to form a variably
dimensional enclosure and surface. The
Sawdust Screen is inspired by the vessels found in the microscopic analysis of wood anatomy in
hardwoods” (Virginia San Fratello). On Figure 16, the “Sawdust Screen” can be seen, which can be pretty
much self-explanatory. It’s a 3D printed screen made out of sawdust. This piece is rather interesting,
because the characteristics of sawdust can be quite similar to coffee powder.
Figure 15 - The Utah Tea Set (Virginia San Fratello 2015).
Figure 16 - Sawdust Screen (Virginia San Fratello).

CHAPTER III / STATE OF THE ART | 55
The next set of examples presented, were all created using coffee waste as a base material and the
composition of these creations vary from one example to the other.
Agridust
Marina Ceccolini studied at the University of Design of San Marino and the final project involved studying
the use of food waste, and find ways to turn this into a useful, biodegradable material. AgriDust ( Figure 17)
is a project of recovery and valorisation of waste fruit and vegetables. Working with six chosen waste
materials (Coffee grounds, peanut shell, husk tomato, bean pod, orange waste and lemon waste), a
biodegradable and atoxic material is born. The material is constituted from 64.5% waste and the remaining
35.5% come from a binder made from potato starch. AgriDust can be used to create pots for plants and
packaging, moreover using cold technology, it can be 3D printed, with the classic extruder being substituted
by a syringe (Ceccolini 2015).
Figure 17 - Agridust (Ceccolini 2015).
Hoop
“3D printing has taken an interest to our rubbish bins! The Italian Francesco Pacelli, 26 year -old engineer
and materials designer, imagines lots of new materials from coffee grounds. Focus on his Hoop project that
recycles food waste for 3D printing” (Grellier 2015).
Francesco Pacelli, member of the +Lab of the Politecnico University in Milan, startled by the exponential
quantities of food waste from now to 2050, took an interest in the means to recycle the waste lastingly by
combining it with an ancestral material, clay. At the same time, he revisits the production of ceramic thanks

56 | CHAPTER III / STATE OF THE ART
to new technologies such as 3D printing. The different formulas created by him proved to be more or less
convincing. They were then given a shape, either by moulding or extruded by means of a syringe (as in the
case of Agridust), so as to design a collection of bricks and modules adapted to the production of storage,
cooking and curing devices. Once the material has taken shape, it is either dried in the sun, or cooke d in a
ceramic furnace at 1,050ºC for nine hours, in collaboration with a local ceramic laboratory (Figure 18).
Figure 18 - Hoop by Francesco Pacelli (Grellier 2015).
“The 3D test prints with these new mixed substances were very interesting because by extruding them with
a syringe, the flow is better and it ’s possible to obtain better sediment, more precise and regular than with
traditional clay. For the moment, coffee grounds are the most relevant substance to use with extrusion
because is it already in powder form. This new ceramic material, lighter and more porous than traditional
ceramic, is relevant for applications needing lightness combined with high temp erature resistance.”
Francesco Pacelli (as cited by Grellier 2015).
Wound up
Wound Up (Figure 19) is a coffee filled 3D
printing filament made using waste by-
products from coffee. It uses those coffee left-
overs to create a special 3D printing material
with visibly unique print finishes. The filament
produces objects with a rich brown colour and
a noticeable natural grain. This is the first in a Figure 19 - Wound Up (3Dom 2015).

CHAPTER III / STATE OF THE ART | 57
line of intriguing materials from 3D-Fuel called the “c2composites”. More distinctive bio-based products
will be released in the near future by the company. It can be printed on any machine capable of printing with
polylactic acid (PLA) using standard PLA settings (3Dom 2015).
FEUP bought one of these filaments to experiment with and do some testing. Using one of their 3D printers
with the ability of printing PLA, they’ve tried to make several objects, one of which can be seen on Figure
20. The method used was Fused Deposition Modelling (FDM). “Fused deposition modelling (FDM) is one of
the AM processes that build part of any geometry by sequential deposition of material on a layer by layer
basis. The process uses heated thermoplastic filaments which are extruded from the tip of nozzle in a
prescribed manner in a semi molten state and solidify at chamber temperature” (Samir Kumar Panda
2009). The 3D printer used for this is a RepRap, developed at one of FEUP’s laboratories.
Figure 20 - 3D Printer, property of FEUP (left). 3D printed octopus using 3Dom coffee filament (right).
Moreover, the filament was analysed under an optical microscope to perhaps uncover the amounts of coffee
used in relation to PLA (Table 9). The images are divided in three types of magnification (25x, 50x and
100x) and three examples of each are shown. For what is noticeable on these samples, one can apprehend
that the percentage of coffee relatively to PLA is not that great. In fact, it looks like a very small amount of

58 | CHAPTER III / STATE OF THE ART
coffee is being used in the mixture. Even from the objects printed with this material, this can be seen. The
final product presents a clear, light brown finish.
Table 9 - Microscopic analysis from 3Dom coffee filament.
Magnification Samples
25x
50x
100x
Although this technology is relatively new to greater audiences, it is safe to say that there are already
attempts to use coffee waste in additive manufacturing, with some being more successful than others.
Nevertheless, as stated before, this technology is here to stay and it might well be the way for waste reuse
in the future.

CHAPTER III / STATE OF THE ART | 59
3.3. Design Applications for Coffee Waste
When it comes to Design, there are also a variety of solutions being developed with coffee waste as a basis.
Here are five examples of what’s being done in the area, some being only concepts that are not yet being
produced for several reasons, and others that are already part of the market as established pieces of
consumption.
HIFA coffee system
Columbian-born designer Adrián Pérez and
Mauricio Carvajal are the creators of HIFA
coffee system (Figure 21). It is still a concept
and it brings up the idea of growing
mushrooms from coffee. They have idealized a
coffee making machine, which reuses the
grounds left-overs as a substrate for this
purpose. The used grounds, an abundant
resource in university districts, creative urban centres, and in pretty much every American household, are
basically the perfect material for growing mushrooms. The top of the HIFA unit houses the coffee brewing
portion of the device. Grounds are placed in, followed by just off-boil water and then a mesh strainer is
plunged down into it to separate the soaked grounds from the divine java. The double-walled carafe can be
lifted off the base for pouring, leaving behind the used coffee grounds in a little yellow cup. The coffee is
then poured into the divided lower portion of the unit. A little mycelium (mushroom roots) is added, sprayed
periodically with water, and after a while mushrooms begin to appear. The cultivation of mushrooms in the
HIFA system is very similar to other mushroom-growing kits, which often come preloaded with mycelium.
Because the HIFA unit fills the mushroom planter from the bottom up, it could be used as a potentially
endless source of edible fungus. When the substrate compartment is full, used grounds could simply be
redirected to other destinations, such as a compost pile or outdoor garden beds (DiStasio 2016).
Figure 21 - HIFA Coffee System (DiStasio 2016).

60 | CHAPTER III / STATE OF THE ART
GroCycle
GroCycle, featured on Figure 22, is a project
launched by Fungi Futures CIC, an innovative
social enterprise based in Devon, UK. They
have been growing Oyster mushrooms from
waste coffee grounds since 2011, and are still
hugely inspired by the scale of the opportunity.
They also want to spread the idea further, and
thus have created the GroCycle Urban Mushroom Farm and have designed an easy to use Mushroom Grow
Kit to enable you to grow your own gourmet mushrooms at home from waste coffee grounds (Cycle). This
product is pretty self-explanatory. As stated before, coffee waste is often used as a fertilizer for plants. In
this case it is being used to produce mushrooms. It is pretty much a well -established product on the market
by now.
Kaffeeform
Another good example of coffee based design
products is Kaffeeform (Figure 23).
"Kaffeeform is a recycled innovative material
created with coffee grounds, vegetable fibers,
cellulose and biopolymers. After five years of
experimentation and research, an original
formula was created to transform old coffee in
new products. " (Kaffeeform 2015). German
designer Julian Lechner invented this product. Following more than five years of research and development,
Lechner developed a method for mixing the used grounds with natural glues and sustainably-sourced wood
particles. The mixture becomes a liquid that can be used in injection moulds to create solid objects. This first
application for the material, Kaffeeform, is completely appropriate to the medium: espresso cups and
saucers also known by the name Kaffeeform. The material is surprisingly hard and strong, it easily stands up
Figure 22 - GroCycle (Cycle).
Figure 23 - Kaffeeform (Delana).

CHAPTER III / STATE OF THE ART | 61
to the heat of fresh espresso and it is tough enough to go through a dishwasher with no probl em. Each piece
is little different thanks to the swirling marbling patterns created by the unique materials. According to
Lechner, Kaffeeform products even retain their coffee smell after production. The cup and saucer sets are
still technically in the pre-production phase so aren’t ready for ordering just yet (Delana).
Eco Sleeve Maker
“The stats are very clear, used coffee grounds
are literally dumped by cafés and little thought
given to their recycling. Incidentally the
grounds are good raw material for
dehumidification, deodorization and compost.
However, today we focus on the ECO Sleeve
Maker, which compresses and converts used
coffee grounds into sleeves for the coffee
cups” (Seth 2014). The way this product would work is by means of adding water and sugar to the coffee
grounds inside a heated chamber to make it stiff and once we’ve used it, the sleeve could be disposed as
compost. The goal of this product would be to prolong the life and efficiency of the materials, while
eliminating the need for paper sleeves. It was created by students Choi Seung Ho, Lim Hyun Mook, Han Ji
Yeon Yu and Tae Kwon of the University Hanseo. It is, however, just a concept, although it seems to have
great potential, having already won recognition as a finalist in the International Design Excellence Awards
this year.
Decafé
Raúl Laurí is the creator of “decafé” (Figure 25), a patented material made from used coffee grounds. He
reflects on how we could make the most of our every day’s wastes. In this case, he has chosen coffee since
it is a product which is near to the user, well-known and worldwide consumed. In fact, it is the second most
traded commodity in the world. In addition, it is certain that coffee is an ‘experience bearer’ as we cannot
ignore the fact that thousands of stories and events normally take place sur rounding a cup of coffee. So, the
material is the result of a long experimentation process, patience and enthusiasm (Laurí 2012). “It is the
Figure 24 - Eco Sleeve Maker (Seth 2014).

62 | CHAPTER III / STATE OF THE ART
fact of believing in what you do what
contributes to give you the necessary strength
to achieve any objective you may have”, Raúl
says. It was achieved basically thanks to
experimentation on the use of some traditional
culinary techniques. It consists mixing the
coffee grounds with a natural binding
substance and undergoing the result to a pressure and temperature based transformation process by which
it is possible to make the material to have enough consistency to be employed in a large range of products.
The creator, however, does not share the recipe, so we don’t actually now the details of the mixture. Decafé
has already a range of products on the market, like lamps and bowls.
It can thus be concluded that much has been done in relation to coffee waste reuse in several areas, from
agriculture to product design, and even the transformation of raw materials into fuel. However, it is also
clear that many of these technologies are at the beginning of their existence and much more can still be
done.
Figure 25 - decafé by Raúl Laurí (Laurí 2012).

CHAPTER III / STATE OF THE ART | 63
3.4. PLA + Spent Coffee Grounds Tests
There is a very complete scientific article on this subject which presents results of tests done to this
composite, PLA and spent coffee grounds (SCG), so those results will be presented next. The paper is titled
“Renewable resource-based green composites of surface-treated spent coffee grounds and polylactide:
Characterisation and biodegradability” from author Chin-San Wu, 2015. The tables and figures displayed
here are all adapted from Wu’s work.
Biodegradation
Table 10 and Figure 26 show the changes in morphology of both the PLA/SCG and PLA characterised as a
function of time buried in soil, after 30 and 60 days that illustrate the extent of any morphological changes.
The 20% PLA/SCG composite exhibited randomly distributed pits, large and deep. These observations
indicate that biodegradation of the SCG phase in PLA/SCG (20%) increased with time. After 30 days,
disruption of the PLA matrix became more apparent. This degradation was consistent with the change in
mass of the PLA matrix as a function of incubation time, which reached almost -26% after only 60 days.
The most likely cause of this mass loss is biodegradation.
Table 10 - Degradation of PLA and PLA/20%SCG as a function of incubation time in soil (Wu 2015).
Day 0 Day 30 Day 60
PLA
PLA/20%SCG

64 | CHAPTER III / STATE OF THE ART
Figure 26 shows the percent mass changes as a function of time for PLA/SCG composites buried in soil
compost. Composites with 40% SCG degraded rapidly over the first 30 days, losing mass approximately
equivalent to the SCG content, and showed a more gradual decrease in mass over the following 30 days (Wu
2015).
Figure 26 - Mass loss of PLA, PLA/20%SCG and PLA/40%SCG as a function of incubation time in soil (Wu 2015).
Water Absorption
Figure 27 - Percent mass gain due to the absorption of water for PLA, PLA/20%SCG and PLA/40%SCG (Wu 2015).
0
20
40
60
80
100
10 20 30 40 50 60
Weig
ht lo
ss ra
tio (d
egra
ded/
initia
l %)
PLA PLA/20%SCG PLA/40%SCG Time (days)
0
5
10
15
20
10 20 30 40 50 60
Weig
ht ga
in (%
)
PLA PLA/20%SCG PLA/40%SCG Time (days)

CHAPTER III / STATE OF THE ART | 65
Figure 27 shows that for PLA/SCG, the percent mass gain over the 60-day test period increased with SCG
content. As the dispersion arrangement of the polymer chains in these systems is expected to be ra ndom,
the above results were likely due to decreased chain mobility at high SCG contents and the hydrophilicity of
SCG, which adhered weakly to the more hydrophobic PLA matrix (Wu 2015).
Thermal Properties
The Hf, Tm, and Tg of the PLA/SCG composites as a function of SCG content were determined using
differential scanning calorimetry (DSC). The results are shown in Table 11. Tm decreased with increasing
SCG content. Conversely, Tg increased with increasing SCG content. This increase is likely a result of the
reduced space available for molecular motion as the relative amount of SCG in the composites. Hf may be
used as an indicator of blend crystallinity. Although the Hf of the PLA/SCG blends decreased with increasing
SCG content, the extent of the decrease was significantly great in PLA/SCG, indicating a lower degree of
crystallinity (Wu 2015)
Table 11 - The effects of SCG content on the thermal properties of PLA/SCG composites (Wu 2015).
SCG (%) Tg (ºC) Tm (ºC) Hf (ºC)
0 57.8 161.3 36.5
10 59.1 159.2 29.6
20 60.5 158.2 26.6
30 61.3 157.6 24.6
40 62.2 156.3 22.3
Torque Measurements in Mixing
Figure 28 shows the effects of SCG content and mixing time on the melt torque of the PLA/SCG composite.
When preparing PLA/SCG, the polymer was first melted and SCG was added to the melt. Therefore, th e
resulting polymer composite contained powder filler. The torque decreased with increasing SCG content and
mixing time, and levelled off after 8 min of mixing. The final torque decreased with increasing SCG content
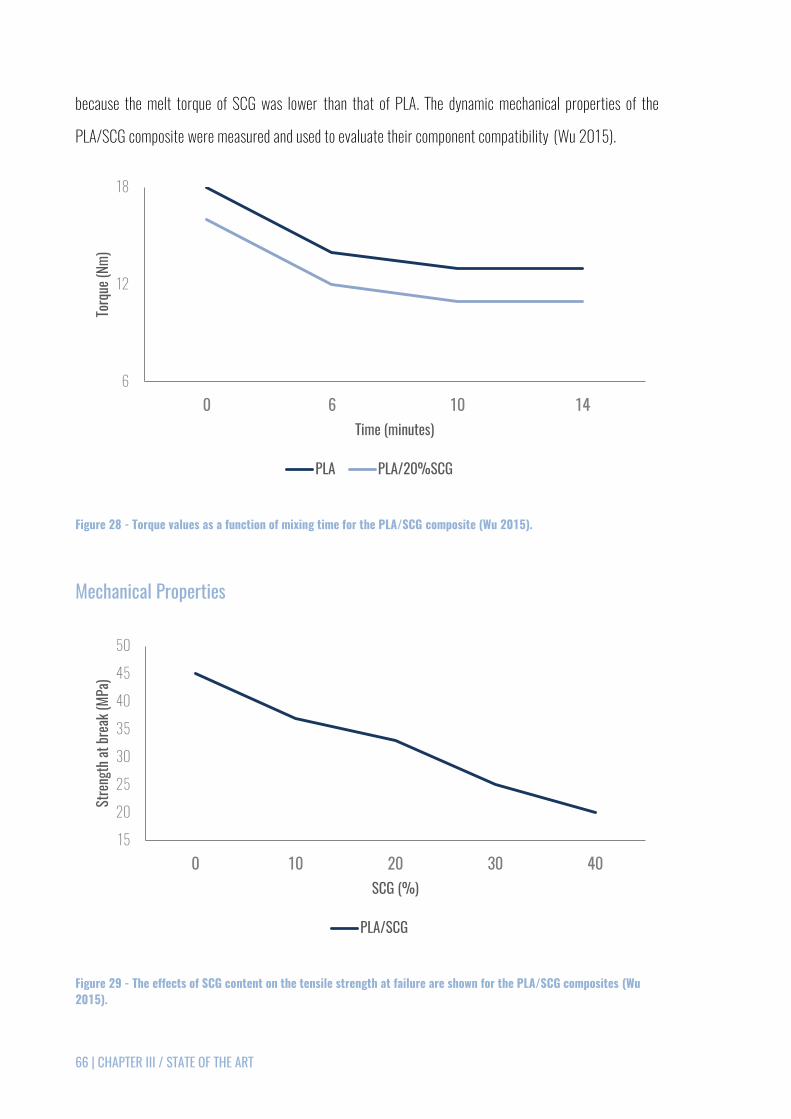
66 | CHAPTER III / STATE OF THE ART
because the melt torque of SCG was lower than that of PLA. The dynamic mechanical properties of the
PLA/SCG composite were measured and used to evaluate their component compatibility (Wu 2015).
Figure 28 - Torque values as a function of mixing time for the PLA/SCG composite (Wu 2015).
Mechanical Properties
Figure 29 - The effects of SCG content on the tensile strength at failure are shown for the PLA/SCG composites (Wu 2015).
6
12
18
0 6 10 14
Torq
ue (N
m)
Time (minutes)
PLA PLA/20%SCG
15
20
25
30
35
40
45
50
0 10 20 30 40
Stre
ngth
at br
eak (
MPa)
SCG (%)
PLA/SCG
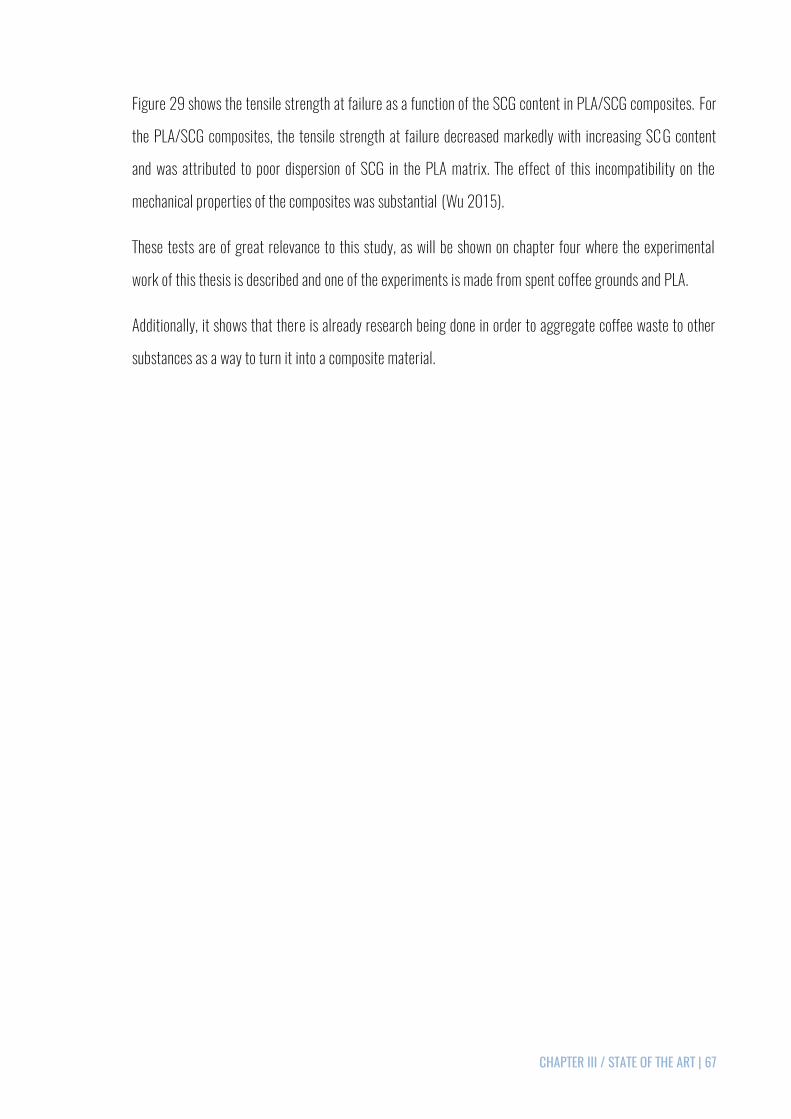
CHAPTER III / STATE OF THE ART | 67
Figure 29 shows the tensile strength at failure as a function of the SCG content in PLA/SCG composites. For
the PLA/SCG composites, the tensile strength at failure decreased markedly with increasing SC G content
and was attributed to poor dispersion of SCG in the PLA matrix. The effect of this incompatibility on the
mechanical properties of the composites was substantial (Wu 2015).
These tests are of great relevance to this study, as will be shown on chapter four where the experimental
work of this thesis is described and one of the experiments is made from spent coffee grounds and PLA.
Additionally, it shows that there is already research being done in order to aggregate coffee waste to other
substances as a way to turn it into a composite material.
Full definition of research according to the Merriam-Webster Dictionary
1: careful or diligent search 2: studious inquiry or examination; especially: investigation or experimentation aimed at the discovery and interpretation of facts, revision of accepted theories or laws in the light of new facts, or practical application of such new or revised theories or laws 3: the collecting of information about a particular subject
CHAPTER IV / EXPERIMENTAL WORK | 69
CHAPTER IV / EXPERIMENTAL WORK
EXPERIMENTAL WORK
The experimental work appears as a way to establish the main and most suitable material to add to coffee
waste, in creating this composite. The base material used in the experiments was spent coffee, obtained
domestically.
Regarding these experiments with coffee waste, the only treatment given to it was, in some cases, by
heating it in an oven at 100 ºC for 24 hours, in order to eliminate its humidity. In all other cases, it was used
as is.
This chapter is divided into five main sections. These sections refer to the materials used. To try to provide
some consistency to the base material, several binders were tested, but only one was chosen as the ideal
partner, for several reasons that will be explained further along this chapter.
The first material tried was epoxy resin. An epoxy resin is the thermosetting matrix or resin materials,
having at least one or more epoxide groups in the molecule. The epoxide also termed as oxirane or
ethoxyline group and is regarded as representative unit of epoxy polymer. Most of the commercially
available epoxy resins are oligomers of diglycidyl ether of bisphenol A (DGEBA). These oligomers then react
with the hardener, the epoxy resin gets cured and becomes a thermosetting polymer (Naheed Saba 2015).
Then, starch was used. Starch is a biopolymer synthesized in a granular form by green plants for energy
storage over long periods. Natural polymers, such as gums and mucilage, are biocompatible, cheap, easily
available and non-toxic materials of native origin. These polymers are increasingly preferred over synthetic
materials for industrial applications due to their intrinsic properties, as well as they are considered
alternative sources of raw materials since they present characteristics of sustainability, biodegradability
and biosafety (Priscilla B.S. Albuquerque 2016)

70 | CHAPTER IV / EXPERIMENTAL WORK
The third binder to be tested was pine resin. Resin is a transparent and sticky viscous liquid, yellow
brownish, a characteristic odor, which some resinous trees, like pine trees, produce when they suffer any
damage or injury to the trunk. Upon leaving the trunk from inside to the outside, it heals the wound,
protecting the tree. When it gets in contact with air, it dries and gets hard and brittle (forming crystals). It
consists of various substances as acids, alcohol and oil (ICNF 2016). Almost at the same time, wax was
added to the coffee and pine resin mix, making it the fourth material used.
The fifth and last substance used was PLA.
“Poly (lactic acid) (PLA) belongs to the family
of aliphatic polyesters commonly made from
α-hydroxy acids, which include polyglycolic
acid or polymandelic acid, and are considered
biodegradable and compostable” (Garlotta
2001). PLA is a biodegradable thermoplastic
derived from natural lactic acid from corn, maize or milk. It is a thermoplastic derived primarily from
annually renewable resources (maize, corn or milk), and it is available in a number of grades, designed for
ease of processing. In-line drying may be needed to reduce water content for extrusion and moulding. The
recommended moulding temperature is 165 – 170ºC. It resembles clear polystyrene, provides good
aesthetics (gloss and clarity), but it is stiff and brittle and needs modification using plasticizers for most
practical applications. It can be processed like most thermoplastics into fibres, films, thermoformed or
injection moulded. PLA is transparent and has FDA (Food and Drug Administration) approval for food
packaging. PLA film and sheet can be printed and laminated. Biopolymers are, howe ver, expensive, costing 2
to 6 times as much as commodity plastics like polypropylene. Food packaging, plastic bags, plant pots,
diapers, bottles, cold drink cups, sheet and film are some examples of the typical applications of this
material (CES Edupack Software, Granta Design Limited 2016). This information validates the use of this
material in the project, having into account its features with regards to food contact.
Figure 30 - PLA food packaging (Mathilde 2013).

CHAPTER IV / EXPERIMENTAL WORK | 71
Regarding the used binders, they all appear with a purpose, not having been chosen at random. The epoxy
resin, the first binder to be tested, appears because it was available at INEGI a nd only in an attempt to
understand if it would be possible to mix the coffee residue with other materials. The starch appears
because it is a natural and biodegradable polymer and these were fundamental points for this project. The
pine resin was used at a time when an ideal binder had not yet been defined and because it was a material
whose access was abundant, since other students were using it as base raw material in their own thesis. On
the other hand, the wax helped to comprehend if the mixture of pine resin with coffee could be improved,
and it was concluded that it would not result. Finally, the choice of PLA arose mainly because of the
characteristics that are already recognized. It is a biodegradable thermoplastic, which can be injected and
can be used in contact with food. Taking into account the initial objectives of this project, PLA has thus
proved to be the ideal candidate.

72 | CHAPTER IV / EXPERIMENTAL WORK
4.1. Epoxy Resin
As stated before, the first binder to be tried was an epoxy resin, Biresin CR83 with 30% catalyst and the
ratios between this material and the coffee have varied, so it could be realized what types of results could
be obtained.
Biresin CR83 is an epoxy resin system with extremely low viscosity designed specifically for the infusion
process for the production of high performance fibre reinforced composites parts and moulds. The system
has thermal properties up to 80ºC. It also has a low tendency to crystallise. It can be used in the marine and
general industrial composite areas. Due to its good wetting properties it is particularly suited for use with
carbon fibre reinforcement (SIKA 2016). See Appendix I for product data sheet.
This experiment appears as an attempt to comprehend if it would be possible to create a somewhat
mouldable material from coffee leftovers. The method of experimentation used is described on Table 12.
Table 12 - Method of experimentation with the epoxy resin.
Action Procedure
The first step was taking the coffee waste to an oven at 100 ºC for 4 hours to eliminate the humidity.
Next, the epoxy resin was mixed with the 30 % catalyst.
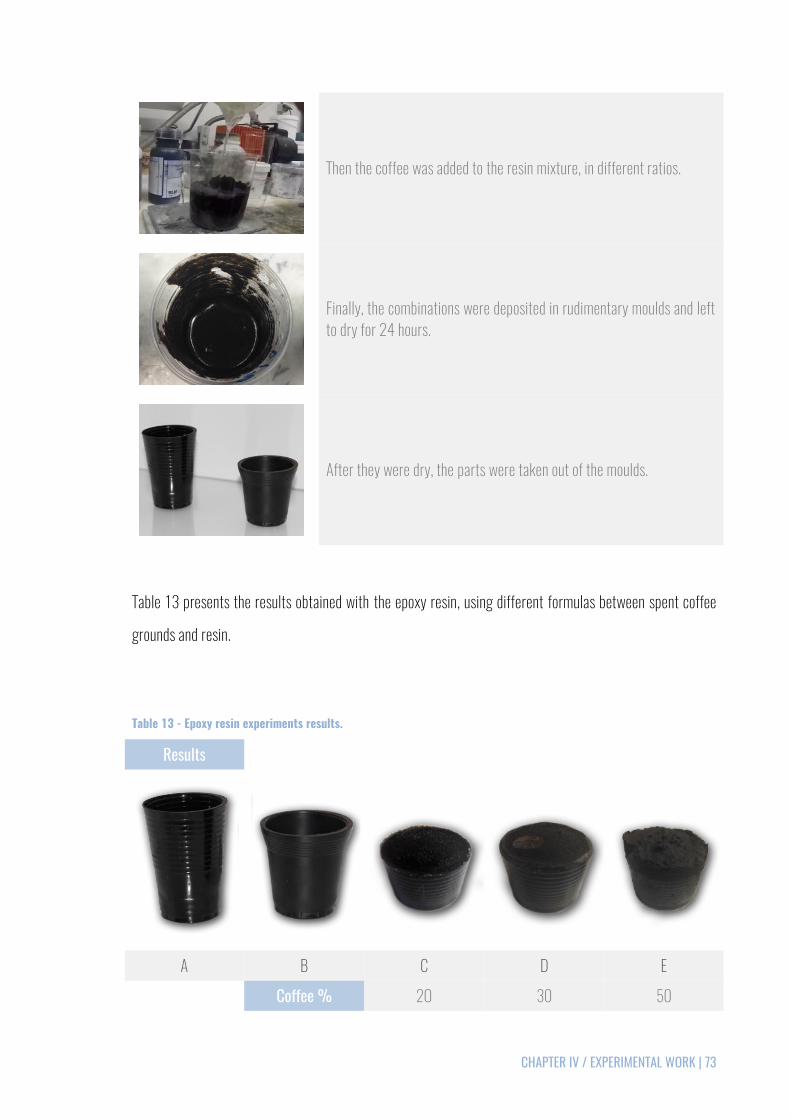
CHAPTER IV / EXPERIMENTAL WORK | 73
Then the coffee was added to the resin mixture, in different ratios.
Finally, the combinations were deposited in rudimentary moulds and left to dry for 24 hours.
After they were dry, the parts were taken out of the moulds.
Table 13 presents the results obtained with the epoxy resin, using different formulas between spent coffee
grounds and resin.
Table 13 - Epoxy resin experiments results.
Results
A B C D E
Coffee % 2O 30 50

74 | CHAPTER IV / EXPERIMENTAL WORK
Cups A and B represent experiments performed to symbolise the existing coffee cups on the market and the
percentages of coffee used, were not taken into consideration. In object C the percentage of coffee used
was 20%, while in object D was 30% and in E 50%. Obviously the different formulas will result in different
characteristics on the object, as visual appearance.
These experiments were performed to demonstrate the possibility of mixture between coffee r emains and a
binder, but have never been seen as a possibility in this project, because the used resin is not safe for food
contact.

CHAPTER IV / EXPERIMENTAL WORK | 75
4.2. Starch
The second material to be used was starch (potato and corn). Several formulas of this material were tried
and the cures were made at different temperatures and for various periods of time.
Because it is a natural polymer, the glue obtained from this element does not affect the degradation of the
final object, since it is also biodegradable.
There are countless experiments conducted with this substance and its bonding properties are already well
known and therefore, it has been used as a binder to join to coffee grounds, for students and researchers
who have tried to create from there a building material , as in the case of Agridust by Marina Ceccolini
presented in chapter III. Table 14 describes the method used on this experiment.
Table 14 - Method of experimentation with starch.
Action Procedure
The starch used in these experiments was potato starch. The first step was mixing the powdered substance with cold water, otherwise it will not mix. Next, the mixture was taken to a gas oven to be heated at a very low temperature and always stirring.
Almost immediately (no more than one minute) it becomes a blob or a paste.

76 | CHAPTER IV / EXPERIMENTAL WORK
This paste was then mixed with coffee waste.
The result of the mix between the paste and the coffee grounds is a substance similar to plasticine.
Alternatively, the mixture between the coffee and the starch can be done from the beginning, before the heating process.
In either case, the result was taken to an oven to solidify.
The temperatures and times of the substance in the oven have varied throughout the whole process.
After it has been in the oven it completely solidifies, achieving sometimes the appearance of an artificial polymer.

CHAPTER IV / EXPERIMENTAL WORK | 77
Table 15 shows some of the results obtained using starch as a binder. These are just the more relevant
results, as some of the initial experiments were unsuccessful and their results are n ot relevant for this
study.
Table 15 - Starch experiments results.
Result % Coffee Temperature (ºC) Time (min)
50 200 30
40 200 20
30 200 20
60 250 60
60 300 60
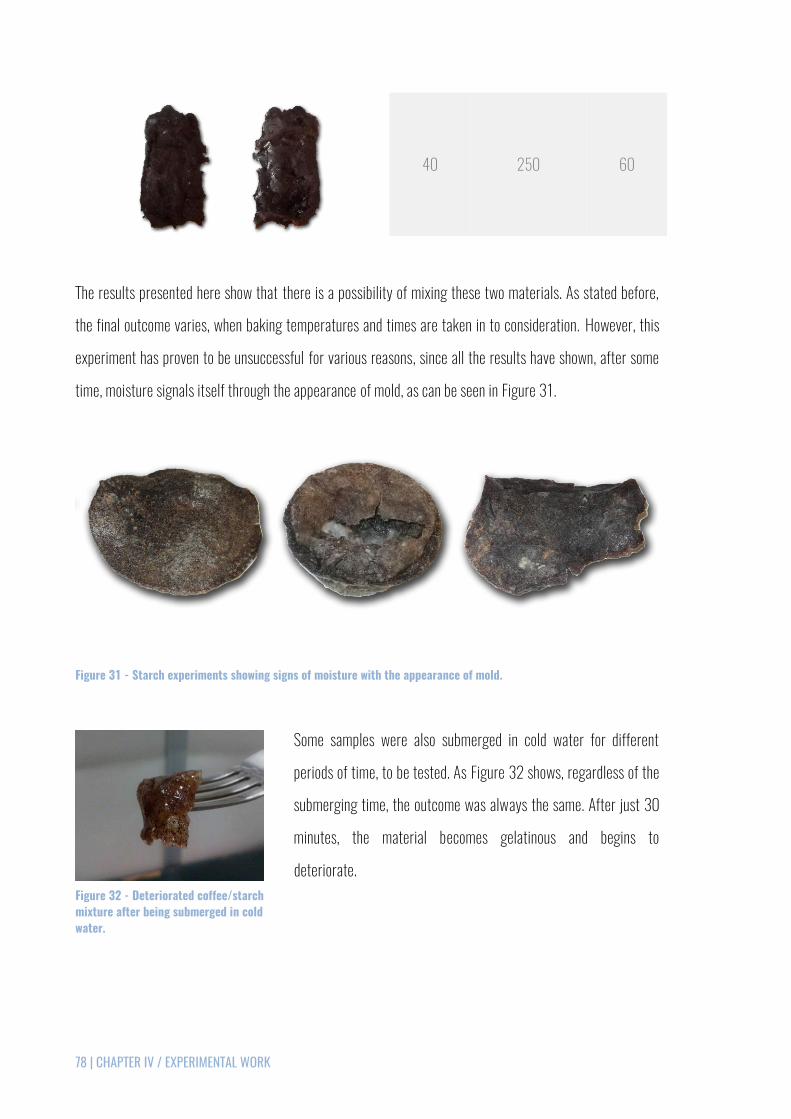
78 | CHAPTER IV / EXPERIMENTAL WORK
40 250 60
The results presented here show that there is a possibility of mixing these two materials. As stated before,
the final outcome varies, when baking temperatures and times are taken in to consideration. However, this
experiment has proven to be unsuccessful for various reasons, since all the results have shown, after some
time, moisture signals itself through the appearance of mold, as can be seen in Figure 31.
Figure 31 - Starch experiments showing signs of moisture with the appearance of mold.
Some samples were also submerged in cold water for different
periods of time, to be tested. As Figure 32 shows, regardless of the
submerging time, the outcome was always the same. After just 30
minutes, the material becomes gelatinous and begins to
deteriorate.
Figure 32 - Deteriorated coffee/starch mixture after being submerged in cold water.

CHAPTER IV / EXPERIMENTAL WORK | 79
4.3. Pine Resin
Later, some experiments were performed using pine resin, as it is a Portuguese material that was readily
available at FEUP. Also in this case, the ratios varied and the cure was virtually instantaneous. The resin
used was YT 321, produced by YSER. YT 321 is a pentaerythritol ester of rosin and stabilized to ensure a
good thermal stability and good oxidation resistance (YSER 2015). For further information on this resin, see
Appendix II.
The process of experimentation with this material was simpler. The pieces of resin where taken to a gas
oven to be heated at approximately 67.5ºC and when it began melting, the coffee powder was added. The
result of the mixture was then taken off the heat and left to dry, which happened in just seconds. It was
quickly realized that this union would be fruitless, given the fragility of the resin itself. It can still be seen in
Figure 33 that most results have become brittle and not very rigid. Additionally, the mixture never became
completely homogenised. The ratios were not even considered, given the poor relation between these two
materials.
Figure 33 - Pine resin experiment results.
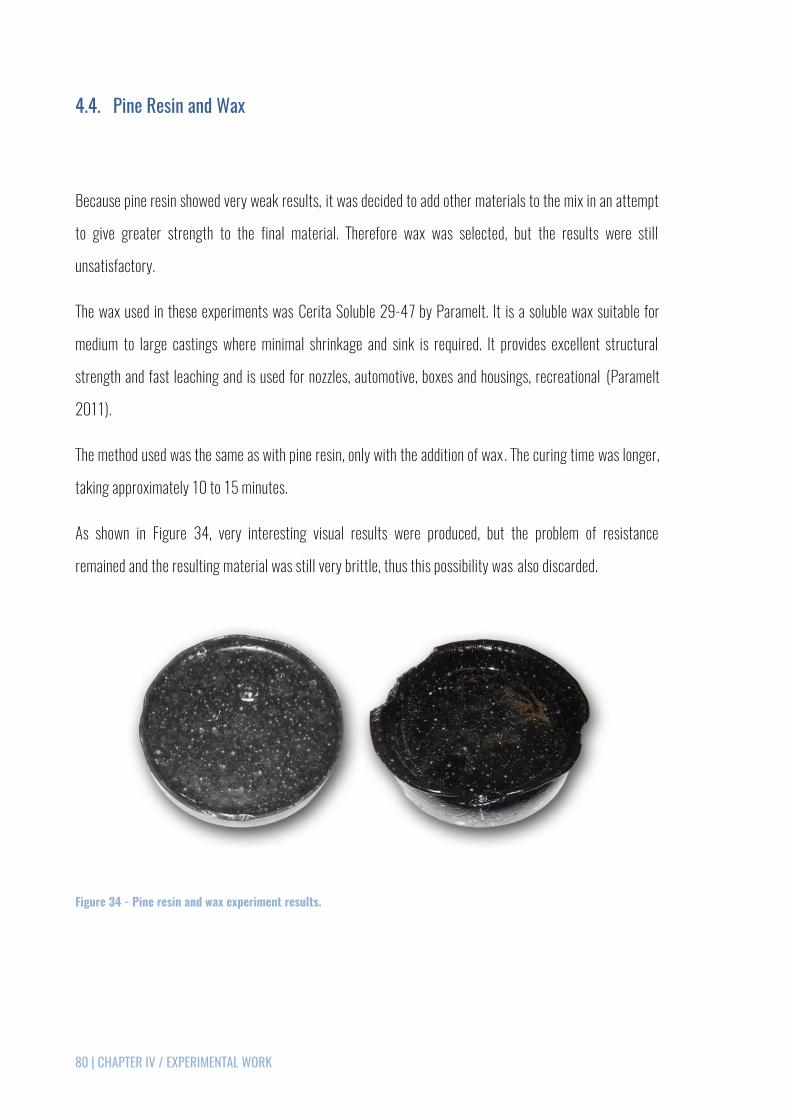
80 | CHAPTER IV / EXPERIMENTAL WORK
4.4. Pine Resin and Wax
Because pine resin showed very weak results, it was decided to add other materials to the mix in an attempt
to give greater strength to the final material. Therefore wax was selected, but the results were still
unsatisfactory.
The wax used in these experiments was Cerita Soluble 29-47 by Paramelt. It is a soluble wax suitable for
medium to large castings where minimal shrinkage and sink is required. It provides excellent structural
strength and fast leaching and is used for nozzles, automotive, boxes and housings, recreational (Paramelt
2011).
The method used was the same as with pine resin, only with the addition of wax . The curing time was longer,
taking approximately 10 to 15 minutes.
As shown in Figure 34, very interesting visual results were produced, but the problem of resistance
remained and the resulting material was still very brittle, thus this possibility was also discarded.
Figure 34 - Pine resin and wax experiment results.

CHAPTER IV / EXPERIMENTAL WORK | 81
4.5. PLA (Polylactide)
Finally, experiments were made using Polylactide (PLA) as a binder and positive results began to appear.
Ingeo Biopolymer 3251D from NatureWorks was the material used throughout the process of
experimentation. It is designed for injection moulding applications. This polymer grade has a higher melt
flow capability than other Ingeo resin grades currently in the marketplace. The higher flow capability allows
for easier moulding of thin-walled parts. It is designed for injection moulding applications, both clear and
opaque, requiring high gloss, UV resistance and stiffness (NatureWorks 2016). For further information on
this material, see Appendix III.
The first method of experimentation with PLA can be seen on Table 16.
Table 16 - Method of experimentation with PLA.
Action Procedure
Before the first experiment with PLA, an object (cup) was created in Solidworks (CAD programme) and converted to STL format. It was then printed by method of FDM on one of FEUP’s printers. The printer is a RepRap, developed at one of FEUP’s laboratories and the filament is a 1.75 mm blue PLA, from 3D Ink.
From the 3D printed piece, a silicone mould was created in INEGI (Institute of Science and Innovation in Mechanical Engineering and Industrial Engineering).
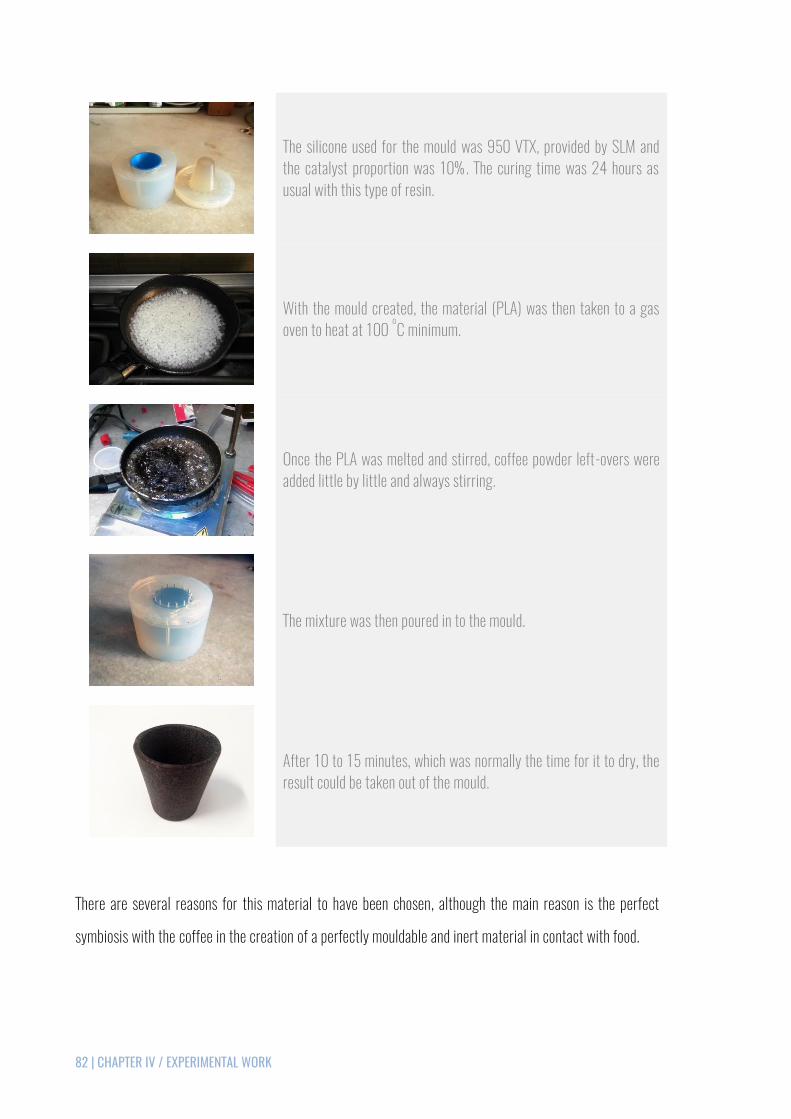
82 | CHAPTER IV / EXPERIMENTAL WORK
The silicone used for the mould was 950 VTX, provided by SLM and the catalyst proportion was 10%. The curing time was 24 hours as usual with this type of resin.
With the mould created, the material (PLA) was then taken to a gas oven to heat at 100 ºC minimum.
Once the PLA was melted and stirred, coffee powder left-overs were added little by little and always stirring.
The mixture was then poured in to the mould.
After 10 to 15 minutes, which was normally the time for it to dry, the result could be taken out of the mould.
There are several reasons for this material to have been chosen, although the main reason is the perfect
symbiosis with the coffee in the creation of a perfectly mouldable and inert material in contact with food.

CHAPTER IV / EXPERIMENTAL WORK | 83
In addition, it is also biodegradable and that is a positive thing as it was one of the initial goals for this work .
In fact, as can be seen on chapter three, point 3.4, PLA and spent coffee grounds together, accelerate its
biodegradability.
Figure 35 represents some of the first mixes of PLA in conjunction with coffee residue. The percentages
were not taken into account, but it was rapidly comprehended it would work for the fulfilment of the pre-
defined goal. For these samples, the mixture was deposited in to some aluminium cupcake moulds.
Figure 35 - Initial PLA experiment results.
After the initial impression on this material, and already with the first silicone mould created, man y
experiments were done in order to try and define the ratio coffee/PLA (Figure 36).
Table 17 shows the best results created in this manner. Sample A is composed from 20% spent coffee
grounds and 80% PLA, sample B is 30% coffee and C 40% .
It was concluded, therefore, that the greater the proportion of coffee in the blend, the longer will have to be
the heating of the two materials in order for them to merge. 40% was the best initial formula for this
mixture, with this mould, although this percentage has been increased as will be seen further along this
chapter.

84 | CHAPTER IV / EXPERIMENTAL WORK
Table 17 - Moulded samples with formulas.
Results
A B C
Coffee % 2O% 30% 40%
Figure 36 - Experiments with PLA/coffee on a silicone mould.

CHAPTER IV / EXPERIMENTAL WORK | 85
This mixture presented however a structural problem, since the
part cannot be machine washed, due to the high temperatures to
which it would be subjected. In this case, the material undergoes
irreparable deformation and gets unusable (Figure 37). The piece
has therefore to be washed by hand, preferably with cold water.
Another preoccupation was if the material would withstand hot
beverages (coffee) temperatures. The part behaved according to
the goal, it even had some insulation, and tolerated the contact with
hot coffee, fulfilling part of its function (Figure 38). However, after
a couple of minutes it began to show signs of softness, and became
wobbly. For this reason, we do not believe the material to be
completely tolerant to hot liquids at this stage.
On Table 18 is possible to see samples of various formulas made between coffee and PLA without the aid of
a mould. The mixture was done in the same exact way as before and as soon as it was liquid and
homogenised, it was deposited on a clean, smooth surface.
Table 18 - Samples of various formulas PLA/coffee without being moulded.
Sample % Coffee Description
5
This first sample has 5% coffee residue and is smooth to the touch. It is also somewhat transparent when placed against a light source.
Figure 37 - Sample after being machine washed.
Figure 38 - Sample with hot coffee.

86 | CHAPTER IV / EXPERIMENTAL WORK
10
The result with 10% coffee doesn’t change much from the previous sample. The surface is also smooth but firm and it is also somewhat transparent.
15
From these experiments, 15% was the limit to attribute some transparency to it, although it may vary with higher thicknesses. Again, smooth surface finish.
20 At 20% coffee waste we lose the transparency of the material. Although the surface maintains a smooth finish.
30
30% and 40% present very similar results, but there’s an obvious difference in the surface roughness, especially to the touch. On the 40% sample it’s already possible to see some of the coffee paste.

CHAPTER IV / EXPERIMENTAL WORK | 87
40
50 With 50% the change is obvious, either by touch or just visual. It is clearly a rougher material.
60
Without a mould, just pouring the mix on to a surface, 60% was the higher percentage we could achieve, as the material begins to not flow as easily. However, some good visual effects may be taken out of it.
As the first mould was too small, another one was created in the same way for the cup ( Figure 39) and more
experiments were done using different percentages of each material , as can be seen on Table 19.
The difference between this mould and the first one, besides the scale, was that the printed part was also
treated with a high performance 3D print coating from Smooth-on, Inc. called XTC‑3D, to give it a smoother
surface. The results obtained are, consequently, also smoother.

88 | CHAPTER IV / EXPERIMENTAL WORK
Figure 39 - Creation of a second, bigger mould for the cups.
Table 19 - Samples of various formulas of PLA/coffee using a mould.
% Coffee Samples
10
20
40
50
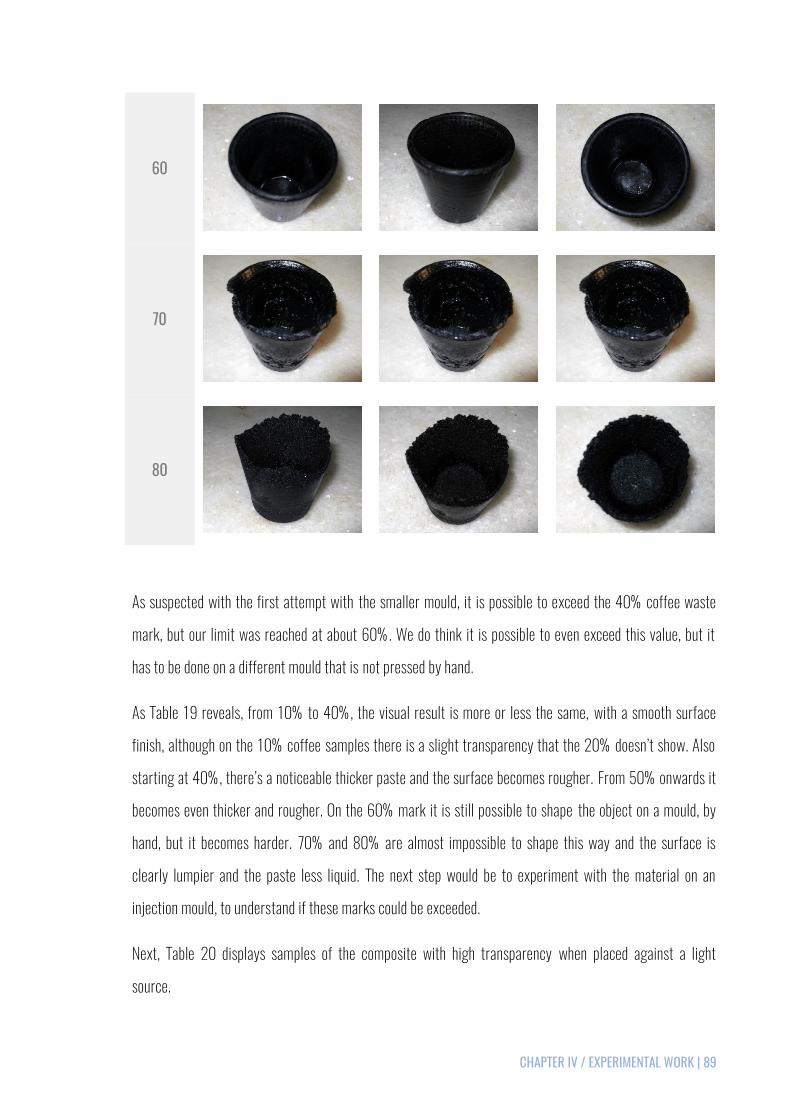
CHAPTER IV / EXPERIMENTAL WORK | 89
60
70
80
As suspected with the first attempt with the smaller mould, it is possible to exceed the 40% coffee waste
mark, but our limit was reached at about 60%. We do think it is possible to even exceed this value, but it
has to be done on a different mould that is not pressed by hand.
As Table 19 reveals, from 10% to 40%, the visual result is more or less the same, with a smooth surface
finish, although on the 10% coffee samples there is a slight transparency that the 20% doesn’t show. Also
starting at 40%, there’s a noticeable thicker paste and the surface becomes rougher. From 50% onwards it
becomes even thicker and rougher. On the 60% mark it is still possible to shape the object on a mould, by
hand, but it becomes harder. 70% and 80% are almost impossible to shape this way and the surface is
clearly lumpier and the paste less liquid. The next step would be to experiment with the material on an
injection mould, to understand if these marks could be exceeded.
Next, Table 20 displays samples of the composite with high transparency when placed against a light
source.

90 | CHAPTER IV / EXPERIMENTAL WORK
Table 20 - Samples with high transparency.
Sample Description
A The three samples pictured here, represent mixtures from 5% to 15% spent coffee grounds and are all somewhat transparent. It allows for a unique effect when placed against a light source. These samples where achieved in the same manner as samples from Table 18. B is made out of 10% coffee waste and is the more transparent of the three. A is 10% and C 15%. It is clear that the amount of coffee changes the visual effect, letting more or less light pass through. These samples brought a new side to this study, since for a designer , the visual properties it displays present new possibilities. . Many objects can be made out of it with the goal of playing with light.
B
C
So, in conclusion for this chapter, it is obvious that the experimental work was fundamental in obtaining and
developing this material. The epoxy resin experiment was valid in order to determine that coffee waste can,
in fact, be mixed with other substances to achieve a composite material. It didn’t work however, because it
is not safe for food contact and is not biodegradable. Starch showed some promising results at the
beginning, but with time it revealed great negative characteristics, with the appearanc e of mold on all
samples. It also couldn’t withstand contact with cold water, being therefore discarded. Pine resin displayed
very weak results, because it couldn’t be homogenised with coffee waste, not even with the addition of wax.
PLA exceeded the initial expectations. It is biodegradable and the experiments showed very good results,
with different formulas, permitting its use in different areas of interest. It is also FDA approved, allowing for
food contact. The final material is not, however, perfect or completely developed. It does not withstand high
temperatures like hot beverages (coffee). There is, for that reason, room for improvement.

CHAPTER V / DESIGN PROPOSAL | 91
CHAPTER V / DESIGN PROPOSAL
DESIGN PROPOSAL
The objective with this chapter is to demonstrate different ways of using the developed material.
The design proposal is divided into four sections. The first section is where the main project is presented.
Section number two addresses the creation of a prototype that validates the main project. On section three,
other design possibilities are proposed in an attempt to show the various areas that the composite material
can be used. Finally, on the fourth section, a construction proposal by means of injection moulding is
presented.
Injection moulding involves melting a thermoplastic by extrusion, injecting the polymer melt into a mold,
cooling the part, and finally ejecting the part. Most polymers can be injection moulded so long as they can
flow and fill the mold cavity easily (Majid Jamshidian 2010). This is the most common method of producing
parts made of plastic. The process includes the injection or forcing of heated molten plastic into a mold
which is in the form of the part to be made. Upon cooling and solidification, the part is ejected and the
process continues. The injection moulding process is capable of producing an infinite variety o f part designs
containing an equally infinite variety of details such as threads, springs, and hinges, and all in a single
moulding operation (Engineers).

92 | CHAPTER V / DESIGN PROPOSAL
5.1. Main Project
The first goal of the main design project would be to create a cup with the capacity of withstanding hot
coffee temperatures. However, throughout this study, it was realized that this would not be possible at this
stage. The project stays the same, but its function adapted to its physical characteristics.
It is a tray with capacity for 6 cups. The cups are made out of our composite (preferably 40% coffee
grounds waste), as well as the two side bases/handles. The tray pla tform is made out of light wood to
introduce some contrast to the set (Figure 40).
Figure 40 - Explanatory sketch for the main design project.
This project was set within the discipline of Industrial Design from the Master’s degree in Product and
Industrial Design’s first year from the Faculties of Engineering and Fine Arts from the University of Porto.
The main objective was the creation of one or more objects from the reuse of wasted materials in the
municipality of Matosinhos, in Porto, Portugal. It was also necessary to take into account the low cost of
creations in an attempt to generate profit for the poorest communities in the region.
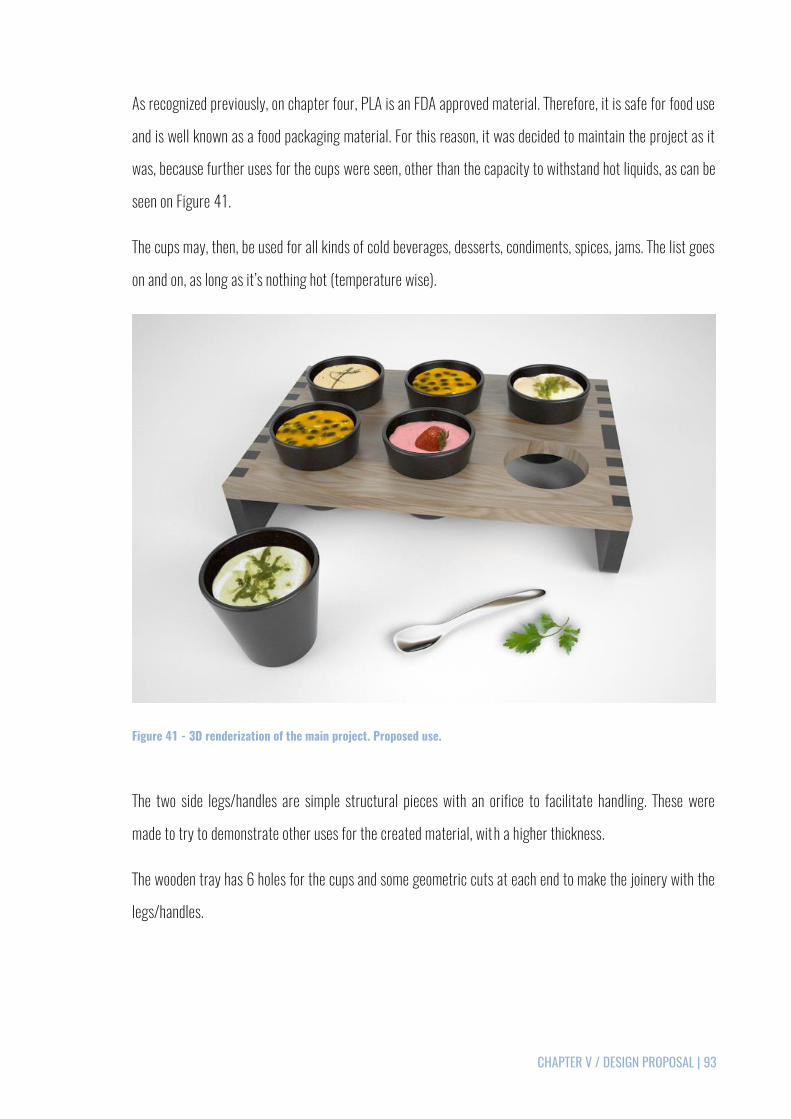
CHAPTER V / DESIGN PROPOSAL | 93
As recognized previously, on chapter four, PLA is an FDA approved material. Therefore, it is safe for food use
and is well known as a food packaging material. For this reason, it was decided to maintain the project as it
was, because further uses for the cups were seen, other than the capacity to withstand hot liquids, as can be
seen on Figure 41.
The cups may, then, be used for all kinds of cold beverages, desserts, condiments, spices, jams. The list goes
on and on, as long as it’s nothing hot (temperature wise).
Figure 41 - 3D renderization of the main project. Proposed use.
The two side legs/handles are simple structural pieces with an orifice to facilitate handling. These were
made to try to demonstrate other uses for the created material, with a higher thickness.
The wooden tray has 6 holes for the cups and some geometric cuts at each end to make the joinery with the
legs/handles.
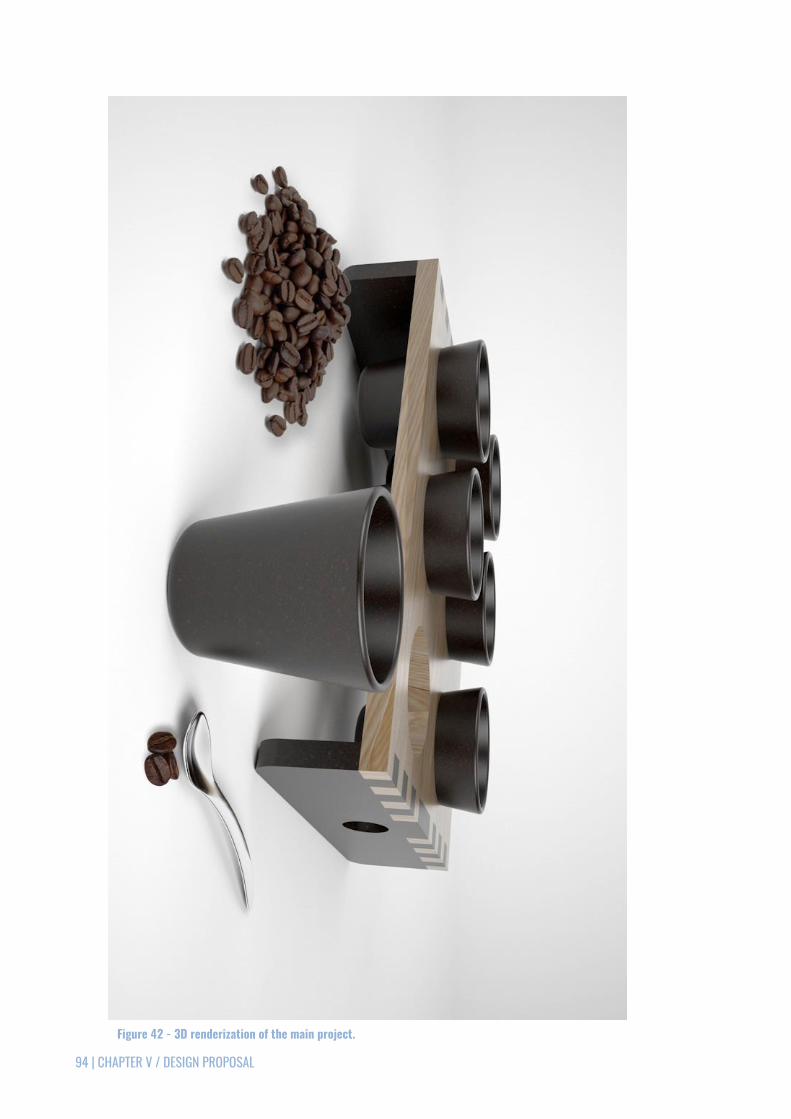
94 | CHAPTER V / DESIGN PROPOSAL
Figure 42 - 3D renderization of the main project.

CHAPTER V / DESIGN PROPOSAL | 95
5.2. Prototype
With the main project idealized, it was time to try and validate it with the construction of a prototype. Table
21 describes the process used for this task.
Table 21 - Prototype creation description.
Action Procedure
The first step was to create the 3D printed cup, in the same way the earlier version was created, as can be seen on chapter four.
From the 3D printed object, a silicone mould was produced.
Next, our formula of 40% coffee waste and PLA was poured into the mould.
After about 15 to 20 minutes the material was dry and the mould could be opened.

96 | CHAPTER V / DESIGN PROPOSAL
These steps were repeated at least 6 times, to produce the cups for the prototype.
For the base legs/handles, again a 3D printed piece was produced.
From that piece, a silicone mould was created.
And following the same process as with the previous objects, the intended part was formed.
For the wooden part, the chosen method was by laser cutting, as it was the fastest and most precise method.
For the laser cut, the CAD part was converted to DWG (2D) and from that, an operative programmed a laser cutting machine to cut a wooden board with the aid of software. The machine used for this task is from Hanma Laser, as is the software that programmes it.

CHAPTER V / DESIGN PROPOSAL | 97
The initial 3D printed pieces were all produced at FEUP on one of their printers, the moulds were created in
INEGI with the aid of their staff and the wooden part was cut at Manuel, Ferreira & Augusto, Lda. The only
assemblage necessary was to glue the legs/handles to the wooden tray.
Figure 43 - Prototype parts.
Figure 44 - Prototype

98 | CHAPTER V / DESIGN PROPOSAL
General Dimensions
Figure 45 - General dimensions for the cup and legs/handles parts.

CHAPTER V / DESIGN PROPOSAL | 99
Figure 46 - General dimensions for the wooden tray.
For the Design process, many software programs were used to obtain the final images presented in each
step, in order to properly communicate the products. The main 3D modelling program was Solidworks,
although 3DS Max was also used at times to achieve the desired results. For the rendering part of the
process, Keyshot and VRay were used for the primary images and Photoshop appeared to complement them
as an image editor software. For the technical drawings of the parts, Solidworks was again used as a base
and then Adobe Illustrator, to turn them into vector images.

100 | CHAPTER V / DESIGN PROPOSAL
5.3. Other Design Possibilities
Because the experimental work presented such positive results in terms of formulas between coffee waste
and PLA, with so many different visual and physical effects, other design possibilities (besides the main
project) were thought of.
Figure 47 illustrates the creative process that allowed for the creation of the product s present on this
section of the chapter. These products try to embrace the different potentials offered by the material. Some
include the contact with food, others the good relation between coffee waste and plants, and even the effect
some samples have when placed against a light source.
Figure 47 - Other design possibilities creative sketch.
CHAPTER V / DESIGN PROPOSAL | 101
From Figure 48 to Figure 55 these possibilities for the produced material can be seen, other than the main
project. They all have into account the sui-generis characteristics of the mixture, studied through the
process of experimentation.
Figure 48 and Figure 49 depict the possibility of creating some kind of object to interact with plants. As
indicated before, on chapter three, coffee is already being used with this purpose and from the tests on
point 3.4 from chapter three, the mixture between PLA and coffee left overs is biodegradable. Consequently,
this is an instant option for the use of this material.
On Figures 50, 51 and 52 there’s an attempt to demonstrate, from a design point of view, how well the
composite would look in contact with food. This is not a problem from the health and safety standpoint,
since it is by now well established that PLA is in no way a hazardous substance for this. So anything like
dessert plates, cups for cold beverages, bowls for salads or fruit and even containers for appetizers could be
a possibility.
Figures 53 and 54 should be accompanied by Table 20 for further understanding of the concept. Basically
at smaller percentages of coffee, the mixture becomes considerably transparent, allowing for light to pass
through it. With this in mind, the idea of conceiving a lamp emerged. The material itself might work as a
shade for the lamp, if the conditions are right. What is meant by this is that the shade should never be in
contact with the hot bulb and preferably this would be an LED (light-emitting diode).
On lifx.com there’s an article explaining how hot LEDs really are. In development and testing, they found that
the heatsink of a fully lit LED bulb was around 60°C-100°C (140°F-212°F) depending on the make and
model of the LED bulb, room temperature, and airflow (Alexander 2014). But you can only feel how really
hot they are, if you touch them directly. Because of this, it is almost certain that the material at the right
distance from the bulb, would withstand the temperature.
The list of design possibilities could go on with the visual properties and surface finishes this material
offers, it really feels like the sky is the limit, as long as the material’s true properties and characteristics are
understood.
Perhaps in the future even more possibilities could emerge, for its use in several areas.
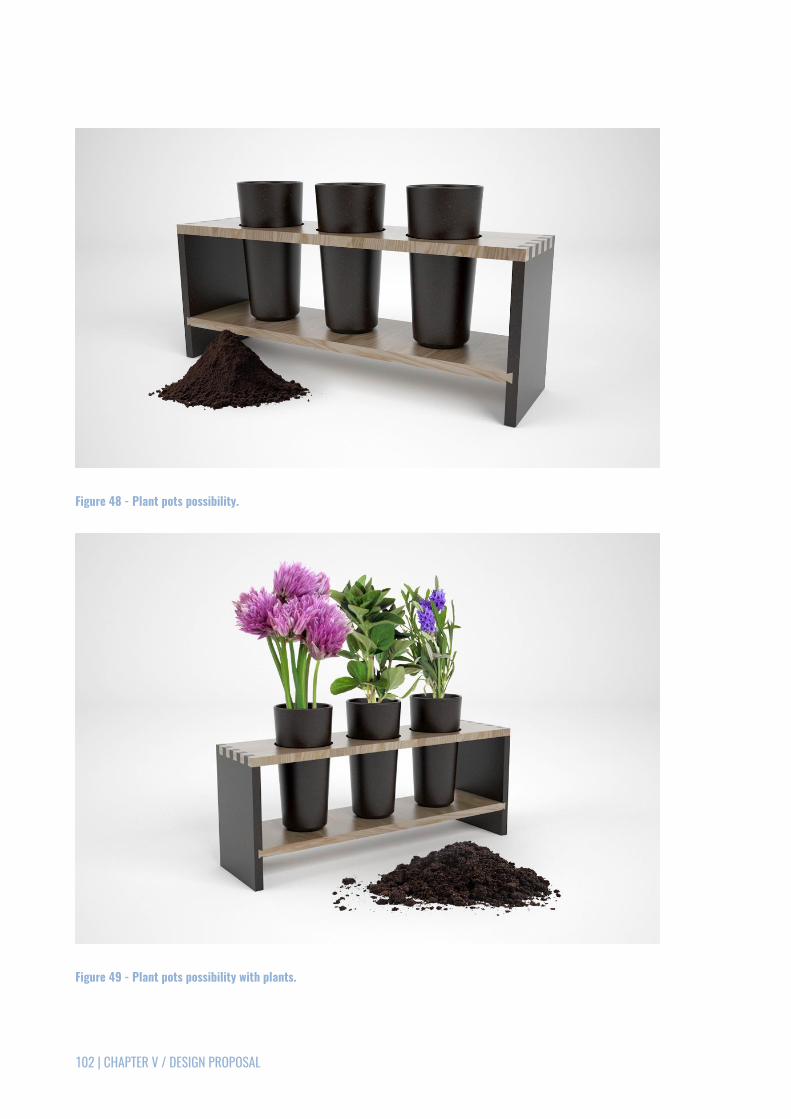
102 | CHAPTER V / DESIGN PROPOSAL
Figure 48 - Plant pots possibility.
Figure 49 - Plant pots possibility with plants.

CHAPTER V / DESIGN PROPOSAL | 103
Figure 50 - Containers for appetizers and cup for cold beverages.
Figure 51 - Different sized bowls and plates for various purposes.
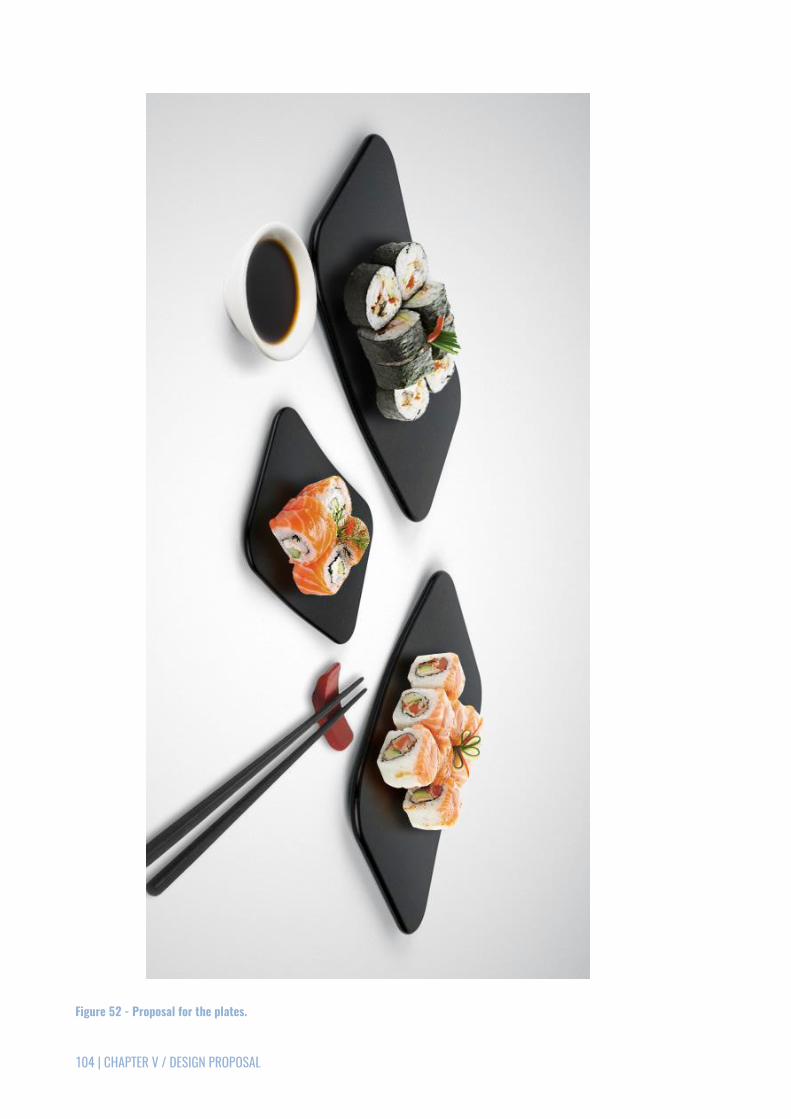
104 | CHAPTER V / DESIGN PROPOSAL
Figure 52 - Proposal for the plates.

CHAPTER V / DESIGN PROPOSAL | 105
Figure 53 - Possibility for using the material as a shade.
Figure 54 - Aspect of the shade against a light source.

106 | CHAPTER V / DESIGN PROPOSAL
Figure 55 - Set of all the design proposals for the developed material.

CHAPTER V / DESIGN PROPOSAL | 107
5.4. Construction Proposal
The proposed method for construction of parts using this material, from an Industrial Designer’s point of
view, has to be by Injection moulding. Figure 56 illustrates an injection moulding machine. Injection
moulding machines consist of a material hopper, screw type plunger or an injection ram and a heating unit.
It holds the mould tool to get the required shape of the components. In which the amount of clamping force
that the machine can exert in terms of in tonnage. The plastic material requires more injection pressure to
fill the mould and this more clamp tonnage is required to hold the mould closed (N. Sreenivasulu 2013).
Figure 56 - Injection Moulding Machine (N. Sreenivasulu 2013).
If Appendixes three and four are consulted, relative to PLA, as well as point 4.5 from chapter four, it
becomes clear that this method is in accordance with the selected material. For the developed substance in
conjunction with coffee powder, there would, nonetheless, be the need to first mix the two materials. This
could be done on a machine similar to the one seen on Table 22. The machine would heat the materials and
constantly mix them to create the desired paste. From this paste, plates or even pallets could be done, and
those parts could then integrate the normal process of injection moulding.
On Figure 57 it is possible to have a glimpse at what a mould for a cup, similar to the one created in the
main project, could look like. So, there would be the nozzle, from which the material would be injected and
then the liquid substance would go through the distribution channels of the two-main-part mould and stay

108 | CHAPTER V / DESIGN PROPOSAL
lodged there. After it cooled down, the cavity would be lifted and then the striper plate would lift our
finished part. This is just a simulation, as this could be made in various different ways.
Table 22 - Plastic industrial Colour Mixer 300kg Blender Machine (Jiangmen Xiecheng Machinery Co.).
Model N° XC-HL300
Mixer type Powder Mixer
Job High Speed Mixer
Agitation type Spiral
Application Liquid with solids in suspension, powder, viscous fluid, liquid, granules
Figure 57 - Tooling for a plastic cup (Gutowski).

CHAPTER V / DESIGN PROPOSAL | 109
A cost simulation for the cup has also been conducted, with the aid of Solidworks (software). This simulation
predicts the creation of 100 000 cups, on an industrial mould with capacity for 64 units. The estimated cost
per unit amounted to 3.46 US dollars (Table 23). However, this study only provides results for the use of
PLA alone. If it would be mixed with 40% of other substance like coffee, which is normally free after used,
this value could descend to almost half. The complete simulation can be consulted on Appendix six of this
document.
Table 23 - Cost Simulation
Manufacturing Method: Plastics Quantity to Produce
Material: PLA Total Number of Parts: 100 000
Stock weight: 0.03 kg Number of cavities: 64
Mold Type: Hot Runner Mold
Maximum Wall Thickness: 4.00 mm Estimated Cost per Part 3.46 USD
Material cost/weight: 2.54 USD/kg
Shop Rate: N/A
And if in previous years, the most negative point of PLA was its price in comparison wi th petrochemical-
based polymers, today, by using other sources of dextrose, optimizing lactic acid production processes and
its costs, substituting electricity energy by wind and solar energy for PLA production, optimizing PLA
production processes, and increasing PLA demands, reduction of its price can be attained. The present PLA
price is much lower than in previous years, but it is not fixed and it even will be considerably lower in the
future because, according to expert forecasts, beyond 2010 the global demand for biodegradable plastics
will continue to increase by 30% each year and PLA will take a large part of this market because of its
valuable properties (Majid Jamshidian 2010).
For what can be seen on this chapter, the design proposal might be considered a success, having in mind
that most of the initial goals were achieved and some have even exceeded expectations. Several proposals
were made for the material and the creation of a prototype became a reality.

110 | CHAPTER VI / CLOSING REMARKS
CHAPTER VI / CLOSING REMARKS
CLOSING REMARKS
6.1. Conclusions
From chapter two, it can be concluded that waste in general is growing and there are no predictions for this
growth to slow down. And although there are already waste treatment strategies in place, if it could be
reused, this problem might not exist in a near future. Also, the use of most wastage materials allow for a no
cost approach, making this an unrivalled advantage. For this reason, it becomes apparent that coffee waste
really is a good choice for a substance to be reused as a material on the creation of design products. It is
also obvious that its abundance will continue to exist and designers should see this as an opportunity.
Chapter three demonstrates that it is safe to recognize that coffee grounds waste is and has been studied
for its characteristics in order for it to be reused in the most various ways and on different areas of interest.
Moreover, there are already attempts to use coffee waste in additive manufacturing, with some being more
successful than others. Additionally, it can be concluded that much has been done in relation to coffee waste
reuse in several areas, from agriculture to product design, and even the transformation of raw materials into
fuel. However, it is also clear that many of these technologies are at the beginning of their existence and
much more can still be done. It also shows that there is already research being done in order to aggregate
coffee waste to other substances as a way to turn it into a composite material.
With chapter four, it can be concluded that PLA exceeded the initial expectations. It is biodegradable and
the experiments showed very good results, with different formulas, permitting its use in different areas of
interest. It is also FDA approved, allowing for food contact. The final material is not, however, perfect or

CHAPTER VI / CLOSING REMARKS | 111
completely developed. It does not withstand high temperatures like hot beverages (coffee) or washing
machines. There is, for that reason, room for improvement to create an ideal material, but the forecasts are
quite positive. Taking into account that it is a mouldable material, the creation of shapes is only limited by
the imagination.
However, it is certain that the developed composite allows for coffee waste to be reused in the universe of
Product and Industrial Design. There is still some way to go to improve this technology, but at this time one
can already realize that coffee does not need to be just another piece of trash, it can be turned in to a
building material, very efficient and applicable to a large number of areas.
6.2. Future Perspectives
For the future, much more could still be done. I, personally, do not believe that a new material can be
developed in its entirety within one year, by only one person, so it would be needed either more time for
development or a team of researchers. The next steps regarding the composite itself would be to try to
improve it in order to withstand higher temperatures, through further experimentation. Perhaps adding
some other substance to the mixture could solve this problem.
Another aspect that would improve the final result in the future would probably be to test the various
formulas on FEUP’s and INEGI’s laboratories to try to achieve greater physical properties.
Finally, it would also be interesting to create some products by means of injection, to confirm, or not, if this
is the best way for part construction.
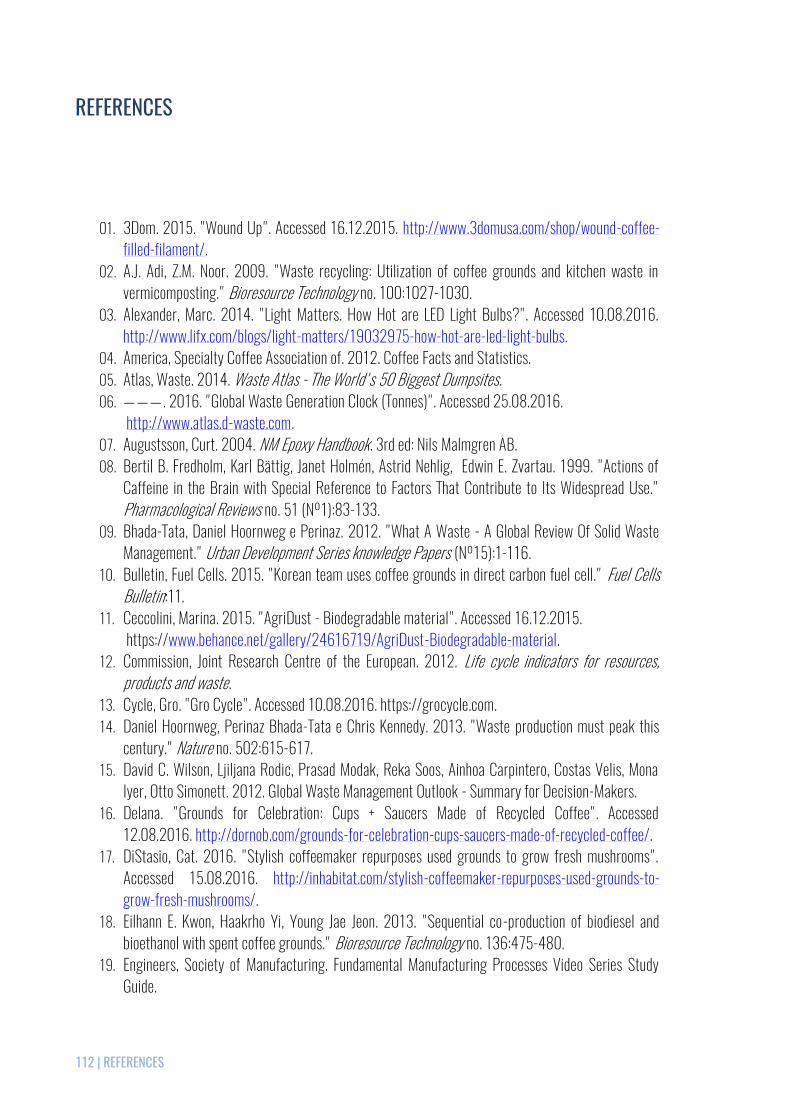
112 | REFERENCES
REFERENCES
01. 3Dom. 2015. "Wound Up". Accessed 16.12.2015. http://www.3domusa.com/shop/wound-coffee-filled-filament/.
02. A.J. Adi, Z.M. Noor. 2009. "Waste recycling: Utilization of coffee grounds and kitchen waste in vermicomposting." Bioresource Technology no. 100:1027-1030.
03. Alexander, Marc. 2014. "Light Matters. How Hot are LED Light Bulbs?". Accessed 10.08.2016. http://www.lifx.com/blogs/light-matters/19032975-how-hot-are-led-light-bulbs.
04. America, Specialty Coffee Association of. 2012. Coffee Facts and Statistics. 05. Atlas, Waste. 2014. Waste Atlas - The World's 50 Biggest Dumpsites. 06. ——— . 2016. "Global Waste Generation Clock (Tonnes)". Accessed 25.08.2016.
http://www.atlas.d-waste.com. 07. Augustsson, Curt. 2004. NM Epoxy Handbook. 3rd ed: Nils Malmgren AB. 08. Bertil B. Fredholm, Karl Bättig, Janet Holmén, Astrid Nehlig, Edwin E. Zvartau. 1999. "Actions of
Caffeine in the Brain with Special Reference to Factors That Contribute to Its Widespread Use." Pharmacological Reviews no. 51 (Nº1):83-133.
09. Bhada-Tata, Daniel Hoornweg e Perinaz. 2012. "What A Waste - A Global Review Of Solid Waste Management." Urban Development Series knowledge Papers (Nº15):1-116.
10. Bulletin, Fuel Cells. 2015. "Korean team uses coffee grounds in direct carbon fuel cell." Fuel Cells Bulletin:11.
11. Ceccolini, Marina. 2015. "AgriDust - Biodegradable material". Accessed 16.12.2015. https://www.behance.net/gallery/24616719/AgriDust-Biodegradable-material.
12. Commission, Joint Research Centre of the European. 2012. Life cycle indicators for resources, products and waste.
13. Cycle, Gro. "Gro Cycle". Accessed 10.08.2016. https://grocycle.com. 14. Daniel Hoornweg, Perinaz Bhada-Tata e Chris Kennedy. 2013. "Waste production must peak this
century." Nature no. 502:615-617. 15. David C. Wilson, Ljiljana Rodic, Prasad Modak, Reka Soos, Ainhoa Carpintero, Costas Velis, Mona
Iyer, Otto Simonett. 2012. Global Waste Management Outlook - Summary for Decision-Makers. 16. Delana. "Grounds for Celebration: Cups + Saucers Made of Recycled Coffee". Accessed
12.08.2016. http://dornob.com/grounds-for-celebration-cups-saucers-made-of-recycled-coffee/. 17. DiStasio, Cat. 2016. "Stylish coffeemaker repurposes used grounds to grow fresh mushrooms".
Accessed 15.08.2016. http://inhabitat.com/stylish-coffeemaker-repurposes-used-grounds-to-grow-fresh-mushrooms/.
18. Eilhann E. Kwon, Haakrho Yi, Young Jae Jeon. 2013. "Sequential co-production of biodiesel and bioethanol with spent coffee grounds." Bioresource Technology no. 136:475-480.
19. Engineers, Society of Manufacturing. Fundamental Manufacturing Processes Video Series Study Guide.

REFERENCES | 113
20. Eurostat. 2015a. Environment in the EU - Each person in the EU generated 481 kg of municipal waste in 2013 - 43% was recycled or composted.
21. ——— . 2015b. "Generation of waste by economic activity". Accessed 16.12.2015. http://ec.europa.eu/eurostat/tgm/table.do;jsessionid=ACitl4TZNMMwLpJeJFXMdIC5m7-JCB1VhQNenuSc-I-c_t9uViC8!-1505779883?tab=table&plugin=1&language=en&pcode=ten00106.
22. ——— . 2016. "Waste statistics". Accessed 17.08.2016. http://ec.europa.eu/eurostat/statistics-explained/index.php/Waste_statistics#Waste_treatment.
23. Ford, Sharon L. N. 2014. "Additive Manufacturing Technology: Potential Implications for U.S. Manufacturing Competitiveness." Journal of International Commerce and Economics:1-35.
24. Foster, Ted Kallmyer and James. 2016. "Caffeine (Coffee) Consumption by Country". Accessed 12.08.2016. http://www.caffeineinformer.com/caffeine-what-the-world-drinks.
25. Garlotta, Donald. 2001. "A Literature Review of Poly(Lactic Acid)." Journal of Polymers and the Environment no. 9 (Nº2):63-84.
26. Gómez-de la Cruz, Francisco J. Cruz-Peragón, Fernando Casanova-Peláez, Pedro J. Palomar-Carnicero, José M. 2015. "A vital stage in the large-scale production of biofuels from spent coffee grounds: The drying kinetics." Fuel Processing Technology no. 130:188-196. http://www.sciencedirect.com/science/article/pii/S0378382014004275.
27. Grellier, Caroline. 2015. "The future of 3D printing in coffee grounds". Accessed 14.12.2015. http://www.makery.info/en/2015/01/19/lavenir-de-limpression-3d-dans-le-marc-de-cafe/.
28. Gutowski, T. Injection Molding. 29. Hansaem Jang, Joey D. Ocon, Seunghwa Lee , Jae Kwang Lee , Jaeyoung Lee. 2015. "Direct power
generation from waste coffee grounds in a biomass fuel cell." Journal of Power Sources no. 296:433-439.
30. Hermann A. Jurgen Pohlan, Marc J. J. Janssens. "Growth And Production Of Coffee." In Soils, Plant Growth And Crop Production.
31. Hyeon-Son Choi, Eu Ddeum Park, Yooheon Park, Hyung Joo Suhc. 2015. "Spent coffee ground extract suppresses ultraviolet B-induced photoaging in hairless mice." Journal of Photochemistry & Photobiology, B: Biology no. 153:164-172.
32. ICNF, COTF. 2016. Resinagem. editado por COTF - Centro de Operações e Técnicas Florestais ICNF - Instituto da Conservação da Natureza e das Florestas.
33. Ideas, Natural Living. 2014. "14 Genius Ways To Recycle Used Coffee Grounds". Accessed 20.07.2016. http://www.naturallivingideas.com/14-genius-ways-recycle-used-coffee-grounds/.
34. Jiangmen Xiecheng Machinery Co., Ltd. "Plastic industrial Color Mixer 300kg Blender Mac hine". Accessed 02.09.2016. http://pt.made-in-china.com/co_jmxiecheng/product_Industrial-Plastic-Color-Mixer-300kg-Blender-Machine-with-CE_engsnshug.html.
35. Jiun Hor Low, Wan Aizan Wan Abdul Rahman, Jamarosliza Jamaluddin. 2015. "The influence of extraction parameters on spent coffee grounds as a renewable tannin resource." Journal of Cleaner Production no. 101:222-228.
36. Kafadar, Cemal. 2016. A History of Coffee. Harvard University, U.S.A. 37. Kaffeeform. 2015. "Kaffeeform". Accessed 14.12.2015. http://www.kaffeeform.com/. 38. Larkin, Stephanie. 2016. "Coffee Consumption around the World". Accessed 20.08.2016.

114 | REFERENCES
http://www.streetdirectory.com/food_editorials/beverages/coffee/coffee_consumption_around_the_world.html.
39. Laurí, Raúl. 2012. "decafé". Accessed 10.08.2016. http://www.raullauri.com. 40. Limited, Granta Design. 2016. CES Edupack software, Cambridge, UK. 41. Majid Jamshidian, Elmira Arab Tehrany, Muhammad Imran, Muriel Jacquot, and St´ephane Desobry.
2010. "Poly-Lactic Acid: Production, Applications, Nanocomposites, and Release Studies." Comprehensive Reviews in Food Science and Food Safety no. 9:552-571.
42. Mathilde. 2013. "Material Matters Series N°1: PLA Plastic". Accessed 23.04.2016. http://makingsociety.com/2013/08/materialmatters-series-n1-pla-plastic/.
43. Merriam-Webster. 2016. "Full Definition of Research". Accessed 30.07.2016. http://www.merriam-webster.com/dictionary/research.
44. Mizuho Hirata, Naohito Kawasaki, Takeo Nakamura, Kazuoki Matsumoto, Mineaki Kabayama, Takamichi Tamura, Seiki Tanada. 2002. "Adsorption of Dyes onto Carbonaceous Materials Produced from Coffee Grounds by Microwave Treatment." Journal of Colloid and Interface Science no. 254:17-22.
45. Modak, Prasad. 2011. Waste - Investing in energy and resource efficiency.284-327 46. N. Sreenivasulu, Dr. D. Ravikanth. 2013. "Injection Moulding Tool Design Manufacturing, Estimation
and Comparison of L&T Power Box Side Panel Using Plastic Materials HDPE, ABS, PP and PC." Journal of Mechanical and Civil Engineering no. 8 (3):23-32.
47. Naheed Saba, Mohammad Jawaid, Othman Y Alothman, MT Paridah1 and Azman Hassan. 2015. "Recent Advances In Epoxy Resin, Natural Fiber-Reinforced Epoxy Composites And Their Applications." Journal of Reinforced Plastics and Composites no. 0 (0):1-24.
48. Narasimharao Kondamudi, Susanta K. Mohapatra, And Mano Misra. 2008. "Spent Coffee Grounds as a Versatile Source of Green Energy." Journal Of Agricultural And Food Chemistry no. 56:11757 - 11760.
49. Nations, Food and Agriculture Organization of the United. 2013. Food wastage footprint - Impacts on natural resources.
50. ——— . 2016. "Food wastage: Key facts and figures". Accessed 12.08.2016. http://www.fao.org/news/story/en/item/196402/icode/.
51. NatureWorks. 2016. "Ingeo - Naturally Advanced Materials". Accessed 28.08.2016. http://www.natureworksllc.com.
52. Organization, International Coffee. 2015a. Annual Review 2013-2014 Strengthening the global coffee sector through international cooperation.
53. ——— . 2015b. "The Current State of the Global Coffee Trade". Accessed 10.12.2015. http://www.ico.org/monthly_coffee_trade_stats.asp.
54. ——— . 2015c. Disappearance (consumption) in selected importing countries. editado por 4b-disappearence.
55. ——— . 2015d. "Portugal - Latest facts and figures about the global coffee trade from the International Coffee Organization". Accessed 10.12.2015. http://infogr.am/_/S268nTQ9nsOy58h5VJZH.
56. ——— . 2015e. Total production by all exporting countries. editado por 1a-total-production.
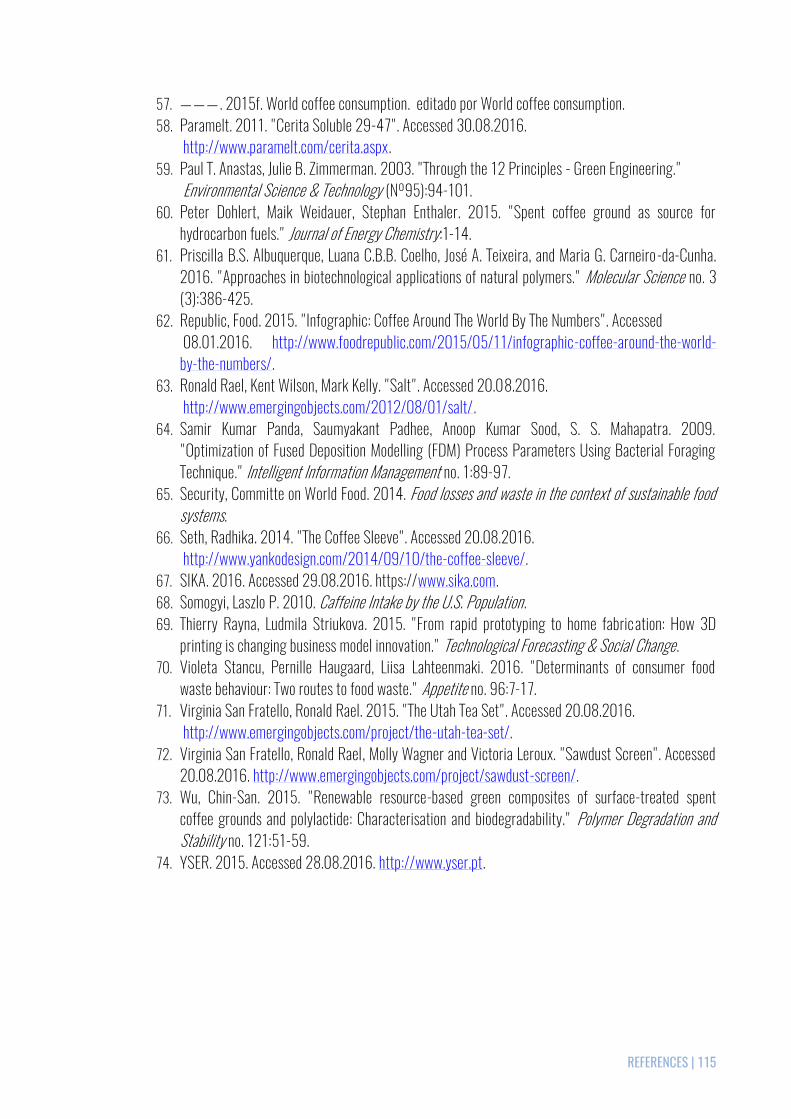
REFERENCES | 115
57. ——— . 2015f. World coffee consumption. editado por World coffee consumption. 58. Paramelt. 2011. "Cerita Soluble 29-47". Accessed 30.08.2016.
http://www.paramelt.com/cerita.aspx. 59. Paul T. Anastas, Julie B. Zimmerman. 2003. "Through the 12 Principles - Green Engineering."
Environmental Science & Technology (Nº95):94-101. 60. Peter Dohlert, Maik Weidauer, Stephan Enthaler. 2015. "Spent coffee ground as source for
hydrocarbon fuels." Journal of Energy Chemistry:1-14. 61. Priscilla B.S. Albuquerque, Luana C.B.B. Coelho, José A. Teixeira, and Maria G. Carneiro -da-Cunha.
2016. "Approaches in biotechnological applications of natural polymers." Molecular Science no. 3 (3):386-425.
62. Republic, Food. 2015. "Infographic: Coffee Around The World By The Numbers". Accessed 08.01.2016. http://www.foodrepublic.com/2015/05/11/infographic-coffee-around-the-world-by-the-numbers/.
63. Ronald Rael, Kent Wilson, Mark Kelly. "Salt". Accessed 20.08.2016. http://www.emergingobjects.com/2012/08/01/salt/.
64. Samir Kumar Panda, Saumyakant Padhee, Anoop Kumar Sood, S. S. Mahapatra. 2009. "Optimization of Fused Deposition Modelling (FDM) Process Parameters Using Bacterial Foraging Technique." Intelligent Information Management no. 1:89-97.
65. Security, Committe on World Food. 2014. Food losses and waste in the context of sustainable food systems.
66. Seth, Radhika. 2014. "The Coffee Sleeve". Accessed 20.08.2016. http://www.yankodesign.com/2014/09/10/the-coffee-sleeve/.
67. SIKA. 2016. Accessed 29.08.2016. https://www.sika.com. 68. Somogyi, Laszlo P. 2010. Caffeine Intake by the U.S. Population. 69. Thierry Rayna, Ludmila Striukova. 2015. "From rapid prototyping to home fabrication: How 3D
printing is changing business model innovation." Technological Forecasting & Social Change. 70. Violeta Stancu, Pernille Haugaard, Liisa Lahteenmaki. 2016. "Determinants of consumer food
waste behaviour: Two routes to food waste." Appetite no. 96:7-17. 71. Virginia San Fratello, Ronald Rael. 2015. "The Utah Tea Set". Accessed 20.08.2016.
http://www.emergingobjects.com/project/the-utah-tea-set/. 72. Virginia San Fratello, Ronald Rael, Molly Wagner and Victoria Leroux. "Sawdust Screen". Accessed
20.08.2016. http://www.emergingobjects.com/project/sawdust-screen/. 73. Wu, Chin-San. 2015. "Renewable resource-based green composites of surface-treated spent
coffee grounds and polylactide: Characterisation and biodegradability." Polymer Degradation and Stability no. 121:51-59.
74. YSER. 2015. Accessed 28.08.2016. http://www.yser.pt.
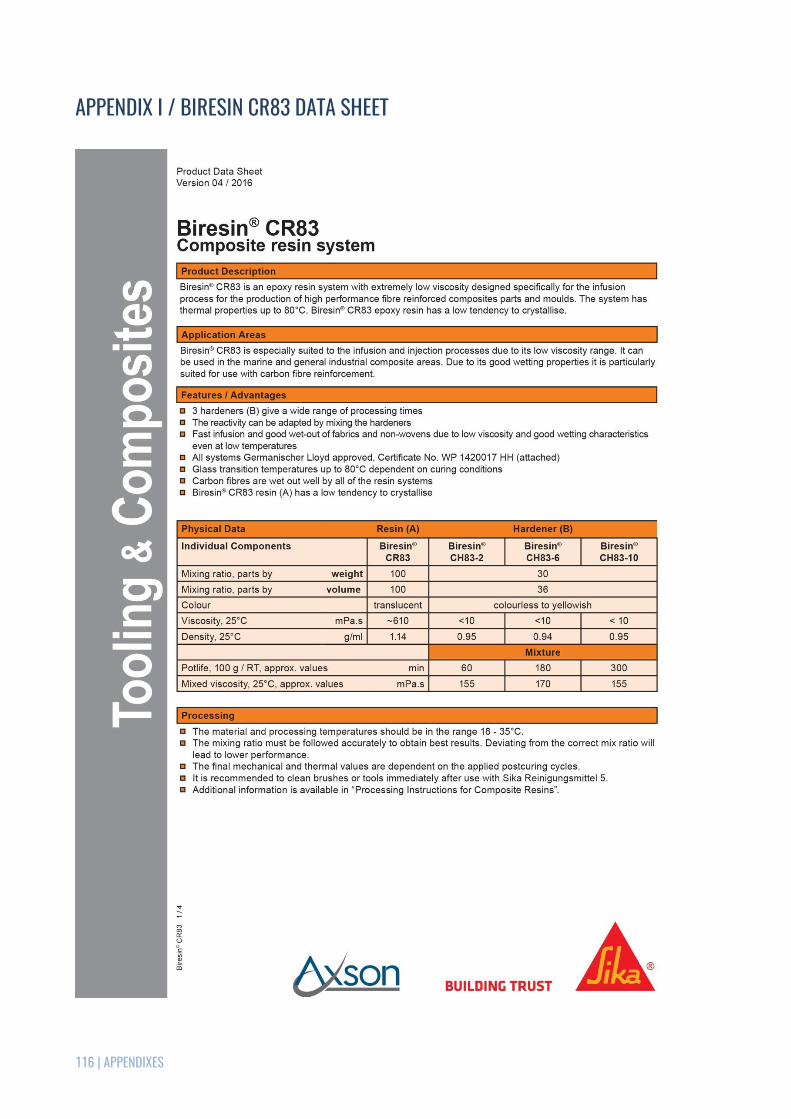
116 | APPENDIXES
APPENDIX I / BIRESIN CR83 DATA SHEET

APPENDIXES | 117

118 | APPENDIXES

APPENDIXES | 119
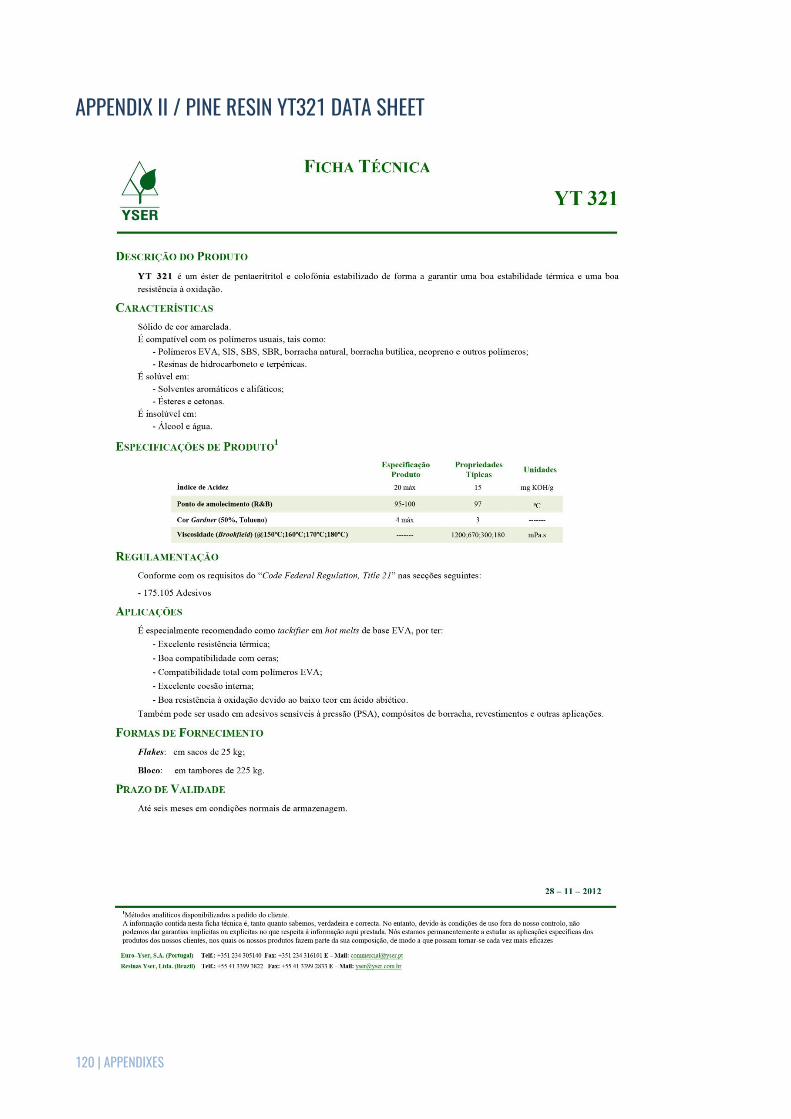
120 | APPENDIXES
APPENDIX II / PINE RESIN YT321 DATA SHEET

APPENDIXES | 121
APPENDIX III / PLA INGEO 3251D DATA SHEET

122 | APPENDIXES

APPENDIXES | 123

124 | APPENDIXES

APPENDIXES | 125
APPENDIX IV / PLA DESCRIPTION CES EDUPACK 2016

126 | APPENDIXES

APPENDIXES | 127
APPENDIX V / SILICONE RUBBER VTX 950 DATA SHEET

128 | APPENDIXES

APPENDIXES | 129
APPENDIX VI / COST REPORT SIMULATION

130 | APPENDIXES

APPENDIXES | 131
APPENDIX VII / ICO DATA TABLES

132 | APPENDIXES

APPENDIXES | 133
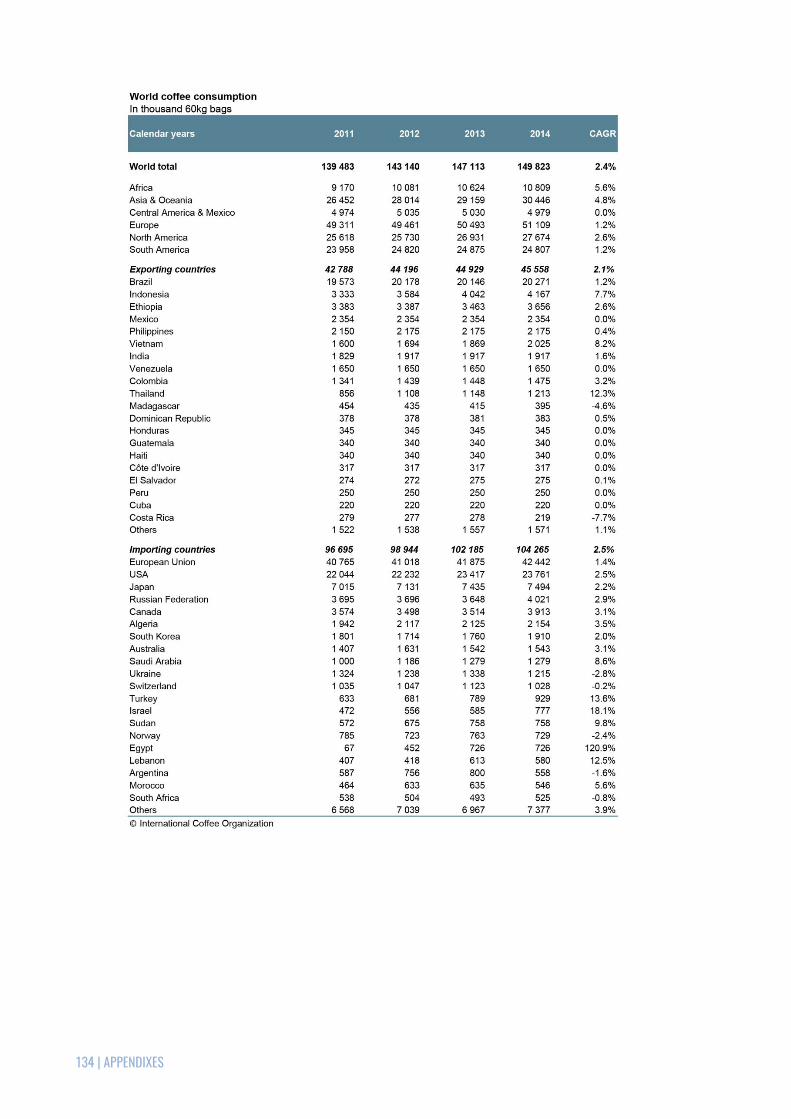
134 | APPENDIXES