Cochlear delays measured with amplitude-modulated tone-burst-evoked OAEs
13
Cochlear delays measured with amplitude-modulated tone-burst-evoked OAEs Shawn S. Goodman a; 1 , Robert H. Withnell a; , Egbert De Boer b , David J. Lilly c , Alfred L. Nuttall d a Department of Speech and Hearing Sciences, Indiana University, 200 South Jordan Avenue, Bloomington, IN 47405, USA b Academic Medical Center, KNO Room D2-226, Meibergdreef 9, 1105 AZ Amsterdam, The Netherlands c VA National Center for Rehabilitative Auditory Research, Veterans A¡airs Medical Center, 3710 Southwest U.S. Veterans Hospital Road, Portland, OR 97207, USA d OHRC/Otolaryngology NRC 04, Oregon Health and Science University, Portland, OR 97207, USA Received 17 August 2003; accepted 17 November 2003 Abstract Delay times in the mammalian cochlea, whether from measurement of basilar membrane (BM) vibration or otoacoustic emissions (OAEs) have, to date, been largely based on phase-gradient estimates from steady-state responses. Here we report cochlear delays measured directly in the time domain from OAEs evoked by amplitude-modulated tone-burst (AMTB) stimuli. Measurement using OAEs provides a non-invasive estimate of cochlear delay but is confounded by the complexity of generation of such OAEs. At low to moderate stimulus levels, and provided that the stimulus frequency range does not include a region of the cochlea where there is a large change in effective reflectance, AMTB stimuli evoke an OAE with an envelope shape that is similar to the stimulus and allow a direct calculation of cochlear group delay. Such delays are commensurate with BM estimates of delay, estimates of cochlear delay inferred from neural recordings, and previous OAE measures of delay in the guinea pig. However, a nonlinear distortion mechanism, variation in effective reflectance, and intermodulation distortion products generated by the nonlinear interaction in the cochlea of the carrier and sidebands of the AMTB stimulus, may all contribute to OAEs arising with envelope shapes that are not a scaled representation of the stimulus, confounding the estimation of cochlear group delay. ß 2003 Published by Elsevier B.V. Key words: Cochlea ; Otoacoustic emission ; Group delay ; Amplitude 1. Introduction The measurement of travel times in the mammalian cochlea has its antecedent in measurements of basilar membrane (BM) vibration and the determination of group delay from the phase gradient (e.g., Rhode, 1971; Sellick et al., 1982). Since then, various measures of cochlear delay have been reported in the literature, including signal-front delay based on data analysis in the time domain (e.g., Neely et al., 1988; Avan et al., 1990; Whitehead et al., 1996), signal-front delay esti- mated from time-frequency measurements (e.g., Ren et al., 2000; Konrad-Martin and Keefe, 2003), phase-gra- dient estimates of group delay (e.g., Robles et al., 1986; Nuttall and Dolan, 1996; Nilsen and Russell, 2000), and group delays inferred from IFFT analysis (e.g., Kalluri and Shera, 2001; Withnell et al., 2003). Mea- surements of BM vibration have mostly been limited to the ¢rst cochlear turn, although measurements have been reported from the fourth turn (e.g., Cooper and Rhode, 1995). In the guinea pig, such measurements from the ¢rst turn reveal cochlear group delays to the 0378-5955 / 03 / $ ^ see front matter ß 2003 Published by Elsevier B.V. doi :10.1016/S0378-5955(03)00375-7 * Corresponding author. Tel.: +1 (812) 855 9339; Fax: +1 (812) 855 5531. E-mail addresses: [email protected] (S.S. Goodman), [email protected] (R.H. Withnell), [email protected] (E. De Boer), [email protected] (D.J. Lilly), [email protected] (A.L. Nuttall). 1 Present address: Physical Acoustics Laboratory, Boys Town National Research Hospital, 555 North 30th Street, Omaha, NE 68131, USA. Hearing Research 188 (2004) 57^69 R Available online at www.sciencedirect.com www.elsevier.com/locate/heares
-
Upload
independent -
Category
Documents
-
view
4 -
download
0
Transcript of Cochlear delays measured with amplitude-modulated tone-burst-evoked OAEs

Cochlear delays measured withamplitude-modulated tone-burst-evoked OAEs
Shawn S. Goodman a;1, Robert H. Withnell a;�, Egbert De Boer b, David J. Lilly c,Alfred L. Nuttall d
a Department of Speech and Hearing Sciences, Indiana University, 200 South Jordan Avenue, Bloomington, IN 47405, USAb Academic Medical Center, KNO Room D2-226, Meibergdreef 9, 1105 AZ Amsterdam, The Netherlands
c VA National Center for Rehabilitative Auditory Research, Veterans A¡airs Medical Center, 3710 Southwest U.S. Veterans Hospital Road, Portland,OR 97207, USA
d OHRC/Otolaryngology NRC 04, Oregon Health and Science University, Portland, OR 97207, USA
Received 17 August 2003; accepted 17 November 2003
Abstract
Delay times in the mammalian cochlea, whether from measurement of basilar membrane (BM) vibration or otoacousticemissions (OAEs) have, to date, been largely based on phase-gradient estimates from steady-state responses. Here we reportcochlear delays measured directly in the time domain from OAEs evoked by amplitude-modulated tone-burst (AMTB) stimuli.Measurement using OAEs provides a non-invasive estimate of cochlear delay but is confounded by the complexity of generation ofsuch OAEs. At low to moderate stimulus levels, and provided that the stimulus frequency range does not include a region of thecochlea where there is a large change in effective reflectance, AMTB stimuli evoke an OAE with an envelope shape that is similarto the stimulus and allow a direct calculation of cochlear group delay. Such delays are commensurate with BM estimates of delay,estimates of cochlear delay inferred from neural recordings, and previous OAE measures of delay in the guinea pig. However, anonlinear distortion mechanism, variation in effective reflectance, and intermodulation distortion products generated by thenonlinear interaction in the cochlea of the carrier and sidebands of the AMTB stimulus, may all contribute to OAEs arising withenvelope shapes that are not a scaled representation of the stimulus, confounding the estimation of cochlear group delay.4 2003 Published by Elsevier B.V.
Key words: Cochlea; Otoacoustic emission; Group delay; Amplitude
1. Introduction
The measurement of travel times in the mammaliancochlea has its antecedent in measurements of basilarmembrane (BM) vibration and the determination ofgroup delay from the phase gradient (e.g., Rhode,
1971; Sellick et al., 1982). Since then, various measuresof cochlear delay have been reported in the literature,including signal-front delay based on data analysis inthe time domain (e.g., Neely et al., 1988; Avan et al.,1990; Whitehead et al., 1996), signal-front delay esti-mated from time-frequency measurements (e.g., Ren etal., 2000; Konrad-Martin and Keefe, 2003), phase-gra-dient estimates of group delay (e.g., Robles et al., 1986;Nuttall and Dolan, 1996; Nilsen and Russell, 2000),and group delays inferred from IFFT analysis (e.g.,Kalluri and Shera, 2001; Withnell et al., 2003). Mea-surements of BM vibration have mostly been limited tothe ¢rst cochlear turn, although measurements havebeen reported from the fourth turn (e.g., Cooper andRhode, 1995). In the guinea pig, such measurementsfrom the ¢rst turn reveal cochlear group delays to the
0378-5955 / 03 / $ ^ see front matter 4 2003 Published by Elsevier B.V.doi:10.1016/S0378-5955(03)00375-7
* Corresponding author. Tel. : +1 (812) 855 9339;Fax: +1 (812) 855 5531.
E-mail addresses: [email protected] (S.S. Goodman),[email protected] (R.H. Withnell), [email protected](E. De Boer), [email protected] (D.J. Lilly), [email protected](A.L. Nuttall).
1 Present address: Physical Acoustics Laboratory, Boys TownNational Research Hospital, 555 North 30th Street, Omaha, NE68131, USA.
HEARES 4808 16-1-04 Cyaan Magenta Geel Zwart
Hearing Research 188 (2004) 57^69
R
Available online at www.sciencedirect.com
www.elsevier.com/locate/heares

region of the 18 kHz place of approximately 400 Ws.Indirect measurements of cochlear delay can be inferredfrom neural recordings, after an ad hoc correction forsynaptic delay (e.g., Goldstein et al., 1971; Allen, 1983;Gummer and Johnstone, 1984) or from neural tuningcurves making use of the reciprocal relationship be-tween ¢lter bandwidth and delay in a cochlea that ex-hibits the property of minimum phase (Shera andGuinan, 2003). In the guinea pig, based on the auditorynerve ¢ber threshold tuning data of Tsuji and Liberman(1997), the reciprocal relationship between ¢lter band-width and group delay gives cochlear delays to the 9and 4.5 kHz regions of 640 and 960 Ws (based on a 400Ws delay to the 18 kHz region and assuming a phasechange across the ¢lter bandwidth that is independentof bandwidth ^ see Shera and Guinan (2003)).Both BM and neural recordings involve invasion of
the structures producing the response being measured.Additionally, these measures represent delays to a ¢xedpoint on the BM. Measurements using otoacousticemissions (OAEs) provide a non-invasive estimate ofcochlear delay but are confounded by the complexityof generation of such OAEs. OAE measures of delayrepresent the delay of the global cochlear response andnot just that of a ¢xed point on the BM. For OAEs,energy propagation in the cochlea has been portrayedas consisting of a round-trip delay, i.e., a delay relativeto the stimulus for that particular frequency to reach itscharacteristic frequency (CF) place, and the delay forthe OAE arising in the cochlea in the region of CF toreach the ear canal (Neely et al., 1988).OAEs have been described as arising from one of two
mechanisms: a place-¢xed mechanism and a wave-¢xedmechanism (Kemp, 1986). The place-¢xed mechanism isnow understood in terms of the theory propounded byZweig and Shera, the OAE arising from re£ectionsfrom impedance perturbations randomly distributedalong the BM, predominantly from wavelets scatteredfrom the peak region of the traveling wave (Zweig andShera, 1995; Shera, 2003). Such an OAE has beenshown to have a cochlear delay for stimulus levels ofV40 dB sound pressure level (SPL) that is commensu-rate with a round-trip delay with the OAE arising fromthe peak region of the traveling wave (Shera andGuinan, 2003). The wave-¢xed mechanism involvesthe OAE arising from a nonlinear wave-related interac-tion on the BM; such a component may not have adelay equal to the round-trip delay to the CF place.For instance, if this type of OAE arises as a result ofenergy added to the BM by the cochlear ampli¢er, thenthe locus of origin may be basal to the peak of thetraveling wave.Measurement of cochlear delay in the time domain
using OAEs has been restricted to signal-front delays.Here we describe cochlear group delays in the guinea
pig measured using amplitude-modulated tone-burst(AMTB)-evoked OAEs as a function of both stimuluslevel and frequency.
1.1. Amplitude modulation and group delay
For the propagation of a signal F(t) through a dis-persive medium such as the cochlea, the e¡ects of suchdispersion on the signal envelope can be characterizedby expanding the phase P of the signal envelope eval-uated at the signal or carrier frequency gc as a Taylorseries:
P ðg Þ ¼ P ðg cÞ þ ½dP =dg �g cðg3g cÞþ
0:5½d2P =dg 2�g cðg3g cÞ2 þ T ð1Þ
The ¢rst term in the expansion is a phase o¡set. Thesecond term is the group delay2of the signal envelope.The third term produces signal envelope broadeningand reduction in the amplitude of the signal envelopewith time (total energy remains constant) (Elmore andHeald, 1969).If the signal F(t) is amplitude modulated over time,
i.e.,
AðtÞ ¼ FðtÞWcosðgmtÞ
where gm6g c gm is the modulation frequency ð2Þ
then calculation of group delay is simpli¢ed to thephase shift in the envelope of the modulation betweenstimulus and OAE, the e¡ect of cochlear dispersion onthe envelope of the modulator being characterized usingEq. 1.The technique of using an amplitude-modulated sig-
nal to calculate group delay dates back to Nyquist andBrand (1928) and the calculation of telephone-line de-lays. In hearing research, examples of using this tech-nique include calculating cochlear group delay fromspiral ganglion cell recordings (Gummer and Johnstone,1984) and group delays of scalp recorded auditory-evoked potentials (Dolphin and Mountain, 1992).In order for amplitude-modulated waves to propa-
gate unchanged through a medium, the group velocitymust be independent of frequency over the frequencyrange (gc3gm) to (gc+gm) (Elmore and Heald, 1969).This is equivalent to saying that the second-order termin Eq. 1 is small relative to the ¢rst-order term. BMmeasurements from the ¢rst cochlear turn of the guinea
2 Group delay is a measure of the delay of the envelope of a signaland not of the carrier signal, the delay of the carrier signal being thephase delay (Papoulis, 1962). The group delay gives the ‘displacementof T [the] center of gravity’ (Papoulis, 1962, p. 135) of the signalenvelope. Mathematically, the group delay (dg) is given by dg = dP/dg ;, i.e., the rate of change of phase with frequency at the signalfrequency.
HEARES 4808 16-1-04 Cyaan Magenta Geel Zwart
S.S. Goodman et al. /Hearing Research 188 (2004) 57^6958
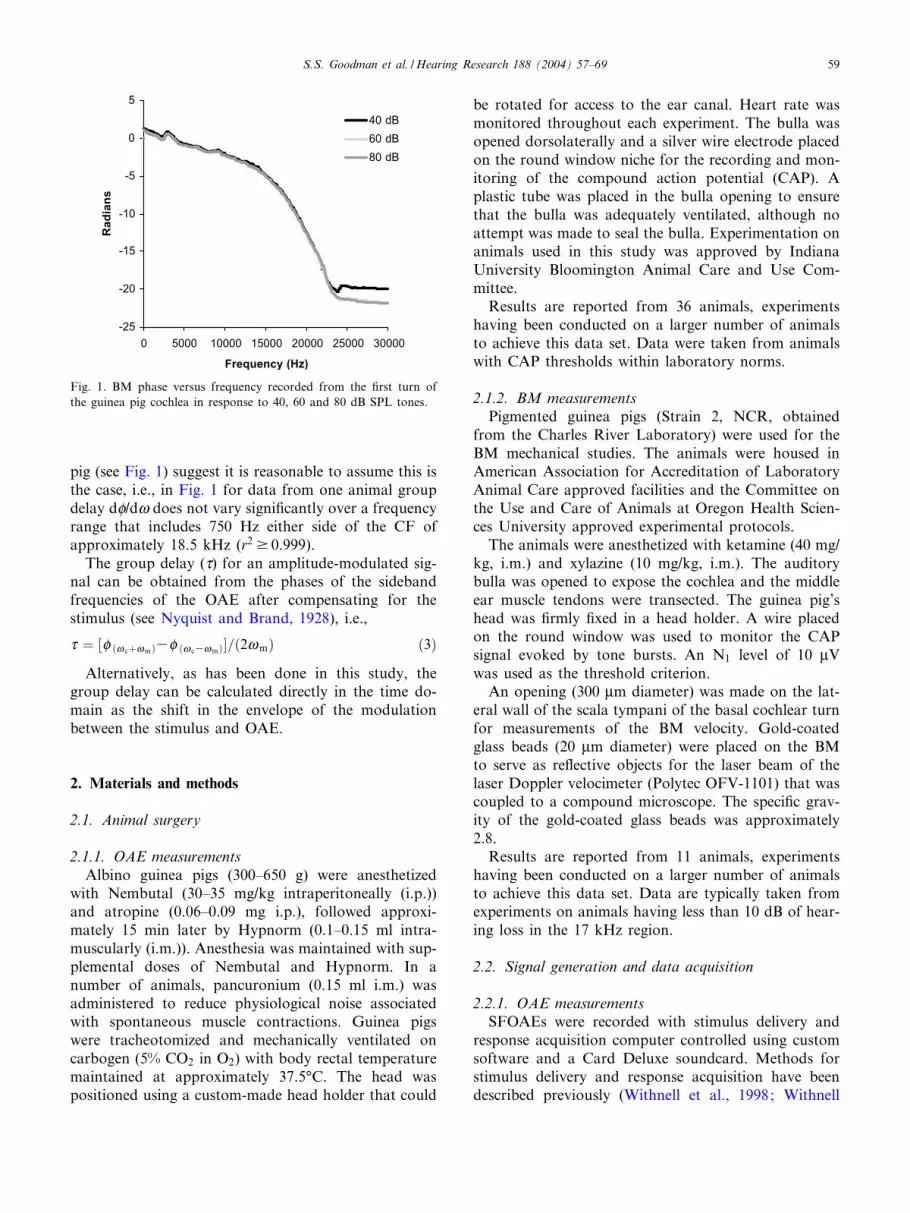
pig (see Fig. 1) suggest it is reasonable to assume this isthe case, i.e., in Fig. 1 for data from one animal groupdelay dP/dg does not vary signi¢cantly over a frequencyrange that includes 750 Hz either side of the CF ofapproximately 18.5 kHz (r2v 0.999).The group delay (d) for an amplitude-modulated sig-
nal can be obtained from the phases of the sidebandfrequencies of the OAE after compensating for thestimulus (see Nyquist and Brand, 1928), i.e.,
d ¼ ½P ðg cþgmÞ3P ðg c3gmÞ�=ð2gmÞ ð3Þ
Alternatively, as has been done in this study, thegroup delay can be calculated directly in the time do-main as the shift in the envelope of the modulationbetween the stimulus and OAE.
2. Materials and methods
2.1. Animal surgery
2.1.1. OAE measurementsAlbino guinea pigs (300^650 g) were anesthetized
with Nembutal (30^35 mg/kg intraperitoneally (i.p.))and atropine (0.06^0.09 mg i.p.), followed approxi-mately 15 min later by Hypnorm (0.1^0.15 ml intra-muscularly (i.m.)). Anesthesia was maintained with sup-plemental doses of Nembutal and Hypnorm. In anumber of animals, pancuronium (0.15 ml i.m.) wasadministered to reduce physiological noise associatedwith spontaneous muscle contractions. Guinea pigswere tracheotomized and mechanically ventilated oncarbogen (5% CO2 in O2) with body rectal temperaturemaintained at approximately 37.5‡C. The head waspositioned using a custom-made head holder that could
be rotated for access to the ear canal. Heart rate wasmonitored throughout each experiment. The bulla wasopened dorsolaterally and a silver wire electrode placedon the round window niche for the recording and mon-itoring of the compound action potential (CAP). Aplastic tube was placed in the bulla opening to ensurethat the bulla was adequately ventilated, although noattempt was made to seal the bulla. Experimentation onanimals used in this study was approved by IndianaUniversity Bloomington Animal Care and Use Com-mittee.Results are reported from 36 animals, experiments
having been conducted on a larger number of animalsto achieve this data set. Data were taken from animalswith CAP thresholds within laboratory norms.
2.1.2. BM measurementsPigmented guinea pigs (Strain 2, NCR, obtained
from the Charles River Laboratory) were used for theBM mechanical studies. The animals were housed inAmerican Association for Accreditation of LaboratoryAnimal Care approved facilities and the Committee onthe Use and Care of Animals at Oregon Health Scien-ces University approved experimental protocols.The animals were anesthetized with ketamine (40 mg/
kg, i.m.) and xylazine (10 mg/kg, i.m.). The auditorybulla was opened to expose the cochlea and the middleear muscle tendons were transected. The guinea pig’shead was ¢rmly ¢xed in a head holder. A wire placedon the round window was used to monitor the CAPsignal evoked by tone bursts. An N1 level of 10 WVwas used as the threshold criterion.An opening (300 Wm diameter) was made on the lat-
eral wall of the scala tympani of the basal cochlear turnfor measurements of the BM velocity. Gold-coatedglass beads (20 Wm diameter) were placed on the BMto serve as re£ective objects for the laser beam of thelaser Doppler velocimeter (Polytec OFV-1101) that wascoupled to a compound microscope. The speci¢c grav-ity of the gold-coated glass beads was approximately2.8.Results are reported from 11 animals, experiments
having been conducted on a larger number of animalsto achieve this data set. Data are typically taken fromexperiments on animals having less than 10 dB of hear-ing loss in the 17 kHz region.
2.2. Signal generation and data acquisition
2.2.1. OAE measurementsSFOAEs were recorded with stimulus delivery and
response acquisition computer controlled using customsoftware and a Card Deluxe soundcard. Methods forstimulus delivery and response acquisition have beendescribed previously (Withnell et al., 1998; Withnell
Fig. 1. BM phase versus frequency recorded from the ¢rst turn ofthe guinea pig cochlea in response to 40, 60 and 80 dB SPL tones.
HEARES 4808 16-1-04 Cyaan Magenta Geel Zwart
S.S. Goodman et al. /Hearing Research 188 (2004) 57^69 59

and Yates, 1998). Brie£y, the acoustic stimulus was de-livered by a Beyer DT48 loudspeaker placed approxi-mately 4 cm from the entrance to the ear canal. Earcanal sound pressure recordings were made by a Senn-heiser MKE 2-5 electrostatic microphone ¢tted with ametal probe tube (1.2 mm long, 1.3 mm inside diameter(i.d.), 15006 acoustic resistor) positioned approximately2 mm into the ear canal. The microphone and probetube combination was calibrated against a Bruel andKjaer 1/8 inch microphone. The output from the probetube microphone was ampli¢ed 20 dB, high-pass ¢ltered(0.64 kHz, four poles Butterworth) and transmitted as abalanced input to one of the analog input channels ofthe computer soundcard (total gain 30 dB) where it wassubsequently digitized inV46 or 93 ms epochs at a rateof 44.1 or 48 kHz (2048 or 4096 points for the FFT).The stimuli were digitally generated AMTBs of 25, 35
or 45 ms duration with 3 or 5 ms cosine ramps, theanalog output bu¡ered by a Tucker^Davis Technolo-gies HB6 loudspeaker bu¡er ampli¢er. Stimulus fre-quencies were approximately 4.5, 9 and 18 kHz. Mod-ulation rates were either 86 or 172 Hz. Stimulus levelsranged from 40 to 90 dB peak SPL (pSPL). SFOAEswere extracted using the nonlinear extraction paradigm(Kemp et al., 1990) from the ear canal sound pressurerecordings made in response to a stimulus train with a6 dB di¡erence between the lower level (probe level)and higher level (reference level) stimuli. Subsequentto recording the ear canal SPL and extracting theSFOAE, each SFOAE was digitally ¢ltered using azero-phase 500-point FIR ¢lter centered at the carrierfrequency with a bandwidth of 2 fm+500 Hz to improvethe signal to noise ratio of the SFOAE (where fm wasthe modulation frequency). Note that narrow-band ¢l-tering of the OAE with a non-causal ¢lter will cause aripple in the time-domain OAE waveform (it is notpresent in the raw data).Measurements in a cavity suggested that intermodu-
lation distortion produced by harmonics of the stimulustone at the SFOAE frequency was more than 20 dBbelow the level of the measured OAE for the highestlevel of stimulus used in this study.
2.2.2. BM measurementsThe acoustic stimulus consisted of a pseudo-random
noise signal (20 ms duration) output from a circularbu¡er on a D/A converter board. This stimulus wasused to drive a condenser microphone (BpK type4134, 0.5Q diameter) serving as a loudspeaker that wascoupled to the animal’s ear. Synchronously with the D/A conversions, an A/D converter sampled the signalfrom the laser velocimeter. The BM response to thepseudo-random noise signal was averaged from morethan 1000 repetitions. The averaged velocity signalwas analyzed with custom software to derive ‘transfer
functions’ of BM motion. See De Boer and Nuttall(1997) for analysis details.
2.3. OAE data analysis
Group delay was calculated by comparing the phasesof cosine waves ¢t to the modulation envelopes of thestimuli and OAEs. Hilbert transforms of the stimuli andOAEs produced analytic signals, the magnitudes ofwhich were the respective envelopes. Due to the pres-ence of onset and o¡set ramps, only the middle por-tions of the envelopes of the stimuli and OAEs could beaccurately ¢t with cosine waves of constant amplitudeand DC o¡set. Therefore, in order to simplify the ¢ttingprocedure, only the middle 50% of the AMTB stimulusand OAE envelopes were used for ¢tting. A representa-tive example of a waveform, its envelope, and the mid-dle portion are shown in Fig. 2. An iterative least-squares algorithm was used to ¢t the envelope of themiddle portion with a cosine wave. The algorithm wasbased on three assumptions: (i) Frequency is knownand constant across the waveform being ¢t. In thecase of an undistorted envelope, this frequency is themodulation frequency of the stimulus. (ii) The ampli-tude of the envelope is constant across the ¢tting range.(iii) DC o¡set is constant across the ¢tting range.The group delay was calculated as
d g ¼P E3P S
g f mð4Þ
where dg is group delay in seconds, gm is the radianfrequency of the cosine waves (equal to the modulationfrequency of the stimulus), PS is the phase in radians ofthe best cosine ¢t to the stimulus envelope, and PE is thephase in radians of the best cosine ¢t to the OAE enve-lope.
Fig. 2. A representative example of a stimulus waveform and its en-velope calculated via the Hilbert transform. An iterative least-squares algorithm was used to ¢t the middle portion of the envelopewith a cosine wave (thick black line).
HEARES 4808 16-1-04 Cyaan Magenta Geel Zwart
S.S. Goodman et al. /Hearing Research 188 (2004) 57^6960

3. Results
3.1. AMTB-evoked OAE waveform envelope shape
The use of amplitude modulation to calculate cochle-ar group delay assumes that the phase is linear over thefrequency range of modulation. For the modulationrates of 86 and 172 Hz used in this study, this assump-tion is presumably valid for the three stimulus frequen-cies used3. Fig. 3 shows three examples of OAEs ob-tained to 9 kHz, 45 ms tone-burst stimuli modulated ata rate of 86 Hz. In each case, the waveform envelopeshape of the OAE is similar to the stimulus with theexception that the modulation depth is di¡erent be-tween stimulus and OAE and between OAEs. Stimulusfrequency is the same in each case and all responseswere obtained from the same animal but with stimuluslevel varied (77, 69 and 66 dB pSPL). Stimulus level-dependent changes in the modulation depth of the OAE
presumably occurred due to changes in the amplituderelationship between the carrier signal and the side-bands (see Section 3.2 for further discussion).Fig. 4 shows examples of OAEs obtained from three
animals in response to a 9 or 18 kHz stimulus at amodulation rate of 86 Hz and stimulus levels in therange 61^72 dB pSPL. Unlike in Fig. 3, OAE waveformenvelope shape in each case is not similar to the stim-ulus; an increase in the number of peaks in the OAEwaveform is evident in the upper and middle panels,consistent with over-modulation, while in the lowerpanel modulation depth is less than that of the stimu-lus. OAEs with ‘distorted’ waveform envelope shapeswere a common ¢nding.
3.2. Variation in amplitude and/or phase of the sidebandsof an AMTB
The waveform envelope shape of an AMTB signal(such as an OAE) will vary if the amplitude ratio4 isaltered and/or the phase shift of the OAE relative to thestimulus is not linear over the range fc U fm (Nyquist
Fig. 3. Three examples of 9 kHz, 45 ms tone-burst stimuli modulated at a rate of 86 Hz stimuli (left column) and the OAEs evoked (right col-umn). In each case, the waveform envelope shape of the OAE is similar to the stimulus with the exception that the modulation depth is di¡er-ent between stimulus and OAE and between OAEs. All responses were obtained from one animal but with stimulus level varied (77, 69 and 66dB pSPL).
3 If one treats the cochlea as scale invariant, i.e., the relative band-width of tuning (Q) does not vary; then the phase response measuredat 18 kHz on the BM can be used to infer dispersive e¡ects at 9 and4.5 kHz. A linear phase response over a 1500 Hz range about a CF of18 kHz in a scale-invariant cochlea is commensurate with a linearphase response over a 750 Hz range at 9 kHz and 375 Hz at 4.5 kHz.
4 Amplitude symmetry of sidebands and/or amplitude ratio of carrierto sidebands.
HEARES 4808 16-1-04 Cyaan Magenta Geel Zwart
S.S. Goodman et al. /Hearing Research 188 (2004) 57^69 61

and Brand, 1928). This is illustrated in Fig. 5 with asimulation that shows (i) an AMTB signal with a mod-ulation depth of 0.2 and sidebands of equal amplitudethat are 14 dB less than the carrier signal but have thesame phase as the carrier signal ( U 0.014 radian), (ii) asper (i) but with sidebands of unequal amplitude (34and 314 dB re carrier signal), (iii) as per (i) but withsidebands of unequal phase (32 and +4 radians re car-rier signal), (iv) as per (i) but with sidebands of unequalamplitude (34 and 314 dB) and unequal phase (33and 0 radians).A di¡erence in sideband amplitude varies the modu-
lation depth of an AMTB without altering the positionof the peaks and troughs. A phase shift that is notlinear will vary the position of the peaks and troughsand the modulation depth. The degree of departurefrom phase linearity is given by the phase shift of thesidebands relative to the phase shift of the carrier (Ny-quist and Brand, 1928), i.e.,
vP ¼ MvP LB þ vPHB
23vP CM ð5Þ
where vP is the deviation from linearity in radians,vPLB is the phase shift of the low-frequency sidebandof the OAE relative to the stimulus, vPHB is the phase
shift of the high-frequency sideband, and vPC is thephase shift of the carrier.
3.3. Causes of OAE distortion
3.3.1. Two sourcesSFOAEs5 from the guinea pig have previously been
shown to be a stimulus level-dependent mix of nonlin-ear distortion and linear re£ection components (Good-man et al., 2003). The complex addition of these twocomponents may impact on the waveform envelopeshape of the OAE obtained from an AMTB stimulusif the resultant OAE sidebands vary in amplitude ratioand/or have a phase shift that is not linear (vPs 0). Ifthe re£ection component dominates the composition ofthe OAE, then the OAE obtained would be expected tobe a scaled version of the stimulus. If the nonlineardistortion component is dominant, the OAE wouldalso be expected to be a scaled version of the stimulus,but with a delay that is not representative of an actualcochlear delay due to the wave-¢xed nature of this com-ponent (in the case of a wave-¢xed nonlinear compo-
Fig. 4. Three examples of OAEs (right column) obtained in response to a 9 or 18 kHz stimulus (left column) from three di¡erent animals, thestimuli modulated at a rate of 86 Hz with stimulus levels in the range 61^72 dB pSPL. Unlike in Fig. 3, OAE waveform envelope shape ineach case is not similar to the stimulus; an increase in the number of peaks in the OAE waveform is evident in the upper and middle panels,consistent with over-modulation, while in the lower panel modulation depth is less than that of the stimulus.
5 In response to tone-burst stimuli with no amplitude modulation.
HEARES 4808 16-1-04 Cyaan Magenta Geel Zwart
S.S. Goodman et al. /Hearing Research 188 (2004) 57^6962

nent, the carrier and sidebands undergo approximatelythe same phase shift relative to the stimulus).
3.3.2. Variation in e¡ective re£ectanceThe amplitude of the OAE nonlinear component is
presumed to be approximately constant versus fre-quency (Talmadge et al., 2000), whereas the amplitudeof the re£ection component has been found to varywith frequency (Shera and Guinan, 1999; Goodmanet al., 2003). This variation in SFOAE re£ection com-ponent amplitude versus frequency with an associatedvariation in phase arises in the guinea pig cochlea pre-sumably as a result of variation in e¡ective re£ectancewith position along the cochlea (Zweig and Shera,
1995; Goodman et al., 2003). Consequently, for fre-quencies corresponding to amplitude minima, the am-plitude ratio of the sidebands will be altered relative tothe stimulus, vPs 0, and the phase gradient will notre£ect the cochlear delay. Variation in the amplituderatio and phase will produce a distorted OAE wave-form.Fig. 6 shows the amplitude and phase microstruc-
tures for an OAE evoked by an AMTB stimulus, thetime-domain stimulus waveform, and the OAE time-domain waveforms for 8171 and 8516 Hz, correspond-ing to amplitude minima and maxima respectively. Foran AMTB OAE arising from the peak region of theSFOAE amplitude microstructure, the OAE waveformis a scaled representation of the stimulus but with achange in modulation index. For the OAE correspond-ing to an amplitude minimum, the OAE waveform isdistorted relative to the stimulus (it has twice as manypeaks as the stimulus). Such waveform distortion couldarise due to changes in the amplitudes and phases of thesidebands associated with a variation in e¡ective re£ec-tance over the frequency range encompassed by thesidebands.
3.3.3. Intermodulation distortionThe nonlinear interaction on the BM of the stimulus
tones that make up the AMTB produces intermodula-tion distortion products. These include distortion prod-ucts at the higher-frequency sideband and lower-fre-
Fig. 5. Schematic of (¢rst panel) an AMTB signal with a modula-tion depth of 0.2 and sidebands of equal amplitude 14 dB less thanthe carrier signal with the same phase as the carrier signal ( U 0.014radian) (2048 point FFT, ‘sampling rate’ of 44 100 Hz), second pan-el : as per ¢rst panel but with sidebands of unequal amplitude (34and 314 dB re carrier signal), third panel: as per ¢rst panel butwith sidebands of unequal phase (32 and +4 radians re carrier sig-nal), fourth panel: as per ¢rst panel but with sidebands of unequalamplitude (34 and 314 dB) and unequal phase (33 and 0 radians).
Fig. 6. Amplitude and phase microstructure for an OAE evoked byan AMTB stimulus, the time-domain stimulus waveform, and theOAE time-domain waveforms for the OAEs at 8171 and 8516 Hz,corresponding to amplitude minima and maxima respectively. Foran AMTB OAE arising from the peak region of the SFOAE ampli-tude microstructure, the OAE waveform is a scaled representationof the stimulus (but with a change in modulation index). For theOAE corresponding to an amplitude minimum, the OAE waveformis distorted relative to the stimulus.
HEARES 4808 16-1-04 Cyaan Magenta Geel Zwart
S.S. Goodman et al. /Hearing Research 188 (2004) 57^69 63

quency sideband arising from the nonlinear interactionof the carrier with the opposing sideband. Such non-linear distortion products, if of su⁄cient amplitude,would vary the amplitude and phase of the sidebandscontributing to the AMTB SFOAE, producing distor-tion of OAE waveform envelope shape.
3.4. AMTB-evoked OAE group delay
Distorted OAE waveforms contaminate estimation ofgroup delay from the least-squares ¢t to a sinusoid (see
Section 2.3). The origin of this distortion is furtherexamined in Section 3.5, such distortion being presentwhen the second-order term in Eq. 1 for the phase ofthe envelope of the AMTB OAE becomes signi¢cantrelative to the ¢rst-order term. Group delay was calcu-lated from that subset of data where the OAE enveloperetained the sinusoidal shape of the AMTB stimuluswaveform envelope, i.e., those OAEs with the samenumber of peaks and dips as the stimuli that evokedthem. Fig. 7 shows the group delays for OAEs evokedby 4.5, 9 and 18 kHz AMTB stimuli versus stimulus
Fig. 7. Group delays for OAEs evoked by 4.5, 9 and 18 kHz AMTB stimuli versus stimulus level and the corresponding linear regression linefor each set of data. Also shown on the upper panel is twice the BM group delay versus stimulus level calculated from BM laser velocimetrymeasurements made near the 18 kHz place. OAE regression line equations: 4.5 kHz: y=30.000027Wx+0.002914, 9 kHz: y=30.000014Wx+0.001637, 18 kHz: y=30.0000085Wx+0.001008.
HEARES 4808 16-1-04 Cyaan Magenta Geel Zwart
S.S. Goodman et al. /Hearing Research 188 (2004) 57^6964

level and the corresponding bi-squares regression linefor each set of data. In each case, group delay decreaseswith increasing stimulus level. Fig. 7, upper panel showsthat group delay decreases from V670 Ws at 40 dBpSPL to 240 Ws at 90 dB pSPL for an 18 kHz stimulus(based on the bi-squares regression line). Also shownon this panel is twice the BM group delay versus stim-ulus level calculated from BM laser velocimetry mea-surements made near the 18 kHz place. BM measure-ments represent a ¢xed point-source measurement.OAEs, in contrast, represent the delay of the globalcochlear response and not just that of a ¢xed pointon the BM. Extension of the regression line for theSFOAE data suggests that at some stimulus level(V25 dB pSPL) below that encompassed by the datathe group delay would be approximately twice the BMdelay. At low stimulus levels, SFOAEs in guinea pighave been shown to arise predominantly from a place-¢xed re£ection mechanism (Goodman et al., 2003) andso are a reasonable estimate of cochlear delay (thissubset of data presumably excludes SFOAEs arisingfrom regions where amplitude minima occur associatedwith variations in e¡ective re£ectance). At higher stim-ulus levels, SFOAE group delays diverge from BMgroup delays, BM group delays being relatively stimu-lus intensity invariant. At the highest stimulus levels,SFOAE group delay is expected to be confounded byOAE arising from a nonlinear distortion mechanism;SFOAEs in guinea pigs at high stimulus levels can bedominated by a nonlinear distortion mechanism (Good-man et al., 2003). The data presumably do not showdelineation of delays for OAEs arising from the twomechanisms due to (i) the mixing of the two compo-nents, (ii) the data set being obtained from nine guineapigs. Further research is necessary on individual ani-mals to explore if such a break-point in group delayexists. The divergence of group delay between BMdata and OAE data is also to be expected based onthe fact that the OAE represents a global measure ofcochlear delay and so delays should decrease due to abasalward shift in the excitation pattern on the BM.Fig. 7, middle panel shows group delays in response
to a 9 kHz stimulus versus stimulus level, delay valuesranging from V940 Ws at 50 dB pSPL to V380 Ws at90 dB pSPL. Fig. 7, lower panel shows group delays inresponse to a 4.5 kHz stimulus versus stimulus level,delay values ranging from V1700 Ws at 45 dB pSPLto V480 Ws at 90 dB pSPL. Extension of the SFOAEregression lines to 25 dB pSPL suggests a delay of 1290Ws for 9 kHz and 2240 Ws for 4.5 kHz, suggestive of agroup delay for the OAE in each case that is approx-imately twice the BM delay (based on cochlear delaysof 640 Ws at 9 kHz and 960 Ws at 4.5 kHz (see Section1)).A two-octave separation between 4.5 and 18 kHz
produces an SFOAE delay di¡erence of 1700 to 630Ws for a 45 dB pSPL stimulus. With increasing stimuluslevel it is expected that a basalward shift in the excita-tion pattern on the BM should result in a decrease indelay. Based on a half-octave shift in the peak of theexcitation pattern at a high stimulus level, and assum-ing local scaling symmetry6, group delays of approxi-mately 1580 and 560 Ws for 4 and 18 kHz respectivelywould be expected7. At 90 dB pSPL group delay valuesof 450 to 300 Ws were obtained. This signi¢cant dispar-ity presumably results from the OAE arising predomi-nantly from a nonlinear distortion mechanism at highstimulus levels (see Section 3.3.1).Using a variant of the suppressor paradigm (Brass
and Kemp, 1991, 1993), Shera and Guinan (2003)found average phase-gradient estimate of group delaysfor SFOAEs in response to 40 dB SPL tone bursts ofapproximately 710 Ws at 18 kHz, 1040 Ws at 9 kHz, and1640 Ws at 4 kHz8. Comparable data from Fig. 7, whichis a time-domain measure of group delay but would beequivalent to a phase-gradient value in a linear system,gives delays of 640, 1035, and 1750 Ws.
3.5. Waveform envelope shape
A ‘good’ envelope shape was de¢ned as an OAEenvelope that retained the sinusoidal shape of theAMTB stimulus, i.e., those OAEs with the same num-ber of peaks and dips as the stimuli that evoked them(does not exclude those OAE waveforms with changesin modulation index). Examination of OAE waveformenvelope shape in terms of the e¡ect of a phase shiftthat is not linear (see Fig. 8) revealed that:1. for vPs 1 and fc = 18 kHz, 70% of OAEs had dis-torted envelope shape while 15% had good envelopeshape;
2. for vPs 0.7 and fc = 9 kHz, 52% of OAEs had dis-torted envelope shape while 5% had good envelopeshape; and
3. for vPs 0.7 and fc = 4.5 kHz, 55% of OAEs haddistorted envelope shape while 26% had good enve-lope shape.It is apparent that a phase shift that is not linear is
not the sole source of AMTB OAE envelope distortionand that, indeed, some OAEs retained a sinusoidal en-velope shape with phase shifts that typically produced
6 While local scaling symmetry only applies at a ¢xed level for theBM excitation pattern, it is suggested that the group delay scales withstimulus level because it can be thought of as the delay to the peak(Vequivalent to the center of gravity) of the wave.
7 Delay= 230:5 times delay estimate at 25 dB pSPL.
8 Obtained from table 1 of Shera and Guinan (2003), i.e., groupdelay= 3.56Wf0:44/1000Wf, where f is expressed in kHz (d=Nsfoae/fCF).
HEARES 4808 16-1-04 Cyaan Magenta Geel Zwart
S.S. Goodman et al. /Hearing Research 188 (2004) 57^69 65

distorted waveforms. However, the inclusion of varia-tion in the amplitude ratio as a parameter that couldimpact on OAE envelope shape (see Section 3.2) didnot improve the identi¢cation of good versus distortedwaveform envelope shapes. Also, apparent from Fig. 8,stimulus level does not appear to a¡ect OAE envelopeshape, as one might expect if intermodulation distortion(Section 3.3.3) contributed to a variation in amplitudeand/or phase of the OAE sidebands.Distorted OAE waveform envelopes compromise the
calculation of group delay. As illustrated in Fig. 5, aphase shift that is not linear produces a shift in theposition of the peaks and troughs, invalidating theuse of a shift in the waveform envelope as a measureof group delay. It is evident, though, that not all exam-ples of distortion of the OAE waveform envelope areexplained by a phase shift that is not linear.
4. Discussion
Signi¢cant advances in our understanding of the me-
chanics of mammalian cochlear function have beenmade in the past 30 years or so, precipitated by theapplication of the Mossbauer technique to the measure-ment of BM vibration in 1967 (Johnstone and Boyle,1967). William Rhode subsequently showed that BMvibration growth is compressively nonlinear (Rhode,1971), such nonlinearity manifesting psycho-acousti-cally as the perception of intermodulation distortionproducts (Tartini’s tones) and physiologically as soundradiating from the ear, or OAEs (Kemp, 1978). ThomasGold, in 1948, predicted that a cellular motor mustexist in the cochlea to provide for the sensitivity andfrequency selectivity observed in humans (Gold, 1948),Duck On Kim and colleagues subsequently demonstrat-ing that a cochlear model with a power source or activemechanical behavior reasonably accurately predictedthe BM measurements of Rhode (Kim et al., 1980;Neely and Kim, 1983, 1986). Nonlinear behavior hassince been combined with active properties in variouscochlear models to form the basis of our current under-standing of cochlear mechanical function (e.g., Zwicker,1986; Chadwick, 1998; de Boer and Nuttall, 2000; Lim
Fig. 8. Phase shift as a function of stimulus level at each of the three stimulus frequencies for each of the OAEs obtained. Good versus badOAE envelope shape (see text) is identi¢ed.
HEARES 4808 16-1-04 Cyaan Magenta Geel Zwart
S.S. Goodman et al. /Hearing Research 188 (2004) 57^6966

and Steele, 2002). However, much remains to be under-stood about the mechanics of the cochlea, including themanner and form of energy propagation in the cochlea,the location of the putative cellular motor and how itworks (for a review, see Withnell et al., 2002), and thesource of cochlear inhomogeneity. OAEs, either directlyor indirectly, are associated with cochlear mechanicalampli¢cation, and provide a non-invasive window intocochlear mechanics. No study has yet reported OAEsmeasured simultaneously with BM motion but the linkbetween OAEs and cochlear mechanics has been estab-lished: Powers et al. (1995) showed that subsequent toproducing a punctate lesion in the cochlea, a sponta-neous OAE was measured concomitant with an increasein neural ¢ring. The parsimonious explanation for thisis that the increased neural ¢ring rate was due to anincrease in BM vibration associated with the presenceof the spontaneous OAE. Complicating the use ofOAEs as a tool to investigate cochlear mechanics isthe fact that they have a complex origin (DPOAEs:Brown et al., 1996; Heitmann et al., 1998; Talmadgeet al., 1999; Kalluri and Shera, 2001; Withnell et al.,2003; SFOAEs: Goodman et al., 2003; Talmadge et al.,2000; TEOAEs: Yates and Withnell, 1999; Withnell etal., 2000).Delay times in the cochlea, whether it be from BM or
OAE measurements have, to date, been largely basedon phase-gradient estimates from steady-state responsesand not directly measured time delays (Tubis et al.,2000). Here we report cochlear delays measured directlyin the time domain from OAEs evoked by AMTB stim-uli. At low to moderate stimulus levels, and providedthat the stimulus frequency range does not include aregion of the cochlea where there is a large change ine¡ective re£ectance, AMTB stimuli appear to evoke anOAE with an envelope shape that is similar to the stim-ulus and allows a direct calculation of cochlear groupdelay. Such delays are commensurate with BM esti-mates of delay, estimates of cochlear delay inferredfrom neural recordings, and previous OAE measuresof delay in the guinea pig (Shera and Guinan, 2003).Comparison of OAE delay with BM data can only be
meaningful when the OAE arises from what approxi-mates a point source and so is analogous to BM mea-surements (unless one has a good model that related thetwo). The data of Fig. 7 do not suggest OAE delaysasymptoting to a constant value at low stimulus levelsas would be expected when the OAE arises from, e¡ec-tively, a point-source location. Measurement of OAEsusing the nonlinear extraction paradigm appears to pre-clude measuring SFOAEs below about 40 dB pSPL dueto signal-to-noise considerations. However, extension ofthe regression lines ¢tted to the data in Fig. 7 suggeststhat at low stimulus levels (V25 dB pSPL) the groupdelay for OAEs measured at 4.5, 9 and 18 kHz approx-
imates a round-trip delay based on BM data (measuredat approximately the 18 kHz CF place) or inferred fromneural data at 9 and 4.5 kHz. AMTB OAE group de-lays measured at high stimulus levels are not represen-tative of cochlear delay times, being confounded pre-sumably by the OAE arising predominantly from anonlinear distortion mechanism. The sideband and car-rier frequencies for an OAE arising from a nonlineardistortion mechanism do not have phases consistentwith their cochlear spatial separation; arising from awave-¢xed mechanism, phase does not accumulatewith frequency for the respective components thatmake up the AMTB OAE.
4.1. Place-¢xed re£ection OAE group delays at highstimulus levels
At high stimulus levels the SFOAE is dominated bya nonlinear distortion mechanism (Goodman et al.,2003). OAEs arising from a place-¢xed re£ection mech-anism provide an estimate of cochlear delay due to thephase accumulation that occurs over the range of thesideband frequencies, subject to the caveat that ampli-tude ratio or phase changes of the carrier and sidebandsassociated with intermodulation distortion productsand variation in e¡ective re£ectance will confoundsuch delay estimates. It may be possible to examinecochlear delays at high stimulus levels using AMTBOAEs, where only the re£ection component is consid-ered in the calculation. Fourier analysis and time-do-main windowing of an AMTB SFOAE data set mea-sured in small step sizes over a wide frequency rangeprovides for separation of the nonlinear and re£ectioncomponents (see Kalluri and Shera, 2001; Withnell etal., 2003; Goodman et al., 2003), allowing group delayto be determined for the re£ection component. How-ever, Goodman et al. (2003) found no level-dependentsystematic change in group delay for this component(from one animal) over the stimulus range 62^86 dBpSPL.
4.2. A 6 dB stimulus level ratio
The nonlinear extraction paradigm (Kemp et al.,1990) used in this study to extract the OAE from theear canal sound pressure recording isolates the OAEfrom the stimulus by virtue of its nonlinear growthwith stimulus level. To maximize the magnitude of theOAE, it should be extracted from ear canal sound pres-sure recordings referenced to a high stimulus levelwhere it has presumably saturated (Martin et al.,1988). In this study, the stimulus level ratio was only6 dB, a value chosen not to maximize the magnitude ofthe OAE but to obtain a representative value of cochle-ar delay. With increasing stimulus level there is a basal-
HEARES 4808 16-1-04 Cyaan Magenta Geel Zwart
S.S. Goodman et al. /Hearing Research 188 (2004) 57^69 67

ward shift in the BM excitation pattern ^ for OAEsevoked by greatly di¡erent stimulus levels there wouldbe a temporal disparity in the onset of the respectiveOAEs.
4.3. Nonlinear extraction versus a suppression paradigm
The nonlinear extraction paradigm is dependent onsaturation of the growth of the OAE for extraction ofthe whole OAE. If OAE growth has not saturated, asoccurs at lower stimulus levels, the extracted OAEunderestimates the actual OAE. The suppression para-digm of Brass and Kemp (1991, 1993) may provide fora larger OAE at low stimulus levels but has the con-founding e¡ect that an additional (suppressor) tone isadded.
4.4. Conclusion
Measurement of cochlear delay times using OAEs areconfounded to some extent by the complexity of theirorigin. OAEs arising from a nonlinear distortion mech-anism, variation in e¡ective re£ectance of the OAE aris-ing from a linear, place-¢xed re£ection mechanism, andintermodulation distortion products generated by thenonlinear interaction in the cochlea of the carrier andsidebands of the AMTB stimulus, may all contribute toOAEs arising with envelope shapes that are not a scaledrepresentation of the stimulus, confounding estimationof cochlear group delay. The group delay calculatedfrom AMTB OAEs would appear to correspond tophysical cochlear delay times only when the shape ofthe OAE envelope is similar to the stimulus and thestimulus level is low.
Acknowledgements
This work was supported by NIH-NIDCD DC04921(R.H.W.), NIH-NIDCD T32 DC00012 Training Grant(S.S.G.), NIHDCD DC00141 (A.L.N.), V.A. Project #C26559C (D.J.L.). Portions of this paper were pre-sented at the Association for Research in Otolaryngol-ogy Mid-Winter Meeting, 2003. We thank Dr. Christo-pher Shera and two anonymous reviewers for providingvaluable feedback on the manuscript and Rachel Rob-erts for willingly proof-reading each version and iden-tifying the grammatical faux pas.
References
Allen, J.B., 1983. Magnitude and phase-frequency response to singletones in the auditory nerve. J. Acoust. Soc. Am. 73, 2071^2092.
Avan, P., Loth, D., Menguy, C., Teyssou, M., 1990. Evoked oto-
acoustic emissions in guinea pig: basic characteristics. Hear. Res.44, 151^160.
Brass, D., Kemp, D.T., 1991. Time-domain observation of otoacous-tic emissions during constant tone stimulation. J. Acoust. Soc.Am. 90, 2415^2427.
Brass, D., Kemp, D.T., 1993. Suppression of stimulus frequency oto-acoustic emissions. J. Acoust. Soc. Am. 93, 920^939.
Brown, A.M., Harris, F.P., Beveridge, H.A., 1996. Two sources ofacoustic distortion products from the human cochlea. J. Acoust.Soc. Am. 100, 3260^3267.
Chadwick, R.S., 1998. Compression, gain, and nonlinear distortion inan active cochlear model with subpartitions. Proc. Natl. Acad. Sci.USA 95, 14594^14599.
Cooper, N.P., Rhode, W.S., 1995. Nonlinear mechanics at the apex ofthe guinea-pig cochlea. Hear. Res. 82, 225^243.
De Boer, E., Nuttall, A.L., 1997. The mechanical waveform of thebasilar membrane. I. Frequency modulations (‘glides’) in impulseresponses and cross-correlation functions. J. Acoust. Soc. Am.101, 3583^3592.
de Boer, E., Nuttall, A.L., 2000. The mechanical waveform of thebasilar membrane. III. Intensity e¡ects. J. Acoust. Soc. Am. 107,1497^1507.
Dolphin, W.F., Mountain, D.C., 1992. The envelope following re-sponse: scalp potentials elicited in the Mongolian gerbil usingsinusoidally AM acoustic signals. Hear. Res. 58, 70^78.
Elmore, W.C., Heald, M.A., 1969. Physics of Waves. Dover Publica-tions, New York.
Gold, T., 1948. Hearing II. The physical basis of the action of thecochlea. Proc. R. Soc. Lond. Biol. 135, 492^498.
Goldstein, J.L., Baer, T., Kiang, N.Y.S., 1971. A theoretical treat-ment of latency, group delay, and tuning characteristics of audi-tory-nerve responses to clicks and tones. In: Sachs, M.B. (Ed.),Physiology of the Auditory System. National Educational Consul-tants, Baltimore, MD, pp. 133^141.
Goodman, S.S., Withnell, R.H., Shera, C.A., 2003. The origin ofSFOAE microstructure in the guinea pig. Hear. Res. 183, 7^17.
Gummer, A.W., Johnstone, B.M., 1984. Group delay measurementfrom the spiral ganglion cells in the basal turn of the guinea pigcochlea. J. Acoust. Soc. Am. 76, 1388^1400.
Heitmann, J., Waldmann, B., Schnitzler, H., Plinkert, P.K., Zenner,H., 1998. Suppression of distortion product otoacoustic emissions(DPOAE) near 2f13f2 removes DP-gram ¢ne structure ^ evidencefor a secondary generator. J. Acoust. Soc. Am. 103, 1527^1531.
Johnstone, B.M., Boyle, A.J., 1967. Basilar membrane vibration ex-amined with the Mossbauer Technique. Science 158, 389^390.
Kalluri, R., Shera, C.A., 2001. Distortion-product source unmixing:A test of the two-mechanism model for DPOAE generation.J. Acoust. Soc. Am. 109, 622^637.
Kemp, D.T., 1978. Stimulated acoustic emissions from within thehuman auditory system. J. Acoust. Soc. Am. 64, 1386^1391.
Kemp, D.T., 1986. Otoacoustic emissions, travelling waves and co-chlear mechanisms. Hear. Res. 22, 95^104.
Kemp, D.T., Ryan, S., Bray, P., 1990. A guide to the e¡ective use ofotoacoustic emissions. Ear Hear. 11, 93^105.
Kim, D.O., Neely, S.T., Molnar, C.E., Matthews, J.W., 1980. Anactive cochlear model with negative damping in the partition:comparison with Rhode’s ante- and post-mortem observations.In: van der Brink, G., Bilsen, F.A. (Eds.), Psychophysical, Phys-iological and Behavioral Studies in Hearing. Delft UniversityPress, Delft, pp. 7^14.
Konrad-Martin, D., Keefe, D.H., 2003. Time-frequency analysisof transient-evoked stimulus-frequency and distortion-productOAEs: Testing cochlear model predictions. J. Acoust. Soc. Am.114, 2021^2043.
Lim, K.M., Steele, C.R., 2002. A three-dimensional nonlinear active
HEARES 4808 16-1-04 Cyaan Magenta Geel Zwart
S.S. Goodman et al. /Hearing Research 188 (2004) 57^6968

cochlear model analyzed by the WKB-numeric method. Hear. Res.170, 190^205.
Martin, G.K., Lonsbury-Martin, B.L., Probst, R., Coats, A.C., 1988.Spontaneous otoacoustic emissions in a nonhuman primate. I.Basic features and relations to other emissions. Hear. Res. 33,49^68.
Neely, S.T., Kim, D.O., 1983. An active cochlear model showingsharp tuning and high sensitivity. Hear. Res. 9, 123^130.
Neely, S.T., Kim, D.O., 1986. A model for active elements in cochlearbiomechanics. J. Acoust. Soc. Am. 79, 1472^1480.
Neely, S.T., Norton, S.J., Gorga, M.P., Jesteadt, W., 1988. Latency ofauditory brain-stem responses and otoacoustic emissions usingtone-burst stimuli. J. Acoust. Soc. Am. 83, 652^656.
Nilsen, K.E., Russell, I.J., 2000. The spatial and temporal representa-tion of a tone on the guinea pig BM. Proc. Natl. Acad. Sci. USA97, 11751^11758.
Nuttall, A.L., Dolan, D.F., 1996. Steady-state sinusoidal velocity re-sponses of the BM in guinea pig. J. Acoust. Soc. Am. 99, 1556^1565.
Nyquist, H., Brand, S., 1928. Measurement of Phase Distortion. BellSyst. Tech. J., 522^549.
Papoulis, A., 1962. The Fourier Integral and its Applications.McGraw-Hill Book Company, New York.
Powers, N.L., Salvi, R.J., Wang, J., Spongr, V., Qiu, C.X., 1995.Elevation of auditory thresholds by spontaneous cochlear oscilla-tions. Nature 375, 585^587.
Ren, T., Nuttall, A.L., Parthasarathi, A.A., 2000. Quantitative mea-sure of multicomponents of otoacoustic emissions. J. Neurosci.Methods 96, 97^104.
Rhode, W.S., 1971. Observations of the vibration of the basilar mem-brane in squirrel monkeys using the Mossbauer technique.J. Acoust. Soc. Am. 49 (Suppl. 2), 1218.
Robles, L., Ruggero, M.A., Rich, N.C., 1986. Basilar membrane me-chanics at the base of the chinchilla cochlea. I. Input^output func-tions, tuning curves, and response phases. J. Acoust. Soc. Am. 80,1364^1374.
Sellick, P.M., Patuzzi, P., Johnstone, B.M., 1982. Measurement ofbasilar membrane motion in the guinea pig using the Mossbauertechnique. J. Acoust. Soc. Am. 72, 131^141.
Shera, C.A., 2003. Wave interference in the generation of re£ection-and distortion-source OAEs. In: Gummer, A.W. (Ed.), Biophysicsof the Cochlea: From Molecule to Model. World Scienti¢c, Sin-gapore, pp. 439^449.
Shera, C.A., Guinan, J.J., 1999. Evoked otoacoustic emissions ariseby two fundamentally di¡erent mechanisms: A taxonomy formammalian OAEs. J. Acoust. Soc. Am. 105, 782^798.
Shera, C.A., Guinan, J.J., 2003. Stimulus-frequency-emission groupdelay: A test of coherent re£ection ¢ltering and a window oncochlear tuning. J. Acoust. Soc. Am. 113, 2762^2772.
Talmadge, C.L., Long, G.R., Tubis, A., Dhar, S., 1999. Experimentalcon¢rmation of the two-source interference model for the ¢nestructure of distortion product otoacoustic emissions. J. Acoust.Soc. Am. 105, 275^292.
Talmadge, C.L., Tubis, A., Long, G.R., Tong, C., 2000. Modeling thecombined e¡ects of basilar membrane nonlinearity and roughnesson stimulus frequency otoacoustic emission ¢ne structure.J. Acoust. Soc. Am. 108, 2911^2932.
Tsuji, J., Liberman, M.C., 1997. Intracellular labeling of auditorynerve ¢bers in guinea pig: Central and peripheral projections.J. Comp. Neurol. 381, 188^202.
Tubis, A., Talmadge, C.L., Tong, C., Dhar, S., 2000. On the relation-ship between the ¢xed-f1, ¢xed-f2, and ¢xed ratio phase deriva-tives of the 2f13f2 distortion product otoacoustic emission.J. Acoust. Soc. Am. 108, 1772^1785.
Whitehead, M.L., Stagner, B.B., Martin, G.K., Lonsbury-Martin,B.L., 1996. Visualization of the onset of distortion-product oto-acoustic emissions, and measurement of their latency. J. Acoust.Soc. Am. 100, 1663^1679.
Withnell, R.H., Yates, G.K., 1998. Onset of basilar membrane non-linearity re£ected in cubic distortion tone input^output functions.Hear. Res. 123, 87^96.
Withnell, R.H., Kirk, D.L., Yates, G.K., 1998. Otoacoustic emissionsmeasured with a physically open recording system. J. Acoust. Soc.Am. 104, 350^355.
Withnell, R.H., Yates, G.K., Kirk, D.L., 2000. Changes to low-fre-quency components of the TEOAE following acoustic trauma tothe base of the cochlea. Hear. Res. 139, 1^12.
Withnell, R.H., Sha¡er, L.A., Lilly, D.J., 2002. What drives mechan-ical ampli¢cation in the mammalian cochlea? Ear Hear. 23, 49^57.
Withnell, R.H., Sha¡er, L.A., Talmadge, C.L., 2003. Generation ofDPOAEs in the guinea pig. Hear. Res. 178, 106^117.
Yates, G.K., Withnell, R.H., 1999. The role of intermodulation dis-tortion in transient-evoked otoacoustic emissions. Hear. Res. 136,49^64.
Zweig, G., Shera, C.A., 1995. The origin of periodicity in the spec-trum of evoked otoacoustic emissions. J. Acoust. Soc. Am. 98,2018^2047.
Zwicker, E., 1986. A hardware cochlear nonlinear preprocessing mod-el with active feedback. J. Acoust. Soc. Am. 80, 146^153.
HEARES 4808 16-1-04 Cyaan Magenta Geel Zwart
S.S. Goodman et al. /Hearing Research 188 (2004) 57^69 69