CO2and Rn degassing from the natural analog of Campo de Calatrava(Spain): Implications for...
14
International Journal of Greenhouse Gas Control 32 (2015) 1–14 Contents lists available at ScienceDirect International Journal of Greenhouse Gas Control j ourna l h o mepage: www.elsevier.com/locate/ijggc CO 2 and Rn degassing from the natural analog of Campo de Calatrava (Spain): Implications for monitoring of CO 2 storage sites J. Elío a,∗ , M.F. Ortega a , B. Nisi b , L.F. Mazadiego a , O. Vaselli c,d , J. Caballero a , F. Grandia e a Universidad Politécnica de Madrid (UPM), Madrid, Spain b CNR-IGG Institute of Geosciences and Earth Resources, Pisa, Italy c Department of Earth Sciences, Florence, Italy d CNR-IGG Institute of Geosciences and Earth Resources, Florence, Italy e AMPHOS21, Barcelona, Spain a r t i c l e i n f o Article history: Received 8 July 2014 Received in revised form 17 October 2014 Accepted 23 October 2014 Keywords: CO2 storage Geochemical monitoring CO2 leakages Radon isotopes Natural analogs Soil gases a b s t r a c t Natural analogs offer a valuable opportunity to investigate the long-term impacts associated with the potential leakage in geological storage of CO 2 . Degassing of CO 2 and radon isotopes ( 222 Rn– 220 Rn) from soil, gas vents and thermal water discharges was investigated in the natural analog of Campo de Calatrava Volcanic Field (CCVF; Central Spain) to determine the CO 2 –Rn relationships and to assess the role of CO 2 as carrier gas for radon. Furthermore, radon measurements to discriminate between shallow and deep gas sources were evaluated under the perspective of their applicability in monitoring programs of carbon storage projects. CO 2 flux as high as 5000 g m −2 d −1 and 222 Rn activities up to 430 kBq m −3 were measured; 220 Rn activi- ties were one order of magnitude lower than those of 222 Rn. The 222 Rn/ 220 Rn ratios were used to constrain the source of the Campo de Calatrava soil gases since a positive correlation between radon isotopic ratios and CO 2 fluxes was observed. Thus, in agreement with previous studies, our results indicate a deep mantle-related origin of CO 2 for both free and soil gases, suggesting that carbon dioxide is an efficient carrier for Rn. Furthermore, it was ascertained that the increase of 222 Rn in the soil gases was likely pro- duced by two main processes: (i) direct transport by a carrier gas, i.e., CO 2 and (ii) generation at shallow level due to the presence of relatively high concentrations of dissolved U and Ra in the thermal aquifer of Campo de Calatrava. The diffuse CO 2 soil flux and radon isotopic surveys carried out in the Campo de Calatrava Volcanic Fields can also be applicable to geochemical monitoring programs in CCS (Carbon Capture and Storage) areas as these parameters are useful to: (i) constrain CO 2 leakages once detected and (ii) monitor both the evolution of the leakages and the effectiveness of subsequent remediation activities. These measurements can also conveniently be used to detect diffuse leakages. © 2014 Elsevier Ltd. All rights reserved. 1. Introduction Carbon Capture and Storage (CCS) is one of the most feasible techniques to reduce anthropogenic greenhouse gas emissions into the atmosphere, allowing fossil fuels combustion to be environ- mentally sustainable (IEA, 2008; IPCC, 2005). In 2011 the United Nations Framework Convention on Climate Change of Durban (UNFCCC, 2011) defined CCS as a clean development mechanism. However, its commercial application still requires further (theoret- ical and practical) investigations in order to make this technology ∗ Corresponding author. Tel.: +34 91 3366 989; fax: +34 913 366 948. E-mail address: [email protected] (J. Elío). economically viable and environmentally safe. Moreover, a proper evaluation of the costs (Kühn et al., 2013; Lupion and Herzog, 2013; Nataly Echevarria Huaman and Xiu Jun, 2014; Romanak et al., 2013) is needed since CCS can be difficult to sustain by private compa- nies without financial support by governmental authorities unless carbon sequestration with enhanced gas recovery and oil recov- ery is applied (CSEGR and CSEOR; e.g., Oldenburg, 2003; Solomon et al., 2008). Eventually, as recently suggested, e.g., Oldenburg, 2012 and references therein, anthropogenic CO 2 can be used to improve the economic viability by increasing the use of this greenhouse gas for different (e.g., industrial, agricultural, food and beverages, pharmaceutical, chemical, healthcare) purposes. Thus, it has been suggested to include the term of “utilization of CO 2 ” in the CCS process, i.e., carbon capture, utilization and storage (CCUS). http://dx.doi.org/10.1016/j.ijggc.2014.10.014 1750-5836/© 2014 Elsevier Ltd. All rights reserved.
Transcript of CO2and Rn degassing from the natural analog of Campo de Calatrava(Spain): Implications for...

C(
Ja
b
c
d
e
a
ARRA
KCGCRNS
1
ttmN(Hi
h1
International Journal of Greenhouse Gas Control 32 (2015) 1–14
Contents lists available at ScienceDirect
International Journal of Greenhouse Gas Control
j ourna l h o mepage: www.elsev ier .com/ locate / i jggc
O2 and Rn degassing from the natural analog of Campo de CalatravaSpain): Implications for monitoring of CO2 storage sites
. Elíoa,∗, M.F. Ortegaa, B. Nisib, L.F. Mazadiegoa, O. Vaselli c,d, J. Caballeroa, F. Grandiae
Universidad Politécnica de Madrid (UPM), Madrid, SpainCNR-IGG Institute of Geosciences and Earth Resources, Pisa, ItalyDepartment of Earth Sciences, Florence, ItalyCNR-IGG Institute of Geosciences and Earth Resources, Florence, ItalyAMPHOS21, Barcelona, Spain
r t i c l e i n f o
rticle history:eceived 8 July 2014eceived in revised form 17 October 2014ccepted 23 October 2014
eywords:O2 storageeochemical monitoringO2 leakagesadon isotopesatural analogsoil gases
a b s t r a c t
Natural analogs offer a valuable opportunity to investigate the long-term impacts associated with thepotential leakage in geological storage of CO2.
Degassing of CO2 and radon isotopes (222Rn–220Rn) from soil, gas vents and thermal water dischargeswas investigated in the natural analog of Campo de Calatrava Volcanic Field (CCVF; Central Spain) todetermine the CO2–Rn relationships and to assess the role of CO2 as carrier gas for radon. Furthermore,radon measurements to discriminate between shallow and deep gas sources were evaluated under theperspective of their applicability in monitoring programs of carbon storage projects.
CO2 flux as high as 5000 g m−2 d−1 and 222Rn activities up to 430 kBq m−3 were measured; 220Rn activi-ties were one order of magnitude lower than those of 222Rn. The 222Rn/220Rn ratios were used to constrainthe source of the Campo de Calatrava soil gases since a positive correlation between radon isotopic ratiosand CO2 fluxes was observed. Thus, in agreement with previous studies, our results indicate a deepmantle-related origin of CO2 for both free and soil gases, suggesting that carbon dioxide is an efficientcarrier for Rn. Furthermore, it was ascertained that the increase of 222Rn in the soil gases was likely pro-duced by two main processes: (i) direct transport by a carrier gas, i.e., CO2 and (ii) generation at shallowlevel due to the presence of relatively high concentrations of dissolved U and Ra in the thermal aquiferof Campo de Calatrava.
The diffuse CO2 soil flux and radon isotopic surveys carried out in the Campo de Calatrava VolcanicFields can also be applicable to geochemical monitoring programs in CCS (Carbon Capture and Storage)areas as these parameters are useful to: (i) constrain CO2 leakages once detected and (ii) monitor both theevolution of the leakages and the effectiveness of subsequent remediation activities. These measurementscan also conveniently be used to detect diffuse leakages.
© 2014 Elsevier Ltd. All rights reserved.
. Introduction
Carbon Capture and Storage (CCS) is one of the most feasibleechniques to reduce anthropogenic greenhouse gas emissions intohe atmosphere, allowing fossil fuels combustion to be environ-
entally sustainable (IEA, 2008; IPCC, 2005). In 2011 the Unitedations Framework Convention on Climate Change of Durban
UNFCCC, 2011) defined CCS as a clean development mechanism.owever, its commercial application still requires further (theoret-
cal and practical) investigations in order to make this technology
∗ Corresponding author. Tel.: +34 91 3366 989; fax: +34 913 366 948.E-mail address: [email protected] (J. Elío).
ttp://dx.doi.org/10.1016/j.ijggc.2014.10.014750-5836/© 2014 Elsevier Ltd. All rights reserved.
economically viable and environmentally safe. Moreover, a properevaluation of the costs (Kühn et al., 2013; Lupion and Herzog, 2013;Nataly Echevarria Huaman and Xiu Jun, 2014; Romanak et al., 2013)is needed since CCS can be difficult to sustain by private compa-nies without financial support by governmental authorities unlesscarbon sequestration with enhanced gas recovery and oil recov-ery is applied (CSEGR and CSEOR; e.g., Oldenburg, 2003; Solomonet al., 2008). Eventually, as recently suggested, e.g., Oldenburg, 2012and references therein, anthropogenic CO2 can be used to improvethe economic viability by increasing the use of this greenhouse
gas for different (e.g., industrial, agricultural, food and beverages,pharmaceutical, chemical, healthcare) purposes. Thus, it has beensuggested to include the term of “utilization of CO2” in the CCSprocess, i.e., carbon capture, utilization and storage (CCUS).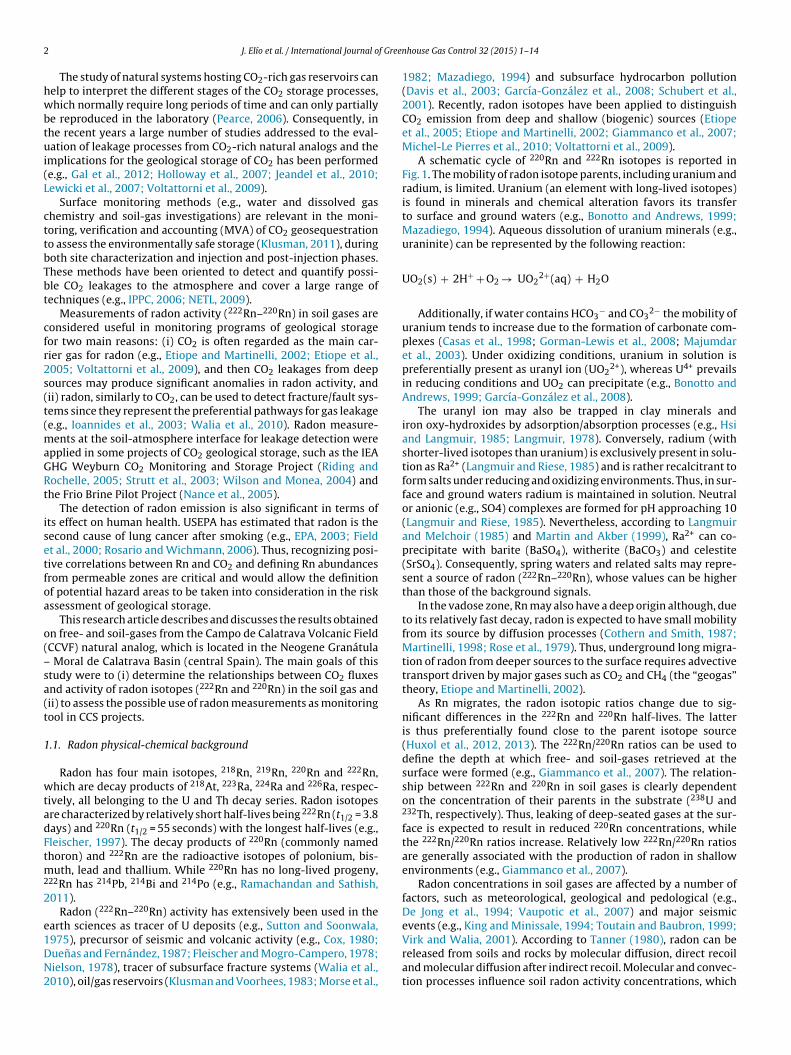
2 f Gree
hwbtui(L
cttbTbt
cfr2s(t(maGRt
isetfoa
o(–sa(t
1
wtadFtm2
2
e1DN2
J. Elío et al. / International Journal o
The study of natural systems hosting CO2-rich gas reservoirs canelp to interpret the different stages of the CO2 storage processes,hich normally require long periods of time and can only partially
e reproduced in the laboratory (Pearce, 2006). Consequently, inhe recent years a large number of studies addressed to the eval-ation of leakage processes from CO2-rich natural analogs and the
mplications for the geological storage of CO2 has been performede.g., Gal et al., 2012; Holloway et al., 2007; Jeandel et al., 2010;ewicki et al., 2007; Voltattorni et al., 2009).
Surface monitoring methods (e.g., water and dissolved gashemistry and soil-gas investigations) are relevant in the moni-oring, verification and accounting (MVA) of CO2 geosequestrationo assess the environmentally safe storage (Klusman, 2011), duringoth site characterization and injection and post-injection phases.hese methods have been oriented to detect and quantify possi-le CO2 leakages to the atmosphere and cover a large range ofechniques (e.g., IPPC, 2006; NETL, 2009).
Measurements of radon activity (222Rn–220Rn) in soil gases areonsidered useful in monitoring programs of geological storageor two main reasons: (i) CO2 is often regarded as the main car-ier gas for radon (e.g., Etiope and Martinelli, 2002; Etiope et al.,005; Voltattorni et al., 2009), and then CO2 leakages from deepources may produce significant anomalies in radon activity, andii) radon, similarly to CO2, can be used to detect fracture/fault sys-ems since they represent the preferential pathways for gas leakagee.g., Ioannides et al., 2003; Walia et al., 2010). Radon measure-
ents at the soil-atmosphere interface for leakage detection werepplied in some projects of CO2 geological storage, such as the IEAHG Weyburn CO2 Monitoring and Storage Project (Riding andochelle, 2005; Strutt et al., 2003; Wilson and Monea, 2004) andhe Frio Brine Pilot Project (Nance et al., 2005).
The detection of radon emission is also significant in terms ofts effect on human health. USEPA has estimated that radon is theecond cause of lung cancer after smoking (e.g., EPA, 2003; Fieldt al., 2000; Rosario and Wichmann, 2006). Thus, recognizing posi-ive correlations between Rn and CO2 and defining Rn abundancesrom permeable zones are critical and would allow the definitionf potential hazard areas to be taken into consideration in the riskssessment of geological storage.
This research article describes and discusses the results obtainedn free- and soil-gases from the Campo de Calatrava Volcanic FieldCCVF) natural analog, which is located in the Neogene Granátula
Moral de Calatrava Basin (central Spain). The main goals of thistudy were to (i) determine the relationships between CO2 fluxesnd activity of radon isotopes (222Rn and 220Rn) in the soil gas andii) to assess the possible use of radon measurements as monitoringool in CCS projects.
.1. Radon physical-chemical background
Radon has four main isotopes, 218Rn, 219Rn, 220Rn and 222Rn,hich are decay products of 218At, 223Ra, 224Ra and 226Ra, respec-
ively, all belonging to the U and Th decay series. Radon isotopesre characterized by relatively short half-lives being 222Rn (t1/2 = 3.8ays) and 220Rn (t1/2 = 55 seconds) with the longest half-lives (e.g.,leischer, 1997). The decay products of 220Rn (commonly namedhoron) and 222Rn are the radioactive isotopes of polonium, bis-
uth, lead and thallium. While 220Rn has no long-lived progeny,22Rn has 214Pb, 214Bi and 214Po (e.g., Ramachandan and Sathish,011).
Radon (222Rn–220Rn) activity has extensively been used in thearth sciences as tracer of U deposits (e.g., Sutton and Soonwala,
975), precursor of seismic and volcanic activity (e.g., Cox, 1980;uenas and Fernández, 1987; Fleischer and Mogro-Campero, 1978;ielson, 1978), tracer of subsurface fracture systems (Walia et al.,010), oil/gas reservoirs (Klusman and Voorhees, 1983; Morse et al.,nhouse Gas Control 32 (2015) 1–14
1982; Mazadiego, 1994) and subsurface hydrocarbon pollution(Davis et al., 2003; García-González et al., 2008; Schubert et al.,2001). Recently, radon isotopes have been applied to distinguishCO2 emission from deep and shallow (biogenic) sources (Etiopeet al., 2005; Etiope and Martinelli, 2002; Giammanco et al., 2007;Michel-Le Pierres et al., 2010; Voltattorni et al., 2009).
A schematic cycle of 220Rn and 222Rn isotopes is reported inFig. 1. The mobility of radon isotope parents, including uranium andradium, is limited. Uranium (an element with long-lived isotopes)is found in minerals and chemical alteration favors its transferto surface and ground waters (e.g., Bonotto and Andrews, 1999;Mazadiego, 1994). Aqueous dissolution of uranium minerals (e.g.,uraninite) can be represented by the following reaction:
UO2(s) + 2H+ + O2 → UO22+(aq) + H2O
Additionally, if water contains HCO3− and CO3
2− the mobility ofuranium tends to increase due to the formation of carbonate com-plexes (Casas et al., 1998; Gorman-Lewis et al., 2008; Majumdaret al., 2003). Under oxidizing conditions, uranium in solution ispreferentially present as uranyl ion (UO2
2+), whereas U4+ prevailsin reducing conditions and UO2 can precipitate (e.g., Bonotto andAndrews, 1999; García-González et al., 2008).
The uranyl ion may also be trapped in clay minerals andiron oxy-hydroxides by adsorption/absorption processes (e.g., Hsiand Langmuir, 1985; Langmuir, 1978). Conversely, radium (withshorter-lived isotopes than uranium) is exclusively present in solu-tion as Ra2+ (Langmuir and Riese, 1985) and is rather recalcitrant toform salts under reducing and oxidizing environments. Thus, in sur-face and ground waters radium is maintained in solution. Neutralor anionic (e.g., SO4) complexes are formed for pH approaching 10(Langmuir and Riese, 1985). Nevertheless, according to Langmuirand Melchoir (1985) and Martin and Akber (1999), Ra2+ can co-precipitate with barite (BaSO4), witherite (BaCO3) and celestite(SrSO4). Consequently, spring waters and related salts may repre-sent a source of radon (222Rn–220Rn), whose values can be higherthan those of the background signals.
In the vadose zone, Rn may also have a deep origin although, dueto its relatively fast decay, radon is expected to have small mobilityfrom its source by diffusion processes (Cothern and Smith, 1987;Martinelli, 1998; Rose et al., 1979). Thus, underground long migra-tion of radon from deeper sources to the surface requires advectivetransport driven by major gases such as CO2 and CH4 (the “geogas”theory, Etiope and Martinelli, 2002).
As Rn migrates, the radon isotopic ratios change due to sig-nificant differences in the 222Rn and 220Rn half-lives. The latteris thus preferentially found close to the parent isotope source(Huxol et al., 2012, 2013). The 222Rn/220Rn ratios can be used todefine the depth at which free- and soil-gases retrieved at thesurface were formed (e.g., Giammanco et al., 2007). The relation-ship between 222Rn and 220Rn in soil gases is clearly dependenton the concentration of their parents in the substrate (238U and232Th, respectively). Thus, leaking of deep-seated gases at the sur-face is expected to result in reduced 220Rn concentrations, whilethe 222Rn/220Rn ratios increase. Relatively low 222Rn/220Rn ratiosare generally associated with the production of radon in shallowenvironments (e.g., Giammanco et al., 2007).
Radon concentrations in soil gases are affected by a number offactors, such as meteorological, geological and pedological (e.g.,De Jong et al., 1994; Vaupotic et al., 2007) and major seismicevents (e.g., King and Minissale, 1994; Toutain and Baubron, 1999;
Virk and Walia, 2001). According to Tanner (1980), radon can bereleased from soils and rocks by molecular diffusion, direct recoiland molecular diffusion after indirect recoil. Molecular and convec-tion processes influence soil radon activity concentrations, which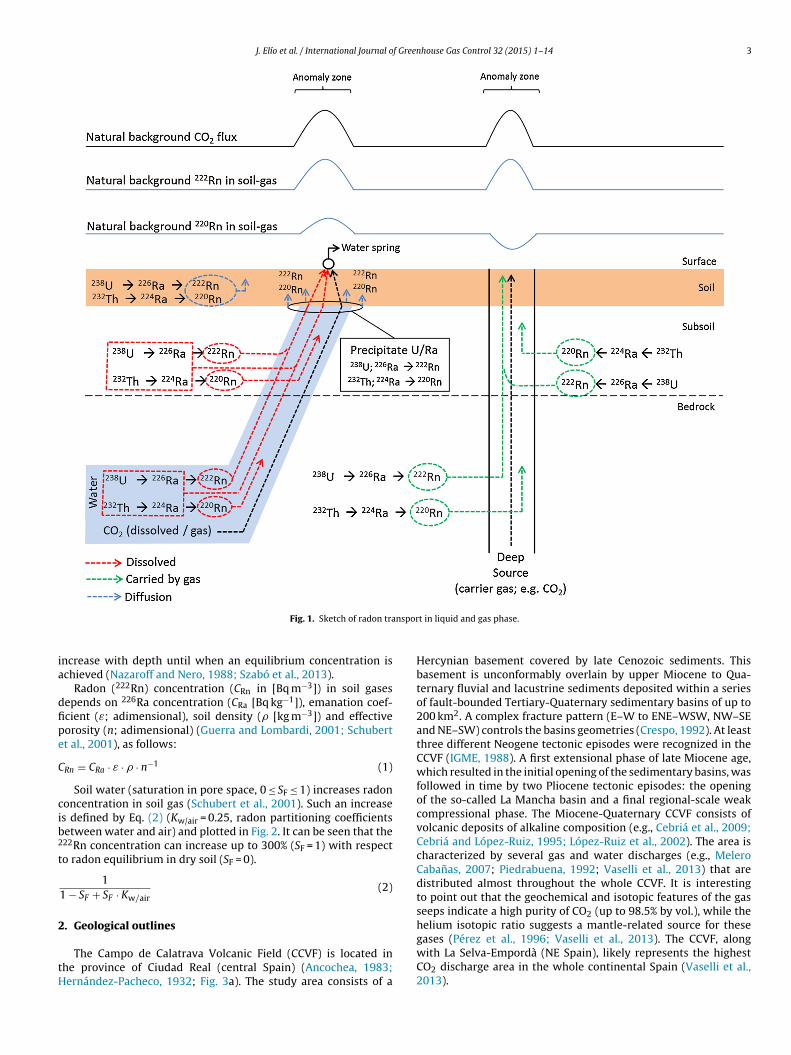
J. Elío et al. / International Journal of Greenhouse Gas Control 32 (2015) 1–14 3
nspor
ia
dfipe
C
cib2
t
2
tH
Fig. 1. Sketch of radon tra
ncrease with depth until when an equilibrium concentration ischieved (Nazaroff and Nero, 1988; Szabó et al., 2013).
Radon (222Rn) concentration (CRn in [Bq m−3]) in soil gasesepends on 226Ra concentration (CRa [Bq kg−1]), emanation coef-cient (ε; adimensional), soil density (� [kg m−3]) and effectiveorosity (n; adimensional) (Guerra and Lombardi, 2001; Schubertt al., 2001), as follows:
Rn = CRa · ε · � · n−1 (1)
Soil water (saturation in pore space, 0 ≤ SF ≤ 1) increases radononcentration in soil gas (Schubert et al., 2001). Such an increases defined by Eq. (2) (Kw/air = 0.25, radon partitioning coefficientsetween water and air) and plotted in Fig. 2. It can be seen that the22Rn concentration can increase up to 300% (SF = 1) with respecto radon equilibrium in dry soil (SF = 0).
11 − SF + SF · Kw/air
(2)
. Geological outlines
The Campo de Calatrava Volcanic Field (CCVF) is located inhe province of Ciudad Real (central Spain) (Ancochea, 1983;ernández-Pacheco, 1932; Fig. 3a). The study area consists of a
t in liquid and gas phase.
Hercynian basement covered by late Cenozoic sediments. Thisbasement is unconformably overlain by upper Miocene to Qua-ternary fluvial and lacustrine sediments deposited within a seriesof fault-bounded Tertiary-Quaternary sedimentary basins of up to200 km2. A complex fracture pattern (E–W to ENE–WSW, NW–SEand NE–SW) controls the basins geometries (Crespo, 1992). At leastthree different Neogene tectonic episodes were recognized in theCCVF (IGME, 1988). A first extensional phase of late Miocene age,which resulted in the initial opening of the sedimentary basins, wasfollowed in time by two Pliocene tectonic episodes: the openingof the so-called La Mancha basin and a final regional-scale weakcompressional phase. The Miocene-Quaternary CCVF consists ofvolcanic deposits of alkaline composition (e.g., Cebriá et al., 2009;Cebriá and López-Ruiz, 1995; López-Ruiz et al., 2002). The area ischaracterized by several gas and water discharges (e.g., MeleroCabanas, 2007; Piedrabuena, 1992; Vaselli et al., 2013) that aredistributed almost throughout the whole CCVF. It is interestingto point out that the geochemical and isotopic features of the gasseeps indicate a high purity of CO2 (up to 98.5% by vol.), while thehelium isotopic ratio suggests a mantle-related source for these
gases (Pérez et al., 1996; Vaselli et al., 2013). The CCVF, alongwith La Selva-Empordà (NE Spain), likely represents the highestCO2 discharge area in the whole continental Spain (Vaselli et al.,2013).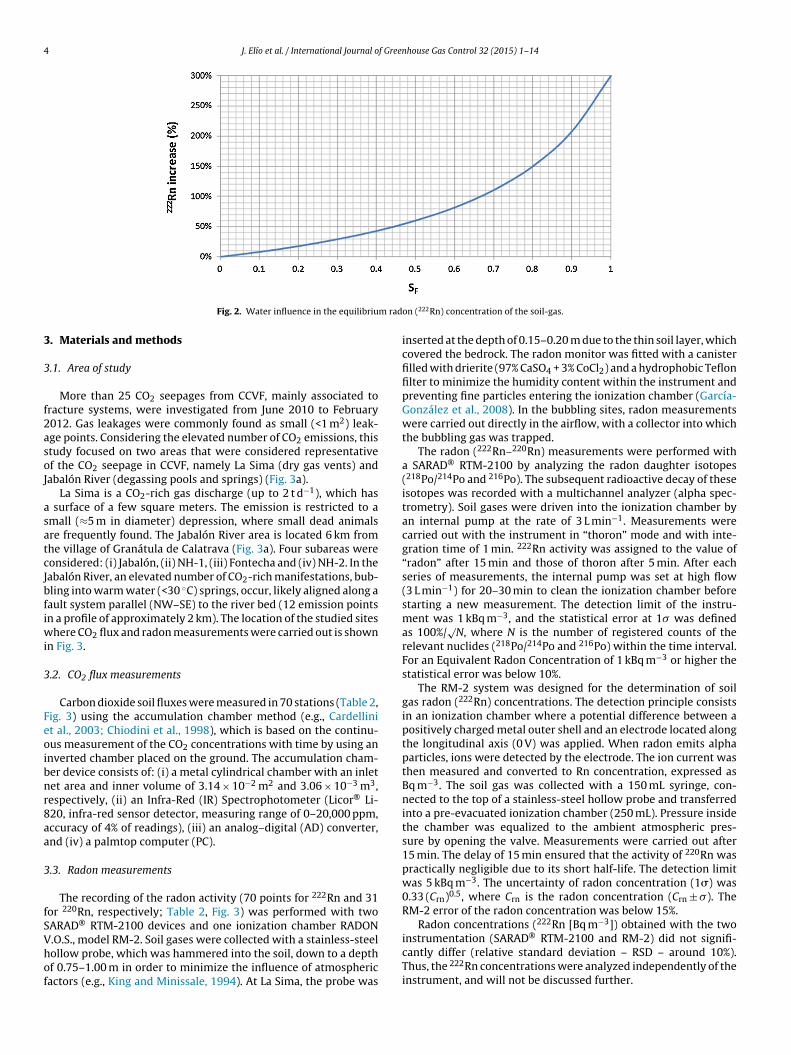
4 J. Elío et al. / International Journal of Greenhouse Gas Control 32 (2015) 1–14
m rad
3
3
f2asoJ
asatcJbfiwi
3
Feoibnr8aa
3
fSVhof
Fig. 2. Water influence in the equilibriu
. Materials and methods
.1. Area of study
More than 25 CO2 seepages from CCVF, mainly associated toracture systems, were investigated from June 2010 to February012. Gas leakages were commonly found as small (<1 m2) leak-ge points. Considering the elevated number of CO2 emissions, thistudy focused on two areas that were considered representativef the CO2 seepage in CCVF, namely La Sima (dry gas vents) andabalón River (degassing pools and springs) (Fig. 3a).
La Sima is a CO2-rich gas discharge (up to 2 t d−1), which has surface of a few square meters. The emission is restricted to amall (≈5 m in diameter) depression, where small dead animalsre frequently found. The Jabalón River area is located 6 km fromhe village of Granátula de Calatrava (Fig. 3a). Four subareas wereonsidered: (i) Jabalón, (ii) NH-1, (iii) Fontecha and (iv) NH-2. In theabalón River, an elevated number of CO2-rich manifestations, bub-ling into warm water (<30 ◦C) springs, occur, likely aligned along aault system parallel (NW–SE) to the river bed (12 emission pointsn a profile of approximately 2 km). The location of the studied sites
here CO2 flux and radon measurements were carried out is shownn Fig. 3.
.2. CO2 flux measurements
Carbon dioxide soil fluxes were measured in 70 stations (Table 2,ig. 3) using the accumulation chamber method (e.g., Cardellinit al., 2003; Chiodini et al., 1998), which is based on the continu-us measurement of the CO2 concentrations with time by using annverted chamber placed on the ground. The accumulation cham-er device consists of: (i) a metal cylindrical chamber with an inletet area and inner volume of 3.14 × 10⁻² m2 and 3.06 × 10⁻³ m3,espectively, (ii) an Infra-Red (IR) Spectrophotometer (Licor® Li-20, infra-red sensor detector, measuring range of 0–20,000 ppm,ccuracy of 4% of readings), (iii) an analog–digital (AD) converter,nd (iv) a palmtop computer (PC).
.3. Radon measurements
The recording of the radon activity (70 points for 222Rn and 31or 220Rn, respectively; Table 2, Fig. 3) was performed with twoARAD® RTM-2100 devices and one ionization chamber RADON
.O.S., model RM-2. Soil gases were collected with a stainless-steelollow probe, which was hammered into the soil, down to a depthf 0.75–1.00 m in order to minimize the influence of atmosphericactors (e.g., King and Minissale, 1994). At La Sima, the probe wason (222Rn) concentration of the soil-gas.
inserted at the depth of 0.15–0.20 m due to the thin soil layer, whichcovered the bedrock. The radon monitor was fitted with a canisterfilled with drierite (97% CaSO4 + 3% CoCl2) and a hydrophobic Teflonfilter to minimize the humidity content within the instrument andpreventing fine particles entering the ionization chamber (García-González et al., 2008). In the bubbling sites, radon measurementswere carried out directly in the airflow, with a collector into whichthe bubbling gas was trapped.
The radon (222Rn–220Rn) measurements were performed witha SARAD® RTM-2100 by analyzing the radon daughter isotopes(218Po/214Po and 216Po). The subsequent radioactive decay of theseisotopes was recorded with a multichannel analyzer (alpha spec-trometry). Soil gases were driven into the ionization chamber byan internal pump at the rate of 3 L min−1. Measurements werecarried out with the instrument in “thoron” mode and with inte-gration time of 1 min. 222Rn activity was assigned to the value of“radon” after 15 min and those of thoron after 5 min. After eachseries of measurements, the internal pump was set at high flow(3 L min−1) for 20–30 min to clean the ionization chamber beforestarting a new measurement. The detection limit of the instru-ment was 1 kBq m−3, and the statistical error at 1� was definedas 100%/
√N, where N is the number of registered counts of the
relevant nuclides (218Po/214Po and 216Po) within the time interval.For an Equivalent Radon Concentration of 1 kBq m−3 or higher thestatistical error was below 10%.
The RM-2 system was designed for the determination of soilgas radon (222Rn) concentrations. The detection principle consistsin an ionization chamber where a potential difference between apositively charged metal outer shell and an electrode located alongthe longitudinal axis (0 V) was applied. When radon emits alphaparticles, ions were detected by the electrode. The ion current wasthen measured and converted to Rn concentration, expressed asBq m−3. The soil gas was collected with a 150 mL syringe, con-nected to the top of a stainless-steel hollow probe and transferredinto a pre-evacuated ionization chamber (250 mL). Pressure insidethe chamber was equalized to the ambient atmospheric pres-sure by opening the valve. Measurements were carried out after15 min. The delay of 15 min ensured that the activity of 220Rn waspractically negligible due to its short half-life. The detection limitwas 5 kBq m−3. The uncertainty of radon concentration (1�) was0.33 (Crn)0.5, where Crn is the radon concentration (Crn ± �). TheRM-2 error of the radon concentration was below 15%.
Radon concentrations (222Rn [Bq m−3]) obtained with the two
instrumentation (SARAD® RTM-2100 and RM-2) did not signifi-cantly differ (relative standard deviation – RSD – around 10%).Thus, the 222Rn concentrations were analyzed independently of theinstrument, and will not be discussed further.
J. Elío et al. / International Journal of Greenhouse Gas Control 32 (2015) 1–14 5
ma, (c
3
tttwtotascTc
with the typical values of gravel, sand and clay (Table 1; Yu et al.,1993). The theoretical concentration was interpreted as a geochem-ical threshold. Hence, in the case that the soil was the only source
Table 1Typical ε, � and n values in soil.
Parameter Minimum Mean Maximum
Fig. 3. Sampling zones: (a) CCVF area, (b) La Si
.4. Soil sampling
Eight soil samples (Table 3; Fig. 3) were collected to measurehe concentration of the radon parent radionuclides (U–Ra) ando assess whether radon was originated by the soil cover or wasransferred from deep sources by advective circulation. Samplingas carried out with an Edelman auger at the same depth where
he soil-gases were measured: two at La Sima gas vent (inside andutside the degassing site) and six at the Jabalón River area (2 closeo the CO2 seepage, i.e., where CO2 was bubbling in water, and 4t a distance of 10–30 m). Samples were analyzed by gamma-ray
pectrometry (Quindós et al., 2006) at the Department of Medi-al Physics, Faculty of Medicine (University of Cantabria, Spain).he 226Ra concentrations in soils provided the theoretical 222Rnoncentrations, which were estimated according to Eq. (1).) Jabalón, (d) NH-1, (e) Fontecha and (f) NH-2.
Since ε, � and n were not measured, the distribution of thetheoretical concentration of 222Rn was estimated by Monte Carlosimulation, assuming that ε, � and n were normally distributed
ε 0.18 0.29 0.40� (kg m−3) 1200 1350 1500n 0.01 0.30 0.50
Source: Yu et al. (1993).
6 f Greenhouse Gas Control 32 (2015) 1–14
oa2
t
4
eg(b
4
in>a2
5
(Qt(TSCF
e((b(
4
sw(mCaabe2
T(
tc(2
zfaRw6d
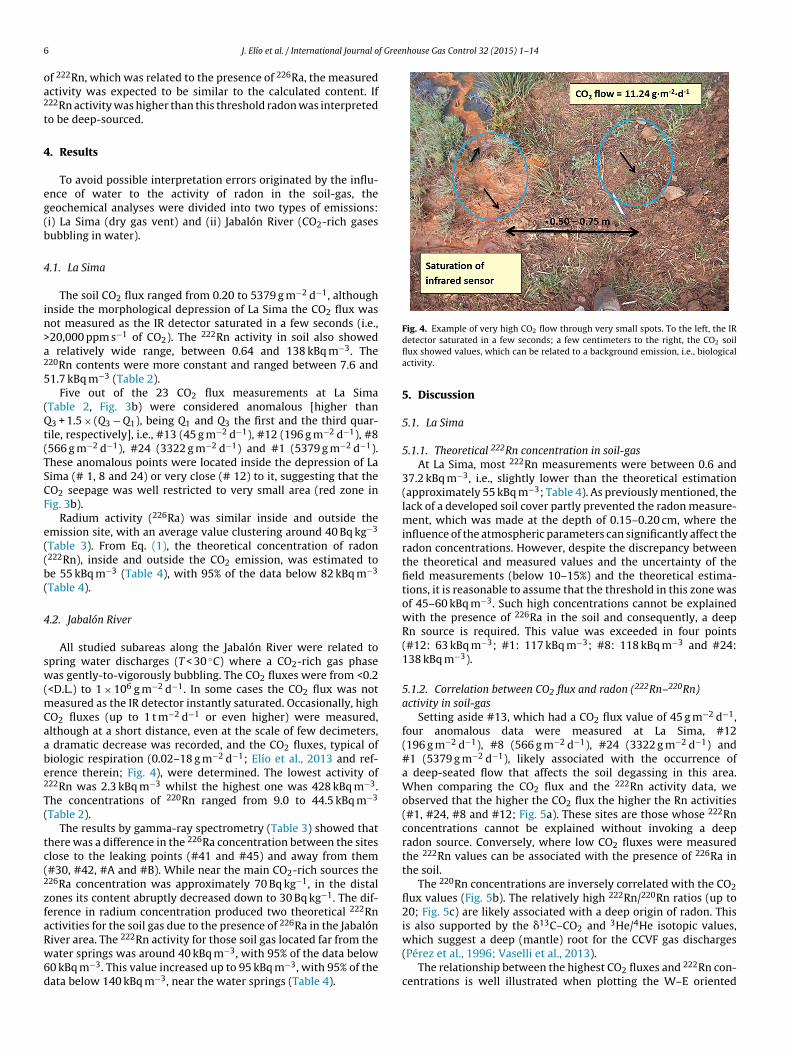
Fig. 4. Example of very high CO2 flow through very small spots. To the left, the IR
J. Elío et al. / International Journal o
f 222Rn, which was related to the presence of 226Ra, the measuredctivity was expected to be similar to the calculated content. If22Rn activity was higher than this threshold radon was interpretedo be deep-sourced.
. Results
To avoid possible interpretation errors originated by the influ-nce of water to the activity of radon in the soil-gas, theeochemical analyses were divided into two types of emissions:i) La Sima (dry gas vent) and (ii) Jabalón River (CO2-rich gasesubbling in water).
.1. La Sima
The soil CO2 flux ranged from 0.20 to 5379 g m−2 d−1, althoughnside the morphological depression of La Sima the CO2 flux wasot measured as the IR detector saturated in a few seconds (i.e.,20,000 ppm s−1 of CO2). The 222Rn activity in soil also showed
relatively wide range, between 0.64 and 138 kBq m−3. The20Rn contents were more constant and ranged between 7.6 and1.7 kBq m−3 (Table 2).
Five out of the 23 CO2 flux measurements at La SimaTable 2, Fig. 3b) were considered anomalous [higher than3 + 1.5 × (Q3 − Q1), being Q1 and Q3 the first and the third quar-
ile, respectively], i.e., #13 (45 g m−2 d−1), #12 (196 g m−2 d−1), #8566 g m−2 d−1), #24 (3322 g m−2 d−1) and #1 (5379 g m−2 d−1).hese anomalous points were located inside the depression of Laima (# 1, 8 and 24) or very close (# 12) to it, suggesting that theO2 seepage was well restricted to very small area (red zone inig. 3b).
Radium activity (226Ra) was similar inside and outside themission site, with an average value clustering around 40 Bq kg−3
Table 3). From Eq. (1), the theoretical concentration of radon222Rn), inside and outside the CO2 emission, was estimated toe 55 kBq m−3 (Table 4), with 95% of the data below 82 kBq m−3
Table 4).
.2. Jabalón River
All studied subareas along the Jabalón River were related topring water discharges (T < 30 ◦C) where a CO2-rich gas phaseas gently-to-vigorously bubbling. The CO2 fluxes were from <0.2
<D.L.) to 1 × 10⁶ g m−2 d−1. In some cases the CO2 flux was noteasured as the IR detector instantly saturated. Occasionally, high
O2 fluxes (up to 1 t m−2 d−1 or even higher) were measured,lthough at a short distance, even at the scale of few decimeters,
dramatic decrease was recorded, and the CO2 fluxes, typical ofiologic respiration (0.02–18 g m−2 d−1; Elío et al., 2013 and ref-rence therein; Fig. 4), were determined. The lowest activity of22Rn was 2.3 kBq m−3 whilst the highest one was 428 kBq m−3.he concentrations of 220Rn ranged from 9.0 to 44.5 kBq m−3
Table 2).The results by gamma-ray spectrometry (Table 3) showed that
here was a difference in the 226Ra concentration between the siteslose to the leaking points (#41 and #45) and away from them#30, #42, #A and #B). While near the main CO2-rich sources the26Ra concentration was approximately 70 Bq kg−1, in the distalones its content abruptly decreased down to 30 Bq kg−1. The dif-erence in radium concentration produced two theoretical 222Rn
ctivities for the soil gas due to the presence of 226Ra in the Jabalóniver area. The 222Rn activity for those soil gas located far from theater springs was around 40 kBq m−3, with 95% of the data below0 kBq m−3. This value increased up to 95 kBq m−3, with 95% of theata below 140 kBq m−3, near the water springs (Table 4).
detector saturated in a few seconds; a few centimeters to the right, the CO2 soilflux showed values, which can be related to a background emission, i.e., biologicalactivity.
5. Discussion
5.1. La Sima
5.1.1. Theoretical 222Rn concentration in soil-gasAt La Sima, most 222Rn measurements were between 0.6 and
37.2 kBq m−3, i.e., slightly lower than the theoretical estimation(approximately 55 kBq m−3; Table 4). As previously mentioned, thelack of a developed soil cover partly prevented the radon measure-ment, which was made at the depth of 0.15–0.20 cm, where theinfluence of the atmospheric parameters can significantly affect theradon concentrations. However, despite the discrepancy betweenthe theoretical and measured values and the uncertainty of thefield measurements (below 10–15%) and the theoretical estima-tions, it is reasonable to assume that the threshold in this zone wasof 45–60 kBq m−3. Such high concentrations cannot be explainedwith the presence of 226Ra in the soil and consequently, a deepRn source is required. This value was exceeded in four points(#12: 63 kBq m−3; #1: 117 kBq m−3; #8: 118 kBq m−3 and #24:138 kBq m−3).
5.1.2. Correlation between CO2 flux and radon (222Rn–220Rn)activity in soil-gas
Setting aside #13, which had a CO2 flux value of 45 g m−2 d−1,four anomalous data were measured at La Sima, #12(196 g m−2 d−1), #8 (566 g m−2 d−1), #24 (3322 g m−2 d−1) and#1 (5379 g m−2 d−1), likely associated with the occurrence ofa deep-seated flow that affects the soil degassing in this area.When comparing the CO2 flux and the 222Rn activity data, weobserved that the higher the CO2 flux the higher the Rn activities(#1, #24, #8 and #12; Fig. 5a). These sites are those whose 222Rnconcentrations cannot be explained without invoking a deepradon source. Conversely, where low CO2 fluxes were measuredthe 222Rn values can be associated with the presence of 226Ra inthe soil.
The 220Rn concentrations are inversely correlated with the CO2flux values (Fig. 5b). The relatively high 222Rn/220Rn ratios (up to20; Fig. 5c) are likely associated with a deep origin of radon. Thisis also supported by the �13C–CO2 and 3He/4He isotopic values,
which suggest a deep (mantle) root for the CCVF gas discharges(Pérez et al., 1996; Vaselli et al., 2013).The relationship between the highest CO2 fluxes and 222Rn con-centrations is well illustrated when plotting the W–E oriented
J. Elío et al. / International Journal of Greenhouse Gas Control 32 (2015) 1–14 7
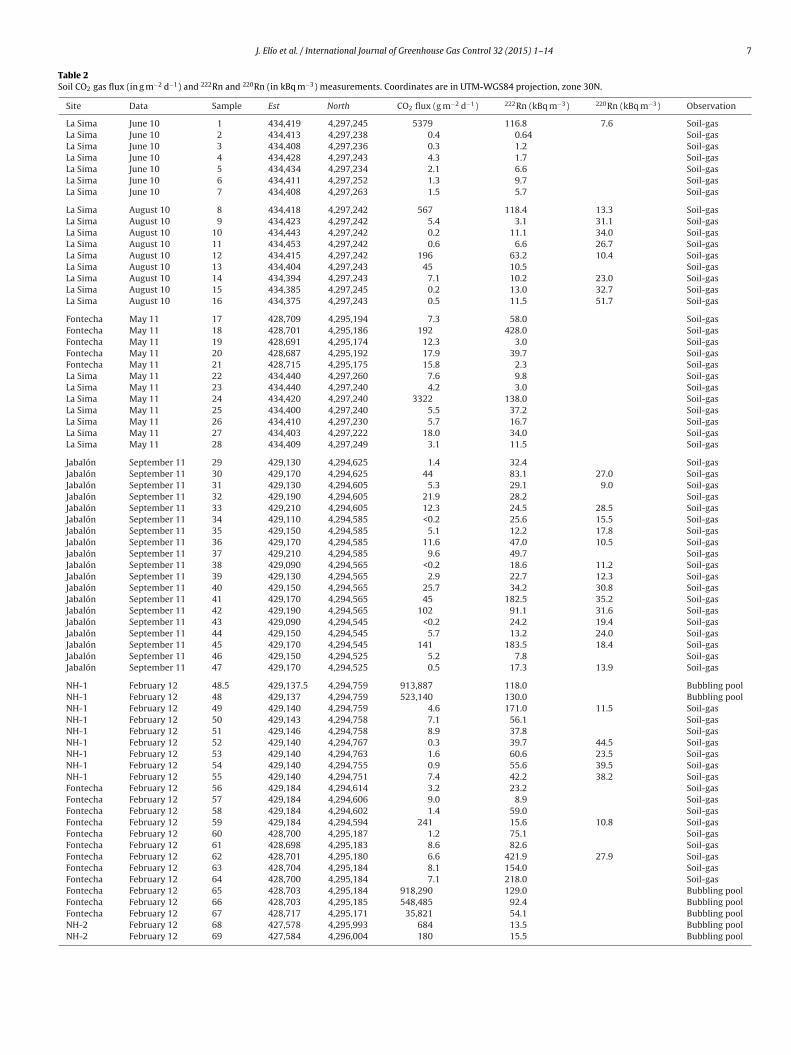
Table 2Soil CO2 gas flux (in g m−2 d−1) and 222Rn and 220Rn (in kBq m−3) measurements. Coordinates are in UTM-WGS84 projection, zone 30N.
Site Data Sample Est North CO2 flux (g m−2 d−1) 222Rn (kBq m−3) 220Rn (kBq m−3) Observation
La Sima June 10 1 434,419 4,297,245 5379 116.8 7.6 Soil-gasLa Sima June 10 2 434,413 4,297,238 0.4 0.64 Soil-gasLa Sima June 10 3 434,408 4,297,236 0.3 1.2 Soil-gasLa Sima June 10 4 434,428 4,297,243 4.3 1.7 Soil-gasLa Sima June 10 5 434,434 4,297,234 2.1 6.6 Soil-gasLa Sima June 10 6 434,411 4,297,252 1.3 9.7 Soil-gasLa Sima June 10 7 434,408 4,297,263 1.5 5.7 Soil-gas
La Sima August 10 8 434,418 4,297,242 567 118.4 13.3 Soil-gasLa Sima August 10 9 434,423 4,297,242 5.4 3.1 31.1 Soil-gasLa Sima August 10 10 434,443 4,297,242 0.2 11.1 34.0 Soil-gasLa Sima August 10 11 434,453 4,297,242 0.6 6.6 26.7 Soil-gasLa Sima August 10 12 434,415 4,297,242 196 63.2 10.4 Soil-gasLa Sima August 10 13 434,404 4,297,243 45 10.5 Soil-gasLa Sima August 10 14 434,394 4,297,243 7.1 10.2 23.0 Soil-gasLa Sima August 10 15 434,385 4,297,245 0.2 13.0 32.7 Soil-gasLa Sima August 10 16 434,375 4,297,243 0.5 11.5 51.7 Soil-gas
Fontecha May 11 17 428,709 4,295,194 7.3 58.0 Soil-gasFontecha May 11 18 428,701 4,295,186 192 428.0 Soil-gasFontecha May 11 19 428,691 4,295,174 12.3 3.0 Soil-gasFontecha May 11 20 428,687 4,295,192 17.9 39.7 Soil-gasFontecha May 11 21 428,715 4,295,175 15.8 2.3 Soil-gasLa Sima May 11 22 434,440 4,297,260 7.6 9.8 Soil-gasLa Sima May 11 23 434,440 4,297,240 4.2 3.0 Soil-gasLa Sima May 11 24 434,420 4,297,240 3322 138.0 Soil-gasLa Sima May 11 25 434,400 4,297,240 5.5 37.2 Soil-gasLa Sima May 11 26 434,410 4,297,230 5.7 16.7 Soil-gasLa Sima May 11 27 434,403 4,297,222 18.0 34.0 Soil-gasLa Sima May 11 28 434,409 4,297,249 3.1 11.5 Soil-gas
Jabalón September 11 29 429,130 4,294,625 1.4 32.4 Soil-gasJabalón September 11 30 429,170 4,294,625 44 83.1 27.0 Soil-gasJabalón September 11 31 429,130 4,294,605 5.3 29.1 9.0 Soil-gasJabalón September 11 32 429,190 4,294,605 21.9 28.2 Soil-gasJabalón September 11 33 429,210 4,294,605 12.3 24.5 28.5 Soil-gasJabalón September 11 34 429,110 4,294,585 <0.2 25.6 15.5 Soil-gasJabalón September 11 35 429,150 4,294,585 5.1 12.2 17.8 Soil-gasJabalón September 11 36 429,170 4,294,585 11.6 47.0 10.5 Soil-gasJabalón September 11 37 429,210 4,294,585 9.6 49.7 Soil-gasJabalón September 11 38 429,090 4,294,565 <0.2 18.6 11.2 Soil-gasJabalón September 11 39 429,130 4,294,565 2.9 22.7 12.3 Soil-gasJabalón September 11 40 429,150 4,294,565 25.7 34.2 30.8 Soil-gasJabalón September 11 41 429,170 4,294,565 45 182.5 35.2 Soil-gasJabalón September 11 42 429,190 4,294,565 102 91.1 31.6 Soil-gasJabalón September 11 43 429,090 4,294,545 <0.2 24.2 19.4 Soil-gasJabalón September 11 44 429,150 4,294,545 5.7 13.2 24.0 Soil-gasJabalón September 11 45 429,170 4,294,545 141 183.5 18.4 Soil-gasJabalón September 11 46 429,150 4,294,525 5.2 7.8 Soil-gasJabalón September 11 47 429,170 4,294,525 0.5 17.3 13.9 Soil-gas
NH-1 February 12 48.5 429,137.5 4,294,759 913,887 118.0 Bubbling poolNH-1 February 12 48 429,137 4,294,759 523,140 130.0 Bubbling poolNH-1 February 12 49 429,140 4,294,759 4.6 171.0 11.5 Soil-gasNH-1 February 12 50 429,143 4,294,758 7.1 56.1 Soil-gasNH-1 February 12 51 429,146 4,294,758 8.9 37.8 Soil-gasNH-1 February 12 52 429,140 4,294,767 0.3 39.7 44.5 Soil-gasNH-1 February 12 53 429,140 4,294,763 1.6 60.6 23.5 Soil-gasNH-1 February 12 54 429,140 4,294,755 0.9 55.6 39.5 Soil-gasNH-1 February 12 55 429,140 4,294,751 7.4 42.2 38.2 Soil-gasFontecha February 12 56 429,184 4,294,614 3.2 23.2 Soil-gasFontecha February 12 57 429,184 4,294,606 9.0 8.9 Soil-gasFontecha February 12 58 429,184 4,294,602 1.4 59.0 Soil-gasFontecha February 12 59 429,184 4,294,594 241 15.6 10.8 Soil-gasFontecha February 12 60 428,700 4,295,187 1.2 75.1 Soil-gasFontecha February 12 61 428,698 4,295,183 8.6 82.6 Soil-gasFontecha February 12 62 428,701 4,295,180 6.6 421.9 27.9 Soil-gasFontecha February 12 63 428,704 4,295,184 8.1 154.0 Soil-gasFontecha February 12 64 428,700 4,295,184 7.1 218.0 Soil-gasFontecha February 12 65 428,703 4,295,184 918,290 129.0 Bubbling poolFontecha February 12 66 428,703 4,295,185 548,485 92.4 Bubbling poolFontecha February 12 67 428,717 4,295,171 35,821 54.1 Bubbling poolNH-2 February 12 68 427,578 4,295,993 684 13.5 Bubbling poolNH-2 February 12 69 427,584 4,296,004 180 15.5 Bubbling pool

8 J. Elío et al. / International Journal of Greenhouse Gas Control 32 (2015) 1–14
Table 3Results of gamma-ray spectrometry in soil samples.
Site Sample 238U (234Th) 226Ra (214Bi) 232Th (228Ac) 40K 137Cs
La Sima Outside 79.0 ± 10.8 40.2 ± 1.5 70.4 ± 4.5 775.5 ± 32.2 <D.L. (1.2)Inside 86.3 ± 11.5 40.9 ± 1.6 117.3 ± 7.2 694.8 ± 29.9 31.6 ± 1.0
Jabalón River 30 26.2 ± 3.9 34.0 ± 1.4 64.5 ± 4.4 984.9 ± 40.2 <D.L. (1.4)A <D.L. (25.4) 23.0 ± 1.2 79.2 ± 5.0 776.3 ± 33.0 <D.L. (1.7)42 39.5 ± 8.5 26.5 ± 1.3 71.1 ± 4.9 871.8 ± 35.6 <D.L. (1.8)41 137.8 ± 14.9 76.0 ± 2.2 72.9 ± 4.9 962.3 ± 39.7 <D.L. (1.8)45 <D.L. (27.6) 69.5 ± 2.1 71.0 ± 4.7 935.4 ± 39.2 <D.L. (1.8)B <D.L. (24.9) 35.4 ± 1.4 57.6 ± 3.9 742.6 ± 30.9 <D.L. (1.6)
Concentrations are in Bq kg−1. Points A and B not shown in Fig. 3.
Table 4Theoretical concentrations of 222Rn (in Bq m−3) in soil gas as calculated by 226Ra decay in the soil.
Site 226Ra (Bq kg−1) 222Rn (kBq m−3)
Min. Q1 Median Mean Q3 95th percentile Max.
La Sima 40 23 44 51 54 61 82 452
pActtt
Ft
Jabalón River (away bubbling) 30 17 33Jabalón River (near bubbling) 70 40 77
rofile (Fig. 6) as a function of the distance from La Sima gas vent.nother relevant result was that at #8 (distance 0 m) the highest
oncentration of 222Rn was recorded while that of 220Rn was amonghe lowest measured values. This might be explained with the dilu-ion of a 220Rn-free deep gas as it rises to the surface. Furthermore,he amount of 220Rn generated at the surface was promptly releasedFig. 5. Relationship between CO2 flux and 222Rn
ig. 6. Spatial correlation between 222Rn/220Rn and CO2 flux in the La Sima zone (Table 2he CO2 leak.
38 41 46 61 33990 95 107 143 791
once produced because of the elevated CO2-rich gas flux and, conse-quently, the recorded data were smaller than those really produced.
The highest 222Rn/220Rn ratios were at #8 (La Sima) and #12, sug-gesting a predominance of the highest half-life isotope (222Rn).These results demonstrate that CO2 acts as a carrier gas for radonin a regime of advective transport./220Rn in the La Sima zone (Table 2, Fig. 3).
, Fig. 3). Horizontal axis is the distance (m) from the sample point to the center of

J. Elío et al. / International Journal of Greenhouse Gas Control 32 (2015) 1–14 9
F 222 226Ra ac −1 −1
r and doi to the
5
5
f(stctrttcs(tolamsct1du
stw#aum
#(at
ig. 7. Equilibrium Rn activity of the soil-gas in the area of Jabalón River versusespectively. Continuous lines are the median of theoretical radon concentration
nterpretation of the references to color in this figure legend, the reader is referred
.2. Jabalón River
.2.1. Theoretical 222Rn activity in soil-gasThe increase of 226Ra activity between the sites located away
rom the thermal waters (30 Bq kg−1) and those close to them70 Bq kg−1) could be produced by a process of transport of dis-olved U and Ra and their precipitation at the spring. Thus, twoheoretical 222Rn concentrations were carried out, although in thisase the influence of soil water saturation (SF; Eq. (2)) are to beaken into account for the interpretation of the gas 222Rn origin. Theadon activity equilibrium of the soil gas is plotted in Fig. 7. In ordero evaluate the influence on the radon measurements produced byhe water contained in the soil, a distinction between the Ra con-entrations was made. In those points located far from the waterprings, the soil is expected to be relatively dry or slightly moistSF ≈ 0.1–0.5). This would imply that the increase of 222Rn fromhe water contained in the soil should not exceed more than 50%f the theoretical concentration for dry soil (≈70 kBq m−3; blackines in Fig. 7). Thus, the concentration of Ra in the soil does notccount for the 222Rn concentrations in soil gases when they areuch higher than 40–70 kBq m−3. Close to the water springs, where
oils are expected to be relatively moist (SF ≈ 0.5–0.8), the radononcentration can increase of 50–150% with respect to dry condi-ions; therefore the theoretical activity of 222Rn could be around20 kBq m−3 (black lines in Fig. 7). If the transport of radium isriven by ground water, the 222Rn content is expected to increasep to 270 kBq m−3 (blue lines in Fig. 7).
In these areas, the points located at a distance from the waterprings were commonly characterized by radon activity values lesshan 70 kBq m−3, which are in agreement with those calculatedith the presence of 226Ra in the relatively dry soil, e.g., #17, #20,32 and #35 (Table 2; Fig. 3). However, this threshold was exceededt two points: #30 (83 kBq m−3) and #42 (91 kBq m−3), which arenlikely values for dry/moderately moist soils. This would imply aore efficient advective transport and/or a deep gas source.In proximity to the water springs (#18, #41, #45, #49–55,
60–64; Table 2 and Fig. 3), the 222Rn activity was between 38#51) and 428 (#18) kBq m−3. As previously described, the radonctivity can increase to 120 kBq m−3 due to presence of water inhe soil. Actually, some high 222Rn values (from 56 to 83 kBq m−3,
tivity. Black and blue lines represent a radium activity of 30 Bq kg and 70 Bq kg ,tted lines are referred to the first (Q1) and the third (Q3) quantile (Table 4). (For
web version of this article.)
e.g., #50, #53, #60 and #61) could be related to the increase inwater saturation. Nevertheless, very high values were also mea-sured at #63 (154 kBq m−3) #49 (171 kBq m−3), #41 (182 kBq m−3),#45 (183 kBq m−3), #64 (218 kBq m−3), #62 (421 kBq m−3) and #18(428 kBq m−3). Radon activity at #63, #49, #41, #45 and #64 canbe attributed to soil moisture when the radium content are up to70 Bq kg−1 (blue line in Fig. 7). However, radon activities higherthan 270 kBq m−3 are unlikely when increases in radium contentand soil moisture are considered. Consequently, also in this case,the contribution by a deep source can be invoked (e.g., #62 and#18). We may speculate that in addition to the increase of radonconcentration by water saturation in the soil, an excess of 222Rnis likely occurring and favored by the presence of parent radionu-clides (U and Ra) dissolved in the ground water system.
5.2.2. Correlation between CO2 flux and radon (222Rn–220Rn)activity in soil-gas
At Jabalón River the highest activities of 222Rn and CO2 fluxesare not apparently closely correlated (Fig. 8a). Nevertheless, 222Rncontents higher than those estimated by the presence of 226Ra inthe soil were detected in sites close to the thermal springs (e.g., #18and #62) and away from them (e.g., #30 and #42), suggesting thepresence of a deep 222Rn source. However, 222Rn activity near thespring waters (blue-colored numbers in Fig. 8a) was always higherthan those measured in the distal points (black-colored numbers inFig. 8a), although CO2 fluxes were relatively low (e.g., #62 and #64versus #30, #42 or #59). An inverse correlation between 220Rn andCO2 was not observed (Fig. 8b). On the other hand, 220Rn had a smallincrease (Fig. 9), which could be interpreted in terms of shalloworigin of radon, at least more superficial than that of La Sima. Thiscould likely be accounted for the transport and precipitation of Uand Ra. In relation to the 222Rn/220Rn ratio (Fig. 8c) there was not aclear increase with the CO2 flux in contrast to what observed at LaSima. Despite the relatively high isotopic ratio (e.g., #49, #62, #45),no correlation with the CO2 flux was highlighted since in some casesthe 222Rn/220Rn ratio decreased (e.g., #59 vs #36 or #49). Similar
features can be produced by either deep or shallow origin for radonand by the soil water saturation.These results suggest that the increase of radon activity in theJabalón River with respect to the background is likely related to two

10 J. Elío et al. / International Journal of Greenhouse Gas Control 32 (2015) 1–14
F lue tet n of th
cbrdgw
rtpF
Fp
ig. 8. Relationship between CO2 flux and 222Rn/220Rn ratios in the Jabalón River (bhe references to color in this figure legend, the reader is referred to the web versio
ontributions: (i) a deep-seated source carried by CO2, supportedy the higher concentrations of 222Rn with respect to those theo-etically estimated by 226Ra in soil, and (ii) a source related to theecay of parent radionuclides (U–Ra), dissolved and transported byroundwater system as supported by the highest radium activitieshen approaching the spring water discharges.
The profiles of the CO2 flux as a function of the distance with
espect to the CO2-rich gas emission sites and those of the Rn iso-opic concentration and 222Rn/220Rn ratios for the Jabalón River arelotted in Figs. 9 and 10. In Fig. 9a and b (profile N–S for Jabalon,ig. 3c, Table 2), the highest value of CO2 flux (#45, 141 g m−2 d−1) isig. 9. Spatial correlation between 222Rn/220Rn and CO2 flux along the Jabalón River (Taermeability). Horizontal axis is the distance (m) from the sample point to the center of t
xts in A indicate the points near water spring, Table 2, Fig. 3). (For interpretation ofis article.)
coupled with that of 222Rn (184 kBq m−3), although at #41 the CO2flux sharply decreases down to 45 g m−2 d−1 while the Rn activitywas found to be constant (182 kBq m−3). Moving to the north ofthe CO2-bearing spring (#36) both activity of 222Rn and CO2 flux(47 kBq m−3 and 12 g m−2 d−1, respectively) decrease. Then, the222Rn activity achieves a secondary peak (#30: 83 kBq m−3), whichis not related to any increase of 226Ra in the soil (Table 3), while the
CO2 flux increases (44 g m−2 d−1). In contrast, in the E–W profile(Fig. 9c and d) the highest recorded CO2 flux (#42; 102 g m−2 d−1)does not match with that of the 222Rn activity (#41; 182 kBq m−3).The activity of 220Rn in both profiles shows an increase associatedble 2, Fig. 3; NF: no flow, soil-gas could not be sampled due to the extremely lowhe CO2 leak.

J. Elío et al. / International Journal of Greenhouse Gas Control 32 (2015) 1–14 11
F er (Tabo
wdea
2
Naaphi
Fidmttbostli
flrdbt
River the CO2 flux was 200 g m−2 d−1 (e.g., #18 and #59) and the222Rn concentration was around 400 kBq m−3 (e.g., #18 and #62).This would support the hypothesis that along the Jabalon Rivera radon source derived from dissolved U and Ra adds to that
ig. 10. Spatial correlation between 222Rn/220Rn and CO2 flux along the Jabalón Rivf the CO2 leak.
ith the CO2 flux, although the highest 220Rn concentration (#41)oes not completely match with respect to the site where the high-st CO2 flux (#45 in profile N–S and #42 in profile E–W in Fig. 9and b) is found.
In Fig. 10, the lack of correlation between the highest values of22Rn concentration and CO2 flux for the same spot is more evident.evertheless, despite the fact that a linear correlation between CO2nd 222Rn is not detected, there is a direct influence in radon (222Rn)ctivity associated with the CO2 leakage. This is supported by theresence of 222Rn concentrations near the seepage zones muchigher than those calculated by considering the Ra concentrations
n the soil or the increase related to soil water saturation.In the springs with bubbling CO2 (#48, #65 to #68; Table 2,
ig. 11) the 222Rn activity is lower with respect to that measuredn the surrounding sites. This discrepancy can likely be due to theifferent sampling methods since in these spots radon measure-ents were carried out directly in the airflow, with a collector on
he bubbling gas phase due to the presence of water. Consequently,hese measurements can be related to the amount of 222Rn carriedy CO2 and not to the content of U and Ra in the thermal watersr the presence of soil water saturation (SF). Nevertheless, in theoil-gas near the degassing sites all effects could be detected andherefore the radon concentration in the gas is higher. The positiveinear correlation between the CO2 flux and concentration of 222Rnn the gas vent is supporting this hypothesis (Fig. 11).
Another significant observation was that at La Sima the CO2uxes in the CO2-rich gas emission sites were higher than those
ecorded along the Jabalón River, with the exception of the water-egassing points, whereas the 222Rn activities showed an oppositeehavior. At La Sima the highest CO2 fluxes were from 3000o 5000 g m−2 d−1 and the 222Rn concentrations were clusteringle 2, Fig. 3). Horizontal axis is the distance (m) from the sample point to the center
around 120 kBq m−3 (Table 1; #1, #8 a#24). Conversely, at Jabalón
Fig. 11. Correlation between CO2 flux and 222Rn in the degassing pools (Table 2,Fig. 3).

1 f Gree
tifwtR
5
ts1flpctt(emafsIa
vtcvea(ftmdr
toe2oeo
itsCttsmsta(“rfla
h
2 J. Elío et al. / International Journal o
ransported by CO2. While at La Sima the only cause that leads to thencrease in radon is the CO2 flux, in the Jabalon River contributionsrom soil water, U and Ra and CO2 flux are to be added. Thus, thisould explain why at La Sima we measured high CO2 fluxes while
he 222Rn activities were relatively lower than that in the Jabaloniver area.
.3. Implication for monitoring CO2 storage sites
The CO2-rich emissions at CCVF are mainly associated with frac-ure systems and the gas discharges are regarded as point-sourceeepage, being occasionally characterized by relatively high flow:
t m−2 d−1 or even higher. In the vicinity of these sites, the CO2uxes approach values, which are typical of soil respiration. In theerspective of assessing gas leakages in areas selected for geologicalarbon storage, the observation of the point-source seepage revealshat the detection of leakage sites can pose serious difficulties givenhe large area potentially affected by the leakage of injected CO2hundreds km2). It is worth mentioning that the amount of CO2mitted from these points can be of the order of magnitude of theaximum leakage rate considered acceptable (0.1% of the total
mount in storage per year; Van der Zwaan and Smekens, 2006)or a commercial storage project (i.e., approximately 1 Mt year−1;uch as in Snоhvit: 0.73 Mt year−1, Sleipner: 0.98 Mt year−1 andn Salah: 1.28 Mt year−1; Michael et al., 2010). Thus, conventionalpproaches might not be able to detect small-scale emissions.
In this regards, in the framework of CCS projects significantariations in terms of soil diffuse CO2 flux may be occurring athe scale of few meters or even centimeters and CO2 leakagesannot be detected until clear evidences (e.g., impacts on theegetation, newly formed bubbling sites) are visible in the field,ven when small sample grids, e.g., 10–20 m (e.g., Elío et al., 2013nd references therein) are considered. Besides, natural analogse.g., geothermal or volcanic areas) have gas fluxes, which are byar higher than those expected for a sequestration project. Fur-hermore, in the case of seepages small geographic changes and
oderate seasonal changes in the CO2 fluxes are expected to beetected with respect to the background levels. This makes theeconnaissance of seepages real challenging.
The application of other cost-effective monitoring/detectionechniques able to cover larger areas, such as Eddy covariance,pen-path laser and remote sensing, need to be improved and prop-rly evaluated for their applicability to CCS projects (e.g., Klusman,011; Lewicki et al., 2009; Ortega et al., 2014). Long-term continu-us soil gas surveys can help to identify leakages (e.g., Schlömert al., 2014), although these might also be undetectable whenccurring in very localized and small areas.
Concerning radon measurements in the CCVF areas, an increasen the 222Rn soil-gas concentration was detected and correlatedo the CO2 flux. The influence of this 222Rn anomaly zone, thoughmall, seems to be of larger extent with respect to that of CO2.onsequently, radon isotopes can be considered as good tracerso discriminate leakage areas, providing useful information abouthe (biological or deep-seated) origin of CO2. Radon isotope mea-urements can overcome the limitations of others geochemicalethods, which are commonly used to interpret the origin of the
oil gases, e.g., �13C–CO2 or helium isotope ratios. Another advan-age of radon measurements is that to avoid “false positives”. Radonctivity in soil-gas is indeed related to lithological and geostructuralfaults and fractures) features. This means that when an increasedeep” CO2 fluxes with respect to the background values occurs,adon activity is also expected to increment. Conversely, if CO2
uxes increase in response of an enhanced biological activity, radonctivity should not suffer any particular variation.At CCFV, the 222Rn activity in the soil gas was occasionally asigh as 430 kBq m−3, i.e., much higher than the threshold value
nhouse Gas Control 32 (2015) 1–14
(>50 kBq m−3; Cothern and Smith, 1987) for which a certain siteis considered with a high-risk potential. Such high concentrationsneed to be taken into account when CCS risk assessment plans are tobe designed, particularly when CO2 leakages may affect residentialareas and working environments. Consumption of CO2-rich watersis also a risk since they may potentially contain high concentrationsof dissolved 222Rn, and U and Ra.
In this study, correlations between 220Rn concentrations andCO2 fluxes were not as clear as observed for those of 222Rn and CO2.In the dry gas vent of La Sima, a significant reduction of the 220Rnconcentrations was detected and likely related to an increase inthe CO2 flux. However, in the emission sites associated with watersprings 222Rn and CO2 were not correlated while a slight increasein 220Rn concentrations with the CO2 flux was recorded. This effectis likely due to different source of 222Rn and 220Rn isotopes.
6. Conclusions
The Campo de Calatrava Volcanic Field is a relevant natural ana-log where gas leakages in the framework of geological CO2 storageprojects can be investigated. A large number of CO2-rich emis-sions, predominantly associated with fracture/fault systems occur,although they mainly discharge as punctual manifestations. Theresults suggest a deep origin of CO2, in agreement with previousgeochemical and isotopic analyses of the gas leaks, which indicatethat CO2 is mantle sourced.
According to our data, the increase of 222Rn in the soil gases islikely produced by two mechanisms, (i) advective transport whereCO2 acts as carrier gas and (ii) generation at shallow level due tothe presence of U and Ra in both thermal waters and soils.
Geochemical surveys of CO2 flux and radon isotopic measure-ments are very useful to: (i) define and quantify CO2 leakagesonce detected and (ii) monitor the evolution of the leakages andthe effectiveness of subsequent remediation activities. These tech-niques can also be successfully applied to detect diffuse leakages.
Acknowledgements
We wish to thank C. Jenkins and Nunzia Voltattorni and ananonymous reviewer who greatly improved an early version ofthe manuscript. This work was funded by the Ciudad de la EnergíaFoundation (CIUDEN), through the ALM-08-006 contract, and co-financed by the European Union (European Energy Programme forRecovery). The sole responsibility of this publication lies with theauthors. The European Union is not responsible for any use thatmay be made of the information contained therein.
References
Ancochea, E., (Ph.D. thesis) 1983. Evolución espacial y temporal del volcanismoreciente de Espana Central. Complutense University, Madrid.
Bonotto, D.M., Andrews, J.N., 1999. Transfer of radon and parent nuclides 238U and234U from soils of the Mendip Hills area, England, to the water phase. J. Geochem.Explor. 66, 255–268.
Cardellini, C., Chiodini, G., Frondini, F., 2003. Application of stochastic simulation toCO2 flux from soil: mapping and quantification of gas release. J. Geophys. Res.108 (B9), 2425.
Casas, I., de Pablo, J., Gimenez, J., Torrero, M.E., Bruno, J., Cera, E., Finch, R.J., Ewing,R.C., 1998. The role of pe, pH, and carbonate on the solubility of UO2 and urani-nite under nominally reducing conditions. Geochim. Cosmochim. Acta 62 (13),2223–2231.
Cebriá, J.M., López-Ruiz, J., Carmona, J., Doblas, M., 2009. Quantitative petrogeneticconstraints on the Pliocene alkali basaltic volcanism of the SE Spain VolcanicProvince. J. Volcanol. Geoth. Res. 185, 172–180.
Cebriá, J.M., López-Ruiz, J., 1995. Alkali basalts and leucitites in an extensional intra-continental plate setting: the Late Cenozoic Calatrava Volcanic Province (Central
Spain). Lithos 35, 27–46.Chiodini, G., Cioni, R., Guidi, M., Raco, B., Marini, L., 1998. Soil CO2 flux measurementsin volcanic and geothermal areas. Appl. Geochem. 13 (5), 543–552.
Cothern, R.C., Smith, J.E., 1987. Environmental Radon. Environmental ScienceResearch, vol. 35. Plenum Press, New York.
f Green
C
C
D
D
D
E
E
E
E
F
F
F
G
G
G
G
G
H
H
H
H
H
II
I
I
I
J
K
K
K
J. Elío et al. / International Journal o
ox, M.E., 1980. Ground radon surveys of a geothermal area in Hawaii. Geophys. Res.Lett. 7, 283–286.
respo, A., (Ph.D. thesis) 1992. Geología, mineralogía y génesis de los yacimientosde manganeso cobaltífero del Campo de Calatrava (Ciudad Real). UCM, pp. 389.
avis, B.M., Istok, J.D., Semprini, L., 2003. Static and push–pull methods usingradon-222 to characterize dense nonaqueous phase liquid. Groundwater 41,470–481.
e Jong, E., Acton, D.F., Kozak, L.M., 1994. Naturally occurring gamma-emitting iso-topes, radon release and properties of parent materials of Saskatchewan soils.Can. J. Soil Science 74, 47–53.
uenas, B.C., Fernández, M.C., 1987. Dependence of radon-222 flux on concentra-tions of soil gas and análisis of the effects produced by several atmosphericvariables. Ann. Geophys. 79, 5025–5029.
lío, J., Nisi, B., Ortega, M.F., Mazadiego, L.F., Vaselli, O., Grandía, F., 2013. CO2 soilflux baseline at the CO2 Injection pilot Plant of Hontomin (Burgos, Spain). Int. J.Greenh. Gas Control 18, 224–236.
PA, US, 2003. EPA Assessment of Risks from Radon in Homes. Office of Radiationand Indoor Air, United States Environmental Protection Agency, Washington,DC.
tiope, G., Martinelli, G., 2002. Migration of carrier and trace gases in the geosphere:an overview. Phys. Earth Planet. In. 129, 185–204.
tiope, G., Guerra, M., Raschi, A., 2005. Carbon dioxide and radon geohazards over agas-bearing fault in the Siena graben (Central Italy). Terr. Atmos. Ocean Sci. 16(4), 885–896.
ield, R.W., Steck, D.J., Smith, B.J., Brus, C.P., Fisher, E.L., Neuberger, J.S., Platz, C.E.,Robinson, R.A., Woolson, R.W., Lynch, F., 2000. Residential radon gas exposureand lung cancer. The Iowa radon lung cancer study. Am. J. Epidemiol. 151 (11),1091–1102.
leischer, R.L., 1997. Radon: overview of properties, origin and transport. In: Durrani,S.A., Ilic, R. (Eds.), Radon Measurements by Etched Track Detectors, Applicationsin Radiation Protection, Earth Sciences and the Environment. World Scientific,Singapore, pp. 1–20.
leischer, R.L., Mogro-Campero, A., 1978. Mapping of integrated radon emanationfor detection of long-distance migration of gases within the earth: techniquesand principles. J. Geophys. Res. 83 (B7), 3539–3549.
al, F., Brach, M., Braibant, G., Bény, C., Michel, K., 2012. What can be learned fromnatural analogue studies in view of CO2 leakage issues in Carbon Capture andStorage applications? Geochemical case study of Sainte-Marguerite area (FrenchMassif Central). Int. J. Greenh. Gas Control 10, 470–485.
arcía-González, J.E., Ortega, M.F., Chacón, E., Mazadiego, L.F., De Miguel, E., 2008.Field validation of radon monitoring as a screening methodology for NAPL-contaminated sites. Appl. Geochem. 23, 2753–2758.
iammanco, S., Sims, K.W.W., Neri, M., 2007. Measurements of 220Rn and 222Rn andCO2 emissions in soil and fumarole gases on Mt. Etna volcano (Italy): implica-tions for gas transport and shallow ground fracture. Geochem. Geophys. Geosyst.8 (10), 1–14.
orman-Lewis, D., Burns, P., Fein, J.B., 2008. Review of uranyl mineral solubilitymeasurements. J. Chem. Thermodyn. 40, 335–352.
uerra, M., Lombardi, S., 2001. Soil-gas method for tracing neotectonic faults in claybasins the Pisticci field (Southern Italy). Tectonophysics 339, 511–522.
ernández-Pacheco, F., 1932. Estudio de la región volcánica central de Espana. Mem.R. Acad. Cienc. Exactas Fis. Nat. Madr., Ser. Cienc. Nat. 3, 1–235.
olloway, S., Pearce, J.M., Hards, V.L., Ohsumi, T., Gale, J., 2007. Natural emissions ofCO2 from the geosphere and their bearing on the geological storage of carbondioxide. Energy 32, 1194–1201.
si, C.K.D., Langmuir, D., 1985. Adsorption of uranyl onto ferric oxyhydroxides:application of the surface complexation site-binding model. Geochim. Cos-mochim. Acta 49, 1931–1941.
uxol, S., Brennwald, M.S., Hoehn, E., Kipfer, R., 2012. On the fate of 220Rn in soilmaterial in dependence of water content: implications from field and laboratoryexperiments. Chem. Geol. 298–299, 116–122.
uxol, S., Brennwald, M.S., Kipfer, R., 2013. Processes controlling 220Rn concentra-tions in the gas and water phases of porous media. Chem. Geol. 335, 87–92.
EA, 2008. Energy Technology Perspectives. OECD/IEA, Paris.GME, 1988. Mapa Ceológico de Espana E: 1:50.000. Hoja n.◦ 784, Ciudad Real.
I.G.M.E, Madrid.oannides, K., Papachristodoulou, C., Stamoulis, K., Karamanis, D., Pavlides, S.,
Chatzipetros, A., Karakala, E., 2003. Soil gas radon: a tool for exploring activefault zones. Appl. Radiat. Isot. 59, 205–213.
PCC, 2005. In: Metz, B., Davidson, O., de Coninck, H.C., Loos, M., Meyer, L.A.(Eds.), IPCC Special Report on Carbon Dioxide Capture and Storage. Preparedby Working Group III of the Intergovernmental Panel on Climate Change.Cambridge University Press, Cambridge/United Kingdom/New York, NY, USA,p. 442.
PCC, 2006. In: National Greenhouse Gas Inventories Programme, Eggleston, H.S.,Buendia, L., Miwa, K., Ngara, T., Tanabe, K. (Eds.), Guidelines for National Green-house Gas Inventories. IGES, Japan.
eandel, E., Battani, A., Sarda, P., 2010. Lessons learned from natural and industrialanalogues for storage of carbon dioxide. Int. J. Greenh. Gas Control 4, 890–909.
ing, C.Y., Minissale, A., 1994. Seasonal variability of soil-gas radon concentration incentral California. Radiat. Meas. 23, 683–692.
lusman, R., Voorhees, K.J., 1983. A new development in petroleum explorationtechnology. Mines Mag. 73, 121–149.
lusman, R.W., 2011. Comparison of surface and near-surface geochemical meth-ods for detection of gas microseepage from carbon dioxide sequestration. Int. J.Greenh. Gas Control 5, 1369–1392.
house Gas Control 32 (2015) 1–14 13
Kühn, M., Busch, A., Niemi, A., Amann-Hildenbrand, A., 2013. Preface: CO2 storage isfeasible and further demonstration projects are needed. CO2 storage at the EGUgeneral assembly 2012. Int. J. Greenh. Gas Control 19, 606–608.
Langmuir, D., 1978. Uranium solution-mineral equilibria at low temperatureswith applications to sedimentary ore deposits. Geochim. Cosmochim. Acta 42,547–569.
Langmuir, D., Melchoir, D., 1985. The geochemistry of Ca, Sr, Ba and Ra sulfates insome deep brines from the Palo Duro Basin, Texas. Geochim. Cosmochim. Acta49, 2423–2432.
Langmuir, D., Riese, A.C., 1985. The thermodynamic properties of radium. Geochim.Cosmochim. Acta 49, 1593–1601.
Lewicki, J., Hilley, G., Fischer, M., Pan, L., Curtis, O., Dobeck, L., Spangler, L., 2009.Detection of CO2 leakage by eddy covariance during the ZERT project’s CO2
release experiments. Energy Procedia 1, 2301–2306.Lewicki, J., Birkholzer, J., Tsang, C.F., 2007. Natural and industrial analogues for
leakage of CO2 from storage reservoirs: identification of features, events, andprocesses and lessons learned. Environ. Geol. 52 (3), 457–467.
López-Ruiz, J., Cebriá, J.M., Doblas, M., 2002. Cenozoic volcanism I: the Iberian Penin-sula. In: Gibbons, W., Moreno, T. (Eds.), The Geology of Spain. Geological Society,London, pp. 417–438.
Lupion, M., Herzog, H.J., 2013. NER300: lessons learnt in attempting to secure CCSprojects in Europe. Int. J. Greenh. Gas Control 19, 19–25.
Majumdar, D., Roszak, S., Balasubramanian, K., Nitsche, H., 2003. Theoretical study ofaqueous uranyl carbonate (UO2CO3) and its hydrated complexes: UO2CO3·nH2O(n = 1−3). Chem. Phys. Lett. 372, 232–241.
Martin, P., Akber, R.A., 1999. Radium isotopes as indicators of adsorption–desorptioninteractions and barite formation in groundwater. J. Environ. Radioact. 46,271–286.
Martinelli, G., 1998. Gas geochemistry and 222Rn migration processes. Radiat. Prot.Dosim. 78 (1), 77–82.
Mazadiego, L.F., (Ph.D. thesis) 1994. Desarrollo de una metodología para la prospec-ción geoquímica en superfície de combustibles fósiles. Polytechnic University ofMadrid.
Melero Cabanas, D., 2007. Ciudad Real: tierra de hervideros, fuentes y banos de aguasminero-medicinales. Imprenta Provincial, Ciudad Real, pp. 254.
Michael, K., Golab, A., Shulakova, V., Ennis-King, J., Allinson, G., Sharma, S., Aiken, T.,2010. Geological storage of CO2 in saline aquifers—a review of the experiencefrom existing storage operations. Int. J. Greenh. Gas Control 4, 659–667.
Michel-Le Pierres, K., Gal, F., Brach, M., Guignat, S., 2010. Radon, helium and CO2 mea-surements in soils overlying a former exploited oilfield, Pechelbronn district,Bas-Rhin, France. J. Environ. Radioact. 10, 835–846.
Morse, J.G., Rana, M.H., Morse, L., 1982. Radon mapping as indicators of subsurfaceoil and gas. Oil Gas J. 80, 227–246.
Nance, H.S., Rauch, H., Strazisar, B., Bromhal, G., Wells, A., Diehl, R., Klusman, R.,Lewicki, J., Oldenburg, C., Kharaka, Y.K., Kakouros, E., 2005. Surface environ-mental monitoring at the Frio CO2 sequestration test site, Texas. In: NationalEnergy Technology Laboratory Fourth Annual Conference on Carbon Captureand Sequestration, Alexandria, VA, May 2–5, GCCC Digital Publication Series#05-04, pp. 1–16.
Nazaroff, W.W., Nero Jr., A.V., 1988. Radon and Its Decay Products in Indoor Air. JohnWiley & Sons, United States of America.
Nataly Echevarria Huaman, R., Xiu Jun, T., 2014. Energy related CO2 emissions andthe progress on CCS projects: a review. Renew. Sustain. Energy Rev. 31, 368–385.
NETL, DOE/NETL-311/081508 2009. Best Practices For: Monitoring, Verification, andAccounting of CO2 Stored in Deep Geologic Formations. National Energy Tech-nology Laboratory.
Nielson, D.L., IDO/78-1701.b.1.1.2 1978. Radon Emanometry as a Geothermal Explo-ration Technique: Theory and an Example from Roosevelt Hot Springs KGRA.University of Utah Research instituted, Earth Science Laboratory, Utah, Salt LakeCity.
Oldenburg, C.M., 2003. Carbon dioxide as cushion gas for natural gas storage. EnergyFuels 17, 240–246.
Oldenburg, C.M., 2012. Why we need the ‘and’ in ‘CO2 utilization and storage’.Greenh. Gas Sci. Technol. 2, 1–2, http://dx.doi.org/10.1002/ghg.1274.
Ortega, M.F., Rincones, M., Elío, J., Gutiérrez del Olmo, J., Nisi, B., Mazadiego, L.F.,Iglesias, L., Vaselli, O., Grandia, F., García, R., De la Vega, R., Llamas, B., 2014.Gas monitoring methodology and application to CCS projects as defined byatmospheric and remote sensing survey in the natural analogue of Campo deCalatrava. Global NEST J. 16 (2), 269–279.
Pearce, J.M., 2006. What can we learn from natural analogues? In: Lombardi, S.,Altunina, L.K., Beaubien, S.E. (Eds.), Advances in the Geological Storage of CarbonDioxide. Springer, Netherlands, pp. 129–140.
Pérez, N.M., Nakai, S., Wakita, H., Albert-Bertan, J.F., Redondo, R., 1996. Preliminaryresults on the 3He/4He isotopic ratios in terrestrial fluids from Iberian Peninsula:seismotectonic and neotectonic implications. Geogaceta 20, 830–833.
Piedrabuena, M.A.P., 1992. Las última manifestaciones asociadas al vulcanismo delCampo de Calatrava (Ciudad Real): los manantiales termales. Cuadernos de Sec-ción Historia 20, 187–201.
Quindós, L.S., Sainz, C., Fuente, I., Nicolás, J., Quindós, L., Arteche, J., 2006. Correctionby self-attenuation in gamma-ray spectrometry for environmental samples. J.Radioanal. Nucl. Chem. 270 (2), 339–343.
Ramachandan, T.V., Sathish, L.A., 2011. Nationwide indoor 222Rn and 220Rn map forIndia: a review. J. Environ. Radioact. 102, 975–986.
Riding, J.B., Rochelle, C.A., 2005. The IEA Weyburn CO2 Monitoring and StorageProject. Final Report of the European Research Team. British Geological SurveyResearch Report, RR/05/03., pp. 54.
1 f Gree
R
R
R
S
S
S
S
S
S
T
4 J. Elío et al. / International Journal o
omanak, K., Harmon, R., Kharaka, Y., 2013. Editorial: geochemical aspects of geo-logic carbon storage. Appl. Geochem. 30, 1–3.
osario, A.S., Wichmann, H.-E., 2006. Environmental pollutants: radon. In: Encyclo-pedia of Respiratory Medicine., pp. 120–125.
ose, A.W., Hawkes, H.E., Webb, J.S., 1979. Geochemistry in mineral exploration, 2nded. Academic Press.
chlömer, S., Möller, I., Furch, M., 2014. Baseline soil gas measurements as part ofa monitoring concept above a projected CO2 injection formation—a case studyfrom Northern Germany. Int. J. Greenh. Gas Control 20, 57–72.
chubert, M., Freyer, K., Treutler, H.C., Weitb, H., 2001. Using the soil gas radon asan indicator for ground contamination by non-aqueous phase-liquids. J. SoilsSediments 1 (4), 217–222.
olomon, S., Carpenter, M., Flach, T.A., 2008. Intermediate storage of carbon dioxidein geological formations: a technical perspective. Int. J. Greenh. Gas Control 2,502–510.
trutt, M.H., Beaubien, S.E., Beaubron, J.C., Brach, M., Cardellini, C., Granieri, R., Jones,D.G., Lombardi, S., Penner, L., Quattocchi, F., Voltatorni, N., 2003. Soil gas as amonitoring tool of deep geological sequestration of carbon dioxide: preliminaryresults from the Encana EOR Project in Weyburn, Saskatcewan (Canada). Greenh.Gas Control Technol. 1, 391–395.
utton, W., Soonwala N., 1975. A Soil Radium Method for Uranium Prospecting.Mineral Exploration 5.
zabó, K.Z., Jordan, G., Horváth, Á., Szabó, Cs., 2013. Dynamics of soil gas radonconcentration in a highly permeable soil based on a long-term high temporal
resolution observation series. J. Environ. Radioact. 124, 74–83.anner, A.B., 1980. Radon migration in the ground: supplementary review. In: Gesell,T.F., Lowder, W.M. (Eds.), Proc. Natural Radiation Environment III, Conf.-780422.US Dept. of Commerce, National Technical Information Service, Springfield, VA,p. 5.
nhouse Gas Control 32 (2015) 1–14
Toutain, J.P., Baubron, J.C., 1999. Gas geochemistry and seismotectonics: a review.Tectonophysics 304, 1–27.
UNFCCC, 2011. Conference of the Parties Serving as the Meeting of the Parties to theKyoto Protocol. FCCC/KP/CMP/20017L.4. United Nations Framework Conventionon Climate Change (UNFCCC), Durban.
Van der Zwaan, B., Smekens, K., 2006. CO2 capture and storage with leakage in anenergy-climate model. Environ. Model. Assess. 14 (2), 135–148.
Vaselli, O., Nisi, B., Tassi, F., Giannini, L., Grandia, F., Darrah, T., Capecchiacci, F.,Perez del Villar, L., 2013. Water and gas geochemistry of the Calatrava VolcanicProvince (CVP) hydrothermal system (Ciudad Real, Central Spain). GeophysicalResearch Abstracts, 10th EGU General Assembly, EGU2013-11102.
Vaupotic, J., Barisic, D., Kobal, I., Lulic, S., 2007. Radioactivity and radon potential ofthe terra rossa soil. Radiat. Meas. 42, 290–297.
Virk, H.S., Walia, V., 2001. Helium/radon precursory signals of Chamoli Earthquake,India. Radiat. Meas. 34, 379–384.
Voltattorni, N., Sciarra, A., Caramanna, G., Cinti, D., Pizzino, L., Quattrocchi, F., 2009.Gas geochemistry of natural analogues for the studies of geological CO2 seques-tration. Appl. Geochem. 24, 1339–1346.
Walia, V., Lin, S.J., Fu, C.C., Yang, T.F., Hong, W., Wen, K., Chen, C., 2010. Soil-gasmonitoring: a tool for fault delineation studies along Hsinhua Fault (Tainan),Southern Taiwan. Appl. Geochem. 25, 602–607.
Wilson, M., Monea, M., 2004. IEA GHG Weyburn CO2 monitoring and storage project,summary report 2000–2004. In: Proceedings of the 7th International Confer-ence on Greenhouse Gas Control Technologies, Petroleum Technology Research
Centre, Vancouver, Canada.Yu, C., Loureiro, C., Cheng, J.-J., Jones, L.G., Wang, Y.Y., Chia, Y.P., Faillace, E., 1993.Data Collection Handbook to Support Modeling Impacts of Radioactive Materialsin Soil. Environmental Assessment and Information Sciences Division, ArgonneNational Laboratory, Argonne, IL.