CMAP Community Data Snapshot | Glencoe - Chicago ...
20
Glencoe Community Data Snapshot Municipality Series August 2021 Release 1
-
Upload
khangminh22 -
Category
Documents
-
view
0 -
download
0
Transcript of CMAP Community Data Snapshot | Glencoe - Chicago ...
GlencoeCommunity Data SnapshotMunicipality SeriesAugust 2021 Release
1
Community Data Snapshot | Glencoe
About the Community Data SnapshotsThe Community Data Snapshots is a series of data profiles for every county, municipality, and Chicago Community Area (CCA)within the Chicago Metropolitan Agency for Planning (CMAP) seven-county northeastern Illinois region. The snapshots primarilyfeature data from the American Community Survey (ACS) five-year estimates, although other data sources include the U.S.Census Bureau, Illinois Environmental Protection Agency (IEPA), Illinois Department of Employment Security (IDES), IllinoisDepartment of Revenue (IDR), HERE Technologies, and CMAP itself.
CMAP publishes updated Community Data Snapshots annually to reflect the most recent data available. The latest version canalways be found at cmap.illinois.gov/data/community-snapshots. The underlying data can be downloaded from the CMAP DataHub. Please direct any inquiries to [email protected].
To improve the Community Data Snapshots in the future, CMAP wants to hear from you! Please take a quick survey to describehow you use this data and what you would like to see in next year’s snapshots.
User Notes
DefinitionsFor data derived from the ACS, the Community Data Snapshots uses terminology based on the ACS subject definitions.
Margins of ErrorThe ACS is a sample-based data product. Exercise caution when using data from low-population communities, as the margins oferror are often large compared to the estimates. For more details, please refer to the ACS sample size and data qualitymethodology.
Regional ValuesRegional values are estimated by aggregating ACS data for the seven counties that compose the CMAP region. These countiesare Cook, DuPage, Kane, Kendall, Lake, McHenry, and Will.
Median ValuesThe Census Bureau encourages users to aggregate small levels of geographies into larger areas to estimate median values forthose areas. Median values for the aggregated geographies (CCAs and the CMAP region) are estimated from the groupedfrequency distributions reported in the ACS.
Municipalities Located in Multiple CountiesCounty data is presented for the CMAP county containing the largest portion (by area) of the municipality.
Municipalities That Extend Beyond the CMAP RegionValues derived from CMAP analyses are generally restricted to geographies that fall within the CMAP regional boundaries.Specifically, values in the General Land Use, Equalized Assesed Value, Park Access, Transit Availability, Walkability, WaterSupply, and ON TO 2050 Indicators tables only represent the portion of each municipality that falls within the seven-countyCMAP region. This snapshot is for Glencoe, which does not extend beyond the CMAP region.
2
Community Data Snapshot | Glencoe
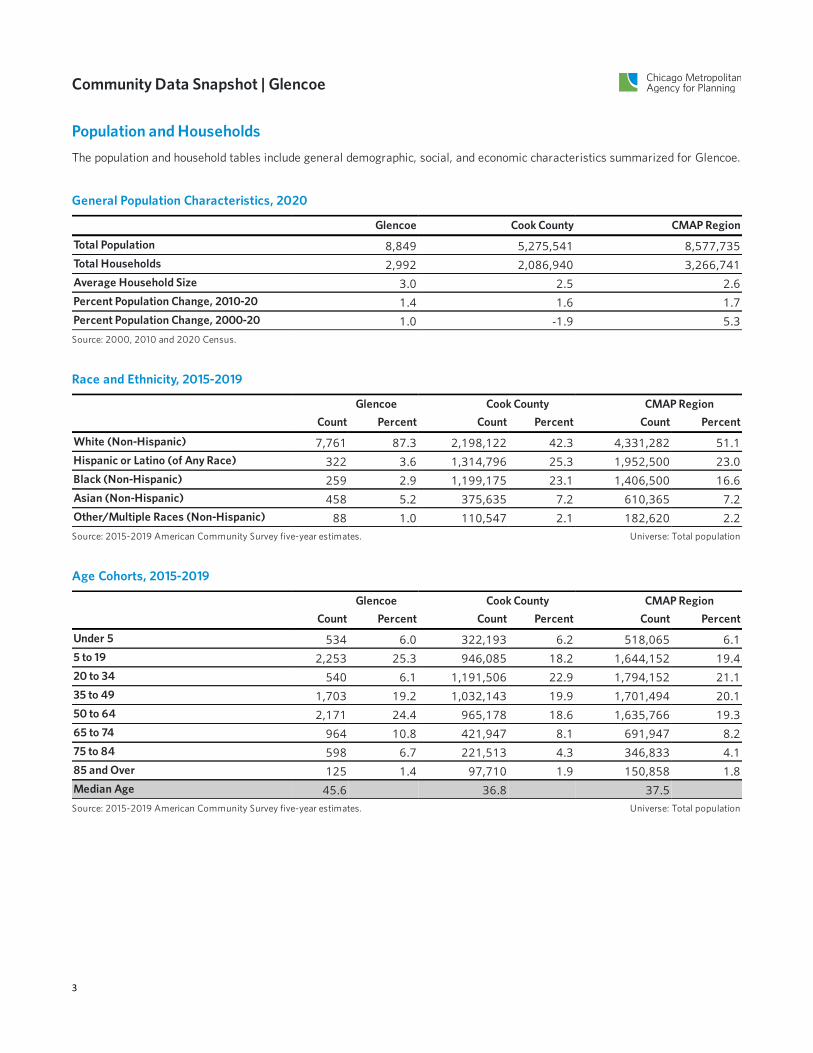
Population and HouseholdsThe population and household tables include general demographic, social, and economic characteristics summarized for Glencoe.
General Population Characteristics, 2020
Glencoe Cook County CMAP Region
Total Population 8,849 5,275,541 8,577,735Total Households 2,992 2,086,940 3,266,741Average Household Size 3.0 2.5 2.6Percent Population Change, 2010-20 1.4 1.6 1.7Percent Population Change, 2000-20 1.0 -1.9 5.3Source: 2000, 2010 and 2020 Census.
Race and Ethnicity, 2015-2019
Glencoe Cook County CMAP RegionCount Percent Count Percent Count Percent
White (Non-Hispanic) 7,761 87.3 2,198,122 42.3 4,331,282 51.1Hispanic or Latino (of Any Race) 322 3.6 1,314,796 25.3 1,952,500 23.0Black (Non-Hispanic) 259 2.9 1,199,175 23.1 1,406,500 16.6Asian (Non-Hispanic) 458 5.2 375,635 7.2 610,365 7.2Other/Multiple Races (Non-Hispanic) 88 1.0 110,547 2.1 182,620 2.2Source: 2015-2019 American Community Survey five-year estimates. Universe: Total population
Age Cohorts, 2015-2019
Glencoe Cook County CMAP RegionCount Percent Count Percent Count Percent
Under 5 534 6.0 322,193 6.2 518,065 6.15 to 19 2,253 25.3 946,085 18.2 1,644,152 19.420 to 34 540 6.1 1,191,506 22.9 1,794,152 21.135 to 49 1,703 19.2 1,032,143 19.9 1,701,494 20.150 to 64 2,171 24.4 965,178 18.6 1,635,766 19.365 to 74 964 10.8 421,947 8.1 691,947 8.275 to 84 598 6.7 221,513 4.3 346,833 4.185 and Over 125 1.4 97,710 1.9 150,858 1.8Median Age 45.6 36.8 37.5Source: 2015-2019 American Community Survey five-year estimates. Universe: Total population
3
Community Data Snapshot | Glencoe
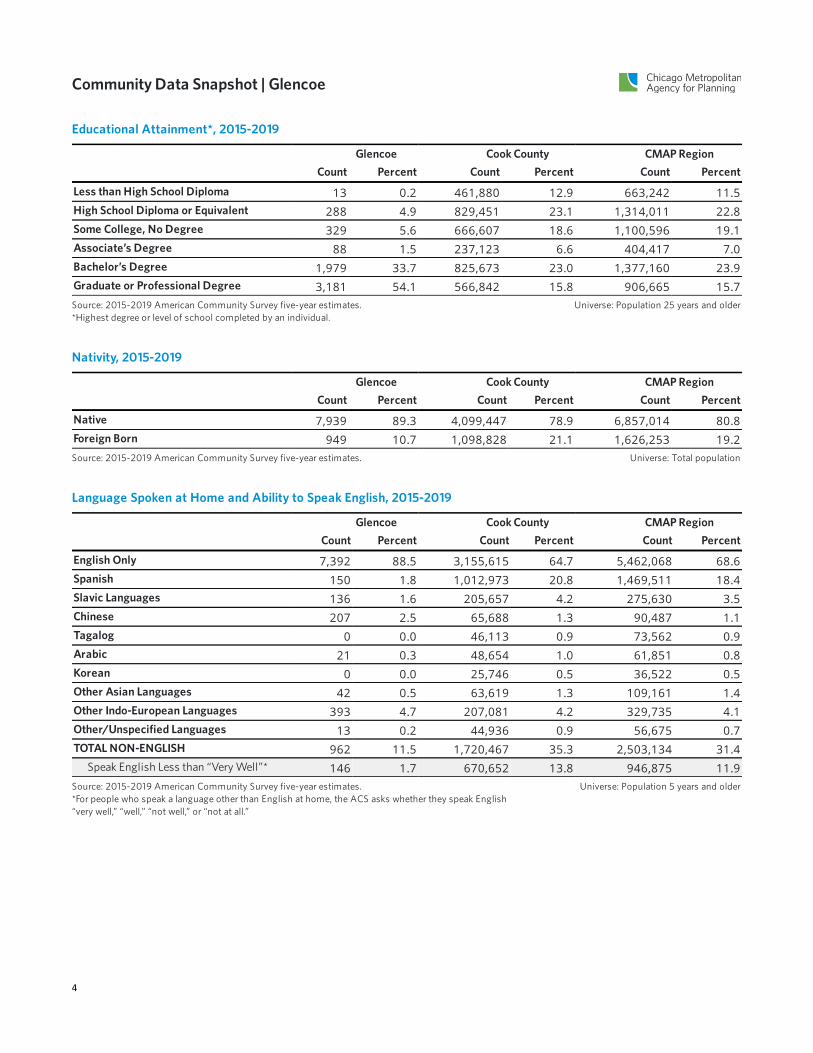
Educational Attainment*, 2015-2019
Glencoe Cook County CMAP RegionCount Percent Count Percent Count Percent
Less than High School Diploma 13 0.2 461,880 12.9 663,242 11.5High School Diploma or Equivalent 288 4.9 829,451 23.1 1,314,011 22.8Some College, No Degree 329 5.6 666,607 18.6 1,100,596 19.1Associate’s Degree 88 1.5 237,123 6.6 404,417 7.0Bachelor’s Degree 1,979 33.7 825,673 23.0 1,377,160 23.9Graduate or Professional Degree 3,181 54.1 566,842 15.8 906,665 15.7Source: 2015-2019 American Community Survey five-year estimates.*Highest degree or level of school completed by an individual.
Universe: Population 25 years and older
Nativity, 2015-2019
Glencoe Cook County CMAP RegionCount Percent Count Percent Count Percent
Native 7,939 89.3 4,099,447 78.9 6,857,014 80.8Foreign Born 949 10.7 1,098,828 21.1 1,626,253 19.2Source: 2015-2019 American Community Survey five-year estimates. Universe: Total population
Language Spoken at Home and Ability to Speak English, 2015-2019
Glencoe Cook County CMAP RegionCount Percent Count Percent Count Percent
English Only 7,392 88.5 3,155,615 64.7 5,462,068 68.6Spanish 150 1.8 1,012,973 20.8 1,469,511 18.4Slavic Languages 136 1.6 205,657 4.2 275,630 3.5Chinese 207 2.5 65,688 1.3 90,487 1.1Tagalog 0 0.0 46,113 0.9 73,562 0.9Arabic 21 0.3 48,654 1.0 61,851 0.8Korean 0 0.0 25,746 0.5 36,522 0.5Other Asian Languages 42 0.5 63,619 1.3 109,161 1.4Other Indo-European Languages 393 4.7 207,081 4.2 329,735 4.1Other/Unspecified Languages 13 0.2 44,936 0.9 56,675 0.7TOTAL NON-ENGLISH 962 11.5 1,720,467 35.3 2,503,134 31.4
Speak English Less than “Very Well”* 146 1.7 670,652 13.8 946,875 11.9Source: 2015-2019 American Community Survey five-year estimates.*For people who speak a language other than English at home, the ACS asks whether they speak English“very well,” “well,” “not well,” or “not at all.”
Universe: Population 5 years and older
4
Community Data Snapshot | Glencoe
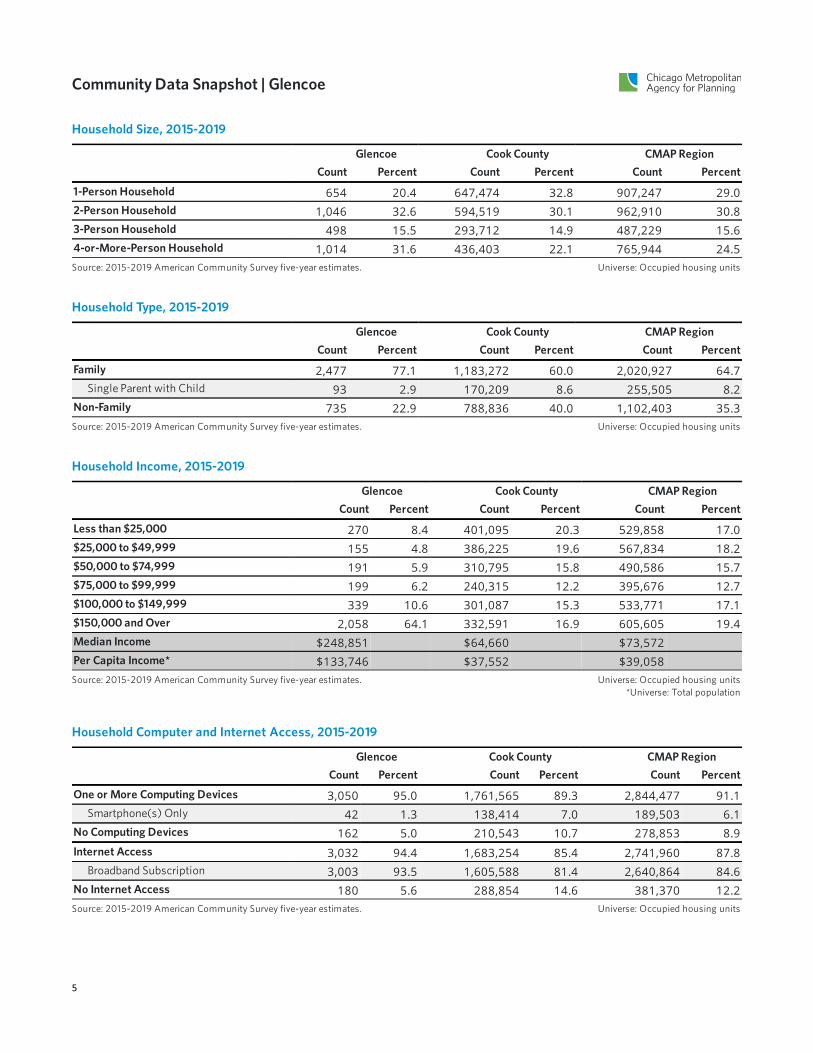
Household Size, 2015-2019
Glencoe Cook County CMAP RegionCount Percent Count Percent Count Percent
1-Person Household 654 20.4 647,474 32.8 907,247 29.02-Person Household 1,046 32.6 594,519 30.1 962,910 30.83-Person Household 498 15.5 293,712 14.9 487,229 15.64-or-More-Person Household 1,014 31.6 436,403 22.1 765,944 24.5Source: 2015-2019 American Community Survey five-year estimates. Universe: Occupied housing units
Household Type, 2015-2019
Glencoe Cook County CMAP RegionCount Percent Count Percent Count Percent
Family 2,477 77.1 1,183,272 60.0 2,020,927 64.7Single Parent with Child 93 2.9 170,209 8.6 255,505 8.2
Non-Family 735 22.9 788,836 40.0 1,102,403 35.3Source: 2015-2019 American Community Survey five-year estimates. Universe: Occupied housing units
Household Income, 2015-2019
Glencoe Cook County CMAP RegionCount Percent Count Percent Count Percent
Less than $25,000 270 8.4 401,095 20.3 529,858 17.0$25,000 to $49,999 155 4.8 386,225 19.6 567,834 18.2$50,000 to $74,999 191 5.9 310,795 15.8 490,586 15.7$75,000 to $99,999 199 6.2 240,315 12.2 395,676 12.7$100,000 to $149,999 339 10.6 301,087 15.3 533,771 17.1$150,000 and Over 2,058 64.1 332,591 16.9 605,605 19.4Median Income $248,851 $64,660 $73,572Per Capita Income* $133,746 $37,552 $39,058Source: 2015-2019 American Community Survey five-year estimates. Universe: Occupied housing units
*Universe: Total population
Household Computer and Internet Access, 2015-2019
Glencoe Cook County CMAP RegionCount Percent Count Percent Count Percent
One or More Computing Devices 3,050 95.0 1,761,565 89.3 2,844,477 91.1Smartphone(s) Only 42 1.3 138,414 7.0 189,503 6.1
No Computing Devices 162 5.0 210,543 10.7 278,853 8.9Internet Access 3,032 94.4 1,683,254 85.4 2,741,960 87.8
Broadband Subscription 3,003 93.5 1,605,588 81.4 2,640,864 84.6No Internet Access 180 5.6 288,854 14.6 381,370 12.2Source: 2015-2019 American Community Survey five-year estimates. Universe: Occupied housing units
5
Community Data Snapshot | Glencoe
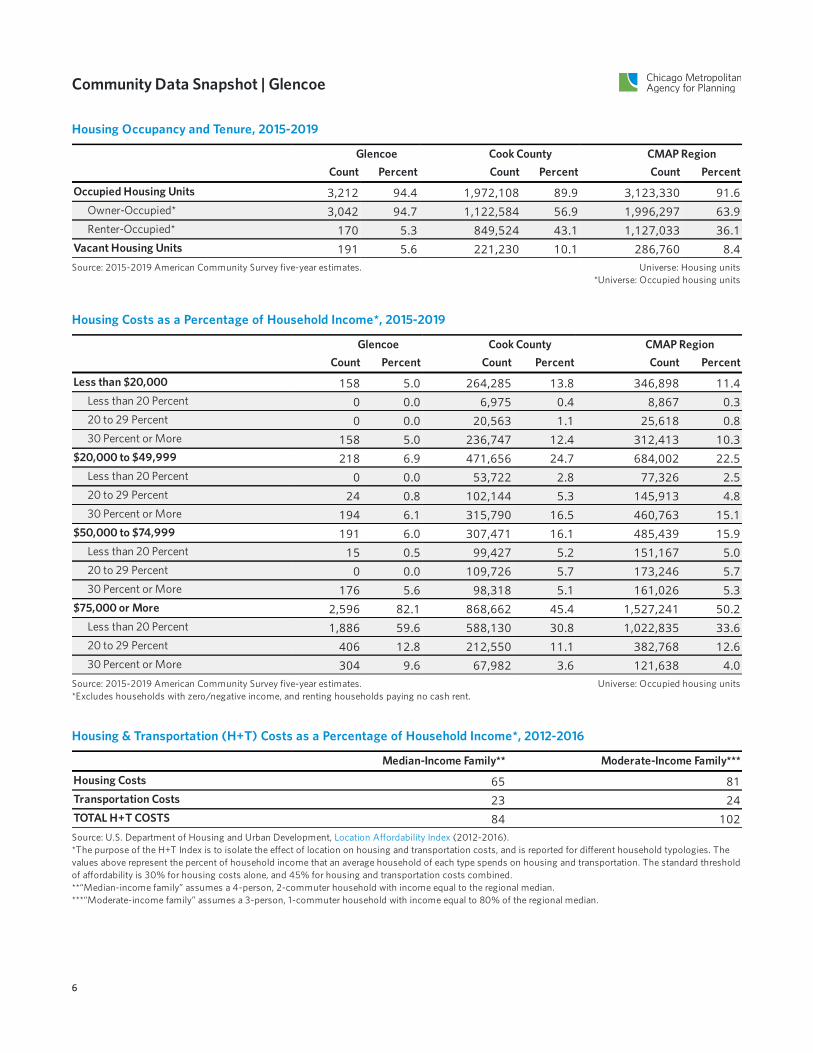
Housing Occupancy and Tenure, 2015-2019
Glencoe Cook County CMAP RegionCount Percent Count Percent Count Percent
Occupied Housing Units 3,212 94.4 1,972,108 89.9 3,123,330 91.6Owner-Occupied* 3,042 94.7 1,122,584 56.9 1,996,297 63.9Renter-Occupied* 170 5.3 849,524 43.1 1,127,033 36.1
Vacant Housing Units 191 5.6 221,230 10.1 286,760 8.4Source: 2015-2019 American Community Survey five-year estimates. Universe: Housing units
*Universe: Occupied housing units
Housing Costs as a Percentage of Household Income*, 2015-2019
Glencoe Cook County CMAP RegionCount Percent Count Percent Count Percent
Less than $20,000 158 5.0 264,285 13.8 346,898 11.4Less than 20 Percent 0 0.0 6,975 0.4 8,867 0.320 to 29 Percent 0 0.0 20,563 1.1 25,618 0.830 Percent or More 158 5.0 236,747 12.4 312,413 10.3
$20,000 to $49,999 218 6.9 471,656 24.7 684,002 22.5Less than 20 Percent 0 0.0 53,722 2.8 77,326 2.520 to 29 Percent 24 0.8 102,144 5.3 145,913 4.830 Percent or More 194 6.1 315,790 16.5 460,763 15.1
$50,000 to $74,999 191 6.0 307,471 16.1 485,439 15.9Less than 20 Percent 15 0.5 99,427 5.2 151,167 5.020 to 29 Percent 0 0.0 109,726 5.7 173,246 5.730 Percent or More 176 5.6 98,318 5.1 161,026 5.3
$75,000 or More 2,596 82.1 868,662 45.4 1,527,241 50.2Less than 20 Percent 1,886 59.6 588,130 30.8 1,022,835 33.620 to 29 Percent 406 12.8 212,550 11.1 382,768 12.630 Percent or More 304 9.6 67,982 3.6 121,638 4.0
Source: 2015-2019 American Community Survey five-year estimates.*Excludes households with zero/negative income, and renting households paying no cash rent.
Universe: Occupied housing units
Housing & Transportation (H+T) Costs as a Percentage of Household Income*, 2012-2016
Median-Income Family** Moderate-Income Family***
Housing Costs 65 81Transportation Costs 23 24TOTAL H+T COSTS 84 102Source: U.S. Department of Housing and Urban Development, Location Affordability Index (2012-2016).*The purpose of the H+T Index is to isolate the effect of location on housing and transportation costs, and is reported for different household typologies. Thevalues above represent the percent of household income that an average household of each type spends on housing and transportation. The standard thresholdof affordability is 30% for housing costs alone, and 45% for housing and transportation costs combined.**“Median-income family” assumes a 4-person, 2-commuter household with income equal to the regional median.***“Moderate-income family” assumes a 3-person, 1-commuter household with income equal to 80% of the regional median.
6
Community Data Snapshot | Glencoe
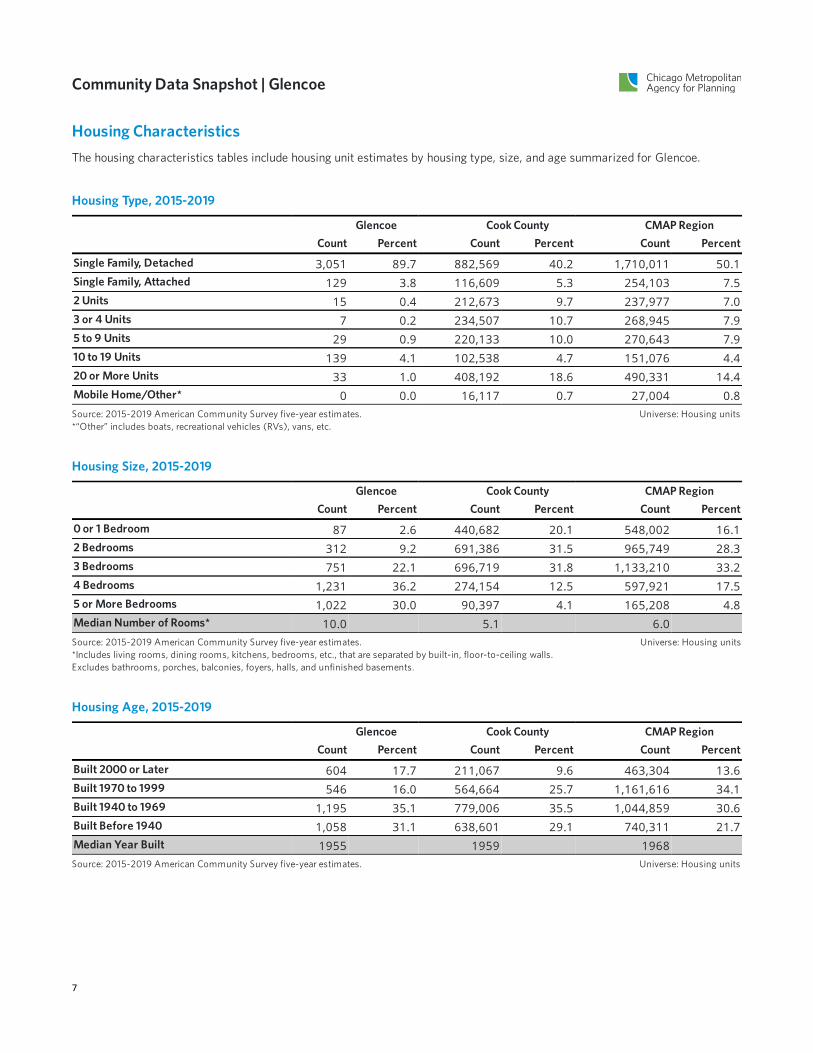
Housing CharacteristicsThe housing characteristics tables include housing unit estimates by housing type, size, and age summarized for Glencoe.
Housing Type, 2015-2019
Glencoe Cook County CMAP RegionCount Percent Count Percent Count Percent
Single Family, Detached 3,051 89.7 882,569 40.2 1,710,011 50.1Single Family, Attached 129 3.8 116,609 5.3 254,103 7.52 Units 15 0.4 212,673 9.7 237,977 7.03 or 4 Units 7 0.2 234,507 10.7 268,945 7.95 to 9 Units 29 0.9 220,133 10.0 270,643 7.910 to 19 Units 139 4.1 102,538 4.7 151,076 4.420 or More Units 33 1.0 408,192 18.6 490,331 14.4Mobile Home/Other* 0 0.0 16,117 0.7 27,004 0.8Source: 2015-2019 American Community Survey five-year estimates.*“Other” includes boats, recreational vehicles (RVs), vans, etc.
Universe: Housing units
Housing Size, 2015-2019
Glencoe Cook County CMAP RegionCount Percent Count Percent Count Percent
0 or 1 Bedroom 87 2.6 440,682 20.1 548,002 16.12 Bedrooms 312 9.2 691,386 31.5 965,749 28.33 Bedrooms 751 22.1 696,719 31.8 1,133,210 33.24 Bedrooms 1,231 36.2 274,154 12.5 597,921 17.55 or More Bedrooms 1,022 30.0 90,397 4.1 165,208 4.8Median Number of Rooms* 10.0 5.1 6.0Source: 2015-2019 American Community Survey five-year estimates.*Includes living rooms, dining rooms, kitchens, bedrooms, etc., that are separated by built-in, floor-to-ceiling walls.Excludes bathrooms, porches, balconies, foyers, halls, and unfinished basements.
Universe: Housing units
Housing Age, 2015-2019
Glencoe Cook County CMAP RegionCount Percent Count Percent Count Percent
Built 2000 or Later 604 17.7 211,067 9.6 463,304 13.6Built 1970 to 1999 546 16.0 564,664 25.7 1,161,616 34.1Built 1940 to 1969 1,195 35.1 779,006 35.5 1,044,859 30.6Built Before 1940 1,058 31.1 638,601 29.1 740,311 21.7Median Year Built 1955 1959 1968Source: 2015-2019 American Community Survey five-year estimates. Universe: Housing units
7

Community Data Snapshot | Glencoe
TransportationThe transportation tables include vehicle availability by household, mode of travel to work, annual vehicle miles traveled, andtransit availability for Glencoe.
Vehicles Available per Household, 2015-2019
Glencoe Cook County CMAP RegionCount Percent Count Percent Count Percent
No Vehicle Available 136 4.2 351,428 17.8 399,783 12.81 Vehicle Available 826 25.7 798,186 40.5 1,111,243 35.62 Vehicles Available 1,608 50.1 588,020 29.8 1,098,207 35.23 or More Vehicles Available 642 20.0 234,474 11.9 514,097 16.5Source: 2015-2019 American Community Survey five-year estimates. Universe: Occupied housing units
Mode of Travel to Work, 2015-2019
Glencoe Cook County CMAP RegionCount Percent Count Percent Count Percent
Work at Home* 315 8.4 123,570 4.9 226,183 5.4Drive Alone 2,203 58.7 1,539,061 61.1 2,865,893 68.4Carpool 179 4.8 200,588 8.0 323,457 7.7Transit 979 26.1 480,559 19.1 557,002 13.3Walk or Bike 40 1.1 136,631 5.4 164,065 3.9Other 34 0.9 37,304 1.5 53,525 1.3TOTAL COMMUTERS 3,435 91.6 2,394,143 95.1 3,963,942 94.6Mean Commute Time (Minutes) 40.8 33.4 32.5Source: 2015-2019 American Community Survey five-year estimates.*Not included in total commuters or mean commute time.
Universe: Workers 16 years and older
Annual Vehicle Miles Traveled per Household*, 2017
Glencoe Cook County CMAP Region
Average Vehicle Miles Traveled per Year 21,183 14,123 17,165Source: Chicago Metropolitan Agency for Planning analysis of 2017 Illinois Environmental Protection Agency, HERE Technologies, and U.S. Census Bureaudata.*Data not available for all communities in the CMAP region.
Transit Availability of Resident and Job Locations*, 2017
Glencoe Cook County CMAP Region
High Transit Availability 80.3% 79.3% 53.9%Moderate Transit Availability 0.0% 12.2% 20.6%Low Transit Availability 19.7% 8.5% 25.5%Source: Chicago Metropolitan Agency for Planning analysis of the 2017 Transit Availability Index.*The CMAP Transit Availability Index is based on four factors: frequency of transit service, proximity to transit stops, activities reachable without a transfer, andpedestrian friendliness. This table reports the share of residents plus jobs whose home and workplace locations, respectively, are within each Transit AvailabilityIndex category.
8
Community Data Snapshot | Glencoe
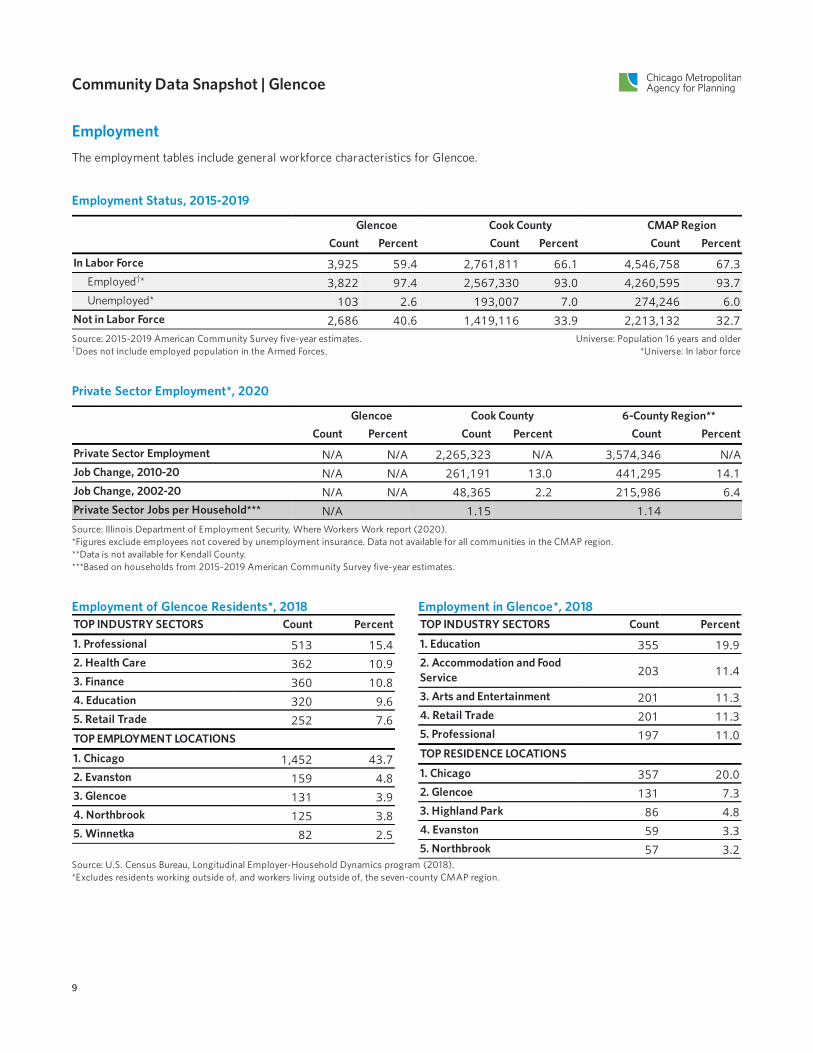
EmploymentThe employment tables include general workforce characteristics for Glencoe.
Employment Status, 2015-2019
Glencoe Cook County CMAP RegionCount Percent Count Percent Count Percent
In Labor Force 3,925 59.4 2,761,811 66.1 4,546,758 67.3Employed * 3,822 97.4 2,567,330 93.0 4,260,595 93.7Unemployed* 103 2.6 193,007 7.0 274,246 6.0
Not in Labor Force 2,686 40.6 1,419,116 33.9 2,213,132 32.7
†
Source: 2015-2019 American Community Survey five-year estimates.Does not include employed population in the Armed Forces.†
Universe: Population 16 years and older*Universe: In labor force
Private Sector Employment*, 2020
Glencoe Cook County 6-County Region**Count Percent Count Percent Count Percent
Private Sector Employment N/A N/A 2,265,323 N/A 3,574,346 N/AJob Change, 2010-20 N/A N/A 261,191 13.0 441,295 14.1Job Change, 2002-20 N/A N/A 48,365 2.2 215,986 6.4Private Sector Jobs per Household*** N/A 1.15 1.14Source: Illinois Department of Employment Security, Where Workers Work report (2020).*Figures exclude employees not covered by unemployment insurance. Data not available for all communities in the CMAP region.**Data is not available for Kendall County.***Based on households from 2015-2019 American Community Survey five-year estimates.
Employment of Glencoe Residents*, 2018 Employment in Glencoe*, 2018TOP INDUSTRY SECTORS Count Percent
1. Professional 513 15.42. Health Care 362 10.93. Finance 360 10.84. Education 320 9.65. Retail Trade 252 7.6TOP EMPLOYMENT LOCATIONS
1. Chicago 1,452 43.72. Evanston 159 4.83. Glencoe 131 3.94. Northbrook 125 3.85. Winnetka 82 2.5
TOP INDUSTRY SECTORS Count Percent
1. Education 355 19.92. Accommodation and FoodService 203 11.4
3. Arts and Entertainment 201 11.34. Retail Trade 201 11.35. Professional 197 11.0TOP RESIDENCE LOCATIONS
1. Chicago 357 20.02. Glencoe 131 7.33. Highland Park 86 4.84. Evanston 59 3.35. Northbrook 57 3.2
Source: U.S. Census Bureau, Longitudinal Employer-Household Dynamics program (2018).*Excludes residents working outside of, and workers living outside of, the seven-county CMAP region.
9
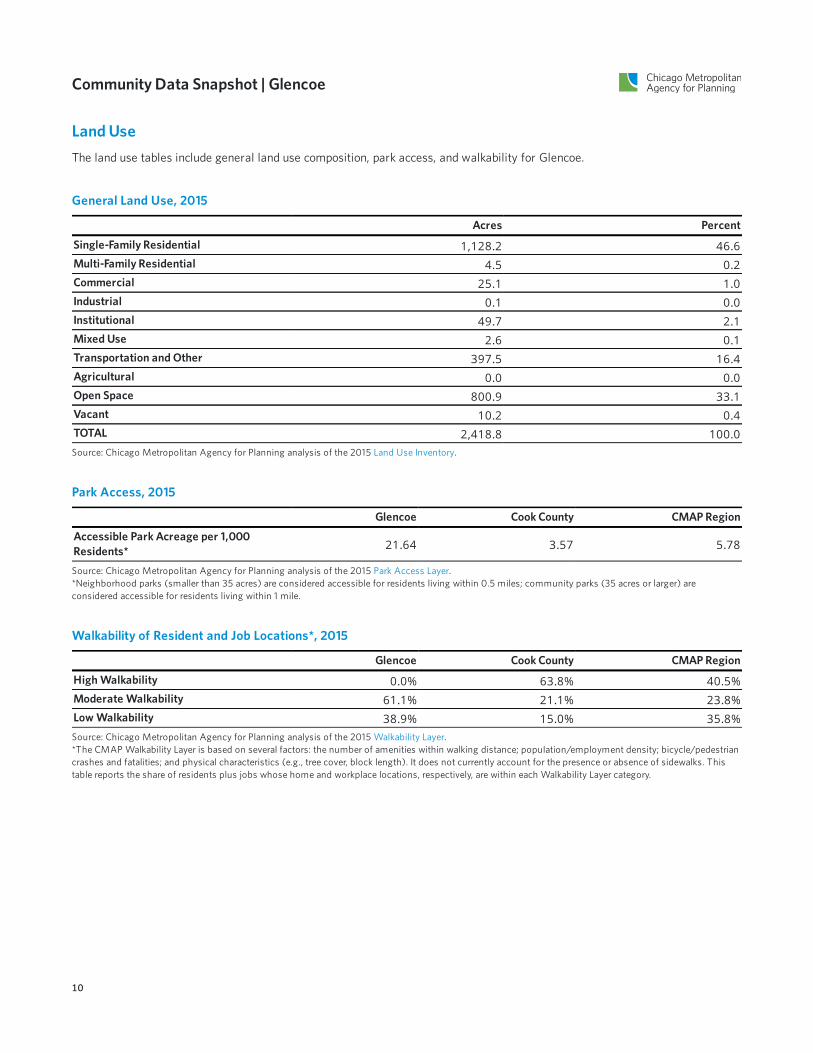
Community Data Snapshot | Glencoe
Land UseThe land use tables include general land use composition, park access, and walkability for Glencoe.
General Land Use, 2015
Acres Percent
Single-Family Residential 1,128.2 46.6Multi-Family Residential 4.5 0.2Commercial 25.1 1.0Industrial 0.1 0.0Institutional 49.7 2.1Mixed Use 2.6 0.1Transportation and Other 397.5 16.4Agricultural 0.0 0.0Open Space 800.9 33.1Vacant 10.2 0.4TOTAL 2,418.8 100.0Source: Chicago Metropolitan Agency for Planning analysis of the 2015 Land Use Inventory.
Park Access, 2015
Glencoe Cook County CMAP Region
Accessible Park Acreage per 1,000Residents* 21.64 3.57 5.78
Source: Chicago Metropolitan Agency for Planning analysis of the 2015 Park Access Layer.*Neighborhood parks (smaller than 35 acres) are considered accessible for residents living within 0.5 miles; community parks (35 acres or larger) areconsidered accessible for residents living within 1 mile.
Walkability of Resident and Job Locations*, 2015
Glencoe Cook County CMAP Region
High Walkability 0.0% 63.8% 40.5%Moderate Walkability 61.1% 21.1% 23.8%Low Walkability 38.9% 15.0% 35.8%Source: Chicago Metropolitan Agency for Planning analysis of the 2015 Walkability Layer.*The CMAP Walkability Layer is based on several factors: the number of amenities within walking distance; population/employment density; bicycle/pedestriancrashes and fatalities; and physical characteristics (e.g., tree cover, block length). It does not currently account for the presence or absence of sidewalks. Thistable reports the share of residents plus jobs whose home and workplace locations, respectively, are within each Walkability Layer category.
10
Community Data Snapshot | Glencoe
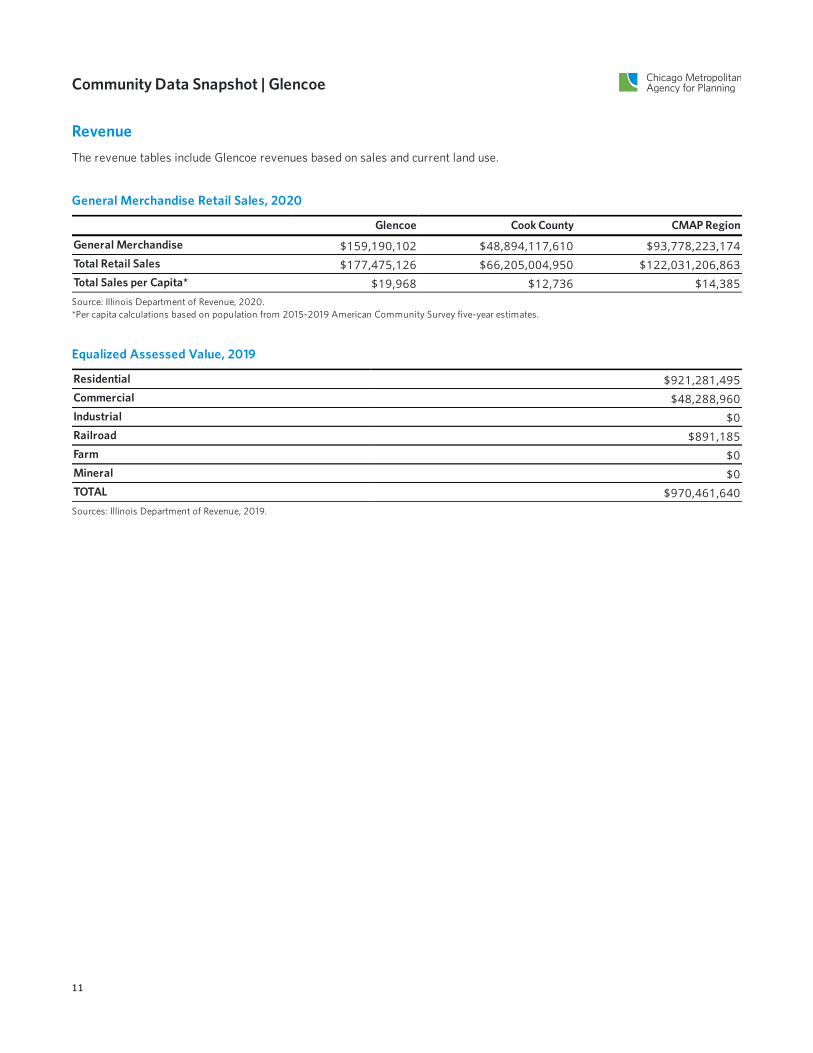
RevenueThe revenue tables include Glencoe revenues based on sales and current land use.
General Merchandise Retail Sales, 2020
Glencoe Cook County CMAP Region
General Merchandise $159,190,102 $48,894,117,610 $93,778,223,174Total Retail Sales $177,475,126 $66,205,004,950 $122,031,206,863Total Sales per Capita* $19,968 $12,736 $14,385Source: Illinois Department of Revenue, 2020.*Per capita calculations based on population from 2015-2019 American Community Survey five-year estimates.
Equalized Assessed Value, 2019
Residential $921,281,495Commercial $48,288,960Industrial $0Railroad $891,185Farm $0Mineral $0TOTAL $970,461,640Sources: Illinois Department of Revenue, 2019.
11
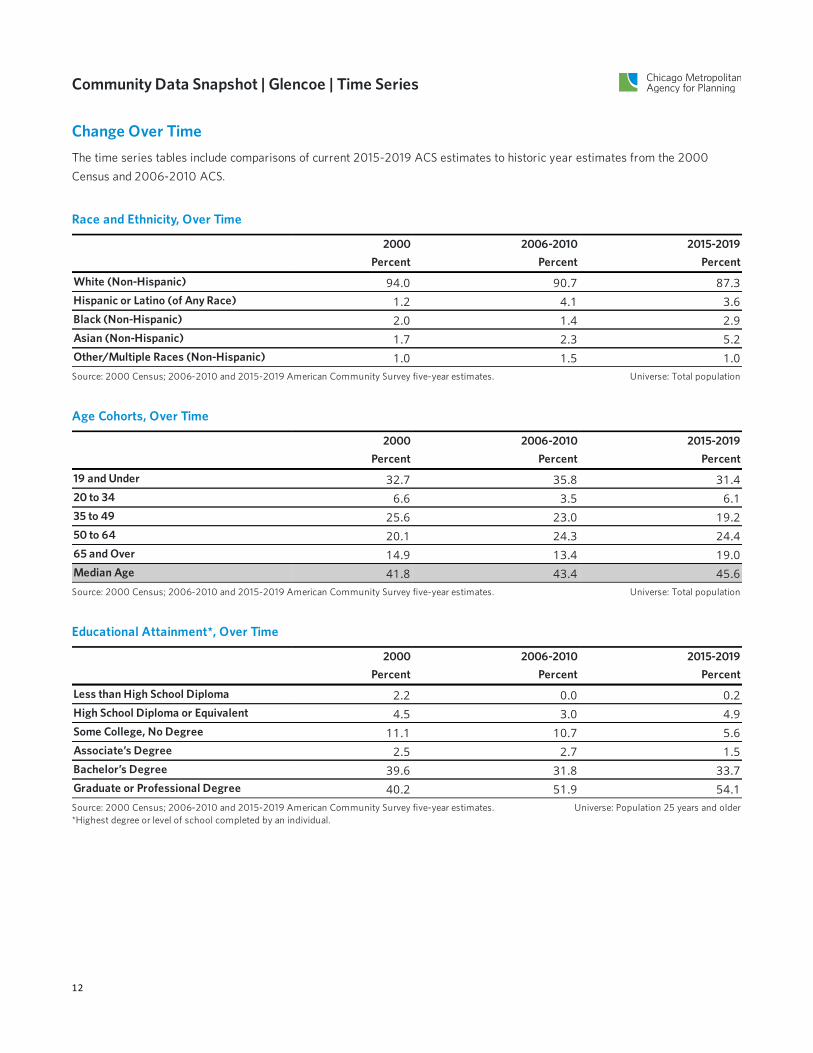
Community Data Snapshot | Glencoe | Time Series
Change Over TimeThe time series tables include comparisons of current 2015-2019 ACS estimates to historic year estimates from the 2000Census and 2006-2010 ACS.
Race and Ethnicity, Over Time
2000 2006-2010 2015-2019Percent Percent Percent
White (Non-Hispanic) 94.0 90.7 87.3Hispanic or Latino (of Any Race) 1.2 4.1 3.6Black (Non-Hispanic) 2.0 1.4 2.9Asian (Non-Hispanic) 1.7 2.3 5.2Other/Multiple Races (Non-Hispanic) 1.0 1.5 1.0Source: 2000 Census; 2006-2010 and 2015-2019 American Community Survey five-year estimates. Universe: Total population
Age Cohorts, Over Time
2000 2006-2010 2015-2019Percent Percent Percent
19 and Under 32.7 35.8 31.420 to 34 6.6 3.5 6.135 to 49 25.6 23.0 19.250 to 64 20.1 24.3 24.465 and Over 14.9 13.4 19.0Median Age 41.8 43.4 45.6Source: 2000 Census; 2006-2010 and 2015-2019 American Community Survey five-year estimates. Universe: Total population
Educational Attainment*, Over Time
2000 2006-2010 2015-2019Percent Percent Percent
Less than High School Diploma 2.2 0.0 0.2High School Diploma or Equivalent 4.5 3.0 4.9Some College, No Degree 11.1 10.7 5.6Associate’s Degree 2.5 2.7 1.5Bachelor’s Degree 39.6 31.8 33.7Graduate or Professional Degree 40.2 51.9 54.1Source: 2000 Census; 2006-2010 and 2015-2019 American Community Survey five-year estimates.*Highest degree or level of school completed by an individual.
Universe: Population 25 years and older
12
Community Data Snapshot | Glencoe | Time Series
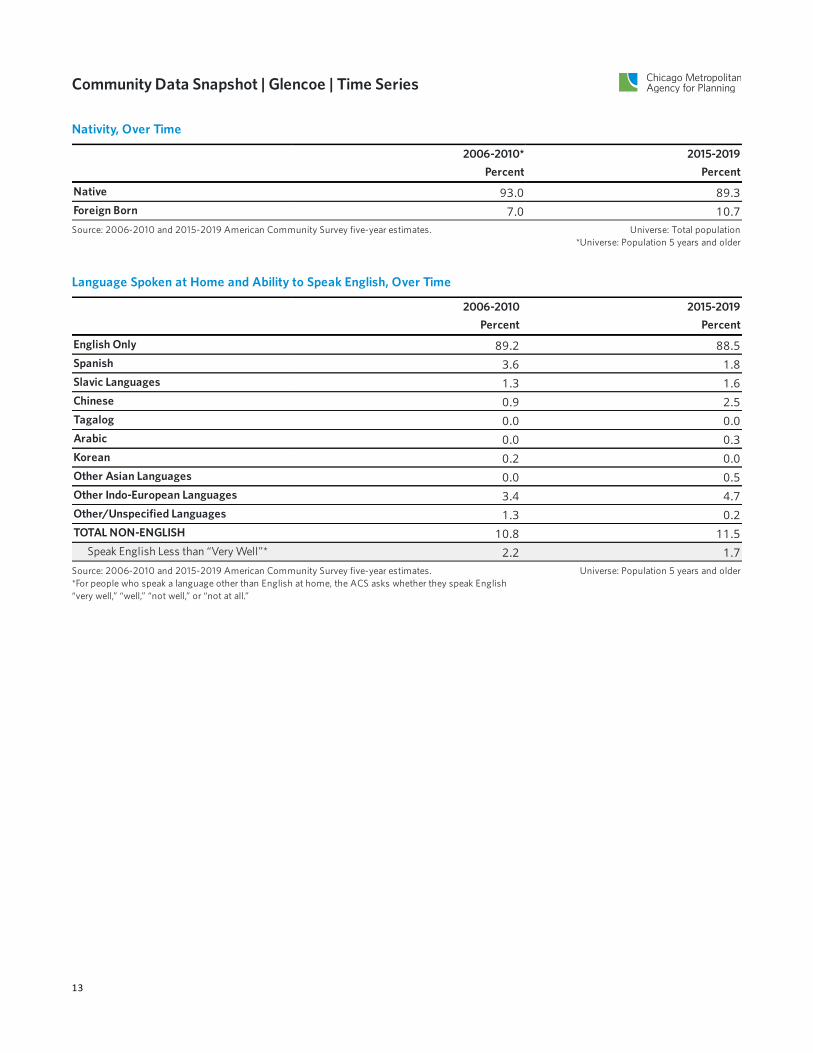
Nativity, Over Time
2006-2010* 2015-2019Percent Percent
Native 93.0 89.3Foreign Born 7.0 10.7Source: 2006-2010 and 2015-2019 American Community Survey five-year estimates. Universe: Total population
*Universe: Population 5 years and older
Language Spoken at Home and Ability to Speak English, Over Time
2006-2010 2015-2019Percent Percent
English Only 89.2 88.5Spanish 3.6 1.8Slavic Languages 1.3 1.6Chinese 0.9 2.5Tagalog 0.0 0.0Arabic 0.0 0.3Korean 0.2 0.0Other Asian Languages 0.0 0.5Other Indo-European Languages 3.4 4.7Other/Unspecified Languages 1.3 0.2TOTAL NON-ENGLISH 10.8 11.5
Speak English Less than “Very Well”* 2.2 1.7Source: 2006-2010 and 2015-2019 American Community Survey five-year estimates.*For people who speak a language other than English at home, the ACS asks whether they speak English“very well,” “well,” “not well,” or “not at all.”
Universe: Population 5 years and older
13
Community Data Snapshot | Glencoe | Time Series
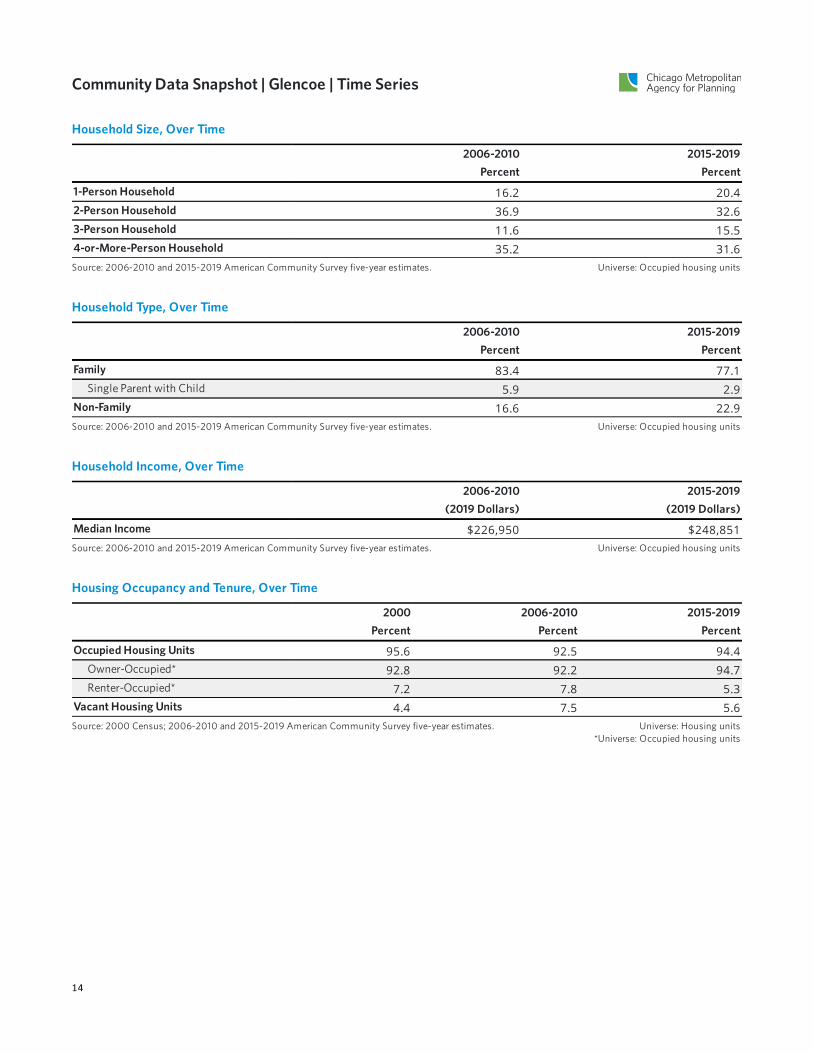
Household Size, Over Time
2006-2010 2015-2019Percent Percent
1-Person Household 16.2 20.42-Person Household 36.9 32.63-Person Household 11.6 15.54-or-More-Person Household 35.2 31.6Source: 2006-2010 and 2015-2019 American Community Survey five-year estimates. Universe: Occupied housing units
Household Type, Over Time
2006-2010 2015-2019Percent Percent
Family 83.4 77.1Single Parent with Child 5.9 2.9
Non-Family 16.6 22.9Source: 2006-2010 and 2015-2019 American Community Survey five-year estimates. Universe: Occupied housing units
Household Income, Over Time
2006-2010 2015-2019(2019 Dollars) (2019 Dollars)
Median Income $226,950 $248,851Source: 2006-2010 and 2015-2019 American Community Survey five-year estimates. Universe: Occupied housing units
Housing Occupancy and Tenure, Over Time
2000 2006-2010 2015-2019Percent Percent Percent
Occupied Housing Units 95.6 92.5 94.4Owner-Occupied* 92.8 92.2 94.7Renter-Occupied* 7.2 7.8 5.3
Vacant Housing Units 4.4 7.5 5.6Source: 2000 Census; 2006-2010 and 2015-2019 American Community Survey five-year estimates. Universe: Housing units
*Universe: Occupied housing units
14
Community Data Snapshot | Glencoe | Time Series
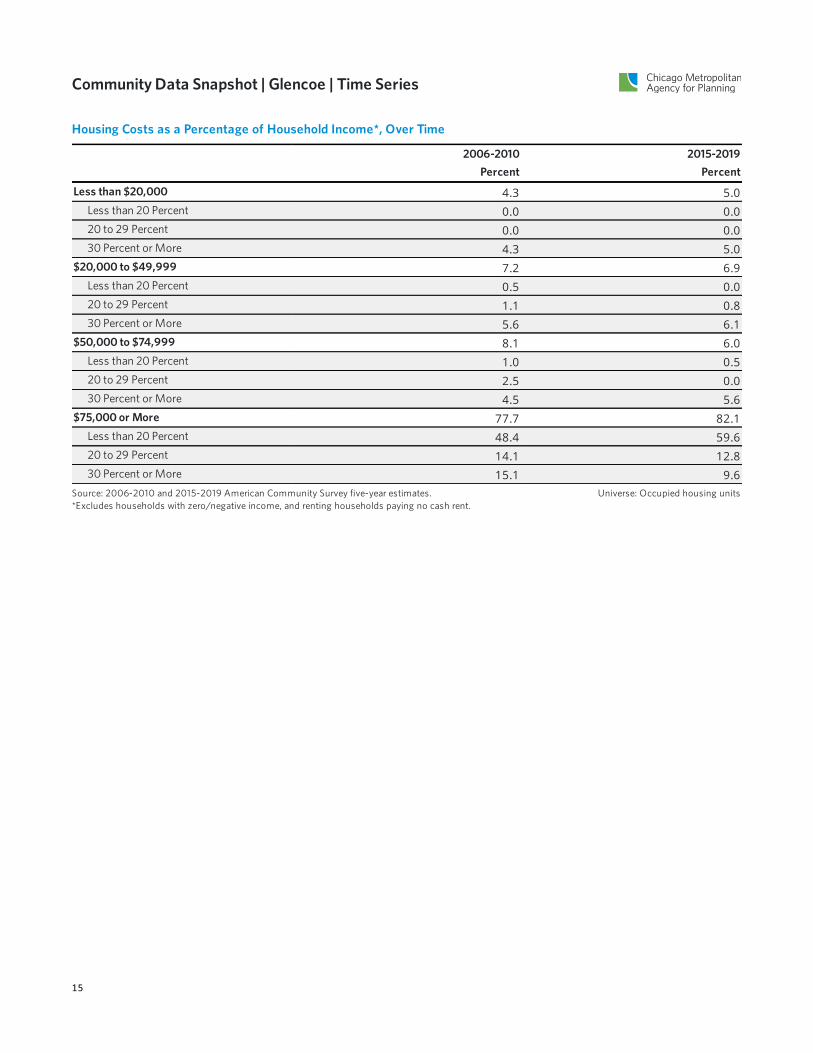
Housing Costs as a Percentage of Household Income*, Over Time
2006-2010 2015-2019Percent Percent
Less than $20,000 4.3 5.0Less than 20 Percent 0.0 0.020 to 29 Percent 0.0 0.030 Percent or More 4.3 5.0
$20,000 to $49,999 7.2 6.9Less than 20 Percent 0.5 0.020 to 29 Percent 1.1 0.830 Percent or More 5.6 6.1
$50,000 to $74,999 8.1 6.0Less than 20 Percent 1.0 0.520 to 29 Percent 2.5 0.030 Percent or More 4.5 5.6
$75,000 or More 77.7 82.1Less than 20 Percent 48.4 59.620 to 29 Percent 14.1 12.830 Percent or More 15.1 9.6
Source: 2006-2010 and 2015-2019 American Community Survey five-year estimates.*Excludes households with zero/negative income, and renting households paying no cash rent.
Universe: Occupied housing units
15
Community Data Snapshot | Glencoe | Time Series
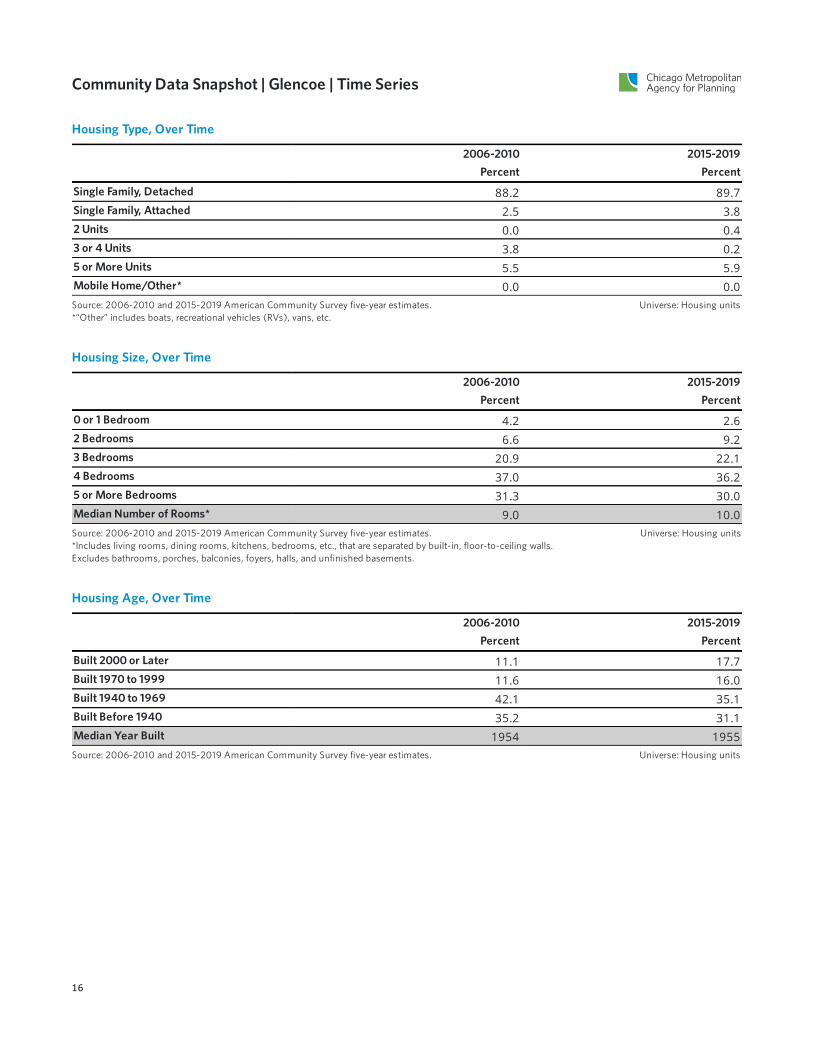
Housing Type, Over Time
2006-2010 2015-2019Percent Percent
Single Family, Detached 88.2 89.7Single Family, Attached 2.5 3.82 Units 0.0 0.43 or 4 Units 3.8 0.25 or More Units 5.5 5.9Mobile Home/Other* 0.0 0.0Source: 2006-2010 and 2015-2019 American Community Survey five-year estimates.*“Other” includes boats, recreational vehicles (RVs), vans, etc.
Universe: Housing units
Housing Size, Over Time
2006-2010 2015-2019Percent Percent
0 or 1 Bedroom 4.2 2.62 Bedrooms 6.6 9.23 Bedrooms 20.9 22.14 Bedrooms 37.0 36.25 or More Bedrooms 31.3 30.0Median Number of Rooms* 9.0 10.0Source: 2006-2010 and 2015-2019 American Community Survey five-year estimates.*Includes living rooms, dining rooms, kitchens, bedrooms, etc., that are separated by built-in, floor-to-ceiling walls.Excludes bathrooms, porches, balconies, foyers, halls, and unfinished basements.
Universe: Housing units
Housing Age, Over Time
2006-2010 2015-2019Percent Percent
Built 2000 or Later 11.1 17.7Built 1970 to 1999 11.6 16.0Built 1940 to 1969 42.1 35.1Built Before 1940 35.2 31.1Median Year Built 1954 1955Source: 2006-2010 and 2015-2019 American Community Survey five-year estimates. Universe: Housing units
16
Community Data Snapshot | Glencoe | Time Series
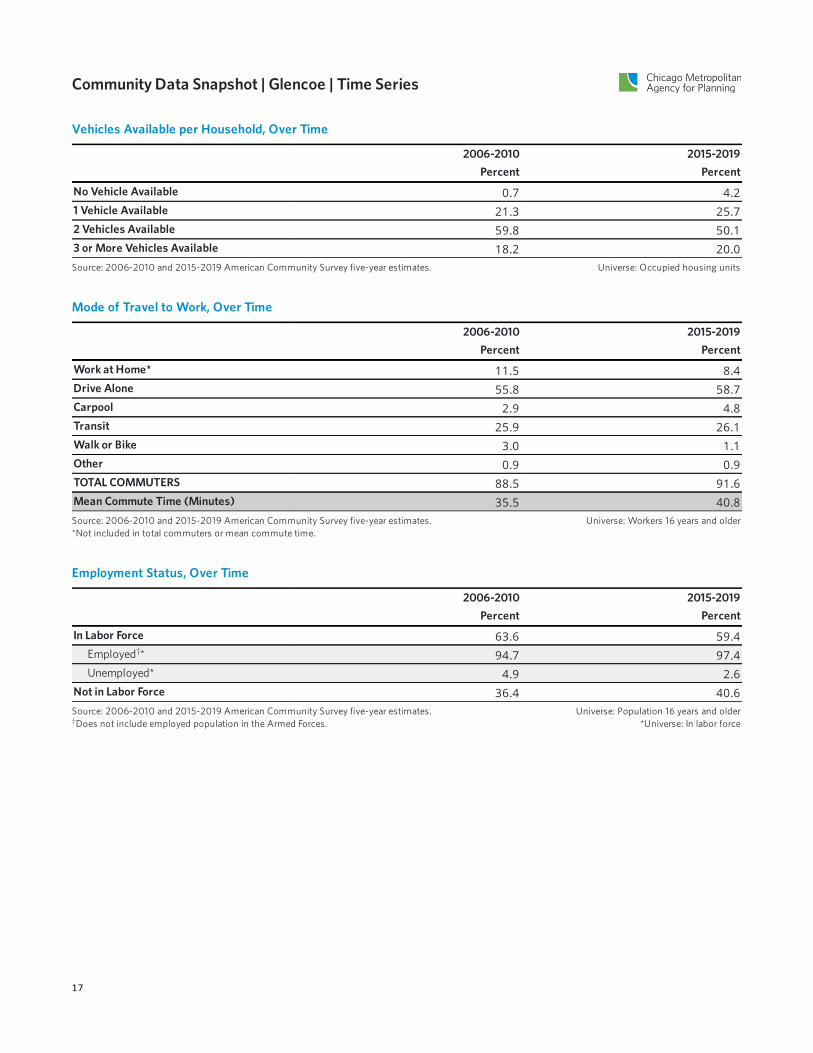
Vehicles Available per Household, Over Time
2006-2010 2015-2019Percent Percent
No Vehicle Available 0.7 4.21 Vehicle Available 21.3 25.72 Vehicles Available 59.8 50.13 or More Vehicles Available 18.2 20.0Source: 2006-2010 and 2015-2019 American Community Survey five-year estimates. Universe: Occupied housing units
Mode of Travel to Work, Over Time
2006-2010 2015-2019Percent Percent
Work at Home* 11.5 8.4Drive Alone 55.8 58.7Carpool 2.9 4.8Transit 25.9 26.1Walk or Bike 3.0 1.1Other 0.9 0.9TOTAL COMMUTERS 88.5 91.6Mean Commute Time (Minutes) 35.5 40.8Source: 2006-2010 and 2015-2019 American Community Survey five-year estimates.*Not included in total commuters or mean commute time.
Universe: Workers 16 years and older
Employment Status, Over Time
2006-2010 2015-2019Percent Percent
In Labor Force 63.6 59.4Employed * 94.7 97.4Unemployed* 4.9 2.6
Not in Labor Force 36.4 40.6
†
Source: 2006-2010 and 2015-2019 American Community Survey five-year estimates.Does not include employed population in the Armed Forces.†
Universe: Population 16 years and older*Universe: In labor force
17
Community Data Snapshot | Glencoe | Water Supply
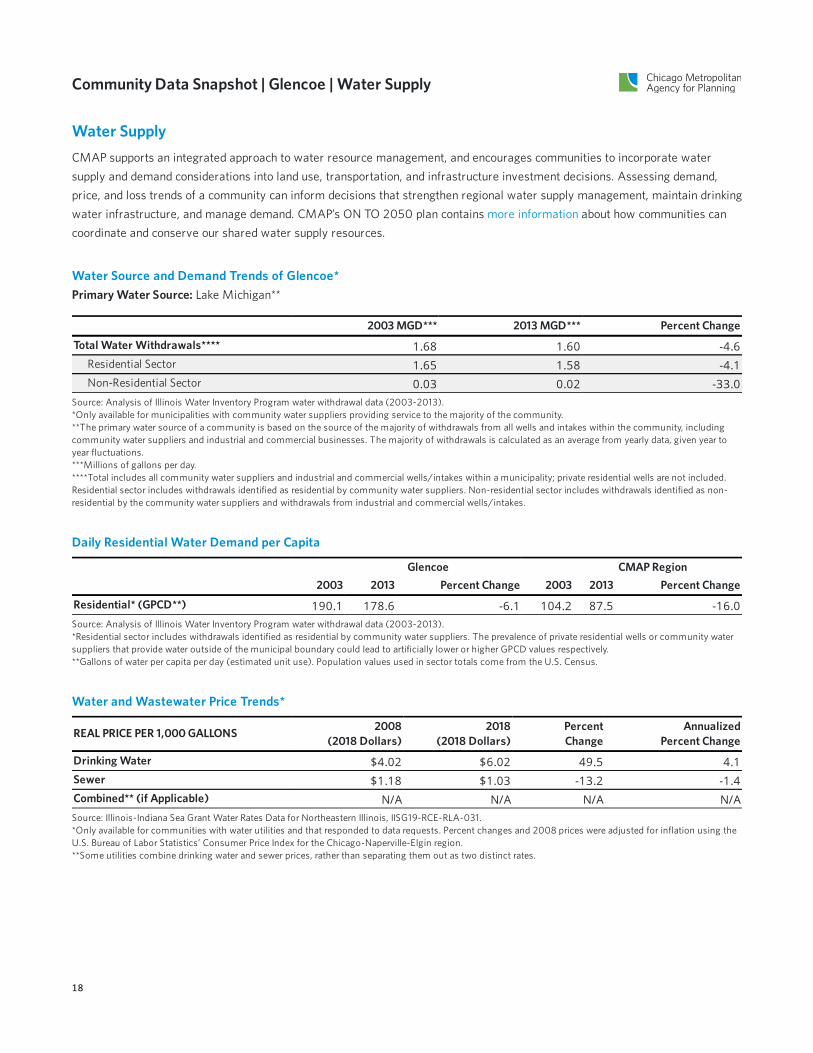
Water SupplyCMAP supports an integrated approach to water resource management, and encourages communities to incorporate watersupply and demand considerations into land use, transportation, and infrastructure investment decisions. Assessing demand,price, and loss trends of a community can inform decisions that strengthen regional water supply management, maintain drinkingwater infrastructure, and manage demand. CMAP’s ON TO 2050 plan contains more information about how communities cancoordinate and conserve our shared water supply resources.
Water Source and Demand Trends of Glencoe*Primary Water Source: Lake Michigan**
2003 MGD*** 2013 MGD*** Percent Change
Total Water Withdrawals**** 1.68 1.60 -4.6Residential Sector 1.65 1.58 -4.1Non-Residential Sector 0.03 0.02 -33.0
Source: Analysis of Illinois Water Inventory Program water withdrawal data (2003-2013).*Only available for municipalities with community water suppliers providing service to the majority of the community.**The primary water source of a community is based on the source of the majority of withdrawals from all wells and intakes within the community, includingcommunity water suppliers and industrial and commercial businesses. The majority of withdrawals is calculated as an average from yearly data, given year toyear fluctuations.***Millions of gallons per day.****Total includes all community water suppliers and industrial and commercial wells/intakes within a municipality; private residential wells are not included.Residential sector includes withdrawals identified as residential by community water suppliers. Non-residential sector includes withdrawals identified as non-residential by the community water suppliers and withdrawals from industrial and commercial wells/intakes.
Daily Residential Water Demand per Capita
Glencoe CMAP Region2003 2013 Percent Change 2003 2013 Percent Change
Residential* (GPCD**) 190.1 178.6 -6.1 104.2 87.5 -16.0Source: Analysis of Illinois Water Inventory Program water withdrawal data (2003-2013).*Residential sector includes withdrawals identified as residential by community water suppliers. The prevalence of private residential wells or community watersuppliers that provide water outside of the municipal boundary could lead to artificially lower or higher GPCD values respectively.**Gallons of water per capita per day (estimated unit use). Population values used in sector totals come from the U.S. Census.
Water and Wastewater Price Trends*
REAL PRICE PER 1,000 GALLONS 2008(2018 Dollars)
2018(2018 Dollars)
PercentChange
AnnualizedPercent Change
Drinking Water $4.02 $6.02 49.5 4.1Sewer $1.18 $1.03 -13.2 -1.4Combined** (if Applicable) N/A N/A N/A N/ASource: Illinois-Indiana Sea Grant Water Rates Data for Northeastern Illinois, IISG19-RCE-RLA-031.*Only available for communities with water utilities and that responded to data requests. Percent changes and 2008 prices were adjusted for inflation using theU.S. Bureau of Labor Statistics’ Consumer Price Index for the Chicago-Naperville-Elgin region.**Some utilities combine drinking water and sewer prices, rather than separating them out as two distinct rates.
18
Community Data Snapshot | Glencoe | Water Supply
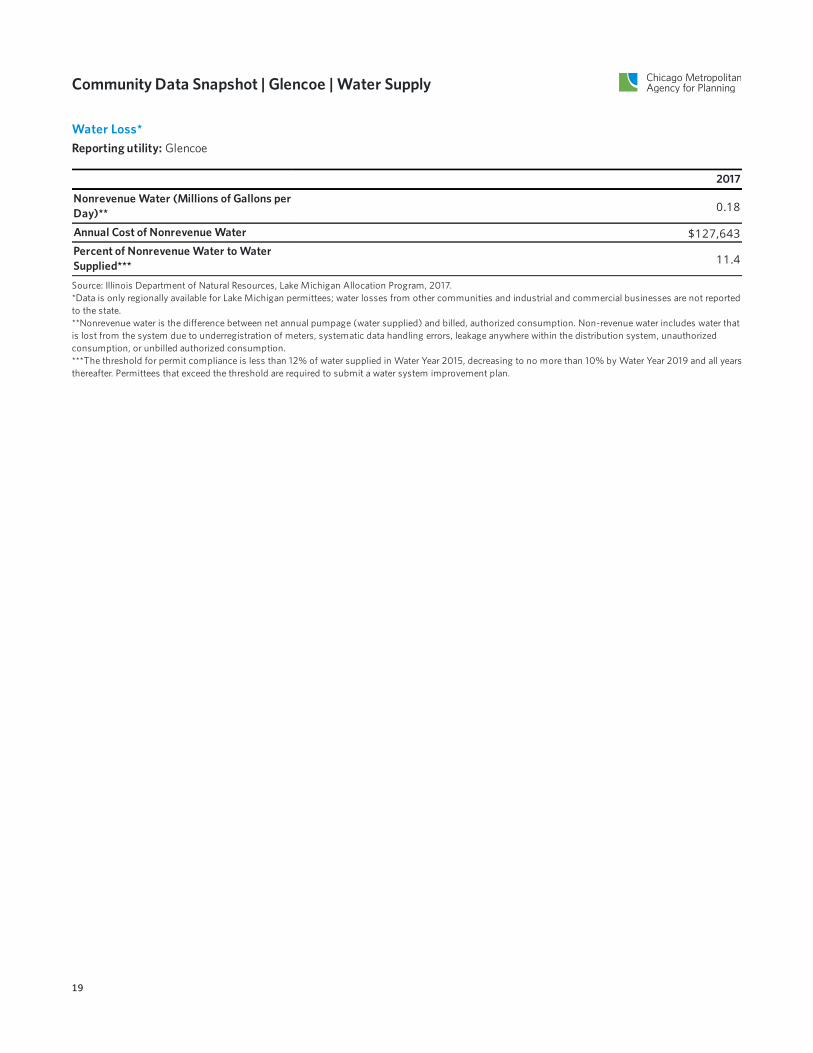
Water Loss*Reporting utility: Glencoe
2017
Nonrevenue Water (Millions of Gallons perDay)** 0.18
Annual Cost of Nonrevenue Water $127,643Percent of Nonrevenue Water to WaterSupplied*** 11.4
Source: Illinois Department of Natural Resources, Lake Michigan Allocation Program, 2017.*Data is only regionally available for Lake Michigan permittees; water losses from other communities and industrial and commercial businesses are not reportedto the state.**Nonrevenue water is the difference between net annual pumpage (water supplied) and billed, authorized consumption. Non-revenue water includes water thatis lost from the system due to underregistration of meters, systematic data handling errors, leakage anywhere within the distribution system, unauthorizedconsumption, or unbilled authorized consumption.***The threshold for permit compliance is less than 12% of water supplied in Water Year 2015, decreasing to no more than 10% by Water Year 2019 and all yearsthereafter. Permittees that exceed the threshold are required to submit a water system improvement plan.
19
Community Data Snapshot | Glencoe | ON TO 2050
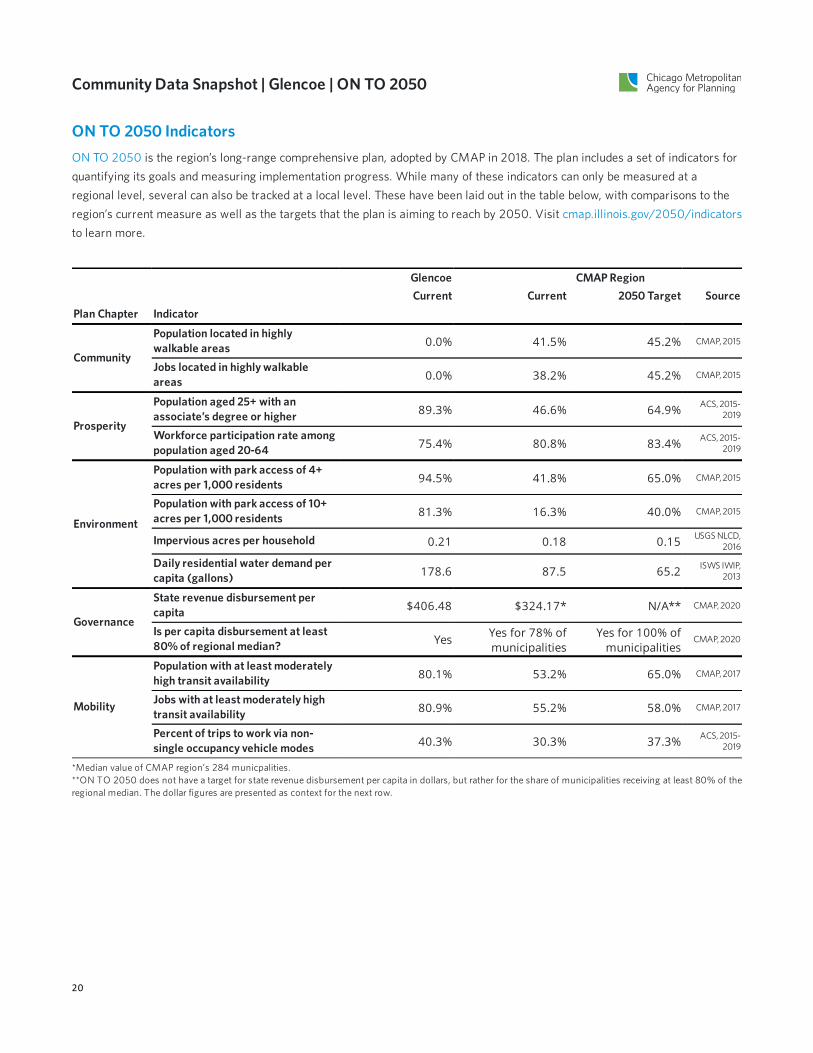
ON TO 2050 IndicatorsON TO 2050 is the region’s long-range comprehensive plan, adopted by CMAP in 2018. The plan includes a set of indicators forquantifying its goals and measuring implementation progress. While many of these indicators can only be measured at aregional level, several can also be tracked at a local level. These have been laid out in the table below, with comparisons to theregion’s current measure as well as the targets that the plan is aiming to reach by 2050. Visit cmap.illinois.gov/2050/indicatorsto learn more.
Glencoe CMAP RegionCurrent Current 2050 Target Source
Plan Chapter Indicator
Community
Population located in highlywalkable areas 0.0% 41.5% 45.2% CMAP, 2015
Jobs located in highly walkableareas 0.0% 38.2% 45.2% CMAP, 2015
Prosperity
Population aged 25+ with anassociate’s degree or higher 89.3% 46.6% 64.9% ACS, 2015-
2019
Workforce participation rate amongpopulation aged 20-64 75.4% 80.8% 83.4% ACS, 2015-
2019
Environment
Population with park access of 4+acres per 1,000 residents 94.5% 41.8% 65.0% CMAP, 2015
Population with park access of 10+acres per 1,000 residents 81.3% 16.3% 40.0% CMAP, 2015
Impervious acres per household 0.21 0.18 0.15 USGS NLCD,2016
Daily residential water demand percapita (gallons) 178.6 87.5 65.2 ISWS IWIP,
2013
Governance
State revenue disbursement percapita $406.48 $324.17* N/A** CMAP, 2020
Is per capita disbursement at least80% of regional median? Yes Yes for 78% of
municipalitiesYes for 100% of
municipalitiesCMAP, 2020
Mobility
Population with at least moderatelyhigh transit availability 80.1% 53.2% 65.0% CMAP, 2017
Jobs with at least moderately hightransit availability 80.9% 55.2% 58.0% CMAP, 2017
Percent of trips to work via non-single occupancy vehicle modes 40.3% 30.3% 37.3% ACS, 2015-
2019
*Median value of CMAP region’s 284 municpalities.**ON TO 2050 does not have a target for state revenue disbursement per capita in dollars, but rather for the share of municipalities receiving at least 80% of theregional median. The dollar figures are presented as context for the next row.
20