Today's top research idea Market snapshot Bosch: Outlook improves ...
28
1 April 2021 Investors are advised to refer through important disclosures made at the last page of the Research Report. Motilal Oswal research is available on www.motilaloswal.com/Institutional-Equities, Bloomberg, Thomson Reuters, Factset and S&P Capital. Research Team ([email protected]) Equities - India Close Chg .% CYTD.% Sensex 49,509 -1.3 3.7 Nifty-50 14,691 -1.0 5.1 Nifty-M 100 23,693 0.4 13.7 Equities-Global Close Chg .% CYTD.% S&P 500 3,973 0.4 5.8 Nasdaq 13,247 1.5 2.8 FTSE 100 6,714 -0.9 3.9 DAX 15,008 0.0 9.4 Hang Seng 10,972 -0.4 2.2 Nikkei 225 29,179 -0.9 6.3 Commodities Close Chg .% CYTD.% Brent (US$/Bbl) 62 -1.5 22.0 Gold ($/OZ) 1,708 1.3 -10.0 Cu (US$/MT) 8,788 0.2 13.4 Almn (US$/MT) 2,188 -0.8 10.8 Currency Close Chg .% CYTD.% USD/INR 73.1 -0.4 0.1 USD/EUR 1.2 0.1 -4.0 USD/JPY 110.7 0.3 7.2 YIELD (%) Close 1MChg CYTD chg 10 Yrs G-Sec 6.2 0.02 0.3 10 Yrs AAA Corp 7.2 0.04 0.6 Flows (USD b) 31-Mar MTD CY21 FIIs -0.23 2.40 7.62 DIIs 0.28 0.42 -3.75 Volumes (INRb) 31-Mar MTD* YTD* Cash 603 717 792 F&O 35,377 44,383 41,170 Note: *Average Today’s top research idea Market snapshot Chart of the Day: Bosch (Outlook improves, to reach FY19 revenue levels in FY22) Bosch: Outlook improves, to reach FY19 revenue levels in FY22 ❖ Demand outlook has improved from initial expectations as the recovery has been better. It expects FY22 revenue to be similar to FY19 levels. Depending on the level of economic activity (high case assumes 11% GDP growth in CY21 and 8.5% in a low case), it expects growth in CY21 as follows: a) PVs 25%/35% (low/high case), b) M&HCV: 87%/106%, c) LCVs: 46%/54%, d) Tractors: 2%/19%, e) 2Ws: 21%/27% and f) 3Ws: 9%/25%. It forecasts M&HCV volumes to reach near previous peak levels in FY23, with volumes crossing ~400k units (v/s FY19 peak of ~444k units). ❖ BOS expects electrification to start with 2Ws/3Ws and has relevant solutions for e-2Ws, e-3Ws, and e-LCVs. For M&HCVs, it expects fuel cells to be relevant solution and is globally strong in this technology. ❖ Supply chain challenges more widespread beyond semi-conductors: The semi-conductor issue is impacting the EU, US, China, and Japan more than India. While the semi-conductor issue is well known, supply chains are under pressure globally due to a shortage of steel, plastics, rare earths, etc. Cos/Sector Key Highlights Strategy A stellar end to the fiscal Bosch The Corner Office: Outlook improves, to reach FY19 revenue levels in FY22 EcoScope What is India’s corporate profitability and what are its determinants? Key highlights – central government finances in Feb’21 Current account moves back into deficit in 3QFY21 Financials Retail credit growth improves to 9.6% YoY; forms ~29% of total loans ECLG scheme extended for another three months Oil & Gas Revision in domestic gas price for 1HFY22 Metals Regional HRC prices rise on tightening demand-supply Trend in sales Source: Company, MOFSL Segment mix Source: Company, MOFSL 120.9 97.0 104.4 116.9 120.9 98.4 94.6 119.4 10.4 0.3 7.6 12.0 3.4 -18.6 -3.9 26.3 FY15 (15m) FY16 FY17 FY18 FY19 FY20 FY21E FY22E Net Sales (INR b) Growth (%) 39 46 48 47 47 46 50 52 26 26 27 28 27 23 18 20 12 3 - - - - - - 8 8 8 8 9 11 11 9 15 17 17 17 16 20 21 19 FY15 (15m) FY16 FY17 FY18 FY19 FY20 FY21E FY22E Fuel Injection Equipment Injectors & Nozzles Starters & Generators Power tools Others Research covered ASIAMONEY Brokers Poll 2020 (India)
-
Upload
khangminh22 -
Category
Documents
-
view
2 -
download
0
Transcript of Today's top research idea Market snapshot Bosch: Outlook improves ...

1 April 2021
Investors are advised to refer through important disclosures made at the last page of the Research Report. Motilal Oswal research is available on www.motilaloswal.com/Institutional-Equities, Bloomberg, Thomson Reuters, Factset and S&P Capital.
Research Team ([email protected])
Equities - India Close Chg .% CYTD.%
Sensex 49,509 -1.3 3.7
Nifty-50 14,691 -1.0 5.1
Nifty-M 100 23,693 0.4 13.7
Equities-Global Close Chg .% CYTD.%
S&P 500 3,973 0.4 5.8
Nasdaq 13,247 1.5 2.8
FTSE 100 6,714 -0.9 3.9
DAX 15,008 0.0 9.4
Hang Seng 10,972 -0.4 2.2
Nikkei 225 29,179 -0.9 6.3
Commodities Close Chg .% CYTD.%
Brent (US$/Bbl) 62 -1.5 22.0
Gold ($/OZ) 1,708 1.3 -10.0
Cu (US$/MT) 8,788 0.2 13.4
Almn (US$/MT) 2,188 -0.8 10.8
Currency Close Chg .% CYTD.%
USD/INR 73.1 -0.4 0.1
USD/EUR 1.2 0.1 -4.0
USD/JPY 110.7 0.3 7.2
YIELD (%) Close 1MChg CYTD chg
10 Yrs G-Sec 6.2 0.02 0.3
10 Yrs AAA Corp 7.2 0.04 0.6
Flows (USD b) 31-Mar MTD CY21
FIIs -0.23 2.40 7.62
DIIs 0.28 0.42 -3.75
Volumes (INRb) 31-Mar MTD* YTD*
Cash 603 717 792
F&O 35,377 44,383 41,170
Note: *Average
Today’s top research idea
Market snapshot
Chart of the Day: Bosch (Outlook improves, to reach FY19 revenue levels in FY22)
Bosch: Outlook improves, to reach FY19 revenue levels in FY22 ❖ Demand outlook has improved from initial expectations as the recovery has
been better. It expects FY22 revenue to be similar to FY19 levels. Depending
on the level of economic activity (high case assumes 11% GDP growth in CY21
and 8.5% in a low case), it expects growth in CY21 as follows: a) PVs 25%/35%
(low/high case), b) M&HCV: 87%/106%, c) LCVs: 46%/54%, d) Tractors:
2%/19%, e) 2Ws: 21%/27% and f) 3Ws: 9%/25%. It forecasts M&HCV volumes
to reach near previous peak levels in FY23, with volumes crossing ~400k units
(v/s FY19 peak of ~444k units).
❖ BOS expects electrification to start with 2Ws/3Ws and has relevant solutions
for e-2Ws, e-3Ws, and e-LCVs. For M&HCVs, it expects fuel cells to be relevant
solution and is globally strong in this technology.
❖ Supply chain challenges more widespread beyond semi-conductors: The
semi-conductor issue is impacting the EU, US, China, and Japan more than
India. While the semi-conductor issue is well known, supply chains are under
pressure globally due to a shortage of steel, plastics, rare earths, etc.
Cos/Sector Key Highlights
Strategy A stellar end to the fiscal
Bosch The Corner Office: Outlook improves, to reach FY19 revenue levels in FY22
EcoScope
What is India’s corporate profitability and what are its determinants?
Key highlights – central government finances in Feb’21
Current account moves back into deficit in 3QFY21
Financials Retail credit growth improves to 9.6% YoY; forms ~29% of total loans
ECLG scheme extended for another three months
Oil & Gas Revision in domestic gas price for 1HFY22
Metals Regional HRC prices rise on tightening demand-supply
Trend in sales
Source: Company, MOFSL
Segment mix
Source: Company, MOFSL
12
0.9
97
.0
10
4.4
11
6.9
12
0.9
98
.4
94
.6
11
9.4
10.4
0.37.6
12.0
3.4
-18.6
-3.9
26.3
FY15(15m)
FY16 FY17 FY18 FY19 FY20 FY21E FY22E
Net Sales (INR b) Growth (%)
39 46 48 47 47 46 50 52
26 26 27 28 27 23
18 20
12 3 - - - - - -8 8 8 8 9 11
11 9
15 17 17 17 16 20 21 19
FY15(15m)
FY16 FY17 FY18 FY19 FY20 FY21E FY22E
Fuel Injection Equipment Injectors & NozzlesStarters & Generators Power toolsOthers
Research covered
ASIAMONEY Brokers Poll 2020 (India)

1 April 2021 2
Core sector contracts 4.6 per cent in February; highest in six months The core sector index, which measures output of eight infrastructure industries declined by 4.6% in February 2021 compared to February last year. This is a sharp dip and a reversal of sorts of the marginal uptake seen in the preceding months with growth of 0.9% in January…
Four PSU banks to get ₹14,500 cr via zero coupon bonds The central government will infuse ₹14,500 crore capital in Central Bank of India, Indian Overseas Bank, Bank of India, and UCO Bank through non-interest bearing bonds, after a similar infusion of ₹5,500 crore in Punjab and Sind Bank in December…
Non-food bank credit offtake slows to 6.5% in February Bank credit offtake in the non-food sector slowed to 6.5 per in February 2021 on an annual basis, mainly on account of the impact of the coronavirus pandemic. Also, the slowdown in growth of personal loans continued as it decelerated to 9.6 per cent in February 2021 from 17 per cent a year ago, said the RBI's data on sectoral deployment of bank credit collected…
Government mops up Rs 32,835 crore from disinvestment in FY21, exceeds RE target The government has mopped up Rs 32,835 crore from CPSE share sale and buybacks, thus exceeding the disinvestment target set in the revised estimates (RE) for current fiscal. The realisation is, however, lower than the record Rs 2.10 lakh crore originally budgeted. In the RE, the target was scaled down…
Cost of domestic LPG cylinder reduced by Rs 10 Prices of cooking gas have been cut by Rs 10 per cylinder following a drop in international rates, Indian Oil Corporation said in a statement. This is the first reduction in prices that have risen by Rs 225 since November. A refill will now cost Rs 809 per cylinder in Delhi…
Piramal Pharma to acquire 100 pc stake in Hemmo Pharma for Rs 775 cr Piramal Pharma Ltd, a subsidiary of the company, has entered into an agreement to acquire a 100 per cent stake in Hemmo Pharmaceuticals for an upfront consideration of Rs 775 crore and earn-outs linked to the achievement of milestones, Piramal Enterprises…
PPF hits 46 year low of 6.4% as govt cuts interest rates of small savings schemes As per a finance ministry circular, dated March 31, 2021, interest rates on small savings schemes have been cut by massively between 40 -110 basis points (100 basis points/bps = 1%) for the first quarter of the financial year 2021-22. The PPF interest rate below 7% would be…
Kindly click on textbox for the detailed news link
In the news today
2
5
6 7
4
1
3
1 April 2021 3
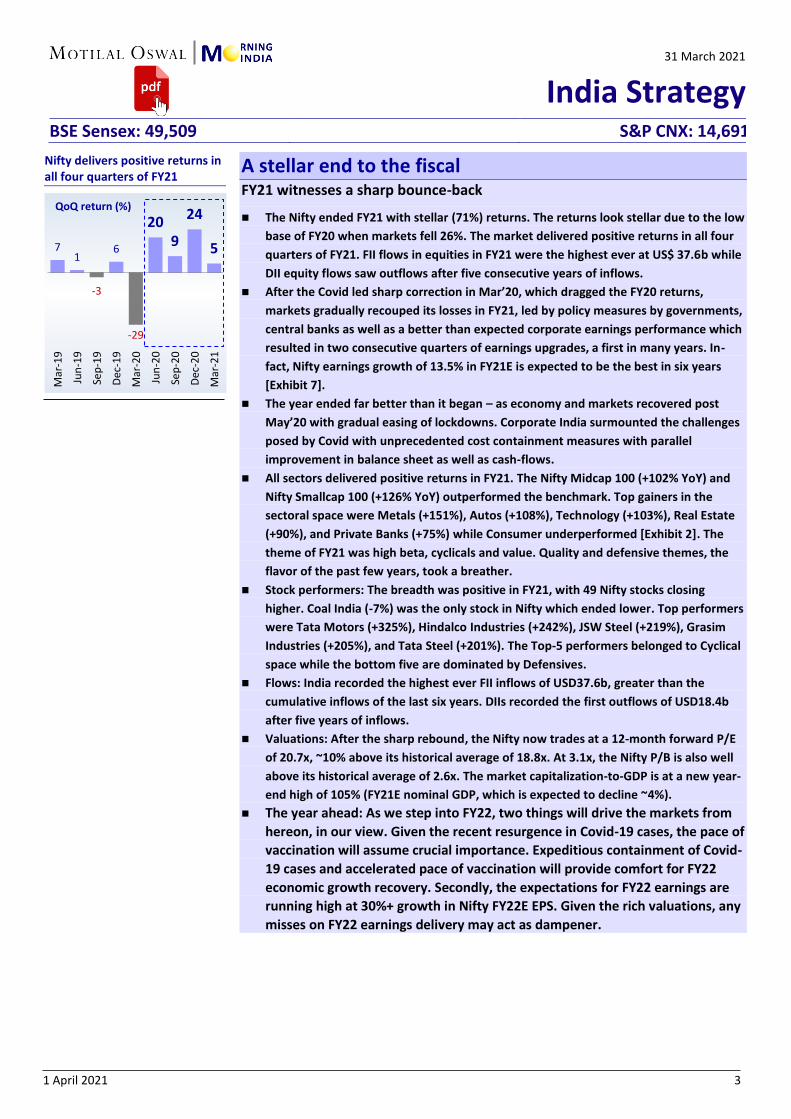
A stellar end to the fiscal FY21 witnesses a sharp bounce-back
◼ The Nifty ended FY21 with stellar (71%) returns. The returns look stellar due to the low
base of FY20 when markets fell 26%. The market delivered positive returns in all four
quarters of FY21. FII flows in equities in FY21 were the highest ever at US$ 37.6b while
DII equity flows saw outflows after five consecutive years of inflows.
◼ After the Covid led sharp correction in Mar’20, which dragged the FY20 returns,
markets gradually recouped its losses in FY21, led by policy measures by governments,
central banks as well as a better than expected corporate earnings performance which
resulted in two consecutive quarters of earnings upgrades, a first in many years. In-
fact, Nifty earnings growth of 13.5% in FY21E is expected to be the best in six years
[Exhibit 7].
◼ The year ended far better than it began – as economy and markets recovered post
May’20 with gradual easing of lockdowns. Corporate India surmounted the challenges
posed by Covid with unprecedented cost containment measures with parallel
improvement in balance sheet as well as cash-flows.
◼ All sectors delivered positive returns in FY21. The Nifty Midcap 100 (+102% YoY) and
Nifty Smallcap 100 (+126% YoY) outperformed the benchmark. Top gainers in the
sectoral space were Metals (+151%), Autos (+108%), Technology (+103%), Real Estate
(+90%), and Private Banks (+75%) while Consumer underperformed [Exhibit 2]. The
theme of FY21 was high beta, cyclicals and value. Quality and defensive themes, the
flavor of the past few years, took a breather.
◼ Stock performers: The breadth was positive in FY21, with 49 Nifty stocks closing
higher. Coal India (-7%) was the only stock in Nifty which ended lower. Top performers
were Tata Motors (+325%), Hindalco Industries (+242%), JSW Steel (+219%), Grasim
Industries (+205%), and Tata Steel (+201%). The Top-5 performers belonged to Cyclical
space while the bottom five are dominated by Defensives.
◼ Flows: India recorded the highest ever FII inflows of USD37.6b, greater than the
cumulative inflows of the last six years. DIIs recorded the first outflows of USD18.4b
after five years of inflows.
◼ Valuations: After the sharp rebound, the Nifty now trades at a 12-month forward P/E
of 20.7x, ~10% above its historical average of 18.8x. At 3.1x, the Nifty P/B is also well
above its historical average of 2.6x. The market capitalization-to-GDP is at a new year-
end high of 105% (FY21E nominal GDP, which is expected to decline ~4%).
◼ The year ahead: As we step into FY22, two things will drive the markets from
hereon, in our view. Given the recent resurgence in Covid-19 cases, the pace of
vaccination will assume crucial importance. Expeditious containment of Covid-
19 cases and accelerated pace of vaccination will provide comfort for FY22
economic growth recovery. Secondly, the expectations for FY22 earnings are
running high at 30%+ growth in Nifty FY22E EPS. Given the rich valuations, any
misses on FY22 earnings delivery may act as dampener.
31 March 2021
India Strategy BSE Sensex: 49,509 S&P CNX: 14,691
Nifty delivers positive returns in all four quarters of FY21
71
-3
6
-29
209
24
5
Mar
-19
Jun
-19
Sep
-19
Dec
-19
Mar
-20
Jun
-20
Sep
-20
Dec
-20
Mar
-21
QoQ return (%)

1 April 2021 4
FY21 Nifty returns best in the last 11 years; low base of FY20 coupled with solid earnings drove the returns
Sectoral performance FY21 (%) – Metals, Autos, Technology Outperform while Consumer Underperforms
Best and worst Nifty performers for FY21 (%) – 29 companies outperform the benchmark
244
-48
78
-16
0 -2
15
-3
42
-25
-2-13
81
15
67
1224
-36
74
11
-9
7
1827
-9
19 10 15
-26
71
FY9
2
FY9
3
FY9
4
FY9
5
FY9
6
FY9
7
FY9
8
FY9
9
FY0
0
FY0
1
FY0
2
FY0
3
FY0
4
FY0
5
FY0
6
FY0
7
FY0
8
FY0
9
FY1
0
FY1
1
FY1
2
FY1
3
FY1
4
FY1
5
FY1
6
FY1
7
FY1
8
FY1
9
FY2
0
FY2
1
Nifty annual return YoY (%)
CAGR of 13.1%
Four years of negative return in the 2000s cycle
Five years of negative return in the 1990s cycle
Three years of negative return in the FY11-20 cycle
71
102
126
151
108 10390
75 73 7163 63
49
28
Nif
ty-5
0
Mid
cap
10
0
Smal
lcap
10
0
Met
al
Au
to
Tech
no
logy
Rea
l Est
ate
Ban
k P
VT
Infr
a
Hea
lth
care
Oil
& G
as
Ban
k P
SU
Med
ia
Co
nsu
mer
FY21 change (%)
32
52
42
21
92
05
20
11
80
17
91
72
13
21
25
11
71
14
11
11
11
10
79
99
79
38
58
48
38
38
28
17
97
67
57
47
3
71
70
68
67
60
58
53
52
50
45
37
36
35
35
35
27
26
17
12
6 5-7
Tata
Mo
tors
Hin
dal
coJS
W S
teel
Gra
sim
Ind
Tata
Ste
el
Ad
ani P
ort
sM
&M
Ind
usI
nd
Bk
Baj
aj F
in.
HC
L Te
chTa
ta C
on
sum
erIn
fosy
sW
ipro
Baj
aj F
inse
rvU
ltra
Tech
Eich
er M
oto
rsU
PL
Cip
laSB
IA
xis
Ban
kH
ero
Mo
toD
ivi's
Lab
.R
elia
nce
Ind
.B
ajaj
Au
toIC
ICI B
ank
L&T
Tech
Mah
.TC
SH
DFC
Ban
kN
ifty
Sun
Ph
arm
aSh
ree
Cem
ent
Tita
n C
oM
aru
tiH
DFC
Lif
eH
DFC
Asi
an P
ain
tsO
NG
CD
r R
edd
y's
SBI L
ife
Ins
Po
wer
Gri
dB
PC
LK
ota
k M
ah.B
kB
rita
nn
iaIT
CN
TPC
Bh
arti
Air
tel
IOC
HU
LN
est
leC
oal
Ind
ia

1 April 2021 5
Outlook improves, to reach FY19 revenue levels in FY22 EVs: Good presence in 2Ws/PVs | PLI opportunity attractive, but awaits clarity
We hosted the senior management of Bosch. Our meeting with Mr. Soumitra Bhattachrya,
MD, Bosch, and Regional President, Bosch Group India, included discussions on the business,
its preparedness for technological disruptions, and the PLI opportunity.
◼ Demand recovery better than originally estimated: The outlook has improved from
initial expectations as the recovery has been better. It expects FY22 revenue to be
similar to FY19 levels. Depending on the level of economic activity (high case
assumes 11% GDP growth in CY21 and 8.5% in a low case), it expects growth in CY21
as follows: a) PVs 25%/35% (low/high case), b) M&HCV: 87%/106%, c) LCVs:
46%/54%, d) Tractors: 2%/19%, e) 2Ws: 21%/27% and f) 3Ws: 9%/25%. It forecasts
M&HCV volumes to reach near previous peak levels in FY23, with volumes crossing
~400k units (v/s FY19 peak of ~444k units).
◼ EVs – BOS supplies to relevant 2Ws, PVs models: BOS expects electrification to
start with 2Ws/3Ws and has relevant solutions for e-2Ws, e-3Ws, and e-LCVs. It is
already supplying to: a) Bajaj Chetak (drive, battery, ECU, connectivity box, and
App/Cloud services), b) TVS iQube (ECU and in-hub drive system), and c) Tata
Nexon. For M&HCVs, it expects fuel cells to be relevant solution and is globally
strong in this technology. For EVs, the parent had a total upfront investment of
EUR5b and invested EUR700m in CY21. It has won 90 projects and orders worth
EUR7.5b.
◼ PLI scheme seems attractive, but details awaited: Of the four PLI schemes for Auto,
BOS would benefit from three of them (excluding the OEM scheme). The group, it
indicated, can claim up to USD1b under this scheme. It will work on these schemes
once the final details are out.
◼ Other takeaways
➢ Supply chain challenges more widespread beyond semi-conductors: The semi-
conductor issue is impacting the EU, US, China, and Japan more than India.
While the semi-conductor issue is well known, supply chains are under pressure
globally due to a shortage of steel, plastics, rare earths, etc.
➢ 100% subsidiary to offer manufacturing as a service: Its 100% subsidiary,
Robert Bosch India Manufacturing, would offer manufacturing as a service in
the Automotive segment for both external customers as well as group
companies.
➢ Margin to see steady improvement based on mix improvement/content increase, restructuring/reskilling,
and cost controls.
➢ BS-VI confirmatory factors are ahead of regulatory norms, with 9%/70% of projects confirming to the factor
of 2.1/1.43.
➢ Its smart campus (75 acres) in the heart of Bengaluru will be operational in Jun’22, its 100th year in India. It
has invested INR8b on this smart campus and would house the second highest number of Bosch employees
in the world.
31 March 2021
CornerOffice
the
Interaction with the CEO
Bosch Limited
Mr. Soumitra Bhattacharya,
MD, Bosch, and Regional President, Bosch Group
in India
Mr. Bhattacharya has been
associated with the Bosch
Group for more than 24
years. A Chartered
Accountant by profession,
over the years he has
handled varied roles across
the group in India and
overseas. He was the CFO of
Bosch India from CY11 till
CY18. In CY16, he took over
as CEO. Prior to joining
Bosch, he worked at the
Tata group where he was
the founding member of the
Tanishq brand for Titan
Company. He also worked
at INDAL, the core
aluminum business of the
ALCAN group, and was a
founding member of its
electronics business

1 April 2021 6
◼ Valuation and view: The transition to BS-VI led to further market share loss in CVs as well as a continuous
decline in its stronghold PV diesel, although the 2W segment has opened up for BOS (one of the 3-4 players in
2W EFI). Valuations have corrected in line with muted earnings over the last four years, dilution in its
competitive positioning, as well as on concerns due to EVs. While it is too early to assess the competitive
landscape in EVs, BOS is very well-prepared to leverage electrification in 2Ws. We expect it to outperform
underlying industry volumes, barring the substantial divergence in segmental trends, driven by an increase in
content under BS-VI as well as additional revenue from 2W EFI. The stock trades ~29.3x/25.4x FY22E/FY23E EPS.
The stock price largely reflects all the negatives, but a re-rating catalyst may emerge in 2-3 quarters. We
maintain Neutral with a TP of ~INR15,550/share (~28x Mar’23E EPS at a 20% discount to its 10-year LPA of 35x).
P/E and P/B band
Source: MOFSL
Source: MOFSL
30.536.5
54.2
18.7
45.8
27.3
10.0
22.0
34.0
46.0
58.0
Mar
-11
Jun
-12
Sep
-13
Dec
-14
Mar
-16
Jun
-17
Sep
-18
Dec
-19
Mar
-21
P/E (x) Avg (x) Max (x)
Min (x) +1SD -1SD
4.05.5
8.7
2.9
6.9
4.1
2.0
4.0
6.0
8.0
10.0
Mar
-11
Jun
-12
Sep
-13
Dec
-14
Mar
-16
Jun
-17
Sep
-18
Dec
-19
Mar
-21
P/B (x) Avg (x) Max (x)
Min (x) +1SD -1SD

1 April 2021 7
31 March 2021
ECOSCOPE The Economy Observer
What is India’s corporate profitability... …and what are its determinants?
◼ When anyone talks about India’s corporate profitability, we tend to narrow down our analysis to the listed
sector comprising of about 6,500 companies. Corporate profitability in India, in this narrow sense, peaked out
at 6.3% of GDP in FY08 and has fallen to a 27-year low of 1.5% of GDP in FY20. During the same period,
corporate profitability in the US moved to 9% from 8% of GDP. The same for the UK rose slightly to 9.1% from
8.6% of GDP. In short, while corporate profitability in India fell in the 2010s decade, it rose to a record high in
the US and was stable in the UK.
◼ This wide gap between India and the Western world in terms of corporate profitability is highly misleading
because it’s like comparing apples with oranges. While the US and the UK are organized/formal economies,
India has a very large unlisted/unorganized sector. According to the Ministry of Corporate Affairs (MCA), only
~0.5% of registered companies in India (6,741 out of 1.33m) are listed and less than half of them are actively
traded. From an economic perspective, the large set of unlisted companies plays a very crucial role. In this
note, we provide a long-term series on India’s corporate profitability, including unlisted companies. Since our
estimates are based on a macroeconomic identity, we discuss in detail about the key determinants of
corporate profitability in a nation.
◼ Using the macroeconomic identity, which we call the ‘Theory of Everything’, our estimates suggest that India’s
corporate profitability (listed + unlisted) moved up from a paltry 5% of GDP in the late 1990s and early 2000s
to its peak of 12.4% of GDP in FY08 and has been in a narrow range (8.5% to 9.5% of GDP) between FY09 and
FY18. It fell to a 15-year low of 7.9% of GDP in FY19, before recovering to 8.9% of GDP in FY20 (subject to
revisions). India’s corporate profitability in recent years was comparable to that of the US and the UK.
However, there are two highlights: a) corporate profitability in India has weakened compared to pre-CY08
levels, while it has increased in the US and the UK, and b) the share of unlisted companies in India’s corporate
profitability has risen to about 70% in recent years from less than half in the 2000s decade.
◼ We also analyze the only available data set on domestic private limited (unlisted) companies by the Reserve
Bank of India (RBI) to get more confidence on these findings. According to RBI data, the profitability of private
limited companies has increased at an average 21% during the past seven years (FY13-19) vis-à-vis an average
growth of just 3% for listed companies. The rising share of unlisted companies in India’s corporate profitability
is thus confirmed by RBI’s data set.
◼ Corporate profitability in an economy is dependent on the corporate sector and behavior of households,
government, and the external sector. Corporate profitability is positively correlated with total investments
and fiscal deficit in a country, while it is inversely correlated with household savings and current account
deficit (CAD) in an economy. In other words, greater the investments/fiscal deficit and lower the household
savings/CAD, the higher is corporate profitability.
◼ Based on these key drivers, the trends in India’s corporate profitability can be broadly divided into five phases
in the past three decades. The rapid surge in profitability between FY03 and FY08 was entirely driven by
higher investments, while the decline in the immediate period post-GFC (FY09-13) was led by higher
household savings and wider CAD. Recently, corporate profitability has been stable, as lower investments
were almost entirely offset by lower household savings.
◼ It will not be advisable to extrapolate trends of listed companies to the entire corporate sector, and thus, the
economy. While listed companies have seen a rise in profitability in 2HCY20, unlisted companies are likely to
have suffered more due to COVID-19. Also, we must appreciate the inter-linkages between different sectors
and its impact on corporate profitability.
1 April 2021 8
31 March 2021
ECOSCOPE The Economy Observer
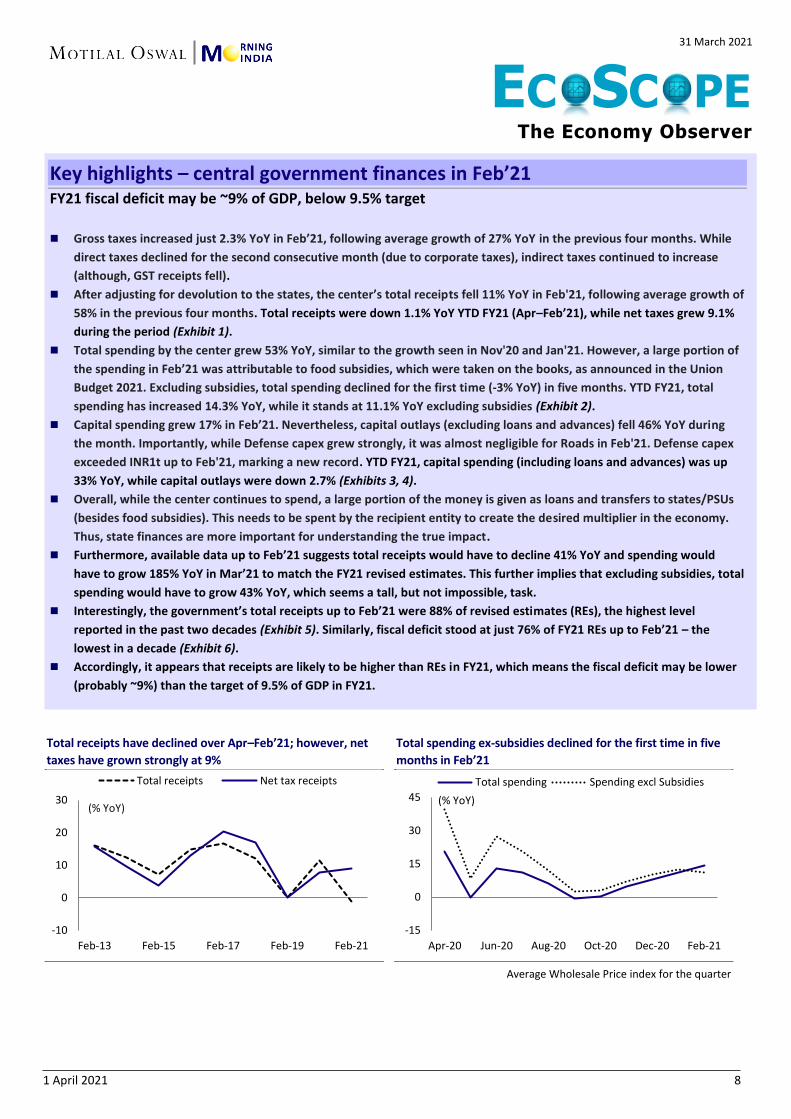
Key highlights – central government finances in Feb’21 FY21 fiscal deficit may be ~9% of GDP, below 9.5% target
◼ Gross taxes increased just 2.3% YoY in Feb’21, following average growth of 27% YoY in the previous four months. While
direct taxes declined for the second consecutive month (due to corporate taxes), indirect taxes continued to increase
(although, GST receipts fell).
◼ After adjusting for devolution to the states, the center’s total receipts fell 11% YoY in Feb'21, following average growth of
58% in the previous four months. Total receipts were down 1.1% YoY YTD FY21 (Apr–Feb’21), while net taxes grew 9.1%
during the period (Exhibit 1).
◼ Total spending by the center grew 53% YoY, similar to the growth seen in Nov'20 and Jan'21. However, a large portion of
the spending in Feb’21 was attributable to food subsidies, which were taken on the books, as announced in the Union
Budget 2021. Excluding subsidies, total spending declined for the first time (-3% YoY) in five months. YTD FY21, total
spending has increased 14.3% YoY, while it stands at 11.1% YoY excluding subsidies (Exhibit 2).
◼ Capital spending grew 17% in Feb’21. Nevertheless, capital outlays (excluding loans and advances) fell 46% YoY during
the month. Importantly, while Defense capex grew strongly, it was almost negligible for Roads in Feb'21. Defense capex
exceeded INR1t up to Feb'21, marking a new record. YTD FY21, capital spending (including loans and advances) was up
33% YoY, while capital outlays were down 2.7% (Exhibits 3, 4).
◼ Overall, while the center continues to spend, a large portion of the money is given as loans and transfers to states/PSUs
(besides food subsidies). This needs to be spent by the recipient entity to create the desired multiplier in the economy.
Thus, state finances are more important for understanding the true impact.
◼ Furthermore, available data up to Feb’21 suggests total receipts would have to decline 41% YoY and spending would
have to grow 185% YoY in Mar’21 to match the FY21 revised estimates. This further implies that excluding subsidies, total
spending would have to grow 43% YoY, which seems a tall, but not impossible, task.
◼ Interestingly, the government’s total receipts up to Feb’21 were 88% of revised estimates (REs), the highest level
reported in the past two decades (Exhibit 5). Similarly, fiscal deficit stood at just 76% of FY21 REs up to Feb’21 – the
lowest in a decade (Exhibit 6).
◼ Accordingly, it appears that receipts are likely to be higher than REs in FY21, which means the fiscal deficit may be lower
(probably ~9%) than the target of 9.5% of GDP in FY21.
Total receipts have declined over Apr–Feb’21; however, net
taxes have grown strongly at 9%
Total spending ex-subsidies declined for the first time in five
months in Feb’21
Average Wholesale Price index for the quarter
-10
0
10
20
30
Feb-13 Feb-15 Feb-17 Feb-19 Feb-21
Total receipts Net tax receipts
(% YoY)
-15
0
15
30
45
Apr-20 Jun-20 Aug-20 Oct-20 Dec-20 Feb-21
Total spending Spending excl Subsidies
(% YoY)

1 April 2021 9
Capital spending has increased sharply, primarily due to
‘loans & advances’…
…as capital outlays in FY21 are weak v/s previous years
Average Wholesale Price index for the quarter
Total receipts in YTD FY21 as % of REs are the highest since
FY01…
…while fiscal deficit in YTD FY21 (as % of REs) is the lowest in
a decade
Average Wholesale Price index for the quarter
-40
-14
12
38
64
Apr-20 Jun-20 Aug-20 Oct-20 Dec-20 Feb-21
Capital spending Capital outlays
(% YoY)
-40
-10
20
50
80
Apr May Jun Jul Aug Sep Oct Nov Dec Jan Feb Mar
Capital Outlays YTD (% YoY)
FY19 FY20 FY21
0
30
60
90
120
FY01 FY03 FY05 FY07 FY09 FY11 FY13 FY15 FY17 FY19 FY21
Total receipts(% of REs)
-10
30
70
110
150
FY01 FY03 FY05 FY07 FY09 FY11 FY13 FY15 FY17 FY19 FY21
Fiscal deficit(% of REs)

1 April 2021 10
Current account moves back into deficit in 3QFY21
Expect CAD to widen in subsequent quarters
◼ India’s current account balance moved to a deficit of USD1.7b (or 0.2% of GDP) in 3QFY21, against an average surplus of
USD17b (3% of GDP) in 1HFY21. CAD was marginally better than the market consensus of USD2.4b (or 0.3% of GDP).
Merchandise deficit stood at 4.7% of GDP in 3QFY21, vis-à-vis 2.2% of GDP in 1HFY21, while the surplus on the invisibles
(services + income) account was at a 10-quarter low of 4.4% of GDP.
◼ Net foreign capital inflows in India amounted to USD33.5b, the highest ever in absolute terms; however, they stood at
4.5% of GDP, the highest in the past six years, but less than half the peak inflows of 11.7% of GDP reported in 2QFY08.
Foreign direct investment (FDI) inflows stood at USD17b, followed by an all-time high of USD25b in 2QFY21. Foreign
portfolio investment (FPIs) inflows came in at USD21.2b – the highest in absolute terms.
◼ As foreign capital inflows outpaced CAD, India added more than USD30b in foreign exchange reserves (FXR) for the
second consecutive quarter in 3QFY21.
◼ With a marginal uptick in investments to 29.5% of GDP and small CAD in 3QFY21, gross domestic savings (GDS) stood at
29.3% of GDP last quarter. For the three quarters in FY21, however, gross domestic savings (GDS) stood at 28.8% of GDP,
lower than 29.6% of GDP in the corresponding period in FY20.
◼ Current account posts deficit after three successive surpluses in 3QFY21:
India’s current account balance moved to a deficit of USD1.7b (or 0.2% of GDP),
after reporting an average surplus of USD17b (or 3% of GDP) in 1HFY21 (Exhibit
1). It was marginally lower than the market consensus of a deficit of USD2.4b (or
0.3% of GDP). This implies India’s current account surplus was 1.7% of GDP in
9MFY21.
◼ Merchandise deficit drives CAD in 3QFY21: Merchandise trade deficit stood at
4.7% of GDP in 3QFY21, vis-à-vis 2.2% of GDP in 1HFY21 (Exhibit 2). The higher
merchandise deficit was primarily attributable to much slower decline in
imports (-4.7% YoY in 3Q vis-à-vis -24.4% in 2Q), while the fall in merchandise
exports (at 4.9% YoY) was similar to that in 2QFY21 (-5.5% YoY). Notably,
although the deficit on petroleum products widened last quarter, the expansion
in merchandise trade deficit was broad-based. The surplus on the invisibles
(services + income) account was also at a 10-quarter low of 4.4% of GDP – as
exports of invisibles fell 1.6% YoY, while imports declined just 1.5% in 3QFY21.
Excluding petroleum products, India had a current account surplus of 2% of
GDP, lower than in the past four quarters, but higher than in the pre-COVID era.
◼ Capital inflows increase substantially in 3QFY21: Net foreign capital inflows in
India amounted to USD33.5b, the highest ever in absolute terms. However, they
stood at 4.5% of GDP, the highest in the past six years, but less than half the
peak inflows of 11.7% of GDP reported in 2QFY08. FDI inflows stood at USD17b,
followed by an all-time high of USD25b in 2QFY21. FPIs inflows came in at
USD21.2b – the highest in absolute terms. Again, as a percentage of GDP, FPI
inflows were 2.9% in 3QFY21 – lower than ~4% of GDP in FY08 and the peak of
5% of GDP in 2QFY11. As foreign capital inflows outpaced CAD, India added
more than USD30b in FXR for the second consecutive quarter in 3QFY21 (Exhibit
3).
31 March 2021
ECOSCOPE The Economy Observer

1 April 2021 11
◼ Savings up in 3QFY21, but lower in 9MFY21: With a marginal uptick in
investments to 29.5% of GDP and small CAD in 3QFY21, GDS stood at 29.3% of
GDP last quarter. For the three quarters in FY21, however, GDS was 28.8% of
GDP, lower than 29.6% of GDP in the corresponding period in FY20 (Exhibit 4).
◼ Except CAD to continue to widen in subsequent quarters: With oil prices
exceeding USD60/barrel in 4QFY21 and the general widening of merchandise
trade deficit, India’s CAD is very likely to widen to ~1% of GDP in 4QFY21. This
implies India could post a surplus of about 0.9% of GDP for the full-year FY21 –
which could deteriorate to deficit of 0.8% of GDP in FY22.
India’s current account back in deficit for the first time in four
quarters in 3QFY21…
…due to sharp deterioration in merchandise trade deficit and
10-quarter low surplus in invisibles
Source: RBI, MOFSL
Strong capital inflows with small CAD result in accretion of
>USD30b in FXR in 3QFY21
* (-) Implies accretion to reserves, (+) implies withdrawal (reduction)
With marginal uptick in investments and small CAD, GDS up in
3QFY21
# Implied savings; Does not include ‘errors & omissions’
(6)
(3)
0
3
6
3QFY15 3QFY16 3QFY17 3QFY18 3QFY19 3QFY20 3QFY21
CAB CAB ex fuel products(% of GDP)
-4.7
3.2
1.2
(8)
(4)
0
4
8
3QFY18 1QFY19 3QFY19 1QFY20 3QFY20 1QFY21 3QFY21
Goods Services Income
(% of GDP)
(40,000)
(20,000)
0
20,000
40,000
Q3 FY16 Q3 FY17 Q3 FY18 Q3 FY19 Q3 FY20 Q3 FY21
Forex reserves* CAB Capital A/c
(USD mn)
-6
-3
0
3
6
20
24
28
32
36
3QFY17 3QFY18 3QFY19 3QFY20 3QFY21
CAB (RHS) Savings# Investments
(% of GDP) (% of GDP)

1 April 2021 12
Retail credit growth improves to 9.6% YoY; forms ~29% of total loans
Retail loans comprise 78% of incremental credit over FY21YTD
◼ Systemic loan growth stood at 6.5% YoY for the fortnight-ended 12th Mar’21. The
outstanding credit base has now reached INR108t. Retail credit growth improved to
9.6% YoY (v/s 9.1% YoY in Jan’21), with retail loans comprising ~78% of incremental
credit over FY21YTD. Among the retail segments, housing loans grew 8.4% YoY (7.7%
in Jan’21) and vehicle loans rose 8.3% YoY (7.1% in Jan’21). Credit cards grew 4.8% YoY
(flattish on a month-on-month basis).
◼ Industry growth remained flattish, while growth in the Services segment improved to
~9.3% YoY. Agri growth also picked up at 10.2% YoY.
◼ Systemic loan growth is showing signs of revival, aided by rising consumer demand, with
disbursements across various retail products – such as 2W, home, auto, LAP, and gold
loans – surpassing pre-COVID levels. Banks, however, remain cautious about growing the
unsecured book. Even growth in the Corporate segment is recovering, with the focus on
lending to high-rated corporates, primarily for working capital needs.
◼ We expect the 1HFY22E capex cycle to be supported by PSU entities, while private
sector capex would revive from 2HFY22E. Thus, we expect banking system credit to
grow ~6.8%/11% YoY over FY21E/FY22E, with private banks expected to grow higher
at ~15% YoY.
Retail growth improves to 9.6% YoY in Feb’21, led by home/auto loans Retail credit growth improved to 9.6% YoY in Feb’21 (v/s 9.1% YoY in Jan’21), with
growth in home loans improving to 8.4% YoY (v/s 7.7% YoY in Jan’21). Vehicle loan
growth also improved at 8.3% YoY (v/s 7.1% YoY in Jan’21), while credit card growth
moderated slightly to 4.8% YoY. On a monthly basis, retail loans grew 1.8% MoM –
within which home/vehicle loans grew 1.6%/1.5% MoM, while credit card growth
stood flattish. Overall, the share of retail in total systemic credit stood at 29.2%
(v/s 20% four years ago) and comprises ~78% of incremental credit over FY21YTD.
Banks have indicated that growth in segments such as Tractors, 2Ws, Auto Loans,
Gold Loans, and Affordable Housing has surpassed pre-COVID levels; recovery is
seen in the Corporate segment as well.
Industry growth muted; expect capex demand to pick up over FY22E ◼ Large-scale industries posted decline of 1.5% YoY. However, medium-scale
industries grew robustly at 21% YoY, while the trend in micro/small businesses
was muted at 1.5% YoY.
◼ Furthermore, growth in the Services/Agri sector improved to 9.3%/10.2% YoY.
Among sectors, Commercial Real Estate grew 1.6% YoY and Transport Operators
grew 4.6% YoY. NBFC, however, grew strongly at 27% YoY.
◼ Given the government’s focus on improving expenditure, we expect capex demand
to pick up – the 1HFY22E capex cycle is likely to be supported by various PSU
companies and a revival is expected in private sector capex from 2HFY22.
System deposit growth trends robust at 12.1% YoY; CD ratio stands at ~72% Deposit growth for the fortnight stood at 12.1% YoY. The outstanding deposit base
reached INR149.6t. Most banks are focusing on garnering deposits (particularly
CASA and retail TD) to ramp up their liability franchises and reduce dependence on
bulk deposits. The systemic CD ratio stood at ~72% (v/s ~76% in Mar’20).
Sector Update | 31 March 2021
Financials
Systemic loan growth at 6.5%
YoY; deposit growth at 12.1%
YoY as of 12th Mar’21
Source: RBI, MOFSL Retail growth improves to 9.6%
YoY (v/s 9.1% in Jan’21)
Source: RBI, MOFSL
6.5%
12.1%
0%
6%
12%
18%
24%
Mar
-15
Jul-
15
No
v-1
5M
ar-1
6Ju
l-1
6N
ov-
16
Mar
-17
Jul-
17
No
v-1
7M
ar-1
8Ju
l-1
8N
ov-
18
Mar
-19
Jul-
19
No
v-1
9M
ar-2
0Ju
l-2
0N
ov-
20
Mar
-21
Loan growth (%)
Deposit growth (%)
9.6%
5%
10%
15%
20%
25%
Feb
-17
May
-17
Au
g-1
7N
ov-
17
Feb
-18
May
-18
Au
g-1
8N
ov-
18
Feb
-19
May
-19
Au
g-1
9N
ov-
19
Feb
-20
May
-20
Au
g-2
0N
ov-
20
Feb
-21
Retail growth yoy (%)

1 April 2021 13
Monetary easing drives reduction in lending rates; NIMs to exhibit
stable/improving trends Continued monetary easing has resulted in lending rates plunging to all-time lows.
Deposit rates for most large banks have bottomed out, and cost of funds is likely to
remain largely stable given the excess liquidity in the system. Thus, we believe the
gradual deployment of excess liquidity and an uptick in loan growth would result in
the gradual normalization of spreads as well as support margins. Large banks with
strong liability franchises would continue to gain incremental market share, in our
view, and are better placed to tackle margin pressure. Therefore, we expect margins
to exhibit a stable/improving trend going ahead.
Maintain preference for ICICIBC, HDFCB, and SBIN
The balance sheets of large private banks are better placed v/s mid-sized peers
given their a) strong capital position, b) huge liquidity, c) cost of funds advantage,
and d) higher provision coverage in the stressed portfolio. Hence, large banks are
well-placed to gain incremental market share. We prefer the large private banks
(ICICIBC, HDFCB, and AXSB) over the mid-sized ones. Among the PSBs, SBIN would
continue to report steady credit growth and gain further market share.
Systemic loan growth at 6.5% YoY; deposit growth at 12.1% YoY as of 12th Mar’21
Source: RBI, MOFSL
System credit growth across segments
Source: RBI, MOFSL
6.5%
12.1%
0%
6%
12%
18%
24%
Mar
-15
Jul-
15
No
v-1
5
Mar
-16
Jul-
16
No
v-1
6
Mar
-17
Jul-
17
No
v-1
7
Mar
-18
Jul-
18
No
v-1
8
Mar
-19
Jul-
19
No
v-1
9
Mar
-20
Jul-
20
No
v-2
0
Mar
-21
Loan growth (%) Deposit growth (%)
-10%
0%
10%
20%
30%
Feb
-17
Ap
r-1
7
Jun
-17
Au
g-1
7
Oct
-17
Dec
-17
Feb
-18
Ap
r-1
8
Jun
-18
Au
g-1
8
Oct
-18
Dec
-18
Feb
-19
Ap
r-1
9
Jun
-19
Au
g-1
9
Oct
-19
Dec
-19
Feb
-20
Ap
r-2
0
Jun
-20
Au
g-2
0
Oct
-20
Dec
-20
Feb
-21
Non-food Cr Agri Industry Services Retail
Industrial credit declined 0.2% YoY, while Agri
loans grew 10.2% YoY in Feb’21
Retail growth improved to 9.6% YoY in Feb’21

1 April 2021 14
ECLG scheme extended for another three months Scope widened to cover most affected sectors with additional credit support
◼ With the rise in COVID-19 cases again and continuing adverse impact of the
pandemic in certain segments of the economy, the government has once again
extended the Emergency Credit Line Guarantee Scheme (ECLGS) of INR3t for
another three months till 30th Jun’21. The last date for disbursement under the
scheme has been extended till 30th Sep’21.
◼ It has also widened scope of the credit guarantee scheme with the introduction of
ECLGS 3.0 to cover business enterprises in Hospitality, Travel and Tourism, Leisure,
and Sporting sectors with loans not exceeding INR5b as on 29th Feb’20. The scheme
would only consider loans less than 60 days overdue as on 29th Feb’20.
◼ As Hospitality, Travel and Tourism, Leisure, and Sporting are the most affected
sectors by the COVID-19 pandemic and would take longer to revive, the
government has further relaxed ECLGS guidelines with additional credit support of
up to 40% of outstanding loans and increased the loan tenor to six years. As per
earlier guidelines, the maximum additional disbursement is up to 20%, with the
maximum loan tenure of four years in ECLGS 1.0 and five years in ECLGS 2.0.
◼ SME growth for Banks over the last two quarters has been aided by
disbursements under the ECLGS scheme. Total loans sanctioned under this
scheme stands ~INR2.5t (including ECLGS 1.0 and 2.0), while ~INR1.81t has been
disbursed as per the last disclosure by the National Credit Guarantee Trustee
Company as on 28th Feb’21. This implies that ~43% of incremental growth in
systemic credit base has been aided by disbursement under this scheme.
◼ The extension of this scheme and further widening of the scope for impacted
sectors would be positive for all lenders. Select banks like CUBK will benefit the
most owing to relatively higher exposure to these stressed sectors, with 8-10%
exposure to the Hotels and Tourism sector, while it has earlier guided for higher
restructuring up to 6% of loans.
Disbursements across Banks under the ECLG scheme 1.0 and 2.0
As on 3QFY21 Credit under ECLG scheme Disbursements under ECLGS Disbursements under ECLGS
INR b Sanctioned Disbursed FY21 YTD
incremental loans % of
incremental loans SME Loans % of SME loans
KMB* NA 97 (56.5) NA 187 51.9%
FB NA 26 32 80.3% 246 10.6%
HDFCB NA 227 886 25.6% 658 34.5%
AXSB 106 89 113 78.3% 640 13.9%
AUBANK* NA 5 31 17.2% 142 3.7%
IIB 44 29 3 841.0% 158 18.4%
ICICIBC** NA 126 537 23.5% 621 20.3%
BOB NA 80 85 93.8% 853 9.4%
SBIN 260 230 428 53.7% 2,937 7.8%
CUBK 21 19 20 96.0% 127 15.0%
Total system 2,460 1,810 4,276 42.3% 19,100 9.5%
*Please note that for AUBANK we have considered SBL MSME and Agri SME for total SME loans; **For ICICIBC, we have clubbed business
banking and SME loans Source: MOFSL, Company
Sector Update | 31 March 2021
Financials

1 April 2021 15
Bank’s exposure to these sectors (INR b)
Funded (INR b) Hospitality Travel and Tourism Leisure
AXSB 24.2
IIB 17.9 9.4
FB 2.4
DCBB 2.4
SBIN 77.6
System credit 481.0
Note: SBIN exposure in Tourism and Hotels; System credit includes Tourism, Hotels, and Restaurants
Source: RBI, Basel III disclosures, and company presentation

1 April 2021 16
Revision in domestic gas price for 1HFY22 Domestic natural gas price unchanged at USD1.79/mmbtu (GCV) for 1HFY22 (press release) ◼ Unchanged APM gas price bodes well for margins of CGDs, given that the
pressure of an increase in gas cost is past us for at least the two upcoming
quarters. In Feb’21, IGL/MAHGL took a CNG price hike of INR0.7–1.5/kg to
recover higher operational costs. Although, we remain wary of the increase in
commissions demanded by OMCs (to double them to ~INR8/kg). Also, the
country is seeing a second wave of the pandemic, due to which restrictions are
increasing once again. As a result, school buses would remain shut, while
transportation in general would take longer to revive (as offices are re-closed),
thereby affecting the volume uptick in CNG.
◼ Even GAIL is likely to benefit as the company uses domestic gas to produce LPG
– thus aiding better margins in the segment.
Gas price ceiling down to USD3.62/mmbtu (GCV) for 1HFY22, from USD4.06/mmbtu in 2HFY21 (press release) ◼ The announcement would result in lower gas price realization for ONGC and
Oil India.
◼ Even RIL would be impacted as its gas production from the KG Basin would now
be capped at a lower gas price. RIL has already auctioned ~12.5mmscmd of gas
(currently flowing ~5mmscmd) from the basin; it is likely to commission
additional gas (peak potential of ~28mmscmd by FY24) after 3QFY22 (from the
R-cluster and MJ field).
Cutting estimates for ONGC and Oil India ◼ We had built in a 20% rise in gas price from Apr’21. Considering there has been
no change in prices, we cut our FY22/FY23E EPS forecast for ONGC standalone
by 5%/8% and for Oil India by 8%/9%.
◼ As a result, we cut our target price for ONGC to INR125 (from INR135) and for
Oil India to INR155 (from INR170). Reiterate Buy.
◼ We believe Brent would remain in the band of USD50–60/bbl. Our forecasts for
ONGC and Oil India are based on Brent of USD55/bbl for FY22/FY23E. A
sustained higher oil price may call for an upgrade in our estimate / target price.
Domestic gas price (USD/mmbtu) - GCV
Source: MOFSL
4.66
3.82
3.062.50 2.48
2.89 3.063.36
3.693.23
2.391.79 1.79
Ap
r-1
5
Oct
-15
Ap
r-1
6
Oct
-16
Ap
r-1
7
Oct
-17
Ap
r-1
8
Oct
-18
Ap
r-1
9
Oct
-19
Ap
r-2
0
Oct
-20
Ap
r-2
1
Domestic gas price (USD/mmbtu) - GCV
Sector Update | 31 March 2021
Oil & Gas
Our Report
1 April 2021 17
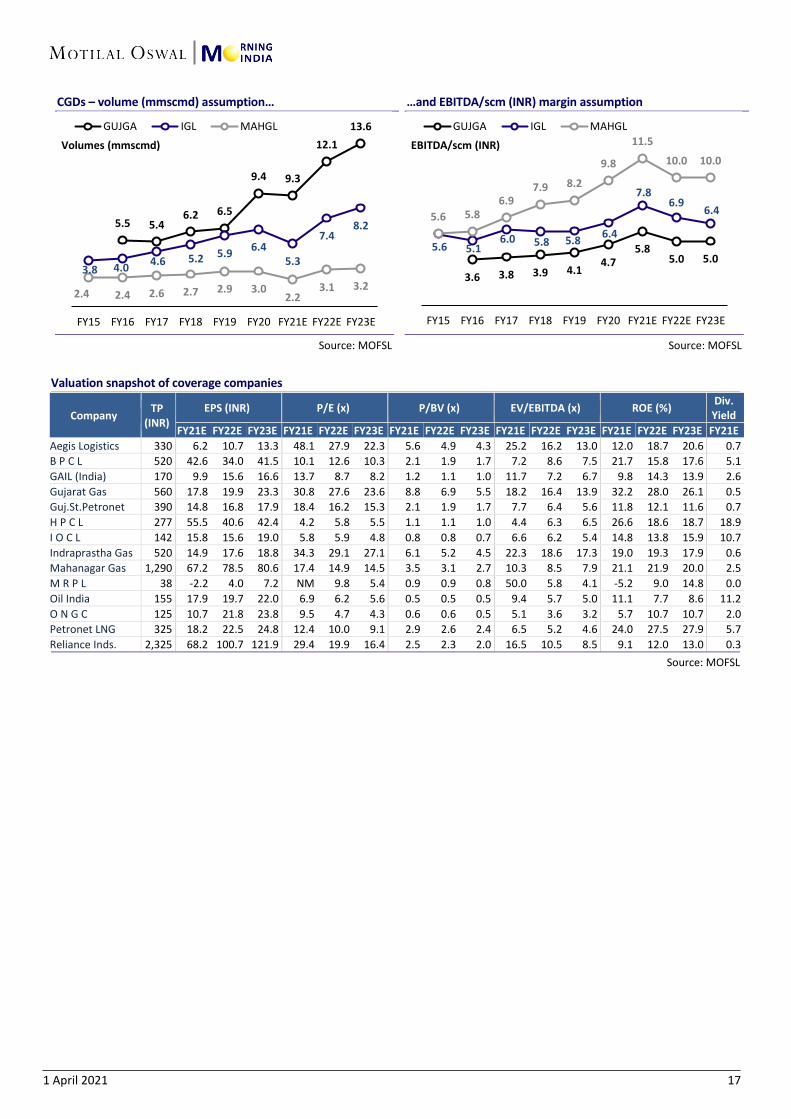
CGDs – volume (mmscmd) assumption…
Source: MOFSL
…and EBITDA/scm (INR) margin assumption
Source: MOFSL
Valuation snapshot of coverage companies
Company TP
(INR)
EPS (INR) P/E (x) P/BV (x) EV/EBITDA (x) ROE (%) Div.
Yield
FY21E FY22E FY23E FY21E FY22E FY23E FY21E FY22E FY23E FY21E FY22E FY23E FY21E FY22E FY23E FY21E
Aegis Logistics 330 6.2 10.7 13.3 48.1 27.9 22.3 5.6 4.9 4.3 25.2 16.2 13.0 12.0 18.7 20.6 0.7
B P C L 520 42.6 34.0 41.5 10.1 12.6 10.3 2.1 1.9 1.7 7.2 8.6 7.5 21.7 15.8 17.6 5.1
GAIL (India) 170 9.9 15.6 16.6 13.7 8.7 8.2 1.2 1.1 1.0 11.7 7.2 6.7 9.8 14.3 13.9 2.6
Gujarat Gas 560 17.8 19.9 23.3 30.8 27.6 23.6 8.8 6.9 5.5 18.2 16.4 13.9 32.2 28.0 26.1 0.5
Guj.St.Petronet 390 14.8 16.8 17.9 18.4 16.2 15.3 2.1 1.9 1.7 7.7 6.4 5.6 11.8 12.1 11.6 0.7
H P C L 277 55.5 40.6 42.4 4.2 5.8 5.5 1.1 1.1 1.0 4.4 6.3 6.5 26.6 18.6 18.7 18.9
I O C L 142 15.8 15.6 19.0 5.8 5.9 4.8 0.8 0.8 0.7 6.6 6.2 5.4 14.8 13.8 15.9 10.7
Indraprastha Gas 520 14.9 17.6 18.8 34.3 29.1 27.1 6.1 5.2 4.5 22.3 18.6 17.3 19.0 19.3 17.9 0.6
Mahanagar Gas 1,290 67.2 78.5 80.6 17.4 14.9 14.5 3.5 3.1 2.7 10.3 8.5 7.9 21.1 21.9 20.0 2.5
M R P L 38 -2.2 4.0 7.2 NM 9.8 5.4 0.9 0.9 0.8 50.0 5.8 4.1 -5.2 9.0 14.8 0.0
Oil India 155 17.9 19.7 22.0 6.9 6.2 5.6 0.5 0.5 0.5 9.4 5.7 5.0 11.1 7.7 8.6 11.2
O N G C 125 10.7 21.8 23.8 9.5 4.7 4.3 0.6 0.6 0.5 5.1 3.6 3.2 5.7 10.7 10.7 2.0
Petronet LNG 325 18.2 22.5 24.8 12.4 10.0 9.1 2.9 2.6 2.4 6.5 5.2 4.6 24.0 27.5 27.9 5.7
Reliance Inds. 2,325 68.2 100.7 121.9 29.4 19.9 16.4 2.5 2.3 2.0 16.5 10.5 8.5 9.1 12.0 13.0 0.3
Source: MOFSL
5.5 5.46.2 6.5
9.4 9.3
12.1
13.6
3.8 4.04.6 5.2 5.9
6.45.3
7.48.2
2.4 2.4 2.6 2.7 2.9 3.02.2
3.1 3.2
FY15 FY16 FY17 FY18 FY19 FY20 FY21E FY22E FY23E
Volumes (mmscmd)
GUJGA IGL MAHGL
3.6 3.8 3.9 4.14.7
5.85.0 5.0
5.6 5.16.0 5.8 5.8
6.4
7.86.9
6.45.6 5.8
6.97.9 8.2
9.8
11.5
10.0 10.0
FY15 FY16 FY17 FY18 FY19 FY20 FY21E FY22E FY23E
EBITDA/scm (INR)
GUJGA IGL MAHGL

1 April 2021 18
Regional HRC prices rise on tightening demand-supply China, Korea FoB export prices rise by 5-7% WoW
◼ The continuing surge in global demand and tightness in supply due to supply-side
issues and productiosn curbs in China has helped regional steel prices inch up
further.
◼ As per Steelmint, regional steel prices have increased 5-7% WoW.
◼ Korea export FOB prices have risen by 5% WoW (10% MoM) to USD838/t (CFR
India - USD875/t). Domestic HRC prices at INR55,500/t are trading at a discount
of INR9,000/t to the landed cost of imports from Korea.
◼ China export FoB prices too increased 7.5% WoW to USD830/t.
◼ We believe domestic HRC prices are likely to see two hikes in India – up to
INR4,000/t now and another INR2,000-3,000/t in Apr’21.
Domestic HRC prices trade at a discount of INR9,000/t to the
landed cost of imports
Source: Steelmint, MOFSL
Domestic HRC prices vis-à-vis regional export price trend
Source: Steelmint, MOFSL
64,988
55,500
28,000
38,000
48,000
58,000
68,000
Jan
/17
May
/17
Sep
/17
Jan
/18
May
/18
Sep
/18
Jan
/19
May
/19
Sep
/19
Jan
/20
May
/20
Sep
/20
Jan
/21
Landed cost - Korea Imports Domestic price(INR/t)
300
500
700
900
Jan
/18
Ap
r/1
8
Jul/
18
Oct
/18
Jan
/19
Ap
r/1
9
Jul/
19
Oct
/19
Jan
/20
Ap
r/2
0
Jul/
20
Oct
/20
Jan
/21
Ap
r/2
1
ADD Ref price From China
Domestic price From Korea(USD/t)
Sector Update | 31 March 2021
Metals
1 April 2021 19
\
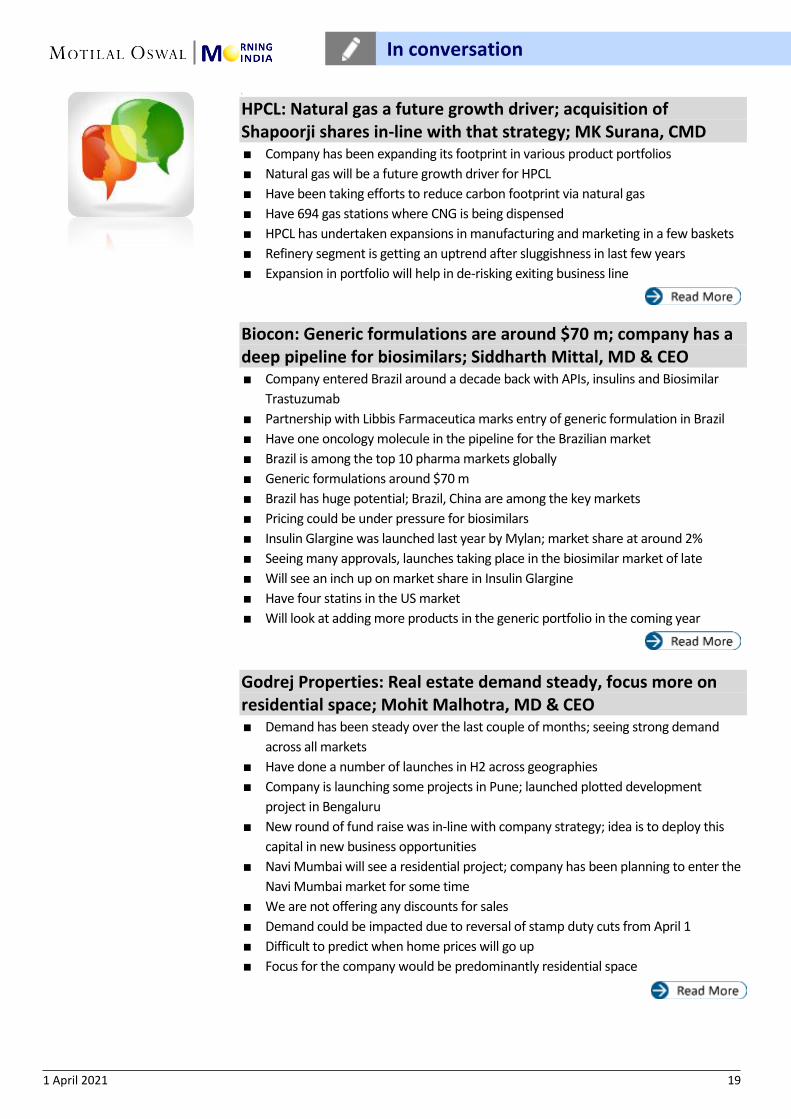
HPCL: Natural gas a future growth driver; acquisition of Shapoorji shares in-line with that strategy; MK Surana, CMD Company has been expanding its footprint in various product portfolios
Natural gas will be a future growth driver for HPCL
Have been taking efforts to reduce carbon footprint via natural gas
Have 694 gas stations where CNG is being dispensed
HPCL has undertaken expansions in manufacturing and marketing in a few baskets
Refinery segment is getting an uptrend after sluggishness in last few years
Expansion in portfolio will help in de-risking exiting business line
Biocon: Generic formulations are around $70 m; company has a deep pipeline for biosimilars; Siddharth Mittal, MD & CEO Company entered Brazil around a decade back with APIs, insulins and Biosimilar
Trastuzumab
Partnership with Libbis Farmaceutica marks entry of generic formulation in Brazil
Have one oncology molecule in the pipeline for the Brazilian market
Brazil is among the top 10 pharma markets globally
Generic formulations around $70 m
Brazil has huge potential; Brazil, China are among the key markets
Pricing could be under pressure for biosimilars
Insulin Glargine was launched last year by Mylan; market share at around 2%
Seeing many approvals, launches taking place in the biosimilar market of late
Will see an inch up on market share in Insulin Glargine
Have four statins in the US market
Will look at adding more products in the generic portfolio in the coming year
Godrej Properties: Real estate demand steady, focus more on residential space; Mohit Malhotra, MD & CEO Demand has been steady over the last couple of months; seeing strong demand
across all markets
Have done a number of launches in H2 across geographies
Company is launching some projects in Pune; launched plotted development
project in Bengaluru
New round of fund raise was in-line with company strategy; idea is to deploy this
capital in new business opportunities
Navi Mumbai will see a residential project; company has been planning to enter the
Navi Mumbai market for some time
We are not offering any discounts for sales
Demand could be impacted due to reversal of stamp duty cuts from April 1
Difficult to predict when home prices will go up
Focus for the company would be predominantly residential space
In conversation
1 April 2021 20
Amber Enterprise: Commodity price rise will remain a concern for next few months; Jasbir Singh, Chairman & CEO Demand continues to be robust
Commodity price rise will remain a concern for next few months
Will pass on commodity price rise with one-quarter lag
Have not been facing issues related to supply-chain; it’s been smooth
Will outperform industry in FY22; industry seen growing at 20-25%
Have 15 plants, working at an average capacity utilisation of 70-75%
PLI scheme will be supportive to capex plans
Won’t go to market for fund; raised Rs. 400 crore via QIP in September 2020
VA Tech Wabag: Projects worth Rs. 2500 crore to be executed over 24 months; Rajneesh Chopra, Global Head-Biz Development Rs. 2500 crore worth of projects will be executed over 24 months
Internal rate of return is as per expectations of all partners
We will end this year with growth despite the pandemic
Our EBITDA will grow at a better pace than our topline next year
There is now a lot of traction and we will have new tenders in Q1FY22
Allcargo Logistics: Shipping sector will recover fast; container freight rates may rise; Shashi Kiran Shetty Suez Canal blockade impacted 2% of the overall available containers
Now that Ever Given is floating again, 70-80 ships of the 400 waiting will move daily
Suez Canal blockade will have an impact on container shortage
Shipping world will recover fast, don’t see any major challenge
Important cargo moved by air during the time of Suez blockade
Freight rates will go up on the container side; availability of containers is disrupted
in the short term
FY22 likely to be stable for company; gained market share in FY21
Gati turnaround is on its right path
Gati’s debt and contingent liability has been reduced
Liberty Shoes: Retail demand back to 90-95% of pre-COVID; government business strong; Adesh Gupta, CEO Retail demand is back to 90-95% vs last year
Optimistic about demand for the next 2 quarters
Not worried as much about the second wave of COVID-19
Government tenders have been 75% higher than last year
Company’s business amidst CRPF has seen a jump of 100% YoY
95% of the payments have been recovered from the defence ministry
Order from Andhra Pradesh police has Rs. 30 crore outstanding
1 April 2021 21
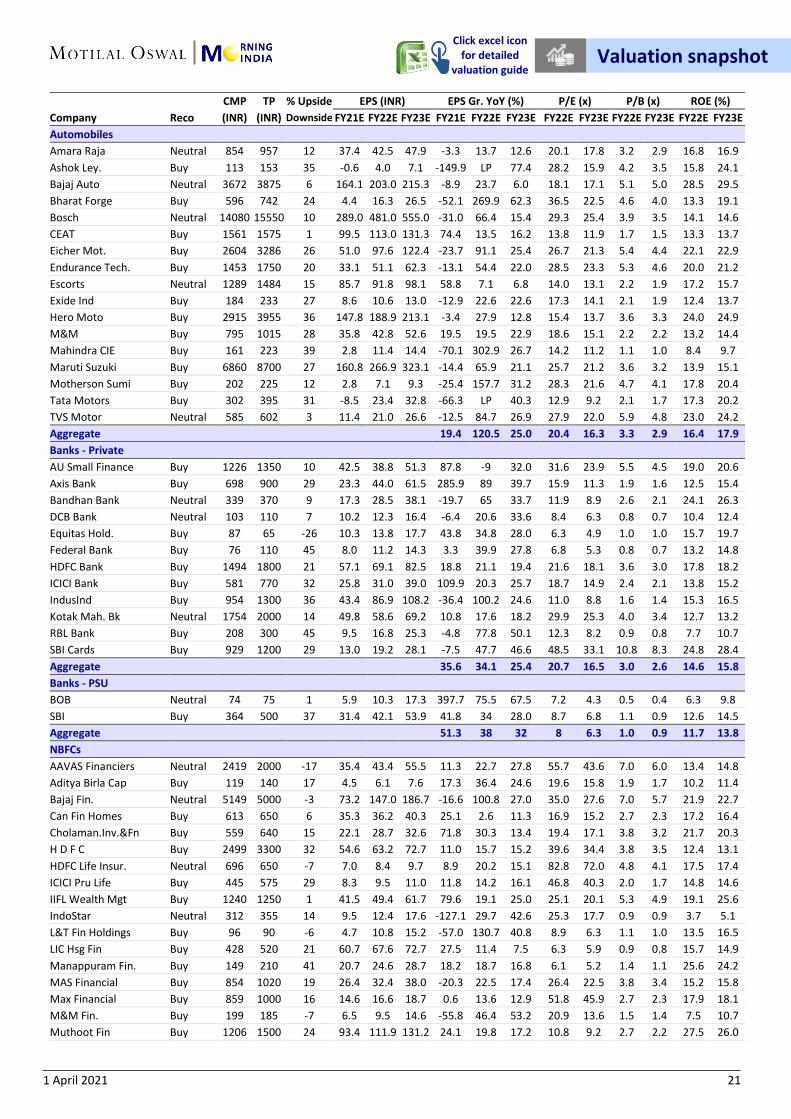
CMP TP % Upside EPS (INR) EPS Gr. YoY (%) P/E (x) P/B (x) ROE (%)
Company Reco (INR) (INR) Downside FY21E FY22E FY23E FY21E FY22E FY23E FY22E FY23E FY22E FY23E FY22E FY23E
Automobiles
Amara Raja Neutral 854 957 12 37.4 42.5 47.9 -3.3 13.7 12.6 20.1 17.8 3.2 2.9 16.8 16.9
Ashok Ley. Buy 113 153 35 -0.6 4.0 7.1 -149.9 LP 77.4 28.2 15.9 4.2 3.5 15.8 24.1
Bajaj Auto Neutral 3672 3875 6 164.1 203.0 215.3 -8.9 23.7 6.0 18.1 17.1 5.1 5.0 28.5 29.5
Bharat Forge Buy 596 742 24 4.4 16.3 26.5 -52.1 269.9 62.3 36.5 22.5 4.6 4.0 13.3 19.1
Bosch Neutral 14080 15550 10 289.0 481.0 555.0 -31.0 66.4 15.4 29.3 25.4 3.9 3.5 14.1 14.6
CEAT Buy 1561 1575 1 99.5 113.0 131.3 74.4 13.5 16.2 13.8 11.9 1.7 1.5 13.3 13.7
Eicher Mot. Buy 2604 3286 26 51.0 97.6 122.4 -23.7 91.1 25.4 26.7 21.3 5.4 4.4 22.1 22.9
Endurance Tech. Buy 1453 1750 20 33.1 51.1 62.3 -13.1 54.4 22.0 28.5 23.3 5.3 4.6 20.0 21.2
Escorts Neutral 1289 1484 15 85.7 91.8 98.1 58.8 7.1 6.8 14.0 13.1 2.2 1.9 17.2 15.7
Exide Ind Buy 184 233 27 8.6 10.6 13.0 -12.9 22.6 22.6 17.3 14.1 2.1 1.9 12.4 13.7
Hero Moto Buy 2915 3955 36 147.8 188.9 213.1 -3.4 27.9 12.8 15.4 13.7 3.6 3.3 24.0 24.9
M&M Buy 795 1015 28 35.8 42.8 52.6 19.5 19.5 22.9 18.6 15.1 2.2 2.2 13.2 14.4
Mahindra CIE Buy 161 223 39 2.8 11.4 14.4 -70.1 302.9 26.7 14.2 11.2 1.1 1.0 8.4 9.7
Maruti Suzuki Buy 6860 8700 27 160.8 266.9 323.1 -14.4 65.9 21.1 25.7 21.2 3.6 3.2 13.9 15.1
Motherson Sumi Buy 202 225 12 2.8 7.1 9.3 -25.4 157.7 31.2 28.3 21.6 4.7 4.1 17.8 20.4
Tata Motors Buy 302 395 31 -8.5 23.4 32.8 -66.3 LP 40.3 12.9 9.2 2.1 1.7 17.3 20.2
TVS Motor Neutral 585 602 3 11.4 21.0 26.6 -12.5 84.7 26.9 27.9 22.0 5.9 4.8 23.0 24.2
Aggregate 19.4 120.5 25.0 20.4 16.3 3.3 2.9 16.4 17.9
Banks - Private
AU Small Finance Buy 1226 1350 10 42.5 38.8 51.3 87.8 -9 32.0 31.6 23.9 5.5 4.5 19.0 20.6
Axis Bank Buy 698 900 29 23.3 44.0 61.5 285.9 89 39.7 15.9 11.3 1.9 1.6 12.5 15.4
Bandhan Bank Neutral 339 370 9 17.3 28.5 38.1 -19.7 65 33.7 11.9 8.9 2.6 2.1 24.1 26.3
DCB Bank Neutral 103 110 7 10.2 12.3 16.4 -6.4 20.6 33.6 8.4 6.3 0.8 0.7 10.4 12.4
Equitas Hold. Buy 87 65 -26 10.3 13.8 17.7 43.8 34.8 28.0 6.3 4.9 1.0 1.0 15.7 19.7
Federal Bank Buy 76 110 45 8.0 11.2 14.3 3.3 39.9 27.8 6.8 5.3 0.8 0.7 13.2 14.8
HDFC Bank Buy 1494 1800 21 57.1 69.1 82.5 18.8 21.1 19.4 21.6 18.1 3.6 3.0 17.8 18.2
ICICI Bank Buy 581 770 32 25.8 31.0 39.0 109.9 20.3 25.7 18.7 14.9 2.4 2.1 13.8 15.2
IndusInd Buy 954 1300 36 43.4 86.9 108.2 -36.4 100.2 24.6 11.0 8.8 1.6 1.4 15.3 16.5
Kotak Mah. Bk Neutral 1754 2000 14 49.8 58.6 69.2 10.8 17.6 18.2 29.9 25.3 4.0 3.4 12.7 13.2
RBL Bank Buy 208 300 45 9.5 16.8 25.3 -4.8 77.8 50.1 12.3 8.2 0.9 0.8 7.7 10.7
SBI Cards Buy 929 1200 29 13.0 19.2 28.1 -7.5 47.7 46.6 48.5 33.1 10.8 8.3 24.8 28.4
Aggregate 35.6 34.1 25.4 20.7 16.5 3.0 2.6 14.6 15.8
Banks - PSU
BOB Neutral 74 75 1 5.9 10.3 17.3 397.7 75.5 67.5 7.2 4.3 0.5 0.4 6.3 9.8
SBI Buy 364 500 37 31.4 42.1 53.9 41.8 34 28.0 8.7 6.8 1.1 0.9 12.6 14.5
Aggregate 51.3 38 32 8 6.3 1.0 0.9 11.7 13.8
NBFCs
AAVAS Financiers Neutral 2419 2000 -17 35.4 43.4 55.5 11.3 22.7 27.8 55.7 43.6 7.0 6.0 13.4 14.8
Aditya Birla Cap Buy 119 140 17 4.5 6.1 7.6 17.3 36.4 24.6 19.6 15.8 1.9 1.7 10.2 11.4
Bajaj Fin. Neutral 5149 5000 -3 73.2 147.0 186.7 -16.6 100.8 27.0 35.0 27.6 7.0 5.7 21.9 22.7
Can Fin Homes Buy 613 650 6 35.3 36.2 40.3 25.1 2.6 11.3 16.9 15.2 2.7 2.3 17.2 16.4
Cholaman.Inv.&Fn Buy 559 640 15 22.1 28.7 32.6 71.8 30.3 13.4 19.4 17.1 3.8 3.2 21.7 20.3
H D F C Buy 2499 3300 32 54.6 63.2 72.7 11.0 15.7 15.2 39.6 34.4 3.8 3.5 12.4 13.1
HDFC Life Insur. Neutral 696 650 -7 7.0 8.4 9.7 8.9 20.2 15.1 82.8 72.0 4.8 4.1 17.5 17.4
ICICI Pru Life Buy 445 575 29 8.3 9.5 11.0 11.8 14.2 16.1 46.8 40.3 2.0 1.7 14.8 14.6
IIFL Wealth Mgt Buy 1240 1250 1 41.5 49.4 61.7 79.6 19.1 25.0 25.1 20.1 5.3 4.9 19.1 25.6
IndoStar Neutral 312 355 14 9.5 12.4 17.6 -127.1 29.7 42.6 25.3 17.7 0.9 0.9 3.7 5.1
L&T Fin Holdings Buy 96 90 -6 4.7 10.8 15.2 -57.0 130.7 40.8 8.9 6.3 1.1 1.0 13.5 16.5
LIC Hsg Fin Buy 428 520 21 60.7 67.6 72.7 27.5 11.4 7.5 6.3 5.9 0.9 0.8 15.7 14.9
Manappuram Fin. Buy 149 210 41 20.7 24.6 28.7 18.2 18.7 16.8 6.1 5.2 1.4 1.1 25.6 24.2
MAS Financial Buy 854 1020 19 26.4 32.4 38.0 -20.3 22.5 17.4 26.4 22.5 3.8 3.4 15.2 15.8
Max Financial Buy 859 1000 16 14.6 16.6 18.7 0.6 13.6 12.9 51.8 45.9 2.7 2.3 17.9 18.1
M&M Fin. Buy 199 185 -7 6.5 9.5 14.6 -55.8 46.4 53.2 20.9 13.6 1.5 1.4 7.5 10.7
Muthoot Fin Buy 1206 1500 24 93.4 111.9 131.2 24.1 19.8 17.2 10.8 9.2 2.7 2.2 27.5 26.0
Valuation snapshot
Click excel icon for detailed
valuation guide

1 April 2021 22
CMP TP % Upside EPS (INR) EPS Gr. YoY (%) P/E (x) P/B (x) ROE (%)
Company Reco (INR) (INR) Downside FY21E FY22E FY23E FY21E FY22E FY23E FY22E FY23E FY22E FY23E FY22E FY23E
Piramal Enterp. Buy 1752 2170 24 119.6 127.2 156.6 -587.6 6.4 23.1 13.8 11.2 1.1 1.0 8.4 9.5
PNB Housing Neutral 375 400 7 63.0 70.5 87.7 64.0 11.9 24.3 5.3 4.3 0.6 0.6 12.8 14.2
Repco Home Fin Buy 337 430 28 49.7 51.3 55.6 10.9 3.2 8.4 6.6 6.1 0.9 0.8 14.4 13.7
SBI Life Insurance Buy 881 1050 19 13.5 19.2 24.2 -5.3 42.2 26.4 46.0 36.4 2.4 2.0 18.0 18.7
Shriram City Union Buy 1363 1400 3 146.0 182.3 224.7 -3.7 24.9 23.2 7.5 6.1 1.0 0.9 13.9 15.1
Shriram Trans. Buy 1422 1575 11 103.7 131.3 149.8 -6.0 26.6 14.1 10.8 9.5 1.4 1.3 14.2 14.3
Aggregate 18.6 31.0 20.1 21.8 18.1 2.9 2.6 13.5 14.4
Capital Goods/Consumer Durables
ABB Buy 1417 1565 10 11.9 20.6 27.1 -28.4 73.7 31.4 68.7 52.3 7.6 6.9 11.1 13.2
Bharat Elec. Buy 125 150 20 6.8 8.6 9.4 -7.2 25.4 9.7 14.6 13.3 2.5 2.2 17.1 16.9
BHEL Sell 49 26 -47 -2.5 1.3 1.9 -41.3 LP 43.5 37.0 25.8 0.6 0.6 1.6 2.3
Blue Star Sell 937 740 -21 9.2 18.0 25.3 -39.8 95.8 40.5 52.0 37.0 10.2 9.2 19.6 24.8
CG Cons. Elec. Buy 394 485 23 8.4 10.6 12.1 19.9 27.1 13.7 37.0 32.6 11.3 9.4 30.5 28.7
Cummins Sell 920 515 -44 19.0 22.5 25.8 -18.2 18.3 14.4 40.8 35.7 5.5 5.3 13.5 14.8
Engineers India Buy 77 85 10 5.6 7.5 7.6 -17.0 32.6 1.2 10.3 10.2 2.1 2.1 19.3 19.1
Havells Neutral 1050 1100 5 16.5 19.6 22.0 40.7 18.8 12.2 53.6 47.8 11.3 9.8 21.2 20.6
K E C Intl. Buy 410 450 10 22.0 26.3 30.0 0.0 19.5 14.2 15.6 13.7 2.7 2.3 17.5 16.9
Larsen & Toubro Buy 1418 1625 15 81.2 66.0 77.7 19.4 -18.7 17.7 21.5 18.3 2.4 2.2 11.4 12.2
Orient Electric Buy 311 350 13 5.3 6.5 7.7 42.8 23.1 18.8 47.8 40.2 13.5 11.5 28.2 28.6
Siemens Neutral 1844 1640 -11 21.3 35.0 36.9 -32.6 64.5 5.5 52.7 50.0 6.3 5.7 11.9 11.4
Thermax Neutral 1346 1100 -18 22.4 33.2 39.6 18.7 48.3 19.1 40.5 34.0 4.5 4.1 11.0 12.0
Voltas Neutral 1002 1170 17 14.3 20.8 24.1 -14.7 45.9 15.9 48.1 41.5 6.5 5.9 13.5 14.1
Whirlpool India Buy 2230 3020 35 27.3 45.5 54.9 -27.4 66.8 20.8 49.1 40.6 8.5 7.2 17.4 17.8
Aggregate -15.6 51.3 16.1 29.5 25.4 3.3 3.1 11.3 12.1
Cement
Ambuja Cem. Neutral 309 275 -11 9.0 8.8 10.4 24.2 -2.1 18.1 35.0 29.6 2.8 2.6 8.4 9.2
ACC Buy 1903 2100 10 78.4 93.0 98.4 8.5 18.6 5.8 20.5 19.3 2.5 2.3 13.1 12.4
Birla Corp. Buy 950 900 -5 71.7 79.6 93.3 9.2 11.1 17.2 11.9 10.2 1.3 1.1 11.0 11.7
Dalmia Bhar. Buy 1587 1495 -6 44.6 45.1 66.7 288.3 1.2 47.7 35.2 23.8 2.5 2.3 7.3 10.0
Grasim Inds. Neutral 1452 1215 -16 82.3 97.4 112.8 -6.8 18.3 15.9 14.9 12.9 2.4 2.3 3.9 5.1
India Cem Neutral 168 160 -4 6.1 5.1 7.2 785.5 -15.7 39.7 32.6 23.4 0.9 0.9 2.8 3.8
J K Cements Buy 2894 2640 -9 81.3 100.6 124.1 30.0 23.7 23.4 28.8 23.3 5.4 4.4 20.3 20.9
JK Lakshmi Ce Buy 433 440 2 25.4 26.1 32.6 12.7 2.7 24.7 16.6 13.3 2.2 1.9 14.3 15.4
Ramco Cem Neutral 1003 805 -20 33.1 32.6 38.7 29.6 -1.5 18.9 30.8 25.9 3.8 3.4 12.9 13.7
Shree Cem Neutral 29475 24300 -18 663.0 702.8 784.7 52.4 6.0 11.6 41.9 37.6 6.1 5.3 15.6 15.1
Ultratech Buy 6737 6650 -1 189.0 225.6 277.8 42.2 19.4 23.2 29.9 24.3 3.7 3.4 13.8 14.9
Aggregate 22.9 13.2 18.8 25.2 21.2 3.2 2.9 12.6 13.6
Consumer
Asian Paints Neutral 2537 2790 10 34.8 40.1 46.4 20.2 15.1 15.9 63.3 54.6 18.8 16.7 31.4 32.4
Britannia Buy 3628 4120 14 82.1 79.4 91.5 40.0 -3.3 15.2 45.7 39.6 18.0 16.5 41.1 43.5
Colgate Buy 1560 1810 16 36.1 40.0 45.3 20.4 10.7 13.3 39.0 34.4 25.6 25.6 65.6 74.3
Dabur Buy 541 640 18 9.9 11.4 13.3 15.0 14.4 17.0 47.6 40.7 11.9 10.6 26.2 27.5
Emami Buy 488 560 15 16.9 17.0 18.7 36.5 0.2 10.1 28.8 26.1 10.2 10.2 35.5 39.0
Godrej Cons. Neutral 729 720 -1 16.8 17.8 20.6 18.7 5.7 15.9 41.0 35.4 8.5 8.2 21.2 23.6
HUL Buy 2431 2690 11 34.1 41.7 48.9 9.3 22.1 17.3 58.3 49.7 11.3 11.3 19.7 22.6
ITC Neutral 219 220 1 10.3 13.1 14.8 -17.0 27.1 12.6 16.7 14.8 4.0 3.8 24.2 26.2
Jyothy Lab Neutral 137 151 10 5.7 5.9 6.2 25.7 3.8 4.9 23.1 22.1 3.9 3.8 17.2 17.6
Marico Buy 412 490 19 8.7 9.8 11.4 6.4 13.1 16.2 42.0 36.1 13.0 12.0 31.5 34.5
Nestle Neutral 17170 17500 2 217.4 253.7 291.8 5.2 16.7 15.0 67.7 58.9 75.8 69.6 116.4 123.4
Page Inds Neutral 30336 28800 -5 303.7 457.3 523.0 -1.3 50.6 14.4 66.3 58.0 37.4 36.2 56.4 62.5
Pidilite Ind. Neutral 1810 1635 -10 22.7 25.5 29.7 -1.6 12.3 16.4 70.9 60.9 14.1 12.2 21.3 21.4
P&G Hygiene Buy 12457 14000 12 180.8 232.9 280.4 32.5 28.8 20.4 53.5 44.4 30.4 26.8 60.3 64.1
Tata Consumer Buy 639 680 6 10.5 13.3 15.5 32.1 26.3 16.5 48.0 41.2 3.8 3.6 8.2 9.1
United Brew Sell 1242 972 -22 7.2 15.3 20.6 -55.8 113.9 34.5 81.1 60.3 8.3 7.7 10.6 13.2
United Spirits Buy 556 725 30 5.7 12.9 17.1 -47.6 126.8 32.5 43.0 32.5 8.0 6.4 18.5 19.7
Valuation snapshot
Click excel icon for detailed
valuation guide

1 April 2021 23
CMP TP % Upside EPS (INR) EPS Gr. YoY (%) P/E (x) P/B (x) ROE (%)
Company Reco (INR) (INR) Downside FY21E FY22E FY23E FY21E FY22E FY23E FY22E FY23E FY22E FY23E FY22E FY23E
Varun Beverages Buy 1006 1145 14 13.7 28.7 38.1 -15.7 109.4 32.8 35.1 26.4 6.8 5.5 21.3 23.0
Aggregate 1.6 21.1 15.4 41.3 35.8 9.7 9.2 23.5 25.7
Healthcare
Alembic Phar Neutral 965 1070 11 59.4 52.4 57.3 35.1 -11.8 9.4 18.4 16.8 3.3 2.9 20.1 19.0
Alkem Lab Buy 2772 3430 24 129.2 137.0 152.9 35.4 6.0 11.6 20.2 18.1 3.8 3.3 20.5 19.6
Ajanta Pharma Buy 1793 2030 13 69.6 78.1 90.5 36.1 12.2 15.9 23.0 19.8 4.4 3.8 20.6 20.4
Aurobindo Buy 882 1100 25 54.5 61.1 68.6 10.9 12.0 12.3 14.4 12.9 2.0 1.8 15.1 14.7
Biocon Neutral 409 385 -6 6.0 9.3 12.0 -2.5 54.4 29.2 43.9 34.0 6.1 5.4 14.7 16.9
Cadila Buy 441 550 25 20.0 23.3 24.7 36.1 16.4 6.0 18.9 17.9 2.9 2.6 16.2 15.2
Cipla Neutral 815 900 10 33.6 36.6 41.8 71.1 9.0 14.3 22.3 19.5 3.1 2.7 14.0 13.9
Divis Lab Buy 3630 4530 25 76.4 99.5 129.3 56.2 30.2 29.9 36.5 28.1 8.8 7.0 26.5 27.7
Dr Reddy’s Neutral 4516 5070 12 158.1 180.0 210.6 20.3 13.9 17.0 25.1 21.4 3.7 3.2 15.6 15.9
Gland Pharma Buy 2478 2900 17 57.7 72.6 92.3 15.9 25.7 27.1 34.1 26.9 5.8 4.8 18.5 19.4
Glenmark Neutral 465 540 16 34.3 35.6 40.7 39.4 3.8 14.3 13.1 11.4 1.7 1.5 13.6 13.7
GSK Pharma Neutral 1440 1500 4 29.8 36.0 40.8 5.7 20.7 13.5 40.0 35.3 11.4 10.0 28.6 28.4
Granules India Buy 303 460 52 22.5 26.3 30.3 72.5 17.1 15.1 11.5 10.0 2.7 2.2 26.0 24.2
IPCA Labs Buy 1903 2420 27 95.2 95.5 102.7 85.2 0.3 7.6 19.9 18.5 4.2 3.5 23.3 20.8
Jubilant Pharmova Buy 680 1120 65 58.7 60.3 69.1 -1.9 2.8 14.6 11.3 9.8 2.2 1.8 21.6 20.5
Laurus Labs Buy 362 470 30 18.3 22.5 27.4 282.5 23.4 21.4 16.1 13.2 5.3 4.0 38.7 34.5
Lupin Buy 1021 1180 16 25.3 39.4 45.6 8.6 55.4 15.7 25.9 22.4 3.2 2.9 12.8 13.4
Strides Pharma Buy 845 980 16 25.8 44.1 54.4 70.0 70.9 23.2 19.1 15.5 2.5 2.2 13.6 15.1
Sun Pharma Buy 598 740 24 25.7 26.8 29.9 56.5 4.4 11.6 22.3 20.0 2.7 2.4 12.9 12.9
Torrent Pharma Neutral 2541 2520 -1 73.8 88.5 100.4 31.6 19.9 13.4 28.7 25.3 6.5 5.6 24.6 23.9
Aggregate 38.0 14.0 15.2 23.0 19.9 3.6 3.1 15.6 15.7
Infrastructure
Ashoka Buildcon Buy 102 145 43 13.2 11.2 12.8 -4.6 -15.0 14.6 9.1 7.9 0.9 0.8 10.2 10.7
IRB Infra Neutral 109 122 12 3.9 5.9 9.7 -79.2 51.2 64.0 18.3 11.2 0.6 0.5 3.1 4.9
KNR Constructions Buy 213 265 24 9.1 12.8 16.5 26.0 40.4 28.4 16.6 12.9 2.7 2.3 17.8 19.1
Aggregate 13.9 10.5 1.0 0.9 7.2 8.8
Media
PVR Neutral 1224 1620 32 -89.1 17.1 36.7 -376.7 LP 113.8 71.4 33.4 3.5 3.1 5.0 9.9
Sun TV Buy 470 640 36 38.6 39.8 40.0 10.9 3.1 0.6 11.8 11.7 2.7 2.6 23.9 22.5
Zee Ent. Neutral 203 265 30 7.3 17.1 19.4 32.5 135.2 13.8 11.9 10.4 1.8 1.6 15.9 15.9
Aggregate -21.6 70.0 10.7 13.6 12.3 2.3 2.0 16.6 16.6
Metals
Hindalco Buy 327 390 19 23.1 32.9 36.9 31.9 42.6 12.2 9.9 8.9 1.5 1.3 16.8 16.2
Hind. Zinc Neutral 273 268 -2 18.8 27.2 26.7 16.6 44.7 -1.7 10.0 10.2 3.1 2.8 33.3 29.2
JSPL Buy 344 385 12 54.5 33.8 35.3 -801.9 -38.1 4.7 10.2 9.7 1.0 0.9 10.6 10.0
JSW Steel Buy 468 435 -7 30.7 43.9 40.2 239.7 43.1 -8.6 10.7 11.6 2.1 1.8 21.8 16.7
Nalco Buy 54 59 9 3.4 5.1 5.4 357.1 49.8 5.5 10.6 10.1 1.0 1.0 9.3 9.6
NMDC Buy 135 140 4 20.9 21.8 18.7 36.8 4.2 -14.5 6.2 7.2 1.2 1.1 20.6 16.0
SAIL Buy 79 104 32 14.4 18.5 17.0 ###### 28 -8.6 4.3 4.6 0.6 0.6 15.8 13.0
Tata Steel Neutral 812 708 -13 64.6 85.7 89.0 613.3 33 3.8 9.5 9.1 1.1 1.0 12.7 11.9
Vedanta Neutral 229 182 -20 24.4 24.4 24.1 177.9 0 -0.9 9.4 9.5 1.4 1.3 14.8 14.1
Aggregate 162.8 20.8 -1.9 8.8 9.0 1.4 1.2 15.3 13.7
Oil & Gas
Aegis Logistics Buy 298 330 11 6.2 10.7 13.3 107.7 72.3 25.1 27.9 22.3 4.9 4.3 18.7 20.6
BPCL Buy 428 520 22 42.6 34.0 41.5 67.9 -20.1 22.1 12.6 10.3 1.9 1.7 15.8 17.6
Castrol India Buy 125 170 36 5.9 8.5 8.5 -29.6 44.4 -0.3 14.7 14.8 7.8 7.1 56.2 50.3
GAIL Buy 136 170 25 9.9 15.6 16.6 -39.8 58.0 6.2 8.7 8.2 1.1 1.0 14.3 13.9
Gujarat Gas Buy 550 560 2 17.8 19.9 23.3 2.9 11.8 17.0 27.6 23.6 6.9 5.5 28.0 26.1
Gujarat St. Pet. Buy 273 390 43 14.8 16.8 17.9 -24.5 13.3 6.3 16.2 15.3 1.9 1.7 12.1 11.6
HPCL Neutral 235 277 18 55.5 40.6 42.4 132.1 -26.8 4.5 5.8 5.5 1.1 1.0 18.6 18.7
IOC Buy 92 142 55 15.8 15.6 19.0 53.6 -1.0 21.8 5.9 4.8 0.8 0.7 13.8 15.9
IGL Neutral 511 520 2 14.9 17.6 18.8 -8.2 17.7 7.3 29.1 27.1 5.2 4.5 19.3 17.9
Valuation snapshot
Click excel icon for detailed
valuation guide

1 April 2021 24
CMP TP % Upside EPS (INR) EPS Gr. YoY (%) P/E (x) P/B (x) ROE (%)
Company Reco (INR) (INR) Downside FY21E FY22E FY23E FY21E FY22E FY23E FY22E FY23E FY22E FY23E FY22E FY23E
Mahanagar Gas Buy 1167 1290 11 67.2 78.5 80.6 -16.3 16.8 2.7 14.9 14.5 3.1 2.7 21.9 20.0
MRPL Neutral 39 38 -2 -2.2 4.0 7.2 -85.5 LP 81.2 9.8 5.4 0.9 0.8 9.0 14.8
Oil India Buy 123 155 26 17.9 19.7 22.0 -21.7 10.1 11.7 6.2 5.6 0.5 0.5 7.7 8.6
ONGC Buy 102 125 22 10.7 21.8 23.8 -18.4 103.7 9.2 4.7 4.3 0.6 0.5 10.7 10.7
PLNG Buy 225 325 45 18.2 22.5 24.8 -1.5 23.8 10.3 10.0 9.1 2.6 2.4 27.5 27.9
Reliance Ind. Buy 2003 2325 16 68.2 100.7 121.9 2.5 47.8 21.0 19.9 16.4 2.3 2.0 12.0 13.0
Aggregate 10.0 32.2 16.9 13.8 11.8 1.7 1.5 12.0 12.8
Retail
Avenue Supermarts Neutral 2854 2850 0 17.6 30.5 38.4 -12.4 73.5 25.8 93.5 74.3 12.5 10.7 15.0 16.1
Aditya Birla Fashion Buy 201 230 14 -2.2 -0.1 0.3 1,107.2 Loss LP NM 633.4 23.0 22.2 -1.8 3.6
Jubilant Food. Neutral 2913 2920 0 15.8 38.3 53.1 -30.1 143.1 38.5 76.0 54.9 24.9 19.6 32.8 35.8
Shoppers Stop Neutral 215 220 2 -34.1 -15.4 -15.0 131.8 Loss Loss NM NM -68.3 -11.8 -338.3 141.0
Titan Company Buy 1557 1800 16 9.7 23.0 30.0 -43.0 136.6 30.1 67.6 52.0 17.6 15.5 27.8 31.6
Trent Neutral 752 660 -12 -3.5 4.5 8.0 -218.0 LP 79.8 168.3 93.6 10.3 9.2 6.8 11.1
V-Mart Retail Buy 2768 3500 26 -10.6 25.0 43.4 -139.0 LP 73.8 110.9 63.8 10.3 8.9 9.8 15.0
Westlife Develop Neutral 459 520 13 -6.3 1.6 6.1 ###### LP 274.8 280.5 74.8 14.0 11.8 5.1 17.2
Aggregate -67.7 351.5 37.3 89.3 65.0 13.7 11.9 15.3 18.3
Technology
Cyient Buy 649 660 2 33.2 43.7 47.3 -1.5 31.5 8.3 14.8 13.7 2.3 2.0 16.1 15.6
HCL Tech. Buy 983 1300 32 48.0 56.5 65.0 18.0 17.5 15.1 17.4 15.1 4.1 3.8 24.6 25.9
Infosys Buy 1368 1600 17 46.4 56.9 67.2 19.3 22.6 18.0 24.0 20.4 8.2 7.8 34.8 39.2
L & T Infotech Neutral 4048 3780 -7 107.3 128.2 151.1 23.9 19.5 17.8 31.6 26.8 8.7 7.2 30.6 29.7
L&T Technology Buy 2655 2830 7 64.3 91.0 109.0 -17.0 41.5 19.7 29.2 24.4 7.3 6.1 27.3 27.4
Mindtree Neutral 2085 1930 -7 65.9 75.3 84.1 71.9 14.2 11.7 27.7 24.8 7.4 6.2 29.3 27.2
Mphasis Buy 1783 1950 9 65.1 79.5 91.8 3.1 22.1 15.4 22.4 19.4 4.6 4.1 22.0 22.7
Coforge Neutral 2929 2690 -8 78.9 102.1 116.9 4.4 29.4 14.5 28.7 25.0 5.6 4.8 20.9 20.7
Persistent Sys Buy 1919 1800 -6 56.5 70.0 81.9 26.8 23.9 17.1 27.4 23.4 5.0 4.3 19.4 19.8
TCS Neutral 3178 3175 0 87.9 111.9 127.0 2.0 27.3 13.5 28.4 25.0 13.0 12.2 47.6 50.8
Tech Mah Neutral 991 1095 10 52.6 60.4 68.6 8.8 14.8 13.6 16.4 14.4 3.1 2.7 20.1 20.0
Wipro Neutral 414 450 9 18.5 21.6 23.9 12.5 17.1 10.6 19.2 17.3 4.4 4.4 23.2 25.8
Zensar Tech Neutral 274 265 -3 15.6 17.9 20.3 33.6 14.7 13.4 15.3 13.5 2.3 2.0 16.3 16.3
Aggregate 10.3 22.4 14.6 24.6 21.4 7.6 7.1 31.1 33.3
Telecom
Bharti Airtel Buy 517 720 39 0.8 4.6 8.2 -110.6 483.5 76.2 111.8 63.4 4.3 4.0 3.9 6.5
Indus Towers Neutral 245 245 0 18.2 20.8 20.0 17.6 14.5 -3.8 11.8 12.2 4.1 3.8 35.8 32.1
Vodafone Idea 9 -8.5 -7.3 -6.8 12.2 Loss Loss NM NM -0.7 -0.5 72.8 39.6
Tata Comm Neutral 1063 950 -11 48.1 58.7 68.8 355.4 22.0 17.2 18.1 15.4 17.9 8.3 196 73.4
Aggregate Loss Loss Loss -35 -50.9 8.8 12.1 -25.4 -23.8
Utiltites
Coal India Buy 130 178 37 18.0 24.7 29.5 -33.7 37.2 19.8 5.3 4.4 1.8 1.5 34.5 33.9
CESC Buy 593 873 47 97.3 96.9 103.9 -0.5 -0.4 7.2 6.1 5.7 0.7 0.7 12.1 12.2
Indian Energy Exchange Buy 333 355 7 6.8 8.4 9.8 14.5 22.3 17.8 39.8 33.8 18.9 16.2 51.0 51.5
JSW Energy Neutral 88 85 -3 4.8 5.9 6.9 -5.8 22.2 18.4 15.0 12.7 1.1 1.1 7.7 8.8
NHPC Neutral 24 26 6 2.9 2.9 3.4 -0.2 1.0 19.0 8.5 7.1 0.7 0.7 8.6 9.8
NTPC Buy 106 141 32 15.4 16.8 18.1 11.3 9.6 7.7 6.3 5.9 0.8 0.7 12.8 13.1
Power Grid Buy 216 248 15 23.9 25.9 27.2 13.0 8.5 5.0 8.3 7.9 1.5 1.4 18.7 18.2
Torrent Power Buy 424 463 9 22.6 30.9 31.7 -19.4 37.1 2.3 13.7 13.4 1.8 1.7 14.0 13.0
Tata Power Buy 103 123 19 4.3 5.4 5.6 15.5 23.8 4.0 19.2 18.4 1.4 1.4 7.7 7.6
Aggregate -6.4 15.7 11.5 7.2 6.4 1.2 1.1 16.3 16.8
Others
BSE Buy 571 750 31 31.8 45.9 52.1 27.7 44.3 13.5 12.4 11.0 1.0 1.0 8.2 8.9
Concor Buy 597 555 -7 13.4 15.9 19.7 -19.5 19.0 24.0 37.5 30.3 3.4 3.2 9.1 10.9
Coromandel Intl Buy 774 1071 38 49.5 55.1 59.5 36.2 11.2 8.0 14.1 13.0 3.6 3.0 27.8 25.3
EPL Buy 236 333 41 8.6 11.3 13.3 25.8 31.4 18.4 20.9 17.7 3.9 3.4 20.0 20.5
Indiamart Inter. Buy 7733 9000 16 105.1 120.4 145.3 104.9 14.5 20.7 64.2 53.2 16.5 11.4 49.8 40.4
Valuation snapshot
Click excel icon for detailed
valuation guide

1 April 2021 25
CMP TP % Upside EPS (INR) EPS Gr. YoY (%) P/E (x) P/B (x) ROE (%)
Company Reco (INR) (INR) Downside FY21E FY22E FY23E FY21E FY22E FY23E FY22E FY23E FY22E FY23E FY22E FY23E
Indian Hotels Buy 111 143 29 -6.8 0.8 2.0 -348.7 LP 165.4 143.7 54.1 3.6 3.5 2.5 6.5
Interglobe Neutral 1635 1525 -7 -143.5 45.2 95.3 2,122.5 LP 111 36 17.2 33.5 12.3 156.3 105.0
Info Edge Neutral 4276 5440 27 21.5 28.6 39.1 28.6 33.0 36.5 149.5 109.5 11.9 11.1 8.1 10.5
Godrej Agrovet Buy 524 645 23 16.4 20.2 23.8 23.8 23.0 17.8 26.0 22.1 4.5 4.0 18.2 19.0
Kaveri Seed Buy 514 633 23 52.2 53.2 57.6 21.1 2.1 8.1 9.6 8.9 2.6 2.3 27.9 27.4
Lemon Tree Hotel Buy 37 50 35 -1.7 0.0 0.6 1,306.7 LP 9,400.7 5,625.9 59.2 4.2 3.9 0.1 6.9
MCX Buy 1513 2050 36 46.6 48.3 64.2 0.4 3.8 32.8 31.3 23.6 5.4 4.8 17.9 21.5
Quess Corp Buy 699 745 7 13.3 34.1 43.9 -27.0 156.3 28.7 20.5 15.9 2.7 2.2 17.9 19.2
PI Inds. Buy 2255 2659 18 51.0 66.8 80.6 69.6 31.0 20.6 33.7 28.0 5.5 4.7 17.7 18.1
SIS Buy 390 620 59 22.7 23.4 29.1 40.6 3.1 24.5 16.7 13.4 1.3 1.1 18.4 18.9
SRF Buy 5407 6315 17 193.0 233.3 282.3 24.4 20.9 21.0 23.2 19.2 4.0 3.4 18.6 19.0
Tata Chemicals Buy 751 547 -27 16.1 34.7 44.3 -49.0 115.0 27.7 21.7 17.0 1.4 1.4 6.7 8.2
Team Lease Serv. Buy 3763 3090 -18 52.6 84.0 113.6 7.6 59.7 35.3 44.8 33.1 8.0 6.4 19.6 21.5
Trident Buy 14 19 35 0.7 1.0 1.3 5.6 53.4 29.2 13.5 10.4 1.8 1.6 14.4 16.2
UPL Neutral 642 631 -2 41.4 49.0 57.4 19.0 18.2 17.2 13.1 11.2 1.5 1.3 18.8 18.9
Valuation snapshot
Click excel icon for detailed
valuation guide

1 April 2021 26
Index 1 Day (%) 1M (%) 12M (%) Index 1 Day (%) 1M (%) 12M (%)
Sensex -1.3 0.8 68.0 Nifty 500 -0.6 1.1 76.0
Nifty-50 -1.0 1.1 70.9 Nifty Midcap 100 0.4 1.8 102.4
Nifty Next 50 0.3 -0.1 61.8 Nifty Smallcap 100 0.4 0.8 125.7
Nifty 100 -0.9 1.0 69.6 Nifty Midcap 150 0.4 2.0 100.1
Nifty 200 -0.7 1.1 73.0 Nifty Smallcap 250 0.5 0.9 117.2
Company 1 Day (%) 1M (%) 12M (%) Company 1 Day (%) 1M (%) 12M (%)
Automobiles 0.0 -3.0 108.5 IIFL Wealth Mgt 0.8 2.7 25.6
Amara Raja Batt. -0.2 -3.5 78.5 PNB Housing -1.8 -14.8 129.5
Ashok Leyland -0.2 -12.0 163.5 Repco Home 1.7 0.9 187.1
Bajaj Auto 0.1 -3.4 81.3 SBI Life Insuran 0.9 1.5 37.4
Bharat Forge 0.9 -2.3 154.7 Shriram City Union 0.7 -12.9 84.1
Bosch -1.2 -5.2 49.6 Shriram Trans. 0.1 10.9 120.1
CEAT 0.6 -2.1 98.4 Capital Goods -0.4 -2.0 92.1
Eicher Motors -1.3 4.3 99.0 ABB -1.5 -7.5 52.0
Endurance Tech. -0.7 0.9 142.4 Bharat Elec. -0.3 -8.8 68.3
Escorts 1.2 -1.7 94.4 BHEL -0.4 2.3 134.4
Exide Inds. -1.4 -9.4 39.8 Cummins 2.3 16.6 182.5
Hero Motocorp -1.6 -9.7 82.9 Engineers India 0.3 -3.8 28.3
M & M 0.0 -1.2 179.0 K E C Intl 1.2 -4.7 121.2
Mahindra CIE -1.3 -11.1 131.9 L&T -0.3 -1.7 75.8
Maruti Suzuki 0.1 -0.2 60.0 Siemens 0.5 -0.3 65.9
Motherson Sumi -0.3 -5.8 230.1 Thermax 0.8 -0.9 82.0
Tata Motors 1.7 -6.5 324.8 Consumer Durables 0.7 3.4 69.5
TVS Motor Co. 1.8 -1.7 97.1 Blue Star 2.6 7.8 103.5
Banks-Private -1.9 -4.2 74.6 CG Cons. Elec. 2.0 2.1 88.5
AU Small Fin. Bank -5.2 8.8 141.0 Havells 0.1 -5.2 118.8
Axis Bank 0.3 -3.8 83.9 Voltas 0.9 -1.5 109.2
Bandhan Bank 0.7 -1.8 66.3 Whirlpool India 1.0 -7.6 23.4
DCB Bank -3.0 -11.8 8.1 Orient Electric 0.2 15.0 57.5
Equitas Holdings 0.6 2.0 104.9 Cement 0.7 8.3 133.5
Federal Bank -0.1 -9.4 84.5 Ambuja Cem. 2.8 12.8 98.3
HDFC Bank -3.9 -2.7 73.3 ACC 1.5 9.8 96.6
ICICI Bank -1.7 -2.7 79.1 Birla Corp. 5.8 11.9 127.9
IndusInd Bank -1.0 -10.3 171.7 Dalmia Bhar. 0.1 10.6 224.6
Kotak Mah. Bank -1.5 -1.6 35.3 Grasim Inds. 2.2 21.0 205.4
RBL Bank -0.3 -11.8 53.0 India Cem 0.0 2.9 58.1
SBI Cards -1.2 -13.0 50.3 J K Cements -1.0 7.7 208.0
Banks-PSU 1.3 -9.8 62.9 JK Lakshmi Ce 3.1 16.1 121.0
BOB 2.6 -13.2 38.5 Ramco Cem 1.9 3.4 95.0
SBI 0.9 -6.6 85.0 Shree Cem 1.3 11.2 67.7
Company 1 Day (%) 1M (%) 12M (%) Ultratech -0.8 10.2 107.0
NBFCs -2.0 -2.3 68.7 Consumer 1.0 7.7 27.9
Aditya Birla Cap 0.3 -3.4 182.9 Asian Paints -1.6 11.4 52.2
Bajaj Fin. -0.8 -1.7 132.3 Britannia 0.3 7.9 34.9
Cholaman.Inv.&Fn 0.6 7.7 265.3 Colgate 0.4 -1.3 24.5
Can Fin Homes 2.1 28.0 119.7 Dabur 0.5 7.4 20.1
HDFC -4.1 -1.6 53.3 Emami -1.1 7.3 186.9
HDFC Life Insur. 1.2 -0.8 57.6 Godrej Cons. 0.3 6.3 40.0
Indostar Capital -0.4 -7.9 24.9 HUL 1.4 14.0 5.8
L&T Fin.Holdings 0.2 -8.6 100.9 ITC 1.8 7.1 27.0
LIC Hsg Fin 1.9 -0.3 82.0 Jyothy Lab -0.1 -8.0 46.0
M&M Fin. -0.6 -2.4 121.3 Marico 0.8 3.6 49.7
Muthoot Fin -0.2 -7.2 97.2 Nestle 0.3 6.7 5.3
Manappuram Fin. -0.5 -15.4 57.4 Page Inds -2.1 8.0 79.2
MAS Financial Serv. -0.2 -2.5 62.2 Pidilite Ind. -0.9 7.4 33.4
Max Financial -0.9 -0.8 123.0 P&G Hygiene 0.8 -3.5 19.2
ICICI Pru Life 3.0 -3.5 25.2 Tata Consumer 1.4 4.9 116.6
ICICI Sec -1.5 -6.2 37.7 United Brew 1.0 7.2 35.3
Index and MOFSL Universe stock performance

1 April 2021 27
Company 1 Day (%) 1M (%) 12M (%) Company 1 Day (%) 1M (%) 12M (%)
United Spirits 0.7 4.1 14.7 Retail
Varun Beverages -1.0 -3.2 89.6 Avenue Super. 0.7 -4.7 29.7
Healthcare 0.5 2.9 71.0 Jubilant Food -1.5 -2.8 98.1
Alembic Phar 0.9 5.0 80.9 Shoppers St. 0.5 3.8 17.4
Alkem Lab 1.1 2.0 19.0 Titan Co. 0.3 10.7 66.8
Ajanta Pharma -3.9 2.6 31.3 Trent -1.1 -7.2 56.8
Aurobindo 1.3 3.1 113.4 V-Mart Retail -0.4 4.8 96.0
Biocon 0.0 4.8 51.1 Westlife Develop -0.1 -8.3 43.4
Cadila 1.5 1.4 65.1 Technology -1.0 6.4 102.6
Cipla 0.3 3.6 92.7 Cyient 0.8 -1.0 182.4
Divis Lab 1.3 7.8 82.6 HCL Tech. -1.3 8.1 125.2
Dr Reddy’s -0.1 2.1 44.9 Infosys -1.3 9.2 113.6
Gland Pharma -0.7 3.2 L&T Infotech -2.9 12.5 182.9
Glenmark 0.6 -0.5 125.5 L&T Technology 0.5 3.4 128.4
GSK Pharma 1.1 -1.4 15.7 Mindtree -2.2 30.3 151.7
Granules -1.9 -6.2 111.2 Mphasis 0.2 8.3 168.4
IPCA Labs 0.8 2.9 37.1 Coforge -0.8 15.4 155.1
Jubilant Pharmo -3.1 -11.4 208.8 Persistent Sys 0.0 16.0 248.2
Laurus Labs 0.5 3.3 461.1 TCS 0.6 9.7 74.3
Lupin 1.4 0.2 73.1 Tech Mah -2.5 7.9 75.5
Strides Pharma -2.6 1.3 161.8 Wipro -0.9 1.0 110.7
Sun Pharma 0.0 0.4 69.7 Zensar Tech 0.7 -6.9 217.1
Torrent Pharma 0.4 4.6 28.9 Telecom -1.3 -7.3 33.4
Infrastructure -0.4 -0.5 73.2 Bharti Airtel -0.8 -7.1 17.4
Ashoka Buildcon 0.6 -9.8 146.4 Indus Towers -3.8 -4.7 53.2
IRB Infra.Devl. 5.1 0.9 104.8 Idea Cellular 0.4 -18.4 197.4
KNR Construct. 3.0 3.1 117.1 Tata Comm -2.6 -1.8 355.6
Media -0.1 -4.9 48.6 Utiltites -1.3 2.3 79.6
PVR -2.3 -10.1 5.3 Coal India -1.5 -14.3 -6.9
Sun TV 1.4 -4.7 64.5 CESC -0.5 -2.0 45.1
Zee Ent. 1.0 1.1 63.8 Indian Energy Ex -2.6 14.9 160.3
Metals 0.4 4.0 150.8 JSW Energy 1.0 22.4 106.5
Hindalco 0.2 -4.0 241.7 NHPC Ltd -2.8 1.2 22.6
Hind. Zinc 4.0 -8.2 75.8 NTPC -1.2 -0.7 26.4
JSPL 2.1 2.4 318.3 Power Grid -2.7 0.4 35.6
JSW Steel 0.1 18.2 219.5 Tata Power -0.3 8.5 214.2
Nalco -0.3 -10.0 85.2 Torrent Power 0.6 11.0 51.9
NMDC 2.3 6.5 69.1 Others
SAIL -0.4 3.1 242.1 BSE 0.9 -1.8 92.4
Tata Steel 1.5 13.6 201.0 Coromandel Intl 0.6 0.4 42.3
Vedanta -0.6 10.5 253.1 Concor 0.0 7.0 80.2
Oil & Gas -0.1 -4.7 47.9 EPL Ltd 2.0 9.6 52.4
Aegis Logistics 2.7 -3.5 113.7 Indiamart Inter. -1.2 -10.1 299.4
BPCL -0.6 -4.9 35.4 Godrej Agrovet 2.2 7.8 42.4
Castrol India 0.8 -3.2 25.6 Indian Hotels 4.9 -9.7 48.1
GAIL 2.3 -4.4 77.3 Interglobe 3.1 0.7 53.0
Gujarat Gas 2.4 11.2 136.3 Info Edge 2.1 -12.7 110.0
Gujarat St. Pet. 2.4 9.5 57.9 Kaveri Seed 5.3 1.2 50.7
HPCL 2.0 -2.4 23.3 Lemon Tree Hotel 3.8 -9.2 68.6
IOC 0.3 -6.3 12.4 MCX -1.1 0.0 33.8
IGL 0.0 3.7 31.4 Piramal Enterp. -0.7 -4.2 86.6
Mahanagar Gas 0.6 0.8 42.7 PI Inds. -0.9 3.3 92.8
MRPL -1.0 -3.6 68.0 Quess Corp 0.6 -7.0 230.5
Oil India -1.1 -2.9 48.3 SIS -1.7 -9.1 -9.5
ONGC -1.6 -8.1 49.6 SRF 0.0 -0.7 94.5
PLNG -0.9 -12.2 12.5 Tata Chemicals -0.1 1.7 236.9
Reliance Ind. -1.3 -3.9 81.8 Team Lease Serv. 2.1 11.4 146.5
Aditya Bir. Fas. -1.0 9.5 33.3 Trident -0.9 1.7 230.6
UPL 2.1 14.5 96.8
Index and MOFSL Universe stock performance

1 April 2021 28
Disclosures: The following Disclosures are being made in compliance with the SEBI Research Analyst Regulations 2014 (herein after referred to as the Regulations).
Motilal Oswal Financial Services Ltd. (MOFSL) is a SEBI Registered Research Analyst having registration no. INH000000412. MOFSL, the Research Entity (RE) as defined in the Regulations, is engaged in the business of providing Stock broking services, Investment Advisory Services, Depository participant services & distribution of various financial products. MOFSL is a subsidiary company of Passionate Investment Management Pvt. Ltd.. (PIMPL). MOFSL is a listed public company, the details in respect of which are available on www.motilaloswal.com. MOFSL (erstwhile Motilal Oswal Securities Limited - MOSL) is registered with the Securities & Exchange Board of India (SEBI) and is a registered Trading Member with National Stock Exchange of India Ltd. (NSE) and Bombay Stock Exchange Limited (BSE), Multi Commodity Exchange of India Limited (MCX) and National Commodity & Derivatives Exchange Limited (NCDEX) for its stock broking activities & is Depository participant with Central Depository Services Limited (CDSL) National Securities Depository Limited (NSDL),NERL, COMRIS and CCRL and is member of Association of Mutual Funds of India (AMFI) for distribution of financial products and Insurance Regulatory & Development Authority of India (IRDA) as Corporate Agent for insurance products. Details of associate entities of Motilal Oswal Financial Services Limited are available on the website at http://onlinereports.motilaloswal.com/Dormant/documents/Associate%20Details.pdf
Details of pending Enquiry Proceedings of Motilal Oswal Financial Services Limited are available on the website at https://galaxy.motilaloswal.com/ResearchAnalyst/PublishViewLitigation.aspx
MOFSL, it’s associates, Research Analyst or their relative may have any financial interest in the subject company. MOFSL and/or its associates and/or Research Analyst may have actual/beneficial ownership of 1% or more securities in the subject company in the past 12 months. MOFSL and its associate company(ies), their directors and Research Analyst and their relatives may; (a) from time to time, have a long or short position in, act as principal in, and buy or sell the securities or derivatives thereof of companies mentioned herein. (b) be engaged in any other transaction involving such securities and earn brokerage or other compensation or act as a market maker in the financial instruments of the company(ies) discussed herein or act as an advisor or lender/borrower to such company(ies) or may have any other potential conflict of interests with respect to any recommendation and other related information and opinions.; however the same shall have no bearing whatsoever on the specific recommendations made by the analyst(s), as the recommendations made by the analyst(s) are completely independent of the views of the associates of MOFSL even though there might exist an inherent conflict of interest in some of the stocks mentioned in the research report. Research Analyst may have served as director/officer, etc. in the subject company in the past 12 months. MOFSL and/or its associates may have received any compensation from the subject company in the past 12 months.
In the past 12 months , MOFSL or any of its associates may have: a) managed or co-managed public offering of securities from subject company of this research report, b) received compensation for investment banking or merchant banking or brokerage services from subject company of this research report, c) received compensation for products or services other than investment banking or merchant banking or brokerage services from the subject company of this research report. d) Subject Company may have been a client of MOFSL or its associates in the past 12 months.
MOFSL and it’s associates have not received any compensation or other benefits from the subject company or third party in connection with the research report. To enhance transparency, MOFSL has incorporated a Disclosure of Interest Statement in this document. This should, however, not be treated as endorsement of the views expressed in the report. MOFSL and / or its affiliates do and seek to do business including investment banking with companies covered in its research reports. As a result, the recipients of this report should be aware that MOFSL may have a potential conflict of interest that may affect the objectivity of this report. Compensation of Research Analysts is not based on any specific merchant banking, investment banking or brokerage service transactions. Above disclosures include beneficial holdings lying in demat account of MOFSL which are opened for proprietary investments only. While calculating beneficial holdings, It does not consider demat accounts which are opened in name of MOFSL for other purposes (i.e holding client securities, collaterals, error trades etc.). MOFSL also earns DP income from clients which are not considered in above disclosures. Above disclosures include beneficial holdings lying in demat account of MOFSL which are opened for proprietary investments only. While calculating beneficial holdings, It does not consider demat accounts which are opened in name of MOFSL for other purposes (i.e holding client securities, collaterals, error trades etc.). MOFSL also earns DP income from clients which are not considered in above disclosures.
Terms & Conditions: This report has been prepared by MOFSL and is meant for sole use by the recipient and not for circulation. The report and information contained herein is strictly confidential and may not be altered in any way, transmitted to, copied or distributed, in part or in whole, to any other person or to the media or reproduced in any form, without prior written consent of MOFSL. The report is based on the facts, figures and information that are considered true, correct, reliable and accurate. The intent of this report is not recommendatory in nature. The information is obtained from publicly available media or other sources believed to be reliable. Such information has not been independently verified and no guaranty, representation of warranty, express or implied, is made as to its accuracy, completeness or correctness. All such information and opinions are subject to change without notice. The report is prepared solely for informational purpose and does not constitute an offer document or solicitation of offer to buy or sell or subscribe for securities or other financial instruments for the clients. Though disseminated to all the customers simultaneously, not all customers may receive this report at the same time. MOFSL will not treat recipients as customers by virtue of their receiving this report. Analyst Certification The views expressed in this research report accurately reflect the personal views of the analyst(s) about the subject securit ies or issues, and no part of the compensation of the research analyst(s) was, is, or will be directly or indirectly related to the specific recommendations and views expressed by research analyst(s) in this report.
Disclosure of Interest Statement Companies where there is interest Analyst ownership of the stock No A graph of daily closing prices of securities is available at www.nseindia.com, www.bseindia.com. Research Analyst views on Subject Company may vary based on Fundamental research and Technical Research. Proprietary trading desk of MOFSL or its associates maintains arm’s length distance with Research Team as all the activities are segregated from MOFSL research activity and therefore it can have an independent view with regards to subject company for which Research Team have expressed their views.
Regional Disclosures (outside India) This report is not directed or intended for distribution to or use by any person or entity resident in a state, country or any jurisdiction, where such distribution, publication, availability or use would be contrary to law, regulation or which would subject MOFSL & its group companies to registration or licensing requirements within such jurisdictions.
For Hong Kong: This report is distributed in Hong Kong by Motilal Oswal capital Markets (Hong Kong) Private Limited, a licensed corporation (CE AYY-301) licensed and regulated by the Hong Kong Securities and Futures Commission (SFC) pursuant to the Securities and Futures Ordinance (Chapter 571 of the Laws of Hong Kong) “SFO”. As per SEBI (Research Analyst Regulations) 2014 Motilal Oswal Financial Services Limited(SEBI Reg No. INH000000412) has an agreement with Motilal Oswal capital Markets (Hong Kong) Private Limited for distribution of research report in Hong Kong. This report is intended for distribution only to “Professional Investors” as defined in Part I of Schedule 1 to SFO. Any investment or investment activity to which this document relates is only available to professional investor and will be engaged only with professional investors.” Nothing here is an offer or solicitation of these securities, products and services in any jurisdiction where their offer or sale is not qualified or exempt from registration. The Indian Analyst(s) who compile this report is/are not located in Hong Kong & are not conducting Research Analysis in Hong Kong.
For U.S: Motilal Oswal Financial Services Limited (MOFSL) is not a registered broker - dealer under the U.S. Securities Exchange Act of 1934, as amended (the"1934 act") and under applicable state laws in the United States. In addition MOFSL is not a registered investment adviser under the U.S. Investment Advisers Act of 1940, as amended (the "Advisers Act" and together with the 1934 Act, the "Acts), and under applicable state laws in the United States. Accordingly, in the absence of specific exemption under the Acts, any brokerage and investment services provided by MOFSL, including the products and services described herein are not available to or intended for U.S. persons. This report is intended for distribution only to "Major Institutional Investors" as defined by Rule 15a-6(b)(4) of the Exchange Act and interpretations thereof by SEC (henceforth referred to as "major institutional investors"). This document must not be acted on or relied on by persons who are not major institutional investors. Any investment or investment activity to which this document relates is only available to major institutional investors and will be engaged in only with major institutional investors. In reliance on the exemption from registration provided by Rule 15a-6 of the U.S. Securities Exchange Act of 1934, as amended (the "Exchange Act") and interpretations thereof by the U.S. Securities and Exchange Commission ("SEC") in order to conduct business with Institutional Investors based in the U.S., MOFSL has entered into a chaperoning agreement with a U.S. registered broker-dealer, Motilal Oswal Securities International Private Limited. ("MOSIPL"). Any business interaction pursuant to this report will have to be executed within the provisions of this chaperoning agreement.
The Research Analysts contributing to the report may not be registered /qualified as research analyst with FINRA. Such research analyst may not be associated persons of the U.S. registered broker-dealer, MOSIPL, and therefore, may not be subject to NASD rule 2711 and NYSE Rule 472 restrictions on communication with a subject company, public appearances and trading securities held by a research analyst account.
For Singapore: In Singapore, this report is being distributed by Motilal Oswal Capital Markets Singapore Pte Ltd (“MOCMSPL”) (Co.Reg. NO. 201129401Z) which is a holder of a capital markets services license and an exempt financial adviser in Singapore, as per the approved agreement under Paragraph 9 of Third Schedule of Securities and Futures Act (CAP 289) and Paragraph 11 of First Schedule of Financial Advisors Act (CAP 110) provided to MOCMSPL by Monetary Authority of Singapore. Persons in Singapore should contact MOCMSPL in respect of any matter arising from, or in connection with this report/publication/communication. This report is distributed solely to persons who qualify as “Institutional Investors”, of which some of whom may consist of "accredited" institutional investors as defined in section 4A(1) of the Securities and Futures Act, Chapter 289 of Singapore (“the SFA”). Accordingly, if a Singapore person is not or ceases to be such an institutional investor, such Singapore Person must immediately discontinue any use of this Report and inform MOCMSPL.
Disclaimer: The report and information contained herein is strictly confidential and meant solely for the selected recipient and may not be altered in any way, transmitted to, copied or distributed, in part or in whole, to any other person or to the media or reproduced in any form, without prior written consent. This report and information herein is solely for informational purpose and may not be used or considered as an offer document or solicitation of offer to buy or sell or subscribe for securities or other financial instruments. Nothing in this report constitutes investment, legal, accounting and tax advice or a representation that any investment or strategy is suitable or appropriate to your specific circumstances. The securities discussed and opinions expressed in this report may not be suitable for all investors, who must make their own investment decisions, based on their own investment objectives, financial positions and needs of specific recipient. This may not be taken in substitution for the exercise of independent judgment by any recipient. Each recipient of this document should make such investigations as it deems necessary to arrive at an independent evaluation of an investment in the securities of companies referred to in this document (including the merits and risks involved), and should consult its own advisors to determine the merits and risks of such an investment. The investment discussed or views expressed may not be suitable for all investors. Certain transactions -including those involving futures, options, another derivative products as well as non-investment grade securities - involve substantial risk and are not suitable for all investors. No representation or warranty, express or implied, is made as to the accuracy, completeness or fairness of the information and opinions contained in this document. The Disclosures of Interest Statement incorporated in this document is provided solely to enhance the transparency and should not be treated as endorsement of the views expressed in the report. This information is subject to change without any prior notice. The Company reserves the right to make modifications and alternations to this statement as may be required from time to time without any prior approval. MOFSL, its associates, their directors and the employees may from t ime to time, effect or have effected an own account transaction in, or deal as principal or agent in or for the securities mentioned in this document. They may perform or seek to perform investment banking or other services for, or solicit investment banking or other business from, any company referred to in this report. Each of these entities functions as a separate, distinct and independent of each other. The recipient should take this into account before interpreting the document. This report has been prepared on the basis of information that is already available in publicly accessible media or developed through analysis of MOFSL. The views expressed are those of the analyst, and the Company may or may not subscribe to all the views expressed therein. This document is being supplied to you solely for your information and may not be reproduced, redistributed or passed on, directly or indirectly, to any other person or published, copied, in whole or in part, for any purpose. This report is not directed or intended for distribution to, or use by, any person or entity who is a citizen or resident of or located in any locality, state, country or other jurisdiction, where such distribution, publication, availability or use would be contrary to law, regulation or which would subject MOFSL to any registration or licensing requirement within such jurisdiction. The securities described herein may or may not be eligible for sale in all jurisdictions or to certain category of investors. Persons in whose possession this document may come are required to inform themselves of and to observe such restriction. Neither the Firm, not its directors, employees, agents or representatives shall be liable for any damages whether direct or indirect, incidental, special or consequential including lost revenue or lost profits that may arise from or in connection with the use of the information. The person accessing this information specifically agrees to exempt MOFSL or any of its affiliates or employees from, any and all responsibility/liability arising from such misuse and agrees not to hold MOFSL or any of its affiliates or employees responsible for any such misuse and further agrees to hold MOFSL or any of its affiliates or employees free and harmless from all losses, costs, damages, expenses that may be suffered by the person accessing this information due to any errors and delays.
Registered Office Address: Motilal Oswal Tower, Rahimtullah Sayani Road, Opposite Parel ST Depot, Prabhadevi, Mumbai-400025; Tel No.: 022 71934200/ 022-71934263; Website www.motilaloswal.com. CIN No.: L67190MH2005PLC153397.Correspondence Office Address: Palm Spring Centre, 2nd Floor, Palm Court Complex, New Link Road, Malad(West), Mumbai- 400 064. Tel No: 022 7188 1000.
Registration Nos.: Motilal Oswal Financial Services Limited (MOFSL)*: INZ000158836(BSE/NSE/MCX/NCDEX); CDSL and NSDL: IN-DP-16-2015; Research Analyst: INH000000412. AMFI: ARN - 146822; Investment Adviser: INA000007100; Insurance Corporate Agent: CA0579 ;PMS:INP000006712. Motilal Oswal Asset Management Company Ltd. (MOAMC): PMS (Registration No.: INP000000670); PMS and Mutual Funds are offered through MOAMC which is group company of MOFSL. Motilal Oswal Wealth Management Ltd. (MOWML): PMS (Registration No.: INP000004409) is offered through MOWML, which is a group company of MOFSL. Motilal Oswal Financial Services Limited is a distributor of Mutual Funds, PMS, Fixed Deposit, Bond, NCDs,Insurance Products and IPOs.Real Estate is offered through Motilal Oswal Real Estate Investment Advisors II Pvt. Ltd. which is a group company of MOFSL. Private Equity is offered through Motilal Oswal Private Equity Investment Advisors Pvt. Ltd which is a group company of MOFSL. Research & Advisory services is backed by proper research. Please read the Risk Disclosure Document prescribed by the Stock Exchanges carefully before investing. There is no assurance or guarantee of the returns. Investment in securities market is subject to market risk, read all the related documents carefully before investing. Details of Compliance Officer: Name: Neeraj Agarwal, Email ID: [email protected], Contact No.:022-71881085.
* MOSL has been amalgamated with Motilal Oswal Financial Services Limited (MOFSL) w.e.f August 21, 2018 pursuant to order dated July 30, 2018 issued by Hon'ble National Company Law Tribunal, Mumbai Bench.