Snapshot Day Multi-Year Report: A Citizen Science ... - NET
41
Snapshot Day Multi-Year Report A Citizen Science Success Story 2000-2013 Prepared for: Authored by: Pam Krone-Davis, MBNMS Lisa Emanuelson, MBNMS Bridget Hoover, MBNMS
-
Upload
khangminh22 -
Category
Documents
-
view
5 -
download
0
Transcript of Snapshot Day Multi-Year Report: A Citizen Science ... - NET

Snapshot Day Multi-Year Report A Citizen Science Success Story
2000-2013 Prepared for:
Authored by:
Pam Krone-Davis, MBNMS
Lisa Emanuelson, MBNMS
Bridget Hoover, MBNMS
ACKNOWLEDGEMENTS
A special thanks to our partners who help in organizing this event each year including the Coastal Watershed Council, Upper Salinas-Las Tablas Resource Conservation District, MBNMS Coastal Discovery Center, Morro Bay National Estuary Program and the San Mateo Resource Conservation District. We are grateful to the organizations that have provided funding and donations, including but not limited to, the US Environmental Protection Agency, State Water Resources Control Board, State Coastal Conservancy, Community Foundation of Monterey County, City and County of Santa Cruz and especially Monterey Bay National Marine Sanctuary. We appreciate the perspective and critical review of this document by Dr. Steve Lonhart, MBNMS, and Karen Worcester, CCRWQCB. Most importantly, we thank the hundreds of volunteers that have participated over the years and made this event possible.
April 2015 2

1. INTRODUCTION
Snapshot Day began as a volunteer monitoring effort on April 22, 2000 – Earth Day, through a joint collaboration with the Coastal Watershed Council (CWC), The Ocean Conservancy and Monterey Bay National Marine Sanctuary (MBNMS). Snapshot Day was intended to get a “snapshot” of the quality of water flowing into MBNMS while raising awareness about watershed health. The Citizen Watershed Monitoring Network (Network) was formed as a consortium focused on organizing citizen monitoring programs to provide a cost effective way to build an informed community with knowledge about watersheds, pollution prevention, threats to good water quality and to train volunteers to collect robust and meaningful water quality data. On that first Snapshot Day in 2000, 110 trained citizen volunteers collected water samples in four counties at 122 sites on 89 waterways in 10 watersheds along a 279-mile stretch of the California central coast. Water from each of these watersheds flows into MBNMS, the third-largest of 14 federally designated underwater areas protected by NOAA’s Office of National Marine Sanctuaries. Citizen volunteers included retired people interested in learning more about ocean health, college students wanting hands on experience in the sciences, citizens wanting to make a difference in their community and sanctuary staff and partners hoping to create a successful and enduring volunteer monitoring program. The Network includes groups that monitor the health of the ten watersheds that flow into MBNMS. The Coastal Watershed Council and California Coastal Commission, along with MBNMS, formed the core of the Network and continue to work together on projects with volunteers including Snapshot Day, First Flush and Urban Watch monitoring programs.
MBNMS encompasses more than 4,600 square nautical miles of ocean and includes many diverse ecosystems encompassing over 500 different species of fish, 180 species of shorebirds and seabirds, and 34 species of marine mammals. Ten major watersheds drain over 7000 square miles of land to the coastal zone of the sanctuary. Land uses in these watersheds include urban and suburban development, intensive agricultural uses, and rural lands. Waters flowing through these watersheds transport pollutants such as sediments, nutrients, pesticides, oils, and pathogens, through the rivers, wetlands, harbors and coastal zone of the sanctuary where they can affect coastal ecosystems, fishes and other resident aquatic organisms.
Water quality monitoring allows resource managers to understand the general health of the sanctuary and its watersheds, identify water quality problems, determine water quality trends over time, and inform water quality policy. Citizens involved in the monitoring effort have an opportunity to contribute to the regional understanding of water quality and to discover the way we live on land influences pollutants entering streams, estuaries and ultimately the sanctuary.
Since its inaugural year in 2000, Snapshot Day continues on the first Saturday of every May as an annual citizen monitoring effort for which volunteers have sampled as many as 243 sites on the central coast of California in an effort to understand the quality of water flowing into the sanctuary. Each year hundreds of volunteers sample sites along the central coast, contributing to an extensive data set of water quality information. Water quality measurements include pH, dissolved oxygen, specific conductivity, turbidity, water clarity, water temperature, nitrate, orthophosphate, total coliform, and Escherichia coli (E. coli). Knowing the concentrations of these contaminants inform decision making and allow agencies to improve
April 2015 3

management of our natural resources.
A natural outcome of Snapshot Day is a community of people committed to environmental stewardship and conservation. By involving citizens in collecting water samples, Snapshot Day provides education about watersheds and the important role they play in ocean health. Snapshot Day could not be conducted across such a broad geographical region on a single day without the help of volunteers. In 2000, 110 volunteers monitored 122 sites from coastal San Mateo County to San Luis Obispo County. In 2003, Snapshot Day was implemented along the entire coast of California when 637 volunteers monitored 546 sites. In 2009, for the special 10 year anniversary event, our largest central coast turnout of 224 volunteers helped to monitor 180 sites. Over the past fourteen years, from 2000-2013, Snapshot Day volunteers have donated more than 13,000 hours, which is equivalent to $243,084.00 of in-kind donations. Many volunteers return each year; some have been involved in this sampling effort for all fourteen years and often request to monitor the same sites year after year in the community where they live, contributing to a sense of ownership and directly observing changes over time.
Annual reports are written each year following the Snapshot Day sampling effort, and as of 2013 enough data have been collected to conduct a more extensive statistical analysis of the data. We present that analysis in this report through the results of three statistical analyses of Snapshot Day data from 2000-2013: 1) characterization of the deviation of analyte concentrations from water quality objectives (exceedances), 2) assessment of trends over time of three water quality constituents, and 3) representativeness of Snapshot Day data via comparison to the more frequent sampling effort conducted by the Central Coast Ambient Monitoring Program (CCAMP) at overlapping sites. Additionally, we review the importance of citizen science efforts in collecting water quality data across a broad geography and at a larger number of sites than could be monitored without the contribution of volunteers. A sampling effort of this scope using professional field technicians would be cost prohibitive.
Regulatory Background MBNMS was designated on September 18, 1992, and is administered by the National Oceanic Atmospheric Association (NOAA). It was established for the primary purpose of resource protection, as well as research, education, and public use of this national treasure. MBNMS extends from the high tide mark to as far as 53 miles offshore, covering everything below the water’s surface from Marin County to Cambria. To implement the mandates of the National Marine Sanctuaries Act, the regulations for MBNMS (15 CFR 922.132) generally prohibit discharges within the boundaries of the sanctuary with limited exceptions for dredged material, and fishing and vessel operation. Discharges beyond the boundary of the sanctuary that subsequently enter and injure sanctuary resources or qualities are similarly prohibited. On March 15, 2012, the Central Coast Regional Water Quality Board (CCRWQB) adopted a Conditional Waiver of Waste Discharge Requirements (Agricultural Order No. R3-2012-0011). The CCRWQB regulates discharges from irrigated agricultural lands to protect surface water and groundwater, under a Conditional Waiver of Waste Discharge Requirements that applies to owners and operators of irrigated land used for commercial crop production. The CCRWQB is focusing on priority water quality issues, such as pesticides and toxicity, nutrients, and sediments – especially nitrate impacts to drinking water sources. More information can be found at http://www.waterboards.ca.gov/centralcoast/water_issues/programs/ag_waivers/index.shtml
April 2015 4

The CCRWQB also oversees a Storm Water Program to prevent stormwater runoff from acting as the vehicle for the discharge of pollutants to surface water bodies. The Storm Water Program is a National Pollutant Discharge Elimination System (NPDES) Program implemented in two phases (Phase I and Phase II). The November 16, 1990 Federal Register describes the requirements of the Phase I Regulations and the December 8, 1999 Federal Register describes the Phase II regulations. The State of California carries out the Storm Water Regulations according to the California Water Code. The City of Salinas holds the only individual Phase I municipal storm water permit in the Central Coast Region. On March 10, 2003, Operators of Phase II Regulated Small Municipal Separate Storm Sewer Systems (MS4s) were required to obtain permit coverage. On February 5, 2013, the proposed final draft of the Phase II Small MS4 General Permit was adopted and became effective on July 1, 2013 (Order No. 2013-0001). More information can be found at: http://www.waterboards.ca.gov/water_issues/programs/stormwater/municipal.shtml
With both the implementation of the Agricultural Order and the MS4 Storm Water permits, there is much more regulatory oversight and requirements to reduce pollutants loads from these sources into surface waters of the state.
2. METHODS
2.1. VOLUNTEERS
The Network recruits an average of 198 citizens a year in the Snapshot Day citizen monitoring program (Table 1). Volunteers are recruited through many avenues: advertisements in local newspapers; professors and teachers at local colleges, universities and high schools; emails to partner agencies, email list serves and former volunteers; and flyers at colleges, universities, and community bulletin boards. For many volunteers, a presentation by a Snapshot Day coordinator in their classroom is how they learn about the program. Through this outreach, people residing in sanctuary watersheds are introduced to MBNMS as a geographic and governmental entity, learn about the purpose of monitoring programs related to ocean health, and are offered an opportunity to contribute to a broader water quality monitoring effort than would be possible on this scale in the absence of a volunteer network. Following outreach, volunteers attend a training session to learn water quality sampling methodology, data collection and gain additional program information.
Volunteer training sessions are conducted in the four regions where Snapshot Day samples are collected—coastal San Mateo County, Santa Cruz County, Monterey County, and San Luis
Table 1. Number of sites sampled each year during the fourteen year period of the Snapshot Day Citizen Monitoring Program.
Year Number of Sites Sampled
Number of Volunteers
2000 110 122 2001 151 160 2002 139 150 2003 152 155 2004 167 168 2005 160 163 2006 174 189 2007 178 180 2008 172 173 2009 180 224 2010 192 202 2011 181 178 2012 180 214
April 2015 5

Obispo County. CWC staff coordinated volunteers in San Mateo and Santa Cruz counties while MBNMS staff coordinated Monterey and San Luis Obispo counties. Volunteers are trained to use equipment to collect field measurements of temperature, conductivity, pH, temperature, and water clarity/turbidity. Each set of equipment includes a detailed map with directions to sites, digital thermometer, pH strips, Oakton conductivity meter, transparency tube or turbidity meter, laboratory sample collection bottles and data sheets. Volunteers are trained to collect and label samples for lab analysis of nitrate-N, orthophosphate-P, and E. coli. Training includes familiarizing volunteers with standardized monitoring protocols, such as wearing gloves to avoid sample contamination while protecting hands from pollutants. They also learn to triple rinse sample bottles. Volunteers are shown how to complete datasheets, given guidance on field safety, shown examples of some basic “do’s” and “don’ts” based on previous years mistakes and provided an overview of the purpose of the monitoring effort.
Four hubs, located in each Snapshot Day region, serve as the meeting spots for volunteers prior to heading out to assigned sites. Once the teams of volunteers have visited all assigned sites, iced samples and equipment are delivered back to the hub in the shortest time possible. Samples are then taken to a laboratory for analysis; in a few instances samples travel over 100 miles to get to a laboratory.
2.2. SITE SELECTION
Sites were chosen based on existing sites monitored by the Central Coast Ambient Monitoring Program (CCAMP), sites monitored by other programs, and sites with public access in streams up and down the coast to ensure geographic representation. The monitoring effort was designed to capture basic water quality parameters that are indicators of stream ecosystem health within important waterbodies draining into MBNMS. Not all sites were measured each year due to programmatic changes, funding constraints, or lack of flowing water. Water quality measurements were collected at a total of 243 different sites (annual range of 122 - 192 sites) along the central coast every spring between 2000-2013 (Fig. 1). A complete list of all site names, site IDs, hydrologic units and GPS locations is available in Appendix B Table 1.
More specific site information can be found on the MBNMS Sanctuary Integrated Monitoring Network (SIMoN) website at http://sanctuarymonitoring.org/regional_sections/maps/wqviewer/. The SIMoN Water Quality Monitoring Viewer is a Google Maps application that provides the locations, measurement types, and data access information for water quality monitoring programs in the region.
April 2015 6

Figure 1. 243 unique sites monitored for Snapshot Day from 2000-2013
April 2015 7

2.3. STATISTICS - EXCEEDANCES
Snapshot Day Water Quality Objectives (WQOs) were adopted from objectives developed by the U.S. Environmental Protection Agency (USEPA), the Central Coast Regional Water Quality Control Board (CCRWQCB) Basin Plan and the Central Coast Ambient Monitoring Program (CCAMP) as guidelines by which to determine impairment of a water body (Table 2; CCRWQCB 2011, USEPA 2012).
Table 2: Water Quality Objectives for Snapshot Day water chemistry and their source.
Analyte Water Quality Objective Objective Source
E. coli (MPN/100 mL) Not to exceed 2351 EPA Ambient Water Quality Criteria
Orthophosphate as P (mg/L) Not to exceed 0.122 Central Coast Ambient Monitoring Program
(CCAMP)
Nitrate as N (mg/L) Not to exceed 1.03 Central Coast Ambient Monitoring Program (CCAMP)
Water Temperature (⁰C) Not to exceed 214 Central Coast Ambient Monitoring Program (CCAMP)
pH Not < 6.5 or > 8.5 General Basin Plan Objective
Dissolved Oxygen Not < 7 or > 13 California Basin Plan Objective
Turbidity (NTU) Not to exceed 2515 Central Coast Ambient Monitoring Program (CCAMP)
Water Clarity (cm) Not less than 25 See page 17 of this report for explanation
1 Environmental Protection Agency, Updated WQO. 2 Central Coast Ambient Monitoring Program, Pajaro River Watershed Characterization Report 1998, rev 2003. 3 Williamson, The Establishment of Nutrient Objectives, Sources, Impacts and Best Management Practices for the Pajaro River and Llagas Creek, 1994. 4 Moyle, P. 1976. Inland Fisheries of California. University of California Press. 5 Sigler, J.W., T.C. Bjornn and F.R. Everest. 1984. Effects of chronic turbidity on density and growth of steelhead and coho salmon. Transactions of the American Fisheries Society 113: 142-150.
April 2015 8

An exceedance occurred when the concentration or measure of a given analyte was above (or below, where applicable) the WQO. Dissolved oxygen and pH have both upper and lower water quality objectives, in which case exceedance occurs when either limit is surpassed. For sites monitored for five or more years, we identified the number of years sampled, the number of years the WQO was exceeded, and the percent of years the WQO was exceeded for each analyte.
In order to evaluate and compare different regions within the central coast, we consolidated sites into hydrologic units (HU) and assessed the number of sites in each HU that exceeded the WQO (Fig. 2). This allowed us to compare the performance between regions for all analytes in terms of the percent of years the WQO was exceeded for sites in that HU.
In the annual Snapshot Day reports, we determine which sites exceeded the WQOs for three or more analytes (field and lab) and associate them with waterbodies that we designated as Areas of Concern. A waterbody that is listed as an Area of Concern for a particular year has at least one site that exceeded three WQOs that year. Note that in early annual Snapshot Day Annual reports, WQOs were based on different standards that have been updated over the last 14 years. The result is that the number of Areas of Concern identified in those early reports may vary from the number reported here.
2.4. STATISTICS - TRENDS
Trends were calculated for a selection of three analytes: nitrate, orthophosphate, and E. coli. Trend testing was performed on sites with at least 5 years of measurements for each analyte of interest where the concentration exceeded the WQO for at least one sampling event. In instances where a site was sampled for five or more years, but one analyte was measured during only four of those years, the trend assessment was not conducted for that particular analyte, though it was conducted for the other two.
Trends were evaluated using the monotonic, non-parametric Mann-Kendall test (Kendall 1938, Mann 1945, Kendall 1948). This test was chosen because it does not require that the data conform to any particular distribution. This is important for maintaining comparability of data in a large data set such as Snapshot Day since water quality data are typically positively skewed and often to varying degrees, so conducting transformations in order to perform parametric statistics is less accurate. The CCRWQB also uses the Mann-Kendall trend test, therefore a comparison of CCAMP statistical results with those from Snapshot Day at overlapping sites may highlight some of the similarities and differences between the two monitoring programs. The Mann-Kendall test also presumes that the data are independent temporally, which is the case in the Snapshot Day time series given the annual separation between samples. Mann-Kendall also requires that seasonality is removed from the data, and as Snapshot Day samples are taken once every spring, seasonality is not a factor in these data. Because the Mann-Kendall test is monotonic, we used the Sen-Theil slope to estimate the magnitude of the trend. Additionally we calculated the 95% Confidence Interval (CI) for this slope to graphically represent the range of most likely trends. If both the upper and lower CIs are positive, then this lends further credence to a positive trend. Similarly if both are negative this signifies a likely downward trend. However if one CI is positive and the other negative, then the results of the trend test are considered uncertain. In this case we consider a trend to most likely have occurred, but with some room for doubt.
April 2015 9

The null hypothesis of the Mann-Kendall test is that no trend exists (Helsel & Hirsch 2002). Two different levels of significance were set showing both a p-value of 0.05 and 0.10, so that sites could be identified where there is a 90% confidence level and an 80% confidence level that a trend exists. With two different p-values, readers can evaluate for themselves what level of confidence to choose. Given the small sample size of Snapshot Day data, we felt readers might be interested in both results in order to evaluate for themselves the odds and preferences for making a Type I versus Type II error. R statistical software and the NADA package was used for the Mann-Kendall test on measurements of the three analytes (R Core Team 2013, Lee 2013). The NADA package for R was used to evaluate censored data (non-detects) for the trend test and to graphically portray censored values as hashed lines between zero and the detection limit for that observation. This package generated the number of samples (N) used in the analysis, Kendall’s tau (τ), p-value, and Sen-Theil slope, which was reported along with graphs of the sites where a significant trend could be detected. Upper and Lower 95% Confidence Intervals (CI) for the Sen-Theil trends were developed using the Openair Package (Carslaw & Ropkins 2014).
2.5. COMPARISON OF CCAMP AND SNAPSHOT DAY RATING AND TRENDS
CCAMP and Snapshot Day programs adopted some sites that share the same sampling location, designated as “overlapping sites.” Both programs have engaged in extensive monitoring of these sites, although over different time frames and at different intervals. CCAMP has two types of sites, coastal confluence and watershed, with different monitoring regimes. CCAMP has conducted monthly water quality monitoring at coastal confluence sites on the central coast of California since 2001. Additionally, CCAMP rotates through an additional 30 watershed sites annually in five watershed areas since 1999. Snapshot Day monitoring takes place once a year in May; however not all sites are monitored each year. A total of 13 coastal confluence and 27 watershed sites overlap with Snapshot Day sites based on a proximity of 200 meters from geo-referenced site data (App. B Table 4, Figure 2).
CCAMP rates sites for each analyte using the following designations: excellent, good, fair, impacted, or severely impacted. This rating is based on a score card approach used prior to October 2014 involving examination of water quality parameters against multiple thresholds appropriate to determining aquatic health (CCRWQCB 2014). All analytes and in-situ measurements taken on Snapshot Day are also measured by CCAMP, and comparisons were made for nitrate, orthophosphate and E. coli. A rating system was not used for Snapshot Day results, rather the percent of years the WQO was exceeded at overlapping sites. This percent can be compared with the CCAMP rating to assess comparability between the results of the two programs.
In addition, a statistical trend test for Snapshot Day was compared with CCAMP trends at overlapping sites for three analytes: nitrate, orthophosphate and E. coli. Similarities and differences exist between the CCAMP trend analysis and that conducted for Snapshot Day in terms of numbers of samples, span of years, and frequency of monitoring. Both CCAMP trends and Snapshot Day trends were assessed using the same statistical software (R and the NADA package) and both involved a Mann-Kendall trend test. (personal communication Dave Paradies 2014). In addition to a trend analysis, CCAMP also shows the results of a change point analysis. CCAMP had a higher sample set (n = 24-130) compared with Snapshot Day (n = 5-14) data. CCAMP assigned a p-value of 0.05 for significance in their trend evaluation similar to the comparison with Snapshot Day. The date range for CCAMP trend analysis at
April 2015 10

coastal confluence sites was from 2001-2012 and for CCAMP watershed sites varied due to the rotational schedule, but normally included two years of data. Data for Snapshot Day ranged between 5 to 13 years of monitoring. CCAMP trend analysis results are available on their website at http://www.ccamp.info.
Figure 2. Table of overlapping sites monitored by CCAMP and during Snapshot Day.
April 2015 11

2.6. QUALITY ASSURANCE AND DATA CENSORING
The protocols for sample handling, analytical methods, equipment calibration and data management are described in the California Coast Wide Snapshot Day 2003 Quality Assurance Project Plan (QAPP), approved by the State of California Water Resources Control Board in 2003. The approved QAPP outlines standard operating procedures for field measures and lab analysis including percentages of duplicate samples, field blanks, split samples, known laboratory controls, replicate measurements to assure accuracy, precision, completeness and representativeness of samples and data collected. In the initial years Snapshot Day samples were sent to eight different labs for analysis. In more recent years, samples were sent to only three different ELAP certified labs: Monterey Bay Analytical Services, County of San Mateo Public Health Laboratory, and County of San Luis Obispo Public Health Laboratory.
Water quality measurements are often reported as below a given detection level. Method detection levels (MDLs) are the lowest level at which an analyte can be measured via a specific method within a stated confidence limit (usually 1%). When an analyte is less than the pre-defined MDL, laboratories report the result as non-detected (ND) or sometimes as a value below the MDL for that analyte. In order to analyze data with non-detects, censoring methods are employed. This usually involves either substitution of another value such as the MDL, ½ the MDL, a median or mean value for the result of interest, or exclusion of the data. Helsel (2005, 2009) believes these methods are inappropriate in that they complicate the computation of descriptive statistics, tests of differences among groups, and regression tests. These problems are exacerbated by the presence of more than one detection limit in a set of data, since a change in a detection limit may be interpreted as a change in the parameter concentration (Smith et al., 1996). Helsel (2005, 2009) suggests using Maximum Likelihood Estimates (MLEs), robust Regression on Order Statistics (ROS), or the Kaplan-Meier (KM) method for incorporating NDs in data analysis.
We chose to utilize the censoring method of substituting half the MDL for ND values and the methods contained in the NADA package for measuring the monotonic association between the concentration and year. For samples where the lab MDL was not reported in lab data, we assigned an MDL as the lowest reported value by that lab and not designated as “ND” for this analyte. For samples where the upper range of the method was exceeded, for example E. coli > 240,000 MPN/100 mL, we accepted the maximum value as the result. The cenken function in the NADA package allows for changes in the MDL between years and interprets the directionality as an increase, decrease or tie based on both the result given and whether this result was censored. For example, a detected value of 0.5 mg/L compared with a censored value of 1 mg/L is considered a tie as the comparison cannot legitimately be considered an increase or a decrease (Lee 2013). However a detected value of 0.5 mg/L compared with a detected value of 1 mg/L in a subsequent year is considered an increase. Because our primary interest in the trend analysis was for sites where WQOs were exceeded and results at these sites were above the MDL, we concluded this method of treating censored data adequately addressed our goal.
April 2015 12

3. RESULTS
Snapshot Day is a single day volunteer monitoring event that occurs annually in the spring of the year on or near May 5th with a date range between April 20th and May 17th. There were a total of 243 Snapshot Day sites that were monitored for at least one year and a total of 186 sites that were monitored for 5 or more years (Figure 1).
3.1 STATISTICS - EXCEEDANCES
Of the sites monitored for 5 or more years, 11 sites (6%) never exceeded any of the Water Quality Objectives (WQOs), and they include: Whitehouse Creek east (202-WHITE-11) , San Vicente Creek In Davenport (304-SANVI-21), Waddell Creek upper site (304-WADDE-22), Carmel River at Rosie's Bridge (307-CARME-33), Garzas Creek (307-GARZA-31), Big Creek at Hwy 1 (308-BIGCR-31), Big Sur River at Andrew Molera Park (308-BIGSU-31), Dani Creek at Hwy 1 (308-DANIC-31), Garrapata Creek (308-GARRA-31), Plaskett Creek at Hwy 1 (308-PLASK-31), and Prewitt Creek at Hwy 1 (308-PREWI-31). Many of these sites are in coastal areas with minimal human development or are located in a watershed upstream from more densely developed areas (Fig. 3). Of the sites monitored for 5 or more years, there were no sites that consistently exceeded the WQOs for all analytes all of the years monitored. Moro Cojo Slough Upper (306-MOROC-31) exceeded the WQO for all seven analytes and field measures in two of the years. Santa Rita Creek at Van Buren Avenue (309-SRITA-35) exceeded three of the WQOs (water clarity, nitrate-N and E. coli) for all 7 years of sampling, as well as exceeding the WQOs for dissolved oxygen for 2 of the 7 years sampled, temperature for 5 of the 7 years sampled, and orthophosphate for all but one year. A table of observations of the number of years a site exceeded the WQO for each site monitored for 5 years or more can be found in Appendix B Table 2 (for lab analyzed water chemistry of nitrate, orthophosphate, E. coli) and Appendix B Table 3 (for field measures of water temperature, dissolved oxygen, pH, turbidity, and water clarity).
We consolidated sites into waterbodies to portray frequent exceedance of ≥3 WQOs and classified them as Areas of Concern. Figure 4 shows the Areas of Concern for each year of sampling, although it is important to note that not all waterbodies are sampled each year due to lack of flowing water, funding or access (Appendix A Figure 1). Areas of Concern for ≥10 years included the following 8 waterbodies: Watsonville Slough, Harkin Slough, Moro Cojo Slough, Tembladero Slough, Alisal Slough, Santa Rita Creek, Natividad Creek and the Reclamation Ditch. Sites and waterbodies that more frequently exceed the WQOs of multiple parameters tend be located in sub-watersheds with intensive agricultural or mixed agricultural and urban use. Of the 186 waterbodies, 85 waterbodies were never listed as an Area of Concern over the years sampled.
April 2015 13
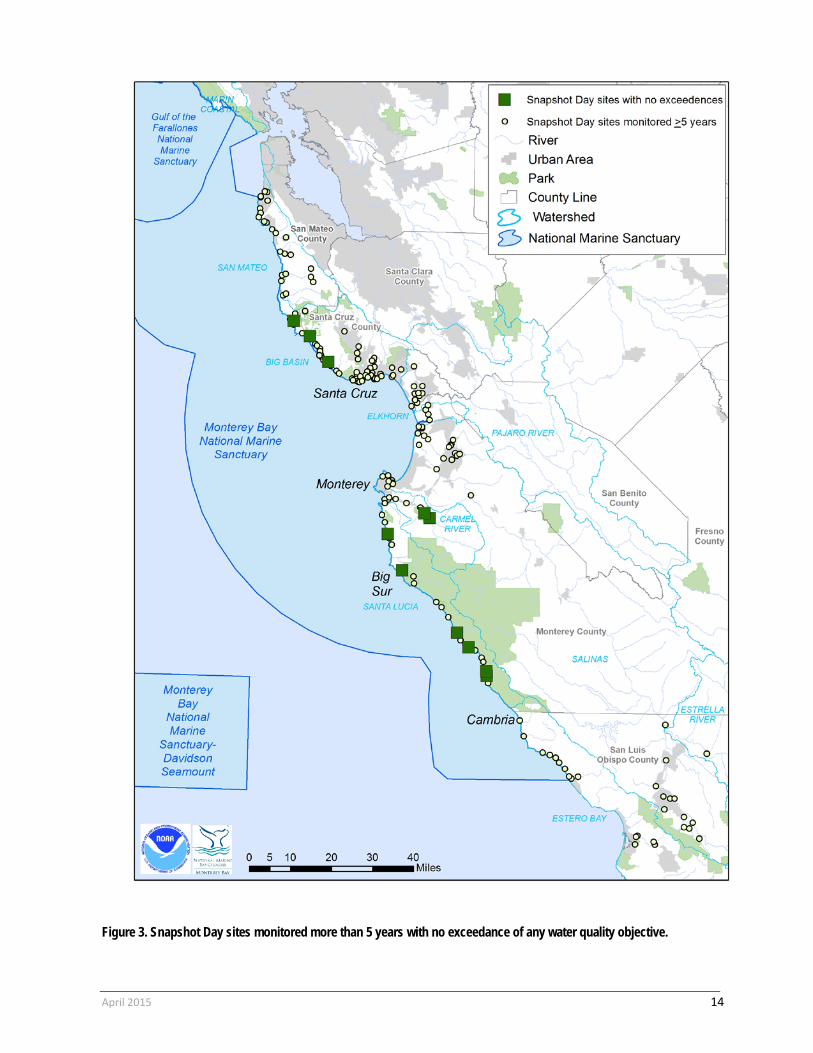
Figure 3. Snapshot Day sites monitored more than 5 years with no exceedance of any water quality objective.
April 2015 14

Figure 4. Areas of Concern by waterbody were identified for each year the waterbody was sampled and exceeded three WQOs for analytes (nitrate, orthophosphate or E. coli) and field measures (dissolved oxygen, pH, water temperature, or clarity).
Nutrients at Sites Monitored ≥5 Years
A total of 72 out of 186 sites (39%) monitored for ≥5 years on Snapshot Day did not exceed nutrient (neither nitrate nor orthophosphate) water quality objectives. A total of 120 out of 186 sites (65%) and 88 sites out of 186 (47%) showed no exceedance of the nitrate WQO and orthophosphate WQO, respectively. Ten sites exceeded the nitrate WQO all the years monitored (Table 4). Two sites exceeded the orthophosphate WQO every year sampled: Trout Creek at 3 bridges (309-TROUT-41), Upper Alisal Creek at Cesar Chavez Park (309-ALISA-32). Table 3 shows sites where either nitrate or orthophosphate exceeded the WQO 50% or more of the years monitored.
April 2015 15

Table 3: Listing of the sites monitored for at least 5 years for nutrients and where either nitrate or orthophosphate exceeded the WQO 50% or more of the years monitored.
Sites were organized into 9 major watersheds, also called hydrologic units (HUs) (Fig. 2). Two HUs (Carmel and Estrella) showed no exceedance of the WQO at any site for nitrate over all the years monitored; however at Carmel’s Hatton Canyon site (307-HATTO-31) the orthophosphate WQO was exceeded 4 out of 7 years (57%) and at the Carmel River mouth (307-CARME-39) the orthophosphate WQO was exceeded 1 out of 8 years (8%). Six sites (27%) in the Santa Lucia watershed exceeded the orthophosphate WQO between 1-30% of the years monitored. Of the 9 HUs monitored, 38% of the sites in the Pajaro, 57% of sites in the Elkhorn Slough and 79% of the sites in the Salinas HUs demonstrated the highest repeated exceedance of the nitrate WQO by exceeding the WQO more than 60% of the years monitored. In five of the HUs (San Mateo, Carmel, Santa Lucia, Estero Bay, Estrella) no sites exceeded the nitrate WQO more than 60% of the years monitored (Fig. 5).
Site Code Site Name# Years
Sampled
Max Concentration
(mg/L)
# Years Exceeded
WQO
Percent Years Exceeded WQO
# Years Sampled
Max Concentration
(mg/L)
# Years Exceeded
WQO
Percent Years
Exceeded WQO
202-ALPIN-11 Alpine Creek at Alpine Rd. 11 0.8 0 0 10 0.36 5 50202-FRENC-11 Frenchman's Creek at mouth 13 4.1 7 54 12 0.11 0 0202-PILAR-11 Pilarcitos Creek at Oak & Pilacitos Ave 14 4.9 9 64 12 0.14 1 8304-ARANA-23 Arana Creek at Paul Sweet Rd 12 0.6 0 0 12 0.27 7 58304-ARROY-23 Arroyo Creek at West Cliff 13 3.6 13 100 12 0.18 1 8304-LIDEL-21 Lidell Creek at Bonnie Doon Rd. 14 1.3 3 21 14 1.34 9 64304-SCSD-02 Santa Cruz Storm Drain 2 9 4.4 9 100 9 0.14 1 11304-SCSD-03 Santa Cruz Storm Drain 3 9 2.4 9 100 9 0.05 0 0304-SCSD-04 Santa Cruz Storm Drain 4 9 4.3 9 100 9 0.12 1 11304-VALEN-21 Valencia Creek at culvert off Valencia & C 13 0.2 0 0 14 0.24 7 50305-BEACH-21 Beach Rd. Ditch at Palm Beach 13 60.1 12 92 13 1.29 3 23305-HARKI-22 Harkins Slough at Pajaro Valley Water Ma 13 11.8 6 46 13 0.38 8 62305-PAJAR-21 Pajaro River under Thurwachter Bridge 14 12.0 13 93 14 0.55 3 21305-STRUV-22 Struve Slough at Lee Rd. 12 0.6 0 0 13 1.07 12 92305-WATSO-21 Watsonville Slough at Harkins Slough Rd 12 0.6 0 0 13 0.69 9 69305-WATSO-22 Watsonville Slough at Pajaro Valley Wate 13 18.4 11 85 13 0.89 11 85305-WATSO-23 Watsonville Slough at Palm Beach Rd. 13 46.6 10 77 13 0.98 3 23306-ELKHO-34 ElkhornSlough at Watsonville Creek 12 48.2 10 83 12 4.26 9 75306-MOROC-31 Moro Cojo Slough Upper 12 37.0 10 83 12 2.05 9 75306-MOROC-32 Moro Cojo Slough at Castroville Slough C 12 1.5 4 33 12 1.10 6 50306-MOROC-33 Moro Cojo Slough Lower at Hwy 1 13 0.3 1 8 13 0.81 7 54307-HATTO-31 Hatton Canyon at Carmel Valley Rd. 7 0.1 0 0 7 0.33 4 57309-ALISA-32 Upper Alisal Creek at Cesar Chavez Park 14 42.8 13 93 14 1.68 14 100309-CENTR-31 Central & 13th PG 14 5.8 12 86 14 0.46 4 29309-GABIL-31 Gabilan Creek at Independence 11 30.1 11 100 11 0.60 3 27309-NATIV-31 Natividad Creek at Las Casitas Rd 13 26.0 10 77 13 0.79 9 69309-RECDI-31 Rec Ditch at Davis 13 39.8 13 100 13 0.94 11 85309-SALIN-31 Salinas River at Gypse Camp 13 33.7 13 100 13 0.27 4 31309-SALIN-32 Salinas River at Davis Rd. 13 21.9 12 92 13 0.28 3 23309-SALIN-33 Salinas River at Chualar Bridge 13 6.2 9 69 13 0.10 0 0309-SALIN-46 Salinas River San Miguel at Estralia Rock 11 2.1 5 45 11 0.47 9 82309-SRITA-32 Santa Rita Creek at Bellizona 7 15.1 6 86 7 0.68 3 43309-SRITA-33 14th hole Salinas Valley Golf course 6 14.4 4 67 6 1.68 3 50309-SRITA-34 Santa Rita Creek at Russell Rd. 7 14.2 7 100 7 0.65 3 43309-SRITA-35 Santa Rita Creek at Van Buren Avenue 7 314.0 7 100 7 1.10 6 86309-TEMBL-31 Tembladero Slough at Molera Rd. 14 73.7 11 79 14 0.65 13 93309-TEMBL-32 Tembladero Slough Hwy 183 13 51.6 12 92 13 0.46 5 38309-TEMBL-33 Tembladero Slough at Preston St bridge 10 74.7 9 90 10 0.53 7 70309-TROUT-41 Trout Creek at 3 bridges 12 0.3 0 0 12 0.41 12 100309-UPPER-31 Upper Natividad Creek at E. Boronda Rd. 13 68.3 13 100 13 1.07 9 69309-YERBA-41 Yerba Buena Creek at Estrada Avenue 9 0.1 0 0 9 0.33 6 67310-SANSI-41 San Simeon Creek at campground bridge 13 13.0 10 77 13 1.00 6 46310-SBE-41 San Bernardo Creek 7 0.7 0 0 7 0.15 5 71310-SYB-41 Santa Ysabela 12 11.0 8 67 12 0.32 6 50310-UCF-41 Upper Chorro Flats 12 3.8 9 75 12 0.59 9 75
Sites Monitored at Least 5 Years Nitrate as N Orthophosphate as P
April 2015 16

Figure 5: Percentage of years that sites within a watershed exceeded water quality objectives (WQOs) for nitrate-N (1.0 mg/L) and orthophosphate-P (0.12 mg/L). Only sites monitored ≥5 years were analyzed. The Estrella watershed was omitted because only 1 site was monitored ≥5 years.
April 2015 17

E. coli at Sites Monitored ≥5 Years The E. coli WQO was exceeded at a higher frequency than the nutrient WQOs. Out of the 176 sites monitored for E. coli for ≥5 years, 137 sites (78%) exceeded the 235 MPN/ 100 mL WQO.
The following 11 sites exceeded the E. coli WQO every year: Santa Cruz Storm Drain at Merced (304-SCSD-02), Santa Cruz Storm Drain at Woodrow (304-SCSD-04), Greenwood Park PG (309-CENTR-31), Hartnell Gulch on Pacific in Monterey (309-LIBRA-31), Moro Cojo Slough (309-MOROC-31), Santa Rita Creek at Bellizona (309-SRITA-32), 14th hole Salinas Valley Golf Course (309-SRITA-33), Santa Rita Creek at Russell Rd. (309-SRITA-34), Santa Rita Creek at Van Buren Avenue (309-SRITA-35), Upper Natividad Creek at E. Boronda Rd.(309-UPPER-31), San Bernardo Creek (310-SBE-41). Many of these sites are in high density urban areas although some are in low density developed areas mixed with agriculture. Notably, two of these sites are Santa Cruz urban drainages along West Cliff Drive (304-SCSD-02, 304-SCSD-04), four are sites on Santa Rita Creek in Salinas (309-SRITA-32, 309-SRITA-33, 309-SRITA-34, 309-SRITA-35), and two are on the Monterey Peninsula (309-CENTR-31, 309-LIBRA-31).
All HUs demonstrated repeated exceedance at some sites, although Carmel, Santa Lucia and Estrella HUs did not have any sites that exceeded the WQO more than 60% of the years sampled (Figure 6). All sites monitored five or more years in the Pajaro, Elkhorn, Salinas and Estero Bay watersheds exceeded the E. coli WQO at least one year.
Figure 6: Percentage of years that sites within a watershed exceeded water quality objectives (WQOs) for E. coli (235 MPN per 100 mL). Only sites monitored ≥5 years were analyzed. The Estrella watershed was omitted because only 1 site was monitored ≥5 years.
April 2015 18

Field Measured Water Chemistry Parameters
Field measures (pH, dissolved oxygen, water temperature, turbidity, and water clarity) conducted at the site were compared with the WQO for all years monitored. A total of 24 out of 186 sites (13%) monitored for ≥5 years did not exceed any of the field parameter WQOs during all Snapshot Day events. The HUs with sites where no exceedance of any field measured water chemistry parameters are identified in Table 4. Four HUs (Pajaro, Elkhorn Slough, Salinas, and Estrella) had at least one field parameter WQO exceeded at a site over all the years monitored. This is important information, especially because samples are only collected annually, but over the course of 14 years, a pattern may emerge and indicate potential chronic impairment that should be investigated.
The WQO for dissolved oxygen (DO) is a range from 7 to 12 mg/L. The range of DO observed over all Snapshot Day events and all sites for the 2109 field measured water chemistry parameters taken was between 0.78 mg/L to 19 mg/L, with 364 samples (17.3 %) falling below the minimum and 19 samples (1.0%) above the maximum WQO. DO was the most commonly exceeded field measured water chemistry parameter with 124 out of 186 (67%) sites falling outside the WQO range at least one year and 11 out of 186 (6%) of sites outside of range more than 60% of the time, for sites monitored 5 or more years. Four sites (Moore Creek at Empire Grade Rd. (304-MOORE-22), Watsonville Slough at Harkins Slough Rd. (305-WATSO-21), Struve Slough at Lee Rd. (305-STRUV-22), and Yerba Buena Creek at Estrada Avenue (309-YERBA-41) were outside the WQO range for dissolved oxygen between 82-90% of the years monitored.
All 9 HUs had one or more sites that exceeded the dissolved oxygen WQO by falling either below the lower limit or above the upper limit (Fig. 6). Big Basin, Pajaro, and Salinas HUs all had sites that exceeded the dissolved oxygen WQO more than 80% of the years monitored (for sites monitored more than 5 years): Big Basin 1 out of 55 sites (18% ), Pajaro 2 out of 13 sites (15% ), Salinas 1 out of 34 sites (3%). Elkhorn did not have any sites that fell within the WQO for all years monitored.
Water temperature was measured above the WQO of 21⁰ C for 80 out of a total of 2131 temperature measurements (3.8%) taken over all Snapshot Day events. The maximum observed water temperature of 30⁰ C was on May 7, 2005 at Moro Cojo Slough Lower at Hwy 1 (306-MOROC-33). Of the sites monitored for more than five years, 153 out of 186 sites (82%) never had an exceedance of the
HU Watershed # Sites with no Exceedance of WQO for Field
Measures
Total # Sites Monitored at Least 5 Years
% of Sites with no exceedance
202 San Mateo 8 31 25.8 304 Big Basin 18 55 32.7 305 Pajaro 1 13 7.7 306 Elkhorn Slough 0 7 0.0 307 Carmel 4 8 50.0 308 Santa Lucia 13 22 59.1 309 Salinas 1 34 2.9 310 Estero Bay 3 15 20.0 317 Estrella 0 1 0.0
Table 4. The HU for Snapshot Day sites that never exceeded the WQO for any field measurement during all the years they were monitored.
April 2015 19

temperature WQO during Snapshot Day monitoring. No sites exceeded the WQO more than 80% of the time. The two sites with the most frequent exceedance of WQO were Santa Rita Creek at Van Buren Avenue (309-SRITA-35) and Moro Cojo Slough at Castroville Slough (306-MOROC-32) with temperatures measured above 21⁰ C for 6 out of 7 years (86%) and 10 out of 13 years (77%), respectively (Fig. 6). Two HUs (Carmel and Santa Lucia) did not have any sites monitored for at least 5 years that exceeded the water temperature WQO.
The WQO for pH is a range between 6.5 and 8.5. The range of pH observed during Snapshot Day monitoring was from 4.7 to 9.9 over the total of 2152 samples taken, with pH falling below the WQO for 101 (1.9%) samples and above for 213 (2.6%) samples. The two sites out of range most frequently were Moro Cojo Slough at Castroville Slough Confluence (306-MOROC-32) where pH measured >8.5 for 11 out of 13 years (85%) and Moro Cojo Slough Lower at Hwy 1 (306-MOROC-33) where pH measured >8.5 for 12 out of 14 (86%) years. Both of these sites are in the Elkhorn Slough HU, where 2 out of 7 sites (29%) exceeded the WQO for more than 80% of the years monitored. None of the HUs had all sites within the pH range for all the years monitored (Fig. 7).
Figure 7: Percentage of years that sites within a watershed exceeded water quality objectives (WQOs) for field measured water chemistry. Only sites monitored ≥5 years were analyzed. The Estrella watershed was omitted because only 1 site was monitored ≥5 years.
Turbidity and water clarity are both measures of light penetration of the water column and both measures relate to the amount of suspended particles in the water (USEPA 1997). Field measurements of either water clarity or turbidity were taken at many sites from 2002 through 2013, however only one of the two measures, and not both, were taken at the same site each year. Furthermore, the same measure was not consistently taken at a particular site each year, thus some years turbidity was measured at a site and other years water clarity was measured at this same site. The Snapshot Day turbidity measurements were taken with turbidity meters whereas water clarity measurements were taken with a transparency tube. However despite the different methods used, the two measures are both indicators of the same water quality problem with the same potential water quality issues: lower production of dissolved oxygen, clogging of fish gills, smothering fish eggs and macro-invertebrates as particles settle (USEPA 1997).
April 2015 20

Therefore, the two measures were combined into “transparency” and displayed the number of sites exceeding the WQO for each watershed in terms of the percent of years these WQOs were exceeded (Fig. 8). There is no universally applicable formula to translate one value to the other, as multiple studies have found different relationships exist between waterbodies (MPCA 2005, Myer & Shaw 2006, Fermanich 2006). As no comparative studies between values have been conducted on the Central Coast, the WQO of not to exceed 25 NTU for turbidity and no less than 25 cm for water clarity was adopted. The decision to use these numerics is based on choosing the mid-range between findings from other studies showing the turbidity measures of 25 NTU can translate in some streams to a water clarity measures of 20 cm and in other cases to water clarity of 30 cm (MPCA 2005, Myer & Shaw 2006, Fermanich 2006).
Figure 8: Percentage of years that sites within a watershed exceeded water quality objectives (WQOs) for turbidity or water clarity (in combination referred to as ‘transparency’). Only sites monitored ≥5 years were analyzed. The Estrella watershed was omitted because only 1 site was monitored ≥5 years.
A total of 548 measures of turbidity and 1341 measures of water clarity were taken over all Snapshot Day events, with an incidence of 45 measures (8.2%) above the turbidity WQO of 25 NTU and 194 samples (14%) below the water clarity WQO of 25 cm. The highest turbidity measured was 385 NTU at Salsipuedes Creek at East Lake Avenue Bridge (305-SALSI-21) on May 21, 2004. A number of sites had water clarity measured at less than 2 cm for one or more years: Butano Creek at Pescadero Rd. (202-BUTAN-11), Moore Creek at the outflow of Antonelli Pond (304-MOORE-21), Moro Cojo Slough upper (306-MOROC-31), Moro Cojo Slough at Castroville Slough Confluence (306-MOROC-32), Rocky Creek (308-ROCKY-31), Paso Robles Creek at Santa Rita Rd (309-PASOR-41), Santa Rita Creek at Bellizona (309-SRITA-32), 14th hole Salinas Valley Golf Course (309-SRITA-33), Santa Rita Creek at Russell Rd. (309-SRITA-34), and Santa Rita Creek at Van Buren Avenue (309-SRITA-35).
Each HU had at least one site that exceeded the WQO for transparency for one or more years. The following HUs had sites that exceeded the transparency (combining the measures of turbidity and water clarity) WQOs for more than 80% of the years monitored: San Mateo at 10 out of 24 sites (42%), Big Basin
April 2015 21

at 14 out of 45 sites (31 %), Pajaro at 2 out of 12 sites (17%), Elkhorn at 2 out of 7 sites (29%), Salinas at 6 out of 34 sites (18%), and Estero Bay at 5 out of 14 sites (11%).
3.2 STATISTICS - TRENDS
Three analytes of special concern (nitrate, orthophosphate and E. coli) were evaluated for trends using the Mann-Kendall test and the calculation of an Arkitas-Sen-Theil slope, provided data were available for ≥5 years at a site and there was at least one exceedance of the WQO.
Nutrient Trends
A total of 186 sites were monitored for ≥5 years and of these the nitrate WQO was exceeded at least once at 66 sites. Of the 66 sites evaluated, a trend in nitrate concentration was detected at 6 sites (14%) based on the Mann-Kendall trend test and a p-value of 0.10, with 5 decreasing trends and 1 increasing trend (Table 5, Fig. 9). If instead we use a more conservative p-value of 0.05, the trend test results show trends at 2 sites, one increasing and one decreasing. The steepest and only increasing trend for nitrate was detected at a site in the Salinas HU on Tembladero Slough at Hwy 183 (309-TEMBL-32, slope = 3.8 mg/L-yr, p-value < 0.01). Because the p-value was less than 0.10 and both the upper and lower 95% confidence intervals (CIs) were positive, our confidence is very high that a trend existed at this site between 2000 and 2013. The nitrate-N concentration at this site for the first three years starting in 2000 was below the WQO and in 2013 was measured at 51.6 mg/L. Conversely, the Santa Cruz Storm Drain at Bay Street (304-SCD-03, slope = -0.053 mg/L-yr, p-value = 0.02) demonstrated a declining trend and with both CIs negative, provided a high level of confidence for a declining concentration trend at this site. Although we concluded there may have been a trend at the other three sites (Arroyo Creek at West Cliff (304-ARROY-23), Santa Cruz Storm Drain at Woodrow (304-SCSD-04, Harkins Slough at PVWMA Pump Station (305-HARKI-22)) based on the p-value <= 0.1, the CIs fell above and below zero, indicating some ambiguity in this result. A longer monitoring period may help distinguish and lend confidence regarding whether a trend actually occurred at these sites.
Table 5. Results of the Mann-Kendall trend test using a p-value of 0.10 indicate one positive and 5 negative trends for nitrate concentration. Selecting a more conservative p-value of 0.05, the test assesses 2 sites as showing trends Also shown are the Arkitas-Sen-Theil slope along with the upper and lower 95% CIs for this slope. When the two CIs are both either positive or negative, this provides increased confidence that a trend existed.
Site Code Site NameHydrologic Unit
(HU)Years
Sampled (#) tau p-valueA-K-T slope (mg/L - yr)
Slope Lower 95%
Confidence Interval
Slope Upper 95%
Confidence Interval
304-SCSD-03 Santa Cruz Storm Drain 3 Big Basin 2004-2013(9) -0.67 0.02 -0.053 -0.14 -0.01309-TEMBL-32 Tembladero Slough Hwy 183 Salinas 2000-2013(13) 0.82 <0.01 3.827 2.51 4.28304-ARROY-23 Arroyo Creek at West Cliff Big Basin 2001-2013(13) -0.36 0.10 -0.097 -0.24 0.06304-SCSD-04 Santa Cruz Storm Drain 4 Big Basin 2004-2013(9) -0.5 0.08 -0.163 -0.56 0.02305-HARKI-22 Harkins Slough at PVWMA Pump Stat Pajaro 2001-2013(13) -0.36 0.10 -0.231 -0.94 0.02306-ELKHO-34 ElkhornSlough at Watsonville Creek Elkhorn Slough 2001-2013(12) -0.39 0.09 -1.981 -4.59 0.85
Nitrate as N
April 2015 22

Figure 9. The three steepest slopes trend lines (one positive and two negative) in nitrate-N concentration over the period of Snapshot Day observations are shown along with the 95% CIs. The only positive trend detected in nitrate-N concentration was at the Tembladero Slough site at Highway 183 immediately south of Castroville. Results below the minimum detection limit are plotted as short vertical dashed lines along the x-axis.
We further investigated the increasing nitrate trend observed at Tembladero Slough at Hwy 183 (309-TEMBL-32) by comparing concentrations to other sites monitored on the Tembladero Slough. The three sites are shown in Figures 10 and 11 are within three miles of one another, with Tembladero Slough at Molera Road (309-TEMBL-31) furthest downstream and closest to the ocean and Tembladero Slough Hwy 183 (309-TEMBL-32) furthest upstream. In some years there was considerable variability in nitrate-N concentrations across the three sites. The highest variation (61.3 mg/L) between sites was observed in 2013 when the furthest downstream site nitrate-N concentration at Tembladero Slough at Molera Road (309-TEMBL-31) was 13.4 mg/L while the furthest upstream concentration at Tembladero Slough at Hwy
April 2015 23

183 (309-TEMBL-32) was 51.6 mg/L and the middle site at Tembladero Slough at Preston Street Bridge (309-TEMBL-33) a concentration of 74.7 mg/L. A similar pattern was observed in 2011 with the highest concentration occurring at the middle site and the lowest concentration at the furthest downstream site. However this pattern was not consistent. During other years (2009, 2010, 2012) the highest concentration was observed at the furthest upstream site 309-TEMBL-32 and lower concentrations at the two downstream sites.
Figure 10. Tembladero Slough sites, although within a 3 mile scope, sometimes have large variability in nitrate-N concentrations, up to a 61.3 mg/L difference between sites.
3.5 miles
April 2015 24

Figure 11. The location of the three sites monitored on Tembladero Slough and the nitrate concentrations measured at each site are shown in the above map and plot. There is considerable variability in concentrations between sites in the same year even though they are within 3 miles of one another.
Of the 186 sites monitored for 5 or more years, the orthophosphate WQO was exceeded at least once at 95 sites. Of the 95 sites where a trend test was conducted, 19 sites (20%) demonstrated a decreasing trend in orthophosphate concentration when a p-value of 0.10 was used for significance and 11 sites (12%) when a p-value of 0.05 was used. Those 19 sites were: 4 sites in the Big Basin HU (7% of sites), 3 sites in the Pajaro HU (23% of sites), 3 sites in the Elkhorn HU (43% of sites), 8 sites in the Salinas HU (24% of sites) and 1 site in the Estero Bay HU (6% of sites) (Table 6). Nine sites had decreasing slopes for both the upper and lower 95% CIs, thus we were highly confident a decreasing trend occurred. Six sites had slopes where the upper CI was 0 or positive, thus indicating some ambiguity regarding whether a trend existed and the need for further monitoring to conclusively make a determination.
April 2015 25

Table 6. Results of the Mann-Kendall trend test using a p-value of 0.10 for significance found 19 negative trends for orthophosphate-P concentration. Selecting a more conservative p-value of 0.05, the test assessed 11 sites as showing trends.
As shown in Figure 12, the three steepest orthophosphate trend line slopes were all decreasing and were seen at Elkhorn Slough at Watsonville Creek (306-ELKHO-34), Moro Cojo Slough upper (309-MOROC-31), and Upper Alisal Creek at Cesar Chavez Park (309-ALISA-32). The Moro Cojo site is in an agricultural area, the Elkhorn Slough site in a predominantly grassland area with nearby rural urban and agriculture, and the Alisal Creek site is in a mixed urban and agricultural area.
No increasing trends for orthophosphate concentration were observed.
Hydrologic Units (HUs) where no nitrate or orthophosphate trend was detected based on our statistical analysis were San Mateo, Carmel, Santa Lucia and Estrella.
Site Code Site NameHydrologic Unit
(HU)Years
Sampled (#) tau p-valueA-K-T slope (mg/L - yr)
Slope Lower 95%
Confidence Interval
Slope Upper 95%
Confidence Interval
304-ARANA-22 Arana Creek at north harbor Big Basin 2001-2013(12) -0.58 0.01 -0.021 -0.02 0.00304-LIDEL-21 Lidell Creek at Bonnie Doon Rd. Big Basin 2000-2013(14) -0.55 0.01 -0.019 -0.04 0.00305-HARKI-22 Harkins Slough at PVWMA Pump StatPajaro 2001-2013(13) -0.51 0.02 -0.035 -0.04 -0.02305-STRUV-21 Struve Slough at Harkins Slough Rd. Pajaro 2001-2013(13) -0.54 0.01 -0.013 -0.06 0.00306-ELKHO-34 ElkhornSlough at Watsonville Creek Elkhorn Slough 2001-2013(12) -0.53 0.02 -0.304 -0.38 -0.05306-MOROC-31 Moro Cojo Slough Upper Elkhorn Slough 2002-2013(12) -0.52 0.02 -0.155 -0.19 -0.02309-ALISA-32 Upper Alisal Crk at Cesar Chavez ParkSalinas 2000-2013(14) -0.42 0.04 -0.060 -0.12 0.00309-DOLPH-31 Dolphin Brook Salinas 2004-2012(8) -0.57 0.04 -0.046 -0.04 0.01309-TEMBL-33 Tembladero Slough at Preston St bridSalinas 2004-2013(10) -0.64 0.01 -0.054 -0.07 -0.01309-TROUT-41 Trout Creek at 3 bridges Salinas 2001-2013(12) -0.56 0.01 -0.013 -0.02 -0.01310-SYB-41 Santa Ysabela Estero Bay 2002-2013(12) -0.44 0.05 -0.010 -0.02 0.01304-APTOS-23 Aptos Creek at mouth Big Basin 2001-2013(12) -0.41 0.07 -0.010 -0.01 0.00304-ZAYAN-21 Zayante Creek at Bean Creek Big Basin 2004-2013(10) -0.44 0.09 -0.014 -0.02 0.01305-HARKI-21 Harkins Slough at Harkins Slough Rd. Pajaro 2000-2013(14) -0.34 0.08 -0.034 -0.03 0.00306-ELKHO-32 Elkhorn Slough at Hudson's Landing Elkhorn Slough 2001-2013(12) -0.36 0.09 -0.025 -0.01 0.01309-ASILO-31 Asilomar at walking bridge Salinas 2001-2013(13) -0.38 0.06 -0.024 -0.02 0.00309-CENTR-31 Central & 13th PG Salinas 2000-2013(14) -0.34 0.09 -0.014 -0.03 0.01309-RECDI-31 Rec Ditch at Davis Salinas 2000-2013(13) -0.38 0.08 -0.039 -0.08 0.00309-TEMBL-31 Tembladero Slough at Molera Rd. Salinas 2001-2013(14) -0.36 0.08 -0.031 -0.06 0.01
Orthophosphate as P
April 2015 26

Figure 12. All orthophosphate-P trends observed for Snapshot Day were negative. The three sites with the steepest slopes are shown in this series of plots. Notes the difference in scale on the y-axis. Results below the minimum detection limit are plotted as short vertical dashed lines along the x-axis.
April 2015 27

E. coli Trends
Of the 176 sites monitored for ≥5 years for E. coli, 151 sites exceeded the WQO at least once. Nineteen of these sites demonstrated trends for E. coli when a p-value of 0.10 was used for significance, with 9 declining trends and 10 increasing trends (Table 7 and App B). When a p-value of 0.05 was used for significance, 7 sites showed trends and only one of them decreasing. The confidence in the trends that were identified was reinforced if both the lower and upper CI had a positive value in the case of an increasing trend and both had a negative value in the case of a decreasing trend. In other words, if zero was not included in the interval between the two CIs, then a trend was more likely and our confidence increased. Out of the 7 significant trends with a p-value of 0.05, our confidence in 5 trends was reinforced by the CIs not including 0 in their interval. Using the conservative p-value for trends for E. coli concentration, increasing trends were observed at sites in the Big Basin HU (3 sites), Santa Lucia HU (1 site), and Salinas HU (1 site). The single decreasing trend was observed in the Salinas HU. Figure 13 shows plots for the three E. coli trends with the steepest slopes, assuming the more conservative p-value of 0.05. Because of the high level of variability associated with E. coli in the environment, we utilized the more conservative p-value for selecting sites to plot.
Table 7. Results of the Mann-Kendall trend test using a p-value of 0.10 for significance found 19 sites with trends. Using a more conservative p-value of 0.05 found 7 significant trends. The program for determining CIs required 6 years of data, returning an NA value when these were not computed.
Site Code Site NameHydrologic Unit
(HU)Years
Sampled (#) tau p-value
A-K-T slope (MPN/100 mL-
yr)
Slope Lower 95%
Confidence Interval
Slope Upper 95%
Confidence Interval
202-PURIS-11 Purisma Creek at Verde Rd. San Mateo 2001-2013(8) 0.71 0.02 44.7 10.9 124.7304-ARROY-22 Arroyo Creek at Delaware Ave Big Basin 2001-2013(8) 0.68 0.02 67.3 24.6 163.9304-MOORE-26 Moore Creek at mouth near interpre Big Basin 2002-2013(7) 0.76 0.02 79.9 0.0 573.0304-SANLO-21 San Lorenzo River at Soquel Avenue Big Basin 2000-2013(8) 0.71 0.02 76.0 8.9 470.7308-LIMEK-31 Limekiln Creek at Hwy 1 Santa Lucia 2002-2013(11) 0.47 0.05 4.2 0.0 41.8309-ASILO-31 Asilomar at walking bridge Salinas 2001-2013(13) -0.47 0.03 -59.2 -195.2 10.7309-GABIL-31 Gabilan Creek at Independence Salinas 2001-2012(11) 0.49 0.04 66.8 -26.0 162.6202-ALPIN-11 Alpine Creek at Alpine Rd. San Mateo 2001-2013(6) -0.67 0.09 -43.1 -704.0 1.7202-SANGR-12 San Gregorio Creek at San Gregorio G San Mateo 2004-2013(5) -0.80 0.09 -522.6 NA NA202-SANPE-12 San Pedro Creek north fork San Mateo 2001-2013(6) -0.73 0.06 -37.8 -76.8 -7.2304-SOQUE-22 Soquel Creek At Mouth Big Basin 2001-2013(8) 0.57 0.06 102.1 -7.8 1408.6305-BEACH-21 Beach Rd. Ditch at Palm Beach Pajaro 2001-2013(8) -0.50 0.10 -37.4 -150.7 12.5305-STRUV-22 Struve Slough at Lee Rd. Pajaro 2001-2013(9) -0.47 0.09 -11.4 -79.3 0.0305-WATSO-21 Watsonville Slough at Harkins Slough Pajaro 2001-2013(8) -0.54 0.08 -64.2 -1532.4 4.1306-MOROC-33 Moro Cojo Slough Lower at Hwy 1 Elkhorn Slough 2001-2013(13) -0.41 0.06 -4.2 -16.7 0.0308-HOTSP-31 Hot Springs Creek at Esalen Santa Lucia 2000-2013(13) 0.36 0.10 3.4 -10.0 16.4309-CENTR-31 Central & 13th PG Salinas 2000-2013(13) -0.36 0.10 -146.5 -699.0 6.8309-SALIN-33 Salinas River at Chualar Bridge Salinas 2001-2013(13) 0.41 0.06 4.3 -0.3 11.1310-DAL-41 Dairy Creek, lower Estero Bay 2003-2008(5) 0.80 0.09 153.1 NA NA
Escherichia coli
April 2015 28

Figure 13: Trends for E. coli concentration at the three sites with a p-value of ≤0.05 with the steepest slopes.
April 2015 29

3.3 COMPARISON OF CCAMP AND SNAPSHOT DAY TRENDS AND RATING
The rating comparison between the overlapping CCAMP and Snapshot Day sites for nitrate, orthophosphate and E. coli showed a good level of coincidence between the two programs despite the difference in sampling regimes and years sampled (see methods). Overlapping sites that were not monitored for ≥5 years during Snapshot Day or were not rated by CCAMP were not included in this comparison. The rating comparison for all overlapping sites is available in Appendix B Tables 4, 5 & 6.
Nitrate We compared CCAMP ratings and Snapshot Day WQO exceedances for nitrate and found that sites with an excellent, good or fair CCAMP rating had exceedances between 0 -14% of the years monitored during Snapshot Day. The sites rated as impacted or severely impacted for nitrate had exceedances ranging between 77-100% of the years monitored during Snapshot Day (Table 8).
Table 8. Comparison of the CCAMP rating at overlapping sites with the range of percent of years sites monitored during Snapshot Day exceeded the Water Quality Objective (WQO)
Sites that CCAMP has identified as impacted or severely impacted are of highest concern for aquatic life according to various indices that include chemistry, biology and physical habitat data (SWAMP 2014). These sites are shown in Table 9 to provide the reader the opportunity to compare Snapshot Day results with CCAMP results, although the CCAMP rating is an overall aquatic health rating and the Snapshot Day relates the percent of years the single analyte WQO was exceeded.
April 2015 30

Table 9. Sites rated by the CCAMP as impacted or severely impacted for nitrate contamination demonstrated a high percent of years the WQO was exceeded during Snapshot Day monitoring.
* Type: W is for watershed sites and CC for Coastal Confluence sites in CCAMP. Note the difference in sampling regimes in the Methods section of this report.
The comparison of the trend tests for CCAMP data with Snapshot Day data also showed some coincidence between the findings of the two programs at overlapping sites. For some overlapping sites a trend analysis was not conducted by one of the programs, usually due to an insufficient sample size. Of the 37 overlapping sites compared for nitrate trends, CCAMP did not observe a trend at 27 sites and Snapshot Day did not at all 37 sites. Thus twenty-seven of the same sites were identified as “no change” or not having a trend by both programs. The greater number of “no trend” sites statistically observed from Snapshot Day data can be partially explained by the lower number of samples due to only sampling on an annual basis. With less samples, a Type 2 error is more likely, where a trend may exist but could not be determined given the small sample size. Additionally, CCAMP may have found a trend where Snapshot data did not due to seasonal differences, for example, seasons when increased fertilization rates take place or when runoff is more highly influenced by storm events. There were no trends found at
Snapshot Day Site Code Site Name
Snapshot Day Date Range
Snapshot Day Trend
% Years Exceeded SSD WQO
TYPE
CCAMP Site Code
CCAMP Date Range
CCAMP Trend CCAMP Rating
202-GAZOS-11 Gazos Creek at mouth 2000-2013 no change 0 CC 304GAZ 2002-2012 no change excellent304-APTOS-21 Aptos Creek at steel bridge in 2000-2013 no change 0 W 304APS 2005-2011 no change excellent304-APTOS-23 Aptos Creek at mouth 2001-2013 no change 0 W 304APW 2001-2002 no change good304-ARANA-21 Arana Creek at Harbor High fis 2001-2013 no change 0 W 304ARA 2005-2011 decreasing good304-SANLO-27 San Lorenzo River at Junction P 2005-2013 no change 0 W 304SLE 2005-2011 no change excellent304-SCOTT-25 Scott Creek at Hwy 1 2006-2013 no change 0 CC 304SCO 2001-2012 no change excellent304-SOQUE-21 Soquel Creek At Nob Hill 2000-2011 no change 0 CC 304SOK 2005-2012 no change excellent304-SOQUE-22 Soquel Creek At Mouth 2001-2013 no change 0 CC 304SOQ 2001-2004 no change excellent305-HARKI-21 Harkins Slough at Harkins Slou 2000-2013 no change 0 W 305HAR 2005-2011 no change excellent305-PAJAR-21 Pajaro River under Thurwachte 2000-2013 no change 93 CC 305THU 1997-2013 no change impacted305-STRUV-22 Struve Slough at Lee Rd. 2001-2013 no change 0 W 305STL 2005-2011 no change fair305-WATSO-22 Watsonville Slough at Pajaro V 2001-2013 no change 85 W 305WSA 2005-2011 increasing severely impacted306-ELKHO-31 Elkhorn Slough at Kirby Park 2004-2013 no change 10 W 306ELK 1999-2012 no change good306-MOROC-33 Moro Cojo Slough Lower at Hw 2001-2013 no change 8 W 306MOR 1999-2012 no change fair307-CARME-33 Carmel River at Rosie's Bridge 2000-2013 no change 0 W 307CMU 2002-2009 no change excellent307-CARME-36 Carmel River at Schulte Rd. 2000-2013 no change 0 W 307CMD 2002-2009 no change excellent307-CARME-38 Carmel River at Hwy 1 2000-2013 no change 0 W 307CML 2001-2012 no change excellent308-BIGCR-31 Big Creek at Hwy 1 2002-2013 no change 0 W 308BGC 2001-2012 increasing excellent308-BIGSU-31 Big Sur River at &rew Molera P 2000-2013 no change 0 W 308BSR 2001-2012 decreasing excellent308-GARRA-31 Garrapata Creek 2001-2013 no change 0 W 308GAR 2002-2009 no change excellent308-LIMEK-31 Limekiln Creek at Hwy 1 2002-2013 no change 0 W 308LIM 2002-2009 no change good308-MILLC-31 Mill Creek at Hwy 1 2002-2013 no change 0 W 308MIL 2002-2009 increasing good308-WILLO-31 Willow Creek at mouth 2002-2013 no change 0 W 308WLO 2002-2012 no change excellent309-ATASC-41 Atascadero Creek at West Mal 2001-2013 no change 0 W 309ATS 1999-2012 no change excellent309-SALIN-31 Salinas River at Gypse Camp 2001-2013 no change 100 W 309SBR 1999-2012 no change severely impacted309-SALIN-32 Salinas River at Davis Rd. 2001-2013 no change 92 W 309DAV 1999-2012 decreasing severely impacted309-SALIN-44 Salinas River at Curbaril Bridge 2001-2013 no change 0 W 309SAT 1999-2012 decreasing fair309-SALIN-47 Salinas River at 13th St bridge 2000-2013 no change 14 W 309PSO 1999-2012 no change good309-SRITA-35 Santa Rita Creek at Van Buren 2007-2013 no change 100 W 309RTA 2006-2012 no change severely impacted309-TEMBL-31 Tembladero Slough at Molera 2001-2013 no change 85 W 309TDW 2001-2012 increasing severely impacted309-TEMBL-33 Tembladero Slough at Preston 2004-2013 no change 90 W 309TEM 2006-2012 increasing severely impacted310-ARROY-42 Arroyo de la Cruz under Hwy 1 2001-2013 no change 0 W 310ADC 2001-2012 no change excellent310-PICOC-41 Pico Creek under Hwy 1 bridge 2001-2013 no change 0 W 310PCO 2002-2009 no change excellent310-SANSI-41 San Simeon Creek at campgrou 2001-2013 no change 77 W 310SSC 2001-2012 increasing impacted310-SANTA-42 Santa Rosa Creek at Ferrasci Rd 2001-2013 no change 0 W 310SRU 2002-2009 no change good310-SANTA-43 Santa Rosa Creek at Windsor S 2002-2013 no change 0 W 310SRO 2001-2012 no change excellent317-ESTRE-43 Estrella River at Whitley Garde 2004-2012 no change 13 W 317ESE 2000-2012 no change excellent
Nitrate
April 2015 31

overlapping sites for Snapshot Day, whereas decreasing trends for nitrate were found at 4 sites for CCAMP and increasing trends at 6 CCAMP sites (Table 10).
The strongest trend for nitrate was on Tembladero Slough at 309-TEMBL-32, which does not have a shared location with a CCAMP site. However CCAMP does share two downstream sites (309TDW, 309TEM) with Snapshot Day (309-TEMBL-31, 309-TEMBL-33), both of which exhibited increasing CCAMP trends. The results from the two programs were compared in Figure 14, because these sites are reasonably proximal, commonly exceed the nitrate WQO, and are characterized by CCAMP as severely impacted.
Figure 14. Sites on Tembladero Slough with increasing trends found by either Snapshot Day or CCAMP trend analysis. Sites are shown in order from upstream to downstream.
Orthophosphate Sites rated by CCAMP as impacted or severely impacted for orthophosphate contamination were generally the sites with the highest percent of years exceeding the WQO during Snapshot Day monitoring (Table 10). All sites receiving impacted or severely impacted ratings by CCAMP for orthophosphate were found to exceed the WQO during Snapshot Day between 14% and 93% of the years monitored, with one exception of no exceedance at Soquel Creek at Nob Hill (304-SOQUE-21). Of the 22 overlapping sites rated as fair, good or excellent by CCAMP for orthophosphate, 18 sites did not exceed the WQO any of the times monitored during Snapshot Day. Four other sites received a fair rating by CCAMP but exceeded the WQO for Snapshot Day: Limekiln Creek at Hwy 1 (308-LIMEK-31) exceeded the WQO 10% of the years monitored, Harkins Slough at Harkins Slough Rd. (305-HARKI-21) exceeded the WQO 21% of the years monitoried, Salinas River at Davis Road (309-SALIN-32), exceeded the WQO 23% of the years
April 2015 32

monitoried, and Salinas River at 13th Street bridge in Paso Robles (309-SALIN-47) exceeded the WQO 36% of the years monitored.
Table 10. Sites rated by the CCAMP as impacted or severely impacted for orthophosphate contamination generally demonstrated exceedance of the orthophosphate WQO during Snapshot Day.
* Type: W is for watershed sites and CC for Coastal Confluence sites in CCAMP. Note the difference in sampling regimes in the
Methods section of this report.
For some overlapping sites a trend analysis was not conducted by one of the programs, usually due to an insufficient sample size. The trend analysis for orthophosphate was performed on each data set at 37 overlapping sites. This analysis did not find a trend at 27 CCAMP and 36 Snapshot Day sites, thus there was agreement between the two trend analyses at 27 sites with both finding “no trend”. The CCAMP trend analysis for orthophosphate found 5 decreasing and 5 increasing trends, while 1 decreasing trends was found by Snapshot Day. Although no increasing trends were observed for Snapshot Day, 5 increasing trends were observed from CCAMP data. In no case was an opposite trend found between the data sets for the same site (Table 11).
Snapshot Day Site Code Site Name
Snapshot Day Date Range
Snapshot Day Trend
% Years Exceeded SSD WQO
Type CCAMP Site Code
CCAMP Date Range
CCAMP Trend CCAMP Rating
202-GAZOS-11 Gazos Creek at mouth 2000-2013 no change 0 CC 304GAZ 2001-2012 no change good304-APTOS-21 Aptos Creek at steel bridge in Nisene M 2000-2013 no change 14 W 304APS 2005-2011 no change impacted304-APTOS-23 Aptos Creek at mouth 2001-2013 no change 33 W 304APW 2001-2002 no change severely impacted304-ARANA-21 Arana Creek at Harbor High fish ladder 2001-2013 no change 31 W 304ARA 2005-2011 no change severely impacted304-SANLO-27 San Lorenzo River at Junction Park 2005-2013 no change 0 W 304SLE 2005-2011 no change fair304-SCOTT-25 Scott Creek at Hwy 1 2006-2013 no change 0 CC 304SCO 2001-2012 no change good304-SOQUE-21 Soquel Creek At Nob Hill 2000-2011 no change 0 CC 304SOK 2005-2012 no change impacted304-SOQUE-22 Soquel Creek At Mouth 2001-2013 no change 8 CC 304SOQ 2001-2004 no change no rating305-HARKI-21 Harkins Slough at Harkins Slough Rd. 2000-2013 no change 21 W 305HAR 2005-2011 no change fair305-PAJAR-21 Pajaro River under Thurwachter Bridge 2000-2013 no change 21 CC 305THU 1997-2012 increasing impacted305-STRUV-22 Struve Slough at Lee Rd. 2001-2013 no change 92 W 305STL 2005-2011 increasing severely impacted305-WATSO-22 Watsonville Slough at Pajaro Valley Wa 2001-2013 no change 85 W 305WSA 2005-2011 no change severely impacted306-ELKHO-31 Elkhorn Slough at Kirby Park 2004-2013 no change 17 W 306ELK 1999-2012 decreasing no rating306-MOROC-33 Moro Cojo Slough Lower at Hwy 1 2001-2013 no change 54 W 306MOR 1999-2012 no change no rating307-CARME-33 Carmel River at Rosie's Bridge 2000-2013 no change 0 W 307CMU 2002-2009 no change excellent307-CARME-36 Carmel River at Schulte Rd. 2000-2013 no change 0 W 307CMD 2002-2009 no change excellent307-CARME-38 Carmel River at Hwy 1 2000-2013 no change 0 W 307CML 2001-2013 increasing good308-BIGCR-31 Big Creek at Hwy 1 2002-2013 no change 0 W 308BGC 2001-2012 decreasing excellent308-BIGSU-31 Big Sur River at &rew Molera Park 2000-2013 no change 0 W 308BSR 2001-2012 decreasing excellent308-GARRA-31 Garrapata Creek 2001-2013 no change 0 W 308GAR 2002-2009 no change excellent308-LIMEK-31 Limekiln Creek at Hwy 1 2002-2013 no change 10 W 308LIM 2002-2009 no change excellent308-MILLC-31 Mill Creek at Hwy 1 2002-2013 no change 0 W 308MIL 2002-2009 no change excellent308-WILLO-31 Willow Creek at mouth 2002-2013 no change 0 W 308WLO 2001-2012 decreasing excellent309-ATASC-41 Atascadero Creek at West Mall Bridge 2001-2013 no change 8 W 309ATS 1999-2012 no change fair309-SALIN-31 Salinas River at Gypse Camp 2001-2013 no change 31 W 309SBR 1999-2012 increasing impacted309-SALIN-32 Salinas River at Davis Rd. 2001-2013 no change 23 W 309DAV 1999-2013 no change fair309-SALIN-44 Salinas River at Curbaril Bridge 2001-2013 no change 0 W 309SAT 1999-2012 no change good309-SALIN-47 Salinas River at 13th St bridge in Paso R 2000-2013 no change 36 W 309PSO 1999-2012 no change fair309-SRITA-35 Santa Rita Creek at Van Buren Avenue 2007-2013 no change 86 W 309RTA 2006-2012 no change severely impacted309-TEMBL-31 Tembladero Slough at Molera Rd. 2001-2013 no change 93 W 309TDW 2001-2012 no change severely impacted309-TEMBL-33 Tembladero Slough at Preston St bridge 2004-2013 decreasing 70 W 309TEM 1999-2012 no change severely impacted310-ARROY-42 Arroyo de la Cruz under Hwy 1 2001-2013 no change 0 W 310ADC 2001-2012 decreasing excellent310-PICOC-41 Pico Creek under Hwy 1 bridge 2001-2013 no change 0 W 310PCO 2002-2009 no change excellent310-SANSI-41 San Simeon Creek at campground bridg 2001-2013 no change 46 W 310SSC 2001-2013 increasing impacted310-SANTA-42 Santa Rosa Creek at Ferrasci Rd 2001-2013 no change 0 W 310SRU 2002-2009 no change good310-SANTA-43 Santa Rosa Creek at Windsor St 2002-2013 no change 0 W 310SRO 2001-2013 no change good317-ESTRE-43 Estrella River at Whitley Gardens 2004-2012 no change 0 W 317ESE 2000-2012 no change fair
Orthophosphate
April 2015 33

Once again, these differences in trend findings and a lower number of observed trends from Snapshot Day are partially due to the smaller sample set for Snapshot Day. Additional reasons for the differences could be that CCAMP monitoring may pick up seasonal differences, such as levels of nutrient applicationrates seasons or storm water runoff. The differences could also be associated with random differences in nutrient levels that may vary temporally. As sampling accounts only for the concentration at an instant in time, differences could just be based on the randomness associated with the timing of that instant.
E. coli
Evaluation of the water quality site ratings by CCAMP for E.coli were highly coincident with the percent of years the site exceeded the WQO on Snapshot Day (Table 11). For all overlapping sites rated as impacted or severely impacted by CCAMP, these same sites exceeded the E.coli WQO 50% or more years on Snapshot Day. All sites rated as excellent, fair or good by CCAMP had an E.coli WQO exceedance rate of less than 50% of the years monitored during Snapshot Day.
Table 11. Sites evaluated as impacted or severely impacted by the regional CCAMP all exceeded the WQO for E. coli during at least half of the years sampled.
* W is for watershed sites and CC for Coastal Confluence sites in CCAMP.
Snapshot Day Site Code Site Name
SSD Date Range Ecoli Trend
% Years Exceeded SSD WQO
Type
CCAMP Site Code
CCAMP Date Range
CCAMP Trend CCAMP Rating
202-GAZOS-11 Gazos Creek at mouth 2001-2009 no change 13 CC 304GAZ 2005-2013 increasing good305-STRUV-22 Struve Slough at Lee Rd. 2001-2009 no change 11 CC 305STL 2005-2011 no change good306-MOROC-33 Moro Cojo Slough Lower at H 2001-2013 no change 8 W 306MOR 2006-2012 no change good308-LIMEK-31 Limekiln Creek at Hwy 1 2002-2013 increasing 9 W 308LIM 2009-2009 no change excellent308-WILLO-31 Willow Creek at mouth 2002-2012 no change 0 W 308WLO 2005-2012 no change excellent309-ATASC-41 Atascadero Creek at West M 2001-2013 no change 67 W 309ATS 2006-2012 increasing impacted304-APTOS-21 Aptos Creek at steel bridge i 2001-2009 no change 0 CC 304APS 2005-2011 no change good304-ARANA-21 Arana Creek at Harbor High f 2001-2009 no change 67 CC 304ARA 2005-2011 no change impacted304-SANLO-27 San Lorenzo River at Junctio 2005-2009 no change 40 CC 304SLE 2005-2011 no change fair304-SCOTT-25 Scott Creek at Hwy 1 2006-2009 no change 0 CC 304SCO 2005-2012 no change excellent304-SOQUE-21 Soquel Creek At Nob Hill 2002-2009 no change 38 CC 304SOK 2005-2013 no change fair305-HARKI-21 Harkins Slough at Harkins Slo 2001-2009 no change 67 CC 305HAR 2005-2011 no change severely impacted305-PAJAR-21 Pajaro River under Thurwach 2001-2009 no change 33 CC 305THU 2005-2013 no change fair305-WATSO-22 Watsonville Slough upstream 2001-2009 no change 33 CC 305WSA 2005-2011 no change fair306-ELKHO-31 Elkhorn Slough at Kirby Park 2001-2013 no change 18 W 306ELK 2006-2012 no change fair307-CARME-33 Carmel River at Rosie's Bridg 2001-2013 no change 0 W 307CMU 2009-2009 no change excellent307-CARME-36 Carmel River at Schulte Rd. 2001-2013 no change 0 W 307CMD 2009-2009 no change excellent307-CARME-38 Carmel River at Hwy 1 2001-2013 no change 8 W 307CML 2005-2012 no change excellent308-BIGCR-31 Big Creek at Hwy 1 2002-2013 no change 0 W 308BGC 2005-2013 no change excellent308-BIGSU-31 Big Sur River at &rew Molera 2001-2013 no change 0 W 308BSR 2005-2013 no change excellent308-GARRA-31 Garrapata Creek 2001-2013 no change 0 W 308GAR 2009-2009 no change excellent308-MILLC-31 Mill Creek at Hwy 1 2002-2013 no change 0 W 308MIL 2009-2009 no change excellent309-SALIN-31 Salinas River at Gypse Camp 2001-2013 no change 8 W 309SBR 2006-2012 no change good309-SALIN-32 Salinas River at Davis Rd. 2001-2013 no change 8 W 309DAV 2005-2013 no change fair309-SALIN-44 Salinas River at Curbaril Brid 2001-2013 no change 44 W 309SAT 2006-2012 no change excellent309-SALIN-47 Salinas River at 13th St bridg 2001-2013 no change 11 W 309PSO 2006-2012 no change good309-SRITA-35 Santa Rita Creek at Van Bure 2007-2013 no change 100 W 309RTA 2006-2012 no change severely impacted309-TEMBL-31 Tembladero Slough at Moler 2001-2013 no change 77 W 309TDW 2005-2013 no change impacted309-TEMBL-33 Tembladero Slough at Presto 2004-2013 no change 80 W 309TEM 2006-2012 no change impacted310-ARROY-42 Arroyo de la Cruz under Hwy 2001-2013 no change 43 W 310ADC 2005-2012 no change excellent310-PICOC-41 Pico Creek under Hwy 1 brid 2001-2013 no change 33 W 310PCO 2009-2009 no change good310-SANSI-41 San Simeon Creek at campgr 2001-2013 no change 30 W 310SSC 2005-2012 no change good310-SANTA-42 Santa Rosa Creek at Ferrasci 2001-2013 no change 43 W 310SRU 2009-2009 no change fair310-SANTA-43 Santa Rosa Creek at Windsor 2002-2013 no change 50 W 310SRO 2005-2012 no change good317-ESTRE-43 Estrella River at Whitley Gar 2004-2012 no change 50 W 317ESE 2006-2012 no change impacted
E. coli
April 2015 34

A trend analysis for E. coli was performed on both the CCAMP and Snapshot Day data sets at 35 overlapping sites. Each of the programs observed 1 increasing trend; however not at the same site (Table 11). At 33 sites, agreement existed between the two anlaysis that “no trend” was found. The lack of coincidence between the two programs sites where an increasing trend was observed (but not from both data sets) could be due to the variation in the sampling regimes between the two programs or to the highly variable E. coli concentrations commonly found in environmental data.
4. DISCUSSION
Volunteer environmental monitoring programs afford the public an opportunity to contribute to environmental decision-making, to constructively address their concerns about the environment, and to learn about the science and technology involved in a monitoring effort (Pfeffer and Wagenet 2007). The Network programs administered by MBNMS and Coastal Watershed Council staffs accomplish these ends and in addition provide data for regional decision-making while fostering community stakeholders that care about the health of the Sanctuary and its watersheds. Outreach strategies and training efforts are key to program success as these raise community awareness of the existence and importance of the sanctuary as well as providing a foundation of training, technology and protocols for reliable data that can be trusted and used by researchers beyond the MBNMS organization. The Snapshot Day citizen monitoring program follows guidelines recommended for a successful citizen monitoring effort including starting with a question that the data will help answer, use of standardized methods for data collection, data validation, providing feedback to volunteers, and reporting results (Silvertown 2009, Bonney et al. 2009)
Over the fourteen years of annual Snapshot Day sampling sufficient data have been collected to provide a basis for identifying sites that show repetitive exceedance (or not) of one or more water quality objectives (WQOs) and some indication of an increasing or decreasing trend in pollutant concentration. While it is beyond the scope of this effort to analyze the cause or source of pollutants entering local waterways, our analysis can help increase the awareness of citizens, agencies and NGOs of pollutants entering our waters at concentrations where ecological harm may occur. Concurring with many ecological studies, areas with greater land use influences from human development tend to exhibit lower water quality (D’Arcy & Frost 2001, Novotny & Olem 1994, Haycock & Muscutt 1995, Johnson et al. 1997, Meador & Goldstein 2003, Foley et al. 2005). Hydrologic Units (HU) with more human development including higher density urban areas, farming and ranching tended to have more sites that exceeded the WQOs for nutrients, E. coli and field measured water chemistry parameters. HUs with more undeveloped land and lower density development, although not achieving a perfect score card, had a lower number of sites repeatedly exceeding WQOs. These findings corroborate the need for continued effort to reduce anthropogenic influences on aquatic ecosystems. We believe this can be accomplished through efforts to reduce the contribution of pollutants from human value adding processes and through conscientious design of conservation practices into urban and agricultural settings and processes (Lenat & Crawford 1994, Haycock & Muscutt 1995, D’Arcy & Frost 2001, Tong & Chen 2002, Allan 2004, Ice 2004, Prokopy et al. 2008, Wong & Brown 2009).
April 2015 35

Due to the small Snapshot Day sample size for each site (n = 5-14) and the variability commonly associated with environmental data, a limited number of trends were observed. Our most positive finding was decreasing trends of orthophosphate concentrations at eleven sites across five HUs utilizing a p-value of 0.05 for significance. Four of these decreasing orthophosphate trends were found at sites in the Salinas HU, where the CCRWQCB has adopted a total maximum daily load (TMDL) for nutrients including orthophosphate and nitrate (CCAMP 2013). However for nitrate in the Salinas HU, we observed 1 increasing trend and no change at 34 sites monitored for at least 5 years. Mixed findings of both increasing and decreasing trends for nutrients by CCAMP in the Salinas HU reinforces the uncertainty regarding improvements in water quality. Although there have been extensive efforts to address agricultural pollution and stormwater runoff by growers, conservation professionals, and regulators, the effectiveness of these efforts and the results from implementing beneficial management practice (BMP) may not yet be observable by our trend analysis. A lag time between installation and a measured benefit from BMPs is common due to both physical and social reasons (Meals et al. 2010). Decreasing trends in orthophosphate could also be influenced by the prolonged period of drought in the Central Coast during the last 2 years of the monitoring period between 2012-2013.
Obtaining good data that are accurate, complete and reliable using volunteers is a challenge faced by all citizen science programs (Galloway et al. 2006, Cohn 2008). The many problems and errors that are likely to be made more frequently by volunteers than professional staff include incorrect use of equipment, contamination of samples, incorrect location of a site, mislabeling of samples, incorrect recording of data, damage to equipment, and improper sample handling (eg. failure to chill samples). The Network has addressed these potential errors and mishaps through a number of measures including training, team composition, maps and photos of site locations, detailed field instructions that follow QAPP protocols, and careful data scrutiny. Training volunteers how to use scientific equipment allows volunteer monitoring efforts to increase the precision of the data collected, leading to meaningful information that can be used to detect changes and support conclusions (Cohn 2008). Careful data scrutiny for errors and omissions and the removal of spurious data is important when using volunteers (Cohn 2008, Dickenson et al. 2010). MBNMS and CWC staff review data sheets with teams to insure completeness and occasionally remove outliers outside of the feasible range for the water quality. Following a rigorous QAPP requires following sample handling procedures, lab standards and the calibration of equipment prior to each sampling event. Through oversight, training and management, the Network has addressed common concerns associated with the use of volunteers such that we believe our data are as reliable as those collected by professionals.
Team formation is critical to good data collection, so that volunteers are not overwhelmed by complex protocols and too much new information (Cohn 2008, Dickinson et al. 2010). Team formation pairs new volunteers with experienced volunteers, professionals with students, surfers with scientists, activists with government staff. Careful assignment of at least one person with prior monitoring experience to a team insures teams have the skill and confidence to properly collect samples and use field equipment. Sharing of common interests, direct involvement and the educational components of the program form the basis of a grass roots stakeholder building process in water quality and the land based influence of human activity on ocean health in the sanctuary. Undoubtedly the help of many volunteers, approximately 198 annually, makes a monitoring program such as Snapshot Day achieveable. The cost of these volunteers if they
April 2015 36

were paid would be over $19,000 annually, which could not be afforded by MBNMS or other contributing organizations.
Another common issue of citizen monitoring is the linkage and barriers to making collected data available and usable by decision-makers who can influence positive environmental change (Conrad & Hilchey 2010, Dickinson et al. 2010). MBNMS is fulfilling the formatting and data evaluation protocols needed to enter the data into a statewide data base. The field data collected during Snapshot Day has been entered into the California Environmental Data Exchange Network (CEDEN) database through the Regional Data Center at Moss Landing Marine Labs. This data base provides access to data at a greater temporal and spatial frequency than what could be collected by a single organization. Central coast regulators have included Snapshot Day data in their review of regional water quality and decision-making process regarding listing 303(d) water bodies (personal commincation, Karen Worcester 2013).
Program success can be measured by whether information collected brings about actions or policies that benefit the environment for the public good (Sullivan et al. 2009, Conrad and Hilchey 2010, Dickinson et al. 2010). Although environmental benefit has not yet been proven, a project to reduce pollutants and restore Santa Rita Creek was initiated. MBNMS staff observed that Santa Rita Creek, a small waterbody in north Salinas, was consistently identified as an Area of Concern and had consistent high nitrate concentrations at monitoring sites (as high as nitrate-N of 315 mg/L). As a result of this finding, a Prop 84 IRWM Implementation grant project was awarded for a collaborative effort between the Resource Conservation District of Monterey County (RCDMC), the Central Coast Wetlands Group (CCWG), and MBNMS staff to work with growers and neighbors to create awareness of watershed health, reduce nitrate contamination and restore habitat along the Ferrasci baseball field section of Santa Rita Creek. The project and water quality monitoring is underway with an end date of Winter 2016 when project effectiveness will be assessed. Similarly, in a separate effort under the leadership of the Coastal Watershed Council, the San Lorenzo River Alliance was formed in 2013 with objectives centered on water quality improvement, habitat restoration, public safety, community engagement and recreational enhancement.
5. CONCLUSION
One measure of Snapshot Day success is the continued ability to recruit a large number of volunteers to help with the environmental monitoring program across ten watersheds that enter MBNMS over a time span of fourteen years. Citizen involvement and the collaboration of Network organizations enables monitoring a greater geographic range and monitoring a higher density of sites than would be possible otherwise. Snapshot Day has also demonstrated that trained citizen scientists can effectively collect reliable and representative water quality data that can be analyzed and utilized by a variety of organizations for regional decision making. The data collected on Snapshot Day in combination with other regional monitoring data have been used by the CCAMP in assessing waterbody health and making 303(d) listing recommendations for impaired waters under the Clean Water Act. A collaborative regional project to restore Santa Rita Creek in Salinas was developed as a result of Snapshot Day observations. Thus Snapshot Day is directly linked to conservation activities and improved environmental management, a key determinant of successful citizen science programs (Conrad 2010)
April 2015 37

Through their involvement, volunteers make a contribution to science and the health of Monterey Bay National Marine Sanctuary. Some volunteers join other MBNMS citizen science efforts including additional Network monitoring programs or local conservation efforts led by other groups. Yet the full potential of volunteer contribution may not be realized by the current program. Involving citizen scientists beyond monitoring tasks and engaging them in social processes aimed at community based initiatives, collaboration regarding sustainable resource management, and participation in local conservation planning may create broader community engagement toward effective ecosystem stewardship (Day & Litke 2005, Conrad & Daoust 2008, Divictor et al. 2010). Although the major focus is on the recruiting and education of volunteers, Network organizations have also advanced the program to the extent of inviting volunteers to define program objectives or engage in participatory conservation planning. For example, the Santa Rita Creek project and efforts by CWC along the San Lorenzo River are both examples of how citizen involvement has directed projects by Network organizations. This role extension is possible if volunteers are determined to make a difference and take a leadership role in their community or contribute to activities of other conservation related organizations.
Despite its success, the scope of Snapshot Day encounters an uncertain future due to the financial challenges faced by Network organizations and the insecurity of ongoing funding of staff and lab analytical costs. In 2014, CWC was no longer able to fully participate in Snapshot Day due to insufficient resources, thus requiring other Network organizations to increase their geographical territory and resulting in a reduction of the total number of sites that could be monitored. Increasingly, the Network is having to downsize its program and is making monitoring site choices aimed at remaining comprehensive and relevant.
April 2015 38

Bibliography
Agricultural Water Quality Alliance [AWQA]. 2014. AWQA 2011-2013 Accomplishments.
Allan JR. 2004. Landscapes and riverscapes: The influence of land use on stream ecosystems. Annual Review of Ecology, Evolution and Systematics. 35:257-284.
Bennett EM, Carpenter SR, Caraco NF. 2001. Human impact on erodible phosphorus and eutrophication: a global perspective. Bioscience. 51(3):227-234.
Bonney R, Cooper CB, Dickinson J, Kelling S, Phillips T, Rosenberg KV, Shirk J. 2009. Citizen science: a developing tool for expanding scientific knowledge and scientific literacy. Bioscience 59(11):977-984.
Carslaw D, Ropkins K. 2014. Package openair. Available at http://cran.r-project.org/web/packages/openair/openair.pdf.
Central Coast Regional Water Quality Control Board [CCRWQCB] 2013. State Water Resources Control Board Resolution No. 2014. Dates March 14, 2013.
Central Coast Regional Water Quality Control Board [CCRWQCB]. 2011. Water quality control plan for the Central Coast Basin. Downloaded on 12/3/14. Available at http://www.swrcb.ca.gov/centralcoast/publications_forms/publications/basin_plan/docs/basin_plan_2011.pdf
Central Coast Regional Water Quality Control Board [CCRWQCB]. 2014. Central Coast Ambient Monitoring Program. Internet accessed on 9/12/14. Available at http://www.ccamp.us/_cc_report1/view_data.php?org_id=rb3.
Cohn J. 2008. Citizen science: Can volunteers do real research? Bioscience 58(3):192-197.
Conrad CT, Daoust T. 2008. Community based monitoring frameworks: increasing effectiveness of environmental stewardship. Environmental Management 41:356-358.
Conrad CC, Hilchey KG. 2010. A review of citizen science and community-based environmental monitoring: issues and opportunities. Environmental Monitoring and Assessment 176:273-291.
D’arcy B, Frost A. 2001. The role of best management practices in alleviating water quality problems associated with diffuse pollution. The Science of the Total Environment 265: 359-367.
Day J, Litke S. 2005. Building local capacity for stewardship and sustainability: the role of community based watershed management in Chilliwack, British Columbia. Environments 25(3):91-110.
Dickinson JL, Zuckerberg B, Bonter DN. 2010. Citizen Science as an ecological research tool: challenges and benefits. Annual Review of Ecology, Evolution and Systematics 41:149-172.
Doud BM, Press, D, Los Huertos M.2008. Agricultural nonpoint source water pollution policy: the case of California’s Central Coast. Agriculture, Ecosystems, & Environment 128(3):151-161.
Fermanich, K. 2006. Transparency: A water clarity measure. Wisconsin Department of Natural Resources. Internet downloaded 3/12/15. Available at http://watermonitoring.uwex.edu/pdf/level1/FactSeries-Turbidity.pdf
Foley JA, DeFries R, Asner GP, Barford C, Bonan G, Carpenter SR, Chapin FS, Coe MT, Daily GC, Gibbs HK, Helkowski JH, Holloway T, Howard EA, Kurcharik CJ, Monfreda C, Patz JA, Preintice C, Ramankutty N, Snyder PK. Global consequences of land use. Science 309:570-574.
April 2015 39

Galloway AW, Tudor MT, Vander Hagen M. 2006. The reliability of citizen science: a case study of Oregon white oak stand surveys. 34(5):1425-1429.
Haycock NE, Muscutt AD. 1995. Landscape management strategies for the control of diffuse pollution. Landscape and Urban Planning 31:313-321.
Ice G. 2004. History of innovative best management practice development and its role in addressing water quality limited waterbodies. Journal of Environmental Engineering 130(6): 684-689.
Johnson L, Richards R, Host GE, Arthur JW. 1997. Landscape influences on water chemistry in Midwestern stream ecosystems. Freshwater Biology 37:193-208.
Helsel DR, Hirsch RM. 2002. Statistical methods in water resources. Techniques of Water Resources Investigation, Book 4, chapter A3. US Geological Survey.
Kendall M. 1938. A new measure of rank correlation. Biometrica 30(12): 81-89.
Kendall M. 1948. Rank correlation methods. Charles Griffin and Co. Ltd. London.
Lenat DR, Crawford JK. 1994. Effects of land use on water quality and aquatic biota of three North Carolina Piedmont streams.
Lee L. 2013. Package ‘NADA’. Nondetects and Data Analysis for environmental data. Version 1.56. Available at http://cran.r-project.org/web/packages/NADA/NADA.pdf
Mann HB. 1945. Nonparametric tests against trend. Econometrica 13: 245-259.
Meador MR, Goldstein RM. 2003. Assessing water quality at large geographic scales: relations among lad use, water physicochemistry, riparian condition and fish community structure. Environmental Management 31(4):504-517.
Meals DW, Dressing SA, Davenport TE. 2010. Lag time in water quality response to best management practices: a review. Journal of Environmental Quality 39:85-96.
Minnesota Pollution Control Agency [MPCA]. 2005. Using transparency tube and total suspended solids data to assess stream turbidity. Internet downloaded 3/12/15 available at http://www.pca.state.mn.us/index.php/water/water-types-and-programs/surface-water/streams-and-rivers/citizen-stream-monitoring-program/citizen-stream-monitoring-program-publications.html
Myre E, Shaw R. 2006. The turbidity tube: simple and accurate measurement of turbidity in the field. Internet downloaded on 3/12/15 available at http://www.cas.umn.edu/assets/pdf/Turbidity%20Tube.pdf.
Novotny V, Olem H. 1994. Water quality; prevention, identification and management of diffuse pollution. New York. Van Nostradn Reinhold. 1054 pp.
Pfeffer MJ, Wagenet LP. 2007. Volunteer environmental monitoring, knowledge creation and citizen-scientist interaction. Chapter 16 in the SAGE Handbook of Environment and Society.
Prokopy LS, Floress K, Klotthor-Weinkauf D, Baumgart-Getz A. 2008. Determinants of agricultural best management practice adoption: Evidence from the literature. Journal of Soil and Water Conservation 63(5): 300-311.
April 2015 40

R Core Team. 2013. R: A language and environment for statistical computing. R Foundation for Statistical Computing, Vienna, Austria. Available at http://www.R-project.org/.
Silvertown J. 2009. A new dawn for citizen science. Trends in Ecology and Evolution. 24(9): 467-471.
Suface Water Ambient Monitoring Program [SWAMP]. 2014. Central Coast healthy watersheds project. Internet accessed on 12/31/14. Available at http://www.waterboards.ca.gov/water_issues/programs/swamp/achievements/2012/assess_healthywatersheds.pdf.
Tong STY, Chen W. 2002. Modeling the relationship between land use and surface water quality. Journal of Environmental Management 66(4):377-393.
USEPA. 1997. Volunteer lake monitoring: A methods manual. EPA 841-B-97-003. Office of Water, U. S. Environmental Protection Agency, Washington, DC.
USEPA. 2012. Recreational water quality criteria. Office of Water: 820-F-12-058. Internet download 12/3/14 Available at http://water.epa.gov/scitech/swguidance/standards/criteria/health/recreation/upload/RWQC2012.pdf
Wong THF, Brown RR. 2009. The water sensitive city: principles for practice. Water Science & Technology 60(3): 673-682.
April 2015 41