Clustering Consumers Based on Trust, Confidence and Giving Behaviour: Data-Driven Model Building for...
28
RESEARCH ARTICLE Clustering Consumers Based on Trust, Confidence and Giving Behaviour: Data- Driven Model Building for Charitable Involvement in the Australian Not-For-Profit Sector Natalie Jane de Vries 1 , Rodrigo Reis 1,2 , Pablo Moscato 1 * 1 Centre for Bioinformatics, Biomarker Discovery & Information-Based Medicine, The University of Newcastle, Callaghan, New South Wales, Australia, 2 Faculdade de Medicina de Ribeirao Preto, Universidade de São Paulo, São Paulo, Brazil * [email protected] Abstract Organisations in the Not-for-Profit and charity sector face increasing competition to win time, money and efforts from a common donor base. Consequently, these organisations need to be more proactive than ever. The increased level of communications between indi- viduals and organisations today, heightens the need for investigating the drivers of charita- ble giving and understanding the various consumer groups, or donor segments, within a population. It is contended that `trust' is the cornerstone of the not-for-profit sector's survival, making it an inevitable topic for research in this context. It has become imperative for chari- ties and not-for-profit organisations to adopt for-profit's research, marketing and targeting strategies. This study provides the not-for-profit sector with an easily-interpretable segmen- tation method based on a novel unsupervised clustering technique (MST-kNN) followed by a feature saliency method (the CM1 score). A sample of 1,562 respondents from a survey conducted by the Australian Charities and Not-for-profits Commission is analysed to reveal donor segments. Each cluster's most salient features are identified using the CM1 score. Furthermore, symbolic regression modelling is employed to find cluster-specific models to predict `low' or `high' involvement in clusters. The MST-kNN method found seven clusters. Based on their salient features they were labelled as: the `non-institutionalist charities sup- porters', the `resource allocation critics', the `information-seeking financial sceptics', the `non-questioning charity supporters', the `non-trusting sceptics', the `charity management believers' and the `institutionalist charity believers'. Each cluster exhibits their own charac- teristics as well as different drivers of `involvement'. The method in this study provides the not-for-profit sector with a guideline for clustering, segmenting, understanding and potential- ly targeting their donor base better. If charities and not-for-profit organisations adopt these strategies, they will be more successful in today's competitive environment. PLOS ONE | DOI:10.1371/journal.pone.0122133 April 7, 2015 1 / 28 OPEN ACCESS Citation: de Vries NJ, Reis R, Moscato P (2015) Clustering Consumers Based on Trust, Confidence and Giving Behaviour: Data-Driven Model Building for Charitable Involvement in the Australian Not-For- Profit Sector. PLoS ONE 10(4): e0122133. doi:10.1371/journal.pone.0122133 Academic Editor: Wei-Xing Zhou, East China University of Science and Technology, CHINA Received: December 1, 2014 Accepted: February 11, 2015 Published: April 7, 2015 Copyright: © 2015 de Vries et al. This is an open access article distributed under the terms of the Creative Commons Attribution License, which permits unrestricted use, distribution, and reproduction in any medium, provided the original author and source are credited. Data Availability Statement: All data are publicly available online through the ACNC website (https:// www.acnc.gov.au/ACNC/Pblctns/Rpts/ACNC/ Publications/Reports/Trust_con.aspx). Funding: The authors have no support or funding to report. Competing Interests: The authors have declared that no competing interests exist.
Transcript of Clustering Consumers Based on Trust, Confidence and Giving Behaviour: Data-Driven Model Building for...

RESEARCH ARTICLE
Clustering Consumers Based on Trust,Confidence and Giving Behaviour: Data-Driven Model Building for CharitableInvolvement in the Australian Not-For-ProfitSectorNatalie Jane de Vries1, Rodrigo Reis1,2, Pablo Moscato1*
1Centre for Bioinformatics, Biomarker Discovery & Information-Based Medicine, The University ofNewcastle, Callaghan, New South Wales, Australia, 2 Faculdade de Medicina de Ribeirao Preto,Universidade de São Paulo, São Paulo, Brazil
AbstractOrganisations in the Not-for-Profit and charity sector face increasing competition to win
time, money and efforts from a common donor base. Consequently, these organisations
need to be more proactive than ever. The increased level of communications between indi-
viduals and organisations today, heightens the need for investigating the drivers of charita-
ble giving and understanding the various consumer groups, or donor segments, within a
population. It is contended that `trust' is the cornerstone of the not-for-profit sector's survival,
making it an inevitable topic for research in this context. It has become imperative for chari-
ties and not-for-profit organisations to adopt for-profit's research, marketing and targeting
strategies. This study provides the not-for-profit sector with an easily-interpretable segmen-
tation method based on a novel unsupervised clustering technique (MST-kNN) followed by
a feature saliency method (the CM1 score). A sample of 1,562 respondents from a survey
conducted by the Australian Charities and Not-for-profits Commission is analysed to reveal
donor segments. Each cluster's most salient features are identified using the CM1 score.
Furthermore, symbolic regression modelling is employed to find cluster-specific models to
predict `low' or `high' involvement in clusters. The MST-kNN method found seven clusters.
Based on their salient features they were labelled as: the `non-institutionalist charities sup-
porters', the `resource allocation critics', the `information-seeking financial sceptics', the
`non-questioning charity supporters', the `non-trusting sceptics', the `charity management
believers' and the `institutionalist charity believers'. Each cluster exhibits their own charac-
teristics as well as different drivers of `involvement'. The method in this study provides the
not-for-profit sector with a guideline for clustering, segmenting, understanding and potential-
ly targeting their donor base better. If charities and not-for-profit organisations adopt these
strategies, they will be more successful in today's competitive environment.
PLOS ONE | DOI:10.1371/journal.pone.0122133 April 7, 2015 1 / 28
OPEN ACCESS
Citation: de Vries NJ, Reis R, Moscato P (2015)Clustering Consumers Based on Trust, Confidenceand Giving Behaviour: Data-Driven Model Building forCharitable Involvement in the Australian Not-For-Profit Sector. PLoS ONE 10(4): e0122133.doi:10.1371/journal.pone.0122133
Academic Editor:Wei-Xing Zhou, East ChinaUniversity of Science and Technology, CHINA
Received: December 1, 2014
Accepted: February 11, 2015
Published: April 7, 2015
Copyright: © 2015 de Vries et al. This is an openaccess article distributed under the terms of theCreative Commons Attribution License, which permitsunrestricted use, distribution, and reproduction in anymedium, provided the original author and source arecredited.
Data Availability Statement: All data are publiclyavailable online through the ACNC website (https://www.acnc.gov.au/ACNC/Pblctns/Rpts/ACNC/Publications/Reports/Trust_con.aspx).
Funding: The authors have no support or funding toreport.
Competing Interests: The authors have declaredthat no competing interests exist.

IntroductionFar from being a calm and slow-paced segment of the tertiary economic sector, charities andnot-for-profit organisations need to be more proactive than ever. They are demanded to adaptto modern technologies and to be more efficient in a highly-competitive environment in whichthey are increasingly competing for donors’ time, trust, confidence, involvement and charitablegiving. This new type of behaviour for institutions that were previously characterised as “lessagressive” in their marketing strategies is progressively imitating the activities of regular for-profit organisations as competition amongst charities becomes more fierce [1].
Some characteristics of charitable giving may be highly dependent of the particular countryor social group under consideration. For instance, researchers have previously argued that Aus-tralian consumers in particular perceive government’s support for charities to be quite high,consequently impacting on their perception of charities’ need for individual support [2]. Fur-thermore, ‘trust’ is a defining concept when it comes to individual charitable giving and itcould even be stated that ‘trust’ constitutes the very foundation on which voluntary institutionsare built [3]. It is therefore an interesting subject to investigate Australian consumers’ supportin terms of donating and volunteering behaviour related to their trust and confidencein charities.
This study aims to investigate these issues in the scenario of Australian consumers’ attitudestowards and trust and confidence in charities. The methodology proposed to segment the pop-ulation in particular clusters of more homogeneous attitudes is quite general and can easily beemployed to analyse other datasets. From a marketing perspective, our study addresses theissue of charities and not-for-profits’ need to behave more competitively among themselves.The purpose of this study is to identify if it is possible to obtain more homogeneous groups ofattitudes and consumer behaviours towards charities. We seek to identify whether there areclear patterns among respondents who are highly similar to each other in terms of their behav-iours and attitudes towards charities. Also, a further analysis of which characteristics are mostrepresentative of each cluster is provided. We note that clustering of the market, or;market seg-mentation, is common practice in private for-profit organisations in order to better understandthe drivers of their consumers, create targeted marketing and advertisement strategies that areaware of these differences and to select those consumer groups worth pursuing. We bring anovel method that provides advanced clustering strategies into the context of Not-For-Profit(NFP) organisations and thus cluster a population of potential donors based on their trust andconfidence in, and their behaviours towards the existing spectrum of charities in aparticular country.
The paper is organised as follows. First, a background to the study including a brief reviewof the literature is provided, followed by Materials and Methods which introduces the datasetused, the methods employed in its processing and the methodology utilised in this study fol-lowed by the Results. Finally, the Discussion section discusses some of these results with impli-cations for managers of charities and provides final remarks for future research.
BackgroundCharities all over the world are facing increasing competition from one another and other NFPorganisations for people’s time, money and efforts. It has long been argued that not-for-profitsare following in for-profit organisations’ footsteps and that they are attempting to adopt moretargeted strategies for finding their most likely donor base [1, 4, 5]. This trend however, has be-come even more important in the modern interconnected world where consumers’ time issparser, globalisation has brought consumers and institutions together globally as well as in-creased competition between institutions for consumer’s time and money [6]. As stated by
Clustering Consumers on Trust and Confidence in Charities
PLOS ONE | DOI:10.1371/journal.pone.0122133 April 7, 2015 2 / 28

Polonsky, Shelley and Voola [2], charities are utilising a range of marketing activities in orderto simply maintain private donations.
One such marketing activity is that of market segmentation [1]. Market segmentation is astrategy well-known to private industry marketers being introduced several decades ago [7]and has since been widely utilised in for-profit organisations. As in the case for businesses, ef-fective market segmentation should allow charities and NFP’s to customise the message con-tent of their appeals and campaigns to distinct groups of prospective donors [1]. In doing so,identifying and selectively targeting the most likely individuals, or groups of giving individuals,would optimise the ratio of successful approaches to total number of approaches [8]. However,as stated by Srnka, Grohs and Eckler [8], although the “who” and “how” questions are impor-tant in segmenting, it is the more detailed factors such as behavioural variables that provide abetter segmentation approach. Furthermore, for the charity and NFP sector, public trust andconfidence are at the pinnacle of its existence and of extreme importance to its success and lon-gevity. This is why in the case of segmenting the market for potential charitable donors, notonly their behaviour is important, but also their trust, and confidence in acharitable organisation.
In this context, it is important to note that donating and/or volunteering behaviour are notsubstitutable to trust or confidence in an organisation. As explained by Bekkers and Bowman[9], some individuals engage in volunteering activities even with the lowest levels of charitableconfidence. This means that some individuals may have low levels of trust and confidence incharities but are still willing to volunteer and donate, and oppositely, there are individuals whodo trust charities but neither engage in volunteering activities or donating financially. Thiscomplex relationship between trust and giving behaviour has been examined empirically in acausal path model where trust and ‘commitment’ to the charity are found to be positivelylinked to donor giving behaviour [10]. This means that when investigating a consumer groupin terms of donating behaviour, trust and confidence in charities form part of the major factors.Furthermore, this extant literature highlights the complexity of consumers’ trust in, and confi-dence of charities and NFP organisations and the need for further empirical examination.
Another important aspect in the context of donor behaviour and charities’ operations tonote, is that of consumers’ perceived wastefulness of charities’ resources. A recent study hasfound that avoiding donor’s funds going to overheads (i.e. administrative and advertisingcosts) and enlightening consumers of this overhead aversion increases donations significantly[11]. Specifically, Gneezy et al. [11] find that when informing potential donors that seed fund-ing has already been obtained (from philanthropists or companies), donations rates significant-ly increase by an astonishing 80%. Interestingly, the study by the Australian Charities and Not-for-Profits Commission (ACNC) of which the data is used in this study, included many finan-cial-focused questions asking respondents about their perceived wastefulness as well as thetypes of information they value. Furthermore, the link between donor’s trust in charities andtheir perceptions on how charities manage resources and donations is covered in this studymaking it an interesting case to test the findings by Gneezy et al. [11].
It is for these reasons that this study aims at segmenting the Australian consumer market interms of trust and confidence in, and donating behaviour towards charities and not-for-profitorganisations. Private donations form an issue for charities and not-for-profit institutions inAustralia in particular as Australian donors perceive that government support of charities ishigh and thus charities are perceived to be less likely to need individual support [2]. This pro-vides one of the many reasons it has become inevitable for Australian charities to embracemore advanced strategic marketing activities. However, due to the philanthropic nature ofcharities and not-for-profits, funds are limited; particularly funds for marketing research andadministrative costs. In this sense, we believe that this research adds a valuable contribution to
Clustering Consumers on Trust and Confidence in Charities
PLOS ONE | DOI:10.1371/journal.pone.0122133 April 7, 2015 3 / 28
the literature by utilising advanced research techniques in a not-for-profit context helpingcharities and NFP organisations to better understand the Australian donor market.
Materials and Methods
Data SetThe data employed in this study consists of a set of responses from a quantitative survey con-ducted on behalf of the Australian Charities and Not-for-profits Commission (ACNC) byChantLink in 2013. The data as well as the survey and report are publicly available online andare maintained by the Office of the Australian Government http://data.gov.au/dataset/trust-and-confidence. This survey collected information about levels of trust and confidence in chari-ties and factors that may affect these levels. It also collected information about awareness andsupport for a national regulator of charities and interest in a public register of charities.
The survey was conducted online between 22 and 29 April 2013 and obtained 1,624 com-plete responses (including a pilot phase of 60 responses). For the purpose of this study we omit-ted the pilot phase responses leaving 1,562 responses for our clustering experiments.Furthermore, in this data set, due to the design of the online questionnaire, not all participantsresponded to every single question. Depending on their responses, individuals were sent to adifferent section and were forced to skip several questions. Therefore, in order to obtain clus-ters without the need to use mechanisms to impute missing data for a large proportion of thesample, the complete data set of n = 1,562 respondents was checked and only those questionsanswered by all individuals are used in the clustering process. As a result, we have 1,562 re-sponses to 43 different questions which form the basis to compute similarities among the re-spondents for the clustering method. In other words, we have a 1,562×43 matrix of our data.This matrix provides the basis for the computation of a similarity (or distance) measure neededfor the clustering process which is described further below.
Some of the remaining questions, which, for instance relate to the respondents’ demograph-ic information, are subsequently used to highlight possible differentiating characteristics of theclusters. We do not include this information in the clustering method, since segmenting a mar-ket based on consumers’ behaviours, trust and confidence in charities is our primary goal andit provides a more detailed cohort analysis than segmenting based on demographicinformation alone.
MST-kNN Clustering MethodIn order to segment the sample of Australian donors, a novel and highly scalable clusteringmethod is employed. The method aims at finding groups of related respondents that share sim-ilar characteristics. These similar characteristics are measured using a particular distance orsimilarity (correlation) metric. The selection of this distance or correlation metric is a signifi-cant step as it defines when two respondents are going to be in the same group; thereforewhether they are ‘closely related’ or not. In order to analyse the data and to find meaningfulgroups we use the unsupervised graph-based clustering algorithm: MST-kNN [12] which haspreviously been used in bioinformatics and in the analysis of a wide range of studies including;Alzheimer’s Disease and yeast transcriptomic datasets, prostate cancer, computational linguis-tics, RNA stability and shows great scalability and performance [13–16].
In this study, the Spearman rank correlation coefficient is used to help us define a distanceor ‘dissimilarity’ between pairs of respondents. This means that this metric is computed forevery possible pair of respondents based on their responses in our 1,562×43 matrix. Conse-quently, the computed a correlation matrix which is a 1,562 by 1,562 array consisting of thecorrelation values for every possible pair of respondents. The Spearman rank correlation
Clustering Consumers on Trust and Confidence in Charities
PLOS ONE | DOI:10.1371/journal.pone.0122133 April 7, 2015 4 / 28
coefficient is a statistical measure of a monotonic relationship between two different variables.We denote the Spearman correlation with Sxy and the distance metric between two respondentsx and y by the expression (1).
dxy ¼ 1� Sxy ð1Þ
A strong Spearman correlation between two variables may suggest that they are related via amonotonic function, alternatively, a strong Pearson correlation, indicates that they are relatedby a linear function. Since the latter is a more restrictive relationship, we have preferred the useof Spearman rank instead of Pearson as the assumption of linearity has been criticized by thearea of computational social sciences by researchers such as Herlocker et al. [17]. Furthermore,since the Spearman correlation does not depend on the assumption of linearity, and it is lesssensitive to strong outliers, it is preferable for the purposes of this study [18].
Fig 1 shows the process of our MST-kNNmethod. It outlines the process of the MST-kNNclustering algorithm. This algorithm is based on the computation of two types of proximitygraphs: the Minimum Spanning Tree (MST) and a k-Nearest Neighbor graph (kNN). The algo-rithm first builds an undirected complete weighted graph G(V,E,W), with a vertex v 2 V foreach of the respondents sets, and an edge e 2 E for each of the respondents pair, with the edge’sweight w 2W being the distance (which will be equal to one minus the Spearman rank correla-tion coefficient between the responses of each respondent). Given G, the algorithm computesthe Minimum Spanning Tree, that is a graph with no cycles such that the total sum of the dis-tances in the edges of the tree is minimum among all possible trees that connect all vertices(the ‘spanning’ requirement).
A simple undirected graph G(V,E,W) is a tree if any two vertices of V are connected onunique simple sequence of edges belonging to E. This is the outcome of computing the mini-mum spanning tree. Following this, the algorithm computes a k-Nearest Neighbor graphwhere the vertices are connected if they are reciprocally k-nearest neighbors of each other ac-cording to a defined value of k. The k-nearest neighbours are defined as the kthmost similarvertices according to the measure used (in this case; one minus the Spearman rank correlationbetween two respondents). The higher the value of k, the more densely connected the graph be-comes. In the clustering process utilised in this study, we define this value as k = 3. This meansthat any two vertices connected by an edge in the 3-Nearest Neighbor graph are no more apartthan the third smallest distance between one of them to all the other vertices.
The edges 3-Nearest Neighbor graph is used to select some edges of the MST for deletion,i.e. two vertices in the MST are not one of the 3-nearest neighbours of each other. If at least oneedge is deleted from the MST, this creates a set of trees, rather than one fully connected graph,which partitions the set of respondents in clusters.
Although the use of proximity graphs such as the MST and kNN methods by themselves isalready functional and can show different structures in the data, their combination is evenmore powerful. A significant characteristic of this combination is that it does not require addi-tional information other than the existing inter-pair distances to produce a clustering. This is agreat advantage since the structure of clusters in a high-dimensional space (here we have 43questions of interest) is not always known a priori or has either predefined labels or classesamong the samples. A further benefit of the MST-kNN algorithm is that it is highly scalable, al-lowing its application in large data sets involving millions of samples [16]. Due to its character-istics, it provides a powerful novel approach to the analysis of questionnaires and thesegmentation of the respondents. It is for these reasons that we employ this method in order tosegment the group of respondents into identifiable sub-groups which charities and not-for-profit organisations can subsequently target.
Clustering Consumers on Trust and Confidence in Charities
PLOS ONE | DOI:10.1371/journal.pone.0122133 April 7, 2015 5 / 28

Fig 1. Process of the MST-kNNmethod. Starting with the complete dataset, a distance matrix is computedwhich forms the basis for a complete graph. A Minimum Spanning Tree is computed within the completegraph. Then, all edges that are not k-Nearest Neighbors are removed resulting in clusters.
doi:10.1371/journal.pone.0122133.g001
Clustering Consumers on Trust and Confidence in Charities
PLOS ONE | DOI:10.1371/journal.pone.0122133 April 7, 2015 6 / 28

CM1 ScoresIn order to highlight the individual and most clearly identifiable characteristics of each clustergenerated by the MST-kNN agglomerative algorithm, a new score introduced in the area ofComputational Linguistics [19]; and Bioinformatics [20] was computed. In other words, theuse of the CM1 score in this study is to find the most salient features for each cluster. As Aviadand Roy [21] explain, in many classification or clustering problems, the user needs to exertconsiderable effort to interpret the results. It is for this reason that a tool such as the CM1score, which highlights feature saliency in each cluster, is useful for interpreting and under-standing clustering results.
For each of the answers given, we compute its associated CM1 score which gives an indica-tion of the differences in averages of that particular question between the members of a clusterand those who do not belong to that cluster, normalized by the range of the values observed inthe individuals outside the cluster. The CM1 scores for a cluster can be split into ‘top’ and ‘bot-tom’ scores. The ‘top’ scores refer to those that have an average which is greater in a specificcluster than in all the others, while the ‘bottom’ scores refer to those attributes which average islower in a specific cluster than in the others. For instance, in the previous application of theCM1 scores in a bioinformatics context in [20], the ‘top’ scores represent those genes that areare highly expressed, or ‘upregulated’ in that cluster (or group) and the ‘bottom’ scores repre-sent those genes that are ‘downregulated’ in that particular group in comparison with the out-group (normalized by a function of the range observed in the outgroup.
CM1 scores are computed using Expression 2. The scores are computed using the differencebetween the average of samples in a specific cluster, X, and all the others, Y. This difference ismoderated by the range of values observed in members of all the other clusters, Y, which has agreater set of samples, instead of the combined standard deviation of the specific cluster, X, andall the other clusters together; Y. For specific details of this score we refer to a study publishedby Marsden et al. [19].
CM1ðw;X;YÞ ¼1
jXjX
x2Xxw �1
jY jX
y2Yyw
1þmaxy2Yfywg �miny2Yfywgð2Þ
Results of the CM1 score analysis are used in this study to describe the clusters resultingfrom the MST-kNN algorithm as these variables are the most discriminative of each cluster.Furthermore, the separation and description of the clusters using the CM1 score is investigatedin further detail through the use of symbolic regression modeling. By modeling each cluster asthe target variable against results from all other clusters and using only those variables that arethe ‘top’ and ‘bottom’ features, we are able to further outline, describe and separate betweenclusters. Details of this method are outlined in the following section.
Symbolic Regression ModelingTarget Variable Selection. To further investigate and gain a greater understanding of
each of the clusters, symbolic regression modeling is used in this study. Unlike with “normalregression” approaches, where models are hypothesised and generated to fit the data, symbolicregression discovers the model structure as well as the coefficients within that structure thatproduce the best fit [22]. This means the models are “driven by the data”. In this study we aimto find data-driven models using this approach for various behaviours towards charities andNFP organisations for each cluster.
This methodology is adopted from research in biological methods where ‘reverse-engineer-ing’ a model from the data is a common and accepted practice [23]. Recently, we adopted this
Clustering Consumers on Trust and Confidence in Charities
PLOS ONE | DOI:10.1371/journal.pone.0122133 April 7, 2015 7 / 28

method in another computational social science context in which we reverse-engineered a cus-tomer engagement model based on survey data rather than hypothesised relationships as iscommon practice in marketing studies [24]. Our intention here is to take a similar approach,but rather than finding a model for the whole data set, we try to find a particular model to suiteach cluster. The purpose of this is to predict whether a donor is more likely to be highly in-volved or less involved with charities and not-for-profits based on their trust and confidencein, and attitudes towards charities. As in [24], we use the symbolic regression modeling soft-ware Eureqa[25], a commercial package which is free for academic use, making the methodeasier to adopt in future studies.
There are several models that were generated using the Eureqa software. As stated, the firstexperiment aims to find a model that could “describe” the clusters as a function of the most dis-criminative CM1 scores. Eureqa allows to search such classification models by introducing a bi-nary target variable (set to 1 for any sample in the cluster of interest and 0 for all the others).This means that for each cluster we assign the value 1 to the cluster of interest and 0 to all othersamples and repeat this for each cluster. Then, we set the cluster of interest as our target vari-able and let Eureqa find the best suited model to describe each cluster. In other words, Eureqaattempts to predict those variables that characterise whether a respondent is from the cluster ofinterest or not. In this way we assess the outcomes of the clustering method and confirm thedescription of the clusters using the CM1 score.
After this, further modeling is done in order to predict ’Involvement Class’ as a function ofall attributes relating to trust and confidence in charities, and general knowledge and careabout a national charity and not-for-profit registry. The ACNC classed the respondents as ei-ther ‘High’ or ’Low’ in involvement based on their answers of donating behaviours. For in-stance, questions about whether a respondent has previously donated money, how often theydonate, whether they volunteer, how often they volunteer or whether they have sponsored achild or an animal are examples of activities which the ACNC classed as ‘High Involvement’.Based on the responses to these questions, the respondents were classified as either ’Low in-volvement’ or ’High involvement’ which is depicted in the data set as 0 and 1 respectively. Thisbinary variable is then set as the ‘target variable’ in Eureqa and a model specific for each clusteris then found using the software.
Symbolic Regression Modeling and Optimality Measures. Before modeling the outlinedexperiments in Eureqa, certain user-defined ‘building blocks’ need to be selected [25]. In thisstudy, for each experiment we selected only the ’constant’, ‘integer constant’, ‘introduction of aninput variable’, ‘addition’, ‘subtraction’ and ’multiplication’ building blocks. Furthermore, dueto the binary nature of our target variables, it is recommended to trial the use of the logisticfunction. This function is used to search for equations that tend to be negative when the outputis false ‘0‘, and positive when true ‘1‘. Therefore, we searched for models using the logistic func-tion as function of the search, y = logistic(f(x)), following the recommendation of the Eureqamanufacturers to deal with binary classification problems. No data splitting option was used asall data points are treated equally. Being a binary classification problem, it is natural to evolvemodels using the Area Under the Curve (AUC) as a fitness function of the evolutionary algo-rithm which is the search engine of Eureqa.
With this sensible selection for a binary classification problem, Eureqa runs its evolutionarysearch procedure to find a model that best fits the data. Eureqa uses a Pareto-optimality frontas it aims at both minimising the error and the complexity of the models [22]. This process isrepeated for each of the clusters after which the results for each cluster are compared to eachother. Results of this process are displayed in the following section.
Clustering Consumers on Trust and Confidence in Charities
PLOS ONE | DOI:10.1371/journal.pone.0122133 April 7, 2015 8 / 28
ResultsAs stated in Materials and Methods, the MST-kNN agglomerative algorithm was applied to an-alyse the data set. As a basis for this algorithm a distance matrix using the Spearman rank cor-relation was used to calculate the distance among all respondents.
Using the distance between all the respondents, a complete weighted graph was built andthe MST-kNN algorithm was able to compute its Minimum Spanning Tree and k-NearestNeighbor proximity graphs. As previously explained, the value of k in the computation of thek-NN proximity graph can affect the size of the clusters, as the value of k influences whetherthe k-NN graph is more or less dense. For instance, when the value of k is set to 1, an edge thatconnects two respondents x and y, indicates that one of them, or both, are the most similar re-spondents in the entire data set and are therefore “nearest neighbors” of each other.
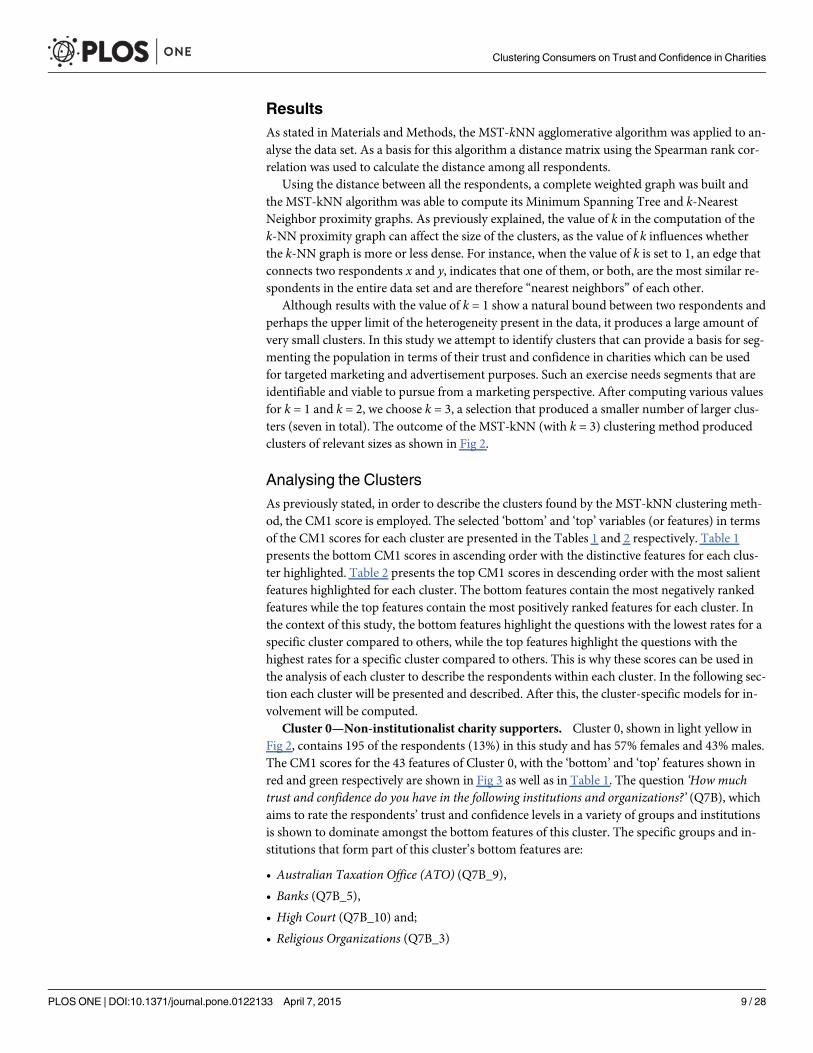
Although results with the value of k = 1 show a natural bound between two respondents andperhaps the upper limit of the heterogeneity present in the data, it produces a large amount ofvery small clusters. In this study we attempt to identify clusters that can provide a basis for seg-menting the population in terms of their trust and confidence in charities which can be usedfor targeted marketing and advertisement purposes. Such an exercise needs segments that areidentifiable and viable to pursue from a marketing perspective. After computing various valuesfor k = 1 and k = 2, we choose k = 3, a selection that produced a smaller number of larger clus-ters (seven in total). The outcome of the MST-kNN (with k = 3) clustering method producedclusters of relevant sizes as shown in Fig 2.
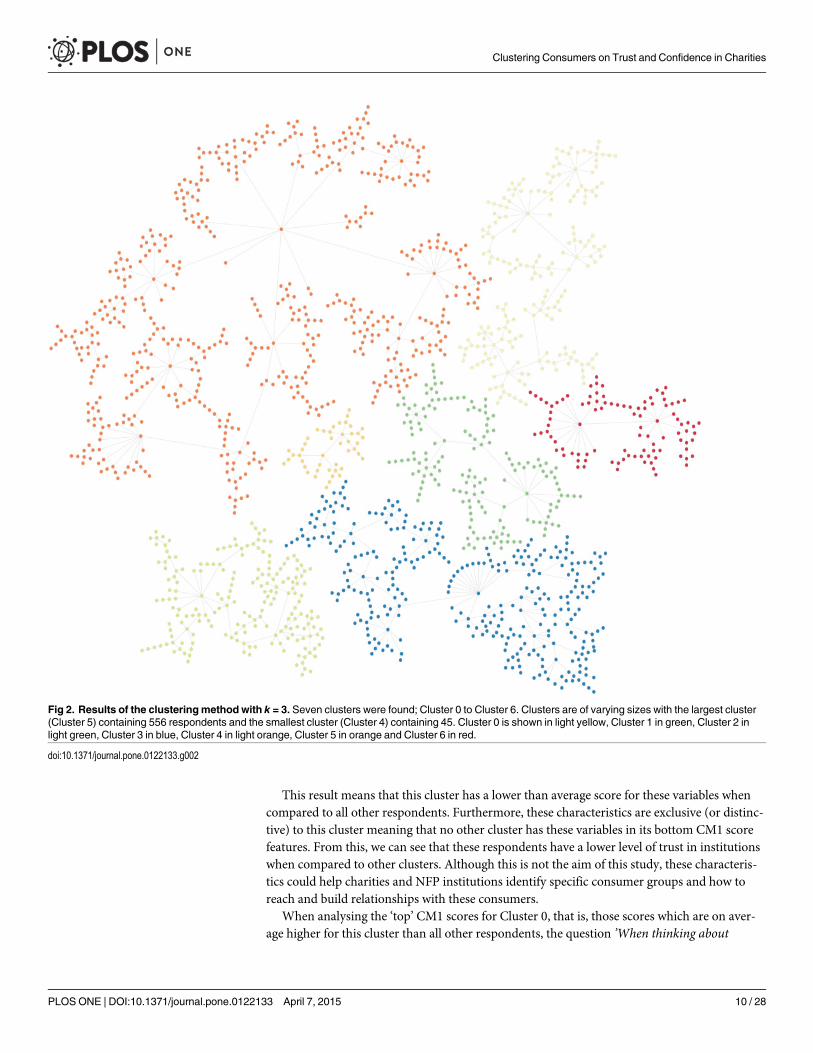
Analysing the ClustersAs previously stated, in order to describe the clusters found by the MST-kNN clustering meth-od, the CM1 score is employed. The selected ‘bottom’ and ‘top’ variables (or features) in termsof the CM1 scores for each cluster are presented in the Tables 1 and 2 respectively. Table 1presents the bottom CM1 scores in ascending order with the distinctive features for each clus-ter highlighted. Table 2 presents the top CM1 scores in descending order with the most salientfeatures highlighted for each cluster. The bottom features contain the most negatively rankedfeatures while the top features contain the most positively ranked features for each cluster. Inthe context of this study, the bottom features highlight the questions with the lowest rates for aspecific cluster compared to others, while the top features highlight the questions with thehighest rates for a specific cluster compared to others. This is why these scores can be used inthe analysis of each cluster to describe the respondents within each cluster. In the following sec-tion each cluster will be presented and described. After this, the cluster-specific models for in-volvement will be computed.
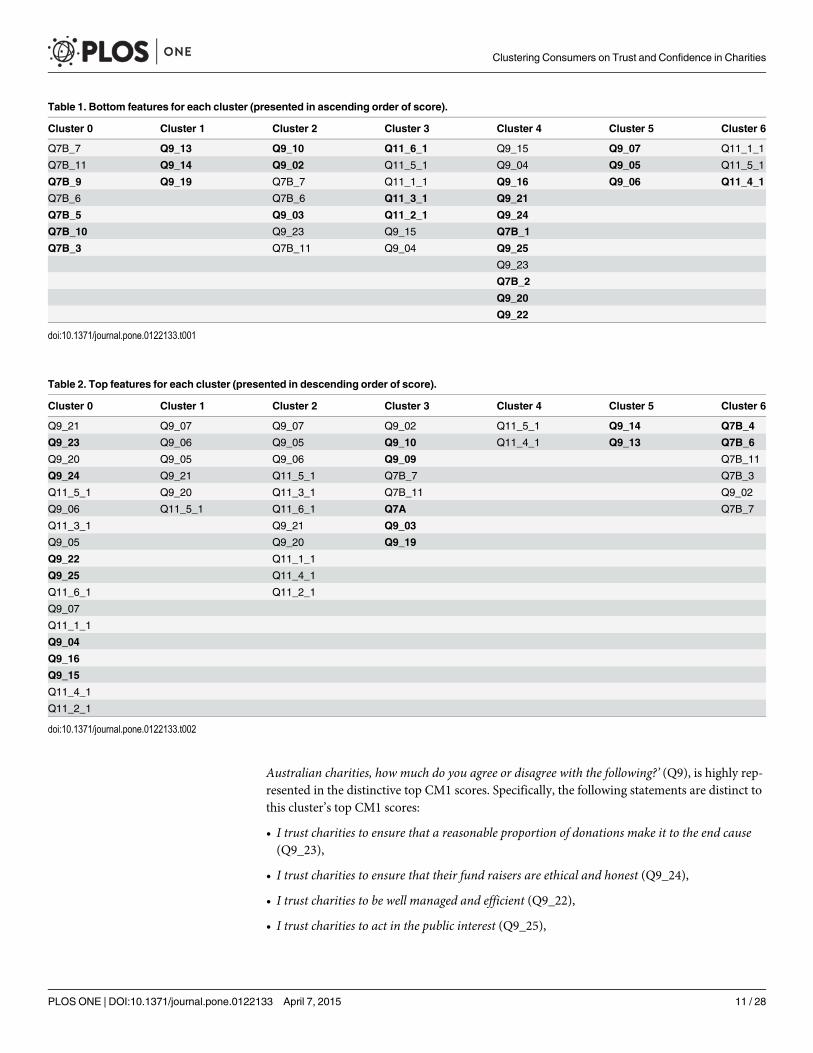
Cluster 0—Non-institutionalist charity supporters. Cluster 0, shown in light yellow inFig 2, contains 195 of the respondents (13%) in this study and has 57% females and 43% males.The CM1 scores for the 43 features of Cluster 0, with the ‘bottom’ and ‘top’ features shown inred and green respectively are shown in Fig 3 as well as in Table 1. The question ‘How muchtrust and confidence do you have in the following institutions and organizations?’ (Q7B), whichaims to rate the respondents’ trust and confidence levels in a variety of groups and institutionsis shown to dominate amongst the bottom features of this cluster. The specific groups and in-stitutions that form part of this cluster’s bottom features are:
• Australian Taxation Office (ATO) (Q7B_9),
• Banks (Q7B_5),
• High Court (Q7B_10) and;
• Religious Organizations (Q7B_3)
Clustering Consumers on Trust and Confidence in Charities
PLOS ONE | DOI:10.1371/journal.pone.0122133 April 7, 2015 9 / 28
This result means that this cluster has a lower than average score for these variables whencompared to all other respondents. Furthermore, these characteristics are exclusive (or distinc-tive) to this cluster meaning that no other cluster has these variables in its bottom CM1 scorefeatures. From this, we can see that these respondents have a lower level of trust in institutionswhen compared to other clusters. Although this is not the aim of this study, these characteris-tics could help charities and NFP institutions identify specific consumer groups and how toreach and build relationships with these consumers.
When analysing the ‘top’ CM1 scores for Cluster 0, that is, those scores which are on aver-age higher for this cluster than all other respondents, the question ’When thinking about
Fig 2. Results of the clusteringmethod with k = 3. Seven clusters were found; Cluster 0 to Cluster 6. Clusters are of varying sizes with the largest cluster(Cluster 5) containing 556 respondents and the smallest cluster (Cluster 4) containing 45. Cluster 0 is shown in light yellow, Cluster 1 in green, Cluster 2 inlight green, Cluster 3 in blue, Cluster 4 in light orange, Cluster 5 in orange and Cluster 6 in red.
doi:10.1371/journal.pone.0122133.g002
Clustering Consumers on Trust and Confidence in Charities
PLOS ONE | DOI:10.1371/journal.pone.0122133 April 7, 2015 10 / 28
Australian charities, how much do you agree or disagree with the following?’ (Q9), is highly rep-resented in the distinctive top CM1 scores. Specifically, the following statements are distinct tothis cluster’s top CM1 scores:
• I trust charities to ensure that a reasonable proportion of donations make it to the end cause(Q9_23),
• I trust charities to ensure that their fund raisers are ethical and honest (Q9_24),
• I trust charities to be well managed and efficient (Q9_22),
• I trust charities to act in the public interest (Q9_25),
Table 1. Bottom features for each cluster (presented in ascending order of score).
Cluster 0 Cluster 1 Cluster 2 Cluster 3 Cluster 4 Cluster 5 Cluster 6
Q7B_7 Q9_13 Q9_10 Q11_6_1 Q9_15 Q9_07 Q11_1_1
Q7B_11 Q9_14 Q9_02 Q11_5_1 Q9_04 Q9_05 Q11_5_1
Q7B_9 Q9_19 Q7B_7 Q11_1_1 Q9_16 Q9_06 Q11_4_1
Q7B_6 Q7B_6 Q11_3_1 Q9_21
Q7B_5 Q9_03 Q11_2_1 Q9_24
Q7B_10 Q9_23 Q9_15 Q7B_1
Q7B_3 Q7B_11 Q9_04 Q9_25
Q9_23
Q7B_2
Q9_20
Q9_22
doi:10.1371/journal.pone.0122133.t001
Table 2. Top features for each cluster (presented in descending order of score).
Cluster 0 Cluster 1 Cluster 2 Cluster 3 Cluster 4 Cluster 5 Cluster 6
Q9_21 Q9_07 Q9_07 Q9_02 Q11_5_1 Q9_14 Q7B_4
Q9_23 Q9_06 Q9_05 Q9_10 Q11_4_1 Q9_13 Q7B_6
Q9_20 Q9_05 Q9_06 Q9_09 Q7B_11
Q9_24 Q9_21 Q11_5_1 Q7B_7 Q7B_3
Q11_5_1 Q9_20 Q11_3_1 Q7B_11 Q9_02
Q9_06 Q11_5_1 Q11_6_1 Q7A Q7B_7
Q11_3_1 Q9_21 Q9_03
Q9_05 Q9_20 Q9_19
Q9_22 Q11_1_1
Q9_25 Q11_4_1
Q11_6_1 Q11_2_1
Q9_07
Q11_1_1
Q9_04
Q9_16
Q9_15
Q11_4_1
Q11_2_1
doi:10.1371/journal.pone.0122133.t002
Clustering Consumers on Trust and Confidence in Charities
PLOS ONE | DOI:10.1371/journal.pone.0122133 April 7, 2015 11 / 28
• I trust charities that let the public know how they use their resources, including money from do-nations (Q9_4),
• I trust charities to make a positive difference to the cause that they are working for (Q9_16)and;
• I trust charities more if they are clear about how they are managed (Q9_15)
These statements suggest that the respondents in this cluster trust charities, however, theyare concerned with how the charity is managed and how charities manage their resources.These distinctive statements regarding trust, indicate that these respondents are more likely totrust (or support) charities and not-for-profit organisations as long as their “need” for informa-tion about the management of the charities is satisfied. Furthermore, from these results we candeduct that this cluster “carefully” supports charities rather than blindly following the crowdor trends.
Cluster 1—Resource allocation critics. Cluster 1 is shown in green in Fig 2 and has 157respondents which makes up 10% of the respondents of the study. In Cluster 1, 55% are fe-males and 45% males. The three ‘bottom’ and six ‘top’ CM1 scores for Cluster 1 are shown inred and green respectively in Fig 4 and presented in Tables 1 and 2. The bottom features consistof statements from the question: ‘When thinking about Australian charities, how much do youagree or disagree with the following?’ (Q9). Specifically, the following statements are the onlybottom features for this cluster:
• I trust charities that are well-known (Q9_13),
• I trust charities that have been established a long time (Q9_14) and;
• I trust charities with well-know supporters and patrons (Q9_19)
These bottom CM1 score features are distinctive to Cluster 1 and can be interpreted as a rel-atively lower concern for charities’ “superficial reputation” for these individuals when com-pared to all other respondents. This means that they potentially care less about whether acharity or NFP organisation is well know, has been established a long time or whether the
Fig 3. CM1 Scores of Cluster 0. The selected top and bottom features are shown in red and green respectively. As can be seen, these coloured featuresform a “shoulder” on either side of the ‘curve’ as they are characteristically higher or lower than the rest of the bars in this bar chart. The selected bottom andtop “shoulders” are also presented in Tables 1 and 2.
doi:10.1371/journal.pone.0122133.g003
Clustering Consumers on Trust and Confidence in Charities
PLOS ONE | DOI:10.1371/journal.pone.0122133 April 7, 2015 12 / 28

charity has celebrity supporters. The top CM1 scores of Cluster 1 explain these individuals fur-ther. Various statements from Q9 and one statement from Q11 are the top CM1 features.These statements are not exclusive to Cluster 1 and they are as follows:
• Charities waste too much money (Q9_07)
• Charities spend too much of their funds on administration (Q9_06)
• Charities spend too much of their funds on salaries and staff benefits (Q9_05)
• I do not trust charities that pay sales people to raise funds (Q9_21),
• I do not trust charities that spend a lot of money on advertising (Q9_20) and;
• In the second column please rate how important it is to you that Australian charities providethis kind of information: The proportion of total funds spent on administrative costs (Q11_5_1)
Although these top features are not exclusive to Cluster 1, there is a clear trend in these re-sults as they are all centred around financial and managerial concerns. This cluster has lowerthan average scores in their concerns for charities’ and not-for-profit organisations’ superficialreputation, however, their care and concern for charities’ financial resource allocation seems tobe a prominent characteristic of this cluster. The negative statements about financial concernsin the top CM1 score results indicate these individuals are critical on how charities managetheir finances and less trust-worthy of charities and NFP’s that allocate resources to adminis-trative and advertising costs. These characteristics show that the individuals in this cluster arequite critical, governance-aware, and feel negatively about the way they think charities allocatetheir financial resources.
Cluster 2—Information-seeking financial sceptics. Cluster 2, shown in light green in Fig2, contains 192 respondents (12% of the total sample) with 60% females and 40% males. Fig 5demonstrates the top and bottom CM1 scores for Cluster 2 with the 7 bottom and 11 top fea-tures shown in red and green respectively (as presented in Tables 1 and 2). Similar to Cluster 0and Cluster 1, Q9: ‘When thinking about Australian charities, how much do you agree or dis-agree with the following?’ is highly represented for Cluster Two’s bottom CM1 scores and thedistinct statements from this question for this cluster are:
Fig 4. CM1 Scores of Cluster 1. The selected top and bottom features are shown in red and green respectively. As can be seen, these coloured featuresform a “shoulder” on either side of the ‘curve’ as they are characteristically higher or lower than the rest of the bars in this bar chart. The selected bottom andtop “shoulders” are also presented in Tables 1 and 2.
doi:10.1371/journal.pone.0122133.g004
Clustering Consumers on Trust and Confidence in Charities
PLOS ONE | DOI:10.1371/journal.pone.0122133 April 7, 2015 13 / 28
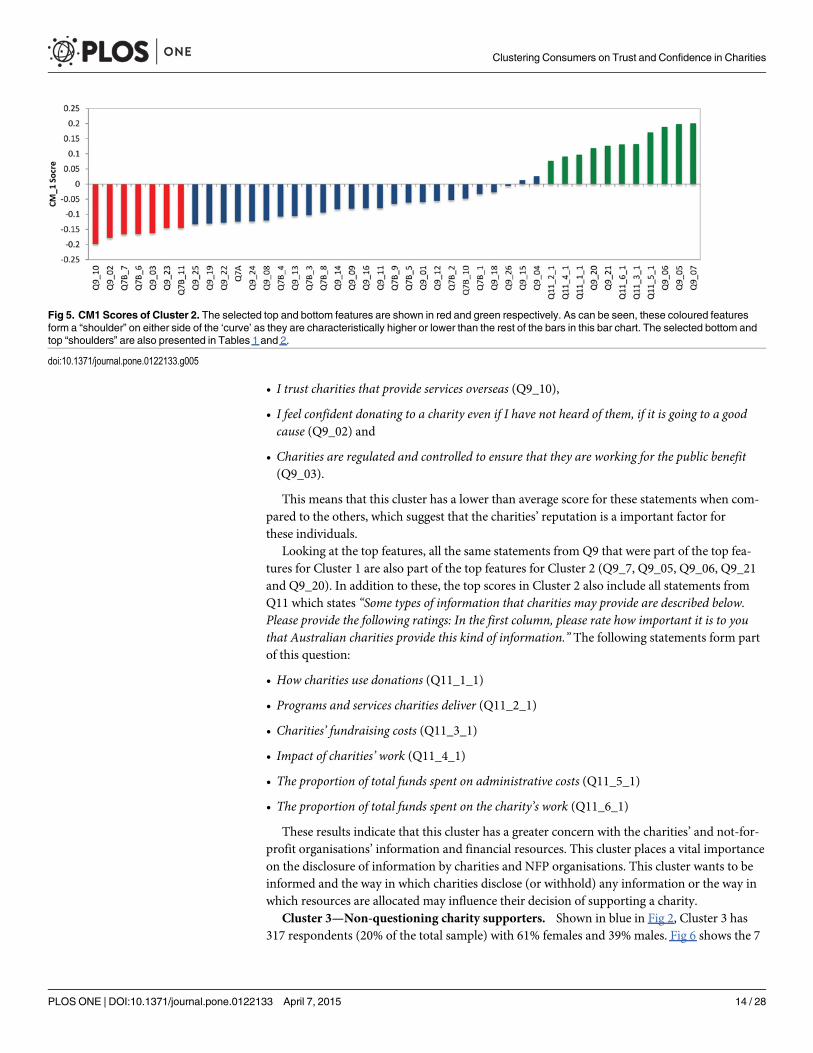
• I trust charities that provide services overseas (Q9_10),
• I feel confident donating to a charity even if I have not heard of them, if it is going to a goodcause (Q9_02) and
• Charities are regulated and controlled to ensure that they are working for the public benefit(Q9_03).
This means that this cluster has a lower than average score for these statements when com-pared to the others, which suggest that the charities’ reputation is a important factor forthese individuals.
Looking at the top features, all the same statements from Q9 that were part of the top fea-tures for Cluster 1 are also part of the top features for Cluster 2 (Q9_7, Q9_05, Q9_06, Q9_21and Q9_20). In addition to these, the top scores in Cluster 2 also include all statements fromQ11 which states “Some types of information that charities may provide are described below.Please provide the following ratings: In the first column, please rate how important it is to youthat Australian charities provide this kind of information.” The following statements form partof this question:
• How charities use donations (Q11_1_1)
• Programs and services charities deliver (Q11_2_1)
• Charities’ fundraising costs (Q11_3_1)
• Impact of charities’ work (Q11_4_1)
• The proportion of total funds spent on administrative costs (Q11_5_1)
• The proportion of total funds spent on the charity’s work (Q11_6_1)
These results indicate that this cluster has a greater concern with the charities’ and not-for-profit organisations’ information and financial resources. This cluster places a vital importanceon the disclosure of information by charities and NFP organisations. This cluster wants to beinformed and the way in which charities disclose (or withhold) any information or the way inwhich resources are allocated may influence their decision of supporting a charity.
Cluster 3—Non-questioning charity supporters. Shown in blue in Fig 2, Cluster 3 has317 respondents (20% of the total sample) with 61% females and 39% males. Fig 6 shows the 7
Fig 5. CM1 Scores of Cluster 2. The selected top and bottom features are shown in red and green respectively. As can be seen, these coloured featuresform a “shoulder” on either side of the ‘curve’ as they are characteristically higher or lower than the rest of the bars in this bar chart. The selected bottom andtop “shoulders” are also presented in Tables 1 and 2.
doi:10.1371/journal.pone.0122133.g005
Clustering Consumers on Trust and Confidence in Charities
PLOS ONE | DOI:10.1371/journal.pone.0122133 April 7, 2015 14 / 28

bottom and 8 top features for Cluster 3 in red and green respectively according Tables 1 and 2.Analysing the bottom features, the question: “Some types of information that charities may pro-vide are described below. Please provide the following ratings: In the first column, please ratehow important it is to you that Australian charities provide this kind of information.” (Q11) ap-pears as the most negative ranked question for this cluster. The distinct features from this ques-tion for Cluster 3 as a bottom features include:
• The proportion of total funds spent on the charity’s work (Q11_1_6),
• Charities’ fundaraising cost (Q11_1_3) and
• Programs and services the charities deliver (Q11_1_2).
These features only appear as bottom features for this cluster and suggests that these indi-viduals consider it to be less important that charities provide this kind of information com-pared to other clusters. Moreover, we can observe that these statements are related to financialinformation which suggests less care about the management of charities’ financial resources.This is quite contrary to Cluster 2 and Cluster 1 which place a great importance on the disclo-sure of this information.
When examining the “top” features, the question How much trust and confidence do youhave in Australian charities overall? (Q7A) is observed as a distinct feature to this cluster anddemonstrates a higher trust and confidence rate in Australian charities overall. Meaning thatthis cluster rates, on average, higher than other clusters in this question. Furthermore, the ques-tionWhen thinking about Australian charities, how much do you agree or disagree with the fol-lowing? (Q9) presents the following distinct statements for this cluster:
• I trust charities that provide services overseas (Q9_10),
• I trust big charities more than smaller ones (Q9_09),
• Charities are regulated and controlled to ensure that they are working for the public benefit(Q9_03) and
• I trust charities with well-known supporters and patrons (Q9_19)
Fig 6. CM1 Scores of Cluster 3. The selected top and bottom features are shown in red and green respectively. As can be seen, these coloured featuresform a “shoulder” on either side of the ‘curve’ as they are characteristically higher or lower than the rest of the bars in this bar chart. The selected bottom andtop “shoulders” are also presented in Tables 1 and 2.
doi:10.1371/journal.pone.0122133.g006
Clustering Consumers on Trust and Confidence in Charities
PLOS ONE | DOI:10.1371/journal.pone.0122133 April 7, 2015 15 / 28

These statements indicate that these individuals are more likely to support large and well-known charities and are in general, charity supporters.
Cluster 4—Non-trusting sceptics. Cluster 4 is the smallest cluster, shown in light orangein Fig 2 and includes 45 respondents (3% of the total sample). 47% are females and 53% aremales. This cluster is the only one which presents a greater number of males than females.Fig 7 demonstrate the CM1 score for the 43 features for Cluster 4, with the 11 bottom and 2top features shown in red and green respectively. The features from questionWhen thinkingabout Australian charities, how much do you agree or disagree with the following? (Q9) domi-nate as a bottom feature. The individual statements from this question for Cluster 4 include:
• I trust charities to make a positive difference to the cause that they are working for (Q9_16),
• I do not trust charities that pay sales people to raise funds (Q9_21),
• I trust charities to ensure that their fund raisers are ethical and honest (Q9_24),
• I trust charities to act in the public interest(Q9_25),
• I do not trust charities that spend a lot of money on advertising (Q9_20) and,
• I trust charities to be well managed and efficient (Q9_22).
These statements suggest a lower concern about Australian charities’ activities. Moreover,the questionHow much trust and confidence do you have in the following institutions and orga-nizations? (Q7B) also are individual features among the bottom feature and indicates a lowerlevel of trust and confidence in Doctors (Q7B_1) and Police (Q7B_2).
When analysing the top features, the question “Some types of information that charities mayprovide are described below. Please provide the following ratings: In the first column, please ratehow important it is to you that Australian charities provide this kind of information.” (Q11) ap-pears as the most positive ranked question. Although this is not a exclusive characteristic forthis cluster, this suggests a greater concern about the information provided by charities.
Cluster 5—Charity management believers. Cluster 5 is the largest cluster with 556 re-spondents (36% of the total sample), shown in orange in Fig 2 and has 62% females and 38%males. Fig 8 shows the 3 bottom and 2 top features for Cluster 5 in red and green respectively.
Fig 7. CM1 Scores of Cluster 4. The selected top and bottom features are shown in red and green respectively. As can be seen, these coloured featuresform a “shoulder” on either side of the ‘curve’ as they are characteristically higher or lower than the rest of the bars in this bar chart. The selected bottom andtop “shoulders” are also presented in Tables 1 and 2.
doi:10.1371/journal.pone.0122133.g007
Clustering Consumers on Trust and Confidence in Charities
PLOS ONE | DOI:10.1371/journal.pone.0122133 April 7, 2015 16 / 28

The following distinct statements:
• Charities waste too much money (Q9_07),
• Charities spend too much of their funds on salaries and staff benefits (Q9_05),
• Charities spend too much of their funds on administration (Q9_06)
from question “When thinking about Australian charities, how much do you agree or disagreewith the following?” (Q9) are shown as a bottom features for this cluster. It indicates that theserespondents do not perceive wastefulness, as the others clusters, and they care less about thecharities’ fund-raising. It is also observed that this is an opposite characteristic compared to theCluster 0, 1 and 2. In addition, when analysing the top features, the statements:
• I trust charities that have been established a long time (Q9_14) and
• I trust charities that are well-known (Q9_13),
appear as distinct top features and indicate some concern about the charities’ reputation. Fur-thermore, these individuals are more likely to support well-known and longestablished charities.
Cluster 6—Institutionalist charity believers. Finally, shown in red in Fig 2, Cluster 6 con-tains 100 respondents (6% of the total sample) with 63% of female and 37% of males. Fig 9shows the 3 bottom and 6 top features for Cluster 6 in red and green respectively. Looking atthe bottom features, the question “Some types of information that charities may provide are de-scribed below. Please provide the following ratings: In the first column, please rate how importantit is to you that Australian charities provide this kind of information.” (Q11) is the most rankedbottom feature with the following individual statement for this cluster:
• Impact of charities’ work (Q11_4_1),
This suggest a lower concern about the information provided by charities.Among the top features the most ranked question isHow much trust and confidence do you
have in the following institutions and organizations? (Q7B), which indicates a higher trust andconfidence level exclusively in the News Media (Q7B_4) and in their Local council (Q7B_6).
Fig 8. CM1 Scores of Cluster 5. The selected top and bottom features are shown in red and green respectively. As can be seen, these coloured featuresform a “shoulder” on either side of the ‘curve’ as they are characteristically higher or lower than the rest of the bars in this bar chart. The selected bottom andtop “shoulders” are also presented in Tables 1 and 2.
doi:10.1371/journal.pone.0122133.g008
Clustering Consumers on Trust and Confidence in Charities
PLOS ONE | DOI:10.1371/journal.pone.0122133 April 7, 2015 17 / 28

Oppositely to Cluster 0, these respondents do trust institutions and are charity supportersas well.
Cluster Partitioning Symbolic Regression Modeling ResultsAs described in Materials and Methods, the first experiment using symbolic regression analysishas been conducted in order to assess the results of the clustering method and the characterisa-tion of the clusters given by the CM1 scores. Therefore, with the purpose of evaluating the clas-sification accuracy, we have modelled a binary variable of the clusters in Eureqa and tried tofind a model to predict which cluster a respondent is a member of as a function of all possiblevariables that formed CM1 scores for all clusters.
Each cluster has been modelled as the target variable of the symbolic regression process,meaning that each cluster had a ‘turn’ at having a binary variable value of 1 whilst all otherclusters’ respondents had a value of 0 for the binary variable. As we are modelling a binary vari-able and as previously explained, a logistic function was introduced in concordance with Eure-qa’s guidelines. Besides this function, the best simple models, (therefore, withoutmultiplication, squares or the introduction of additional logistic functions) are selected foranalysis here. The best models fitting these criteria are presented in Table 3.
The accuracy of these models depends on how well the model separates the respondentsbeing tested into those belonging and those not belonging to the cluster in question. In this
Fig 9. CM1 Scores of Cluster 6. The selected top and bottom features are shown in red and green respectively. As can be seen, these coloured featuresform a “shoulder” on either side of the ‘curve’ as they are characteristically higher or lower than the rest of the bars in this bar chart. The selected bottom andtop “shoulders” are also presented in Tables 1 and 2.
doi:10.1371/journal.pone.0122133.g009
Table 3. Best ‘simple’ logistic models for assessing cluster partitioning. For each model, the Fitnesswas guided by the Area Under the Curve value and is shown as well as the best model found by Eureqa.
Target Variable Fitness Model (Cluster = logistic(x))
Cluster 0 0.417 x = (Q11_5_1 + Q9_23—Q7B_9)
Cluster 1 0.293 x = (Q11_5_1 + Q9_06 + 0.9Q9_07 + 0.8 Q9_21 - 23 - Q9_19 - 2.5 Q9_13)
Cluster 2 0.324 x = (Q16 + Q19_05 + 8.41 Q10_4 + 1.1 Q9_10 - Q13 - Q19_07 - 10.4 Q10_8)
Cluster 3 0.600 x = (Q9_02 - 1.1 Q9_15)
Cluster 4 0.223 x = (Q11_4_1 + 0.3 Q11_5_1 - Q9_15 - 0.3 Q9_21)
Cluster 5 0.324 x = (Q9_13 + 2.02 Q9_14 - Q9_07 - Q9_05 - Q9_06)
Cluster 6 0.320 x = (Q7B_6 + 1.3 Q7B_4 + 0.4 Q9_02 - 1.48 - Q11_4_1 - 1.48 Q11_1_1)
doi:10.1371/journal.pone.0122133.t003
Clustering Consumers on Trust and Confidence in Charities
PLOS ONE | DOI:10.1371/journal.pone.0122133 April 7, 2015 18 / 28

study, we have selected the option for Eureqa to optimise the Area Under Curve (AUC) in eval-uating the quality of its mathematical models. A fitness value (error) of ‘zero’ thus represents a“perfect”model, in other words, a model that perfectly separates the respondents of the clusterin question from those of the other clusters. Therefore, the closer to zero the fitness values rep-resented in Table 3 are, the better the models are to separate samples that belong to the clusterunder consideration from those that belong to other clusters.
Five out of these seven models show fitness values lower than 0.350 with only one modelhaving a fitness value higher than 0.50 (Cluster 3). More complex models were found by Eur-eqa with fitness (error) values much closer to zero, however, we have chosen to present those‘simple’models for ease of interpretation. The models have been compared against the CM1scores in Tables 1 and 2 and as can be inspected, all variables found to have a positive relation-ship with the target variable of the cluster match that particular clusters’ top CM1 score fea-tures and conversely, all variables found to have a negative relationship with the target clustermatch that cluster’s bottom CM1 score features. For some clusters almost all, or all (like in thecase of Cluster 5), of the CM1 score features previously discussed are used in the model to pre-dict respondents’membership to that cluster and perfectly match to be either a positive rela-tionship (from top CM1 score features) or a negative relationship (from bottom CM1 scorefeatures).
As stated, in the more complex models, more accurate error measures were found whichshow an even more accurate prediction of cluster membership for each of the clusters whichsatisfies our assessment of the cluster partitioning and description using the CM1 score.
Cluster-specific Models of Involvement Symbolic Regression ModelingResultsHere we present and discuss the results of the symbolic regression process to predict ‘Low’ or‘High’ Involvement of the respondents in each of the clusters.
Again, the introduction of a logistic function was implemented in order to deal with the bi-nary variable. Other than this, ‘simple’ building blocks were again used. Subsequently, we haveanalysed the models found by Eureqa and have selected the best-fitting model in terms of AUCfor each cluster that, within its logistic function, simply used linear regression functions. Thisgives us varied results for each of the clusters with Eureqa finding better-fitting models forsome clusters than others. Nonetheless, these models provide us with useful information whichcan be used to interpret the consumers within each cluster as well as inform the NFP sector ofmore detailed implications regarding each of the clusters found in this study. The involvementclass models selected for analysis for each cluster are presented in Table 4 as well as their corre-sponding fitness values.
Cluster 0—Non-institutionalist charity supporters. As shown in Table 4, a simple modelwith only two variables satisfied the criteria outlined in the previous section. One variable witha positive relationship to predict involvement and one with a negative relationship. Interesting-ly, a variable from Question 19 entered the model for Cluster 0 which has not occurred in amodel for any other cluster. This question asked respondents what types of information theywould be interested in (on a scale of 1 to 10) to look up in a national registry for charities andNFP organisations, if this would be available. Specifically, Q19_14 relates to “The names andpositions of responsible people”, meaning that people who are interested in doing this in Cluster0 are more likely to be highly involved with charities. The other variable, Q9_20 relates to howrespondents, on a scale of 1 to 10 agree with the statement “I don’t trust charities that spend alot of money on advertising”. Although this is a negative statement about charities, in this clus-ter, it is negatively related with high involvement in charities. Meaning that respondents who
Clustering Consumers on Trust and Confidence in Charities
PLOS ONE | DOI:10.1371/journal.pone.0122133 April 7, 2015 19 / 28

answered lower on this scale aremore likely to be in the high involvement class than those re-spondents who agreed with this statement more strongly.
Cluster 1—Resource allocation critics. In the Eureqamodel to predict involvement forCluster One there are four variables that positively influence involvement and three variablesthat negatively influence involvement as can be seen in Table 4. Specifically, Q7B_9 relates to arespondents’ trust in the Australian Taxation Office (ATO) meaning that those respondents inthis cluster with higher levels of trust in the ATO are more likely to be highly involved withcharities and show high involvement charitable behaviours. Furthermore, Q9_02 and Q9_11also have a positive relationship with involvement for Cluster One and relate to a person’s con-fidence in donating to a charity they have not previously heard of before and their trust in char-ities that provide services in Australia, respectively. The fourth variable to have a positive effecton respondent’s involvement level is Q16 which asks respondents on a scale or 0 to 10, howmuch do they know about the Australian Charities and Not-for-profits Commission (ACNC).This means that those people who feel like they know more about the ACNC, are more likelyto be highly involved with charities and NFP’s.
Looking at those variables in a negative relationship with involvement for this cluster wegain further insights. Q9_20 states “I don’t trust charities that spend a lot of money on advertis-ing” and respondents had to answer on a scale from 0 to 10 whether they agreed with this state-ment. Q9_09 also has a negative relationship with involvement and asks respondents again ona scale of 0 to 10 to agree with a statement; “I trust big charities more than smaller ones”. Finally,Q10_8 has a strong negative impact on this cluster’s involvement which is a binary variableand equalled to one when a respondent had never done any activity such as finding out furtherinformation about the cluster or checked to see if it was a genuine charities.
Cluster 2—Information-seeking financial sceptics. For cluster two a fairly complexmodel was found for involvement class. There are four variables with a positive relationshipand three variables with a negative relationship with involvement class. Firstly, Q16 is positive-ly related to involvement class and asked respondents how much they feel they know about theACNC (on a scale of 1 to 10). Next, Q19_05 is also positively related to involvement class.Question 19 overall relates to the types of information consumers may be interested in access-ing from a national governing body of the NFP sector. Specifically, Q19_05 relates to the typeof charity (e.g. welfare, education and training, accommodation, disability, children, etc.). Thismeans that those respondents who answered they are likely to look for this type of information,are more likely to be part of the high involvement class. Next, the variable Q10_4 has a strongpositive effect in this model and is a binary variable whether respondents had previously givento a charity they hadn’t heard of. The fourth positive variable in the model for Cluster 2 isQ9_10 which rates on a scale (1–10) how much respondents agree with the statement: “I trust
Table 4. Best ‘simple’ logistic models for Involvement Class. For each cluster, the Fitness was guided by the Area Under the Curve value is shown aswell as the best model found by Eureqa.
Cluster Fitness Model (QCLASS = logistic(x))
0: Non-institutionalist charity supporters 0.793 x = (Q19_14 - Q9_20)
1: Resource allocation critics 0.321 x = (Q7B_9 + Q9_02 + Q9_11 + Q16 - Q9_20 - 2.2 Q9_09 - 11.4 Q10_8)
2: Information-seeking financial sceptics 0.296 x = (Q11_5_1 + Q16 +12.4 Q10_4 +1.6Q9_10 -Q19_07 -Q9_05*Q13 -93.3Q10_8)
3: Non-questioning charity supporters 0.850 x = (Q7B_3 - 14;Q7B_2)
4: Non-trusting sceptics 0.331 x = (84.1Q10_7 - Q9_25)
5: Charity management believers 0.881 x = (Q9_16 - Q13)
6: Institutionalist charity believers 0.436 x = (2.5 Q9_15 - Q11_1_1 - Q19_07)
doi:10.1371/journal.pone.0122133.t004
Clustering Consumers on Trust and Confidence in Charities
PLOS ONE | DOI:10.1371/journal.pone.0122133 April 7, 2015 20 / 28
charities that provide services overseas”. This means that respondents who more strongly agreewith this statement are more likely to be in the high involvement class.
The first negatively related variable is Q13 which is a yes/no question (i.e. a binary variable)and stated: “To the best of your knowledge, is there an organisation or agency that is responsiblefor watching over the activities of Australian charities?” where a ‘Yes’ answer constituted a 1and a ‘No’ answer is given the weight equal to 2. This configuration of the binary variablemeans a ‘No’ answer to this question exerts a stronger negative impact in the equation whereasa ‘Yes’ answer obviously has a lesser negative impact. This means that those respondents whoanswered ‘No’ are in fact more likely to be in the high involvement class than those respon-dents who did know there was a governing “watchdog” organisation for the NFP sector. Thenext negatively impacting variable is Q19_07 which asks respondents (on a scale of 1 to 10)whether they would be interested in where the charity operates (e.g. states in Australia or over-seas) which means that those respondents who answered higher on this scale, are less likely tobe highly involved. Lastly, Q10_8 is a negatively impacting variable in the model for Cluster 2.Question 10 stated “When you have given money to a charity, have you ever done any of the fol-lowing?” with several options to say yes/no. Therefore, this is another binary variable. What isinteresting is that Q10_8 states “None of the above”. This means that Cluster 2’s respondentswho had not proceeded to check the charity’s status, or claimed a tax refund are less likely to bein the high involvement class.
Cluster 3—Non-questioning charity supporters. For cluster 3 only a simple model satis-fied the criteria we set for analysing involvement class models. Unfortunately, the fitness valueis not of very good quality (0.85) as shown in Table 4, however, this model is included for com-pleteness and used to motivate an initial interpretation. Should charities wish to generate tar-geted marketing strategies for each of these clusters, models of any complexity levels could beused. Furthermore, it is important to add that in most more complex models, the two variablesin this model are still included. The fact that Eureqa has found these two variables first andthey are still included in almost all other models means that these variables are perhaps of con-siderable importance in predicting involvement class in this cluster. One positive and one nega-tively impacting variable make up the simple model for the non-questioning charity supportersto predict involvement class. Firstly, Q7B_7 relates to respondents’ trust in the Federal Parlia-ment (on a scale of 1 to 10) and secondly, Q7B_2 to respondents’ trust in the police. Remark-ably, that means that for this cluster, those respondents with higher levels of trust in theFederal Parliament and lower levels of trust in the police, are more likely to be in the highinvolvement class.
Cluster 4—Non-trusting sceptics. As can be seen in Table 4, Cluster 4 also has a modelwith only two variables. However, the model for cluster four has a fitness value of 0.321, whichmeans it is of reasonable accuracy. Again, like for Cluster 3 we have a case of one positive im-pact and one negative. The strongly positively impacting variable (with a coefficient of 84.1) isQ10_7 which was a yes/no question whether respondents had previously checked to see if thecharity was registered after they had given money to that charity. Considering Cluster 4 hasbeen labelled as the non-trusting sceptics” it is logical that respondents in this cluster wouldlike to check further information and are more likely to be highly involved if they do so (pro-vided that their information need is satisfied). This strong positive impact is offset by the nega-tive impact of Q9_25 which rates on a 1−10 scale whether respondents “trust charities to act inthe public interest”. Considering this cluster is the ‘non-trusting sceptic’ cluster, finding theseimpacts on involvement class are interesting even though it is only a small cluster.
Cluster 5—Charity management believers. For cluster five we again have a small modelwith a non-desirable fitness value (0.881). However, as stated, we use this as the initial interpre-tation of high involvement for the cluster and these variables are included in almost all other
Clustering Consumers on Trust and Confidence in Charities
PLOS ONE | DOI:10.1371/journal.pone.0122133 April 7, 2015 21 / 28
(more complex) models. The first variable, with a positive impact on involvement class isQ9_16 which rates how much respondents agree (on the 1–10 scale) with the statement: “Itrust charities to make a positive difference to the cause that they are working for”. This meansthat for the ‘charity management believers‘ they are even more likely to be highly involved withcharities if they rate higher on this statement. Conversely, Q13 is negatively related with in-volvement class which, as stated, asked respondent of their knowledge of a national ‘watchdog’for the NFP sector. Again, the same applies here as for cluster two due to the peculiar configu-ration of this binary variable. A ‘Yes’ answer again for this cluster means a lesser negative im-pact and therefore means that those Cluster 5 respondents who previously were aware of anational organisation for the NFP sector are actually more likely to be in the highinvolvement class.
Cluster 6—Institutionalist charity believers. For cluster six, Eureqa has found a modelwith one positively influencing variable and two negative ones. The positive variable, strength-ened with a coefficient of 2.5, is Q9_15 which rates on a 1–10 scale how much respondentsagreed with: “I trust charities more if they are clear about how they are managed”. This meansthat those respondents who agree with this statement more strongly, are more likely to be inthe high involvement class. The first negative variable is Q11_1_1 which relates to the impor-tance respondents place on charities providing information about how they use donations (ona 1–10 scale). For the institutionalist charity believers it means that as as respondents in thiscluster agreed more strongly to this, they are in fact, less likely to be highly involved. Finally,Q19_07 is also negatively related to involvement class in this cluster. As stated, question 19asked respondents how likely it is that they seek certain types of information from the ACNC.Specifically, Q19_07 relates to “Where the charity operates”. This corresponds with the samevariable in cluster two wherevQ19_07 also had a negative impact.
The specific findings for each of the clusters outlined in this section are further elaboratedon in the final section including the discussion. A general overview of our study is presentedfollowed by some specific implications for charity and NFP managers. Furthermore, we high-light the contribution of this work, as well as our limitation and futureresearch recommendations.
Discussion
Significance and ContributionThe results from this study provide the charity and NFP marketing literature with various in-teresting implications. Firstly, this study is among the first to utilise the novel clustering meth-odology of the MST-kNNmethod in a context of marketing and, specifically, it is the firstapplication in the field of charities and not-for-profit organisations. Secondly, the applicationof the CM1 score to obtain easily interpretable salient features which better characterise eachsegment, provides literature and practice with a new approach to understand, investigate anddescribe clusters or segments more easily without a priori assumptions. As stated, this data-driven approach to consumer segmentation has become almost crucial for charities. The sectorneeds to move towards private-industry type marketing strategies in order to ‘survive’ and con-tinue maintaining their levels of private donors’ support. Our selection of the Australian sectorwas motivated by the fact that it is experiencing a multifaceted challenge. On one side, there ex-ists a large number of charitable organizations relative to the population size and, on the other,there is the perceived notion that they already have enough public funding and subsequentlydo not greatly depend on private donations.
Furthermore, the method we have used in this study is easily transferable to different datasets and various situations. A charity or not-for-profit institution could easily apply this
Clustering Consumers on Trust and Confidence in Charities
PLOS ONE | DOI:10.1371/journal.pone.0122133 April 7, 2015 22 / 28

clustering method to its existing donor database in order to identify groups for personalisationwithin their collected information. Likewise, this method could also be used to examine a widersegment of the national population, possibly a certain geographic area close to a particular in-stitution, to identify those segments of the population worth pursuing in their marketing cam-paigns. In doing so, this method helps charities avoid the use of wasteful mass-marketingcampaigns and instead, personalise their advertising and communication efforts to be moresuited to each donor segment.
Cluster-specific strategies for the NFP sectorThe clusters identified in this study provide an initial insight into the specific donor segmentsof the Australian market. For each cluster there are specific actions charity managers could un-dertake in order to drive these consumers (possible donors) from ‘low involvement’ to ‘high in-volvement’. The motivation for these actions can directly be taken from the symbolicregression result findings.
We start with Cluster 0, the non-institutionalist charity supporters. Although, their CM1scores indicated that these respondents tend to be ‘charity supporters’ there is always room toincrease donors’ support of charities. Therefore we turn to the models found from Eureqa. Forthis cluster, charity managers could make the names and positions of the responsible peoplewithin the organisation more accessible to the public (or to the donors) in order to drive in-volvement from this cluster. Furthermore, as we identify these respondents as ‘non-institution-alists’, it could work in a charity’s favour to avoid reaching these consumers throughpartnerships with large institutions as their levels of trust in institutions are lower than allother respondents. If a charity is effective in providing information on their operations andmanagement, the ‘non-institutionalist charity supporters would be an attractive target market.
Looking at Cluster 1, the ‘resource allocation critics’, the aspects that hinder involvementfor this cluster are in line with their CM1 score description. These consumers do not like chari-ties that have high levels of “perceived wastefulness”, that is, charities who spend a lot of fundson administrative or advertising costs. What drives involvement for this cluster is their knowl-edge if the ACNC and the fact that they like charities that provide services in Australia (i.e. intheir own country). An interesting observation about this cluster is that donating to a charitythey had not previously heard of before, drives involvement in this cluster. For the NFP sectorthis means that these respondents may be more likely than others to make a donation to a char-ity they had not previously heard of before. For charities to target this cluster they need to re-member to be mindful about where their funds and resources go as well as the reporting ofwhere their resources go. Furthermore, informing consumers about the ACNC could also helpdrive involvement for the ‘resource allocation critics’.
For Cluster 2, different tactics apply, should charity managers wish to target these consum-ers. These ‘information-seeking financial sceptics’ are more likely to be highly involved with acharity when they have greater knowledge of a national NFP sector ‘watchdog’ organisation.This means that charities could educate consumers in their respective possible donor baseabout what type of organisation they report to and what organisation(s) there are to regulatethe charity and NFP sector. As was argued in the Introduction, trust and confidence in charitiesare closely linked. For the respondents in this cluster this possibly means that with a greaterknowledge of a national governing body for the NFP sector, they trust charities more, and aresubsequently more likely to be involved with charities in terms of donating time or money. Astheir description suggest, information about the charity or NFP is important to them. Further-more, whether cluster one respondents had previously heard of a charity before and knowingwhat type of charity it is also drives their involvement. This means that with basic
Clustering Consumers on Trust and Confidence in Charities
PLOS ONE | DOI:10.1371/journal.pone.0122133 April 7, 2015 23 / 28

communication messages, charities can inform consumers of this information and drive higherlevels of involvement from cluster two.
Due to the small model found for Clusters 3, 4 and 5, only limited inferences can be made.For Cluster 3, the ‘non-questioning charity supporters’, the simple symbolic regression modelhelps charities to better define this cluster. For example, knowing that trust in the federal par-liament impacts involvement for these consumers means that charities could follow trends inthe population’s trust in the government and act accordingly. Furthermore, interestingly, trustin police negatively impacts involvement in Cluster 3 meaning that to target these consumers,charities should avoid partnerships with the police force or having police officer spokespersons.Cluster 4, the ‘non-trusting sceptics’may be hard to convince, however, several actions mayhelp to convert these consumers to possible donors. When these consumers checked whethercharities were registered (after donating money) they were more likely to have higher levels ofinvolvement. This signals to charities that it is of high importance to ensure they are registered.Cluster 5, the ‘charity management believers’, is most likely quite opposite to Cluster 4. Theseconsumers do trust charities to make a positive difference towards the cause they are workingfor, and the more they are convinced of this, the more they are likely to be highly involved.This makes Cluster 4 an attractive group of potential donors to target. Charities management’stask is to then keep these supporters up to date of regular progressions in the work they aredoing and the positive effects of their efforts. Furthermore, as with Cluster 2, these respondentsare more likely to be highly involved when they know more about a national organisation‘watchdog’ of the charities and NFPs sector. Again, charities can pass on the information ofsuch an organisation which could improve trust and involvement levels from donors.
Cluster 6, the ‘institutionalist charity believers’, are more likely to display high involvementbehaviours towards charities if the charity is clear about how they are managed. For charityand NFP management this simply means to be transparent in the way they operate, how theyare organised, who is responsible and other information regarding the management of thecharity. This information could be provided on the charity’s web page, their news letters, or ad-ditional actions could be taken such as the provision of contact details which donors can use torequest further information. The negatively related variables for this cluster are interesting.They are in concordance with their label as ‘institutionalist charity believers’ since these con-sumers do not place importance on the charity providing information on the use of donations.In fact, this variable negatively impacts involvement. Furthermore, these respondents do notbecome more involved with the charity as a result of finding out where it operates meaningthat this kind of information is not of great importance to the members of this cluster. Again,this means that Cluster 6 provides an attractive market segment for charities to target.
Overall, several trends and behaviours of potential donors have been highlighted by ourstudy. We have found some clusters in which charities and NFP’s are more likely to be success-ful in obtaining donations than in others. For instance, for a new charity with limited resources,it would not be advisable to target Cluster 4, the ‘non-trusting sceptics’ as they would likely bea lot less successful than with consumers part of Clusters 0, 5 or 6; the ‘non-institutionalistcharity supporters’, the ‘charity management believers’ and the ‘institutionalist charity believ-ers’, respectively. One interesting trend found across almost all clusters is the donor’s concernswith the financial resource allocation within charities. Even in the involvement models forthose clusters that are charity ‘supporters’ or ‘believers’, financial concerns surface. This meansthat the findings in this study are in concordance with Gneezy et al.’s [11] comprehensivestudy on avoiding overhead aversion. As stated, they found that donations increased signifi-cantly if seed funding for overheads was already covered and potential donors were informedof this. The message to the NFP sector from this general trend is that charities and NFP organi-sations need to, no matter which market segment they are targeting, be transparent about their
Clustering Consumers on Trust and Confidence in Charities
PLOS ONE | DOI:10.1371/journal.pone.0122133 April 7, 2015 24 / 28

resource allocation, avoid allocating too many funds to advertising and administration activi-ties (where possible) and be open to their donors about their operations and management.
Limitations and future researchAlthough this study provides literature and charity and not-for-profit marketing managers sev-eral implications and contributions, there are some limitations. Firstly, the data set used camewith some limitations. As it was an online administered questionnaire, the system was able todirect respondents to various parts of the survey as well as skip questions that did not apply tosome of them. This left several items uncompleted where some or the majority of respondentsdid not answer all questions. In order to be able to still use the entire dataset, we omitted thosequestions (variables) that not every respondent answered. This reduced the number of vari-ables we were able to use in our clustering method and subsequent cluster analysis.
Another limitation we have found with the dataset is the way the ‘Involvement Class’ is con-structed. The ACNC assigned respondents to either the ‘low involvement class’ or the ‘high in-volvement class’ based on their responses in question 3. There were several questions that, ifrespondents answered ‘yes’, it would automatically classify them as ‘high involvement’. For in-stance, whether they had made regular monthly donations to a charity or sponsored an animalor a child via a charity. Although we do not argue that it is logical to assume certain activitiesare of a higher involvement level with a charity than others, we do argue that a respondentcould feel like they are highly involved with a charity even though they had not answered ‘yes’to these questions. One example of an activity classified as ‘low involvement’ by the ACNC is“Sold raffle tickets or conducted other fundraising on behalf of a charity”. We note, that if an in-dividual supports a charity by selling raffle tickets once, we resonate with this claim, however,if a person spends a considerable amount of time doing so (for example, several days a week) itcould also be reasonable to assume that this person is ‘highly involved’ with the charity they aresupporting. For our study this means that the results found to define the involvement classcould in the future be better defined if a better framework for classifying the ‘InvolvementClass’ is designed. Instead of merging activity types into the dichotomy provided by ‘Low/HighInvolvement’ an alternative would be to seek mathematical models that could predict each oneof the activities separately.
The last limitation we highlight is a conscious “self-imposed” limitation during the analysisof the symbolic regression modeling. As stated, we only selected those models for analysis thatincluded ‘simple’ functions used by Eureqa (the argument for the logistic model is a linearfunction). We have also explained that more complex models have found better results interms of the Area-Under-the-Curve, which means that in future studies more effort could beexerted in analysing these findings. Our aim in this study was to provide the literature and theNFP sector with an easily-interpretable method for segmentation and subsequent analysis. It isfor this reason we have imposed this limitation and suggest future research directions to ex-plore this path further.
Furthermore, future research could consider a mixed-method approach utilising a qualita-tive method such as in [2] combined with a quantitative method as outlined in this study forgreater depth of results and to provide a more detailed analysis of each cluster or group of con-sumers. For example, in their qualitative research, Polonsky, Shelley and Voola [2] state that,“the strength of the stimulus related to personalized appeals and may create a link between theindividual and the cause, which would increase donor’s support” [p.74].
Another future research suggestion is to conduct another study of a similar kind with a dif-ferent questionnaire tool. In the current study, no questions about either actual monetary do-nations or time spent volunteering were included. These questions could help to more
Clustering Consumers on Trust and Confidence in Charities
PLOS ONE | DOI:10.1371/journal.pone.0122133 April 7, 2015 25 / 28

accurately gauge consumers’ behaviours and their attitudes towards charities and, therefore,help charities to understand their donor base even better by considering their individualities.
Future research could also extend the study across multiple countries and/or cultures inorder to find more generalisable results which can then be applied in more countries and areas.
As stated, we have only used the best most simple Eureqamodels. In the future, a new waycould be constructed to automatically analyse all results found by Eureqa’s symbolic regressionmodelling method to assist the user of the clustering results in interpreting their findings. Inthis process, other Artificial Intelligence and Machine Learning methodologies could be em-ployed to truly find the best underlying structure in the data. Eureqa employs a genetic pro-gramming technology which, combined with other types of algorithms to “learn from thedata”, would lead to a new generation of more accurate models which, in turn, could providemore refined donor behaviour models.
Taking this study even further, the novel concept of “functional construct” as introduced inan earlier publication [24], could be applied in the context of NFP sector research. For instance,the data in this study comprised of separate questions, or “items”, which could be analysed by aprocess as outlined in de Vries et al. [24] to find functional constructs for further behaviouralmodelling. This would provide literature and the charity and NFP sector with an even deeperunderstanding of the relationship that exists between consumers’ attitudes, trust and confi-dence in and the behaviours such as donating they actually display towards charities. Theseconstructs could even form the basis for other methods such as Structural Equation Modelling(SEM) as in [26] to find the structural relationships between ‘constructs’ of items. In a study in-vestigating the charity and NFP sector in particular, a SEM could investigate the relationshipsbetween trust and donating behaviour or confidence and trust in a charity or the relationshipbetween trust and volunteering.
These future research directions are bountiful and based on the results in this study we high-ly recommend the charity and NFP sector to continue their trend in this way to become moresuccessful, less wasteful and ultimately, serve their true cause better and more efficiently. Theclustering method in this study can lead to a data-driven marketing strategy as it allows chari-ties to segment their donor market and then investigate their salient features with a relativelysimple method that eases interpretation (the CM1 score). The technique is also highly scalableand can easily be applied to problems involving several millions of consumers [16]. Obviously,such large datasets are unlikely to come from questionnaire-based studies but with the increas-ing use of online communication channels, this is a realistic scenario and a research areaworth pursuing.
The findings related to the cluster analysis collectively provide guidance and a better under-standing of a possible donor base for the NFP and charity sector. If charities take actions todrive donor involvement with a data-driven approach, higher levels of monetary donationsand an increase in volunteering efforts will ensue. By following for-profit organisations andbusinesses in being more informed about the environment and market they operate in, chari-ties can hope to thrive, be more successful in obtaining funds and ultimately, achieve greatersuccess in the causes they are working towards.
AcknowledgmentsWe would like to thank Dr. Ahmed Shamsul Arefin for his technical help and support in thepreparation of this manuscript.
Clustering Consumers on Trust and Confidence in Charities
PLOS ONE | DOI:10.1371/journal.pone.0122133 April 7, 2015 26 / 28

Author ContributionsConceived and designed the experiments: PM NJdV. Performed the experiments: RR NJdV.Analyzed the data: NJdV PM RR. Contributed reagents/materials/analysis tools: PM RR.Wrote the paper: NJdV RR PM. Data pre-processing: RR. Cluster analysis: NJdV PM.
References1. Shelley L, Polonsky J. Do charitable causes need to segment their current donor base on demographic
factors?: An Australian examination. International Journal of Nonprofit and Voluntary Sector Marketing.2002; 7(1):19–29. doi: 10.1002/nvsm.164
2. Polonsky J, Shelley L, Voola R. An Examination of Helping BehaviorSome Evidence from Australia.Journal of Nonprofit & Public Sector Marketing. 2002; 10(2):67–82. doi: 10.1300/J054v10n02_04
3. Sargeant A, Lee S. Donor Trust and Relationship Commitment in the U.K. Charity Sector: The Impacton Behavior. Nonprofit Volunt Sect Q. 2004; 33(2):185–202. doi: 10.1177/0899764004263321
4. Schlegelmilch B. Targeting of Fund-raising Appeals How to Identify Donors. Eur J Mark. 1988; 22(1):31–40. doi: 10.1108/EUM0000000005265
5. Yavas U, Riecken G, Parameswaran R. Personality, organization-specific attitude, and socioeconomiccorrelates of charity giving behavior. Journal of the Academy of Marketing Science. 1981; 9(1–2):52–65. doi: 10.1007/BF02723565
6. Menp K. Clustering the consumers on the basis of their perceptions of the Internet banking services. In-ternet Research. 2006; 16(3):304–322. doi: 10.1108/10662240610673718
7. Smith W. Product Differentiation and Market Segmentation as Alternative Marketing Strategies. J Mark.1956; 21(1):3–8. doi: 10.2307/1247695
8. Srnka K, Grohs R, Eckler I. Increasing Fundraising Efficiency by Segmenting Donors. AustralasianMarketing Journal (AMJ). 2003; 11(1):70–86. doi: 10.1016/S1441-3582(03)70119-0
9. Bekkers R, BowmanW. The Relationship Between Confidence in Charitable Organizations and Volun-teering Revisited. Nonprofit Volunt Sect Q. 2009; 38(5):884–897. doi: 10.1177/0899764008324516
10. Sargeant A, Lee S. Trust and relationship commitment in the United Kingdom voluntary sector: Deter-minants of donor behavior. Psychology and Marketing. 2004; 21(8):613–635. doi: 10.1002/mar.20021
11. Gneezy U, Keenan E, Gneezy A. Avoiding overhead aversion in charity. Science. 2014; 346(6209):632–635. doi: 10.1126/science.1253932 PMID: 25359974
12. Inostroza-Ponta, M, Mendes, A, Berretta, R, Moscato, P. An Integrated QAP-Based Approach to Visu-alize Patterns of Gene Expression Similarity. In: Randall, M, Abbass, HA, Wiles, J, editors. Progress inArtificial Life, Third Australian Conference, ACAL 2007, Gold Coast, Australia, December 4-6, 2007,Proceedings. vol. 4828 of Lecture Notes in Computer Science. Springer; 2007. p. 156–167.
13. Inostroza-Ponta M, Berretta R, Moscato P. QAPgrid: A two level QAP-based approach for large-scaledata analysis and visualization. PLOSONE. 2011; 6(1):e14468. doi: 10.1371/journal.pone.0014468PMID: 21267077
14. Clark M, Johnston R, Inostroza-Ponta M, Fox A, Fortini E, Moscato P, et al. Genome-wide analysis oflong noncoding RNA stability. Genome res. 2012; 22(5):885–898. doi: 10.1101/gr.131037.111 PMID:22406755
15. Arefin, A, Riveros, C, Berretta, R, Moscato, P. kNN-MST-Agglomerative: A fast and scalable graph-based data clustering approach on gpu. In: Computer Science & Education (ICCSE), 2012 7th Interna-tional Conference on. IEEE; 2012. p. 585–590.
16. Arefin A, Mathieson L, Johnstone D, Berretta R, Moscato P. Unveiling clusters of RNA transcript pairsassociated with markers of Alzheimers disease progression. PLOS ONE. 2012; 7(9):e45535. doi: 10.1371/journal.pone.0045535 PMID: 23029078
17. Herlocker, J, Konstan, J, Borchers, A, Riedl, J. An algorithmic framework for performing collaborative fil-tering. In: Proceedings of the 22nd annual international ACM SIGIR conference on Research and de-velopment in information retrieval. ACM; 1999. p. 230–237.
18. Blattberg R, Do K, Scott N. Database Marketing: Analyzing and Managing Customers. 1st ed. 1.Auflage. New York: Springer Verlag; 2008.
19. Marsden J, Budden D, Craig H, Moscato P. Language Individuation and Marker Words: Shakespeareand His Maxwell’s Demon. PLOSONE. 2013; 8(6):e66813. doi: 10.1371/journal.pone.0066813 PMID:23826143
Clustering Consumers on Trust and Confidence in Charities
PLOS ONE | DOI:10.1371/journal.pone.0122133 April 7, 2015 27 / 28
20. Filiou M, Arefin A, Moscato P, Graeber M. ‘Neuroinflammation differs categorically from inflammation:transcriptomes of Alzheimer’s disease, Parkinson’s disease, schizophrenia and inflammatory diseasescompared. Neurogenetics. 2014; 15(3):201–212. doi: 10.1007/s10048-014-0409-x PMID: 24928144
21. Aviad B, Roy G. A decision support method, based on bounded rationality concepts, to reveal featuresaliency in clustering problem. Decis Supp Syst. 2012; 54(1):292–303. doi: 10.1016/j.dss.2012.05.037
22. Smits G, Kotanchek M. Pareto-front exploitation in symbolic regression. In: Genetic programming theo-ry and practice II. U.S.: Springer; 2005. p. 283–299.
23. Huynh-Thu V, Irrthum A, Wehenkel L, Geurts P. Inferring Regulatory Networks from Expression DataUsing Tree-Based Methods. PLOS ONE. 2010; 5(9):e12776. doi: 10.1371/journal.pone.0012776PMID: 20927193
24. de Vries N, Carlson J, Moscato P. A Data-Driven Approach to Reverse Engineering Customer Engage-ment Models: Towards Functional Constructs. PLOS ONE. 2014; 9(7):e102768. doi: 10.1371/journal.pone.0102768 PMID: 25036766
25. Nutonian. Eureqa Pro Desktop - Academic. Nutonian Inc.; 2014.
26. de Vries N, Carlson J. Examining the drivers and brand performance implications of customer engage-ment with brands in the social media environment. Journal of Brand Management. 2014; 21(6):495 –
515. doi: 10.1057/bm.2014.18
Clustering Consumers on Trust and Confidence in Charities
PLOS ONE | DOI:10.1371/journal.pone.0122133 April 7, 2015 28 / 28