Inheritance and Charitable Donations
22
* Affiliations: Wilhelm, Rooney, and Steinberg: Department of Economics, IUPUI. Wilhelm and Rooney are also affiliated with the Center on Philanthropy at Indiana University. Brown: Depar tment of Economics, P omona Coll ege. Corresponding Author: Richard Steinberg, Dept. of Economics, IUPUI, 516 Cavanaugh Hall, 425 University Blvd., Indianapolis, IN. 46202- 5140 USA ([email protected]). A Last Minute R Us production. We thank the many supporters of the Center on Philanthropy and the Center for funneling support our way for this research. We also thank Adrian Sargeant, Sheryl Ball, and Francie Ostrower for providing useful references, and Rob McClelland, John Havens, and other attendees at the ARNOVA conference where an earlier version of this paper was presented. PRELIMINARY – NOT FOR QUOTATION OR CITATION WITHOUT PERMISSION Version of December 30, 2002 Inheritance and Charitable Donations by Richard Steinberg, Mark Wilhelm, Patrick Rooney, and Eleanor Brown * Abstract In this paper, we employ a unique new data set (the Philanthropy Panel Study (PPS), a module within the Panel Study of Income Dynamics (PSID)) to test whether the propensity to donate out of inherited wealth is equal to the propensities to donate out of other wealth, earned income, and transfer payments. We find that the elasticity of giving from non-inherited wealth is much greater than from inherited wealth for total giving and gifts to religion, combined causes, people in need, health, education, and other causes. The effects of income derived from inherited wealth and labor income are similar in terms of elasticities, although inherited wealth creates a higher marginal propensity to donate. Transfer income has either a small or no apparent effect on donations.
Transcript of Inheritance and Charitable Donations

*Affiliations: Wilhelm, Rooney, and Steinberg: Department of Economics, IUPUI. Wilhelm and Rooney are also affiliated with the Center on Philanthropy at Indiana University. Brown: Department of Economics, Pomona College. Corresponding Author: Richard Steinberg,Dept. of Economics, IUPUI, 516 Cavanaugh Hall, 425 University Blvd., Indianapolis, IN. 46202-5140 USA ([email protected]). A Last Minute �R� Us production. We thank the manysupporters of the Center on Philanthropy and the Center for funneling support our way for thisresearch. We also thank Adrian Sargeant, Sheryl Ball, and Francie Ostrower for providing usefulreferences, and Rob McClelland, John Havens, and other attendees at the ARNOVA conferencewhere an earlier version of this paper was presented.
PRELIMINARY – NOT FOR QUOTATION OR CITATION WITHOUT PERMISSIONVersion of December 30, 2002
Inheritance and Charitable Donations
by
Richard Steinberg, Mark Wilhelm, Patrick Rooney, and Eleanor Brown*
Abstract
In this paper, we employ a unique new data set (the Philanthropy Panel Study(PPS), a module within the Panel Study of Income Dynamics (PSID)) to testwhether the propensity to donate out of inherited wealth is equal to thepropensities to donate out of other wealth, earned income, and transfer payments. We find that the elasticity of giving from non-inherited wealth is much greaterthan from inherited wealth for total giving and gifts to religion, combined causes,people in need, health, education, and other causes. The effects of income derivedfrom inherited wealth and labor income are similar in terms of elasticities,although inherited wealth creates a higher marginal propensity to donate. Transferincome has either a small or no apparent effect on donations.

1
I) Introduction
Economists generally assume that household behavior depends on household income andhousehold wealth, without reference to the manner in which these resources have been acquired.It doesn’t matter whether income comes from labor or capital, whether it is earned or transferred,or whether it represents current earnings or pension payments. This assumption is usuallyuntested; in particular, it has rarely been tested with respect to charitable donations. In thispaper, we employ a unique new data set to test whether the propensity to donate out of inheritedwealth is equal to the propensities to donate out of other resources, specifically other wealth,earned income, and regular transfer payments.
While the relation between source of income and consumption decisions is intrinsicallyinteresting, a deeper understanding of the determinants of charitable giving is particularlygermane to an assessment of the future health of the nonprofit sector and its role as an alternativeto government for providing public goods. Havens and Schervish (1999) estimate that over thenext 55 years there will be an enormous transfer of wealth from one generation to the next. Depending upon the assumed real growth rate of the economy, they project that the transfer willrange from $41 trillion to $136 trillion. Most of this sum will be transferred to heirs, but a smallfraction amounting to an enormous sum will be left to charity – between $6 trillion and $25trillion dollars. Their estimates reflect the allocations of estates in the past, where tax-wisedecisions recognized the impact of estate taxation and the deduction for charitable bequests. Since then, a temporary phasing-out of federal estate taxes has been enacted, and this phase-outmay be made permanent. If so, charitable bequests would be much lower. However, heirs aredonors too. As Avery (1994, p. 5) puts it, “the economic impact of these bequests will hinge onwhether the behavior of those who receive the money is different from those who give it.” Regardless of estate taxation, the bulk of the wealth will be transferred to heirs and so whatmatters is whether inherited wealth is donated to a greater or lesser extent than earned income.
Our results are clear in terms of elasticities, but clouded in terms of the marginalpropensity to donate out of each source. In terms of elasticity, earned income and inheritedwealth have similar effects, non-inherited wealth has a much larger effect, and transfer incomehas a small or zero effect on each kind of giving. In terms of marginal propensities to give, thedifference between inherited and non-inherited wealth shrinks and those between inheritedwealth and earned or transfer income grows when evaluated for some plausible values of thesample distribution.
In the next section, we present evidence from a variety of sources that the source ofincome might matter to donors. Then, we discuss related literature, the empirical specification,the data, and the results. We follow this with a discussion of planned future research and a set ofconcluding remarks.
II. Why might the source of income matter to donors?

2
There are several reasons to suspect that the source of purchasing power matters. Case,Quigley, and Shiller (2002, p.3) state the case succinctly:
“First, increases in measured wealth of different kinds may be viewed byhouseholds as temporary or uncertain. Second, households may have a bequestmotive which is strengthened by tax laws that favor holding appreciated assetsuntil death. Third, households may view the accumulation of some kinds ofwealth as an end in and of itself. Fourth households may not find it easy tomeasure their wealth, and may not even know what it is from time to time. Theunrealized capital gains held by households in asset markets may be transitory, butthey can be measured with far more precision in thick markets with many activetraders. Fifth, people may segregate different kinds of wealth into separate“mental accounts,” which are then framed quite differently. The psychology offraming may dictate that certain assets are more appropriate to use for currentexpenditures while others are earmarked for long-term savings (Shefrin andThaler, 1988).”
In particular, there are hints that psychological framing mattters for consumption out ofincome (Arkes et al., 1995 and for giving decisions (Andreoni, 1995). We don’t know preciselyhow the decision to contribute various sorts of income is framed by donors and charitablesolicitors, but it is plausible that inherited wealth is viewed differently from earned income orthat different social constraints attach to these sources of income. Those who inherit wealth mayfeel that the income is theirs to spend on their own well-being. Alternatively, they may feelentrusted as stewards to devote that wealth to public purposes or the family dynasty. Inheritorsmay feel guilty or embarrassed if they live off inherited wealth, fearful that their moral characterwill be denigrated by friends and associates. Two papers by Cherry, Frykblom, and Shogren(2002a, b) report evidence from laboratory experiments on human subjects that speak to some ofthese issues. In the first, some subjects play a standard dictator game in which they are given asum of money to divide between themselves and another subject. If these subjects act accordingto the standard selfish model of economics (with self-regarding utility functions) then they willkeep the entire sum of money for themselves, but only 19% (when the sum was $10) and 15%(when it was $40) did so. Other subjects “earned” their money, earning $40 if they could answerat least 10 out of 17 questions taken from the GMAT correctly and $10 otherwise. Whendictators earned their money in this way, and the word “earnings” was used to frame subjectdecisions, they kept the entire sum for themselves in 79% and 70% of the cases. The differencein outcomes is highly statistically significant, and the authors conclude that self-regardingbehavior arises when “the legitimacy of assets in a bargain [is] sufficient.” In their second paper,where subjects contribute towards a public good, they come to a different conclusion – that thereis no difference between contributions from earned and windfall income.
Sociologist Francie Ostrower conducted extensive interviews with ninety-eight wealthydonors from the New York City area, finding support for these conjectures. She concludes (p.

3
170) that :
“Some donors distinguished between the freedom one has to use inherited wealthas opposed to earned wealth. One person said that someone who earns money is“much more free to do whatever he or she wants,” but “money inherited shouldstay in the family.” Another said she would have “no business” leaving all hermoney to charity, because it was her husband’s money and he expected it to go totheir children. One donor felt that “if it came from someone else, you kind of oweit to that person to think about what they would have liked you to do with it.” These comments also indicate that for some donors, inheritors’ wealth is notviewed as being theirs in the same way as wealth that is earned. ... [M]oneyassumes meanings for these donors that go beyond the economic.”
She finds mixed support for the concept that inheritors would feel ashamed to rely upon theirinheritance for personal consumption. One respondent whose wealth was self-made, opined that(p. 104):
“[A]ny inheritance that goes beyond providing for the basic security ... of the nextgeneration should either be taxed ... or provide for giving. I see no justificationfor self-respecting people to expect to survive on what their forbears have done.”
However, recipients can choose to view themselves favorably regardless (p. 107):
“While they acknowledged that they had inherited funds, there was some tendencyfor inheritors to stress their own accomplishments or to downplay the importanceof what they had inherited.”
Religion provides a powerful set of beliefs and social constraints that encourage givingand define what is to be given. For example, many religions emphasize tithing – the giving ofone tenth part of one’s income – but vary in their description of what is to count as income forthis purpose. The Church of Jesus Christ of Latter-Day Saints (commonly known as theMormons) has been particularly successful in eliciting tithing, which is used to supporteducation, missionary, and welfare programs as well as church construction and operations(Swainston, 1992). Mormon official policy does not define tithable income, as Dahl and Ransomexplain (1999, p. 705):
“Church leaders teach that payment of an honest tenth is necessary to be right withGod, but that such matters are between the individual and God. While the rate of10 percent is immutable, precisely which items to tithe is not laid out in detail. Bishops do not ask members for an accounting of what income sources weretithed; rather, in a yearly interview, each member simply declares to the bishopwhether or not he has paid a full tithe.”

4
Dahl and Ransom explored the views of Church members through a telephone interviewof 1,200 Mormons living in Utah in 1996. They asked about five broad categories of income –gifts and inheritances, housing capital gains, stock investments, miscellaneous deductions, andretirement savings. For example, 61.9% of respondents said that they would pay a tithe on $500given as a Christmas gift by the respondent’s parents, whereas only 33.2% of respondents wouldpay a tithe on the value of a $500 sofa given to them by their parents on Christmas. About halfof respondents expressing an opinion would tithe an inheritance of farm land worth $700,000 ifthey continue to farm the land, whereas almost all would pay a tithe if that same inherited farmland were sold rather than farmed. Overall, they conclude (p. 708):
“Respondents apparently think about income as the amount of cash available forimmediate consumption, but do not seem to impute income from in-kind transferswhen figuring their tithing base. Latter-Day Saints’ perceptions on how to treathousing capital gains indicate that the source and subsequent use of the gainstrongly impact tithing beliefs.”
They also find that some beliefs about what should be tithed are independent of the potential forpersonal financial gain, whereas others are not. For example, those that received a sizable gift orinheritance had the same views as those who did not on whether gifts and inheritances should betithed, and those who were unemployed expressed the same view on whether unemploymentcompensation should be tithed as those who remained employed. However, homeowners wereless likely than renters to state that they would tithe capital gains from sale of a house.
Brooks (2002) argues that both the administrative practices of welfare bureaucrats andsocial pressures cause welfare recipients to feel socially isolated. This social isolation reducessocial capital, and, he hypothesizes, charitable donations made by the welfare recipient. Heconfirms this prediction using data from the Consumer Expenditure Survey, finding that amarginal dollar of income from welfare is associated with a decrease in giving of 57 cents,controlling for current or permanent income and non-housing wealth.
Second, some forms of purchasing power accrue smoothly, others appear in lumps. Alarge gift or inheritance may attract the attention of prospect researchers, professional fundraiserswho specialize in locating candidate donors on whom special efforts should be targeted. The“ask” is a major determinant of contributions. For example, the Giving and Volunteering in theU.S. 1996 survey found that “respondents were nearly twice as likely to give if they were askedto contribute than if they were not asked (Independent Sector, 1996, p. 4-107). In addition,receipt of a lump sum reduces the transactions costs of major gifts. The donor does not have toincur the planning costs of intentional savings, and charitable fundraisers will provide donorswith all the information they need to decide on the merits of particular causes and tax-wisevehicles for supporting those causes. Lump sum income may become particularly important forthose donors that are motivated by status competitions such as those provided by “giving clubs”(where donations exceeding some threshold confer special recognition on the giver) or namingopportunities (Glazer and Konrad, 1996; Harbaugh, 1998).

5
Auten and Rudney’s (2000) analysis of a five-year panel of donors revealed that manydonors, particularly the richest ones, make large gifts irregularly rather than smaller gifts everyyear. They point out that (p. 91):
“Giving a large sum of money once every five years may provide a donor morerecognition and influence with the recipient institution than giving the sameamount each year over the five years. This consideration would suggest that onlythe wealthy would make large enough gifts for it to matter.”
Receipt of a one-time lump of income, such as that provided by an inheritance, would provide asimilar opportunity for donors. Note that this argument stands in contrast to the usual conclusionthat rational consumers would want to smooth their consumption over time. The differencecomes about because a large one-time gift creates increasing marginal benefits for the donor.
Finally, different sources of income may vary in well-understood economic propertiesthat are unobserved in particular data sets. For example, consumers may regard income fromparticular sources as more likely to be expected or unexpected, permanent or transitory, risky orrisk-free, liquid or illiquid, taxable or untaxed. Income sources have differing time profiles, andso some may prove more useful than others for alleviating capital constraints. In addition, thetypes of people who chose to earn particular types of income may differ in measured andunmeasured ways from those who chose to earn other types of income, and these differences mayalso affect giving. For example, Schervish et al. (2001) find that ‘high-tech wealth holders’ havea distinctive set of giving behaviors, perhaps due to their desire for control and independence,insecurity, reliance on distinctive business networks rather than family (most are unmarried),young age, frequent relocations, and lack of religiosity. Thus, the assumption that all sources ofincome have equivalent effects on consumption is perhaps overly restrictive given the omissionsin most real-world data.
Related Literature
Several papers look at inheritance and other behaviors. Joulfaian and Wilhelm (1994)find that inheritors do not substantially reduce their labor supply but do increase consumptionexpenditures by a small amount (also see Holtz-Eakin, Joulfaian and Rosen, 1993). Holtz-Eakin, Joulfaian and Rosen (1994a, b) find that inheritance is associated with increased self-employment. Arrondel, Masson and Pestieau (1997) conclude that the marginal propensity tobequeath out of an inheritance received is greater than the marginal propensity to bequeath out of“human resources” (earnings). In general, they find that children adopt similar behaviors as didtheir parents when they decide whether to leave a bequest, make a will, or loan money to theirown children.
The much larger empirical literature on donations has mostly concerned the effects oftaxes, government spending, income, and wealth on donations. Most use U.S. tax data, which

6
limits analysis in two ways. First, one cannot disaggregate giving into gifts to specific charitablesubsectors, nor can one obtaining data on aggregate gifts by non-itemizers or on non-deductiblegifts. Second, information on income and wealth are deficient. There is no attempt to gathercomprehensive information on wealth, as the tax pertains to income defined in a particular way,leaving authors to rely on various proxies such as mortgage interest payments and realized capitalgains. Income data pertains to taxable income, excluding many forms of transfer income. Onthe other hand, tax data are well suited to the construction of panel data sets, allowing thedecomposition of income and tax rates into permanent and transitory components (e.g. Randolph,1995, Auten, Sieg, and Clotfelter, 2002).
A few studies have used data from other sources, and two are most relevant here. First,as previously mentioned, Brooks (2002) used Consumer Expenditure Survey data to estimate theeffect of welfare receipts on giving. Second, Avery (1994), reporting on work with MichaelRendall, used the 1989 Survey of Consumer Finances to estimate the effects of income, inheritedwealth, and non-inherited wealth on giving to all causes. Avery hypothesizes that the propensityto give out of inheritances may be higher than propensities to give from other income sources (p. 29):
“Since [inheritors] have not anticipated this inheritance – and therefore haven’tearmarked it for savings or a college fund – it is a windfall, and philanthropy isone of the interests people pursue with windfalls. Uncertainty about lifeexpectancy may therefore bode well for philanthropy in the long run because itcreates these windfalls.”
Contrary to expectations, however, Avery reports that (p. 29):
“Relative to income, wealth was an important factor only for those peoplebetween the ages of 45 and 64. For other age groups, income was a much moresignificant predictor. Moreover, only for those age 45 to 54 was inherited wealthimportant. For the population as a whole, we predict that the average personwould give $4.56 to charity each year for every $1,000 in non-inherited wealth,but only $0.76 out of inherited wealth. Thus, an increase in inheritance may notcreate a new generation of philanthropists. Indeed, it is the original creators ofwealth who appear to be the most giving.”
III. Empirical Methods
Our approach is to estimate models of the following form, where all variables relate tocharacteristics of heirs or families that have not received inheritances:
Giving = f(Earned Income, Transfer Income, Annuitized Wealth, Annuitized Inheritance, Controls) + g

7
Following the tradition for estimates of giving demand, we estimate all equations in log-logform. This functional form has become traditional, in part, because of the results of Lankford andWyckoff (1991), who found that the best estimates from a more flexible functional form (theBox-Cox Tobit) were derived from a functional form that was approximately linear in logs. Wethen test whether the coefficients on the various income and annuitized wealth variables areequal in order to determine whether they have different effects on giving. More specifically, weface the following complications:
a) Giving cannot take negative values, so truncation bias is a real possibility. In our mainresults, which include 3444 observations, total giving was reported as less than $25 or zero in911 cases, religious giving in 1662 cases, combined causes in 2209 cases, gifts to the needy in2374 cases, health giving in 2652 cases, education giving in 2865 cases, and giving to othercauses in 2710 cases. For now, we assume that giving represents an underlying latent variablethat can take negative values, but that that variable is censored at $25. If we also assume theerror term is normal and homoskedastic, then tobit is the proper estimating procedure. However,because there are strong indications that the error term is neither normally distributed norhomoskedastic, all results here should be interpreted with caution until planned future workexplores alternative models.
b) PSID data follows a genealogical sampling approach, wherein all families created bythe children of sample families are also included in the sample. Thus, our data containsobservations from split-off families, whose heads were siblings in original sample families. Siblings are likely to have correlated error terms because of their common upbringing andheredity. For this version of the paper, no correction has been made for this correlation, and soour estimated standard errors are too small and reported levels of significance are too high.
c) Wealth and inheritances are reported, in PSID data, as stocks whereas earned incomeand transfers are flows. In effect, stocks and flows have a different scale, complicating the testfor equivalence of their respective coefficients. In order to deal with this, we report estimatesderived from “annuitized” wealth and inheritance – that is, from the flow of income that could begenerated in perpetuity from these stocks. Assuming a 2% real rate of return, these annuitizedvalues are simply the stock variables multiplied by 0.02. We do not adjust these values to reflectthe finite lifetimes of recipients. This approach has real limitations – the coefficient on the stockvariables becomes smaller if the assumed real rate of return becomes larger, whereas thecoefficients on the flow variables are unaltered. Thus, statistical tests for equality of the earnedand transfer income coefficients or the inheritance and wealth coefficients are (all else equal)persuasive, but one should not put credence into the formal tests of the equality of inheritanceand earned income or transfer payment coefficients. Rather, one should look at the numericalestimates to see if they are the same order of magnitude.
d) Although data on the dependent variables concern giving in 2000, the data for all theindependent income variables concerns 1998 and the non-inherited wealth variable concerns1999. This is because the PSID data from the 2001 wave is not yet available. If the lag between

8
cause and effect is less than two years, as seems likely from some other panel analyses (e.g.Barrett, McGuirk, and Steinberg, 1997), then our estimates will suffer from measurement errorbiases.
IV. Data
We estimate our models of giving as a function of the components of income with datafrom the Philanthropy Panel Study (PPS), a module within the Panel Study of Income Dynamics(PSID). The first wave of the PPS was fielded in 2001 (the thirty-second wave of the PSID) andasked respondents about their giving in calender year 2000. Respondents were asked to recallgifts made by themselves and other members of their family residing with them; we assume thattheir responses pertain to their own gifts and, for married/cohabiting respondents, those of theirpartners. Giving was queried separately for several charitable purposes: to religious institutions(RELIGGIV) (excluding institutions run by religious entities but for non-religious purposes, suchas schools, hospitals and other charities), to combined funds (COMBGIV) (e.g., United Way,Catholic Charities, United Jewish Appeal, etc.), to help people with basic needs (NEEDYGIV),for health care purposes (HLTHGIV), for educational purposes (EDUCGIV), and for “other”purposes (OTHERGIV) (youth and family services, improving neighborhoods, the arts, theenvironment, international aid, and other purposes the respondent could mention). Respondentswere directed to report only those gifts made to charitable organizations. We report the sum ofthese forms of giving as TOTGIV. Finally, respondents were asked the detailed questions aboutgiving to these purposes only if they first passed an introductory screen which asked them if theyhad given more than $25 dollars.
There are 7,319 family units in the 2001 PSID. We do not yet have the charitable givingdata for the 553 new split-off families nor for the 240 recontacts in this wave. We do not use the404 families from the 1997 immigrant sample (any inheritances these families received prior to1995 are missing) and the 1,659 families from the Survey of Equal Opportunity (SEO) low-income subsample. The 1999 weights that would allow us to combine the SEO subsample withthe Survey Research Center (SRC) nationally representative cross-section have just recentlybecome available; we will include these families in our subsequent work. This leaves 4,463families from the SRC subsample. We exclude the 243 families that experienced a change inhead between the 1999 and 2001 interviews. Such a change in family composition implies thatfamily income from the 1999 wave is likely a poor proxy for the resources from which the 2001-wave giving data came. The resulting sample contains 4,220 families.
Only 1.5 percent of the PPS respondents have any missing data items concerning theircharitable giving (Wilhelm 2002). Because missing charity data are so rare, we set the missingvalues to zero. Thus, strictly speaking, we analyze the lower bound on the giving data. Consistent with this choice, we set the giving level to zero for those who did not pass through thescreening question and for a few family units that said they gave more than $25 but the sum ofreported giving to the various charitable purposes was less than $25. Finally, because negativevalues for income (16 observations) and wealth (602 observations) are inconsistent with our
1PSID has not yet released detailed data on OFUM income in 1998. Instead, they provideaggregate variables for OFUM taxable and transfer income, respectively. In turn, OFUM taxableincome includes both labor and asset income, and there is no way at the present time to separatethese two components. We assume that the majority of OFUM taxable income is from labor, andfor this paper, include it all in our measure of earned income.
2We also experimented with a 50-50 assignment of farm and business income to labor. Results changed only trivially, and both variables fit the data equally well, so we arbitrarilyselected the assignment in the text for regressions reported here.
9
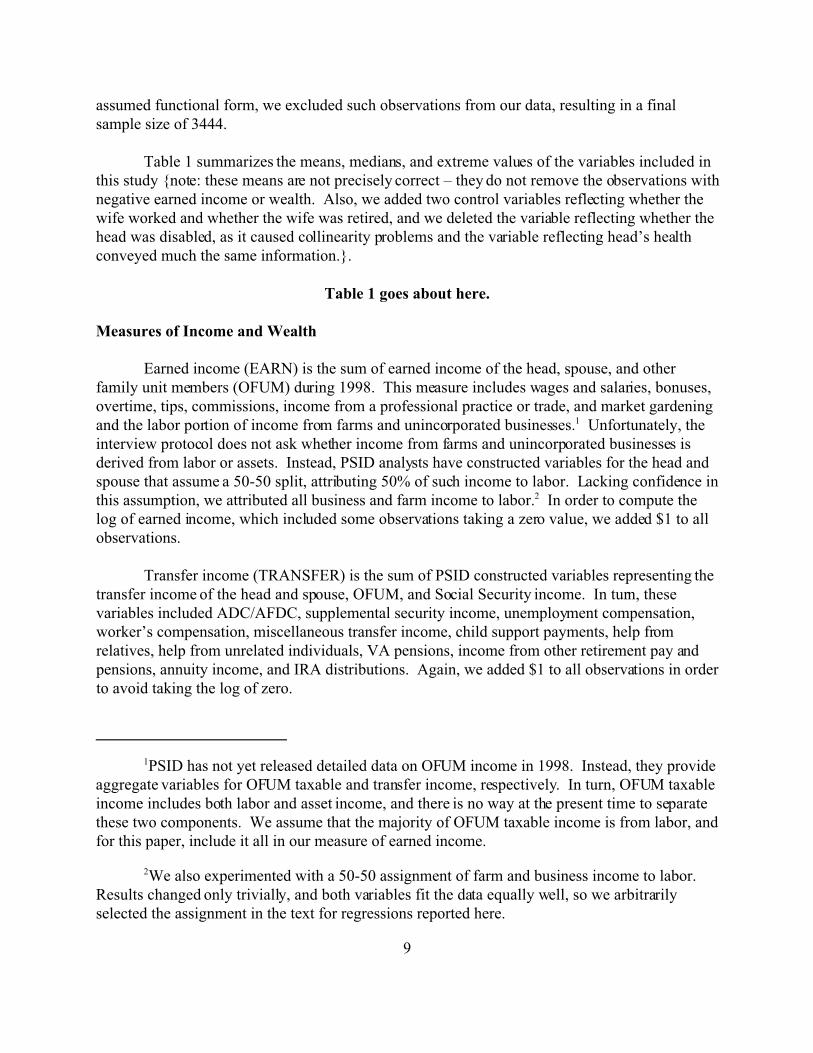
assumed functional form, we excluded such observations from our data, resulting in a finalsample size of 3444.
Table 1 summarizes the means, medians, and extreme values of the variables included inthis study {note: these means are not precisely correct – they do not remove the observations withnegative earned income or wealth. Also, we added two control variables reflecting whether thewife worked and whether the wife was retired, and we deleted the variable reflecting whether thehead was disabled, as it caused collinearity problems and the variable reflecting head’s healthconveyed much the same information.}.
Table 1 goes about here.
Measures of Income and Wealth
Earned income (EARN) is the sum of earned income of the head, spouse, and otherfamily unit members (OFUM) during 1998. This measure includes wages and salaries, bonuses,overtime, tips, commissions, income from a professional practice or trade, and market gardeningand the labor portion of income from farms and unincorporated businesses.1 Unfortunately, theinterview protocol does not ask whether income from farms and unincorporated businesses isderived from labor or assets. Instead, PSID analysts have constructed variables for the head andspouse that assume a 50-50 split, attributing 50% of such income to labor. Lacking confidence inthis assumption, we attributed all business and farm income to labor.2 In order to compute thelog of earned income, which included some observations taking a zero value, we added $1 to allobservations.
Transfer income (TRANSFER) is the sum of PSID constructed variables representing thetransfer income of the head and spouse, OFUM, and Social Security income. In turn, thesevariables included ADC/AFDC, supplemental security income, unemployment compensation,worker’s compensation, miscellaneous transfer income, child support payments, help fromrelatives, help from unrelated individuals, VA pensions, income from other retirement pay andpensions, annuity income, and IRA distributions. Again, we added $1 to all observations in orderto avoid taking the log of zero.

3We also experimented with a measure of wealth that excluded the value of the family’sequity in its primary place of residence. The coefficient on wealth changed a little, all othercoefficients were essentially unchanged, and there was no real difference in fit, so we arbitrarilyselected the broader measure including housing wealth. In future work, we plan on seeingwhether home equity affects giving differently from other forms of wealth.
10
Wealth (WEALTH) is computed as the annuitized value of the corresponding variableconstructed by PSID analysts from the interview data, and includes the value of the family’sequity in its primary place of residence.3 Our measure of wealth is net of inheritances received,as we do not wish to double count this form of wealth, and we added 1 to all values to avoidtaking the log of zero.
Our measure of inheritances received, INHERIT, is the annuitized sum of any “large giftsor inheritances of money or property worth $10,000 or more” during the five years preceding the1999 wave, as recalled in 1999. We use the simple sum of the three largest gifts or inheritances;366 sample families received one gift or inheritance, 35 received two, and 5 received three.{These numbers are not exactly right. They were calculated before we excluded the negativeincome and wealth observations. After the deletion, 303 sample families received one or moreinheritances.} We did not adjust the total in any way to reflect the year in which the respectiveinheritances were received, despite the fact that any unspent remainder will appreciate over time. However, any appreciation will be reflected in our measures of wealth, and so it is possible thatsome of the effect of the early inheritances will be attributed to later wealth.
Other Variables
We also include a variety of demographic variables that are commonly used in estimatesof giving demand – age of the head (AGE), age of the head squared (AGE**2), sex of the head(SEX; female=1), number of children in the household (NUMKIDS), marital status of the head(MARRIED; yes=1), race of head (BLACK; African-American=1), ethnicity of head(HISPANIC; yes=1) and location of family unit (SOUTH; residence in a southern state=1). Wealso employ a few variables that are not commonly available in other data sets but whichplausibly affect giving – employment status of head and spouse [(WORKINGH andWORKINGW; yes=1), (RETIREDH and RETIREDW; yes=1), (the excluded category representsthose temporarily laid off, looking for work, keeping house, student, disabled, and other(workfare, prison, jail)], a variable reflecting whether the head’s health is good (HEALTHH; nogood=1), one reflecting whether the spouse’s health is good (HEALTHW; no good=1), and onereflecting whether the family unit resides in a major metropolitan area (BIGMETRO; yes=1),defined as a metropolitan area where the core and fringe county populations total one million ormore. We also include the age of the youngest child (AGEYOUNG), which plausibly affectsgiving to education and giving more generally, along with a dummy variable (NOKIDS; 1=yes)to ensure that the coefficient on AGEYOUNG is meaningful when the sample includes familieswith no resident children.

4We are not entirely satisfied with this approach, and will explore alternative functionalforms in our future research.
11
V. Results And Proposed Extensions
Tables 2 through 4 report our results for the effects of the four income measures (earned,transfer, annuitized inheritance, and annuitized non-inherited wealth) on total giving and givingto six charitable purposes. Table 2 presents comparisons in elasticity form. These areunconditional elasticities, calculated from the tobit coefficients to reflect the fact that an increasein any of the respective regressors affects both the likelihood that any one individual will becomea donor and the amount he or she would give conditional on a donation being made.
We would also like to know the marginal propensity to donate out of each source ofincome, expressed as a derivative rather than an elasticity. In order to do so, we multiply theunconditional elasticity by the ratio of the appropriate measure of giving to the appropriatemeasure of income. However, our selected functional form has constant elasticity, which meansthat the derivative varies from zero to infinite depending upon where it is evaluated. We chooseto evaluate this derivative at both the mean (Table 3) and median (Table 4) sample ratios, afterremoving observations from family units that did not receive the specified kind of income. Thisexclusion is both a practical necessity (otherwise, we are averaging some infinite values withfinite ones) and a reasonable compromise in dealing with the shortcoming of our assumedfunctional form. Although Lankford and Wyckoff (1991) validate the constant elasticity form fortheir sample (which contained a single measure of income that never took a zero value), oursample is different, and the elasticity need not remain constant as income tends to zero.4 {Weneed to recalculate the ratios for giving to each purpose, which is why the derivatives are notreported in the table except for TOTGIV}
Tables 2, 3, and 4 go about here
Results indicate that the source of earning power matters. Most measures of income andwealth have significant positive effects on giving to the various causes, and these effects areoften different from each other in a numerical and statistical sense. INHERIT always has apositive effect, significant except for giving to religion and people in need. EARN also has auniformly positive effect that is significant except for giving to religion. TRANSFER has aninconsistently-signed effect that is mildly significant (and positive) only for gifts to people inneed and to health. WEALTH has a large positive effect which is overwhelmingly significant inall cases.
The picture is more complicated when we test whether the various types of income haveequivalent effects on total giving. In terms of elasticities, the elasticity of each form of givingwith respect to WEALTH is always much larger (in both a statistical and numerical sense) thanthe corresponding elasticity with respect to INHERIT, TRANSFER, and EARN. The elasticity

12
with respect to TRANSFER is always numerically the smallest, although it is significantlysmaller than the next-to-smallest in only four of the seven cases. EARN has a larger effect thanINHERIT for total giving, combined causes, people in need, health, and education, whereasINHERIT has a larger effect for religion and other. These differences are not significant exceptfor giving to combined causes.
Some of these tests are sensitive to the assumed real rate of return, but the comparisonbetween WEALTH and INHERIT is not. The WEALTH elasticity is between 4.5 and 13.3 timeslarger than the INHERIT elasticity, providing strong evidence that the source of income matters.The evidence is weaker when we compare the elasticities with respect to WEALTH and EARNbecause of its dependence on the real rate of return used to annuitize WEALTH, but in manycases, it would take an implausibly high real rate of return to make the respective point estimatesequal. The two elasticities would be equal for giving to combined causes if the real rate of returnequals 4.75%, but it would take a real rate of return of 21.5% to equalize the elasticities for giftsto religion. The required rate of return in other cases ranges between 8% and 15.7%.
The complicated picture arises when we compare marginal propensities rather thanelasticities. Here, we find that an amount of wealth sufficient to generate $1 of income each yearresults in about 81 cents of additional total giving per year, whereas an inheritance sufficient togenerate $1 of income per year results in about 25 cents of giving when we use the mean ratio ofgiving to wealth for those with positive wealth and the mean ratio of giving to inheritance forthose with a positive inheritance to compute the marginal propensities. Put another way, a dollarof wealth appears to generate about 1.6 cents of additional giving per year and a dollar ofinheritance appears to generate about 0.5 cents of giving. This difference is huge, in both anumerical and statistical sense. However, if we instead evaluate the marginal propensities togive at the median ratios, both effects are smaller and the difference is insignificant. Similarpatterns hold for giving to specified charitable causes, although the numbers are less dramaticand many of the median ratios were zero. Clearly, more research is needed before we can cometo a firm conclusion in terms of marginal propensities.
Table 5 goes about here
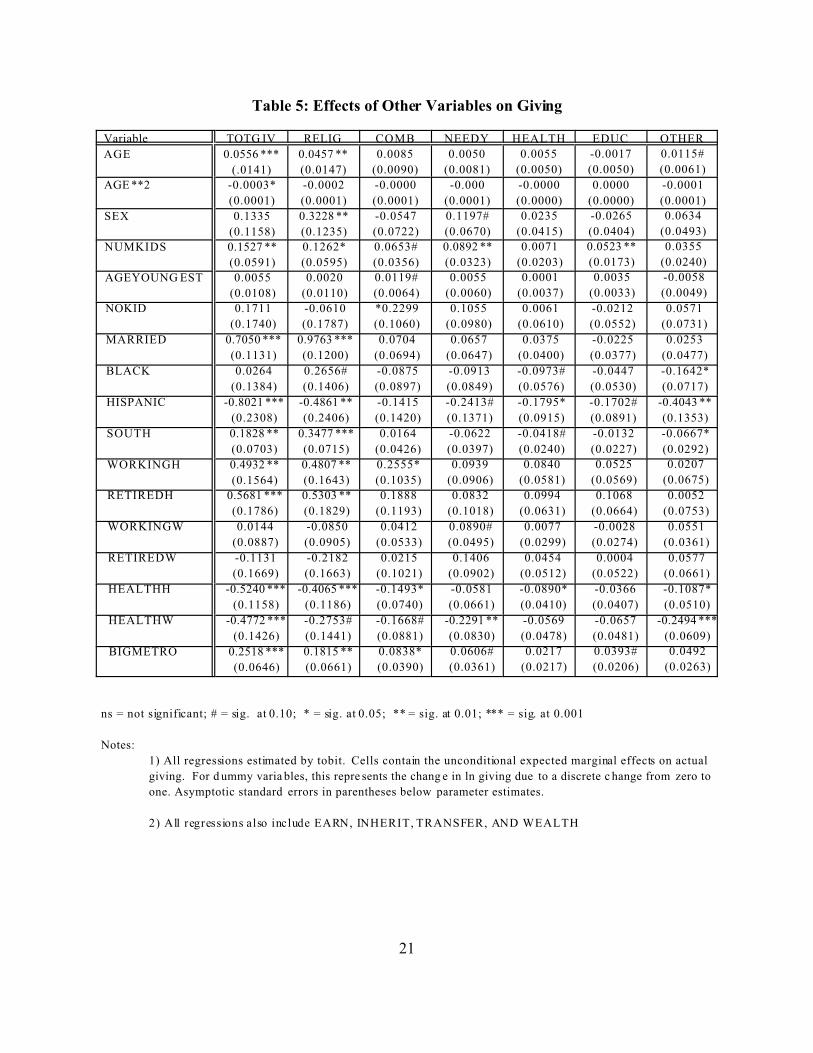
Some of the demographic variables have interesting effects on giving, although this is notthe primary focus of the present paper. Female-headed households make larger averagedonations to most causes, but this effect is numerically and statistically most significant forreligious giving and gifts to the needy. The number of children in the household has astatistically significant positive effect except for giving to health and other (borderline significantfor gifts to combined causes). Households in which the head is married have much higher levelsof total giving than households with unmarried heads, but this effect seems to be exclusively dueto religious giving.
Other studies {add cite} find that households headed by African Americans give less thanother households but that this difference is not statistically significant once one controls for

13
income and education. Our variables reflecting giving to various charitable causes allow us tosay more. African-American households apparently give more to religion and less to health and“other” than households headed by those from other races, although this effect is only significantat the 10% level for religion and health. In contrast, Hispanics appear to give less across theboard. This effect is large and highly significant for overall giving, but it is also strong for giftsto religion and “other” and moderately significant for health, education, and people in need. Thisresult is provocative, but perhaps Hispanics interpret the questions differently or give in ways notcaptured by the survey (such as sending remittances to their country of origin, or giving andvolunteering informally through family and community networks).
Families whose head works appear to give more than the excluded category (laid off,looking for work, etc.), and this effect is significant for overall giving, giving to religion, andgiving to combined funds. However, a bigger and more statistically-significant positive effectoccurs for total giving and giving to religion by families with a retired head. In contrast, thework status of the spouse is not a factor except marginally for gifts to help persons in need byworking spouses.
Not surprisingly, households give significantly less to almost all causes if the health ofthe head or spouse is no good. The estimated effect was always negative, but the effect ofHEALTHH was not significant for gifts to the needy or education, and the effect of HEALTHWwas not significant for gifts to health and education. We are unaware of any previous studies thathave investigated the effect of health measures on giving.
Finally, large metropolitan areas have significantly higher amounts of total giving, givingto religion, and gifts to combined causes. There is also a positive effect, of lesser statisticalsignificance, for gifts to the needy and to education . This is somewhat surprising in light ofexpectations that residents of large cities can each contribute less to a public good and yet enjoy agreater aggregate quantity of that good, and perhaps speaks to theories of alienation, socialcapital, and community attachment. The finding is in contrast to that of Hochman and Rodgers{add cite}, who found that giving is highest in small- to medium-size cities. {Check also studiesby Wilson and by Wolpert on this point} Region also seems to have an effect. Althoughitemized gifts per taxpayer are lower in the southern states {add cite}, this appears largely to bedue to the lack of control for important covariates. We find that overall giving is higher forsouthern respondents, and this effect is largely due to gifts to religion. Southern giving is lowerthan elsewhere for most other causes, significantly so for health and “other.”
Planned Future Research
This paper represents an early stage of an ongoing research project, and we share ourideas for future research in the hopes that readers will share their ideas with us.
First, we will explore further disaggregating our measures of income. Transfer income, inparticular, combines welfare payments, intrafamily transfers, and social security into one

14
category despite their plausibly different effects on giving. In particular, this disaggregation willallow us to compare our results more directly with those of Brooks (2002). In addition, there issome indication from other literatures that the recipient of income matters. Income given to malespouses results in a different pattern of behavior than income given to female spouses {add acite}, and we have the data to explore whether similar differences arise in giving. This point isrelated to, but distinct from the question of which spouse decides on the allocation of charitablegifts (Andreoni, Brown, and Rischall, forthcoming).
Second, we will incorporate additional control variables. In particular, we can determinethe religious preference of respondents, and see whether, e.g., Mormons treat the sources ofincome differently as suggested in Dahl and Ransom (1999). Measures of educational attainmentwill also be added.
Third, we will experiment with alternative measures of inheritance. The questions aboutinheritances received during the last five years has been asked in previous waves, and analternative question on inheritances received during the last year can be used instead of thisvariable. In addition, we will explore various ways to account for the year in which theinheritance is received. We will also account for contemporaneous income and wealth when thedata from the 2001 wave of the PSID become fully available.
Fourth, we will improve the econometrics by explicitly accounting for the correlation inerror terms between siblings and for the censored, non-normal, and heteroskedastic nature of theerror term. We will also explore alternative functional forms. Finally, we will try to account forcross-equation restrictions arising from the fact that gifts to the various charitable subsectorsmust add up to total gifts, so that the various estimated marginal effects of income, wealth, andother variables must add up as well.
VI. Discussion
Our results indicate that the source of income matters. Non-inherited wealth has an effecton giving that is larger than that of inherited wealth, earned income, or transfer income and thisdifference is usually substantial. In terms of elasticities, non-inherited wealth has between 4.5and 13.3 times the effect of inherited wealth. Thus, we provide further support to Avery’s (1994)conclusion that the creators of wealth are considerably more generous than the recipients ofwealth. However, that conclusion should really be derived from a comparison of marginalpropensities to donate, rather than elasticities, and this conclusion becomes murky when theappropriate conversions are made. In contrast, there is little apparent difference between theelasticities of giving from inherited wealth or from labor income, but the latter appears to create asignificantly larger marginal propensity to donate. Finally, we find that transfers have noapparent effect on total gifts and gifts to religion, combined funds, education, and other, with asmall but significant positive effect on giving to people in need and to health.
Why does non-inherited wealth have such a large impact? Is it because of the windfall

15
nature of unexpected capital gains, unobservable determinants of both savings and giving,differences in the timing of the wealth, inheritance, and income measures, or differences in theperceived permanence or riskiness of income flows? Is the difference understandable intraditional economic models, or does it demonstrate that framing effects are pervasive? Does theresult represent a real difference in behavior, or the impact of unmeasured taste variables that arecorrelated with the mixtures of income and wealth held by respondents? The result isprovocative, and requires more research. As future waves of the PPS generate panels of bothgiving and wealth, we can learn more about this phenomenon.
If our results are to be taken at face value, they paint a potentially dire portrait for thefuture of donative nonprofits (those that derive most of their revenues from donations, asopposed to commercial activities). Those now possessing the wealth are giving out of non-inherited wealth. Upon their passing away, their children will give out of inherited wealth. Using the marginal propensities to give evaluated at the mean, the children will be about 3.2times less generous with the money they receive than were their parents prior to death, and soannual giving would fall each year of the transfer process, ceteris paribus. Retention of estatetaxation with a deduction for charitable bequests would help counteract this decline; permanentrepeal would accentuate it. Even at face value, the picture is less dire if marginal propensities togive are evaluated at the median, for here heirs are only slightly less generous with inheritedwealth than their benefactors were.
References
Andreoni, James. 1995. Warm-Glow vs. Cold-Prickle: The Effect of Positive and NegativeFraming on Cooperation in Experiments. Quarterly Journal of Economics, CIX, pp. 1-21.
Andreoni, James, Eleanor Brown, and Isaac Rischall. Forthcoming. Charitable Giving ByMarried Couples: Who Decides and Why Does It Matter? Journal of Human Resources.
Arkes, H., C. Joyner, M. Pezzo, J. Nash, K. Siegel-Jacobs, and E. Stone. 1995. ThePsychology of Windfall Gains. Organizational Behavior and Human Decision Processes59, pp. 331-347.
Arrondel, Luc, Andre Masson, and Pierre Pestieau. 1997. Bequest and Inheritance: EmpiricalIssues and French-U.S. Comparison. In G. Erreygers and T. Vandevelde, eds., IsInheritance Legitimate? Heidelberg: Springer-Verlag.
Auten, Gerald E. and Rudney, Gabriel. 1990. The Variability of Individual Charitable Giving inthe U.S. Voluntas, 1, pp. 80-97.
Auten, Gerald E., Holger Sieg, and Charles T. Clotfelter. 2002. Charitable Giving, Income , andTaxes: An Analysis of Panel Data. American Economic Review, 92, pp. 371-82.

16
Avery, Robert. 1994. The Pending Intergenerational Transfer. Philanthropy, VIII#1, apublication of The Philanthropic Roundtable. p. 5, 28-29.
Barrett, Kevin Stanton, Anya M. McGuirk and Richard Steinberg. 1997. Further Evidence onthe Dynamic Impact of Taxes on Charitable Giving. National Tax Journal, L. pp. 321-34.
Brooks, Arthur C. 2002. Welfare Receipt and Private Charity. Public Budgeting and Finance22(3), pp. 100-113.
Case, Karl E., John M. Quigley, and Robert J. Shiller, 2002. Comparing Wealth Effects: Thestock Market versus the Housing Market, manuscript, December.
Cherry, Todd L., Peter Frykblom, and Jason F. Shogren. 2002a. Hardnose the Dictator. American Economic Review. (Note – we have the working paper version, and need toconfirm that the published version obtained the same results)
Cherry, Todd L., Peter Frykblom, and Jason F. Shogren. 2002b. Does the Origin ofEndowments Impact Contributions in Public Good Games? Working paper.
Dahl, Gordon B. and Michael R. Ransom. 1999. Does Where you Stand Depend on WhereYou Sit? Tithing Donations and Self-Serving Beliefs. The American Economic Review,89#4, pp. 703-727.
Glazer, Amihai and Kai A. Konrad. 1996. A Signalling Explanation for Private CharityAmerican Economic Review, 86#4, pp. 1019-1028.
Harbaugh, W. 1998. What do Donations Buy? Journal of Public Economics, 67, pp. 269-284.
Havens, John and Paul Schervish. 1999. Millionaires and the Millennium: New Estimates ofthe Forthcoming Wealth Transfer and Prospects for a Golden Age of Philanthropy. Chestnut Hill, MA: Boston College Social Welfare Research Institute Working Paper.
Holtz-Eakin, Douglas; David Joulfaian and Harvey S. Rosen. 1993. The Carnegie ConjectureSome Empirical Evidence. Quarterly Journal of Economics 108(2), pp. 413-435
Holtz-Eakin, Douglas; David Joulfaian and Harvey S. Rosen. 1994a. Sticking It Out:Entrepreneurial Survival and Liquidity Constraints. Journal of Political Economy, 102.No.1.
Holtz-Eakin, Douglas; David Joulfaian and Harvey S. Rosen. 1994b. Entrepreneurial Decisionsand Liquidity Constraints. RAND Journal of Economics, 25#2.

17
Independent Sector. 1996. Giving and Volunteering in the United States: Findings from aNational Survey, 1996 Edition. Washington, D.C.: Independent Sector.
Joulfaian, David and Mark Wilhelm. 1994. Inheritance and Labor Supply. Journal of HumanResources, 29, pp. 1205-1234.
Lankford, R. Hamilton and James H. Wyckoff. 1991. Modeling Charitable Giving Using a Box-Cox Standard Tobit Model, The Review of Economics and Statistics, 73, pp. 460-470
Ostrower, Francie. 1995. Why the Wealthy Give: The Culture of Elite Philanthropy. Princeton,NJ: Princeton University Press.
Randolph, William C., 1995. Dynamic Income, Progressive Taxes, and the Timing of CharitableContributions, Journal of Political Economy, 4:3, 709-738.
Scheffrin and Thaler. 1988. {Finish this}
Schervish, Paul G., Mary A. O’Herlihy, and John J. Havens. 2001. Agent-Animated Wealth andPhilanthropy: The Dynamics of Accumulation and Allocation Among High-Tech Donors. Boston, MA: Social Welfare Research Institute.
Swainston, Howard D. 1992. Tithing. In Daniel H. Ludlow, ed., Encyclopedia of Mormonism,Vol. 4. New York: Macmillan, pp. 1480-82.
Wilhelm, Mark. 2002. The Distribution of Giving in Six Surveys. Indianapolis: IUPUI Dept. of Economics Working Paper.

18
Table 1: Descriptive Statistics
Variable Mean Median Maximum Minimum
TOTG IV $1,579.00 $400.00 $491,500.00 $0.00
RELIGGIV $892.00 $0.00 $67,000.00 $0.00
COMB GIV $180.00 $0.00 $38,824.00 $0.00
NEEDY GIV $142.00 $0.00 $24,500.00 $0.00
HLTHG IV $187.00 $0.00 $490,000.00 $0.00
EDUCG IV $84.00 $0.00 $50,000.00 $0.00
OTHE RGIV $94.00 $0.00 $26,500.00 $0.00
EARN $50,398.00 $39,000.00 $2,049,000.00 $-82,020.00
TRANSFER $7,341.00 $285.00 $569,880.00 $0.00
INHERIT $6,252.00 $0.00 $5,000,000.00 $0.00
WEALTH $241,565.00 $68,000.00 $27,700,000.00 -$196,500
AGE 46 44 97 17
SEX 0.22 na na na
NUMKIDS 0.76 0 7 0
MARRIED 0.61 na na na
BLACK 0.08 na na na
HISPANIC 0.02 na na na
SOUTH 0.32 na na na
BIGMETRO 0.54 na na na
WORKINGH 0.78 na na na
RETIREDH 0.14 na na na
DISABLEDH 0.02 na na na
HEALTHH 0.11 na na na
HEALTHW 0.06 na na na

19
Table 2: Income Elasticities of Giving
Variable TOTG IV RELIG COMB NEEDY HEALTH EDUC OTHER
INHERIT 0.0451 ***
(.0173)
0.0270
(.0174)
0.0201*
(.0100)
0.0108
(.0092)
0.0120*
(.0053)
0.0150 **
(.0048)
0.0199 **
(.0063)
EARN 0.0815 ***
(.0156)
0.0206
(.0158)
0.0572 ***
(.0101)
0.0182*
(.0087)
0.0121*
(.0051)
0.0224 ***
(.0054)
0.0182 **
(.0063)
TRANSFER 0.0111
(.0087)
-0.0071
(.0089)
-0.0018
(.0052)
0.0091#
(.0048)
0.0051#
(.0029)
-0.0011
(.0027)
0.0007
(.0035)
WEALTH 0.3837 ***
(.0212)
0.2213 ***
(.0219)
0.1359 ***
(.0136)
0.1431 ***
(.0130)
0.0936 ***
(.0084)
0.0898 ***
(.0082)
0.0891 ***
(.0097)
INHER=EARN? ns ns ** ns ns ns ns
INHER=TRNSFR? # # # ns ns ** **
INHER=WLTH? *** *** *** *** *** *** ***
EARN=TRNSFR? *** ns *** ns ns *** *
EARN=WLTH? *** *** *** *** *** *** ***
TRNSFR=WLTH? *** *** *** *** *** *** ***
Pseudo - R2 0.0896 0.0577 0.0535 0.0465 0.0714 0.0832 0.0613
ns = not significant; # = sig. at 0.10l; * = sig. at 0.05; ** = sig. at 0.01; *** = sig. at 0.001
Notes:
1) All regres sions estimated by tobit. Cells co ntain estimated unconditio nal elasticities.
2) Wealth and inheritance variables have been annuitized to make their coefficients comparable to those on
the various income variables. Rows labeled in the form “A=B?” report on W ald tests for the equality of the
coefficients on A and B. The symbols in these cells indicate the level at which the null is rejected.
3) Other control variables include AGE, AGE**2, SEX, KIDS, MARRIED, BLACK, HISPANIC, SOUTH,
WORKINGH, RETIREDH, WORKINGW, RETIREDW, HEALTHH, HEALTHW, BIGMETRO,
AGEYOUNG EST, and NOKIDS.

20
Table 3: Marginal Propensity to Give Evaluated at Mean
Variable TOTG IV RELIG COMB NEEDY HEALTH EDUC OTHER
INHERIT 0.2532 *** 0.0931 0.0110* 0.0076 0.0039* 0.0042 ** 0.0061 **
EARN 0.0064 *** 0.0012 0.0003 *** 0.0001* 0.0000* 0.0000 *** 0.0001 **
TRANSFER 0.0217 -0.0108 -0.0004 0.0010# 0.0002# -0.0000 0.0000
WEALTH 0.8098 *** 0.3413 *** 0.0255 *** 0.0235 *** 0.0039 *** 0.0059 *** 0.0104 ***
INHER=EARN? * ns # ns * ** **
INHER=TRNSFR? * # * ns * ** **
INHER=WLTH? *** *** * *** ns ns #
EARN=TRNSFR? ns ns ns # ns ns ns
EARN=WLTH? *** *** *** *** *** *** ***
TRNSFR=WLTH? *** *** *** *** *** *** ***
Table 4: Marginal Propensity to Give, Evaluated at Median
Variable TOTG IV RELIG COMB NEEDY HEALTH EDUC OTHER
INHERIT 0.0679 *** 0.0090 – – – – –
EARN 0.0007 *** 0.0000 – – – – –
TRANSFER 0.0005 -0.0000 – – – – –
WEALTH 0.0784 *** 0.0049 *** – – – – –
INHER=EARN? ** ns – – – – –
INHER=TRNSFR? * ns – – – – –
INHER=WLTH? ns ns – – – – –
EARN=TRNSFR? ns ns – – – – –
EARN=WLTH? *** *** – – – – –
TRNSFR=WLTH? *** *** – – – – –
ns = not significant; # = sig. at 0.10; * = sig. at 0.05; ** = sig. at 0.01; *** = sig. at 0.001
Notes:
1) See notes to Table 2.
2) Hypo thesis tests treat giving/in come as fixe d in repeate d samples .
3) – indicates could not be calculated because the median ratio was zero.
21
Table 5: Effects of Other Variables on Giving
Variable TOTG IV RELIG COMB NEEDY HEALTH EDUC OTHER
AGE 0.0556 ***
(.0141)
0.0457 **
(0.0147)
0.0085
(0.0090)
0.0050
(0.0081)
0.0055
(0.0050)
-0.0017
(0.0050)
0.0115#
(0.0061)
AGE **2 -0.0003*
(0.0001)
-0.0002
(0.0001)
-0.0000
(0.0001)
-0.000
(0.0001)
-0.0000
(0.0000)
0.0000
(0.0000)
-0.0001
(0.0001)
SEX 0.1335
(0.1158)
0.3228 **
(0.1235)
-0.0547
(0.0722)
0.1197#
(0.0670)
0.0235
(0.0415)
-0.0265
(0.0404)
0.0634
(0.0493)
NUMKIDS 0.1527 **
(0.0591)
0.1262*
(0.0595)
0.0653#
(0.0356)
0.0892 **
(0.0323)
0.0071
(0.0203)
0.0523 **
(0.0173)
0.0355
(0.0240)
AGEYOUNG EST 0.0055
(0.0108)
0.0020
(0.0110)
0.0119#
(0.0064)
0.0055
(0.0060)
0.0001
(0.0037)
0.0035
(0.0033)
-0.0058
(0.0049)
NOKID 0.1711
(0.1740)
-0.0610
(0.1787)
*0.2299
(0.1060)
0.1055
(0.0980)
0.0061
(0.0610)
-0.0212
(0.0552)
0.0571
(0.0731)
MARRIED 0.7050 ***
(0.1131)
0.9763 ***
(0.1200)
0.0704
(0.0694)
0.0657
(0.0647)
0.0375
(0.0400)
-0.0225
(0.0377)
0.0253
(0.0477)
BLACK 0.0264
(0.1384)
0.2656#
(0.1406)
-0.0875
(0.0897)
-0.0913
(0.0849)
-0.0973#
(0.0576)
-0.0447
(0.0530)
-0.1642*
(0.0717)
HISPANIC -0.8021 ***
(0.2308)
-0.4861 **
(0.2406)
-0.1415
(0.1420)
-0.2413#
(0.1371)
-0.1795*
(0.0915)
-0.1702#
(0.0891)
-0.4043 **
(0.1353)
SOUTH 0.1828 **
(0.0703)
0.3477 ***
(0.0715)
0.0164
(0.0426)
-0.0622
(0.0397)
-0.0418#
(0.0240)
-0.0132
(0.0227)
-0.0667*
(0.0292)
WORKINGH 0.4932 **
(0.1564)
0.4807 **
(0.1643)
0.2555*
(0.1035)
0.0939
(0.0906)
0.0840
(0.0581)
0.0525
(0.0569)
0.0207
(0.0675)
RETIREDH 0.5681 ***
(0.1786)
0.5303 **
(0.1829)
0.1888
(0.1193)
0.0832
(0.1018)
0.0994
(0.0631)
0.1068
(0.0664)
0.0052
(0.0753)
WORKINGW 0.0144
(0.0887)
-0.0850
(0.0905)
0.0412
(0.0533)
0.0890#
(0.0495)
0.0077
(0.0299)
-0.0028
(0.0274)
0.0551
(0.0361)
RETIREDW -0.1131
(0.1669)
-0.2182
(0.1663)
0.0215
(0.1021)
0.1406
(0.0902)
0.0454
(0.0512)
0.0004
(0.0522)
0.0577
(0.0661)
HEALTHH -0.5240 ***
(0.1158)
-0.4065 ***
(0.1186)
-0.1493*
(0.0740)
-0.0581
(0.0661)
-0.0890*
(0.0410)
-0.0366
(0.0407)
-0.1087*
(0.0510)
HEALTHW -0.4772 ***
(0.1426)
-0.2753#
(0.1441)
-0.1668#
(0.0881)
-0.2291 **
(0.0830)
-0.0569
(0.0478)
-0.0657
(0.0481)
-0.2494 ***
(0.0609)
BIGMETRO 0.2518 ***
(0.0646)
0.1815 **
(0.0661)
0.0838*
(0.0390)
0.0606#
(0.0361)
0.0217
(0.0217)
0.0393#
(0.0206)
0.0492
(0.0263)
ns = not significant; # = sig. at 0.10; * = sig. at 0.05; ** = sig. at 0.01; *** = sig. at 0.001
Notes:
1) All regressions estimated by tobit. Cells contain the unconditional expected marginal effects on actual
giving. For d ummy varia bles, this repre sents the chang e in ln giving due to a discrete c hange from zero to
one. Asymptotic standard errors in parentheses below parameter estimates.
2) All regressions also include EARN, INHERIT, TRANSFER, AND WEALTH