Clonal Outbreak of Plasmodium falciparum Infection in Eastern Panama
28
Accepted Manuscript 1 © The Author 2014. Published by Oxford University Press on behalf of the Infectious Diseases Society of America. All rights reserved. For Permissions, please e-mail: [email protected]. Clonal outbreak of Plasmodium falciparum in eastern Panama Nicanor Obaldia III 1* , Nicholas K. Baro 1* , Jose E. Calzada 2 , Ana M. Santamaria 2 , Rachel Daniels 3 , Wesley Wong 1 , Hsiao-Han Chang 4 , Elizabeth J. Hamilton 1 , Myriam Arevalo-Herrera 5 , Socrates Herrera 5 , Dyann F. Wirth 1,6 , Daniel L. Hartl 3 , Matthias Marti 1 , Sarah K. Volkman 1,6,7,§ 1 Department of Immunology and Infectious Diseases, Harvard School of Public Health, Boston, MA, United States 02115 2 Instituto Conmemorativo Gorgas de Estudios de la Salud, Panamá City, República of Panamá 3 Department of Organismic and Evolutionary Biology, Harvard University, Cambridge, MA, United States 02138 4 Department of Epidemiology, Harvard School of Public Health, Boston, MA, United States 02115 5 Centro de Investigación Científica Caucaseco/Centro Latino Americano de Investigación en Malaria (CLAIM) Cali, Colombia 6 Broad Institute, Cambridge, MA, United States 02142 7 Simmons College, Boston, MA, United States 02115 *These authors contributed equally to this work. § Corresponding author: [email protected]; Tel: 617-432-1621; Fax: 617-432-4766 Journal of Infectious Diseases Advance Access published October 21, 2014 by guest on June 19, 2016 http://jid.oxfordjournals.org/ Downloaded from
-
Upload
independent -
Category
Documents
-
view
0 -
download
0
Transcript of Clonal Outbreak of Plasmodium falciparum Infection in Eastern Panama

Acce
pted M
anus
cript
1
© The Author 2014. Published by Oxford University Press on behalf of the Infectious Diseases Society of America. All rights reserved. For Permissions, please e-mail: [email protected].
Clonal outbreak of Plasmodium falciparum in eastern Panama
Nicanor Obaldia III1*
, Nicholas K. Baro1*
, Jose E. Calzada2, Ana M. Santamaria
2, Rachel Daniels
3,
Wesley Wong1, Hsiao-Han Chang
4, Elizabeth J. Hamilton
1, Myriam Arevalo-Herrera
5, Socrates
Herrera5, Dyann F. Wirth
1,6, Daniel L. Hartl
3, Matthias Marti
1, Sarah K. Volkman
1,6,7,§
1Department of Immunology and Infectious Diseases, Harvard School of Public Health, Boston, MA, United
States 02115
2Instituto Conmemorativo Gorgas de Estudios de la Salud, Panamá City, República of Panamá
3Department of Organismic and Evolutionary Biology, Harvard University, Cambridge, MA, United States
02138
4Department of Epidemiology, Harvard School of Public Health, Boston, MA, United States 02115
5Centro de Investigación Científica Caucaseco/Centro Latino Americano de Investigación en Malaria (CLAIM)
Cali, Colombia
6Broad Institute, Cambridge, MA, United States 02142
7Simmons College, Boston, MA, United States 02115
*These authors contributed equally to this work.
§Corresponding author: [email protected]; Tel: 617-432-1621; Fax: 617-432-4766
Journal of Infectious Diseases Advance Access published October 21, 2014 by guest on June 19, 2016
http://jid.oxfordjournals.org/D
ownloaded from

Acce
pted M
anus
cript
2
Abstract
Identifying the source of resurgent parasites is paramount to strategic and successful intervention for malaria
elimination. Although malaria incidence in Panama is low, a recent outbreak resulted in a six-fold increase in
reported cases. We hypothesized parasites sampled from this epidemic might be related and exhibit clonal
population structure. We tested the genetic relatedness using informative single nucleotide polymorphisms and
drug resistance loci. We found the parasites to be clustered into three clonal subpopulations and shared
relatedness with parasites from Colombia. Two clusters of Panamanian parasites shared identical drug
resistance haplotypes, and all clusters shared a chloroquine-resistance genotype matching the pfcrt haplotype of
Colombian origin. Our findings suggest these resurgent parasite populations are highly clonal and likely
resulted from epidemic expansion of imported or vestigial cases. Outbreak investigation using genetic tools can
illuminate potential sources of epidemic malaria and guide strategies to prevent further resurgence in areas of
malaria elimination.
by guest on June 19, 2016http://jid.oxfordjournals.org/
Dow
nloaded from

Acce
pted M
anus
cript
3 Malaria transmission has been greatly reduced in Panama over the past several decades, suggesting only
a limited number of parasite types may remain among infected individuals. After three decades of successful
malaria control, Panama experienced an outbreak of epidemic proportions between 2001 and 2005, accounting
for greater than 60 percent of all cases reported over the past 35 years[1,2]. Study of P. falciparum isolates
collected during the outbreak provides an opportunity to study the population structure of Panamanian parasites
and understand genetic signatures associated with reemerging parasites during an elimination campaign.
Genetic diversity in parasite populations has been linked to transmission intensity[3,4], with limited
genetic diversity and extensive linkage disequilibrium (LD)[4–6] observed in low-transmission settings. South
America shows evidence of decreased outcrossing and genetic drift primarily resulting from inbreeding and
asexual replication[7–9]. Population bottlenecks, low transmission, inbreeding, and epidemic expansions can
all give rise to clonal lineages[3,9–15]. We hypothesize that, with fewer and fewer parasite types, limited
opportunities for outcrossing during the mosquito phase of the lifecycle results in transmission of highly related
or even clonal parasites. Genetic traits, such as drug resistance, are inherited from one generation to the next,
and hence are predicted to be homogeneous among highly related parasites. Furthermore, the epidemic rise of
malaria transmission during 2001–2005 in Panama similarly predicts that these parasites would be highly
related or even genetically identical.
A molecular barcode has recently been deployed in Senegal, where barcoded parasites revealed
increases in and persistence of clonality coincident with increased deployment of malaria control
interventions[5]. Uncommon malaria cases or outbreaks[16] in settings of low malaria endemicity provide an
ideal opportunity to ascertain whether simple genetic fingerprinting tools like the molecular barcode can reveal
clonal parasite population structure. Using the molecular barcode and a panel of assays for drug resistance loci,
we detected highly related clonal and parasite lineages in Panama consistent with this hypothesis. Deployments
of genotyping tools that reveal parasite population structure in low transmission settings are critical for
successful malaria elimination campaigns.
by guest on June 19, 2016http://jid.oxfordjournals.org/
Dow
nloaded from

Acce
pted M
anus
cript
4 Results
Genotyping reveals three clonal parasite populations among P. falciparum from eastern Panama
Using a molecular barcode that assesses 24 neutral, unlinked single nucleotide polymorphisms (SNPs)
with a high minor allele frequency, we identified three clonal parasite populations from among 37 P. falciparum
samples collected in two provinces (Panamá and Darien) and mostly within three Amerindian reservations
(Kuna Yala, Madugandi and Embera-Wounan) in eastern Panama between 2003 and 2008 (Fig. 1). These SNP
data were then used to group the parasites into three clusters of essentially genetically identical parasites (Fig.
2). These three clonal clusters include isolates mainly from Kuna Yala (n = 15) (Group I); Darien (n = 5) and
Panamá (n = 15) Provinces, along with two from Kuna Yala (PE01 and PF02) (Group II); and two coastal
samples (PF002 and KY44) (Group III).
Twelve of the 24 alleles were polymorphic among the Panamanian isolates to delineate these three
groups, yielding 4,096 theoretically possible genotypes. Analysis of molecular variance (AMOVA) using the
molecular barcode evaluated the percentage of molecular variance within and between groups; 68% of the
variation was explained by comparing collection sites (p = 0.001) compared to 96% (p = 0.001) explained by
clonal groups, which we define as clusters of essentially genetically identical parasites regardless of geographic
site of isolation. These data imply that clone-correction was more consistent with these data; consequently the
clonal groups were used for additional genetic analysis.
Clonal subpopulations of eastern Panama are related to more genetically diverse parasites from neighboring
Colombia.
Given the very low prevalence of P. falciparum infection in Panama before and after this epidemic in
2001–2005, we sought to test whether these parasites were related to parasites from neighboring Colombia,
which exhibits higher malaria transmission. Twenty P. falciparum samples collected from Buenaventura and
Tumaco (Pacific coast) and Tierra Alta (northwestern region) in Colombia during 2011–2012 (Fig. 1), were
similarly genotyped by barcode and compared with those sampled from Panama. Structure analysis revealed
by guest on June 19, 2016http://jid.oxfordjournals.org/
Dow
nloaded from
Acce
pted M
anus
cript
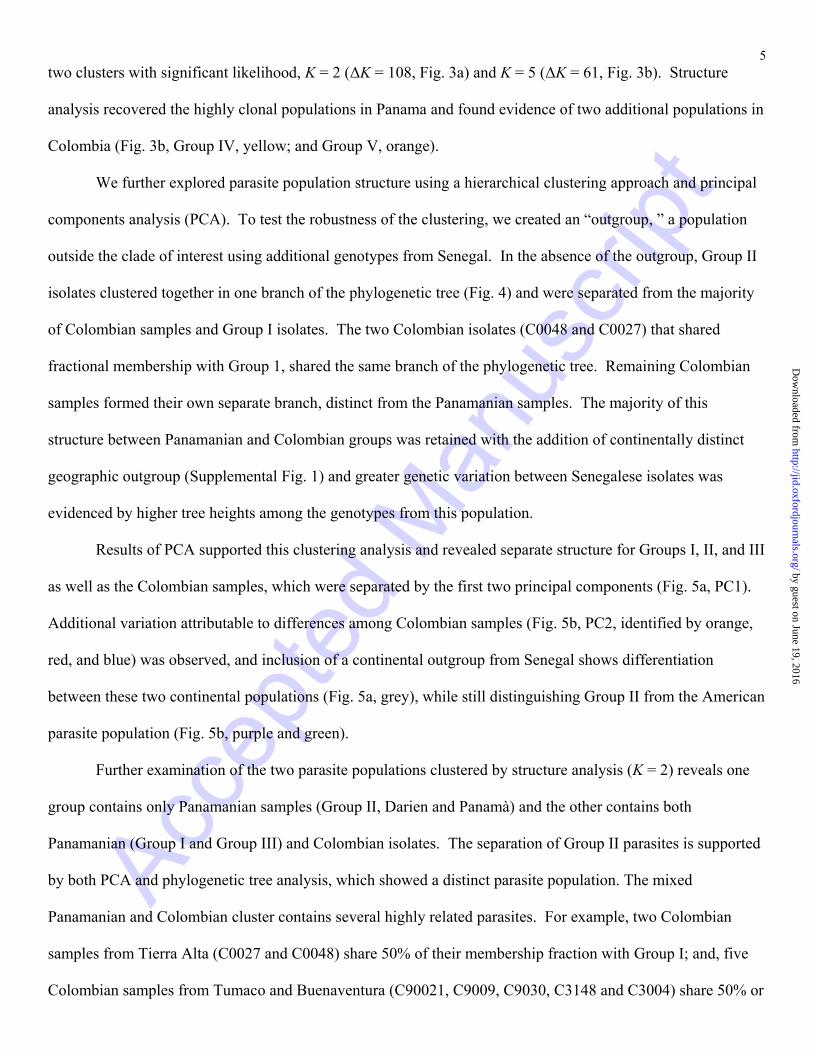
5 two clusters with significant likelihood, K = 2 (ΔK = 108, Fig. 3a) and K = 5 (ΔK = 61, Fig. 3b). Structure
analysis recovered the highly clonal populations in Panama and found evidence of two additional populations in
Colombia (Fig. 3b, Group IV, yellow; and Group V, orange).
We further explored parasite population structure using a hierarchical clustering approach and principal
components analysis (PCA). To test the robustness of the clustering, we created an “outgroup, ” a population
outside the clade of interest using additional genotypes from Senegal. In the absence of the outgroup, Group II
isolates clustered together in one branch of the phylogenetic tree (Fig. 4) and were separated from the majority
of Colombian samples and Group I isolates. The two Colombian isolates (C0048 and C0027) that shared
fractional membership with Group 1, shared the same branch of the phylogenetic tree. Remaining Colombian
samples formed their own separate branch, distinct from the Panamanian samples. The majority of this
structure between Panamanian and Colombian groups was retained with the addition of continentally distinct
geographic outgroup (Supplemental Fig. 1) and greater genetic variation between Senegalese isolates was
evidenced by higher tree heights among the genotypes from this population.
Results of PCA supported this clustering analysis and revealed separate structure for Groups I, II, and III
as well as the Colombian samples, which were separated by the first two principal components (Fig. 5a, PC1).
Additional variation attributable to differences among Colombian samples (Fig. 5b, PC2, identified by orange,
red, and blue) was observed, and inclusion of a continental outgroup from Senegal shows differentiation
between these two continental populations (Fig. 5a, grey), while still distinguishing Group II from the American
parasite population (Fig. 5b, purple and green).
Further examination of the two parasite populations clustered by structure analysis (K = 2) reveals one
group contains only Panamanian samples (Group II, Darien and Panamà) and the other contains both
Panamanian (Group I and Group III) and Colombian isolates. The separation of Group II parasites is supported
by both PCA and phylogenetic tree analysis, which showed a distinct parasite population. The mixed
Panamanian and Colombian cluster contains several highly related parasites. For example, two Colombian
samples from Tierra Alta (C0027 and C0048) share 50% of their membership fraction with Group I; and, five
Colombian samples from Tumaco and Buenaventura (C90021, C9009, C9030, C3148 and C3004) share 50% or
by guest on June 19, 2016http://jid.oxfordjournals.org/
Dow
nloaded from

Acce
pted M
anus
cript
6 more of their membership fraction with Group III. The two coastal samples (KY44 and PF002, Group III) were
more closely related to Colombian parasites than to other Panamanian parasites (see Fig. 3), based upon
population structure analysis. Parallel analysis on a subset of monogenomic samples (containing less than two
N‟s among the 24 SNPs assayed) yielded similar results (Supplemental Figs. 2-5).
Clonal Panamanian parasite population supported by nearly identical drug resistance haplotypes
Drug pressure historically applied to P. falciparum selects drug resistant parasites. To test whether
parasites with identical barcodes shared drug resistant loci profiles we assayed 32 SNPs across six genes
associated with drug resistance (Supplementary Table 2). All Panamanian isolates harbored resistance
mutations in pfcrt, pfmdr1, pfdhps and pfdhfr, and excluding mixed calls for pfmdr1 in two samples (KY44 and
PF002), all had identical drug resistance haplotypes irrespective of their clonal group assignment. These two
samples (KY44 and PF002) that contained evidence of mixed calls for pfmdr1 were collected off the
Panamanian coast (Group III, Coastal) and lacked two additional changes including D1246 in PfMDR1 and
A437 in PfDHPS. The only other genetic variation among these drug resistance loci noted were mixed allele
calls from two Darien isolates suggesting the presence of both the mutant and wild-type alleles at amino acid
positions 86, 1042, and 1246 (DA29); or residue 1246 (DA04) of PfMDR1. Overall, there was significantly
greater diversity among drug resistance loci from Colombian parasites compared to Panamanian parasites
(Supplementary Table 2).
Drug resistance profiles are consistent with the relatedness between Colombian and eastern Panamanian
samples detected by the putatively neutral markers of the molecular barcode. All Panamanian samples have
amino acid changes at positions 75, 76, 97 and 220 in PfCRT, resulting in the CVMET-Q-S-N-I haplotype
previously reported to originate in Colombia and subsequently identified in Venezuela. Here, Colombian
samples from Tierra Alta also shared this PfCRT haplotype, indicating genetic similarity between these
Colombian samples and those found in Panama. For PfMDR1, over 80% of the Panamanian shared the triple
mutant haplotype N-F-R-S-D-Y (with amino acid changes: Y184F, N1042D, and D1246Y), while remaining
variation came from Group III parasites that shared the N-F-R-S-D-D haplotype, or from mixed alleles in some
by guest on June 19, 2016http://jid.oxfordjournals.org/
Dow
nloaded from

Acce
pted M
anus
cript
7 Darien isolates. Previous reports identify the N-F-R-S-D-D haplotype as having originated in Colombia, and it
is detected among coastal Panamanian parasites (Group III). Mixed allele calls in some Darien parasites that
shared nearly identical molecular barcodes were suggestive of gene amplification of pfmdr1, which was
confirmed by HRM analysis that detected the N86Y change among additional copies (Supplemental Table 2,
see DA29 for example). All isolates shared the double mutant I-C-N-I haplotype for PfDHFR, and Groups I
and II shared the SG-K-A-A PfDHPS haplotype. Group III again differed from other Panamanian parasites by
carrying the wild-type allele at position 437. A summary of identified drug-resistance associated haplotypes is
shown in Supplemental Fig. 6. Collectively, analysis of drug resistance alleles is consistent with members of
Group III being distinct from other Panamanian isolates and sharing some drug resistance haplotypic
information previously reported from Colombia.
Discussion
Application of molecular barcode genotyping to resurgent P. falciparum infections in Panama reveals
clonal parasite populations that are distinct from genetically diverse P. falciparum from nearby Colombia.
These clonal Panamanian parasites harbor nearly identical drug resistance loci, while the largely genetically
diverse Colombian parasites exhibited correspondingly heterogeneous drug resistance loci. Collectively these
data demonstrate the utility of simple molecular genotyping tools and approaches to reveal the similar or
dissimilar nature of P. falciparum parasites among clinical cases for the purposes of outbreak investigation, and
can identify genetically similar or identical parasites from among these cases. The 24 SNP barcode is useful to
differentiate parasite populations in low endemic settings, as most of the previous studies were done in high
endemic African settings. Although numerous reports from South and Central American malaria endemic
countries[1,12,14,17–21] have evaluated P. falciparum populations, these findings demonstrate the combination
of a comprehensive panel of both molecular barcode SNPs and drug resistance-associated SNPs can fingerprint
and identify the relatedness of transmitted parasites from clinical cases during resurgent malaria.
Given the highly related nature of these parasites from Panama, only 12 variant neutral SNPs were
sufficient to divide them into three clonal subpopulations that were confirmed by AMOVA and maintained this
by guest on June 19, 2016http://jid.oxfordjournals.org/
Dow
nloaded from
Acce
pted M
anus
cript
8 structure after subsequent clustering and PCA interrogation. Investigation of molecular variance revealed that
these clonal groups were more similar than groups formed by geographic information alone, consistent with the
almost identical barcodes shared by these populations. Thus, molecular genotyping techniques provide granular
information about parasite identity and relatedness that may aid in identifying the origin of new infections or
tracking the spread of infections during an outbreak setting to better identify and target reservoirs of infection.
These data support the hypothesis that eastern Panamanian isolates have limited genetic diversity and clonal
population structure. The persistence of clonal lineages throughout and after the epidemic is consistent with the
hypothesis that as parasite population structure becomes more pronounced, inbreeding occurs more frequently,
and opportunities for outcrossing are limited by low frequency of complex infections[4]. Furthermore, that
epidemic malaria can seed the expansion of specific clonal types that can spread from the original site of the
epidemic.
Parasite population cluster into groups irrespective of study site thus additional factors may contribute to
the clonal lineages observed. For example, it has been shown that the San Blas Range, which stretches along
the northern coast of eastern Panama adjacent to the San Blas Islands, may be an important physical and
sociodemographic barrier,[22] which has been shown to serve as a barrier to some malaria vector species[23].
One could thus speculate that these islands may serve as residual transmission reservoirs for geographically
isolated parasite populations, consistent with the lack of additional drug resistance mutations and lack of shared
alleles of barcode alleles as compared to mainland parasites.
Use of outgroups, first from neighboring Colombia and then from continentally distinct Senegal,
strengthen the conclusion that these Panamanian parasites were highly related and clonal. Although the time
difference between sample collection limit or comparison of these two populations, the addition of these
outgroups in the analysis maintained the underlying population structure among Panamanian parasites and
revealed the relatedness of parasites collected along the Caribbean coast to parasites from Colombia. The
addition of Senegalese samples maintains the population structure of the Central and South American
populations and reveals the limited diversity of the American populations by comparison. Molecular barcode
by guest on June 19, 2016http://jid.oxfordjournals.org/
Dow
nloaded from

Acce
pted M
anus
cript
9 data was used to identify clonal parasites in Colombia and Panama, distinguish relatedness between non-clonal
parasites and to infer trends in changing parasite populations in low transmission settings.
Drug resistance mutations were consistent with the observations that Colombian parasites were more
diverse than those from Panama; and, that the Group III parasites from the coastal region were more similar to
Colombian parasites than the other groups of Panamanian parasites among those sampled. This was detected by
the sharing of both pfcrt and pfmdr1 haplotypes among these parasites. Evidence of pfmdr1 copy number
variation was detected, consistent with the introduction of mefloquine as a first-line therapy in 2004[2] in
Panama, and previously documented cases demonstrating that increases in pfmdr1 copy number modulate
resistance to mefloquine[24–27]. Bacon et al. proposed two pfmdr1 founder lineages in the Amazonian Basin
Region, and that the double mutant N-F-R-S-D-D may have given rise to two independent drug-resistant
lineages [28]. Given the majority of triple mutant N-F-R-S-D-Y and two seemingly vestigial N-F-R-S-D-D
haplotypes from islands off the Caribbean coast (Group III), these findings are consistent with northward
dispersion of double mutant PfMDR1 haplotypes that likely have acquired additional mutations from selective
drug pressure. These findings are consistent with PfMDR1 haplotypes found in Amazonian Basin[28], Peru[9],
Ecuador[9], Venezuela [13], Bolivar[11], and Colombia [29]. The distinct nature of Group III parasites was
also detected when the pfdhfr and pfdhps loci were genotyped, with Group I and II parasites sharing the SG-K-
A-A PfDHPS haplotype. Parasites from the outbreak most likely expanded from residual/vestigial populations
from Panama, as parasites north of Panama harbor chloroquine sensitive pfcrt alleles and the CMET pfcrt
haplotype uniquely identifies parasites from the Panama/Colombia region. The ability to identify the source of
an outbreak demonstrates the utility of molecular tools for monitoring outbreaks in elimination settings.
Using molecular genotyping strategies, highly clonal P. falciparum parasites were detected in Panama
during an outbreak investigation in 2003–2005 that persisted after the epidemic subsided through 2008.
Interrogations of these clonal parasite populations to Colombian parasites are consistent with a northward
migration of drug resistant parasites from Colombia to Panama along the Atlantic coast and subsequent
expansion of clonal lineages. The highly related genetic signatures of these Panamanian parasites are consistent
by guest on June 19, 2016http://jid.oxfordjournals.org/
Dow
nloaded from

Acce
pted M
anus
cript
10 with clonal expansion during the outbreak, and their persistence is possibly related to the likely lack of
insufficient transmission that would normally allow for outcrossing between genetically distinct parasites or
geographic isolation of distinct parasite populations. These findings are consistent with data from other low-
transmission settings using whole genome sequence analysis[30,31]. Use of granular molecular fingerprinting
of parasites such as the molecular barcode tool allow identification of highly related parasites during outbreaks
and tracking of the potential spread of these infections critical for their interruption.
by guest on June 19, 2016http://jid.oxfordjournals.org/
Dow
nloaded from

Acce
pted M
anus
cript
11 Methods
Ethics Statement
Parasite samples were obtained from studies previously approved by the Gorgas Memorial Institutional
Review Board (ICGES-IRB), as part of a nested study conducted by the Ministry of Health (MINSA) and the
Central Public Health Laboratory (CPHL-ICGES) malaria surveillance and vector control program at Gorgas
Memorial Institute of Health Studies (ICGES), or by the Institutional Review Board (IRB) of the Malaria
Vaccine and Drug Development Center (MVDC) as part of a study conducted by the Centro Latino Americano
de Investigación en Malaria (CLAIM)[18] in Colombia. DNA extracted from field isolates was collected
anonymously and not linked to the identity of the donor.
Study Sites and P. falciparum Isolates
We examined 37 P. falciparum DNA field isolates collected during 2003–2008 from malaria endemic
provinces in eastern Panama (Panamá Province, n = 17; Kuna Yala, n = 15; Darien, n = 5) and 20 P. falciparum
DNA isolates collected during 2011–2012 from health care facilities of three malaria-endemic sites in Colombia
(Buenaventura, n = 5; Tumaco, n = 5, Tierra Alta, n = 10). Samples were collected at the corregimiento or
department level (smallest political division) together with geographic, demographic, and epidemiological
malaria data.
Inclusion criteria for Panamanian patient samples were malaria microscopic, PCR, OptiMAL® dipstick
test (DiaMed, Cressier, Switzerland) positive P. falciparum monoinfections (i.e. only the species P. falciparum
was present) obtained either by active or passive surveillance during the MINSA malaria surveillance program
or from regional hospital clinical cases reported to the CPHL-ICGES. Inclusion criteria for the Colombian
samples were malaria microscopic and PCR positive P. falciparum monoinfections obtained by the MVDC.
Samples containing P. vivax or mixed infections were excluded from the study.
Sample extraction and preparation
Genomic DNA was extracted from blood directly, or spotted onto Whatman FTA filter paper, using the
QIAmp DNA Blood Mini Kit (QIAGEN, Valencia, CA) according to manufacturer specifications. DNA
by guest on June 19, 2016http://jid.oxfordjournals.org/
Dow
nloaded from

Acce
pted M
anus
cript
12 samples were stored at ICGES in Panama City at -20°C or at MVDC in Colombia until genotyping analysis at
the Harvard School of Public Health, Boston, MA.
Genotyping
TaqMan Genotyping
Extracted DNA was pre-amplified using a pooled assay master mix containing forward and reverse
primers[32] with TaqMan® PreAmp Master Mix according to manufacturer‟s instructions (Life Technologies,
Grand Island, NY; Part. No. 4384256). Pre-amplified samples were genotyped as described [33]. Samples
were genotyped with both HRM and Taqman technologies
High Resolution Melting (HRM) Genotyping
Extracted DNA was pre-amplified using pooled forward and reverse primers for HRM drug resistance
assays, as described above[32], and assayed across 23 drug resistance loci[34]. In addition, we developed and
optimized HRM assays for the molecular barcode loci based on previous design criteria [34]. Samples were
PCR-amplified using a gradient thermocycler (Bio-Rad C1000), followed by HRM analysis on a LightScanner-
384 (BioFire Defense, Inc., Salt Lake City, UT) to optimize amplification conditions. All PCR amplifications
were performed using 2.0 μL Lightscanner Master Mix (BioFire Defense, Inc., Salt Lake City, UT), 2.5 μL of a
1:100 dilution of pre-amplified template, 0.5 μL primers and probes, and overlaid with 10 μL mineral oil.
Genomic DNA from cultured P. falciparum strains, with known genotype profiles representative of major and
minor alleles for the panel of SNPS in the molecular barcode, were used for assay validation and as genotyping
controls for all reaction plates. Optimal annealing temperatures were determined using gradient thermal cycling
for asymmetric PCR (10) in ratios of 5:1. Molecular barcode assays 10, 11, 13, 21, and 24 performed optimally
under asymmetric forward to reverse primer ratios of 5:1; all other assays required 1:5 primer asymmetry. Final
primer concentrations for a 5 μL total reaction volume were 0.5 μM excess primer, 0.1 μM limiting primer, and
0.4 μM of the 3‟-blocked probe. Amplification conditions were 95°C denaturation for 2 minutes, 50 cycles of
94°C for 5 seconds and 66°C for 30 seconds, and pre-melt cycle of 5 seconds each at 95°C and 37°C. The
change in fluorescence was recorded as samples were melted from 40 to 90°C on the LightScanner-384 and
analyzed using the Call-It module within the LightScanner software. Assay sequences are shown in
by guest on June 19, 2016http://jid.oxfordjournals.org/
Dow
nloaded from

Acce
pted M
anus
cript
13 Supplemental Table 1.
Statistical analysis
Samples were genotyped for 24 SNP markers in the molecular barcode using both TaqMan and HRM
assays, and SNP variant calls based on overall concordance between three to five replicates per sample. Assay
calls were imported into GenAlEx 6.5 for statistical and population genetic analysis[35]. Samples showing
strong fluorescence signals for both alleles in TaqMan assays or shared peaks in HRM assays were marked as
an “N” and treated as missing data in downstream genetic analysis. Two or more N‟s among the 24 SNPs
assayed were taken to indicate more than one P. falciparum genome present; Summary statistics were
calculated in GenAlEx 6.5 and genetic distance matrix was used to generate PCA plots using haploid genetic
distance between polymorphic alleles. When indicated, 40 random barcoded samples from Senegal were used
with Colombian and Panama populations to test for population structure in the presence of a group outside the
clade of interest.
Structure(v2.3.3)[36] analyses were run with 100,000 burn-in steps and followed by 10,000 iterations
and repeated 20 times. StructureHarvester[37] was used to identify the most likely number of subpopulations
(K) based on delta-K criterion,[38] and CLUMPP[39], and Python 2.7.3 were used for data visualization.
Phylogenetic trees were constructed using Bayesian Markov chain Monte Carlo (MCMC)[40]. TreeAnnotator
v1.7.5 and TreeStat v1.7.5 were used to generate a maximum clade credibility tree and the tree was visualized
with FIGTREE v1.3.1[41].
Acknowledgements.
We wish to acknowledge at Gorgas Memorial Institute of Health Studies in Panama: Nestor Sosa, Director, for
his logistical support and William Otero at Tropical Medicine Research for shipment of samples to HSPH.
Ruben Berrocal, Minister of SENACYT, Panama. Jorge Motta at SNI Panama, Ceferino Sanchez and Gines
Sanchez at TMR, Panama, Alan McGill at WRAIR, Silver Spring, MA, Steven Hoffman at SANARIA, Wilbur
Milhous at the USF for their encouragement and support, and Dan Neafsey for critical reading of the
by guest on June 19, 2016http://jid.oxfordjournals.org/
Dow
nloaded from

Acce
pted M
anus
cript
14 manuscript. Authors thank the participants of the community form malaria endemic regions of Panama and
Colombia.
Author contributions.
N.O.III provided samples, proposed the study and helped plan and design experiments, and analyzed and
interpreted the data and wrote the manuscript; N.K.B, planned and designed experiments, carried out
genotyping assays, analyzed and interpreted the data and wrote the manuscript. J.E.C collected samples and
participated in the planning and design of the study. A.M.S isolated and prepared P. falciparum field DNA
samples for shipping to HSPH and collected samples summary data. R.D converted the molecular barcode
assays to the HRM format, carried out quantification assays, analyzed data and reviewed the manuscript. W.W
and H-H.C. analyzed data and reviewed manuscript. E.J.H. optimized and carried out barcode assays. M.A.H.
and S.H. provided samples from Colombia and reviewed the manuscript. D.L.H, M.M., and D.F.W oversaw the
study planning and design; D.L.H. supervised the analysis and interpretation of the data. S.K.V advised N.O.III,
helped plan and design the experiments, carried out quantification assays, analyzed and interpreted data and
helped write the manuscript.
Footnotes
Funding.
This study was supported in part by a Doctoral fellowship to N.O.III from SENACYT-IFHARU, Panama and a
grant from the Ministerio de Economia y Finanzas de Panama-Gorgas Memorial Institute of Health Studies in
Panama. Colombian work was supported by NIAID/ICEMR program [grant number 5U19AI089702].
Genotyping data and analysis was supported by a grant from the Bill and Melinda Gates Foundation [grant
number OPP1053604].
Competing financial interests.
The authors declare no competing financial interests and do not have a commercial or other association that
might pose a conflict of interest.
by guest on June 19, 2016http://jid.oxfordjournals.org/
Dow
nloaded from
Acce
pted M
anus
cript
15 Previous meetings.
American Society of Tropical Medicine and Hygiene 62nd Annual Meeting; November 13-17, 2013; Marriott
Wardman Park Hotel, Washington, DC, USA.
ParaINsites: From Protozoa to worms; April 12, 2014; Harvard School of Public Health; Boston, MA, USA.
2014 Keystone Symposium: The Science of Malaria Eradication; February 2 – 7, 2014; Merida, Mexico.
Genomic Epidemiology of Malaria 2014; June 8 – 11, 2014; Wellcome Trust Genome Campus, Hinxton,
Cambridge, UK.
Corresponding author.
Sarah K. Volkman; 665 Huntington Avenue, Boston, MA 02115; [email protected]; Tel: 617-432-
1621; Fax: 617-432-4766
by guest on June 19, 2016http://jid.oxfordjournals.org/
Dow
nloaded from

Acce
pted M
anus
cript
16 References
1. Calzada JE, Samudio F, Bayard V, Obaldia N, de Mosca IB, Pascale JM. Revising antimalarial drug
policy in Central America: experience in Panama. Trans. R. Soc. Trop. Med. Hyg. 2008; 102:694–8.
2. Samudio F, Santamaria AM, Obaldia NIII, Pascale JM, Bayard V, Calzada JE. Prevalence of
Plasmodium Falciparum Mutations Associated With Antimalarial Drug Resistance During an Epidemic
in Kuna Yala, Panama, Central America. Am J Trop Med Hyg 2005; 73:839–841. Available at:
http://www.ajtmh.org.ezp-
prod1.hul.harvard.edu/content/73/5/839.abstract?ijkey=717f951009f58d860a9f4bae6f2fa3c6e525313c&k
eytype2=tf_ipsecsha. Accessed 9 September 2013.
3. Anderson TJ, Haubold B, Williams JT, et al. Microsatellite markers reveal a spectrum of population
structures in the malaria parasite Plasmodium falciparum. Mol. Biol. Evol. 2000; 17:1467–82. Available
at: http://www.ncbi.nlm.nih.gov/pubmed/11018154. Accessed 15 August 2013.
4. Volkman SK, Neafsey DE, Schaffner SF, Park DJ, Wirth DF. Harnessing genomics and genome biology
to understand malaria biology. Nat. Rev. Genet. 2012; 13:315–28. Available at:
http://www.ncbi.nlm.nih.gov/pubmed/22495435. Accessed 21 August 2013.
5. Daniels R, Chang H-H, Séne PD, et al. Genetic surveillance detects both clonal and epidemic
transmission of malaria following enhanced intervention in Senegal. PLoS One 2013; 8:e60780.
Available at:
http://www.pubmedcentral.nih.gov/articlerender.fcgi?artid=3617153&tool=pmcentrez&rendertype=abstr
act. Accessed 16 June 2013.
6. Volkman SK, Ndiaye D, Diakite M, et al. Application of genomics to field investigations of malaria by
the international centers of excellence for malaria research. Acta Trop. 2012; 121:324–32. Available at:
http://www.pubmedcentral.nih.gov/articlerender.fcgi?artid=3294120&tool=pmcentrez&rendertype=abstr
act. Accessed 22 August 2013.
7. Echeverry DF, Nair S, Osorio L, Menon S, Murillo C, Anderson TJC. Long term persistence of clonal
malaria parasite Plasmodium falciparum lineages in the Colombian Pacific region. BMC Genet. 2013;
by guest on June 19, 2016http://jid.oxfordjournals.org/
Dow
nloaded from

Acce
pted M
anus
cript
17 14:2. Available at:
http://www.pubmedcentral.nih.gov/articlerender.fcgi?artid=3563461&tool=pmcentrez&rendertype=abstr
act. Accessed 23 April 2013.
8. Urdaneta L, Plowe C, Goldman I, Lal AA. Point mutations in dihydrofolate reductase and
dihydropteroate synthase genes of Plasmodium falciparum isolates from Venezuela. Am. J. Trop. Med.
Hyg. 1999; 61:457–62. Available at: http://www.ncbi.nlm.nih.gov/pubmed/10497990. Accessed 21
August 2013.
9. Griffing SM, Mixson-Hayden T, Sridaran S, et al. South American Plasmodium falciparum after the
malaria eradication era: clonal population expansion and survival of the fittest hybrids. PLoS One 2011;
6:e23486. Available at:
http://www.pubmedcentral.nih.gov/articlerender.fcgi?artid=3174945&tool=pmcentrez&rendertype=abstr
act. Accessed 15 August 2013.
10. Ariey F, Chalvet W, Hommel D, et al. Plasmodium falciparum parasites in French Guiana: limited
genetic diversity and high selfing rate. Am. J. Trop. Med. Hyg. 1999; 61:978–85. Available at:
http://www.ncbi.nlm.nih.gov/pubmed/10674682. Accessed 15 August 2013.
11. Cortese JF, Caraballo A, Contreras CE, Plowe C V. Origin and dissemination of Plasmodium falciparum
drug-resistance mutations in South America. J. Infect. Dis. 2002; 186:999–1006. Available at:
http://www.ncbi.nlm.nih.gov/pubmed/12232841. Accessed 15 August 2013.
12. Ferreira MU, Liu Q, Kaneko O, et al. Allelic diversity at the merozoite surface protein-1 locus of
Plasmodium falciparum in clinical isolates from the southwestern Brazilian Amazon. Am. J. Trop. Med.
Hyg. 1998; 59:474–80. Available at: http://www.ncbi.nlm.nih.gov/pubmed/9749647. Accessed 21
August 2013.
13. Griffing S, Syphard L, Sridaran S, et al. pfmdr1 amplification and fixation of pfcrt chloroquine resistance
alleles in Plasmodium falciparum in Venezuela. Antimicrob. Agents Chemother. 2010; 54:1572–9.
Available at:
by guest on June 19, 2016http://jid.oxfordjournals.org/
Dow
nloaded from

Acce
pted M
anus
cript
18 http://www.pubmedcentral.nih.gov/articlerender.fcgi?artid=2849383&tool=pmcentrez&rendertype=abstr
act. Accessed 15 August 2013.
14. Machado RLD, Povoa MM, Calvosa VSP, et al. Genetic structure of Plasmodium falciparum populations
in the Brazilian Amazon region. J. Infect. Dis. 2004; 190:1547–55. Available at:
http://www.ncbi.nlm.nih.gov/pubmed/15478058. Accessed 21 August 2013.
15. Mehlotra RK, Mattera G, Bockarie MJ, et al. Discordant patterns of genetic variation at two chloroquine
resistance loci in worldwide populations of the malaria parasite Plasmodium falciparum. Antimicrob.
Agents Chemother. 2008; 52:2212–22. Available at: /pmc/articles/PMC2415780/?report=abstract.
Accessed 16 August 2013.
16. Patel JC, Taylor SM, Juliao PC, et al. Genetic Evidence of Importation of Drug-Resistant Plasmodium
falciparum to Guatemala from the Democratic Republic of the Congo. Emerg. Infect. Dis. 2014; 20:932–
40. Available at:
http://www.pubmedcentral.nih.gov/articlerender.fcgi?artid=4036788&tool=pmcentrez&rendertype=abstr
act. Accessed 19 September 2014.
17. Albrecht L, Castiñeiras C, Carvalho BO, et al. The South American Plasmodium falciparum var gene
repertoire is limited, highly shared and possibly lacks several antigenic types. Gene 2010; 453:37–44.
Available at: http://www.ncbi.nlm.nih.gov/pubmed/20079817. Accessed 16 August 2013.
18. Herrera S, Quiñones ML, Quintero JP, et al. Prospects for malaria elimination in non-Amazonian regions
of Latin America. Acta Trop. 2012; 121:315–23. Available at:
http://www.pubmedcentral.nih.gov/articlerender.fcgi?artid=3224666&tool=pmcentrez&rendertype=abstr
act. Accessed 21 August 2013.
19. Zalis MG, Pang L, Silveira MS, Milhous WK, Wirth DF. Characterization of Plasmodium falciparum
isolated from the Amazon region of Brazil: evidence for quinine resistance. Am. J. Trop. Med. Hyg.
1998; 58:630–7. Available at: http://www.ncbi.nlm.nih.gov/pubmed/9598453. Accessed 8 September
2013.
by guest on June 19, 2016http://jid.oxfordjournals.org/
Dow
nloaded from

Acce
pted M
anus
cript
19 20. Contreras CE, Cortese JF, Caraballo A, Plowe C V. Genetics of drug-resistant Plasmodium falciparum
malaria in the Venezuelan state of Bolivar. Am. J. Trop. Med. Hyg. 2002; 67:400–5. Available at:
http://www.ncbi.nlm.nih.gov/pubmed/12452494. Accessed 8 September 2013.
21. Aramburú Guarda J, Ramal Asayag C, Witzig R. Malaria reemergence in the Peruvian Amazon region.
Emerg. Infect. Dis. 5:209–15. Available at: /pmc/articles/PMC2640690/?report=abstract. Accessed 21
August 2013.
22. Mc Donald Posso AJ, Montenegro G JA, Cruz CE, Moreno de Rivera AL, Cumbrera A.
Sociodemographic variables for predicting diabetes in panama. Diabetes Care 2013; 36:e118. Available
at: http://care.diabetesjournals.org.ezp-prod1.hul.harvard.edu/content/36/8/e118.long. Accessed 9
September 2013.
23. Loaiza JR, Bermingham E, Scott ME, Rovira JR, Conn JE. Species composition and distribution of adult
Anopheles (Diptera: Culicidae) in Panama. J. Med. Entomol. 2008; 45:841–51. Available at:
http://www.pubmedcentral.nih.gov/articlerender.fcgi?artid=2874935&tool=pmcentrez&rendertype=abstr
act. Accessed 22 August 2013.
24. Anderson TJC, Nair S, Qin H, et al. Are transporter genes other than the chloroquine resistance locus
(pfcrt) and multidrug resistance gene (pfmdr) associated with antimalarial drug resistance? Antimicrob.
Agents Chemother. 2005; 49:2180–8. Available at: http://aac.asm.org.ezp-
prod1.hul.harvard.edu/content/49/6/2180.long#ref-20. Accessed 9 September 2013.
25. Price RN, Uhlemann A-C, Brockman A, et al. Mefloquine resistance in Plasmodium falciparum and
increased pfmdr1 gene copy number. Lancet 364:438–47. Available at:
http://www.ncbi.nlm.nih.gov/pubmed/15288742. Accessed 9 September 2013.
26. Price RN, Cassar C, Brockman A, et al. The pfmdr1 Gene Is Associated with a Multidrug-Resistant
Phenotype in Plasmodium falciparum from the Western Border of Thailand. Antimicrob. Agents
Chemother. 1999; 43:2943–2949. Available at: http://aac.asm.org.ezp-
prod1.hul.harvard.edu/content/43/12/2943.abstract?ijkey=2350ec24c41f29527a97d0dadf133d861a78285
1&keytype2=tf_ipsecsha. Accessed 9 September 2013.
by guest on June 19, 2016http://jid.oxfordjournals.org/
Dow
nloaded from
Acce
pted M
anus
cript
20 27. Pickard AL, Wongsrichanalai C, Purfield A, et al. Resistance to Antimalarials in Southeast Asia and
Genetic Polymorphisms in pfmdr1. Antimicrob. Agents Chemother. 2003; 47:2418–2423. Available at:
http://aac.asm.org.ezp-
prod1.hul.harvard.edu/content/47/8/2418.abstract?ijkey=5721d8f2074693a1543f4da8254fd48b255b37ea
&keytype2=tf_ipsecsha. Accessed 9 September 2013.
28. Bacon DJ, McCollum AM, Griffing SM, et al. Dynamics of malaria drug resistance patterns in the
Amazon basin region following changes in Peruvian national treatment policy for uncomplicated malaria.
Antimicrob. Agents Chemother. 2009; 53:2042–51. Available at:
http://www.pubmedcentral.nih.gov/articlerender.fcgi?artid=2681566&tool=pmcentrez&rendertype=abstr
act. Accessed 8 September 2013.
29. Mehlotra RK, Mattera G, Bockarie MJ, et al. Discordant patterns of genetic variation at two chloroquine
resistance loci in worldwide populations of the malaria parasite Plasmodium falciparum. Antimicrob.
Agents Chemother. 2008; 52:2212–22. Available at:
http://www.pubmedcentral.nih.gov/articlerender.fcgi?artid=2415780&tool=pmcentrez&rendertype=abstr
act. Accessed 16 August 2013.
30. Dharia N V, Plouffe D, Bopp SER, et al. Genome scanning of Amazonian Plasmodium falciparum shows
subtelomeric instability and clindamycin-resistant parasites. Genome Res. 2010; 20:1534–44. Available
at:
http://www.pubmedcentral.nih.gov/articlerender.fcgi?artid=2963817&tool=pmcentrez&rendertype=abstr
act. Accessed 18 August 2013.
31. Miotto O, Almagro-Garcia J, Manske M, et al. Multiple populations of artemisinin-resistant Plasmodium
falciparum in Cambodia. Nat. Genet. 2013; 45:648–55. Available at:
http://www.ncbi.nlm.nih.gov/pubmed/23624527. Accessed 6 August 2013.
32. Mharakurwa S, Daniels R, Scott A, Wirth DF, Thuma P, Volkman SK. Pre-amplification methods for
tracking low-grade Plasmodium falciparum populations during scaled-up interventions in Southern
by guest on June 19, 2016http://jid.oxfordjournals.org/
Dow
nloaded from

Acce
pted M
anus
cript
21 Zambia. Malar. J. 2014; 13:89. Available at: http://www.ncbi.nlm.nih.gov/pubmed/24618119. Accessed
26 March 2014.
33. Daniels R, Volkman SK, Milner DA, et al. A general SNP-based molecular barcode for Plasmodium
falciparum identification and tracking. Malar. J. 2008; 7:223. Available at:
http://www.pubmedcentral.nih.gov/articlerender.fcgi?artid=2584654&tool=pmcentrez&rendertype=abstr
act. Accessed 9 August 2013.
34. Daniels R, Ndiaye D, Wall M, et al. Rapid, field-deployable method for genotyping and discovery of
single-nucleotide polymorphisms associated with drug resistance in Plasmodium falciparum. Antimicrob.
Agents Chemother. 2012; 56:2976–86. Available at:
http://www.pubmedcentral.nih.gov/articlerender.fcgi?artid=3370755&tool=pmcentrez&rendertype=abstr
act. Accessed 8 August 2013.
35. Peakall R, Smouse PE. GenAlEx 6.5: genetic analysis in Excel. Population genetic software for teaching
and research--an update. Bioinformatics 2012; 28:2537–9. Available at:
http://www.pubmedcentral.nih.gov/articlerender.fcgi?artid=3463245&tool=pmcentrez&rendertype=abstr
act. Accessed 6 August 2013.
36. Pritchard JK, Stephens M, Donnelly P. Inference of population structure using multilocus genotype data.
Genetics 2000; 155:945–59. Available at:
http://www.pubmedcentral.nih.gov/articlerender.fcgi?artid=1461096&tool=pmcentrez&rendertype=abstr
act. Accessed 12 December 2013.
37. Earl DA, vonHoldt BM. STRUCTURE HARVESTER: a website and program for visualizing
STRUCTURE output and implementing the Evanno method. Conserv. Genet. Resour. 2011; 4:359–361.
Available at: http://link.springer.com/10.1007/s12686-011-9548-7. Accessed 9 August 2013.
38. Evanno G, Regnaut S, Goudet J. Detecting the number of clusters of individuals using the software
STRUCTURE: a simulation study. Mol. Ecol. 2005; 14:2611–20. Available at:
http://www.ncbi.nlm.nih.gov/pubmed/15969739. Accessed 7 August 2013.
by guest on June 19, 2016http://jid.oxfordjournals.org/
Dow
nloaded from

Acce
pted M
anus
cript
22 39. Jakobsson M, Rosenberg NA. CLUMPP: a cluster matching and permutation program for dealing with
label switching and multimodality in analysis of population structure. Bioinformatics 2007; 23:1801–6.
Available at: http://bioinformatics.oxfordjournals.org/content/23/14/1801.full. Accessed 11 December
2013.
40. Drummond AJ, Suchard MA, Xie D, Rambaut A. Bayesian phylogenetics with BEAUti and the BEAST
1.7. Mol. Biol. Evol. 2012; 29:1969–73. Available at:
http://www.pubmedcentral.nih.gov/articlerender.fcgi?artid=3408070&tool=pmcentrez&rendertype=abstr
act. Accessed 7 August 2013.
41. FigTree. Available at: http://tree.bio.ed.ac.uk/software/figtree/. Accessed 22 August 2013.
by guest on June 19, 2016http://jid.oxfordjournals.org/
Dow
nloaded from

Acce
pted M
anus
cript
23 Figure Legends
Figure 1. Map of Panama with regional locations by group of Plasmodium falciparum isolates collected
during 2003-2008. A map of eastern Panama showing study sites color coded by clonal groups identified by
the molecular barcode (Group I = blue, Group II = green, Group III = red, and Colombian = orange) is shown
with Province and Country boundaries (gray, dashed lines). The diameter of the circle corresponds to the
number of samples collected at each site. The base map for this figure was generated using Python 2.7.3 using
„shapefiles‟ freely available at (http://www.diva-gis.org/gdata).
Figure 2. Epidemiologic and Genotyping data for Panamanian and Colombian isolates. Isolate sample
names are color-coded by collection site (left: Darien = purple; Panamá = Green; Kuna Yala = Blue) and
epidemiologic data is shown with genotypes for each sample. Groups [I (blue), II (green), III (red), and
Colombia (orange)] are indicated on the right.
Figure 3. Membership fraction plot of eastern Panamanian and Colombian sub-populations.
Structure analysis showing the K=2 (A) and K=5 (B) clustering. The genotype of each sample is represented by
a single vertical line partitioned into segments in proportion of the estimated membership in the different
subpopulations. The upper most level of structure among Panamanian isolates, or the most likely number of
clusters (K = 2, A), and second most likely number of clusters (K=5, B) are shown. The sample name is color-
coded by region (Darien = purple; Panamá = Green; Kuna Yala = Blue; Coastal = Red; Colombia = Orange).
Figure 4. Phylogenetic tree of Plasmodium falciparum isolates from eastern Panama and Colombia.
Maximum clade credibility tree of eastern Panamanian and Colombian isolates is shown. Isolates are color
coded at terminal branch arms by study site and color coded (cartoon triangle) to indicate Group (Groups [I
(blue), II (green), III (red), and Colombia (orange)]. Branch nodes are labeled by the median-height at each
node for re-calculated genetic distances from 10,000 bootstrap replicates.
Figure 5. Principal component analysis of Plasmodium falciparum Panamanian isolates. Two-
dimensional plots of PCA are shown using 24 alleles of the molecular barcode for the Panamanian and
by guest on June 19, 2016http://jid.oxfordjournals.org/
Dow
nloaded from

Acce
pted M
anus
cript
24 Colombian isolates alone (A) with PC1 explaining 39% of variance and PC2 explaining 18% of the variance, or
with Senegalese out-group (B) with PC1 explaining 26% of variance and PC2 explaining 14% of the variance.
Samples are color coded by group (Group I = blue, Group II = green, Group III = red, Colombian = orange,
Senegalese = gray).
by guest on June 19, 2016http://jid.oxfordjournals.org/
Dow
nloaded from

Acce
pted M
anus
cript
25
by guest on June 19, 2016http://jid.oxfordjournals.org/
Dow
nloaded from

Acce
pted M
anus
cript
26
by guest on June 19, 2016http://jid.oxfordjournals.org/
Dow
nloaded from

Acce
pted M
anus
cript
27
by guest on June 19, 2016http://jid.oxfordjournals.org/
Dow
nloaded from

Acce
pted M
anus
cript
28
by guest on June 19, 2016http://jid.oxfordjournals.org/
Dow
nloaded from