Climate Change and the Pacific Food System
19
PACIFIC ECONOMIC COOPERATION COUNCIL PACIFIC FOOD SYSTEM OUTLOOK 2008-2009 Climate Change and the Food SyStem
-
Upload
independent -
Category
Documents
-
view
0 -
download
0
Transcript of Climate Change and the Pacific Food System
P a c i f i c E c o n o m i c c o o P E r a t i o n c o u n c i l
P a c i f i c f o o d S y S t E m o u t l o o k 2 0 0 8 - 2 0 0 9
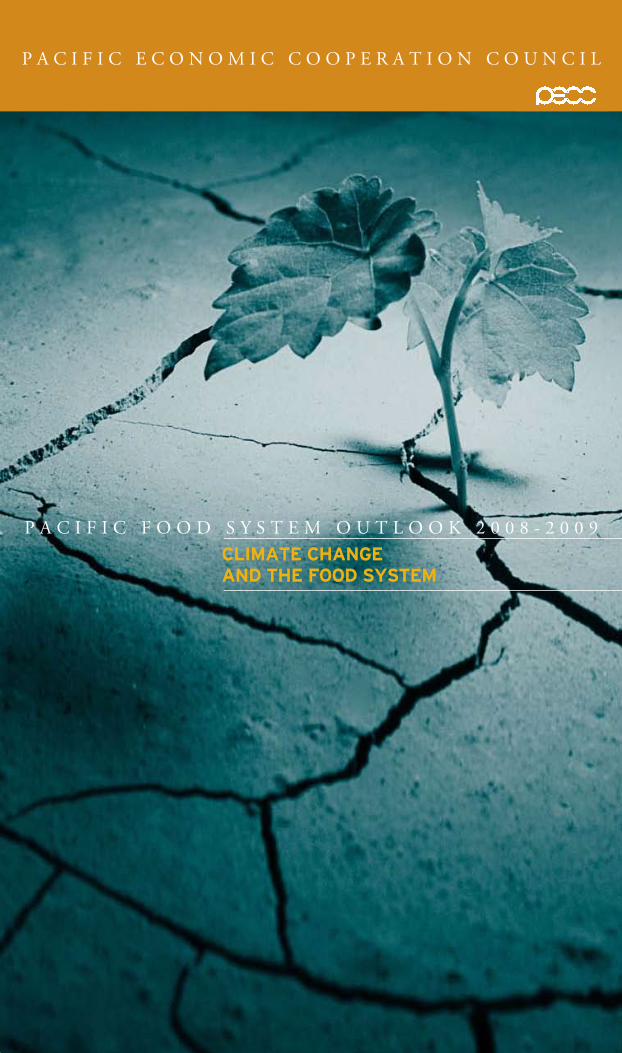
Climate Change and the Food SyStem

P a c i f i c f o o d S y S t E m o u t l o o k 2 0 0 8 - 2 0 0 9
Climate Change and the Food SyStem
P a c i f i c E c o n o m i c c o o P E r a t i o n c o u n c i l

P a c i f i c f o o d S y S t e m o u t l o o k 2 0 0 8 – 2 0 0 9 1
Foreword 2
Coordinators and Forecasting Panel 3
greenhouse gases, Climate Change, and agriculture 4
agricultural Productivity in the PeCC region, 1980-2008 8
Climate Change Projections and the PeCC Food System 11
agriculturalproductivityimpactsvary 11
foodinsecurityincreases 15
Sealevelriseaffectsfoodsupplychains 15
Public and Private Sector Responses 16
the Role of models in assessing Climate Change impacts 17
Biofuels: a Viable ghg mitigation Strategy? 19
implications for decision makers 20
References 24
Sponsor Profiles 27
PeCC members 28
ContentS
iSBN:978-981-230-891-7
Pacific Food System Outlook 2008-2009S P o n S o r S
the Pacific Food System Outlook extends thanks to its sponsors. for information about the activities of our sponsors, see page 28.
first published in Singapore in 2008 byiSEaS Publishinginstitute of Southeast asian Studies30 Heng mui keng terracePasir PanjangSingapore 119614E-mail: [email protected]: http://bookshop.iseas.edu.sg
and
Pacific Economic cooperation council (PEcc)PEcc international Secretariat29 Heng mui keng terrace#07-01, Block aSingapore 119620E-mail: [email protected]
all rights reserved. no part of this publication may be reproduced, stored in a retrieval system, or transmitted in any form or by any means, electronic, mechanical, photocopying, recording or otherwise, without the prior permission of the institute of Southeast asian Studies.
©2008 Pacific Economic cooperation council
The responsibility for facts and opinions in this publication rests exclusively with the authors and their interpretations do not necessarily reflect the views or the policy of the publishers or their supporters.
ISEAS Library Cataloguing-in-Publication Data
Pacific food system outlook. annual. 2001/2002- Each issue has a distinctive title.
Vols. for <2006/2007-> published by iSEaS and Pacific Economic cooperation council.continues: Pacific food outlook
1. food industry and trade—asia—Periodicals. 2. food industry and trade—Pacific area—Periodicals. 3. food prices—asia—Periodicals. 4. food prices—Pacific area—Periodicals. 5. agriculture and state—asia—Periodicals. 6. agriculture and state—Pacific area—Periodicals. i. Pacific Economic cooperation council. ii. institute of Southeast asian Studies. iii. title: Pacific food outlookHd9016 a82P11 2008
iSBn 978-981-230-891-7 (2008-2009 : soft cover)iSBn 978-981-230-892-4 (2008-2009 : Pdf)
Printed in Singapore by utopia Press Pte ltd
P a c i f i c f o o d S y S t e m o u t l o o k 2 0 0 8 – 2 0 0 9 32 P a c i f i c f o o d S y S t e m o u t l o o k 2 0 0 8 - 2 0 0 9
this year’s report focuses on climate change and its ramifications for the asia-Pacific food system, argu-
ably one of the most affected sectors in the region’s economy. the report identifies the potential pub-
lic and private sector responses to the daunting future challenges of this issue, the most complex of the
issues we have addressed in the 12-year history of the Pacific food System outlook (PfSo).
the discourse on climate change has changed significantly over the past 10 years, from whether or not cli-
mate change is taking place to what can and should be done about it.
Public and private sector decision makers around the region need the best possible information if they
are to make informed decisions about this issue. We examine recent evidence of climate change; the potential
longer-term impacts on agriculture, food security, and the broader food system; and the nature of adaptive and
mitigation measures the government and private sectors should consider to maximize opportunities and mini-
mize potential adverse economic impacts.
undertaking analysis of climate change again puts the PfSo front and center on a key issue that has
implications for the region’s food system. our last report on rural development, as well as previous reports on
infrastructure and biofuels (www.pecc.org/food), recently caught the attention of PEcc leadership. We were
invited to brief the PEcc Standing committee meeting in Bangkok, July 25-26, 2008, on our project and
future plans. don Gunasekera, our australian representative, participated in a special session at that meeting to
address the timely issue of global food price inflation.
this year’s meeting was held at the East-West center in Honolulu, Hawaii. We are grateful for the very sub-
stantive contributions of Barry Smit of the university of Guelph, don Gunsasekera of the australian Bureau of
agricultural and resource Economics, ching-cheng chang of taipei’s academia Sinica, and Jan lewandrowski
of the u.S. department of agriculture climate change Program office. We are also grateful to nancy lewis,
director of research, East-West center, for her welcoming comments and participation in our opening session, to
June kuramoto for her excellent administrative support for our meeting, and to charles morrison for making the
resources of the center available to us. We would like to acknowledge and thank Betty ip, director of Public and
Business affairs, PEcc international Secretariat, for her tireless efforts in supporting our project and administer-
ing our part of the PEcc Web site. our thanks are also extended to the institute of Southeast asian Studies in
Singapore for publishing and disseminating our report throughout the asia-Pacific region.
We are grateful to the team of individual economists and agri-food specialists representing the participat-
ing economies of the PEcc region for their contributions. Special thanks to Brad Gilmour of agriculture and
agrifood canada for his rigorous review of early drafts of this report. We appreciate the work of Joe yacinski
and carol Hardy of yacinksi design; Jane Sapp, for editorial review; and mary anne normile and cheryl
christensen of ErS for their important support for this project. as in previous years, the financial support of
farm foundation and uSda’s Economic research Service, as well as the support from the country PEcc
committees, has made this unique multinational and multi-disciplinary project a continuing reality.
FoReWoRd
Walter J. armbruster
President Emeritus, farm foundation
chairman, Pacific food System outlook, PEcc
William t. coyle
Senior Economist, Economic research
Service, uSda
Senior coordinator, Pacific food System
outlook, PEccnovember 2008
PeCC CooRdinatoRS
Walter J. Armbrusterchairman Pacific Food System Outlook President Emeritusfarm foundation [email protected]
William T. CoyleSenior coordinator, Pacific Food
System OutlookSenior Economist, market and
trade Economics divisionEconomic research Serviceu.S. department of [email protected]
aUStRalia
Don Gunasekerachief Economistaustralian Bureau of agricultural
and resource [email protected]
Canada
Brad Gilmourresearch and analysis directorateagriculture and agrifood [email protected]
Barry SmitProfessordepartment of Geographyuniversity of Guelph [email protected]
indoneSia
Ronnie S. Natawidjajadirector center for agricultural Policy and
agribusiness Studies (caPaS) Padjadjaran university, Bandung [email protected]
KoRea
Chang-Gil KimSenior fellowkorea rural Economic [email protected]
neW Zealand
Peter Baileyresearch Economist new Zealand institute of
Economic research (nZiEr)[email protected]
ChineSe taiPei
Ching-Cheng Changresearch fellow institute of Economicsacademia Sinicaemily@ econ.sinica.edu.tw
Pei-Ru Chenassistant research fellowdivision of international affairstaiwan institute of Economic
thailand
Ruangrai Tokrisnaassociate Professordepartment of agricultural and
resource Economicsfaculty of Economics kasetsart university, Bangkok [email protected]
United StateS
Robbin Shoemakerassociate directorresource & rural Economics
divisionEconomic research Serviceu.S. department of [email protected]
Jan LewandrowskiGlobal change Program officeoffice of chief Economistu.S. department of [email protected]
CooRdinatoRS and FoReCaSting Panel
4 P a c i f i c f o o d S y S t e m o u t l o o k 2 0 0 8 – 2 0 0 9 P a c i f i c f o o d S y S t e m o u t l o o k 2 0 0 8 – 2 0 0 9 5
the fourth assessment report of the international Panel on climate change
(iPcc, 2007), the recent series of droughts in australia, the increased frequency of extreme weather events in other parts of the region, and rising food prices in 2006-08 all underscore broad concerns about the earth’s chang-ing climate and the ramifications of these changes for the PEcc region’s economy.
of all economic sectors, climate change has its most sig-
nificant impacts on agriculture because of its broad geographic dispersion and obvious close dependence on climate and envi-ronmental factors. rising average temperatures, changes in precipi-tation patterns, and other weather changes, are having and will con-tinue to have a variety of impacts, some positive and others negative, on agricultural productivity in the PEcc region. these impacts will vary by geographic location, the mix of agricultural activities, and the extent of private and public sector adjustments.
the short- and long-term impacts of climate change on the asian-Pacific food system
and possible responses are the primary focus of this report. the debate no longer centers on whether or not climate change is underway. the discussion here centers on where and how climate change manifests itself in the region’s food system with a view to better informing strate-gies for adaptation, adjustment, and mitigation. the report draws on the two days of discussion at the 12th annual Pacific food System outlook meeting at the East-West center in Honolulu in
September 2008. the report also draws on numerous other reports based on research from universi-ties, international and national governmental agencies, and non-governmental organizations.
greenhouse gases, Climate Change, and agriculture
the intergovernmental Panel on climate change (iPcc) 2007 report states that warming of the climate system is unequivocal and “very likely” (90 percent prob-ability) to be caused by human activities, particularly those that emit greenhouse gases (GHGs). among the GHGs, carbon
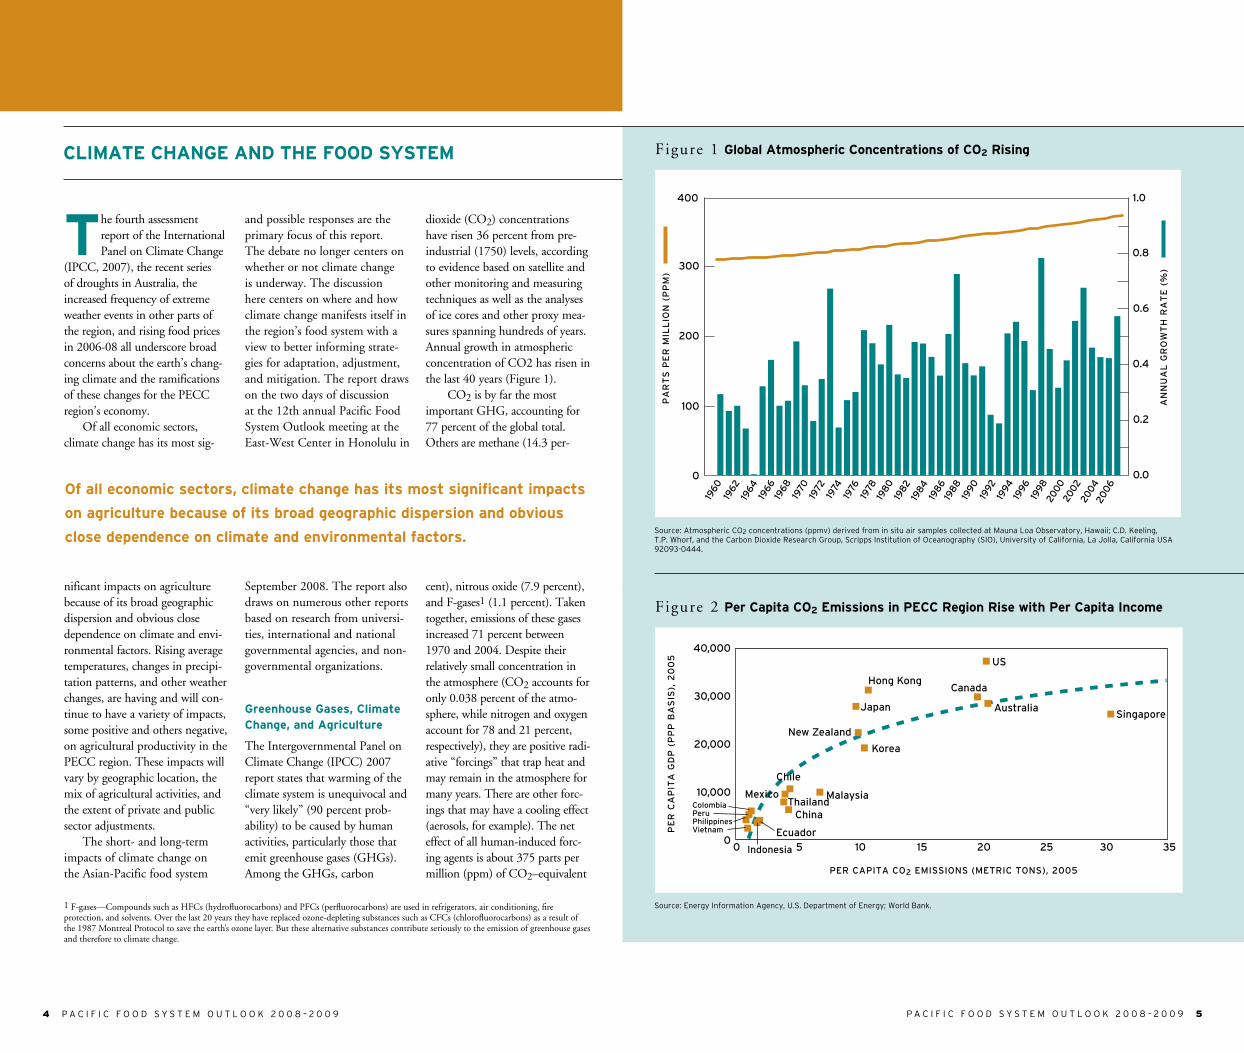
dioxide (co2) concentrations have risen 36 percent from pre-industrial (1750) levels, according to evidence based on satellite and other monitoring and measuring techniques as well as the analyses of ice cores and other proxy mea-sures spanning hundreds of years. annual growth in atmospheric concentration of co2 has risen in the last 40 years (figure 1).
co2 is by far the most important GHG, accounting for 77 percent of the global total. others are methane (14.3 per-
cent), nitrous oxide (7.9 percent), and f-gases1 (1.1 percent). taken together, emissions of these gases increased 71 percent between 1970 and 2004. despite their relatively small concentration in the atmosphere (co2 accounts for only 0.038 percent of the atmo-sphere, while nitrogen and oxygen account for 78 and 21 percent, respectively), they are positive radi-ative “forcings” that trap heat and may remain in the atmosphere for many years. there are other forc-ings that may have a cooling effect (aerosols, for example). the net effect of all human-induced forc-ing agents is about 375 parts per million (ppm) of co2–equivalent
Climate Change and the Food SyStem
of all economic sectors, climate change has its most significant impacts
on agriculture because of its broad geographic dispersion and obvious
close dependence on climate and environmental factors.
figure 1 global atmospheric Concentrations of Co2 Rising
0.0
0.2
0.4
0.6
0.8
1.0
0
100
200
300
400
Source:atmosphericco2concentrations(ppmv)derivedfrominsituairsamplescollectedatmaunaloaobservatory,Hawaii;c.d.keeling,t.P.Whorf,andthecarbondioxideResearchGroup,Scrippsinstitutionofoceanography(Sio),universityofcalifornia,laJolla,californiauSa92093-0444.
an
nu
al
gr
ow
th
ra
te
(%
)
pa
rt
s p
er
mil
lio
n (
pp
m)
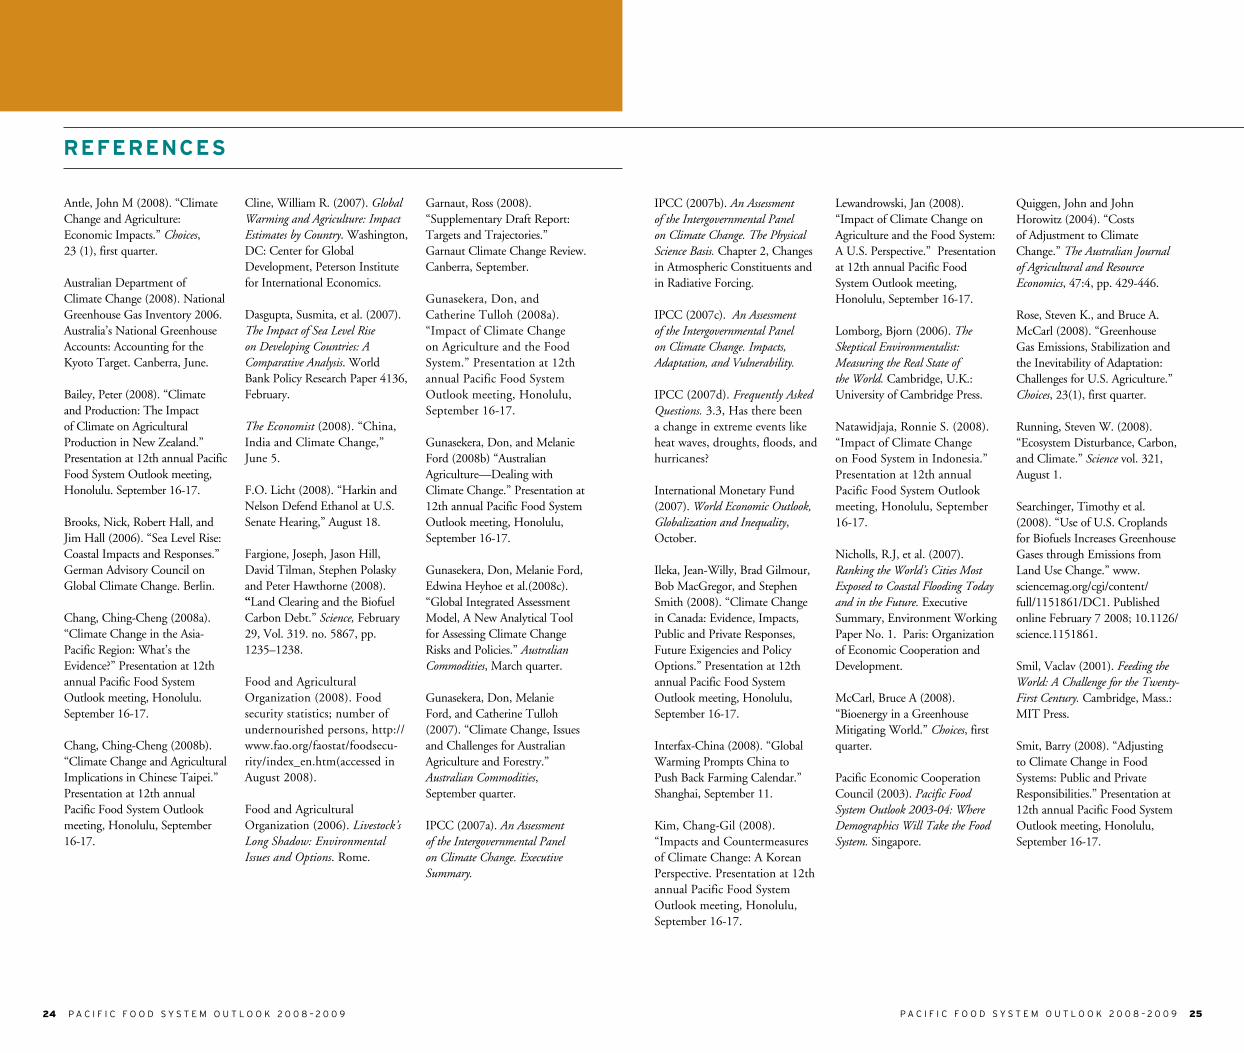
figure 2 Per Capita Co2 emissions in PeCC Region Rise with Per Capita income
colombiaperuphilippinesvietnam
australia
canada
us
hong Kong
Japan
new Zealand
Korea
malaysiathailand
china
chile
mexico
ecuador
indonesia
singapore
0 5 10 15 20 25 30 35
40,000
30,000
20,000
10,000
0
Source:energyinformationagency,u.S.departmentofenergy;WorldBank.
pe
r c
ap
ita
gd
p (
pp
p b
as
is),
20
05
per capita co2 emissions (metric tons), 2005
1 f-gases—compounds such as Hfcs (hydrofluorocarbons) and Pfcs (perfluorocarbons) are used in refrigerators, air conditioning, fire protection, and solvents. over the last 20 years they have replaced ozone-depleting substances such as cfcs (chlorofluorocarbons) as a result of the 1987 montreal Protocol to save the earth’s ozone layer. But these alternative substances contribute seriously to the emission of greenhouse gases and therefore to climate change.

6 P a c i f i c f o o d S y S t e m o u t l o o k 2 0 0 8 – 2 0 0 9
because of a warmer winter, a cooler summer, a decline in fossil fuel consumption, and a rise in renewable energy use. By sec-tor, the biggest GHG emitters in the united States in 2006 were industry (29 percent) and transportation (28), followed by commercial (17), residential (17), and agricultural (8). total u.S. emissions were offset by 12.5 percent from carbon sequestra-tion by net additions to various co2-absorbing biomass (u.S. EPa, 2008).
agriculture’s global contribu-tion to GHG emissions is 13.5 percent (figure 5) (iPcc, 2007a). in the PEcc region, agriculture in australia and the united States accounts for 16 percent (australian department of climate change, 2008) and 8 percent (u.S. EPa,
australia, and Singapore) (figure 3). the rate of growth in co2 emissions in the last 10 years was most rapid in china, malaysia, and Vietnam, reflecting their recent rapid economic growth, and slowest in colombia, the u.S., and Japan (figure 4). china alone contributed more than 50 percent and the u.S. 16 percent in total growth in the PEcc region’s co2 emissions in that period. china emerged in 2007 as the world’s largest GHG emitter. indonesia ranks fourth after china, the u.S., and the E.u. when the impact of deforestation is fully accounted (World Bank, 2007).
Emissions in most developed economies have stabilized at high levels. in the united States, emissions declined 1.1 percent in 2006 compared with 2005
with a net positive, or warming effect (iPcca, 2007). Water vapor is also a GHG and, despite its far greater concentration than co2, is considered part of the planet’s feedback system, rising or falling with the temperature, thus acting as an amplifier of co2-driven warming.
Since energy use is at the heart of economic growth, it is not surprising that co2 emissions from fossil fuel combustion are highly correlated with income. this is the case in the PEcc region, as is shown in figure 2. annual co2 emissions range from 1 ton per capita per year for the lowest-income economies in the region (Philippines, Vietnam, Peru, and indonesia) to more than 20 tons per capita in the high-income economies (canada, u.S.,
P a c i f i c f o o d S y S t e m o u t l o o k 2 0 0 8 – 2 0 0 9 7
Climate Change and the Food SyStem
figure 3 Per Capita Co2 emissions Vary across the Region
0
5
10
15
20
25
30
35
Sing
apor
eA
ustr
alia
Uni
ted
Stat
esCa
nada
Chin
ese
Taip
ei
Hon
g Ko
ng C
hina
Japa
n
Chin
a
New
Zea
land
Mal
aysi
a
Chile
Mex
ico
Thai
land
Ecua
dor
Indo
nesi
aCo
lom
bia
Peru
Vie
tnam
Phili
ppin
es
Kore
a
30.3
20.2 20.1 19.2
12.510.9 10.3 9.7 9.4
6.5
4.1 3.8 3.74.1
1.8 1.6 1.4 1.1 1.0 0.9
Source:energyinformationagency,u.S.departmentofenergy;dataforco2emissionsonlyfromburningfossilfuels(oil,coal,andnaturalgas),notfromdeforestationorothersources.
me
tr
ic t
on
s p
er
ca
pit
a,
20
05
figure 4 Co2 emissions growing more Rapidly in low- and middle-income asian Countries
0 20 60 80 120 14040 100
colombiaunited states
Japanperu
mexiconew Zealand
ecuadorcanada
Korea, southphilippines
australiasingapore
thailandindonesia
chilehong Kong
chinese taipeichina
malaysiavietnam
4.5 10.7 13.4 18.2 19.0 21.3 22.9 23.4 30.7 31.9 34.9 41.8 50.5 54.7 54.7 58.3 58.5 65.0 70.0 121.1
Source:energyinformationagency,u.S.departmentofenergy,http://www.eia.doe.gov/oiaf/1605/ggrpt/excel/historical_co2.xls;dataforco2emissionsonlyfromburningfossilfuels(oil,coal,andnaturalgas),notfromdeforestationorothersources.
percent change, 2003-05 avg compared to 1994-96 avg
figure 5 agriculture is a Significant Contributor of ghg emissions
0
1,000
2,000
3,000
4,000
5,000
6,000
7,000
8,000
united states australia 2006 2005
7,260.0*
521.9
Source:Gunasekera(2007),iPcc(2007a),u.S.ePa(2008).
global
mil
lio
n m
et
ric
to
ns
of
co
2 e
qu
iva
le
nt
agri 13.5%
forestry 17.4%
industry 19.4%
residential/commercial 7.9%transport 13.1%
energy supply 25.9%
waste and wastewater 2.8%
agri 8.0%
other 92.0%
agri 16.3%
other 83.7%
*--gross emissions. net emissions are less 830 million tons of co2 equivalents from terrestrial carbon sequestration.
australia u.s.
other agriculture

8 P a c i f i c f o o d S y S t e m o u t l o o k 2 0 0 8 – 2 0 0 9 P a c i f i c f o o d S y S t e m o u t l o o k 2 0 0 8 – 2 0 0 9 9
Climate Change and the Food SyStem
portation sector. livestock accounts for about 35 percent of all human-induced cH4, largely coming from the digestive sys-tems of ruminants. the livestock sector also generates 65 percent of nitrous oxide, mostly from manure. according to the fao report, livestock depends on vast land resources--about 30 percent of the earth’s land surface, includ-ing permanent pasture and about one-third of global arable land for production of livestock feedstuffs (fao, 2006).
rice production, on the other hand, is growing more slowly.
Production in the PEcc region increased about 12 percent, with harvest area expanding only 1 to 2 percent, from 1990-92 to 2006-08 (uSda). methane emissions from this source have likely stabilized while those from growth in the production of livestock products have expanded. Projections for korea show a slight decline for GHG emissions from agriculture by 2015, with reductions from arable land more than offsetting rises from livestock production (kim, 2008).
agricultural Productivity in the PeCC Region, 1980-2008
there is no doubt that sig-nificant changes have occurred in the region’s climate (table 1). nevertheless, the productivity of the region’s agriculture generally
tion (Smil, 2001). conversely, agriculture and rural areas have the potential for absorbing more co2 through the con-version of land to forestry and other less intensive uses.
n Higher rates of n2o emission stimulated by naturally occur-ring bacteria from soil cultiva-tion, use of nitrogenous fertil-izers, and use of animal waste.
the atmospheric concentration of this GHG has been increas-ing linearly for the past two decades (iPcc, 2007b).
n Higher rates of cH4 emission from cultivation of rice fields
and from enteric fermenta-tion from expanding livestock production. Global atmo-spheric concentration levels now appear to have stabilized (iPcc, 2007b). major agricultural con-
tributors to the region’s GHG emissions are livestock and rice production, both emitters of cH4. With rapid income growth in the developing parts of the PEcc region, these economies are engaged in a process of dietary convergence with developed economies: consumers are shifting from staple grains to animal prod-ucts, the latter of which are more resource-intensive and GHG-emitting. according to the food and agricultural organization (fao), the global livestock sector alone generates more GHGs as measured in co2 equivalents—18 percent—than the global trans-
2008), respectively, of these economies’ total GHG emissions, disproportionately more than agriculture’s role in each nation’s economy. about half of new Zealand’s GHG emissions result from agricultural production. although new Zealand’s overall emissions are very low, agricultural production is a large component of the economy and exports; the economy ranks among the world’s top 20 emitters on a per capita basis (Bailey, 2008). Emissions from thai agriculture account for 24 percent of the economy’s total (tokrisna, 2008); and in korean
agriculture, primarily from rice and livestock production, they account for only 2.5 percent of the total (kim, 2008). the level varies in the rest of the region depending on agriculture’s energy intensity and relative role in the economy.
across the PEcc region, agri-culture generates emissions of all three leading GHG gases. carbon dioxide (co2) emissions are pri-marily related to land-use change, while emissions of methane (cH4) and nitrous oxide (n2o) are primarily related to livestock or crop production. the follow-ing three sources account for most of the region’s agriculture-related emissions: n the release of co2 caused by
intensive land use and the exposure of soils that occurs when virgin land and forest area are converted to grazing and to food and feed produc-
economy evidence of climate change Sources
australia averagetemperaturesincreased0.4to0.7°csince1950,alongwithmoreheatwaves,fewerfrosts,morerainintheNorthwest,andlessrainintheSouthandeast.intensityofdroughtsincreased.
iPcc(2007c),chapter11.
canada agriculturebenefitedfromgradualwarmingandlengtheningofgrowingseasons,butwasadverselyaffectedbyincreasedfrequencyandintensityofheatwavesandstorms.Warmerconditionsandmoremoderatewintershaveaidedsurvivalandspreadofpestsaffectingagricultureandforestry,includingtheinfestationofthepinebeetleinwesterncanada.meltingglaciershaveraisedconcernsabouttheneedformorecarefulwatermanagementinthefuture.
ilekaetal.(2008)
chile inmostoflatinamerica,therearenoclearlong-termtrendsinmeansurfacetemperature.thefewexceptionsincludeacoolingtrendinchile.adecliningtrendinprecipitationandindeglaciationinsouthernchilemayhavecontributedtonegativetrendsinstreamflows.
iPcc(2007c),chapter13
china Short-durationheatwavesandanincreasednumberofwarmerdaysandnightsincreasedinfrequencyinrecentdecades.extremerainsinwesternandsouthernregionsweremorefrequent,summerrainsmoreintenseineastchina,andfloodsseventimesmorefrequentsincethe1950s.
iPcc(2007c),chapter10
indonesia averagetemperaturesrosebutnotasfastastheglobalaverage.Ratesofincreaseweremoderatedbytheslowwarmingofequatorialwaterssur-roundingtheislands.changesinrainfallpatterns(risesinnorthernregionsanddeclinesinsouthernregions)andincreasedintensityofelNinoaffectedagriculture,includingthetimingofriceharvests.changesinclimatewerealsoassociatedwithincreasedinsectinfestations.
Natawidjaja(2008)
Japan averagetemperaturesroseabout1.0°cinthe20thcentury.therewasnosignificanttrendinprecipitationbutvariabilityincreased.
iPcc(2007c),chapter10
korea averagetemperaturesrose1.5°cinthelast100years,fasterthantheglobalaverage.thewarmingtrendisshiftingnorthward,reducingproduc-tionofapples,barley,andothercropsandreducinglivestockproductivity.
kim(2008)
NewZealand Precipitationwasheavierandmorepersistentinwesternpartsoftheeconomy.conditionsbecamedrierintheeast.morefrequentdroughts(fourmajordroughtssince1992)hadnegativeimpactsondairyandotheragriculturalproduction.
Bailey(2008)
Pacificislands theannualnumberofhotdaysandwarmnightsincreasedacrosstheSouthPacificduring1961-2003.Smallislandseastofthedatelineexperi-encedrisingincidenceoftropicalstormsduringanelNiñoevent.
iPcc(2007c)chapter16
Philippines averagetemperaturesrose0.14°cin1971-2000,belowtheglobalaverage.annualmeanrainfallincreasedafterthe1980s.
iPcc(2007c)
chinesetaipei averagetemperaturesrose1to1.4°c,fasterthantheglobalaverage.theintensityofprecipitationincreasedintheNortheastanddeclinedintheSouth.thereweresevereimpactsonriceandhorticulturalcropsfrommorefrequentextremeevents(typhoons,flooding,frost,drought,andhail).
chang(2008b)
thailand averagetemperaturerose1°cinthelast45years.Precipitationpatternschanged,withgreaterfrequencyoffloodingintheSouthanddroughtintheNorthandNorthwest.Rainfedagriculture,includingrice,intheNorthwasmostaffected.
tokrisna(2008)
unitedStates averagetemperaturesandprecipitationincreased,withsignificantregionalvariability.Heatwavesincreasedinfrequencyandseverecoldperiodsdeclined.conditionsbecamedrierintheSoutheastandWest.climateeffectsweregreateronmoresensitivehorticulturalcrops.impactsongrainandoilseedcropsmaybepositiveuntiloptimaltemperaturelevelsaresurpassed.
lewandrowski(2008),iPcc(2007c)
table 1 evidence of Climate Change in the PeCC Region
there is no doubt that significant changes have occurred in the region’s
climate (table 1). nevertheless, the productivity of the region’s agriculture
generally has risen in the last three decades.

10 P a c i f i c f o o d S y S t e m o u t l o o k 2 0 0 8 – 2 0 0 9
and the darling, which account for about 50 percent of the econ-omy’s annual agricultural output, including a large share of horticul-tural crops (Gunasekera, 2007). rice production, which is primar-ily irrigated, declined sharply, from 1.2 million tons in 2000 to practi-cally nil in 2007 (figure 7).
Climate Change Projections and the PeCC Food System
the iPcc released its fourth assessment report in 2007.2 this report and previous ones provide authoritative information about climate change, its causes, impacts, and future implications across vari-ous economic sectors and regions of the world. in the latest iPcc report the following key projec-tions were made that are relevant to the PEcc food system:n agricultural productivity
impacts vary
n food insecurity increasesn Sea level rise affects food supply
chains
agRiCUltURal
PRodUCtiVity imPaCtS VaRy
rising temperatures may increase agricultural productivity in some higher-latitude economies in the next century and reduce it in lower-latitude economies. this is a robust finding reflected in research spanning the last 15-20 years. a recent study that provides very detailed economy-by-economy impacts, using data from general circulation models (Gcm) and a broad spectrum of agriculturally specific models, also confirms this result (cline, 2007). according to this study, the net effect on PEcc’s agriculture of rising temperatures and other climate variables may be slightly positive, about 2 percent, by 2080 (table 3). moderate to medium
P a c i f i c f o o d S y S t e m o u t l o o k 2 0 0 8 – 2 0 0 9 11
Climate Change and the Food SyStem
farming practices. climate change impacts can be isolated under experimental conditions in which temperature, moisture, and co2 concentration are carefully con-trolled, but impacts are difficult to identify under field conditions.
reviewing yield data gives little indication of any significant discontinuities for the leading crops in the region over the past 30 years. average yields in almost all cases have shown a rising trend, with the notable exceptions of australian barley and wheat and canadian barley (table 2).
the pace of yield growth, however, has slowed in the last decade. this is a broad regional phenomenon except for u.S. corn, thai rice, and malaysian rice, where yield growth accel-erated, and for australian sor-ghum, u.S. wheat, indonesian rice, and Japanese rice, where growth was stable in the last two decades. the overall slowing in yield growth is consistent with global trends: global aggregate yield growth averaged 2 percent per year in 1970-90 but declined to 1.1 percent in 1990-2007 and is expected to further decline to 1 percent in the next 10 years (trostle, 2008). this slowing is explained by the waning effects of the green revolution which had its start in the 1960s (cline, 2007). While conventional wis-dom supports this view, some agribusinesses expect continued increases in yields; for example, u.S. corn yields are expected by some to rise by as much as 40 percent in the next 10 years (f.o. licht, 2008).
there is also the possibility that economies with low grain yields can catch up by overcom-ing agronomic and marketing constraints, such as raising average china corn yields (5.1 mt/ha) closer to average u.S. yields (9.1 mt/ha) and raising rice yields in the Philippines and malaysia closer to levels in indonesia and Vietnam.
other trends affecting produc-tion are independent of climate change. the global dietary shift from food grains to feed grains in many of the region’s emerging economies is reflected in regional patterns in which production of rice and wheat has remained rela-tively stable while feed grain pro-duction has grown considerably.
of all the economies in the PEcc region, australia stands out as the one potentially most affected by climate change. the frequency of drought conditions increased in the last decade, from one per decade in the 1980s and 1990s to three in the last decade, with droughts in 2002, 2006 and 2007. Wheat yields in those years averaged about 1 ton, or about half the more typical 2 tons per hectare (figure 6). one of the hardest hit agricultural areas was the catchment for australia’s two largest river systems, the murray
has risen in the last three decades. the impacts of climate change are, in many cases, obscured by other factors, such as the adop-tion of new technologies (better seed and other inputs), increased scale of operation, and improved
figure 6 Wheat yields: incidence of drought increased in australia in 2000s
0.5
1.0
1.5
2.0
2.5
198
019
8119
8219
8319
84
1985
1987
1991
198
819
8919
90
1992
1993
1994
1995
1996
1997
1998
1999
198
6
2000
2001
2002
2003
2004
2005
2006
2007
2008
0
1
2
3
4
5
Source:uSda.
me
tr
ic t
on
s p
er
he
ct
ar
eCountry/commodity 1980-89 1990-99 2000-08
australiabarley 1.4 1.8 1.7
australiarice 4.9 6 6.9
australiasorghum 2 2.3 2.6
australiawheat 1.4 1.8 1.6
canadabarley 2.6 3 2.9
canadacorn 6 7 7.8
canadarapeseed 6 7 7.8
canadawheat 1.8 2.3 2.4
chinacorn 3.7 4.8 5.1
chinarice 3.5 4.2 4.4
chinawheat 2.7 3.6 4.2
thaicorn 2.3 3.1 3.8
thairice 1.3 1.5 1.8
indonesiarice 2.7 2.8 2.9
Japanrice 4.3 4.5 4.7
Vietnamrice 1.8 2.4 3.0
malaysiarice 1.8 1.9 2.2
Philippinerice 1.6 1.9 2.3
mexicocorn 1.5 2.3 2.9
uScorn 6.6 7.7 9.1
uSrice 4.1 4.6 5.3
uSsoybeans 2 2.5 2.7
uSwheat 2.4 2.6 2.8
table 2 average yields of leading Crops in the PeCC Region
Source:uSda
2 the intergovernmental Panel on climate change (iPcc) was established in 1988 by the World meteorological organization and the united nations Environment Program. the 2007 iPcc report is the fourth (previous reports were issued in 1990, 1995, and 2001).
australia us china canada
metric tons per hectare
three droughts in last 10 years

12 P a c i f i c f o o d S y S t e m o u t l o o k 2 0 0 8 – 2 0 0 9 P a c i f i c f o o d S y S t e m o u t l o o k 2 0 0 8 – 2 0 0 9 13
tury, events such as heat stress, drought, flooding, or outbreaks of pests or pathogens are dif-ficult to predict and may come quickly, making it difficult for food producers to adjust.
assumptions about the yield-enhancing impact of co2 are critical to the model-projected net regional outcome. Such assumptions can make the dif-ference between an overall increase in the region’s projected
that weather extremes will be more frequent and severe and have a more injurious effect on the region’s agriculture in the future. Historical data show a large drying trend since the mid-1950s over much of the northern Hemisphere and great-er storm intensity since 1970 in some regions (iPcc, 2007d). compared to the slowly rising mean trends of climate variables projected for the next cen-
glaciers by rising temperatures, projected to increase more rap-idly than most other parts of the PEcc region. this area supplies 40 percent of the world’s popula-tion with water for agriculture and other uses through seven riv-ers, four of which flow through the asian part of the PEcc region: the yellow, yangtze, mekong, and Salween.
according to the iPcc, scientists have high confidence
local increases in temperature (1 to 3 c degrees) in the higher latitudes and changes in precipi-tation, along with assumptions about carbon fertilization, are expected to have positive impacts on crop yields. agricultural pro-ductivity increases are projected for canada, the united States, china, Japan, korea, and new Zealand. above the 1-to-3 degree rise, impacts on agricultural pro-ductivity are expected to turn negative (iPcc, 2007c).
in lower latitudes, many economies are already at average temperatures that are close to or exceeding optimal levels for agri-culture. in these economies, even moderate increases (1 to 2 degrees) are likely to have significant negative impacts on major crops. agricultural productivity declines are projected to be most severe
across the region’s latin american and Southeast asian economies. australia also is projected to be among the most negatively affected of the region’s economies.
Precipitation is also projected to rise in most parts of the region, with the exception of mexico, chile, and the southern parts of australia and the united States, where declines are projected. the increases tend to be the greatest in the northern latitudes or higher altitudes (tibetan Plateau) and lowest in the equatorial parts of the region. While higher temperatures can lead to higher precipitation levels, they can also lead to the drying out of soil and the increased need for irrigation.
rising temperatures and changing precipitation levels are likely to have significant impacts on the extent and quality of
grasslands and rangelands as well, and on the survival and spread of pests—all factors affecting the productivity of agriculture (iPcc, 2007c).
Warming may also mean that increased precipitation falls as rain instead of snow, leading to challenges for water manage-ment, hydropower, and agricul-ture in some parts of the region. Within the PEcc region, large areas of china, Japan, korea, Southeast asia, the united States, and mexico are dependant on irrigated agriculture. Water man-agement could become a critical challenge for many economies if climate warming and changing precipitation patterns make water increasingly scarce.
the Himalayan Glaciers on the tibetan Plateau are among the most affected of the world’s
Climate Change and the Food SyStem
figure 7 australia’s irrigated Rice Production declines Sharply
0
200
400
600
800
1,000
1,200
198
019
8119
8219
8319
84
1985
1987
1991
198
819
8919
90
1992
1993
1994
1995
1996
1997
1998
1999
198
6
2000
2001
2002
2003
2004
2005
2006
2007
2008
Source:uSda.
1,0
00
me
tr
ic t
on
s
estimated impacts Change in output
Farm output output w/o w/ w/o w/ area per ha carbon carbon carbon carbon fert. fert. fert. fert. mil of 1000 ha 2003 $ 2003 $ Percent Percent millions of 2003 $
australia 455,722 29 13,060 -26.6 -15.6 -3,472 -2,034
canada 67,502 254 17,131 -2.2 12.5 -365 2,150
chile 26,502 246 6,517 -24.4 -13.1 -1,590 -851
china 153,956 1,381 212,550 -7.2 6.8 -15,341 14,243
colombia 50,706 186 9,438 -23.2 -11.7 -2,188 -1,100
ecuador 12,356 176 2,176 -28.8 -18.1 -627 -394
indonesia 33,700 1,051 35,413 -17.9 -5.6 -6,330 -1,967
Japan 4,762 9,032 43,009 -5.7 8.4 -2,464 3,618
korea 1,877 8,707 16,344 -9.3 4.3 -1,525 698
malaysia 7,585 1,368 10,374 -22.5 -10.9 -2,336 -1,130
mexico 183,839 136 25,043 -35.4 -25.7 -8,856 -6,428
NewZealand 15,640 254 3,979 2.2 17.5 87 697
Peru 35,382 171 6,058 -30.6 -2a0.2 -1,852 -1,221
Philippines 10,700 1,054 11,280 -23.4 -11.9 -2,639 -1,342
thailand 19,367 738 14,295 -26.2 -15.1 -3,739 -2,156
unitedStates 379,344 260 98,536 -5.9 8.0 -5,791 8,120
Vietnam 8,895 969 8,616 -15.1 -2.0 -1,300 -202
PeccRegion 1,467,835 364 533,819 -11.3 2.0 -60,328 10,701
World 3,097,935 380 1,175,860 -15.9 -3.2 -186,510 -38,107
Source:WilliamR.cline(2007).Global Warming and Agriculture, Impact Estimates by Country.centerforGlobaldevelopment,Petersoninstituteforinternationaleconomics.
table 3 Climate Change Projections and impact on PeCC agriculture, 2080s

14 P a c i f i c f o o d S y S t e m o u t l o o k 2 0 0 8 – 2 0 0 9 P a c i f i c f o o d S y S t e m o u t l o o k 2 0 0 8 – 2 0 0 9 15
agricultural productivity (2 percent) versus a decline (-11 percent). the same holds for all individual economies, with the exception of new Zealand’s agriculture, where productivity is projected to increase without the carbon fertilization assump-tion, but even more so with it.
for some time, researchers have noted that rising concen-trations of atmospheric co2, the most important radiative forcing linked to global warm-ing (iPcc, 2007a), seems to have a positive impact on many crops within a certain range of temperature increases. this should not be surprising in light of the indispensible role
co2 plays in photosynthesis. But the magnitude of the impact has been subject to debate for some time (cline, 2007).
according to the 2007 iPcc report, recent research justifies the scaling back of the yield-enhancing assumption of co2 atmospheric concentrations to 550 ppm, about 50 percent above current concentration lev-els. according to this research, yields for c3 crops3 would increase 10-25 percent and for c4 crops4 0-10 percent. cline assumes an average 15 percent increase in yield in his 2080 economy-by-economy projec-tions of climate change impacts on agriculture. Estimates aris-
ing from australia’s Garnaut commission, based on more recent scientific evidence, sug-gests that atmospheric co2 con-centrations of 450 ppm probably constitute the upper bound for their “fertilization effect.” this is considerably lower than previ-ously assumed. nevertheless, according to the 2007 iPcc report, the role of co2 is still an area of great uncertainty: “…the true strength of the effect of co2 on crop yields at field or regional scale, its interaction with higher temperatures and variable precipitation levels, and the level beyond which co2 sat-uration may occur remain largely unknown (iPcc, 2007c).”
Climate Change and the Food SyStem
Food inSeCURity inCReaSeS
the number of food-insecure peo-ple in the PEcc region is about 11 percent, or 210 million people, with the greatest regional inci-dence in the poorest economies in Southeast asia, South america, and parts of china (fao food security statistics). the rate of food insecurity in the less devel-oped parts of the PEcc region is about half that in the rest of the developing world.
climate change impacts on agricultural productivity in the PEcc region will vary, with
gains in the high latitudes and losses in tropical areas where most of the region’s food-insecure population live. food supplies in these tropical areas may be further threatened by more frequent extreme weather events, the effects of greater pest infestations, and the potential adverse impacts of sea level rise on coastal aquaculture and food production in low-lying areas, particularly in Southeast asia.
While projections of the impact of climate change on global food security are uncer-tain, economic growth can help to mitigate adverse effects. With or without climate change, big declines in the number of food-insecure people are expected from reference levels projected for 2020 (figure 8). However, declines are not quite as sharp when climate change factors are considered (iPcc, 2007c).
for one scenario (a2), the global number of food-insecure people rises. this scenario assumes steadily expanding population, slower spread of technology, and slower income growth in developing economies (see description of iPcc sce-narios in the role of models in assessing climate change impacts, p. 17).
Projections such as these demonstrate the greater sensitiv-ity of the food security outcome to income growth relative to cli-mate change per se, although the
iPcc is careful to caution about the limitations of the models it uses. nevertheless, this discussion underlines the importance of eco-nomic development in providing low-income subsistence house-holds with the resources needed to adapt to climate and other changes through application of technology and diversification of economic and agricultural activi-ties (natawidjaja, 2008).
Sea leVel RiSe aFFeCtS
Food SUPPly ChainS
Global average sea levels have been rising at an accelerating rate since 1961 (1.8 mm/year for 1961-2003 vs. 3.1 mm/year for 1993-2003), most likely because of thermal expansion of the oceans and other lesser factors. the iPcc projects sea level increases of 0.18 meters to 0.59 meters by 2100, depending on which model-based scenarios are used (iPcc, 2007a).
Sea level rise is most threaten-ing to agriculture, food system infrastructure, ports and related transport facilities, and population settlements in low-lying coastal areas (antle, 2008). Southeast asia, china, and a number of the Pacific islands in the PEcc region are particularly vulnerable.
data show that sea level trends vary significantly in dif-ferent parts of the world. the average sea level rise for australia of 0.3 mm per year in the last 100 years is lower than the global average. there is also significant
variation around australia; for example, a 0.6-mm-per-year rise in Hobart versus a 1-mm-per-year decline in Geraldton in a recent 30-year period (http://www.ozcoasts.org.au/indicators/sea_level_rise.jsp).
a potential problem from rising sea levels is exacerbated by income growth in the developing parts of the region, leading to the migration of millions of people to coastal cities. the growth in human settlements within 30 kilometers of the coast is twice the global average (Brooks, 2006). this is the most significant demo-graphic change expected in the PEcc region in the next 50 years, as discussed in our 2003 report (PEcc, 2003).
among urban agglomera-tions with the largest populations potentially exposed to coastal flooding in the latter part of this century, 9 of the 20 most vulner-
Climate change impacts on agricultural productivity in the PeCC region
will vary, with gains in the high latitudes and losses in tropical areas
where most of the region’s food-insecure population live.
figure 8 Climate Change Projected to have modest impact on global Food Security
0
200
400
600
800
1,000
2020 2080 2080 2080 2080
reference case fischer (2005) parry (2004) fischer (2005) parry (2004)
with climate change, including no climate change positive effects of elevated co2
663
782749
630
108 91
233
768 769
108 90
233
13699
244
885
136102
221
742
Source:table5.6,page299;iPcc(2007c).SeedescriptionofiPccscenariosintheRoleofmodelsinassessingclimatechangeimpacts,p.17.
mil
lio
n p
eo
pl
e
a1 a2 b1 b2
3 c3 crops include rice, wheat, soybeans, fine grains, legumes, and most trees. these crops may also benefit from increased efficiency of water use as a consequence of reduced stomatal conductance with rising co2. (cline, p. 24).4 c4 crops include corn, millet, sorghum, and sugarcane (cline, p. 24).

16 P a c i f i c f o o d S y S t e m o u t l o o k 2 0 0 8 – 2 0 0 9 P a c i f i c f o o d S y S t e m o u t l o o k 2 0 0 8 – 2 0 0 9 17
able are in the PEcc region: Guangzhou, china; Ho chi minh city, Vietnam; Shanghai, china; Bangkok, thailand; Hai Phong, Vietnam; tianjin, china; ningbo, china; tokyo, Japan; and Jakarta, indonesia (table 4). a number of Pacific islands also face extreme susceptibility to sea level rise in the next century because their land area is barely above sea level; these are coral atolls. the newer volcanic-based islands face less severe risks.
among PEcc economies, the agricultural impacts are potentially greatest for Vietnam, mexico, and chinese taipei (chang, 2008b), with absolute potential impacts greatest for china. about 3,000 kilometers of Vietnam’s coastline is at or below one meter of elevation, potentially affecting almost 11 percent of the population, the largest percent-age of affected population among 84 economies analyzed. Some of the same lands are Vietnam’s
generalcirculationmodels(Gcms)areusedextensivelyinprojectinglong-termglobalclimatechange.
thesearecomplexsystemsofequationsthatdividetheplanetintoathree-dimensionalgrid,represent-
ingthedynamicphysicalattributesoftheocean,landsurfacesandatmosphere.
modelprojectionsaredrivenbyassumptionsaboutfutureatmosphericconcentrationsofgreenhousegases
andotherforcings.futuregrowthofGHGconcentrationlevelscanbeassumed(suchas1percentgrowthper
year)orderivedfromvariouseconomicmodel-basedscenarios.inthe2007iPccreport,sixfamiliesofsce-
nariosareused:
n a1(a1fi,a1B,anda1t):theseassumerapideconomicgrowth,aglobalpopulationreaching9billionby2050
beforedeclining,incomeconvergencebetweendevelopedanddevelopingeconomies,anddifferentassump-
tionsaboutenergyuse(a1fi,emphasisonfossilfuels;a1B,abalanceduseofmanyenergysources;anda1t,
emphasisonnon-fossilfuels).
n a2:steadilyexpandingpopulation,alesseconomicallyintegratedworld,slowerspreadoftechnological
change,andlessincomeconvergence.
n B1:rapidgrowthasina1,aglobaleconomydominatedbyservicesandinformation,populationrisingto9
billionin2050beforedeclining,greateruseofcleanandresource-efficienttechnologies,andemphasisona
moreintegratedworld.
n B2:steadilyexpandingpopulationbutslowerthanina2;alesseconomicallyintegratedworldthaninB1and
a1,withlowerlevelsofeconomicdevelopmentandlessrapidandmorefragmentedtechnologicalchange.
theoutputofweathervariablesfromtheGcmmodelscanbemappedtodifferenteconomiesandthenused
inagriculturalmodelstoestimatetheprojectedimpactsthesevariableswillhaveontheeconomy’sagriculture.
anothercategoryofmodel,theintegratedassessmentmodel,providesbroaderinsightsaboutthepotentialeco-
nomicandenvironmentalimpactsofclimatechangeaswellasabasisforevaluatingdifferentmitigationoptions
(Gunasekera,2008).
muchprogresshasbeenmadeinrepresentingtheplanet’sclimateandlikelychangesintheseGcm
models,aswellasintheuseofvariousscenariostodeterminefutureglobalGHGlevels.Nowtherearemany
teamsofclimatespecialistsaroundtheworldsupportedbybettercomputers,increasedandmoreaccurate
datafromsatellitesandothersources,andgreaterknowledgeaboutthemainforcesandinterrelationships
affectingtheclimate.
modelershavebecomemoreconfidentinascertainingwhatislikelytohappen,butmanyuncertainties
remain,including:
n theeffectsofclouds.thisisasignificantareaofuncertaintyinclimatemodels.cloudshavevariableeffects
ontheclimate.oneoftherolesthatcloudsplayisincoolingthesurface,byreflectingsunlightbackinto
space;anotheriswarming,byincreasingtheamountofinfraredradiationallowedthroughfromtheatmo-
spheretotheearth’ssurface.
n thedifficultyinquantifyingepisodicchanges.forexample,theinfestationofthepinebeetleintheforestsof
Britishcolumbia,canada,ledtoalargeshareofforestlandquicklychangingfrombeinganetcarbonsinkto
beinganetcarbonsource(Running,2008).
n thedifficultyinaccountingforchangesinthevalueofalbedo.thealbedovaluemeasurestheearth’sreflec-
tivity,whichrangesfrom90percentforfreshsnowtoabout4percentforcharcoal,withtheearth’saverage
beingabout30percent.thevalueisconstantlychangingwithhumanactivity,throughchangesinlanduse,
suchasexpansionofurbanareasandconversionofforestlandtoagriculturaluse.climatechangecanalso
triggeraseriesofchangesandfeedbacks:ifsnowmelts,thealbedodecreasesasthewhitereflectivesnow
disappears,revealingthedarkersoilunderneath.thus,moresunlightisabsorbedbythedarksoil,andtem-
peraturesincreasestillfurther.
n theneedformoreinformationregardingclimatechangeanditsinteractionwithagricultureandeconomic
variablesindevelopingeconomies.apreponderanceofclimatechangedataandanalysesnowcomesfrom
thedevelopedeconomies.
the Role oF modelS in aSSeSSing Climate Change imPaCtS
most fertile, those in the red and mekong river delta regions, which represent a large share of the economy’s rice-growing area (dasgupta, 2007).
Public and Private Sector Responses
Public or private sector responses to climate change are predicated on an assessment of the future benefits and costs of doing something now versus the future benefits and costs of inaction. Such an assessment is neces-sarily complex and affected by many factors, including local conditions and the immediacy of expected adverse effects. thus, a farmer’s propensity to respond to climate change projections in australia’s murray-darling catchment is much higher than that of a farmer, say, in the u.S. corn Belt. one is already fac-ing manifestations of climate change in increased frequency of drought, and the other is not.
farmers are accustomed to adjusting to changes in weather and growing conditions, as well as changes in the marketplace. this is a reality in agriculture. Weather variability is the most significant supply-side factor farmers must deal with on a regular basis.
adapting to climate change is different. it implies the rec-ognition that there are trends in climate-related variables. in any particular location these trends may include gradually increasing temperatures, slowly changing precipitation patterns, slowly rising sea levels and salt water intrusion on low-lying coastal areas, or increasing frequency of extreme weather events. the change is inevitable (rose,
Climate Change and the Food SyStem
Rank Country Urban Current Future agglomeration 1,000s 1,000s 1 india kolkata 1,929 14,014
2 india mumbai 2,787 11,418
3 Bangladesh dhaka 844 11,135
4 china Guangzhou 2,718 10,333
5 Vietnam Hochiminhcity 1,931 9,216
6 china Shanghai 2,353 5,451
7 thailand Bangkok 907 5,138
8 myanmar Rangoon 510 4,965
9 uSa miami 2003 4,795
10 Vietnam HaiPhong 794 4,711
11 egypt alexandria 1,330 4,375
12 china tianjin 956 3,790
13 Bangladesh khulna 441 3,641
14 china Ningbo 299 3,305
15 Nigeria lagos 357 32,290
16 coted'ivoire abidjan 519 3,110
17 uSa Newyork-Newark 1,540 2,931
18 Bangladesh chittagong 255 2,866
19 Japan tokyo 1,110 2,521
20 indonesia Jakarta 513 2,248
24,096 142,253 Source:Nicholls,R.J.,etal(2007);Ranking the World's Cities Most Exposed to Coastal Flooding Today and in the Future.executiveSummary.oecdenvironmentWorkingPaperNo.1.Paris:organizationofeconomiccooperationanddevelopment
table 4 top 20 Cities Ranked by Population exposed to Flooding in the 2070s

18 P a c i f i c f o o d S y S t e m o u t l o o k 2 0 0 8 – 2 0 0 9 P a c i f i c f o o d S y S t e m o u t l o o k 2 0 0 8 – 2 0 0 9 19
wheat this year because of explicit concerns about the effects of global warming on the economy’s agri-culture (interfax-china, 2008).
mitigation policy is more significant because it is focused on actually reducing net GHG emis-sions or on undertaking carbon sequestration strategies. mitigation measures, usually promoted by governments, include the use of direct payments, a carbon tax, or a cap-and-trade system to cut GHG emissions. these approaches are likely to be economy-wide, affecting agriculture directly or indirectly according to the scope
a wealthy farmer in australia may be more able to adapt to slowly rising temperatures by using more drought-resistant seed varieties, while a poor rice farmer in Southeast asia may find it difficult to adapt because of isolation and the lack of resources (natawidjaja, 2008).
Policy intervention may be required to assist poor farmers in undertaking adaptive measures. aid may simply be the providing of information, such as china’s recent advice to farmers in certain locations to delay the harvest of corn and the sowing of winter
2008).5 and adaptive measures are needed to reduce the costs or take advantage of the benefits of the change. the costs of adapta-tion are always positive, and the extent of these costs depends on the speed of climate change (Quiggen and Horowitz, 2003). if the change is too rapid or extreme, adaptation may require moving to a more attractive loca-tion, seeking off-farm opportuni-ties, or abandoning agriculture altogether.
the degree of adaptation depends on the extent of climate change and the capacity to adapt.
inrecentyears,biofuelshavebeenpromotedonthebasisoftheirpotentialcontributiontoenergy
securityandruraldevelopment,aswellastheirenvironmentalbenefits.BiofuelproductioninthePecc
regionhasexpandedrapidlybutisconcentratedprimarilyintheunitedStates,withmuchlessproduc-
tioninchina,canada,thailand,andcolombia(figure9).manyPecceconomieshavedevelopedpoliciesto
promoteexpandeduse.
Biofuelshaveanadvantageoverfossilfuelsbecausetheircombustioniscarbonneutral.Whilebothbiofuels
andfossilfuelsgiveoffco2whenburned,biofuelsrecycleco2recentlyabsorbedfromtheatmospherebythe
cropsusedtoproducethem.fossilfuels,ontheotherhand,areaddingtoatmosphericco2concentrationsby
givingoffco2thatwasabsorbedandtrappedinplantmaterialmillionsofyearsago.
Whentakingabroaderperspectiveusing“life-cycle”analyses,weseethattheadvantagesofbiofuelsin
reducingGHGrelativetofossilfuelsperkilometertraveledvaryfroman18percentreductionforu.S.cornetha-
noltoa90percentreductionformalaysianbiodieselfrompalmoil(figure10).thevariabilityarisesfromdiffer-
encesinthefeedstocksused,theculturalpracticesemployedtoproducethem,andthekindsofinputsusedto
processthemintobiofuel.usingbio-feedstockforproducingelectricityalsopotentiallyhasahighpercentage
offset(85-96percent)ofnetGHGemissions(mccarl,2008).
RecentanalyseshaveraisedquestionsabouttheGHGimplicationsoflandusechangesthatresultfrom
expandingbiofuelproduction(Searchingeretal.,2008;andfargione,etal.,2008).thesestudiesconsiderthe
globalGHGimpactsofconvertinglandnowcoveredwithtrees,grass,andothernatural“carbonsinks”into
farmlandforgrowinghigher-pricedcropsforbiofuelproduction.accordingtothesestudies,whenemissions
fromlandusechangesareconsideredinestimatesofdirectemissionsforcornethanol,thetotalbecomes
higherthanforfossilfuels.
itisclearthatbiofuelsnowareveryland-intensivebutprogressisbeingmadeinmakingthemlessso.first-
generationbiofuelyieldsperhectarerangefrom608litersforu.S.soybeansto3,740litersforu.S.cornand
5,600litersformalaysianpalmbiodiesel.Givenu.S.cornyieldsandcurrentethanolconversionrates,meeting
u.S.demandforgasoline(570billionliters),forexample,wouldrequirethecultivationofover200millionhect-
aresofu.S.farmland—morelandareathancurrentlyisinu.S.cropproduction.
Higherbiomassyieldsandbiofuelconversionratesforfirst-generationbiofuelsandthecommercializationof
cellulosicethanolholdpromiseforraisingper-hectarebiofuelyieldstomorethan9,000liters,thusreducingthe
land-intensityofproductionandraisingGHGoffsets.
increasingly,regionalattention,primarilyintheunitedStates,canada,china,Japan,australia,New
Zealand,andthailand,isbeingfocusedoncommercializingcellulosicethanol.manysmallcompanies,sometimes
incollaborationwithlargecompaniesanduniversities,areinvestingbillionsofdollarsofprivateventurecapital
andpublicgrantsinthiseffort.celluloseisthemostwidelyavailablebiologicalmaterialintheworld,presentin
suchlow-valuematerialsaswoodchipsandwoodwaste,fast-growinggrasses,cropresiduessuchascorncobs
andsugarcanebagasse,andmunicipalwaste.Someofthesesourcescouldbeproducedonmarginallandsand
notindirectcompetitionwithfoodcrops.
convertingcellulosetoethanolisnotcurrentlyeconomicalandisnotlikelytobesoforanothertwoto
threeyears,bythemostoptimisticforecasts.estimatedproductioncostsarestillsignificantlyhigherthanfor
first-generationbiofuels.apublicrolewilllikelycontinue,giventhehighcostoffindingandreducingthecosts
ofenzymesandincreasingthesupplyofbiomass,includingcropvarietiesbredforhigheryieldsperhectare.
Researchisalsofocusedonfindingordevelopingcropvarietiesthatgrowwellonmarginallands,havedrought
andpestresistance,areinexpensivetoharvest,andaremoreeasilyconvertedtoethanol.
Questionsremainaboutwhateffectsharvestinggrasses,trees,andcropresidueswouldhaveonerodibility
andfertilityoflandresources.therearealsoquestionsregardinglogisticalandenvironmentalcostsofharvest-
ing,transporting,andstoringlargevolumesofbulkycellulosicfeedstockforprocessingintoethanol.
BioFUelS: a ViaBle ghg mitigation StRategy?Climate Change and the Food SyStem
figure 9 PeCC Biofuel Production Concentrated in U.S., But expanding in other Countries
0
5
10
15
20
25
30
35
0
.5
1
1.5
2
2.5
0
10
20
30
40
2004 2005 2006 2007 2008 f
us
bra
zil
euro
pere
st o
f pec
c
chin
a
thai
land
phili
ppin
es
colo
mbi
ain
done
sia
Kore
a
mal
aysi
aa
ustr
alia
cana
da
ro
w
sing
apor
e
16.4 14.317.9 16.8
23.7 21.8
28.9 30.335.5
38.8
Source:f.o.licht.
bil
lio
n l
ite
rs
bil
lio
n l
ite
rs
bil
lio
n l
ite
rs
leading producers, 2008 pecc minus u.s., 2008
total biofuel production
ethanol
biodiesel
ethanol
biodiesel
5 Even if concentrations were fixed at 2000 levels, average temps would rise .3 to .9 degrees by 2090-2099 regardless of the seriousness of mitigation. Steven k. rose and Bruce a. mccarl (2008). “Greenhouse Gas Emissions, Stabilization and the inevitability of adaptation: challenges for u.S. agriculture.” choices, first quarter.
rest of world pecc

20 P a c i f i c f o o d S y S t e m o u t l o o k 2 0 0 8 – 2 0 0 9 P a c i f i c f o o d S y S t e m o u t l o o k 2 0 0 8 – 2 0 0 9 21
and adjust to climate and other changes, helping to reduce nega-tive economic effects.
there is now much more agreement about the need for concerted and coordinated pri-vate and public sector efforts to address climate change. Programs to reduce GHGs require broad participation and long-term orientation, since mitigation strat-egies will only slowly affect cli-mate change and will benefit the entire region. While some econo-mies might undertake mitigation programs to provide leadership by example, to be effective in the long run they must: n Be implemented on a regional,
or preferably global, scale through aPEc, the un, or similar institutions.
duction of insurance programs and other income protection schemes to reduce the risk from increased frequency of extreme climate events. it is important that these initiatives do not distort agricultural markets in ways that negatively affect production and trade of farm products domesti-cally and internationally. Public information regarding climate change effects must be integrated into extension programs and eco-nomic development planning.
Promoting economic devel-opment will be a critical compo-nent in low-income areas because farmers will need additional resources to adapt to climate change. Higher-income house-holds have a longer time horizon and greater capacity to adapt
the increased likelihood of more frequent extreme weather and cli-matic events.
Public support is needed for research and development targeted at farm-level adaptation, taking account of unique differences in climate factors in different geo-graphic locations within an econ-omy. Such support may include development and introduction of drought-tolerant crops; combat-ing the spread of various pests due to warmer temperatures; support for better water management and new, more efficient irrigation systems; measures to protect low-lying rice-producing areas from sea level rise; introduction of livestock breeds that do better in drier con-ditions; advice on adjusting farm management practices; and intro-
GHG by 10 or 25 percent by 2020, GdP would be 1.1 percent or 1.6 percent less than otherwise would be the case, versus 0.9 per-cent with a program that did not undertake to cut GHG emissions (Garnaut, 2008).
recognition of the global nature of climate change is reflected in international initia-tives, such as the un framework convention on climate change (1992), the kyoto Protocol (1997), and the major Economies Process (2007). the latter is now
focused on reaching an inter-national consensus on reducing GHG emissions after the kyoto Protocol expires in 2012. these efforts will continue to be chal-lenged by equity concerns, that developing economies are the least responsible for the rising concentration of GHGs in the atmosphere yet are likely to be most affected by climate change (table 2).
implications for decision makers
Governments have a responsibil-ity to collect and disseminate data related to long-term climate change and its potential effects. a top priority must be to provide climate change data targeted to local needs and circumstances. this is necessary to aid farmers’ and other food system partici-pants’ adaptation to gradual and short-term changes, as well as to
most likely to occur when they are in the economic interests of the producer.
Governments in the PEcc region have also promoted the production and use of biofuels (figure 9) as a mitigation strat-egy. Biofuels can offset GHG emissions in varying degrees, depending on what biomass is used, how it is used, and the extent to which land use changes are undertaken. Ethanol from sugar cane or cellulosic sources, for example, reduces GHG emis-
sions more than ethanol from wheat or corn, and electricity production using switchgrass offsets more GHG emissions than corn ethanol used as a fuel (mccarl, 2008)6.
Since the atmosphere is shared by all economies, indi-vidual or national initiatives to reduce GHG emissions are often challenging because of the lack of broad cooperation. if one economy imposes strict abate-ment policies on itself and others do not, this may adversely affect the competitive position of the initiating economy, while shifting GHG-emitting industries to other economies and not reducing over-all global emissions. recent eco-nomic cost estimates of australia’s cap-and-trade proposal, scheduled for introduction in 2010, reflect the disincentives faced by an economy trying to act indepen-dently. according to australian estimates, if the government cut
of the program. the costs of a cap-and-trade program are reduced by broad sectoral participation. agriculture, however, may be excluded because of its geographic dispersion and the difficulties involved in monitoring a large number of farms, each emitting a very small quantity of GHGs. on the other hand, farms may be allowed to participate in a cap-and-trade system by voluntarily reduc-ing emissions or increasing seques-tration and providing offset credits to those required to participate
(e.g., power generating plants). co2 cap-and-trade programs are being used in new Zealand and Europe. australia and parts of the united States and canada are planning to introduce programs in the next several years. cap-and-trade programs are a common feature of recent u.S. legislative proposals regarding climate change (lewandrowski, 2008).
Governments can encour-age reduction or sequestration of GHG emissions at the farm level by promoting minimum tillage, expansion of forestry areas, the more efficient use of fertilizer to reduce nitrous oxide emissions, and the use of anaerobic digesters in livestock operations to capture methane for on-farm energy use. one way governments can do this is to provide information about the GHG consequences of applying these different prac-tices (lewandrowski, 2008). nevertheless, these changes are
figure 10 Some Biofuels Provide Significant opportunity for ghg offsets
-120
-100
-80
-60
-40
-20
0
US
corn
EU s
ugar
bee
ts
EU w
heat
US
cellu
losi
c
Bra
zil s
ugar
EU ra
pese
ed
Mal
aysi
a pa
lm o
ilIn
dia
Jatr
opha
US
soyb
eans
-18
-35
-47
-88 -91
-30
-70
-90
-110
Source:imf,2007.PercentreductioninGHGemissionsisdefinedasthechangeinlifecyclegreenhousegasemissionsperkilometertraveledbyreplacingfossilfuelswithbiofuelsinconventionalvehicles.“lifecycle”referstoemissionsmeasuredovertheentireproductioncycleofthefuel.
re
du
ct
ion
in
gh
g e
mis
sio
ns
(p
er
ce
nt
)
Climate Change and the Food SyStem
Since the atmosphere is shared by all economies, individual or national
initiatives to reduce ghg emissions are often challenging because of the
lack of broad cooperation.

22 P a c i f i c f o o d S y S t e m o u t l o o k 2 0 0 8 – 2 0 0 9 P a c i f i c f o o d S y S t e m o u t l o o k 2 0 0 8 – 2 0 0 9 23
climate on agricultural produc-tivity across the PEcc region, policymakers should promote the greatest possible openness in the region’s food system to reduce the risk of food supply disrup-tions. the potential for gains in agricultural productivity in higher-latitude economies and decreases in lower-latitude econo-mies over the next century, along with the increased likelihood of extreme events such as droughts and floods, suggest the potential for increased dependence on trade in the future. allowing the free play of comparative advantage will assure the most efficient allocation of food system resources and the least cost in adapting the food sys-tem to climate change.
ible thresholds leading to even greater climate change.
increasing production of bio-fuels in a cost-effective manner is one strategy in which agriculture can play an important role in GHG mitigation. many PEcc economies already encourage the blending of biofuels with fos-sil fuel. care must be exercised, however, to be sure the bioen-ergy is produced in ways that actually reduce GHG emissions relative to fossil fuels by taking account of all emissions related to land use change, feedstock production, conversion processes to biofuels, and distribution to final consumers.
finally, given the uncertain and variable long-term effects of
n achieve broad sectoral and indi-vidual economy participation to avoid accrual of economic advantages to non-participants. as a significant GHG emitter and potential carbon sink, the food system must be included.
n Provide a clear and sustained signal regarding the high cost of carbon emissions through implementation of a carbon tax, a cap-and-trade system, or other mechanisms. these actions will lead to reductions in the use of fossil fuels and decreases in GHG emissions and will provide economic incentives for the development and produc-tion of alternative low-carbon energy sources. this will also help avoid crossing irrevers-
aPeC— asiaPacificeconomiccooperationCh4—methaneCo2—carbondioxideFao—foodandagricultureorganizationgdP—GrossdomesticProductghg—GreenhousegasimF—internationalmonetaryfund
iPCC—internationalPanelonclimatechangen2o—NitrousoxidePeCC—PacificeconomiccooperationcouncilPPP—PurchasingpowerparityUn—unitedNationsUSda—u.S.departmentofagriculture
a B B R e V i a t i o n S U S e d i n t h e P a C i F i C F o o d S y S t e m o U t l o o K
Climate Change and the Food SyStem
24 P a c i f i c f o o d S y S t e m o u t l o o k 2 0 0 8 – 2 0 0 9 P a c i f i c f o o d S y S t e m o u t l o o k 2 0 0 8 – 2 0 0 9 25
Quiggen, John and John Horowitz (2004). “costs of adjustment to climate change.” The Australian Journal of Agricultural and Resource Economics, 47:4, pp. 429-446.
rose, Steven k., and Bruce a. mccarl (2008). “Greenhouse Gas Emissions, Stabilization and the inevitability of adaptation: challenges for u.S. agriculture.” Choices, 23(1), first quarter.
running, Steven W. (2008). “Ecosystem disturbance, carbon, and climate.” Science vol. 321, august 1.
Searchinger, timothy et al. (2008). “use of u.S. croplands for Biofuels increases Greenhouse Gases through Emissions from land use change.” www.sciencemag.org/cgi/content/full/1151861/dc1. Published online february 7 2008; 10.1126/science.1151861.
Smil, Vaclav (2001). Feeding the World: A Challenge for the Twenty-First Century. cambridge, mass.: mit Press.
Smit, Barry (2008). “adjusting to climate change in food Systems: Public and Private responsibilities.” Presentation at 12th annual Pacific food System outlook meeting, Honolulu, September 16-17.
lewandrowski, Jan (2008). “impact of climate change on agriculture and the food System: a u.S. Perspective.” Presentation at 12th annual Pacific food System outlook meeting, Honolulu, September 16-17.
lomborg, Bjorn (2006). The Skeptical Environmentalist: Measuring the Real State of the World. cambridge, u.k.: university of cambridge Press.
natawidjaja, ronnie S. (2008). “impact of climate change on food System in indonesia.” Presentation at 12th annual Pacific food System outlook meeting, Honolulu, September 16-17.
nicholls, r.J, et al. (2007). Ranking the World’s Cities Most Exposed to Coastal Flooding Today and in the Future. Executive Summary, Environment Working Paper no. 1. Paris: organization of Economic cooperation and development.
mccarl, Bruce a (2008). “Bioenergy in a Greenhouse mitigating World.” Choices, first quarter.
Pacific Economic cooperation council (2003). Pacific Food System Outlook 2003-04: Where Demographics Will Take the Food System. Singapore.
iPcc (2007b). An Assessment of the Intergovernmental Panel on Climate Change. The Physical Science Basis. chapter 2, changes in atmospheric constituents and in radiative forcing.
iPcc (2007c). An Assessment of the Intergovernmental Panel on Climate Change. Impacts, Adaptation, and Vulnerability.
iPcc (2007d). Frequently Asked Questions. 3.3, Has there been a change in extreme events like heat waves, droughts, floods, and hurricanes?
international monetary fund (2007). World Economic Outlook, Globalization and Inequality, october.
ileka, Jean-Willy, Brad Gilmour, Bob macGregor, and Stephen Smith (2008). “climate change in canada: Evidence, impacts, Public and Private responses, future Exigencies and Policy options.” Presentation at 12th annual Pacific food System outlook meeting, Honolulu, September 16-17.
interfax-china (2008). “Global Warming Prompts china to Push Back farming calendar.” Shanghai, September 11.
kim, chang-Gil (2008). “impacts and countermeasures of climate change: a korean Perspective. Presentation at 12th annual Pacific food System outlook meeting, Honolulu, September 16-17.
Garnaut, ross (2008). “Supplementary draft report: targets and trajectories.”Garnaut climate change review. canberra, September.
Gunasekera, don, and catherine tulloh (2008a). “impact of climate change on agriculture and the food System.” Presentation at 12th annual Pacific food System outlook meeting, Honolulu, September 16-17.
Gunasekera, don, and melanie ford (2008b) “australian agriculture—dealing with climate change.” Presentation at 12th annual Pacific food System outlook meeting, Honolulu, September 16-17. Gunasekera, don, melanie ford, Edwina Heyhoe et al.(2008c). “Global integrated assessment model, a new analytical tool for assessing climate change risks and Policies.” Australian Commodities, march quarter. Gunasekera, don, melanie ford, and catherine tulloh (2007). “climate change, issues and challenges for australian agriculture and forestry.” Australian Commodities, September quarter.
iPcc (2007a). An Assessment of the Intergovernmental Panel on Climate Change. Executive Summary.
antle, John m (2008). “climate change and agriculture: Economic impacts.” Choices, 23 (1), first quarter.
australian department of climate change (2008). national Greenhouse Gas inventory 2006. australia’s national Greenhouse accounts: accounting for the kyoto target. canberra, June.
Bailey, Peter (2008). “climate and Production: the impact of climate on agricultural Production in new Zealand.” Presentation at 12th annual Pacific food System outlook meeting, Honolulu. September 16-17. Brooks, nick, robert Hall, and Jim Hall (2006). “Sea level rise: coastal impacts and responses.” German advisory council on Global climate change. Berlin.
chang, ching-cheng (2008a). “climate change in the asia-Pacific region: What’s the Evidence?” Presentation at 12th annual Pacific food System outlook meeting, Honolulu. September 16-17.
chang, ching-cheng (2008b). “climate change and agricultural implications in chinese taipei.” Presentation at 12th annual Pacific food System outlook meeting, Honolulu, September 16-17.
cline, William r. (2007). Global Warming and Agriculture: Impact Estimates by Country. Washington, dc: center for Global development, Peterson institute for international Economics.
dasgupta, Susmita, et al. (2007).The Impact of Sea Level Rise on Developing Countries: A Comparative Analysis. World Bank Policy research Paper 4136, february.
The Economist (2008). “china, india and climate change,” June 5.
f.o. licht (2008). “Harkin and nelson defend Ethanol at u.S. Senate Hearing,” august 18.
fargione, Joseph, Jason Hill, david tilman, Stephen Polasky and Peter Hawthorne (2008). “land clearing and the Biofuel carbon debt.” Science, february 29, Vol. 319. no. 5867, pp. 1235–1238.
food and agricultural organization (2008). food security statistics; number of undernourished persons, http://www.fao.org/faostat/foodsecu-rity/index_en.htm(accessed in august 2008).
food and agricultural organization (2006). Livestock’s Long Shadow: Environmental Issues and Options. rome.
ReFeRenCeS

26 P a c i f i c f o o d S y S t e m o u t l o o k 2 0 0 8 – 2 0 0 9 P a c i f i c f o o d S y S t e m o u t l o o k 2 0 0 8 – 2 0 0 9 27
u.S. Environmental Protection agency (2008). Inventory of U.S. Greenhouse Gas Emissions and Sinks: 1990-2006. Executive Summary, Publication # 430-r-08-005. april 15, ES-4 and table ES-8 on ES-16.
Woodward, alistair, Simon Hales, and Philip Weinstein (1998). “climate change and Human Health in the asia Pacific region: Who Will Be most Vulnerable?” Climate Research, vol. 11:31-38.
World Bank and indonesian department for international development, (2007). Executive Summary. Indonesia and Climate Change: Current Status and Policies. Jakarta.
economic Research Service
http://www.ers.usda.govthe Economic research Service (ErS) is the main source of eco-nomic information and research in the u.S. department of agriculture. ErS economists and social scientists develop and dis-tribute a broad range of economic and other social science informa-tion and analysis to inform public and private decision making on agriculture, food, environmental, and rural issues.
the ErS’s timely reports are distributed to public and private decision makers to assist them in conducting business, formulat-ing policy, and learning about the farm, rural, and food sectors. ErS publications are available to the public and the news media in both print and electronic form.
the agency’s three divisions—food and rural Economics, market and trade Economics, and resource Economics—conduct research, perform com-modity market and policy analysis, and develop economic and statisti-cal indicators. the executive and legislative branches of the uS fed-eral government use ErS informa-tion to help develop, administer, and evaluate farm, food, rural, and resource policies and programs.
in addition to research reports and commodity analyses, ErS publishes AmberWaves, a maga-zine covering the full range of the agency’s research and analysis, including the economics of agri-culture, food, rural america, trade and the environment.
Farm Foundation
http://www.farmfoundation.orgfarm foundation is a publicly supported nonprofit organization working to improve the economic and social well-being of u.S. agriculture, the food system and rural communities by assisting private and public sector decision makers in identifying and under-standing forces that will shape the future. Serving as a catalyst, farm foundation partners with private and public sector stake-holders, sponsoring conferences and workshops to understand forces shaping the competitive-ness of agriculture and the food system; encouraging transfer of research into practical tools for increasing human capital; promot-ing informed dialogue on public issues and policies; and building knowledge-based networks for u.S. agriculture and rural people. farm foundation does not lobby, or advocate positions or policies. its 75-year history for objectivity allows it to bring together diverse stakeholders for quality discussions on issues and policies, providing a solid basis for informed private and public-sector decisions.
SPonSoR PRoFileS
tokrisna, ruangrai (2008). “climate change and impacts on agriculture, Private and Public responses, and future Policy options: the case of thailand.” Presentation at 12th annual Pacific food System outlook meeting, Honolulu, September 16-17.
trostle, ron (2008). Global Agricultural Supply and Demand: Factors Contributing to the Recent Increase in Food Commodity Prices (revised). WrS-081. Washington dc: Economic research Service, uSda, July.

28 P a c i f i c f o o d S y S t e m o u t l o o k 2 0 0 8 – 2 0 0 9 P a c i f i c f o o d S y S t e m o u t l o o k 2 0 0 8 – 2 0 0 9 29
Seoul 137-747koreatel: 82-2-3460 1242fax: 82-3-3460 1244 http://www.kopec.or.kr/eng/
index.php
malaySiamalaysia national committee for
Pacific Economic cooperation (mancPEc)
institute of Strategic and international Studies (iSiS)
no. 1 Pesiaran Sultan SalahuddinP.o. Box 12424 50778 kuala lumpurmalaysia tel: 60-3-2693 9366fax: 60-3-2693 9430
meXiComexico national committee for
Pacific Economic cooperation (mXcPEc)
Plaza Juárez no. 20, floor 6 col. centro, deleg. cuauhtémoc, c.P. 06010
mexico citymexicotel: 52 – 55 - 9159 5382fax: 52 -55 - 9159-5374
mongoliamongolia monPEcc SecretariatSuite 70, ministry of foreign
affairsPeave avenue 7a, Sukhbaatar dist.ulaanbaatar-48,mongolia 210648tel/fax: 976 - 11 – 262394http://www.monpecc.org
neW Zealandnew Zealand national
committee for Pacific Economic cooperation (nZPEcc)
te Whare Wananga o te upoko o te ika a maui, P.o. Box 600, Wellington, new Zealand
tel: 64-4-463 5794fax: 64-4-463 5454
PeRUPeruvian national committee for
Pacific Economic cooperation (PEruPEc)
ministry of foreign affairsJr. lampa 545, 4th floorlimaPeru tel: 51-1-311 2570fax: 51-1-311 2564
the PhiliPPineSPhilippine Pacific Economic
cooperation committee (PPEcc)
c/o Philippine foundation for Global concerns
43/f, Philamlife tower 8767 Paseo de roxasmakati city, Philippinestel: 63-2-885 0924fax: 63-2-845 4832
PaCiFiC iSlandS FoRUm (PiF)Pacific islands forum SecretariatPrivate mail BagSuva, fijitel: 679-3312600/ 3302375
(direct)fax: 679-3300102
SingaPoReSingapore national committee
for Pacific Economic cooperation (SincPEc)
c/o lee kong chian School of Business Singapore management university
50 Stamford road 5th floor room 5029Singapore 178899tel: 65-68280157fax: 65-68280777
PaCiFiC eConomiC CooPeRation CoUnCilPacific Economic cooperation
council international Secretariat
level 7, lobby a29 Heng mui keng terraceSingapore 119620tel: 65-6737 9822 fax: 65-6737 9824http://www.pecc.org
aUStRaliaaustralian Pacific Economic
cooperation committee (auSPEcc)
JG crawford Buildingaustralian national universitycanberra act 0200australiatel: 61-2-6125 0567fax: 61-2-6125 0169http://apseg.anu.edu.au/auspecc/
index.html
BRUnei daRUSSalamBrunei darussalam national
committee for Pacific Economic cooperation (BdcPEc)
department of multilateral Economics
ministry of foreign affairsBandar Seri Begawan Bd 2710Brunei darussalamtel: 673-2-261 177fax: 673-2-261 620
Canadacanadian national committee for
Pacific Economic cooperation (cancPEc)
asia Pacific foundation of canadaSuite 220-890 West Pender Street, Vancouver, B.c, V6c 1J9 canada tel: 1-604-684-5986fax: 1-604-681-1370http://www.asiapacific.ca/
Chilechilean national committee for
Pacific Economic cooperation (cHilPEc)
chile Pacific foundationav. los leones 382, of. 701ProvidenciaSantiago, chiletel: 56-2-334 3200fax: 56-2-334 3201http://www.funpacifico.cl
Chinachina national committee for
Pacific Economic cooperation (cncPEc)
3 toutiao taijichangBeijingchina 100005tel: 86-10- 8511 9648 fax: 86-10- 8511 9647http://www.pecc.net.cn/
ColomBiacolombia national committee
for Pacific Economic cooperation (colPEcc)
c/o asia Work-Group,ministry of foreign affairsPalacio de San carloscalle 10 no 5-51,Bogotacolombiatel: 57-1- 5667 140fax: 57-1- 5667 145
eCUadoREcuadorian committee for the
Pacific Economic cooperation council (EcPEcc)
av. carrión & Páez Str. (corner), Zurita Bldg, mezzanine
ministry of foreign affairs, Quito, Pichincha,Ecuador, South americatel: 593-2-2501-197/2561-215
(ext. 253) fax: 593-2-2508987
hong Kong, ChinaHonk kong committee for
Pacific Economic cooperation (HkcPEc)
trade & industry department 17/f, trade & industry
department tower700 nathan roadkowloonHong kong, chinatel: 852-23985305fax: 852-27877799http://www.hkcpec.org
indoneSiaindonesia national committee for
Pacific Economic cooperation (incPEc)
centre for Strategic and international Studies (cSiS)
Jalan tanah abang iii/23-27 Jakarta 10160indonesiafax: 62-21-386 5532tel: 62-21-384 7517http://www.csis.or.id
JaPanJapan national committee for
Pacific Economic cooperation (JancPEc)
the Japan institute of international affairs (Jiia)
11f kasumigaseki Building3-2-5 kasumigaseki, chiyodakutokyo 100Japantel: 81-3-3503 7744fax: 81-3-3503 6707 http://www.jiia.or.jp/pecc/
KoRea korea national committee for
Pacific Economic cooperation (koPEc)
korea institute for international Economic Policy (kiEP)
300-4, yeorngok-dong, Seocho-Gu
PeCC memBeRS
ChineSe taiPeichinese taipei Pacific Economic
cooperation committee (ctPEcc)
taiwan institute of Economic research (tiEr)
5f, 16-8, tehui Street taipeichinese taipeitel: 886-2-2586 5000fax: 886-2-2594 6528 http://www.tier.org.tw
thailandthailand national committee for
Pacific Economic cooperation (tncPEc)
department of Economic affairsministry of foreign affairsSri ayudhya roadBangkok 10400thailandtel: 66 -2-6435248 fax: 66 - 2-6435247
United StateSunited States asia Pacific council1819 l Street, Second floorWashington, dc 20036uSatel: 1-202-293-3995fax: 1-202-293-1402http://www.usapc.org/
Viet namdepartment of multilateral
Economic cooperationVietnam chamber of commerce
and industry (Vcci)international relations
department9 dao duy anh Street, Hanoi
VietnamVietnamtel: 84-4-5742162fax: 84-4-5742020 /2030
P a c i f i c f o o d S y S t e m o u t l o o k 2 0 0 7 – 2 0 0 8 31P a c i f i c f o o d S y S t e m o u t l o o k 2 0 0 4 – 2 0 0 5 *
overviewthe Pacific Economic cooperation council (PEcc) is an independent, multi-stakeholder organization com-mitted to the promotion of cooperation and dialogue in the asia Pacific. founded in 1980, the PEcc is a network of member committees composed of individuals and institutions dedicated to promoting cooperation across the region. the council is one of the three official observers of the aPEc process.
PEcc was formed in 1980 at the initiative of mr. masayoshi ohira and mr. malcolm fraser, then Prime ministers of Japan and australia.
membershipcurrently PEcc has a total of 26 member committees representing the economies of australia, Brunei darussalam, canada, chile, china, colombia, Ecuador, Hong kong, china, indonesia, Japan, korea, malaysia, mexico, mongolia, new Zealand, the Pacific islands forum, Peru, the Philippines, Singapore, chinese taipei, thailand, the united States, Vietnam, and france Pacific territories and institutional mem-bers: the Pacific trade and development conference (Paftad) and Pacific Basin Economic council (PBEc).
member committees comprise representatives from business, government, academic, media and civil soci-ety who initiate and/or participate in PEcc work program while undertaking their own activities to promote asia Pacific cooperation in their respective economies.
governancePEcc’s governing body is its Standing committee which consists of the chairs of each member committee. the Standing committee meets once a year. day-to-day operations are managed by PEcc’s international Secretariat situated in Singapore.
ProjectsPEcc signature projects are decided on by the Standing committee and undertaken by its member commit-tees. in addition PEcc’s member committees also collaborate on a number of international projects.
for more information, contact the PEcc international Secretariat, lobby a, Seventh floor, 29 Heng mui keng terrace, Singapore 119620, tel: 65-6737 9822, fax: 65-6737 9824, email: [email protected]
PaCiFiC eConomiC CooPeRation CoUnCil
30 P a c i f i c f o o d S y S t e m o u t l o o k 2 0 0 8 - 2 0 0 9

the Pacific Food System Outlook represents the first regionwide coordinated effort to provide the outlook for the Pacific food system. the food system includes not just production agriculture, but also the whole complex of economic relationships and linkages that tie the region’s food consumers to producers. the goal of the Pacific Food System Outlook is to help increase knowledge about the diverse components of this vital segment of the global economy.
ISBN 978-981-230-891-7
9 7 8 9 8 1 2 3 0 8 9 1 7
PIC182