Robustness Generalizations of the Shortest Feasible Path ...
Upload
khangminh22Category
view
0download
0
minerals
Article
Clean and Feasible Utilization of High Silica Fluorspar Powdervia Reverse Flotation: A Pilot Study
Chenhu Zhang 1,2, Jiande Gao 2,3, Yuehua Hu 2,*, Wei Sun 2, Fei Lv 2 and Zhenjun Liu 2
Citation: Zhang, C.; Gao, J.; Hu, Y.;
Sun, W.; Lv, F.; Liu, Z. Clean and
Feasible Utilization of High Silica
Fluorspar Powder via Reverse
Flotation: A Pilot Study. Minerals
2021, 11, 555. https://doi.org/
10.3390/min11060555
Academic Editors: Kirsten
Claire Corin, Wenjihao Hu,
Peipei Wang, Ljudmilla Bokányi
and Zhiyong Gao
Received: 16 April 2021
Accepted: 20 May 2021
Published: 24 May 2021
Publisher’s Note: MDPI stays neutral
with regard to jurisdictional claims in
published maps and institutional affil-
iations.
Copyright: © 2021 by the authors.
Licensee MDPI, Basel, Switzerland.
This article is an open access article
distributed under the terms and
conditions of the Creative Commons
Attribution (CC BY) license (https://
creativecommons.org/licenses/by/
4.0/).
1 School of Chemistry and Material engineering, Liupanshui Normal University, Liupanshui 553004, China;[email protected]
2 School of Mineral Processing and Bioengineering, Central South University, Changsha 410083, China;[email protected] (J.G.); [email protected] (W.S.); [email protected] (F.L.); [email protected] (Z.L.)
3 College of Chemistry and Chemical Engineering, Central South University, Changsha 410083, China* Correspondence: [email protected]
Abstract: Fluorite is a nonrenewable mineral used to produce anhydrous hydrofluoric acid (AHF)and aluminum fluoride. The demand for low-grade fluorite powder (CaF2 < 97%) has fallen sharplyowing to the current market conditions. Therefore, a large number of fluorite concentrates havebeen improved by acid leaching. While this approach can efficiently remove CaCO3 from fluoriteconcentrate, the SiO2 content, which significantly affects AHF consumption during the productionof HF or aluminum fluoride, cannot be completely removed. To solve this problem, in this study,we used reverse flotation before leaching the fluorite concentrates. Subsequently, the feasibilityof reverse flotation desilication was determined. The obtained results of the ZP (zeta potential)measurements, solution chemistry analysis, FTIR (Fourier transform infrared spectroscopy) analysis,and micro-flotation tests indicated that employing dodecylamine as the collector and citric acid asthe depressor could effectively separate sericite from fluorite. The batch flotation experiment andthe pilot test were conducted in Chenzhou (Hunan, China) followed by their operation in XinyuanMining Co. Ltd., which produces monolithic fluorite ore on the large scale in Asia. Notably, wefound that the contents of both SiO2 and Al2O3 were from 2.82%, 1.17% reduced to 1.28%, 0.74% inthe batch flotation experiment. The results of the pilot test showed that the new reverse flotation +leaching technology could dramatically reduce the potential environmental impact and costs, therebysignificantly improving the economic benefits by satisfying the requirements of the market.
Keywords: fluorite; desilication; reverse flotation; leaching
1. Introduction
Fluorite (CaF2) is a non-renewable mineral and is employed as a flux agent in steelmak-ing and hydrofluoric acid production [1,2]. In China, the mineral is derived mainly fromnaturally occurring fluorite minerals and tailings of tungsten, and there are a few notabledifferences between both the production processes. Moreover, the ultimate objective ofevery Chinese company is to produce high-grade products (CaF2 ≥ 97%, SiO2 < 1%).
In the past, the fluorite concentrate’s quality index was usually CaF2 ≥ 97%. However,although the fluorite production was efficient, the side effects of resource exploitationin China were becoming increasingly apparent, and it was difficult to maintain a steadyproduction of high-grade fluorite, which contained more impurities than before. Thetwo major impurities found in fluorite concentrates are carbonate (CaCO3) and silicate(SiO2). Several studies reported that all commercial fluorite production processes used frothflotation to remove the impurities [3–7]. Furthermore, this method was widely employedto remove gangue minerals from fluorite concentrations to further improve the fluoritegrade [8–11].
The Jiepailing fluorite mine is the single largest fluorite deposit in China, and has thelargest ore of monolithic fluorite in Asia, and reserves 26.21 million tons of CaF2 mineral.
Minerals 2021, 11, 555. https://doi.org/10.3390/min11060555 https://www.mdpi.com/journal/minerals

Minerals 2021, 11, 555 2 of 15
In our previous study, the use of a two-stage depressed technology in the Jiepailing fluoritemine proved to be successful [12]. Thus far, a two-stage depressed process comprising oneroughing and six cleaning procedures has been used for the processing of fluorite minerals.Subsequently, concentrates containing 93% fluorite, 2.5% calcite, and 3.5% sericite wereobtained. Nonetheless, there is a lot of uncertainty regarding the current market and the costof fluorite powders (93% ≤ CaF2 ≤ 97%). This is primarily because CaCO3 in the fluoriteconcentrates consumes sulfuric acid (H2SO4) and is also associated with the generation ofheat energy and waste volume during the furnace reactions in the acidulation of fluoriteconcentrate. This creates a burden on anhydrous hydrofluoric acid (AHF) manufacturersbecause of the increased production costs. In such cases, leaching is the easiest solution. Asshown in Figure 1, the fluorite concentrate is leached by waste hydrochloric acid (from adownstream chemical plant) after flotation.
Minerals 2021, 11, x FOR PEER REVIEW 2 of 15
The Jiepailing fluorite mine is the single largest fluorite deposit in China, and has the largest ore of monolithic fluorite in Asia, and reserves 26.21 million tons of CaF2 mineral. In our previous study, the use of a two-stage depressed technology in the Jiepailing fluorite mine proved to be successful [12]. Thus far, a two-stage depressed process com-prising one roughing and six cleaning procedures has been used for the processing of fluorite minerals. Subsequently, concentrates containing 93% fluorite, 2.5% calcite, and 3.5% sericite were obtained. Nonetheless, there is a lot of uncertainty regarding the current market and the cost of fluorite powders (93% ≤ CaF2 ≤ 97%). This is primarily because CaCO3 in the fluorite concentrates consumes sulfuric acid (H2SO4) and is also associated with the generation of heat energy and waste volume during the furnace reactions in the acidulation of fluorite concentrate. This creates a burden on anhydrous hydrofluoric acid (AHF) manufacturers because of the increased production costs. In such cases, leaching is the easiest solution. As shown in Figure 1, the fluorite concentrate is leached by waste hydrochloric acid (from a downstream chemical plant) after flotation.
Figure 1. Acid leaching process of fluorite minerals in the Xinyuan dressing plant.
Through this process, the calcite present in the fluorite concentrate was removed completely, but the CaF2 content increased to ~96% only and the remaining impurities could not be removed by this method. Moreover, sericite (SiO2) is a more important im-purity than CaCO3 because it affects H2SO4 consumption during hydrofluoric acid (HF) or aluminum fluoride production. A number of side effects occur during the preparation owing to the hydrogen fluoride gas present in the reactor: 4HF (g) + SiO2 (s) = 2H2O (g) + SiF4 (g). Copious amounts of raw materials could be lost during production because of the high SiO2 content. Furthermore, against the background of this unprecedented situation caused by the pandemic, we need to find an effective method to desilicate fluorite concen-trates before leaching.
Currently, during the direct flotation process, it is difficult to remove the silica com-pletely via entrainment and the dissolved Ca ion might activate the sericite surface, as observed in our previous studies. In addition, further flotation cleaning was found to be ineffective. Therefore, we decided to use reverse flotation because it can be successful in cases where the gangue contains silicates (quartz or mica) and is floated with a collector of amine-type, while the valuable minerals are hydrophilic and are enriched in the under-flow fraction [13–15]. This method was also reported to be the most widely used technol-ogy for the desilicification of various important minerals, i.e., iron ore and magnesite ore [16–18]. Several studies have been focusing on various amines and their derivatives that can be employed as cationic collectors in reverse flotation. Dodecylamine (DDA) is excep-tionally effective as a collector of silicate minerals [19–22].
Figure 1. Acid leaching process of fluorite minerals in the Xinyuan dressing plant.
Through this process, the calcite present in the fluorite concentrate was removedcompletely, but the CaF2 content increased to ~96% only and the remaining impurities couldnot be removed by this method. Moreover, sericite (SiO2) is a more important impurity thanCaCO3 because it affects H2SO4 consumption during hydrofluoric acid (HF) or aluminumfluoride production. A number of side effects occur during the preparation owing tothe hydrogen fluoride gas present in the reactor: 4HF (g) + SiO2 (s) = 2H2O (g) + SiF4 (g).Copious amounts of raw materials could be lost during production because of the highSiO2 content. Furthermore, against the background of this unprecedented situation causedby the pandemic, we need to find an effective method to desilicate fluorite concentratesbefore leaching.
Currently, during the direct flotation process, it is difficult to remove the silica com-pletely via entrainment and the dissolved Ca ion might activate the sericite surface, asobserved in our previous studies. In addition, further flotation cleaning was found to beineffective. Therefore, we decided to use reverse flotation because it can be successful incases where the gangue contains silicates (quartz or mica) and is floated with a collector ofamine-type, while the valuable minerals are hydrophilic and are enriched in the underflowfraction [13–15]. This method was also reported to be the most widely used technology forthe desilicification of various important minerals, i.e., iron ore and magnesite ore [16–18].Several studies have been focusing on various amines and their derivatives that can beemployed as cationic collectors in reverse flotation. Dodecylamine (DDA) is exceptionallyeffective as a collector of silicate minerals [19–22].

Minerals 2021, 11, 555 3 of 15
Conversely, fluorite depressants can efficiently enhance the flotation separation ofsericite from fluorite. Liu and Zhang observed that citric acid (CA) might successfullyeradicate Ca2+ ions from the chalcopyrite surface, thereby associated with the increasein the selective flotation separation between galena and chalcopyrite through the use ofdextrin [23,24]. Additionally, Gao et al. and Gan et al. reported that CA exerts sufficientdepressive effects on the oleate flotation of fluorite because of its robust chelating capacitywith Mg2+ or Ca2+ [25,26]. Thus, these studies provided us with valuable insights intoour analysis.
Consequently, it is worthwhile to develop a new method to achieve desilication andpurification of fluorite concentrate before acid leaching. Although we have previouslyformulated an efficient two-stage depressing process for mineral processing, this studyaddresses the need for an efficient chemical scheme for improving the separation of sericiteminerals in fluorite flotation. Fundamental analyses, such as micro-flotation, batch flotation,solution chemistry analysis, ZP measurements, and FTIR were conducted for the detailedinformation regarding the mechanism. This pilot study was carried out in the Xinyuanfluorite dressing plant and can potentially solve several long-standing complicationsregarding the shortage of high-quality fluorite concentrates.
2. Materials and Methods
We obtained pure fluorite and sericite samples from Hunan, China. The spectra ofX-ray diffraction depicted in Figure 2 confirm the 98.41% and 91% purity of the fluoriteand sericite samples, respectively. Grinding of the samples was performed using anagate mortar.
Minerals 2021, 11, x FOR PEER REVIEW 3 of 15
Conversely, fluorite depressants can efficiently enhance the flotation separation of sericite from fluorite. Liu and Zhang observed that citric acid (CA) might successfully eradicate Ca2+ ions from the chalcopyrite surface, thereby associated with the increase in the selective flotation separation between galena and chalcopyrite through the use of dex-trin [23,24]. Additionally, Gao et al. and Gan et al. reported that CA exerts sufficient de-pressive effects on the oleate flotation of fluorite because of its robust chelating capacity with Mg2+ or Ca2+ [25,26]. Thus, these studies provided us with valuable insights into our analysis.
Consequently, it is worthwhile to develop a new method to achieve desilication and purification of fluorite concentrate before acid leaching. Although we have previously formulated an efficient two-stage depressing process for mineral processing, this study addresses the need for an efficient chemical scheme for improving the separation of seric-ite minerals in fluorite flotation. Fundamental analyses, such as micro-flotation, batch flo-tation, solution chemistry analysis, ZP measurements, and FTIR were conducted for the detailed information regarding the mechanism. This pilot study was carried out in the Xinyuan fluorite dressing plant and can potentially solve several long-standing complica-tions regarding the shortage of high-quality fluorite concentrates.
2. Materials and Methods We obtained pure fluorite and sericite samples from Hunan, China. The spectra of X-
ray diffraction depicted in Figure 2 confirm the 98.41% and 91% purity of the fluorite and sericite samples, respectively. Grinding of the samples was performed using an agate mor-tar.
Figure 2. Spectra of X-ray diffraction for (a) fluorite and (b) sericite samples used for the flotation tests.
A micro-floatation test was conducted with the particle size of the fraction range from +37–74 μm. Further grinding of the samples was performed to obtain -5 μm size, and they were then used for ZP measurements and FTIR.
The fluorite concentrate in the real ore flotation test was a flotation separation con-centrate supplied by Hunan Xinyuan Mineral Company. The samples consisted of 92.87% CaF2 and 2.82% SiO2.
The following suppliers were contacted for the chemically pure reagents: citric acid (H2C2O4) from Aladdin Biological Technology Ltd., Shanghai, China, and DDA (C12H27N) from Baisaiqin Chemical Technology Co., Ltd., Shanghai, China. Diluted solutions (0.1%) of HCl or NaOH were used for adjusting the pH.
Deionized water (DI, 18 mΩ·cm) was used for micro-flotation and test experiments.
2.1. Micro-Flotation Experiments A hitch-groove flotation cell (40-mL), kept in a mechanically agitated flotation ma-
chine, was used to conduct the micro-flotation experiment. Particles (2.0 g) of the pure mineral were kept in a Plexiglas cell containing DI water (35 mL). For 2 min the pH of the
Figure 2. Spectra of X-ray diffraction for (a) fluorite and (b) sericite samples used for the flotation tests.
A micro-floatation test was conducted with the particle size of the fraction range from+37–74 µm. Further grinding of the samples was performed to obtain −5 µm size, and theywere then used for ZP measurements and FTIR.
The fluorite concentrate in the real ore flotation test was a flotation separation con-centrate supplied by Hunan Xinyuan Mineral Company. The samples consisted of 92.87%CaF2 and 2.82% SiO2.
The following suppliers were contacted for the chemically pure reagents: citric acid(H2C2O4) from Aladdin Biological Technology Ltd., Shanghai, China, and DDA (C12H27N)from Baisaiqin Chemical Technology Co., Ltd., Shanghai, China. Diluted solutions (0.1%)of HCl or NaOH were used for adjusting the pH.
Deionized water (DI, 18 mΩ·cm) was used for micro-flotation and test experiments.
2.1. Micro-Flotation Experiments
A hitch-groove flotation cell (40-mL), kept in a mechanically agitated flotation ma-chine, was used to conduct the micro-flotation experiment. Particles (2.0 g) of the puremineral were kept in a Plexiglas cell containing DI water (35 mL). For 2 min the pH of

Minerals 2021, 11, 555 4 of 15
the resulting suspension was adjusted via the addition of NaOH or HCl, followed bydepressant incorporation. Post 3 min conditioning of the suspension with the depressant,incorporation of the collector was made and provided 3 min agitation for the suspension.
For the flotation of the individual mineral, we collected and filtered the floated and un-floated particles and allowed them to dry. Individual micro-flotation tests were performedthrice and their average values were reported as the final result.
2.2. Measurement of Zeta Potential
Measurement for the ZP was carried out at 20 C via the ZP analyzer (Zetasizer,Malvern, UK). The mineral suspensions with 40 mL of KCl (0.01 mol/L) and 0.016 g solidswere prepared at a given collector concentration and pH and were used as the backgroundelectrolyte. The supernatant liquor obtained after a settling period of 5 min was used tomeasure the ZP measurement.
2.3. FTIR Spectral Analysis
We recorded the FTIR spectra of the samples on a Bruker Alpha FTIR spectrometer(Thermo, Waltham, MA, USA) at ~25 C. Analysis of the samples was conducted by forminga KBr disc and scanned over a range of 400 to 4000 cm−1. Analysis procedures for thepowder samples were as follows: the mineral powder (0.1 g) addition to the solution of thedesired volume (25 mL) was carried out, followed by ultrasonication and stirring for 3 mineach, and then treated for 6 min. After filtration, the solid material was obtained by using avacuum drying method for the subsequent FTIR reflection spectroscopic measurements.The infrared spectrum of the untreated mineral was considered as the reference.
2.4. Batch Flotation Experiment
Fluorite concentrate ores were procured from Xinyuan Mining Co. Ltd. (Chenzhou,China) and were then divided into two portions. One portion was separated from theorigin reagents using ultrasonic cleaning equipment, and the other was left unchanged.In an XFD-63 flotation cell (0.5 L) at a pH of approximately 6, the pulp was conditionedto solids (30%) with the depressant and collector. Fluorite concentrate (100 g) was usedfor flotation tests with l700 r/min flotation impeller speed. The tests of ore flotation werecarried out according to the illustration described in Figure 3. Three replicates of theexperiments were conducted and their mean values were regarded as the final results.
Minerals 2021, 11, x FOR PEER REVIEW 4 of 15
resulting suspension was adjusted via the addition of NaOH or HCl, followed by depres-sant incorporation. Post 3 min conditioning of the suspension with the depressant, incor-poration of the collector was made and provided 3 min agitation for the suspension.
For the flotation of the individual mineral, we collected and filtered the floated and unfloated particles and allowed them to dry. Individual micro-flotation tests were per-formed thrice and their average values were reported as the final result.
2.2. Measurement of Zeta Potential Measurement for the ZP was carried out at 20 °C via the ZP analyzer (Zetasizer, Mal-
vern, England). The mineral suspensions with 40 mL of KCl (0.01 mol/L) and 0.016 g solids were prepared at a given collector concentration and pH and were used as the background electrolyte. The supernatant liquor obtained after a settling period of 5 min was used to measure the ZP measurement.
2.3. FTIR Spectral Analysis We recorded the FTIR spectra of the samples on a Bruker Alpha FTIR spectrometer
(Thermo, Waltham, MA, USA) at ~25 °C. Analysis of the samples was conducted by form-ing a KBr disc and scanned over a range of 400 to 4000 cm−1. Analysis procedures for the powder samples were as follows: the mineral powder (0.1 g) addition to the solution of the desired volume (25 mL) was carried out, followed by ultrasonication and stirring for 3 min each, and then treated for 6 min. After filtration, the solid material was obtained by using a vacuum drying method for the subsequent FTIR reflection spectroscopic meas-urements. The infrared spectrum of the untreated mineral was considered as the refer-ence.
2.4. Batch Flotation Experiment Fluorite concentrate ores were procured from Xinyuan Mining Co. Ltd. (Chenzhou,
China) and were then divided into two portions. One portion was separated from the origin reagents using ultrasonic cleaning equipment, and the other was left unchanged. In an XFD-63 flotation cell (0.5 L) at a pH of approximately 6, the pulp was conditioned to solids (30%) with the depressant and collector. Fluorite concentrate (100 g) was used for flotation tests with l700 r/min flotation impeller speed. The tests of ore flotation were car-ried out according to the illustration described in Figure 3. Three replicates of the experi-ments were conducted and their mean values were regarded as the final results.
Figure 3. Flowsheet of the flotation tests. Figure 3. Flowsheet of the flotation tests.
Minerals 2021, 11, 555 5 of 15
2.5. Pilot Test
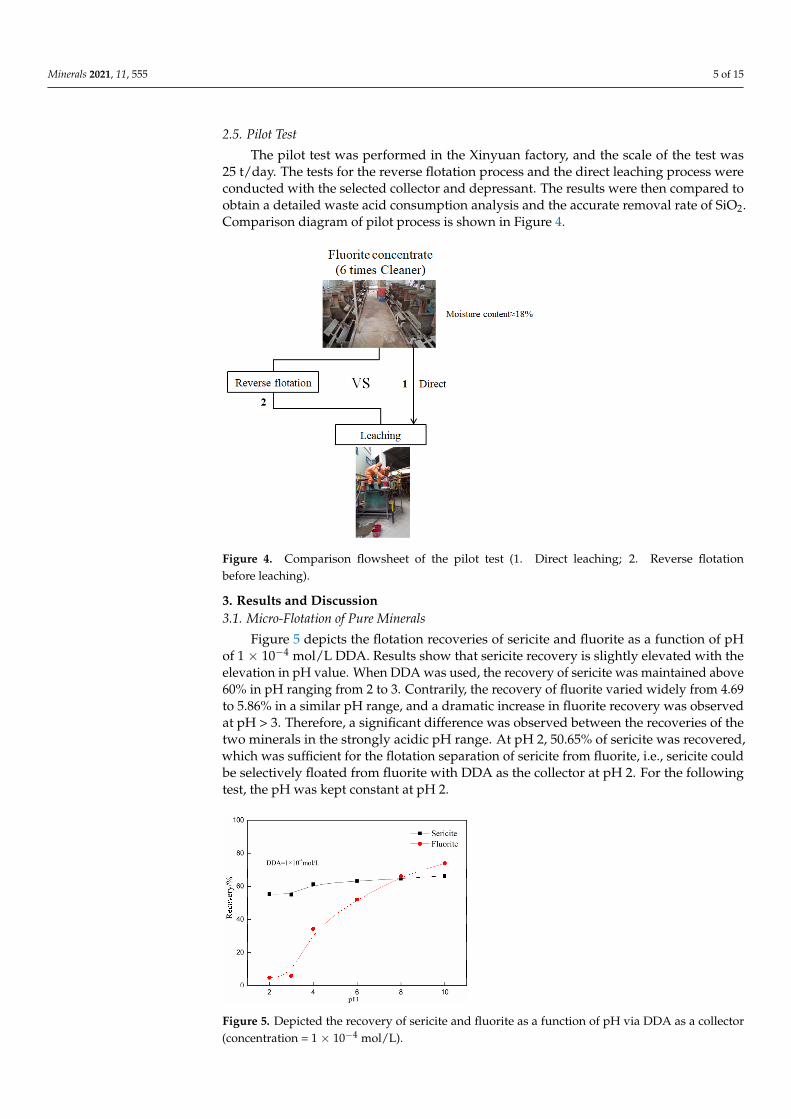
The pilot test was performed in the Xinyuan factory, and the scale of the test was25 t/day. The tests for the reverse flotation process and the direct leaching process wereconducted with the selected collector and depressant. The results were then compared toobtain a detailed waste acid consumption analysis and the accurate removal rate of SiO2.Comparison diagram of pilot process is shown in Figure 4.
Minerals 2021, 11, x FOR PEER REVIEW 5 of 15
2.5. Pilot Test The pilot test was performed in the Xinyuan factory, and the scale of the test was 25
t/day. The tests for the reverse flotation process and the direct leaching process were con-ducted with the selected collector and depressant. The results were then compared to ob-tain a detailed waste acid consumption analysis and the accurate removal rate of SiO2. Comparison diagram of pilot process is shown in Figure 4.
Figure 4. Comparison flowsheet of the pilot test (1. Direct leaching; 2. Reverse flotation before leaching).
3. Results and Discussion 3.1. Micro-Flotation of Pure Minerals
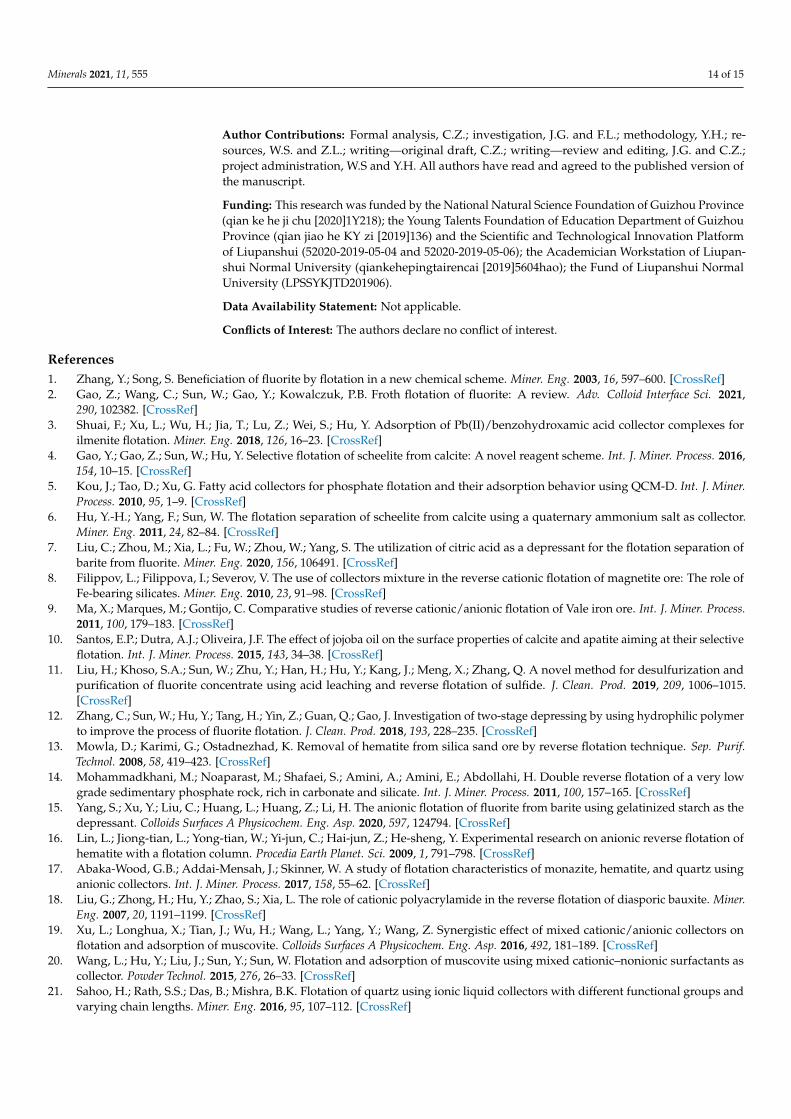
Figure 5 depicts the flotation recoveries of sericite and fluorite as a function of pH of 1 × 10⁻⁴ mol/L DDA. Results show that sericite recovery is slightly elevated with the ele-vation in pH value. When DDA was used, the recovery of sericite was maintained above 60% in pH ranging from 2 to 3. Contrarily, the recovery of fluorite varied widely from 4.69 to 5.86% in a similar pH range, and a dramatic increase in fluorite recovery was observed at pH > 3. Therefore, a significant difference was observed between the recoveries of the two minerals in the strongly acidic pH range. At pH 2, 50.65% of sericite was recovered, which was sufficient for the flotation separation of sericite from fluorite, i.e., sericite could be selectively floated from fluorite with DDA as the collector at pH 2. For the following test, the pH was kept constant at pH 2.
Figure 5. depicted the recovery of sericite and fluorite as a function of pH via DDA as a collector (concentration = 1 × 10⁻⁴ mol/L).
Figure 4. Comparison flowsheet of the pilot test (1. Direct leaching; 2. Reverse flotationbefore leaching).
3. Results and Discussion3.1. Micro-Flotation of Pure Minerals
Figure 5 depicts the flotation recoveries of sericite and fluorite as a function of pHof 1 × 10⁻⁴ mol/L DDA. Results show that sericite recovery is slightly elevated with theelevation in pH value. When DDA was used, the recovery of sericite was maintained above60% in pH ranging from 2 to 3. Contrarily, the recovery of fluorite varied widely from 4.69to 5.86% in a similar pH range, and a dramatic increase in fluorite recovery was observedat pH > 3. Therefore, a significant difference was observed between the recoveries of thetwo minerals in the strongly acidic pH range. At pH 2, 50.65% of sericite was recovered,which was sufficient for the flotation separation of sericite from fluorite, i.e., sericite couldbe selectively floated from fluorite with DDA as the collector at pH 2. For the followingtest, the pH was kept constant at pH 2.
Minerals 2021, 11, x FOR PEER REVIEW 5 of 15
2.5. Pilot Test The pilot test was performed in the Xinyuan factory, and the scale of the test was 25
t/day. The tests for the reverse flotation process and the direct leaching process were con-ducted with the selected collector and depressant. The results were then compared to ob-tain a detailed waste acid consumption analysis and the accurate removal rate of SiO2. Comparison diagram of pilot process is shown in Figure 4.
Figure 4. Comparison flowsheet of the pilot test (1. Direct leaching; 2. Reverse flotation before leaching).
3. Results and Discussion 3.1. Micro-Flotation of Pure Minerals
Figure 5 depicts the flotation recoveries of sericite and fluorite as a function of pH of 1 × 10⁻⁴ mol/L DDA. Results show that sericite recovery is slightly elevated with the ele-vation in pH value. When DDA was used, the recovery of sericite was maintained above 60% in pH ranging from 2 to 3. Contrarily, the recovery of fluorite varied widely from 4.69 to 5.86% in a similar pH range, and a dramatic increase in fluorite recovery was observed at pH > 3. Therefore, a significant difference was observed between the recoveries of the two minerals in the strongly acidic pH range. At pH 2, 50.65% of sericite was recovered, which was sufficient for the flotation separation of sericite from fluorite, i.e., sericite could be selectively floated from fluorite with DDA as the collector at pH 2. For the following test, the pH was kept constant at pH 2.
Figure 5. depicted the recovery of sericite and fluorite as a function of pH via DDA as a collector (concentration = 1 × 10⁻⁴ mol/L). Figure 5. Depicted the recovery of sericite and fluorite as a function of pH via DDA as a collector(concentration = 1 × 10⁻⁴ mol/L).

Minerals 2021, 11, 555 6 of 15
Figure 6 demonstrates the sericite and fluorite recovery as a function of DDA dosage atpH 2 and the picture showing that the sericite recovery slowly increased with an elevationin the concentration of DDA. The selective flotation of sericite and fluorite can be achievedwith a DDA concentration higher than 20 × 10−5 mol/L. Though, the sericite recoverywas only ~69%. Moreover, owing to its hydrophilic property, hardly 31% of the sericitewas removed from the pulp. Nevertheless, the recovery of fluorite increased rapidly whengreater than 20 × 10−5 mol/L of concentration of DDA was there. This was becauseentrainment still exists because froth collapse from high concentration DDA is a longtime. Although the result of the separation was satisfactory, it was difficult to operate theproduction process in a highly acidic environment (pH = 2) because of the potentially highcost and equipment corrosion. Thus, CA was used to depress fluorite, which hindered theadsorption with DDA. Figure 7 displays sericite and fluorite recovery as a function of CAdosage at pH 7.
Minerals 2021, 11, x FOR PEER REVIEW 6 of 15
Figure 6 demonstrates the sericite and fluorite recovery as a function of DDA dosage at pH 2 and the picture showing that the sericite recovery slowly increased with an eleva-tion in the concentration of DDA. The selective flotation of sericite and fluorite can be achieved with a DDA concentration higher than 20 × 10–5 mol/L. Though, the sericite re-covery was only ~69%. Moreover, owing to its hydrophilic property, hardly 31% of the sericite was removed from the pulp. Nevertheless, the recovery of fluorite increased rap-idly when greater than 20 × 10–5 mol/L of concentration of DDA was there. This was be-cause entrainment still exists because froth collapse from high concentration DDA is a long time. Although the result of the separation was satisfactory, it was difficult to operate the production process in a highly acidic environment (pH = 2) because of the potentially high cost and equipment corrosion. Thus, CA was used to depress fluorite, which hin-dered the adsorption with DDA. Figure 7 displays sericite and fluorite recovery as a func-tion of CA dosage at pH 7.
Figure 6. Recovery of sericite and fluorite as a function of DDA dosage at pH 2.
Figure 7. Recovery of sericite and fluorite as a function of CA dosage at pH 7.
Figure 7 reveals that the recovery of sericite was stable under weak acid or neutral conditions. Almost the same recovery was observed in the presence of CA as observed in its absence, indicating the weak depressive effect of CA on sericite flotation. Nevertheless, the recovery of fluorite sharply decreased when the CA concentration increased. When the CA dosage was 5 × 10⁻⁴ mol/L, the minimum fluorite recovery reached 4.83%. Based on these results, it was conjectured that CA could effectively depress fluorite at pH 7.
CA is a widely available trimacinic organic acid and could effectively adjust the value of pulp pH. The pH of the pulp was approximately 5, which was increased by the CA dosage (5 × 10⁻⁴ mol/L) as presented in Figure 7. In addition, the pH value of the solution was found to play the most imperative role in the flotation process (Figure 5). To deter-mine the impact of depressing by CA in the flotation process, Figure 8 shows the recovery of sericite and fluorite with or without CA as a function of DDA dosage.
Figure 6. Recovery of sericite and fluorite as a function of DDA dosage at pH 2.
Minerals 2021, 11, x FOR PEER REVIEW 6 of 15
Figure 6 demonstrates the sericite and fluorite recovery as a function of DDA dosage at pH 2 and the picture showing that the sericite recovery slowly increased with an eleva-tion in the concentration of DDA. The selective flotation of sericite and fluorite can be achieved with a DDA concentration higher than 20 × 10–5 mol/L. Though, the sericite re-covery was only ~69%. Moreover, owing to its hydrophilic property, hardly 31% of the sericite was removed from the pulp. Nevertheless, the recovery of fluorite increased rap-idly when greater than 20 × 10–5 mol/L of concentration of DDA was there. This was be-cause entrainment still exists because froth collapse from high concentration DDA is a long time. Although the result of the separation was satisfactory, it was difficult to operate the production process in a highly acidic environment (pH = 2) because of the potentially high cost and equipment corrosion. Thus, CA was used to depress fluorite, which hin-dered the adsorption with DDA. Figure 7 displays sericite and fluorite recovery as a func-tion of CA dosage at pH 7.
Figure 6. Recovery of sericite and fluorite as a function of DDA dosage at pH 2.
Figure 7. Recovery of sericite and fluorite as a function of CA dosage at pH 7.
Figure 7 reveals that the recovery of sericite was stable under weak acid or neutral conditions. Almost the same recovery was observed in the presence of CA as observed in its absence, indicating the weak depressive effect of CA on sericite flotation. Nevertheless, the recovery of fluorite sharply decreased when the CA concentration increased. When the CA dosage was 5 × 10⁻⁴ mol/L, the minimum fluorite recovery reached 4.83%. Based on these results, it was conjectured that CA could effectively depress fluorite at pH 7.
CA is a widely available trimacinic organic acid and could effectively adjust the value of pulp pH. The pH of the pulp was approximately 5, which was increased by the CA dosage (5 × 10⁻⁴ mol/L) as presented in Figure 7. In addition, the pH value of the solution was found to play the most imperative role in the flotation process (Figure 5). To deter-mine the impact of depressing by CA in the flotation process, Figure 8 shows the recovery of sericite and fluorite with or without CA as a function of DDA dosage.
Figure 7. Recovery of sericite and fluorite as a function of CA dosage at pH 7.
Figure 7 reveals that the recovery of sericite was stable under weak acid or neutralconditions. Almost the same recovery was observed in the presence of CA as observed inits absence, indicating the weak depressive effect of CA on sericite flotation. Nevertheless,the recovery of fluorite sharply decreased when the CA concentration increased. When theCA dosage was 5 × 10⁻⁴ mol/L, the minimum fluorite recovery reached 4.83%. Based onthese results, it was conjectured that CA could effectively depress fluorite at pH 7.
CA is a widely available trimacinic organic acid and could effectively adjust the valueof pulp pH. The pH of the pulp was approximately 5, which was increased by the CAdosage (5 × 10⁻⁴ mol/L) as presented in Figure 7. In addition, the pH value of the solutionwas found to play the most imperative role in the flotation process (Figure 5). To determinethe impact of depressing by CA in the flotation process, Figure 8 shows the recovery ofsericite and fluorite with or without CA as a function of DDA dosage.

Minerals 2021, 11, 555 7 of 15Minerals 2021, 11, x FOR PEER REVIEW 7 of 15
Figure 8. Recovery of sericite and fluorite both in the presence and absence of CA as a function of DDA dosage.
The obtained results in Figure 8 showed the satisfactory separation of sericite and fluorite by DDA in the presence of CA at a neutral pH, but high dosages of CA affected the pH, which can be elucidated with a comparison. In this test, the effect of DDA concen-tration was investigated in the absence and presence of CA at pH 5.
Furthermore, when the DDA concentration was 2 × 10⁻⁴ mol/L at pH 5, the floatability of the fluorite treated with CA was far lower than that of the untreated fluorite. The dif-ference in floatability between the two conditions was approximately 55% when the DDA concentration was 3 × 10⁻⁴ mol/L. This result indicated that the fluorite surface pretreat-ment, which reduced the pH prior to DDA addition, was beneficial to the depressing be-havior of fluorite. This finding could be ascribed to the decreasing of the pH level in the pulp because of the acidity of CA. However, the main reason is the decrease in the DDA amount adsorbed onto the fluorite surface treated with CA. It could be concluded that CA not only preserved the pH value of the pulp for the best flotation conditions for sericite but also effectively depressed the fluorite.
3.2. Zeta Potential (ZP) To investigate the pH effect on the fluorite and sericite ZP in the presence of the col-
lector, electrokinetic potentials were measured with CA (Figure 9). In the pH range of 2 to 11, the pure sericite minerals were always negatively charged, this is in a consistent with the results of the earlier study [27]. In the absence of reagents, fluorite had an isoelectric point (IEP) at pH 7.8, which was also in agreement with existing studies [28].
Figure 9. ZP of (a) sericite and (b) fluorite as a function of pH in various conditions.
As seen in Figure 9a, when the pH was in the range 2–11, the ZP of sericite changed from negative to positive in the presence of DDA. This indicated that a high level of DDA amount has been absorbed on the sericite surface. Additionally, upon the addition of de-pressant CA, the ZP decreased by approximately 10 mV at the IEP ZP of sericite. This implied the slight absorption of CA on the negatively charged sericite surface and that the
Figure 8. Recovery of sericite and fluorite both in the presence and absence of CA as a function ofDDA dosage.
The obtained results in Figure 8 showed the satisfactory separation of sericite andfluorite by DDA in the presence of CA at a neutral pH, but high dosages of CA affected thepH, which can be elucidated with a comparison. In this test, the effect of DDA concentrationwas investigated in the absence and presence of CA at pH 5.
Furthermore, when the DDA concentration was 2 × 10⁻⁴ mol/L at pH 5, the floatabil-ity of the fluorite treated with CA was far lower than that of the untreated fluorite. Thedifference in floatability between the two conditions was approximately 55% when theDDA concentration was 3 × 10⁻⁴ mol/L. This result indicated that the fluorite surface pre-treatment, which reduced the pH prior to DDA addition, was beneficial to the depressingbehavior of fluorite. This finding could be ascribed to the decreasing of the pH level in thepulp because of the acidity of CA. However, the main reason is the decrease in the DDAamount adsorbed onto the fluorite surface treated with CA. It could be concluded that CAnot only preserved the pH value of the pulp for the best flotation conditions for sericite butalso effectively depressed the fluorite.
3.2. Zeta Potential (ZP)
To investigate the pH effect on the fluorite and sericite ZP in the presence of thecollector, electrokinetic potentials were measured with CA (Figure 9). In the pH range of2 to 11, the pure sericite minerals were always negatively charged, this is in a consistentwith the results of the earlier study [27]. In the absence of reagents, fluorite had anisoelectric point (IEP) at pH 7.8, which was also in agreement with existing studies [28].
Minerals 2021, 11, x FOR PEER REVIEW 7 of 15
Figure 8. Recovery of sericite and fluorite both in the presence and absence of CA as a function of DDA dosage.
The obtained results in Figure 8 showed the satisfactory separation of sericite and fluorite by DDA in the presence of CA at a neutral pH, but high dosages of CA affected the pH, which can be elucidated with a comparison. In this test, the effect of DDA concen-tration was investigated in the absence and presence of CA at pH 5.
Furthermore, when the DDA concentration was 2 × 10⁻⁴ mol/L at pH 5, the floatability of the fluorite treated with CA was far lower than that of the untreated fluorite. The dif-ference in floatability between the two conditions was approximately 55% when the DDA concentration was 3 × 10⁻⁴ mol/L. This result indicated that the fluorite surface pretreat-ment, which reduced the pH prior to DDA addition, was beneficial to the depressing be-havior of fluorite. This finding could be ascribed to the decreasing of the pH level in the pulp because of the acidity of CA. However, the main reason is the decrease in the DDA amount adsorbed onto the fluorite surface treated with CA. It could be concluded that CA not only preserved the pH value of the pulp for the best flotation conditions for sericite but also effectively depressed the fluorite.
3.2. Zeta Potential (ZP) To investigate the pH effect on the fluorite and sericite ZP in the presence of the col-
lector, electrokinetic potentials were measured with CA (Figure 9). In the pH range of 2 to 11, the pure sericite minerals were always negatively charged, this is in a consistent with the results of the earlier study [27]. In the absence of reagents, fluorite had an isoelectric point (IEP) at pH 7.8, which was also in agreement with existing studies [28].
Figure 9. ZP of (a) sericite and (b) fluorite as a function of pH in various conditions.
As seen in Figure 9a, when the pH was in the range 2–11, the ZP of sericite changed from negative to positive in the presence of DDA. This indicated that a high level of DDA amount has been absorbed on the sericite surface. Additionally, upon the addition of de-pressant CA, the ZP decreased by approximately 10 mV at the IEP ZP of sericite. This implied the slight absorption of CA on the negatively charged sericite surface and that the
Figure 9. ZP of (a) sericite and (b) fluorite as a function of pH in various conditions.
As seen in Figure 9a, when the pH was in the range 2–11, the ZP of sericite changedfrom negative to positive in the presence of DDA. This indicated that a high level of DDAamount has been absorbed on the sericite surface. Additionally, upon the addition ofdepressant CA, the ZP decreased by approximately 10 mV at the IEP ZP of sericite. Thisimplied the slight absorption of CA on the negatively charged sericite surface and thatthe interaction between CA and the negatively charged sericite was weak. The depressant

Minerals 2021, 11, 555 8 of 15
CA and the collector DDA incorporation increased the ZP of sericite by 35 mV, whichsuggested a strong electrostatic interaction of positively charged DDA with the negativelycharged surface of sericite. The sericite ZP results in the presence of reagents also indicatedthat the quite stronger adsorption of DDA on the sericite surface than that of CA. Therefore,CA had little influence on the adsorption on the sericite surface. This is in good agreementwith the results of the flotation depicted in Figure 6.
As shown in Figure 9b, a positively charged fluorite surface was observed at pH < 7.8while it was negatively charged at pH > 7.8. After the addition of DDA to the pulpsuspension, the ZP in the entire pH range increased, and rose more quickly at pH > 7.8,i.e., the ZP increased negatively, indicating that the interaction between DDA and fluoritesurfaces gradually strengthened with increasing pH.
Additionally, depressant CA incorporation alters the fluorite ZP significantly, as it wasdecreased by an average of 25 mV during flotation, suggesting the strong depressant CAadsorption onto the fluorite surface. Unlike sericite, when both the collector DDA and thedepressant CA were present, the fluorite ZP remained negative and only a slight increasethan that in the presence of CA alone was observed in the pH range 2–11. This impliedthat the DDA adsorption on the surface of fluorite might be increasingly hindered by thepresence of CA.
3.3. Solution Chemistry Analysis
The analysis of the solution chemistry of flotation is an effective way to examinethe surface characteristics of the minerals and the reagents in the process of mineralflotation [29]. The solution chemistry equilibria of DDA are given as,
RNH2(s) = RNH2(aq) S = 10−4.70 (1)
RNH3+ = RNH2(aq) + H+ Ka = 10−10.63 (2)
2RNH3+ = (RNH3
2+)2+2 Kd = 102.08 (3)
RNH3+ + RNH2(aq) =
[RNH3
+·RNH2(aq)
]Kim = 103.12 (4)
The solution chemistry equilibria of CA are as follows:
H3Cit = H2Cit − + H+ Ka1 = 10−3.13 (5)
H2Cit − = HCit 2− + H+ Ka2 = 10−4.76 (6)
HCit 2− = Cit 3− + H+ Ka3 = 10−6.4 (7)
Cit 3− = Cit 4− + H+ Ka4 = 10−11.6 (8)
Based on the above formulas, at DDA concentration (CDDA) = 2 × 10⁻⁴ mol/L,Figures 10 and 11 demonstrate the component distributions of DDA and CA, respectively,as a function of pH.
Figure 10 indicated the precipitation of neutral RNH2 molecule at pH 10.04, and itsionic forms (RNH3)2
2+ and RNH3+ dominated in a pH range of 2.0–9.5. The maximum
ion–molecular complex was observed at pH 9.85. Moreover, the sericite surface wasalways negative because the pH was less than 10. The primary species of the collector areRNH2·RNH3
+, RNH3+, and (RNH3)2
2+, so the electrostatic adsorption was strong betweenthe two. Nevertheless, at pH 7.8–10, the fluorite surface changed from positive to negative,i.e., the DDA adsorption capacity on the fluorite surface increased in a weak alkalineenvironment, which is in agreement with the flotation data that was obtained earlier.

Minerals 2021, 11, 555 9 of 15
Minerals 2021, 11, x FOR PEER REVIEW 8 of 15
interaction between CA and the negatively charged sericite was weak. The depressant CA and the collector DDA incorporation increased the ZP of sericite by 35 mV, which sug-gested a strong electrostatic interaction of positively charged DDA with the negatively charged surface of sericite. The sericite ZP results in the presence of reagents also indi-cated that the quite stronger adsorption of DDA on the sericite surface than that of CA. Therefore, CA had little influence on the adsorption on the sericite surface. This is in good agreement with the results of the flotation depicted in Figure 6.
As shown in Figure 9b, a positively charged fluorite surface was observed at pH < 7.8 while it was negatively charged at pH > 7.8. After the addition of DDA to the pulp sus-pension, the ZP in the entire pH range increased, and rose more quickly at pH > 7.8, i.e., the ZP increased negatively, indicating that the interaction between DDA and fluorite sur-faces gradually strengthened with increasing pH.
Additionally, depressant CA incorporation alters the fluorite ZP significantly, as it was decreased by an average of 25 mV during flotation, suggesting the strong depressant CA adsorption onto the fluorite surface. Unlike sericite, when both the collector DDA and the depressant CA were present, the fluorite ZP remained negative and only a slight in-crease than that in the presence of CA alone was observed in the pH range 2–11. This implied that the DDA adsorption on the surface of fluorite might be increasingly hindered by the presence of CA.
3.3. Solution Chemistry Analysis The analysis of the solution chemistry of flotation is an effective way to examine the
surface characteristics of the minerals and the reagents in the process of mineral flotation [29]. The solution chemistry equilibria of DDA are given as,
RNH ( ) = RNH ( ) S = 10 . (1)
RNH = RNH ( ) + H K = 10 . (2)
2RNH = (RNH ) K = 10 . (3)
RNH + RNH ( ) = [RNH ∙ RNH ( )] K = 10 . (4)
The solution chemistry equilibria of CA are as follows:
H Cit = H Cit + H K = 10 . (5)
H Cit = HCit + H K = 10 . (6)
HCit = Cit + H K = 10 . (7)
Cit = Cit + H K = 10 . (8)
Based on the above formulas, at DDA concentration (CDDA) = 2 × 10⁻⁴ mol/L, Figures 10 and 11 demonstrate the component distributions of DDA and CA, respectively, as a function of pH.
Figure 10. Species distribution diagram of DDA as a function of pH. (DDA total conc. = 2.0 × 10⁻⁴ mol/L.) Figure 10. Species distribution diagram of DDA as a function of pH. (DDA totalconc. = 2.0 × 10⁻⁴ mol/L.)
Minerals 2021, 11, x FOR PEER REVIEW 9 of 15
Figure 11. Species distribution diagram of CA as a function of pH (25 °C and 1 atm) [30].
Figure 10 indicated the precipitation of neutral RNH2 molecule at pH 10.04, and its ionic forms (RNH3)22+ and RNH3+ dominated in a pH range of 2.0–9.5. The maximum ion–molecular complex was observed at pH 9.85. Moreover, the sericite surface was always negative because the pH was less than 10. The primary species of the collector are RNH2·RNH3+, RNH3+, and (RNH3)22+, so the electrostatic adsorption was strong between the two. Nevertheless, at pH 7.8–10, the fluorite surface changed from positive to negative, i.e., the DDA adsorption capacity on the fluorite surface increased in a weak alkaline en-vironment, which is in agreement with the flotation data that was obtained earlier.
As seen in Figure 11, the Cit3− species reached a maximum at pH 9.9, showing con-sistency with the flotation behavior of fluorite. In a strongly alkaline medium, the main CA species was Cit3− and they played a significant role in the inhibition of fluorite. Certain studies have shown that the reactions of Ca2+ and Cit3− ions were thermodynamically fa-vored at pH in the range 5.5–13.0 [31]. Thus, anionic Cit3− was adsorbed onto the nega-tively charged fluorite surface at pH > IEP 7.8 via chemical adsorption process rather than electrostatic attraction. In addition, fluorite ZP showed a significant difference when treated with both CA and DDA. Compared to the ZP in the presence of CA alone, the ZP of fluorite in the presence of both CA and DDA shifted to a slightly more acidic value. We assumed that DDA was physically adsorbed onto the fluorite surface in a similar manner to the sericite surface. However, in a pH range from 2–11, the pH of the fluorite surface treated by both CA and DDA changed to high alkaline values. Thus, the assumption was invalid. Furthermore, this result implied that Cit ions in the pulp suspension transferred to the fluorite surfaces as the hydrolysis progressed and that additional chelates could be formed.
3.4. FTIR Results The above experiments and analyses demonstrated that the depressant CA and the
collector DDA could be selectively adsorbed onto sericite and fluorite surfaces, but the adsorption mechanism remains unclear and needs to be elucidated. Here, we analyze the FTIR spectra of sericite and fluorite to study the possible adsorption mechanism.
Sericite has two clear characteristic peaks at 3628 and 1024 cm–1 (Figure 12a), which were associated with stretching vibration of the Al–OH groups and the in-plane stretching of the Si-O-Si (Al) or Si (Al)-O groups, respectively [32]. The peaks at 2357 and 2360 cm–1 were ascribed to the CO2 impurities (exclusion). For the DDA spectrum, two peaks at 2918 and 2844 cm–1 were attributed to –CH stretching. Similarly, the peak appearing at 2364 cm−1 and having a shoulder at 2335 cm–1 was attributed to the stretching of –CN group [33,34]. The spectra obtained for sericite with DDA indicated that the –CH3 or –CH2 stretching bands appeared at 2847 and 2919 cm–1. Additional band shifts of DDA could not be used to determine the electrostatic adsorption of DDA onto the surface of sericite.
Figure 11. Species distribution diagram of CA as a function of pH (25 C and 1 atm) [30].
As seen in Figure 11, the Cit3− species reached a maximum at pH 9.9, showingconsistency with the flotation behavior of fluorite. In a strongly alkaline medium, the mainCA species was Cit3− and they played a significant role in the inhibition of fluorite. Certainstudies have shown that the reactions of Ca2+ and Cit3− ions were thermodynamicallyfavored at pH in the range 5.5–13.0 [31]. Thus, anionic Cit3− was adsorbed onto thenegatively charged fluorite surface at pH > IEP 7.8 via chemical adsorption process ratherthan electrostatic attraction. In addition, fluorite ZP showed a significant difference whentreated with both CA and DDA. Compared to the ZP in the presence of CA alone, the ZPof fluorite in the presence of both CA and DDA shifted to a slightly more acidic value. Weassumed that DDA was physically adsorbed onto the fluorite surface in a similar mannerto the sericite surface. However, in a pH range from 2–11, the pH of the fluorite surfacetreated by both CA and DDA changed to high alkaline values. Thus, the assumption wasinvalid. Furthermore, this result implied that Cit ions in the pulp suspension transferredto the fluorite surfaces as the hydrolysis progressed and that additional chelates couldbe formed.
3.4. FTIR Results
The above experiments and analyses demonstrated that the depressant CA and thecollector DDA could be selectively adsorbed onto sericite and fluorite surfaces, but theadsorption mechanism remains unclear and needs to be elucidated. Here, we analyze theFTIR spectra of sericite and fluorite to study the possible adsorption mechanism.
Sericite has two clear characteristic peaks at 3628 and 1024 cm−1 (Figure 12a), whichwere associated with stretching vibration of the Al–OH groups and the in-plane stretching

Minerals 2021, 11, 555 10 of 15
of the Si-O-Si (Al) or Si (Al)-O groups, respectively [32]. The peaks at 2357 and 2360 cm−1
were ascribed to the CO2 impurities (exclusion). For the DDA spectrum, two peaks at2918 and 2844 cm−1 were attributed to –CH stretching. Similarly, the peak appearing at2364 cm−1 and having a shoulder at 2335 cm−1 was attributed to the stretching of –CNgroup [33,34]. The spectra obtained for sericite with DDA indicated that the –CH3 or –CH2stretching bands appeared at 2847 and 2919 cm−1. Additional band shifts of DDA couldnot be used to determine the electrostatic adsorption of DDA onto the surface of sericite.Furthermore, compared to the FTIR spectrum of the sericite treated with DDA only, thesericite treated with both CA and DDA did not show any CA characteristic peak, whichconfirmed the absence of CA absorption onto the sericite surface.
Minerals 2021, 11, x. https://doi.org/10.3390/xxxxx www.mdpi.com/journal/minerals
(a) (b)
Figure 12. (a) Fourier transform infrared spectra of sericite pre- and post-binding with DDA and CA. (b) Fourier transform infrared spectra of fluorite pre- and post-binding with DDA and CA. Figure 12. (a) Fourier transform infrared spectra of sericite pre- and post-binding with DDA and CA. (b) Fourier transforminfrared spectra of fluorite pre- and post-binding with DDA and CA.
For the fluorite system, as shown in Figure 12b, similar peaks (2933 and 2849 cm−1)appeared for the fluorite surface with DDA. This suggested the occurrence of an electrostaticadsorption process similar to that of sericite with DDA, and this in turn indicated that theselectivity of DDA was poor. In the FTIR spectrum of CA, the peaks observed at 1715, 3370,1417, and 799 cm−1 were due to the presence of –COOH groups, –OH groups, C–O groups,and C–H stretching, respectively. In comparison with the FTIR spectrum of the purifiedfluorite, the fluorite exposed to DDA and CA showed characteristic absorption peaks at1715 and 3370 cm−1 owing to the presence of –COOH groups and weakened vibrationsof –OH groups, respectively. Moreover, the peak at 1393 cm−1, caused by C–O groups,represented a band shift of 24 cm−1 and demonstrated the chemisorption of CA on thefluorite surface. In the spectrum, fluorite treated with CA and DDA showed the change incharacteristic absorption peaks as well as presented the symmetrical stretching vibrationof chelates in the range 1500–1700 cm−1. Because of the disappearance of the stretchingvibration of –CH groups (2933 and 2849 cm−1), we deduced that the DDA adsorption washindered by the CA chemisorbed onto the fluorite surface.
3.5. Batch Flotation Experiment Results
Based on the optimized micro-flotation test conditions, two tests were conducted on afluorite concentrate containing 92.87% CaF2 (fluorite), 2.82% SiO2 (sericite including 1.17%Al2O3), and 3.14% CaCO3 (calcite), which was procured from the Xinyuan mine (Hunan,China). Most of the fluorite and sericite minerals in the fluorite powder were distributed inthe +10–37µm range. Fewer amounts as sericite were set in a fluorite combination (10µm).The images of the feed powders obtained via an optical microscope are shown in Figure 13.

Minerals 2021, 11, 555 11 of 15Minerals 2021, 11, x FOR PEER REVIEW 11 of 15
Figure 13. Images of feed material by microscope (F1—fluorite; Q—sericite).
As depicted in Figure 13, the average size of fluorite was clearly less than that of sericite. Additionally, at 10μm, the sericite was present with the fluorite. Thus, it is diffi-cult to further enrich the fluorite concentrate because the fine particles of sericite could be easily entrained [35] and Ca2+ ions could be activated by NaOl [27]. The detailed flowsheet and reagent scheme of the closed-circuit flotation are shown in Figure 3. The conditions for the comparison tests of flotation and the obtained results are represented in Table 1 and Figure 14, respectively.
Table 1. The conditions for the comparison tests of flotation.
Sample Condition 1 Fluorite concentrate 2 Direct flotation (unwashed ore) + SS (200 g/t) + NaOl (50 g/t) 3 Direct flotation (washed ore) + SS (200 g/t) + NaOl (50 g/t) 4 Reverse flotation (unwashed ore) + CA (5 kg/t) + DDA (50 g/t) 5 Reverse flotation (washed ore) + CA (5 kg/t) + DDA (50 g/t)
Figure 14. Results of the comparison tests of flotation (direct and reverse).
Figure 14 displays the results of the comparison tests of direct flotation and reverse flotation. Simple 1 was the fluorite concentrate and was retrieved from the flotation plant site. The unwashed simple 2 was treated with sodium silicate (SS). The CaF2 content of the concentrate increased slightly, but the SiO2 content showed no such changes. The CaCO3 content of the concentrate decreased when the fluorite concentrate was washed (simple 3), largely due to the inhibition of the impurity minerals caused by washing. However, the SiO2 and Al2O3 contents were unaffected. This proved that sericite could not be re-moved easily by direct flotation. When the CA and DDA dosages were 5.0 kg/t and 50 g/t, respectively, fluorite content increased to 95.07%, whereas SiO2 and Al2O3 content de-
Figure 13. Images of feed material by microscope (F1—fluorite; Q—sericite).
As depicted in Figure 13, the average size of fluorite was clearly less than that ofsericite. Additionally, at 10µm, the sericite was present with the fluorite. Thus, it is difficultto further enrich the fluorite concentrate because the fine particles of sericite could beeasily entrained [35] and Ca2+ ions could be activated by NaOl [27]. The detailed flowsheetand reagent scheme of the closed-circuit flotation are shown in Figure 3. The conditionsfor the comparison tests of flotation and the obtained results are represented in Table 1and Figure 14, respectively.
Table 1. The conditions for the comparison tests of flotation.
Sample Condition
1 Fluorite concentrate2 Direct flotation (unwashed ore) + SS (200 g/t) + NaOl (50 g/t)3 Direct flotation (washed ore) + SS (200 g/t) + NaOl (50 g/t)4 Reverse flotation (unwashed ore) + CA (5 kg/t) + DDA (50 g/t)5 Reverse flotation (washed ore) + CA (5 kg/t) + DDA (50 g/t)
Minerals 2021, 11, x FOR PEER REVIEW 11 of 15
Figure 13. Images of feed material by microscope (F1—fluorite; Q—sericite).
As depicted in Figure 13, the average size of fluorite was clearly less than that of sericite. Additionally, at 10μm, the sericite was present with the fluorite. Thus, it is diffi-cult to further enrich the fluorite concentrate because the fine particles of sericite could be easily entrained [35] and Ca2+ ions could be activated by NaOl [27]. The detailed flowsheet and reagent scheme of the closed-circuit flotation are shown in Figure 3. The conditions for the comparison tests of flotation and the obtained results are represented in Table 1 and Figure 14, respectively.
Table 1. The conditions for the comparison tests of flotation.
Sample Condition 1 Fluorite concentrate 2 Direct flotation (unwashed ore) + SS (200 g/t) + NaOl (50 g/t) 3 Direct flotation (washed ore) + SS (200 g/t) + NaOl (50 g/t) 4 Reverse flotation (unwashed ore) + CA (5 kg/t) + DDA (50 g/t) 5 Reverse flotation (washed ore) + CA (5 kg/t) + DDA (50 g/t)
Figure 14. Results of the comparison tests of flotation (direct and reverse).
Figure 14 displays the results of the comparison tests of direct flotation and reverse flotation. Simple 1 was the fluorite concentrate and was retrieved from the flotation plant site. The unwashed simple 2 was treated with sodium silicate (SS). The CaF2 content of the concentrate increased slightly, but the SiO2 content showed no such changes. The CaCO3 content of the concentrate decreased when the fluorite concentrate was washed (simple 3), largely due to the inhibition of the impurity minerals caused by washing. However, the SiO2 and Al2O3 contents were unaffected. This proved that sericite could not be re-moved easily by direct flotation. When the CA and DDA dosages were 5.0 kg/t and 50 g/t, respectively, fluorite content increased to 95.07%, whereas SiO2 and Al2O3 content de-creased from 2.82 to 1.28% and from 1.17 to 0.74%, respectively. For comparison, to
Figure 14. Results of the comparison tests of flotation (direct and reverse).
Figure 14 displays the results of the comparison tests of direct flotation and reverseflotation. Simple 1 was the fluorite concentrate and was retrieved from the flotation plantsite. The unwashed simple 2 was treated with sodium silicate (SS). The CaF2 content ofthe concentrate increased slightly, but the SiO2 content showed no such changes. TheCaCO3 content of the concentrate decreased when the fluorite concentrate was washed(simple 3), largely due to the inhibition of the impurity minerals caused by washing.However, the SiO2 and Al2O3 contents were unaffected. This proved that sericite could notbe removed easily by direct flotation. When the CA and DDA dosages were 5.0 kg/t and50 g/t, respectively, fluorite content increased to 95.07%, whereas SiO2 and Al2O3 contentdecreased from 2.82 to 1.28% and from 1.17 to 0.74%, respectively. For comparison, to

Minerals 2021, 11, 555 12 of 15
acquire the flotation performance via CA + DDA for cleaned samples, it was found that theresidual reagent (NaOl) used in the production and for the activation of sericite affectedthe collection of DDA. When simple 5 was cleaned, the CaF2 content of the concentrateincreased to 95.89% and SiO2 recovery was only 30.49%. Both SiO2 and Al2O3 contentdropped. The root cause of this phenomenon was the ratio of SiO2 to Al2O3 in sericite (2:1).Furthermore, the removal rate of sericite was 69.51%. Therefore, the reverse flotation ofCA + DDA showed great potential for industrial applications. Owing to the volatility ofthe samples in batch flotation experiments, the grade and recovery of fluorite productswere verified by subsequent semi-industrial tests.
3.6. Pilot Test Results
The process of the pilot test is illustrated in Figure 4. The primary purpose of thepilot test was to verify the feasibility of the batch flotation experiments. The results of thecomparison tests for the direct leaching (process 1 plan date: May 10–17) and the reverseflotation + leaching (process 2 plan date: May 15–21) processes are depicted in Figure 15,Figure 16, and Figure 17. Figure 15 presents a comparison of the grade of fluorite concen-trates obtained in processes 1 and 2. The grade of fluorite in process 2 was ~1.5% higherthan that obtained in process 1. According to the current market conditions, the price offluorite powder (CaF2 ≥ 97%) per ton is USD 39.67 higher than the original price of fluoritepowder (95% ≤ CaF2 < 97%). Moreover, the SiO2 content of the concentrate in process 2was ~1.0% lower than that in process 1 (Figure 16). This result also contributed to thereduction in the consumption of sulfuric acid in the downstream hydrofluoric acid processand reduced the impurities in the product. In addition, the recovery of fluorite concentratewas lowered from 76.84 to 73.59% only, so the loss of fluorite is extremely small. Althoughthe results of the pilot test have certain limitations, the new reverse flotation + leachingtechnology can dramatically reduce the potential costs and environmental impact. Thenew process not only contributed to the safety of AHF production plants but also reporteda huge increase in the forecasted profits (~USD 1,4374.06 per day) (Table 2). Naturally, theeconomic benefits would also significantly improve with the increased price of high-gradefluorite powder (CaF2 ≥ 97%).
Minerals 2021, 11, x FOR PEER REVIEW 12 of 15
acquire the flotation performance via CA + DDA for cleaned samples, it was found that the residual reagent (NaOl) used in the production and for the activation of sericite af-fected the collection of DDA. When simple 5 was cleaned, the CaF2 content of the concen-trate increased to 95.89% and SiO2 recovery was only 30.49%. Both SiO2 and Al2O3 content dropped. The root cause of this phenomenon was the ratio of SiO2 to Al2O3 in sericite (2:1). Furthermore, the removal rate of sericite was 69.51%. Therefore, the reverse flotation of CA + DDA showed great potential for industrial applications. Owing to the volatility of the samples in batch flotation experiments, the grade and recovery of fluorite products were verified by subsequent semi-industrial tests.
3.6. Pilot Test Results The process of the pilot test is illustrated in Figure 4. The primary purpose of the pilot
test was to verify the feasibility of the batch flotation experiments. The results of the com-parison tests for the direct leaching (process 1 plan date: May 10–17) and the reverse flo-tation + leaching (process 2 plan date: May 15–21) processes are depicted in Figure 15, Figure 16, and Figure 17. Figure 15 presents a comparison of the grade of fluorite concen-trates obtained in processes 1 and 2. The grade of fluorite in process 2 was ~1.5% higher than that obtained in process 1. According to the current market conditions, the price of fluorite powder (CaF2 ≥ 97%) per ton is USD 39.67 higher than the original price of fluorite powder (95% ≤ CaF2 < 97%). Moreover, the SiO2 content of the concentrate in process 2 was ~1.0% lower than that in process 1 (Figure 16). This result also contributed to the re-duction in the consumption of sulfuric acid in the downstream hydrofluoric acid process and reduced the impurities in the product. In addition, the recovery of fluorite concentrate was lowered from 76.84 to 73.59% only, so the loss of fluorite is extremely small. Although the results of the pilot test have certain limitations, the new reverse flotation + leaching technology can dramatically reduce the potential costs and environmental impact. The new process not only contributed to the safety of AHF production plants but also reported a huge increase in the forecasted profits (~USD 1,4374.06 per day) (Table 2). Naturally, the economic benefits would also significantly improve with the increased price of high-grade fluorite powder (CaF2 ≥ 97%).
Figure 15. Comparison of the grade of fluorite concentrates in processes 1 and 2. Figure 15. Comparison of the grade of fluorite concentrates in processes 1 and 2.

Minerals 2021, 11, 555 13 of 15Minerals 2021, 11, x FOR PEER REVIEW 13 of 15
Figure 16. Comparison of the SiO2 content of the concentrates in processes 1 and 2.
Figure 17. Results of mineral recovery from the fluorite concentrate in processes 1 and 2.
Table 2. Forecast profits based on pilot test results (2000 t/d).
Consumption Unit Price
(USD/t) 1# (t/d) 2# (t/d) ∆ profit (USD/d)
Fluorite powder (95 ≤ CaF2 < 97%)
154.04 614.72 / +17583.32
Fluorite powder (CaF2 ≥ 97%) 190.71 / 588.72
Diluted hydrochloric 58.68 73.77 49.18 +1442.94 Citric acid 440.1 / 10 –4401
Dodecylamine 3374.1 / 0.1 –337.41 Waste water treatment
cost 2.934 1803.59 1727.30 +76.29
Power 0.3814 234.45 224.53 +9.92 Total / / / +14,374.06
4. Conclusions This study found that reverse flotation was an efficient approach for the desilication
of fluorite concentrates. Through micro-flotation tests, it was confirmed that the fluorite and sericite separation under acidic conditions or with CA + DDA could be quite success-ful. Additionally, a dominant electrostatic attraction force was detected in the interaction of DDA with sericite and fluorite, and the mechanism of CA was confirmed by ZP meas-urements, solution chemistry analysis, and FTIR. Furthermore, we found that the content of SiO2 and Al2O3 decreased during the batch flotation experiment. The results of the pilot test proved that the new reverse flotation + leaching technology could dramatically reduce the potential environmental impact and costs, thereby significantly improving the eco-nomic benefits by satisfying the current demands of the market.
Figure 16. Comparison of the SiO2 content of the concentrates in processes 1 and 2.
Minerals 2021, 11, x FOR PEER REVIEW 13 of 15
Figure 16. Comparison of the SiO2 content of the concentrates in processes 1 and 2.
Figure 17. Results of mineral recovery from the fluorite concentrate in processes 1 and 2.
Table 2. Forecast profits based on pilot test results (2000 t/d).
Consumption Unit Price
(USD/t) 1# (t/d) 2# (t/d) ∆ profit (USD/d)
Fluorite powder (95 ≤ CaF2 < 97%)
154.04 614.72 / +17583.32
Fluorite powder (CaF2 ≥ 97%) 190.71 / 588.72
Diluted hydrochloric 58.68 73.77 49.18 +1442.94 Citric acid 440.1 / 10 –4401
Dodecylamine 3374.1 / 0.1 –337.41 Waste water treatment
cost 2.934 1803.59 1727.30 +76.29
Power 0.3814 234.45 224.53 +9.92 Total / / / +14,374.06
4. Conclusions This study found that reverse flotation was an efficient approach for the desilication
of fluorite concentrates. Through micro-flotation tests, it was confirmed that the fluorite and sericite separation under acidic conditions or with CA + DDA could be quite success-ful. Additionally, a dominant electrostatic attraction force was detected in the interaction of DDA with sericite and fluorite, and the mechanism of CA was confirmed by ZP meas-urements, solution chemistry analysis, and FTIR. Furthermore, we found that the content of SiO2 and Al2O3 decreased during the batch flotation experiment. The results of the pilot test proved that the new reverse flotation + leaching technology could dramatically reduce the potential environmental impact and costs, thereby significantly improving the eco-nomic benefits by satisfying the current demands of the market.
Figure 17. Results of mineral recovery from the fluorite concentrate in processes 1 and 2.
Table 2. Forecast profits based on pilot test results (2000 t/d).
Consumption Unit Price (USD/t) 1# (t/d) 2# (t/d) ∆ Profit (USD/d)
Fluorite powder (95 ≤ CaF2 < 97%) 154.04 614.72 / +17,583.32Fluorite powder (CaF2 ≥ 97%) 190.71 / 588.72Diluted hydrochloric 58.68 73.77 49.18 +1442.94
Citric acid 440.1 / 10 −4401Dodecylamine 3374.1 / 0.1 −337.41
Waste water treatment cost 2.934 1803.59 1727.30 +76.29Power 0.3814 234.45 224.53 +9.92Total / / / +14,374.06
4. Conclusions
This study found that reverse flotation was an efficient approach for the desilication offluorite concentrates. Through micro-flotation tests, it was confirmed that the fluorite andsericite separation under acidic conditions or with CA + DDA could be quite successful.Additionally, a dominant electrostatic attraction force was detected in the interaction ofDDA with sericite and fluorite, and the mechanism of CA was confirmed by ZP measure-ments, solution chemistry analysis, and FTIR. Furthermore, we found that the contentof SiO2 and Al2O3 decreased during the batch flotation experiment. The results of thepilot test proved that the new reverse flotation + leaching technology could dramaticallyreduce the potential environmental impact and costs, thereby significantly improving theeconomic benefits by satisfying the current demands of the market.
Minerals 2021, 11, 555 14 of 15
Author Contributions: Formal analysis, C.Z.; investigation, J.G. and F.L.; methodology, Y.H.; re-sources, W.S. and Z.L.; writing—original draft, C.Z.; writing—review and editing, J.G. and C.Z.;project administration, W.S and Y.H. All authors have read and agreed to the published version ofthe manuscript.
Funding: This research was funded by the National Natural Science Foundation of Guizhou Province(qian ke he ji chu [2020]1Y218); the Young Talents Foundation of Education Department of GuizhouProvince (qian jiao he KY zi [2019]136) and the Scientific and Technological Innovation Platformof Liupanshui (52020-2019-05-04 and 52020-2019-05-06); the Academician Workstation of Liupan-shui Normal University (qiankehepingtairencai [2019]5604hao); the Fund of Liupanshui NormalUniversity (LPSSYKJTD201906).
Data Availability Statement: Not applicable.
Conflicts of Interest: The authors declare no conflict of interest.
References1. Zhang, Y.; Song, S. Beneficiation of fluorite by flotation in a new chemical scheme. Miner. Eng. 2003, 16, 597–600. [CrossRef]2. Gao, Z.; Wang, C.; Sun, W.; Gao, Y.; Kowalczuk, P.B. Froth flotation of fluorite: A review. Adv. Colloid Interface Sci. 2021,
290, 102382. [CrossRef]3. Shuai, F.; Xu, L.; Wu, H.; Jia, T.; Lu, Z.; Wei, S.; Hu, Y. Adsorption of Pb(II)/benzohydroxamic acid collector complexes for
ilmenite flotation. Miner. Eng. 2018, 126, 16–23. [CrossRef]4. Gao, Y.; Gao, Z.; Sun, W.; Hu, Y. Selective flotation of scheelite from calcite: A novel reagent scheme. Int. J. Miner. Process. 2016,
154, 10–15. [CrossRef]5. Kou, J.; Tao, D.; Xu, G. Fatty acid collectors for phosphate flotation and their adsorption behavior using QCM-D. Int. J. Miner.
Process. 2010, 95, 1–9. [CrossRef]6. Hu, Y.-H.; Yang, F.; Sun, W. The flotation separation of scheelite from calcite using a quaternary ammonium salt as collector.
Miner. Eng. 2011, 24, 82–84. [CrossRef]7. Liu, C.; Zhou, M.; Xia, L.; Fu, W.; Zhou, W.; Yang, S. The utilization of citric acid as a depressant for the flotation separation of
barite from fluorite. Miner. Eng. 2020, 156, 106491. [CrossRef]8. Filippov, L.; Filippova, I.; Severov, V. The use of collectors mixture in the reverse cationic flotation of magnetite ore: The role of
Fe-bearing silicates. Miner. Eng. 2010, 23, 91–98. [CrossRef]9. Ma, X.; Marques, M.; Gontijo, C. Comparative studies of reverse cationic/anionic flotation of Vale iron ore. Int. J. Miner. Process.
2011, 100, 179–183. [CrossRef]10. Santos, E.P.; Dutra, A.J.; Oliveira, J.F. The effect of jojoba oil on the surface properties of calcite and apatite aiming at their selective
flotation. Int. J. Miner. Process. 2015, 143, 34–38. [CrossRef]11. Liu, H.; Khoso, S.A.; Sun, W.; Zhu, Y.; Han, H.; Hu, Y.; Kang, J.; Meng, X.; Zhang, Q. A novel method for desulfurization and
purification of fluorite concentrate using acid leaching and reverse flotation of sulfide. J. Clean. Prod. 2019, 209, 1006–1015.[CrossRef]
12. Zhang, C.; Sun, W.; Hu, Y.; Tang, H.; Yin, Z.; Guan, Q.; Gao, J. Investigation of two-stage depressing by using hydrophilic polymerto improve the process of fluorite flotation. J. Clean. Prod. 2018, 193, 228–235. [CrossRef]
13. Mowla, D.; Karimi, G.; Ostadnezhad, K. Removal of hematite from silica sand ore by reverse flotation technique. Sep. Purif.Technol. 2008, 58, 419–423. [CrossRef]
14. Mohammadkhani, M.; Noaparast, M.; Shafaei, S.; Amini, A.; Amini, E.; Abdollahi, H. Double reverse flotation of a very lowgrade sedimentary phosphate rock, rich in carbonate and silicate. Int. J. Miner. Process. 2011, 100, 157–165. [CrossRef]
15. Yang, S.; Xu, Y.; Liu, C.; Huang, L.; Huang, Z.; Li, H. The anionic flotation of fluorite from barite using gelatinized starch as thedepressant. Colloids Surfaces A Physicochem. Eng. Asp. 2020, 597, 124794. [CrossRef]
16. Lin, L.; Jiong-tian, L.; Yong-tian, W.; Yi-jun, C.; Hai-jun, Z.; He-sheng, Y. Experimental research on anionic reverse flotation ofhematite with a flotation column. Procedia Earth Planet. Sci. 2009, 1, 791–798. [CrossRef]
17. Abaka-Wood, G.B.; Addai-Mensah, J.; Skinner, W. A study of flotation characteristics of monazite, hematite, and quartz usinganionic collectors. Int. J. Miner. Process. 2017, 158, 55–62. [CrossRef]
18. Liu, G.; Zhong, H.; Hu, Y.; Zhao, S.; Xia, L. The role of cationic polyacrylamide in the reverse flotation of diasporic bauxite. Miner.Eng. 2007, 20, 1191–1199. [CrossRef]
19. Xu, L.; Longhua, X.; Tian, J.; Wu, H.; Wang, L.; Yang, Y.; Wang, Z. Synergistic effect of mixed cationic/anionic collectors onflotation and adsorption of muscovite. Colloids Surfaces A Physicochem. Eng. Asp. 2016, 492, 181–189. [CrossRef]
20. Wang, L.; Hu, Y.; Liu, J.; Sun, Y.; Sun, W. Flotation and adsorption of muscovite using mixed cationic–nonionic surfactants ascollector. Powder Technol. 2015, 276, 26–33. [CrossRef]
21. Sahoo, H.; Rath, S.S.; Das, B.; Mishra, B.K. Flotation of quartz using ionic liquid collectors with different functional groups andvarying chain lengths. Miner. Eng. 2016, 95, 107–112. [CrossRef]
Minerals 2021, 11, 555 15 of 15
22. Lima, N.P.; Valadão, G.E.; Peres, A.E. Effect of amine and starch dosages on the reverse cationic flotation of an iron ore. Miner.Eng. 2013, 45, 180–184. [CrossRef]
23. Liu, Q.; Zhang, Y. Effect of calcium ions and citric acid on the flotation separation of chalcopyrite from galena using dextrin.Miner. Eng. 2000, 13, 1405–1416. [CrossRef]
24. Liu, C.; Zheng, Y.; Yang, S.; Fu, W.; Chen, X. Exploration of a novel depressant polyepoxysuccinic acid for the flotation sep-arationof pentlandite from lizardite slimes. Appl. Clay Sci. 2020, 105939. [CrossRef]
25. Gan, W.; Crozier, B.; Liu, Q. Effect of citric acid on inhibiting hexadecane–quartz coagulation in aqueous solutions containingCa2+, Mg2+ and Fe3+ ions. Int. J. Miner. Process. 2009, 92, 84–91. [CrossRef]
26. Gao, Z.; Gao, Y.; Zhu, Y.; Hu, Y.; Sun, W. Selective Flotation of Calcite from Fluorite: A Novel Reagent Schedule. Minerals 2016,6, 114. [CrossRef]
27. Hu, Y.; He, J.; Zhang, C.; Zhang, C.; Sun, W.; Zhao, D.; Chen, P.; Han, H.; Gao, Z.; Liu, R.; et al. Insights into the activationmechanism of calcium ions on the sericite surface: A combined experimental and computational study. Appl. Surf. Sci. 2018, 427,162–168. [CrossRef]
28. Gao, Z.; Sun, W.; Hu, Y.-H.; Liu, X.-W. Anisotropic surface broken bond properties and wettability of calcite and fluorite crystals.Trans. Nonferrous Met. Soc. China 2012, 22, 1203–1208. [CrossRef]
29. Somasundaran, P.; Wang, D. Solution Chemistry: Minerals and Reagents; Elsevier: Amsterdam, The Netherlands, 2006; ISBN0080465072.
30. Al-Khaldi, M.; Nasr-El-Din, H.; Mehta, S.; Al-Aamri, A. Reaction of citric acid with calcite. Chem. Eng. Sci. 2007, 62, 5880–5896.[CrossRef]
31. Nagy, N.M.; Konya, J.; Kónya, I. Ion-exchange processes of lead and cobalt ions on the surface of calcium-montmorillonitein the presence of complex-forming agents II. The effect of DTPA, tartaric acid and citric acid on the sorption of lead ions oncalcium-montmorillonite. Colloids Surfaces A Physicochem. Eng. Asp. 1998, 137, 243–252. [CrossRef]
32. Tian, J.; Gao, H.; Guan, J.; Ren, Z. Modified floc-flotation in fine sericite flotation using polymethylhydrosiloxane. Sep. Purif.Technol. 2017, 174, 439–444. [CrossRef]
33. Carrara, C.; Irusta, S.; Lombardo, E.; Cornaglia, L. Study of the Co-VPO interaction in promoted n-butane oxidation catalysts.Appl. Catal. A Gen. 2001, 217, 275–286. [CrossRef]
34. Gupta, N.; Balomajumder, C.; Agarwal, V.K. Adsorption of cyanide ion on pressmud surface: A modeling approach. Chem. Eng. J.2012, 191, 548–556. [CrossRef]
35. Warren, L.J. Determination of the contributions of true flotation and entrainment in batch flotation tests. Int. J. Miner. Process.1985, 14, 33–44. [CrossRef]
Copyright © 2022 FDOKUMEN