Classifying Vulnerability to Sleep Deprivation Using Baseline Measures of Psychomotor Vigilance
12
SLEEP, Vol. 38, No. 5, 2015 1 Predicting Vulnerability to Sleep Deprivation—Patanaik et al. INTRODUCTION The negative consequences of sleep deprivation on cogni- tive performance are well documented. 1–3 Lapses in atten- tion resulting from sleep deprivation contribute to industrial catastrophes, medical errors, transportation accidents, and security breaches. 4–8 Sleep deprivation is thought to impair neurobehavioral functioning by destabilizing performance, as evidenced by the capacity to perform well for short periods of time, interrupted by occasional attention failures. 9 The extent to which sleep loss affects performance varies widely across individuals, however, with some subjects remaining relatively unaffected while others show severe cognitive impairment. 9 Notably, between-subject differences in performance are trait like and stable across repeated exposures to sleep deprivation, irrespective of sleep history. 10–12 Over the past decade, several studies have shown that subjects who are vulnerable versus resistant to the effects of sleep loss differ in their brain activa- tion and behavioral performance when they are well rested. 13–19 Such findings suggest that baseline measures can be used to predict how well a person will perform when he/she is de- prived of sleep. One of the most sensitive measures of performance impair- ment by sleep deprivation is vigilance, 20 commonly assessed Objective: To identify measures derived from baseline psychomotor vigilance task (PVT) performance that can reliably predict vulnerability to sleep deprivation. Design: Subjects underwent total sleep deprivation and completed a 10-min PVT every 1–2 h in a controlled laboratory setting. Participants were categorized as vulnerable or resistant to sleep deprivation, based on a median split of lapses that occurred following sleep deprivation. Standard reaction time, drift diffusion model (DDM), and wavelet metrics were derived from PVT response times collected at baseline. A support vector machine model that incorporated maximum relevance and minimum redundancy feature selection and wrapper-based heuristics was used to classify subjects as vulnerable or resistant using rested data. Setting: Two academic sleep laboratories. Participants: Independent samples of 135 (69 women, age 18 to 25 y), and 45 (3 women, age 22 to 32 y) healthy adults. Measurements and Results: In both datasets, DDM measures, number of consecutive reaction times that differ by more than 250 ms, and two wavelet features were selected by the model as features predictive of vulnerability to sleep deprivation. Using the best set of features selected in each dataset, classification accuracy was 77% and 82% using fivefold stratified cross-validation, respectively. Conclusions: Despite differences in experimental conditions across studies, drift diffusion model parameters associated reliably with individual differences in performance during total sleep deprivation. These results demonstrate the utility of drift diffusion modeling of baseline performance in estimating vulnerability to psychomotor vigilance decline following sleep deprivation. Keywords: classification, differential vulnerability, diffusion model, psychomotor vigilance task, sleep deprivation Citation: Patanaik A, Kwoh CK, Chua EC, Gooley JJ, Chee MW. Classifying vulnerability to sleep deprivation using baseline measures of psychomotor vigilance. SLEEP 2015;38(5):XXX–XXX. CLASSIFYING VULNERABILITY TO SLEEP DEPRIVATION USING BASELINE PVT MEASURES Classifying Vulnerability to Sleep Deprivation Using Baseline Measures of Psychomotor Vigilance Amiya Patanaik, BTech 1 ; Chee Keong Kwoh, PhD 1 ; Eric C.P. Chua, PhD 2 ; Joshua J. Gooley, PhD 2 ; Michael W.L. Chee, MBBS 2 1 School of Computer Engineering, Nanyang Technological University, Singapore; 2 Centre for Cognitive Neuroscience, Neuroscience and Behavioral Disorders Program, Duke-NUS Graduate Medical School, Singapore Submitted for publication May, 2014 Submitted in final revised form August, 2014 Accepted for publication August, 2014 Address correspondence to: Michael W.L. Chee, 8 College Road, Room 06-18, Singapore 169857; Tel: +65-6516 4916; Email: michael.chee@ duke nus.edu.sg or Amiya Patanaik, Email: [email protected] pii: sp-00365-14 http://dx.doi.org/XXXXXXXXXXXXX using the psychomotor vigilance task (PVT). 21 During the PVT, participants maintain their fastest possible reaction time (RT) to a simple visual stimulus presented at random interstimulus intervals. Recently, it was shown that subjects who are vulnerable to the effects of total sleep deprivation on PVT performance show slower and more variable response times when they are well rested. 17 In separate work, subjects categorized as vulnerable or resistant to sleep deprivation differed in their diffusion drift parameters derived from PVT RT data sampled at baseline. 19 These studies demonstrate that baseline PVT performance carries information about vulner- ability to subsequent sleep deprivation, but it remains unclear whether features of rested PVT performance can be used to classify a person’s relative performance in the sleep deprived state. The current study sought to assess the reliability of classi- fying subjects as vulnerable or resistant to sleep deprivation, using baseline features of PVT performance. We used two independent datasets to carry out our analysis involving PVT data collected from different laboratories under different ex- perimental conditions. We extracted standard RT metrics, dif- fusion model parameters, and features derived from spectral analysis of RTs, and used a support vector machine (SVM) classifier with stratified fivefold cross-validation (CV5) to es- timate generalization error. The objectives of this work were fourfold: 1. Identify and rank candidate features derived from base- line PVT response times that predict vulnerability to sleep deprivation. 2. Select a compact feature set from the candidate features resulting in maximum prediction accuracy, and measure
Transcript of Classifying Vulnerability to Sleep Deprivation Using Baseline Measures of Psychomotor Vigilance
SLEEP, Vol. 38, No. 5, 2015 1 Predicting Vulnerability to Sleep Deprivation—Patanaik et al.
INTRODUCTIONThe negative consequences of sleep deprivation on cogni-
tive performance are well documented.1–3 Lapses in atten-tion resulting from sleep deprivation contribute to industrial catastrophes, medical errors, transportation accidents, and security breaches.4–8 Sleep deprivation is thought to impair neurobehavioral functioning by destabilizing performance, as evidenced by the capacity to perform well for short periods of time, interrupted by occasional attention failures.9 The extent to which sleep loss affects performance varies widely across individuals, however, with some subjects remaining relatively unaffected while others show severe cognitive impairment.9 Notably, between-subject differences in performance are trait like and stable across repeated exposures to sleep deprivation, irrespective of sleep history.10–12 Over the past decade, several studies have shown that subjects who are vulnerable versus resistant to the effects of sleep loss differ in their brain activa-tion and behavioral performance when they are well rested.13–19 Such findings suggest that baseline measures can be used to predict how well a person will perform when he/she is de-prived of sleep.
One of the most sensitive measures of performance impair-ment by sleep deprivation is vigilance,20 commonly assessed
Objective: To identify measures derived from baseline psychomotor vigilance task (PVT) performance that can reliably predict vulnerability to sleep deprivation.Design: Subjects underwent total sleep deprivation and completed a 10-min PVT every 1–2 h in a controlled laboratory setting. Participants were categorized as vulnerable or resistant to sleep deprivation, based on a median split of lapses that occurred following sleep deprivation. Standard reaction time, drift diffusion model (DDM), and wavelet metrics were derived from PVT response times collected at baseline. A support vector machine model that incorporated maximum relevance and minimum redundancy feature selection and wrapper-based heuristics was used to classify subjects as vulnerable or resistant using rested data.Setting: Two academic sleep laboratories.Participants: Independent samples of 135 (69 women, age 18 to 25 y), and 45 (3 women, age 22 to 32 y) healthy adults.Measurements and Results: In both datasets, DDM measures, number of consecutive reaction times that differ by more than 250 ms, and two wavelet features were selected by the model as features predictive of vulnerability to sleep deprivation. Using the best set of features selected in each dataset, classification accuracy was 77% and 82% using fivefold stratified cross-validation, respectively.Conclusions: Despite differences in experimental conditions across studies, drift diffusion model parameters associated reliably with individual differences in performance during total sleep deprivation. These results demonstrate the utility of drift diffusion modeling of baseline performance in estimating vulnerability to psychomotor vigilance decline following sleep deprivation.Keywords: classification, differential vulnerability, diffusion model, psychomotor vigilance task, sleep deprivationCitation: Patanaik A, Kwoh CK, Chua EC, Gooley JJ, Chee MW. Classifying vulnerability to sleep deprivation using baseline measures of psychomotor vigilance. SLEEP 2015;38(5):XXX–XXX.
CLASSIFYING VULNERABILITY TO SLEEP DEPRIVATION USING BASELINE PVT MEASURES
Classifying Vulnerability to Sleep Deprivation Using Baseline Measures of Psychomotor VigilanceAmiya Patanaik, BTech1; Chee Keong Kwoh, PhD1; Eric C.P. Chua, PhD2; Joshua J. Gooley, PhD2; Michael W.L. Chee, MBBS2
1School of Computer Engineering, Nanyang Technological University, Singapore; 2Centre for Cognitive Neuroscience, Neuroscience and Behavioral Disorders Program, Duke-NUS Graduate Medical School, Singapore
Submitted for publication May, 2014Submitted in final revised form August, 2014Accepted for publication August, 2014Address correspondence to: Michael W.L. Chee, 8 College Road, Room 06-18, Singapore 169857; Tel: +65-6516 4916; Email: michael.chee@duke nus.edu.sg or Amiya Patanaik, Email: [email protected]
pii: sp-00365-14 http://dx.doi.org/XXXXXXXXXXXXX
using the psychomotor vigilance task (PVT).21 During the PVT, participants maintain their fastest possible reaction time (RT) to a simple visual stimulus presented at random interstimulus intervals. Recently, it was shown that subjects who are vulnerable to the effects of total sleep deprivation on PVT performance show slower and more variable response times when they are well rested.17 In separate work, subjects categorized as vulnerable or resistant to sleep deprivation differed in their diffusion drift parameters derived from PVT RT data sampled at baseline.19 These studies demonstrate that baseline PVT performance carries information about vulner-ability to subsequent sleep deprivation, but it remains unclear whether features of rested PVT performance can be used to classify a person’s relative performance in the sleep deprived state.
The current study sought to assess the reliability of classi-fying subjects as vulnerable or resistant to sleep deprivation, using baseline features of PVT performance. We used two independent datasets to carry out our analysis involving PVT data collected from different laboratories under different ex-perimental conditions. We extracted standard RT metrics, dif-fusion model parameters, and features derived from spectral analysis of RTs, and used a support vector machine (SVM) classifier with stratified fivefold cross-validation (CV5) to es-timate generalization error. The objectives of this work were fourfold:
1. Identify and rank candidate features derived from base-line PVT response times that predict vulnerability to sleep deprivation.
2. Select a compact feature set from the candidate features resulting in maximum prediction accuracy, and measure

SLEEP, Vol. 38, No. 5, 2015 2 Predicting Vulnerability to Sleep Deprivation—Patanaik et al.
the performance of this classification model for each dataset.
3. Evaluate the reliability of classification by training the model on one dataset and testing it on another one.
4. Evaluate test-retest performance of classification by training the model using baseline data collected during one study visit, and then testing it using baseline data collected more than 5 mo later from the same set of individuals.
MATERIAL AND METHODS
SubjectsIn the current investigation, we analyzed PVT data collected
from two laboratories. For Dataset 1, a total of 135 subjects (69 females, age 18–25 y) who participated in five different functional imaging studies22–26 were evaluated. All five experi-ments in this dataset were conducted at the Cognitive Neuro-science Laboratory, under similar experimental conditions. For Dataset 2, 45 healthy ethnic-Chinese subjects (3 females, age 22–32 y) were enrolled in a laboratory study at the Chronobi-ology and Sleep Laboratory (CSL) as part of a previous study.17 Both datasets shared some common recruitment criteria. For example, health was assessed using screening questionnaires and self-reported medical history. Participants who took medi-cations or consumed nicotine products were excluded. In the week before the laboratory study, participants were required to maintain a consistent sleep-wake schedule (6.5–9 h of sleep every day in Dataset 1, and 8 h time in bed for sleep in Dataset 2), which was verified by actigraphy monitoring (Actiwatch-L or Actiwatch 2, MiniMitter, Inc., Bend, OR). In the week prior to the study, subjects were asked to avoid caffeine, alcohol, and over-the-counter medications. Informed consent was obtained from all participants, and research procedures were approved by the National University of Singapore Institutional Review Board (IRB) and the SingHealth Centralized IRB for Dataset 1 and Dataset 2, respectively.
Sleep Deprivation ProceduresDataset 1: Subjects arrived at the laboratory at 19:30 and
were kept awake continuously overnight under supervision of a research assistant. A handheld 10-min PVT was administered every hour from 20:00 to 05:00 (10 test periods). Subjects were seated upright during testing and were exposed to ordinary room light. Participants’ movements were not restricted be-tween PVT tests.
Dataset 2: Subjects underwent total sleep deprivation in a laboratory suite that was shielded from external time cues. Par-ticipants arrived in the evening and went to bed at their regular prestudy sleep time. After 8 h of time in bed for sleep, sub-jects were kept awake for at least 26 h using constant routine (CR) procedures, as previously described.27 During the CR procedure, subjects remained in bed in a semirecumbent posi-tion, with exposure to dim ambient lighting (< 5 lux). The PVT was administered every 2 h (starting 2.5 h or 4.5 h after wake time) by computer using E-Prime 2 Professional software (Psy-chology Software Tools, Inc., Sharpsburg, PA). Visual stimuli were presented on a liquid crystal display monitor placed on an over-bed table, which allowed subjects to take the PVT while
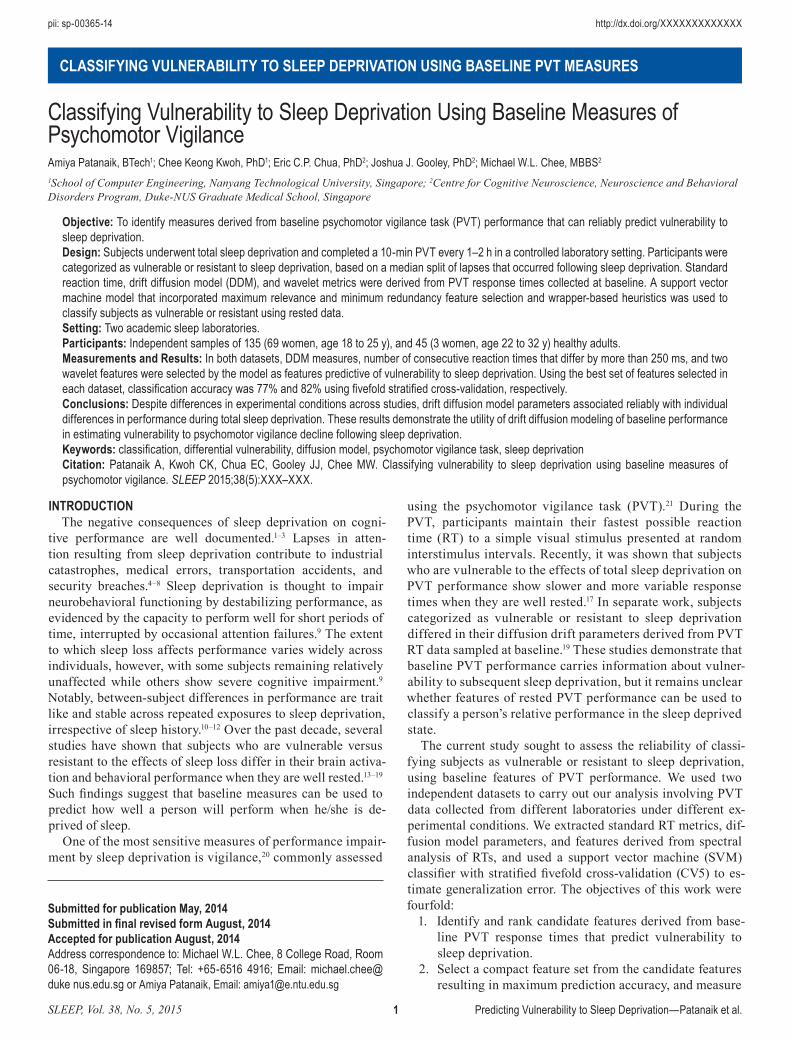
remaining in bed. After undergoing sleep deprivation, partici-pants were invited to return to the laboratory at least 5 mo later to complete additional testing. A subset of subjects (n = 34) took part in the follow-up study. Subjects reported to the laboratory in the mid-afternoon (between 14:00–18:00) and completed two 10-min PVTs taken 2 h apart from one another under conditions that were similar to the first study visit. The research protocols for both datasets are summarized in Figure 1.
Assessment of Vulnerability to Sleep DeprivationDuring total sleep deprivation, cognitive performance usu-
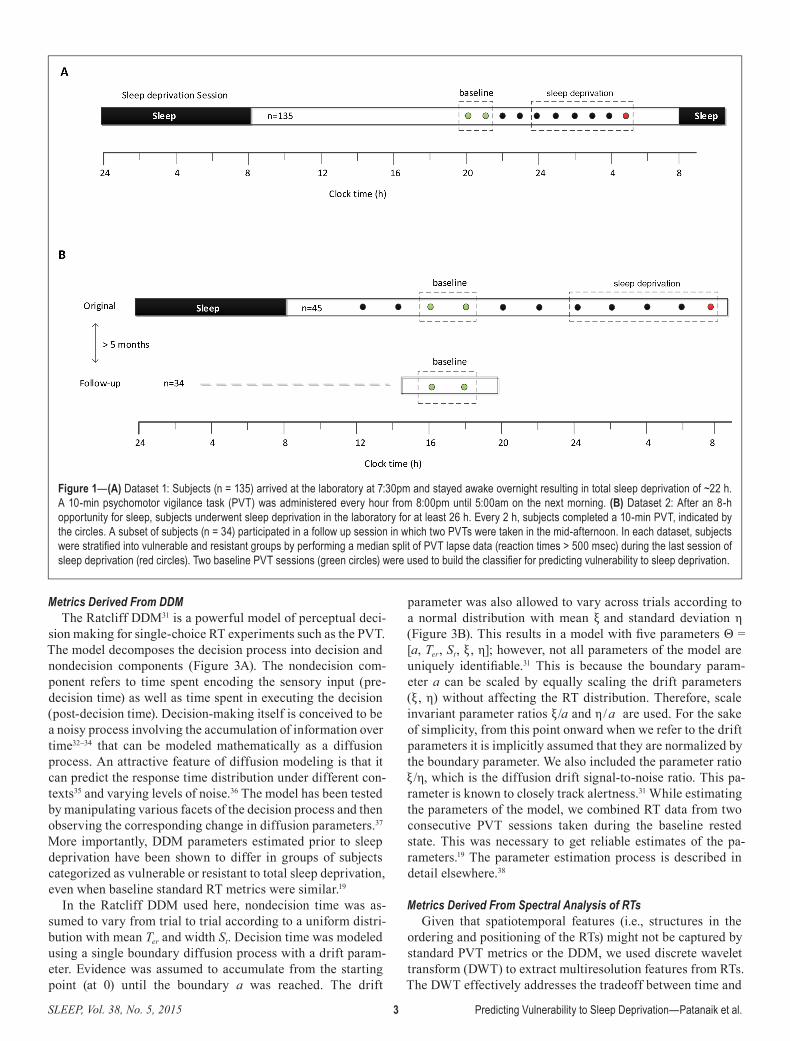
ally reaches its nadir in the early morning hours, typically between 04:00 and 08:00, when the sleep homeostat and circa-dian clock interact to promote high levels of sleepiness.28 This is also the period when sleepiness-related motor vehicle ac-cidents are most likely to occur.29 We therefore analyzed PVT performance during this time window as a measure of suscep-tibility to sleep deprivation. Subjects were categorized as vul-nerable or resistant based on a median split on the number of lapses, defined as RTs that exceed 500 msec (Figure 1. PVTs marked in red). For Dataset 1, 70 subjects were categorized as vulnerable (≥ 5 lapses). For Dataset 2, 25 subjects were cat-egorized as vulnerable (≥ 23 lapses), of whom 19 completed the follow-up study. The large difference in the median lapse value is likely a result of different experimental conditions be-tween the two studies (see Discussion). The divergence in per-formance between vulnerable and resistant groups after their usual bedtime is shown in Figure 2. For Dataset 1, the first two PVT tests administered at 20:00 and 21:00 were used as the baseline. For Dataset 2, the third and fourth PVT sessions, which were taken during the mid-afternoon, were used as the rested baseline, as PVT measurements for the follow up ses-sion were available for the same time period.
RT-Derived Features As detailed in the next paragraphs, we used a combination
of standard RT metrics, features derived from the drift diffu-sion model (DDM), and spectral analysis of RTs.
Standard RT MetricsThe most widely used PVT outcome metric is the number
of lapses followed by mean RT, mean 1/RT, fastest 10% RT, median RT, slowest 10% RT, and the slowest 10% 1/RT.30 The reciprocal RT is also referred to as response speed (response speed = 1/RT). In an analysis of various PVT out-come metrics during partial or total sleep deprivation, Basner and Dinges30 found that metrics involving response speed (RS) and lapses were the most sensitive to sleep loss. It was there-fore recommended that these measures be used as the primary outcomes measures of the 10-min version of the PVT. In our analysis we considered lapses, mean RT, mean RS, slowest 10% RS, fastest 10% RT, median RT, and standard deviation of RT. We also included mean absolute deviation (MAD) from the mean, and ΔRT > 250, which is the number of consecutive RTs that differ by more than 250 msec. The latter was included based on a previous finding that, under baseline conditions, subjects who were categorized as vulnerable to sleep depriva-tion showed a greater number of consecutive RTs that differed more than 250 msec compared to resistant individuals.17
SLEEP, Vol. 38, No. 5, 2015 3 Predicting Vulnerability to Sleep Deprivation—Patanaik et al.
Metrics Derived From DDMThe Ratcliff DDM31 is a powerful model of perceptual deci-
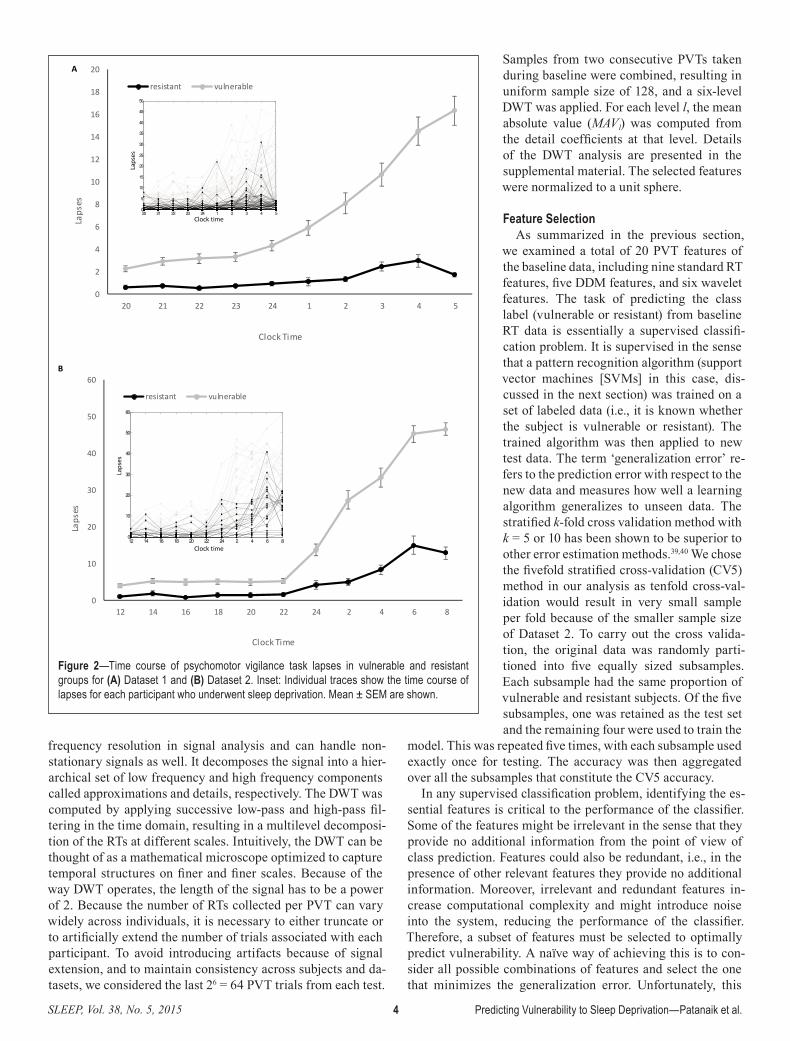
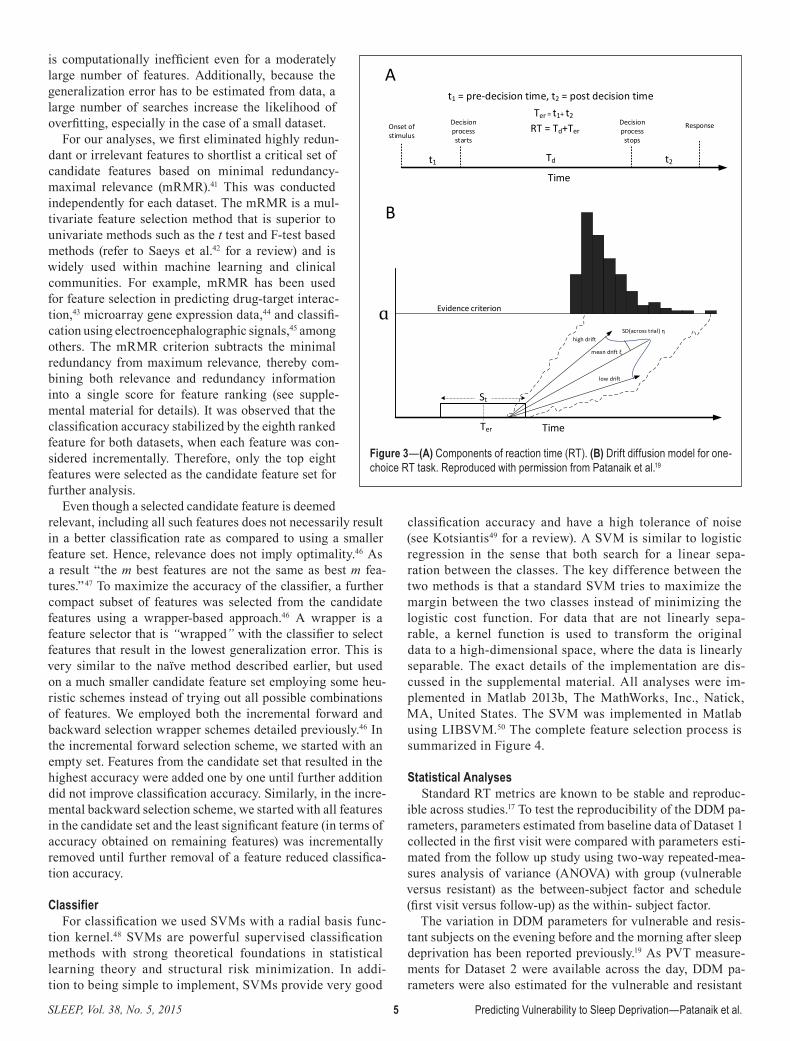
sion making for single-choice RT experiments such as the PVT. The model decomposes the decision process into decision and nondecision components (Figure 3A). The nondecision com-ponent refers to time spent encoding the sensory input (pre-decision time) as well as time spent in executing the decision (post-decision time). Decision-making itself is conceived to be a noisy process involving the accumulation of information over time32–34 that can be modeled mathematically as a diffusion process. An attractive feature of diffusion modeling is that it can predict the response time distribution under different con-texts35 and varying levels of noise.36 The model has been tested by manipulating various facets of the decision process and then observing the corresponding change in diffusion parameters.37
More importantly, DDM parameters estimated prior to sleep deprivation have been shown to differ in groups of subjects categorized as vulnerable or resistant to total sleep deprivation, even when baseline standard RT metrics were similar.19
In the Ratcliff DDM used here, nondecision time was as-sumed to vary from trial to trial according to a uniform distri-bution with mean Ter and width St. Decision time was modeled using a single boundary diffusion process with a drift param-eter. Evidence was assumed to accumulate from the starting point (at 0) until the boundary a was reached. The drift
parameter was also allowed to vary across trials according to a normal distribution with mean ξ and standard deviation η (Figure 3B). This results in a model with fi ve parameters Θ = [a, Ter, St, ξ , η]; however, not all parameters of the model are uniquely identifi able.31 This is because the boundary param-eter a can be scaled by equally scaling the drift parameters (ξ , η) without affecting the RT distribution. Therefore, scale invariant parameter ratios ξ /a and η/a are used. For the sake of simplicity, from this point onward when we refer to the drift parameters it is implicitly assumed that they are normalized by the boundary parameter. We also included the parameter ratio ξ /η, which is the diffusion drift signal-to-noise ratio. This pa-rameter is known to closely track alertness.31 While estimating the parameters of the model, we combined RT data from two consecutive PVT sessions taken during the baseline rested state. This was necessary to get reliable estimates of the pa-rameters.19 The parameter estimation process is described in detail elsewhere.38
Metrics Derived From Spectral Analysis of RTsGiven that spatiotemporal features (i.e., structures in the
ordering and positioning of the RTs) might not be captured by standard PVT metrics or the DDM, we used discrete wavelet transform (DWT) to extract multiresolution features from RTs. The DWT effectively addresses the tradeoff between time and
Figure 1—(A) Dataset 1: Subjects (n = 135) arrived at the laboratory at 7:30pm and stayed awake overnight resulting in total sleep deprivation of ~22 h. A 10-min psychomotor vigilance task (PVT) was administered every hour from 8:00pm until 5:00am on the next morning. (B) Dataset 2: After an 8-h opportunity for sleep, subjects underwent sleep deprivation in the laboratory for at least 26 h. Every 2 h, subjects completed a 10-min PVT, indicated by the circles. A subset of subjects (n = 34) participated in a follow up session in which two PVTs were taken in the mid-afternoon. In each dataset, subjects were stratifi ed into vulnerable and resistant groups by performing a median split of PVT lapse data (reaction times > 500 msec) during the last session of sleep deprivation (red circles). Two baseline PVT sessions (green circles) were used to build the classifi er for predicting vulnerability to sleep deprivation.
SLEEP, Vol. 38, No. 5, 2015 4 Predicting Vulnerability to Sleep Deprivation—Patanaik et al.
frequency resolution in signal analysis and can handle non-stationary signals as well. It decomposes the signal into a hier-archical set of low frequency and high frequency components called approximations and details, respectively. The DWT was computed by applying successive low-pass and high-pass fil-tering in the time domain, resulting in a multilevel decomposi-tion of the RTs at different scales. Intuitively, the DWT can be thought of as a mathematical microscope optimized to capture temporal structures on finer and finer scales. Because of the way DWT operates, the length of the signal has to be a power of 2. Because the number of RTs collected per PVT can vary widely across individuals, it is necessary to either truncate or to artificially extend the number of trials associated with each participant. To avoid introducing artifacts because of signal extension, and to maintain consistency across subjects and da-tasets, we considered the last 26 = 64 PVT trials from each test.
Samples from two consecutive PVTs taken during baseline were combined, resulting in uniform sample size of 128, and a six-level DWT was applied. For each level l, the mean absolute value (MAVl) was computed from the detail coefficients at that level. Details of the DWT analysis are presented in the supplemental material. The selected features were normalized to a unit sphere.
Feature SelectionAs summarized in the previous section,
we examined a total of 20 PVT features of the baseline data, including nine standard RT features, five DDM features, and six wavelet features. The task of predicting the class label (vulnerable or resistant) from baseline RT data is essentially a supervised classifi-cation problem. It is supervised in the sense that a pattern recognition algorithm (support vector machines [SVMs] in this case, dis-cussed in the next section) was trained on a set of labeled data (i.e., it is known whether the subject is vulnerable or resistant). The trained algorithm was then applied to new test data. The term ‘generalization error’ re-fers to the prediction error with respect to the new data and measures how well a learning algorithm generalizes to unseen data. The stratified k-fold cross validation method with k = 5 or 10 has been shown to be superior to other error estimation methods.39,40 We chose the fivefold stratified cross-validation (CV5) method in our analysis as tenfold cross-val-idation would result in very small sample per fold because of the smaller sample size of Dataset 2. To carry out the cross valida-tion, the original data was randomly parti-tioned into five equally sized subsamples. Each subsample had the same proportion of vulnerable and resistant subjects. Of the five subsamples, one was retained as the test set and the remaining four were used to train the
model. This was repeated five times, with each subsample used exactly once for testing. The accuracy was then aggregated over all the subsamples that constitute the CV5 accuracy.
In any supervised classification problem, identifying the es-sential features is critical to the performance of the classifier. Some of the features might be irrelevant in the sense that they provide no additional information from the point of view of class prediction. Features could also be redundant, i.e., in the presence of other relevant features they provide no additional information. Moreover, irrelevant and redundant features in-crease computational complexity and might introduce noise into the system, reducing the performance of the classifier. Therefore, a subset of features must be selected to optimally predict vulnerability. A naïve way of achieving this is to con-sider all possible combinations of features and select the one that minimizes the generalization error. Unfortunately, this
Figure 2—Time course of psychomotor vigilance task lapses in vulnerable and resistant groups for (A) Dataset 1 and (B) Dataset 2. Inset: Individual traces show the time course of lapses for each participant who underwent sleep deprivation. Mean ± SEM are shown.
0
2
4
6
8
10
12
14
16
18
20
20 21 22 23 24 1 2 3 4 5
Laps
es
Clock Time
resistant vulnerable
0
10
20
30
40
50
60
12 14 16 18 20 22 24 2 4 6 8
Laps
es
Clock Time
resistant vulnerable
12 14 16 18 20 22 24 2 4 6 80
10
20
30
40
50
60
Clock time
Laps
es
20 21 22 23 24 1 2 3 4 50
5
10
15
20
25
30
35
40
45
50
Clock time
Laps
es
A
B
SLEEP, Vol. 38, No. 5, 2015 5 Predicting Vulnerability to Sleep Deprivation—Patanaik et al.
is computationally inefficient even for a moderately large number of features. Additionally, because the generalization error has to be estimated from data, a large number of searches increase the likelihood of overfitting, especially in the case of a small dataset.
For our analyses, we first eliminated highly redun-dant or irrelevant features to shortlist a critical set of candidate features based on minimal redundancy-maximal relevance (mRMR).41 This was conducted independently for each dataset. The mRMR is a mul-tivariate feature selection method that is superior to univariate methods such as the t test and F-test based methods (refer to Saeys et al.42 for a review) and is widely used within machine learning and clinical communities. For example, mRMR has been used for feature selection in predicting drug-target interac-tion,43 microarray gene expression data,44 and classifi-cation using electroencephalographic signals,45 among others. The mRMR criterion subtracts the minimal redundancy from maximum relevance, thereby com-bining both relevance and redundancy information into a single score for feature ranking (see supple-mental material for details). It was observed that the classification accuracy stabilized by the eighth ranked feature for both datasets, when each feature was con-sidered incrementally. Therefore, only the top eight features were selected as the candidate feature set for further analysis.
Even though a selected candidate feature is deemed relevant, including all such features does not necessarily result in a better classification rate as compared to using a smaller feature set. Hence, relevance does not imply optimality.46 As a result “the m best features are not the same as best m fea-tures.”47 To maximize the accuracy of the classifier, a further compact subset of features was selected from the candidate features using a wrapper-based approach.46 A wrapper is a feature selector that is “wrapped” with the classifier to select features that result in the lowest generalization error. This is very similar to the naïve method described earlier, but used on a much smaller candidate feature set employing some heu-ristic schemes instead of trying out all possible combinations of features. We employed both the incremental forward and backward selection wrapper schemes detailed previously.46 In the incremental forward selection scheme, we started with an empty set. Features from the candidate set that resulted in the highest accuracy were added one by one until further addition did not improve classification accuracy. Similarly, in the incre-mental backward selection scheme, we started with all features in the candidate set and the least significant feature (in terms of accuracy obtained on remaining features) was incrementally removed until further removal of a feature reduced classifica-tion accuracy.
ClassifierFor classification we used SVMs with a radial basis func-
tion kernel.48 SVMs are powerful supervised classification methods with strong theoretical foundations in statistical learning theory and structural risk minimization. In addi-tion to being simple to implement, SVMs provide very good
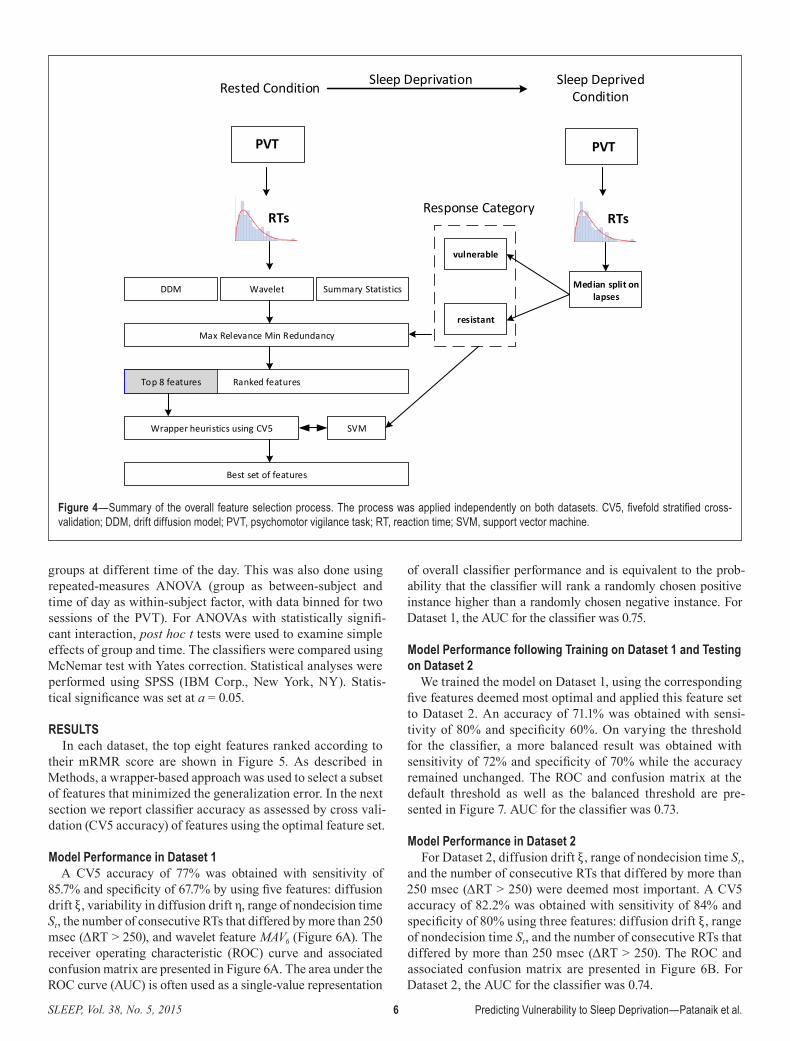
classification accuracy and have a high tolerance of noise (see Kotsiantis49 for a review). A SVM is similar to logistic regression in the sense that both search for a linear sepa-ration between the classes. The key difference between the two methods is that a standard SVM tries to maximize the margin between the two classes instead of minimizing the logistic cost function. For data that are not linearly sepa-rable, a kernel function is used to transform the original data to a high-dimensional space, where the data is linearly separable. The exact details of the implementation are dis-cussed in the supplemental material. All analyses were im-plemented in Matlab 2013b, The MathWorks, Inc., Natick, MA, United States. The SVM was implemented in Matlab using LIBSVM.50 The complete feature selection process is summarized in Figure 4.
Statistical AnalysesStandard RT metrics are known to be stable and reproduc-
ible across studies.17 To test the reproducibility of the DDM pa-rameters, parameters estimated from baseline data of Dataset 1 collected in the first visit were compared with parameters esti-mated from the follow up study using two-way repeated-mea-sures analysis of variance (ANOVA) with group (vulnerable versus resistant) as the between-subject factor and schedule (first visit versus follow-up) as the within- subject factor.
The variation in DDM parameters for vulnerable and resis-tant subjects on the evening before and the morning after sleep deprivation has been reported previously.19 As PVT measure-ments for Dataset 2 were available across the day, DDM pa-rameters were also estimated for the vulnerable and resistant
Figure 3—(A) Components of reaction time (RT). (B) Drift diffusion model for one-choice RT task. Reproduced with permission from Patanaik et al.19
A
B
Onset of stimulus
Decision process starts
Decision process
stops
Response
t1 = pre-decision time, t2 = post decision timeTer = t1+ t2
RT = Td+Ter
Tdt1 t2
Time
Time
Evidence criterionɑ
Ter
St
high drift
low drift
mean drift ξ
SD(across trial) η
SLEEP, Vol. 38, No. 5, 2015 6 Predicting Vulnerability to Sleep Deprivation—Patanaik et al.
groups at different time of the day. This was also done using repeated-measures ANOVA (group as between-subject and time of day as within-subject factor, with data binned for two sessions of the PVT). For ANOVAs with statistically signifi-cant interaction, post hoc t tests were used to examine simple effects of group and time. The classifiers were compared using McNemar test with Yates correction. Statistical analyses were performed using SPSS (IBM Corp., New York, NY). Statis-tical significance was set at a = 0.05.
RESULTSIn each dataset, the top eight features ranked according to
their mRMR score are shown in Figure 5. As described in Methods, a wrapper-based approach was used to select a subset of features that minimized the generalization error. In the next section we report classifier accuracy as assessed by cross vali-dation (CV5 accuracy) of features using the optimal feature set.
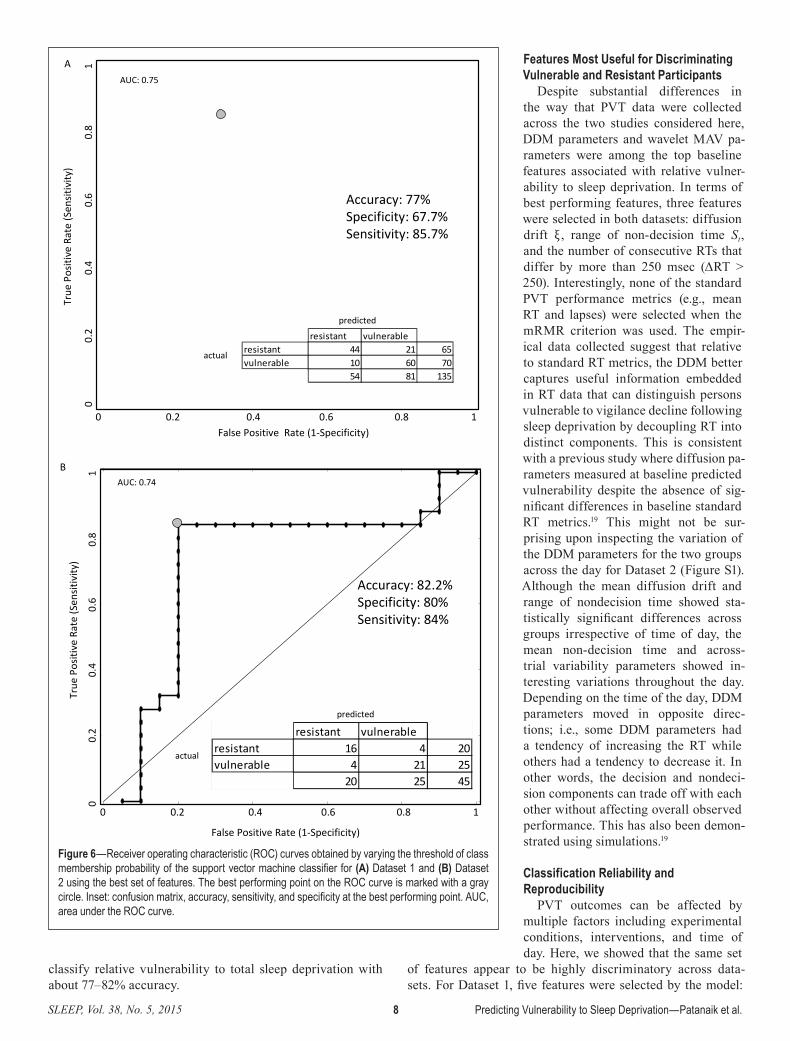
Model Performance in Dataset 1A CV5 accuracy of 77% was obtained with sensitivity of
85.7% and specificity of 67.7% by using five features: diffusion drift ξ , variability in diffusion drift η, range of nondecision time St, the number of consecutive RTs that differed by more than 250 msec (ΔRT > 250), and wavelet feature MAV6 (Figure 6A). The receiver operating characteristic (ROC) curve and associated confusion matrix are presented in Figure 6A. The area under the ROC curve (AUC) is often used as a single-value representation
of overall classifier performance and is equivalent to the prob-ability that the classifier will rank a randomly chosen positive instance higher than a randomly chosen negative instance. For Dataset 1, the AUC for the classifier was 0.75.
Model Performance following Training on Dataset 1 and Testing on Dataset 2
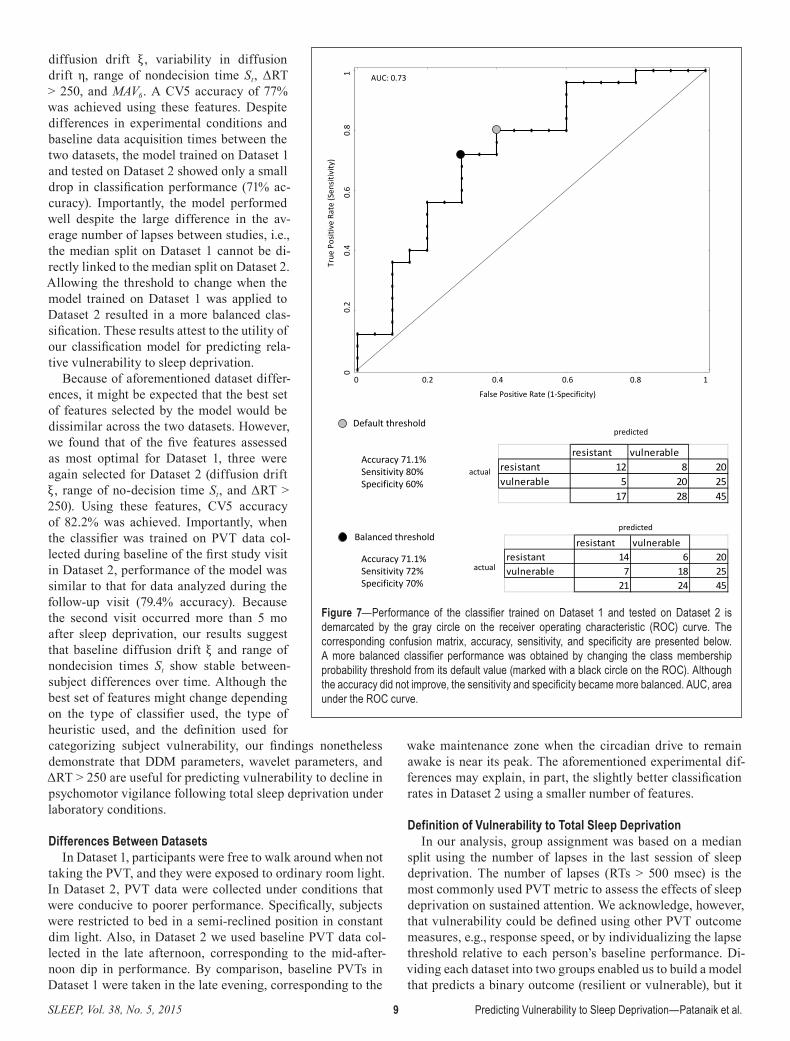
We trained the model on Dataset 1, using the corresponding five features deemed most optimal and applied this feature set to Dataset 2. An accuracy of 71.1% was obtained with sensi-tivity of 80% and specificity 60%. On varying the threshold for the classifier, a more balanced result was obtained with sensitivity of 72% and specificity of 70% while the accuracy remained unchanged. The ROC and confusion matrix at the default threshold as well as the balanced threshold are pre-sented in Figure 7. AUC for the classifier was 0.73.
Model Performance in Dataset 2For Dataset 2, diffusion drift ξ , range of nondecision time St,
and the number of consecutive RTs that differed by more than 250 msec (ΔRT > 250) were deemed most important. A CV5 accuracy of 82.2% was obtained with sensitivity of 84% and specificity of 80% using three features: diffusion drift ξ , range of nondecision time St, and the number of consecutive RTs that differed by more than 250 msec (ΔRT > 250). The ROC and associated confusion matrix are presented in Figure 6B. For Dataset 2, the AUC for the classifier was 0.74.
Figure 4—Summary of the overall feature selection process. The process was applied independently on both datasets. CV5, fivefold stratified cross-validation; DDM, drift diffusion model; PVT, psychomotor vigilance task; RT, reaction time; SVM, support vector machine.
Rested Condition Sleep Deprived Condition
PVT PVT
Sleep Deprivation
RTs RTs
Median split on lapses
vulnerable
resistant
Response Category
DDM Wavelet Summary Statistics
Max Relevance Min Redundancy
Ranked featuresTop 8 features
Wrapper heuristics using CV5 SVM
Best set of features

SLEEP, Vol. 38, No. 5, 2015 7 Predicting Vulnerability to Sleep Deprivation—Patanaik et al.
Reproducibility of Classification across Testing Episodes in the Same Participants
Using the optimal feature set selected in Dataset 2, when the model was trained on baseline PVT data collected during the first visit and then tested on PVT data from the follow-up visit, we obtained an accuracy of 79.4%, with sensitivity of 73.7% and speci-ficity of 86.7%.
Classification Using the Most Sensitive PVT Measures
Although standard PVT metrics were not selected by the model, we considered the possibility that such measures might none-theless carry information about vulnerability to sleep deprivation. Using lapses, mean RS, and slowest 10% RS measured at baseline, three measures previously found to be sensi-tive to total sleep deprivation,30 we obtained a CV5 accuracy of 64.4% on Dataset 1 and CV5 accuracy of 68.9% on Dataset 2. Com-pared to the best performing features for each dataset, classification accuracy using these PVT measures was significantly poorer in the case of Dataset 1 (χ
12 = 10.2, P < 0.005)
but not significantly different for the smaller Dataset 2, (χ
12 = 1.8, ns).
DDM Variability across Visits and with Time; Computational Performance
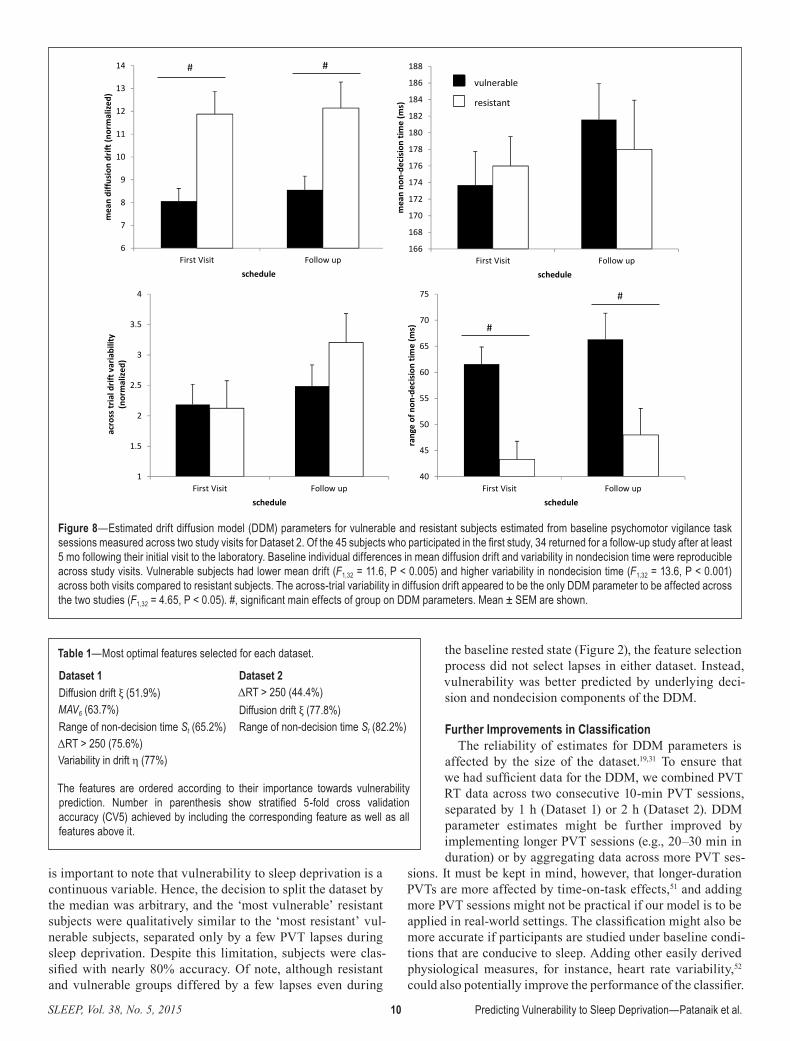
Except for across-trial variability in drift η (F1,32 = 4.65, P < 0.05), DDM pa-rameters were stable across study visits (Figure 8). Vulnerable subjects had lower mean drift (F1,32 = 11.6, P < 0.005) and higher variability in nondecision time (F1,32 = 13.6, P < 0.001) across both visits compared to re-sistant subjects. Although DDM parameters were significantly affected by time of the day (Figure S1, supplemental material), vulner-able subjects had lower mean diffusion drift (F1,43 = 4.03, P < 0.001) and higher variability in nondecision time (F1,43 = 27.5, P < 0.001) irrespective of time elapsed since wake.
The feature extraction process was rea-sonably quick (~10 min/subject) when run on a contemporary workstation (six core Intel® Xeon® 3.2 GHz with 16 GB of RAM), with the majority of time spent estimating the DDM parameters. Overall, the χ2 DDM fit (at baseline) for Dataset 1 was 19.2 ± 6.1 and for Dataset 2 it was 16.8 ± 7.2. The critical value for χ2, df = 14 was 26.1.
DISCUSSIONWe observed large between-subject differences in PVT per-
formance during sleep deprivation, such that persons vulner-able to sleep deprivation had on an average three to eight times more lapses than members of the resistant group. Although
prior studies have identified baseline differences between in-dividuals who are either vulnerable or resistant to sleep depri-vation, the ability to predict performance vulnerability using baseline data has not been systematically examined. Here, we examined features beyond summary statistics conventionally used in assessing RTs, including measures derived from the DDM and spectral analysis. Using two independent datasets, we identified a subset of PVT features that can be used to
Figure 5—Stratified fivefold cross-validation (CV5) accuracy of the classifier as features ranked by minimal redundancy-maximal relevance (mRMR) criterion were incrementally added to the feature set for (A) Dataset 1 and (B) Dataset 2. The top eight features in each dataset (partitioned by vertical line) were considered for the candidate feature set. The feature set was composed of 5 drift diffusion model parameters (mean drift: ξ /a, across trial variability in drift: eta, mean nondecision time: Ter, variability in non-decision time: St, drift signal to noise ratio: driftSNR); nine standard reaction time (RT) metrics (mean RT, mean response speed (RS), fastest 10% RT, median RT, slowest 10% RS, median RT, standard deviation of RT: std RT, mean absolute deviation of RT: MAD RT and the number of consecutive RTs that differ by more than 250 msec: ΔRT > 250); and six metrics derived from spectral analysis of RTs (mean absolute value of detail coefficient at level 1 through level 6: MAV1 to MAV6).
SLEEP, Vol. 38, No. 5, 2015 8 Predicting Vulnerability to Sleep Deprivation—Patanaik et al.
classify relative vulnerability to total sleep deprivation with about 77–82% accuracy.
Features Most Useful for Discriminating Vulnerable and Resistant Participants
Despite substantial differences in the way that PVT data were collected across the two studies considered here, DDM parameters and wavelet MAV pa-rameters were among the top baseline features associated with relative vulner-ability to sleep deprivation. In terms of best performing features, three features were selected in both datasets: diffusion drift ξ , range of non-decision time St, and the number of consecutive RTs that differ by more than 250 msec (ΔRT > 250). Interestingly, none of the standard PVT performance metrics (e.g., mean RT and lapses) were selected when the mRMR criterion was used. The empir-ical data collected suggest that relative to standard RT metrics, the DDM better captures useful information embedded in RT data that can distinguish persons vulnerable to vigilance decline following sleep deprivation by decoupling RT into distinct components. This is consistent with a previous study where diffusion pa-rameters measured at baseline predicted vulnerability despite the absence of sig-nificant differences in baseline standard RT metrics.19 This might not be sur-prising upon inspecting the variation of the DDM parameters for the two groups across the day for Dataset 2 (Figure S1). Although the mean diffusion drift and range of nondecision time showed sta-tistically significant differences across groups irrespective of time of day, the mean non-decision time and across-trial variability parameters showed in-teresting variations throughout the day. Depending on the time of the day, DDM parameters moved in opposite direc-tions; i.e., some DDM parameters had a tendency of increasing the RT while others had a tendency to decrease it. In other words, the decision and nondeci-sion components can trade off with each other without affecting overall observed performance. This has also been demon-strated using simulations.19
Classification Reliability and Reproducibility
PVT outcomes can be affected by multiple factors including experimental conditions, interventions, and time of day. Here, we showed that the same set
of features appear to be highly discriminatory across data-sets. For Dataset 1, five features were selected by the model:
Figure 6—Receiver operating characteristic (ROC) curves obtained by varying the threshold of class membership probability of the support vector machine classifier for (A) Dataset 1 and (B) Dataset 2 using the best set of features. The best performing point on the ROC curve is marked with a gray circle. Inset: confusion matrix, accuracy, sensitivity, and specificity at the best performing point. AUC, area under the ROC curve.
False Positive Rate (1-Specificity)
True
Pos
itive
Rat
e (S
ensit
ivity
)
Accuracy: 77%Specificity: 67.7%Sensitivity: 85.7%
AUC: 0.75
predicted
actual
A
False Positive Rate (1-Specificity)
True
Pos
itive
Rat
e (S
ensit
ivity
)
Accuracy: 82.2%Specificity: 80%Sensitivity: 84%
AUC: 0.74
predicted
actual
0 0.2 0.4 0.6 0.8 1
0
0.
2
0.4
0
.6
0.8
1
resistant vulnerableresistant 16 4 20vulnerable 4 21 25
20 25 45
B
resistant vulnerableresistant 44 21 65vulnerable 10 60 70
54 81 135
0 0.2 0.4 0.6 0.8 1
0
0.
2
0.
4
0.
6
0.
8
1
SLEEP, Vol. 38, No. 5, 2015 9 Predicting Vulnerability to Sleep Deprivation—Patanaik et al.
diffusion drift ξ , variability in diffusion drift η, range of nondecision time St, ΔRT > 250, and MAV6. A CV5 accuracy of 77% was achieved using these features. Despite differences in experimental conditions and baseline data acquisition times between the two datasets, the model trained on Dataset 1 and tested on Dataset 2 showed only a small drop in classification performance (71% ac-curacy). Importantly, the model performed well despite the large difference in the av-erage number of lapses between studies, i.e., the median split on Dataset 1 cannot be di-rectly linked to the median split on Dataset 2. Allowing the threshold to change when the model trained on Dataset 1 was applied to Dataset 2 resulted in a more balanced clas-sification. These results attest to the utility of our classification model for predicting rela-tive vulnerability to sleep deprivation.
Because of aforementioned dataset differ-ences, it might be expected that the best set of features selected by the model would be dissimilar across the two datasets. However, we found that of the five features assessed as most optimal for Dataset 1, three were again selected for Dataset 2 (diffusion drift ξ , range of no-decision time St, and ΔRT > 250). Using these features, CV5 accuracy of 82.2% was achieved. Importantly, when the classifier was trained on PVT data col-lected during baseline of the first study visit in Dataset 2, performance of the model was similar to that for data analyzed during the follow-up visit (79.4% accuracy). Because the second visit occurred more than 5 mo after sleep deprivation, our results suggest that baseline diffusion drift ξ and range of nondecision times St show stable between-subject differences over time. Although the best set of features might change depending on the type of classifier used, the type of heuristic used, and the definition used for categorizing subject vulnerability, our findings nonetheless demonstrate that DDM parameters, wavelet parameters, and ΔRT > 250 are useful for predicting vulnerability to decline in psychomotor vigilance following total sleep deprivation under laboratory conditions.
Differences Between DatasetsIn Dataset 1, participants were free to walk around when not
taking the PVT, and they were exposed to ordinary room light. In Dataset 2, PVT data were collected under conditions that were conducive to poorer performance. Specifically, subjects were restricted to bed in a semi-reclined position in constant dim light. Also, in Dataset 2 we used baseline PVT data col-lected in the late afternoon, corresponding to the mid-after-noon dip in performance. By comparison, baseline PVTs in Dataset 1 were taken in the late evening, corresponding to the
wake maintenance zone when the circadian drive to remain awake is near its peak. The aforementioned experimental dif-ferences may explain, in part, the slightly better classification rates in Dataset 2 using a smaller number of features.
Definition of Vulnerability to Total Sleep DeprivationIn our analysis, group assignment was based on a median
split using the number of lapses in the last session of sleep deprivation. The number of lapses (RTs > 500 msec) is the most commonly used PVT metric to assess the effects of sleep deprivation on sustained attention. We acknowledge, however, that vulnerability could be defined using other PVT outcome measures, e.g., response speed, or by individualizing the lapse threshold relative to each person’s baseline performance. Di-viding each dataset into two groups enabled us to build a model that predicts a binary outcome (resilient or vulnerable), but it
Figure 7—Performance of the classifier trained on Dataset 1 and tested on Dataset 2 is demarcated by the gray circle on the receiver operating characteristic (ROC) curve. The corresponding confusion matrix, accuracy, sensitivity, and specificity are presented below. A more balanced classifier performance was obtained by changing the class membership probability threshold from its default value (marked with a black circle on the ROC). Although the accuracy did not improve, the sensitivity and specificity became more balanced. AUC, area under the ROC curve.
False Positive Rate (1-Specificity)
True
Pos
itive
Rat
e (S
ensit
ivity
)
AUC: 0.73
predicted
actual
0 0.2 0.4 0.6 0.8 1
00.
2
0
.4
0.6
0
.8
1
Balanced threshold
resistant vulnerableresistant 12 8 20vulnerable 5 20 25
17 28 45
Accuracy 71.1%Sensitivity 80%Specificity 60%
Default threshold
resistant vulnerableresistant 14 6 20vulnerable 7 18 25
21 24 45
predicted
actualAccuracy 71.1%Sensitivity 72%Specificity 70%
SLEEP, Vol. 38, No. 5, 2015 10 Predicting Vulnerability to Sleep Deprivation—Patanaik et al.
is important to note that vulnerability to sleep deprivation is a continuous variable. Hence, the decision to split the dataset by the median was arbitrary, and the ‘most vulnerable’ resistant subjects were qualitatively similar to the ‘most resistant’ vul-nerable subjects, separated only by a few PVT lapses during sleep deprivation. Despite this limitation, subjects were clas-sified with nearly 80% accuracy. Of note, although resistant and vulnerable groups differed by a few lapses even during
the baseline rested state (Figure 2), the feature selection process did not select lapses in either dataset. Instead, vulnerability was better predicted by underlying deci-sion and nondecision components of the DDM.
Further Improvements in ClassificationThe reliability of estimates for DDM parameters is
affected by the size of the dataset.19,31 To ensure that we had sufficient data for the DDM, we combined PVT RT data across two consecutive 10-min PVT sessions, separated by 1 h (Dataset 1) or 2 h (Dataset 2). DDM parameter estimates might be further improved by implementing longer PVT sessions (e.g., 20–30 min in duration) or by aggregating data across more PVT ses-
sions. It must be kept in mind, however, that longer-duration PVTs are more affected by time-on-task effects,51 and adding more PVT sessions might not be practical if our model is to be applied in real-world settings. The classification might also be more accurate if participants are studied under baseline condi-tions that are conducive to sleep. Adding other easily derived physiological measures, for instance, heart rate variability,52 could also potentially improve the performance of the classifier.
Figure 8—Estimated drift diffusion model (DDM) parameters for vulnerable and resistant subjects estimated from baseline psychomotor vigilance task sessions measured across two study visits for Dataset 2. Of the 45 subjects who participated in the first study, 34 returned for a follow-up study after at least 5 mo following their initial visit to the laboratory. Baseline individual differences in mean diffusion drift and variability in nondecision time were reproducible across study visits. Vulnerable subjects had lower mean drift (F1,32 = 11.6, P < 0.005) and higher variability in nondecision time (F1,32 = 13.6, P < 0.001) across both visits compared to resistant subjects. The across-trial variability in diffusion drift appeared to be the only DDM parameter to be affected across the two studies (F1,32 = 4.65, P < 0.05). #, significant main effects of group on DDM parameters. Mean ± SEM are shown.
6
7
8
9
10
11
12
13
14
First Visit Follow up
mea
n di
ffusio
n dr
ift (n
orm
alize
d)
schedule
#
166
168
170
172
174
176
178
180
182
184
186
188
First Visit Follow up
mea
n no
n-de
cisio
n tim
e (m
s)
schedule
resistant
1
1.5
2
2.5
3
3.5
4
First Visit Follow up
acro
ss tr
ial d
rift v
aria
bilit
y(n
orm
alize
d)
schedule
40
45
50
55
60
65
70
75
First Visit Follow up
rang
e of
non
-dec
ision
tim
e (m
s)
schedule
#
#
vulnerable
#
Table 1—Most optimal features selected for each dataset.
Dataset 1 Dataset 2Diffusion drift ξ (51.9%) ΔRT > 250 (44.4%)MAV6 (63.7%) Diffusion drift ξ (77.8%)Range of non-decision time St (65.2%) Range of non-decision time St (82.2%)ΔRT > 250 (75.6%)Variability in drift η (77%)
The features are ordered according to their importance towards vulnerability prediction. Number in parenthesis show stratified 5-fold cross validation accuracy (CV5) achieved by including the corresponding feature as well as all features above it.

SLEEP, Vol. 38, No. 5, 2015 11 Predicting Vulnerability to Sleep Deprivation—Patanaik et al.
CONCLUSIONIn this study, we built a classifier to predict vulnerability
in sustained attention during sleep deprivation, using features derived from PVTs taken under rested baseline conditions. We included a range of features including several summary sta-tistics, DDM parameters, and features derived from wavelet transform of the RT sequence. We found that DDM parameters, including decision and nondecision components, the number of consecutive RTs that differ by more than 250 msec, and wavelet features can be used to discriminate sleep depriva-tion vulnerable and resistant individuals with an accuracy of 77–82% across datasets.
ACKNOWLEDGMENTSThe authors thank Badrinarayanan Rangarajan and Ankit
Das for technical discussions regarding best strategies for fea-ture selection; and research staff and students in the Chrono-biology and Sleep Laboratory and the Cognitive Neuroscience Laboratory for their assistance in carrying out these studies.
DISCLOSURE STATEMENTThe study was supported by the National Research Foun-
dation/National Medical Research Council, Singapore under STaR 004/2008 (Chee); the Duke-NUS Signature Research Program funded by the Agency for Science, Technology and Research, Singapore, and the Ministry of Health, Singapore; the National Medical Research Council, Singapore under NIG/1000/2009 (Gooley); and the SingHealth Foundation, Singapore, under SHF/FG410P/2009 (Gooley). The authors have indicated no financial conflicts of interest. Work was performed at Cognitive Neuroscience Laboratory and Chrono-biology and Sleep Laboratory, Duke-NUS Graduate Medical School, Singapore.
REFERENCES1. Durmer JS, Dinges DF. Neurocognitive consequences of sleep
deprivation. Semin Neurol, 2005:117–29.2. Knutson KL, Spiegel K, Penev P, Van Cauter E. The metabolic
consequences of sleep deprivation. Sleep Med Rev 2007;11:163–78.3. Pilcher JJ, Huffcutt AI. Effects of sleep deprivation on performance: a
meta-analysis. Sleep 1996;19:318–26.4. Fairclough SH, Graham R. Impairment of driving performance caused
by sleep deprivation or alcohol: a comparative study. Hum Factors 1999;41:118–28.
5. Dinges DF. An overview of sleepiness and accidents. J Sleep Res 1995;4:4–14.
6. Barger LK, Ayas NT, Cade BE, et al. Impact of extended-duration shifts on medical errors, adverse events, and attentional failures. PLoS Med 2006;3:e487.
7. Philip P, Åkerstedt T. Transport and industrial safety, how are they affected by sleepiness and sleep restriction? Sleep Med Rev 2006;10:347–56.
8. Williamson AM, Feyer A-M. Moderate sleep deprivation produces impairments in cognitive and motor performance equivalent to legally prescribed levels of alcohol intoxication. Occup Environ Med 2000;57:649–55.
9. Doran S, Van Dongen H, Dinges D. Sustained attention performance during sleep deprivation: evidence of state instability. Arch Ital Biol 2001;139:253–67.
10. Van Dongen H, Baynard MD, Maislin G, Dinges DF. Systematic interindividual differences in neurobehavioral impairment from sleep loss: evidence of trait-like differential vulnerability. Sleep 2004;27:423–33.
11. Van Dongen H, Maislin G, Dinges DF. Dealing with inter-individual differences in the temporal dynamics of fatigue and performance: importance and techniques. Aviat Space Env Med 2004;75:A147–54.
12. Lim J, Choo WC, Chee MW. Reproducibility of changes in behaviour and fMRI activation associated with sleep deprivation in a working memory task. Sleep 2007;30:61–70.
13. Caldwell JA, Mu Q, Smith JK, et al. Are individual differences in fatigue vulnerability related to baseline differences in cortical activation? Behav Neurosci 2005;119:694–707.
14. Mu Q, Mishory A, Johnson KA, et al. Decreased brain activation during a working memory task at rested baseline is associated with vulnerability to sleep deprivation. Sleep 2005;28:433–46.
15. Chuah YL, Venkatraman V, Dinges DF, Chee MW. The neural basis of interindividual variability in inhibitory efficiency after sleep deprivation. J Neurosci 2006;26:7156–62.
16. Chee MW, Chuah LY, Venkatraman V, Chan WY, Philip P, Dinges DF. Functional imaging of working memory following normal sleep and after 24 and 35 h of sleep deprivation: correlations of fronto-parietal activation with performance. Neuroimage 2006;31:419–28.
17. Chua ECP, Yeo S-C, Lee ITG, et al. Sustained attention performance during sleep deprivation associates with instability in behavior and physiologic measures at baseline. Sleep 2014;37:27–39.
18. Van Dongen H, Dinges DF. Sleep, circadian rhythms, and psychomotor vigilance. Clin Sports Med 2005;24:237–49.
19. Patanaik A, Zagorodnov V, Kwoh CK, Chee MWL. Predicting vulnerability to sleep deprivation using diffusion model parameters. J Sleep Res 2014;23:576–84.
20. Lim J, Dinges DF. A meta-analysis of the impact of short-term sleep deprivation on cognitive variables. Psychol Bull 2010;136:375.
21. Dinges DF, Powell JW. Microcomputer analyses of performance on a portable, simple visual RT task during sustained operations. Behav Res Methods Instrum Comput 1985;17:652–5.
22. Chee MW, Chuah YL. Functional neuroimaging and behavioral correlates of capacity decline in visual short-term memory after sleep deprivation. Proc Natl Acad Sci 2007;104:9487–92.
23. Venkatraman V, Chuah YL, Huettel SA, Chee MW. Sleep deprivation elevates expectation of gains and attenuates response to losses following risky decisions. Sleep 2007;30:603–9.
24. Chee MW, Tan JC. Lapsing when sleep deprived: neural activation characteristics of resistant and vulnerable individuals. Neuroimage 2010;51:835–43.
25. Chuah LY, Chee MW. Cholinergic augmentation modulates visual task performance in sleep-deprived young adults. J Neurosci 2008;28:11369–77.
26. Chuah LY, Dolcos F, Chen AK, Zheng H, Parimal S, Chee MW. Sleep deprivation and interference by emotional distracters. Sleep 2010;33:1305–13.
27. Duffy JF, Dijk D-J. Getting through to circadian oscillators: why use constant routines? J Biol Rhythms 2002;17:4–13.
28. Achermann P, Borbély AA. Simulation of daytime vigilance by the additive interaction of a homeostatic and a circadian process. Biol Cybern 1994;71:115–21.
29. Horne J, Reyner L. Vehicle accidents related to sleep: a review. Occup Environ Med 1999;56:289–94.
30. Basner M, Dinges DF. Maximizing sensitivity of the psychomotor vigilance test (PVT) to sleep loss. Sleep 2011;34:581–91.
31. Ratcliff R, Van Dongen HP. Diffusion model for one-choice reaction-time tasks and the cognitive effects of sleep deprivation. Proc Natl Acad Sci 2011;108:11285–90.
32. Ratcliff R. A theory of memory retrieval. Psychol Rev 1978;85:59.33. Ratcliff R, Murdock BB. Retrieval processes in recognition memory.
Psychol Rev 1976;83:190.34. Ratcliff R, Rouder JN. Modeling response times for two-choice
decisions. Psychol Sci 1998;9:347–56.35. Ratcliff R. A diffusion model account of response time and accuracy in
a brightness discrimination task: fitting real data and failing to fit fake but plausible data. Psychon Bull Rev 2002;9:278–91.
36. Ratcliff R, Tuerlinckx F. Estimating parameters of the diffusion model: approaches to dealing with contaminant reaction times and parameter variability. Psychon Bull Rev 2002;9:438–81.
37. Voss A, Rothermund K, Voss J. Interpreting the parameters of the diffusion model: an empirical validation. Mem Cognit 2004;32:1206–20.
38. Patanaik A, Zagorodnov V, Kwoh C. Parameter estimation and simulation for one-choice Ratcliff diffusion model. ACM-SIGAPP SAC; 2014:29:3–7.
SLEEP, Vol. 38, No. 5, 2015 12 Predicting Vulnerability to Sleep Deprivation—Patanaik et al.
39. Rodriguez JD, Perez A, Lozano JA. Sensitivity analysis of k-fold cross validation in prediction error estimation. IEEE Trans Pattern Anal Mach Intell 2010;32:569–75.
40. Kohavi R. A study of cross-validation and bootstrap for accuracy estimation and model selection. IJCAI 1995;14:1137–45.
41. Peng H, Long F, Ding C. Feature selection based on mutual information criteria of max-dependency, max-relevance, and min-redundancy. IEEE Trans Pattern Anal Mach Intell 2005;27:1226–38.
42. Saeys Y, Inza I, Larrañaga P. A review of feature selection techniques in bioinformatics. Bioinformatics 2007;23:2507–17.
43. He Z, Zhang J, Shi X-H, et al. Predicting drug-target interaction networks based on functional groups and biological features. PloS One 2010;5:e9603.
44. Ding C, Peng H. Minimum redundancy feature selection from microarray gene expression data. J Bioinform Comput Biol 2005;3:185–205.
45. Horlings R, Datcu D, Rothkrantz LJ. Emotion recognition using brain activity. CompSysTech ‘08 Proceedings of the 9th International Conference on Computer Systems and Technologies and Workshop for PhD Students in Computing. Article No. 6. 2008.
46. Kohavi R, John GH. Wrappers for feature subset selection. Eng Appl Artif Intel 1997;97:273–324.
47. Cover TM. The best two independent measurements are not the two best. IEEE Trans Syst Man Cybern 1974:116–7.
48. Vapnik V. The nature of statistical learning theory. New York, Springer: 2000:138–67.
49. Kotsiantis S. Supervised machine learning: a review of classification techniques. Informatica 2007;31:249–68.
50. Chang C-C, Lin C-J. LIBSVM: a library for support vector machines. ACM Trans Intell Syst Technol 2011;2:27.
51. Van Dongen H, Belenky G, Krueger JM. Investigating the temporal dynamics and underlying mechanisms of cognitive fatigue. In: Ackermann PL, editor. Cognitive fatigue. Washington, DC: American Psychological Association, 2010.
52. Chua EC, Tan WQ, Yeo SC, et al. Heart rate variability can be used to estimate sleepiness-related decrements in psychomotor vigilance during total sleep deprivation. Sleep 2012;35:325–34.