Classification of rice germplasm. I. Analysis using ALP and PCR-based RFLP
10
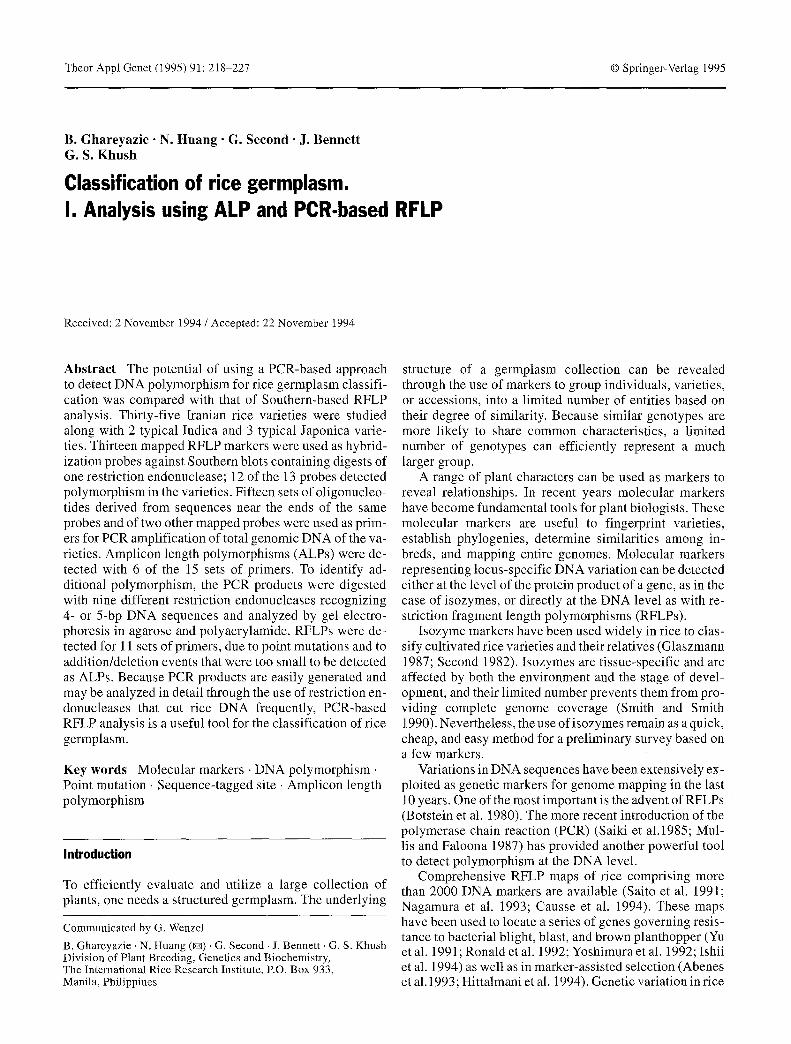
Theor Appl Genet (1995) 91:218-227 Springer-Verlag 1995 B. Ghareyazie N. Huang G. Second J. Bennett G. S. Khush Classification of rice germplasm. I. Analysis using ALP and PCR-based RFLP Received: 2 November 1994 / Accepted: 22 November 1994 Abstract The potential of using a PCR-based approach to detect DNA polymorphism for rice germplasm classifi- cation was compared with that of Southern-based RFLP analysis. Thirty-five Iranian rice varieties were studied along with 2 typical Indica and 3 typical Japonica varie- ties. Thirteen mapped RFLP markers were used as hybrid- ization probes against Southern blots containing digests of one restriction endonuclease; 12 of the 13 probes detected polymorphism in the varieties. Fifteen sets of oligonucleo- tides derived from sequences near the ends of the same probes and of two other mapped probes were used as prim- ers for PCR amplification of total genomic DNA of the va- rieties. Amplicon length polymorphisms (ALPs) were de- tected with 6 of the 15 sets of primers. To identify ad- ditional polymorphism, the PCR products were digested with nine different restriction endonucleases recognizing 4- or 5-bp DNA sequences and analyzed by gel electro- phoresis in agarose and polyacrylamide. RFLPs were de- tected for 11 sets of primers, due to point mutations and to addition/deletion events that were too small to be detected as ALPs. Because PCR products are easily generated and may be analyzed in detail through the use of restriction en- donucleases that cut rice DNA frequently, PCR-based RFLP analysis is a useful tool for the classification of rice germplasm. Key words Molecular markers. DNA polymorphism Point mutation Sequence-tagged site Amplicon length polymorphism Introduction To efficiently evaluate and utilize a large collection of plants, one needs a structured germplasm. The underlying Communicated by G. Wenzel B. Ghareyazie - N. Huang (~) G. Second, J. Bennett. G. S. Khush Division of Plant Breeding, Genetics and Biochemistry, The International Rice Research Institute, RO. Box 933, Manila, Philippines structure of a germplasm collection can be revealed through the use of markers to group individuals, varieties, or accessions, into a limited number of entities based on their degree of similarity. Because similar genotypes are more likely to share common characteristics, a limited number of genotypes can efficiently represent a much larger group. A range of plant characters can be used as markers to reveal relationships. In recent years molecular markers have become fundamental tools for plant biologists. These molecular markers are useful to fingerprint varieties, establish phylogenies, determine similarities among in- breds, and mapping entire genomes. Molecular markers representing locus-specific DNA variation can be detected either at the level of the protein product of a gene, as in the case of isozymes, or directly at the DNA level as with re- striction fragment length polymorphisms (RFLPs). Isozyme markers have been used widely in rice to clas- sify cultivated rice varieties and their relatives (Glaszmann 1987; Second 1982). Isozymes are tissue-specific and are affected by both the environment and the stage of devel- opment, and their limited number prevents them from pro- viding complete genome coverage (Smith and Smith 1990). Nevertheless, the use of isozymes remain as a quick, cheap, and easy method for a preliminary survey based on a few markers. Variations in DNA sequences have been extensively ex- ploited as genetic markers for genome mapping in the last 10 years. One of the most important is the advent of RFLPs (Botstein et al. 1980). The more recent introduction of the polymerase chain reaction (PCR) (Saiki et a1.1985; Mul- lis and Faloona 1987) has provided another powerful tool to detect polymorphism at the DNA level. Comprehensive RFLP maps of rice comprising more than 2000 DNA markers are available (Saito et al. 1991; Nagamura et al. 1993; Causse et al. 1994). These maps have been used to locate a series of genes governing resis- tance to bacterial blight, blast, and brown planthopper (Yu et al. 1991; Ronald et al. 1992; Yoshimura et al. 1992; Ishii et al. 1994) as well as in marker-assisted selection (Abenes et al. 1993; Hittalmani et al. 1994). Genetic variation in rice
-
Upload
independent -
Category
Documents
-
view
0 -
download
0
Transcript of Classification of rice germplasm. I. Analysis using ALP and PCR-based RFLP
Theor Appl Genet (1995) 91:218-227 �9 Springer-Verlag 1995
B. G h a r e y a z i e �9 N. H u a n g �9 G. S e c o n d �9 J. B e n n e t t G. S. K h u s h
Classification of rice germplasm. I. Analysis using ALP and PCR-based RFLP
Received: 2 November 1994 / Accepted: 22 November 1994
A b s t r a c t The potential of using a PCR-based approach to detect DNA polymorphism for rice germplasm classifi- cation was compared with that of Southern-based RFLP analysis. Thirty-five Iranian rice varieties were studied along with 2 typical Indica and 3 typical Japonica varie- ties. Thirteen mapped RFLP markers were used as hybrid- ization probes against Southern blots containing digests of one restriction endonuclease; 12 of the 13 probes detected polymorphism in the varieties. Fifteen sets of oligonucleo- tides derived from sequences near the ends of the same probes and of two other mapped probes were used as prim- ers for PCR amplification of total genomic DNA of the va- rieties. Amplicon length polymorphisms (ALPs) were de- tected with 6 of the 15 sets of primers. To identify ad- ditional polymorphism, the PCR products were digested with nine different restriction endonucleases recognizing 4- or 5-bp DNA sequences and analyzed by gel electro- phoresis in agarose and polyacrylamide. RFLPs were de- tected for 11 sets of primers, due to point mutations and to addition/deletion events that were too small to be detected as ALPs. Because PCR products are easily generated and may be analyzed in detail through the use of restriction en- donucleases that cut rice DNA frequently, PCR-based RFLP analysis is a useful tool for the classification of rice germplasm.
K e y w o r d s Molecular markers. DNA polymorphism �9 Point mutation �9 Sequence-tagged site �9 Amplicon length polymorphism
Introduction
To efficiently evaluate and utilize a large collection of plants, one needs a structured germplasm. The underlying
Communicated by G. Wenzel B. Ghareyazie - N. Huang (~) �9 G. Second, J. Bennett. G. S. Khush Division of Plant Breeding, Genetics and Biochemistry, The International Rice Research Institute, RO. Box 933, Manila, Philippines
structure of a germplasm collection can be revealed through the use of markers to group individuals, varieties, or accessions, into a limited number of entities based on their degree of similarity. Because similar genotypes are more likely to share common characteristics, a limited number of genotypes can efficiently represent a much larger group.
A range of plant characters can be used as markers to reveal relationships. In recent years molecular markers have become fundamental tools for plant biologists. These molecular markers are useful to fingerprint varieties, establish phylogenies, determine similarities among in- breds, and mapping entire genomes. Molecular markers representing locus-specific DNA variation can be detected either at the level of the protein product of a gene, as in the case of isozymes, or directly at the DNA level as with re- striction fragment length polymorphisms (RFLPs).
Isozyme markers have been used widely in rice to clas- sify cultivated rice varieties and their relatives (Glaszmann 1987; Second 1982). Isozymes are tissue-specific and are affected by both the environment and the stage of devel- opment, and their limited number prevents them from pro- viding complete genome coverage (Smith and Smith 1990). Nevertheless, the use of isozymes remain as a quick, cheap, and easy method for a preliminary survey based on a few markers.
Variations in DNA sequences have been extensively ex- ploited as genetic markers for genome mapping in the last 10 years. One of the most important is the advent of RFLPs (Botstein et al. 1980). The more recent introduction of the polymerase chain reaction (PCR) (Saiki et a1.1985; Mul- lis and Faloona 1987) has provided another powerful tool to detect polymorphism at the DNA level.
Comprehensive RFLP maps of rice comprising more than 2000 DNA markers are available (Saito et al. 1991; Nagamura et al. 1993; Causse et al. 1994). These maps have been used to locate a series of genes governing resis- tance to bacterial blight, blast, and brown planthopper (Yu et al. 1991; Ronald et al. 1992; Yoshimura et al. 1992; Ishii et al. 1994) as well as in marker-assisted selection (Abenes et al. 1993; Hittalmani et al. 1994). Genetic variation in rice
ge rmp la sm and the evolu t ionary re la t ionships among Oryza species have also been inves t iga ted (Wang and Tanks ley 1989; Second 1991).
However , R F L P analys is requires the handl ing o f l iv- ing mater ia l (in order to mainta in the probes) and large quanti t ies of qual i ty DNA, and involves several t ime-con- suming and tedious steps and detec t ion sys tems that use e i ther r ad io i so tope or complex biochemis t ry . Speed, effi- c iency and safety cons idera t ions have led many inves t iga- tors to evalua te PCR-based techniques as an a l ternat ive to Southern-b lo t analys is (Wi l l i ams et al. 1990; Tragoonrung et al. 1992; Hi t ta lmani et al. 1994). PCR analysis is fast and easy to pe r fo rm and requires only a few nano- grams of D N A or a smal l amount of p lant t issue and not l iv ing mater ia l . PCR also a l lows direct de tec t ion o f inser- t ion/dele t ion and po in t -muta t ion events permi t t ing de- ta i led analys is of var ia t ion at the D N A level. The major l imi ta t ion for PCR analysis is that it requires ex tens ive p re l iminary sequence informat ion in order to synthes ize pr imers .
Southern-based RFLPs main ly detect po lymorph i sms in regions sur rounding the probe. This area can be as big as 30 kb. PCR-based approaches , on the other hand, detect var ia t ion only wi thin the ampl i f i ed D N A fragment , which is genera l ly f rom 0.5 to 2 kb. Regula r Southern-based R F L P detects p o l y m o r p h i s m in a larger area, and the PCR- based approach detects smal ler var iat ions. It therefore re- mains unclear if the level of D N A p o l y m o r p h i s m detected by PCR is comparab le with that o f Sou thern-based RFLP.
As a first s tep towards c lass i fy ing r ice germplasm, we looked for a quick, easy, and eff icient approach to detect D N A var ia t ion among r ice variet ies . We examined the p o l y m o r p h i s m detec ted by Southern analysis vs that de- tec ted by PCR. We found that the level of Southern-based R F L P is h igher than that of PCR-based RFLP, but s ince the PCR-based approach is quicker and more efficient, it may be a bet ter choice.
Materials and methods
Plant materials and DNA isolation
Table 1 The Iranian rice varieties and the three indica ponica varieties analyzed
219
and two ja-
Entry no. Variety name Acc. no.
1 Sorkheh molaii KC 03080180 a 2 Sorkheh Iran 19 b 3 Tarom molaii Iran 53 4 Salari KC 03080163 5 - KC 03080394 6 Hasan saraii KC 03080139 7 Gharibake sangsari KC 03080191 8 Sorkheh Iran 7 9 Rashti Iran 54
10 Champa ramhormoz Iran 64 11 Sadri KC 03080223 12 - KC 03080168 13 Tarom Iran 35 14 Koram Iran 24 15 Khale beenam KC 03080206 16 Pakistani KC 03080010 17 Dom siah KC 03080357 18 Champa Iran 28 19 Berenj KC 03080005 20 Champa KC 03080039 21 - KC 03080204 22 Champa KC 03080007 23 Hasan saraii KC 03080125 24 Abji boji Ivan 51 25 Amboori sosangerd Iran 11 26 Abji boji KC 03080161 27 - KC 03080334 28 Champa tokhme dasti Iran 12 29 Sadri KC 03080089 30 - KC 03080162 31 Ghol gholi KC 03080025 32 Gerdeh sorkhak Iran 40 33 Champa beenam KC 03080153 34 Siah jir sar KC 03080172 35 Hemar Iran 13 36 Taichung native 1 (Indica) 37 Azucena (Japonica) 38 Haifuguya (Japonica) 39 Cecer air (Indica) 40 #610 (Indica)
a Accession numbers of the National Gene Bank of Islamic Repub- lic of Iran, Karaj, Iran b Accession numbers of the Rice Research Institute of Iran (RRII), Rasht, Iran - , = No variety name
Thirty five Iranian rice varieties, plus three typical indica, and two typical japonica varieties were used in this study (Table 1). Seeds of Iranian varieties were obtained from either the Iranian National Germplasm Center or the Rice Research Institute of Iran (RRII), Rasht, Iran. Indica and japonica varieties were from the Internation- al Rice Germplasm Center at IRRI. Rice plants were grown in the field until the harvest of rice tissues for DNA isolation.
Total genomic DNA was extracted from leaves of rice plants us- ing the Dellaporta et al. (1983) method.
Restriction endonucleases
Nine restriction enzymes, CfoI, HaeIII, HinFI, MspI, MvaI, RsaI, StyI, MseI, and TaqI, recognizing four or five base sequences were used for PCR-based RFLP analysis. One six-base cutter per probe, either EcoRV or ScaI, was used for Southern-based RFLR The en- zymes were obtained from Boehringer-Mannheim (Germany) and were used as recommended by the manufacturer.
PCR amplification of rice genomic DNA
A set of 15 pairs of primers (see Table 2) was either synthesized, based on sequence information of RFLP markers (Williams et al. 1991), or obtained from Raymond L. Rodriguez (University of Cal- ifornia, Davis) and Susan McCouch (Cornell University, Ithaca). The primers were synthesized based on the information from full or ter- minal sequence data of mapped single-copy genomic clones from in- dica rice, IR36 (McCouch et al. 1988).
PCR reactions in 25 gl contained 50 mM KC1, 10 mM Tris-HC1 (pH 8.2), 1.5 mM MgC12, 0.01% gelatin, 0.1 mM each of four dNTPs, 500 nM of each primer, 50-100 ng of genomic DNA and 1 unit of Taq polymerase. Amplification consisted of 10 min at 93~ before adding Taq polymerase, and of 35 cycles of 1 min at 93~ (denaturation), 1 min at 60~ (annealing), and 2 min at 72~ (elon- gation) followed by 5 min at 72~
The primers were used to amplify rice genomic DNA isolated from the 40 rice varieties. PCR products were separated in a 2% ag-
220
arose gel containing 0.5 btg/ml EtBr. Separated PCR products were visualized under UV light and photographed to examine amplicon length polymorphism (ALP). Then, PCR products were digested with nine different restriction endonucleases (4-5 base cutters) and sep- arated on either a 2% agarose gel or a 5-10% polyacrylamide gel with subsequent staining with EtBr to detect point mutations and small addition/deletions in order to reveal PCR-based RFLR The mo- lecular-weight-marker DNA was a 1-kb ladder from BRL.
Southern hybridization
Rice DNA (6 btg) was digested with EcoRV or ScaI and electrophor- esed overnight at 25 V on 0.9% agarose gels in TAE buffer. DNA was transferred to a Amersham Hybond N + nylon membrane for Southern hybridization after incubation for 30 rain in 0.25 M HC1, 30 min in 1.5 M NaC1, 0.5 M NaOH, and 15 min in 0.4 M NaOH. All these steps were carried out with gentle shaking. Membranes were subsequently pre-hybridized overnight using hybridization buf- fer and then hybridized with plasmids containing the probes, which had been 32p-labelled using the random priming method (Feinberg and Vogelstein 1983). All RFLP probes were provided by Dr. S. D. Tanksley (Cornell University, USA). After hybridization, the mem- branes were washed under stringent conditions and autoradio- graphed. The blots were successively used for 12 hybridizations between which the probes were removed by the Sambrook et al. (1989) method.
Definition
The degree of polymorphism (D.R) for each enzyme/primer (or probe) combination was calculated based on Falconer (1989) by the following equation:
%D.P. = number of varieties with rarer alleles x 100 total number of varieties
The highest value for D.R in the two allele system is 50%, with three alleles 66.7%, and with four alleles 75%.
Results and discussion
DNA polymorphism revealed by Southern analysis
Fol lowing digestion of genomic DNA with a single restric- t ion endonuclease (EcoRI or ScaI), 12 of 13 RFLP mark- ers identified allelic variation among the 40 rice varieties (Table 2, co lumn 2). Only RG386 was monomorphic (Fig. 1A). At other loci, the number of alleles and degree of polymorphism were high (Table 2, columns 3 and 4). The allelic variation at locus RG214 is shown in Fig. 1B; most rice varieties carried the 2-kb band allele but three other alleles (4 kb, 5.5 kb and 8 kb) were also detected. These results indicate that a high level of polymorphism exists in these selected rice varieties. This f inding of a high level of variation in the selected varieties was also sup- ported indirectly through a comparison in which the same alleles identif ied in a world collection of rice germplasm (Second et al., unpubl ished data) were also found in the 40 rice varieties. Furthermore, we found a new alelle at the waxy locus in the Khale beenam variety (data not shown), which might be attributed to the high level of variation of I ranian germplasm, especially for the traits corresponding to the quali ty characters of rice, such as amylose content.
Detection of DNA polymorphism by PCR analysis
DNA variation can be revealed as differences in the mo- lecular weight of PCR-ampli f ied fragments (or as amplifi- cation). This variation can be observed before restriction
Table 2 Polymorphism of 15 DNA marker loci across 40 rice varieties
Marker loci Southern-based RFLP PCR-based RFLP
ALP (- digestion) RFLP (+ digestion)
Pattern # Alleles a %DP Pattern # Alleles a %DP Pattern # Alleles a %DP
Additional polymorphism
pTA248 Poly 3 30 Poly 2 38 Poly 3 46 Yes RG 13 Poly 3 47 Poly 3 40 Poly 4 49 Yes RG64 Poly 3 22 Poly 3 22 Poly 4 24 Yes RG100 nd nd nd Mono 1 0 Mono 1 0 No RG 118 Poly 2 9 Mono 1 0 Poly 3 49 Yes RG120 Poly 3 33 Mono 1 0 Mono 1 0 No RG173 Poly 2 19 Mono 1 0 Poly 2 10 Yes RG214 Poly 4 25 Poly 2 22 Poly 4 23 Yes RG235 Poly 4 50 Poly 2 13 Poly 2 13 No RG241 Poly 3 20 Mono 1 0 Poly 2 5 Yes RG257 nd nd nd Mono 1 0 Poly 2 5 Yes RG329 Poly 3 25 Mono 1 0 Poly b 2 5 Yes RG365 Poly 3 17 Poly 2 8 Poly 2 8 No RG386 Mono 1 0 Mono 1 0 Poly 2 35 Yes Waxy Poly 4 31 Mono 1 0 Poly 3 33 Yes
DP: the highest degree of polymorphism among enzyme/marker combinations (see Materials and methods for definition) a # Alleles represents the highest number of alleles obtained among the marker/enzyme combinations b The shown polymorphism was obtained from digestion of PCR product with NlaIII restriction endonuclease (these data were not count- ed in the calculation of point mutations) nd: no data
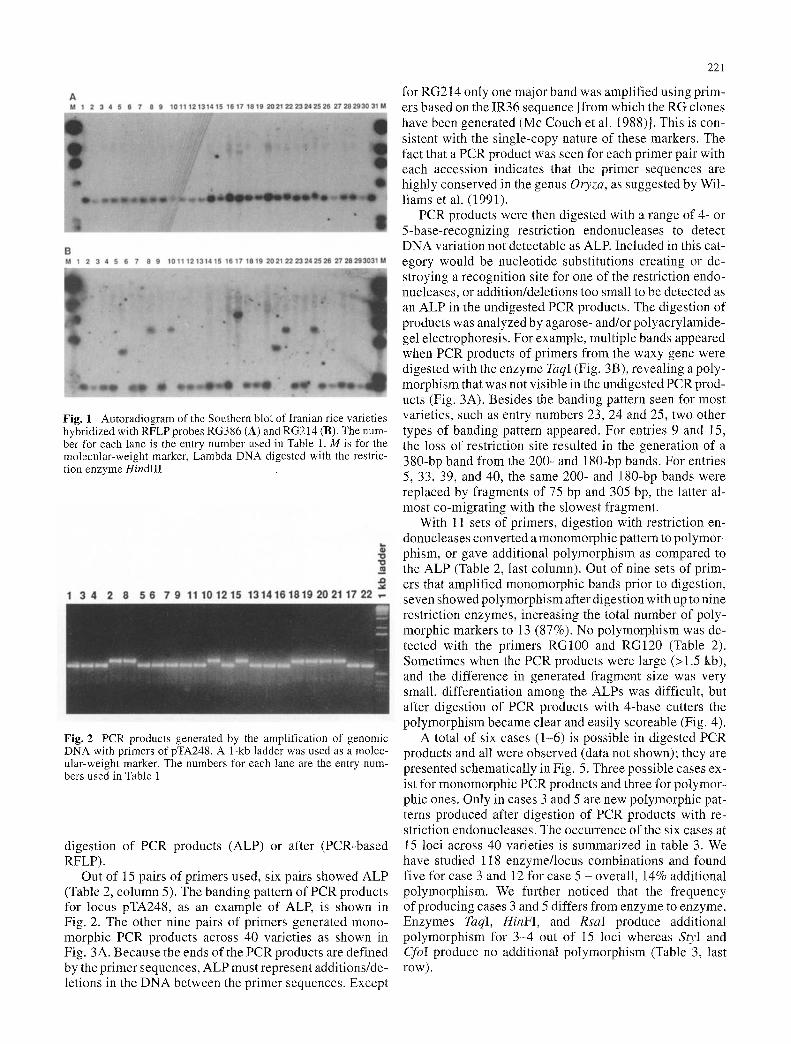
Fig. 1 Autoradiogram of the Southern blot of Iranian rice varieties hybridized with RFLP probes RG386 (A) and RG214 (B). The num- ber for each lane is the entry number used in Table 1. M is for the molecular-weight marker, Lambda DNA digested with the restric- tion enzyme HindIII
Fig. 2 PCR products generated by the amplification of genomic DNA with primers of pTA248. A 1-kb ladder was used as a molec- ular-weight marker. The numbers for each lane are the entry num- bers used in Table 1
digestion of PCR products (ALP) or after (PCR-based RFLP).
Out of 15 pairs of primers used, six pairs showed ALP (Table 2, column 5). The banding pattern of PCR products for locus pTA248, as an example of ALP, is shown in Fig. 2. The other nine pairs of primers generated mono- morphic PCR products across 40 varieties as shown in Fig. 3A. Because the ends of the PCR products are defined by the primer sequences, ALP must represent additions/de- letions in the DNA between the primer sequences. Except
221
for RG214 only one major band was amplified using prim- ers based on the IR36 sequence [from which the RG clones have been generated (Mc Couch et al. 1988)J. This is con- sistent with the single-copy nature of these markers. The fact that a PCR product was seen for each primer pair with each accession indicates that the primer sequences are highly conserved in the genus Oryza, as suggested by Wil- liams et al. (1991).
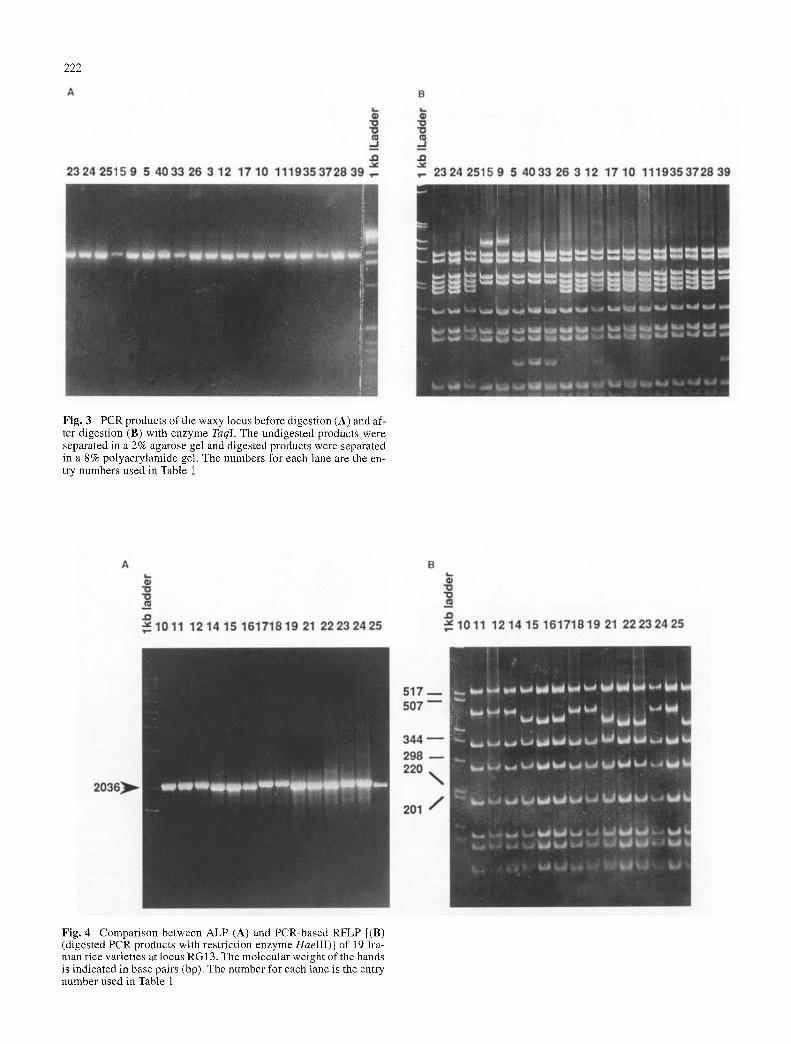
PCR products were then digested with a range of 4- or 5-base-recognizing restriction endonucleases to detect DNA variation not detectable as ALR Included in this cat- egory would be nucleotide substitutions creating or de- stroying a recognition site for one of the restriction endo- nucleases, or addition/deletions too small to be detected as an ALP in the undigested PCR products. The digestion of products was analyzed by agarose- and/or polyacrylamide- gel electrophoresis. For example, multiple bands appeared when PCR products of primers from the waxy gene were digested with the enzyme TaqI (Fig. 3B), revealing a poly- morphism that was not visible in the undigested PCR prod- ucts (Fig. 3A). Besides the banding pattern seen for most varieties, such as entry numbers 23, 24 and 25, two other types of banding pattern appeared. For entries 9 and 15, the loss of restriction site resulted in the generation of a 380-bp band from the 200- and 180-bp bands. For entries 5, 33, 39, and 40, the same 200- and 180-bp bands were replaced by fragments of 75 bp and 305 bp, the latter al- most co-migrating with the slowest fragment.
With 11 sets of primers, digestion with restriction en- donucleases converted a monomorphic pattern to polymor- phism, or gave additional polymorphism as compared to the ALP (Table 2, last column). Out of nine sets of prim- ers that amplified monomorphic bands prior to digestion, seven showed polymorphism after digestion with up to nine restriction enzymes, increasing the total number of poly- morphic markers to 13 (87%). No polymorphism was de- tected with the primers RG100 and RG120 (Table 2). Sometimes when the PCR products were large (>1.5 kb), and the difference in generated fragment size was very small, differentiation among the ALPs was difficult, but after digestion of PCR products with 4-base cutters the polymorphism became clear and easily scoreable (Fig. 4).
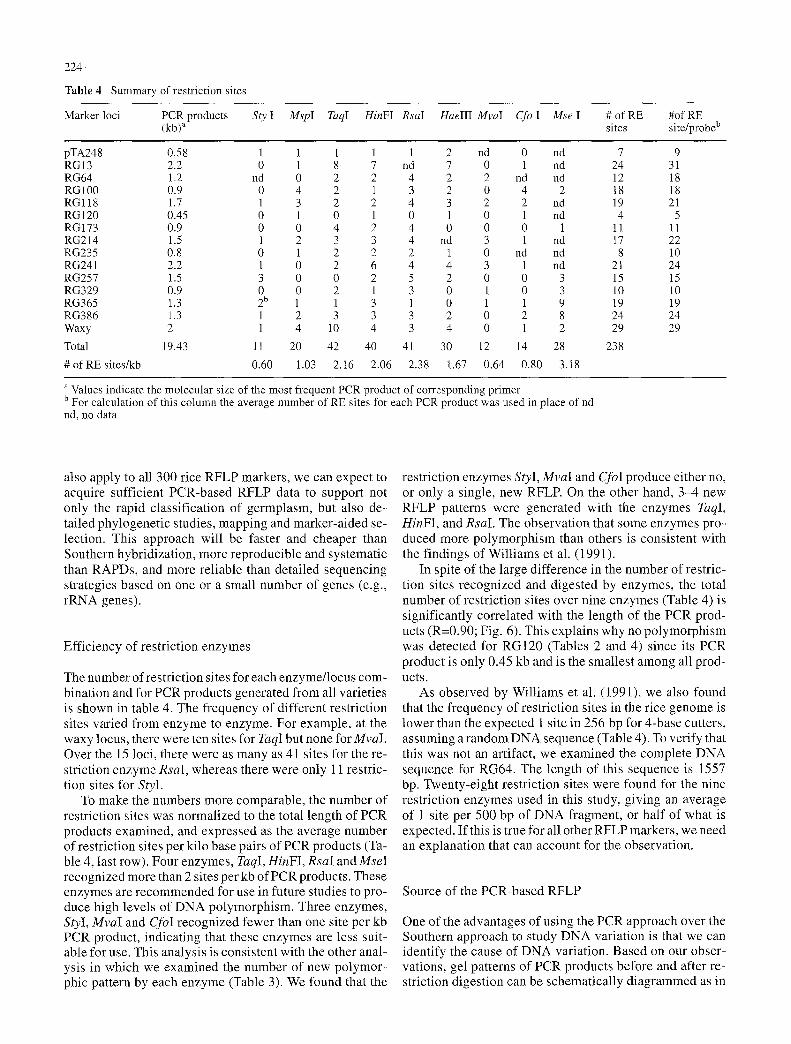
A total of six cases (1-6) is possible in digested PCR products and all were observed (data not shown); they are presented schematically in Fig. 5. Three possible cases ex- ist for monomorphic PCR products and three for polymor- phic ones. Only in cases 3 and 5 are new polymorphic pat- terns produced after digestion of PCR products with re- striction endonucleases. The occurrence of the six cases at 15 loci across 40 varieties is summarized in table 3. We have studied 118 enzyme/locus combinations and found five for case 3 and 12 for case 5 - overall, 14% additional polymorphism. We further noticed that the frequency of producing cases 3 and 5 differs from enzyme to enzyme. Enzymes TaqI, HinFI, and RsaI produce additional polymorpbism for 3-4 out of 15 loci whereas StyI and CfoI produce no additional polymorphism (Table 3, last row) .
222
Fig. 3 PCR products of the waxy locus before digestion (A) and af- ter digestion (B) with enzyme TaqI. The undigested products were separated in a 2% agarose gel and digested products were separated in a 8% polyacrylamide gel. The numbers for each lane are the en- try numbers used in Table 1
Fig. 4 Comparison between ALP (A) and PCR-based RFLP [(B) (digested PCR products with restriction enzyme HaeIII)] of 19 Ira- nian rice varieties at locus RG 13. The molecular weight of the bands is indicated in base pairs (bp). The number for each lane is the entry number used in Table 1
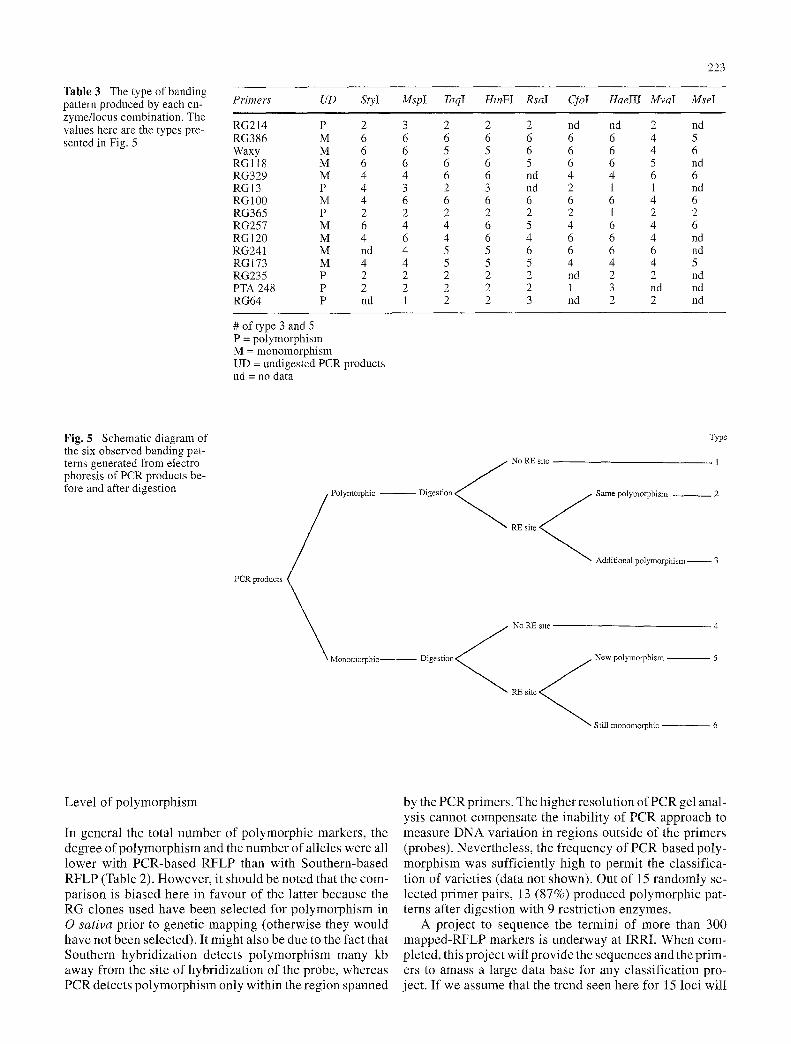
Table 3 The type of banding pattern produced by each en- zyme/locus combination. The values here are the types pre- sented in Fig. 5
Primers UD StyI MspI TaqI HinFI RsaI CfoI HaeIII MvaI MseI
RG214 P 2 3 2 2 2 nd nd 2 nd RG386 M 6 6 6 6 6 6 6 4 5 Waxy M 6 6 5 5 6 6 6 4 6 RGl l8 M 6 6 6 6 5 6 6 5 nd RG329 M 4 4 6 6 nd 4 4 6 6 RG13 P 4 3 2 3 nd 2 1 1 nd RG100 M 4 6 6 6 6 6 6 4 6 RG365 P 2 2 2 2 2 2 1 2 2 RG257 M 6 4 4 6 5 4 6 4 6 RG120 M 4 6 4 6 4 6 6 4 nd RG241 M nd 4 5 5 6 6 6 6 nd RG173 M 4 4 5 5 5 4 4 4 5 RG235 P 2 2 2 2 2 nd 2 2 nd PTA 248 P 2 2 2 2 2 1 3 nd nd RG64 P nd 1 2 2 3 nd 2 2 nd
# of type 3 and 5 P = polymorphism M = monomorphism UD = undigested PCR products nd = no data
223
Fig. 5 Schematic diagram of the six observed banding pat- terns generated from electro- phoresis of PCR products be- fore and after digestion Polymorphic
PCR products
Monomorphic
- - Digestion <
No RE site
Type
1
Same polymorphism 2
RE site
Additional polymorphism, 3
No RE site �9 4
Digestion < RE site < j New polymorphism - - 5
Still monomorphic - - 6
Level of p o l y m o r p h i s m
In genera l the total number of po lymorph ic markers , the degree o f p o l y m o r p h i s m and the number o f al le les were all lower with PCR-based R F L P than with Southern-based R F L P (Table 2). However , it should be noted that the com- par i son is b iased here in favour of the lat ter because the RG clones used have been se lec ted for p o l y m o r p h i s m in 0 sativa prior to genet ic mapp ing (o therwise they would have not been selected). It might also be due to the fact that Southern hybr id iza t ion detects p o l y m o r p h i s m many kb away from the site of hybr id iza t ion of the probe, whereas PCR detects p o l y m o r p h i s m only within the region spanned
by the PCR pr imers . The higher resolu t ion o f PCR gel anal- ysis cannot compensa te the inabi l i ty of PCR approach to measure D N A var ia t ion in regions outs ide of the pr imers (probes) . Never theless , the f requency o f PCR-based po ly - morph i sm was suff ic ient ly high to permi t the c lass i f ica- t ion of var ie t ies (data not shown). Out of 15 r andomly se- lec ted pr imer pairs, 13 (87%) p roduced po lymorph ic pat- terns after d iges t ion with 9 res t r ic t ion enzymes .
A project to sequence the termini of more than 300 m a p p e d - R F L P markers is underway at IRRI. When com- pleted, this project wil l p rov ide the sequences and the pr im- ers to amass a large data base for any c lass i f ica t ion pro- ject . I f we assume that the t rend seen here for 15 loci wil l
224
Table 4 Summary of restriction sites
Marker loci PCR products Sty I MspI TaqI HinFI RsaI HaeIII MvaI Cfo I Mse I # of RE #of RE (kb) a sites site/probe b
pTA248 0.58 1 1 1 1 1 2 nd 0 nd 7 9 RGI 3 2.2 0 1 8 7 nd 7 0 i nd 24 31 RG64 1.2 nd 0 2 2 4 2 2 nd nd 12 18 RG100 0.9 0 4 2 1 3 2 0 4 2 18 18 RGll8 1.7 1 3 2 2 4 3 2 2 nd 19 21 RG120 0.45 0 1 0 1 0 1 0 1 nd 4 5 RG173 0.9 0 0 4 2 4 0 0 0 1 11 11 RG214 1.5 1 2 3 3 4 nd 3 1 nd 17 22 RG235 0.8 0 1 2 2 2 1 0 nd nd 8 10 RG241 2.2 1 0 2 6 4 4 3 1 nd 21 24 RG257 1.5 3 0 0 2 5 2 0 0 3 15 15 RG329 0.9 0 0 2 1 3 0 1 0 3 10 10 RG365 1.3 2 b 1 1 3 1 0 1 1 9 19 19 RG386 1.3 1 2 3 3 3 2 0 2 8 24 24 Waxy 2 1 4 10 4 3 4 0 1 2 29 29
Total 19.43 11 20 42 40 41 30 12 14 28 238
# of RE sites/kb 0.60 1.03 2.16 2.06 2.38 1.67 0.64 0.80 3.18
a Values indicate the molecular size of the most frequent PCR product of corresponding primer b For calculation of this column the average number of RE sites for each PCR product was used in place of nd nd, no data
also apply to all 300 rice RFLP markers, we can expect to acquire sufficient PCR-based RFLP data to support not only the rapid classification of germplasm, but also de- tailed phylogenet ic studies, mapping and marker-aided se- lection. This approach will be faster and cheaper than Southern hybridization, more reproducible and systematic than RAPDs, and more reliable than detailed sequencing strategies based on one or a small number of genes (e.g., rRNA genes).
Efficiency of restriction enzymes
The number of restriction sites for each enzyme/ locus com- bination and for PCR products generated from all varieties is shown in table 4. The frequency of different restriction sites varied f rom enzyme to enzyme. For example, at the waxy locus, there were ten sites for TaqI but none forMvaI. Over the 15 loci, there were as many as 41 sites for the re- striction enzyme RsaI, whereas there were only 11 restric- tion sites for StyI.
To make the numbers more comparable, the number o f restriction sites was normalized to the total length of PCR products examined, and expressed as the average number of restriction sites per kilo base pairs of PCR products (Ta- ble 4, last row). Four enzymes, TaqI, HinFI, RsaI and MseI recognized more than 2 sites per kb of PCR products. These enzymes are recommended for use in future studies to pro- duce high levels of D N A polymorphism. Three enzymes, StyI, MvaI and CfoI recognized fewer than one site per kb PCR product, indicating that these enzymes are less suit- able for use. This analysis is consistent with the other anal- ysis in which we examined the number of new polymor- phic pattern by each enzyme (Table 3). We found that the
restriction enzymes StyI, MvaI and CfoI produce either no, or only a single, new RFLR On the other hand, 3 -4 new RFLP patterns were generated with the enzymes TaqI, HinFI, and RsaI. The observation that some enzymes pro- duced more po lymorphism than others is consistent with the findings of Williams et al. (1991).
In spite of the large difference in the number of restric- tion sites recognized and digested by enzymes, the total number of restriction sites over nine enzymes (Table 4) is significantly correlated with the length of the PCR prod- ucts (R=0.90; Fig. 6). This explains why no po lymorphism was detected for RG120 (Tables 2 and 4) since its PCR product is only 0.45 kb and is the smallest among all prod- ucts.
As observed by Williams et al. (1991), we also found that the frequency of restriction sites in the rice genome is lower than the expected 1 site in 256 bp for 4-base cutters, assuming a random D N A sequence (Table 4). To verify that this was not an artifact, we examined the complete D N A sequence for RG64. The length of this sequence is 1557 bp. Twenty-eight restriction sites were found for the nine restriction enzymes used in this study, giving an average of 1 site per 500 bp of D N A fragment, or half of what is expected. If this is true for all other RFLP markers, we need an explanation that can account for the observation.
Source of the PCR-based RFLP
One of the advantages of using the PCR approach over the Southern approach to study D N A variation is that we can identify the cause of D N A variation. Based on our obser- vations, gel patterns of PCR products before and after re- striction digestion can be schematically d iagrammed as in
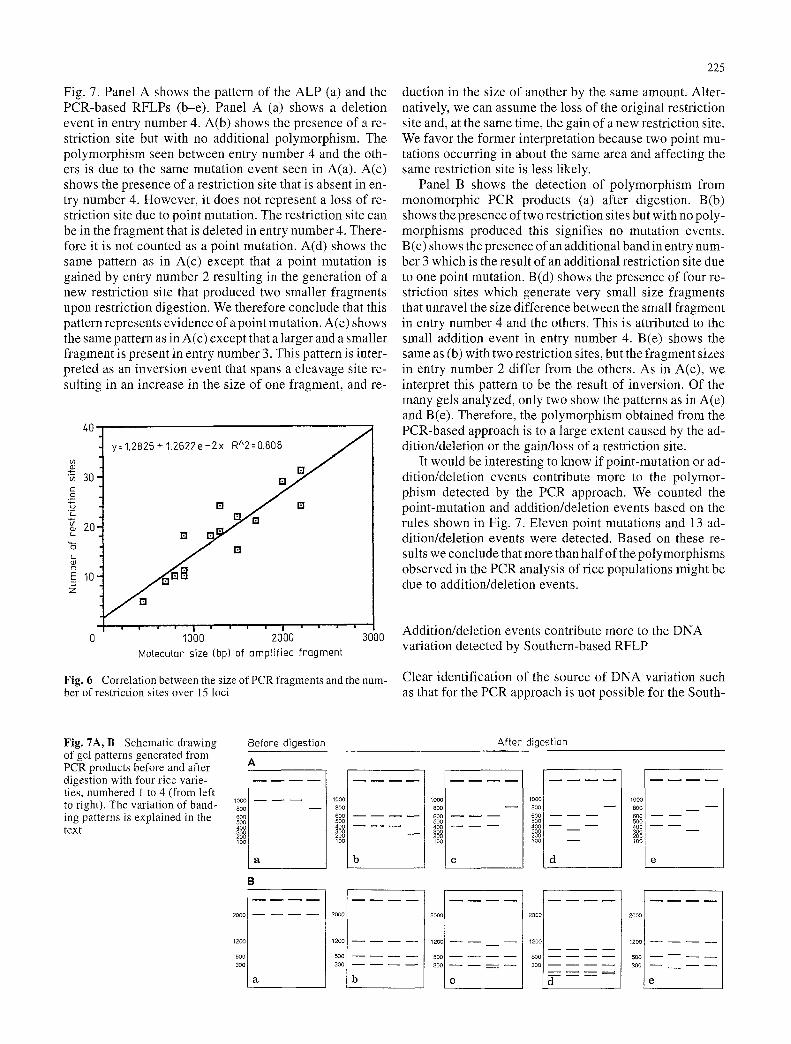
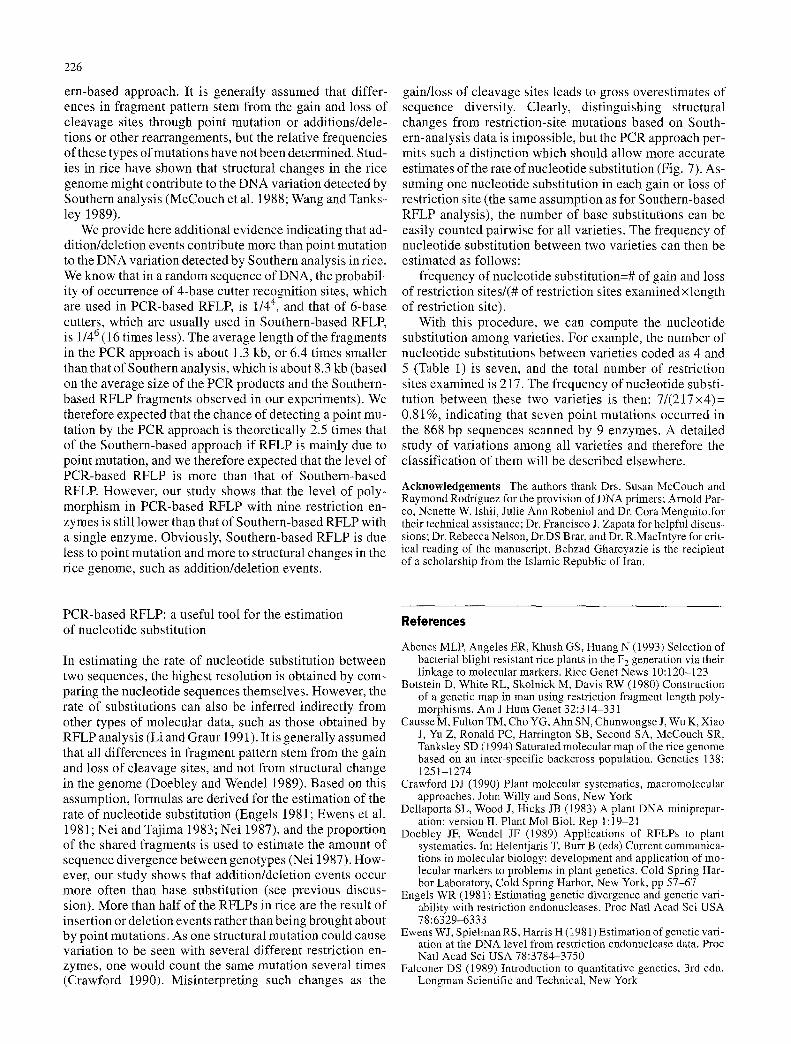
Fig. 7. Panel A shows the pattern of the ALP (a) and the PCR-based RFLPs (b-e). Panel A (a) shows a deletion event in entry number 4. A(b) shows the presence of a re- striction site but with no additional polymorphism. The polymorphism seen between entry number 4 and the oth- ers is due to the same mutation event seen in A(a). A(c) shows the presence of a restriction site that is absent in en- try number 4. However, it does not represent a loss of re- striction site due to point mutation. The restriction site can be in the fragment that is deleted in entry number 4. There- fore it is not counted as a point mutation. A(d) shows the same pattern as in A(c) except that a point mutation is gained by entry number 2 resulting in the generation of a new restriction site that produced two smaller fragments upon restriction digestion. We therefore conclude that this pattern represents evidence of a point mutation. A(e) shows the same pattern as in A(c) except that a larger and a smaller fragment is present in entry number 3. This pattern is inter- preted as an inversion event that spans a cleavage site re- sulting in an increase in the size of one fragment, and re-
40
�9 m 30' o =
u "E
20,
"+6
e 10 Z
y=1.2826 + 1.2622e-2x RA2=0.808 EI~
[] / m
= = i | I m �9 i �9 I i i i .
1000 2000 3000 Motecutar size (bp) of amptified fragment
Fig. 6 Correlation between the size of PCR fragments and the num- ber of restriction sites over 15 loci
225
duction in the size of another by the same amount. Alter- natively, we can assume the loss of the original restriction site and, at the same time, the gain of a new restriction site. We favor the former interpretation because two point mu- tations occurring in about the same area and affecting the same restriction site is less likely.
Panel B shows the detection of polymorphism from monomorphic PCR products (a) after digestion. B(b) shows the presence of two restriction sites but with no poly- morphisms produced this signifies no mutation events. B(c) shows the presence of an additional band in entry num- ber 3 which is the result of an additional restriction site due to one point mutation. B(d) shows the presence of four re- striction sites which generate very small size fragments that unravel the size difference between the small fragment in entry number 4 and the others. This is attributed to the small addition event in entry number 4. B(e) shows the same as (b) with two restriction sites, but the fragment sizes in entry number 2 differ from the others. As in A(e), we interpret this pattern to be the result of inversion. Of the many gels analyzed, only two show the patterns as in A(e) and B(e). Therefore, the polymorphism obtained from the PCR-based approach is to a large extent caused by the ad- dition/deletion or the gain/loss of a restriction site.
It would be interesting to know if point-mutation or ad- dition/deletion events contribute more to the polymor- phism detected by the PCR approach. We counted the point-mutation and addition/deletion events based on the rules shown in Fig. 7. Eleven point mutations and 13 ad- dition/deletion events were detected. Based on these re- sults we conclude that more than half of the polymorphisms observed in the PCR analysis of rice populations might be due to addition/deletion events.
Addition/deletion events contribute more to the D N A variation detected by Southern-based RFLP
Clear identification of the source of D N A variation such as that for the PCR approach is not possible for the South-
Fig. 7A, B Schematic drawing of gel patterns generated from PCR products before and after digestion with four rice varie- ties, numbered 1 to 4 (from left to right). The variation of band- ing patterns is explained in the text
Before digestion
1000 800
6O0 500
lO0
a
1000 800 600 500
100
b
After digestion
10oo
800 600 500
100
lOOO - - 800
600 500
100
d
1 0 0 0
800 600 500 400 - - - -
e
2000
I200
500 300
2O00
1200
500
300
a ,
2 0 0 (
120c
50( 30(
b 1 3
2000
1200
5O0 3 O O
'd
2OOO
I200
500 - - - - - - - -
300 - - - - - -
e
226
ern-based approach. It is generally assumed that differ- ences in fragment pattern stem from the gain and loss of cleavage sites through point mutation or additions/dele- tions or other rearrangements, but the relative frequencies of these types of mutations have not been determined. Stud- ies in rice have shown that structural changes in the rice genome might contribute to the DNA variation detected by Southern analysis (McCouch et al. 1988; Wang and Tanks- ley 1989).
We provide here additional evidence indicating that ad- dition/deletion events contribute more than point mutation to the DNA variation detected by Southern analysis in rice. We know that in a random sequence of DNA, the probabil- ity of occurrence of 4-base cutter recognition sites, which are used in PCR-based RFLP, is 1/44, and that of 6-base cutters, which are usually used in Southern-based RFLP, is 1/46 (16 times less). The average length of the fragments in the PCR approach is about 1.3 kb, or 6.4 times smaller than that of Southern analysis, which is about 8.3 kb (based on the average size of the PCR products and the Southern- based RFLP fragments observed in our experiments). We therefore expected that the chance of detecting a point mu- tation by the PCR approach is theoretically 2.5 times that of the Southern-based approach if RFLP is mainly due to point mutation, and we therefore expected that the level of PCR-based RFLP is more than that of Southern-based RFLR However, our study shows that the level of poly- morphism in PCR-based RFLP with nine restriction en- zymes is still lower than that of Southern-based RFLP with a single enzyme. Obviously, Southern-based RFLP is due less to point mutation and more to structural changes in the rice genome, such as addition/deletion events.
gain/loss of cleavage sites leads to gross overestimates of sequence diversity. Clearly, distinguishing structural changes from restriction-site mutations based on South- ern-analysis data is impossible, but the PCR approach per- mits such a distinction which should allow more accurate estimates of the rate of nucleotide substitution (Fig. 7). As- suming one nucleotide substitution in each gain or loss of restriction site (the same assumption as for Southern-based RFLP analysis), the number of base substitutions can be easily counted pairwise for all varieties. The frequency of nucleotide substitution between two varieties can then be estimated as follows:
frequency of nucleotide substitution=# of gain and loss of restriction sites/(# of restriction sites examined • of restriction site).
With this procedure, we can compute the nucleotide substitution among varieties. For example, the number of nucleotide substitutions between varieties coded as 4 and 5 (Table 1) is seven, and the total number of restriction sites examined is 217. The frequency of nucleotide substi- tution between these two varieties is then: 7 / (217x4)= 0.81%, indicating that seven point mutations occurred in the 868 bp sequences scanned by 9 enzymes. A detailed study of variations among all varieties and therefore the classification of them will be described elsewhere.
Acknowledgements The authors thank Drs. Susan McCouch and Raymond Rodriguez for the provision of DNA primers; Arnold Par- co, Nenette W. Ishii, Julie Ann Robeniol and Dr. Cora Menguito.for their technical assistance; Dr. Francisco J. Zapata for helpful discus- sions; Dr. Rebecca Nelson, Dr.DS Brar, and Dr. R.MacIntyre for crit- ical reading of the manuscript. Behzad Ghareyazie is the recipient of a scholarship from the Islamic Republic of Iran.
PCR-based RFLP: a useful tool for the estimation of nucleotide substitution
In estimating the rate of nucleotide substitution between two sequences, the highest resolution is obtained by com- paring the nucleotide sequences themselves. However, the rate of substitutions can also be inferred indirectly from other types of molecular data, such as those obtained by RFLP analysis (Li and Graur 1991). It is generally assumed that all differences in fragment pattern stem from the gain and loss of cleavage sites, and not from structural change in the genome (Doebley and Wendel 1989). Based on this assumption, formulas are derived for the estimation of the rate of nucleotide substitution (Engels 1981; Ewens et al. 1981; Nei and Tajima 1983; Nei 1987), and the proportion of the shared fragments is used to estimate the amount of sequence divergence between genotypes (Nei 1987). How- ever, our study shows that addition/deletion events occur more often than base substitution (see previous discus- sion). More than half of the RFLPs in rice are the result of insertion or deletion events rather than being brought about by point mutations. As one structural mutation could cause variation to be seen with several different restriction en- zymes, one would count the same mutation several times (Crawford 1990). Misinterpreting such changes as the
References
Abenes MLR Angeles ER, Khush GS, Huang N (1993) Selection of bacterial blight resistant rice plants in th e F 2 generation via their linkage to molecular markers. Rice Genet News 10:120-123
Botstein D, White RL, Skolnick M, Davis RW (1980) Construction of a genetic map in man using restriction fragment length poly- morphisms. Am J Hum Genet 32:314-331
Causse M, Fulton TM, Cho YG, Ahn SN, Chunwongse J, Wu K, Xiao J, Yn Z, Ronald PC, Harrington SB, Second SA, McCouch SR, Tanksley S D (t 994) S aturated molecular map of the rice genome based on an inter-specific backcross population. Genetics 138: 1251-1274
Crawford DJ (1990) Plant molecular systematics, macromolecular approaches. John Willy and Sons, New York
Dellaporta SL, Wood J, Hicks JB (1983) A plant DNA miniprepar- ation: version II. Plant Mol Biol. Rep 1:19-21
Doebley JF, Wendel JF (1989) Applications of RFLPs to plant systematics. In: Helentjaris T, Burr B (eds) Current communica- tions in molecular biology: development and application of mo- lecular markers to problems in plant genetics. Cold Spring Har- bor Laboratory, Cold Spring Harbor, New York, pp 57-67
Engels WR (1981) Estimating genetic divergence and genetic vari- ability with restriction endonucleases. Proc Natl Acad Sci USA 78:6329-6333
Ewens WJ, Spielman RS, Harris H (1981) Estimation of genetic vari- ation at the DNA level from restriction endonuclease data. Proc Natl Acad Sci USA 78:3784-3750
Falconer DS (1989) Introduction to quantitative genetics, 3rd edn. Longman Scientific and Technical, New York
Feinberg AR Vogelstein B (1983) A technique for radiolabeling DNA restriction endonuclease fragments to high specific activ- ity: addendum. Anal Biochem 132:6-13
Glaszmann JC (1987) Isozymes and Asian rice varieties.Theor Appl Genet 74:21-30
Hittalmani S, Foolad M, Mew T, Rodriguez R, Huang N (1994) Ac- curate identification of blast resistance gene, Pi-2(t) in rice plants by flanking DNA markers. Rice Genet News (in press)
Ishii T, Brar DS, Multani DS, Khush GS (1994) Molecular tagging of genes for brown planthopper resistance and earliness intro- gressed from Oryza australiensis into cultivated rice, O. sativa. Genome 37:217-221
Li WH, Graur D (1991) Fundamentals of molecular evolution. Si- nauer Associates, Inc. publishers, Sunderland, Massachusetts
McCouch S, Kochert G, Yu ZH,.Wang ZY, Khush GS, Coffman WR, Tanksley SD (1988) Molecular mapping of rice chromosomes. Theor Appl Genet 76:815-829
Mullis KB, Faloona F (1987) Specific synthesis of DNA in vitro via a polymerase chain reaction. Methods Enzymol 155:335- 350
Nagamura Y, Yamamoto K, Harushima Y, Wu J, Antonio BA, Sue N, Shomura A, Lin SY, Miyamoto Y, Toyama T, Kirihara T, Shi- mizu T, Wang ZX, Tamura Y, Ashikawa I, Yano M, Kurata N (1993). A high-density STS and EST linkage map of rice. Rice Genome 2:3
Nei M (1987) Molecular evolutionary genetics. Columbia Univer- sity Press, New York
Nei M, Tajima F (1983) Maximum-likelihood estimation of the num- ber of nucleotide substitutions from restriction-site data. Genet- ics 105:207
Ronald PC, Albano B, Tabien R, Abenes L, Wu KS, McCouch S, Tanksley SD (1992) Genetic and physical analysis of rice bacte- rial blight disease resistance locus, Xa21. Mol Gen Genet 236:113-120
Saiki RK, Scarf S, Faloona F, Mullis KB, Horn GT, Elrich HA, Arn- heim N (1985) Enzymatic amplification of beta globin genomic sequences and restriction-site analysis for diagnosis of sickle-cell anemia. Science 230:1350-1354
227
Saito A, Yano M, Kishimoto N, Nakagahra M, Yoshimura A, Saito K, Kuhara S, Ukai Y, Kawase M, Nagamine T, Yushimura S, Ide- ta O, Ohsawa R, Hayano Y, Iwata N, Sugiura M (1991) Linkage map of restriction fragment length polymorphism loci in rice. Ja- pan J Breed. 41:665-670
Sambrook J, Fritsch EF, Maniatis T (1989) Molecular cloning: a la- boratory manual, 2nd edn. Cold Spring Harbor Laboratory, Cold Spring Harbor, New York
Second G (1982) Origin of the genetic diversity of cultivated rice (Oryza spp.): study of the polymorphism scored at 40 isozyme loci. Jpn J Genet 57:25-57
Second G (1991) Molecular markers in rice systematics and the eval- uation of genetic resources. In: Bajaj YPS (ed) Biotechnology in agriculture and forestry. Vo114, rice. Springer Verlag, Berlin Hei- delberg, pp 468-494
Smith JSC, Smith OS (1990) Fingerprinting crop varieties. Adv Ag- ron 47:85-140
Tragoonrung S, Kanazin V, Hayes PM, Blake TK (1992) Sequence- tagged-site-facilitated PCR for barley genome mapping. Theor Appl Genet 84:1002-1008
Wang ZY, Tanksley SD (1989) Restriction fragment length polymor- phism in Oryza sativa L. Genome 32:1113-1118
Williams JGK, Anne R Kubelik, Kennet J Livak, Antoni Rafalski J, Scott V Tingey (1990) DNA polymorphisms amplified by arbi- trary primers are useful as genetic markers. Nucleic Acids Res 18:5631-6535
Williams, MNV, Pande N, Nair S, Mohan M, Bennett J (1991) Re- striction fragment length polymorphism analysis of polymerase chain reaction products amplified from mapped loci of rice (Ory- za sativa L.) genomic DNA. Theor Appl Genet 82:489-498
Yoshimura S, Yoshimura A, Saito A, Kishimoto N, Kawase N, Yano M, Nakagahra M, Ogawa M, Iwata M (1992) RFLP analysis of introgressed chromosomal segments in three near-isogenic lines of rice for bacterial blight resistance genes, Xa-1, Xa-3 and Xa-4. Jpn. J. Genet. 67:29-37
Yu ZH, Mackill D J, Bonmann JM, Tanksley SD (1991) Tagging genes for blast resistance in rice via linkage to RFLP markers. Theor Appl Genet 81:471-476