Scaling the bandwidth wall: challenges in and avenues for CMP scaling
This is a PREPRINT of an article published on line in the Journal of Abnormal Psychology © 2010 American Psychological Association
Fergusson DM, Boden JM, Horwood LJ. Classification of behavior disorders in adolescence: Scaling methods, predictive validity and gender differences. Journal of Abnormal Psychology
Published on line 20 September 2010, doi:10.1037/a0018610
Classification of behavior disorders in adolescence: scaling
methods, predictive validity, and gender differences
David M. Fergusson
Joseph M. Boden
L. John Horwood
Christchurch Health and Development Study
University of Otago, Christchurch School of Medicine and Health Sciences
Christchurch, New Zealand
Corresponding author: Prof. David M. Fergusson, Christchurch Health and Development Study,
Christchurch School of Medicine and Health Sciences, PO Box 4345, Christchurch, New Zealand
Phone: +643 372 0406 Fax: +643 372 0407 Email: [email protected]
2
Abstract
The present study examined issues relating to the measurement and discriminant validity of DSM
diagnostic criteria for behavior disorders in adolescence (conduct disorder; oppositional/defiant
disorder; attention deficit/hyperactivity disorder). Data were obtained from a birth cohort of 995
New Zealand-born individuals studied to the age of 25, and modelled associations between behavior
disorder from ages 14 to 16 (CD; ODD; ADHD) later outcomes including crime, substance use,
mental health, parenthood/partnership outcomes, and education/employment outcomes to age 25.
The associations between behavior disorders and outcomes were adjusted for both comorbid
behavior disorders and a range of confounding factors. The results suggested that: i) dimensional
measures of behavior disorder were more strongly correlated with outcomes than categorical (DSM)
measures; ii) CD, ODD and ADHD each had a distinctive pattern of associations with longer-term
consequences; and iii) there was no evidence to suggest that the developmental consequences of
CD, ADHD and ODD differed by gender. In general, the results supported the validity of DSM
diagnostic domains, but also highlighted the importance of DSM-V including methods for both
recognising the severity of disorder and addressing subclinical symptom levels.

3
This paper is one of a series of papers examining the proposed DSM-V classification of
disruptive behavior disorders. This classification proposes that disruptive behaviors in childhood
and adolescence can be classified into the following diagnostic categories: 1) Conduct Disorder; 2)
Oppositional Defiant Disorder; and 3) Attention Deficit Hyperactivity Disorder (Castellanos, 2008;
Moffitt et al., 2008).
While these classifications are founded on substantial bodies of research evidence and
clinical experience a number of questions require further analysis (Moffitt et al., 2008). In this paper
we address three fundamental questions relating to the Conduct Disorder (CD), Oppositional
Defiant Disorder (ODD) and Attention Deficit Hyperactivity Disorder (ADHD) classifications in
adolescence. These questions are as follows.
1. Scales or Categories
A tension that follows the DSM classification of disruptive behaviors concerns the extent to
which these classifications identify: a) qualitatively distinct groups of children with a clearly
defined disorder; or b) extremes of underlying dimensional variables. It is clear that the weight of
the evidence now favours the view that DSM classifications of disruptive behaviors are more likely
to represent the extremes of underlying dimensions than discrete diagnostic categories (Fergusson
& Horwood, 1995b; Helzer, Bucholz, & Gossop, 2007; Hudziak, Achenbach, Althoff, & Pine,
2007; Krueger & Bezdjian, 2009; Krueger, Markon, Patrick, & Iacono, 2005). The area in which
the differences between categorical descriptions and dimensional models of disruptive behavior are
likely to be most marked is in the area of predictive validity. More specifically, simulations have
shown that dichotomising an underlying continuous distribution may lead to substantial loss of
predictive validity with this loss being particularly marked when the classification involves the
extremes of the distribution (Altman & Royston, 2006; MacCallum, Zhang, Preacher, & Rucker,
2002). Therefore, the first issue addressed in this study concerns the extent which the predictive

4
validity of measures of CD, ODD and ADHD varies between continuous and categorical
representations of symptoms of these disorders.
2. Patterns of associations between behavior disorders and outcomes
A second issue concerns the extent to which symptoms of CD, ODD and ADHD predict
future developmental outcomes, including: crime; mental health disorders; substance use;
relationship and parenthood difficulties; and educational achievement and related outcomes, when
due allowance is made for the comorbidity of these disorders and potentially confounding factors
that may be associated with the disorder and later outcomes (Moffitt et al., 2008). Of particular
interest is the extent to which each disorder has a distinctive pattern of associations with later
outcomes; evidence of a distinctive profile of associations for each disorder would provide support
for the validity of DSM diagnostic domains.
While there is a substantial body of evidence on the linkages between disruptive behavior in
childhood and later outcomes (Boylan, Vaillancourt, Boyle, & Szatmari, 2007; Burke, Loeber, &
Birmaher, 2002; Flory & Lynam, 2003; Keenan, Loeber, & Green, 1999; Moffitt & Scott, in press;
Robins, 1991; Zoccolillo, 1992), to our knowledge no study has compared the long terms outcomes
of CD, ODD and ADHD in terms of a wide range of outcomes. In the present study we attempt that
task by examining the relationship between symptoms of CD, ODD and ADHD assessed at the ages
of 14-16 years and developmental outcomes in a New Zealand birth cohort studied to the age of 25.
Underlying this investigation is an interest in determining the future risk profile of each disorder.
While there has been substantial research which has examined developmental differences in the
outcomes of CD and ADHD (Broidy et al., 2003; Disney, Elkins, McGue, & Iacono, 1999;
Fergusson & Horwood, 1995a; Fergusson, Horwood, & Lynskey, 1993a; Fergusson, Horwood, &
Ridder, 2007; Fergusson, Lynskey, & Horwood, 1993; Flory, Milich, Lynam, Leukefeld, &
Clayton, 2003; Gunter, Arndt, Riggins-Caspers, Wenman, & Cadoret, 2006; Lynskey & Fergusson,
1995; Molina & Pelham, 2003), less has been known about the differences between ODD and CD
5
or ADHD (Biederman, Petty, Dolan et al., 2008; Biederman, Petty, Monuteaux et al., 2008;
Copeland, Shanahan, Costello, & Angold, 2009; Stringaris & Goodman, 2009a, , 2009b). The
present study aims to explore this issue.
3. Gender Differences
It has been well-documented that CD, ADHD and ODD are far more common in males than
females (Boylan et al., 2007; Eme, 2007; Hudziak et al., 2007; Moffitt, Caspi, Rutter, & Silva,
2001; Stefanatos & Baron, 2007; Zoccolillo, 1992). This observation has led to debates about the
extent to which gender-specific measures and thresholds should be set in the definition of these
disorders (Moffitt et al., 2001; Rutter et al., 2004; Zahn-Waxler, 1993; Zoccolillo, 1993). One way
of approaching this issue is to examine whether the relationships between CD, ADHD, ODD, and
later outcomes vary with gender. Evidence suggesting different relationships for males and females
would support the need for gender-specific criteria, whereas findings of gender similarities in these
relationships would be consistent with the view that, for prognostic purposes, a common set of
criteria may be used to measure males and females.
Overview
To address each of these questions we used data gathered as part of the Christchurch Health
and Development Study (CHDS), a longitudinal study of a birth cohort of 1265 New Zealand born
children who have been studied from birth to the age of 25. This paper uses the data to examine the
relationships between diagnostic criteria at ages 14 to 16 and outcomes up to the age of 25, with
these analyses focussing on the three questions relating to predictive validity outlined above. First,
we contrast the predictive validity of dimensional models that rank cohort members by the extent of
disorder with corresponding diagnostic models based on DSM criteria to examine the differences in
the predictive validity of dimensional and categorical representations of DSM diagnoses. Second,
we examine whether different disorders (CD, ODD, and ADHD) in adolescence have different

6
developmental consequences for outcomes assessed from adolescence into adulthood. Finally, we
fit nested models to test whether the predictive validity of adolescent DSM criteria varies with
gender.
Method
Data were gathered during the course of the Christchurch Health and Development Study, a
longitudinal study of an unselected birth cohort of 1,265 children born in the Christchurch (New
Zealand) urban region during a 4-month period in mid-1977. This cohort has been studied at birth, 4
months, 1 year, annual intervals to age 16 years, and at ages 18, 21, and 25 years. A more detailed
description of the study and an overview of study findings have been provided by Fergusson and
Horwood (2001). The present analyses were based on the 995 participants for whom information
was available regarding behavioral disorders during the period 14-16 years and adult outcomes at
ages 21 and 25 years (78.7% of the original sample).
Disruptive Childhood Behaviors 14-16 Years
Information concerning disruptive childhood behavior was obtained at two assessments
taking place when the sample members were aged 15 and 16 years. At each age, sample members
were interviewed on a comprehensive mental health interview that examined aspects of mental
health and adjustment over the previous 12 months. A parallel interview was also conducted with
the child’s mother at each assessment stage. The two interviews were conducted at different sites
(mothers were interviewed at home and children at school) and by different interviewers. All
information obtained was subject to the signed consent of study participants.
As part of the assessments at each age information was obtained on DSM-III-R (American
Psychiatric Association, 1987) symptom criteria for disruptive childhood behaviors, including
conduct disorder (CD), oppositional defiant disorder (ODD), and attention deficit hyperactivity
disorder (ADHD) (Fergusson, Horwood, & Lynskey, 1993b). For child self-report, the assessment
7
of ODD and ADHD was based on the relevant sections of the Diagnostic Interview Schedule for
Children (DISC) (Costello, Edelbrock, Kalas, Kessler, & Klaric, 1982), whereas CD was assessed
using the Self-Report Early Delinquency (SRED) scale (Moffitt & Silva, 1988). For parental reports
ODD and ADHD were assessed using items from the Revised Behavior Problems Checklist
(RBPC) (Quay & Peterson, 1987), and CD was assessed using a parent version of the SRED. The
combined symptom data thus comprised information on DSM-III-R symptom criteria for two
separate 12 month periods (ages 14-15 and 15-16 years) from two sources (parent, self-report).
The ways in which this information was used to derive DSM-III-R symptom criteria and
disorder classifications has been described in detail in a previous paper (Fergusson, Horwood et al.,
1993b). However, for the purposes of the present analysis it was desirable to have disorder
classifications that mirrored the DSM-IV as closely as possible. Since data were not available on all
DSM-IV (American Psychiatric Association, 1994) symptom criteria it was necessary to develop
operational definitions of disorder as follows:
For CD, maternal report data were available for all but one of the 15 DSM-IV criteria
(forced sexual activity), and for self-report data were available all but two of the criteria (often
bullies, threatens, intimidates; forced sexual activity). The diagnostic criterion of the presence of
three or more symptoms in a given 12 month period was applied for both maternal and self-reports.
Two-thirds of those classified as meeting criteria for CD on the basis of maternal or self-report
showed an onset of symptoms before age 10, as assessed using prospectively-collected maternal and
teacher reports of conduct problems in middle childhood.
For ODD, data were available for all eight symptom criteria for self report and all but one of
the eight criteria for maternal report (often angry and resentful). The diagnostic criterion of the
presence of four or more symptoms in a given 12 month period was applied for both maternal and
self-report. However, in order to avoid creating arbitrary dependencies between CD and ODD in the
analysis, the usual exclusion criteria between CD and ODD were ignored. That is, participants
could be classified as having both CD and ODD.

8
For ADHD, of the DSM-IV symptom criteria for inattention, self report data were available
for six symptoms and maternal report data for five of the nine symptom criteria. Data were not
available for both parent and self-report on inattention criteria (a), (e) and (i), and for parent report
only on criterion (g). For hyperactivity-impulsivity self report data were available for eight
symptoms and maternal report for six of the nine symptom criteria. The missing hyperactivity-
impulsivity criteria included symptoms (c), (d) and (f) for parent report and symptom (e) for self-
report. To deal with the reduced item set the cut-point for a disorder classification in a given 12
month period was reduced to five or more symptoms of inattention for both maternal and self
reports; whereas the criterion of six or more symptoms of hyperactivity/impulsivity was retained.
In terms of the additional classification criterion that evidence of ADHD be present during
childhood, examination of the data showed that all of the participants classified as meeting criteria
for ADHD during the period 14-16 years had displayed at least some ADHD symptomatology by
age 7 on the basis of prospective maternal or teacher report.
The observed symptom reports and the modified diagnostic criteria above were used to
derive two measures reflecting the extent of disordered behavior in each domain (CD, ODD,
ADHD) over the two year period from age 14-16 years.
1. The first measure, used for the purposes of data display, classified participants into one of three
groups, reflecting the extent to which the individual met diagnostic criteria for each disorder on
the basis of either maternal or self report at either the age 15 or the age 16 interview. Each
cohort member therefore had four opportunities for behavior disorder classification (maternal
report age 15; self-report age 15; maternal report age 16; self-report age 16). These groups were:
(i) no symptoms, the participant was never reported by either mother or child as having any
symptoms of the disorder; (ii) sub-clinical, the participant was reported by either mother or
child as meeting criteria for at least one symptom of disorder but never met full diagnostic
criteria; (iii) clinical, the participant met diagnostic criteria for disorder on the basis of either
self or maternal report or both. Combining parental and self report measures of disorder in this
9
manner was done on the basis of previous research in the cohort that examined a range of
alternatives for combining multiple informant data, including optimal informant and latent class
approaches (Fergusson, Horwood et al., 1993b). This analysis showed that all approaches led to
similar rates of classification of disorder.
For the purposes of comparison with the continuous scale score (below), each of the the
three-level measures was dichotomized, classifiying participants into clinical/non-clinical
categories for CD, ODD, and ADHD.
2. The second measure, used for the main data analyses, was a continuous scale measure reflecting
the number of symptom criteria reported for each disorder. This measure was based on a count
of the number of symptoms of disorder reported by either the mother or child over the two year
period. In calculating this measure a symptom was recorded as present if it was reported by
either source (mother or child) in either of the interview periods (14-15, 15-16 years). The
correlations between each measure were as follows: r (CD-ODD) = .62; r (CD-ADHD) = .53; r
(ODD-ADHD) = .73.
Outcome measures
Crime.
Number of self-reported property/violent offenses, ages 18-25. At ages 21 and 25, cohort
members were questioned questioned about their criminal behaviors since the previous assessment
using an instrument based on the Self-Report Delinquency Inventory (SRDI: Elliott & Huizinga,
1989) supplemented by additional custom-written survey items. This information was used to
derive count measures of the number of self-reported property/violent offenses committed in each
year over the period from age 18 to age 25 years. Property offenses were defined to include theft,
burglary, breaking and entering, vandalism, fire setting, and related offenses; violent offenses
included assault, fighting, use of a weapon, or threats of violence against a person. For each
category of offense, the total number of self-reported offenses were summed over the period to
10
derive a measure of the total number of property and violent offenses committed during the period
18-25 years.
Number of times arrested, ages 18 to 25. At ages 21 and 25, cohort members were
questioned about any contacts they may have had with the police and courts during each year
following the previous assessment. In particular, they were asked whether or not they had been
arrested for any reason during each year, and, if so, they were asked to provide details of the
circumstances leading to the arrest and the consequences of the arrest. For the purposes of the
present investigation, the responses to these measures were summed to derive a measure of the total
number of self-reported arrests during the period 18 to 25 years.
Substance use.
Nicotine dependence symptoms, ages 18-25. At ages 21 and 25, participants were
questioned as to the frequency with which they had smoked cigarettes during the month prior to the
assessment. Those who reported smoking were further questioned using custom written survey
items to assess DSM-IV (American Psychiatric Association, 1994) symptom criteria for nicotine
dependence. For the purposes of the present analyses, the symptom reports at ages 21 and 25 were
combined to create a measure of the total number of symptoms of nicotine dependence reported at
age 21 or 25 years, where each symptom was counted as present if it was reported at either age.
Alcohol abuse/dependence symptoms, ages 18-25. At ages 21 and 25 years, study
participants were interviewed on a structured mental health interview designed to assess aspects of
mental health and psychosocial adjustment since the previous assessment. As part of the mental
health assessment at each age, components of the Composite International Diagnostic Interview
(CIDI)(World Health Organization, 1993) were used to assess DSM-IV symptom criteria for
alcohol abuse/dependence. Participants were questioned about alcohol abuse/dependence
symptoms occurring in the past 12 months, and during each 12 month period following the previous
assessment. For the purposes of the present analysis, the symptom reports were combined to create

11
a count measure of the total number of symptoms of alcohol abuse/dependence reported at any time
during the period 18 to 25 years. In calculating this score, symptom reports were first pooled over
assessment periods to record a symptom as present if it was reported at least once during the period
18 to 25 years.
Illicit drug abuse/dependence symptoms, ages 18-25. At ages 21 and 25, cohort members
were questioned as to their use of a range of illicit drugs, including cannabis. In addition, those
who reported using illicit drugs were further questioned regarding symptoms of abuse/dependence
on illicit drug using items of the CIDI relevant to DSM-IV symptom criteria for abuse
of/dependence upon cannabis and other illicit drugs. For the purposes of the present analysis, the
symptom reports were combined to create a count measure of the total number of symptoms of
illicit drug abuse/dependence that were reported at any time during the period 18 to 25 years, where
each symptom was recorded as present or absent on the basis of the pooled reports across the two
assessment periods.
Mental health disorders.
Major depression/anxiety disorder, ages 18-25. At ages 21 and 25, participants were
questioned regarding symptoms of major depression and a range of anxiety disorders (including
generalized anxiety disorder, panic disorder, agoraphobia, social phobia, and specific phobia) using
CIDI items and DSM-IV diagnostic criteria. For the purposes of the present analysis sample
members who met DSM diagnostic criteria for a major depressive episode or one or more anxiety
disorders at any time during either assessment period (18-21 years; 21-25 years) were classified as
having major depression/anxiety disorder during the period 18-25 years.
Anti-social personality disorder (ages 18-25). At ages 21 and 25, anti-social personality
disorder was assessed using custom-written survey items reflecting the DSM-IV criteria for anti-
social personality disorder. These items were considered to have face validity due to their
derivation from DSM-IV behavioral descriptors. Sample members who met diagnostic criteria for

12
anti-social personality disorder during an assessment period (18-21 years; 21-25 years) were
classified as having the disorder during the period 18-25 years.
Number of suicide attempts, ages 18-25 years. Suicidal behavior during the periods 18-21
years and 21-25 years was assessed via self-report by asking sample members whether they had
ever thought about killing themselves or had attempted suicide during the assessment period, and
the frequency of such thoughts or attempts. For the purposes of the present analyses, the number of
suicide attempts reported by participants during each assessment period were summed over the
assessment periods to derive a measure of the total number of suicide attempts during the period 18
to 25 years.
Pregnancy/parenthood/partnership outcomes.
Pregnancy/parenthood by age 20. At ages 16, 18, and 21, participants were questioned
about their history of pregnancy and parenthood. Female cohort members were questioned as to
whether they had ever become pregnant, and the age(s) that this had occurred; while male cohort
members were questioned as to whether they had ever gotten a partner pregnant, and the age(s) that
this had occurred. In addition, all cohort members were asked whether they had ever become a
natural parent, and the age(s) that this had occurred. Those cohort members who indicated that they
had gotten pregnant/gotten a partner pregnant prior to age 21 were classified using a dichotomous
measure as having a pregnancy by age 20. Those cohort members who indicated having become a
natural parent prior to age 21 were classified using a dichotomous measure as being a parent by age
20. The youngest age of parenthood in the cohort was age 16.
Interpartner violence (IPV) perpetration, ages 24-25. At age 25, sample members in
partnerships of over one month duration in the last year were asked about the occurrence of IPV
perpetration using a 22-item scale that incorporated selected items from the Revised Conflict
Tactics Scale (CTS2, Straus, Hamby, Boney-McCoy, & Sugarman, 1996). The selected items
spanned the domains of minor psychological aggression, severe psychological aggression, minor

13
physical assault, severe physical assault, and sexual coercion as described by Straus et al. (1996).
To devise a measure of the overall perpetration of violence in the cohort, each item was scored in
dichotomous (absent/present) form and a scale score created from the sum of these items. The scale
was found to have adequate reliability (α = .79).
Education/employment outcomes.
Delayed reading. At age 18, the word recognition skills of sample members were assessed
using the New Zealand revision of the Burt Word Reading Test (Gilmore, Croft, & Reid, 1981).
This measure was scored in two ways. First, for each participant a total test score representing the
number of correct responses was computed. Second, a dichotomous measure of reading delay was
constructed by classifying participants with a test score that was below the normed score indicating
a reading age of 12 (scores of 90 or below) as being reading delayed.
Leaving school without qualifications. At age 18, sample members were questioned
regarding their educational history. In particular, information was obtained on attainment of high
school qualifications. For the purposes of the present analyses, participants who had left school by
age 18 and had failed to attain a recognized high school qualification were classified as having left
school without qualifications.
Attained university degree or equivalent. At age 25, sample members were questioned as
to whether they had ever attained a Bachelor’s level or higher degree from a university or tertiary
institution. Those who reported having attained this level of qualification were classified using a
dichotomous measure as having obtained a university degree by age 25.
Educational achievement rank score. An additional measure was devised to reflect the
overall progression of each cohort member through the hierarchy of educational qualifications.
Each level in the progression was assigned an ordinal value (from 0 = no high school qualifications
to 6 = gained university degree), and each individual received a score based on his or her highest
14
level of qualification. This score served as a measure of educational achievement rank score in these
analyses.
Personal income, age 25. At age 25 sample members were asked to estimate their personal
gross income from all sources over the previous 12 months. This estimate served as the measures of
personal and income (in New Zealand dollars) at age 25 (personal income, M = 28,538; SD =
18,688).
Covariate factors
A range of covariate factors were selected from the study database on the basis that they were
associated with the range of outcomes listed above. These factors included:
Measures of family economic circumstances.
Maternal age. The mother’s age was recorded at the birth of each cohort member.
Maternal education. Maternal education levels were assessed at the participant’s birth
using a three point scale: 1 = mother lacked formal educational qualifications (had not graduated
from high school); 2 = mother had secondary level qualifications (had graduated from high school);
3 = mother had tertiary level qualifications (had obtained a university degree or tertiary technical
qualification).
Family living standards (0-10 years). At each year a global assessment of the material
living standards of the family was obtained via interviewer rating. Ratings were made on a five
point scale that ranged from “very good” to “very poor”. These ratings were averaged over the 10
year period to give a measure of typical family living standards during this period.
Family socioeconomic status (at birth). This was assessed at the time of the participant’s
birth using the Elley-Irving (Elley & Irving, 1976) scale of socioeconomic status for New Zealand.
This scale classifies SES into levels on the basis of paternal occupation ranging from 1 =
professional occupations to 6 = unskilled occupations.

15
Average family income (0-10 years). At each year estimates of the family’s gross annual
income were obtained from parental report. These income estimates for each year were recoded
into decile categories and the resulting measures then averaged over the ten year period to produce a
measure of the family’s averaged income decile rank.
Measures of family functioning.
Parental illicit drug use. When sample members were aged 11, information was obtained
from parents as to whether any parent had a history of illicit drug use. Participants were classified
as having a parent history of illicit drug use if one of his/her parents was reported to have a history
of illicit drug use.
Parental criminality. When sample members were aged 15 years, their parents were
questioned as to whether any parent had a history of criminal offending. Participants were
classified as having a parent history of criminality if one of his/her parents was reported to have a
history of offending.
Parental alcohol problems. When sample members were aged 15 years, their parents were
questioned as to whether any parent had a history of problems with alcohol, or alcohol dependence.
Participants were classified as having a parent history of alcohol problems if one of his/her parents
was reported to have a history of alcohol problems.
Family problems measure. A measure of family problems was calculated using a count
measure of 38 different measures of family disadvantage during the period 0-15 years, including
measures of disadvantaged parental background, poor pre-natal health practices and perinatal
outcomes, and disadvantageous child-rearing practices (Fergusson, Horwood, & Lynskey, 1994a).
Changes of parents to age 15. As part of the study data on changes of parents were
collected at annual intervals (Fergusson, Horwood, & Lynskey, 1994b). These data were used to
construct a measure of the number of changes of parent figures during the interval from birth to the
16
age of 15 years, including changes due to parental separation/divorce, reconciliation, remarriage,
death, and other changes of custodial parents.
Exposure to abuse in childhood.
Childhood sexual abuse. At ages 18 and 21 years sample members were questioned about
their experience of sexual abuse during childhood (< 16 years); (Fergusson, Lynskey, & Horwood,
1996). Questioning spanned an array of abusive experiences from episodes involving non-contact
abuse (e.g. indecent exposure) to episodes involving attempted or completed intercourse. Using this
information a 4-level scale was devised reflecting the most extreme form of sexual abuse reported
by the young person at either age.
Parental use of physical punishment (childhood physical abuse). At ages 18 and 21
sample members were asked to describe the extent to which their parents used physical punishment
during childhood (Fergusson & Lynskey, 1997). Separate questioning was conducted for mothers
and fathers. This information was used to create a 4-level scale reflecting the most severe form of
physical punishment reported for either parent.
Childhood cognitive ability and educational achievement.
Child cognitive ability. Cognitive ability was assessed at ages 8 and 9 using the Revised
Wechsler Intelligence Scale for Children (WISC-R: Wechsler, 1974). Total IQ scores were
computed on the basis of results on four verbal and four performance subscales. The split half
reliabilities of these scores were .93 at age 8 and .95 at age 9. For the purposes of the present
analysis the observed WISC-R total IQ scores at age 8 and 9 were combined by averaging over the
two administrations.
Grade point average ages 11-13 years. School performance was assessed via teachers’
ratings in each of five areas of the curriculum (reading, handwriting, written expression, spelling,
mathematics) using a 5-point scale ranging from very good to very poor. To provide a global
17
measure of the child’s educational achievement over the interval from 11-13 years, the teacher
ratings were summed across years and curriculum areas and then averaged to provide a teacher
rating grade point average for each child.
Adolescent depression/anxiety.
Internalizing disorder, ages 14-16. Parallel to the assessment of disruptive behavior
disorders, ages 15 and 16 years cohort members and their parents were questioned about symptoms
of major depression and anxiety disorders (generalized anxiety disorder; over-anxious disorder;
social phobia; simple phobia) occurring in the previous 12 months using the relevant sections of the
Diagnostic Interview Schedule for Children (DISC: Costello et al., 1982). These items were used to
classify participants according to DSM-III-R (American Psychiatric Association, 1987) symptom
criteria for major depression and anxiety disorders. Participants were classified as having major
depression or an anxiety disorder during the period 14-16 years if they met criteria for disorder on
the basis of either self or parental report over the period 14-16 years.
Statistical analyses
The analyses of the present data were conducted in several stages. In the first stage, the
associations between the three level dimensional measures of CD, ODD, and ADHD (none;
subclinical; clinical) and each of the outcomes was examined using the Mantel-Haenszel chi-square
test of linear trend for dichotomous outcomes, or the F-test of linearity from one-way ANOVA for
continuous and count measures.
In the second stage of the analysis, to compare the predictive utility of the continuous
symptom scale measure of each behavior disorder with a dichotomous disorder classification,
Pearson correlations were computed between the alternative measures of CD, ODD, and ADHD
and each of the outcomes. The squares of these correlations provide estimates of the proportion of
variance explained in each outcome by each measure of disorder. The distribution of these variance

18
explained estimates for each measure and disorder was plotted as a box-whisker diagram using the
Graph Plot function in Stata 10.0 (StataCorp, 2007).
In the third stage of the analyses, the associations between the continuous scale measures of
CD, ODD, and ADHD and each of the outcome measures were modelled using logistic regression
(for dichotomous outcomes); negative binomial regression (for count measures); and multiple
regression (for the measures of income and overall educational achievement). Two models were
fitted for each outcome; first, to control for comorbidity between each of the behavior disorders, the
scale measures for the three disorders were entered into the regression model simultaneously.
Second, in order to control for potential confounding, the fitted models were then extended to
incorporate the covariate factors described above. All covariates were included in all models. A
Sidak correction (Sidak, 1971), which accounts for correlations between outcome measures, was
used to control for the effect of multiple significance tests (48 in total) of the adjusted associations
between each disorder and the outcomes.
Finally, to examine whether there were gender differences in the extent to which the
dimensional measures of behavior disorder were associated with later outcomes, the associations
between each outcome and CD, ODD, and ADHD were modelled using a moderated regression
approach by fitting a series of nested regression models of the general form:
F(Y) k = B0k + ΣBjkXj
where Y represented a given outcome, and F(Y) was either the log odds of Y (for dichotomous
outcomes), the log rate of Y (for count measures), or the mean of Y (for continuous outcomes); and
Xj were the set of predictors (measures of CD, ODD, ADHD symptoms, and covariate factors). In
these models gender-specific intercept parameters B0k and slope parameters Bj k for predictors Xj
were fitted simultaneously within the same regression model. The parameters Bjk represent the
effect of the predictors within levels of gender k (k = 1 male; k = 2 female). Tests of gender
equality of slope for each measure of disruptive behavior were derived from Wald chi-square tests
of the null hypothesis that Ho: Bj1 = Bj2 for each Xj.

19
Results
Prevalence and comorbidity of CD, ODD, and ADHD (ages 14-16)
Examination of the data showed that 21.8% of the sample met DSM-IV (American
Psychiatric Association, 1994) symptom criteria for a diagnosis of a behavior disorder. In terms of
comorbidity, 13.1% of the sample met criteria for one behavior disorder; 6.1% of the sample met
criteria for two behavior disorders; and 2.6% met criteria for all three behavior disorders. For CD,
10.6% of the sample (7.4% of females; 13.7% of males) met DSM-IV criteria for the disorder; for
ODD, 15.1% of the sample (15.0% of females; 15.1% of males) met DSM-IV criteria for the
disorder; and for ADHD, 7.5% of the sample (6.2% of females; 8.9% of males) met DSM-IV
criteria for the disorder. For those meeting criteria for two behavior disorders, 5.6% met criteria for
both CD and ODD (4.0% of females; 7.3% of males); 5.5% met criteria for both ODD and ADHD
(4.2% for females; 6.9% for males); and 2.8% met criteria for both CD and ADHD (1.0% for
females; 4.6% for males).
Associations between dimensional measures of CD, ODD, ADHD (ages 14-25) and outcomes
to age 25
Table 1 shows the sample classified into three groups (none; subclinical; clinical) according
to the extent to which participants met diagnostic criteria for CD, ODD, and ADHD (see Methods).
The Table reports associations between these classifications of CD, ODD, and ADHD measured at
ages 14-16, and a series of outcome measures to age 25 in the areas of: crime; substance use; mental
health; pregnancy/parenthood/partnership; and education/employment (see Methods). The Table
shows the rates (for dichotomous outcomes) or mean scores and standard deviations (for continuous
and count measures) for each of three levels of CD, ODD, and ADHD symptoms.
The Table shows that, for all outcomes, increasing severity of disorder was associated with
increasing risks of crime; substance dependence; mental health disorders; early parenthood;
20
interpartner violence; lower educational achievement; and lower income. In all cases those
meeting criteria for disorder had the worst outcomes; those with no symptoms had the best
outcomes; and those with sub-clinical symptoms had outcomes that were intermediate between the
other two groups. In all but one case, there was evidence of a statistically significant (p < .05)
linear trend as tested by the Mantel-Haenszel chi square test of linearity (for dichotomous
outcomes) and by the F-test for linearity (for continuous and count measures).
INSERT TABLE 1 HERE
Scales or categories
In the previous section, Table 1 demonstrated that there was evidence of linear relationships
between the extent of disruptive behavior and each outcome. This result is consistent with the view
that the measures of CD, ODD and ADHD are best conceptualised as dimensional variables in
which the severity of disorder varies from none to severe. To explore the implications of
dimensional versus categorical scaling of DSM symptoms, comparisons were made of the
predictive power of two representations of these symptoms: a) a dimensional (scale score) model in
which the severity of disorder was represented by the number of DSM-IV criteria present; and b) a
categorical model in which respondents were classified as disordered or non disordered using DSM-
IV criteria.
The results of these analyses are depicted in Figure 1, which shows box-whisker plots of the
distribution of shared variance estimates for each of the 16 outcomes for each measure of disorder
(CD scale score; CD dichotomous; ODD scale score; ODD dichotomous; ADHD scale score;
ADHD dichotomous). These comparisons showed that the scale score model consistently out
performed the categorical DSM-IV model in terms of its capacity to predict later outcomes.
Specifically:
21
1. For CD variance estimates for the scale score measure ranged from .006 to .199 with a median
value of .065; in contrast, the estimates for the DSM-IV classification ranged from .002 to .113
with a median value of .032.
2. For ODD, variance estimates between the scale score measure and outcomes ranged from .018
to .141 with a median value of .054; in contrast the estimates for the DSM-IV classification
ranged from .004 to .089 with a median of .030.
3. For ADHD, variance estimates between the scale score measure and outcomes ranged from .010
to .162 with a median value of .052; in contrast the estimates for the DSM-IV classification
ranged from .001 to .06 with a median of .017.
On average, estimates of explained variance for the categorical model were only 0.49 (95% CI:
0.42-0.55) times the values for the corresponding scale score model.
INSERT FIGURE 1 HERE
Adjustment for comorbid disorders and confounding factors
To examine the extent to which each of the disorders listed in Table 1 was associated with
later outcomes after control for both comorbidity and potential confounding, the associations
between the three behavior disorder scale score measures and outcomes were modelled. The results
of these analyses are shown in Table 2, which shows the unstandardized regression coefficients,
standard errors, and tests of significance for the associations between each of the three dimensional
measures of CD, ODD, and ADHD, and outcomes to age 25, after adjusting the associations for: a)
comorbid behavior disorders; and b) both comorbid behavior disorders, and the full range of
potentially confounding factors described above. Finally, the Table also reports on the statistically
significant (p < .05) confounding factors in the analyses (further information concerning specific
confounding factors can be obtained from the authors by request). The Table shows:
22
1. Adjustment for comorbid disorders reduced the number of statistically significant (p < .05)
associations between behavior disorders and outcomes. Accounting for comorbidity between
behavior disorders clearly limited the extent to which some disorders were predictive of some
adverse outcomes.
2. In general, adjustment for both comorbid behavior disorders and confounding factors further
reduced the magnitude of the associations between each behavior disorder and each outcome.
Exceptions to this pattern were found for the associations between ODD and the measures of
crime and ASPD, which became stronger after controlling for both comorbid disorders and
confounding factors. These findings suggest that confounding factors may have served to
suppress the associations between ODD and behavior disorders to some extent.
3. After adjustment for comorbid behavior disorders and confounding factors, CD and ODD had
differing patterns of association with later outcomes, although there were some similarities. For
example, both CD and ODD were significantly (p < .05) associated with property/violent crime.
However, CD was significantly (p < .05) associated with several education/employment
outcomes, whereas ODD was not; similarly, CD was significantly (p < .05) associated with all
three substance use outcomes, whereas ODD was not. In addition, CD was significantly (p <
.05) associated with early pregnancy and parenthood, and IPV perpetration, whereas ODD was
not. On the other hand, ODD was associated with all three adverse mental health outcomes
after controlling for confounding factors, including contemporaneous internalizing disorders,
whereas CD was associated with only later ASPD. In general, both CD and ODD were
predictive of later adverse outcomes after adjustment for comorbid disorders and confounding
factors, although CD had a broader pattern of associations with outcomes than did ODD.
4. In contrast, after adjustment for comorbid behavior disorders and confounding factors, ADHD
was significantly (p < .01) associated with outcomes in the area of education/income. However,
ADHD symptoms, after controlling for CD symptoms, were not related to increased risk in
23
adverse outcomes in any of the other areas (crime; substance use; mental health;
pregnancy/parenthood/partnership) after adjustment.
5. Application of the Sidak corrected p-value (p = .0182) for correlated multiple comparisons
(Sidak, 1971) suggested that, after correction for multiple comparisons, the pattern of results
remained generally consistent. The exceptions to this were that the adjusted associations
between: ODD and later ASPD; CD and pregnancy; and CD and later intimate partner violence
were no longer statistically significant after applying the Sidak correction.
INSERT TABLE 2 HERE
Tests of gender differences
To examine whether there were gender differences in the extent to which the dimensional
measures of behavior disorder were associated with later outcomes, after adjustment for comorbid
disorders and confounding factors, nested regression methods were used to test the similarity of
model parameters across gender groups (see Methods).
The results of these analyses showed that, of the 48 comparisons made, there was only a
single significant (p < .05) gender difference in the association between a behavior disorder
measure and an outcome. For self-reported property and violent crime, the association with CD
was stronger for females. However, this difference was no longer significant upon application of
the Sidak correction for multiple significance testing. In general, the results of these analyses
showed that there was very little evidence to suggest that the associations between the dimensional
measures of behavior and later adverse outcomes differed according to gender.
Discussion
In this paper we have addressed three issues relating to the measurement and discriminant
validity of DSM diagnostic criteria for conduct disorder (CD), oppositional/defiant disorder (ODD)

24
and attention-deficit/hyperactivity disorder (ADHD), using prospective data from a longitudinal
birth cohort. These issues were:
Scales versus categories
The first stage of our analysis examined the extent to which there was evidence of consistent
relationships between the extent of disruptive behavior disorders and subsequent developmental
outcomes in a number of domains. These data (Table 1) showed consistent evidence of increasing
risks of outcomes with increasing levels of symptoms of CD, ODD and ADHD. These findings are
consistent with a growing body of evidence that suggests that DSM criteria for disruptive behavior
disorders describe broad dimensional measures that rank the population on underlying dimensions
in which the severity of symptomatology ranges from none to severe (Broidy et al., 2003;
Fergusson & Horwood, 1995b; Helzer et al., 2007; Hudziak et al., 2007; Krueger & Bezdjian, 2009;
Krueger et al., 2005). There is also increasing agreement in discussions of the measurement of
disorder of the need to distinguish levels of severity of disorder (Altman & Royston, 2006;
Bissonnette, Ickes, Bernstein, & Knowles, 1990; MacCallum et al., 2002).
In addition, the results of the analyses suggested that symptom scale scores had a greater
level of predictive validity than dichotomous (categorical) measures of DSM diagnoses. On
average, estimates of the proportion of variance explained in outcomes by dichotomous measures of
behavior disorders were less than half the size of the estimates derived using continuous scale
scores. These results suggest that classification schemes that take into account the severity of
disorder will have stronger predictive validity than dichotomous classification schemes.
Irrespective of how this issue is to be addressed in DSM-V (Castellanos, 2008; Moffitt et al., 2008),
the results suggest that it is important that the use of black and white diagnostic classification is
supplemented by some nomenclature for both describing the severity of disorder and/or addressing
the issues raised by sub-clinical symptom levels.

25
Discriminant validity of DSM diagnostic classifications
The second stage of the analysis examined the extent to which symptoms of CD, ODD and
ADHD were associated with differing longer-term outcomes when due allowance was made for : a)
the comorbidities of these disorders; and b) confounding factors. This analysis suggested that each
disorder was associated with a different profile of future outcome risks.
The clearest distinction was between CD or ODD and ADHD. The analysis suggested that
while CD/ODD were associated with increased risks of crime, substance use, mental health
problems, and adverse parenthood/partnership outcomes, ADHD was not associated with these
outcomes after control for comorbidity and confounding. This result is consistent with a series of
previous findings from this study (Fergusson & Horwood, 1995b; Fergusson, Horwood et al.,
1993a; Fergusson et al., 2007; Fergusson, Lynskey et al., 1993; Fergusson, Lynskey, & Horwood,
1997; Lynskey & Fergusson, 1995) all of which have found that ADHD in the absence of CD/ODD
is not associated with crime or substance use but is associated with educational under-achievement
and related outcomes. The present study extends these results to the age of 25, and shows that
increasing ADHD symptoms in adolescence were associated with lower levels of educational
achievement and income. This pattern of associations between ADHD and later educational and
employment outcomes has also been observed in the present cohort using continuous symptom
measures of childhood ADHD (Fergusson & Horwood, 1992; Fergusson, Horwood et al., 1993a;
Fergusson et al., 1997).
While the findings of this and other studies (Biederman, Petty, Dolan et al., 2008; Brook,
Duan, Zhang, Cohen, & Brook, 2008; Disney et al., 1999; Mannuzza, Klein, & Moulton, 2008;
Milich & Loney, 1979; Satterfield et al., 2007; Satterfield & Schell, 1997) have shown that ADHD
in the absence of CD/ODD is not associated with increased risks of crime, substance use or
antisocial behavior, not all studies have found this to be the case (Barkley, Fischer, Edelbrock, &
Smallish, 1990; Barkley, Fischer, Smallish, & Fletcher, 2004; Elkins, McGue, & Iacono, 2007;

26
Gunter et al., 2006; Milberger, Biederman, Faraone, Wilens, & Chu, 1997; Sourander et al., 2006).
Indeed, a meta- analysis (Pratt, Cullen, Blevins, Daigle, & Unnever, 2002) concluded that the
weight of the evidence favoured the view that ADHD was a risk factor for later crime. The reasons
for these differences in the literature on this topic are not clear, but may be related to between study
differences in the extent of control for comorbidity and confounding. It is notable that findings from
the CHDS have consistently shown that when due allowance is made for confounding and
cormorbidity, measures of ADHD have been unrelated to crime and antisocial behavior (Fergusson
& Horwood, 1995b; Fergusson, Horwood et al., 1993a; Fergusson et al., 2007; Fergusson, Lynskey
et al., 1993; Fergusson et al., 1997; Lynskey & Fergusson, 1995), but have been predictors of later
academic achievement and related outcomes (Fergusson & Horwood, 1992, , 1995a; Fergusson,
Horwood et al., 1993a; Fergusson et al., 1997). A strength of the present study was the availability
of both information on the comorbidities of ADHD, and on a wide range of prospectively assessed
confounding factors assessed over the period from birth to adolescence. The present findings
suggest that when such statistical control is applied, ADHD in the absence of CD/ODD was not
associated with increased risks of crime, substance use or other forms of antisocial behavior.
The results of the present study also showed that the long term consequences of adolescent
CD and ODD were also relatively distinct. The two conditions showed some overlap in terms of
risks of later self-reported crime. However, ODD showed stronger linkages with intermalizing
problems (depression/anxiety; suicide attempts) while CD had more pervasive consequences that
spanned substance use, sexual and partnership relationships, educational achievement and
employment outcomes. These results support the view that CD and ODD are distinct, albeit highly
correlated domains of externalising (Biederman, Petty, Dolan et al., 2008; Biederman, Petty,
Monuteaux et al., 2008; Copeland et al., 2009; Stringaris & Goodman, 2009a, , 2009b). The results
are in general agreement with a recent study by Copeland and colleagues (Copeland et al., 2009),
who showed that CD in adolescence was more likely to be associated with later ASPD and
substance use, whereas ODD in adolescence was more likely to be associated with depression.

27
These findings and conclusions clearly support the current DSM-IV division of externalising
symptoms into domains representing symptoms of CD, ODD and ADHD. Not only do CD, ODD
and ADHD appear to be factorially distinct domains of externalising behaviors, these domains also
have different profiles of outcome risks.
Gender differences
The third question addressed in the analysis concerned the issue of whether the relationships
between disruptive behavior disorders and later outcomes varied with gender. Addressing this
question is important for examining the extent to which the development of gender-specific
diagnostic criteria are justified (Moffitt et al., 2001; Rutter et al., 2004; Zahn-Waxler, 1993;
Zoccolillo, 1993). This question was addressed by fitting nested regression models to test the
equality of regression parameters for males and females. The findings of the analysis showed that
there was very little evidence to suggest that the developmental consequences of CD, ODD and
ADHD varied with gender. These findings do not support the view that there is a need to develop
gender-specific criteria for CD, ODD and ADHD.
Summary and implications for DSM-V
The accumulated findings of this study lead to the following conclusions about the
relationships between CD, ODD and ADHD in adolescence and later developmental outcomes:
1. There was consistent evidence to suggest that DSM criteria for CD, ODD and ADHD were
indicators of underlying dimensions for which the extent of disorder varied from none to severe.
This results highlights the importance of DSM-V including methods for both recognising the
severity of disorder and addressing subclinical symptom levels. While the present study
suggested that a sizeable proportion of adolescents display symptoms of disruptive behavior
disorder, the results also clearly show that increasing severity of disorders was related to
increased risks of adverse outcomes.
28
2. There was clear evidence for the discriminant validity of CD, ODD and ADHD to the extent
that each disorder had a distinctive pattern of longer term consequences. CD was associated
with pervasive increases in risks of adverse psychosocial, educational and economic outcomes.
The adverse effects of ADHD in isolation were confined to educational and related outcomes.
The adverse outcomes of ODD were confined to increased risks of later crime and elevated risks
of internalizing problems. These findings reinforce factor analytic and other evidence of the
validity of these diagnostic domains (Burke et al., 2002; Fergusson, Horwood, & Lynskey,
1994c). The findings also support the assertion that CD, ODD, and ADHD each need to be
included as discrete diagnostic entities in the DSM-V system for categorizing disruptive
behavior disorders.
3. There was no consistent evidence to suggest that the developmental consequences of CD,
ADHD and ODD in adolescence differed for males and females. These findings do not support
the view that DSM-V should develop gender-specific diagnostic classifications for males and
females.
Although the present study provides evidence for the utility of a dimensional approach to
disruptive behavior disorders, it is clear that the categorical approach may also have significant
utility, particularly in situations in which diagnostic information is required. Furthermore, the
evidence for the discriminant validity of each disorder provided by the present study suggests that
the categorical approach may also play a role in treatment and prognosis of disruptive behavior
disorders.
Limitations
The present study has a number of limitations that should be borne in mind. Perhaps the
most important of these was that the assessments of DSM criteria for disruptive behavior disorders
were obtained in adolescence. This limitation made it difficult to distinguish between life-course
persistent and adolescent limited disorders (Moffitt, 1993), although it was clear that the majority of

29
those meeting criteria for behavior disorder in adolescence also displayed behavior problems in
middle childhood. The assessment of disorders using two sources (mother, child) over a two year
time span may have caused the symptom count measures and prevalence estimates for each disorder
to be somewhat inflated, particularly in comparison to studies that examine prevalence within a
single 12-month period; while the “or” method of classification used in the present study is used
commonly in the literature, debate continues as to its appropriateness in all circumstances (Kraemer
et al., 2003). Also, it should be noted that the present study was unable to account for the complete
range of DSM-IV symptoms for each behavior disorder during adolescence; did not have access to
teacher report data on adolescent behaviors; and for each disorder, did not assess whether symptoms
were associated with significant impairment. A further limitation is that the findings apply to a
specific cohort studied over a particular historical period in a specific social context. The extent to
which the present findings can be generalised to other cohort and social contexts requires further
investigation. Finally, as with all observational studies, errors of measurement in the assessment of
exposure outcomes and uncontrolled sources of confounding remain potential threats to study
validity.
Acknowledgements
This research was funded by grants from the Health Research Council of New Zealand, the National
Child Health Research Foundation, the Canterbury Medical Research Foundation and the New
Zealand Lottery Grants Board.
30
References
Altman, D. G., & Royston, P. (2006). The cost of dichotomising continuous variables. British
Medical Journal, 332, 1080.
American Psychiatric Association. (1987). Diagnostic and Statistical Manual of Mental Disorders
(3rd ed. - rev). Washington, DC: American Psychiatric Association.
American Psychiatric Association. (1994). Diagnostic and Statistical Manual of Mental Disorders
(4th ed.). Washington, DC: American Psychiatric Association.
Barkley, R. A., Fischer, M., Edelbrock, C. S., & Smallish, L. (1990). The adolescent outcome of
hyperactive children diagnosed by research criteria: I. An 8-year prospective follow-up
study. Journal of the American Academy of Child & Adolescent Psychiatry, 29, 546-557.
Barkley, R. A., Fischer, M., Smallish, L., & Fletcher, K. (2004). Young adult follow-up of
hyperactive children: antisocial activities and drug use. Journal of Child Psychology and
Psychiatry, 45, 195-211.
Biederman, J., Petty, C. R., Dolan, C., Hughes, S., Mick, E., Monuteaux, M. C., et al. (2008). The
long-term longitudinal course of oppositional defiant disorder and conduct disorder in
ADHD boys: findings from a controlled 10-year prospective longitudinal follow-up study.
Psychological Medicine, 38, 1027-1036.
Biederman, J., Petty, C. R., Monuteaux, M. C., Mick, E., Parcell, T., Westerberg, D., et al. (2008).
The longitudinal course of comorbid oppositional defiant disorder in girls with attention-
deficit/hyperactivity disorder: findings from a controlled 5-year prospective longitudinal
follow-up study. Journal of Developmental and Behavioral Pediatrics, 29, 501-507.
Bissonnette, V., Ickes, W., Bernstein, I., & Knowles, E. (1990). Personality moderating variables: A
warning about statistical artifact and a comparison of analytic techniques. Journal of
Personality, 58, 567-587.
31
Boylan, K., Vaillancourt, T., Boyle, M., & Szatmari, P. (2007). Comorbidity of internalizing
disorders in children with oppositional defiant disorder. European Child and Adolescent
Psychiatry, 16, 484-494.
Broidy, L. M., Nagin, D. S., Tremblay, R. E., Brame, B., Dodge, K., Fergusson D.M. et al. (2003).
Developmental trajectories of childhood disruptive behaviors and adolescent delinquency: A
six site, cross national study. Development and Psychopathology, 39, 222-245.
Brook, J. S., Duan, T., Zhang, C., Cohen, P. R., & Brook, D. W. (2008). The association between
attention deficit hyperactivity disorder in adolescence and smoking in adulthood. American
Journal of Addiction, 17, 54-59.
Burke, J. D., Loeber, R., & Birmaher, B. (2002). Oppositional defiant and conduct disorder: A
review of the past 10 years, part II. Journal of the American Academy of Child & Adolescent
Psychiatry, 41, 1275-1293.
Castellanos, F. X. (2008). Report of the DSM-V ADHD and Disruptive Behavior Disorders Work
Group. Retrieved 3 April, 2009, from
http://www.psych.org/MainMenu/Research/DSMIV/DSMV/DSMRevisionActivities/DSMV
WorkGroupReports/ADHDandDisruptiveBehaviorDisordersWorkGroupReport.aspx
Copeland, W. E., Shanahan, L., Costello, E. J., & Angold, A. (2009). Childhood and adolescent
psychiatric disorders as predictors of young adult disorders. Archives of General Psychiatry,
66, 764-772.
Costello, A., Edelbrock, C., Kalas, R., Kessler, M., & Klaric, S. A. (1982). Diagnostic Interview
Schedule for Children (DISC). Bethesda, MD: National Institute of Mental Health.
Disney, E. R., Elkins, I. J., McGue, M., & Iacono, W. G. (1999). Effects of ADHD, conduct
disorder, and gender on substance use and abuse in adolescence. American Journal of
Psychiatry, 156, 1515-1521.
32
Elkins, I. J., McGue, M., & Iacono, W. G. (2007). Prospective effects of attention-
deficit/hyperactivity disorder, conduct disorder, and sex on adolescent substance use and
abuse. Archives of General Psychiatry, 64, 1145-1152.
Elley, W. B., & Irving, J. C. (1976). Revised socio-economic index for New Zealand. New Zealand
Journal of Educational Studies, 11, 25-36.
Elliott, D. S., & Huizinga, D. (1989). Improving self-reported measures of delinquency. In M. W.
Klein (Ed.), Cross-national research in self-reported crime and delinquency (pp. 155-186).
Boston, MA: Kluwer.
Eme, R. F. (2007). Sex differences in child-onset, life-course-persistent conduct disorder. A review
of biological influences. Clinical Psychology Review, 27, 607-627.
Fergusson, D. M., & Horwood, L. J. (1992). Attention deficit and reading achievement. Journal of
Child Psychology & Psychiatry & Allied Disciplines, 33, 375-385.
Fergusson, D. M., & Horwood, L. J. (1995a). Early disruptive behavior, IQ, and later school
achievement and delinquent behavior. Journal of Abnormal Child Psychology, 23, 183-199.
Fergusson, D. M., & Horwood, L. J. (1995b). Predictive validity of categorically and dimensionally
scored measures of disruptive childhood behaviors. Journal of the American Academy of
Child & Adolescent Psychiatry, 34, 477-485.
Fergusson, D. M., & Horwood, L. J. (2001). The Christchurch Health and Development Study:
Review of findings on child and adolescent mental health. Australian and New Zealand
Journal of Psychiatry, 35, 287-296.
Fergusson, D. M., Horwood, L. J., & Lynskey, M. T. (1993a). The effects of conduct disorder and
attention deficit in middle childhood on offending and scholastic ability at age 13. Journal
of Child Psychology & Psychiatry, 34, 899-916.
Fergusson, D. M., Horwood, L. J., & Lynskey, M. T. (1993b). The prevalence and comorbidity of
DSM-III-R diagnoses in a birth cohort of 15 year olds. Journal of the American Academy of
Child & Adolescent Psychiatry, 32, 1127-1134.

33
Fergusson, D. M., Horwood, L. J., & Lynskey, M. T. (1994a). The childhoods of multiple problem
adolescents: A 15-year longitudinal study. Journal of Child Psychology & Psychiatry, 35,
1123-1140.
Fergusson, D. M., Horwood, L. J., & Lynskey, M. T. (1994b). Parental separation, adolescent
psychopathology, and problem behaviors. Journal of the American Academy of Child &
Adolescent Psychiatry, 33, 1122-1131.
Fergusson, D. M., Horwood, L. J., & Lynskey, M. T. (1994c). Structure of DSM-III-R criteria for
disruptive childhood behaviors: Confirmatory factor models. Journal of the American
Academy of Child & Adolescent Psychiatry, 33, 1145-1155.
Fergusson, D. M., Horwood, L. J., & Ridder, E. M. (2007). Conduct and attentional problems in
childhood and adolescence and later substance use, abuse and dependence: Results of a 25
year longitudinal study. Drug and Alcohol Dependence, 88S, S14-S26.
Fergusson, D. M., & Lynskey, M. T. (1997). Physical punishment/maltreatment during childhood
and adjustment in young adulthood. Child Abuse & Neglect, 21, 617-630.
Fergusson, D. M., Lynskey, M. T., & Horwood, L. J. (1993). Conduct problems and attention
deficit behaviour in middle childhood and cannabis use by age 15. Australian & New
Zealand Journal of Psychiatry, 27, 673-682.
Fergusson, D. M., Lynskey, M. T., & Horwood, L. J. (1996). Childhood sexual abuse and
psychiatric disorder in young adulthood: I. Prevalence of sexual abuse and factors associated
with sexual abuse. Journal of the American Academy of Child & Adolescent Psychiatry, 35,
1355-1364.
Fergusson, D. M., Lynskey, M. T., & Horwood, L. J. (1997). Attentional difficulties in middle
childhood and psychosocial outcomes in young adulthood. Journal of Child Psychology &
Psychiatry & Allied Disciplines, 38, 633-644.

34
Flory, K., & Lynam, D. R. (2003). The relation between attention deficit hyperactivity disorder and
substance abuse: What role does conduct disorder play? Clinical Child and Family
Psychology Review, 6, 1-16.
Flory, K., Milich, R., Lynam, D. R., Leukefeld, C., & Clayton, R. (2003). Relation between
childhood disruptive behavior disorders and substance use and dependence symptoms in
young adulthood: individuals with symptoms of attention-deficit/hyperactivity disorder and
conduct disorder are uniquely at risk. Psychology of Addictive Behaviors, 17, 151-158.
Gilmore, A., Croft, C., & Reid, N. (1981). Burt Word Reading Test. New Zealand Revision.
Teachers Manual. Wellington, New Zealand: New Zealand Council for Educational
Research.
Gunter, T. D., Arndt, S., Riggins-Caspers, K., Wenman, G., & Cadoret, R. J. (2006). Adult
outcomes of attention deficit hyperactivity disorder and conduct disorder: are the risks
independent or additive? Annals of Clinical Psychiatry, 18, 233-237.
Helzer, J. E., Bucholz, K. K., & Gossop, M. (2007). A dimensional option for the diagnosis of
substance dependence in DSM-V. International Journal of Methods in Psychiatric
Research, 16, S24-S33.
Hudziak, J. J., Achenbach, T. M., Althoff, R. R., & Pine, D. S. (2007). A dimensional approach to
developmental psychopathology. International Journal of Methods in Psychiatric Research,
16, S16-23.
Keenan, K., Loeber, R., & Green, S. (1999). Conduct disorder in girls: A review of the literature.
Clinical Child and Family Psychology Review, 2, 3-19.
Kraemer, H. C., Measelle, J. R., Ablow, J. C., Essex, M. J., Boyce, W. T., & Kupfer, D. J. (2003). A
new approach to integrating data from multiple informants in psychiatric assessment and
research: Mixing and matching contexts and perspectives. American Journal of Psychiatry,
160, 1566-1577.
35
Krueger, R. F., & Bezdjian, S. (2009). Enhancing research and treatment of mental disorders with
dimensional concepts: toward DSM-V and ICD-11. World Psychiatry, 8, 3-6.
Krueger, R. F., Markon, K. E., Patrick, C. J., & Iacono, W. G. (2005). Externalizing
psychopathology in adulthood: a dimensional-spectrum conceptualization and its
implications for DSM-V. Journal of Abnormal Psychology, 114, 537-550.
Lynskey, M. T., & Fergusson, D. M. (1995). Childhood conduct problems, attention deficit
behaviors, and adolescent alcohol, tobacco, and illicit drug use. Journal of Abnormal Child
Psychology, 23, 281-302.
MacCallum, R. C., Zhang, S., Preacher, K. J., & Rucker, D. D. (2002). On the practice of
dichotomization of quantitative variables. Psychological Methods, 7, 19-40.
Mannuzza, S., Klein, R. G., & Moulton, J. L., 3rd. (2008). Lifetime criminality among boys with
attention deficit hyperactivity disorder: a prospective follow-up study into adulthood using
official arrest records. Psychiatry Research, 160, 237-246.
Milberger, S., Biederman, J., Faraone, S. V., Wilens, T., & Chu, M. P. (1997). Associations
between ADHD and psychoactive substance use disorders. Findings from a longitudinal
study of high-risk siblings of ADHD children. American Journal of Addiction, 6, 318-329.
Milich, R., & Loney, J. (1979). The role of hyperactive and aggressive symptomatology in
predicting adolescent outcome among hyperactive children Journal of Pediatric
Psychology, 4, 93-112.
Moffitt, T. E. (1993). Adolescence-limited and life-course-persistent antisocial behavior: A
developmental taxonomy. Psychological Review, 100, 674-701.
Moffitt, T. E., Arseneault, L., Jaffee, S. R., Kim-Cohen, J., Koenen, K. C., Odgers, C. L., et al.
(2008). Research review: DSM-V conduct disorder: research needs for an evidence base.
Journal of Child Psychology and Psychiatry, 49, 3-33.

36
Moffitt, T. E., Caspi, A., Rutter, M., & Silva, P. A. (2001). Sex Differences in Antisocial Behaviour.
Conduct Disorder, Delinquency, and Violence in the Dunedin Longitudinal Study.
Cambridge: Cambridge University Press.
Moffitt, T. E., & Scott, S. (in press). Conduct Disorders of childhood and adolescence. In M. Rutter
(Ed.), Child and Adolescent Psychiatry (4th ed.). London: Blackwells.
Moffitt, T. R., & Silva, P. A. (1988). Self-reported delinquency: Results from an instrument for
New Zealand. Australian and New Zealand Journal of Criminology, 21, 227-240.
Molina, B. S., & Pelham, W. E., Jr. (2003). Childhood predictors of adolescent substance use in a
longitudinal study of children with ADHD. Journal of Abnormal Psychology, 112, 497-507.
Pratt, T. C., Cullen, F. T., Blevins, K. R., Daigle, L., & Unnever, J. D. (2002). The relationship of
attention deficit hyperactivity disorder to crime and delinquency: a meta-analysis.
International Journal of Police Science and Management, 4, 344-360.
Quay, H. C., & Peterson, D. R. (1987). Manual for the Revised Behaviour Problem Checklist.
Miami: H.C. Quay & D.R. Peterson.
Robins, L. N. (1991). Conduct disorder: Annual Research Review, Journal of Child Psychology and
Psychiatry, 32, 193-213.
Rutter, M., Caspi, A., Fergusson, D. M., Horwood, L. J., Goodman, R., Maughan, B., et al. (2004).
Sex differences in developmental reading disability: New findings from 4 epidemiology
studies. Journal of the American Medical Association, 291, 2007-2012.
Satterfield, J. H., Faller, K. J., Crinella, F. M., Schell, A. M., Swanson, J. M., & Homer, L. D.
(2007). A 30-year prospective follow-up study of hyperactive boys with conduct problems:
adult criminality. Journal of the American Academy of Child & Adolescent Psychiatr, 46,
601-610.
Satterfield, J. H., & Schell, A. (1997). A prospective study of hyperactive boys with conduct
problems and normal boys: adolescent and adult criminality. Journal of the American
Academy of Child & Adolescent Psychiatr, 36, 1726-1735.
37
Sidak, Z. (1971). On probabilities of rectangles in multivariate normal Student distributions: their
dependence on correlations. Annals of Mathmatical Statistics, 41, 169-175.
Sourander, A., Elonheimo, H., Niemela, S., Nuutila, A. M., Helenius, H., Sillanmaki, L., et al.
(2006). Childhood predictors of male criminality: a prospective population-based follow-up
study from age 8 to late adolescence. Journal of the American Academy of Child &
Adolescent Psychiatr, 45, 578-586.
StataCorp. (2007). Stata Statistical Software: Release 10.0. Texas: Stata Corporation, College
Station.
Stefanatos, G. A., & Baron, I. S. (2007). Attention-deficit/hyperactivity disorder: a
neuropsychological perspective towards DSM-V. Neuropsychological Review, 17, 5-38.
Straus, M. A., Hamby, S. L., Boney-McCoy, S., & Sugarman, D. B. (1996). The Revised Conflict
Tactics Scales (CTS2). Development and preliminary psychometric data. Journal of Family
Issues, 17, 283-316.
Stringaris, A., & Goodman, R. (2009a). Longitudinal outcome of youth oppositionality: irritable,
headstrong, and hurtful behaviors have distinctive predictions. Journal of the American
Academy of Child & Adolescent Psychiatr, 48, 404-412.
Stringaris, A., & Goodman, R. (2009b). Three dimensions of oppositionality in youth. Journal of
Child Psychology and Psychiatry, 50, 216-223.
Wechsler, D. (1974). Manual for the Wechsler Intelligence Scale for Children - Revised. New York:
Psychological Corporation.
World Health Organization. (1993). Composite International Diagnostic Interview (CIDI). Geneva,
Switzerland: World Health Organization.
Zahn-Waxler, C. (1993). Warriors and worriers: Gender and psychopathology. Development and
Psychopathology, 5, 79-89.

38
Zoccolillo, M. (1992). Co-occurrence of conduct disorder and its adult outcomes with depressive
and anxiety disorders: A review. Journal of the American Academy of Child & Adolescent
Psychiatry, 31, 547-556.
Zoccolillo, M. (1993). Gender and the development of conduct disorder. Development and
Psychopathology, 5, 65-78.

39
Table 1. Associations between three-level measures of: a) conduct disorder; b) oppositional/defiant disorder; and c) attention deficit/hyperactivity disorder at ages 14-16 and outcomes to age 25.
Conduct Disorder Oppositional/Defiant Disorder Attention Deficit/Hyperactivity Disorder
Measure
None (n = 599)
Sub-clinical
(n = 291) Clinical
(n = 105)
Linear trend
p1
None (n = 452)
Sub-clinical
(n = 393) Clinical
(n = 150)
Linear trend
p1
None (n = 311)
Sub-clinical
(n = 609) Clinical (n = 75)
Linear trend
p1
Crime
Mean (SD) property/violent crime incidents ages 18-25
0.84 (4.41)
4.11 (13.12)
9.83 (21.18)
<.001 0.74 (3.94)
2.64 (9.27)
8.98 (21.18)
<.001 0.86 (4.31)
2.60 (9.80)
11.69 (24.54)
<.001
Mean (SD) number of arrests ages 18-25
0.19 (1.12)
0.56 (1.72)
1.74 (4.63)
<.001 0.18 (0.72)
0.52 (2.05)
1.13 (3.70)
<.001 0.19 (0.73)
0.44 (1.68)
1.74 (5.22)
<.001
Substance Use
Mean (SD) number of nicotine dependence symptoms ages 18-25
1.22
(1.99)
2.49
(2.53)
3.63
(2.32)
<.001
1.25
(2.02)
2.08
(2.42)
2.97
(2.56)
<.001
1.16
(2.02)
2.13
(2.41)
2.29
(2.48)
<.001
Mean (SD) number of alcohol abuse/dependence symtpsoms ages 18-25
1.08 (1.82)
1.80 (2.45)
2.55 (2.91)
<.001 1.05 (1.78)
1.56 (2.26)
2.30
(2.88)
<.001 1.18 (2.06)
1.48 (2.16)
2.24
(2.92)
<.01
Mean (SD) number of illicit drug abuse/dependence symptoms ages 18-25
0.63 (1.71)
1.83 (2.95)
2.33 (3.06)
<.001 0.60 (1.72)
1.49 (2.73)
1.98
(2.75) <.001 0.66
(1.80) 1.30
(2.52) 2.10
(2.89) <.001
Mental Health
% major depression/anxiety disorder ages 21-25 38.6 50.0 51.5 <.01 33.3 48.4 59.9 <.001 35.2 46.5 50.0 <.01
% anti-social personality disorder ages 21-25 0.9 7.8 22.8 <.001 0.7 6.9 14.3 <.001 2.0 4.9 20.8 <.001

40
Conduct Disorder Oppositional/Defiant Disorder Attention Deficit/Hyperactivity Disorder
Measure
None (n = 599)
Sub-clinical
(n = 291) Clinical
(n = 105)
Linear trend
p1
None (n = 452)
Sub-clinical
(n = 393) Clinical
(n = 150)
Linear trend
p1
None (n = 311)
Sub-clinical
(n = 609) Clinical (n = 75)
Linear trend
p1
Mean (SD) number of suicide attempts, ages 21-25
0.05 (0.33)
0.13 (0.64)
0.31 (1.16)
<.001 0.04 (0.30)
0.09 (0.47)
0.30 (1.14)
<.001 0.05 (0.32)
0.11 (0.62)
0.17 (0.88)
<.001
Pregnancy/parenthood/ partnership
% pregnant/got partner pregnant by age 20 10.6 25.8 32.0 <.001 11.4 18.1 32.9 <.001 9.5 19.2 33.8 <.001
% became a parent by age 20 3.7 12.5 20.2 <.001 4.3 7.8 20.0 <.001 3.6 8.6 21.6 <.001
Mean (SD) interpartner violence perpetration score age 24-252
1.55
(1.73)
2.22
(2.38)
3.20
(3.13)
<.001
1.40
(1.69)
2.13
(2.28)
3.01
(2.74)
<.001
1.60
(2.03)
1.96
(2.19)
3.07
(2.34)
<.001
Education/employment
% delayed reading (age 18) 17.2 22.3 28.4 <.05 16.2 19.1 33.1 <.001 13.0 21.1 39.4 <.001
% leaving school without qualifications 9.1 26.3 58.2 <.001 8.4 21.0 47.5 <.001 6.0 21.7 53.6 <.001
% university degree to age 25 34.8 14.6 2.1 <.001 33.5 23.4 5.7 <.001 39.2 20.7 7.3 <.001
Mean (SD) educational achievement rank
4.81 (2.11)
3.55 (2.15)
2.34 (1.79)
<.001 4.78(2.08)
3.97 (2.26)
2.93 (2.10)
<.001 5.03 (2.03)
3.93 (2.22)
2.75 (2.19)
<.001
Mean (SD) income age 25 ($000)
33.0 (21.4)
29.8 (19.2)
28.7 (18.2)
<.05 34.2 (21.4)
30.4 (20.4)
26.9 (16.7)
<.01 35.2 (23.0)
30.5 (19.3)
25.8 (16.8)
<.001
1 p-value based on test of linear trend; Mantel-Haenszel chi-square test for dichotomous measures; F-test from one-way ANOVA for continuous and count measures. 2 Number of participants restricted to only those being in partnerships during the period 24-25 years (n = 770)
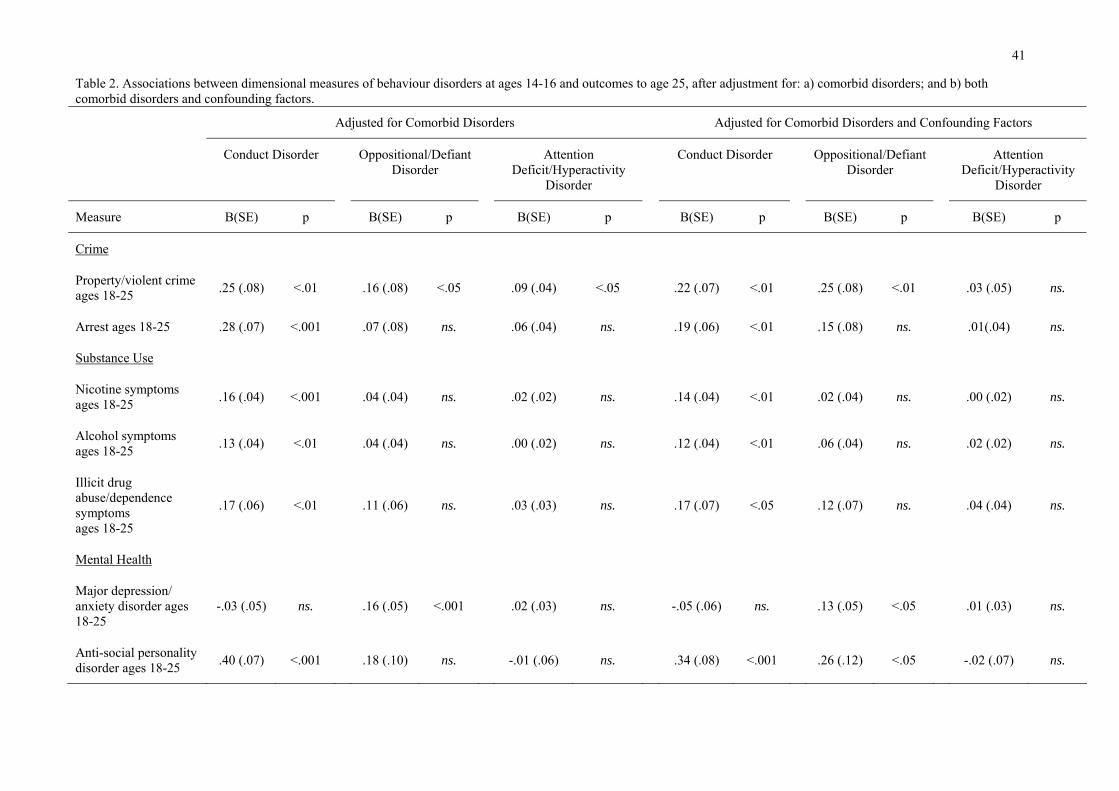
41
Table 2. Associations between dimensional measures of behaviour disorders at ages 14-16 and outcomes to age 25, after adjustment for: a) comorbid disorders; and b) both comorbid disorders and confounding factors.
Adjusted for Comorbid Disorders Adjusted for Comorbid Disorders and Confounding Factors
Conduct Disorder Oppositional/Defiant Disorder
Attention Deficit/Hyperactivity
Disorder
Conduct Disorder Oppositional/Defiant Disorder
Attention Deficit/Hyperactivity
Disorder
Measure B(SE) p B(SE) p B(SE) p B(SE) p B(SE) p B(SE) p
Crime
Property/violent crimeages 18-25 .25 (.08) <.01 .16 (.08) <.05 .09 (.04) <.05 .22 (.07) <.01 .25 (.08) <.01 .03 (.05) ns.
Arrest ages 18-25 .28 (.07) <.001 .07 (.08) ns. .06 (.04) ns. .19 (.06) <.01 .15 (.08) ns. .01(.04) ns.
Substance Use
Nicotine symptoms ages 18-25 .16 (.04) <.001 .04 (.04) ns. .02 (.02) ns. .14 (.04) <.01 .02 (.04) ns. .00 (.02) ns.
Alcohol symptoms ages 18-25 .13 (.04) <.01 .04 (.04) ns. .00 (.02) ns. .12 (.04) <.01 .06 (.04) ns. .02 (.02) ns.
Illicit drug abuse/dependence symptoms ages 18-25
.17 (.06) <.01 .11 (.06) ns. .03 (.03) ns. .17 (.07) <.05 .12 (.07) ns. .04 (.04) ns.
Mental Health
Major depression/ anxiety disorder ages 18-25
-.03 (.05) ns. .16 (.05) <.001 .02 (.03) ns. -.05 (.06) ns. .13 (.05) <.05 .01 (.03) ns.
Anti-social personality disorder ages 18-25 .40 (.07) <.001 .18 (.10) ns. -.01 (.06) ns. .34 (.08) <.001 .26 (.12) <.05 -.02 (.07) ns.

42
Adjusted for Comorbid Disorders Adjusted for Comorbid Disorders and Confounding Factors
Conduct Disorder Oppositional/Defiant Disorder
Attention Deficit/Hyperactivity
Disorder
Conduct Disorder Oppositional/Defiant Disorder
Attention Deficit/Hyperactivity
Disorder
Measure B(SE) p B(SE) p B(SE) p B(SE) p B(SE) p B(SE) p
Suicide attempts ages 18-25 .09 (.05) ns. .30 (.07) <.001 -.05 (.04) ns. -.03 (.06) ns. .22 (.07) <.01 -.04 (.04) ns.
Pregnancy/Parenthood/Partnership
Pregnant/got partner pregnant by age 20 .14 (.05) <.01 .09 (.06) ns. .07 (.03) <.05 .12 (.06) <.05 .03 (.06) ns. .07 (.03) ns.
Became a parent by age 20 .21 (.06) <.001 .10 (.08) ns. .07 (.04) ns. .18 (.08) <.05 .01 (.08) ns. .07 (.05) ns.
Inter-partner violence perpetration age 24-25 .06 (.03) <.05 .07 (.03) <.05 .02 (.02) ns. .06 (.03) <.05 .06 (.03) ns. .02 (.02) ns.
Education/employment
Delayed reading age 18 .00 (.06) ns. -.02 (.06) ns. .15 (.03) <.001 -.10 (.06) ns. -.06 (.06) ns. .15 (.03) <.001
Leaving school without qualifications .40 (.06) <.001 .01 (.06) ns. .16 (.03) <.001 .34 (.07) <.001 -.05 (.07) ns. .16 (.04) <.001
University degree by age 25 -.50 (.12) <.001 -.01 (.07) ns. -.16 (.04) <.001 -.31 (.12) <.05 .01 (.08) ns. -.15 (.04) <.01
Educational achievement rank -.10 (.01) <.001 .00 (.01) ns. -.04 (.01) <.001 -.06 (.01) <.001 .01 (.01) ns. -.03 (.01) <.001
Income at age 25 .33 (.49) ns. -.43 (.50) ns. -.83 (.28) <.001 .67 (.50) ns. .05 (.48) ns. -.65 (.20) <.01
43
Note: Statistically significant (p < .05) covariate factors for at least one outcome included: maternal age; maternal education level; family living standards ages 0-10; average family income ages 0-10; socio-economic status at birth; parental history of illicit drug use; parental history of criminal offending; exposure to childhood sexual abuse; exposure to physical punishment in childhood; depression/anxiety disorder ages 14-16; gender Note: Ns range from 770 to 995 in covariate adjusted analyses.

44
Figure 1: Distribution of proportion of variance explained estimates across all outcomes for different classifications of behavior disorder (continuous,
dichotomous) and outcomes.
N.B. Area within box indicates interquartile range (IQR); area within whiskers indicates the lowest datum still within 1.5 IQR of the lower quartile, and the
highest datum still within 1.5 IQR of the upper quartile; closed dots indicate extreme outliers ( > 3 IQR).
Copyright © 2022 FDOKUMEN