Classification by progressive generalization: a new automated methodology for remote sensing...
20
int. j. remote sensing, 1998 , vol. 19, no. 14 , 2685± 2704 Classi® cation by progressive generalization: a new automated methodology for remote sensing multichannel data J. CIHLAR² ¶, QINGHAN XIAO
-
Upload
independent -
Category
Documents
-
view
1 -
download
0
Transcript of Classification by progressive generalization: a new automated methodology for remote sensing...

int j remote sensing 1998 vol 19 no 14 2685plusmn 2704
Classireg cation by progressive generalization a new automated
methodology for remote sensing multichannel data
J CIHLARsup2 para QINGHAN XIAOsup3 J CHENsup2 J BEAUBIENsectK FUNGsup2 and R LATIFOVICsup3sup2 Canada Centre for Remote Sensing Ottawa Ontario K1A 0Y7 Canadasup3 Intermap Technologies Ottawa Ontario K2E 1A2 CanadasectCanadian Forest Service Sainte-Foy Quebec G1V 4C7 Canada
(Received 21 April 1997 in reg nal form 3 December 1997 )
Abstract A new procedure for digital image classireg cation is described Theprocedure labelled Classi reg cation by Progressive Generalization (CPG) wasdeveloped to avoid drawbacks associated with most supervised and unsupervisedclassireg cations Using lessons from visual image interpretation and map makingnon-recursive CPG aims to identify all signireg cant spectral clusters within thescene to be classireg ed The basic principles are (i ) initial data compression usingspectral and spatial techniques ( ii ) identireg cation of all potentially signireg cantspectral clusters in the scene to be classireg ed ( iii ) minimum distance classireg cationand (iv) the use of spectral spatial and large-scale pattern information in theprogressive merging of the increasingly dissimilar clusters The procedure wastested with high- (Landsat Thematic Mapper (TM)) and medium- (Advanced VeryHigh Resolution Radiometer (AVHRR) 1 km composites) resolution data It wasfound that the CPG yields classireg cation accuracies comparable to or better thancurrent unsupervised classireg cation methods is less sensitive to control parametersthan a commonly used unsupervised classireg er and works well with both TM andAVHRR data The CPG requires only three parameters to be specireg ed at theoutset all specifying sizes of clusters that can be neglected at certain stages in theprocess Although the procedure can be run automatically until the desirednumber of classes is reached it has been designed to provide information to theanalyst at the last stage so that reg nal cluster merging decisions can be made withthe analystrsquos input It is concluded that the strategy on which the CPG is basedprovides an e ective approach to the classireg cation of remote sensing data TheCPG also appears to have a considerable capacity for data compression
1 Introduction
Image classireg cation ie categorization of pixels based on their spectral (or other)characteristics is one of the fundamental analysis techniques for remotely senseddata with land cover mapping arguably being the most frequent application Basedon the tradition of surveys and mapping by means of aerial photography numericalimage classireg cation methods were developed when data became digital and calibratedand as computer power increased Currently used methods fall into two basiccategories supervised and unsupervised (Duda and Hart 1973 ) Even recent classi-reg cation strategies such as evidential reasoning (Peddle 1993 ) and neural networks(Benediktsson et al 1990) are forms of supervised classireg cation while classireg cationtrees (Hansen et al 1996 ) represent an unsupervised classireg cation procedure
paraE-mail josefcihlarccrs nrcangcca
Ntilde 1998 Government of Canada
J Cihlar et al2686
Supervised classireg cation assumes that the locations of some land cover classessurfaceconditions are accurately known so that they can be used to establish a patternthrough which other similar locations can be found In the case of unsupervisedclassireg cation no knowledge of surface conditions is assumed (apart from the statist-ical characteristics such as the probability distributions and not in all cases)Unsupervised classireg cation algorithms attempt to identify the naturalrsquo groupings inthe data under the constraints of the classireg cation process specireg ed by the analyst
If enough is known about the surface supervised classireg cation is likely to be thetool of choice because it permits e ective exploitation of the data contentUnfortunately enoughrsquo may be too demanding because the surface informationmust be su cient to decide a priori which parts of the spectral content are signireg cantand which should be ignored For example there may be spectral variations withincover type not all of which may be known in advance Although for limited areasit is possible to have su cient knowledge of ground conditions to make suchdecisions this becomes increasingly more di cult over larger areas (eg 100 km2 )because of the cost of reg eld data collection and other reasons Furthermore thespectral characteristics of a cover type are likely to change with distance as manysignature extension studies have concluded in the past Given the current interest inland cover classireg cation over large areas (eg Townshend et al 1994) the drawbacksof supervised classireg cation are evident
Since unsupervised classireg cation aims to identify all important spectral clusterswithout necessarily knowing at the outset which among them are thematicallysignireg cant this classireg cation procedure has an inherent advantage over supervisedclassireg cationETH that is one need not specify a priori the classes and their spectralexpression Another important feature is operator independence Given that the sameresult can be obtained for the same data set by various analysts or that consistentresults can be obtained by one analyst over di erent areas this method has inherentadvantage for scientireg c studies encompassing large areas andor periods of timeHowever unsupervised classireg cation also has disadvantages Since it strives for anoverall optimum spanning of the entire data set it may miss specireg c detailed butrelevant information Such loss would not occur in supervised classireg cation oncethe analyst knows of the existence of the classes of interest however small theymay be
Another important disadvantage of unsupervised classireg cation is the dependenceof the result on the parameters guiding the classireg cation process For exampleBryant (1978) reviewed the numerous choices an analyst must make in using unsuper-vised classireg cation pointing out the need to optimize the parameters for a givendata set through trials The limitations of clustering methods have been well recog-nized (Ball and Hall 1965 Duda and Hart 1973 VanderZee and Ehrlich 1995) Infact by a choice of the clustering parameters it may be possible to produce variousnumbers of clusters for the same data set ranging from one to the number of spectralvalue combinations present in the input data The spectral clusters should be themat-ically most meaningful at some intermediate number which is almost always higherthan the number of desired thematic classes but is not known a priori
An ideal classireg cation method should be accurate reproducible by others giventhe same input data (failing of supervised classireg cation) robust (not sensitive tosmall changes in the input data) yet able to exploit fully the information content ofthe data applicable uniformly over the whole domain of interest and objective (notdependent on the analystrsquos decisions) This paper describes a new classireg cation
Classireg cation by progressive generalization 2687
procedure that aims to satisfy as many of these criteria as possible The philosophybehind the approach is outlined in the next section followed by a description of thesteps in the classireg cation process The performance of the new method is assessedon various data sets and in comparison with a common unsupervised classireg cationalgorithm
2 Principles
In examining the possible approaches to digital classireg cation it is instructive toconsider visual image interpretation the most successful operational classireg cationmethodology to date Starting with an image (often enhanced to make the perceptionof colour di erences easy) an interpreter uses spectral (colour) and spatial (texturepattern shape context and other) clues to identify dominant classes in the image(Rabben 1960) He (or she) aims to detect the largest classes based on the arearepresented and the classireg cation legend will thus have no more than several dozenclasses In other words larger classes are `more importantrsquo He then identireg es otherclasses to make sure all the relevant conditions are captured by the analysisFurthermore the reg nal map will not contain very small individual areas because ofthe accepted practice both in reg eld mapping and in cartography of a minimummapping unit or equivalently the largest contiguous area of any class to be ignoredas a separate spatial entity in the reg nal product The strategies of reg nding the largestclusters using spectral as well as spatial measures and merging classes which arespatially highly interspersed can be usefully employed in digital analysis as well
It should be noted that a human interpreter does not use the spectral informationas thoroughly as a computer While humans perceive colour di erences very wellthey can distinguish only a relatively limited number of radiometric levels (eg Cihlarand Protz 1972) The success of the visual image interpretation is primarily due tothe importance of spatial clues such as shape texture pattern shadows heightcontext etc However these spatial clues have di erent meanings and importance asthe sensor resolution and area coverage change For example coarse resolution dataimaging large areas have texture and some broad pattern information but beyondthat the major clues are spectroradiometric In such cases digital classireg cation shouldoutperform visual analysis especially if texture and pattern can be quantireg ed throughcomputer calculations
One example of a successful combination of visual and digital analysis has beenproduced in recent years (Beaubien 1994 Beaubien et al 1997 1998 ) The essenceof Beaubienrsquos methodology is visual identireg cation of important colours (regarded astraining areasrsquo) in an image which had been computer enhanced in a standardizedmanner This identireg cation is made more reproducible and consistent by a customizedtransformation in which specireg c colours represent distinct known cover types (typic-ally needleleaf and broadleaf forest and bare ground ) The second mechanism forincreasing the consistency of the choice of training areas is the simplireg cation of thespectral space the original spectral channels are quantized to retain a limited numberof possible colour combinations typically lt 1024 without losing signireg cant informa-tion (as judged by visual examination of the original and quantized data) Pixelsrepresentative of individual colourstraining areas are selected in the quantized imagebased on visual analysis and the analystrsquos judgement one or more pixels (adjacentor not) may be selected to represent a colourcreate a training area The quantizedimage is thus treated as a classireg cation with a very large number of classes and thesubsequent steps are designed to identify the key spectral classes which account for
J Cihlar et al2688
most of the imaged area This methodology was proven to be signireg cantly morepowerful than a standard supervised classireg cation because it allows the selection ofall the training areas which are important for the scene of interest and the objectivesof the classireg cation (Beaubien et al 1997 1998 ) The principal disadvantage of thismethodology is operator dependence albeit more limited that in a supervised classi-reg cation in the selection of areas for radiometric normalization and in selecting pixelsto represent individual colourstraining areas
The crux of the spectral classireg cation problem is to determine the location andsize of the clusters in multi-dimensional spectral space or for simplicity their meansand standard deviations in each of the input data channels This is the major challengein using the unsupervised classireg cation method which would otherwise be the preferredmethod for applications where ground data are unavailable or limited (except for caseswhere subtle distinctions are important) The method development discussed belowthus includes an objective way of identifying meaningful and spectrally representativecluster centroids in both number and location in the spectral space
The procedure developed in this study is based on the following assumptions
1 In classifying an image one should consider all the spectral combinations inthe input data ( clustersrsquo) as entities and using appropriate criteria combinethese to reg t the desired classireg cation legend
2 Larger spectral clusters in the data set are more important Small clusters donot `matterrsquo ie they will not be retained in the reg nal classireg cation regardlessof their spectral uniqueness
3 Histogram quantization helps identify signireg cant spectral clustersregions inthe data set without loss of signireg cant information
4 Adequate seed clusters can be established by combining small pure spectrallyadjacent clusters (ie by spectrally broadening the cluster in the spectral space)
5 Two clusters should be combined if they are close together spatially andorspectrally which of these measures are used and how should depend on thenumber of clusters remaining
6 By allowing only cluster merging and by limiting the number of clustersthrough the minimum size of cluster that can be ignored (smallest number ofpixels) one avoids important disadvantages of the unsupervised classireg cationie how many clusters should be retained and when to split or to merge clusters
7 Since classireg cation is a human construct it is not generally feasible to devisea fully automated computer algorithm and the process must allow for humanjudgement to inmacr uenceconreg rm the reg nal results
The procedure developed on the basis of these assumptions has been dubbedClassireg cation by Progressive Generalization or CPG Using a combination of imageenhancement unsupervised classireg cation and visual analysis CPG aims to identifyall potentially signireg cant spectral clusters in the data and to group these until areasonable number of thematically meaningful clusters is obtained for labelling Thenew procedure has the following features
(i ) Use of histogram quantization to reduce the maximum possible number ofspectral clusters
( ii ) Use of spatial reg ltering to identify spatially dominant spectral clusters(iii ) Use of the largest pure clusters (ie one level in each of the quantized input
channels) as seed clusters
Classireg cation by progressive generalization 2689
(iv) Use of progressive decrease of radiometric resolution to merge (thus redu-cing the number of ) initially small clusters to be used as additional seedclusters
(v) Use of the minimum pixel-to-cluster centroid distance to assign pixelsto clusters
(vi ) Use of a combination of spectral and spatial cluster measures to aid clustermerging decisions
(vii ) No interference with the cluster merging process until the large-scale pat-terns become important (the penultimate step ie the procedure is auto-matic until that step)
(viii ) No need for ground information until the reg nal step ( labelling of clusters)
3 CPG procedure
In principle the CPG procedure is very simple reg nd means for representativespectral clusters in the data set assign every pixel to a cluster and combine similarclusters until the remaining clusters can be assigned thematic labels
The procedure consists of the following steps ( reg gure 1)
Figure 1 Flowchart of the CPG steps
J Cihlar et al2690
Step 1 Contrast stretch The range of values in each input channel is stretched toencompass the entire range of values permissible (typically 8 bits)
Step 2 Quantization This step reduces the number of grey levels in each inputchannel The number of retained grey levels is as low as possible without losingsignireg cant information In practice this can be derived by decreasing the number oflevels until a visually observable di erence appears in a side-by-side comparisonwith the original contrast-stretched data For example we have found that for borealenvironments ten or eleven levels are su cient to capture the information containedin Landsat Thematic Mapper (TM) data (Beaubien et al 1997 1998 ) As a safetymargin a larger number of levels can be used than is implied by the visual assessmentThe number of levels varies with the spectral band and scene type less with sensortype After the quantization each unique combination of the spectral values repres-ents a pure spectral cluster with only one possible digital level in each input channel
Step 3 Spatial image reg ltering The purpose of this step is to identify spatiallydominant spectral clusters in the scene based on the number as well as the spatialarrangement of the pixels from various clusters In principle a smaller cluster couldbe distributed in such a way that it becomes spatially dominant over a larger butmore compact one Mode reg ltering is used typically within a 5 Ouml 5 or 7 Ouml 7 windowThis reg lter reg nds the most abundant cluster within the window and places it in thecentre pixel
Step 4 Identireg cation of large seed clusters Large clusters are considered to be allthose containing more than a pre-dereg ned minimum fraction of all pixels (MinLSC=Minimum Large Seed Cluster) to be classireg ed For example 0 1 can be used as aconservative value assuming that no single spectral value could form the basis of athematic class unless it had at least 0 001 pixels to start with MinLSC should besmaller than the minimum mapping unit After Step 3 the size of all clusters isdetermined They are then sorted in decreasing size and the large seed clusters areidentireg ed as those larger than MinLSC their number is not otherwise restricted
Step 5 Merge medium-sized pure clusters It is possible that the large seed clustersmay not contain all the thematically relevant classes (or subclasses) For examplewhen many di erent values of pixels (and therefore many clusters of similar size) arepresent the large clusters might represent only a portion of the spectral space Forthis reason CPG provides for the creation of additional seed clusters using medium-sized pure clusters as input Medium-sized clusters are those containing betweenMaxNC and MinLSC pixels where MaxNC (=Maximum Neglected Cluster) is thenumber of pixels in the largest cluster to be neglected in identifying seed clusters(eg 0 002 as a conservative value) However the medium-sized clusters are com-bined before being considered for candidate seed clusters ie their radiometricresolution is further reduced The rule is simple the smallest remaining cluster aboveMaxNC is added to the closest and largest medium-sized medium cluster whichdi ers by only one quantized level in one spectral dimension Since this operationis performed iteratively and sequentially for each spectral dimension the pixelseventually combined in such a seed cluster could di er by as many quantized levelsas twice the number of input channels Note that the order of spectral dimensionsin the merging operation matters so the sequence should start with the channel thatoverall o ers the least amount of important information All pixels merged into oneseed cluster are given the same label Once this process is completed only combined
Classireg cation by progressive generalization 2691
clusters which contain more than MinLSC pixels are selected to be seed clustersPure clusters smaller than MaxNC are ignored in constructing the seed clusters
Steps 1plusmn 5 yield a set of seed clusters with the quantization and reg ltering (Steps2 3) used as aids in this process Steps 6plusmn 10 are based on the original full-resolution data
Step 6 Classireg cation Using seed clusters from Steps 4 and 5 above the means arecomputed for each cluster using the original input channels from Step 1 All pixelsin the image are assigned to one of the seed clusters based on the minimum Euclideandistance This algorithm is used because of its conceptual simplicity and computa-tional speed Note that the number of resulting clusters could be less than the numberof seed clusters depending on the distribution of the large and medium seed clustersin the spectral space
Step 7 Merging clusters using spectral similarity The spectral similarity SS ij iscomputed between all pairwise combinations of the clusters from Step 6 SS ij isdereg ned as
SS ij=S ij + S ji
SD ij(1 )
S ij=
n
k=1(cosijk S ik )
n
k=1cosijk
(2 )
cosijk=|M ik Otilde M jk |
SD ij(3 )
SD ij=A n
k=1(M ik Otilde M jk)
2B12
(4 )
where i THORN j and M =arithmetic cluster mean S ij= standard deviation of cluster i inthe direction of the cluster j centroid S ik= standard deviation of cluster i in spectralchannel k SD = spectral distance between clusters cos=cosine of the angle betweenclusters i j =cluster number k = spectral channel and n = total number of spectralchannels
SS ij is thus computed as the sum of the standard deviations of the two clustersi j along the vector (of length SD ij ) connecting the centroids of the two clusters( reg gure 2) It is a measure of the spectral proximity of the two clusters both in termsof their mean values and at the margins Equations (1)plusmn (4 ) are based on the simpleconcept that clusters which overlap in the spectral space should be combined reg rstbefore non-overlapping clusters are considered for merging
All the clusters from Step 6 are sorted according to decreasing size Starting withthe smallest cluster i the cluster j which has the lowest SD ij is found Next allclusters r with SD ir lt 1acute1SD ij are found Cluster i is then identireg ed to be merged withcluster p provided that SS ipgtSS iq for p qtimesr That is if several clusters have a similardistance in the multispectral space to i the one spectrally closest overall is mergedin preference to those that are more distant Note that the size of the larger clusteris not changed at this stage This process continues until the smallest remainingcluster contains MinCM pixels where MinCM is the Minimum Cluster size for
J Cihlar et al2692
Figure 2 The parameters considered in Step 7 (automatic merging of clusters) The initialchoice is based on SD If several clusters have similar SD values the standard deviationS of the smaller cluster in the direction of the larger one (and vice versa) are alsoconsidered See text for detailed explanation
Merging Then the identireg ed candidates are merged and assigned to the identireg edclusters p (or j )
Step 8 Identifying candidates for merging using spectral and spatial similarity Themeans standard deviations SD ij and SS ij are recomputed for clusters resulting fromStep 7 In addition spatial adjacency SA ij is computed as a measure of the intermixingof pixels from clusters i and j The assumption is made that two clusters that aremutually highly interspersed should be combined in preference to clusters that arespatially distinct or clumped The spatial adjacency is dereg ned as
SA ij=NA ij
Min(NPi NPj )(5 )
where NA ij=number of cases where pairs of pixels from clusters i and j are adjacent(including diagonals) in a 3 Ouml 3 window and NP =number of pixels in the cluster
NA ij is computed by counting for each pixel in cluster i the number of instanceswhen a pixel from cluster j is adjacent ( located within a 3 Ouml 3 window centred onthe pixel i ) The denominator represents the smaller cluster because the goal of thisstep is to facilitate merging smaller clusters with the larger ones
Step 9 Merge clusters using spectral spatial and pattern similarity The values ofSD ij and SA ij from Step 8 together with the cluster size provide the informationneeded to decide on further cluster merging Although such merging could also beaccomplished by automated decision rules such an approach might produce undesir-able results This is because the distinctions retained in the reg nal classireg cation do notnecessarily correspond to the magnitude of the spectral and spatial di erences among
Classireg cation by progressive generalization 2693
the clusters Therefore the computer only suggests the clusters to be merged andthe decision is left to the analyst as follows
For clusters from Step 8 the cluster pair i j which has the lowest SD ij is foundNext all clusters r with SD ir lt 1acute1SD ij are found Cluster i is then identireg ed to bemerged with cluster p provided that SA ip gt SA iq for p qtimesr That is if several clustersare spectrally similar to i the one closest spatially overall is merged in preference tothose that are spatially separate The identities of clusters i and j (or p) their sizesSD ij and SA ij are provided as inputs to the analyst This search for candidate pairsfor merging is repeated as long as desired nominally until the number of remainingclusters (not identireg ed for further merging) equals the number of classes in theclassireg cation legend
The pairs of clusters suggested for merging are then reviewed on the computerscreen after displaying them in contrasting colours Besides SD and SA values thesimilarity of patterns of the two clusters over the entire classireg ed area is consideredThe proposed merge is accepted only if in the judgement of the analyst the twopatterns are very similar in both spatial extent and in local pixel density variationsThe rationale is that if the two clusters follow each other that closely they shouldbe combined even if they are less spectrally similar than clusters combined earlier(Step 7) No knowledge of ground conditions is required for this decision becausethe decision is based on a visual assessment of the similarity between two patternsHowever it is possible that the analyst may have other independent informationwhich may lead him to override the proposed merging The primary reason for usingvisual assessment is that a comparison of the two patterns over larger distances inthe image is not feasible with current computer technology especially for areas ofsome size and an appreciable number of clusters
Step 10 Labelling Knowledge of surface conditions is required to put thematic classlabels on the clusters from Step 9 This is no di erent from using other unsupervisedclassireg cation methods Means and standard deviations computed for the reg nal clusterscan e ectively aid the labelling process provided spectral characteristics of variousexpected classes are known Another very e ective aid consists of displaying theresulting clusters using their mean values in selected spectral channels The selectionis based on the ease of visual interpretation or the familiarity of the analyst withthat particular presentation of the data
4 CPG evaluation
We have evaluated the performance of the CPG methodology in several ways
1 assessment of the Advanced Very High Resolution Radiometer (AVHRR)classireg cation accuracy using classireg cation derived from Landsat ThematicMapper (TM) data as the surface truthrsquo
2 assessment of the sensitivity of the classireg cation results to the control para-meters including a comparison with the ISOCLASS method
3 applicability to data from various sources by using AVHRR and TM inputdata
In all the CPG tests below which are based on AVHRR data we used four channels(AVHRR channels 1 (C1) and 2 (C2) normalized di erence vegetation index NDVI(Nm ) and area under the NDVI curve (Na )) representing the growing season means(the reg rst three parameters) or totals (Na ) These measures are similar to those used
J Cihlar et al2694
by DeFries et al (1995) but di er in the dereg nitions mainly to avoid the periodswith snow on the ground The data were based on 10-day composites assembledover the 1993 growing season AVHRR channels 1 and 2 were corrected for atmo-spheric and bidirectional e ects and the NDVI was corrected for solar zenith anglee ects More detail on these corrections is provided by Cihlar et al (1997 b) andCihlar et al (1997 c) The length of growing season was established using AVHRRchannel 4 data corrected for atmospheric and surface emissivity e ects as the periodduring which surface temperature was above 10 szlig C Since a water mask was used toeliminate water bodies from the AVHRR classireg cation process (the original compositeimages contain many cloud-contaminated pixels over water) only land pixels wereused in the tests involving AVHRR data
41 Classireg cation accuracyThe assessment of the accuracy of the CPG was performed using the 1993
AVHRR data over Ontario and Quebec (NW corner at Otilde 77 szlig 58 frac34 57 5 sup2 50 szlig 57 frac34 31 2 sup2 SE corner at Otilde 73 szlig 29 frac34 24 3 sup2 45 szlig 12 frac34 34 3 sup2 ) presented in the Lambert Conformal Conicprojection The control parameters used were MinLSC=0 1 MaxNC=0 002MinCM=0 5 This procedure resulted in 81 spectral clusters
The accuracy assessment was carried out using TM-derived classireg cation overthe Matagami Quebec This classireg cation was prepared using an image from20 August 1991 (Royer et al 1994 ) no signireg cant changes in land cover occurredin the area between 1991 and 1993 Supervised classireg cation was used together withsubstantial site information obtained from air photographs and limited reg eld observa-tions (including aircraft overmacr ights) The procedure has been used extensively insimilar environments in di erent parts of Quebec and has been shown to produceaccurate results from the thematic classes employed (Beaubien 1994 )
The AVHRR and TM data sets were co-registered as follows Using groundcontrol points the classireg ed TM image was registered to the same map projectionas the AVHRR Next the AVHRR classireg cation was re-sampled to the TM pixelspacing using nearest neighbour re-sampling algorithm The 81 AVHRR clusterswere labelled on the basis of the highest correspondence with TM-derived classesThis approach avoids the potential optimistic bias in accuracy assessment (Hammondand Verbyla 1996 ) although conservative bias underestimating the actual accuracy(eg due to image mis-registration and errors in reference data (Verbyla andHammond 1995)) is di cult to avoid because it is embedded in the TM classireg cationCihlar et al (1996) provide more information on the classireg ed TM data set used
Table 1 shows the confusion matrix for the two data sets for all land pixels Itshows that only the most ubiquitous coniferous class was estimated with goodaccuracy The accuracy for the remaining classes was quite poor and the diagonalaccuracy DiAc (see equation (7)) was also low with only 51 of pixels correctlyidentireg ed relative to the TM classireg cation
AVHRR classireg cation accuracy is inmacr uenced by the mixed land cover in mostAVHRR pixels (Penner 1995 Cihlar et al 1996) The accuracy tests were thusrepeated by considering only AVHRR pixels with more than a threshold percentageof TM pixels from one cover type As the AVHRR pixels become more homogeneousthe classireg cation accuracy increases correspondingly (table 2) Cihlar et al (1997 a)obtained similar results with CPG for the southern and northern BOREAS studyareas with diagonal accuracies of 84plusmn 89 for pixel purities above 80
Tables 1 and 2 show that if the AVHRR pixels are relatively homogeneous the
Classireg cation by progressive generalization 2695
Table 1 Confusion matrix for AVHRR (rows) and TM (columns) for the Matagami testsite
TM TM TM TM TM TM TM
AVHRR Conifers 1 Decid 2 Mixed 3 Disturb 4 Fen 5 Water 6 Regen 71 83acute6 50 3 60 7 17 0 47 4 71 6 24 52 0 0 0 0 0 0 03 1 4 3 9 7acute9 0 5 1 2 0 9 2 14 0 1 0 0 0 1 4acute6 0 2 0 0 0 85 6 7 4 0 4 1 35 9 30acute3 6 6 13 66 0 1 0 2 0 1 0 0 0 1 10acute3 0 07 8 2 41 6 27 1 42 0 20 8 10 6 59acute0
Note the classireg cation accuracies were computed using equations (6 ) and (7) Theoriginal 20 classes were grouped into seven 1=coniferous (including density classes gt6040plusmn 60 25plusmn 40) 2=deciduous (density gt40 with or without coniferous understorey) 3=mixed (gt55 coniferous gt55 deciduous) 4=disturbed (recent cuts recent cuts moreor less covered by vegetation) 5= fen (wetland with 10plusmn 25 conifers wetland with lt10conifers grass-dominated wetland) 6=water (note that pixel assignment to water in theAVHRR classireg cation was based on the US Department of Commerce (1977) database) 7=regeneration (various stages after disturbances)
Table 2 CPG accuracy at various pixel purity thresholds for the Matagami test site DiAc
and Khat were computed using equations (6 ) plusmn (8 )
Purity threshold () DiAc () Khat (unitless)
None 51 1 0 30450 56 8 0 37160 63 9 0 45680 80 1 0 704
CPG accuracy can be high The values in tables 1 and 2 are also similar to thoseachieved for several areas in Canada using AVHRR data and the unsupervisedclassireg er ISOCLASS (Cihlar et al 1996)
42 Sensitivity to control parametersIdeally the reg nal results should be completely independent of the parameters
guiding the classireg cation process The sensitivity of the results to the (usually arbitrar-ily chosen) control parameter is of critical importance The sensitivity can be low ifthe classes are spectrally distinct but in practice many classes overlap and the resultscan thus depend strongly on the controlling parameters The requirement is thenthat these parameters be few and their impact on the reg nal classireg cation results beminimal
To perform an assessment of the CPG sensitivity we used AVHRR data for anarea in Ontario and Quebec (NW corner at Otilde 77 szlig 58 frac34 57 5 sup2 50 szlig 57 frac34 31 2 sup2 and SEcorner at Otilde 73 szlig 29 frac34 24 3 sup2 45 szlig 12 frac34 34 3 sup2 ) The CPG method was applied with variouscombinations of the control parameters (Steps 4 5 7) The accuracy tests used CPGclusters after Step 7 this was done to eliminate the analystrsquos inmacr uence which entersin Step 9 In all the tests the spectral clusters resulting from each classireg cation werelabelled as belonging to a land cover class specireg ed in a reference classireg cation The
J Cihlar et al2696
labelling was based on the largest overlap between the CPG cluster and the landcover class in the reference classireg cation
An independent classireg cation was used to test the sensitivity of the CPG tocontrol parameters and to allow comparisons of CPG (and of ISOCLASS asdiscussed below) The reference classireg cation was produced from a similar AVHRRdata set (1993 growing season channels 1 2 NDVI for Canada) This classireg cationwas prepared using an interactive procedure named the Enhancement-Classireg cationMethod (ECM Beaubien 1994 Beaubien et al 1997 1998) and labelled based on avisual comparison with about 100 Landsat scenes When tested against Landsatclassireg cation the absolute accuracy of the ECM classireg cation was found similar tothat of the CPG (Beaubien et al 1997) It should be noted that the absolute accuracyof the reference classireg cation is less important since only relative changes are ofinterest here The accuracies were computed as follows
DiAc (i i ) =100
q
i=jP ( test) i
P (ECM ) i(6 )
where P ( test) i is the number of 1 km pixels in the test classireg cation labelled as classi ( ie column total ) in the CPG or ISOCLASS classireg cation P (ECM ) i is the numberof 1 km pixels in the reference classireg cation labelled as class i and j to q are thespectral clusters in the test classireg cation labelled as class i
DiAc thus measures the proportion of ground cover that was positively identireg edrsquoas that cover in the test classireg cation assuming that the reference classireg cation iscorrect The overall classireg cation accuracy for a given data set is then computed as
DiAc =100
n
i=jP (i i )
NP(7 )
where P (i i ) is the diagonal entry in the confusion matrix (number of pixels) and NP
is the total number of pixels in the matrix DiAc is thus the most stringent measurecounting only positive matches as correctly classireg ed
The Khat distance was also computed for each confusion matrix (Congalton1991) as follows
Khat =N
r
i=1x ii Otilde
r
i=1(x i x+i)
N2 Otilde
r
i=1(x i+ x+i)
(8 )
where x ii is the total number of pixels in row i column i N is the total number ofpixels r is the number of rows (columns) and x i+ and x+i are row and column totalsrespectively
As seen from equation (8) Khat measures the dispersion outside of the diagonalin the confusion matrix in relation to the concentration along the diagonal axis Fora perfect classireg cation Khat =1 0
Table 3 shows the results of the tests for various combinations of control para-meters CL COR is dereg ned as the proportion of CPG clusters in which gt67 of thepixels corresponded to only one reference class PICOR represents the percentage ofthe pixels in CL COR clusters relative to all land pixels in the image Considering
Classireg cation by progressive generalization 2697
Table 3 Sensitivity of the CPG to control parameters
CPG test Parameters DiAc () Khat CLCOR () PICOR (gt67)
1 0 10 1 76 6 0 743 68 9 57 72 0 050 1 78 9 0 768 75 2 64 23 0 050 5 76 8 0 746 71 7 58 74 0 10 5 72 6 0 700 61 7 51 75 0 20 5 71 7 0 689 60 3 48 76 0 40 5 65 1 0 613 45 4 29 1
Parameters values xy refer to threshold values (in per cent of the number of land pixels)of MinLSC used in Steps 45 and Step 7 of the CPG MaxNC was 0 002 in all casesDiAc and Khat were computed using equations (6 ) plusmn (8 )
CL COR indicates the proportion of CPG clusters in which gt67 of the pixels corre-sponded to only one reference cover type
PICOR is the percentage of pixels in CL COR clusters relative to all land pixels
the MinLSC=0 1 combination as the baseline ( test 1) it is evident that changesin control parameters had relatively small e ect on the results Changing the seedcluster threshold (Steps 4 5) by a factor of four (tests 2 5 6) changed the accuracyby lt5 absolute and that Khat by lt0 08 and much smaller changes occurred fora narrower range (tests 1 2 and 4 5) Changes in MaxNC had a minimal e ect onDiAc and Khat (compare tests 2 and 3) CL COR and PICOR generally mirroredDiAc and Khat but were more pronounced The proportion of well matched clusterschanged by up to 15 2 and PICOR by up to 15 5 due to variations in the seedcluster thresholds Step 7 threshold had somewhat stronger e ect here as well areg vefold change leading to a change in CL COR (PICOR ) of 3 5 (5 5) Consideringthe extreme combinations (tests 2 versus 5) the parameters changed by a factor of40 while the DiAc decreased by 17 5 Overall it is evident that CPG is able totolerate an appreciable range of control variables
The sensitivity of CPG was also assessed in comparison to that of ISOCLASS(Tou and Gonzales 1974) a commonly used unsupervised classireg cation algorithmThe same Ontario plusmn Quebec data as for the above CPG tests (table 1) were usedISOCLASS requires reg ve parameters to be specireg ed (Loveland et al 1991) and onlysome combinations were tested here (table 4) Tests 1 plusmn 4 are variations on the com-bination employed by Cihlar et al (1996) while test 5 is the combination used by
Table 4 Sensitivity of ISOCLASS to control parameters
Larger PICOR
ISOCLASS DiAc () CL COR All CL COR (gt67)test Parameters Khat () () ()
1 81123 24 5250 72 2 0 695 56 3 58 8 48 92 81121 64 5250 72 2 0 695 54 3 59 3 48 93 81123 22 3250 69 2 0 661 45 46 3 40 34 40123 24 5250 60 9 0 653 40 45 32 55 70152 63 530 67 2 0 640 44 3 52 9 40 8
Values abcde represent a=maximum number of clusters b =maximum number ofiterations c =cluster-combining distance d = cluster splitting distance e=minimum numberof pixels in a cluster
Other measurements are as described in table 3
J Cihlar et al2698
Loveland et al (1991) for classifying NDVI monthly composites over North AmericaAn additional accuracy measure has been introduced to remacr ect the fact that somereg nal clusters had very few pixels and were therefore clearly noise etc thus thedistinction between larger CL COR rsquo and all CL COR rsquo clusters In all cases the resultshave been compared with the reference classireg cation using the same approach asfor the CPG
Results of the comparisons show that in most cases the performance ofISOCLASS was signireg cantly more sensitive to the degree of change of the controlparameters than the CPG The results were not sensitive to changes in the ISOCLASScluster combining distance but responded substantially to reduced cluster splittingdistance (tests 1 versus 3 ) They were highly sensitive to the maximum number ofclusters (tests 1 versus 4) when all the accuracy measures decreased Comparing thevarious tests to test 1 it is evident that change in the control parameters by a factorof two resulted in reducing the ISOCLASS accuracy by 0plusmn 15 7 depending on theparameter involved
43 RobustnessThe CPG was initially developed for large-area applications with AVHRR data
as the primary data source However the principles should apply to other data aswell A detailed assessment of the CPG performance should be carried out using thereference data set with 100 accuracy which does not su er from the mixed-pixelsproblem in the way AVHRR data do High-resolution satellite image data wouldthus be appropriate for this purpose Unfortunately most classireg cations of such dataare erroneous to various degrees and cannot thus be used as a rigorous standardConsequently we are left with an imperfect but plausible testETH does the classireg edimage retain most or all of the information visible in the input data
A trial classireg cation was therefore carried out for TM data of part of the BOREASNorthern Study Area (scene centre at Otilde 99 szlig 34 frac34 8 8 sup2 55 szlig 53 frac34 35 5 sup2 with 58 5 km in EWand 49 5 km in SN directions) TM channels 3 4 and 5 were employed and noradiometric corrections were made to the data As before the procedure was carriedout automatically with the following control variables MinLSC=0 3 MaxNC=0 002 This reduced the 2679 clusters (after Step 2) to 71 The TM image wasre-created from the CPG classireg cation by replacing each of the 71 clusters with thecluster mean in each spectral channel The re-created three-channel image was thenvisually compared with the original TM image (prior to quantization) Only onesubstantial di erence could be found between the two images namely bright barerock and gravel road (covered with locally dug material ) were combined into onecluster Figure 3 shows a part of the two images in which a noticeable di erenceoccurred along the road The small di erence between the original and the classireg edTM data accompanied by a reduction of the number of clusters from 2679 to 71shows that the CPG is an e ective classireg cation procedure
5 Discussion
51 Comparison with supervised and unsupervised classi reg cationsCompared to supervised classireg cation the CPG has the advantages of an unsu-
pervised classireg cation ie it does not require knowledge of surface conditions andthematic classes involved until the labelling step (Step 10) This is important forclassireg cations over areas greater than the analystrsquos personal knowledge encompassesBecause of the potentially changing signatures with distance the analyst would need
Classireg cation by progressive generalization 2699
(a) (b)
Figure 3 Comparison of the original and classireg ed TM data for part of the BOREASNorthern Study Area west of Thompson Manitoba Canada (a) Original TM image( band 5=red 4=green 3=blue) (b) Classi reg ed image into 71 clusters each clusterdisplayed using mean values derived from the original image
to know the distribution of all classes across most of the area of interest at least assamples for each class When the area is su ciently small this knowledge can beobtained with conreg dence but the task becomes di cult for larger (eg gt100 km) orunfamiliar areas and impossible at the continental scale Importantly with a fairlylow sensitivity to only three control parameters CPG is much less subject to theanalystrsquos inmacr uence than supervised classireg cation
In comparison to the various unsupervised classireg cation algorithms CPG doesnot require prior knowledge of the number of distinct spectral clusters (which istypically higher than the number of desired thematic classes) This is a fundamentaladvantage because the number of distinct clusters is very di cult to know for aspecireg c data set and because classireg cation results are sensitive to it (table 4) Whenclouds are present some of the distinct clusters are mixtures of surface and cloudsignatures and the number of clusters may thus be highly variable even for the samearea The choice of the number of clusters for a particular unsupervised classireg cationtask thus becomes arbitrary although statistically optimal numbers can be dereg nedthrough trial runs (eg Masselli et al 1996) A high number of clusters is notnecessarily advantageous (Loveland 1996 personal communication) because thesmaller clusters may be thematically meaningless CPG avoids these problems byreg nding the maximum number of natural clusters in the initial data set
Since the CPG needs fewer control parameters than a typical unsupervisedclassireg er it introduces less analyst bias On the other hand it allows the analyst toinmacr uence the classireg cation process in the last stage when small spectral or spatialdi erences may be thematically signireg cant A comparison with ISOCLASS (tables 3and 4) shows the CPG accuracies to be higher and overall less sensitive to variationsin the control parameters consistently with the above expectations The varioustests albeit limited thus indicate the overall accuracies achieved are comparable orsuperior to other present unsupervised classireg cation methods
While unsupervised classireg ers typically employ only spectral information CPG
J Cihlar et al2700
uses a combination of spectral and spatial measures This is preferable because notall the relevant information is in the spectral domain It is also consistent with therich history of photointerpretation where spatial clues are very important (Rabben1960) The same logic applies to involving the analyst in the last cluster mergingphase (Step 9) Strictly speaking the results of Step 8 (suggested merging of clusters)could be applied automatically However the present measures of spatial adjacencyare inadequate to capture the similarity of patterns at various spatial scales Thespatial adjacency (equation (5)) quantireg es the relation only for the immediate neigh-bourhood of the cluster Although a larger window could be used it would remaina reg xed-size one while the di erences in spatial patterns can occur at di erent spatialscales for various clusters At present the human eyeplusmn brain combination is moste cient at evaluating these di erences The subjectivity of the analystrsquos inmacr uence isminimized in CPG by accepting or rejecting choices for pairwise grouping proposedby the algorithm The recommendation of the algorithm can be overridden by theanalyst but presumably only in cases where it improves the reg nal result
Unlike some unsupervised classireg ers CPG is not recursive This is an advantagebecause at every step a qualitatively di erent process takes place and its results canbe analysed and assessed Furthermore di erent characteristics of the data space areexploited so that the maximum possible information is extracted before the subjectiveelement enters the process While a safersquo number of iterations in a recursive classireg ca-tion can be readily dereg ned as `manyrsquo it is more di cult to specify a minimum requirednumber of iterations usually preliminary data runs are needed to reg nd it for a part-icular data set CPG avoids the need to pre-determine the number of iterations Atthe same time it can be implemented as a continuous process in which the threeparameters are specireg ed at the outset and the program halts at the end of Step 8
52 CPG performanceComparisons of CPG results for AVHRR and TM data sets described above
indicate that the method e ectively reduces the dimensionality of the original datayet retains the signireg cant spectral information The tests indicate that the CPGprocedure meets many of the requirements for an ideal classireg cation algorithm statedat the outset provided that the desired classes can be identireg ed primarily usingradiometric information The CPG result resembles the original image especiallywhen the classes are colour coded appropriately (eg reg gure 3 (b)) They do not havea salt-and-pepper appearance indicating noise in the classireg cation as results ofunsupervised classireg cations tend to have This is because by design the classes arebased on generalizations of the digital levels in the original images to retain most ofthe original pixel information
Ideally a classireg cation scheme would be completely independent of the analystrsquosinmacr uence and would yield results with 100 accuracy These are fairly contradictoryrequirements and thus to achieve high accuracy some guidance to the classireg er isclearly necessary CPG requires only one type of information at the various stagespreceding the labelling step namely the smallest spectral cluster that should beignored This is probably the minimum that must be specireg ed in a digital classireg cationprocess otherwise the classireg cation is not likely to produce practical results It isalso consistent with the minimum mapping unit concept
Since CPG is designed to detect the larger spectral clusters it may suppress smallbut signireg cant ones For example urban areas (AVHRR) or roads (TM) may disap-pear in the clustering process Similarly classes of interest that are spectrally similar
Classireg cation by progressive generalization 2701
to others may be grouped If any of these are important they can be identireg edthrough post-classireg cation steps eg by splitting clusters or using supervised classireg er(applied to the original data) for these classes
The algorithm used in the quantization process (Step 2) inmacr uences the results ofthe clustering especially for the large seed clusters Various options exist eg quant-ization of the original image quantization of an equalized image etc For exampleequalized quantization provides higher resolution in spectrally similar areas whiledirectrsquo quantization is preferable when small clusters (in the wings of the histograms)are likely to be important The decision regarding the type of quantization procedurecan be made from these considerations from prior experience or based on theabsence of a signireg cant di erence between the original and the quantized image Thefact that the original multispectral image can be reduced to relatively few digitallevels without visible loss of land cover type information suggests that the moredetailed data represent di erences within land cover types not among them Thisand contextual information appear to allow interpreters to classify successfully landcover from hard copy images (eg de Boissezon et al 1993 ) even though theradiometric content is reduced compared to the digital data
The merging of medium sized clusters (Step 5) is intended to ensure that smallerbut potentially signireg cant clusters are not omitted from the classireg cation the largeclusters will be selected in any case Since it a ects only the selection of the smallestseed clusters there is a relationship between MinLSC threshold and these two stepsIn particular if MinLSC is su ciently low Step 5 may not be required The needfor it can be readily ascertained by comparing the means of large and medium seedclusters For example we found for a 4-channel AVHRR data set of all Canada thatthe large seed clusters with MinLSC=0 1 spanned the entire spectral space Itshould be noted that spatial image reg ltering (Step 3) also a ects only the small seedclusters but its e ectiveness is probably less predictable as it will vary with theheterogeneity of the scene being classireg ed
The computer implementation of CPG consists of various image processing andset orderingsearching operations When the number of initial clusters is high thesearches can be time consuming The number of initial clusters depends on thenumber of input channels and the number of digital levels in each channel afterquantization (Step 2) The overall process thus is more computer-demanding thanfor other algorithms such as supervised classireg cation This could be reduced byoptimizing the software used and it should become of less concern as computingspeeds increase For the same reason CPG would not be a practical classireg cationapproach for imaging spectrometer data unless a dimensionality reduction scheme(such as principal component analysis) is applied reg rst The computational demandmay not be a big disadvantage since the number of independent channels in remotesensing data of natural scenes tends to be limited even for hyperspectral data (Price1994) Conversely CPG is less sensitive to the spatial resolutionarea size of theinput data set This is because most of the operations handle clusters and the pixelclassireg cation algorithm itself (Step 6) is fast
Since CPG assigns each pixel to one cover class it is a hardrsquo classireg er Variousoperations are possible that improve the reg nal result of an unsupervised classireg cationeg an adjustment of the map legend in relation to the identireg ed spectral classes(Lark 1995 ) fuzzy techniques (Foody 1996) contextual correction (Groom et al1996) additional cluster splitting based on ancillary information (Loveland et al1991) etc These could be applied to the CPG results as well provided that therequisite ground data are available
J Cihlar et al2702
CPG appears to have considerable capacity for data compression For examplein the TM classireg cation for NSA the number of spectral clusters was reduced by97 5 (from amp2679 to 71) yet the vast majority of the visible spectral informationwas retained ( reg gure 3)
6 Summary and conclusions
Land cover type classireg cation is arguably the most widespread application ofremote sensing data for terrestrial environments Although many di erent classireg ca-tion approaches have been developed to date they have substantial disadvantagesin practical use Specireg c drawbacks vary with the methodology but may include oneor more of the following prior knowledge of the number of distinct spectral clustersprior knowledge of the approximate spatial distribution and the spectral variabilityof the land cover classes of interest knowledge of the statistical properties of spectralclusters and their distribution in the multi-dimensional spectral space prior specireg ca-tion of parameters controlling the classireg cation process and others Most of theseare not known exactly and some are unknowable in practice Thus in many caseswhere existing supervised or unsupervised classireg ers are used digital land coverclassireg cation becomes a trial-and-error procedure with several runs and modireg cationsof the intermediate results
In this study we have attempted to develop a methodology that would representthe spectral information content of the data accurately would facilitate obtainingan accurate classireg cation would not require knowledge of the data distribution inthe spectral space and could run automatically with minimum input from theanalyst The resulting procedure Classireg cation by Progressive Generalization (CPG)meets these criteria CPG is based on the identireg cation of all signireg cantrsquo clusters inthe data followed by classireg cation of all pixels and a guided merging of the resultingclusters It can be run automatically until the desired number of classes is reachedHowever it gives an analyst the option of optimizing the results by introducingindependent information in the last stages when the merging of large clusters (basedon spectral similarity) might be undesirable It does not require knowledge of spectralspace such as the number and proximity of clusters It needs only three parametersto be specireg ed a priori all of which refer to the size of clusters that can be ignoredat a given stage of the analysis and are therefore relatively easy to estimate by auser of the classireg cation product
Several tests have been carried out to evaluate the CPG accuracy (absolute andin comparison with ISOCLASS a typical unsupervised classireg er) sensitivity tocontrol parameters and usefulness with various input data Results of these testscan be summarized as follows
E The accuracy achievable by the CPG is comparable or superior to otherexisting unsupervised classireg cation methods (represented by ISOCLASS)
E The CPG is less sensitive to control parameters that is ISOCLASSE CPG performs well with AVHRR and TM data
It is concluded that the classireg cation strategy embodied in CPG represents aviable and e ective approach to the digital classireg cation of remote sensing data
Acknowledgments
We wish to acknowledge the contribution of Ms Fengting Huang to the processingof AVHRR data used in this paper Drs Zhanqing Li and Frank Ahern from the
Classireg cation by progressive generalization 2703
Canada Centre for Remote Sensing provided helpful comments on a draft of thispaper
References
Ball G H and Hall D J 1965 ISODATA a novel method of data analysis and patterclassireg cation Technical Report Stanford Research Institute Menlo Park CaliforniaUSA
Beaubien J 1994 Landsat TM satellite images of forests from enhancement to classireg cationCanadian Journal of Remote Sensing 20 17plusmn 26
Beaubien J Cihlar J Simard G and Xiao Q 1998 Land cover from thematic mapperdata using new enhancement ETH classireg cation methodology In preparation
Beaubien J Cihlar J Xiao Q Chen J Fung K and Hurlburt P 1997 A newnationally consistent satellite-derived land cover of Canada a comparison of twomethodologies Proceedings of the International Symposium Geomatics in the Era ofRadarsat Ottawa Ontario May 25 plusmn 30 (published on CD-ROM)
Bryant J 1978 Applications of clustering in multi-image data analysis NASA Report no 18Contract NAS-9-14689-8S NASA Johnson Space Center Houston Texas USA
Cihlar J Beaubien J Xiao Q Chen J and Li Z 1997 a Land cover of the BOREASregion from AVHRR and Landsat data Canadian Journal of Remote Sensing 23
163plusmn 175Cihlar J Chen J and Li Z 1997 b Seasonal AVHRR multichannel data sets and products
for scaling up biospheric processes Journal of Geophysical ResearchETH Atmospheres
102 29625plusmn 29640Cihlar J Ly H Li Z Chen J Pokrant H and Huang F 1997 c Multitemporal
multichannel data sets for land biosphere studies ETH artifacts and corrections Remote
Sensing of Environment 60 35plusmn 57Cihlar J Ly H and Xiao Q 1996 Land cover classireg cation with AVHRR multichannel
composites in northern environments Remote Sensing of Environment 58 36plusmn 51Cihlar J and Protz R 1972 Perception of tome di erences from reg lm transparencies
Photogrammetria 8 131plusmn 140Congalton R G 1991 A review of assessing the accuracy of classireg cations of remotely
sensed data Remote Sensing of Environment 37 35plusmn 41De Boissezon H Gonzales G Pous B and Sharman M 1993 Rapid estimates of crop
acreage and production as a European scale using high resolution imageryETH opera-tional review Proceedings of the International Symposium of Operationalization ofRemote Sensing Entschede T he Netherlands April 19 plusmn 23 1993 pp 94plusmn 105
DeFries R Hansen M and Townshend J 1995 Global discrimination of land covertypes from metrics derived from AVHRR Pathreg nder data Remote Sensing of
Environment 54 209plusmn 222Duda R O and Hart P E 1973 Pattern Classireg cation and Scene Analysis (New York
Wiley)Foody G M 1996 Approaches for the production and evaluation of fuzzy land cover
classireg cations from remotely sensed data International Journal of Remote Sensing 17
1317 plusmn 1340Groom G B Fuller R M and Jones A R 1996 Contextual correction techniques for
improving land cover mapping from remotely sensed images International Journal of
Remote Sensing 17 69plusmn 89Hammond T O and Verbyla D L 1996 Optimistic bias in classireg cation accuracy
assessment International Journal of Remote Sensing 17 1261plusmn 1266Hansen M Dubayah R and DeFries R 1996 Classi reg cation trees an alternative to
traditional land cover classireg ers International Journal of Remote Sensing 171075 plusmn 1081
Loveland T R Merchant J W Ohlen D O and Brown J F 1991 Developmentof a land-cover characteristics database for the conterminous US Photogrammetric
Engineering and Remote Sensing 57 1453plusmn 1463
Classireg cation by progressive generalization2704
Masselli F Petkov L Maracchi G and Conese C 1996 Eco-climatic classireg cationof Tuscany through NOAA-AVHRR data International Journal of Remote Sensing
17 2369plusmn 2384Price J C 1994 How unique are spectral signatures Remote Sensing of Environment
49 181plusmn 186Rabben E L 1960 Fundamentals of photo interpretation In Manual of Photographic
Interpretation edited by R N Colwell (Washington DC The American Society ofPhotogrammetry) pp 99plusmn 168
Royer A Anseau C Viau A Theriault A Bonn F OrsquoNeill N Granberg H BSingh B Schuepp P Beaubien J and Cihlar J 1994 Impact des changementsde lrsquoenvironnement global sur la foret boreale du Quebec In T eledetection del rsquoEnvironnement dans lrsquoEspace Francophone (Sainte-Foy Quebec Presses de lrsquouniversitedu Quebec) pp 305plusmn 330
Tou J T and Gonzales R C 1974 Pattern Recognition Principles (Reading MAAddison-Wesley)
Townshend J R G Justice C O Skole D Malingreau J-P Cihlar J TeilletP Sadowski F and Rutenberg S 1994 The 1 km resolution global data setneeds of the International Geosphere Biosphere Programme International Journal of
Remote Sensing 15 3417plusmn 3441US Department of Commerce 1977 World Data Bank II Volume 1 ETH North America and
General Userrsquos Guide (Springreg eld VA National Technical Information Service) VanderZee D and Ehrlich D 1995 Sensitivity of ISODATA to changes in sampling
procedures and processing parameters when applied to AVHRR time-series NDVIdata International Journal of Remote Sensing 16 673plusmn 686
Verbyla D L and Hammond T O 1995 Conservative bias in classireg cation accuracyassessment due to pixel-by-pixel comparison of classireg ed images with reference gridsInternational Journal of Remote Sensing 16 581plusmn 587
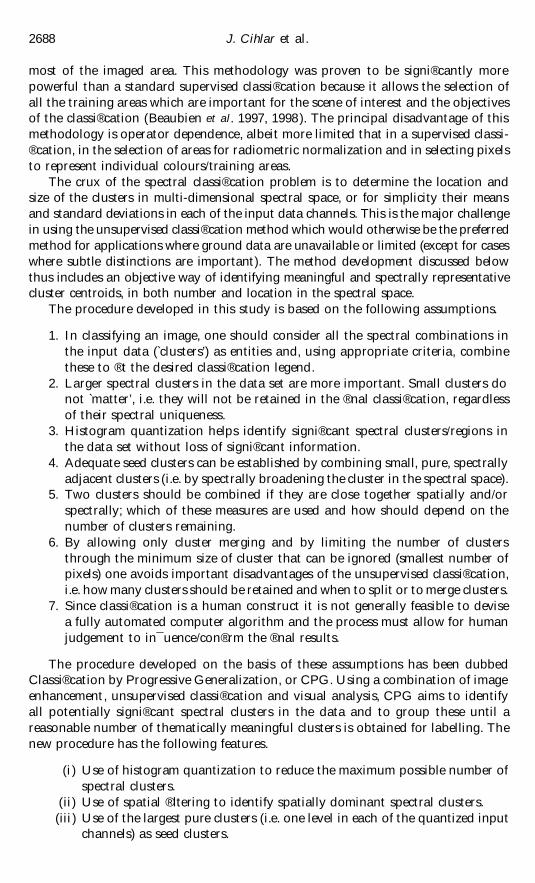