Class Point: An Approach for the Size Estimation of Object-Oriented Systems
23
Class Point: An Approach for the Size Estimation of Object-Oriented Systems Gennaro Costagliola, Member, IEEE, Filomena Ferrucci, Genoveffa Tortora, Senior Member, IEEE Computer Society, and Giuliana Vitiello Abstract—In this paper, we present an FP-like approach, named Class Point, which was conceived to estimate the size of object- oriented products. In particular, two measures are proposed, which are theoretically validated showing that they satisfy well-known properties necessary for size measures. An initial empirical validation is also performed, meant to assess the usefulness and effectiveness of the proposed measures to predict the development effort of object-oriented systems. Moreover, a comparative analysis is carried out, taking into account several other size measures. Index Terms—Object-oriented systems, size measures, Function Point Analysis, theoretical validation, empirical validation, effort prediction model. æ 1 INTRODUCTION I N recent years, many software measures have been defined to gather information about relevant aspects of software products. Software product measures quantify properties, which are usually classified as internal and external attributes. Internal attributes of a product can be measured in terms of the product itself, i.e., independently from its behavior (e.g., size, complexity, modularity). On the contrary, external attributes usually denote properties that can be measured by taking into account how the product relates to its environment [29]. Examples of external attributes are reliability, understandability, and maintainability. Since external attributes depend not only on the considered product but also on its behavior in its environment, they are hard to quantify. For that reason, the current trend is to investigate measures for quantifying internal attributes and to establish models, which correlate external attribute measures with the internal attribute ones. Software size represents one of the most interesting internal attributes of a product. It has been employed in several effort/cost models as a predictor of the effort and cost needed to design and implement the software (see, e.g., [6], [29], [42], [64]). Thus, size evaluation is one of the main tasks for planning software project development with reliable cost and effort estimations. Several measures have been defined so far in order to estimate the size of software systems. Among them, Function Points (FPs) have achieved a wide acceptance in the estimation of the size of business systems and to indirectly predict the effort, cost, and duration of their projects [2], [27], [42]. The method provides an estimation of software size by measuring the functionality of the system to be developed. This allows Function Point Analysis (FPA) to be applied in the early phases of the lifecycle, which is the main reason for the success of the method. Although the applicability of FPA is limited to procedur- al business systems, many researchers agree that the FP method can be generalized in order to be successfully used for other types of systems (e.g., engineering, scientific and real-time systems) and for different programming paradigms [4], [6], [27], [31], [35], [68], [70]. In this paper, we present an FP-like approach, named Class Point, which was conceived to estimate the size of object-oriented products, based on design documentation. In particular, two measures are proposed, named CP 1 and CP 2 . CP 1 is meant to be used at the beginning of the development process to carry out a preliminary size estimation, which can be later refined by applying CP 2 when more information is available. The idea underlying the Class Point method is the quantification of classes in a program in analogy to the function counting performed by the FP measure. This idea derives from the observation that in the procedural paradigm the basic programming units are functions or procedures; whereas, in the object-oriented paradigm, the logical building blocks are classes, which correspond to real-world objects and are related to each other. The Class Point size estimation process is structured into three main phases, corresponding to analogous phases in the FP approach. During the first step the design specifica- tions are analyzed in order to identify and classify the classes into four types of system components, namely the problem domain type, the human interaction type, the data management type, and the task management type. During the second step, each identified class is assigned a complexity level, which is determined on the basis of the local methods in the class and of the interaction of the class with the rest of the system. This is achieved by exploiting suitable measures for OO classes. The measures and the way they are used to carry out this step represent the 52 IEEE TRANSACTIONS ON SOFTWARE ENGINEERING, VOL. 31, NO. 1, JANUARY 2005 . The authors are with the Dipartimento di Matematica e Informatica, Universita`of Salerno, Via Ponte Don Melillo, 84084 Fisciano, SA, Italy. E-mail: {gcostagliola, fferrucci, tortora, gvitiello}@unisa.it. Manuscript received 7 Jan. 2004; revised 23 June 2004; accepted 13 Dec. 2004; published online 9 Feb. 2005. Recommended for acceptance by L.C. Briand. For information on obtaining reprints of this article, please send e-mail to: [email protected], and reference IEEECS Log Number TSE-0006-0104. 0098-5589/05/$20.00 ß 2005 IEEE Published by the IEEE Computer Society
Transcript of Class Point: An Approach for the Size Estimation of Object-Oriented Systems

Class Point: An Approach for the SizeEstimation of Object-Oriented Systems
Gennaro Costagliola, Member, IEEE, Filomena Ferrucci,
Genoveffa Tortora, Senior Member, IEEE Computer Society, and Giuliana Vitiello
Abstract—In this paper, we present an FP-like approach, named Class Point, which was conceived to estimate the size of object-
oriented products. In particular, two measures are proposed, which are theoretically validated showing that they satisfy well-known
properties necessary for size measures. An initial empirical validation is also performed, meant to assess the usefulness and
effectiveness of the proposed measures to predict the development effort of object-oriented systems. Moreover, a comparative
analysis is carried out, taking into account several other size measures.
Index Terms—Object-oriented systems, size measures, Function Point Analysis, theoretical validation, empirical validation, effort
prediction model.
�
1 INTRODUCTION
IN recent years, many software measures have beendefined to gather information about relevant aspects of
software products. Software product measures quantifyproperties, which are usually classified as internal andexternal attributes. Internal attributes of a product can bemeasured in terms of the product itself, i.e., independentlyfrom its behavior (e.g., size, complexity, modularity). Onthe contrary, external attributes usually denote propertiesthat can be measured by taking into account how theproduct relates to its environment [29]. Examples ofexternal attributes are reliability, understandability, andmaintainability. Since external attributes depend not onlyon the considered product but also on its behavior in itsenvironment, they are hard to quantify. For that reason, thecurrent trend is to investigate measures for quantifyinginternal attributes and to establish models, which correlateexternal attribute measures with the internal attribute ones.
Software size represents one of the most interesting
internal attributes of a product. It has been employed in
several effort/cost models as a predictor of the effort and
cost needed to design and implement the software (see, e.g.,
[6], [29], [42], [64]). Thus, size evaluation is one of the main
tasks for planning software project development with
reliable cost and effort estimations. Several measures have
been defined so far in order to estimate the size of software
systems. Among them, Function Points (FPs) have achieved
a wide acceptance in the estimation of the size of business
systems and to indirectly predict the effort, cost, and
duration of their projects [2], [27], [42]. The method
provides an estimation of software size by measuring the
functionality of the system to be developed. This allowsFunction Point Analysis (FPA) to be applied in the earlyphases of the lifecycle, which is the main reason for thesuccess of the method.
Although the applicability of FPA is limited to procedur-al business systems, many researchers agree that theFP method can be generalized in order to be successfullyused for other types of systems (e.g., engineering, scientificand real-time systems) and for different programmingparadigms [4], [6], [27], [31], [35], [68], [70].
In this paper, we present an FP-like approach, namedClass Point, which was conceived to estimate the size ofobject-oriented products, based on design documentation.In particular, two measures are proposed, named CP1 andCP2. CP1 is meant to be used at the beginning of thedevelopment process to carry out a preliminary sizeestimation, which can be later refined by applying CP2
when more information is available.The idea underlying the Class Point method is the
quantification of classes in a program in analogy to thefunction counting performed by the FP measure. This ideaderives from the observation that in the proceduralparadigm the basic programming units are functions orprocedures; whereas, in the object-oriented paradigm, thelogical building blocks are classes, which correspond toreal-world objects and are related to each other.
The Class Point size estimation process is structured intothree main phases, corresponding to analogous phases inthe FP approach. During the first step the design specifica-tions are analyzed in order to identify and classify theclasses into four types of system components, namely theproblem domain type, the human interaction type, the datamanagement type, and the task management type.
During the second step, each identified class is assigneda complexity level, which is determined on the basis of thelocal methods in the class and of the interaction of the classwith the rest of the system. This is achieved by exploitingsuitable measures for OO classes. The measures and theway they are used to carry out this step represent the
52 IEEE TRANSACTIONS ON SOFTWARE ENGINEERING, VOL. 31, NO. 1, JANUARY 2005
. The authors are with the Dipartimento di Matematica e Informatica,Universita of Salerno, Via Ponte Don Melillo, 84084 Fisciano, SA, Italy.E-mail: {gcostagliola, fferrucci, tortora, gvitiello}@unisa.it.
Manuscript received 7 Jan. 2004; revised 23 June 2004; accepted 13 Dec. 2004;published online 9 Feb. 2005.Recommended for acceptance by L.C. Briand.For information on obtaining reprints of this article, please send e-mail to:[email protected], and reference IEEECS Log Number TSE-0006-0104.
0098-5589/05/$20.00 � 2005 IEEE Published by the IEEE Computer Society

substantial difference between CP1 and CP2. Indeed, in CP1
the complexity level of each class is determined on the basisof the Number of External Methods (NEM) [33], [50], [51], andthe Number of Services Requested (NSR). The NEM measureallows us to estimate the size of the interface of a singleclass in an object-oriented system and is given by thenumber of local methods which are public. NSR provides ameasure for the interconnection of system components. It isagain applicable to a single class and is determined by thenumber of different services requested to other classes. InCP2, besides the above measures, the Number Of Attributes(NOA) [33] measure is taken into account in order toevaluate the complexity level of each class. Once acomplexity level of each class has been assigned, suchinformation and its type are used to assign a weight to theclass. Then, the Total Unadjusted Class Point value (TUCP) iscomputed as a weighted sum. Finally, the Class Point valueis determined by adjusting the TUCP with a value obtainedby considering global system characteristics as in FPA.
In the paper, we also report on the results of twocomplementary validations, which have been performed onthe proposed measures, namely, the theoretical and theempirical one. In fact, it is widely acknowledged that asoftware measure can be acceptable and effectively usableonly if its usefulness has been proven by means of avalidation process. The aim of such a process is to show thatthe measure really measures the attribute it is supposed toand that it is practically useful. The proposed Class Pointmeasures have been theoretically evaluated against well-known properties, namely, the desirable size propertiesdefined by Briand et al. [9]. Moreover, an empirical studyhas been performed to investigate the usefulness of theClass Point approach as a means to estimate the effort of OOproducts. It is indeed an initial study based on data derivedfrom 40 students’ projects, on which a linear regressionanalysis, based on a 4-fold cross validation technique, hasbeen carried out. The results of such an analysis indicatethat each of the variables CP1 and CP2 exhibits a highcorrelation with the development effort. Moreover, it turnsout that the proposed measures can effectively be usedduring the design phase to predict the effort values with ahigh degree of confidence. In particular, the results of theempirical analysis show a better performance of theCP2 measure than the CP1 one. This further supports theintuition that attributes can profitably be exploited in theestimation of system size. On the other hand, the number ofattributes of each class may not be very accurate early in thedevelopment process, and it is likely to be available later inthe process than the number of external methods andrequested services. Thus, CP1 can be used to obtain apreliminary estimation and CP2 to refine such estimationwhen the number of attributes is available. The empiricalanalysis has also shown that both measures exhibit a betterpredictive capability than the single basic measuresinvolved in the Class Point counting, as well as with respectto some measures obtained by merely summing up thebasic ones.
The remainder of the paper is organized as follows: InSection 2, Function Point Analysis is recalled together withsome OO size measures. A detailed description of the
Class Point approach is given in Section 3. Section 4 dealswith the theoretical validation of the Class Point measures;whereas, in Section 5, the results of the empirical analysisare given. Finally, Section 6 contains some concludingobservations and suggests further aspects to be investigated.
2 SIZE MEASURES
In this section, we recall the basic concepts underlying theFP method and describe some size measures conceived forthe OO paradigm.
2.1 Function Point Analysis
Not long ago, the Lines of Code (LOC) count was the onlysoftware size measure used for defining product measures.In spite of the simplicity and familiarity of this counting,LOC could only be computed once the software productwas available and could not be used for predicting the sizeof the software under development. The need to estimatesoftware size in the early phases of the lifecycle hasmotivated the investigation of more accurate softwaresizing techniques. One such technique is the Function Pointmethod, which was introduced by Albrecht [2] to measurethe size of a data-processing system from the end-user’spoint of view. The original definition of the method hasbeen modified several times, resulting in different versionsof the counting procedure. Since 1986, the InternationalFunction Point User Group (IFPUG) has been operating withthe aim of defining the standard for the method andpopularizing it all over the world. The current standardversion is reported in the IFPUG Counting PracticesManual [34].
The FP method can be applied throughout the develop-ment process, starting from early requirements definition. Itdetermines the size of a system by performing a sequence ofsteps. The analysis starts with the identification of allfunctions. Each function is classified as belonging to one ofthe following function types: external input (EI), externaloutput (EO), external inquiry (EQ), internal logical file (ILF),and external interface file (EIF). The first three classes offunctions fall within the transaction function typology,while the last two, referring to the logical files, areconsidered data function types. Each function is thenweighted based on its type and on the level of itscomplexity, in agreement with standard values as specifiedin the Counting Practices Manual. As an example, fortransactions (EI, EO, and EQ), the rating is based on thenumber of Data Element Types (DETs) and Referenced FileTypes (FTRs). A DET is a unique, nonrepeated fieldrecognized by the user. An FTR can be an ILF referencedor maintained by the transaction or an EIF read by thetransaction. Thus, if an external inquiry has more than 16DETs and at least two FTRs, it is assigned a high complexitylevel and a weight value equal to 6.
The weighted total of the five components of theapplication is then multiplied by the Value AdjustmentFactor, which is computed on the basis of the degree ofinfluence that each of 14 general system characteristics islikely to have on the application. The adjustment factorcauses the FP count to vary with respect to the unadjustedcount from -35 percent (corresponding to a null degree of
COSTAGLIOLA ET AL.: CLASS POINT: AN APPROACH FOR THE SIZE ESTIMATION OF OBJECT-ORIENTED SYSTEMS 53

influence for all the 14 characteristics) to +35 percent(corresponding to all degrees set to 5).
During the last few years, the FP measure has gainedincreasing approval by application developers. They haveexploited the FP count in order to profitably estimateproductivity, in terms of Function Points per person-month,and quality, in terms of the number of defects per functionpoint with respect to requirements, design, coding, and userdocumentation phases. Besides its early applicability, thesuccess of Function Points for measuring the size of a systemis due to its independence from the language and the toolsused throughout the lifecycle.
The appealing features of the approach have motivatedseveral proposals meant to exploit the main ideas of themethod in order to predict the size of object-orientedsystems. In the following section, we describe severaladaptations of the FP method to OO systems, besides othersize measures conceived for object-orientation.
2.2 Size Measures for OO Systems
The widespread use of object-oriented methodologies insoftware development has motivated the investigation ofproduct measures that allow us to monitor, test, andsupport the development and the maintenance of softwarein OO environments. Indeed, existing software size mea-sures for the procedural paradigm turn out to no longer besuitable to capture specific object-oriented features, such asclasses, inheritance, encapsulation, and message passing.
In [50], [51], two size measures, named Size1 and Size2,were considered for the OO paradigm. Size1 is defined asthe number of noncommented lines of source code. Itrepresents the Lines Of Code count for the OO paradigmand then it is subject to the same criticisms, namely, the lackof standardization, the language dependency, and theinadequacy for early phases of the software lifecycle. TheSize2 measure is closer to the OO methodology and it isbased on a less ambiguous count which can also be carriedout in the design phase. Size2 is defined as the total count ofthe number of data attributes and the number of external(or public) local methods in a class, more precisely,
Size2 ¼ NOAþNEM;
where NOA is the number of attributes of the class andNEM is the number of external methods of a class, i.e.,methods which are available through the class interface tomembers of other classes [33]. Thus, the definition of Size2does not include private methods. An immediate simpleextension of class size definition has been provided in [33],as the sum of the number of all the local methods and thenumber of attributes of the class, more formally,
SC ¼ NOAþNOM;
where NOM is the number of local methods (i.e., NOMincludes also nonpublic methods).
In [21], Chidamber and Kemerer have defined a set of sixmeasures for assessing the design of OO systems, withspecial reference to the identification, the semantics, and therelationships steps of Booch’s design methodology [7].Among them, the Weighted Methods per Class (WMC), theNumber Of Children (NOC), and the Response For a Class
(RFC) measures can be used as size measures, as pointedout in [9]. WMC is given by the summation of the staticcomplexities of all the local methods. Since the complexityof a method can be evaluated by using any traditional staticcomplexity measure, WMC is actually a family of measures.In particular, when all the methods in a class are consideredto be equally complex, WMC boils down to the Number Oflocal Methods of a class, i.e., NOM.
The measure NOC is given by the number of directsubclasses of a class. It estimates the number of subclasses,which will inherit the methods of the parent class. RFC isthe number of methods local to a class plus the number ofnonlocal methods which are called by a local method. Thismeasure of the potential communication among classesprovides information about the testing and debuggingefforts that may be required by an object.
All the previous measures provide a class-level measure-ment. As a consequence, they are more useful forproductivity analysis once the software has been realizedbut less profitable for effort prediction [57]. Indeed, such atask is better supported by an overall view of the system asprovided by system-level measures [32]. For that reason,several system-level measures have been defined [15], [16],[17], [18], [54], [60]. Most of them derive measures fromclass-level ones. For instance, as suggested by Henderson-Sellers, we can sum the class-level values across the system[33]. Lorenz and Kidd have also elaborated a set of system-level measures, including the average method size over thesystem, the average number of methods per class, and theaverage number of instance variables per class [54].
The System Meter method is another system-levelapproach to size measurement, especially conceived forbusiness models [60]. A business modeling language,named DOME, is used to distinguish among language,library, and project-specific Description Objects, thus givingspecial relevance to reusable components in the measure-ment process. Like FPA, the method can be applied to anymanagement information system. However, System Meter isespecially directed to object-oriented development pro-cesses and empirical studies have suggested that it predictsdevelopment effort more precisely than FPA [61].
Nesi and Querci present a set of size/complexitymeasures specifically targeted at effort estimation andprediction. Some of these measures are obtained bycombining existing measures, so as to enhance theireffort predictive capability. Three different levels areconsidered, namely, method, class, and system, and foreach level measures are defined in terms of measures oflower levels [64].
In the last years, other size measures have beensuggested as adaptations of the FP method to OO systems[6], [27], [35], [42], [68], [69]. In particular, Whitmireproposes the application of his 3D Function Points toobject-oriented software systems, by considering each classas an internal file and messages sent across the systemboundary as transactions [71]. However, 3D Function Pointsrequire a greater degree of detail in order to determine sizeand consequently make early counting more difficult.
TheObject Pointmeasure is another adaptation of FP, usedin the improved COCOMO 2.0 estimation technique [6]. The
54 IEEE TRANSACTIONS ON SOFTWARE ENGINEERING, VOL. 31, NO. 1, JANUARY 2005

Object Point count is very similar to FP, but objects are takenas the basis of the counting process. However, such objectsare not directly related to “objects” in the OO methodology,but rather refer to screens, reports, or 3GLmodules. Fetcke etal. propose a method based on rules which map use casemodels in the Jacobson OOSE method to concepts of FPA[30]. Their proposal is based on the standard FPA defined inthe IFPUG Counting Practices Manual (IFPUG 1994), and isdescribed through three industrial case studies that adoptedthe OOSE approach.
Predictive Object Points (POPs) represent another system-level measure for effort prediction, which adopts a countingscheme analogous to FPs. It was proposed by Minkiewicz asa suitable combination of well-known OO measures [57].POPs counting is based on theWMCmeasure applied to toplevel classes, and combines such information with theaverage depth of the inheritance tree and the average NOC.In order to compute the WMC value, each method isweighted by a complexity determined by the type ofmethod (constructor, destructor, modifier, selector, itera-tor), by the number of properties the method affects and thenumber of services it provides to the system. As pointed outby the author, detailed information required by the POPcounting for determining complexity of methods is notavailable in early stages of the software developmentprocess. As a solution, he proposes to approximate suchvalues on the basis of the available information. Closelyrelated to the POP approach, is the method proposed for thedefinition of Object-oriented Function Points (OFPs) in [3].The method is characterized by a mapping of FP concepts(logical files and transactions) to OO concepts (classes andmethods), and by a flexible method for handling specificOO concepts like inheritance and aggregation. With respectto Minkiewicz’s approach, the complexity of methods isdetermined only by the information contained in theirsignatures. In particular, data referenced in it are countedand classified as simple items or complex items, dependingon whether they refer to elementary data types or classtypes. Then, the complexity level of each method isdetermined by exploiting the IFPUG tables for transactionsand by considering simple and complex items as DET andFTR elements of traditional FP. Similarly, the complexity ofeach class is classified as low, average or high using IFPUGstandard tables for logical files.
3 THE CLASS POINT APPROACH
In this section, we present the Class Point approach, whichprovides a system-level estimation of the size of OOproducts. It has been conceived by recasting the ideasunderlying the FP analysis within the OO paradigm and bysuitably combining well-known OO measures. The basicideas of the Class Point method were first proposed in [26],and later refined giving rise to the definition of twomeasures, CP1 and CP2, which are presented in whatfollows. Indeed, the aim of the proposed approach is toprovide a method which allows us to refine estimatesthroughout the development and to exploit new informa-tion as it is available. As a matter of fact, the CP1 measurewas conceived to provide an initial size estimation at thebeginning of the development process. Such an estimation
can be further detailed by applying CP2, whose computa-tion requires data that are usually available later in thedevelopment process.
As opposed to the other adaptations of FP, whenconceiving the Class Point approach as an extension of FP,we decided against using one-to-one mappings from FPlogical files and transactions to classes and methods,respectively. In the procedural paradigm, data and opera-tions are indeed separate from each other. However, in theOO paradigm, operations are tightly related to the data theymanipulate and are therefore embedded in the concept of aclass. As a consequence, the Class Point method is especiallyfocussed on classes, which are the entities the methodshould count and weigh on the basis of their complexitylevels, as was the case for functions in FPA. The complexitylevel of each class is derived from the information about thelocal methods in the class, about the interaction of the classwith the rest of the system, and, when available, about theattributes. Moreover, while the classification of datafunction types and transaction function types in FPA wasespecially conceived for business applications, the categor-ization of classes in the Class Point measures is independentof any application typology. To some extent, our approachis similar to POP counting, with the main difference lying inthe fact that we distinguish among categories of classes,rather than classifying methods. Another point of distinc-tion with respect to POPs is that data are also taken intoaccount in the Class Point measures, and the informationneeded to perform the counting is usually available at thedesign phase rather than being replaced by estimatedvalues.
In Section 3.1, we describe the Class Point approachwhich underlies the estimation of the CP1 and CP2
measures. In Section 3.2, we describe the process that ledto the definition of the proposed measures.
3.1 The Class Point Method
The process of Class Point size estimation is composed ofthree main phases, corresponding to analogous phases inthe FP approach. A sketch of the method is shown inTable 1.
3.1.1 Identification and Classification of User Classes
During the first step of the Class Point counting, the designspecifications are analyzed in order to identify and classifythe classes. Generally, four types of system components can
COSTAGLIOLA ET AL.: CLASS POINT: AN APPROACH FOR THE SIZE ESTIMATION OF OBJECT-ORIENTED SYSTEMS 55
TABLE 1The Class Point Method

be distinguished, namely the problem domain type (PDT),the human interaction type (HIT), the data managementtype (DMT), and the task management type (TMT). ThePDT component contains classes representing real-worldentities in the application domain of the system. Thus,taking as an example a distributed information system foraccident management as described in [19], typical PDTclasses are Incident, FieldOfficer, and EmergencyReport. Theclasses of HIT type are designed to satisfy the need forinformation visualization and human-computer interaction.With regard to the previous example, the classes Emergen-cyReportForm and ReportEmergencyButton belong to thistype. The DMT component encompasses the classes thatoffer functionality for data storage and retrieval. In theexample, a DMT component is the IncidentManagementsubsystem containing classes responsible for issuing SQLqueries in order to store and retrieve records representingIncidents in the database. Finally, TMT classes are designedfor task management purposes, thus they are responsiblefor the definition and control of tasks such as Manage-EmergencyControl and ReportEmergencyControl. Moreover,such component also includes classes responsible for thecommunication between subsystems allocated to differentcomputers, and classes responsible for the communicationwith external systems. As a matter of fact, Message andConnection are typical classes falling within this component.
The above classification was first suggested by Coad andNicola in order to facilitate the modification and the reuseof classes [22]. However, such class typologies can bedetected in any OO system, independently of the applica-tion domain and of the design methodology adopted (e.g.,[7], [8], [22], [23], [37], [66]).
3.1.2 Evaluation of a Class Complexity Level
In the Class Point approach, the behavior of each classcomponent is taken into account in order to evaluate itscomplexity level. The difference between the CP1 and CP2
measures lies in the way such a complexity level isdetermined. In particular, in CP1 the number of externalmethods and the number of services requested are takeninto account; whereas, in CP2, the number of attributes isalso exploited.
The Number of External Methods (NEM) measures the sizeof the interface of a class and is determined by the numberof locally defined public methods. The Number of ServicesRequested (NSR) provides a measure of the interconnectionof system components. It is again applicable to a single classand is determined by the number of different servicesrequested from other classes. Both measures are available in
design documentation. Indeed, activities that characterizeany OO design process include the identification of theclasses with their attributes and methods, and the construc-tion of interaction (or collaboration) diagrams showingwhich external services are needed for a class to perform theexpected tasks [67]. A measure similar to NSR wasproposed by Li and Henry. Such a measure, named MessagePassing Coupling (MPC), was introduced in [50], [51] tomeasure the interdependence among classes determined bythe number of messages sent by each class. Compared toMPC, the NSR counting requires less detail and can beperformed during analysis and early design.
As for CP1, the complexity level of a class is assignedbased on the NSR and NEM range values according toTable 2. Each class is then weighted in agreement with itstype and its level of complexity. For example, if a class hasmore than nine NEM and the NSR value is not less than 2, itis assigned a high complexity level. The rationale behindTable 2 will be made clear in Section 3.2.
When computing CP2, the number of attributes is alsotaken into account in order to evaluate the complexity levelof a class. Thus, in CP2, the measure NOA has beenconsidered as an additional parameter giving rise toTables 3a, 3b, and 3c. Each table is related to a fixed NSRrange and indexed on NEM and NOA.
3.1.3 Estimating the Total Unadjusted Class Point
Once the complexity level of each identified class has beenestablished, we are ready to compute the Total UnadjustedClass Point value (TUCP). To this aim one needs to fill in theTUCP table (see Table 4). Each entry in the table expressesthe weighted number of classes whose typology andcomplexity level are given by the corresponding row andcolumn, respectively.
Thus, the TUCP is computed as the weighted total of thefour components of the application:
TUCP ¼X4
i¼1
X3
j¼1
wij � xij;
where xij is the number of classes of component type i(problem domain, human interaction, etc.) with complexitylevel j (low, average, or high), and wij is the weightingvalue for type i and complexity level j.
3.1.4 Technical Complexity Factor Estimation
The Technical Complexity Factor (TCF) is determined byassigning the degree of influence (ranging from 0 to 5) that18 general system characteristics have on the application,
56 IEEE TRANSACTIONS ON SOFTWARE ENGINEERING, VOL. 31, NO. 1, JANUARY 2005
TABLE 2Evaluating the Complexity Level of a Class for CP1

from the designer’s point of view. The estimates given forthe degrees of influence are recorded in the ProcessingComplexity table illustrated in Fig. 1. The sum of theinfluence degrees related to such general system character-istics forms the Total Degree of Influence (TDI), which is usedto determine the TCF according to the following formula:
TCF ¼ 0:55þ ð0:01�TDIÞ:
The final value of the Adjusted Class Point (CP) isobtained by multiplying the Total Unadjusted Class Pointvalue by TCF
CP ¼ TUCP �TCF:
The CP count can vary with respect to the unadjustedcount from -45 percent (corresponding to a null TDI) to
+45 percent (corresponding to all degrees set to 5), due to
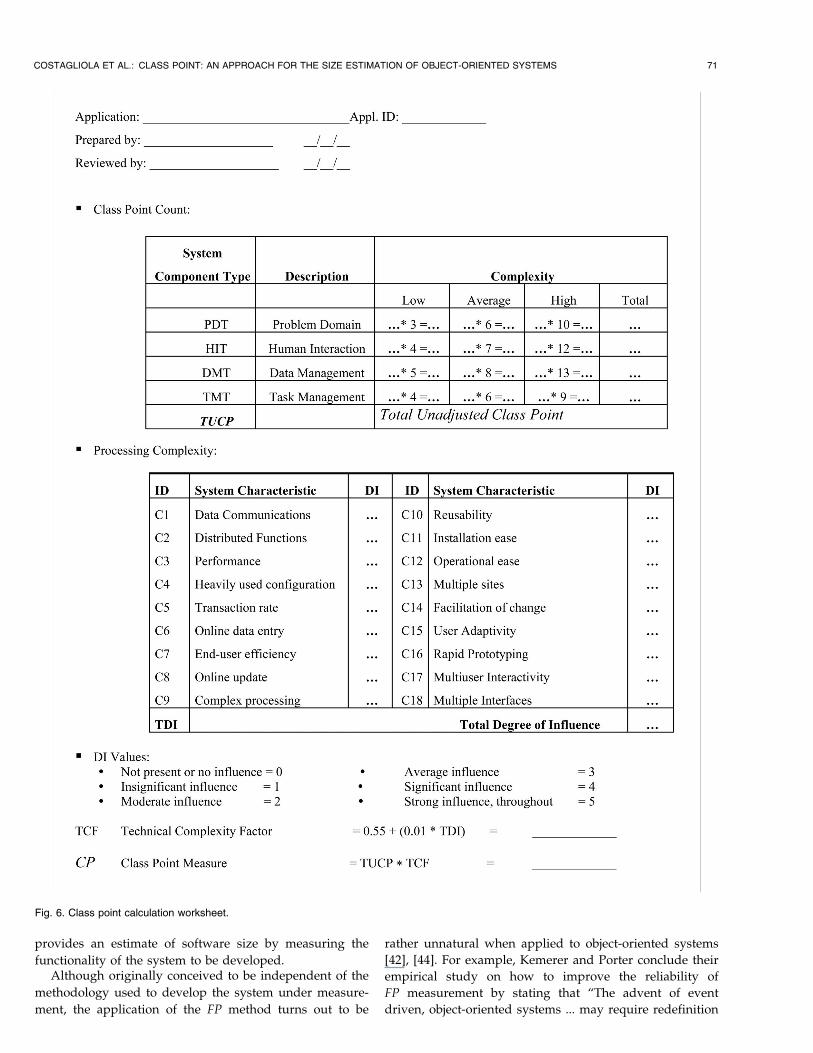
the adjustment factor. A Class Point calculation worksheet
(Fig. 6) is shown in the Appendix.It is worth noting that the Technical Complexity Factor is
determined by taking into account the characteristics that
are considered in the FP method and some additional
characteristics especially conceived for object-oriented
systems, namely:
15. User Adaptivity
16. Rapid Prototyping17. Multiuser Interactivity
18. Multiple Interfaces
The introduction of the above additional characteristics
has beenmotivated by the observation that object-orientation
COSTAGLIOLA ET AL.: CLASS POINT: AN APPROACH FOR THE SIZE ESTIMATION OF OBJECT-ORIENTED SYSTEMS 57
TABLE 3CP2 Evaluation of the Complexity Level of a Class
TABLE 4Evaluating the TUCP

represents the most appropriate paradigm for the develop-ment of effective graphical user interfaces (GUIs). It is widelyrecognized that the components of a graphical user interfaceare better represented by objects and their direct manipula-tion is naturally supported [53]. Also, an OO user interface iseasier to connect with an application that is designed andimplemented in an OO manner and the reuse of softwarecomponents is facilitated.
In spite of the availability of powerful and useful object-oriented tools for building interactive graphical applications[1], [20], [37], [39], [47], [48], [53], [63], the development ofthese modern interfaces often requires the major part ofsoftware project resources due to the costs of their design,implementation, debugging and modification [62], [63].Thus, the use of a good size estimation is stronglyrecommended for an appropriate planning of the inter-active software project development.
Table 5 contains the guidelines that should help todetermine the influence degree of each of the introducedfactors.
3.2 The Class Point Definition—An Expert-BasedProcess
In this section, we describe the process that has led us to thedefinition of the Class Pointmeasures. It has been supportedby the judgments of a group of 12 engineers with experiencein the development of interactive OO applications, whojoined us in several discussions.
Concerning the complexity level of a class, we haveobserved that the class behavior can be characterized interms of its methods, its attributes, and its interaction withother classes. Such consideration was also supported by ananalysis of Bunge’s ontology. In recent years, much interesthas been devoted to the application of such an ontology in
the context of object-orientation [21]. As a matter of fact,Bunge’s properties provide the basis for the notion of objectand are concerned with meaning and definition ofrepresentations of the world. These representations consistof concepts and things, named substantial individuals, each
characterized by certain inherent properties. This leads tothe definition of an object as a substantial individual with itsfinite collection of properties viewed as a whole. In terms ofobject-orientation, the set of properties of an objectcorresponds to the set of methods and instance variablesassigned to it. The object itself is viewed as a representationof the application domain that includes its properties. Forour purposes, special attention has been put on Bunge’sdefinition of the complexity of an object as the “numerosityof its composition.” In the context of object-orientation, thisconcept corresponds to the complexity of an object class,
which can therefore be defined as the number of propertiesattached to the class. Chidamber and Kemerer exploited theprevious definition of object complexity in order to definetheir WMC measure. Nevertheless, in their interpretation ofBunge’s definition, the properties of a class that actuallycontribute to its complexity are methods. They decided notto consider attributes in the complexity evaluation, arguingthat these are less time consuming than methods. However,our viewpoint is that two classes having the same numberof methods and different numbers of attributes cannot beequally time consuming. Still, being aware that the
attributes of a class may not be available in early design,in the CP1 measure such information is not considered fordetermining the complexity level. On the contrary, theevaluation of the complexity level in the CP2 measure doesexploit the number of attributes to get a more accurateestimation, when such information is available.
58 IEEE TRANSACTIONS ON SOFTWARE ENGINEERING, VOL. 31, NO. 1, JANUARY 2005
Fig. 1. The Processing Complexity table.

Major objects of discussion with OO engineers have beenthe assignment of the weights wij involved in the computa-tion of the Total Unadjusted Class Point value (TUCP), andthe definition of the Technical Complexity Factor.
Each engineer was asked to estimate the weights of thethree complexity levels for each component type. Theprocess started from four triplets of weights we submittedto the engineers. Such initial values were determined byanalyzing effort information about several classes of eachtypology and assigning a weight to each class based on thatinformation. For each typology, we first averaged theassigned weights, and then averaged all the weights belowthe resulting value, and all the weights above, so as to haveinitial low, average, and high weights. Engineers analyzedthose values and their own adjustments were comparedand discussed until consensus was reached, resulting in theweights shown in Table 4.
As for the Technical Complexity Factor, while retaining theoriginal 14 factors of Function Point analysis, we indicatedthree additional factors to be included for interactiveapplications, namely, User Adaptivity, Rapid Prototyping,
and Multiple Interfaces. Indeed, the user-centered approachthat should be adopted in the GUI design process naturallyrequires that much of the development effort is devoted toachieve a high degree of usability of the interface in order tomeet user’s needs and preferences. Therefore, it is widelyrecognized that prototyping is essential for GUI develop-ment. Users should be able to experiment with theprototype and provide feedback to improve the design.Further effort could also be necessary to provide theinterface with user adaptivity capabilities and to designmultiple interfaces to the same application. This might berequired to allow the user to choose the type of interactionthat best suits his/her needs, experience, and capabilities.
The engineers were asked to express their opinions onthe proposed factors. They confirmed that the presence ofsuch factors could considerably affect the developmenteffort of an interactive application. Moreover, during thediscussions with the subjects, an additional factor,Multiuser Interactivity, was identified. Such a proposaloriginated from the observation that during the creation ofa multiuser interface several specific issues must be
COSTAGLIOLA ET AL.: CLASS POINT: AN APPROACH FOR THE SIZE ESTIMATION OF OBJECT-ORIENTED SYSTEMS 59
TABLE 5Guidelines to Determine the Influence Degree of the Introduced Factors
1. The guidelines for adaptivity have been inspired by the taxonomy of adaptive systems suggested in [65].

addressed in order to enable users to simultaneouslyinteract with a common user interface. These involveprocess synchronization, replicated window management,multiuser event handling, etc. [47].
Our proposal of the additional factors has also beenencouraged by general considerations about the genesis andevolution of the Technical Complexity Factor in Function Pointcounting. In the original definition of the method, Albrechtproposed 10 application characteristics for general systems,for a maximum value adjustment factor of 25 percent. Therefinement of the model suggested in 1983 considers14 application general systems characteristics, for a max-imum value adjustment factor of 35 percent, whichcorresponds to the standardized version of the counting.However, in the literature different opinions have beenexpressed on the Technical Complexity Factor [38], [40], [43],[46], [68]. In particular, the empirical analysis performed byKemerer revealed that the application of the ProcessingComplexity Factor to the raw Function Point measure canhave little impact on the performance of Function Points inthe cost estimation process [43]. Similar conclusions weredrawn by Jefferey et al., starting from a comparativeanalysis of FP counting and the variation proposed byJones in [40]. Indeed, in [38], they deduced that furtherinvestigation is needed to determine whether other factorsshould be included, or whether the original factors shouldbe replaced with other environment variables. Analogousissues were addressed by Symons, who argued that “Therestriction to 14 factors seems unlikely to be satisfactory forall time. Other factors may be suggested now, and otherswill surely arise in the future. A more open-ended approachseems desirable [68].” We especially agree with the latteropinion and suggest the above factors as the mostappropriate to adequately perform Class Point countingwhen dealing with OO interactive applications.
4 THEORETICAL VALIDATION
Several measures have been defined so far in order tomeasure internal attributes of software systems. However, asoftware measure can be acceptable and effectively usableonly if its usefulness has been proven by means of avalidation process. The aim of such a process is to show thata measure really measures the attribute that is supposed toand it is practically useful. It is widely acknowledged thattwo kinds of validation are needed, namely theoretical andempirical validation. The former is a basic step in thevalidation process and should allow one to prove that ameasure satisfies properties characterizing the concept (e.g.,size, complexity, coupling, etc.) it is supposed to [9]. If thisis the case, the usefulness of the measure can be verified bycarrying out an empirical validation process, which usuallyexploits statistical analysis techniques.
Several researchers havedefinedmeasurement theoreticalprinciples that software measures should adhere to in orderto be valid [29], [72], [73]. However, as suggested by Briandet al. in [10], the software engineering community mightbenefit from the adoption of amore pragmatic approach, ableto provide more practical results. Similar considerationshave led several authors to provide guidelines and frame-works for theoretical and empirical validation of measures
[9], [45], [49], [70]. In particular, they suggest that themeasures should obey certain fundamental properties andmeasures of internal attributes should be validated empiri-cally against external attributes.
In this section, we focus on the theoretical validationprocess and consider the general framework proposed byBriand et al. [9]. The framework contributes to the definitionof a firmer theoretical ground of software measurement byproviding convenient and intuitive properties for severalmeasurement concepts, such as size, length, complexity,cohesion, and coupling. The generality of the approach is dueto the fact that the properties characterizing these conceptsare independent of the software artifacts (e.g., softwarespecification, design, code) the concepts are applied to.
In the following, the theoretical validation is performedby evaluating the Class Point approach against the proper-ties proposed in [9], which are specific for size measures.We only consider the CP2 measure since the correspondingtheoretical validation process can also be applied to CP1 asa special case.
In [9], three properties are defined, which are specific tothe size measures, namely, Nonnegativity, Null Value, andModule Additivity. It is worth noting that such properties arenecessary but not sufficient. Still, they constrain the searchfor measures and “make the measure definition processmore rigorous and less exploratory.”
Before describing the analysis process we performed onthe CP2 measure, let us report the definitions of the generalframework and the properties that the size measures aresupposed to verify. In the framework, a system is character-ized as a set of elements and a set of relationships betweenthose elements, as formalized in the following definition.
Definition 1 [9]: Representation of Systems and Modules.A system S will be represented as a pair < E;R > , whereE represents the set of elements of S and R is a binaryrelation on EðR � E � EÞ representing the relationshipsbetween S’s elements. Given a system S ¼ < E;R > , asystem m ¼ < Em;Rm > is a module of S if and only ifEm � E, Rm � Em � Em, and Rm � R. The elements of amodule are connected to the elements of the rest of thesystem by incoming and outgoing relationships. The setInputRðmÞ of relationships from elements outside modulem to those of module m is defined as
InputRðmÞ ¼ f< e1; e2 >2 Rje2 2 Em and e1 2 E � Emg:
The set OutputRðmÞ of relationships from the elements of amodule m to those of the rest of the system is defined as
OutputRðmÞ ¼ f< e1; e2 >2 Rje1 2 Em and e2 2 E � Emg:
The basic properties of size measures are very intuitive;they ensure that the size cannot be negative, it is null whenthe system has no element, and it can be obtained as thesum of the size of its modules when they are disjoint. Moreformally:
Property Size 1: (Nonnegativity). The size of a system S ¼< E;R > is nonnegative
SizeðSÞ � 0:
60 IEEE TRANSACTIONS ON SOFTWARE ENGINEERING, VOL. 31, NO. 1, JANUARY 2005

Property Size 2: (Null Value). The size of a system S ¼< E;R > is null if E is empty
E ¼ ; ) SizeðSÞ ¼ 0:
Property Size 3: (Module Additivity). The size of a system
S ¼ < E;R > is equal to the sum of the sizes of two of its
modulesm1 ¼ < Em1; Rm1
> andm2 ¼ < Em2; Rm2
> such
that any element of S is an element of either m1 or m2
ðm1 � S and m2 � S and E¼Em1[ Em2
and Em1\ Em2
¼;Þ) SizeðSÞ ¼ Sizeðm1Þ þ Sizeðm2Þ:
As a consequence of the above properties, the size of a
system can be obtained as the sum of the sizes of its disjoint
modules. Other interesting and intuitive properties derive
from properties Size 1-Size 3. Among them, we recall the
size monotonicity property, which states that the size never
decreases when adding new elements to the system [9]. In
the following theorem, we prove that the CP2 measure
satisfies the above properties. For a better understanding of
the proof, let us preliminarily map an object-oriented
system design S into the general framework by Briand
et al. Indeed, let us observe that assuming E to be the set of
classes in S, a request of service from one class to another
class establishes a binary relation between classes. Thus, R
may be regarded to as the “request for service” binary
relation on the set of classes E. Now, we are ready to prove
our thesis.
Theorem 1. The Nonnegativity, Null Value, and Module
Additivity properties hold for the CP2 measure.
Proof. Since the CP2 value is obtained as a weighted sum of
nonnegative numbers, the Nonnegativity property holds.
If no class is present in the system design the CP2 value
is trivially null and the Null Value property is also
verified.In order to prove the Module Additivity property, let
S ¼ < E;R > be the system, and let m1 ¼ < Em1; Rm1
>and m2 ¼ < Em2
; Rm2> be its modules,2 such that the
following condition holds:m1�S,m2�S,E ¼ Em1[ Em2
,and Em1
\Em2¼ ;.
Let us observe that the conditions m1 � S, m2 � S,and E ¼ Em1
[ Em2imply that no modification is made
to the classes of S when the system is partitioned intomodules m1 and m2. This means that for each class, thevalues for NOA, NEM, and NSR, will be unchanged afterthe partitioning. Indeed, the NOA, NEM, and NSR valuesin a class are the same no matter how the class is used inthe system, i.e., regardless of the actual connectionsamong modules. In particular, it is worth pointing outthat it may be the case that not all of the public methodsof a class are actually used in a system. Similarly, theNSR counting for a class does take into account thenumber of requests independently of whether eachrequest is sent to a class in the same module or not.Thus, denoting by TUCP , TUCP 0, and TUCP 00 the Total
Unadjusted Class Point values for system S and modulesm1 and m2, respectively, the following equality holds:
TUCP ¼ ðTUCP 0 þ TUCP 00Þ:
Since TCF (which depends on the degree of influence ofgeneral system characteristics) refers to the whole systemand it is common to all modules composing the system,the CP2 value of S can be obtained as the sum of the CP2
values related to m1 and m2:
CP2 ¼ TUCP �TCF ¼ ðTUCP 0 þ TUCP 00Þ�TCF
¼ TUCP 0�TCF þ TUCP 00�TCF ¼ CP20 þ CP2
00:
ut
Thus, we can state that the CP2 measure (as well as CP1)satisfies the necessary conditions for a size measure, asgiven in [9].
5 EMPIRICAL EVALUATION
It is widely accepted that system size is strongly correlatedwith development effort [6], [58], [61], [64]. The theoreticalvalidation carried out in the previous section shows that theClass Point measures satisfy properties that are considerednecessary for size measures. However, it by no meansensures the usefulness of the measures as predictors ofeffort and cost. An empirical evaluation process is insteadrequired to verify their predictive power. Thus, we haveperformed an empirical study meant to determine whetherthe Class Point measures can be used to predict thedevelopment effort of OO systems in terms of person-hours.
We have used data from 40 Java systems developedduring two successive semesters of graduate courses onSoftware Engineering. The use of such data in the validationprocess has provided initial experimental evidence of theeffectiveness of the Class Point approach. It is clear that theuse of students’ projects may threaten the external validityof the experiment and, hence, for the assessment of themethod, further analysis is needed by using data comingfrom the industrial world. Nevertheless, we have worked tomake the validation process as accurate as possible. First ofall, we have put special focus on the data collection phase,following the approach that Basili et al. adopted to validatea set of OO design measures as quality indicators [5]. Withtheir exhaustive explanation of the process carried out, itwas suggested that we divide the students into groups ofthree members, each one representing a development teamin our experimentation. All students had some experiencewith the Java programming language. Moreover, in order toprovide them with necessary skills, they were taught theUnified Software Development Process [8] and the Class Pointmeasures. Uniformity among groups was ensured byequally distributing the most skillful students. Such asettlement allowed us to perform our validation in a stabledevelopment environment (all teams being instructed tofollow the same standards). Each team was asked toimplement a different game using the Unified SoftwareDevelopment Process, to fill in a Class Point worksheet, andto collect all other information needed for the empiricalanalysis. The effective effort required for the whole
COSTAGLIOLA ET AL.: CLASS POINT: AN APPROACH FOR THE SIZE ESTIMATION OF OBJECT-ORIENTED SYSTEMS 61
2. In the given interpretation of the system representation, a module isformed by a set of classes.

development process (including the Requirements, Design,Implementation, and Test workflows) was also preciselymonitored, in terms of person-hours. As a side effect, theexperiment has confirmed our intuition that the Class Pointmeasures do not require a long training, and are not labor-intensive. In fact, this was one of the objectives we aimed at,when the measures were conceived, to overcome one of thecriticisms to FPA [4], [55], [60].
Moreover, in order to gain a more realistic accuracy ofthe derived models and have more reliable nonbiasedresults, we followed a 4-fold cross validation approach.Multiple-fold cross validation has been successfully used inthe literature in order to validate cost estimation models(see, e.g., [11], [12], [14], [28]). The process is especiallyrecommended to increase the accuracy of prediction modelswhen dealing with small data sets.
In Section 5.1, we describe the cross validation processapplied to CP1 and CP2, while in Section 5.2, we analyze theimpact of the complexity factors on the predictive capabilityof the measures. Subsequently, we compare the resultsgained for CP1 and CP2 with other measures, in Section 5.3.
5.1 The Cross Validation Process
To carry out the cross validation process on the 40 dataprojects, the following steps have been performed:
1. We have partitioned the whole data set into fourrandomly selected test sets of equal size. For eachset, we have analyzed the remaining 30 projects toidentify the corresponding training set obtained byremoving influential outliers.
2. We have used each training set to perform anOrdinary Least-Squares (OLS) regression analysisand derive the effort prediction model.
3. Accuracy has been separately calculated for each testset and the resulting values have been aggregatedacross all four test sets.
In what follows, we describe each of the above steps.
5.1.1 Partitioning the Data Set
Table 6 reports the data of the 40 projects, following theorder resulting from the random partition performed. Thus,the first ten projects form the first test set, the subsequentten projects form the second one, and so on.
Descriptive statistics have been computed both for thevariable Effort (denoted by EFH), expressed in terms ofperson-hours, and the variables CP1 and CP2, related to the40 systems used. The summary statistics of those variablesare given in Table 7.
For each test set, we have considered the remaining30 projects as an initial training set. In order to verify thepresence of a positive linear relationship between each ofthe measures CP1 and CP2 and the effort, we used scatterplot graphics. As illustrated in Figs. 2a and 2b, for eithermeasure, each scatter plot shows a positive linear relation-ship between the variables involved. This suggests that alinear regression analysis of EFH and CP1 (respectively,EFH and CP2) can be performed. Prior to that, weperformed a careful outlier analysis in order to removepossible extreme values which may unduly influence themodels obtained from the regression analysis. Thus, as a
first step, for each initial training set, we identified outliersusing boxplots (see Fig. 3). Then, for each outlier, wedetermined Cook’s distance to verify its influence on thegenerated model. Indeed, Cook’s distance is the standardstatistic to detect influential observations—it measures theoverall effect that omitting a given observation would havein the model. Thus, any influential outlier has beenremoved from the corresponding initial training set,resulting in the sets used to derive the models.
The graphics in Fig. 3 show that for CP1 system 27represents the only outlier for training sets 1, 2, and 4. Thisis also an influential observation for those training sets, dueto Cook’s distances greater than the threshold value 0.13,corresponding to the ratio between 4 and the sample size,30 (see Table 8).
Three outliers are instead detected for CP2, namely,system 5, in training set 2, system 16, in training sets 1, 3, 4,and system 27, in training sets 1, 2, and 4. As we canobserve from Cook’s distances reported in Table 8, onlysystem 5 is also an influential observation for training set 2and has been consequently removed from it. The other datapoints have been retained since they are not influentialobservations and cannot prejudice the results.
5.1.2 OLS Regression Analysis to Derive Effort
Prediction Models
In order to perform empirical validation of the CP1 and CP2
measures, we have applied an Ordinary Least-Squaresregression analysis. It allows us to determine the equationof a line that can be used to predict the development effortin terms of the number of person-hours required. Thismodeling technique has often been used for validationpurposes due to its useful predictive capability and to themature statistical packages supporting it [14].3
When applying the OLS regression, several crucialindicators have been taken into account to evaluate thequality of the prediction. In particular, the goodness of fit ofa regression model has been determined by the Coefficientof Determination, R2, which measures the percentage ofvariation in the dependent variable explained by theindependent variable. Moreover, to evaluate the statisticalsignificance we have performed a t-test and determined thep-value and the t-value of the coefficient and intercept foreach model. In particular, a significance threshold of 0.05for the p-value is commonly used to establish whether avariable is a significant predictor. In other words, when it isless than 0.05, we can reject the hypothesis that thecoefficient is zero. The reliability of the predictor is thengiven by the t-value of the coefficient. The commonly usedthreshold is 1.5, so a t-value greater than 1.5 indicates thatthe predictor is reliable at a risk level of 5 percent or lessand hence it is a reliable predictor. It is worth noting thatthe p-value of the coefficient coincides with the overallp-value of the model (denoted by Signif F), which is relatedto the probability that the independent variable impacts thedependent variable, i.e., that the regression equation issignificant. Moreover, squaring the t-valuewe can obtain theF value, due to the relation between Student’s t distributionand Fisher-Snedecor’s F distribution. As for the intercept,
62 IEEE TRANSACTIONS ON SOFTWARE ENGINEERING, VOL. 31, NO. 1, JANUARY 2005
3. For our study, we employed the package SPSS for Windows 9.0.

COSTAGLIOLA ET AL.: CLASS POINT: AN APPROACH FOR THE SIZE ESTIMATION OF OBJECT-ORIENTED SYSTEMS 63
TABLE 6The Data for the 40 Projects

the corresponding p-value provides the probability that it is
zero. Thus, also for the intercept a high t-value, together
with a low p-value indicate that the null hypothesis can be
rejected.In the following, we provide the results of the OLS
regression carried out with each training set. In particular,
such results are given in Fig. 4, where the data concerning
the above indicators are reported. We can observe that for
each training set, the linear regression analysis shows a high
R2 value, for both CP1 and CP2, with a slightly higher value
for CP2. As an example, consider training set 1. For CP1, we
have R2 ¼ 0:86, which indicates that 86 percent is the
amount of variance of the dependent variable EFH that is
explained by the model related to CP1, whereas for CP2, we
have R2 ¼ 0:95 indicating that 95 percent is the amount that
is explained by the model related to CP2. For this training
set, the equation of the regression model for CP1 is:
EFH ¼ 0:843�CP1 þ 241:853;
where the coefficient 0.843 and the intercept 241.853 are
significant at level 0.05, as from the t-test. The equation of
the regression model for CP2 on the other hand, is
EFH ¼ 0:912�CP2 þ 239:751;
where the coefficient 0.912 and the intercept 239.751 are
again significant at level 0.05.
5.1.3 Accuracy Evaluation of the Prediction Models
In order to assess the acceptability of the effort prediction
models, we have adopted the criteria suggested by Conte et
al. [25]. In particular, we considered the Magnitude of
Relative Error, which is defined as
MRE ¼ jEFHreal � EFHpredj=EFHreal;
where EFHreal and EFHpred are the actual and predicted
efforts, respectively. The rationale behind this measure is
that the gravity of the absolute error is proportional to the
size of the observations. Such value has been calculated for
each of the 10 observations in any test set, using the models
derived for both CP1 and CP2. For each test set, we have
evaluated the prediction accuracy by taking into account a
summary measure, given by the Mean of MRE (MMRE), to
measure the aggregation of MRE over the 10 observations.
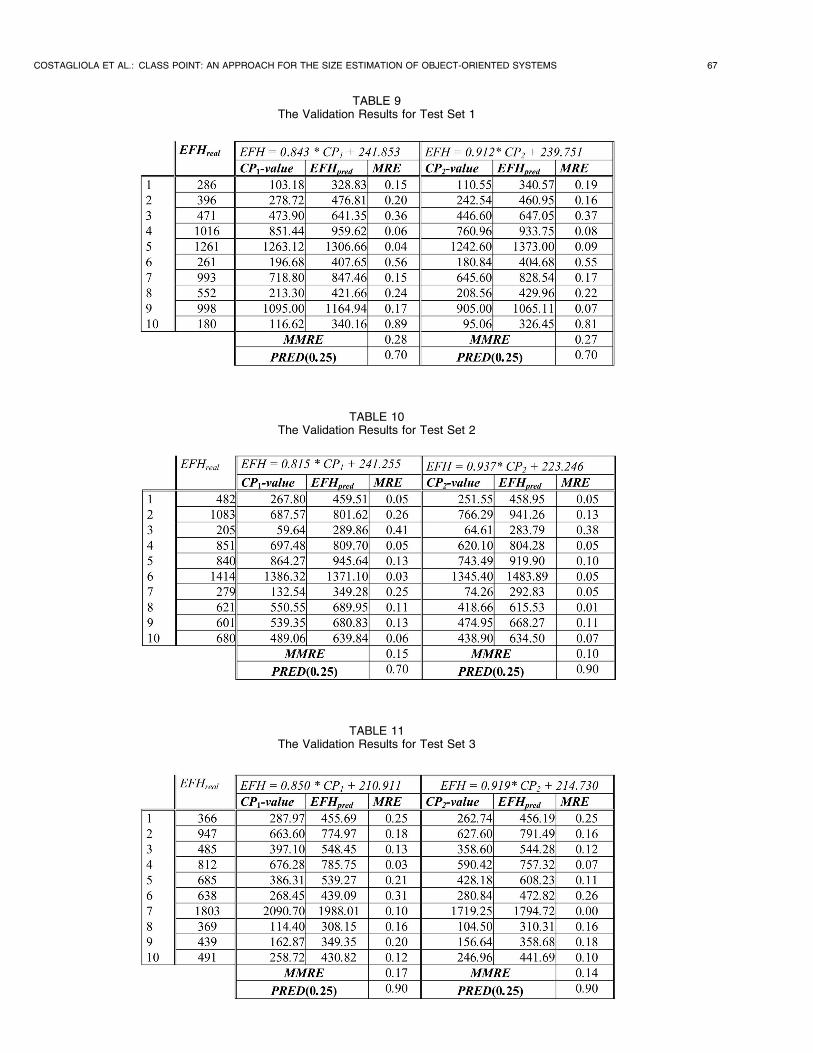
The values of such measures are reported in Tables 9, 10, 11,
and 12. In particular, we can observe that only the model
derived from training set 1 for CP1, exhibits MMRE value
(slightly) greater than 0.25, which represents an acceptable
threshold for an effort prediction model, as suggested by
Conte et al. All other models satisfy that condition.
64 IEEE TRANSACTIONS ON SOFTWARE ENGINEERING, VOL. 31, NO. 1, JANUARY 2005
TABLE 7Descriptive Statistics of EFH, CP1, and CP2
Fig. 2. The scatter plots for (a) EFH and CP1, and (b) EFH and CP2, resulting from the OLS regression applied to the four training sets.

Moreover, we have considered another meaningful mea-sure, namely the prediction at level l, defined as
PREDðlÞ ¼ k=N;
where k is the number of observations whose MRE is lessthan or equal to l, andN is the total number of observations.Again, according to Conte et al., at least 75 percent of thepredicted values should fall within 25 percent of their actualvalues. In other words, a good effort prediction modelshould have PREDð0:25Þ � 0:75. As we can observe fromthe results shown in Tables 9, 10, 11, and 12, the requiredcondition is satisfied for most of the derived models. Theexceptions present PREDð0:25Þ ¼ 0:7 and lie in the models
derived from training set 1 and in the models derived fromtraining sets 2 and 4 for CP1.
Once accuracy has been separately calculated for eachtest set, the resulting values have been aggregated across allfour sets. Table 13 reports the results of such analysis.
As we can see, the aggregate MMRE and aggregatePREDð0:25Þ suggest that both CP1 and CP2 are good forestimating the development effort. Moreover, of the twomeasures, CP2 exhibits a slightly better performance, thusconfirming our intuition that attributes may contribute,together with the NEM and NSR measures, to predict thedevelopment effort of object-oriented systems. Neverthe-less, the knowledge of the number of attributes may not bevery accurate early in the development process, whereas thenumber of external methods and the number of requestedservices are usually available earlier than the number ofattributes. This suggests the use of the CP1 measure at thebeginning of the development process, in order to obtain apreliminary effort estimation, which can be refined byemploying CP2 when the number of attributes is known. Asa matter of fact, CP2 is strongly correlated to CP1, as shownby the OLS regression carried out on the 40 projects, whoseresults are summarized in Fig. 5.
5.2 Analyzing the Impact of the Complexity Factors
As pointed out in Section 3, some studies reported in theliterature revealed that the application of the Processing
COSTAGLIOLA ET AL.: CLASS POINT: AN APPROACH FOR THE SIZE ESTIMATION OF OBJECT-ORIENTED SYSTEMS 65
Fig. 3. The boxplots derived for the four training sets for variables CP1 and CP2.
TABLE 8The Values of Cook’s Distance for Outliers of CP1 and CP2

66 IEEE TRANSACTIONS ON SOFTWARE ENGINEERING, VOL. 31, NO. 1, JANUARY 2005
Fig. 4. The results of the OLS regression analysis for evaluating the EFH using CP1 and CP2 for each training set.
COSTAGLIOLA ET AL.: CLASS POINT: AN APPROACH FOR THE SIZE ESTIMATION OF OBJECT-ORIENTED SYSTEMS 67
TABLE 9The Validation Results for Test Set 1
TABLE 10The Validation Results for Test Set 2
TABLE 11The Validation Results for Test Set 3

Complexity Factor to the raw Function Point measure canhave little impact on the performance of Function Points inthe cost estimation process [38], [43], [68]. It is thereforeinteresting to verify if this is also the case for the Class Pointapproach, i.e., whether or not the 14 Function Point factorsare useful in our context, and also if the four additionalfactors enhance the prediction accuracy. In this section, wereport on the results of the 4-fold cross validationperformed on the unadjusted CP1 and CP2 measures(denoted by TUCP1 and TUCP2), and on 14-CP1 and14-CP2, which denote the measures obtained by consider-ing only the 14 Function Point factors. Data related to thesemeasures are reported in Table 14, while Table 15 showssummary descriptive statistics of the measures considered.
The models obtained for each training set exhibit ap-value equal to 0.000, denoting that each regressionequation is significant. For the sake of simplicity, inTable 16 we only report the aggregate MMRE andPREDð0:25Þ resulting from the cross validation, for eachof the considered measures.
In the table, we note that the values obtained withTUCP1 and TUCP2 are not too different from thoseobtained with the measures adjusted using the 14 FPAcharacteristics. These results raise doubts about the effectiveusefulness of the FPA characteristics for the evaluation ofthe Class Point measures, in analogy to the questions posedby several researchers for FPA [38], [43], [68]. Moreover, bycomparing the above results with the ones reported inTable 13, we note a slightly better performance in terms ofMMRE for CP1 and CP2. This improvement may have beendetermined by the use of the four additional characteristics.Nevertheless, this could depend on the specific data set weconsidered, related to interaction intensive applications. Inany case, the small enhancement achieved is not sufficientto support the importance of the Technical Complexity Factorin the Class Point measures. Further investigation is there-fore worthwhile, in order to understand whether theproposed adjustment improves the performance of theClass Point measures, or whether the raw measures shouldbe used instead.
5.3 Comparison with Other Size Measures
In the present section, we present the results of thecomparative study that we have performed with respectto each of the single basic measures employed in the ClassPoint approach (i.e., NEM, NOA, and NSR), and with
68 IEEE TRANSACTIONS ON SOFTWARE ENGINEERING, VOL. 31, NO. 1, JANUARY 2005
TABLE 12The Validation Results for Test Set 4
TABLE 13Aggregate Accuracy Evaluation
Fig. 5. Results of the OLS regression analysis with CP1 as independent
variable and CP2 as dependent variable.

respect to the measures obtained by summing the basic
ones. Again, the comparative study is based on the 4-fold
cross validation technique described in Section 5.1. As a
matter of fact, we first carried out an OLS regression on the
training sets, obtained by removing the influential outliers.
Then, we evaluated the performance of the derived models
for all considered measures, using the data coming from the
corresponding testing sets.
Table 17 shows a summary descriptive statistics of the
measures considered. We recall that data about NEM, NOA,
and NSR for the 40 projects are listed in Table 6.Again, for the sake of simplicity, in Table 18 we report
only the aggregate MMRE and PREDð0:25Þ resulting from
the cross validation, for each of the considered measures.We note that among the single measures, the best
performance is gained by NEM and NEM+NOA+NSR, for
COSTAGLIOLA ET AL.: CLASS POINT: AN APPROACH FOR THE SIZE ESTIMATION OF OBJECT-ORIENTED SYSTEMS 69
TABLE 14Data of the Unadjusted Class Point Measures and of the 14-CP1 and 14-CP2
TABLE 15Descriptive Statistics of the Measures Considered
TABLE 16Aggregate Accuracy Evaluation of the Prediction Models Derived from the Considered Measures

which we have acceptable MMRE values, and PREDð0:25Þvalues very close to the indicated threshold. An acceptableMMRE value also results for Size2 but only 63 percent of
the values predicted by the corresponding model fall within
25 percent of their actual values. All other measures do not
satisfy the considered criteria, indicating a low accuracy inthe corresponding prediction models.
Comparing the above results with the ones of Section 5.1,
we may derive two main conclusions. First, CP1 and CP2
are better correlated to effort than any single measure
composing them. Second, the mere sum of the singlemeasures cannot be sufficient to enhance the performance
of a prediction model, but a more suitable combination is
required.In order to complete our analysis, we have carried out a
multivariate OLS regression using as independent variablesthe basic measures of the Class Point approach. Again, the
4-fold cross validation technique has been applied by
carrying out a multivariate OLS regression on the fourtraining sets, and then evaluating the performance of the
derived models, using the data coming from the corre-
sponding testing sets. Table 19 reports the aggregateMMRE
and PREDð0:25Þ resulting from such analysis. Compared
with the values reported in Table 13, we can deduce that the
Class Point measures exhibit a more accurate predictive
capability. In any case, this study has confirmed once again
that the use of the NOA measure may yield a better
predictive accuracy in models which are based on a
multivariate regression as well.
6 FINAL REMARKS
Several measures have been defined so far in order to
estimate the size of software systems. System-level mea-
sures are especially important for project managers who
could benefit from an overall view of the system [32]. As a
matter of fact, tasks such as planning software project
development, and estimating cost and effort, are more
effectively performed when a size estimate of the whole
system is available.Among system-level measures, Function Points have
achieved a worldwide acceptance to estimate the size of
business systems and to indirectly predict the effort, cost
and duration of their projects [2], [27], [42]. The method
70 IEEE TRANSACTIONS ON SOFTWARE ENGINEERING, VOL. 31, NO. 1, JANUARY 2005
TABLE 17Descriptive Statistics of the Measures Considered for the Comparison Analysis
TABLE 18Aggregate Accuracy Evaluation of the Prediction Models Derived from Basic and Combined Size Measures
TABLE 19Aggregate Accuracy Evaluation of the Prediction Models Derived from Multivariate OLS Regression Analyses
provides an estimate of software size by measuring the
functionality of the system to be developed.Although originally conceived to be independent of the
methodology used to develop the system under measure-
ment, the application of the FP method turns out to be
rather unnatural when applied to object-oriented systems
[42], [44]. For example, Kemerer and Porter conclude their
empirical study on how to improve the reliability of
FP measurement by stating that “The advent of event
driven, object-oriented systems ... may require redefinition
COSTAGLIOLA ET AL.: CLASS POINT: AN APPROACH FOR THE SIZE ESTIMATION OF OBJECT-ORIENTED SYSTEMS 71
Fig. 6. Class point calculation worksheet.

of FP’s or the development of one or several new measuresto identify system size” [42]. Many researchers agree thatthe FP method can be generalized in order to besuccessfully used for other types of systems (e.g. engineer-ing, scientific and real-time systems) and for differentprogramming paradigms [6], [23], [27], [35], [66], [67]. As amatter of fact, Verner and Tate suggest a general FP-likemodel for a more objective and accurate size estimation,which can be tailored to any specific software developmentenvironment [69].
The Class Point approach presented in this paper, reflectsthe main features of the FP-like general model proposed byVerner and Tate, namely, the partitioning of a system intodifferent component types with different sizing criteria foreach type, the sizing of the individual components, the sumof the component sizes and an overall system adjustment toallow for global factors. The proposed partitioning of theclasses into different types which are sized with differentrules is not tailored to a specific application environmentand this provides a high level of flexibility of the method.
The Class Point approach provides a system-level sizemeasure by suitably combining well known OO measures,which consider specific aspects of a single class. Inparticular, two measures are proposed, namely, CP1 andCP2. CP1 is meant to be used at the beginning of thedevelopment process to carry out a preliminary sizeestimation, which can be refined by applying CP2 wheninformation about the number of attributes is also available.As a matter of fact, the empirical study reported in thepaper has shown that each of the proposed measures CP1
and CP2 can be effectively used during the design phase topredict the effort values with a high degree of confidence. Inparticular, a better performance of the CP2 measure hasresulted with respect to CP1, supporting the intuition thatattributes can be profitably exploited in the estimation ofsystem size. On the other hand, the number of attributes ofeach class may not be very accurate early in the develop-ment process. Indeed, the number of attributes is likely tobe available later in the process than the number of externalmethods and requested services.
The empirical study presented in the paper hassuggested that the CP1 and CP2 measures may have abetter predictive capability than each of their singleconstituents. Moreover, the proposed aggregation techni-que turns out to be effective. In fact, the comparativeanalysis reveals that the mere sum of single measurescannot be sufficient to enhance the performance of aprediction model.
Let us conclude by remarking that further analysis isneeded for assessment of the Class Point method. Indeed, inthe present paper, we have provided a preliminaryempirical evaluation, based on data coming from 40 Javasystems, developed during two successive semesters ofgraduate courses on software engineering. The results ofsuch analysis lead us to believe in the effectiveness of theapproach. Nevertheless, we are aware that the use ofstudents’ projects may threaten the external validity of theexperiment and that data coming from the industrial worldare needed for a more reliable validation. Industrial datacould be also used to analyze the impact of the Technical
Complexity Factor. Indeed, the study reported in the paper
seems to suggest that the Processing Complexity adjustment
does not significantly affect the prediction accuracy of the
Class Point measures. Thus, further investigation would
allow us to understand whether the Technical Complexity
Factor is effectively useful, or whether the unadjusted Class
Point measures should be adopted.
7 Appendix
The class point calculation worksheet is presented in Fig. 6.
ACKNOWLEDGMENTS
The authors would like to gratefully acknowledge the
reviewers for their helpful comments and constructive
criticisms. Thanks are also due to Maria Rizzo for
discussions held during this work.
REFERENCES
[1] J.-M. Aalto and A. Jaaksi, “Object-Oriented Development ofInteractive Systems with OMT++,” Proc. Conf. Technology ofObject-Oriented Languages and Systems (TOOLS 14), pp. 205-218,1994.
[2] A.J. Albrecht, “Measuring Application Development Productiv-ity,” Proc. Joint SHARE/GUIDE/IBM Application Development Symp.,pp. 83-92, 1979.
[3] G. Antoniol, C. Lokan, G. Caldiera, and R. Fiutem, “A FunctionPoint-Like Measure for Object-Oriented Software,” J. EmpiricalSoftware Eng., vol. 4, pp. 263-287, Sept. 1999.
[4] R.D. Banker, R.J. Kauffman, C. Wright, and D. Zweig, “Automat-ing Output Size and Reuse Metrics in a Repository-BasedComputer-Aided Software Engineeering (CASE) Environment,”IEEE Trans. Software Eng., vol. 20, no. 3, pp. 169-187, Mar. 1994.
[5] V.R. Basili, L.C. Briand, and W.L. Melo, “A Validation of Object-Oriented Design Metrics as Quality Indicators,” IEEE Trans.Software Eng., vol. 22, no. 10, pp. 751-761, Oct. 1996.
[6] B.W. Boehm, B. Clark, and E. Hiriwitz, “Cost Models for FutureLife Cycle Processes: COCOMO 2. 0,” Ann. Software Eng., vol. 1,no. 1, pp. 1-24, 1995.
[7] G. Booch, Object-Oriented Analysis and Design, second ed.Benjamin/Cummings, 1994.
[8] G. Booch, I. Jacobson, and J. Rumbaugh, The Unified SoftwareDevelopment Process. Addison-Wesley, 1999.
[9] L.C. Briand, S. Morasca, and V.R. Basili, “Property Based SoftwareEngineering Measurement,” IEEE Trans. Software Eng., vol. 22,no. 1, pp. 68-86, Jan. 1996.
[10] L. Briand, K. El Emam, and S. Morasca, “On the Application ofMeasurement Theory in Software Engineering,” J. EmpiricalSoftware Eng., vol. 1, pp. 61-68, 1996.
[11] L. Briand, K. El Emam, D. Surmann, I. Wiekzorek, and K.Maxwell, “An Assessment and Comparison of Common SoftwareCost Estimation Modeling Techniques,” Proc. Int’l Conf. SoftwareEng. (ICSE ’99), pp. 313-322, 1999.
[12] L. Briand, T. Langley, and I. Wiekzorek, “A Replicated Assess-ment and Comparison of Common Software Cost ModelingTechniques,” Technical Report ISERN-99-15, International Soft-ware Eng. Research Network, 1999.
[13] L. Briand, E. Arisholm, S. Counsell, F. Houdek, and P. Thevenod-Fosse, “Empirical Studies of Object-Oriented Artifacts, Methods,and Processes: State of The Art and Future Directions,” J. EmpiricalSoftware Eng., vol. 4, pp. 387-404, Sept. 1999.
[14] L. Briand and J. Wust, “Modeling Development Effort in Object-Oriented Systems Using Design Properties,” IEEE Trans. SoftwareEng., vol. 27, no. 11, pp. 963-986, Nov. 2001.
[15] F. Brito e Abreu, “The MOOD Metrics Set,” Proc. ECOOP’95Workshop Metrics, 1995.
[16] F. Brito e Abreu and R. Carapuca, “OO Software Engineering:Measuring and Controlling the Development Process,” Proc.Fourth Int’l Conf. Software Quality, 1994.
72 IEEE TRANSACTIONS ON SOFTWARE ENGINEERING, VOL. 31, NO. 1, JANUARY 2005

[17] F. Brito e Abreu, M. Goulao, and R. Estevers, “Toward the DesignQuality Evaluation of OO Software Systems,” Proc. Fifth Int’l Conf.Software Quality, 1995.
[18] F. Brito e Abreu and W. Melo, “Evaluating the Impact of OODesign on Software Quality,” Proc. Third Int’l Software MetricsSymp., 1996.
[19] B. Bruegge, K. O’Toole, and D. Rothenberger, “Design Considera-tions for an Accident Management System,” Proc. Second Int’l Conf.Cooperative Information Systems, pp. 90-100, 1994.
[20] J.M. Carrol, Scenario-Based Design. John Wiley, 1995.[21] S.R. Chidamber and C.F. Kemerer, “A Metrics Suite for Object-
Oriented Design,” IEEE Trans. Software Eng., vol. 20, no. 6, pp. 476-493, June 1994.
[22] P. Coad and J. Nicola, Object-Oriented Programming. Prentice Hall,1993.
[23] P. Coad and E. Yourdon, Object-Oriented Analysis, second ed.Yourdon Press, 1991.
[24] D. Collins, Designing Object-Oriented User Interfaces. RedwoodCity, Calif.: Benjamin/Cummings, 1995.
[25] S.D. Conte, H.E. Dunsmore, and V.Y. Shen, Software Eng. Metricsand Models. Menlo Park, Calif.: Benjamin/Cummings, 1986.
[26] G. Costagliola, F. Ferrucci, G. Tortora, and G. Vitiello, “Towardsa Software Size Metrics for Object-Oriented Systems,” Proc.AQUIS ’98 Conf., pp. 121-126, 1998.
[27] J.B. Dreger, Function Point Analysis. Prentice Hall, 1989.[28] K. El Emam, “A Primer on Object-Oriented Measurement,” Proc.
Seventh IEEE Int’l Sofware Metrics Symp. (METRICS ’01), pp. 185-188, 2001.
[29] N. Fenton, “Software Measurement: A Necessary Scientific Basis,”IEEE Trans. Software Eng., vol. 20, no. 3, pp. 199-206, Mar. 1994.
[30] T. Fetcke, A. Abran, and T.-H. Nguyen, “Mapping the OO-Jacobson Approach into Function Point Analysis,” Proc. IFPUG1997 Spring Conf., pp. 134-142, 1997.
[31] I.M.Graham,Migrating toObject Technology.Addison-Wesley, 1995.[32] R. Harrison, S.J. Counsell, and R.V. Nithi, “An Evaluation of the
MOOD Set of Object-Oriented Software Metrics,” IEEE Trans.Software Eng., vol. 24, no. 6, pp. 491-496, June 1998.
[33] B. Henderson-Sellers, Object-Oriented Metrics: Measures of Complex-ity. Prentice-Hall, 1996.
[34] Function Point Counting Practices Manual, Release 4.1.1, Int’lFunction Point Users Group, 2001.
[35] M. Itakura and A. Takayanagi, “A Model for Estimating ProgramSize and its Evaluation,” Proc. Sixth Int’l Conf. Software Eng.,pp. 104-109, 1982.
[36] A. Jaaksi, “Object-Oriented Specification of User Interfaces,”Software-Practice and Experience, vol. 25, pp. 1203-1221, Nov. 1995.
[37] I. Jacobson, M. Christerson, P. Jonsson, and G. Overgaard, Object-Oriented Software Engineering: A Use Case Driven Approach.Addison-Wesley, 1992.
[38] D. Jeffrey, G.C. Low, and M. Barnes, “A Comparison of FunctionPoint Counting Techniques,” IEEE Trans. Software Eng., vol. 19,no. 5, pp. 529-532, May 1993.
[39] J.A. Johnson, B.A. Nardi, C.L. Zarmer, and J.R. Miller, “ACE:Building Interactive Graphical Applications,” Comm. ACM, vol. 36,pp. 41-55, Apr. 1993.
[40] C. Jones, A Short History of Function Points and Feature Points.Software Productivity Research Incorporated, 1988.
[41] S.H. Kan, Metrics and Models in Software Quality Engineering.Addison-Wesley, 1995.
[42] C.F. Kemerer and B.S. Porter, “Improving the Reliability ofFunction Point Measurement: An Empirical Study,” IEEE Trans.Software Eng., vol. 18, no. 11, pp. 1011-1024, Nov. 1992.
[43] C.F. Kemerer, “An Empirical Validation of Software CostEstimation Models,” Comm. ACM, vol. 30, no. 5, pp. 416-429,May 1987.
[44] J. Keyes, “New Metrics Needed for New Generation: Lines ofCode, Function Points Won’t Do at the Dawn of the Graphical,Object Era,” IEEE Software, vol. 12, no. 6, pp. 42-52, 1992.
[45] B.A. Kitchenham, N. Fenton, and S.L. Pfleeger, “Towards aFramework for Software Measurement Validation,” IEEE Trans.Software Eng., vol. 21, no. 12, pp. 929-944, Dec. 1995.
[46] B. Kitchenham and K. Kansala, “Inter-Item Correlations amongFunction Points,” Proc. IEEE Int. Software Metrics Symp., pp. 11-14,1993.
[47] D. Kohlert, K. Rodham, and D. Olsen, “Implementing a GraphicalMulti-User Interface Toolkit,” Software-Practice and Experience,vol. 23, no. 9, pp. 981-999, 1993.
[48] G.E. Krasner and S.T. Pope, “A Cookbook for Using the Model-View-Controller User Interface Paradigm in Smaltalk-80,” J. Object-Oriented Programming, vol. 1, pp. 26-49, May-June 1988.
[49] K.B. Lakshmanan, S. Jayaprakash, and P.K. Sinha, “Properties ofControl-Flow Complexity Measures,” IEEE Trans. Software Eng.,vol. 17, pp. 1289-1295, Dec. 1991.
[50] W. Li and S. Henry, “Object-Oriented Metrics that PredictMaintainability,” J. Systems and Software, vol. 23, pp. 111-122, 1993.
[51] W. Li, S. Henry, D. Kafura, and R. Schulman, “Measuring Object-Oriented Design,” J. Object Oriented Programming, July-Aug. 1995.
[52] Y-B. Lin and D. Daly, “A Flexible Graphical User Interface forPerformance Modeling,” Software-Practice and Experience, vol. 25,no. 2, pp. 193-216, 1995.
[53] M.A. Linton, J.M. Vlissides, and P.R. Calder, “Composing UserInterfaces with InterViews,” Computer, vol. 22, pp. 8-22, Feb. 1989.
[54] M. Lorenz and J. Kidd, Object-Oriented Software Metrics. PrenticeHall Object-Oriented Series, 1994.
[55] G.C. Low and D.R. Jeffrey, “Function Points in the Estimation andEvaluation of the Software Process,” IEEE Trans. Software Eng.,vol. 16, pp. 64-71, Jan. 1990.
[56] J.E. Matson, B.E. Barrett, and J.M. Mellichamp, “SoftwareDevelopment Cost Estimation Using Function Points,” IEEETrans. Software Eng., vol. 20, pp. 275-287, Apr. 1994.
[57] A.F. Minkiewicz, “Measuring Object Oriented Software withPredictive Object Points,” Proc. Conf. Applications in SoftwareMeasurements (ASM ’97), 1997.
[58] V.B. Misic and D.N. Tesic, “Estimation of Effort and Complexity:an Object-Oriented Case Study,” J. Systems and Software, vol. 41,pp. 133-143, 1999.
[59] S. Morasca, L.C. Briand, V.R. Basili, L.J. Weyuker, and M.V.Zelkowitz, “Comments on Towards a Framework for SoftwareMeasurement Validation,” IEEE Trans. Software Eng., vol. 23,pp. 187-188, Mar. 1997.
[60] S. Moser, B. Henderson-Sellers, and V.B. Misic, “MeasuringObject-Oriented Business Models,” Proc. TOOL Pacific’97 Conf.,1997.
[61] S. Moser, B. Henderson-Sellers, and V.B. Misic, “Cost EstimationBased on Business Models,” J. Systems and Software, vol. 49, pp. 33-42, 1999.
[62] B.A. Myers and M.B. Rosson, “Survey on User InterfaceProgramming,” Proc. Conf. Human Factors in Computing Systems(SIGGHI ’92), pp. 195-202, 1992.
[63] B.A. Myers, R.G. McDaniel, R.C. Miller, A.S. Ferrency, A.Faulring, B.D. Kyle, A. Mickish, A. Klimovitski, and P. Doane,“The Amulet Environment: New Models for Effective UserInterface Software Development,” IEEE Trans. Software Eng.,vol. 23, pp. 347-365, June 1997.
[64] P. Nesi and T. Querci, “Effort Estimation and Prediction of Object-Oriented Systems,” J. Systems and Software, vol. 42, pp. 89-102,1998.
[65] M. Norman, D.P. Browne, and P.A. Totterdell, Adaptive UserInterfaces. London: Academic Press, 1990.
[66] J. Rumbaugh, M. Blaha, W. Premerlani, F. Eddy, and W. Lorensen,Object-Oriented Modeling and Design. Prentice Hall, 1991.
[67] I. Sommerville, Software Engineering, Addison Wesley, 1996.[68] C.R. Symons, “Function Point Analysis: Difficulties and Improve-
ments,” IEEE Trans. Software Eng., vol. 14, pp. 2-11, Jan. 1988.[69] J. Verner and G. Tate, “A Software Size Model,” IEEE Trans.
Software Eng., vol. 18, pp. 265-278, Apr. 1992.[70] E.J. Weyuker, “Evaluating Software Complexity Measures,” IEEE
Trans. Software Eng., vol. 14, pp. 1357-1365, Sept. 1988.[71] S.A. Whitmire, “3D Function Points: Applications for Object-
Oriented Software,” Proc. ASM’96 Conf., 1996.[72] H. Zuse, “Reply to: Property-Based Software Engineering Mea-
surement,” IEEE Trans. Software Eng., vol. 23, p. 533 Aug. 1997.[73] H. Zuse, Software Complexity: Measures and Methods. Berlin: Walter
de Gruyter, 1990.
COSTAGLIOLA ET AL.: CLASS POINT: AN APPROACH FOR THE SIZE ESTIMATION OF OBJECT-ORIENTED SYSTEMS 73

Gennaro Costagliola received the Laureadegree cum laude in computer science fromthe University of Salerno, Italy in 1987 and theMS degree in computer science from theUniversity of Pittsburgh in 1991. From 1991 to1993, he was a visiting researcher at theUniversity of Pittsburgh. He is currently aprofessor and the director of the Laurea degreecourses in computer science at the University ofSalerno. His research interests include software
engineering, visual languages, parsing technologies, multimedia data-bases, Web technologies, and e-learning. He is a member of ACM,IEEE, and IEEE Computer Society.
Filomena Ferrucci received the Laurea degreein computer science (cum laude) from theUniversity of Salerno (Italy) in 1990 and thePhD degree in applied mathematics and com-puter science from the University of Naples(Italy) in 1995. From 1995 to 2001, she was aresearch associate at the University of Salerno,where she is currently an associate professor incomputer science and teaches courses onsoftware engineering and Web information
systems. She was a program cochair of the 14th InternationalConference on Software Engineering and Knowledge Engineering anda guest editor of the special issue of the International Journal ofSoftware Engineering and Knowledge Engineering dedicated to aselection of the best papers of the conference. She has served asProgram Committee member for several international conferences. Hermain research interests are in software metrics for the effort estimationof OO systems and Web applications. Her other research interestsinclude software-development environments, visual languages, Human-Computer Interaction, and e-learning. She is coauthor of several paperspublished in international journals, books, and proceedings of refereedinternational conferences.
Genoveffa Tortora graduated in computerscience in 1978. Since 1990, she has been afull professor at University of Salerno, Italy,where she teaches database systems andfundamentals of computer science. In 1998,she was a founding member of the Departmentof Mathematics and Computer Science, actingas chair until October 2000. Since November2000, she has been the dean of the Faculty ofMathematical, Natural, and Physical Sciences.
Her research interests include software-development environments,visual languages, geographical information systems, and pictorialinformation systems. She is author and coauthor of several paperspublished in scientific journals, books, and proceedings of refereedconferences, and is coeditor of two books. She is an associate editorand reviewer for international scientific journals. She has been programchair and program committee member in a number of internationalconferences. From 1999-2003, she was a steering committee memberof the IEEE Symposium on Human-Centric Computing Languages andEnvironments. She is a senior member of the IEEE Computer Society.
Giuliana Vitiello graduated in computer sciencein 1991. She received the PhD degree in appliedmathematics and computer science from Uni-versity of Salerno, Italy, in 1996. She joined theDepartment of Mathematics and ComputerScience at University of Salerno as a researcherin July 1998. Since September 2002, she hasbeen an associate professor with the samedepartment, teaching courses on human com-puter interaction and object oriented program-
ming. In 2000, she was a visiting researcher at Cleveland StateUniversity. She has worked on grammar specification of interactive andvisual languages on diagnosis of logic programs, on visual querylanguages for geographic information systems, and on softwaredevelopment effort prediction models. On those topics, she haspublished several scientific papers in international journals, contributedvolumes, and conference proceedings. She has served as programcommittee member for several international conferences and, in 2002,she was program cochair of the 14th International Conference onSoftware Engineering and Knowledge Engineering. She is an ACMSIGCHI member.
. For more information on this or any other computing topic,please visit our Digital Library at www.computer.org/publications/dlib.
74 IEEE TRANSACTIONS ON SOFTWARE ENGINEERING, VOL. 31, NO. 1, JANUARY 2005