
Clash of the titans - In Search of the Perfect Investment
79
December 7, 2012 Clash of the titans Equity Research Survey results confirm ecosystems drive platform stickiness Many debate whether “open” or “closed” platforms will dominate today’s compute landscape of smartphones and tablets. This debate misses a deeper point on market structure, and we view the concept of two-sided markets, in which platform users consume an ecosystem of complements, as a more helpful framework for the discussion. In a two-sided market, a company creates a platform (iOS, Android, etc) that enables other companies, or complements (Facebook for example), to sell their products and services to platform users. Indeed, our survey of 1K+ mobile users highlights the ways ecosystems drive platform stickiness. Tablet and smartphone share likely converge over time Platform stickiness is set to drive convergence of OS share in tablets and smartphones as tablets increasingly become an anchor device given users spend more for content on these devices. If left without a meaningful competitor in tablets, Apple's dominant share is likely to pull its smartphone share steadily upward over time. Thus, a credible tablet becomes a strategic imperative for Google, or they run the risk of a steady decline of Android smartphone share starting in CY13. For Microsoft, 2013 will be critical given it is coming from behind in both device areas and platform loyalty is raising switching costs. HTML5 is a way off; but TV likely the next big battleground Market disruption related to HTML5, the forthcoming web code standard with greatly improved media streaming, is at least 3-5 years out, and as such platform loyalty will continue to build in the meantime. Looking ahead, we believe the next big market disruption could be in the form of smart TVs. These devices, integrated with existing mobile ecosystems, could be the battleground for the next big compute revolution. As such, smart TVs’ ability to become another platform component will likely mean significant investment from Apple, Microsoft, Google, Samsung and others. Grading the group We call out companies that are well positioned: Apple (AAPL, CL Buy, $760PT), Facebook (FB, Buy, $35PT), and Samsung (005930.KS, Buy, ₩1.75mn PT); those straddling the line: Amazon (AMZN, Buy, $280PT); and companies that are challenged: Google (GOOG, Neutral, $680PT), Intel (INTC, Sell, $16PT), and Microsoft (MSFT, Neutral, $31PT) in the context of platform adoption. Heather Bellini, CFA (212) 357-7710 [email protected] Goldman, Sachs & Co. Bill Shope, CFA (212) 902-6834 [email protected] Goldman, Sachs & Co. Michael Bang +82(2)3788-1655 [email protected] Goldman Sachs (Asia) L.L.C., Seoul Branch Brian Baytosh (917) 343-4120 [email protected] Goldman, Sachs & Co. Sonya Banerjee (212) 357-4322 [email protected] Goldman, Sachs & Co. Perry Huang (212) 902-6785 [email protected] Goldman, Sachs & Co. Elizabeth Borbolla (212) 357-4977 [email protected] Goldman, Sachs & Co. Cristina Colon, CFA (212) 902-9913 [email protected] Goldman, Sachs & Co. Stephen Oshman (917) 343-3128 [email protected] Goldman, Sachs & Co. Goldman Sachs does and seeks to do business with companies covered in its research reports. As a result, investors should be aware that the firm may have a conflict of interest that could affect the objectivity of this report. Investors should consider this report as only a single factor in making their investment decision. For Reg AC certification and other important disclosures, see the Disclosure Appendix, or go to www.gs.com/research/hedge.html. Analysts employed by non-US affiliates are not registered/qualified as research analysts with FINRA in the U.S. The Goldman Sachs Group, Inc. Global Investment Research
-
Upload
khangminh22 -
Category
Documents
-
view
2 -
download
0
Transcript of Clash of the titans - In Search of the Perfect Investment

December 7, 2012
Clash of the titans
Equity Research
Survey results confirm ecosystems drive platform stickiness
Many debate whether “open” or “closed” platforms will dominate today’s
compute landscape of smartphones and tablets. This debate misses a
deeper point on market structure, and we view the concept of two-sided
markets, in which platform users consume an ecosystem of complements,
as a more helpful framework for the discussion. In a two-sided market, a
company creates a platform (iOS, Android, etc) that enables other
companies, or complements (Facebook for example), to sell their products
and services to platform users. Indeed, our survey of 1K+ mobile users
highlights the ways ecosystems drive platform stickiness.
Tablet and smartphone share likely converge over time
Platform stickiness is set to drive convergence of OS share in tablets and
smartphones as tablets increasingly become an anchor device given users
spend more for content on these devices. If left without a meaningful
competitor in tablets, Apple's dominant share is likely to pull its
smartphone share steadily upward over time. Thus, a credible tablet
becomes a strategic imperative for Google, or they run the risk of a steady
decline of Android smartphone share starting in CY13. For Microsoft, 2013
will be critical given it is coming from behind in both device areas and
platform loyalty is raising switching costs.
HTML5 is a way off; but TV likely the next big battleground
Market disruption related to HTML5, the forthcoming web code standard
with greatly improved media streaming, is at least 3-5 years out, and as
such platform loyalty will continue to build in the meantime. Looking
ahead, we believe the next big market disruption could be in the form of
smart TVs. These devices, integrated with existing mobile ecosystems,
could be the battleground for the next big compute revolution. As such,
smart TVs’ ability to become another platform component will likely mean
significant investment from Apple, Microsoft, Google, Samsung and others.
Grading the group
We call out companies that are well positioned: Apple (AAPL, CL Buy,
$760PT), Facebook (FB, Buy, $35PT), and Samsung (005930.KS, Buy,
₩1.75mn PT); those straddling the line: Amazon (AMZN, Buy, $280PT); and
companies that are challenged: Google (GOOG, Neutral, $680PT), Intel
(INTC, Sell, $16PT), and Microsoft (MSFT, Neutral, $31PT) in the context of
platform adoption.
Heather Bellini, CFA
(212) 357-7710 [email protected] Goldman, Sachs & Co.
Bill Shope, CFA
(212) 902-6834 [email protected] Goldman, Sachs & Co.
Michael Bang
+82(2)3788-1655 [email protected] Goldman Sachs (Asia) L.L.C., Seoul Branch
Brian Baytosh
(917) 343-4120 [email protected] Goldman, Sachs & Co.
Sonya Banerjee
(212) 357-4322 [email protected] Goldman, Sachs & Co.
Perry Huang
(212) 902-6785 [email protected] Goldman, Sachs & Co.
Elizabeth Borbolla
(212) 357-4977 [email protected] Goldman, Sachs & Co.
Cristina Colon, CFA
(212) 902-9913 [email protected] Goldman, Sachs & Co.
Stephen Oshman
(917) 343-3128 [email protected] Goldman, Sachs & Co.
Goldman Sachs does and seeks to do business with companies covered in its research reports. As a result, investorsshould be aware that the firm may have a conflict of interest that could affect the objectivity of this report. Investorsshould consider this report as only a single factor in making their investment decision. For Reg AC certification and otherimportant disclosures, see the Disclosure Appendix, or go to www.gs.com/research/hedge.html. Analysts employed bynon-US affiliates are not registered/qualified as research analysts with FINRA in the U.S.
The Goldman Sachs Group, Inc. Global Investment Research

December 7, 2012 Americas: Technology
Goldman Sachs Global Investment Research 2
Table of Contents
Portfolio Manager Summary 3
Smart TVs as the next battleground 10
Beneficiaries: Apple, Facebook, Samsung 11
Straddling the line: Amazon 12
Challenged: Google, Microsoft 12
Two-sided markets: A handy theoretical framework 14
The virtuous cycle: More users mean more complements, which means more users,
which means more complements… 14
Make the platform free for one side, so the other side will pay 14
When platforms compete, it’s a race for users ... except when it’s not 15
Customer segmentation is the key to profitability 16
The compute evolution: MSFT’s fall, the rise of new leaders 20
Smartphones and tablets make the platform relevant 25
The user path to standardizing on a platform 30
Vendor implications 31
Should I stay or should I go? How users choose a platform 32
HTML5 could change everything 38
What does the near future look like? A lot like today. 41
Are televisions the next wave of disruption? 42
User interface is a potential opportunity for platform integration 44
Sizing the TV opportunity 45
Challenges to being successful in TV 46
Vendor strategies in the TV space 46
Mobile survey: Pulse of 1,000 consumers 51
Platforms and purchasing decisions 51
Use of services (music, videos, e-books) 56
Platforms and purchasing decisions 58
Use of services (music, videos, e-books) 61
Appendix: The early platform wars (Apple, Commodore, Microsoft) 69
Online Search (AOL, Yahoo!, and Google) 73
Disclosure Appendix 76

December 7, 2012 Americas: Technology
Goldman Sachs Global Investment Research 3
Portfolio Manager Summary
Much has been made about whether “open” or “closed” platforms will win out in today’s
compute paradigm. However, we think this framework is challenging because the current
compute dynamic is not this black and white and the resulting discussion is more
circuitous than it is helpful. For example, while Apple is “closed” as its products are
vertically integrated from a hardware and software perspective, Apple is also very much
“open” as it supports a vibrant developer ecosystem to create third-party applications that
run on Apple’s devices. Furthermore, in our view, the open/closed debate overlooks factors
that are key to driving a platform’s long-term success, most notable of which is the
importance of the ecosystem.
In this report we provide investors with a guide to navigate the new consumer
compute landscape, brought about by mainstream adoption of smartphones and
tablets. Our discussion is differentiated in that we use the concept of two-sided
markets to frame our view, support our work with a survey of more than 1K mobile
users, and draw conclusions on key industry participants.
We distill our analysis into four key takeaways:
1. Survey of 1K+ mobile device users suggests ecosystems drive platform stickiness,
thus leading to a slow decline in Android smartphone share starting in 2013.
2. Vendor share of tablets and smartphones is likely to converge over time, helping
to solidify Apple’s ecosystem dominance.
3. Market disruption related to HTML5, the forthcoming version of the standard web
programming language that delivers greatly improved audio and video streaming,
is at least 3-5 years out, meaning ecosystem importance will only get stronger.
4. TV, and its integration with mobile device ecosystems, could be the battleground
for the next compute revolution, and its ability to become another anchor
platform component will likely mean significant investment from the competition.
We call out companies that are well positioned: Apple (AAPL, CL Buy, $760 price target),
Facebook (FB, Buy, $35 price target), and Samsung (005930.KS, Buy, ₩1.75mn price target);
those straddling the line: Amazon (AMZN, Buy, $280 price target); and companies that are
challenged: Google (GOOG, Neutral, $680 price target), Intel (INTC, Sell, $16 price target),
and Microsoft (MSFT, Neutral, $31 price target) in the context of platform adoption.
In aggregate, these companies have over $250bn in net cash, and given the high stakes, we
believe it is possible for all (especially the laggards), to deploy their balance sheets whether
for device subsidies in an effort to increase compute market share, acquisition of content,
M&A (as did Google did in the case of Motorola Mobility), or in some cases capex for a
broad-based fiber build-out to help position for the disruption we expect to occur in TVs.
Put another way, we think that the companies that are not well positioned for the future
will draw a line in the sand that could negatively impact their cash flow and operating
margins looking out over the next several years as they seek to preserve or improve their
market relevance.

December 7, 2012 Americas: Technology
Goldman Sachs Global Investment Research 4
How we got here The compute landscape has undergone a dramatic transformation over the last
decade with consumers responsible for the massive market realignment. While PCs
were the primary internet connected device in 2000 (139mn shipped that year), today they
represent just 29% of all internet connected devices (1.2bn devices to ship in 2012), while
smartphones and tablets comprise 66% of the total. Further, although Microsoft was the
leading OS provider for compute devices in 2000 at 97% share, today the consumer
compute market (1.07bn devices) is led by Android at 42% share, followed by Apple at 24%,
Microsoft at 20% and other vendors at 14%. See Exhibit 1.
Exhibit 1: Vendor share of consumer compute, 2000-2016E Shift from single-vendor dominance (MSFT) to multiple vendors (AAPL, GOOG, MSFT, Other)
Source: IDC, Goldman Sachs Research.
Introducing the concept of a two-sided market
Instead of trying to determine platform winners/ losers by considering whether the
platform is “open” or “closed,” we think the concept of two-sided markets is a more
helpful theoretical framework within which the topic can be debated.
In a two-sided market, a company creates a platform that enables other companies (the
first side of the market) to sell their products and services to platform users (the second
side of the market). Accordingly, the platform is the foundation that enables the market to
exist (examples of platforms include Apple’s iOS or Google’s Android) while the
complements are the products or services that sit on top of the platform and are utilized by
the end user (examples of complements include Facebook or the Amazon Kindle Reading
App). Clearly, this type of market possesses cross-side network effects, meaning the more
users a platform attracts, the more complements are created, which in turn brings more
users. See Exhibit 2.
In our view, there are only a handful of meaningful platform providers in the consumer
compute space today, though there are numerous complement providers (essentially any
entity that offers an app, either native for a platform or browser-based, is a complement).
That being said, this report is focused on the largest platform providers and key
complement providers. Though we acknowledge that there are many other companies
that are relevant to this discussion such as eBay, who as with Amazon benefits from device
7% 6% 6% 5% 5%
21% 22% 21% 23% 22% 21% 23% 24% 23% 25% 27% 29%
1% 3%
14%
33%
42% 41% 41%40% 39%
93% 94% 94% 95% 95%
49% 46%43%
46% 46%
35%
25%
20% 20% 22%23%
26%29% 32%
35%31% 30% 29%
18%14% 15% 13%
9%5%
0%
10%
20%
30%
40%
50%
60%
70%
80%
90%
100%
2000 2001 2002 2003 2004 2005 2006 2007 2008 2009 2010 2011 2012E 2013E 2014E 2015E 2016E
AAPL GOOG MSFT Other

December 7, 2012 Americas: Technology
Goldman Sachs Global Investment Research 5
proliferation as it gives consumers more opportunities to leverage the site, as well as
complements such as Yelp, Pandora and Netflix, just to name a few.
Exhibit 2: Two-sided markets illustrated
Source: Goldman Sachs Research.
To the victor go the spoils, or in this case, profits Users and complements are basic requirements in a platform battle, but the true
measure of success is ultimately profitability. Quality of users matters. As discussed in
the next section, Apple customers have shown more willingness to pay for complements
than Android users. Further, despite growing competition, the power of Apple’s iOS
platform also remains significant in operating profits on devices. Over the last ten quarters
Apple has grown its share of mobile operating profits (from both tablets and smartphone
device sales) from around 55% to nearly 70% based on Goldman Sachs estimates. While
we would note that, with the exception of Motorola, Google does not capture any of the
Android OEMs revenue as it provides the Android OS free of charge, the company
monetizes the shift to mobile through online search.
December 7, 2012 Americas: Technology
Goldman Sachs Global Investment Research 6
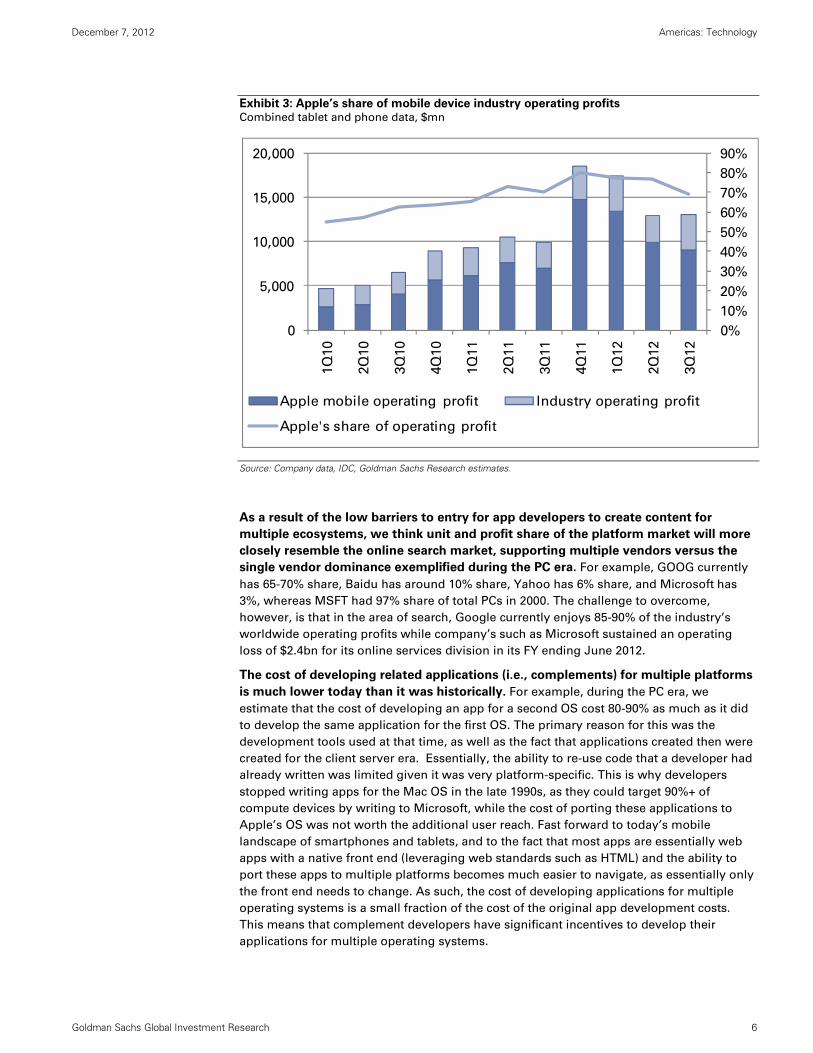
Exhibit 3: Apple’s share of mobile device industry operating profits Combined tablet and phone data, $mn
Source: Company data, IDC, Goldman Sachs Research estimates.
As a result of the low barriers to entry for app developers to create content for
multiple ecosystems, we think unit and profit share of the platform market will more
closely resemble the online search market, supporting multiple vendors versus the
single vendor dominance exemplified during the PC era. For example, GOOG currently
has 65-70% share, Baidu has around 10% share, Yahoo has 6% share, and Microsoft has
3%, whereas MSFT had 97% share of total PCs in 2000. The challenge to overcome,
however, is that in the area of search, Google currently enjoys 85-90% of the industry’s
worldwide operating profits while company’s such as Microsoft sustained an operating
loss of $2.4bn for its online services division in its FY ending June 2012.
The cost of developing related applications (i.e., complements) for multiple platforms
is much lower today than it was historically. For example, during the PC era, we
estimate that the cost of developing an app for a second OS cost 80-90% as much as it did
to develop the same application for the first OS. The primary reason for this was the
development tools used at that time, as well as the fact that applications created then were
created for the client server era. Essentially, the ability to re-use code that a developer had
already written was limited given it was very platform-specific. This is why developers
stopped writing apps for the Mac OS in the late 1990s, as they could target 90%+ of
compute devices by writing to Microsoft, while the cost of porting these applications to
Apple’s OS was not worth the additional user reach. Fast forward to today’s mobile
landscape of smartphones and tablets, and to the fact that most apps are essentially web
apps with a native front end (leveraging web standards such as HTML) and the ability to
port these apps to multiple platforms becomes much easier to navigate, as essentially only
the front end needs to change. As such, the cost of developing applications for multiple
operating systems is a small fraction of the cost of the original app development costs.
This means that complement developers have significant incentives to develop their
applications for multiple operating systems.
0%
10%
20%
30%
40%
50%
60%
70%
80%
90%
0
5,000
10,000
15,000
20,000
1Q
10
2Q
10
3Q
10
4Q
10
1Q
11
2Q
11
3Q
11
4Q
11
1Q
12
2Q
12
3Q
12
Apple mobile operating profit Industry operating profit
Apple's share of operating profit
December 7, 2012 Americas: Technology
Goldman Sachs Global Investment Research 7
Expect convergence over time Our survey of 1K mobile device users revealed that individuals who own both a tablet
and a smartphone spend 2.4X on content (apps, music, books, video, etc) than
individuals who only own a smartphone. Of note, Apple customers in particular have
shown more willingness to pay for complements than Android users. According to our
survey, respondents who owned both an iPhone and iPad spent a third more on
complements than respondents who owned both an Android phone and Android tablet.
We also learned that the vast majority (or 86%) of mobile device users view the device
ecosystem as important to their device purchasing decisions. Accordingly, as tablet
penetration increases (68% of the individuals we surveyed owned both a tablet and a
smartphone) we think the tablet will move into more of an anchor position, and will have
increasing levels of influence on future smartphone purchases.
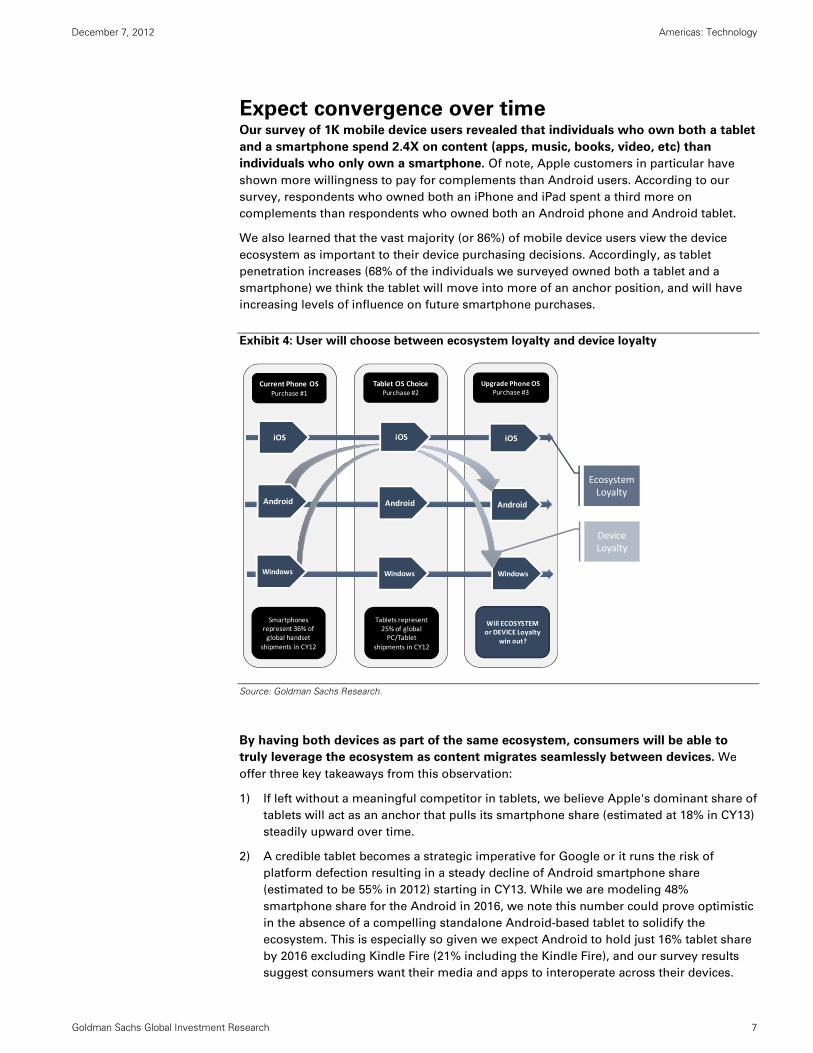
Exhibit 4: User will choose between ecosystem loyalty and device loyalty
Source: Goldman Sachs Research.
By having both devices as part of the same ecosystem, consumers will be able to
truly leverage the ecosystem as content migrates seamlessly between devices. We
offer three key takeaways from this observation:
1) If left without a meaningful competitor in tablets, we believe Apple's dominant share of
tablets will act as an anchor that pulls its smartphone share (estimated at 18% in CY13)
steadily upward over time.
2) A credible tablet becomes a strategic imperative for Google or it runs the risk of
platform defection resulting in a steady decline of Android smartphone share
(estimated to be 55% in 2012) starting in CY13. While we are modeling 48%
smartphone share for the Android in 2016, we note this number could prove optimistic
in the absence of a compelling standalone Android-based tablet to solidify the
ecosystem. This is especially so given we expect Android to hold just 16% tablet share
by 2016 excluding Kindle Fire (21% including the Kindle Fire), and our survey results
suggest consumers want their media and apps to interoperate across their devices.
Current Phone OSPurchase #1
Tablet OS Choice Purchase #2
Upgrade Phone OS Purchase #3
Smartphonesrepresent 36% of global handset
shipments in CY12
Tablets represent 25% of global PC/Tablet
shipments in CY12
Will ECOSYSTEM or DEVICE Loyalty
win out?
iOS iOS
Android
Windows
Android
Windows
iOS
Android
Windows
Ecosystem Loyalty
Device Loyalty

December 7, 2012 Americas: Technology
Goldman Sachs Global Investment Research 8
3) Microsoft faces an uphill battle (though not insurmountable) given it lacks meaningful
share in either tablets or smartphones and as such will need to rely on its appeal to
knowledge workers to help drive adoption as its complement ecosystem will remain
behind the iOS and Android platforms at least over the next 6-12 months.
While we would expect operating system share convergence to occur in developed
markets, there have been some concerns that ecosystem stickiness will be less robust in
emerging markets. Furthermore, carriers in emerging markets have shown fewer
propensities to subsidize smartphones given the low availability of consumer credit
histories and generally lower ARPU. Nevertheless, this may all be changing. Apple, for
instance, has a robust and growing user base for its App Store in regions such as Greater
China, and the company is fostering adoption by enabling and encouraging local
developers to contribute domestic app content. In addition, iCloud is also available in China
and other emerging regions, enabling multi-device management and content sharing for
iOS devices. While iTunes media content has not been available in most emerging regions,
limiting a key source of ecosystem complements, this may also be changing. Indeed, on
December 4, Apple announced that it was opening the iTunes music store in Russia, Turkey,
India, South Africa, and 52 other countries. This strengthening ecosystem presence in
emerging regions is not only introducing the switching costs for consumer devices in these
countries (a rare historical phenomenon), but it is also making emerging market carriers
more likely to subsidize devices due to increased customer loyalty and heavier data
consumption that drives much higher ARPU. Other platform vendors are building
ecosystems in emerging regions as well, so it is only a matter of time before the platform
battle moves beyond the developed regions.
December 7, 2012 Americas: Technology
Goldman Sachs Global Investment Research 9
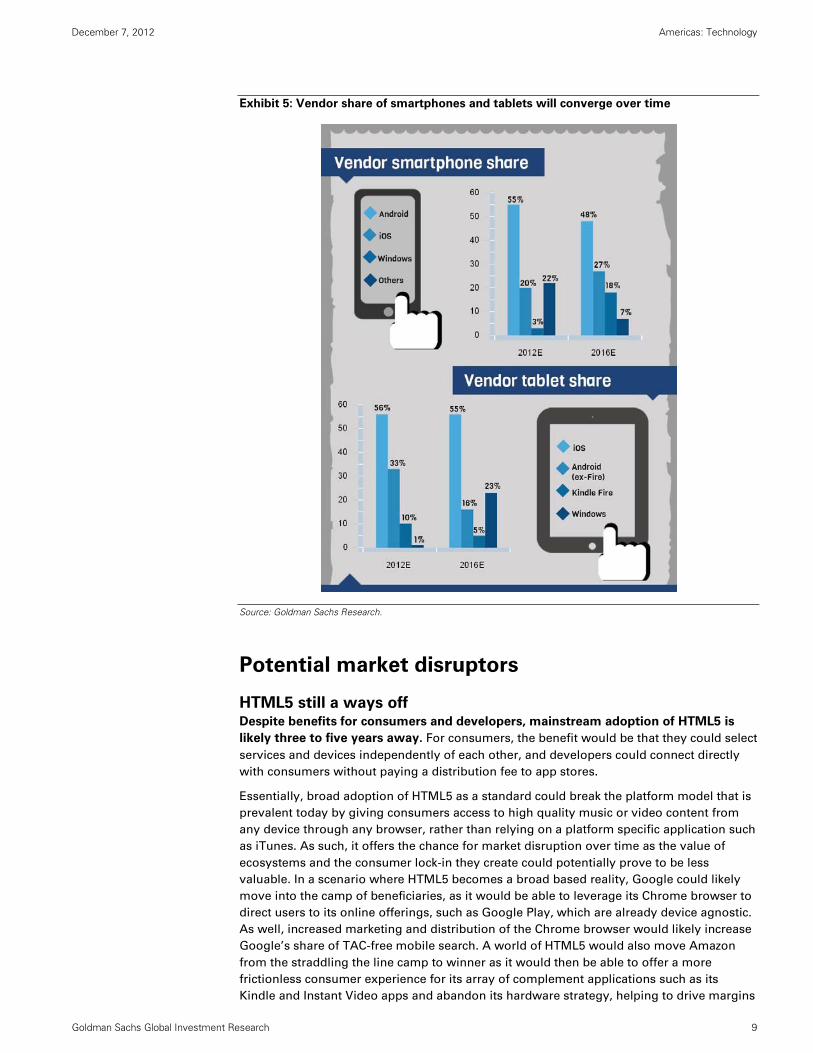
Exhibit 5: Vendor share of smartphones and tablets will converge over time
Source: Goldman Sachs Research.
Potential market disruptors
HTML5 still a ways off Despite benefits for consumers and developers, mainstream adoption of HTML5 is
likely three to five years away. For consumers, the benefit would be that they could select
services and devices independently of each other, and developers could connect directly
with consumers without paying a distribution fee to app stores.
Essentially, broad adoption of HTML5 as a standard could break the platform model that is
prevalent today by giving consumers access to high quality music or video content from
any device through any browser, rather than relying on a platform specific application such
as iTunes. As such, it offers the chance for market disruption over time as the value of
ecosystems and the consumer lock-in they create could potentially prove to be less
valuable. In a scenario where HTML5 becomes a broad based reality, Google could likely
move into the camp of beneficiaries, as it would be able to leverage its Chrome browser to
direct users to its online offerings, such as Google Play, which are already device agnostic.
As well, increased marketing and distribution of the Chrome browser would likely increase
Google’s share of TAC-free mobile search. A world of HTML5 would also move Amazon
from the straddling the line camp to winner as it would then be able to offer a more
frictionless consumer experience for its array of complement applications such as its
Kindle and Instant Video apps and abandon its hardware strategy, helping to drive margins

December 7, 2012 Americas: Technology
Goldman Sachs Global Investment Research 10
higher. In either an HTML5 based or ecosystem/app based world, we continue to view
Facebook as the ultimate complement.
Smart TVs as the next battleground
We see the television as the next potential catalyst for disrupting current market
dynamics, just as the advent of smartphones and tablets has created new category
leaders and put Microsoft and Intel’s relevance at risk. Given consumer cloud platforms
largely center around media consumption, in our view the television is a natural extension
of these platforms giving complements another device on which to deliver their services.
In our view, the television is an attractive target for several reasons:
1. It carries a higher purchase price than a smartphone, with average 46-inch set costing
roughly 3X the average wholesale price of smartphone.
2. The replacement cycle for televisions at around eight years is roughly 4X that of a
smartphone. While this does push out revenue, in our view it also creates the potential
for competitive disruption as we believe consumers will match the platform of their
more frequently purchased smartphones and tablets to the television they already own.
The television effectively raises the consumer’s cost to switch platforms.
3. As a shared device the television has the potential to impact the platform choice of an
entire household rather than a single individual.
For these reasons, we expect Apple, Google, Microsoft and Samsung will focus
intently on the connected viewing experience while Facebook will continue to serve
as the ultimate complement given its user base. In fact, we have seen signs of early
disruption in the $110bn worldwide television market through set-top box-like devices such
as Apple TV, Google TV, Roku boxes and through streaming video services on Microsoft’s
Xbox gaming console. In fact, we would expect the launch of Xbox720 in 2H13 to take
gaming and streaming content to another level and for online communication to be
enhanced by leveraging assets acquired by Skype. Further, we view the potential for
technology companies to partner with cable companies on a more intuitive more user-
friendly customer interface, or viewing guide, as another potential source of disruption.
That said, cable companies differ on their view regarding partnering with technology
companies, given the risk of surrendering the viewer relationship.
Competing in television is not without risks.
Television hardware is a challenging business with low-single-digit margins, heavy
inventory risk, and rapidly commoditizing technology.
On the content side, the cable bundle is deeply entrenched given how its economics
highly favor the networks, making it difficult to offer consumers attractive a la carte
pricing.
With so much at stake, we would expect the ecosystem vendors to spend
aggressively in the areas of opex and capex to try and be first to redefine the TV
market. The potential for consumer lock-in that the television creates will likely drive
platform companies to continue exploring the space. As such, while the battle is just
getting started on this front, we see it as having the potential to either further entrench
current winners such as Apple, or completely disrupt the market once again.
December 7, 2012 Americas: Technology
Goldman Sachs Global Investment Research 11
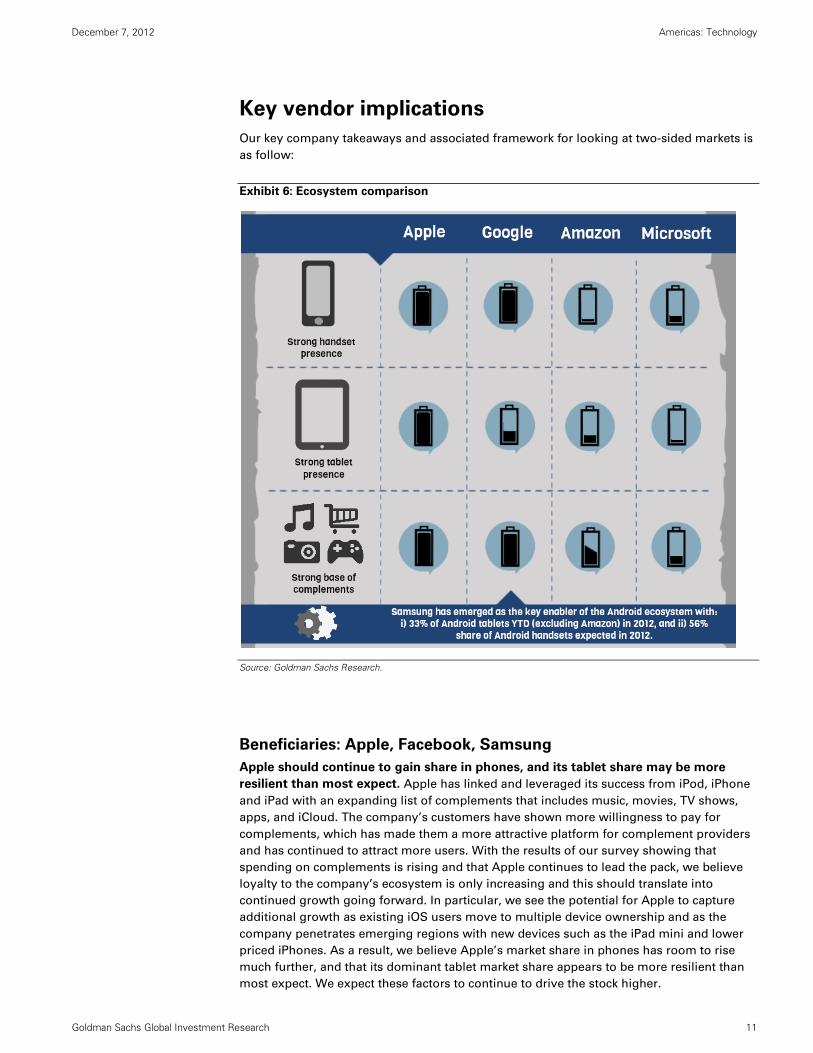
Key vendor implications
Our key company takeaways and associated framework for looking at two-sided markets is
as follow:
Exhibit 6: Ecosystem comparison
Source: Goldman Sachs Research.
Beneficiaries: Apple, Facebook, Samsung
Apple should continue to gain share in phones, and its tablet share may be more
resilient than most expect. Apple has linked and leveraged its success from iPod, iPhone
and iPad with an expanding list of complements that includes music, movies, TV shows,
apps, and iCloud. The company’s customers have shown more willingness to pay for
complements, which has made them a more attractive platform for complement providers
and has continued to attract more users. With the results of our survey showing that
spending on complements is rising and that Apple continues to lead the pack, we believe
loyalty to the company’s ecosystem is only increasing and this should translate into
continued growth going forward. In particular, we see the potential for Apple to capture
additional growth as existing iOS users move to multiple device ownership and as the
company penetrates emerging regions with new devices such as the iPad mini and lower
priced iPhones. As a result, we believe Apple’s market share in phones has room to rise
much further, and that its dominant tablet market share appears to be more resilient than
most expect. We expect these factors to continue to drive the stock higher.

December 7, 2012 Americas: Technology
Goldman Sachs Global Investment Research 12
Facebook is one of a few companies for which the shift to mobile brings better
pricing and is margin accretive. We view the rise of smartphones and tablets as a
tailwind to the company’s core ad business as mobile Sponsored Stories in news feed
monetize at 40X the CPM of typical right rail ads, while carrying comparable costs in
absolute dollar terms. Looking out to 2013, we see Sponsored Stories as well as new
offerings such as Gifts and Offers, both on mobile and the desktop, potentially contributing
$2bn or more to the company’s top line, which even with some cannibalization of right rail
spending will help reaccelerate ad revenue growth in our view. With more than 1bn users,
Facebook is the ultimate complement. Although the stock is still off considerably from its
IPO price, we see recent outperformance as continuing into 2013 as the market starts to
fully appreciate its ability to monetize mobile and our view that they are a key local enabler.
Samsung Electronics is well positioned to maintain its position as the leading
Android device maker and support other open platforms, such as Windows 8, given
unmatched scale, vertical integration (especially in displays and semiconductors),
hardware differentiation, and short design lead times. We estimate Samsung Electronics'
smartphone market share in the US at around 20% but over 35% in the rest of the world as
of end 2012. Over the mid-term we believe that Samsung’s strategy is based more on
device proliferation and, as such, the company is operating system and platform agnostic.
Device proliferation delivers two benefits for the company: (1) from selling the hardware
device; and (2) capturing a greater portion of smartphone and tablet bill of material (BoM).
At this time, Samsung Electronics has the potential to address around 40-45% of mobile
BoM. If Samsung Electronics is able to integrate additional functionality such as
baseband/connectivity the company may be able to position itself to capture over 70% of
smartphone and tablet BoM.
Straddling the line: Amazon
Ultimately, the big benefit to Amazon in the new compute landscape is related to the fact
that consumers can transact with Amazon on a continuous basis through their internet-
connected devices. However, we think the company needs to find an avenue to remain as
dominant in digital media as it has been in physical since it is unlikely in our view that the
company can successfully establish itself as the fourth consumer compute platform. In
order to try and accomplish this, the Kindle Fire was launched a year ago. Taking this a
step further, given the value consumers place on ecosystems, we would not be surprised
to see the introduction of an Amazon branded phone in early 2013. However, we believe
the launch of a phone could put pressure on the stock near-term given the potential for
margin dilution. While its ability to become a meaningful platform provider is still very
much a question, Amazon is well positioned to benefit as a complement provider.
Challenged: Google, Microsoft
To maintain Android smartphone dominance, a successful Android-based tablet
strategy is an imperative for Google. The dominant company in internet search, Google
confronts a threat to pricing and margins in the shift to mobile. While the company’s
Android operating system represented more than 70% of smartphone shipments in 3Q12,
iOS still generates more than 60% of mobile internet traffic, and Google pays TAC rates on
iOS devices that we estimate are north of 75% to be the default search provider. Further,
smartphone search CPCs stand at about 30-50% of those on the desktop. The larger danger
for Google in our view, is that tablet share loss leads to smartphone share defection as
consumers choose to standardize on a platform, which would expose the company to a
rising portion of mobile searches subject to higher TAC rates and highlights the importance
of a compelling tablet offering to Google. We see Android tablet share excluding the Kindle
Fire going from 33% this year to 21% next year. We also see Android smartphone share

December 7, 2012 Americas: Technology
Goldman Sachs Global Investment Research 13
declining next year to 53% from 55% this year. Lastly, we expect the company to make
large investments with perceived higher risk down the road as it searches for a way to
penetrate the living room, with Google Fiber as a potential enabler. We continue to believe
the company’s operating margins are likely to face pressure over the next few years. While
we believe the investments the company could make over the next few years could cause
shareholder concern, we ultimately see Google as trying to find a way to stay just as
relevant in the new compute paradigm as it was during Web 1.0 and 2.0.
Microsoft faces a critical period of adoption in 2013 as it seeks to reverse its market
share losses in total compute. After watching its market share of total consumer compute
fall from 93% in 2000 to 20% expected in 2012, we expect the recent launches of Windows
Phone 8 and Windows 8 tablets to help the company reclaim some share in coming years.
This transition is particularly meaningful given the Goldman Sachs view of the health of
the consumer PC market, which we forecast will be flat in 2013. Of note, we estimate that
Microsoft would have to sell roughly 5 Windows Phones or roughly two Windows 8 RT
tablets to offset the loss of one traditional Windows PC sale, which we estimate has an
overall blended selling price of $60 for business and consumer. With 2013 being a critical
period of adoption for the company, we expect the shares to stay relatively range bound
near-term, and then, based on the adoption of its new compute SKUs, we would expect
heightened volatility post a conclusion on whether Microsoft will be a true competitive
platform to current compute leader Apple.
We believe the ongoing share shift in consumer computing toward smartphones and
tablets and away from traditional PCs will be negative for Intel. While Intel has over
90% market share in processors for traditional PC clients, it has de minimis share in tablets
and smartphones. We expect Intel to have difficulty gaining share in smartphones and
tablets given that: (1) Leading mobile device vendors such as Apple and Samsung design
their own processors, which limits Intel’s opportunity; (2) In cases where merchant chips
are used, we expect ARM chips from companies such as Qualcomm to generally win as a
result of the low-power characteristics of the ARM architecture, well-established
relationships between ARM vendors and mobile hardware companies, and in some cases
more experience by the ARM chip companies with connectivity.

December 7, 2012 Americas: Technology
Goldman Sachs Global Investment Research 14
Two-sided markets: A handy theoretical framework
In thinking about the current competition among the largest names in technology to
become the dominant ecosystem for providing consumers with seamless media
consumption and social communication across multiple screens, the economic concept of
two-sided markets is a handy theoretical framework (see Exhibit 7). Within two-sided
markets, a platform provider enables a system whereby platform complements can directly
provide services to end users. Using music services as an example, on Apple’s iOS
platform end users can subscribe to commercial free streaming music by using the iOS
Pandora app. Similarly, Facebook users can use Spotify’s paid subscription offering to
stream all the music in Spotify’s library. In this section, we outline key dynamics of two-
side markets, including cross-side network effects, the impact of subsidies, and the
importance of customer segmentation.
Exhibit 7: Market structure of two-sided networks
Source: Goldman Sachs Research.
The virtuous cycle: More users mean more complements, which
means more users, which means more complements…
Typically, platform users prize a wide breadth of choice in the offerings available on a
given platform. Again using music as an example, iOS users are likely to place a high value
on the ability to not only access their iTunes libraries on their devices, but also the
availability of Spotify, Pandora, and other music services. In short, the more platform
complements there are, the more attractive the platform offering is to end users. Similarly,
for platform complements, which in the four-screen ecosystem (in which users consume
content on PCs, phones, tablets and TVs) include both app developers and content
providers, more end users, or potential consumers, make a given platform more appealing.
Economists call this concept “cross-side network effects”, and it clearly applies to the four-
screen consumer cloud.
Make the platform free for one side, so the other side will pay
Platforms usually need to subsidize one side of the market to gain adoption and start the
virtuous cycle of cross-side network effects. Within two-sided networks, usually one side
has a greater willingness to pay than the other. The most current examples of this are
Platform
Users Complements
Services
$$$$

December 7, 2012 Americas: Technology
Goldman Sachs Global Investment Research 15
Google Search and Facebook. Both companies provide their service free of charge to end
users, while charging advertisers for access to those end users. Another classic example of
this in tech history is Adobe and Acrobat. Adobe made the Acrobat Reader free to
consumers, which let them read PDF documents, in order to expand the market for Acrobat
Pro, which enables complements to produce PDF documents. The business principle at
work here is determining which side is the “money side”, i.e., which side has the greater
willingness to pay, and subsidizing the other side to encourage market growth. In the
current consumer cloud ecosystem, we can see this principle at work in Google providing
its Android operating system to OEMs for free, in order to gain consumer adoption of
smart phones.
When platforms compete, it’s a race for users ... except when it’s
not
Given the cross-side network effects that come into play with any two-sided market, it
would seem clear that, strategically, a platform that can accumulate more users at a faster
rate would be in an advantaged position. However, just as it is important for platform
providers to determine whether end users or complements are the “money side”,
platforms must also analyze if customers can be segmented with regard to price
discrimination.
As an example, there are more than 500mn Android phone users and 700K Google Play
Apps which have been downloaded 20bn times. This compares with roughly 200mn iPhone
users, 750K iPhone and iPad apps, and 35bn downloads. Based solely on the number of
end users and complements, one could argue that Google has meaningfully narrowed
Apple’s lead, or perhaps even overtaken it. However, users and complements are basic
requirements in a wider platform competition, and the true measure of success is
monetization and ultimately, profitability. To this end, Apple reported during its 4QFY12
results call that it has paid out a cumulative $6.5bn to app developers since the launch of
its App Store in 2008. Similarly, during Google’s 3Q12 call management announced the
company’s annualized mobile revenue run rate (including ads and the gross merchandise
volume of apps and Google Play media) was $8bn for the quarter. Assuming Google’s
mobile ad revenue slightly more than doubled in the past year to a $5.5bn run rate, this
implies roughly $2.5bn in annualized app and media sales for the September quarter.
Different companies, different monetization strategies
Tax collectors: This monetization strategy simply means keeping a piece of every
transaction on the platform. For example, Apple keeps 30% of every app sale in the
AppStore. iTunes also falls in this category, along with the Google Play store,
Amazon’s Kindle Store and Cloud Player service, and Facebook’s app platform.
Alternative funding: Companies using this strategy typically provide their service to
end users free of charge while leveraging that user base to support an alternate form
of funding, typically advertising. For example, Google offers its search engine and
Facebook offers its social network to internet users for free and fund their operations
by charging for advertising on their websites.
The X way out: In the prior two examples, it is worth noting that the platform provider
effectively only monetizes one side of transactions on the platform, typically
complements. As an alternative, platforms could charge end users a platform usage
fee. It could be argued that the premium iOS devices carry over other smart phones
and tablets is actually an iOS platform usage fee. In effect, Apple monetizes both sides
of transactions on its platform. It is interesting to note, however, that while Apple’s
customers have also shown more willingness to pay for complements, Apple’s stated
goal is to manage the complements side of the business to breakeven. In fact,

December 7, 2012 Americas: Technology
Goldman Sachs Global Investment Research 16
hardware is the primary source of monetization and profits for Apple, and the
company has paid $6.5 billion to developers (complement providers), which has
enabled it to attract complement providers to its platform.
Customer segmentation is the key to profitability
Apple customers have shown more willingness to pay for complements than Android
users. This in turn makes iOS a more attractive platform for complement providers and this
eventually attracts more users. The loyalty and quality of Apple’s user base, driven by its
platform strength, enable it to command subsidies for the iPhone from the carriers in the
form of a hefty wholesale average sales price (ASP). This platform strength also supports
higher retail prices for iPad. As shown in Exhibits 8-9, Apple’s tablet ASPs remain roughly
1.5X the rest of the industry and its wholesale phone ASPs are nearly 3X those of the rest
of the industry. That said, while Apple still possesses a first-mover advantage, the
company is not without increasing competition. For example, Goldman Sachs Asia
technology analyst Michael Bang expects Samsung Electronics to ship some 80mn high-
end smartphones ($600+ wholesale ASP) in 2012, which compares to Goldman Sachs
hardware analyst Bill Shope’s forecast of 136mn iPhone shipments in CY2012.
Exhibit 8: iOS versus non-iOS tablet ASPs
Exhibit 9: iOS versus non-iOS smart phone ASPs
Source: IDC, Goldman Sachs Research estimates.
Source: IDC, Goldman Sachs Research estimates.
Despite growing competition, the power of Apple’s iOS platform is remains significant. As
shown in the exhibits below, despite the very rapid growth in tablet and smart phone
maker unit shipment share, these OEMs combined were only able to overtake Apple in
total mobile revenue in 3Q12. Combined unit shipments of tablets and phones using the
Android operating system have risen from roughly 10% of shipments in 1Q10 to nearly
70% in 3Q12, compared to Apple’s just under 20% share of shipments. As of 3Q12, Apple
had captured just over 40% of total mobile device revenue, compared to the Android OEMs
at roughly 50% according to IDC. Lastly, we would note that, with the exception of
Motorola, Google does not capture any of the Android OEMs revenue as it provides the
Android OS free of charge.
$660 $666$628 $604
$653$617 $592
$558 $538 $538
$268 $251
$426 $439 $449$393
$325$384
$354$307
$0
$100
$200
$300
$400
$500
$600
$700
$800
2Q
10
3Q
10
4Q
10
1Q
11
2Q
11
3Q
11
4Q
11
1Q
12
2Q
12
3Q
12
iOS ASP Non-iOS ASP
$600 $595 $610 $625 $625 $622 $617$644 $630
$603 $600
$223$196 $178 $182
$216 $217 $211 $221 $208 $188 $192
$0
$100
$200
$300
$400
$500
$600
$700
$800
1Q
10
2Q
10
3Q
10
4Q
10
1Q
11
2Q
11
3Q
11
4Q
11
1Q
12
2Q
12
3Q
12
iOS ASP Non-iOS ASP

December 7, 2012 Americas: Technology
Goldman Sachs Global Investment Research 17
Exhibit 10: Mobile unit shipments and share by OS
Combined tablet and phone data, millions of units
Exhibit 11: Mobile device revenue and share by OS
Combined tablet and phone data, $mn
Source: IDC, Goldman Sachs Research estimates.
Source: IDC, Goldman Sachs Research estimates.
Given Apple’s pricing power, the company takes the majority of mobile device operating
profits. As shown in Exhibit 12, over the last ten quarters Apple has grown its share of
mobile operating profits from around 55% to nearly 80%. We based our aggregate mobile
device industry operating profits on Goldman Sachs Investment Research estimates of
mobile segment operating profits for Apple, HTC, LG Electronics, Google’s Motorola unit,
Nokia, Research In Motion, and Samsung Electronics. It should be noted that this analysis
understates Apple’s share of operating profit for the narrower smart phone and tablet
market as the mobile units for its competitors include feature phones.
Exhibit 12: Apple’s share of mobile device industry operating profits
Combined tablet and phone data, $mn
Source: Company data, IDC, Goldman Sachs Research estimates.
Apple customers also spend more on media and apps for their mobile devices, with
Amazon Kindle Fire users also showing a high propensity for consumption. In
0%
10%
20%
30%
40%
50%
60%
70%
80%
0
50
100
150
200
250
1Q
10
2Q
10
3Q
10
4Q
10
1Q
11
2Q
11
3Q
11
4Q
11
1Q
12
2Q
12
3Q
12
Android iOS Rest of industry
Android share iOS share
0%
10%
20%
30%
40%
50%
60%
0
10,000
20,000
30,000
40,000
50,000
60,000
70,000
1Q
10
2Q
10
3Q
10
4Q
10
1Q
11
2Q
11
3Q
11
4Q
11
1Q
12
2Q
12
3Q
12
Android iOS Rest of industry
Android share iOS share
0%
10%
20%
30%
40%
50%
60%
70%
80%
90%
0
5,000
10,000
15,000
20,000
1Q
10
2Q
10
3Q
10
4Q
10
1Q
11
2Q
11
3Q
11
4Q
11
1Q
12
2Q
12
3Q
12
Apple mobile operating profit Industry operating profit
Apple's share of operating profit
December 7, 2012 Americas: Technology
Goldman Sachs Global Investment Research 18
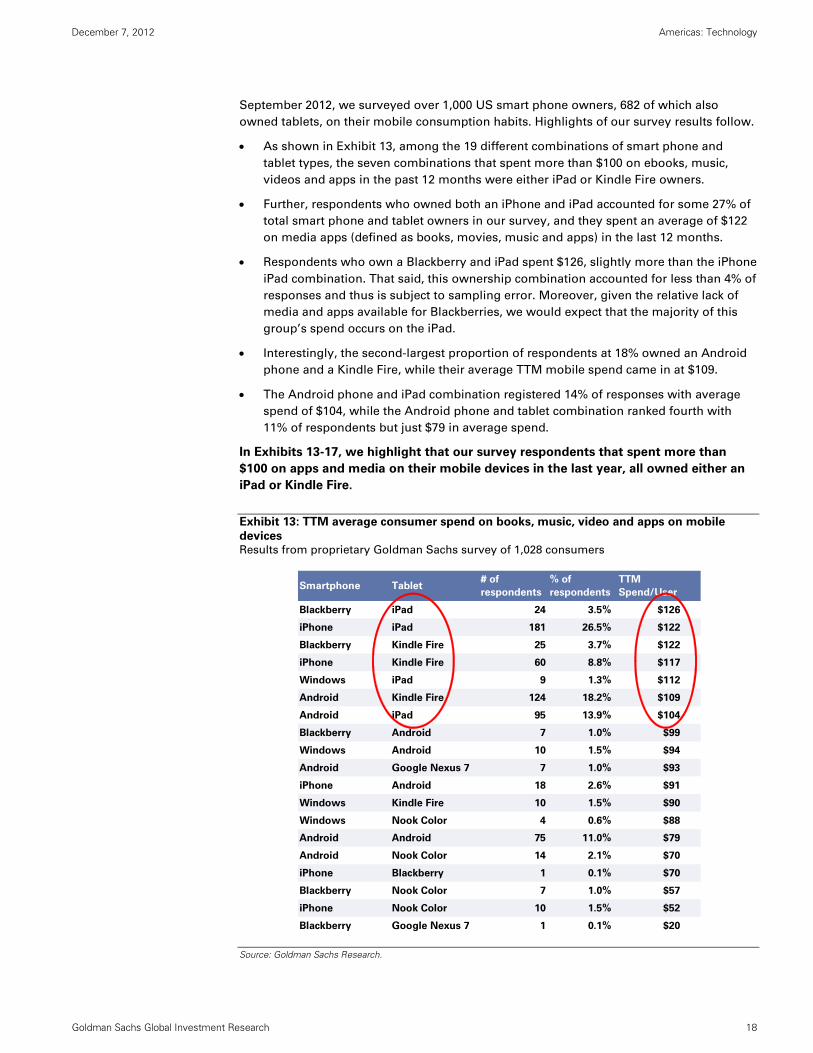
September 2012, we surveyed over 1,000 US smart phone owners, 682 of which also
owned tablets, on their mobile consumption habits. Highlights of our survey results follow.
As shown in Exhibit 13, among the 19 different combinations of smart phone and
tablet types, the seven combinations that spent more than $100 on ebooks, music,
videos and apps in the past 12 months were either iPad or Kindle Fire owners.
Further, respondents who owned both an iPhone and iPad accounted for some 27% of
total smart phone and tablet owners in our survey, and they spent an average of $122
on media apps (defined as books, movies, music and apps) in the last 12 months.
Respondents who own a Blackberry and iPad spent $126, slightly more than the iPhone
iPad combination. That said, this ownership combination accounted for less than 4% of
responses and thus is subject to sampling error. Moreover, given the relative lack of
media and apps available for Blackberries, we would expect that the majority of this
group’s spend occurs on the iPad.
Interestingly, the second-largest proportion of respondents at 18% owned an Android
phone and a Kindle Fire, while their average TTM mobile spend came in at $109.
The Android phone and iPad combination registered 14% of responses with average
spend of $104, while the Android phone and tablet combination ranked fourth with
11% of respondents but just $79 in average spend.
In Exhibits 13-17, we highlight that our survey respondents that spent more than
$100 on apps and media on their mobile devices in the last year, all owned either an
iPad or Kindle Fire.
Exhibit 13: TTM average consumer spend on books, music, video and apps on mobile
devices Results from proprietary Goldman Sachs survey of 1,028 consumers
Source: Goldman Sachs Research.
Smartphone Tablet# of
respondents
% of
respondents
TTM
Spend/User
Blackberry iPad 24 3.5% $126
iPhone iPad 181 26.5% $122
Blackberry Kindle Fire 25 3.7% $122
iPhone Kindle Fire 60 8.8% $117
Windows iPad 9 1.3% $112
Android Kindle Fire 124 18.2% $109
Android iPad 95 13.9% $104
Blackberry Android 7 1.0% $99
Windows Android 10 1.5% $94
Android Google Nexus 7 7 1.0% $93
iPhone Android 18 2.6% $91
Windows Kindle Fire 10 1.5% $90
Windows Nook Color 4 0.6% $88
Android Android 75 11.0% $79
Android Nook Color 14 2.1% $70
iPhone Blackberry 1 0.1% $70
Blackberry Nook Color 7 1.0% $57
iPhone Nook Color 10 1.5% $52
Blackberry Google Nexus 7 1 0.1% $20

December 7, 2012 Americas: Technology
Goldman Sachs Global Investment Research 19
Additionally, iPads and Kindle Fires dominate categories when one looks at users by the
type of phone they use.
For example, among Android phone users:
Kindle Fires are 39% of tablet ownership with $109 in TTM spend.
iPads account for 30% of tablet ownership with $104 in TTM spend.
Android tablets (excluding the Kindle Fire) have 24% share and $79 in TTM spend.
Similarly, among Blackberry users:
Fires account for 39% of tablet ownership and $122 in TTM spend.
iPads represent 28% of tablet ownership, with $126 in TTM spend.
Not surprisingly, among iPhone users:
iPads represented 67% of tablet ownership with an average spend of $122, which in
our view highlights the importance of familiarity and interoperability within the
consumer cloud ecosystem.
Fires represented 22% of tablet ownership and $117 in average spend
Exhibit 14: Average TTM spend by tablet type and tablet
share among Android phone users
Exhibit 15: Average TTM spend by tablet type and tablet
share among iPhone users
Source: Goldman Sachs Research.
Source: Goldman Sachs Research.
Exhibit 16: Average TTM spend by tablet type and tablet
share among Blackberry users
Exhibit 17: Average TTM spend by tablet type and tablets
share among Windows Phone users
Source: Goldman Sachs Research.
Source: Goldman Sachs Research.
$79
$93
$104 $109
$70
24%
2%
30%
39%
4%
0.0%
5.0%
10.0%
15.0%
20.0%
25.0%
30.0%
35.0%
40.0%
45.0%
$0
$20
$40
$60
$80
$100
$120
Android Google
Nexus 7
iPad Kindle Fire Nook Color
TTM Media and Apps Spend, $, LHS % Tablet Share, RHS
$91
$70
$122 $117
$52
7%
0%
67%
22%
4%0.0%
10.0%
20.0%
30.0%
40.0%
50.0%
60.0%
70.0%
80.0%
$0
$20
$40
$60
$80
$100
$120
$140
Android Blackberry iPad Kindle Fire Nook Color
TTM Media and Apps Spend, $, LHS % Tablet Share, RHS
$99
$20
$126 $122
$57
11%
2%
38%39%
11%
0.0%
5.0%
10.0%
15.0%
20.0%
25.0%
30.0%
35.0%
40.0%
45.0%
$0
$20
$40
$60
$80
$100
$120
$140
Android Google
Nexus 7
iPad Kindle Fire Nook Color
TTM Media and Apps Spend, $, LHS % Tablet Share, RHS
$94
$112
$90 $88
30%
27%
30%
12%
0.0%
5.0%
10.0%
15.0%
20.0%
25.0%
30.0%
35.0%
$0
$20
$40
$60
$80
$100
$120
Android iPad Kindle Fire Nook Color
TTM Media and Apps Spend, $, LHS % Tablet Share, RHS
December 7, 2012 Americas: Technology
Goldman Sachs Global Investment Research 20
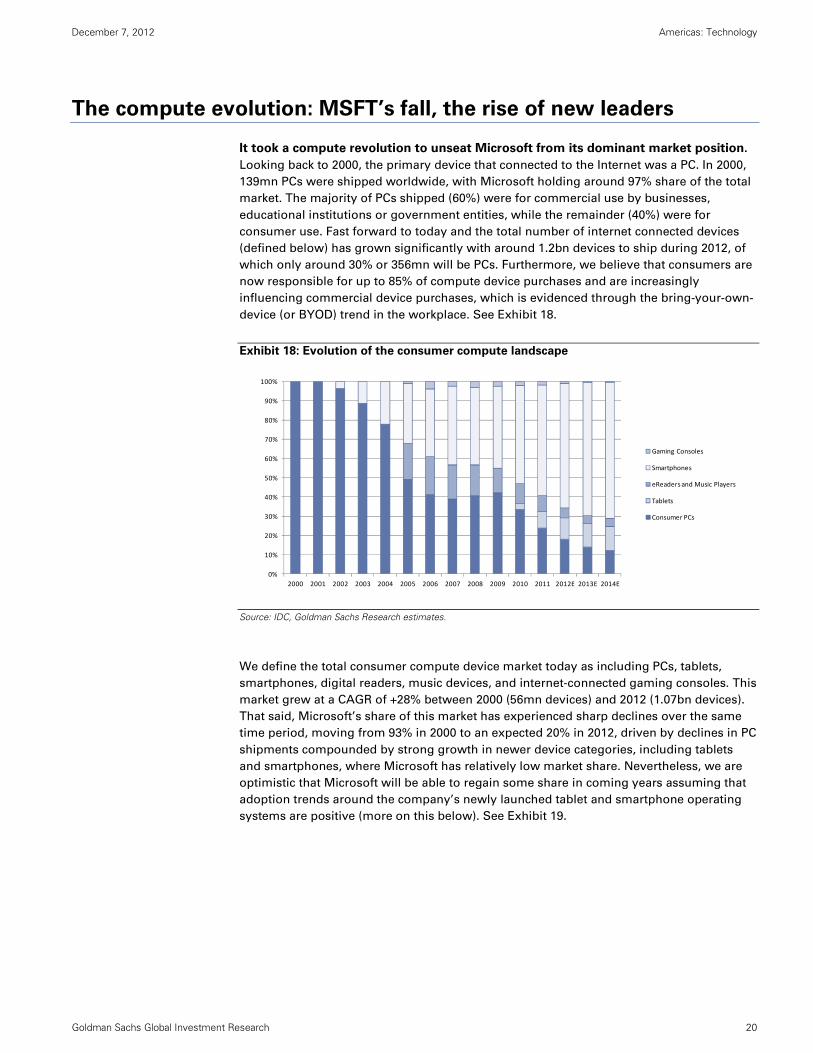
The compute evolution: MSFT’s fall, the rise of new leaders
It took a compute revolution to unseat Microsoft from its dominant market position.
Looking back to 2000, the primary device that connected to the Internet was a PC. In 2000,
139mn PCs were shipped worldwide, with Microsoft holding around 97% share of the total
market. The majority of PCs shipped (60%) were for commercial use by businesses,
educational institutions or government entities, while the remainder (40%) were for
consumer use. Fast forward to today and the total number of internet connected devices
(defined below) has grown significantly with around 1.2bn devices to ship during 2012, of
which only around 30% or 356mn will be PCs. Furthermore, we believe that consumers are
now responsible for up to 85% of compute device purchases and are increasingly
influencing commercial device purchases, which is evidenced through the bring-your-own-
device (or BYOD) trend in the workplace. See Exhibit 18.
Exhibit 18: Evolution of the consumer compute landscape
Source: IDC, Goldman Sachs Research estimates.
We define the total consumer compute device market today as including PCs, tablets,
smartphones, digital readers, music devices, and internet-connected gaming consoles. This
market grew at a CAGR of +28% between 2000 (56mn devices) and 2012 (1.07bn devices).
That said, Microsoft’s share of this market has experienced sharp declines over the same
time period, moving from 93% in 2000 to an expected 20% in 2012, driven by declines in PC
shipments compounded by strong growth in newer device categories, including tablets
and smartphones, where Microsoft has relatively low market share. Nevertheless, we are
optimistic that Microsoft will be able to regain some share in coming years assuming that
adoption trends around the company’s newly launched tablet and smartphone operating
systems are positive (more on this below). See Exhibit 19.
0%
10%
20%
30%
40%
50%
60%
70%
80%
90%
100%
2000 2001 2002 2003 2004 2005 2006 2007 2008 2009 2010 2011 2012E 2013E 2014E
Gaming Consoles
Smartphones
eReaders and Music Players
Tablets
Consumer PCs

December 7, 2012 Americas: Technology
Goldman Sachs Global Investment Research 21
Exhibit 19: Evolution of consumer compute market share by OS
Source: IDC, Goldman Sachs Research estimates.
Fundamentally, Microsoft’s business was disrupted by other vendors who
successfully introduced compelling new device categories. Microsoft became the
market-leading provider of operating systems for client computing in the 1980s with MS-
DOS, strengthening its dominance in the 1990s with the introduction of Windows. However,
the introduction of new device categories starting in 2001 with the launch of the iPod
(followed by the iPhone in 2007 and the iPad in 2010), which meaningfully changed the
way that individuals consume and create digital content, displaced PCs from their
dominant market positioning (see Exhibit 20). Although Microsoft has attempted to
participate in these new markets, for example, by introducing its smartphone operating
system Windows Phone in 2010 and introducing Windows 8 for tablets in 2012, the
company has been a significant technology laggard relative to category pioneers including
Apple, Google and Amazon.com. As such, we view the late October 2012 launches of
Windows 8 and Windows Phone 8 as critical for Microsoft to expand its share of the
consumer compute market.
Exhibit 20: Select compute device timeline
Source: Company data.
However, thus far, Microsoft has failed to establish a meaningful foothold in key
growth categories. The importance of smartphones cannot be understated as these
internet-connected “pocket PCs” have experienced explosive growth; 122mn smartphones
shipped in 2007 (of which 4mn were iPhones) versus 693mn devices expected to ship in
22% 21%23% 22% 21%
23% 24% 23% 25%
0% 0% 1%3%
14%
33%
42% 41% 41%
46%43%
46% 46%
35%
25%
20% 20%22%
0%
5%
10%
15%
20%
25%
30%
35%
40%
45%
50%
2006 2007 2008 2009 2010 2011 2012E 2013E 2014E
% Share of Consumer Compute (Unit Basis)
Apple Android Windows
20122005 2006 2007 2009 2010 20111995 20042001
iPod Mini Nintendo Wii
Galaxy Phone
Nook Kindle Fire
Nexus 7
Windows 8 OS
Windows Phone 8
Nexus 4
iPad Mini
Nexus 10
Nexus
iPad
Galaxy Tab
Nook Color
iPhone
iPod Touch
Kindle
iPod Classic
XboxiPod Shuffle
iPod Nano
Xbox 360
IE + Windows 95

December 7, 2012 Americas: Technology
Goldman Sachs Global Investment Research 22
2012 (136mn are estimated to be iPhones) reflecting a five-year category CAGR of 41%
(106% CAGR for iPhones over the same time frame). Importantly, we believe smartphones
will comprise around 65% of total consumer compute devices in 2012, progressing to 69%
in 2013 and 73% in 2016.
Tablets have also enjoyed strong growth since the category was introduced in 2010, which
is visible in the two-year CAGR of +148% (19.3mn devices shipped in 2010 vs. 119mn units
expected to ship in 2012). We think that tablets will make up around 11% of total consumer
compute devices in 2012, which will progress toward 12% in 2013 and 13% in 2016.
Importantly, we believe that Microsoft will end 2012 with 1% share of the tablet market and
3% of the smartphone market, although in 2013 we would expect Microsoft’s share of the
tablet market to increase to 12% (given the October 2012 release of the company’s first
tailored tablet OS) and Microsoft’s share of the smartphone market to increase to 7%
(gradual progression with Windows Phone OS). See 21- 22.
Exhibit 21: Evolution of tablet unit market share
Note: Android share includes Kindle Fire. Source: IDC, Goldman Sachs Research estimates.
Exhibit 22: Evolution of smartphone unit market share
Source: IDC, Goldman Sachs Research estimates.
77%
56% 56% 60% 61% 58% 56%
22%
43% 43%28% 23%
22% 21%
1% 1% 1%12% 16% 20% 23%
0%
10%
20%
30%
40%
50%
60%
70%
80%
90%
100%
2010 2011 2012E 2013E 2014E 2015E 2016E
iOS Tablet Share Total Android Tablet Share Windows Tablet Share
16% 20% 20% 18% 20% 24% 27%
23%
47%55%
53% 51%50% 48%
4%
2%
3% 7% 11%13%
18%
58%
31%22% 22% 18%
13%7%
0%
10%
20%
30%
40%
50%
60%
70%
80%
90%
100%
2010 2011 2012E 2013E 2014E 2015E 2016E
iOS Smartphone Share Android Smartphone Share Windows Smartphone Share Others Smartphone Share

December 7, 2012 Americas: Technology
Goldman Sachs Global Investment Research 23
With Microsoft on the sidelines up until recently, the consumer compute OS market
had come down to two key vendors: Apple with iOS and Google with Android (see
Exhibit 23). Apple’s strong market presence (we estimate 24% share of total consumer
compute in 2012) is the result of its role as a successful pioneer of key new compute
devices, including the smartphone and tablet. That having been said, as the company’s
software and application ecosystem is tied to its hardware devices, there was a need for an
alternative cross-platform operating system to enable competitive form factors. Google
met this need with the introduction of the Android operating system (open source) in
November 2007, which has proliferated across smartphones in particular, but tablets as
well. In fact, May 2012 data from OpenSignalMaps suggests there are more than 4K distinct
devices running Android with Samsung, HTC, Sony and Motorola as key device vendors.
Accordingly, with an estimated 42% of the total consumer compute market in 2012,
Google/ Android has captured the dominant position (Apple has the number-two spot at
24%, followed by Microsoft at 20% and other vendors at 14%), largely driven by Android’s
success in the smartphone category, where attractive device form factors have been
introduced by Samsung and others. We expect Android share to tick down slightly to 41%
share of total consumer compute in 2013/14 partly as Microsoft captures incremental share
with Windows 8 and Windows Phone 8.
Exhibit 23: Evolution of consumer compute market share on a unit basis
Source: IDC, Goldman Sachs Research estimates.
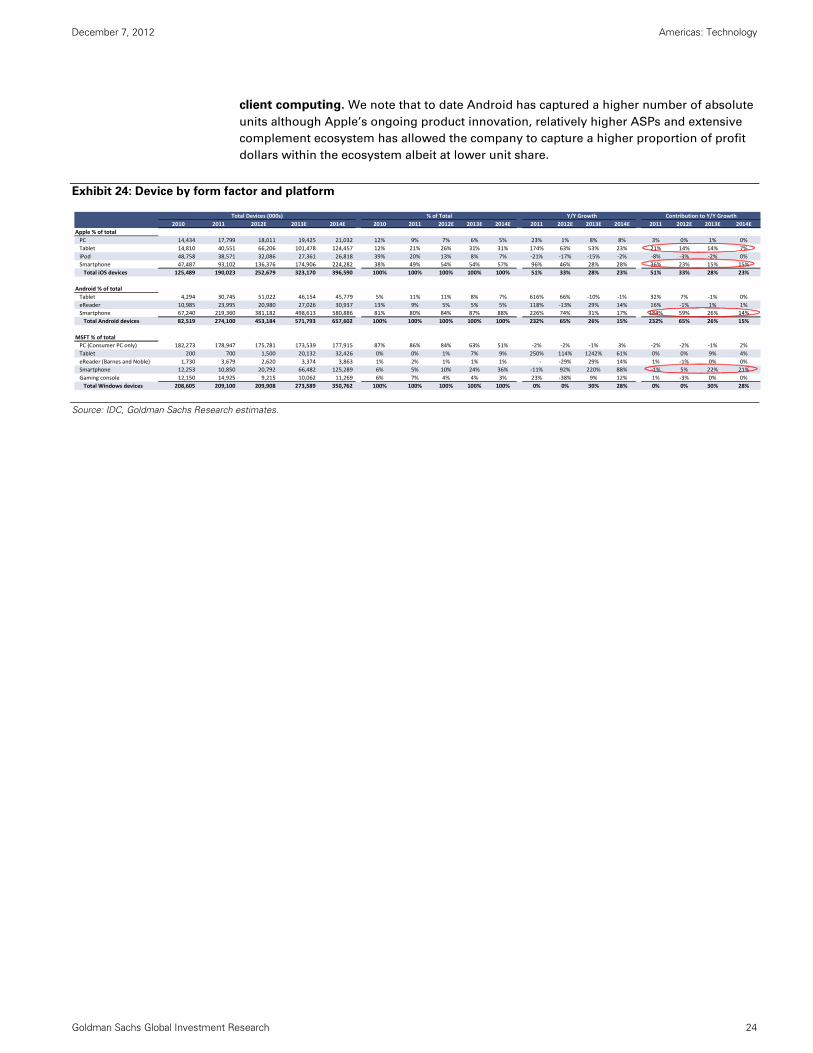
As shown in Exhibit 24, tablets and smartphones are expected to drive growth in the
total consumer compute market. Of the three platforms, we see Apple as best positioned
given its strength in both segments. While Android is expected to have around 21% of the
total tablet market (excluding Kindle Fire) in CY13 (as shown in Exhibit 29 on page 27), its
strength lies in smartphones, where Android is expected to grow units 31% yoy and have
53% share during the same time period. For Microsoft it is very early days, given the late
October 2012 launches of its new tablet and smartphone operating systems, though we
think the company is well positioned to go after productivity users given its appeal to its
Office user base.
Given diversification of the consumer compute market, we think it is unlikely that a
single vendor will come to dominate the entire market as Microsoft had done with
Total Devices (000s)
2006 2007 2008 2009 2010 2011 2012E 2013E 2014E 2015E 2016E
Total Consumer Devices
Apple 52,087 64,153 79,029 88,714 125,489 190,023 252,679 323,170 396,590 491,238 580,204
Android ‐ ‐ 1,951 11,435 82,519 274,100 453,184 571,793 657,602 725,341 772,732
Windows 107,115 129,130 159,398 187,863 208,605 209,100 209,908 273,589 350,762 411,226 519,488
Other 74,104 105,523 106,681 120,553 171,866 148,430 154,708 209,738 208,535 167,061 100,121
Total 233,306 298,806 347,059 408,565 588,480 821,654 1,070,479 1,378,290 1,613,489 1,794,867 1,972,545
% of Total Consumer Devices
Apple 22% 21% 23% 22% 21% 23% 24% 23% 25% 27% 29%
Android 0% 0% 1% 3% 14% 33% 42% 41% 41% 40% 39%
Windows 46% 43% 46% 46% 35% 25% 20% 20% 22% 23% 26%
Other 32% 35% 31% 30% 29% 18% 14% 15% 13% 9% 5%
Total 100% 100% 100% 100% 100% 100% 100% 100% 100% 100% 100%
YoY Growth
Apple 42% 23% 23% 12% 41% 51% 33% 28% 23% 24% 18%
Android ‐ ‐ ‐ 486% 622% 232% 65% 26% 15% 10% 7%
Windows 27% 21% 23% 18% 11% 0% 0% 30% 28% 17% 26%
Other 47% 42% 1% 13% 43% ‐14% 4% 36% ‐1% ‐20% ‐40%
Total 36% 28% 16% 18% 44% 40% 30% 29% 17% 11% 10%
December 7, 2012 Americas: Technology
Goldman Sachs Global Investment Research 24
client computing. We note that to date Android has captured a higher number of absolute
units although Apple’s ongoing product innovation, relatively higher ASPs and extensive
complement ecosystem has allowed the company to capture a higher proportion of profit
dollars within the ecosystem albeit at lower unit share.
Exhibit 24: Device by form factor and platform
Source: IDC, Goldman Sachs Research estimates.
Total Devices (000s) % of Total Y/Y Growth Contribution to Y/Y Growth
2010 2011 2012E 2013E 2014E 2010 2011 2012E 2013E 2014E 2011 2012E 2013E 2014E 2011 2012E 2013E 2014E
Apple % of total
PC 14,434 17,799 18,011 19,425 21,032 12% 9% 7% 6% 5% 23% 1% 8% 8% 3% 0% 1% 0%
Tablet 14,810 40,551 66,206 101,478 124,457 12% 21% 26% 31% 31% 174% 63% 53% 23% 21% 14% 14% 7%
iPod 48,758 38,571 32,086 27,361 26,818 39% 20% 13% 8% 7% ‐21% ‐17% ‐15% ‐2% ‐8% ‐3% ‐2% 0%
Smartphone 47,487 93,102 136,376 174,906 224,282 38% 49% 54% 54% 57% 96% 46% 28% 28% 36% 23% 15% 15%
Total iOS devices 125,489 190,023 252,679 323,170 396,590 100% 100% 100% 100% 100% 51% 33% 28% 23% 51% 33% 28% 23%
Android % of total
Tablet 4,294 30,745 51,022 46,154 45,779 5% 11% 11% 8% 7% 616% 66% ‐10% ‐1% 32% 7% ‐1% 0%
eReader 10,985 23,995 20,980 27,026 30,937 13% 9% 5% 5% 5% 118% ‐13% 29% 14% 16% ‐1% 1% 1%
Smartphone 67,240 219,360 381,182 498,613 580,886 81% 80% 84% 87% 88% 226% 74% 31% 17% 184% 59% 26% 14%
Total Android devices 82,519 274,100 453,184 571,793 657,602 100% 100% 100% 100% 100% 232% 65% 26% 15% 232% 65% 26% 15%
MSFT % of total
PC (Consumer PC only) 182,273 178,947 175,781 173,539 177,915 87% 86% 84% 63% 51% ‐2% ‐2% ‐1% 3% ‐2% ‐2% ‐1% 2%
Tablet 200 700 1,500 20,132 32,426 0% 0% 1% 7% 9% 250% 114% 1242% 61% 0% 0% 9% 4%
eReader (Barnes and Noble) 1,730 3,679 2,620 3,374 3,863 1% 2% 1% 1% 1% ‐ ‐29% 29% 14% 1% ‐1% 0% 0%
Smartphone 12,253 10,850 20,792 66,482 125,289 6% 5% 10% 24% 36% ‐11% 92% 220% 88% ‐1% 5% 22% 21%
Gaming console 12,150 14,925 9,215 10,062 11,269 6% 7% 4% 4% 3% 23% ‐38% 9% 12% 1% ‐3% 0% 0%
Total Windows devices 208,605 209,100 209,908 273,589 350,762 100% 100% 100% 100% 100% 0% 0% 30% 28% 0% 0% 30% 28%
December 7, 2012 Americas: Technology
Goldman Sachs Global Investment Research 25
Smartphones and tablets make the platform relevant
The emergence of new device categories, namely the smartphone and the tablet,
created a compute revolution that dramatically altered the total compute landscape.
At this point, Apple’s platform and Android-based devices are the focus; it is still early days
for Microsoft.
Smartphones became top of mind with Apple’s release of the iPhone in 2007, though
various other vendors quickly followed suit with competitive devices. As noted by IDC,
smartphone shipments outpaced PC shipments for the first time as of 4Q10, driven by
favorable pricing offered by carriers and retailers as well as the proliferation of Android-
based devices that offered consumers a range of choices across price points. For
comparison, Goldman Sachs analyst Simona Jankowski estimates approximately 690mn
smartphones will ship in 2012, which is close to 2X the number of PCs (356mn) forecast by
Goldman Sachs Hardware analyst, Bill Shope, during the same time period; in 2013 950mn
smartphones are expected to ship (+37% yoy), which is 2.7X the number of PC shipments
(357mn, flat yoy) anticipated.
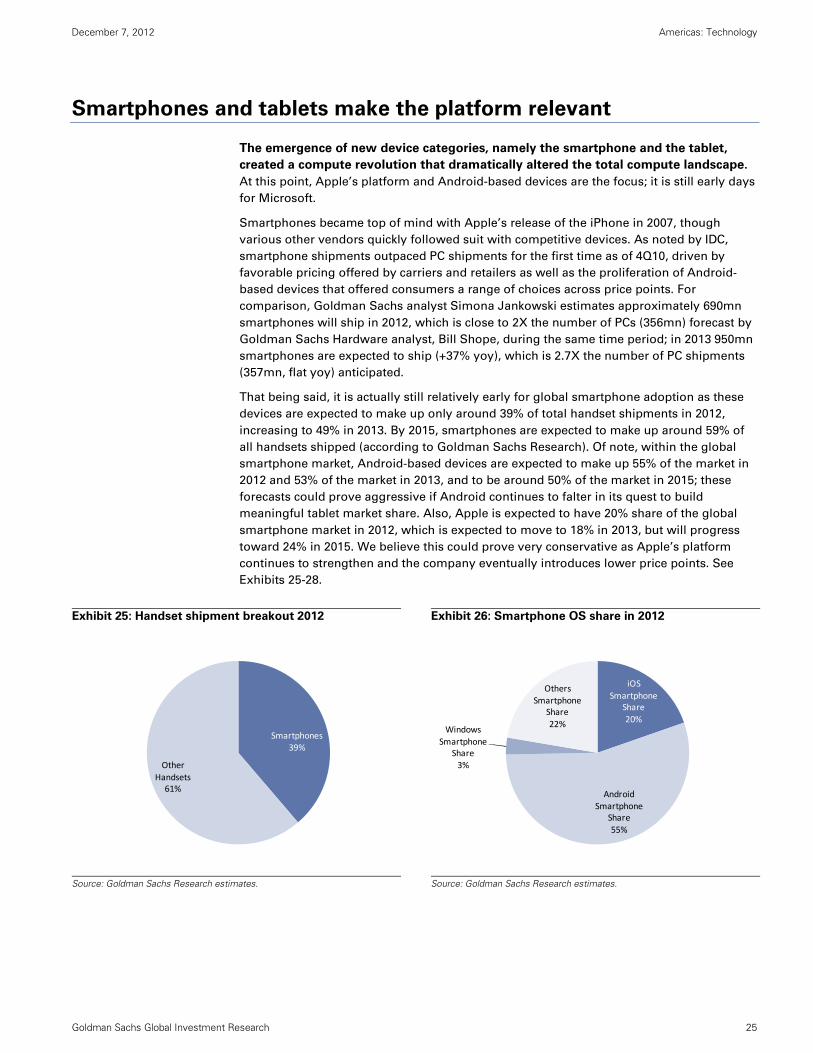
That being said, it is actually still relatively early for global smartphone adoption as these
devices are expected to make up only around 39% of total handset shipments in 2012,
increasing to 49% in 2013. By 2015, smartphones are expected to make up around 59% of
all handsets shipped (according to Goldman Sachs Research). Of note, within the global
smartphone market, Android-based devices are expected to make up 55% of the market in
2012 and 53% of the market in 2013, and to be around 50% of the market in 2015; these
forecasts could prove aggressive if Android continues to falter in its quest to build
meaningful tablet market share. Also, Apple is expected to have 20% share of the global
smartphone market in 2012, which is expected to move to 18% in 2013, but will progress
toward 24% in 2015. We believe this could prove very conservative as Apple’s platform
continues to strengthen and the company eventually introduces lower price points. See
Exhibits 25-28.
Exhibit 25: Handset shipment breakout 2012
Exhibit 26: Smartphone OS share in 2012
Source: Goldman Sachs Research estimates.
Source: Goldman Sachs Research estimates.
Smartphones39%
Other
Handsets61%
iOS
Smartphone Share
20%
Android Smartphone
Share
55%
Windows
Smartphone Share3%
Others Smartphone
Share
22%

December 7, 2012 Americas: Technology
Goldman Sachs Global Investment Research 26
Exhibit 27: Handset shipment breakout 2015
Exhibit 28: Smartphone OS share in 2015
Source: Goldman Sachs Research estimates.
Source: Goldman Sachs Research estimates.
As with smartphones, Apple broke new ground with the release of its iPad tablet in 2010.
Although other vendors have introduced a range of Android-based tablets since the iPad,
most notably Samsung with the Galaxy Tab (September 2010), Amazon.com with the
Kindle Fire (September 2011), and Google with the Nexus 7 (June 2012), this market has
largely been dominated by Apple.
Goldman Sachs estimates that 119mn tablets will ship in 2012, which is up 65% yoy versus
72mn devices shipped in 2011 and reflects a two-year CAGR of 148%; in 2013 a total of
168mn tablets are expected to ship (up 41% yoy), which reflects a three-year CAGR of
106%.Within this market, iPad share is expected to move from 56% in 2012 to 60% in 2013
and to 56% in 2016, while Android will move from 43% share in 2012 to 28% in 2013 and to
21% in 2016 (incl. Kindle Fire). The remainder of this market is made up of devices from
Microsoft (1% share in 2012, 12% share in 2013 and 23% share in 2016) among others. See
Exhibit 29.
Smartphones
59%
Other Handsets41%
iOS
Smartphone Share
24%
Android
Smartphone Share
50%
Windows
Smartphone Share
13%
Others Smartphone
Share13%

December 7, 2012 Americas: Technology
Goldman Sachs Global Investment Research 27
Exhibit 29: Market share by device
Note: Total consumer compute market share by vendor includes gaming consoles and streaming music players, which are visible in Exhibit 24.
Source: IDC, Goldman Sachs Research estimates.
In terms of the breakout between consumer and commercial tablet adoption, IDC estimates
that around 94% of tablets shipped in 2011 were for consumer use while only 6% were for
commercial use. By 2016, consumers are expected to adopt around 83% of total units
shipped, while the remaining 17% of units will be for commercial use. As the tablet market
is broadly being propelled by consumer purchases, we think that it is reasonable to assume
that consumer preferences regarding vendor/ device have a meaningful influence on
commercial purchasing decisions now and in the future, especially in a world moving
increasingly toward BYOD. That being said, total tablet shipments are expected to rival
consumer PC shipments in 2013 (168mn tablets vs. 193mn PCs) and surpass consumer PC
shipments in 2014 (203mn tablets vs. 199mn PCs), based on Goldman Sachs forecasts. In
fact, in our view, the lines are blurring between consumer PCs and tablets, and as such
these device categories will likely converge as OEMs become more adept at creating form
factors that can cross both categories in more convenient ways. See Exhibit 30.
2005 2006 2007 2008 2009 2010 2011 2012E 2013E 2014E 2015E 2016E
Consumer Compute Market Share by Device
Consumer PC
Windows 94% 94% 93% 93% 93% 93% 91% 91% 90% 89% 89% 89%
Mac OS 6% 6% 7% 7% 7% 7% 9% 9% 10% 11% 11% 11%
Total 100% 100% 100% 100% 100% 100% 100% 100% 100% 100% 100% 100%
Tablet
iOS Tablet Share 0% 0% 0% 0% 0% 77% 56% 56% 60% 61% 58% 56%
Android Tablet Share 0% 0% 0% 0% 0% 22% 43% 43% 28% 23% 22% 21%
Kindle Fire Share 0% 0% 0% 0% 0% 0% 7% 10% 6% 5% 5% 5%
Android ex‐Fire 0% 0% 0% 0% 0% 22% 36% 33% 21% 18% 17% 16%
Windows Tablet Share 0% 0% 0% 0% 0% 1% 1% 1% 12% 16% 20% 23%
Total 0% 0% 0% 0% 0% 100% 100% 100% 100% 100% 100% 100%
Smartphone
iOS Smartphone Share 0% 0% 3% 10% 15% 16% 20% 20% 18% 20% 24% 27%
Android Smartphone Share 0% 0% 0% 1% 5% 23% 47% 55% 53% 51% 50% 48%
Windows Smartphone Share 6% 9% 11% 13% 11% 4% 2% 3% 7% 11% 13% 18%
Others Smartphone Share 94% 91% 86% 77% 70% 58% 31% 22% 22% 18% 13% 7%
Total 100% 100% 100% 100% 100% 100% 100% 100% 100% 100% 100% 100%
eReaders
B&N eReader Share 0% 0% 0% 0% 0% 14% 13% 11% 11% 11% 11% 11%
Kindle eReader Share 0% 0% 0% 0% 0% 55% 62% 33% 25% 20% 20% 20%
Others eReader Share 0% 0% 0% 0% 0% 31% 25% 56% 64% 68% 69% 69%
Total 0% 0% 0% 0% 0% 100% 100% 100% 100% 100% 100% 100%
Total Consumer Compute Market Share by Vendor
Apple 21% 22% 21% 23% 22% 21% 23% 24% 23% 25% 27% 29%
Google 0% 0% 0% 1% 3% 14% 33% 42% 41% 41% 40% 39%
Microsoft 49% 46% 43% 46% 46% 35% 25% 20% 20% 22% 23% 26%
Other 29% 32% 35% 31% 30% 29% 18% 14% 15% 13% 9% 5%
Total 79% 78% 79% 77% 75% 65% 44% 34% 35% 35% 32% 31%

December 7, 2012 Americas: Technology
Goldman Sachs Global Investment Research 28
Exhibit 30: Consumer PC shipments versus total tablet shipments (000s)
Source: IDC, Goldman Sachs Research estimates.
More important than the release of the physical smartphone or the tablet has been
the emergence of broad application ecosystems surrounding each platform. We think
that the cross-device capabilities (or lack thereof) offered by each ecosystem increase
switching costs for users as they leverage the massive application catalog that exists for
each.
There are more than 750K iPhone and iPad apps, which have been downloaded 35bn times,
and there are more than 700K Google Play Apps, which have been downloaded 20bn times
(for comparison, we note that Microsoft’s application store, which just started, has around
20K Windows 8 applications and is growing quickly). Importantly, Apple’s application
ecosystem is tied directly to its own operating system, which is limited to its own devices,
while many Android applications are capable of running across Android devices (Kindle
Fire devices are a notable exceptions as they only run applications from the Amazon.com
Appstore, which has only a fraction of the total applications that are available for Android,
for example from Google Play). Furthermore, as the Apple and Android platforms have
emerged as the front-runners in today’s platform wars, developers have been cognizant
about developing applications for both platforms or are relying on browser-based
applications that are OS/ device-agnostic. Given the low costs associated with porting
applications from one platform to another, we would expect the market to support three
broad ecosystems.
That said, we believe it is still relatively early days for the platform revolution as a majority
of the global population has yet to adopt a smartphone (as noted above, smartphones are
expected to be only around 39% of the total mobile phone market in 2012; 70% of handset
shipments in developed markets vs. 29% in emerging markets) and even fewer have
adopted tablets (see Exhibit 31). Accordingly, we believe there is a large revenue
opportunity still to come for the key platform providers. Along these lines, our survey work
suggests that content/ application spend increases when an individual owns a smartphone
and a tablet that share a common platform; to date, this trend has favored Apple and we
would expect it to do so going forward as well.
0
50,000
100,000
150,000
200,000
250,000
300,000
350,000
400,000
2010 2011 2012E 2013E 2014E
Total PCs
Total Tablets

December 7, 2012 Americas: Technology
Goldman Sachs Global Investment Research 29
Exhibit 31: Total devices shipped between 2000-2014E
Source: IDC, Goldman Sachs Research estimates.
As shown by our mobile user survey, consumers indicated that (1) familiarity with a
platform and (2) the ability to continue to use previously purchased applications are
critical factors when deciding on new device purchases. Accordingly, it is clear that
having a first-mover advantage is important, though we note that the new device itself
must be a compelling standalone offering, otherwise the user may not be willing to stay
with a given ecosystem. Accordingly, considering only these two criteria in the context of
Apple, Android and Microsoft, we note that Apple’s integrated system strategy enjoys the
following advantages:
Fragmentation of the Android-based device ecosystem, while favorable in the context
of market penetration, also presents a significant hurdle around establishing a
consistent “Android” user experience. We note, however, that of the 367mn Android
smartphone shipments expected in 2012, roughly 56% of these are estimated to be
driven by Samsung.
Android device proliferation creates challenges around transferring content between
Android devices. As an example, even Android smartphone leader Samsung does not
offer an easy process to transfer content; Samsung describes four different methods to
transfer music, photos, videos, each of which can involve a complicated set of
processes depending on the device or content type. We see the emergence of cross-
platform third party storage solutions such as Dropbox, Box, and Google Drive
alleviating some of this burden.
As we have stated, we think it is still early days for Microsoft in both the tablet and
smartphone markets relative to Apple and Android. That being said, we think the
release of Windows 8 and Windows Phone 8 will help the company achieve a more
meaningful presence within both markets as the company drives adoption within its
installed user base, especially among Office loyalists.
Our conclusion: although some might say the battle looks won at this point, we think
the compute revolution is actually in its infancy with the competitive battle just
getting started. Our long-term view is that there will ultimately be a closed loop between
smartphone, tablets and other devices, such as TVs, that will keep users tied to an
ecosystem (more on this topic on page 42 of this report).
Total Tablet Shipments580,454
Total Consumer PC Shipments1,876,948
Apple Smartphone Shipments718,638
Android Smartphone Shipments1,756,725
0
500,000
1,000,000
1,500,000
2,000,000
2,500,000
Shipped Units in 000s

December 7, 2012 Americas: Technology
Goldman Sachs Global Investment Research 30
The user path to standardizing on a platform
While it can be debated whether the smartphone or the tablet is the “anchor” device that
binds a user to a particular platform, in our view the path to standardization is not fixed
and the so-called “anchor” device can be different at different points in time. As outlined in
Exhibit 32, we believe users will choose between device loyalty and ecosystem loyalty, and
we see three distinct and likely paths for users as they standardize on one platform which
we outline thereafter. In our view, we are still in the early stages of smartphone adoption.
Goldman Sachs analyst Simona Jankowski estimates that smartphones will be 39% of total
handsets in 2012, which compares with 27% in 2011 and 19% in 2010. Furthermore, in
developing markets, only 29% of total mobile phone shipments are estimated to be
smartphones in 2012. That being said, the base of smartphone users is much larger than
the base of tablet users; we estimate that between 2007 and 2012 around 1.1bn Apple,
Android and Windows smartphones shipped vs. 210mn total tablet shipments. Between
2007 and 2014, we think 2.9bn Apple, Android and Windows smartphones will have
shipped versus 580mn tablets worldwide.
Exhibit 32: User will choose between ecosystem loyalty and device loyalty
Source: Goldman Sachs Research.
As mentioned earlier, we believe in the current landscape there are three different paths to
ecosystem loyalty for consumers which we outline below.
Path 1: In this scenario, the user owns an iPhone but not a tablet. In our view, given the
importance of familiarity (cited by 86% of smartphone owners in our survey) and of using
apps across devices (cited by 40% of non-tablet owners), the user is most likely to purchase
an iPad. Our view is supported by our survey results in which the iPad enjoyed 67% tablet
Current Phone OSPurchase #1
Tablet OS Choice Purchase #2
Upgrade Phone OS Purchase #3
Smartphonesrepresent 36% of global handset
shipments in CY12
Tablets represent 25% of global PC/Tablet
shipments in CY12
Will ECOSYSTEM or DEVICE Loyalty
win out?
iOS iOS
Android
Windows
Android
Windows
iOS
Android
Windows
Ecosystem Loyalty
Device Loyalty

December 7, 2012 Americas: Technology
Goldman Sachs Global Investment Research 31
share among iPhone owners. At this point, with the ability to sync media and apps across
both devices the user has effectively standardized on Apple’s platform.
Path 2: The user owns a smartphone other than the iPhone and does not own a tablet. In
this scenario, we believe the importance of familiarity diminishes as compelling
alternatives to the iPad have only trickled onto the market thus far. Our view on
fragmentation is supported by the fact that the iPad enjoyed 32% tablet share among non-
iPhone owners, compared to the Kindle Fire at 40% and Android tablets at 25%. At this
point, we view this user as roughly just as likely to purchase an iPad as any other tablet.
That said, if the user does purchase an iPad, we believe the ability to sync media and apps
will result in this users next phone purchase likely being an iPhone.
Path 3: As in path 2, the user owns a non-iPhone smartphone but not a tablet. However, in
this scenario we assume there is a compelling alternative to the iPad, whether it is the
Kindle Fire, Google Nexus 7, Microsoft Surface or some new device. If one of these new or
relatively new entrants is on the same platform as the user’s smartphone, in our view, the
user is likely to purchase that tablet given the appeal of familiarity and the desire to cross-
sync apps and media.
Vendor implications
Amazon: by leveraging its large customer base, the company has made significant inroads
with its Kindle Fire tablet offering, which is expected to have garnered 10% of the global
tablet market as of 2012 (this is notable as it was released only in September 2011). Further,
through its Kindle and CloudPlayer apps, which are available for both iOS and Android
devices, and its Instant video for iPad app, Amazon has effectively made its offerings a
platform-within-a-platform and enabled distribution across the majority of computing
devices. That said, as with any non-Apple music app, using Cloud Player on iOS is not
entirely frictionless. For example, songs purchased from iTunes prior to Apple dropping
digital rights management restrictions cannot be imported in to Cloud Player without some
form of work-around, such as burning them to a CD and then re-importing from the CD. In
a world in which HTML5 is perhaps 3-5 years away from becoming a true platform of its
own, if at all, we would not be surprised to see Amazon.com at some point launch a
smartphone to bolster its presence in the mobile ecosystem space. This is especially the
case given the shift of physical media to digital.
Apple: Given the current industry dynamic in the mobile ecosystem space, in our view
Apple can maintain its lead through continuing innovations and platform adoption. As
detailed in our report, Apple Inc. (AAPL): How resilient is the platform and what are the real
risks?, June 29, 2012, Apple enjoys a high degree of platform loyalty, which becomes even
more pronounced with users who own more than one device. Not only does this dynamic
result in few defections from the platform, but it also lays the foundation for a powerful
number of upgrades in the future. By our estimate, only 69 million iOS devices shipped in
FY2012 were upgrades, but this number can surpass 195 million in FY2014. In addition, we
believe that Apple has plenty of room to attract new users. Most notably, we believe the
company can sharply increase its share in emerging regions, as its platform takes hold and
new devices such as the iPad mini and lower priced iPhones make entry more affordable. If
we are taking the Windows smartphone number down, we can boost the iPhone share in
the units beyond our published forecast horizon. As outlined in greater detail in the
Compute evolution section on page 20, over time we would expect overall smartphone and
tablet share to converge given the power of familiarity with the operating system and
ability to sync media and apps across devices.
Google: While Google has garnered significant share of the smartphone market with its
Android operating system, we continue to view a breakout tablet offering as critical to
protecting its high market share. As we have said, given the pull of familiarity and synced

December 7, 2012 Americas: Technology
Goldman Sachs Global Investment Research 32
app use, we believe smartphone and tablet share are likely to converge over time. As such,
in a world where Google does not have a compelling tablet offering, not only is the
company’s ability to play in the mobile media and device space limited, but mobile search
margins will be negatively impacted due to high TAC rates. Without a successful tablet
offering, in our view, Google, which has long dominated desktop search without having to
pay materially for distribution, will face a mobile world not just where CPCs (cost per click)
are lower, but where they have to rely on others platforms for distribution. For example,
one item to watch, in our view, is if Samsung, given it is the workhorse of Android, will be
able to extract TAC payments from Google in the future or some sort of tax for making
Android a brand name.
Samsung Electronics: We estimate that Samsung Electronics’ global smartphone market
share may reach 33% in 2012, making the company the largest smartphone vendor.
Although over 95% of these devices may be on the Android platform, Samsung Electronics
maintains a multi-operating system policy. In other words, the company is operating
system agnostic – Samsung Electronics will provide products in line with consumers’
demands focusing on hardware differentiation (AM OLED panel, larger screen, better
application processor, etc). With the largest reach, fast design times, and differentiated
designs, we believe that platform providers such as Google and Microsoft may continue to
rely on Samsung Electronics disproportionately compared to other OEM makers, a virtuous
cycle for Samsung Electronics. Meanwhile, Samsung Electronics’ success in the tablet
market has been mixed compared to the company’s smartphone success. For example, we
estimate that Samsung Electronics’ tablet market share may only reach 12% (albeit better
than single digit in 1H12) in 2012 compared to 33% for smartphones. We attribute the
difference to Samsung Electronics not being able to offer a compelling device at a
differentiated price from market incumbents. However, with hardware (S-Pen; the stylus)
differentiation and more realistic pricing for less differentiated products it appears that
Samsung Electronics’ tablet momentum is gaining momentum. We believe that Samsung
Electronics plans to leverage its semiconductor/hardware differentiation, relationship with
platform providers, and scale to become a more aggressive tablet provider over the mid-
term. For now we expect that Samsung Electronics will continue to focus on providing
hardware and that even over the mid-term the company is unlikely to focus on an internally
developed operating system.
Microsoft: We view the success of Microsoft’s Surface tablet as critical to its ability to
compete in this new compute paradigm. In our view Microsoft’s tablet offerings will likely
be the key anchor in determining pull through of Windows-based smartphones. Further,
we would not be surprised to see the company release a Microsoft branded smartphone at
some point, following in its lead of developing its own tablet offering, Surface. As such, we
would expect Microsoft to increase its share in both the tablet and smartphone markets,
but at what level remains to be seen.
Should I stay or should I go? How users choose a platform
Given the importance of attracting and retaining users, we looked at three different user
segments and their preferences on the path to standardizing on a platform:
1. Loyal users who remain with the platform they are already on.
2. Defectors, who leave one ecosystem to become new users of another.
3. Brand-new users who have yet to purchase a smartphone or tablet.

December 7, 2012 Americas: Technology
Goldman Sachs Global Investment Research 33
Loyalists: Familiarity and app purchases likely limit churn
We define this group as those who are likely to stay because of familiarity with the user
interface (UI) and convenience with content/apps (e.g., don’t have to repurchase again). In
our proprietary survey of over 1,000 smartphone owners (see Exhibits 33-34):
86% reported that familiarity with their current device would be a top-three
consideration in their next devices purchase.
Among the tablet owner sub-group, 86% also reported that familiarity was a top-three
criterion.
47% of smartphone owners and 42% of tablet owners stated their purchased apps
would be a top-three factor in remaining on the same platform.
Among respondents who do not own a tablet, 40% indicated apps purchased on their
smartphone would be a primary driver in a tablet purchase decision.
Exhibit 33: For your next smartphone purchase, what would make you buy the same
device again? Please rank the three most important features or select all. (n=977)
Source: Goldman Sachs Research.
77%
9%4% 4% 4% 1% 2%
6%
21%
17% 15%8%
4% 2%
3%
17%
14% 15%
6%
6%2%
0%
10%
20%
30%
40%
50%
60%
70%
80%
90%
100%
Familiarity
with how it
works
Don't want
to
repurchase
my apps
Don't want
to move my
photos
Don't want
to move my
music
Don't want
to move my
videos
Don't want
to move my
e-books
Other
1st 2nd 3rd86%
47%
35% 34%
18%
11%6%

December 7, 2012 Americas: Technology
Goldman Sachs Global Investment Research 34
Exhibit 34: For your next tablet purchase, what would make you buy the same device you
have now again? Please rank the three most important features. (n=582)
Source: Goldman Sachs Research.
Defectors: Pricing is key, but app ecosystem also important
We highlight a few points from our survey that lead us to conclude that pricing and the
application ecosystem are key factors in driving user defection (see Exhibits 35-36):
68% of smartphone owners reported that price would be a top-three factor in
switching ecosystems for their next device purchase. That said, in a June 29 report on
Apple, How resilient is the platform and what are the real risks? Goldman Sachs
hardware analyst Bill Shope highlighted results from a survey of iPhone users in which
the weighted average discount needed to get them to consider switching platforms
was approximately 50%, or a discount range of about $200-$400 across the iPad
product family and roughly $50-$200 for the iPhone.
o 68% of both Android phone users and Windows phone users named price as a
top factor, whereas 63% and 61% of iPhone and Blackberry users, respectively,
listed price as a top consideration.
Among the tablet owner sub-group (respondents who own both a smartphone and a
tablet) 66% of respondents reported that price was a top-three consideration.
o 67% Android tablet and 69% of Kindle Fire owners ranking it in their top three
versus 63% of iPad owners.
That being said, 47% of smartphone owners and 46% of tablet owners cited the quality
and variety apps available as a top three factor in switching platforms.
74%
10%4% 3% 6% 2% 1%
8%
16%
16% 13%12%
9%2%
4%
15%
11%11% 8%
13%
1%0.0%
10.0%
20.0%
30.0%
40.0%
50.0%
60.0%
70.0%
80.0%
90.0%
100.0%
Familiarity
with how it
works
Don't want
to
repurchase
my apps
Don't want
to move my
e-books
Don't want
to move my
music
Don't want
to move my
videos
Don't want
to move my
photos
Other
1st 2nd 3rd
42%
30%26% 26% 24%
86%
3%

December 7, 2012 Americas: Technology
Goldman Sachs Global Investment Research 35
Exhibit 35: What would make you switch smartphone device ecosystems? Please rank the
three most important features or select if you don't care because you don't use the
phone's ecosystem. (n=908)
Source: Goldman Sachs Research.
Exhibit 36: What would make you switch tablet device ecosystems (i.e., Google Android to
Apple iOS or vice versa)? Please rank the three most important features. (n=553)
Source: Goldman Sachs Research.
35%30%
14%7% 6% 5% 3% 1%
18%
15%
15%
16%11%
8%
0% 2%
15%
7%
17%
10%15%
7%
1% 1%0.0%
10.0%
20.0%
30.0%
40.0%
50.0%
60.0%
70.0%
80.0%
Price Bigger
screen size
Variety
and quality
of
available
apps
Better
camera
Ability to
share
content
across
multiple
devices
Ability to
use
Microsoft
Word and
Excel
Other Smaller
screen size
1st 2nd 3rd68%
52%47%
33%
21%
4%
33%
5%
36%
10%
29%
6% 8% 6%2% 3%
17%
19%
11%
9%12%
10%
2% 0%
13%
17%
5%
18% 8%7%
0% 1%0.0%
10.0%
20.0%
30.0%
40.0%
50.0%
60.0%
70.0%
Price Variety
and quality
of
available
apps
Bigger
screen size
Ability to
share
content
across
multiple
devices
Ability to
use
Microsoft
Word and
Excel
Better
camera
Smaller
screen size
Other
1st 2nd 3rd
66%
46% 46%
34%
23%
4%
28%
4%
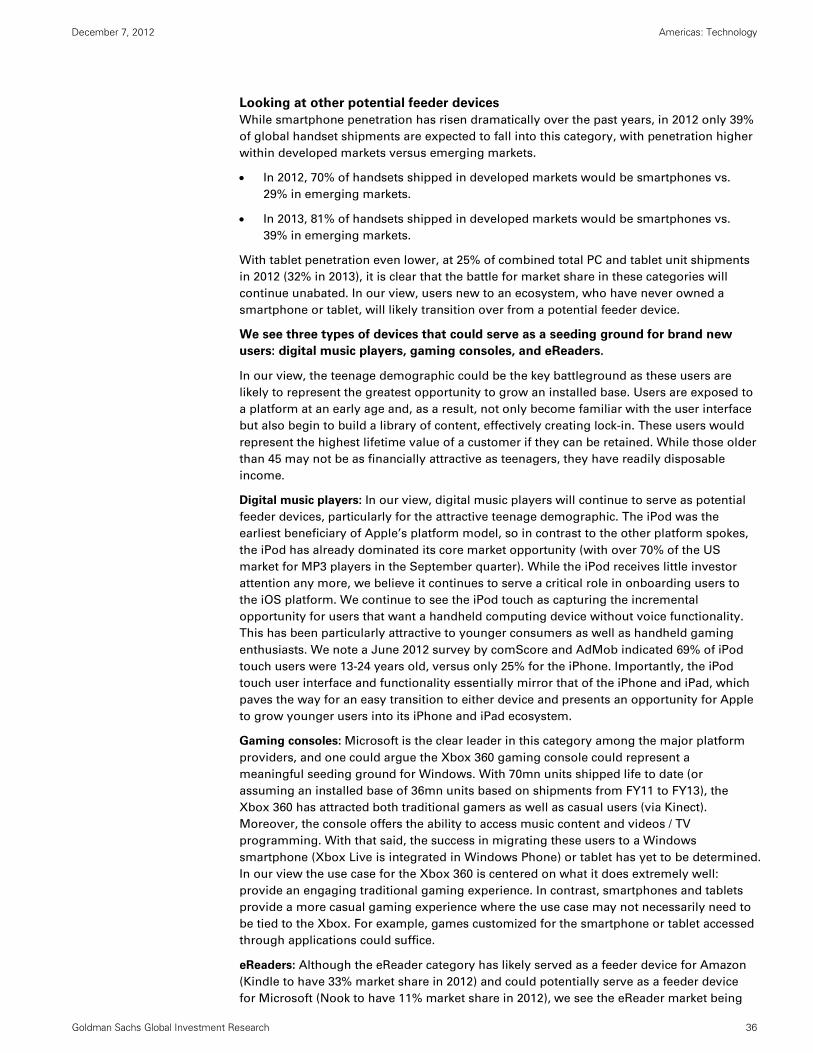
December 7, 2012 Americas: Technology
Goldman Sachs Global Investment Research 36
Looking at other potential feeder devices
While smartphone penetration has risen dramatically over the past years, in 2012 only 39%
of global handset shipments are expected to fall into this category, with penetration higher
within developed markets versus emerging markets.
In 2012, 70% of handsets shipped in developed markets would be smartphones vs.
29% in emerging markets.
In 2013, 81% of handsets shipped in developed markets would be smartphones vs.
39% in emerging markets.
With tablet penetration even lower, at 25% of combined total PC and tablet unit shipments
in 2012 (32% in 2013), it is clear that the battle for market share in these categories will
continue unabated. In our view, users new to an ecosystem, who have never owned a
smartphone or tablet, will likely transition over from a potential feeder device.
We see three types of devices that could serve as a seeding ground for brand new
users: digital music players, gaming consoles, and eReaders.
In our view, the teenage demographic could be the key battleground as these users are
likely to represent the greatest opportunity to grow an installed base. Users are exposed to
a platform at an early age and, as a result, not only become familiar with the user interface
but also begin to build a library of content, effectively creating lock-in. These users would
represent the highest lifetime value of a customer if they can be retained. While those older
than 45 may not be as financially attractive as teenagers, they have readily disposable
income.
Digital music players: In our view, digital music players will continue to serve as potential
feeder devices, particularly for the attractive teenage demographic. The iPod was the
earliest beneficiary of Apple’s platform model, so in contrast to the other platform spokes,
the iPod has already dominated its core market opportunity (with over 70% of the US
market for MP3 players in the September quarter). While the iPod receives little investor
attention any more, we believe it continues to serve a critical role in onboarding users to
the iOS platform. We continue to see the iPod touch as capturing the incremental
opportunity for users that want a handheld computing device without voice functionality.
This has been particularly attractive to younger consumers as well as handheld gaming
enthusiasts. We note a June 2012 survey by comScore and AdMob indicated 69% of iPod
touch users were 13-24 years old, versus only 25% for the iPhone. Importantly, the iPod
touch user interface and functionality essentially mirror that of the iPhone and iPad, which
paves the way for an easy transition to either device and presents an opportunity for Apple
to grow younger users into its iPhone and iPad ecosystem.
Gaming consoles: Microsoft is the clear leader in this category among the major platform
providers, and one could argue the Xbox 360 gaming console could represent a
meaningful seeding ground for Windows. With 70mn units shipped life to date (or
assuming an installed base of 36mn units based on shipments from FY11 to FY13), the
Xbox 360 has attracted both traditional gamers as well as casual users (via Kinect).
Moreover, the console offers the ability to access music content and videos / TV
programming. With that said, the success in migrating these users to a Windows
smartphone (Xbox Live is integrated in Windows Phone) or tablet has yet to be determined.
In our view the use case for the Xbox 360 is centered on what it does extremely well:
provide an engaging traditional gaming experience. In contrast, smartphones and tablets
provide a more casual gaming experience where the use case may not necessarily need to
be tied to the Xbox. For example, games customized for the smartphone or tablet accessed
through applications could suffice.
eReaders: Although the eReader category has likely served as a feeder device for Amazon
(Kindle to have 33% market share in 2012) and could potentially serve as a feeder device
for Microsoft (Nook to have 11% market share in 2012), we see the eReader market being
December 7, 2012 Americas: Technology
Goldman Sachs Global Investment Research 37
subsumed by the broader tablet market over time. For AMZN in particular, we think the
company’s eReader presence declines as customers opt to purchase Kindle Fire tablets
(launched in September 2011), which have broader functionality versus the standalone
Kindle eReader at a comparable price point (an 8GB Kindle Fire starts at $159 vs. the most
basic Kindle at $69 or the Kindle Paperwhite at $119). Other tablets in the sub-10 inch
category, which is similar to the eReader form factor, include the Samsung Galaxy Tab
(launched September 2010), the Google Nexus 7 (launched June 2012) and the iPad mini
(launched October 2012).

December 7, 2012 Americas: Technology
Goldman Sachs Global Investment Research 38
HTML5 could change everything
Turning to longer-term market analysis, we now look at potential changes that could
disrupt the competitive dynamic we have outlined for the near and medium term. The
promise of HTML5 is that it can liberate the services and media that users consume from
any specific device. As an example, instead of utilizing a natively developed iOS application
that is confined to Apple’s device ecosystem, a user can access browser-based HTML5
content from any internet-connected device. Indeed, abstraction is the way of technology,
just as virtualization decoupled the operating system from the underlying hardware and
Software-as-a-Service freed enterprise applications from the corporate data center.
Sweeping technology transitions take time. Salesforce.com, the premier SaaS CRM
vendor, was founded in 1999, yet the SaaS CRM market accounted for just 24% of the total
CRM market in 2011, according to IDC. Similarly, the dominant virtualization vendor, VMW
was founded a year earlier in 1998, but our field work indicates almost 55-60% workload
penetration at the end of 2012. In our view, HTML5 is just as potentially disruptive as SaaS
and virtualization, and we would expect the journey will be similarly as long.
What is HTML5?
HTML5, which stands for hypertext mark-up language 5, is the forthcoming version of the
standard programming language for building websites. In the form that many now expect,
HTML5 would add significant functional capabilities to current web code. These include
push notifications, off-line storage, 2D graphics, improved audio and video streaming,
along with access to a device’s camera and other sensors. These capabilities would allow
developers to create web-based apps for any mobile device in a true write-once-run-
anywhere fashion by eliminating the need to rely on native code resident on a device or
third-party software known as plug-ins to deliver these functionalities. In this way, HTML5
would allow consumers to select services and devices independently of each other. Also,
HTML5 is attractive to developers as it has the potential to eliminate or reduce the
distribution fee they pay to app stores.
As a definitional note, in common usage HTML5 has become synonymous with the “future
of the internet”. In practice, this concept encompasses more than just HTML5 and includes
updates to the cascading style sheets 3 (CSS3) language which governs the look and feel of
webpages as well the hypertext transfer protocol (HTTP) for creating links between
webpages.
HTML5 standard likely won’t be complete until 2014
The standardization process for HTML5, which began in 2004, is controlled by the World
Wide Web Consortium (W3C), which has set a date of 2014 for issuing a ratified standard.
As a result, the research firm Gartner does not see mainstream adoption of the full HTML5
standard until year-end 2014.
Because of the protracted ratification process, the Webkit project, led by Apple and Google,
was formed in 2001. The Webkit browser engine incorporates production ready pieces of
the HTML5 specification, such as embedded video for native rendering, and forms the
basis for the mobile and desktop versions of Apple’s Safari browser and Google’s Chrome
browser. However, Microsoft’s Internet Explorer and Mozilla’s Firefox browsers are not
based on Webkit. This split presents developers with the danger of needing to develop
multiple versions of their websites.
Mobile browsers lag support in giving access to device features
The dominant mobile browsers, Apple’s Safari and Google’s Android browsers, do not
provide the functionality necessary to transform native mobile apps to web-based apps.

December 7, 2012 Americas: Technology
Goldman Sachs Global Investment Research 39
In February, Facebook launched its mobile website testing suite called Ringmark to allow
mobile developers to test which browsers support HTML5 and other functionality their
web-based mobile app would need. The suite groups specific tests into groups, or “rings”,
of features of similar complexity. The following is a post from Facebook’s developer page:
You can think of the rings as straightforward software versioning. Ring 0
represents the base functionality that most mobile phones have today. Ring 1
represents what functionality is needed to unlock the most common apps that
developers want to build; specifically, 2D games, music and video apps, and
camera apps.
From there on, each subsequent ring represents a slice of features that will unlock
the next generation of mobile web apps, based on developer necessity. For
example, we expect Ring 2 to include upcoming technology like WebRTC and
WebGL.
Examples of the types of apps in Ring 0, which could now be made into web apps based on
browser functionality, would be Words With Friends, YouTube, Facebook and Twitter, to
name a few. Apps that would need Ring 1 capabilities to become web apps would be
Angry Birds, Cut the Rope, Spotify, Vimeo, and Instagram among others.
WebRTC in the text above refers to an HTML5 API (application programming interface)
designed to enable voice calling, video chat, and file sharing without plug-ins. WebGL is an
API for 3D graphics rendering.
As shown in Exhibit 37, the most used mobile browsers, Safari and the Android browser,
fail nearly a third of the tests in the Ring 1 battery, implying the migration of native smart
phone apps to the web depends on continued development by mobile browser makers.
Even Chrome for Android, the newest mobile browser introduced by Google at the
beginning of the year, failed a tenth of the tests in Ring 1. Looked at differently, Ringmark
and IDC estimate that roughly 90-95% of native mobile apps in the entertainment, gaming,
and reference categories could become web-based apps if mobile browsers were Ring 1-
compliant.
Exhibit 37: Mobile browsers failing to support web-based apps Results from Ringmark tests to determine if browsers have the capability to support web apps.
Source: www.readwriteweb.com
Exhibit 38 shows Safari and the stock Android browser’s share of mobile web traffic by
unique user, which account for a combined 85% of mobile web traffic.
Ring 0 Ring 1
Passed Failed Passed Failed
iOS Safari 97 0 106 34
Stock Android browser 97 0 93 44
Android Chrome 97 0 143 17

December 7, 2012 Americas: Technology
Goldman Sachs Global Investment Research 40
Exhibit 38: Mobile browser share by unique users
Source: NetMarketShare.
Developer interest in HTML5 is high, but skews toward hybrid apps
According to Appcelerator and IDC’s quarterly survey of mobile developers, interest in the
HTML5 platform continues to be high. While down from 74% in the 2Q12 survey, 66% of
respondents indicated they were “very interested” in developing for the mobile web in
HTML5. See Exhibit 39.
Exhibit 39: Mobile app developers “Very Interested” in developing for HTML5
Source: IDC/Appcelerator.
0%
10%
20%
30%
40%
50%
60%
70%
80%
90%
100%
Sep
-11
Oct-
11
No
v-1
1
Dec-1
1
Jan
-12
Feb
-12
Mar-
12
Ap
r-12
May-1
2
Ju
n-1
2
Ju
l-12
Au
g-1
2
Sep
-12
Oct-
12
Safari Android
66% 66% 67%
74%
66%
0%
10%
20%
30%
40%
50%
60%
70%
80%
90%
100%
3Q11 4Q11 1Q12 2Q12 3Q12

December 7, 2012 Americas: Technology
Goldman Sachs Global Investment Research 41
Further, in the 1Q12 Appcelerator survey, 79% of respondents indicated that they plan to
use elements of HTML5 in their 2012 initiatives. However, of those planning to use HTML5
only 6% reported planning to build HTML5 apps for the mobile web only, while 72%
indicated they would pursue a hybrid strategy which incorporates both native device code
and HTML5 programming. In our view, this indicates that most developers see device-
agnostic HTML5 apps as a ways off. In fact, Facebook has spoken recently about its view
that HTML5 is several years out and as a result over the past 12 months re-focused its
engineering efforts back towards iOS and Android apps. Facebook released its latest iOS
app in August, while its updated Android app is currently undergoing internal testing. See
Exhibits 40-41.
Exhibit 40: Do you plan to use HTML5 in 2012?
Exhibit 41: Only 6% plan to build HTML5 mobile web
apps
Source: IDC/Appcelerator.
Source: IDC/Appcelerator.
What does the near future look like? A lot like today.
With mainstream HTML5 adoption likely a few years away, we see little else that could
disrupt the current app-centric, device-specific mobile environment for some time. Indeed,
even when HTML5 adoption reaches critical mass, there will still be a significant number of
legacy apps in the installed base that would make legacy platforms sticky. In this respect,
the time it takes for HTML5 to be viable becomes increasingly important over time. Thus,
we would expect the current competitive landscape to remain relatively unchanged in the
medium term.
79%
21%
0%
10%
20%
30%
40%
50%
60%
70%
80%
90%
Yes No
72%
22%
6%
0%
10%
20%
30%
40%
50%
60%
70%
80%
Hybrid Pure Native HTML5 web app

December 7, 2012 Americas: Technology
Goldman Sachs Global Investment Research 42
Are televisions the next wave of disruption?
The debate around whether the television will serve as the next playing field in the
compute revolution is driven by two factors:
1) Speculation around the potential for television innovation from non-traditional vendors,
i.e., Apple.
2) An ongoing discussion around cord cutting and an interest in disassembling the cable
content bundle.
As it pertains to today’s consumer cloud platforms, we see the television as a natural
extension of the computing landscape. In terms of platforms and two-sided markets, this
can be thought of as providing an additional device on which complements can deliver
services to end users. However, as we see innovation within the television landscape from
Apple, Google, Microsoft and others, we would not be surprised to see television enable
another industry shake-up, just as client-server ushered in the Microsoft era or
smartphones and tablets brought Apple to prominence. For example, it is easy to imagine
a connected television being a household’s hub for video chat in addition to delivering
streaming entertainment and online gaming. Other key mobile compute platform attributes
we see integrating well with televisions are content distribution through the cloud, viewing
owned content, and the more intuitive and user friendly interface. That said, we believe this
piece of the compute revolution is still in the earliest of days.
TV’s could create the highest user switching costs
As a part of the consumer cloud ecosystem, we see the television as having the potential to
be a powerful anchor device for platforms due to its higher purchase price, longer
replacement cycle and prominent place in the living room. On purchase price, the average
selling price of an LCD television globally is roughly $480, according to DisplaySearch.
However, the average price of a 46 inch LCD television, the typical size we view as
necessary to be the center of family viewing, is more than $950. This is significantly higher
than the ASP for a smartphone ($309 unsubsidized in 2012 per Goldman Sachs analyst
Simona Jankowski) and more than even the most expensive tablets (64GB iPad with retina
display has a list price of $699). As such, once a consumer adds a television to their crop of
cloud ecosystem devices, in our view the user is then more likely to shift their less-
expensive tablet and phone devices to the same ecosystem as their television, if they differ.
If a user purchases a television on the same platform as his or her other devices, we
believe this further entrenches the user in that ecosystem. See Exhibit 42.

December 7, 2012 Americas: Technology
Goldman Sachs Global Investment Research 43
Exhibit 42: Will Smart TVs be the next battle ground in compute?
Source: Goldman Sachs Research.
Further, the replacement cycle for televisions is significantly longer than for tablets and
smartphones. Based on IDC’s estimates for annual shipments and the installed base of
network-enabled, televisions we estimate the useful life of these devices to be four years,
while historically the LCD television replacement cycle has been roughly 8 years, which
compares to roughly two years for tablets and phones. As such, we would expect
consumers to align their devices to their televisions, which they replace relatively less often.
That said, we also view the television as creating the potential for ecosystem disruption
should one of the players create an offering compelling enough to lure users away from
the ecosystem of their tablets or phones. Ultimately, we view the addition of a television to
a user’s set of ecosystem devices as dramatically increasing the switching cost of leaving a
given platform. Finally, because the television is more a household device than an
individual device, we would note that the television has the potential to affect platform
decisions for multiple people rather than for just a single individual.
Early disruption starting with TV attachments
Many players have moved into the television market with attachments for the television, or
what IDC calls “video-centric media adapters,” which offer first and third party video
streaming. These vendors include Apple with the Apple TV, Google with Google TV and
Roku with its small set-top boxes. Additionally, Microsoft has entered the video streaming
space with its Xbox gaming console. All of these devices offer an integrated Netflix service
for subscribers, and, with the exception of the Apple TV, all integrate an Amazon Instant
Video service (although Instant Video can be accessed through screen mirroring with
Current Phone OS Tablet OS Choice Smart TV Choice
Smartphonesrepresent 36% of global handset
shipments in CY12
Tablets represent 25% of global PC/Tablet
shipments in CY12
Will ECOSYSTEM or DEVICE Loyalty
win out?
iOS Apple
Android
Windows
Microsoft
iOS
Android
Windows
Ecosystem Loyalty
Device Loyalty

December 7, 2012 Americas: Technology
Goldman Sachs Global Investment Research 44
Airplay), which is available for free to Amazon’s Prime members. That said, the Apple TV,
Roku boxes and Xbox integrate with the Hulu Plus video service. Further, all these devices
provide music sources or services: (1) the Apple TV does so through iTunes Match, its
streaming service, or by linking to an iTunes library on another device or by screen
mirroring a device running another content source such as Pandora, (2) Roku boxes use
third-party services like Pandora or Mog, (3) Google TV offers the GooglePlay music store
and third party service like Pandora, and (4) Xbox offers access to Microsoft’s music service,
Xbox Music, and third parties like last.fm and iHeartRadio. As shown in Exhibit 43, IDC
expects the market for video-centric media adapters to grow at a 20% CAGR to 64mn unit
shipments in 2016 from 32mn unit shipments this year.
Exhibit 43: Shipments of media adapters, such as Apple TV, Google TV and Roku
Source: IDC.
User interface is a potential opportunity for platform integration
Another possibility for near-term integration of the television into new compute platforms
would be delivering cable providers video lineups as an app on a device such as the Apple
TV, Google TV or Xbox. Goldman Sachs Telco analyst Jason Armstrong highlights this
possibility in a September 17 report titled Still Bullish on Cable, although not blind to the
risks. Such an agreement would give platform providers access to the customer
relationship and the opportunity to become a one-stop destination for entertainment of all
types. However, cable companies have differing views on ceding control of the customer
relationship to a third party. As Jason Armstrong highlights, Comcast is investing heavily
in its own platform and is generally opposed to opening up its APIs to third parties, and
most other Cable companies appear to be similarly guarded. On the other hand, Time
Warner Cable appears more amenable to working closely with technology companies and
even integrating with third-party platforms. With the common view that cable user
interfaces are unwieldy and dated, closer integration with a more user-friendly platform
could raise cable company customer satisfaction in the near term. However, there is
significant risk in relinquishing control of the user interface. Becoming just another
complement on a third party’s platform could potentially negatively impact viewership and
might also raise the possibility of a revenue share model.
9
19
32
4448
56
64
94%
103%
70%
37%
10%16% 13%
0%
20%
40%
60%
80%
100%
120%
0
10
20
30
40
50
60
70
2010 2011 2012 2013 2014 2015 2016
Video-centric media adapters and media servers % growth

December 7, 2012 Americas: Technology
Goldman Sachs Global Investment Research 45
Sizing the TV opportunity
While the overall television market is very mature, the opportunity lies with the newest
technologies, such as internet enablement for streaming video and web apps. As shown in
Exhibits 44-45, according to DisplaySearch, the total television market will grow at a 3%
CAGR to 267mn units in 2016 from an expected 237mn units this year, with revenues
declining at 2% CAGR to roughly $102bn in 2016 from $110bn this year. In contrast to the
overall market, IDC expects the network-enabled television sub-market (defined as
television with integrated networking over either WiFi or Ethernet) will grow at a 26%
CAGR to 124mn units in 2016 from 50mn units this year. At 124mn unit shipments in 2016,
network-enabled televisions would represent just over 45% of the market (see Exhibit 46).
Exhibit 44: Global TV unit shipments, mn
Exhibit 45: Global TV unit sales, $bn
Source: DisplaySearch.
Source: DisplaySearch.
Exhibit 46: Network-enabled TV unit shipments forecast, mn
Source: IDC
248 249 237 239 247 257
267
-10%
-8%
-6%
-4%
-2%
0%
2%
4%
6%
8%
10%
0
50
100
150
200
250
300
350
2010 2011 2012 2013 2014 2015 2016
Total TV units % growth
$117.8
$114.8
$109.9
$106.9$108.2
$106.4
$102.1
(2.5%)
(4.3%)
(2.7%)
1.3%
(1.7%)
(4.0%)
-10%
-8%
-6%
-4%
-2%
0%
2%
4%
6%
8%
10%
$90
$95
$100
$105
$110
$115
$120
2010 2011 2012 2013 2014 2015 2016
Total TV sales % growth
20
32
50
73
91
114124
39%
59%55%
47%
26% 25%
8%
0%
10%
20%
30%
40%
50%
60%
70%
0
20
40
60
80
100
120
140
2010 2011 2012 2013 2014 2015 2016
Network-enabled televisions % growth

December 7, 2012 Americas: Technology
Goldman Sachs Global Investment Research 46
Challenges to being successful in TV
One of the most talked-about potential consumer benefits of a possible Apple iOS-based
TV (and many other so-called “over the top solutions” such as Roku and Hulu) is the
unbundling of the cable package. Most of the discussion centered on the clear appeal to
consumers of being able to purchase individual cable channels like ESPN or Discovery
Channel on an à la carte basis and on the success any device that offered this capability
would enjoy. However, the cable bundle has solid economics at its foundation. Looking at
ESPN as an example, it is widely known that roughly $5 of every monthly cable bill goes to
Disney for the inclusion of ESPN in the bundle. Assuming roughly half of households
currently subscribing to a cable bundle would pay for ESPN on an à la carte basis, Disney
would need to charge roughly $10 per subscriber to maintain its content fee revenue.
Further, ESPN also generates revenue from advertising. In our view, there are likely to be
many casual ESPN viewers who would be unwilling to pay the higher fee for an à la carte
service, thus weighing on ratings and pressuring ad revenue. As such, ESPN would need to
charge more than $10 per à la carte subscriber to match the revenue it generated as part of
the cable bundle. In a high cost of living area like New York City where the standard HD
cable package costs roughly $85 a month, this means consumers would be able to
purchase just eight unbundled channels for the same price they pay for hundreds of
channels in the bundle. Moreover, in less expensive areas an HD bundle can be as little as
$50 per month. Additionally, ESPN appeals to a broad audience for live sports, and many
channels on cable have far smaller audiences for which the economics of a shift to à la
carte pricing might not make sense. Further, for all content producers, being part of the
cable bundle provides significant revenue visibility in an industry where producers’
fortunes can rise and fall based on Nielsen ratings. As such we see significant structural
hurdles to unbundling the cable package.
Additionally, as the television industry stands now, it has several features which may make
it less attractive to the large platform providers. First, it is a lower-margin business than the
core businesses for the major platform companies. For example, we estimate Samsung
Electronics’ LCD business operating margin at 5% for 2012, which compares to a 35%
operating margin for Apple and a 31% non-GAAP operating margin for Google. Second, as
mentioned before, replacement cycles for televisions at roughly eight years are
significantly longer than the two-year useful life of smartphones or tablets. Additionally,
the television business carries heavy inventory risk as well as rapid hardware
commoditization. These reasons largely explain why the major platform providers have
initially approached the market with television attachments rather than a full-blown
television.
Vendor strategies in the TV space
As is typical of Google, the company’s efforts in the television space are multi-faceted.
Initially launched in October 2010, Google TV is the company’s offering in the set-top box
market. It is available through manufacturing partners Vizio and Sony with their Co-Star
and Internet Player devices, respectively, as well as being integrated into the LG G2 Series
of smart TVs. Powered by the Android operating system, the offering combines Google’s
YouTube, Google Play, and Chrome browser as well as Google TV Search and the
PrimeTime recommendation engine. Also, the offering integrates with Netflix, Amazon
Instant Video, HBO Go, Pandora and many other apps that deliver audio and video content
streams. In our view, traction to date for this product has been limited. In our view, if
Google moves to produce a fully functional television, the company would likely use an
approach similar to its strategy in the handset and tablet market whereby it would partner
with OEMs to deliver a Google branded product as well as licensing its software to other
OEMs.
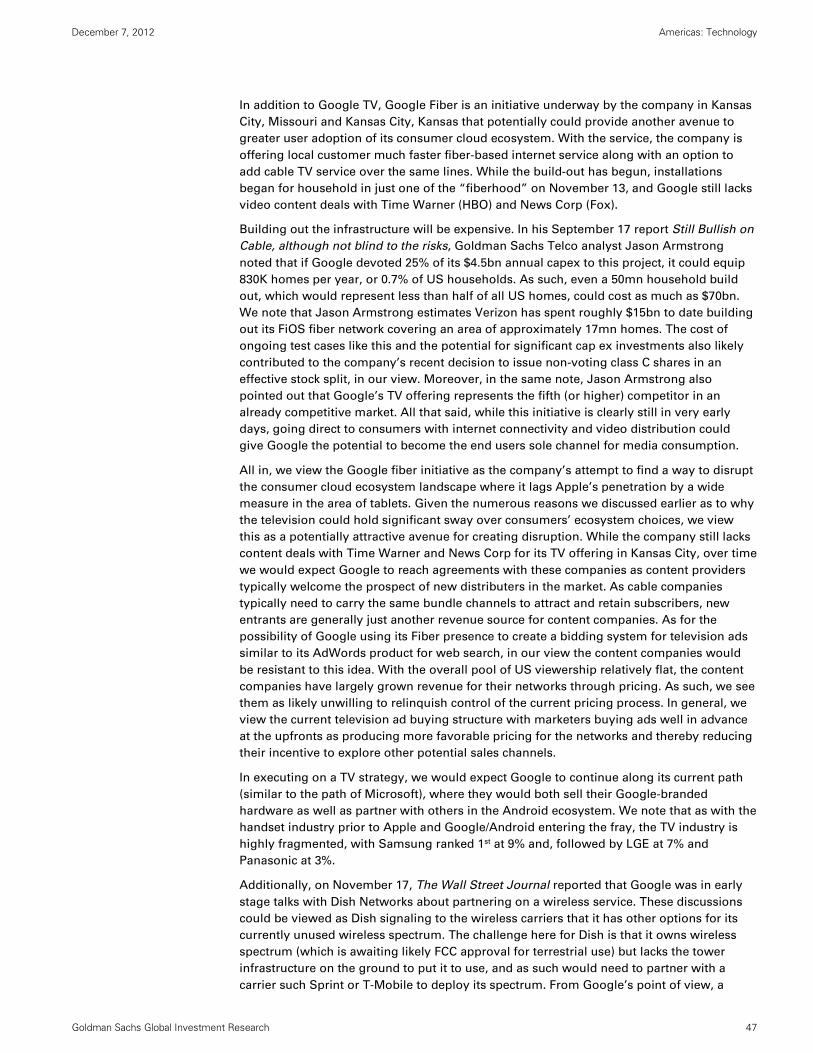
December 7, 2012 Americas: Technology
Goldman Sachs Global Investment Research 47
In addition to Google TV, Google Fiber is an initiative underway by the company in Kansas
City, Missouri and Kansas City, Kansas that potentially could provide another avenue to
greater user adoption of its consumer cloud ecosystem. With the service, the company is
offering local customer much faster fiber-based internet service along with an option to
add cable TV service over the same lines. While the build-out has begun, installations
began for household in just one of the “fiberhood” on November 13, and Google still lacks
video content deals with Time Warner (HBO) and News Corp (Fox).
Building out the infrastructure will be expensive. In his September 17 report Still Bullish on
Cable, although not blind to the risks, Goldman Sachs Telco analyst Jason Armstrong
noted that if Google devoted 25% of its $4.5bn annual capex to this project, it could equip
830K homes per year, or 0.7% of US households. As such, even a 50mn household build
out, which would represent less than half of all US homes, could cost as much as $70bn.
We note that Jason Armstrong estimates Verizon has spent roughly $15bn to date building
out its FiOS fiber network covering an area of approximately 17mn homes. The cost of
ongoing test cases like this and the potential for significant cap ex investments also likely
contributed to the company’s recent decision to issue non-voting class C shares in an
effective stock split, in our view. Moreover, in the same note, Jason Armstrong also
pointed out that Google’s TV offering represents the fifth (or higher) competitor in an
already competitive market. All that said, while this initiative is clearly still in very early
days, going direct to consumers with internet connectivity and video distribution could
give Google the potential to become the end users sole channel for media consumption.
All in, we view the Google fiber initiative as the company’s attempt to find a way to disrupt
the consumer cloud ecosystem landscape where it lags Apple’s penetration by a wide
measure in the area of tablets. Given the numerous reasons we discussed earlier as to why
the television could hold significant sway over consumers’ ecosystem choices, we view
this as a potentially attractive avenue for creating disruption. While the company still lacks
content deals with Time Warner and News Corp for its TV offering in Kansas City, over time
we would expect Google to reach agreements with these companies as content providers
typically welcome the prospect of new distributers in the market. As cable companies
typically need to carry the same bundle channels to attract and retain subscribers, new
entrants are generally just another revenue source for content companies. As for the
possibility of Google using its Fiber presence to create a bidding system for television ads
similar to its AdWords product for web search, in our view the content companies would
be resistant to this idea. With the overall pool of US viewership relatively flat, the content
companies have largely grown revenue for their networks through pricing. As such, we see
them as likely unwilling to relinquish control of the current pricing process. In general, we
view the current television ad buying structure with marketers buying ads well in advance
at the upfronts as producing more favorable pricing for the networks and thereby reducing
their incentive to explore other potential sales channels.
In executing on a TV strategy, we would expect Google to continue along its current path
(similar to the path of Microsoft), where they would both sell their Google-branded
hardware as well as partner with others in the Android ecosystem. We note that as with the
handset industry prior to Apple and Google/Android entering the fray, the TV industry is
highly fragmented, with Samsung ranked 1st at 9% and, followed by LGE at 7% and
Panasonic at 3%.
Additionally, on November 17, The Wall Street Journal reported that Google was in early
stage talks with Dish Networks about partnering on a wireless service. These discussions
could be viewed as Dish signaling to the wireless carriers that it has other options for its
currently unused wireless spectrum. The challenge here for Dish is that it owns wireless
spectrum (which is awaiting likely FCC approval for terrestrial use) but lacks the tower
infrastructure on the ground to put it to use, and as such would need to partner with a
carrier such Sprint or T-Mobile to deploy its spectrum. From Google’s point of view, a

December 7, 2012 Americas: Technology
Goldman Sachs Global Investment Research 48
wireless partnership would provide an opportunity to go directly to consumers with
already activated Nexus phones and tablets. Sidestepping the carriers in this way would
give Google greater control over the distribution and marketing of it devices. For example,
it could choose to sell them as a low-cost bundle subsidized by a wireless contract in an
effort to drive greater tablet share where it trails Apple by a sizeable margin. In doing so,
Google would give itself the opportunity to significantly reduce the TAC rates it currently
pays for tablet based searches as well as the possibility to expand media sales through its
Google Play online store. Further, a wireless partnership would also give Google greater
control over the user experience. Given that a Google-Dish partnership would still require a
third party’s towers or a build-out, in our view the talks are most likely exploratory.
Microsoft
Microsoft has been focused on its entry into the living room since the launch of the Xbox in
2001. A year later, it launched its Xbox Live subscription service by which it enabled
consumers to play others online with a broadband connection. Fast forward to 2005 and
the company launched Xbox360, its second-generation console, and soon afterward in
2008 it started offering the ability to stream Netflix videos through the broadband
connected console, while in 2012 Amazon’s Prime Instant Video services became available.
We believe Microsoft will fight aggressively to garner share of the living room, and
leverage what it has learned from its entertainment device experience, including its Kinect
sensor. This, coupled with its recent launch of the touch-based Windows 8 operating
system could be used as tools to enter this market. We would expect Microsoft to follow a
strategy similar to what it has done with Surface and produce both its own smart TV as
well as partner with OEMs for them to use Microsoft’s operating system to power these
smart devices.
Apple
Speculation of the introduction of an Apple television has existed for years, but it was not
until the release of Steve Jobs’ biography in October 2011 that there was any concrete
evidence that any such device could actually be in the works. While the view that Apple will
somehow address the television market in short order has now become consensus, the
company’s actual strategy for the device remains the key question mark. In its current form,
the television industry is a challenge for predominantly hardware-centric vendors—longer
replacement cycles relative to their current offerings (at roughly eight years, 4X that of
smartphones and tablets), razor-thin margins, massive inventory risk and near-instant
hardware commoditization. But long-time industry observers know that much of the same
was true of the cell phone market before the introduction of the Apple iPhone, which now
garners roughly 70% of industry operating profits. So when considering the entry of Apple
or any other company, the monetization strategy is likely to be one of the most important
factors to consider.
Despite the seeming commonalities and attempts at convergence, we think there is an
important distinction between Apple’s existing iOS devices and televisions. The television
has historically been a passive and shared viewing device, whereas smartphones and
tablets tend to be interactive computing devices, most often used by an individual (not
groups) at any given time. We believe this distinction is why efforts to make televisions
more interactive have so far been generally unsuccessful, and also explains why after
nearly six years on the market, Apple still refers to its Apple TV product as a “hobby.” With
this in mind, we believe there are three possible approaches that Apple could take in
attacking the market:
An Apple-branded television could easily be “nichey”. The general assumption is
that Apple will choose to enter this market with a television set. This would be the
literal interpretation of Steve Jobs’ commentary from Walter Isaacson’s biography in
which he is quoted as saying, “I’d like to create an integrated television set that is

December 7, 2012 Americas: Technology
Goldman Sachs Global Investment Research 49
completely easy to use…It would be seamlessly synced with all of your devices and
with iCloud…It will have the simplest user interface you could imagine. I finally cracked
it.” As content consumption continues to grow, it follows that iOS device users will
want to be able to easily view this content on their televisions. While this can be done
through peripherals today, any Apple TV user can likely attest that the experience is far
from seamless; an integrated television could solve this. In addition, we believe Apple
has avoided launching a television in the past because it has had a difficult time
securing licenses for an appropriate amount of digital movies and television content.
Nevertheless, Apple’s available media content has been steadily increasing, and the
company could be further along in addressing this issue. Despite these factors,
however, we believe an Apple branded television could easily be niche and high-end.
A set-top box could reach a wider audience. A broader penetration strategy would
be a set-top box approach in which Apple partners with cable/satellite providers to
deliver a set-top box to consumers. Here, Apple would be able to skirt many of the
content licensing challenges that have slowed progress in the past. Nevertheless, the
company would face a set of different challenges in trying to negotiate with the
cable/satellite providers who vary greatly in their willingness to cooperate with third
parties and many of whom have their own efforts underway to improve the user
interface. With a set-top box approach, Apple would likely want to gain control of the
entire user interface, which would enable it to more easily and elegantly tie live TV
content with iCloud and iTunes media, as well as bring in its massive installed base of
hardware devices. If Apple was able to secure relationships with enough providers, we
believe this approach would allow for broader reach. Indeed, Apple would be able to
marry its iOS installed base of nearly 300 million users to the massive cable/satellite TV
market, which despite the rise of streaming services and alternate delivery services,
remains by far the largest distributor of video content.
Licensing iOS to TV OEMs would be a departure, but not unprecedented. Another
possible approach to the television market would be for Apple to license its OS to TV
OEMs. This would potentially allow Apple to reach the broadest possible audience,
though it would be remarkably out of character for Apple given its penchant for tight
device-platform integration. While we view this strategy as least likely, it is worth
noting that Apple has departed from this strategy with cars. In February, Mercedes-
Benz announced that its in-house “Digital DriveStyle App” would allow drivers of cars
equipped with the feature to access features on their phone (including Siri) using
controls on the center armrest. With the preview of iOS 6 in June, Apple announced
the introduction of “Eyes Free”, a new feature allows a car to bring up Siri voice
control using a button on the steering wheel. Nine auto makers were announced at the
time as committing to the Eyes Free Siri integration in the next 12 months, with GM
recently introducing several vehicles with the feature. Apple’s willingness to weaken
the link between device and platform integration in this case suggests that the
company could be viewing the opportunity for non-compute devices differently.
Whatever strategy Apple chooses, we believe the company is likely to treat the new
product as a peripheral rather than a main device spoke, at least in the early stages.
Nevertheless, we would expect an Apple television offering to be a key driver of platform
value as we believe any such introduction would be made with a keen eye on linking and
potentially leveraging the company’s existing ecosystem and installed base of iOS users.
Samsung Electronics
Samsung Electronics is the largest TV set maker in the world. We estimate that the
company may take 20% LCD TV volume market share and 25% LCD TV value market in
2012. We do not expect Samsung Electronics’ volume market share to fluctuate
significantly because there are diminishing returns to pursuing higher market share. In
other words, in order to increase market share Samsung Electronics would have to enter

December 7, 2012 Americas: Technology
Goldman Sachs Global Investment Research 50
new lower ASP/lower margin markets which may not be margin accretive for the business.
Therefore, with a clear focus on higher value added TV sets Samsung Electronics
introduced networked TVs quite early and has been marketing Smart TVs more
aggressively in 2012. At this point, Smart TVs (from both Samsung Electronics and
traditional TV set makers) feature Internet connections, streaming service apps (i.e., Netflix,
Hulu), social networking services (Facebook, Twitter), and a user interface from the device
maker that contains additional services and apps. In the case of Samsung Electronics,
content between smartphones, tablets, and PCs can be shared with the TV through
AllShare, a Samsung Electronics-designed app. Samsung Electronics’ Smart TVs are a step
toward making content consumption easier, but there are still many hurdles before it can
be said that TVs are ready for true convergence. For example, a TV platform would need to
address many issues, including app convergence on devices with a significantly larger
screen size and different resolution. Therefore, we believe that Samsung Electronics will
continue to work with Google and Microsoft around Smart TV platforms and solutions, but
we do not expect an aggressive strategy in the near term.

December 7, 2012 Americas: Technology
Goldman Sachs Global Investment Research 51
Mobile survey: Pulse of 1,000 consumers
We surveyed over 1,000 people in the United States to understand their smartphone and
tablet ownership, which services they use for music, videos and e-books, as well as the key
drivers behind their purchasing decision for each device. The respondents ranged in age
from 25 to 65+ (weighted average age of about 38 years), with a 53% / 47% female to male
split (see Exhibit 47).
Exhibit 47: Age of respondents (n=1,028)
Source: Goldman Sachs Research.
Smartphones
Platforms and purchasing decisions
Not surprisingly, Android and Apple smartphones account for the large majority of devices
at about 84% (Android: 48%, Apple: 36%) of the respondents. Coming in a distant third and
fourth place are Blackberry (11%) and Windows (6%). This compares to our estimated
installed base share of roughly 53% for Android, 18% for iOS, 9% for Blackberry, and 2%
for Microsoft, based on current Goldman Sachs Research estimates and an assumed two
year useful life for the devices. Each of the 1,028 respondents indicated they owned a
smartphone (see Exhibit 48).
36%
27%
12%11% 10%
4%
0%
5%
10%
15%
20%
25%
30%
35%
40%
25‐34 35‐44 45‐54 18‐24 55‐64 65+

December 7, 2012 Americas: Technology
Goldman Sachs Global Investment Research 52
Exhibit 48: What type of smartphone do you have? If you own more than one smartphone,
please think about the smart phone you use the most. (n=1,028)
Source: Goldman Sachs Research. Responses do not sum to 100% due to rounding.
Although Apple came in second place in market share by operating system as indicated in
the prior question, the company placed first (at 36% share) in terms of smartphone
manufacturers given the fragmentation of Android across several OEMs. Of the various
OEMs using Android, Samsung held the highest share at 23%, with HTC and Motorola
tying for the second position at 10%. Companies with the most number of mentions in the
“Other” category included Pantech, Sony Ericsson, Huawei and ZTE (see Exhibit 49).
Exhibit 49: Who manufactures your smartphone? If you own more than one smartphone,
please think about the smart phone you use the most. (n=1,028)
Source: Goldman Sachs Research.
48%
36%
11%
6%
Android
Apple
Blackberry
Windows
36%
23%
10% 10% 10%8%
3%2%
0%
5%
10%
15%
20%
25%
30%
35%
40%
Apple Samsung HTC Blackberry Motorola LG Other Nokia

December 7, 2012 Americas: Technology
Goldman Sachs Global Investment Research 53
When asked about the key criteria users would consider when purchasing their next
smartphone, familiarity with the user interface was the most important factor by a
large margin, with 86% of respondents indicating this was one of their top three
considerations. Further, a full 77% reported this was their top consideration. Nearly
half the respondents (47%) indicated that the ability to continue to use previously
purchased apps was among their top three decision factors. Interestingly, the respondents
could have selected all of the options as driving their purchasing decision. With that said,
only 9% of the respondents did so, which indicates to us that consumers have specific
criteria in mind (see Exhibit 50).
Exhibit 50: For your next smartphone purchase, what would make you buy the same
device again? Please rank the three most important features or select all. (n=977)
Source: Goldman Sachs Research.
In our view these results also suggest that once a smartphone manufacturer gains a
subscriber, the likelihood of retaining the user is high given the lock-in through familiarity
and the inconvenience and cost of switching devices and/or platforms. In fact, we gave
respondents the opportunity to indicate that their phone’s ecosystem did not matter to
them, and only 14% did so. While this may appear bullish for Android, we think that the
lack of a leading tablet offering for consumers has the potential to drive platform defectors
as once users add a tablet to their suite of devices our research strongly suggests a desire
to be able to leverage their content across multiple form factors (see Exhibit 51).
77%
9%4% 4% 4% 1% 2%
6%
21%
17% 15%8%
4% 2%
3%
17%
14% 15%
6%
6%2%
0%
10%
20%
30%
40%
50%
60%
70%
80%
90%
100%
Familiarity
with how it
works
Don't want
to
repurchase
my apps
Don't want
to move my
photos
Don't want
to move my
music
Don't want
to move my
videos
Don't want
to move my
e-books
Other
1st 2nd 3rd86%
47%
35% 34%
18%
11%6%

December 7, 2012 Americas: Technology
Goldman Sachs Global Investment Research 54
Exhibit 51: Proprietary Goldman Sachs survey results show consumers unwilling to switch
platforms
Source: Goldman Sachs Research.
When asked why they would change device ecosystems (e.g., change from Google’s
Android to Apple’s iOS, or vice versa), the respondents indicated that price would be the
primary reason, which was chosen as the most important criteria by 35% of the
respondents. Price was also noted as a top three consideration by 68% of the respondents.
We note a smartphone’s ecosystem in terms of applications (top three factor for 47%) did
not rank as high as price or screen size (top three for 52%). While it is worth noting that
price and screen size (non-ecosystem related factors) can influence purchasing decisions,
in our view the responses to the prior question suggest that user lock-in can be created
through familiarity of use and device / platform switching costs. In support of this point we
would again highlight Goldman Sachs Hardware analyst Bill Shope’s June 29 report on
Apple, How resilient is the platform and what are the real risks?, which outlined results
from a survey of iPhone users in which the weighted average discount needed to get them
to consider switching platforms was approximately 50%, or a discount range of about
$200-$400 across the iPad product family and roughly $50-$200 for the iPhone. See Exhibit
52.
14%, Ecosystem doesn't matter
86%, Ecosystem matters

December 7, 2012 Americas: Technology
Goldman Sachs Global Investment Research 55
Exhibit 52: What would make you switch smartphone device ecosystems (i.e., Google
Android to Apple iOS or vice versa)? Please rank the three most important features or
select if you don't care because you don't use the phone's ecosystem. (n=908)
Source: Goldman Sachs Research.
We note the 86% of respondents indicating familiarity with their device would be a top
three concern in repurchase consideration represented 844 individuals, whereas the 68%
saying price would be a to factor in switching ecosystem comprised 615 individuals. In our
view, the most attractive end users for a platform, those with the highest willingness to pay,
likely already use high-end devices. Further, we would expect these users are unlikely to
downgrade to a less robust device given the higher level of functionality they have become
accustomed to. Moreover, as illustrated Exhibits 53-54, the major smartphone makers all
play in the high-end market now with similarly equipped phones having relatively similar
price points, and similarly equipped tablets also pricing roughly in line. As such, view
familiarity with a platform as a primary factor in ecosystem selection.
Exhibit 53: Comparison of popular smartphones’ prices and features
Note: Pricing with two year contract.
Source: Verizon and AT&T websites.
35%30%
14%7% 6% 5% 3% 1%
18%
15%
15%
16%11%
8%
0% 2%
15%
7%
17%
10%15%
7%
1% 1%0.0%
10.0%
20.0%
30.0%
40.0%
50.0%
60.0%
70.0%
80.0%
Price Bigger
screen size
Variety
and quality
of
available
apps
Better
camera
Ability to
share
content
across
multiple
devices
Ability to
use
Microsoft
Word and
Excel
Other Smaller
screen size
1st 2nd 3rd68%
52%47%
33%
21%
4%
33%
5%
Apple HTC LG Motorola Nokia Samsung
iPhone 5 iPhone 4S iPhone 4 TrophyWindows
Phone 8XIntuition Spectrum 2 Lucid
Droid RAZR
MAXX HD
Droid RAZR
MAXXDroid RAZR Lumia 920 Lumia 820
Galaxy
Note IIGalaxy S III
Galaxy
Nexus
Galaxy
Stellar
$199.00 $99.00 Free $179.00 $99.99 $199.00 $149.00 $69.99 $299.99 $199.99 $99.99 $99.00 $49.00 $299.00 $199.99 $149.00 Free
iOS iOS iOS WP7 WP8 Android Android Android Android Android Android WP8 WP8 Android Android Android Android
16 GB 16 GB 8 GB 16 GB 8 GB 32 GB 16 GB 8 GB 32 GB 16 GB 16 GB 32 GB 8 GB 16 GB 16 GB 16 GB 4 GB

December 7, 2012 Americas: Technology
Goldman Sachs Global Investment Research 56
Exhibit 54: Comparison of tablet prices and features
Source: Company websites.
Use of services (music, videos, e-books)
When asked whether they use their smartphone to listen to music, 86% of the respondents
answered affirmatively. We then asked this subsegment to rank the top three music
services that are used on their smartphone. Overall, iTunes was reported as the primary
music service by 41% of respondents, while 59% indicated it was in their top three.
Pandora was selected as the primary service by 32%, with 62% putting it in the top three.
Amazon Cloud Player, Spotify, and Google Play were well behind the leaders, with 28%,
24%, and 21% of respondents, respectively, ranking them among their top three music
services. In terms of the “Other” category, iHeartRadio had the most mentions followed by
YouTube. While the high response rate for Pandora suggests the popularity of cross-
platform music services, we view the similarly high number of responses for Apple’s
proprietary iTunes services as indicative of the sway platform owned and operated
complements can have on users’ subsequent device choices. See Exhibit 55.
Exhibit 55: Which services do you use to listen to music on your smartphone? Please rank
the three you use the most. If you use only one or two services, then leave blank those
that do not apply. (n=879)
Source: Goldman Sachs Research.
Large screen Small screen
Amazon Apple Google Samsung Amazon Apple Google Samsung
Kindle Fire
HD
iPad with
Retina
di l
iPad 2 Nexus 10 Galaxy NoteGalaxy Tab
2
Kindle Fire
HDiPad mini Nexus 7
Galaxy Tab
2
$299.00 $499.00 $399.00 $399.00 $499.99 $399.99 $199.00 $329.00 $199.00 $249.00
8.9" 9.7" 9.7" 10" 10.1" 10.1" 7" 7.9" 7" 7"
16GB 16GB 16GB 16GB 16GB 16GB 16GB 16GB 16GB 8G
WiFi only WiFi only WiFi only WiFi only WiFi only WiFi only WiFi only WiFi only WiFi only WiFi only
Android iOS iOS Android Android Android Android iOS Android Android
31%
41%
7% 6% 7% 6% 3% 0%
24%
14%
10% 11% 8%4%
5%
0%
10%5%
11%7%
6%
7%7%
0%0.0%
10.0%
20.0%
30.0%
40.0%
50.0%
60.0%
70.0%
Pandora iTunes
library
Amazon
Cloud
Player
Spotify Google
Play
library
Other SiriusXM MoG
1st 2nd 3rd
65%
59%
28%
21%17%
1%
24%
14%

December 7, 2012 Americas: Technology
Goldman Sachs Global Investment Research 57
Watching videos on smartphones is another popular activity, with 80% of the respondents
indicating this use case. When asked to rank the top three video services, the respondents
indicated that YouTube is their provider of choice. In fact, YouTube garnered the most
mentions as the provider of first choice, as well as second and third. Of the total number of
mentions for this question, YouTube placed first at 644, more than double the second place
showing of Netflix at 317 and nearly 3X that of iTunes at 221. Given the dominance of third
party complements in the video arena, we would expect video would exert less influence
on users subsequent device purchases. See Exhibit 56.
Exhibit 56: Which services do you use for videos on your smartphone? Please rank the
three you use the most. If you use only one or two services, then leave blank those that do
not apply. (n=822)
Source: Goldman Sachs Research.
Compared to the use of music and video services on smartphones, reading e-books
appears to be a less-common use case with only 53% of the respondents indicating they
use their smartphones in this way. When asked to rank the top three e-book services, the
respondents indicated the Amazon Kindle App placed first, garnering 60% of the votes as
their first selection. Interestingly, Google Play was ranked as the most popular service as
the respondent’s second choice as well as third choice. Of the total number of mentions for
this question, Amazon Kindle App placed first at 415, nearly double Apple iBooks at 212
and compares to Google Play at 197. Similar to video, we would expect e-books to create
relatively less platform lock-in given the dominance of third party complements. See
Exhibit 57.
53%
20%11% 8%
3% 2% 2%
16%
14%
9%7%
9% 5% 2%
9%
5%
6%8%
7%6%
3%
0.0%
10.0%
20.0%
30.0%
40.0%
50.0%
60.0%
70.0%
80.0%
90.0%
YouTube Netflix iTunes
library
Amazon
Instant
Video
Hulu+ Google Play
library
Other
1st 2nd 3rd78%
39%
24%18%
7%
27%
13%

December 7, 2012 Americas: Technology
Goldman Sachs Global Investment Research 58
Exhibit 57: Which services do you use for purchasing e-books on your smartphone? Please
rank the three you use the most. If you use only one or two services, then leave blank
those that do not apply. (n=549)
Source: Goldman Sachs Research.
Tablets
Platforms and purchasing decisions
When asked whether they owned a tablet, 68% of the respondents answered in the
affirmative. Of those who have purchased a tablet, the iPad was the most common
accounting for 44% of the total responses, with the Kindle Fire placing second at 31%. The
Samsung Galaxy Tab placed third with 11% share, while a variety of other brands were
included in the “Other” category including ASUS, Acer and the Motorola XOOM. For 3Q12,
IDC’s tablet shipment data indicates iPad accounted for 50% of worldwide units while the
Kindle Fire comprised 9% and Samsung held 13% share. See Exhibit 58.
60%
21%
10%5% 3%
13%
13%
13%
6%1%
3%
4%
12%
10%
3%
0.0%
10.0%
20.0%
30.0%
40.0%
50.0%
60.0%
70.0%
80.0%
Amazon Kindle
App
Apple iBooks Google Play
library
Nook reading app Other
1st 2nd 3rd
76%
36%
22%
8%
39%

December 7, 2012 Americas: Technology
Goldman Sachs Global Investment Research 59
Exhibit 58: What type of tablet do you own? If you own more than one tablet, please think
about the tablet you use the most. (n=702)
Source: Goldman Sachs Research.
We asked the respondents who do not currently own a tablet what the key criteria would
be if they were to purchase one. The majority (at 40%) noted the ability to use applications
across their smartphone and tablet as the most important factor. Similarly, the other key
criteria were related to the ability to share content on both devices. Given the relatively
greater penetration of smartphones in our survey (e.g., all of the 1,028 respondents owned
a smartphone, but only 702 owned a tablet), as well as globally (Goldman Sachs is
forecasting 666mn smartphones shipped in 2012 and 865 units shipped in 2013 versus
119mn tablets in 2012 and 168mn units in 2013), these results might suggest that the
smartphones could serve as the anchor buying decision for tablets. However, given the
popularity of iPad and nascent nature of viable tablet competition, as consumers purchase
tablets, we then believe that as they go to replace their smartphone that the desire for
cross device compatibility will lead people to want to have both their phone and tablet part
of the same ecosystem, as discussed in detail in the section titled The user path to
standardizing on a platform on page 30. See Exhibit 59.
44%
31%
11%8%
5%
1%
0%
5%
10%
15%
20%
25%
30%
35%
40%
45%
50%
iPad Kindle Fire Samsung Galaxy Tab
Other Nook Color Google Nexus 7

December 7, 2012 Americas: Technology
Goldman Sachs Global Investment Research 60
Exhibit 59: If you do not own a tablet what would be the primary driver of selecting which device to buy? (n=326)
Source: Goldman Sachs Research.
When we asked those who currently own a tablet what key factors would drive their
purchasing decision for their next tablet, the large majority at 74% indicated familiarity with
the user experience as their top criteria while 86% put this factor in their top three
considerations. The desire to continue to use their existing applications as well as e-books
was cited as a top three criteria by 42% and 30% of respondents, respectively. See Exhibit
60.
Exhibit 60: For your next tablet purchase, what would make you buy the same device you
have now again? Please rank the three most important features. (n=582)
Source: Goldman Sachs Research.
40%
17% 17%
11%9%
7%
0%
5%
10%
15%
20%
25%
30%
35%
40%
45%
I want to be able to use the apps I have purchased for my
smartphone on my tablet
I want my photos easily synched across both
devices
I want my existing music library to be shareable across both devices
I want my existing e‐book library to be
shareable across both
devices
I want my existing video library to be shareable across both devices
Other
74%
10%4% 3% 6% 2% 1%
8%
16%
16% 13%12%
9%2%
4%
15%
11%11% 8%
13%
1%0.0%
10.0%
20.0%
30.0%
40.0%
50.0%
60.0%
70.0%
80.0%
90.0%
100.0%
Familiarity
with how it
works
Don't want
to
repurchase
my apps
Don't want
to move my
e-books
Don't want
to move my
music
Don't want
to move my
videos
Don't want
to move my
photos
Other
1st 2nd 3rd
42%
30%26% 26% 24%
86%
3%

December 7, 2012 Americas: Technology
Goldman Sachs Global Investment Research 61
When asked what would cause them to switch tablet ecosystems, the respondents
indicated price is the most important factor (selected by 36% of the respondents as the
most important reason), followed by a larger screen size (selected by 29% as the most
important reason) and the variety and quality of applications (selected by 10% as the most
important reason). Overall, participants view the ecosystem as an important criterion in
device selection, with 85% of respondents reporting they cared about and use the
ecosystem. As such, this means that there appears to be a place for a low-cost tablet
provider to come into the market; in particular for Android, as a way of leveraging its vast
smartphone installed base. That having been said, this device would be compared to
Apple’s iPad and iPad mini offerings in our view in terms of application breadth and quality
of design. In terms of total mentions, while price and the variety and quality of apps still
placed first and second at 363 and 254, respectively, a bigger screen size was not far
behind in third at 252. We note that overall, the criteria that would cause a user to switch
tablet ecosystems is generally similar to the criteria that would cause a user to switch
smartphone ecosystems. See Exhibit 61.
Exhibit 61: What would make you switch tablet device ecosystems (i.e., Google Android to
Apple iOS or vice versa)? Please rank the three most important features. (n=553)
Source: Goldman Sachs Research.
Use of services (music, videos, e-books)
When asked whether they use their tablet to listen to music, 84% of the respondents
answered affirmatively. We then asked this subsegment to rank the top three music
services. Overall, iTunes was chosen by 41% of the respondents as their first choice.
Pandora was selected by 28% as their primary music service, while the Amazon Cloud
Player was chosen by 13%. In terms of the “Other” category, iHeartRadio had the most
mentions followed by YouTube. Interestingly, the responses closely mirror those for music
services on smartphones as well, which also suggests that consumer use both devices in a
similar fashion. We note that of the total number of mentions for this question, Pandora
placed first at 335, slightly outpacing iTunes at 319. Amazon came in third with 180
mentions. See Exhibit 62.
36%
10%
29%
6% 8% 6%2% 3%
17%
19%
11%
9%12%
10%
2% 0%
13%
17%
5%
18% 8%7%
0% 1%0.0%
10.0%
20.0%
30.0%
40.0%
50.0%
60.0%
70.0%
Price Variety
and quality
of
available
apps
Bigger
screen size
Ability to
share
content
across
multiple
devices
Ability to
use
Microsoft
Word and
Excel
Better
camera
Smaller
screen size
Other
1st 2nd 3rd
66%
46% 46%
34%
23%
4%
28%
4%

December 7, 2012 Americas: Technology
Goldman Sachs Global Investment Research 62
Exhibit 62: Which services do you use to listen to music on your tablet? Please rank the
three you use the most. (n=545)
Source: Goldman Sachs Research.
Watching videos on tablets is more popular than on a smartphone, with 84% indicating this
use case (versus 80% for smartphones). When asked to rank the top three video services,
the respondents indicated that YouTube is their provider of choice. In fact, YouTube
garnered the most mentions as the provider of first choice, as well as second and third
choice, which is identical to the responses for watching videos on smartphones. Of the
total number of mentions, YouTube placed first at 405, with Netflix in second place at 304
and Amazon Instant Video third at 197. iTunes placed fourth at 169 mentions. See Exhibit
63.
28%
41%
13%7%
3% 4% 3% 1%
24%
12%
9%
11%
7% 3% 1%2%
10% 5%
11%
7%
6%7%
5%1%
0.0%
10.0%
20.0%
30.0%
40.0%
50.0%
60.0%
70.0%
Pandora iTunes
library
Amazon
Cloud
Player
Spotify Google
Play
library
SiriusXM Other MoG
1st 2nd 3rd62%
59%
33%
16%14%
4%
26%
9%

December 7, 2012 Americas: Technology
Goldman Sachs Global Investment Research 63
Exhibit 63: Which services do you use for videos on your tablet? Please rank the three you
use the most. (n=591)
Source: Goldman Sachs Research.
In contrast to smartphones, reading e-books on a tablet is done by the large majority of the
respondents, with 85% indicating this as a use case (versus only 55% for smartphones).
Not surprising in our view is the lead for Amazon, with its Kindle application selected as
the primary service by 64% of the respondents. Apple iBooks was cited as the most popular
second choice (55%) while Google Play came in as the most popular third choice (10%). Of
interest to note is the total number of mentions for this question, where the Amazon Kindle
App placed first at 420 (nearly identical to the 415 mentions for e-books on smartphones).
A similar situation applies to Apple iBooks which garnered 217 mentions (also nearly
identical to the 212 mentions on the smartphone). Google Play placed third at 141
mentions (versus 197 on the smartphone). The nearly identical number of mentions for e-
books on smartphones and tablets for Amazon and Apple also suggests to us that
consumers are looking for one consistent user experience across devices. See Exhibit 64.
33% 30%
18%12%
4% 2% 1%
22%
16%
9%
9%
9%5%
1%
13%
5%
7%
8%
11%
5%
1%0.0%
10.0%
20.0%
30.0%
40.0%
50.0%
60.0%
70.0%
80.0%
YouTube Netflix Amazon
Instant
Video
iTunes
library
Hulu+ Google Play
library
Other
1st 2nd 3rd69%
51%
29%24%
3%
33%
12%

December 7, 2012 Americas: Technology
Goldman Sachs Global Investment Research 64
Exhibit 64: Which services do you use for purchasing e-books on your tablet? Please rank
the three you use the most. (n=548)
Source: Goldman Sachs Research.
Device ecosystem
The respondents indicated that the ability to share content across devices would make
them change device ecosystems for both smartphones and tablets. When asked which
device ecosystem they would likely use for storage and content sharing, the majority at
63% indicated Apple’s iCloud service, whereas 44% indicated Google Drive. We note these
results could suggest a benefit for Apple given that within our survey population the
iPhone accounted for only 36% of users while the iPad accounted for 44% of users (and in
reality market share is roughly 20% and 55% respectively). Given iCloud’s service is limited
to Apple devices, this result could imply that users of non-Apple products are considering
moving to Apple. A similar situation for Google could also play out given that Android
accounted for 48% of smartphones in our survey, but only 1% of tablets given the Nexus 7
and Samsung Galaxy Tab 7.0 were only recently released. With that said, as 44% of the
respondents indicated they would consider Google drive as their storage / content sharing
service, and given the current penetration rate of the Nexus 7, the survey results could also
be a potential tailwind for Google tablets, if they produced a device that consumers found
as appealing. Interestingly, Dropbox is a potential beneficiary of mobile OS fragmentation
given it is available cross platform, as are its rivals Box, Google Drive and Microsoft’s
SkyDrive. See Exhibit 65.
64%
21%
6% 7%2%
9%
15%
10% 6%
2%
3%
4%
10%9%
1%
0.0%
10.0%
20.0%
30.0%
40.0%
50.0%
60.0%
70.0%
80.0%
Amazon Kindle
App
Apple iBooks Google Play
library
Nook reading app Other
1st 2nd 3rd
77%
26%23%
5%
40%

December 7, 2012 Americas: Technology
Goldman Sachs Global Investment Research 65
Exhibit 65: You said that the ability to share content across multiple devices would make
you switch device ecosystems. Which file storage/content sharing services are you most
likely to use? Please check all that apply. (n=522)
Source: Goldman Sachs Research.
Spending habits
Not surprisingly, tablet owners report spending more than respondents who only
own a smartphone, and iPad owners generally spend more than other tablet owners.
We asked how much users are spending to consume content on their tablets and/or
smartphones over the prior 12 months. Nearly 50% of smartphone only owners reported
spending less than $20 or nothing on media and apps in the last 12 months, whereas 42%
of those who also own a tablet reported spending more than $100 on media and apps in
the last 12 months. See Exhibit 66.
63%
44%
25%
11%4%
0%
10%
20%
30%
40%
50%
60%
70%
iCloud Google Drive DropBox Sky Drive Other
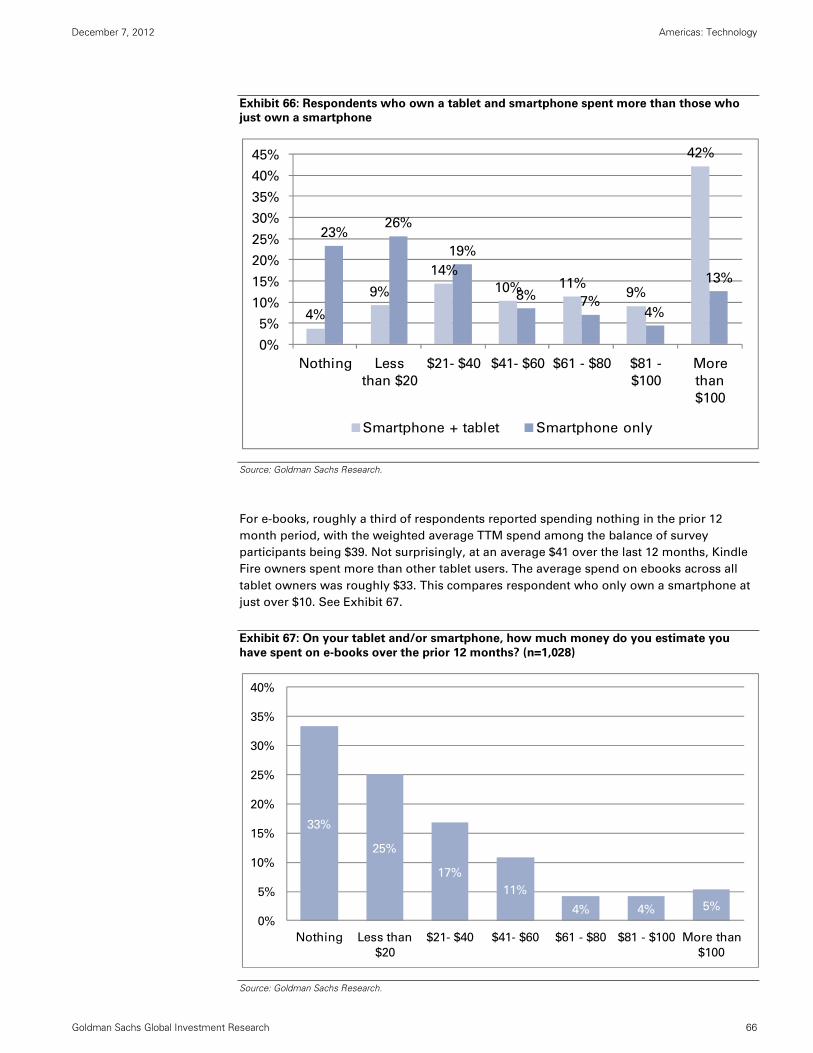
December 7, 2012 Americas: Technology
Goldman Sachs Global Investment Research 66
Exhibit 66: Respondents who own a tablet and smartphone spent more than those who
just own a smartphone
Source: Goldman Sachs Research.
For e-books, roughly a third of respondents reported spending nothing in the prior 12
month period, with the weighted average TTM spend among the balance of survey
participants being $39. Not surprisingly, at an average $41 over the last 12 months, Kindle
Fire owners spent more than other tablet users. The average spend on ebooks across all
tablet owners was roughly $33. This compares respondent who only own a smartphone at
just over $10. See Exhibit 67.
Exhibit 67: On your tablet and/or smartphone, how much money do you estimate you
have spent on e-books over the prior 12 months? (n=1,028)
Source: Goldman Sachs Research.
4%
9%
14%
10% 11%9%
42%
23%26%
19%
8% 7%4%
13%
0%
5%
10%
15%
20%
25%
30%
35%
40%
45%
Nothing Less
than $20
$21- $40 $41- $60 $61 - $80 $81 -
$100
More
than
$100
Smartphone + tablet Smartphone only
33%
25%
17%
11%
4% 4% 5%
0%
5%
10%
15%
20%
25%
30%
35%
40%
Nothing Less than
$20
$21- $40 $41- $60 $61 - $80 $81 - $100 More than
$100
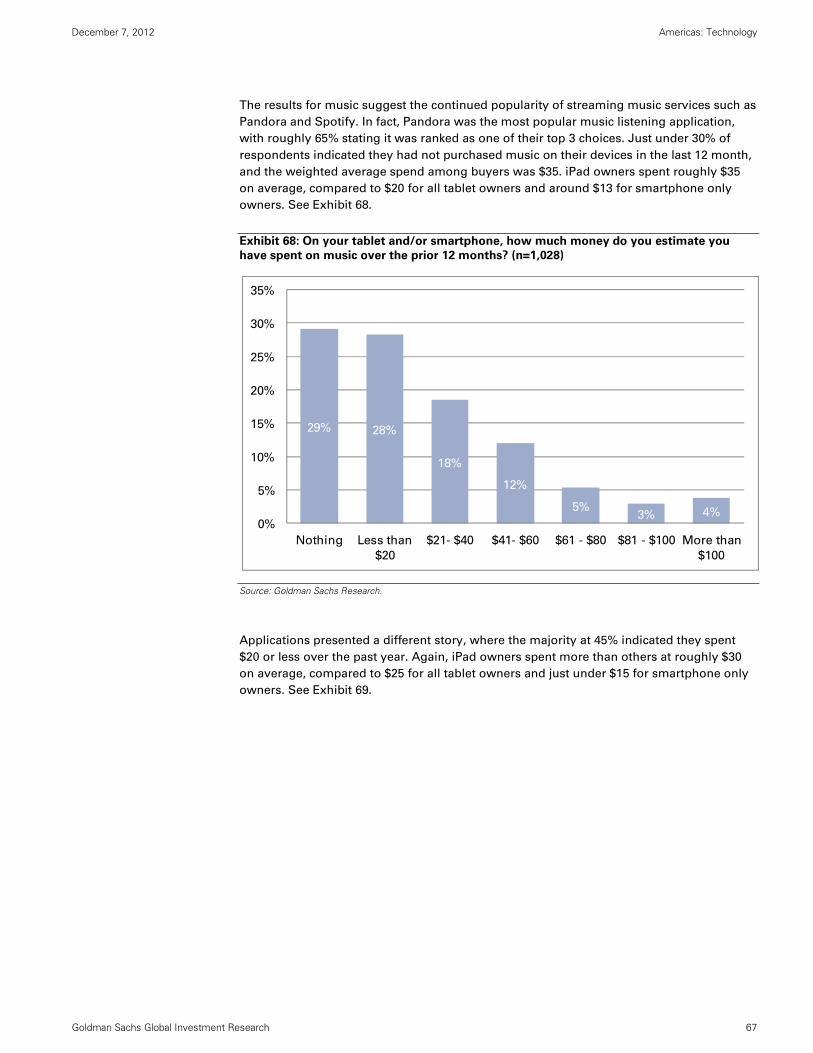
December 7, 2012 Americas: Technology
Goldman Sachs Global Investment Research 67
The results for music suggest the continued popularity of streaming music services such as
Pandora and Spotify. In fact, Pandora was the most popular music listening application,
with roughly 65% stating it was ranked as one of their top 3 choices. Just under 30% of
respondents indicated they had not purchased music on their devices in the last 12 month,
and the weighted average spend among buyers was $35. iPad owners spent roughly $35
on average, compared to $20 for all tablet owners and around $13 for smartphone only
owners. See Exhibit 68.
Exhibit 68: On your tablet and/or smartphone, how much money do you estimate you
have spent on music over the prior 12 months? (n=1,028)
Source: Goldman Sachs Research.
Applications presented a different story, where the majority at 45% indicated they spent
$20 or less over the past year. Again, iPad owners spent more than others at roughly $30
on average, compared to $25 for all tablet owners and just under $15 for smartphone only
owners. See Exhibit 69.
29% 28%
18%
12%
5%3% 4%
0%
5%
10%
15%
20%
25%
30%
35%
Nothing Less than
$20
$21- $40 $41- $60 $61 - $80 $81 - $100 More than
$100

December 7, 2012 Americas: Technology
Goldman Sachs Global Investment Research 68
Exhibit 69: On your tablet and/or smartphone, how much money do you estimate you
have spent on apps over the prior 12 months? (n=1,028)
Source: Goldman Sachs Research.
Given free video services like YouTube, we are not surprised to see half of our respondents
report not spending anything on video on their devices. Yet again, iPad owners were the
highest spenders. On average, they spent roughly $24 on video in the last 12 months
compared to the average tablet user at roughly $21 and smartphone only users at $6. See
Exhibit 70.
Exhibit 70: On your tablet and/or smartphone, how much money do you estimate you
have spent on videos over the prior 12 months? (n=1,028)
Source: Goldman Sachs Research.
19%
45%
21%
7%4% 2% 2%0%
5%
10%
15%
20%
25%
30%
35%
40%
45%
50%
Nothing Less than
$20
$21- $40 $41- $60 $61 - $80 $81 - $100 More than
$100
50%
25%
11%6% 5% 2% 2%0%
10%
20%
30%
40%
50%
60%
Nothing Less than
$20
$21- $40 $41- $60 $61 - $80 $81 - $100 More than
$100
Video

December 7, 2012 Americas: Technology
Goldman Sachs Global Investment Research 69
Appendix: The early platform wars (Apple, Commodore, Microsoft)
In the early 1970s, a team at Intel invented the microprocessor, which was a single chip
capable of computing power previously found only on mainframes the size of large rooms.
This technological leap finally made the personal computer feasible. However, the
microprocessor still required an operating system to manage the computer’s hardware
resources. The fight amongst operating systems vying for dominance in the 1980s was one
of the first conflicts between open and closed systems in the information era. The adoption
of a dominant standard was inevitable as software was not compatible between operating
systems and software development and distribution costs were high.
The early market: Apple and Commodore
While early attempts at creating a consumer product failed in the marketplace, the appeal
of possibly creating a computer for the mass market resulted in the formation of PC
companies such as Commodore and Apple. These two companies adopted a closed
approach, in that they developed both the hardware and operating system in house.
Apple was founded in April 1976 and released its first mainstream success, the Apple II
only a year later. While sales of the system were initially sluggish, only selling 600
machines in 1977, sales eventually picked up after an aggressive marketing campaign and
the release of popular software. What really led the company to mainstream success was
the release of VisiCalc in 1979, the original spreadsheet application. This program is often
considered the application that transitioned the microcomputer from a niche product to a
mainstream enterprise product. In 1978, Apple only sold 7,600 machines, but after the
release of VisiCalc the company gained popularity and sold nearly 210,000 units in 1981. All
of Apple’s computers used proprietary operating systems developed in-house. Steve Jobs
decided early on that Apple would not license its OS to other OEMs as he felt that doing so
would diminish the user experience and the Apple brand. As a result, the company treated
the hardware and the operating system as a united product and rejected Bill Gates’
attempts to separate the two.
Commodore International, which originally started as a manufacturer of calculators,
entered the computer market in 1977. It began selling and marketing computers at much
lower prices than their competition, targeting the average consumer rather than enterprise
customers. However, the company only gained prominence with the release of its
Commodore 64 computer in 1982. The inexpensive price and successful sales strategy
drove initial customer adoption, while the superior hardware, with favorable sound and
graphical specifications, encouraged software developers to create programs for the
Commodore system. Once quality software was released for the system, its sales spiked.
Accounting for nearly 4% market share in 1980, the company captured nearly 37% share by
1985. Commodore, like Apple, used an in house operating system and chose not to license
it to other OEMs.
The entrance of Big Blue and the “Attack of the Clones”
IBM was late entering the microcomputer market and, in rushing to release its version of
the PC in late 1981, was forced to contract the operating system out to Microsoft (founded
in 1975) and the processor to Intel. The only proprietary part of the IBM PC was the ROM
BIOS (read only memory, basic input, output system), which controlled the keyboard,
display screen, disk drives, and other miscellaneous functions and proved relatively easy to
reverse engineer. As IBM used off-the-shelf hardware and a third-party operating system,
its PC was relatively easy to replicate. In fact, it took less than a year for legal clones of the
IBM PC to hit the market (starting with Compaq in 1982). Microsoft licensed its operating

December 7, 2012 Americas: Technology
Goldman Sachs Global Investment Research 70
system to the hundreds of IBM PC clones. Sales of IBM PCs exploded starting in 1983 as
enterprise customers, reassured by the IBM brand name, began buying microcomputers.
Microsoft’s open system and the size of its install base attracted software developers to the
MS platform, which in turn drove further customer adoption. Microsoft grew from having
no footprint in the market in 1981 to controlling 49% (3.7 mn units) in less than four years
and 90% of the 367mn unit market in 2011. See Exhibit 71.
Exhibit 71: PC Market Share by shipments While Apple and Commodore were able to gain early prominence in the personal computer
market, the IBM PC + Clones, running Microsoft’s operating system, were able to eventually
overtake them as AAPL and CBM suffered from limited software development.
Source: Jeremy Reimer, Total Share: 30 years of personal computer market share figures; Goldman Sachs Research estimates.
The key failure of closed systems – limited hardware platforms
While Microsoft was able to insulate itself from the success or failure of individual products
by distributing its platform via a variety of OEMs who used off the shelf components,
Apple’s computers relied on a series of proprietary components (e.g., Motorola processors,
Apple print drivers, etc.). This decision tied Apple to a small hardware ecosystem and
made it more susceptible to the success or failure of individual products. The closed nature
of Apple and Commodore’s platforms limited the number of hardware devices running
their respective operating systems, which meant that the failure of one of their devices in
the market would greatly affect share. Apple and Commodore continually faced this
problem. While Apple released the incredibly popular Apple II in 1977, it took the company
nearly seven years to offer another product that the market deemed worthy of replacing it.
During that seven-year period, Apple released the Apple III, which suffered from
engineering flaws and had to be recalled, and the Apple Lisa, which was too expensive for
the mass market ($9,995 in US dollars in 1983). While Apple finally released the extremely
popular Apple Macintosh in 1984, the damage had already been done and both Microsoft
and Commodore had overtaken Apple’s early advantage in the PC market.
Commodore suffered from a similar malady as the company was unable to replicate the
commercial success of the Commodore 64. While it released the Amiga to succeed the
Commodore 64 in 1985, the Amiga was unsuccessfully marketed and was slowed by
prolonged patent battles with Atari. In the end, Commodore failed to provide a commercial
0%
10%
20%
30%
40%
50%
60%
70%
80%
90%
100%
1980 1985 1990 1995 2012
IBM PC + Clones Apple Commodore

December 7, 2012
Goldman Sachs Global Investment Research
successor. A
an incredibl
market shar
company in
Exhibit 72: P
Source: Jeremyestimates.
Microsof
Microsoft a
and capture
developers
higher. By 1
victor in the
descendant
of Apple’s i
compute ha
compute in
with 62% sh
Google/And
Amazon Kin
October 201
will help Mi
20-25%.
In retrospec
1. The IBM
who for
microco
busines
a strong
As the technology of the C64 grew outdated, the comp
le rate. While Commodore held a 37% share of the ma
re had plummeted to less than 4%. The rapid loss in re
nto a financial spiral that ended in its bankruptcy in Ap
PC shipment by operating system (in thousands of un
y Reimer, Total Share: 30 years of personal computer market share figures
ft – From sea to shining sea
nd its OEMs took advantage of the troubles facing bot
ed a major portion of the market. As Microsoft grew in
flocked to its platform, pushing sales of Microsoft’s op
1990, Microsoft had captured nearly 85% of the market
e PC platform wars. Today, Microsoft’s dominance is e
ts of the IBM PC currently occupy 92% of the market, a
Pad in 2010 and Android-based tablets means that Mic
as actually now faced a headwind. Tablets are expected
2012, with Apple dominating this market since the rel
hare of Media Tablets in 2011, as noted by Gartner, Oc
droid taking 35% share in 2011 (Gartner, October 17, 20
ndle Fire and Google Nexus. While Windows 8 was lau
12, we think it will take several quarters to determine w
icrosoft gain material market share, which we would e
ct, there were three main factors that led to Microsoft’s
M brand name was key to Microsoft’s early success
rmed the majority of the early PC market, were willing
omputers from IBM, as the company had previously bu
sses as a leading provider of enterprise mainframes. M
g foothold in the market (starting with its 1981 release
Americas: Technology
71
pany lost market share at
rket in 1985, by 1990 its
evenues threw the
ril 1994. See Exhibit 72.
nits shipped)
; Goldman Sachs Research
h Apple and Commodore
share, software
perating system even
t and emerged as the
ven more apparent, as
lthough the introduction
crosoft’s share of total
d to be 25% of total
ease of the iPad in 2010
tober 17, 2012, with
012), generally due to
unched just at the end of
whether or not this release
stimate as greater than
s platform dominance:
s. Enterprise customers,
to purchase
uilt a rapport with
Microsoft was able to gain
) by offering an enterprise

December 7, 2012
Goldman Sachs Global Investment Research
product
was suf
2. Micros
have a
problem
licensed
diversif
failure o
release
system
lack of a
release
followin
hardwa
hardwa
3. Micros
and dis
content
flocked
incentiv
cycle: th
When M
incentiv
access t
the 198
origina
co-deve
the Mic
Exhibit 73: SAs Microsoft
Source: JeremyResearch estim
While the IB
would succe
to gain shar
behind as s
was the res
t, while Commodore was targeting the still nascent co
ffering from an aging Apple II hardware platform.
oft’s decision to license its operating system ensur
diverse offering of hardware platforms. Microsoft w
ms that plagued both Apple and Commodore by adopt
d OS ensured that numerous OEMs would produce Mi
fying its hardware options and insulating the company
of any specific hardware device. As a result, when an u
d, customers could change out their hardware, rather
s. Product diversity allowed Microsoft to avoid share l
a successful hardware platform – a weakness that App
of the Apple II and the Macintosh (1980-1984) and Com
ng the release of its C64 (1986-1994). In fact, we believ
are offerings allowed it to steal share from these comp
are platforms were weak.
oft benefited from a software “network effect.” As
stribution costs were high, openness helped attract the
t available. As the software offerings for the MS-OS sy
to the platform, which in turn provided software deve
ve to publish Windows compatible software. This creat
he larger the install base, the more software offerings,
Microsoft reached 85% market share in 1990, develope
ve to write software for Apple or Commodore as the M
to a much larger market. In addition, porting costs we
80s and rewriting software for a second platform incurr
l cost of development (see Exhibit 73). As Microsoft’s s
eloping software diminished, leading developers to wr
crosoft platform.
Software porting costs discouraged cross platform det gained share, the incentive for porting software between
y Reimer, Total Share: 30 years of personal computer market share figuresates.
BM brand name drove its original success, Microsoft’s
eed over the closed systems of Apple and Commodore
re during periods of hardware trouble for its competito
oftware developers flocked to their platform. In retrosp
ult of its choice to license its operating system.
Americas: Technology
72
nsumer market and Apple
red it would constantly
was able to bypass several
ting an open system. A
icrosoft-based computers,
y from the success or
unsuccessful product was
than changing operating
oss resulting from the
ple suffered between the
mmodore suffered
e that Microsoft’s diverse
anies when their
software development
e relatively scarce software
ystem grew, customers
elopers an even greater
ted a self-perpetuating
, the larger the install base.
ers had almost no
Microsoft platform offered
re relatively expensive in
red around 75% of the
share grew, the benefit of
rite programs solely for
evelopment, 1990 n platforms diminished
; Microsoft; Goldman Sachs
openness ensured that it
e. The company was able
ors and left them all
pect, Microsoft’s success

December 7, 2012 Americas: Technology
Goldman Sachs Global Investment Research 73
Online Search (AOL, Yahoo!, and Google)
Just as Microsoft’s success was helped by the diversity of hardware OEMs who had chosen
to license its OS, Google was helped by the diversity of content producers that emerged
during a key growth phase of the web in the mid-1990s.
Widespread internet adoption, starting in the mid-1990s, placed an unprecedented amount
of information at the fingertips of the user. However, while the internet made information
more accessible, finding relevant information in an efficient manner proved to be quite
difficult; this led to the advent of web portals and search engines. Yahoo!, which was
founded in 1995, was one of many companies that attempted to overcome these
challenges. The company began manually indexing web pages to create a searchable
directory. However, Yahoo!, like many of the other early search engines, was organized as
an internet portal and information aggregator.
Because the early internet lacked quality news, media, and information providers, Yahoo!
aggregated quality content on its website. Like AOL, Yahoo! created a “walled garden”,
seeking to keep users on its site to simplify their browsing experience. These internet
portals were so successful that many individuals believed that AOL or Yahoo! were the
entire internet. While Yahoo! offered a search engine, it tried to fulfill the needs of all its
visitors on its own website. At that time, search capability was not the core function of the
business, but rather an additional feature.
The modern search engine: Google and PageRank
Web portals grew and prospered in the early years of the internet, but were only successful
due to the lack of quality content available offsite. However, as the internet grew in
popularity, a greater amount of quality content started to migrate online. Internet users
preferred to consume content on sites that specialized on a topic, such as EPSN in sports,
rather than using a generalist web portal like Yahoo!. As internet users started to transition
from consuming content on web portals to consuming content on the general internet, they
looked for a more efficient method of finding what they wanted. They found their tool in
Google’s search engine. Google benefited from this rapidly growing adjacent search
market that Yahoo! and MSN missed.
Google, founded in 1998, radically changed the way that users interact with the web.
Assuming desirable content was linked to more often, Google used web crawlers to
automatically index and then rank websites by the number and importance of pages that
linked back to the site. In fact, when it was founded, the company was capable of creating
an index of 26 mn pages in a couple of hours, and today the company processes the web’s
one trillion URLs several times a day. Google’s formula to determine content relevance was
a significant advantage over the existing search engines, which used unranked, hierarchical
directories. Not only did Google have more relevant search results, it focused on sending
users offsite to quality providers of content, opening up the internet to an eager audience.
Rather than adopting the web portal model used by Yahoo!, Google used a minimalist
interface and focused solely on search. See Exhibit 74.

December 7, 2012 Americas: Technology
Goldman Sachs Global Investment Research 74
Exhibit 74: Google share of total online searches, 2003-2011 Google’s explosive growth in the early 2000s was driven by its superior search technology and
rejection of the closed portal model of online search.
Source: comScore, Goldman Sachs Research estimates.
Internet users quickly adopted Google’s search engine and the company grew its share of
the search market from 0% in 1998 to 32% in 2003. In fact, Google’s search algorithm was
so much better than its competitors’ that it was hired to power both Yahoo! and MSN
search results from 2000 to 2004. Yahoo!’s shortcoming was that it tried to be everything to
everyone; a “one stop shop” for the internet, when in reality users sought out sites with
best of breed content. For example, Google did not compete with Yahoo! Sports or Movies,
it offered access to ESPN and IMDB.
Search monetization
Google was also the first company to successfully monetize search. Before Google’s pay-
per-click model, search engines were funded by ad banners. These proved to be relatively
ineffective and counter-productive. Google adopted a new model that sold ads in an
auction, which factors in bid price and ad click-through rate. This system resulted in both
better ROI for advertisers and profitability for Google.
Google’s long-term success
While Google’s search algorithm originality allowed it to gain a significant share of the
search market, it was logical to assume that Yahoo! and MSN could recapture a significant
share once they developed their own algorithmic search. This, however, did not prove to
be the case as Google itself became a verb and embedded into people’s workflow.
Between 2000 and 2002, Yahoo! attempted to strengthen its search capability by acquiring
Inktomi and AltaVista. These acquisitions combined with internal R&D allowed Yahoo! to
transition off of Google’s search engine in 2004. However, even though the company
developed a search algorithm comparable to Google’s, it remained unable to retake share.
MSN search was also forced to use Google until 2004 when it released its own internally
developed search engine. However, its share remained relatively small, even after the
0%
10%
20%
30%
40%
50%
60%
70%
80%
2003 2004 2005 2006 2007 2008 2009 2010 2011
Google Yahoo! MSN Other

December 7, 2012
Goldman Sachs Global Investment Research
launch of B
efforts of Ya
users. For a
using it has
incredibly d
Microsoft h
stayed relat
space have
Google was
internet to t
Closed web
migrated to
it unmistaka
can fulfill al
Exhibit 75: SIt was eviden
explain why
associate the
Source: comSco
Rating and
Facebook, I
Corp. (N/N,
ing in 2009. Google’s ability to maintain its vast marke
ahoo! and Bing, indicates that the company has been a
all intensive purposes, Google has become synonymou
become second nature for many individuals. Yahoo!
difficult to break into the unconscious habit of typing in
as gained share with Bing, we note that Google’s shar
tively constant at 65% of the market, while the remaini
fought for the rest, with Microsoft primarily taking sha
s successful because of its superior algorithm-based ap
the general public by sending users offsite to sites bett
b portals, such as Yahoo!, AOL, and MSN, saw significa
o the open internet. Past conflicts between open and cl
ably clear that platform isolation poses serious risks an
l the needs of a platform’s ecosystem (see Exhibit 75).
Share of total page views on major search engines vsnt even in the mid-2000s that people associated Google w
Yahoo! and MSN (Bing) have been unable to steal share
em with online search.
ore, company data, Goldman Sachs Research estimates.
pricing information: Amazon.com Inc. (B/N, $253.37), A
nc. (B/N, $26.97), Google Inc. (N/N, $691.13), Intel Corp
$26.73) and Samsung Electronics (B/A, W1,454,000).
Americas: Technology
75
et share, despite the
able to successfully lock in
us with online search and
and Bing have found it
n google.com. While
re of US searches has
ng competitors in the
are from those providers.
pproach as it opened the
ter suited to fit their needs.
ant declines as users
osed systems have made
nd that no single company
. query share, 2005 with search. This helps
. Visitors just simply don’t
Apple Inc. (B/N, $547.25),
p. (S/A, $20.16), Microsoft

December 7, 2012 Americas: Technology
Goldman Sachs Global Investment Research 76
Disclosure Appendix
Reg AC
We, Heather Bellini, CFA, Bill Shope, CFA and Michael Bang, hereby certify that all of the views expressed in this report accurately reflect our
personal views about the subject company or companies and its or their securities. We also certify that no part of our compensation was, is or will be,
directly or indirectly, related to the specific recommendations or views expressed in this report.
Investment Profile
The Goldman Sachs Investment Profile provides investment context for a security by comparing key attributes of that security to its peer group and
market. The four key attributes depicted are: growth, returns, multiple and volatility. Growth, returns and multiple are indexed based on composites
of several methodologies to determine the stocks percentile ranking within the region's coverage universe.
The precise calculation of each metric may vary depending on the fiscal year, industry and region but the standard approach is as follows:
Growth is a composite of next year's estimate over current year's estimate, e.g. EPS, EBITDA, Revenue. Return is a year one prospective aggregate
of various return on capital measures, e.g. CROCI, ROACE, and ROE. Multiple is a composite of one-year forward valuation ratios, e.g. P/E, dividend
yield, EV/FCF, EV/EBITDA, EV/DACF, Price/Book. Volatility is measured as trailing twelve-month volatility adjusted for dividends.
Quantum
Quantum is Goldman Sachs' proprietary database providing access to detailed financial statement histories, forecasts and ratios. It can be used for
in-depth analysis of a single company, or to make comparisons between companies in different sectors and markets.
GS SUSTAIN
GS SUSTAIN is a global investment strategy aimed at long-term, long-only performance with a low turnover of ideas. The GS SUSTAIN focus list
includes leaders our analysis shows to be well positioned to deliver long term outperformance through sustained competitive advantage and
superior returns on capital relative to their global industry peers. Leaders are identified based on quantifiable analysis of three aspects of corporate
performance: cash return on cash invested, industry positioning and management quality (the effectiveness of companies' management of the
environmental, social and governance issues facing their industry).
Disclosures
Coverage group(s) of stocks by primary analyst(s)
Heather Bellini, CFA: America-Software. Bill Shope, CFA: America-IT Hardware/Systems. Michael Bang: Asia Pacific Media, Korea Technology.
America-IT Hardware/Systems: Apple Inc., Dell Inc., EMC Corporation, Emulex Corp., Fusion-io, Inc., Hewlett-Packard Co., International Business
Machines, Lexmark International Group, NetApp, Inc., QLogic Corp., Seagate Technology, Western Digital Corp., Xerox Corp..
America-Software: ANSYS, Inc., Adobe Systems Inc., Amazon.com Inc., Autodesk Inc., Citrix Systems Inc., Dolby Laboratories, Inc., Facebook, Inc.,
Google Inc., Jive Software, Inc., Microsoft Corp., Oracle Corp., Parametric Technology Corp., Red Hat, Inc., Rovi Corp., VMware, Inc., Workday, Inc.,
salesforce.com, Inc..
Asia Pacific Media: Astro Malaysia Holdings Berhad, Baidu.com, Inc., Changyou.com, Ctrip.com International, Daum Communications, Dish TV India,
NCsoft, NHN, New Oriental Education & Technology Group Inc. (ADR), SINA Corporation, Sohu.com, SouFun Holdings Limited, Sun TV Network,
TAL Education Group, Television Broadcasts, Tencent Holdings, Xueda Education Group, Youku Tudou Inc., Zee Entertainment Enterprises.
Korea Technology: Asia Pacific Systems, Iljin Materials, LG Display, LG Electronics, LG Innotek Co., SFA Engineering, SK Hynix Inc., Samsung Electro-
Mechanics, Samsung Electronics, Samsung SDI Co., Samsung Techwin, Seoul Semiconductor, Soulbrain.
Company-specific regulatory disclosures
Compendium report: please see disclosures at http://www.gs.com/research/hedge.html. Disclosures applicable to the companies included in this
compendium can be found in the latest relevant published research
December 7, 2012 Americas: Technology
Goldman Sachs Global Investment Research 77
Distribution of ratings/investment banking relationships
Goldman Sachs Investment Research global coverage universe
Rating Distribution Investment Banking Relationships
Buy Hold Sell Buy Hold Sell
Global 31% 55% 14% 49% 42% 35%
As of October 1, 2012, Goldman Sachs Global Investment Research had investment ratings on 3,442 equity securities. Goldman Sachs assigns stocks
as Buys and Sells on various regional Investment Lists; stocks not so assigned are deemed Neutral. Such assignments equate to Buy, Hold and Sell
for the purposes of the above disclosure required by NASD/NYSE rules. See 'Ratings, Coverage groups and views and related definitions' below.
Price target and rating history chart(s)
Compendium report: please see disclosures at http://www.gs.com/research/hedge.html. Disclosures applicable to the companies included in this
compendium can be found in the latest relevant published research
Regulatory disclosures
Disclosures required by United States laws and regulations
See company-specific regulatory disclosures above for any of the following disclosures required as to companies referred to in this report: manager
or co-manager in a pending transaction; 1% or other ownership; compensation for certain services; types of client relationships; managed/co-
managed public offerings in prior periods; directorships; for equity securities, market making and/or specialist role. Goldman Sachs usually makes a
market in fixed income securities of issuers discussed in this report and usually deals as a principal in these securities.
The following are additional required disclosures: Ownership and material conflicts of interest: Goldman Sachs policy prohibits its analysts,
professionals reporting to analysts and members of their households from owning securities of any company in the analyst's area of
coverage. Analyst compensation: Analysts are paid in part based on the profitability of Goldman Sachs, which includes investment banking
revenues. Analyst as officer or director: Goldman Sachs policy prohibits its analysts, persons reporting to analysts or members of their
households from serving as an officer, director, advisory board member or employee of any company in the analyst's area of coverage. Non-U.S. Analysts: Non-U.S. analysts may not be associated persons of Goldman, Sachs & Co. and therefore may not be subject to NASD Rule 2711/NYSE
Rules 472 restrictions on communications with subject company, public appearances and trading securities held by the analysts.
Distribution of ratings: See the distribution of ratings disclosure above. Price chart: See the price chart, with changes of ratings and price targets in
prior periods, above, or, if electronic format or if with respect to multiple companies which are the subject of this report, on the Goldman Sachs
website at http://www.gs.com/research/hedge.html.
Additional disclosures required under the laws and regulations of jurisdictions other than the United States
The following disclosures are those required by the jurisdiction indicated, except to the extent already made above pursuant to United States laws
and regulations. Australia: Goldman Sachs Australia Pty Ltd and its affiliates are not authorised deposit-taking institutions (as that term is defined in
the Banking Act 1959 (Cth)) in Australia and do not provide banking services, nor carry on a banking business, in Australia. This research, and any
access to it, is intended only for "wholesale clients" within the meaning of the Australian Corporations Act, unless otherwise agreed by Goldman
Sachs. Brazil: Disclosure information in relation to CVM Instruction 483 is available at http://www.gs.com/worldwide/brazil/area/gir/index.html.
Where applicable, the Brazil-registered analyst primarily responsible for the content of this research report, as defined in Article 16 of CVM Instruction
483, is the first author named at the beginning of this report, unless indicated otherwise at the end of the text. Canada: Goldman, Sachs & Co. has
approved of, and agreed to take responsibility for, this research in Canada if and to the extent it relates to equity securities of Canadian issuers.
Analysts may conduct site visits but are prohibited from accepting payment or reimbursement by the company of travel expenses for such
visits. Hong Kong: Further information on the securities of covered companies referred to in this research may be obtained on request from
Goldman Sachs (Asia) L.L.C. India: Further information on the subject company or companies referred to in this research may be obtained from
Goldman Sachs (India) Securities Private Limited; Japan: See below. Korea: Further information on the subject company or companies referred to
in this research may be obtained from Goldman Sachs (Asia) L.L.C., Seoul Branch. New Zealand: Goldman Sachs New Zealand Limited and its
affiliates are neither "registered banks" nor "deposit takers" (as defined in the Reserve Bank of New Zealand Act 1989) in New Zealand. This research,
and any access to it, is intended for "wholesale clients" (as defined in the Financial Advisers Act 2008) unless otherwise agreed by Goldman
Sachs. Russia: Research reports distributed in the Russian Federation are not advertising as defined in the Russian legislation, but are information
and analysis not having product promotion as their main purpose and do not provide appraisal within the meaning of the Russian legislation on
appraisal activity. Singapore: Further information on the covered companies referred to in this research may be obtained from Goldman Sachs
(Singapore) Pte. (Company Number: 198602165W). Taiwan: This material is for reference only and must not be reprinted without permission.
Investors should carefully consider their own investment risk. Investment results are the responsibility of the individual investor. United Kingdom: Persons who would be categorized as retail clients in the United Kingdom, as such term is defined in the rules of the Financial Services
Authority, should read this research in conjunction with prior Goldman Sachs research on the covered companies referred to herein and should refer
to the risk warnings that have been sent to them by Goldman Sachs International. A copy of these risks warnings, and a glossary of certain financial
terms used in this report, are available from Goldman Sachs International on request.
European Union: Disclosure information in relation to Article 4 (1) (d) and Article 6 (2) of the European Commission Directive 2003/126/EC is available
at http://www.gs.com/disclosures/europeanpolicy.html which states the European Policy for Managing Conflicts of Interest in Connection with
Investment Research.
Japan: Goldman Sachs Japan Co., Ltd. is a Financial Instrument Dealer under the Financial Instrument and Exchange Law, registered with the Kanto
Financial Bureau (Registration No. 69), and is a member of Japan Securities Dealers Association (JSDA) and Financial Futures Association of Japan
(FFAJ). Sales and purchase of equities are subject to commission pre-determined with clients plus consumption tax. See company-specific
disclosures as to any applicable disclosures required by Japanese stock exchanges, the Japanese Securities Dealers Association or the Japanese
Securities Finance Company.

December 7, 2012 Americas: Technology
Goldman Sachs Global Investment Research 78
Ratings, coverage groups and views and related definitions
Buy (B), Neutral (N), Sell (S) -Analysts recommend stocks as Buys or Sells for inclusion on various regional Investment Lists. Being assigned a Buy
or Sell on an Investment List is determined by a stock's return potential relative to its coverage group as described below. Any stock not assigned as
a Buy or a Sell on an Investment List is deemed Neutral. Each regional Investment Review Committee manages various regional Investment Lists to a
global guideline of 25%-35% of stocks as Buy and 10%-15% of stocks as Sell; however, the distribution of Buys and Sells in any particular coverage
group may vary as determined by the regional Investment Review Committee. Regional Conviction Buy and Sell lists represent investment
recommendations focused on either the size of the potential return or the likelihood of the realization of the return.
Return potential represents the price differential between the current share price and the price target expected during the time horizon associated
with the price target. Price targets are required for all covered stocks. The return potential, price target and associated time horizon are stated in each
report adding or reiterating an Investment List membership.
Coverage groups and views: A list of all stocks in each coverage group is available by primary analyst, stock and coverage group at
http://www.gs.com/research/hedge.html. The analyst assigns one of the following coverage views which represents the analyst's investment outlook
on the coverage group relative to the group's historical fundamentals and/or valuation. Attractive (A). The investment outlook over the following 12
months is favorable relative to the coverage group's historical fundamentals and/or valuation. Neutral (N). The investment outlook over the
following 12 months is neutral relative to the coverage group's historical fundamentals and/or valuation. Cautious (C). The investment outlook over
the following 12 months is unfavorable relative to the coverage group's historical fundamentals and/or valuation.
Not Rated (NR). The investment rating and target price have been removed pursuant to Goldman Sachs policy when Goldman Sachs is acting in an
advisory capacity in a merger or strategic transaction involving this company and in certain other circumstances. Rating Suspended (RS). Goldman
Sachs Research has suspended the investment rating and price target for this stock, because there is not a sufficient fundamental basis for
determining, or there are legal, regulatory or policy constraints around publishing, an investment rating or target. The previous investment rating and
price target, if any, are no longer in effect for this stock and should not be relied upon. Coverage Suspended (CS). Goldman Sachs has suspended
coverage of this company. Not Covered (NC). Goldman Sachs does not cover this company. Not Available or Not Applicable (NA). The
information is not available for display or is not applicable. Not Meaningful (NM). The information is not meaningful and is therefore excluded.
Global product; distributing entities
The Global Investment Research Division of Goldman Sachs produces and distributes research products for clients of Goldman Sachs on a global
basis. Analysts based in Goldman Sachs offices around the world produce equity research on industries and companies, and research on
macroeconomics, currencies, commodities and portfolio strategy. This research is disseminated in Australia by Goldman Sachs Australia Pty Ltd
(ABN 21 006 797 897); in Brazil by Goldman Sachs do Brasil Corretora de Títulos e Valores Mobiliários S.A.; in Canada by Goldman, Sachs & Co.
regarding Canadian equities and by Goldman, Sachs & Co. (all other research); in Hong Kong by Goldman Sachs (Asia) L.L.C.; in India by Goldman
Sachs (India) Securities Private Ltd.; in Japan by Goldman Sachs Japan Co., Ltd.; in the Republic of Korea by Goldman Sachs (Asia) L.L.C., Seoul
Branch; in New Zealand by Goldman Sachs New Zealand Limited; in Russia by OOO Goldman Sachs; in Singapore by Goldman Sachs (Singapore)
Pte. (Company Number: 198602165W); and in the United States of America by Goldman, Sachs & Co. Goldman Sachs International has approved this
research in connection with its distribution in the United Kingdom and European Union.
European Union: Goldman Sachs International, authorized and regulated by the Financial Services Authority, has approved this research in
connection with its distribution in the European Union and United Kingdom; Goldman Sachs AG, regulated by the Bundesanstalt für
Finanzdienstleistungsaufsicht, may also distribute research in Germany.
General disclosures
This research is for our clients only. Other than disclosures relating to Goldman Sachs, this research is based on current public information that we
consider reliable, but we do not represent it is accurate or complete, and it should not be relied on as such. We seek to update our research as
appropriate, but various regulations may prevent us from doing so. Other than certain industry reports published on a periodic basis, the large
majority of reports are published at irregular intervals as appropriate in the analyst's judgment.
Goldman Sachs conducts a global full-service, integrated investment banking, investment management, and brokerage business. We have
investment banking and other business relationships with a substantial percentage of the companies covered by our Global Investment Research
Division. Goldman, Sachs & Co., the United States broker dealer, is a member of SIPC (http://www.sipc.org).
Our salespeople, traders, and other professionals may provide oral or written market commentary or trading strategies to our clients and our
proprietary trading desks that reflect opinions that are contrary to the opinions expressed in this research. Our asset management area, our
proprietary trading desks and investing businesses may make investment decisions that are inconsistent with the recommendations or views
expressed in this research.
The analysts named in this report may have from time to time discussed with our clients, including Goldman Sachs salespersons and traders, or may
discuss in this report, trading strategies that reference catalysts or events that may have a near-term impact on the market price of the equity
securities discussed in this report, which impact may be directionally counter to the analysts' published price target expectations for such stocks. Any
such trading strategies are distinct from and do not affect the analysts' fundamental equity rating for such stocks, which rating reflects a stock's
return potential relative to its coverage group as described herein.
We and our affiliates, officers, directors, and employees, excluding equity and credit analysts, will from time to time have long or short positions in,
act as principal in, and buy or sell, the securities or derivatives, if any, referred to in this research.
This research is not an offer to sell or the solicitation of an offer to buy any security in any jurisdiction where such an offer or solicitation would be
illegal. It does not constitute a personal recommendation or take into account the particular investment objectives, financial situations, or needs of
individual clients. Clients should consider whether any advice or recommendation in this research is suitable for their particular circumstances and, if
appropriate, seek professional advice, including tax advice. The price and value of investments referred to in this research and the income from them
may fluctuate. Past performance is not a guide to future performance, future returns are not guaranteed, and a loss of original capital may occur.
Fluctuations in exchange rates could have adverse effects on the value or price of, or income derived from, certain investments.
Certain transactions, including those involving futures, options, and other derivatives, give rise to substantial risk and are not suitable for all investors.
Investors should review current options disclosure documents which are available from Goldman Sachs sales representatives or at
http://www.theocc.com/about/publications/character-risks.jsp. Transaction costs may be significant in option strategies calling for multiple purchase
and sales of options such as spreads. Supporting documentation will be supplied upon request.
In producing research reports, members of the Global Investment Research Division of Goldman Sachs Australia may attend site visits and other
meetings hosted by the issuers the subject of its research reports. In some instances the costs of such site visits or meetings may be met in part or in

December 7, 2012 Americas: Technology
Goldman Sachs Global Investment Research 79
whole by the issuers concerned if Goldman Sachs Australia considers it is appropriate and reasonable in the specific circumstances relating to the
site visit or meeting.
All research reports are disseminated and available to all clients simultaneously through electronic publication to our internal client websites. Not all
research content is redistributed to our clients or available to third-party aggregators, nor is Goldman Sachs responsible for the redistribution of our
research by third party aggregators. For all research available on a particular stock, please contact your sales representative or go to
http://360.gs.com.
Disclosure information is also available at http://www.gs.com/research/hedge.html or from Research Compliance, 200 West Street, New York, NY
10282.
© 2012 Goldman Sachs.
No part of this material may be (i) copied, photocopied or duplicated in any form by any means or (ii) redistributed without the prior written consent of The Goldman Sachs Group, Inc.