From Logistic to Algebra: Some clarifications on Diophantus’ undertaking (in Greek)
Upload
khangminh22Category
view
0download
0
energies
Article
Clarifications on the Behavior of Alternative Gases to SF6 inDivergent Electric Field Distributions under AC Voltage
Houssem Eddine Nechmi 1,* , Michail Michelarakis 1 , Abderrahmane (Manu) Haddad 1 and Gordon Wilson 2
�����������������
Citation: Nechmi, H.E.;
Michelarakis, M.; (Manu) Haddad, A.;
Wilson, G. Clarifications on the
Behavior of Alternative Gases to SF6
in Divergent Electric Field
Distributions under AC Voltage.
Energies 2021, 14, 1065. https://
doi.org/10.3390/en14041065
Academic Editor: Anna Rita Di Fazio
Received: 19 January 2021
Accepted: 16 February 2021
Published: 18 February 2021
Publisher’s Note: MDPI stays neutral
with regard to jurisdictional claims in
published maps and institutional affil-
iations.
Copyright: © 2021 by the authors.
Licensee MDPI, Basel, Switzerland.
This article is an open access article
distributed under the terms and
conditions of the Creative Commons
Attribution (CC BY) license (https://
creativecommons.org/licenses/by/
4.0/).
1 Advanced High Voltage Engineering Research Centre, School of Engineering, Cardiff University, The Parade,Cardiff CF24 3AA, UK; [email protected] (M.M.); [email protected] (A.H.)
2 National Grid House, (Floor C3), Warwick Technology Park, Gallows Hill, Warwick CV34 6DA, UK;[email protected]
* Correspondence: [email protected]; Tel.: +44-29208-76390
Abstract: Negative and positive partial discharge inception voltages and breakdown measurementsare reported in a needle-plane electrode system as a function of pressure under AC voltage for naturalgases (N2, CO2, and O2/CO2), pure NovecTM gases (C4F7N and C5F10O) and NovecTM in differentnatural gas admixtures. For compressed 4% C4F7N–96% CO2 and 6% C5F10O–12% O2–82% CO2 gasmixtures, the positive-streamer mode is identified as the breakdown mechanism. Breakdown andnegative partial discharge inception voltages of 6% C5F10O–12% O2–82% CO2 are higher than thoseof 4% C4F7N–96% CO2. At 8.8 bar abs, the breakdown voltage of 6% C5F10O–12% O2–82% CO2 isequal to that of 12.77% O2–87.23% CO2 (buffer gas). Synergism in negative partial discharge inceptionvoltage/electric field fits with the mean value and the sum of each partial pressure individuallycomponent for a 20% C4F7N–80% CO2 and 6% C5F10O–12% O2–82% CO2, respectively. In 9% C4F7N–91% CO2, the comparison of partial discharge inception electric fields is Emax (CO2) = Emax(C4F7N),and Emax (12.77% O2–87.23% CO2) = Emax(C5F10O) in 19% C5F10O–81%(12.77% O2–87.23% CO2).Polarity reversal occurs under AC voltage when the breakdown polarity changes from negative topositive cycle. Polarity reversal electric field EPR was quantified. Fitting results show that EPR (CO2)= EPR(9% C4F7N–91% CO2) and EPR(SF6) = EPR (22% C4F7N–78% CO2). EPR (4% C4F7N–96% CO2)= EPR (12.77% O2–87.23% CO2) and EPR (6% C5F10O–12% O2–82% CO2) < EPR (4% C4F7N–96% CO2)< EPR (CO2).
Keywords: N2; O2/CO2; C4F7N; C4F7N/CO2; C5F10O; C5F10O/O2/CO2; gaseous breakdown;divergent electric fields; partial discharge inception voltage/electric field; polarity reversal pres-sure/electric field
1. Introduction
In compressed SF6 [1–5], the propagation mechanism (leader criterion) is the break-down mode in the presence of conducting particles fixed/floating on conductors or insula-tors. In the presence of invasive pollutants, the streamer inception level is lower than theleader inception level. The conventional partial discharge (PDs) measurement techniqueconstitutes a means to detect the presence of defects without conducting destructive tests.
On the other hand, for C4F7N/CO2 mixtures [6], the PDs activity under AC voltagevaries as a function of pressure and the magnitude of the electric field, including breakdownpolarity reversal (PR), when the AC breakdown polarity changes from negative half-cycleto positive half-cycle with the increase of pressure. At the reversal critical pressure (PRpressure), breakdowns occur on positive or negative half-cycles. Before PR, PDs areobserved during the negative half-cycle, and current pulses occur on the positive cycle. Forthe same electric field distribution, increasing the pressure leads to an increase of the partialdischarge inception voltage (PDIV) and an increase of the intensity of the maximum electricfield on the tip of the needle. The latter causes inception of a denser PDs activity on thepositive cycle and an attenuation of the PDs on the negative cycle. For pressures above PR,
Energies 2021, 14, 1065. https://doi.org/10.3390/en14041065 https://www.mdpi.com/journal/energies
Energies 2021, 14, 1065 2 of 23
negative PDs activity decreases until being hidden by the background noise of the currentsensing circuit. In this case, only higher positive polarity PDs activity is detectable, and thepositive PDIV is close to breakdown. It was reported that the breakdown voltage is equalunder positive and negative polarities under lightning impulse voltage waveform in quasi-uniform fields and at PR pressure [7,8]. The PR pressure increases linearly with the increaseof field utilization factor η given by Equation (1). It should be noted that η = Emean/Emax,Emax being the maximum electric field for a given electrode configuration; it is computedusing finite element method simulation using COMSOL MultiphysicsTM software.; andEmean is the mean electric field given by Emean = V/d where V is the applied voltage and dis the electrodes gap. The linear increase is characterized by a constant polarity reversalelectric field EPR calculated according to Equation (1), where Vi is the positive PDIV fordivergent electric fields and the breakdown voltage for quasi-uniform electric fields, d isthe electrode gap. Table 1 reports EPR for different gas/gas mixtures [6–8].
(EPR or Emax) =Vi
d · n(1)
Table 1. Reported polarity reversal electric field EPR according to Equation (1) [6–8].
Gas/Gas Mixture EPR (kV/mm) Pressure (bar abs) η
SF6 [7,8] 86 7.5 0.17CO2 [6] 64 2.5 0.0385
3.7% C4F7N–96.3% CO2 [8] 47 9.5 0.3310% C4F7N–90% CO2 [7] 66 5.5 0.22
The present work investigates both the negative/positive-inception and breakdownvoltages of a classic defect in GIS (fixed particle on the live conductor) under AC voltagewaveform for different gases and gas mixtures. Natural gases, such as N2, CO2, andO2/CO2, are also assessed since they constitute the buffer gas(es) when mixed with thefluorinated SF6 replacement candidates (C4F7N or C5F10O). The main purpose of addingnatural gases is to lower the boiling point of the final fluorinated/natural gas mixtureto reach operating temperatures similar to SF6 for indoor and outdoor high voltage ap-plications. In addition, pure C4F7N and C5F10O were studied at the sub-atmosphericpressure level without liquefaction. Then, including minimal working temperature and itscorresponding concentrations [7–9], the addition of highly electronegative gases to naturalgases is investigated, and the synergism of the constituents is quantified. Inception electricfield was calculated in positive/negative polarities for pure/gas mixtures, and synergismlaws are deducted. The polarity reversal electric fields are calculated for the C4F7N/CO2and C5F10O/O2/CO2 gas mixtures.
2. Materials and Methods
To study pure gas/gas mixture pre-breakdown and breakdown characteristics undernon-uniform fields, a needle/plane defect model was utilized as described in previouswork [6]. The needle was placed between two plane electrodes of Bruce profile to providehomogeneous background electric field conditions. The plane electrodes were made ofaluminum and the 100 µm tip radius needle from tungsten of 99.99% purity. The electrodeset was placed inside a vessel made of stainless steel (volume = 12 L, max pressure = 12 barabs). The high voltage needle electrode that was connected to the bushing was fixed andwas connected to a high voltage AC source (3.75 kVA) with a maximum output voltage of50 kV rms. The high voltage bushing installed on the test vessel was rated at 38 kV AC rms.The grounded plane electrode, however, was vertically moveable within the test chamberso that the desired gap length can be achieved with an accuracy of 0.1 mm. Current sensingwas performed by coupling a high-frequency current transformer (HFCT), of 500 MHz
Energies 2021, 14, 1065 3 of 23
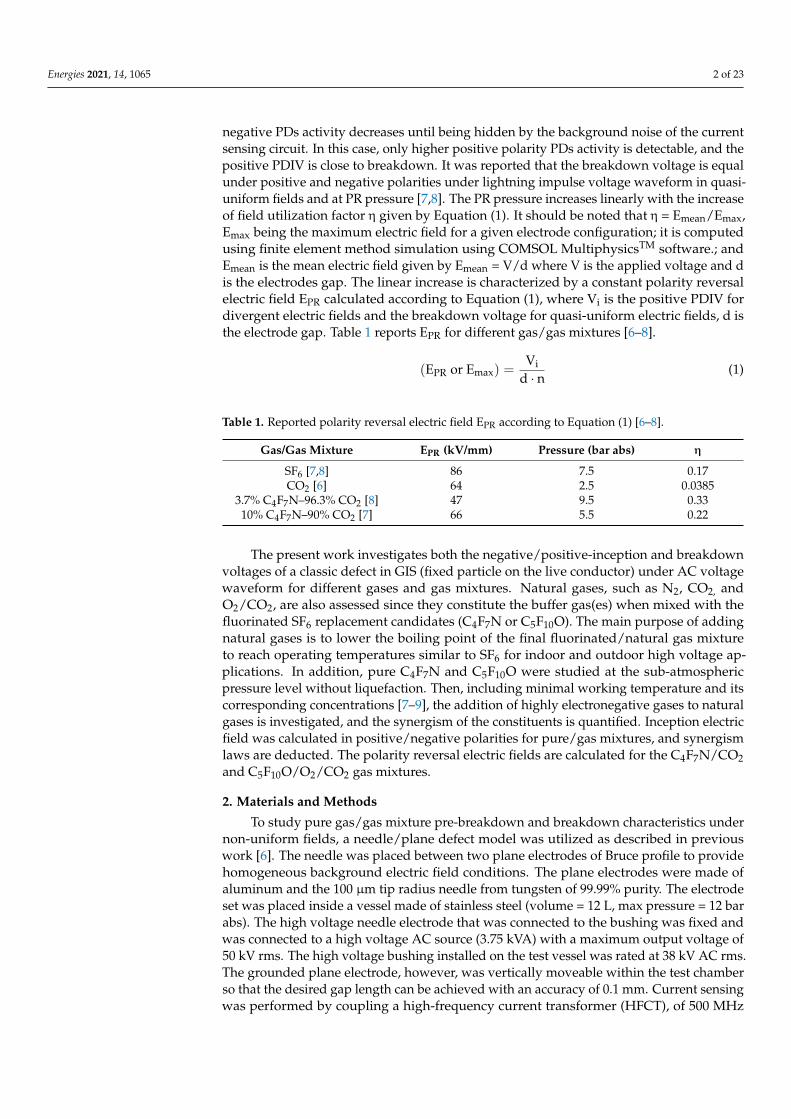
upper cutoff frequency, to the lower (grounded) plane electrode, while the recording of thegenerated signals was performed through a 500 MHz, 2 GS/s oscilloscope (see Figure 1).
Energies 2021, 14, x FOR PEER REVIEW 3 of 24
AC rms. The grounded plane electrode, however, was vertically moveable within the test chamber so that the desired gap length can be achieved with an accuracy of 0.1 mm. Cur-rent sensing was performed by coupling a high-frequency current transformer (HFCT), of 500 MHz upper cutoff frequency, to the lower (grounded) plane electrode, while the re-cording of the generated signals was performed through a 500 MHz, 2 GS/s oscilloscope (see Figure 1).
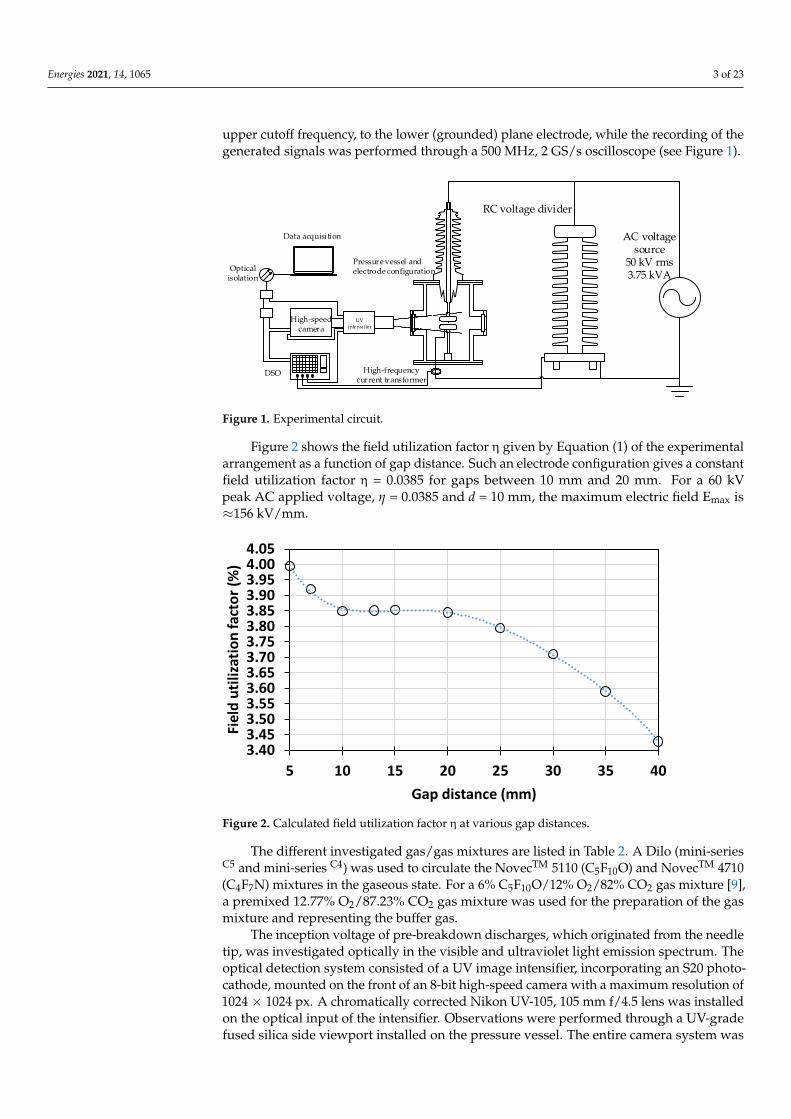
Figure 2 shows the field utilization factor η given by Equation (1) of the experimental arrangement as a function of gap distance. Such an electrode configuration gives a con-stant field utilization factor η = 0.0385 for gaps between 10 mm and 20 mm. For a 60 kV peak AC applied voltage, η = 0.0385 and d = 10 mm, the maximum electric field Emax is ≈156 kV/mm.
Figure 1. Experimental circuit.
Figure 2. Calculated field utilization factor η at various gap distances.
The different investigated gas/gas mixtures are listed in Table 2. A Dilo (mini-series C5 and mini-series C4) was used to circulate the Novec TM 5110 (C5F10O) and Novec TM 4710 (C4F7N) mixtures in the gaseous state. For a 6% C5F10O/12% O2/82% CO2 gas mixture [9], a premixed 12.77% O2/87.23% CO2 gas mixture was used for the preparation of the gas mix-ture and representing the buffer gas.
High-speed camera
UVinte nsi fier
Pressure vessel and electrode configuration
Data acquisition
RC voltage divider
AC voltage source
50 kV rms3.75 kVA
High-frequency current transformer
DSO
Optical isolation
3.403.453.503.553.603.653.703.753.803.853.903.954.004.05
5 10 15 20 25 30 35 40
Fiel
d ut
iliza
tion
fact
or (%
)
Gap distance (mm)
Figure 1. Experimental circuit.
Figure 2 shows the field utilization factor η given by Equation (1) of the experimentalarrangement as a function of gap distance. Such an electrode configuration gives a constantfield utilization factor η = 0.0385 for gaps between 10 mm and 20 mm. For a 60 kVpeak AC applied voltage, η = 0.0385 and d = 10 mm, the maximum electric field Emax is≈156 kV/mm.
Energies 2021, 14, x FOR PEER REVIEW 3 of 24
AC rms. The grounded plane electrode, however, was vertically moveable within the test chamber so that the desired gap length can be achieved with an accuracy of 0.1 mm. Cur-rent sensing was performed by coupling a high-frequency current transformer (HFCT), of 500 MHz upper cutoff frequency, to the lower (grounded) plane electrode, while the re-cording of the generated signals was performed through a 500 MHz, 2 GS/s oscilloscope (see Figure 1).
Figure 2 shows the field utilization factor η given by Equation (1) of the experimental arrangement as a function of gap distance. Such an electrode configuration gives a con-stant field utilization factor η = 0.0385 for gaps between 10 mm and 20 mm. For a 60 kV peak AC applied voltage, η = 0.0385 and d = 10 mm, the maximum electric field Emax is ≈156 kV/mm.
Figure 1. Experimental circuit.
Figure 2. Calculated field utilization factor η at various gap distances.
The different investigated gas/gas mixtures are listed in Table 2. A Dilo (mini-series C5 and mini-series C4) was used to circulate the Novec TM 5110 (C5F10O) and Novec TM 4710 (C4F7N) mixtures in the gaseous state. For a 6% C5F10O/12% O2/82% CO2 gas mixture [9], a premixed 12.77% O2/87.23% CO2 gas mixture was used for the preparation of the gas mix-ture and representing the buffer gas.
High-speed camera
UVinte nsi fier
Pressure vessel and electrode configuration
Data acquisition
RC voltage divider
AC voltage source
50 kV rms3.75 kVA
High-frequency current transformer
DSO
Optical isolation
3.403.453.503.553.603.653.703.753.803.853.903.954.004.05
5 10 15 20 25 30 35 40
Fiel
d ut
iliza
tion
fact
or (%
)
Gap distance (mm)
Figure 2. Calculated field utilization factor η at various gap distances.
The different investigated gas/gas mixtures are listed in Table 2. A Dilo (mini-seriesC5 and mini-series C4) was used to circulate the NovecTM 5110 (C5F10O) and NovecTM 4710(C4F7N) mixtures in the gaseous state. For a 6% C5F10O/12% O2/82% CO2 gas mixture [9],a premixed 12.77% O2/87.23% CO2 gas mixture was used for the preparation of the gasmixture and representing the buffer gas.
The inception voltage of pre-breakdown discharges, which originated from the needletip, was investigated optically in the visible and ultraviolet light emission spectrum. Theoptical detection system consisted of a UV image intensifier, incorporating an S20 photo-cathode, mounted on the front of an 8-bit high-speed camera with a maximum resolution of1024 × 1024 px. A chromatically corrected Nikon UV-105, 105 mm f/4.5 lens was installedon the optical input of the intensifier. Observations were performed through a UV-gradefused silica side viewport installed on the pressure vessel. The entire camera system was
Energies 2021, 14, 1065 4 of 23
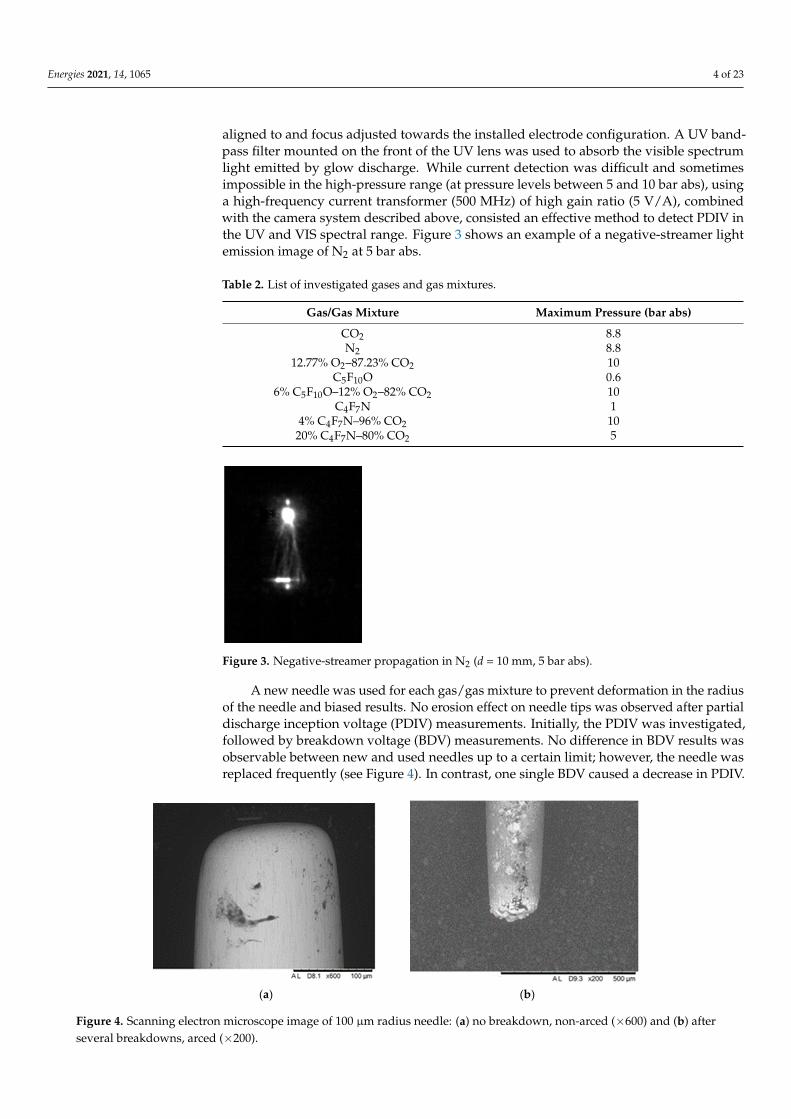
aligned to and focus adjusted towards the installed electrode configuration. A UV band-pass filter mounted on the front of the UV lens was used to absorb the visible spectrumlight emitted by glow discharge. While current detection was difficult and sometimesimpossible in the high-pressure range (at pressure levels between 5 and 10 bar abs), usinga high-frequency current transformer (500 MHz) of high gain ratio (5 V/A), combinedwith the camera system described above, consisted an effective method to detect PDIV inthe UV and VIS spectral range. Figure 3 shows an example of a negative-streamer lightemission image of N2 at 5 bar abs.
Table 2. List of investigated gases and gas mixtures.
Gas/Gas Mixture Maximum Pressure (bar abs)
CO2 8.8N2 8.8
12.77% O2–87.23% CO2 10C5F10O 0.6
6% C5F10O–12% O2–82% CO2 10C4F7N 1
4% C4F7N–96% CO2 1020% C4F7N–80% CO2 5
Energies 2021, 14, x FOR PEER REVIEW 4 of 24
Table 2. List of investigated gases and gas mixtures.
Gas/Gas Mixture Maximum Pressure (bar abs) CO2 8.8 N2 8.8
12.77% O2–87.23% CO2 10 C5F10O 0.6
6% C5F10O–12% O2–82% CO2 10 C4F7N 1
4% C4F7N–96% CO2 10 20% C4F7N–80% CO2 5
The inception voltage of pre-breakdown discharges, which originated from the nee-dle tip, was investigated optically in the visible and ultraviolet light emission spectrum. The optical detection system consisted of a UV image intensifier, incorporating an S20 photocathode, mounted on the front of an 8-bit high-speed camera with a maximum res-olution of 1024×1024 px. A chromatically corrected Nikon UV-105, 105 mm f/4.5 lens was installed on the optical input of the intensifier. Observations were performed through a UV-grade fused silica side viewport installed on the pressure vessel. The entire camera system was aligned to and focus adjusted towards the installed electrode configuration. A UV bandpass filter mounted on the front of the UV lens was used to absorb the visible spectrum light emitted by glow discharge. While current detection was difficult and sometimes impossible in the high-pressure range (at pressure levels between 5 and 10 bar abs), using a high-frequency current transformer (500 MHz) of high gain ratio (5 V/A), combined with the camera system described above, consisted an effective method to de-tect PDIV in the UV and VIS spectral range. Figure 3 shows an example of a negative-streamer light emission image of N2 at 5 bar abs.
Figure 3. Negative-streamer propagation in N2 (d = 10 mm, 5 bar abs).
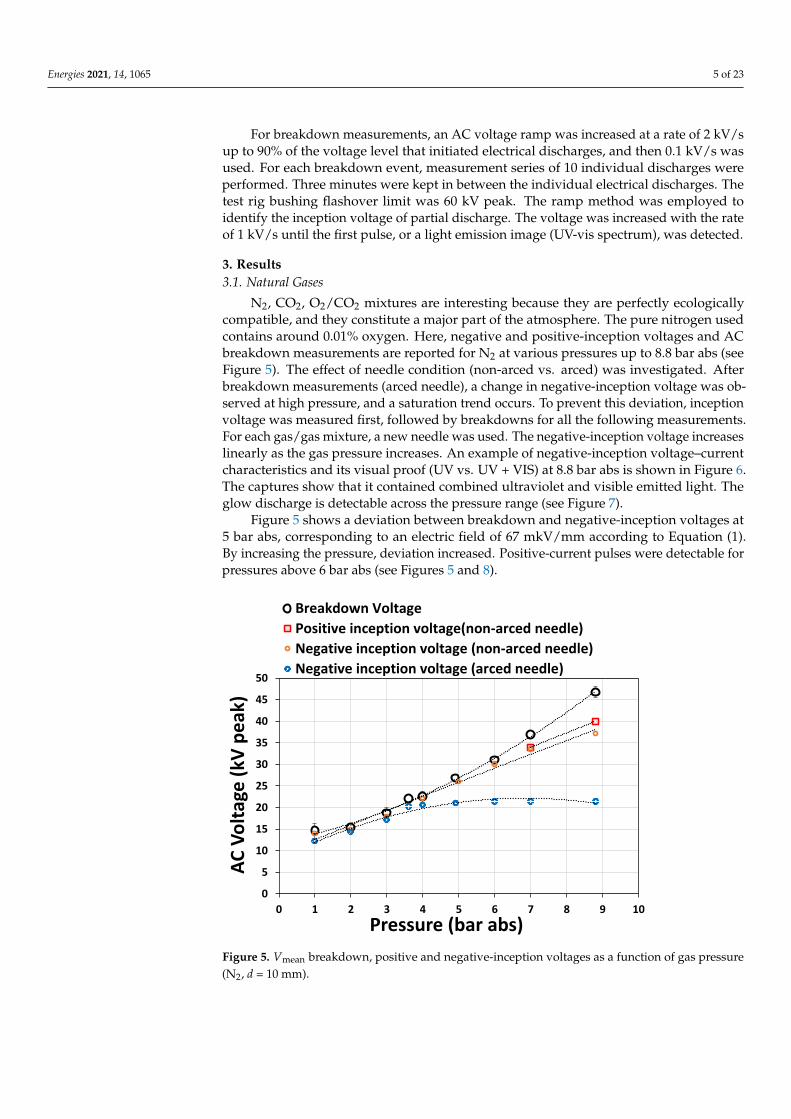
A new needle was used for each gas/gas mixture to prevent deformation in the radius of the needle and biased results. No erosion effect on needle tips was observed after partial discharge inception voltage (PDIV) measurements. Initially, the PDIV was investigated, followed by breakdown voltage (BDV) measurements. No difference in BDV results was observable between new and used needles up to a certain limit; however, the needle was replaced frequently (see Figure 4). In contrast, one single BDV caused a decrease in PDIV.
Figure 3. Negative-streamer propagation in N2 (d = 10 mm, 5 bar abs).
A new needle was used for each gas/gas mixture to prevent deformation in the radiusof the needle and biased results. No erosion effect on needle tips was observed after partialdischarge inception voltage (PDIV) measurements. Initially, the PDIV was investigated,followed by breakdown voltage (BDV) measurements. No difference in BDV results wasobservable between new and used needles up to a certain limit; however, the needle wasreplaced frequently (see Figure 4). In contrast, one single BDV caused a decrease in PDIV.
Energies 2021, 14, x FOR PEER REVIEW 5 of 24
(a) (b)
Figure 4. Scanning electron microscope image of 100 µm radius needle: (a) no breakdown, non-arced (x600) and (b) after several breakdowns, arced (x200).
For breakdown measurements, an AC voltage ramp was increased at a rate of 2 kV/s up to 90% of the voltage level that initiated electrical discharges, and then 0.1 kV/s was used. For each breakdown event, measurement series of 10 individual discharges were performed. Three minutes were kept in between the individual electrical discharges. The test rig bushing flashover limit was 60 kV peak. The ramp method was employed to iden-tify the inception voltage of partial discharge. The voltage was increased with the rate of 1 kV/s until the first pulse, or a light emission image (UV-vis spectrum), was detected.
3. Results 3.1. Natural Gases
N2, CO2, O2/CO2 mixtures are interesting because they are perfectly ecologically com-patible, and they constitute a major part of the atmosphere. The pure nitrogen used con-tains around 0.01% oxygen. Here, negative and positive-inception voltages and AC break-down measurements are reported for N2 at various pressures up to 8.8 bar abs (see Figure 5). The effect of needle condition (non-arced vs. arced) was investigated. After breakdown measurements (arced needle), a change in negative-inception voltage was observed at high pressure, and a saturation trend occurs. To prevent this deviation, inception voltage was measured first, followed by breakdowns for all the following measurements. For each gas/gas mixture, a new needle was used. The negative-inception voltage increases linearly as the gas pressure increases. An example of negative-inception voltage–current charac-teristics and its visual proof (UV vs. UV + VIS) at 8.8 bar abs is shown in Figure 6. The captures show that it contained combined ultraviolet and visible emitted light. The glow discharge is detectable across the pressure range (see Figure 7).
Figure 5 shows a deviation between breakdown and negative-inception voltages at 5 bar abs, corresponding to an electric field of 67 mkV/mm according to Equation (1). By increasing the pressure, deviation increased. Positive-current pulses were detectable for pressures above 6 bar abs (see Figures 5 and 8).
The breakdown voltage of N2 showed a linear dependence on increasing gas pressure in contrast to electronegative gas/gas mixtures that present nonlinear tendency for the same needle-plane configuration, such as CO2 and 4% C4F7N–96% CO2 [6]. The breakdown occurred exclusively under a negative AC voltage peak for the pressure range. According to the pre-breakdown current measurements (see Figure 8) and the optical observations (see Figures 3 and 8), the negative glow streamer mode was identified as the breakdown mechanism for compressed N2. These findings agree with previous investigations [10–15].
Figure 4. Scanning electron microscope image of 100 µm radius needle: (a) no breakdown, non-arced (×600) and (b) afterseveral breakdowns, arced (×200).
Energies 2021, 14, 1065 5 of 23
For breakdown measurements, an AC voltage ramp was increased at a rate of 2 kV/sup to 90% of the voltage level that initiated electrical discharges, and then 0.1 kV/s wasused. For each breakdown event, measurement series of 10 individual discharges wereperformed. Three minutes were kept in between the individual electrical discharges. Thetest rig bushing flashover limit was 60 kV peak. The ramp method was employed toidentify the inception voltage of partial discharge. The voltage was increased with the rateof 1 kV/s until the first pulse, or a light emission image (UV-vis spectrum), was detected.
3. Results3.1. Natural Gases
N2, CO2, O2/CO2 mixtures are interesting because they are perfectly ecologicallycompatible, and they constitute a major part of the atmosphere. The pure nitrogen usedcontains around 0.01% oxygen. Here, negative and positive-inception voltages and ACbreakdown measurements are reported for N2 at various pressures up to 8.8 bar abs (seeFigure 5). The effect of needle condition (non-arced vs. arced) was investigated. Afterbreakdown measurements (arced needle), a change in negative-inception voltage was ob-served at high pressure, and a saturation trend occurs. To prevent this deviation, inceptionvoltage was measured first, followed by breakdowns for all the following measurements.For each gas/gas mixture, a new needle was used. The negative-inception voltage increaseslinearly as the gas pressure increases. An example of negative-inception voltage–currentcharacteristics and its visual proof (UV vs. UV + VIS) at 8.8 bar abs is shown in Figure 6.The captures show that it contained combined ultraviolet and visible emitted light. Theglow discharge is detectable across the pressure range (see Figure 7).
Figure 5 shows a deviation between breakdown and negative-inception voltages at5 bar abs, corresponding to an electric field of 67 mkV/mm according to Equation (1).By increasing the pressure, deviation increased. Positive-current pulses were detectable forpressures above 6 bar abs (see Figures 5 and 8).
Energies 2021, 14, x FOR PEER REVIEW 6 of 24
Figure 5. Vmean breakdown, positive and negative-inception voltages as a function of gas pressure (N2, d = 10 mm).
(a) (b)
(c)
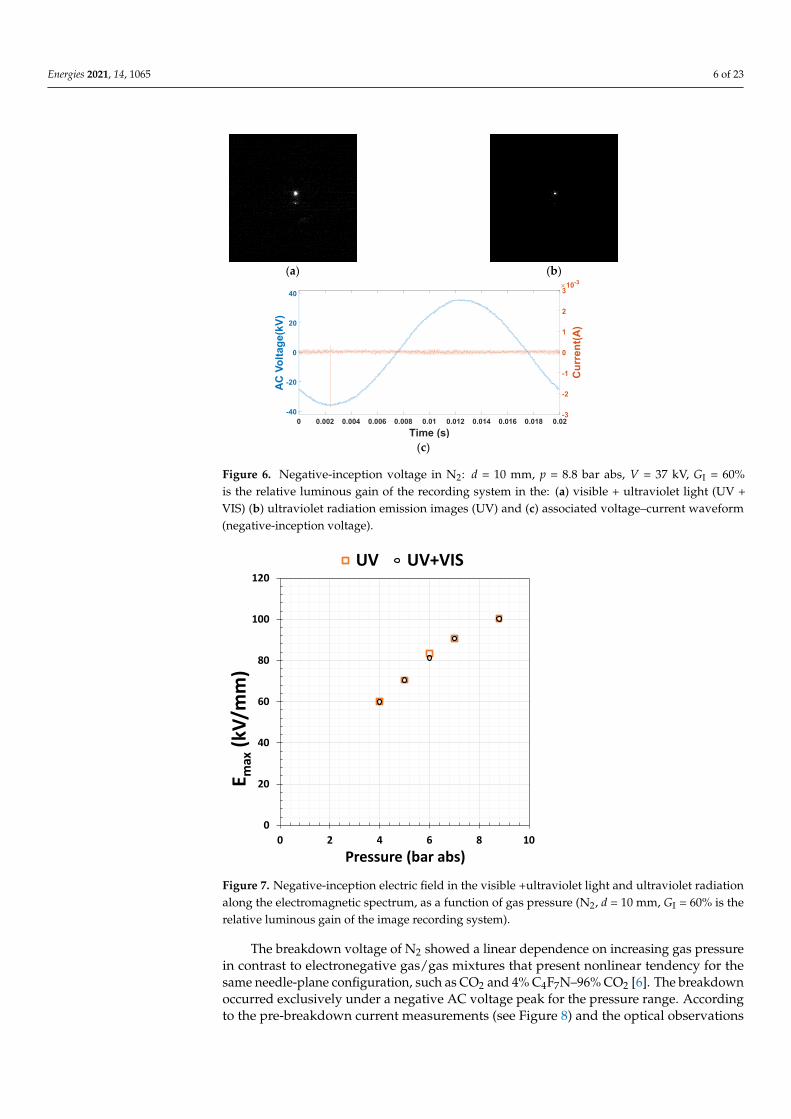
Figure 6. Negative-inception voltage in N2: d = 10 mm, p = 8.8 bar abs, V = 37 kV, GI = 60% is the relative luminous gain of the recording system in the: (a) visible + ultraviolet light (UV + VIS) (b) ultraviolet radiation emission images (UV) and (c) associated voltage–current waveform (nega-tive-inception voltage).
0
5
10
15
20
25
30
35
40
45
50
0 1 2 3 4 5 6 7 8 9 10
AC V
olta
ge (k
V pe
ak)
Pressure (bar abs)
Breakdown VoltagePositive inception voltage(non-arced needle)Negative inception voltage (non-arced needle)Negative inception voltage (arced needle)
0 0.002 0.004 0.006 0.008 0.01 0.012 0.014 0.016 0.018 0.02Time (s)
-40
-20
0
20
40
AC V
olta
ge(k
V)
-3
-2
-1
0
1
2
3
Cur
rent
(A)
10-3
Figure 5. Vmean breakdown, positive and negative-inception voltages as a function of gas pressure(N2, d = 10 mm).
Energies 2021, 14, 1065 6 of 23
Energies 2021, 14, x FOR PEER REVIEW 6 of 24
Figure 5. Vmean breakdown, positive and negative-inception voltages as a function of gas pressure (N2, d = 10 mm).
(a) (b)
(c)
Figure 6. Negative-inception voltage in N2: d = 10 mm, p = 8.8 bar abs, V = 37 kV, GI = 60% is the relative luminous gain of the recording system in the: (a) visible + ultraviolet light (UV + VIS) (b) ultraviolet radiation emission images (UV) and (c) associated voltage–current waveform (nega-tive-inception voltage).
0
5
10
15
20
25
30
35
40
45
50
0 1 2 3 4 5 6 7 8 9 10
AC V
olta
ge (k
V pe
ak)
Pressure (bar abs)
Breakdown VoltagePositive inception voltage(non-arced needle)Negative inception voltage (non-arced needle)Negative inception voltage (arced needle)
0 0.002 0.004 0.006 0.008 0.01 0.012 0.014 0.016 0.018 0.02Time (s)
-40
-20
0
20
40
AC V
olta
ge(k
V)
-3
-2
-1
0
1
2
3
Cur
rent
(A)
10-3
Figure 6. Negative-inception voltage in N2: d = 10 mm, p = 8.8 bar abs, V = 37 kV, GI = 60%is the relative luminous gain of the recording system in the: (a) visible + ultraviolet light (UV +VIS) (b) ultraviolet radiation emission images (UV) and (c) associated voltage–current waveform(negative-inception voltage).
Energies 2021, 14, x FOR PEER REVIEW 7 of 24
Figure 7. Negative-inception electric field in the visible +ultraviolet light and ultraviolet radiation along the electromagnetic spectrum, as a function of gas pressure (N2, d = 10 mm, GI = 60% is the relative luminous gain of the image recording system).
(a) (b)
(c)
0
20
40
60
80
100
120
0 2 4 6 8 10
E max
(kV/
mm
)
Pressure (bar abs)
UV UV+VIS
Cur
rent
(A)
Appa
rent
cha
rge(
C)
Figure 7. Negative-inception electric field in the visible +ultraviolet light and ultraviolet radiationalong the electromagnetic spectrum, as a function of gas pressure (N2, d = 10 mm, GI = 60% is therelative luminous gain of the image recording system).
The breakdown voltage of N2 showed a linear dependence on increasing gas pressurein contrast to electronegative gas/gas mixtures that present nonlinear tendency for thesame needle-plane configuration, such as CO2 and 4% C4F7N–96% CO2 [6]. The breakdownoccurred exclusively under a negative AC voltage peak for the pressure range. Accordingto the pre-breakdown current measurements (see Figure 8) and the optical observations
Energies 2021, 14, 1065 7 of 23
(see Figures 3 and 8), the negative glow streamer mode was identified as the breakdownmechanism for compressed N2. These findings agree with previous investigations [10–15].
Energies 2021, 14, x FOR PEER REVIEW 7 of 24
Figure 7. Negative-inception electric field in the visible +ultraviolet light and ultraviolet radiation along the electromagnetic spectrum, as a function of gas pressure (N2, d = 10 mm, GI = 60% is the relative luminous gain of the image recording system).
(a) (b)
(c)
0
20
40
60
80
100
120
0 2 4 6 8 10
E max
(kV/
mm
)
Pressure (bar abs)
UV UV+VIS
Cur
rent
(A)
Appa
rent
cha
rge(
C)
Energies 2021, 14, x FOR PEER REVIEW 8 of 24
(d)
Figure 8. Voltage–current waveform for measuring (a) partial discharge, on negative-streamer emission image (VIS+UV), (b) associated current, (c) apparent charge and (d) breakdown voltages, on the negative half-cycle (N2, d = 10 mm p = 8.8 bar abs).
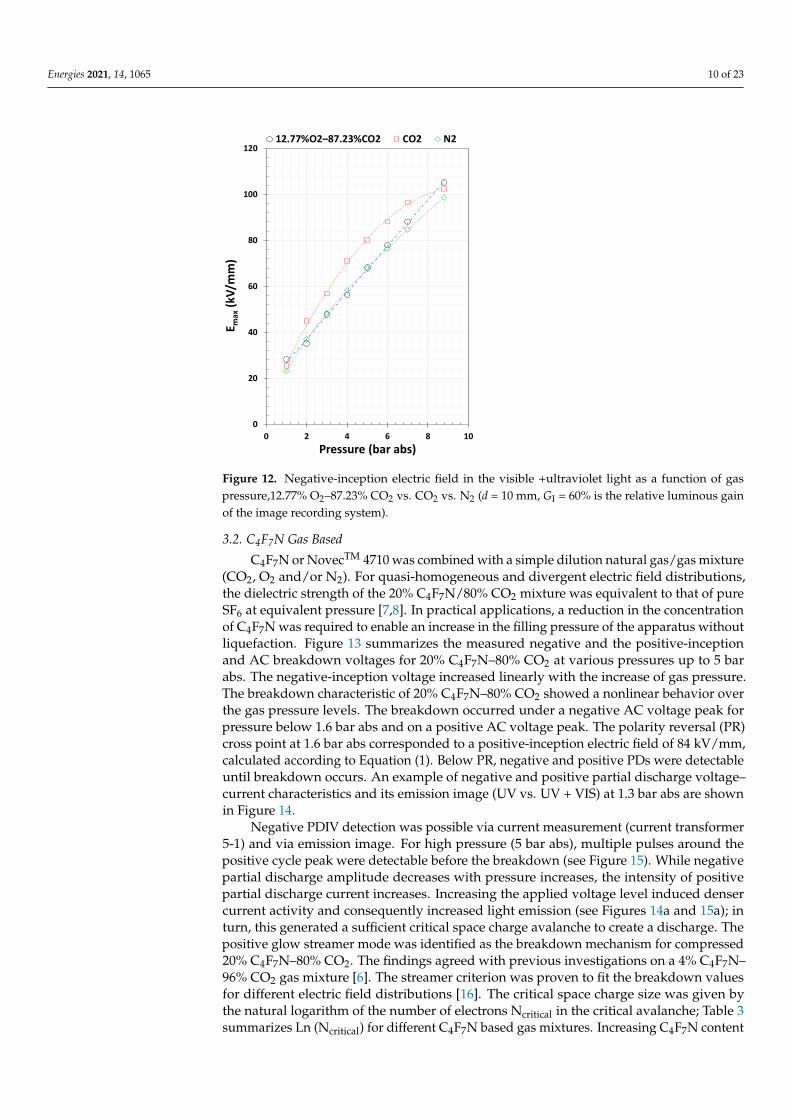
Figure 9 summarizes the negative and the positive-inception voltage and AC break-down measurement for 12.77% O2–87.23% CO2 at various pressures up to 10 bar abs. The negative-inception voltage increased linearly with the increase of gas pressure. An exam-ple of negative and positive partial discharge voltage–current characteristics and its emis-sion image (UV + VIS) at 8.8 bar abs are shown in Figure 10. The intensity of negative partial discharge current decreased with an increase of pressure (see Figure 11a). The breakdown characteristic of 12.77% O2–87.23% CO2 showed a nonlinear behavior when the gas pressure increased. The breakdown occurred under the negative AC voltage peak for pressures below 1.6 bar abs and on the positive AC voltage peak above. The polarity reversal (PR) cross point at 1.6 bar abs corresponds to a positive-inception electric field of 50 kV/mm, calculated according to Equation (1). At pressures below PR, only negative PDs were detectable up to breakdown. At PR pressure, similar partial discharge activities occurred on positive and negative cycles (see Figure 10a). The luminosity of the positive cycle was lower than that of the negative cycle (see Figure 10b,c). At pressures above PR [3,6], the needle tip was covered with a cloud of charge carriers, which were stabilized by negative ions formed by the attachment of electrons. Consequently, the negative space charges generate a reduction of the electric field on the side of the tip. This causes an in-crease in the breakdown voltage. For high pressure (8.8 bar abs), one positive-current pulse was detectable before the breakdown; the positive-streamer channels transited to leader channels and arrived at the opposite electrode instantly. The space charge near the needle tip resulted in a reduced electric field. The electrode was virtually elongated, the gap width was reduced, and the electric field was enhanced in the remaining gap, result-ing in a reduction in breakdown voltage. It established an electrical conduction path be-tween the two electrodes. Heating and expansion of the conductive channel occurred, and multiple branches were created (see Figure 11c). The negative partial discharge inception voltage (PDIV) was identified with current and emission light images. The negative par-tial discharge inception electric field (PDIEF) Emax was calculated according to Equation (1) for different natural gases as a function of pressure. The results are shown in Figure 12. Along the pressure range investigated, PDIEF of N2 and 12.77% O2–87.23% CO2 exhib-its a linear trend. On the other hand, PDIEF of CO2 evolved linearly and presented a sat-uration trend at higher pressure levels (> 5 abs). As a result, at the highest and lowest pressures (8.8 bar abs and 1 bar abs), PDIEF (12.77% O2–87.23% CO2) > PDIEF (CO2) > PDIEF (N2). However, at the intermediate pressures, PDIEF (CO2) was higher than PDIEF (12.77% O2–87.23% CO2 and N2) and PDIEF (N2) = PDIEF (12.77% O2–87.23% CO2).
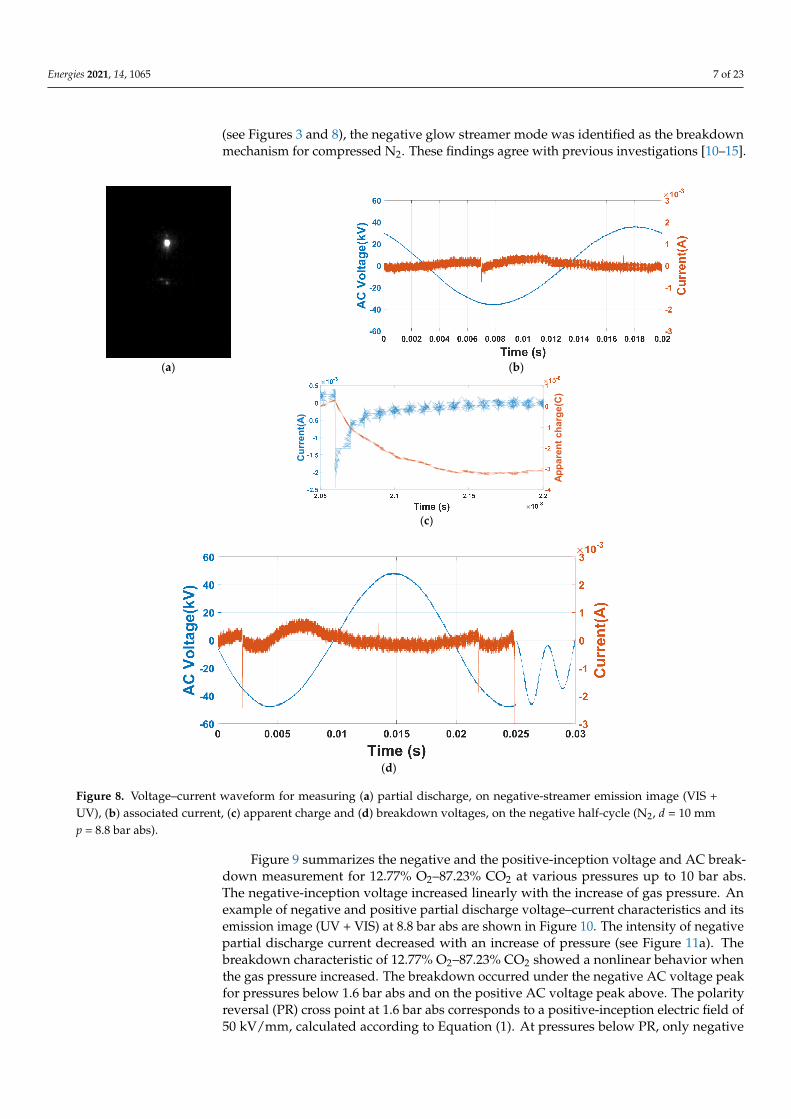
Figure 8. Voltage–current waveform for measuring (a) partial discharge, on negative-streamer emission image (VIS +UV), (b) associated current, (c) apparent charge and (d) breakdown voltages, on the negative half-cycle (N2, d = 10 mmp = 8.8 bar abs).
Figure 9 summarizes the negative and the positive-inception voltage and AC break-down measurement for 12.77% O2–87.23% CO2 at various pressures up to 10 bar abs.The negative-inception voltage increased linearly with the increase of gas pressure. Anexample of negative and positive partial discharge voltage–current characteristics and itsemission image (UV + VIS) at 8.8 bar abs are shown in Figure 10. The intensity of negativepartial discharge current decreased with an increase of pressure (see Figure 11a). Thebreakdown characteristic of 12.77% O2–87.23% CO2 showed a nonlinear behavior whenthe gas pressure increased. The breakdown occurred under the negative AC voltage peakfor pressures below 1.6 bar abs and on the positive AC voltage peak above. The polarityreversal (PR) cross point at 1.6 bar abs corresponds to a positive-inception electric field of50 kV/mm, calculated according to Equation (1). At pressures below PR, only negative
Energies 2021, 14, 1065 8 of 23
PDs were detectable up to breakdown. At PR pressure, similar partial discharge activitiesoccurred on positive and negative cycles (see Figure 10a). The luminosity of the positivecycle was lower than that of the negative cycle (see Figure 10b,c). At pressures abovePR [3,6], the needle tip was covered with a cloud of charge carriers, which were stabilizedby negative ions formed by the attachment of electrons. Consequently, the negative spacecharges generate a reduction of the electric field on the side of the tip. This causes anincrease in the breakdown voltage. For high pressure (8.8 bar abs), one positive-currentpulse was detectable before the breakdown; the positive-streamer channels transited toleader channels and arrived at the opposite electrode instantly. The space charge near theneedle tip resulted in a reduced electric field. The electrode was virtually elongated, thegap width was reduced, and the electric field was enhanced in the remaining gap, resultingin a reduction in breakdown voltage. It established an electrical conduction path betweenthe two electrodes. Heating and expansion of the conductive channel occurred, and mul-tiple branches were created (see Figure 11c). The negative partial discharge inceptionvoltage (PDIV) was identified with current and emission light images. The negative partialdischarge inception electric field (PDIEF) Emax was calculated according to Equation (1) fordifferent natural gases as a function of pressure. The results are shown in Figure 12. Alongthe pressure range investigated, PDIEF of N2 and 12.77% O2–87.23% CO2 exhibits a lineartrend. On the other hand, PDIEF of CO2 evolved linearly and presented a saturation trendat higher pressure levels (>5 abs). As a result, at the highest and lowest pressures (8.8 barabs and 1 bar abs), PDIEF (12.77% O2–87.23% CO2) > PDIEF (CO2) > PDIEF (N2). However,at the intermediate pressures, PDIEF (CO2) was higher than PDIEF (12.77% O2–87.23%CO2 and N2) and PDIEF (N2) = PDIEF (12.77% O2–87.23% CO2).
Energies 2021, 14, x FOR PEER REVIEW 9 of 24
Figure 9. Vmean breakdown, positive and negative-inception voltages as a function of gas pressure (12.77% O2–87.23% CO2, d = 10 mm).
(a)
(b) (c)
Figure 10. Voltage–current waveform for measuring (a) partial discharge at polarity reversal (PR) pressure in 12.77% O2–87.23% CO2 (d = 10 mm, P = 1.6 bar abs). GI = 60% is the relative luminous gain of the recording system in the VIS+UV range for (b) negative cycle and (c) positive cycle.
0
10
20
30
40
50
60
0 1 2 3 4 5 6 7 8 9 10 11
AC V
olta
ge (k
V pe
ak)
Pressure (bar abs)
Breakdown Voltage Positive inception voltageNegative inception voltage
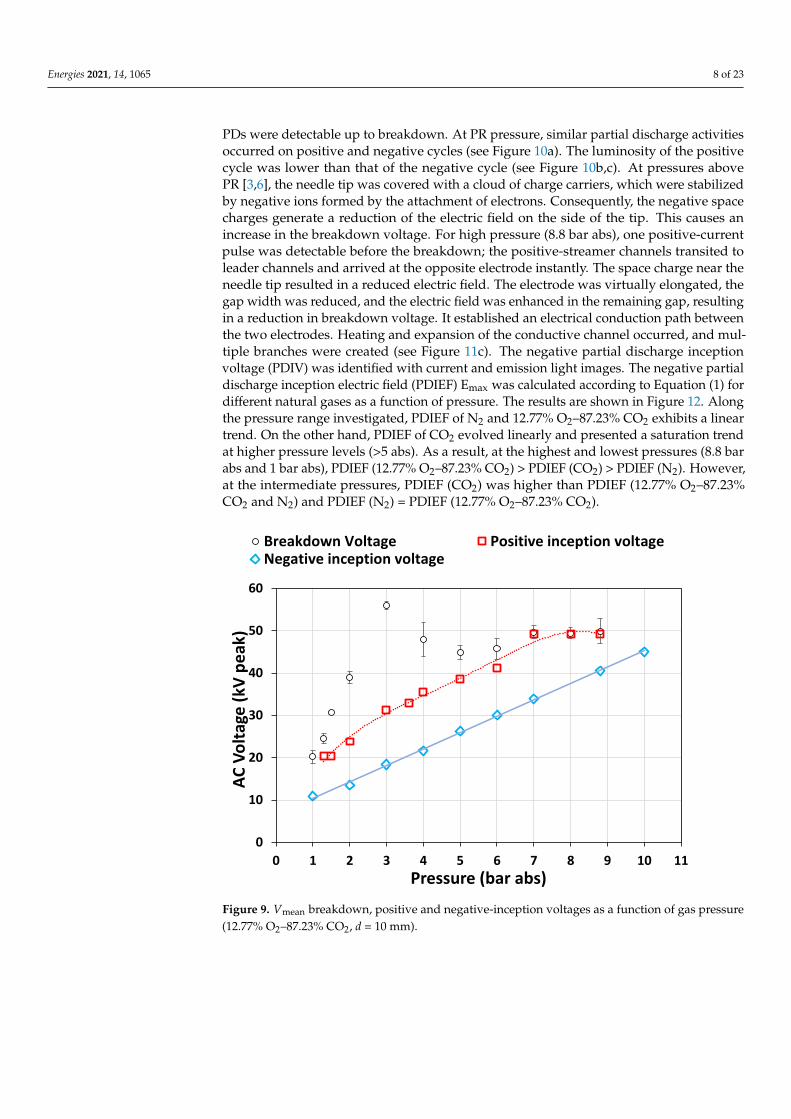
Figure 9. Vmean breakdown, positive and negative-inception voltages as a function of gas pressure(12.77% O2–87.23% CO2, d = 10 mm).
Energies 2021, 14, 1065 9 of 23
Energies 2021, 14, x FOR PEER REVIEW 9 of 24
Figure 9. Vmean breakdown, positive and negative-inception voltages as a function of gas pressure (12.77% O2–87.23% CO2, d = 10 mm).
(a)
(b) (c)
Figure 10. Voltage–current waveform for measuring (a) partial discharge at polarity reversal (PR) pressure in 12.77% O2–87.23% CO2 (d = 10 mm, P = 1.6 bar abs). GI = 60% is the relative luminous gain of the recording system in the VIS+UV range for (b) negative cycle and (c) positive cycle.
0
10
20
30
40
50
60
0 1 2 3 4 5 6 7 8 9 10 11
AC V
olta
ge (k
V pe
ak)
Pressure (bar abs)
Breakdown Voltage Positive inception voltageNegative inception voltage
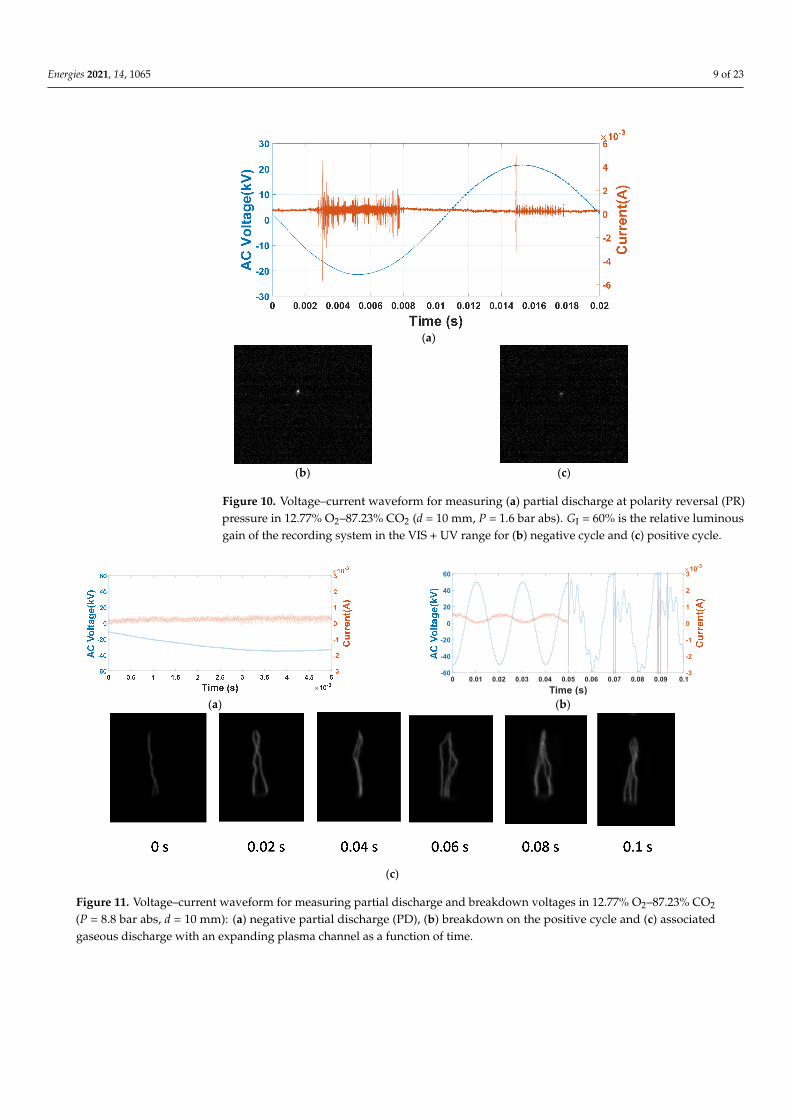
Figure 10. Voltage–current waveform for measuring (a) partial discharge at polarity reversal (PR)pressure in 12.77% O2–87.23% CO2 (d = 10 mm, P = 1.6 bar abs). GI = 60% is the relative luminousgain of the recording system in the VIS + UV range for (b) negative cycle and (c) positive cycle.
Energies 2021, 14, x FOR PEER REVIEW 10 of 24
(a) (b)
(c)
Figure 11. Voltage–current waveform for measuring partial discharge and breakdown voltages in 12.77% O2–87.23% CO2 (P = 8.8 bar abs, d = 10 mm): (a) negative partial discharge (PD), (b) breakdown on the positive cycle and (c) associated gaseous discharge with an expanding plasma channel as a function of time.
Figure 12. Negative-inception electric field in the visible +ultraviolet light as a function of gas pres-sure,12.77% O2–87.23% CO2 vs. CO2 vs. N2 (d = 10 mm, GI = 60% is the relative luminous gain of the image recording system).
3.2. C4F7N Gas Based C4F7N or NovecTM 4710 was combined with a simple dilution natural gas/gas mixture
(CO2, O2 and/or N2). For quasi-homogeneous and divergent electric field distributions, the dielectric strength of the 20% C4F7N/80% CO2 mixture was equivalent to that of pure SF6 at equivalent pressure [7,8]. In practical applications, a reduction in the concentration of C4F7N was required to enable an increase in the filling pressure of the apparatus without liquefaction. Figure 13 summarizes the measured negative and the positive-inception and
0 0.01 0.02 0.03 0.04 0.05 0.06 0.07 0.08 0.09 0.1Time (s)
-60
-40
-20
0
20
40
60
-3
-2
-1
0
1
2
310-3
0
20
40
60
80
100
120
0 2 4 6 8 10
E max
(kV/
mm
)
Pressure (bar abs)
12.77%O2–87.23%CO2 CO2 N2
Figure 11. Voltage–current waveform for measuring partial discharge and breakdown voltages in 12.77% O2–87.23% CO2
(P = 8.8 bar abs, d = 10 mm): (a) negative partial discharge (PD), (b) breakdown on the positive cycle and (c) associatedgaseous discharge with an expanding plasma channel as a function of time.
Energies 2021, 14, 1065 10 of 23
Energies 2021, 14, x FOR PEER REVIEW 10 of 24
(a) (b)
(c)
Figure 11. Voltage–current waveform for measuring partial discharge and breakdown voltages in 12.77% O2–87.23% CO2 (P = 8.8 bar abs, d = 10 mm): (a) negative partial discharge (PD), (b) breakdown on the positive cycle and (c) associated gaseous discharge with an expanding plasma channel as a function of time.
Figure 12. Negative-inception electric field in the visible +ultraviolet light as a function of gas pres-sure,12.77% O2–87.23% CO2 vs. CO2 vs. N2 (d = 10 mm, GI = 60% is the relative luminous gain of the image recording system).
3.2. C4F7N Gas Based C4F7N or NovecTM 4710 was combined with a simple dilution natural gas/gas mixture
(CO2, O2 and/or N2). For quasi-homogeneous and divergent electric field distributions, the dielectric strength of the 20% C4F7N/80% CO2 mixture was equivalent to that of pure SF6 at equivalent pressure [7,8]. In practical applications, a reduction in the concentration of C4F7N was required to enable an increase in the filling pressure of the apparatus without liquefaction. Figure 13 summarizes the measured negative and the positive-inception and
0 0.01 0.02 0.03 0.04 0.05 0.06 0.07 0.08 0.09 0.1Time (s)
-60
-40
-20
0
20
40
60
-3
-2
-1
0
1
2
310-3
0
20
40
60
80
100
120
0 2 4 6 8 10
E max
(kV/
mm
)
Pressure (bar abs)
12.77%O2–87.23%CO2 CO2 N2
Figure 12. Negative-inception electric field in the visible +ultraviolet light as a function of gaspressure,12.77% O2–87.23% CO2 vs. CO2 vs. N2 (d = 10 mm, GI = 60% is the relative luminous gainof the image recording system).
3.2. C4F7N Gas Based
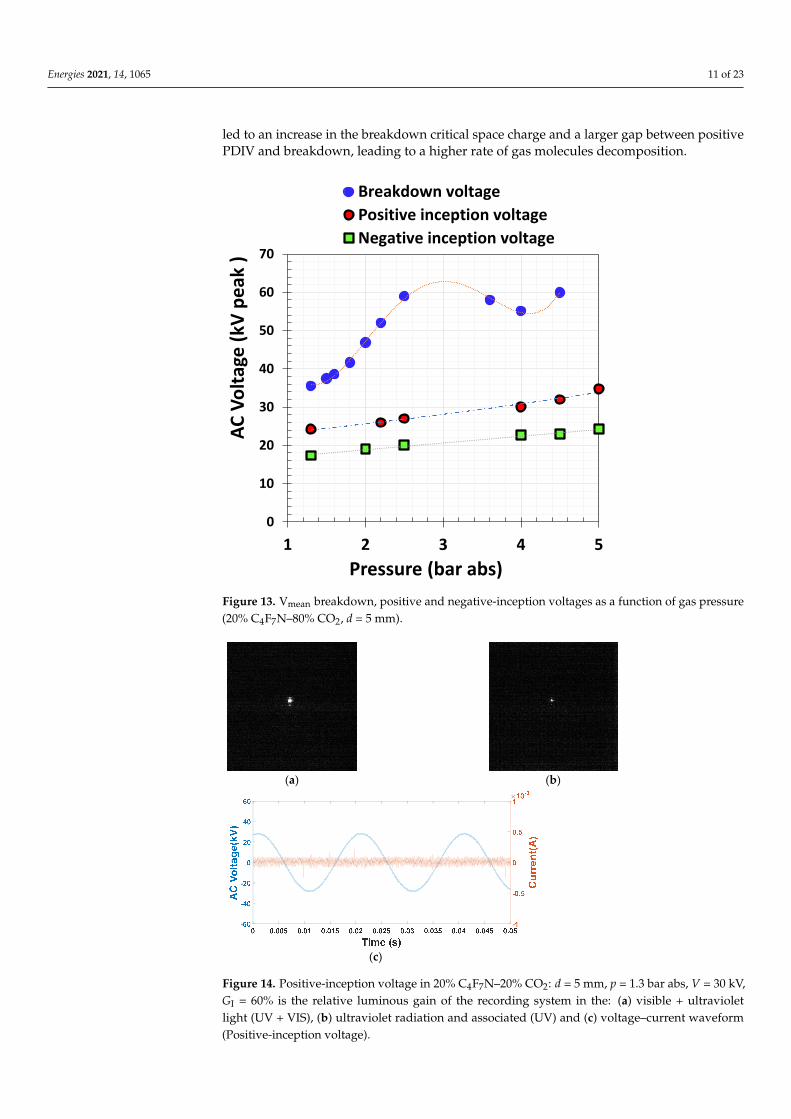
C4F7N or NovecTM 4710 was combined with a simple dilution natural gas/gas mixture(CO2, O2 and/or N2). For quasi-homogeneous and divergent electric field distributions,the dielectric strength of the 20% C4F7N/80% CO2 mixture was equivalent to that of pureSF6 at equivalent pressure [7,8]. In practical applications, a reduction in the concentrationof C4F7N was required to enable an increase in the filling pressure of the apparatus withoutliquefaction. Figure 13 summarizes the measured negative and the positive-inceptionand AC breakdown voltages for 20% C4F7N–80% CO2 at various pressures up to 5 barabs. The negative-inception voltage increased linearly with the increase of gas pressure.The breakdown characteristic of 20% C4F7N–80% CO2 showed a nonlinear behavior overthe gas pressure levels. The breakdown occurred under a negative AC voltage peak forpressure below 1.6 bar abs and on a positive AC voltage peak. The polarity reversal (PR)cross point at 1.6 bar abs corresponded to a positive-inception electric field of 84 kV/mm,calculated according to Equation (1). Below PR, negative and positive PDs were detectableuntil breakdown occurs. An example of negative and positive partial discharge voltage–current characteristics and its emission image (UV vs. UV + VIS) at 1.3 bar abs are shownin Figure 14.
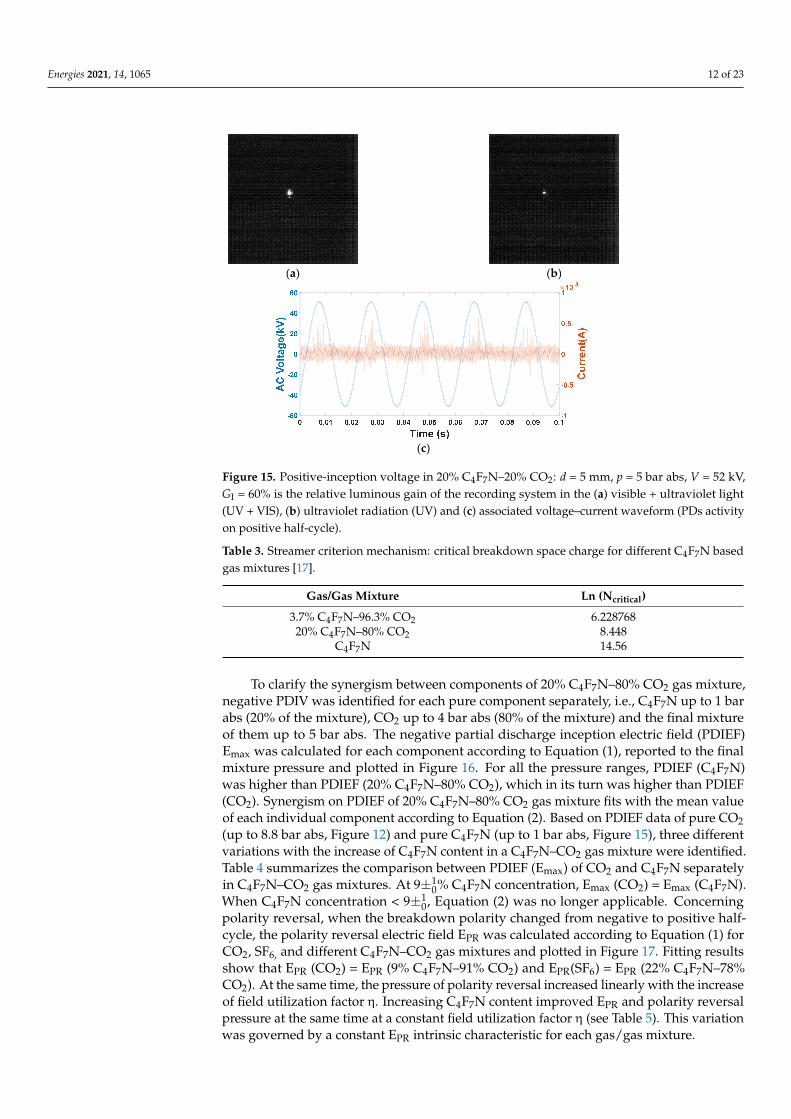
Negative PDIV detection was possible via current measurement (current transformer5-1) and via emission image. For high pressure (5 bar abs), multiple pulses around thepositive cycle peak were detectable before the breakdown (see Figure 15). While negativepartial discharge amplitude decreases with pressure increases, the intensity of positivepartial discharge current increases. Increasing the applied voltage level induced densercurrent activity and consequently increased light emission (see Figures 14a and 15a); inturn, this generated a sufficient critical space charge avalanche to create a discharge. Thepositive glow streamer mode was identified as the breakdown mechanism for compressed20% C4F7N–80% CO2. The findings agreed with previous investigations on a 4% C4F7N–96% CO2 gas mixture [6]. The streamer criterion was proven to fit the breakdown valuesfor different electric field distributions [16]. The critical space charge size was given bythe natural logarithm of the number of electrons Ncritical in the critical avalanche; Table 3summarizes Ln (Ncritical) for different C4F7N based gas mixtures. Increasing C4F7N content
Energies 2021, 14, 1065 11 of 23
led to an increase in the breakdown critical space charge and a larger gap between positivePDIV and breakdown, leading to a higher rate of gas molecules decomposition.
Energies 2021, 14, x FOR PEER REVIEW 12 of 24
same time at a constant field utilization factor η (see Table 5). This variation was governed by a constant EPR intrinsic characteristic for each gas/gas mixture.
( ) ( ) ( )max 4 7 max 2max 4 7 2
C F N - Partial pressure + CO - Partial pressure20%C F N - 80%CO =
2E E
E (2)
Table 4. Negative partial discharge inception electric field (PDIEF) (Emax) comparison between CO2 and C4F7N as a function of component concentration.
Case C4F7N/CO2 Gas Mixture
% C4F7N % CO2 Emax (CO2) > Emax (C4F7N) <9± >91± Emax (CO2) = Emax (C4F7N) 9± 91± Emax (CO2) < Emax (C4F7N) >9± <91±
Table 5. Polarity reversal electric field EPR according to Equation (1) (current work).
Gas/Gas Mixture EPR (kV/mm) Pressure (bar abs) η 20% C4F7N–80% CO2 84 1.6 0.0385 4% C4F7N–96% CO2 50 0.7 0.0385
Figure 13. Vmean breakdown, positive and negative-inception voltages as a function of gas pressure (20% C4F7N–80% CO2, d = 5 mm).
0
10
20
30
40
50
60
70
1 2 3 4 5
AC V
olta
ge (k
V pe
ak )
Pressure (bar abs)
Breakdown voltagePositive inception voltageNegative inception voltage
Figure 13. Vmean breakdown, positive and negative-inception voltages as a function of gas pressure(20% C4F7N–80% CO2, d = 5 mm).
Energies 2021, 14, x FOR PEER REVIEW 13 of 24
(a) (b)
(c)
Figure 14. Positive-inception voltage in 20% C4F7N–20% CO2: d = 5 mm, p = 1.3 bar abs, V = 30 kV, GI = 60% is the relative luminous gain of the recording system in the: (a) visible + ultraviolet light (UV + VIS), (b) ultraviolet radiation and associated (UV) and (c) voltage–current waveform (Posi-tive-inception voltage).
(a) (b)
(c)
Figure 15. Positive-inception voltage in 20% C4F7N–20% CO2: d = 5 mm, p = 5 bar abs, V = 52 kV, GI = 60% is the relative luminous gain of the recording system in the (a) visible + ultraviolet light (UV + VIS), (b) ultraviolet radiation (UV) and (c) associated voltage–current waveform (PDs activity on positive half-cycle).
Figure 14. Positive-inception voltage in 20% C4F7N–20% CO2: d = 5 mm, p = 1.3 bar abs, V = 30 kV,GI = 60% is the relative luminous gain of the recording system in the: (a) visible + ultravioletlight (UV + VIS), (b) ultraviolet radiation and associated (UV) and (c) voltage–current waveform(Positive-inception voltage).
Energies 2021, 14, 1065 12 of 23
Energies 2021, 14, x FOR PEER REVIEW 13 of 24
(a) (b)
(c)
Figure 14. Positive-inception voltage in 20% C4F7N–20% CO2: d = 5 mm, p = 1.3 bar abs, V = 30 kV, GI = 60% is the relative luminous gain of the recording system in the: (a) visible + ultraviolet light (UV + VIS), (b) ultraviolet radiation and associated (UV) and (c) voltage–current waveform (Posi-tive-inception voltage).
(a) (b)
(c)
Figure 15. Positive-inception voltage in 20% C4F7N–20% CO2: d = 5 mm, p = 5 bar abs, V = 52 kV, GI = 60% is the relative luminous gain of the recording system in the (a) visible + ultraviolet light (UV + VIS), (b) ultraviolet radiation (UV) and (c) associated voltage–current waveform (PDs activity on positive half-cycle).
Figure 15. Positive-inception voltage in 20% C4F7N–20% CO2: d = 5 mm, p = 5 bar abs, V = 52 kV,GI = 60% is the relative luminous gain of the recording system in the (a) visible + ultraviolet light(UV + VIS), (b) ultraviolet radiation (UV) and (c) associated voltage–current waveform (PDs activityon positive half-cycle).
Table 3. Streamer criterion mechanism: critical breakdown space charge for different C4F7N basedgas mixtures [17].
Gas/Gas Mixture Ln (Ncritical)
3.7% C4F7N–96.3% CO2 6.22876820% C4F7N–80% CO2 8.448
C4F7N 14.56
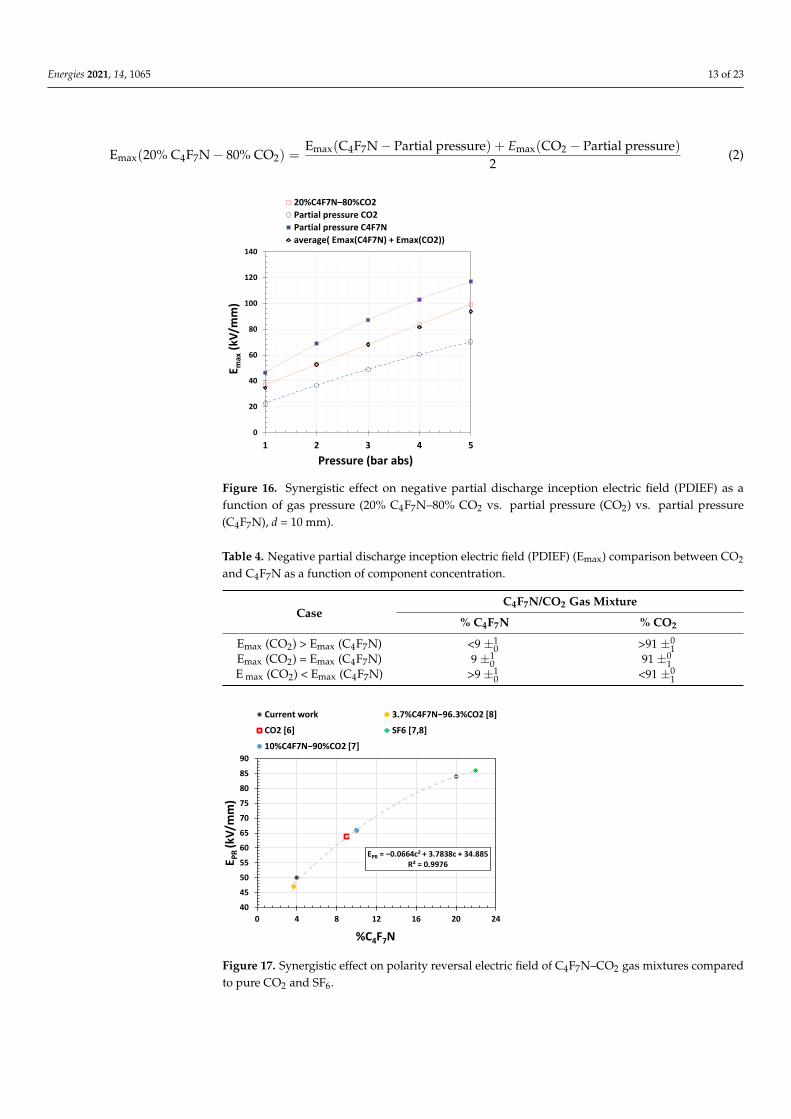
To clarify the synergism between components of 20% C4F7N–80% CO2 gas mixture,negative PDIV was identified for each pure component separately, i.e., C4F7N up to 1 barabs (20% of the mixture), CO2 up to 4 bar abs (80% of the mixture) and the final mixtureof them up to 5 bar abs. The negative partial discharge inception electric field (PDIEF)Emax was calculated for each component according to Equation (1), reported to the finalmixture pressure and plotted in Figure 16. For all the pressure ranges, PDIEF (C4F7N)was higher than PDIEF (20% C4F7N–80% CO2), which in its turn was higher than PDIEF(CO2). Synergism on PDIEF of 20% C4F7N–80% CO2 gas mixture fits with the mean valueof each individual component according to Equation (2). Based on PDIEF data of pure CO2(up to 8.8 bar abs, Figure 12) and pure C4F7N (up to 1 bar abs, Figure 15), three differentvariations with the increase of C4F7N content in a C4F7N–CO2 gas mixture were identified.Table 4 summarizes the comparison between PDIEF (Emax) of CO2 and C4F7N separatelyin C4F7N–CO2 gas mixtures. At 9±1
0% C4F7N concentration, Emax (CO2) = Emax (C4F7N).When C4F7N concentration < 9±1
0, Equation (2) was no longer applicable. Concerningpolarity reversal, when the breakdown polarity changed from negative to positive half-cycle, the polarity reversal electric field EPR was calculated according to Equation (1) forCO2, SF6, and different C4F7N–CO2 gas mixtures and plotted in Figure 17. Fitting resultsshow that EPR (CO2) = EPR (9% C4F7N–91% CO2) and EPR(SF6) = EPR (22% C4F7N–78%CO2). At the same time, the pressure of polarity reversal increased linearly with the increaseof field utilization factor η. Increasing C4F7N content improved EPR and polarity reversalpressure at the same time at a constant field utilization factor η (see Table 5). This variationwas governed by a constant EPR intrinsic characteristic for each gas/gas mixture.
Energies 2021, 14, 1065 13 of 23
Emax(20% C4F7N − 80% CO2) =Emax(C4F7N − Partial pressure) + Emax(CO2 − Partial pressure)
2(2)
Energies 2021, 14, x FOR PEER REVIEW 14 of 24
Figure 16. Synergistic effect on negative partial discharge inception electric field (PDIEF) as a func-tion of gas pressure (20% C4F7N–80% CO2 vs. partial pressure (CO2) vs. partial pressure (C4F7N), d = 10 mm).
Figure 17. Synergistic effect on polarity reversal electric field of C4F7N–CO2 gas mixtures com-pared to pure CO2 and SF6.
3.3. C5F10O Gas Based The vaporization of C5F10O or Novec TM 5110 was obtained above 26.9 °C. C5F10O
could only be used as an additive at a pressure below the saturated vapor pressure and could not be used in a pure state for insulation applications where the minimum operating temperature of an HV apparatus may drop to −25 °C or below. A mixture with a low concentration of a C5F10O (4–6%) and a buffer gas (O2/N2/CO2) resulted in an improvement of the dielectric strength [9].
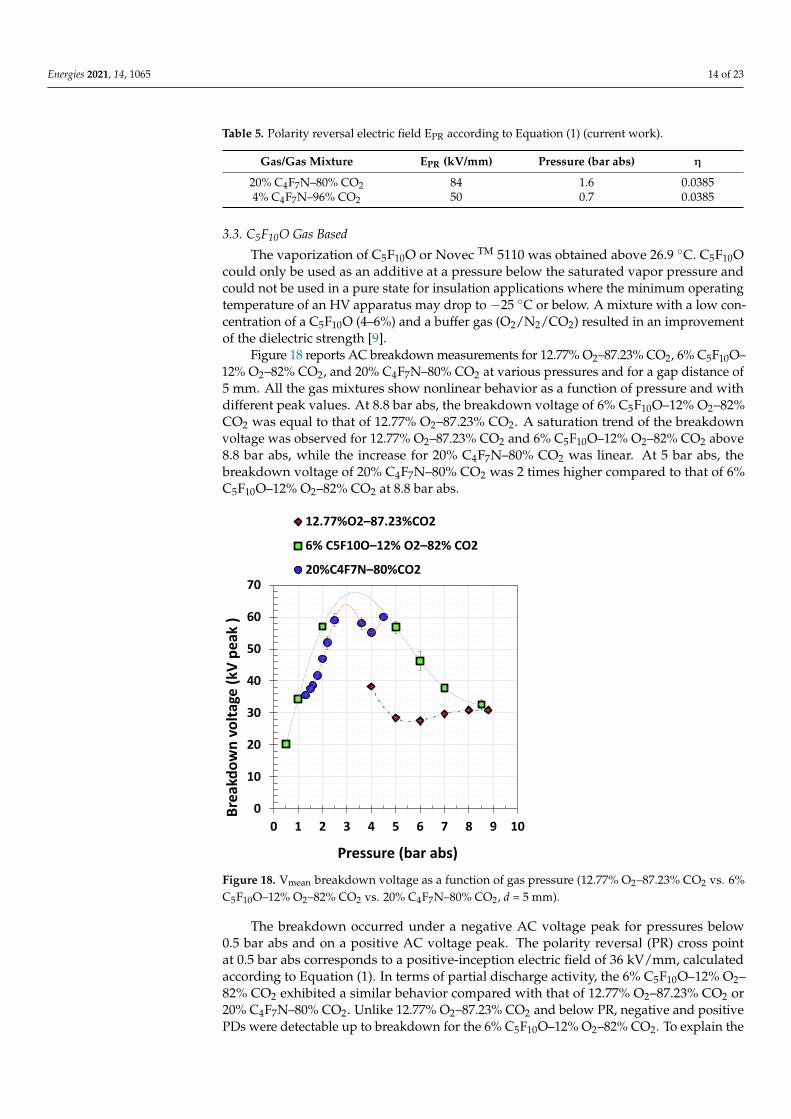
Figure 18 reports AC breakdown measurements for 12.77% O2–87.23% CO2, 6% C5F10O–12% O2–82% CO2, and 20% C4F7N–80% CO2 at various pressures and for a gap distance of 5 mm. All the gas mixtures show nonlinear behavior as a function of pressure and with different peak values. At 8.8 bar abs, the breakdown voltage of 6% C5F10O–12% O2–82% CO2 was equal to that of 12.77% O2–87.23% CO2. A saturation trend of the break-down voltage was observed for 12.77% O2–87.23% CO2 and 6% C5F10O–12% O2–82% CO2 above 8.8 bar abs, while the increase for 20% C4F7N–80% CO2 was linear. At 5 bar abs, the breakdown voltage of 20% C4F7N–80% CO2 was 2 times higher compared to that of 6% C5F10O–12% O2–82% CO2 at 8.8 bar abs.
0
20
40
60
80
100
120
140
1 2 3 4 5
E max
(kV/
mm
)
Pressure (bar abs)
20%C4F7N–80%CO2Partial pressure CO2Partial pressure C4F7Naverage( Emax(C4F7N) + Emax(CO2))
EPR = −0.0664c2 + 3.7838c + 34.885R² = 0.9976
4045505560657075808590
0 4 8 12 16 20 24
E PR
(kV/
mm
)
%C4F7N
Current work 3.7%C4F7N−96.3%CO2 [8]CO2 [6] SF6 [7,8]10%C4F7N−90%CO2 [7]
Figure 16. Synergistic effect on negative partial discharge inception electric field (PDIEF) as afunction of gas pressure (20% C4F7N–80% CO2 vs. partial pressure (CO2) vs. partial pressure(C4F7N), d = 10 mm).
Table 4. Negative partial discharge inception electric field (PDIEF) (Emax) comparison between CO2
and C4F7N as a function of component concentration.
CaseC4F7N/CO2 Gas Mixture
% C4F7N % CO2
Emax (CO2) > Emax (C4F7N) <9 ±10 >91 ±0
1Emax (CO2) = Emax (C4F7N) 9 ±1
0 91 ±01
E max (CO2) < Emax (C4F7N) >9 ±10 <91 ±0
1
Energies 2021, 14, x FOR PEER REVIEW 14 of 24
Figure 16. Synergistic effect on negative partial discharge inception electric field (PDIEF) as a func-tion of gas pressure (20% C4F7N–80% CO2 vs. partial pressure (CO2) vs. partial pressure (C4F7N), d = 10 mm).
Figure 17. Synergistic effect on polarity reversal electric field of C4F7N–CO2 gas mixtures com-pared to pure CO2 and SF6.
3.3. C5F10O Gas Based The vaporization of C5F10O or Novec TM 5110 was obtained above 26.9 °C. C5F10O
could only be used as an additive at a pressure below the saturated vapor pressure and could not be used in a pure state for insulation applications where the minimum operating temperature of an HV apparatus may drop to −25 °C or below. A mixture with a low concentration of a C5F10O (4–6%) and a buffer gas (O2/N2/CO2) resulted in an improvement of the dielectric strength [9].
Figure 18 reports AC breakdown measurements for 12.77% O2–87.23% CO2, 6% C5F10O–12% O2–82% CO2, and 20% C4F7N–80% CO2 at various pressures and for a gap distance of 5 mm. All the gas mixtures show nonlinear behavior as a function of pressure and with different peak values. At 8.8 bar abs, the breakdown voltage of 6% C5F10O–12% O2–82% CO2 was equal to that of 12.77% O2–87.23% CO2. A saturation trend of the break-down voltage was observed for 12.77% O2–87.23% CO2 and 6% C5F10O–12% O2–82% CO2 above 8.8 bar abs, while the increase for 20% C4F7N–80% CO2 was linear. At 5 bar abs, the breakdown voltage of 20% C4F7N–80% CO2 was 2 times higher compared to that of 6% C5F10O–12% O2–82% CO2 at 8.8 bar abs.
0
20
40
60
80
100
120
140
1 2 3 4 5
E max
(kV/
mm
)
Pressure (bar abs)
20%C4F7N–80%CO2Partial pressure CO2Partial pressure C4F7Naverage( Emax(C4F7N) + Emax(CO2))
EPR = −0.0664c2 + 3.7838c + 34.885R² = 0.9976
4045505560657075808590
0 4 8 12 16 20 24
E PR
(kV/
mm
)
%C4F7N
Current work 3.7%C4F7N−96.3%CO2 [8]CO2 [6] SF6 [7,8]10%C4F7N−90%CO2 [7]
Figure 17. Synergistic effect on polarity reversal electric field of C4F7N–CO2 gas mixtures comparedto pure CO2 and SF6.
Energies 2021, 14, 1065 14 of 23
Table 5. Polarity reversal electric field EPR according to Equation (1) (current work).
Gas/Gas Mixture EPR (kV/mm) Pressure (bar abs) η
20% C4F7N–80% CO2 84 1.6 0.03854% C4F7N–96% CO2 50 0.7 0.0385
3.3. C5F10O Gas Based
The vaporization of C5F10O or Novec TM 5110 was obtained above 26.9 ◦C. C5F10Ocould only be used as an additive at a pressure below the saturated vapor pressure andcould not be used in a pure state for insulation applications where the minimum operatingtemperature of an HV apparatus may drop to −25 ◦C or below. A mixture with a low con-centration of a C5F10O (4–6%) and a buffer gas (O2/N2/CO2) resulted in an improvementof the dielectric strength [9].
Figure 18 reports AC breakdown measurements for 12.77% O2–87.23% CO2, 6% C5F10O–12% O2–82% CO2, and 20% C4F7N–80% CO2 at various pressures and for a gap distance of5 mm. All the gas mixtures show nonlinear behavior as a function of pressure and withdifferent peak values. At 8.8 bar abs, the breakdown voltage of 6% C5F10O–12% O2–82%CO2 was equal to that of 12.77% O2–87.23% CO2. A saturation trend of the breakdownvoltage was observed for 12.77% O2–87.23% CO2 and 6% C5F10O–12% O2–82% CO2 above8.8 bar abs, while the increase for 20% C4F7N–80% CO2 was linear. At 5 bar abs, thebreakdown voltage of 20% C4F7N–80% CO2 was 2 times higher compared to that of 6%C5F10O–12% O2–82% CO2 at 8.8 bar abs.
Energies 2021, 14, x FOR PEER REVIEW 15 of 24
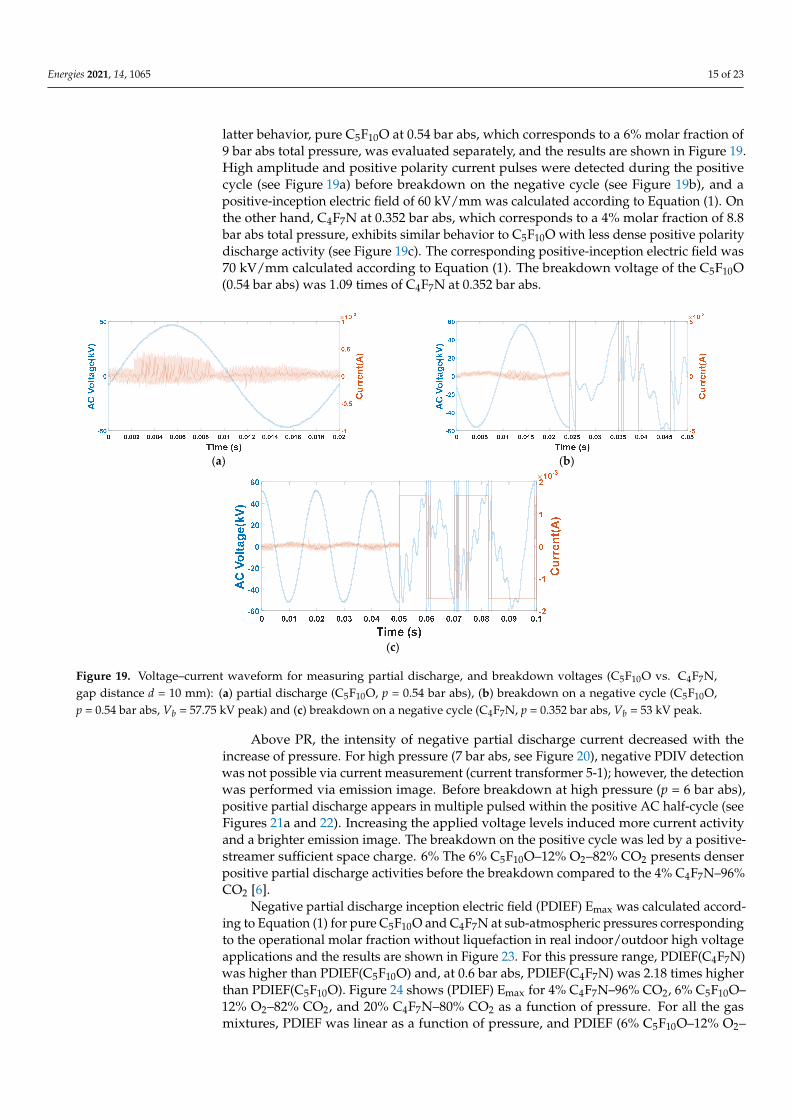
The breakdown occurred under a negative AC voltage peak for pressures below 0.5 bar abs and on a positive AC voltage peak. The polarity reversal (PR) cross point at 0.5 bar abs corresponds to a positive-inception electric field of 36 kV/mm, calculated accord-ing to Equation (1). In terms of partial discharge activity, the 6% C5F10O–12% O2–82% CO2 exhibited a similar behavior compared with that of 12.77% O2–87.23% CO2 or 20% C4F7N–80% CO2. Unlike 12.77% O2–87.23% CO2 and below PR, negative and positive PDs were detectable up to breakdown for the 6% C5F10O–12% O2–82% CO2. To explain the latter behavior, pure C5F10O at 0.54 bar abs, which corresponds to a 6% molar fraction of 9 bar abs total pressure, was evaluated separately, and the results are shown in Figure 19. High amplitude and positive polarity current pulses were detected during the positive cycle (see Figure 19a) before breakdown on the negative cycle (see Figure 19b), and a positive-inception electric field of 60 kV/mm was calculated according to Equation (1). On the other hand, C4F7N at 0.352 bar abs, which corresponds to a 4% molar fraction of 8.8 bar abs total pressure, exhibits similar behavior to C5F10O with less dense positive polarity discharge activity (see Figure 19c). The corresponding positive-inception electric field was 70 kV/mm calculated according to Equation (1). The breakdown voltage of the C5F10O (0.54 bar abs) was 1.09 times of C4F7N at 0.352 bar abs.
Above PR, the intensity of negative partial discharge current decreased with the in-crease of pressure. For high pressure (7 bar abs, see Figure 20), negative PDIV detection was not possible via current measurement (current transformer 5-1); however, the detec-tion was performed via emission image. Before breakdown at high pressure (p = 6 bar abs), positive partial discharge appears in multiple pulsed within the positive AC half-cycle (see Figure 21a and Figure 22). Increasing the applied voltage levels induced more current activity and a brighter emission image. The breakdown on the positive cycle was led by a positive-streamer sufficient space charge. 6% The 6% C5F10O–12% O2–82% CO2 presents denser positive partial discharge activities before the breakdown compared to the 4% C4F7N–96% CO2 [6].
Figure 18. Vmean breakdown voltage as a function of gas pressure (12.77% O2–87.23% CO2 vs. 6% C5F10O–12% O2–82% CO2 vs. 20% C4F7N–80% CO2, d = 5 mm).
0
10
20
30
40
50
60
70
0 1 2 3 4 5 6 7 8 9 10
Brea
kdow
n vo
ltage
(kV
peak
)
Pressure (bar abs)
12.77%O2–87.23%CO2
6% C5F10O–12% O2–82% CO2
20%C4F7N–80%CO2
Figure 18. Vmean breakdown voltage as a function of gas pressure (12.77% O2–87.23% CO2 vs. 6%C5F10O–12% O2–82% CO2 vs. 20% C4F7N–80% CO2, d = 5 mm).
The breakdown occurred under a negative AC voltage peak for pressures below0.5 bar abs and on a positive AC voltage peak. The polarity reversal (PR) cross pointat 0.5 bar abs corresponds to a positive-inception electric field of 36 kV/mm, calculatedaccording to Equation (1). In terms of partial discharge activity, the 6% C5F10O–12% O2–82% CO2 exhibited a similar behavior compared with that of 12.77% O2–87.23% CO2 or20% C4F7N–80% CO2. Unlike 12.77% O2–87.23% CO2 and below PR, negative and positivePDs were detectable up to breakdown for the 6% C5F10O–12% O2–82% CO2. To explain the
Energies 2021, 14, 1065 15 of 23
latter behavior, pure C5F10O at 0.54 bar abs, which corresponds to a 6% molar fraction of9 bar abs total pressure, was evaluated separately, and the results are shown in Figure 19.High amplitude and positive polarity current pulses were detected during the positivecycle (see Figure 19a) before breakdown on the negative cycle (see Figure 19b), and apositive-inception electric field of 60 kV/mm was calculated according to Equation (1). Onthe other hand, C4F7N at 0.352 bar abs, which corresponds to a 4% molar fraction of 8.8bar abs total pressure, exhibits similar behavior to C5F10O with less dense positive polaritydischarge activity (see Figure 19c). The corresponding positive-inception electric field was70 kV/mm calculated according to Equation (1). The breakdown voltage of the C5F10O(0.54 bar abs) was 1.09 times of C4F7N at 0.352 bar abs.
Energies 2021, 14, x FOR PEER REVIEW 16 of 24
(a) (b)
(c)
Figure 19. Voltage–current waveform for measuring partial discharge, and breakdown voltages (C5F10O vs. C4F7N, gap distance d= 10 mm): (a) partial discharge (C5F10O, p = 0.54 bar abs), (b) breakdown on a negative cycle (C5F10O, p = 0.54 bar abs, Vb = 57.75 kV peak) and (c) breakdown on a negative cycle (C4F7N, p = 0.352 bar abs, Vb = 53 kV peak.
(a) (b)
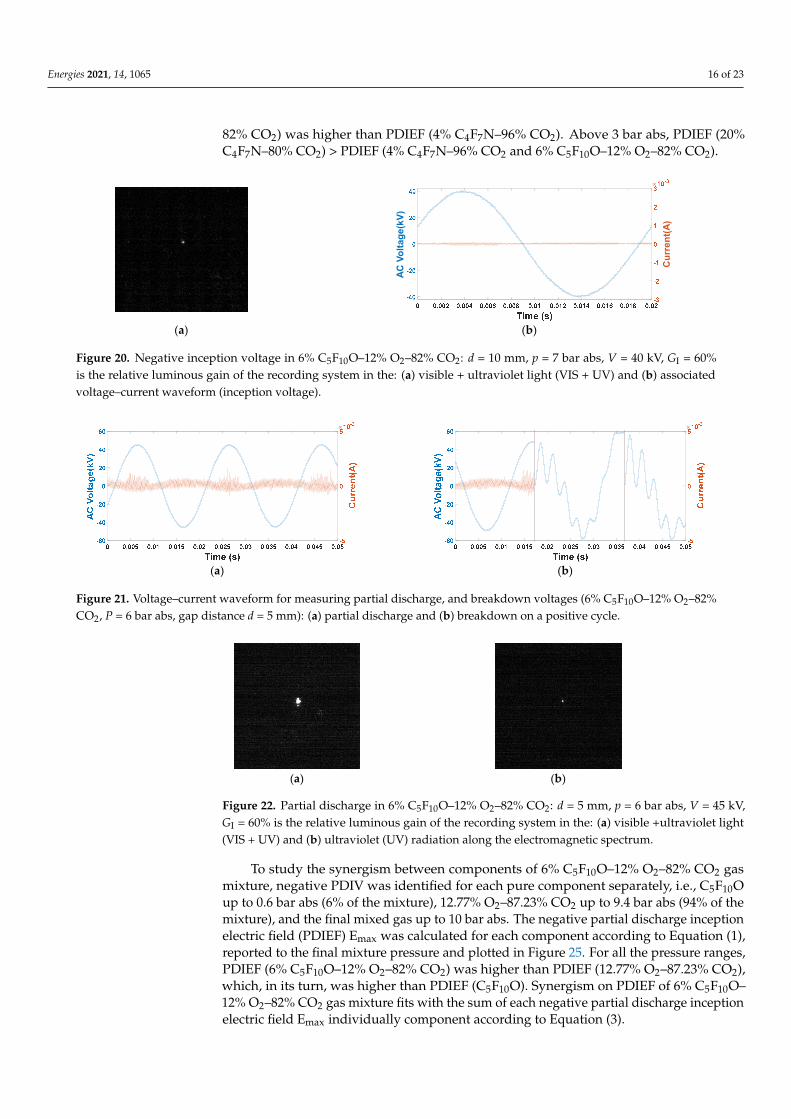
Figure 20. Negative inception voltage in 6% C5F10O–12% O2–82% CO2: d = 10 mm, p = 7 bar abs, V = 40 kV, GI = 60% is the relative luminous gain of the recording system in the: (a) visible + ultraviolet light (VIS + UV) and (b) associated voltage–current waveform (inception voltage).
(a) (b)
Figure 21. Voltage–current waveform for measuring partial discharge, and breakdown voltages (6% C5F10O–12% O2–82% CO2, P = 6 bar abs, gap distance d = 5 mm): (a) partial discharge and (b) breakdown on a positive cycle.
AC V
olta
ge(k
V)
Cur
rent
(A)
Figure 19. Voltage–current waveform for measuring partial discharge, and breakdown voltages (C5F10O vs. C4F7N,gap distance d = 10 mm): (a) partial discharge (C5F10O, p = 0.54 bar abs), (b) breakdown on a negative cycle (C5F10O,p = 0.54 bar abs, Vb = 57.75 kV peak) and (c) breakdown on a negative cycle (C4F7N, p = 0.352 bar abs, Vb = 53 kV peak.
Above PR, the intensity of negative partial discharge current decreased with theincrease of pressure. For high pressure (7 bar abs, see Figure 20), negative PDIV detectionwas not possible via current measurement (current transformer 5-1); however, the detectionwas performed via emission image. Before breakdown at high pressure (p = 6 bar abs),positive partial discharge appears in multiple pulsed within the positive AC half-cycle (seeFigures 21a and 22). Increasing the applied voltage levels induced more current activityand a brighter emission image. The breakdown on the positive cycle was led by a positive-streamer sufficient space charge. 6% The 6% C5F10O–12% O2–82% CO2 presents denserpositive partial discharge activities before the breakdown compared to the 4% C4F7N–96%CO2 [6].
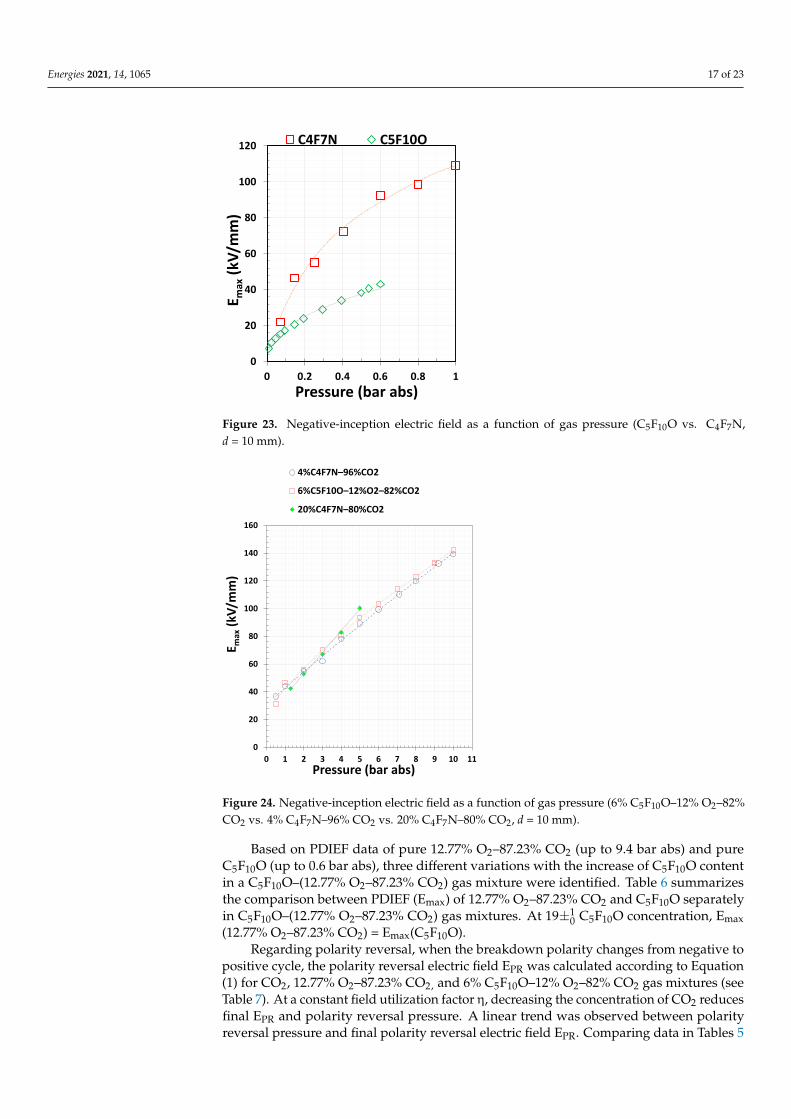
Negative partial discharge inception electric field (PDIEF) Emax was calculated accord-ing to Equation (1) for pure C5F10O and C4F7N at sub-atmospheric pressures correspondingto the operational molar fraction without liquefaction in real indoor/outdoor high voltageapplications and the results are shown in Figure 23. For this pressure range, PDIEF(C4F7N)was higher than PDIEF(C5F10O) and, at 0.6 bar abs, PDIEF(C4F7N) was 2.18 times higherthan PDIEF(C5F10O). Figure 24 shows (PDIEF) Emax for 4% C4F7N–96% CO2, 6% C5F10O–12% O2–82% CO2, and 20% C4F7N–80% CO2 as a function of pressure. For all the gasmixtures, PDIEF was linear as a function of pressure, and PDIEF (6% C5F10O–12% O2–
Energies 2021, 14, 1065 16 of 23
82% CO2) was higher than PDIEF (4% C4F7N–96% CO2). Above 3 bar abs, PDIEF (20%C4F7N–80% CO2) > PDIEF (4% C4F7N–96% CO2 and 6% C5F10O–12% O2–82% CO2).
Energies 2021, 14, x FOR PEER REVIEW 16 of 24
(a) (b)
(c)
Figure 19. Voltage–current waveform for measuring partial discharge, and breakdown voltages (C5F10O vs. C4F7N, gap distance d= 10 mm): (a) partial discharge (C5F10O, p = 0.54 bar abs), (b) breakdown on a negative cycle (C5F10O, p = 0.54 bar abs, Vb = 57.75 kV peak) and (c) breakdown on a negative cycle (C4F7N, p = 0.352 bar abs, Vb = 53 kV peak.
(a) (b)
Figure 20. Negative inception voltage in 6% C5F10O–12% O2–82% CO2: d = 10 mm, p = 7 bar abs, V = 40 kV, GI = 60% is the relative luminous gain of the recording system in the: (a) visible + ultraviolet light (VIS + UV) and (b) associated voltage–current waveform (inception voltage).
(a) (b)
Figure 21. Voltage–current waveform for measuring partial discharge, and breakdown voltages (6% C5F10O–12% O2–82% CO2, P = 6 bar abs, gap distance d = 5 mm): (a) partial discharge and (b) breakdown on a positive cycle.
AC V
olta
ge(k
V)
Cur
rent
(A)
Figure 20. Negative inception voltage in 6% C5F10O–12% O2–82% CO2: d = 10 mm, p = 7 bar abs, V = 40 kV, GI = 60%is the relative luminous gain of the recording system in the: (a) visible + ultraviolet light (VIS + UV) and (b) associatedvoltage–current waveform (inception voltage).
Energies 2021, 14, x FOR PEER REVIEW 16 of 24
(a) (b)
(c)
Figure 19. Voltage–current waveform for measuring partial discharge, and breakdown voltages (C5F10O vs. C4F7N, gap distance d= 10 mm): (a) partial discharge (C5F10O, p = 0.54 bar abs), (b) breakdown on a negative cycle (C5F10O, p = 0.54 bar abs, Vb = 57.75 kV peak) and (c) breakdown on a negative cycle (C4F7N, p = 0.352 bar abs, Vb = 53 kV peak.
(a) (b)
Figure 20. Negative inception voltage in 6% C5F10O–12% O2–82% CO2: d = 10 mm, p = 7 bar abs, V = 40 kV, GI = 60% is the relative luminous gain of the recording system in the: (a) visible + ultraviolet light (VIS + UV) and (b) associated voltage–current waveform (inception voltage).
(a) (b)
Figure 21. Voltage–current waveform for measuring partial discharge, and breakdown voltages (6% C5F10O–12% O2–82% CO2, P = 6 bar abs, gap distance d = 5 mm): (a) partial discharge and (b) breakdown on a positive cycle.
AC V
olta
ge(k
V)
Cur
rent
(A)
Figure 21. Voltage–current waveform for measuring partial discharge, and breakdown voltages (6% C5F10O–12% O2–82%CO2, P = 6 bar abs, gap distance d = 5 mm): (a) partial discharge and (b) breakdown on a positive cycle.
Energies 2021, 14, x FOR PEER REVIEW 17 of 24
(a) (b)
Figure 22. Partial discharge in 6% C5F10O–12% O2–82% CO2: d = 5 mm, p = 6 bar abs, V = 45 kV, GI = 60% is the relative luminous gain of the recording system in the: (a) visible +ultraviolet light (VIS + UV) and (b) ultraviolet (UV) radiation along the electromagnetic spectrum.
Negative partial discharge inception electric field (PDIEF) Emax was calculated ac-cording to Equation (1) for pure C5F10O and C4F7N at sub-atmospheric pressures corre-sponding to the operational molar fraction without liquefaction in real indoor/outdoor high voltage applications and the results are shown in Figure 23. For this pressure range, PDIEF(C4F7N) was higher than PDIEF(C5F10O) and, at 0.6 bar abs, PDIEF(C4F7N) was 2.18 times higher than PDIEF(C5F10O). Figure 24 shows (PDIEF) Emax for 4% C4F7N–96% CO2, 6% C5F10O–12% O2–82% CO2, and 20% C4F7N–80% CO2 as a function of pressure. For all the gas mixtures, PDIEF was linear as a function of pressure, and PDIEF (6% C5F10O–12% O2–82% CO2) was higher than PDIEF (4% C4F7N–96% CO2). Above 3 bar abs, PDIEF (20% C4F7N–80% CO2)> PDIEF (4% C4F7N–96% CO2 and 6% C5F10O–12% O2–82% CO2).
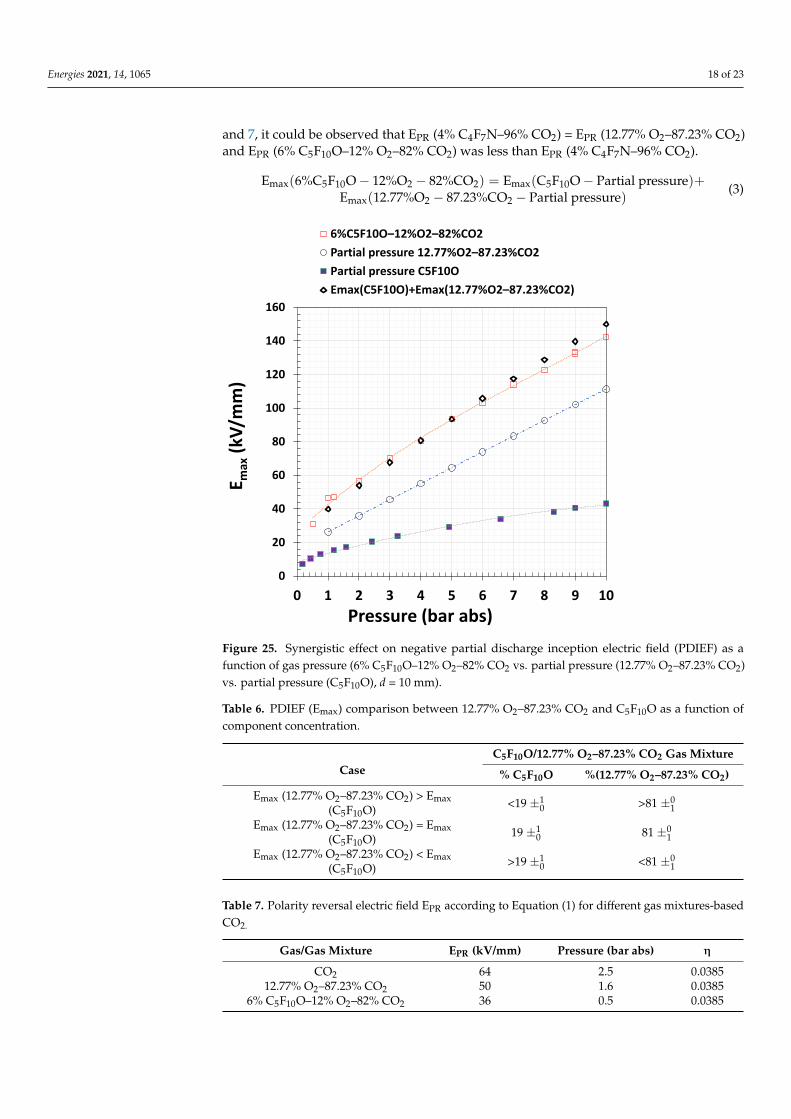
To study the synergism between components of 6% C5F10O–12% O2–82% CO2 gas mixture, negative PDIV was identified for each pure component separately, i.e., C5F10O up to 0.6 bar abs (6% of the mixture), 12.77% O2–87.23% CO2 up to 9.4 bar abs (94% of the mixture), and the final mixed gas up to 10 bar abs. The negative partial discharge inception electric field (PDIEF) Emax was calculated for each component according to Equation (1), reported to the final mixture pressure and plotted in Figure 25. For all the pressure ranges, PDIEF (6% C5F10O–12% O2–82% CO2) was higher than PDIEF (12.77% O2–87.23% CO2), which, in its turn, was higher than PDIEF (C5F10O). Synergism on PDIEF of 6% C5F10O–12% O2–82% CO2 gas mixture fits with the sum of each negative partial discharge incep-tion electric field Emax individually component according to Equation (3).
Based on PDIEF data of pure 12.77% O2–87.23% CO2 (up to 9.4 bar abs) and pure C5F10O (up to 0.6 bar abs), three different variations with the increase of C5F10O content in a C5F10O–(12.77% O2–87.23% CO2) gas mixture were identified. Table 6 summarizes the comparison between PDIEF (Emax) of 12.77% O2–87.23% CO2 and C5F10O separately in C5F10O–(12.77% O2–87.23% CO2) gas mixtures. At 19± C5F10O concentration, Emax (12.77% O2–87.23% CO2) = Emax(C5F10O).
Regarding polarity reversal, when the breakdown polarity changes from negative to positive cycle, the polarity reversal electric field EPR was calculated according to Equation (1) for CO2, 12.77% O2–87.23% CO2, and 6% C5F10O–12% O2–82% CO2 gas mixtures (see Table 7). At a constant field utilization factor η, decreasing the concentration of CO2 re-duces final EPR and polarity reversal pressure. A linear trend was observed between po-larity reversal pressure and final polarity reversal electric field EPR. Comparing data in Tables 5 and 7, it could be observed that EPR (4% C4F7N–96% CO2) = EPR (12.77% O2–87.23% CO2) and EPR (6% C5F10O–12% O2–82% CO2) was less than EPR (4% C4F7N–96% CO2).
( ) ( )( )
− − = − +
+ − −max 5 10 2 2 max 5 10
max 2 2
6%C F O 12%O 82%CO C F O Partial pressure
12.77%O 87.23%CO Partial pressure
E E
E (3)
Figure 22. Partial discharge in 6% C5F10O–12% O2–82% CO2: d = 5 mm, p = 6 bar abs, V = 45 kV,GI = 60% is the relative luminous gain of the recording system in the: (a) visible +ultraviolet light(VIS + UV) and (b) ultraviolet (UV) radiation along the electromagnetic spectrum.
To study the synergism between components of 6% C5F10O–12% O2–82% CO2 gasmixture, negative PDIV was identified for each pure component separately, i.e., C5F10Oup to 0.6 bar abs (6% of the mixture), 12.77% O2–87.23% CO2 up to 9.4 bar abs (94% of themixture), and the final mixed gas up to 10 bar abs. The negative partial discharge inceptionelectric field (PDIEF) Emax was calculated for each component according to Equation (1),reported to the final mixture pressure and plotted in Figure 25. For all the pressure ranges,PDIEF (6% C5F10O–12% O2–82% CO2) was higher than PDIEF (12.77% O2–87.23% CO2),which, in its turn, was higher than PDIEF (C5F10O). Synergism on PDIEF of 6% C5F10O–12% O2–82% CO2 gas mixture fits with the sum of each negative partial discharge inceptionelectric field Emax individually component according to Equation (3).
Energies 2021, 14, 1065 17 of 23
Energies 2021, 14, x FOR PEER REVIEW 18 of 24
Table 6. PDIEF (Emax) comparison between 12.77% O2–87.23% CO2 and C5F10O as a function of component concentration.
Case C5F10O/12.77% O2–87.23% CO2 Gas Mixture
% C5F10O %(12.77% O2–87.23% CO2) Emax (12.77% O2–87.23% CO2) > Emax (C5F10O) < 19± > 81± Emax (12.77% O2–87.23% CO2) = Emax (C5F10O) 19± 81± Emax (12.77% O2–87.23% CO2) < Emax (C5F10O) > 19± < 81±
Table 7. Polarity reversal electric field EPR according to Equation (1) for different gas mixtures-based CO2.
Gas/Gas Mixture EPR (kV/mm) Pressure (bar abs) η CO2 64 2.5 0.0385
12.77% O2–87.23% CO2 50 1.6 0.0385 6% C5F10O–12% O2–82% CO2 36 0.5 0.0385
Figure 23. Negative-inception electric field as a function of gas pressure (C5F10O vs. C4F7N, d = 10 mm).
0
20
40
60
80
100
120
0 0.2 0.4 0.6 0.8 1
E max
(kV/
mm
)
Pressure (bar abs)
C4F7N C5F10O
0
20
40
60
80
100
120
140
160
0 1 2 3 4 5 6 7 8 9 10 11
E max
(kV/
mm
)
Pressure (bar abs)
4%C4F7N–96%CO2
6%C5F10O–12%O2–82%CO2
20%C4F7N–80%CO2
Figure 23. Negative-inception electric field as a function of gas pressure (C5F10O vs. C4F7N,d = 10 mm).
Energies 2021, 14, x FOR PEER REVIEW 18 of 24
Table 6. PDIEF (Emax) comparison between 12.77% O2–87.23% CO2 and C5F10O as a function of component concentration.
Case C5F10O/12.77% O2–87.23% CO2 Gas Mixture
% C5F10O %(12.77% O2–87.23% CO2) Emax (12.77% O2–87.23% CO2) > Emax (C5F10O) < 19± > 81± Emax (12.77% O2–87.23% CO2) = Emax (C5F10O) 19± 81± Emax (12.77% O2–87.23% CO2) < Emax (C5F10O) > 19± < 81±
Table 7. Polarity reversal electric field EPR according to Equation (1) for different gas mixtures-based CO2.
Gas/Gas Mixture EPR (kV/mm) Pressure (bar abs) η CO2 64 2.5 0.0385
12.77% O2–87.23% CO2 50 1.6 0.0385 6% C5F10O–12% O2–82% CO2 36 0.5 0.0385
Figure 23. Negative-inception electric field as a function of gas pressure (C5F10O vs. C4F7N, d = 10 mm).
0
20
40
60
80
100
120
0 0.2 0.4 0.6 0.8 1
E max
(kV/
mm
)
Pressure (bar abs)
C4F7N C5F10O
0
20
40
60
80
100
120
140
160
0 1 2 3 4 5 6 7 8 9 10 11
E max
(kV/
mm
)
Pressure (bar abs)
4%C4F7N–96%CO2
6%C5F10O–12%O2–82%CO2
20%C4F7N–80%CO2
Figure 24. Negative-inception electric field as a function of gas pressure (6% C5F10O–12% O2–82%CO2 vs. 4% C4F7N–96% CO2 vs. 20% C4F7N–80% CO2, d = 10 mm).
Based on PDIEF data of pure 12.77% O2–87.23% CO2 (up to 9.4 bar abs) and pureC5F10O (up to 0.6 bar abs), three different variations with the increase of C5F10O contentin a C5F10O–(12.77% O2–87.23% CO2) gas mixture were identified. Table 6 summarizesthe comparison between PDIEF (Emax) of 12.77% O2–87.23% CO2 and C5F10O separatelyin C5F10O–(12.77% O2–87.23% CO2) gas mixtures. At 19±1
0 C5F10O concentration, Emax(12.77% O2–87.23% CO2) = Emax(C5F10O).
Regarding polarity reversal, when the breakdown polarity changes from negative topositive cycle, the polarity reversal electric field EPR was calculated according to Equation(1) for CO2, 12.77% O2–87.23% CO2, and 6% C5F10O–12% O2–82% CO2 gas mixtures (seeTable 7). At a constant field utilization factor η, decreasing the concentration of CO2 reducesfinal EPR and polarity reversal pressure. A linear trend was observed between polarityreversal pressure and final polarity reversal electric field EPR. Comparing data in Tables 5
Energies 2021, 14, 1065 18 of 23
and 7, it could be observed that EPR (4% C4F7N–96% CO2) = EPR (12.77% O2–87.23% CO2)and EPR (6% C5F10O–12% O2–82% CO2) was less than EPR (4% C4F7N–96% CO2).
Emax(6%C5F10O − 12%O2 − 82%CO2) = Emax(C5F10O − Partial pressure)+Emax(12.77%O2 − 87.23%CO2 − Partial pressure)
(3)
Energies 2021, 14, x FOR PEER REVIEW 19 of 24
Figure 24. Negative-inception electric field as a function of gas pressure (6% C5F10O–12% O2–82% CO2 Vs 4% C4F7N–96% CO2 Vs 20% C4F7N–80% CO2, d = 10 mm).
Figure 25. Synergistic effect on negative partial discharge inception electric field (PDIEF) as a func-tion of gas pressure (6% C5F10O–12% O2–82% CO2 Vs partial pressure (12.77% O2–87.23% CO2) Vs partial pressure (C5F10O), d = 10 mm).
4. Discussion Compared to CO2, the addition of O2 (12.77% O2–87.23% CO2) increased the critical
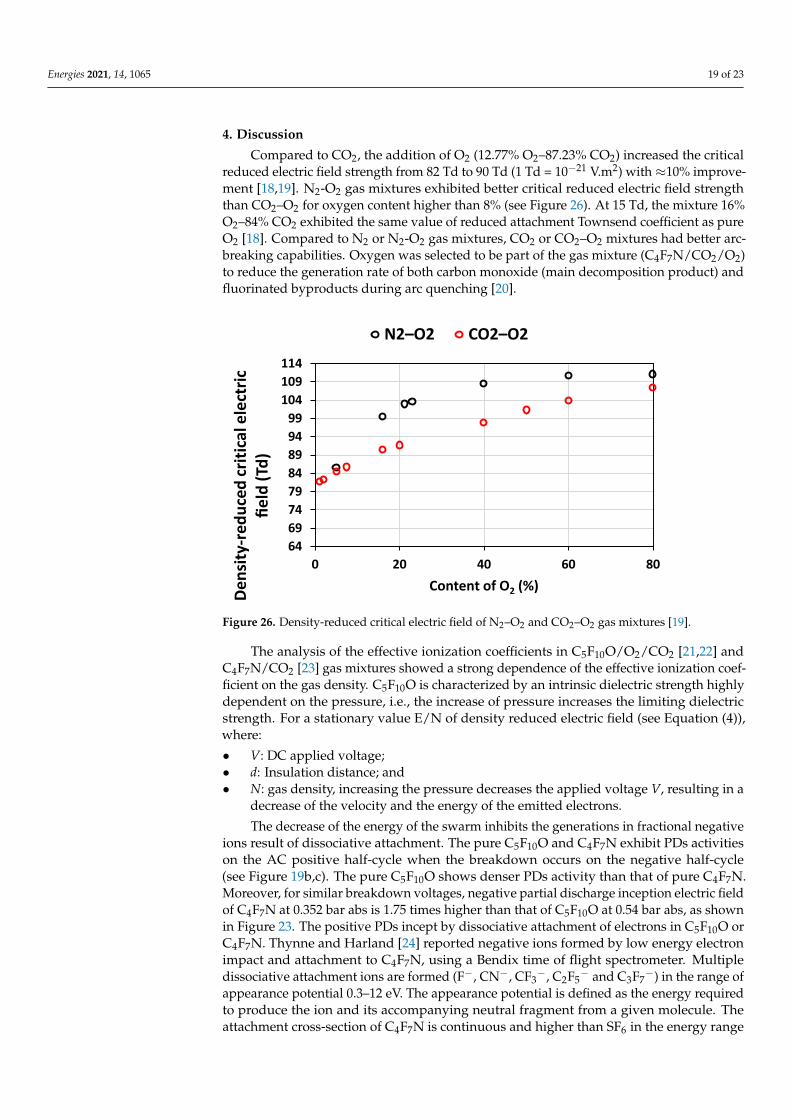
reduced electric field strength from 82 Td to 90 Td (1 Td = 10−21 V.m2) with ≈10% improve-ment [18,19]. N2-O2 gas mixtures exhibited better critical reduced electric field strength than CO2–O2 for oxygen content higher than 8% (see Figure 26). At 15 Td, the mixture 16% O2–84% CO2 exhibited the same value of reduced attachment Townsend coefficient as pure O2 [18]. Compared to N2 or N2-O2 gas mixtures, CO2 or CO2–O2 mixtures had better arc-breaking capabilities. Oxygen was selected to be part of the gas mixture (C4F7N/CO2/O2) to reduce the generation rate of both carbon monoxide (main decomposi-tion product) and fluorinated byproducts during arc quenching [20].
0
20
40
60
80
100
120
140
160
0 1 2 3 4 5 6 7 8 9 10
E max
(kV/
mm
)
Pressure (bar abs)
6%C5F10O–12%O2–82%CO2Partial pressure 12.77%O2–87.23%CO2Partial pressure C5F10OEmax(C5F10O)+Emax(12.77%O2–87.23%CO2)
Figure 25. Synergistic effect on negative partial discharge inception electric field (PDIEF) as afunction of gas pressure (6% C5F10O–12% O2–82% CO2 vs. partial pressure (12.77% O2–87.23% CO2)vs. partial pressure (C5F10O), d = 10 mm).
Table 6. PDIEF (Emax) comparison between 12.77% O2–87.23% CO2 and C5F10O as a function ofcomponent concentration.
CaseC5F10O/12.77% O2–87.23% CO2 Gas Mixture
% C5F10O %(12.77% O2–87.23% CO2)
Emax (12.77% O2–87.23% CO2) > Emax(C5F10O) <19 ±1
0 >81 ±01
Emax (12.77% O2–87.23% CO2) = Emax(C5F10O) 19 ±1
0 81 ±01
Emax (12.77% O2–87.23% CO2) < Emax(C5F10O) >19 ±1
0 <81 ±01
Table 7. Polarity reversal electric field EPR according to Equation (1) for different gas mixtures-basedCO2.
Gas/Gas Mixture EPR (kV/mm) Pressure (bar abs) η
CO2 64 2.5 0.038512.77% O2–87.23% CO2 50 1.6 0.0385
6% C5F10O–12% O2–82% CO2 36 0.5 0.0385
Energies 2021, 14, 1065 19 of 23
4. Discussion
Compared to CO2, the addition of O2 (12.77% O2–87.23% CO2) increased the criticalreduced electric field strength from 82 Td to 90 Td (1 Td = 10−21 V.m2) with ≈10% improve-ment [18,19]. N2-O2 gas mixtures exhibited better critical reduced electric field strengththan CO2–O2 for oxygen content higher than 8% (see Figure 26). At 15 Td, the mixture 16%O2–84% CO2 exhibited the same value of reduced attachment Townsend coefficient as pureO2 [18]. Compared to N2 or N2-O2 gas mixtures, CO2 or CO2–O2 mixtures had better arc-breaking capabilities. Oxygen was selected to be part of the gas mixture (C4F7N/CO2/O2)to reduce the generation rate of both carbon monoxide (main decomposition product) andfluorinated byproducts during arc quenching [20].
Energies 2021, 14, x FOR PEER REVIEW 20 of 24
Figure 26. Density-reduced critical electric field of N2–O2 and CO2–O2 gas mixtures [19].
The analysis of the effective ionization coefficients in C5F10O/O2/CO2 [21,22] and C4F7N/CO2 [23] gas mixtures showed a strong dependence of the effective ionization co-efficient on the gas density. C5F10O is characterized by an intrinsic dielectric strength highly dependent on the pressure, i.e., the increase of pressure increases the limiting die-lectric strength. For a stationary value E/N of density reduced electric field (see Equation (4)), where: • V: DC applied voltage; • d: Insulation distance; and • N: gas density, increasing the pressure decreases the applied voltage V, resulting in
a decrease of the velocity and the energy of the emitted electrons. The decrease of the energy of the swarm inhibits the generations in fractional nega-
tive ions result of dissociative attachment. The pure C5F10O and C4F7N exhibit PDs activi-ties on the AC positive half-cycle when the breakdown occurs on the negative half-cycle (see Figure 19b,c). The pure C5F10O shows denser PDs activity than that of pure C4F7N. Moreover, for similar breakdown voltages, negative partial discharge inception electric field of C4F7N at 0.352 bar abs is 1.75 times higher than that of C5F10O at 0.54 bar abs, as shown in Figure 23. The positive PDs incept by dissociative attachment of electrons in C5F10O or C4F7N. Thynne and Harland [24] reported negative ions formed by low energy electron impact and attachment to C4F7N, using a Bendix time of flight spectrometer. Mul-tiple dissociative attachment ions are formed (F−, CN−, CF3−, C2F5− and C3F7−) in the range of appearance potential 0.3–12 eV. The appearance potential is defined as the energy re-quired to produce the ion and its accompanying neutral fragment from a given molecule. The attachment cross-section of C4F7N is continuous and higher than SF6 in the energy range between 0.1 eV and 1 eV [25]. Hösl et al. [23] proved the existence of three types of anions (F− or CN− and/or C4F7N−) at low energies and developed a model, including the anions electron detachment to fit their experimental breakdown data. Ranković et al. [26] detected and identified the C4F7N fragments (F−, CN−, C3F4N−, C4F6N−) by the electron en-ergy loss spectroscopy and the dissociative electron attachment spectroscopy created at energies around ~1 eV.
The attachment cross-section C5F10O [25] is similar to that of SF6 for electron energies below 0.7 eV, and that it is substantially larger than that of SF6 in the region between 0.7 eV and 10 eV. The formation of anions is governed by dissociative attachment to C5F10O.
6469747984899499
104109114
0 20 40 60 80
Dens
ity-re
duce
d cr
itica
l ele
ctric
fie
ld (T
d)
Content of O2 (%)
N2–O2 CO2–O2
Figure 26. Density-reduced critical electric field of N2–O2 and CO2–O2 gas mixtures [19].
The analysis of the effective ionization coefficients in C5F10O/O2/CO2 [21,22] andC4F7N/CO2 [23] gas mixtures showed a strong dependence of the effective ionization coef-ficient on the gas density. C5F10O is characterized by an intrinsic dielectric strength highlydependent on the pressure, i.e., the increase of pressure increases the limiting dielectricstrength. For a stationary value E/N of density reduced electric field (see Equation (4)),where:
• V: DC applied voltage;• d: Insulation distance; and• N: gas density, increasing the pressure decreases the applied voltage V, resulting in a
decrease of the velocity and the energy of the emitted electrons.
The decrease of the energy of the swarm inhibits the generations in fractional negativeions result of dissociative attachment. The pure C5F10O and C4F7N exhibit PDs activitieson the AC positive half-cycle when the breakdown occurs on the negative half-cycle(see Figure 19b,c). The pure C5F10O shows denser PDs activity than that of pure C4F7N.Moreover, for similar breakdown voltages, negative partial discharge inception electric fieldof C4F7N at 0.352 bar abs is 1.75 times higher than that of C5F10O at 0.54 bar abs, as shownin Figure 23. The positive PDs incept by dissociative attachment of electrons in C5F10O orC4F7N. Thynne and Harland [24] reported negative ions formed by low energy electronimpact and attachment to C4F7N, using a Bendix time of flight spectrometer. Multipledissociative attachment ions are formed (F−, CN−, CF3
−, C2F5− and C3F7
−) in the range ofappearance potential 0.3–12 eV. The appearance potential is defined as the energy requiredto produce the ion and its accompanying neutral fragment from a given molecule. Theattachment cross-section of C4F7N is continuous and higher than SF6 in the energy range
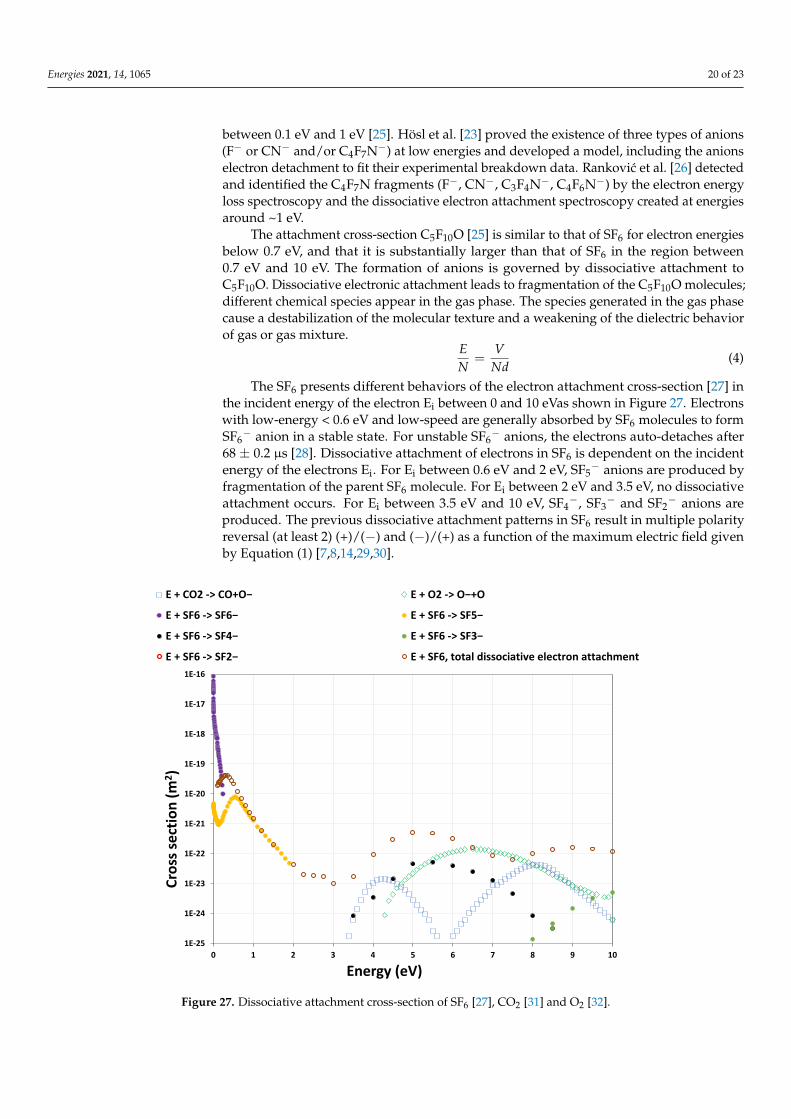
Energies 2021, 14, 1065 20 of 23
between 0.1 eV and 1 eV [25]. Hösl et al. [23] proved the existence of three types of anions(F− or CN− and/or C4F7N−) at low energies and developed a model, including the anionselectron detachment to fit their experimental breakdown data. Rankovic et al. [26] detectedand identified the C4F7N fragments (F−, CN−, C3F4N−, C4F6N−) by the electron energyloss spectroscopy and the dissociative electron attachment spectroscopy created at energiesaround ~1 eV.
The attachment cross-section C5F10O [25] is similar to that of SF6 for electron energiesbelow 0.7 eV, and that it is substantially larger than that of SF6 in the region between0.7 eV and 10 eV. The formation of anions is governed by dissociative attachment toC5F10O. Dissociative electronic attachment leads to fragmentation of the C5F10O molecules;different chemical species appear in the gas phase. The species generated in the gas phasecause a destabilization of the molecular texture and a weakening of the dielectric behaviorof gas or gas mixture.
EN
=V
Nd(4)
The SF6 presents different behaviors of the electron attachment cross-section [27] inthe incident energy of the electron Ei between 0 and 10 eVas shown in Figure 27. Electronswith low-energy < 0.6 eV and low-speed are generally absorbed by SF6 molecules to formSF6
− anion in a stable state. For unstable SF6− anions, the electrons auto-detaches after
68 ± 0.2 µs [28]. Dissociative attachment of electrons in SF6 is dependent on the incidentenergy of the electrons Ei. For Ei between 0.6 eV and 2 eV, SF5
− anions are produced byfragmentation of the parent SF6 molecule. For Ei between 2 eV and 3.5 eV, no dissociativeattachment occurs. For Ei between 3.5 eV and 10 eV, SF4
−, SF3− and SF2
− anions areproduced. The previous dissociative attachment patterns in SF6 result in multiple polarityreversal (at least 2) (+)/(−) and (−)/(+) as a function of the maximum electric field givenby Equation (1) [7,8,14,29,30].
Energies 2021, 14, x FOR PEER REVIEW 21 of 24
Dissociative electronic attachment leads to fragmentation of the C5F10O molecules; differ-ent chemical species appear in the gas phase. The species generated in the gas phase cause a destabilization of the molecular texture and a weakening of the dielectric behavior of gas or gas mixture.
E VN Nd
= (4)
The SF6 presents different behaviors of the electron attachment cross-section [27] in the incident energy of the electron Ei between 0 and 10 eVas shown in Figure 27. Electrons with low-energy < 0.6 eV and low-speed are generally absorbed by SF6 molecules to form SF6− anion in a stable state. For unstable SF6− anions, the electrons auto-detaches after 68 ± 0.2µs [28]. Dissociative attachment of electrons in SF6 is dependent on the incident energy of the electrons Ei. For Ei between 0.6 eV and 2 eV, SF5− anions are produced by fragmen-tation of the parent SF6 molecule. For Ei between 2 eV and 3.5 eV, no dissociative attach-ment occurs. For Ei between 3.5 eV and 10 eV, SF4−, SF3− and SF2− anions are produced. The previous dissociative attachment patterns in SF6 result in multiple polarity reversal (at least 2) (+)/(−) and (−)/(+) as a function of the maximum electric field given by Equation (1) [7,8,14,29,30].
Figure 27. Dissociative attachment cross-section of SF6[27], CO2 [31] and O2[32].
Only one polarity reversal happens in C4F7N/CO2 mixtures and pure CO2. The break-down voltage in positive polarity becomes constraining and goes below the voltage in negative polarity when the pressure increases and/or the field tends to be divergent.
5. Conclusions The breakdown characteristic as a function of pressure under non-uniform electric
field distribution is linear for N2 and strongly nonlinear for weak electronegative gas/gas mixture (CO2, 12.77% O2–87.23% CO2) or strong electronegative gas/gas mixture (C4F7N,
1E-25
1E-24
1E-23
1E-22
1E-21
1E-20
1E-19
1E-18
1E-17
1E-16
0 1 2 3 4 5 6 7 8 9 10
Cros
s sec
tion
(m2 )
Energy (eV)
E + CO2 -> CO+O− E + O2 -> O−+O
E + SF6 -> SF6− E + SF6 -> SF5−
E + SF6 -> SF4− E + SF6 -> SF3−
E + SF6 -> SF2− E + SF6, total dissociative electron attachment
Figure 27. Dissociative attachment cross-section of SF6 [27], CO2 [31] and O2 [32].
Energies 2021, 14, 1065 21 of 23
Only one polarity reversal happens in C4F7N/CO2 mixtures and pure CO2. Thebreakdown voltage in positive polarity becomes constraining and goes below the voltagein negative polarity when the pressure increases and/or the field tends to be divergent.
5. Conclusions
The breakdown characteristic as a function of pressure under non-uniform elec-tric field distribution is linear for N2 and strongly nonlinear for weak electronegativegas/gas mixture (CO2, 12.77% O2–87.23% CO2) or strong electronegative gas/gas mixture(C4F7N, C5F10O, 4% C4F7N–96% CO2, 20% C4F7N–80% CO2, 6% C5F10O–12% O2–82%CO2). The negative glow streamer mode is identified as the breakdown mechanism forcompressed N2.
For compressed 4% C4F7N–96% CO2 and 6% C5F10O–12% O2–82% CO2 gas mixturesunder non-uniform electric field distribution, the positive-streamer mode is identified asthe breakdown mechanism. Breakdown and negative partial discharge inception voltagesof 6% C5F10O–12% O2–82% CO2 are higher than those of 4% C4F7N–96% CO2. For highpressure, negative PDIV detection is not possible via current measurement; the detectionis feasible via emission image. At 8.8 bar abs, the breakdown voltage of 6% C5F10O–12%O2–82% CO2 is equal to that of 12.77% O2–87.23% CO2 (buffer gas). At 5 bar abs, thebreakdown voltage of 20% C4F7N–80% CO2 is 2 times higher compared with that of 6%C5F10O–12% O2–82% CO2 at 8.8 bar abs.
For 20% C4F7N–80% CO2 gas mixture, synergism in negative partial discharge incep-tion voltage/electric field fits with the mean value of each individual partial pressure com-ponent (C4F7N and CO2). Based on partial discharge inception voltage/electric field dataof pure CO2 (up to 8.8 bar abs) and pure C4F7N (up to 1 bar abs), three different variationswith the increase of C4F7N content in a C4F7N–CO2 gas mixture was identified. At 9 ±1
0C4F7N concentration, partial discharge inception electric field Emax (CO2) = Emax(C4F7N).When C4F7N concentration < 9 ±1
0, the mean value of each partial pressure individualcomponent (C4F7N and CO2) is no longer applicable.
For 6% C5F10O–12% O2–82% CO2 gas mixture, synergism in negative partial dischargeinception voltage/electric field (Emax) fits with the sum of each individual partial pressurecomponent (C5F10O and 12.77% O2–87.23% CO2). Based on partial discharge inceptionvoltage/electric field data of 12.77% O2–87.23% CO2 (up to 9.4 bar abs) and pure C5F10O (upto 0.6 bar abs), three different variations with the increase of C5F10O content in a C5F10O–(12.77% O2–87.23% CO2) gas mixture was identified. At 19 ±1
0 C5F10O concentration, Emax(12.77% O2–87.23% CO2) = Emax(C5F10O).
Polarity reversal occurs under AC voltage when the breakdown polarity changes fromnegative to positive cycle. Polarity reversal electric field EPR was quantified. Fitting resultsshow that EPR (CO2) = EPR(9% C4F7N–91% CO2) and EPR(SF6) = EPR (22% C4F7N–78%CO2). The pressure of polarity reversal increases linearly with the increasing field utilizationfactor η. At a constant field utilization factor η, increasing C4F7N content improves EPR andpolarity reversal pressure. This variation is ruled by a constant EPR intrinsic characteristicfor each gas/gas mixture. The addition of O2 in 12.77% O2–87.23% CO2 and C5F10O inC5F10O–(12.77% O2–87.23% CO2) reduces final EPR and polarity reversal pressure, EPR (4%C4F7N–96% CO2) = EPR (12.77% O2–87.23% CO2) and EPR (6% C5F10O–12% O2–82% CO2)< EPR (4% C4F7N–96% CO2) < EPR (CO2).
Author Contributions: Conceptualization, H.E.N., M.M., A.H. and G.W.; methodology, H.E.N.;validation, A.H.; formal analysis, H.E.N.; investigation, H.E.N.; writing—original draft preparation,H.E.N.; writing—review and editing, H.E.N., M.M., A.H. and G.W.; supervision, A.H.; projectadministration, A.H. and G.W.; funding acquisition, A.H. and G.W. All authors have read and agreedto the published version of the manuscript.
Funding: This research was funded by National Grid Electricity Transmission UK.
Institutional Review Board Statement: Not applicable.
Informed Consent Statement: Not applicable.
Energies 2021, 14, 1065 22 of 23
Data Availability Statement: Not applicable.
Conflicts of Interest: The authors declare no conflict of interest.
References1. Niemeyer, L.; Pinnekamp, F. Leader Discharges in SF6. J. Phys. D Appl. Phys. 1983, 16, 1031–1045. [CrossRef]2. Mazurek, B.; Cross, J.D.; van Heeswijk, R.G. The effect of a metallic particle near a spacer on flashover phenomena in SF6. IEEE
Trans. Electr. Insul. 1993, 28, 219–229. [CrossRef]3. Takahashi, T.; Yamada, T.; Hayakawa, N.; Yuasa, S.; Okabe, S.; Okubo, H. Corona stabilization effect in SF6 gas viewed from
sequential generation of partial discharge. In Proceedings of the 1999 Eleventh International Symposium on High VoltageEngineering, London, UK, 23–27 August 1999; Volume 3, pp. 88–91.
4. Piccin, R.; Mor, A.R.; Morshuis, P.; Girodet, A.; Smit, J. Partial discharge analysis of gas insulated systems at high voltage AC andDC. IEEE Trans. Dielectr. Electr. Insul. 2015, 22, 218–228. [CrossRef]
5. Ouss, E.; Beroual, A.; Girodet, A.; Ortiz, G.; Zavattoni, L.; Vu-Cong, T. Characterization of partial discharges from a protrusion inHVDC coaxial geometry. IEEE Trans. Dielectr. Electr. Insul. 2020, 27, 148–155. [CrossRef]
6. Nechmi, H.E.; Slama, M.E.A.; Haddad, A.M.; Wilson, G. AC Volume Breakdown and Surface Flashover of a 4% NovecTM
4710/96% CO2 Gas Mixture Compared to CO2 in Highly Nonhomogeneous Fields. Energies 2020, 13, 1710. [CrossRef]7. Nechmi, H.E.; Beroual, A.; Girodet, A.; Vinson, P. Fluoronitriles/CO2 gas mixture as an eco-friendly alternative candidate to SF6
in high voltage insulation systems. In Proceedings of the 2016 IEEE Conference on Electrical Insulation and Dielectric Phenomena(CEIDP), Toronto, ON, Canada, 16–19 October 2016; pp. 384–387. [CrossRef]
8. Nechmi, H.E.; Beroual, A.; Girodet, A.; Vinson, P. Fluoronitriles/CO2 gas mixture as promising substitute to SF6 for insulation inhigh voltage applications. IEEE Trans. Dielectr. Electr. Insul. 2016, 23, 2587–2593. [CrossRef]
9. Cigré Technical Brochure No 802, Working Group B3.45: Application of non-SF6 Gases or Gas-Mixtures in Medium and HighVoltage Gas-Insulated Switchgear. May 2020. Available online: https://e-cigre.org/publication/802-application-of-non-sf6-gases-or-gas-mixtures-in-medium-and-high-voltage-gas-insulated-switchgear (accessed on 5 January 2021).
10. Michelarakis, M.; Widger, P.; Beroual, A.; Haddad, A.M. Electrical Detection of Creeping Discharges over Insulator Surfaces inAtmospheric Gases under AC Voltage Application. Energies 2019, 12, 2970. [CrossRef]
11. Malik, N.H. Streamer Breakdown Criterion for Compressed Gases. IEEE Trans. Dielectr. Electr. Insul. 1981, EI-16, 463–467.[CrossRef]
12. Saitoh, H.; Morita, K.; Kikkawa, T.; Kato, K.; Hayakawa, N.; Okubo, H. Impulse partial discharge and breakdown characteristicsof rod-plane gaps in N2/SF6 gas mixtures. In Proceedings of the 2001 Annual Report Conference on Electrical Insulation andDielectric Phenomena (Cat. No.01CH37225), Kitchener, ON, Canada, 14–17 October 2001; pp. 397–400. [CrossRef]
13. Saitoh, H.; Morita, K.; Kikkawa, T.; Hayakawa, N.; Okubo, H. Impulse partial discharge and breakdown characteristics ofrod–plane gaps in air and N2 gases. Electr. Eng. Jpn. 2004, 148, 36–43. [CrossRef]
14. Sadaoui, F.; Beroual, A. Influence of polarity on breakdown voltage of gases in divergent electric field under lightning impulsevoltages. In Proceedings of the 2012 International Conference on High Voltage Engineering and Application, Shanghai, China,17–20 September 2012; pp. 496–499. [CrossRef]
15. Sadaoui, F. Comparaison des Caractéristiques Electriques et Optiques des Décharges Glissantes sur Différents Types D’isolateursdans le CO2, le SF6 et le N2 et Leurs Mélanges à Différentes Pressions. Ph.D. Thesis, Ecole Centrale de Lyon, Université of Lyon,Lyon, France, 2013.
16. Hösl, A. Analysis of Electron Detachment in Pulsed Townsend Measurements. Ph.D. Thesis, ETH Zurich, Zürich, Switzerland,2019. No. 26230.
17. Nechmi, H.E.; Beroual, A.; Girodet, A.; Vinson, P. Effective ionization coefficients and limiting field strength of fluoronitriles-CO2mixtures. IEEE Trans. Dielectr. Electr. Insul. 2017, 24, 886–892. [CrossRef]
18. Zhao, H.; Deng, Y.; Lin, H. Study of the synergistic effect in dielectric breakdown property of CO2-O2 mixtures. AIP Adv. 2017, 7,095102. [CrossRef]
19. Haefliger, P.; Franck, C. Comparison of swarm and breakdown data in mixtures of nitrogen, carbon dioxide, argon and oxygen. J.Phys. D Appl. Phys. 2019, 52, 025204. [CrossRef]
20. Hermosillo, V.; Gregoire, C.; Vancell, D.; Ozil, J.; Kieffel, Y.; Pierres, E. Performance Evaluation of CO2/Fluoronitrile Mixture at HighShort Circuit Current Level in GIS and Dead-Tank High-Voltage Circuit Breakers; Paper A3-301; Cigré: Paris, France, 2018.
21. Egüz, E.; Chachereau, A.; Hösl, A.; Franck, C. Measurements of Swarm Parameters in C4F7N:O2:CO2, C5F10O:O2:CO2 andC5F10O:O2:N2 Mixtures. In Proceedings of the 19th International Symposium on High Voltage Engineering (ISH 2019), Budapest,Hungary, 26–30 August 2019.
22. Chachereau, A.; Franck, C.M. Electrical insulation properties of the perfluoroketone C5F10O. J. Phys. D Appl. Phys. 2018, 51,335204. [CrossRef]
23. Hösl, A.; Chachereau, A.; Pachin, J.; Franck, C.M. Identification of the discharge kinetics in the perfluoronitrile C4F7N withswarm and breakdown experiments. J. Phys. D Appl. Phys. 2019, 52, 235201. [CrossRef]
24. Thynne, J.C.J.; Harland, P.W. Ionisation of pentafluoroethyl cyanide and heptafluoro-n-propyl cyanide by electron impact. Int. J.Mass Spectrom. Ion Phys. 1973, 11, 399–408. [CrossRef]
Energies 2021, 14, 1065 23 of 23
25. Chachereau, A. Electron and Ion Kinetics in Fluorinated Gases for Electrical Insulation. Ph.D. Thesis, ETH Zurich, Zürich,Switzerland, 2018. No. 25657.
26. Rankovic, M.; Kumar, T.P.R.; Nag, P.; Kocišek, J.; Fedor, J. Temporary anions of the dielectric gas C3F7CN and their decay channels.J. Chem. Phys. 2020, 152, 244304.
27. Christophorou, L.G.; Olthoff, J.K. Electron interactions with SF6. J. Phys. Chem. Ref. Data 2000, 29, 267. [CrossRef]28. Harland, P.W.; Thynne, J.C.J. Autodetachment lifetimes, attachment cross sections, and negative ions formed by sulfur hexafluo-
ride and sulfur tetrafluoride. J. Phys. Chem. 1971, 75, 3517. [CrossRef]29. Guo, C.; Wang, T.; Li, Z.; Zhang, Q.; Wen, T.; You, H.; Qin, Y.; Ma, J.; Wang, H.; Li, Y. The reversal of SF6/N2 gas mixtures polarity
effect under lightning impulse. In Proceedings of the 2015 IEEE 11th International Conference on the Properties and Applicationsof Dielectric Materials (ICPADM), Sydney, NSW, Australia, 19–22 July 2015; pp. 176–179. [CrossRef]
30. Bujotzek, M.; Seeger, M. Parameter dependence of gaseous insulation in SF6. IEEE Trans. Dielectr. Electr. Insul. 2013, 20, 845–855.[CrossRef]
31. Itikawa, Y. Cross Sections for Electron Collisions with Carbon Dioxide. J. Phys. Chem. Ref. Data 2002, 31, 749. [CrossRef]32. Itikawa, Y. Cross Sections for Electron Collisions with Oxygen Molecules. J. Phys. Chem. Ref. Data 2009, 38. [CrossRef]
Copyright © 2022 FDOKUMEN