Clara Intan, Laurencia Prasetya Limartha Mochamad Riky ...
8
DRAFT ICIC Express Letters ICIC International c 2013 ISSN 1881-803X Volume 4, Number 5, March 2019 pp. 1–ISII2010-000 Clara Intan, Laurencia Prasetya Limartha Mochamad Riky Pramudya Ekaputra, Fergyanto Efendy Gunawan* Industrial Engineering Department, BINUS Graduate Program - Master of Industrial Engineering, Bina Nusantara University, Jakarta, Indonesia 11480 *[email protected] Submitted June 2019; accepted August 2019 STRESS DUE TO SCIENTIFIC PUBLICATION AMONG ACADEMIC 1 LECTURERS: INDONESIA CASE 2 Abstract. Recently, the Indonesia government has put forward regulations about sci- entific publication addressed to academia. Lecturers in Indonesia often consider that they are underpaid, the existing support systems for research is limited, and academic workloads are excessive. By considering those constraints, we anticipate that the new regulations may alleviate lecturers’ stress level. Therefore, the purpose of this study is to examine the impact of the publication obligations on job stress among academic lecturers in Indonesia. We adopt the Job Demand-Control-Support (JDC-S) model that expresses the construct Job Stress and the affecting factors, namely, Job Demand, Job Control, and Job Supports. Questionnaires are used to collect the required data for those constructs from a random sample of 100 lecturers in the country. The data are analyzed by using descriptive statistics and multivariate regression analysis, and the findings follow. Those who hold doctoral degree incline to consider the publication demand is low, but for those with master degree, their opinion about the demand spread uniformly from low, average, and high. The participants find it rather hard to control aspects around the responsibil- ity. The supports for publication are considered low, but they do not contribute much in alleviating the stress level. The stress model fits reasonably well to the issue, suggesting Job Demand and Job Control to be the most relevant factors. Keywords: Job Stress, Job Demand, Job Control, Job Support, Scientific Publica- tion 1. Introduction. During the last five year, the data presented by Ref. [1] suggest that the number of 3 scientific publications from Indonesia has increased significantly in quantity as shown in Fig. 1 and in 4 quality as shown in Fig. 2. 5 The trend is a result of a set of regulation put forward by Indonesia government such as Permenris- 6 tekdikti No. 20 concerning providing professional lecturers honorary allowances to improve the quality 7 and quantity of scientific publications and Permenpan No. 17 and 46 of 2013 regarding the obligation to 8 produce and disseminate scientific publication. 9 Without any doubt, the policies of increasing the academic contribution have contributed an additional 10 but significant amount of workloads to Indonesia lecturers. How it affects the stress level among Indonesia 11 lecturers is the subject of this research work. 12 Any employee concerns with the issues of job stress and job satisfaction as they strongly influence 13 working performance. For the reason, many bodies of works have addressed the issue across various 14 sectors of employment including health [2, 3], telecommunications [4], banking [5, 6], petrochemical 15 industry [7], security [8], and education [9]. Those studies found the stress is influenced by various factors 16 such as workload, professional recognition, time and resources constraints, interpersonal relationships, 17 technology training and support, facilities, and technology literacy. Besides, Ref. [9] found that the 18 phenomenon of the stressed lecturers in academia is rather pervasive. In the latter case, it may be 19 influenced by student misbehavior, curriculum exposure constraints, and some academic responsibility 20 such as publication. We should note that excessive stress may have negative association with physical 21 health as established by Ref. [10]. 22 Understanding the stress level induced by the new policy regarding the scientific publication in In- 23 donesia is a crucial and novel issue. 24 1
-
Upload
khangminh22 -
Category
Documents
-
view
1 -
download
0
Transcript of Clara Intan, Laurencia Prasetya Limartha Mochamad Riky ...

DRAFT
ICIC Express Letters ICIC International c©2013 ISSN 1881-803XVolume 4, Number 5, March 2019 pp. 1–ISII2010-000
Clara Intan, Laurencia Prasetya LimarthaMochamad Riky Pramudya Ekaputra, Fergyanto Efendy Gunawan*
Industrial Engineering Department, BINUS Graduate Program - Master of Industrial Engineering,Bina Nusantara University,Jakarta, Indonesia 11480
Submitted June 2019; accepted August 2019
STRESS DUE TO SCIENTIFIC PUBLICATION AMONG ACADEMIC1
LECTURERS: INDONESIA CASE2
Abstract. Recently, the Indonesia government has put forward regulations about sci-entific publication addressed to academia. Lecturers in Indonesia often consider thatthey are underpaid, the existing support systems for research is limited, and academicworkloads are excessive. By considering those constraints, we anticipate that the newregulations may alleviate lecturers’ stress level. Therefore, the purpose of this study is toexamine the impact of the publication obligations on job stress among academic lecturersin Indonesia. We adopt the Job Demand-Control-Support (JDC-S) model that expressesthe construct Job Stress and the affecting factors, namely, Job Demand, Job Control, andJob Supports. Questionnaires are used to collect the required data for those constructsfrom a random sample of 100 lecturers in the country. The data are analyzed by usingdescriptive statistics and multivariate regression analysis, and the findings follow. Thosewho hold doctoral degree incline to consider the publication demand is low, but for thosewith master degree, their opinion about the demand spread uniformly from low, average,and high. The participants find it rather hard to control aspects around the responsibil-ity. The supports for publication are considered low, but they do not contribute much inalleviating the stress level. The stress model fits reasonably well to the issue, suggestingJob Demand and Job Control to be the most relevant factors.
Keywords: Job Stress, Job Demand, Job Control, Job Support, Scientific Publica-tion
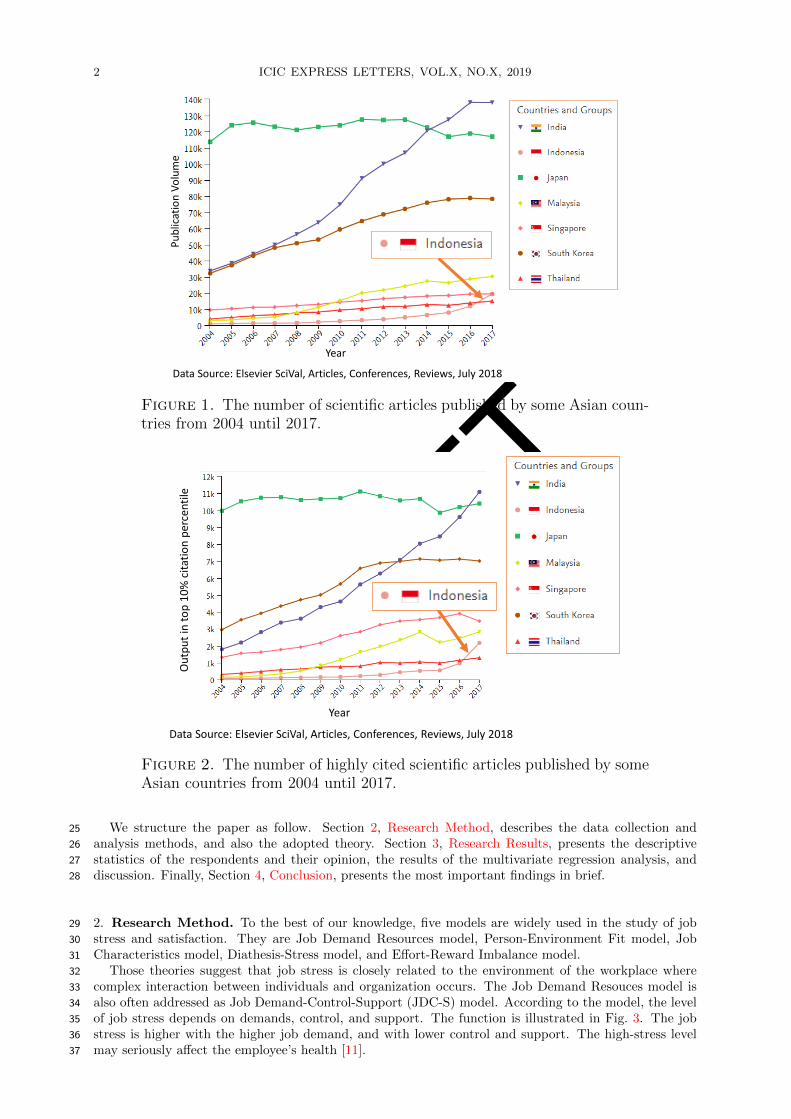
1. Introduction. During the last five year, the data presented by Ref. [1] suggest that the number of3
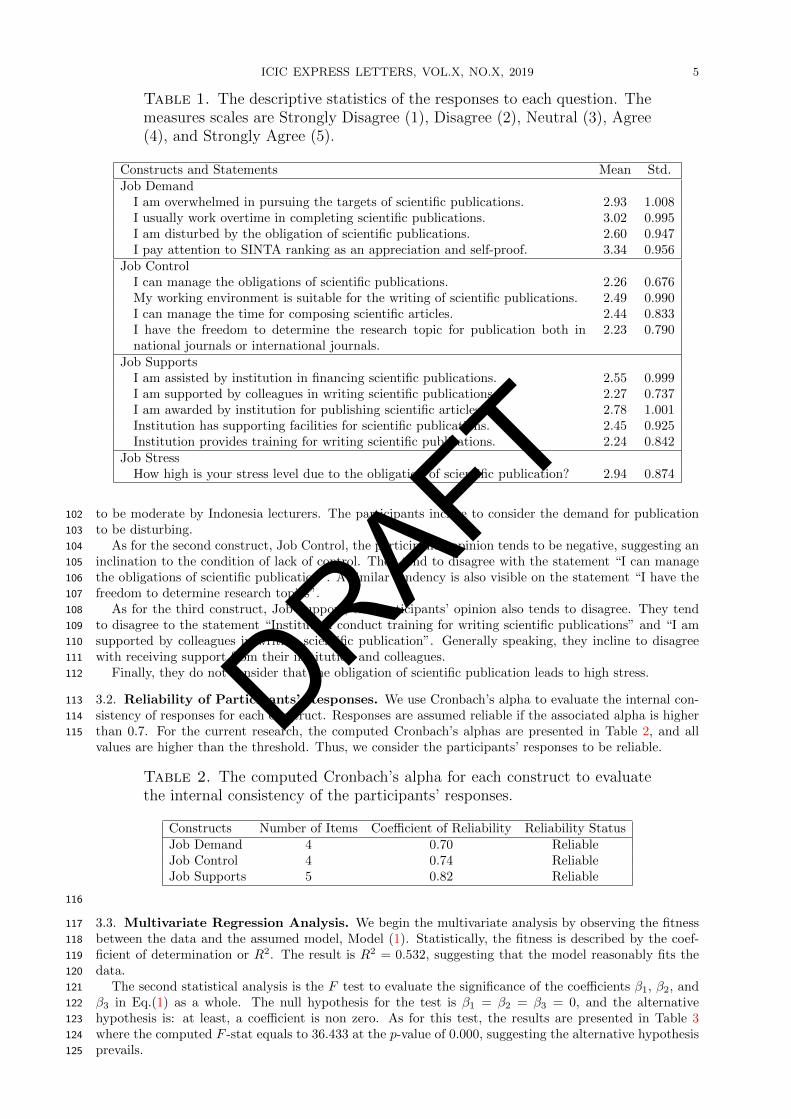
scientific publications from Indonesia has increased significantly in quantity as shown in Fig. 1 and in4
quality as shown in Fig. 2.5
The trend is a result of a set of regulation put forward by Indonesia government such as Permenris-6
tekdikti No. 20 concerning providing professional lecturers honorary allowances to improve the quality7
and quantity of scientific publications and Permenpan No. 17 and 46 of 2013 regarding the obligation to8
produce and disseminate scientific publication.9
Without any doubt, the policies of increasing the academic contribution have contributed an additional10
but significant amount of workloads to Indonesia lecturers. How it affects the stress level among Indonesia11
lecturers is the subject of this research work.12
Any employee concerns with the issues of job stress and job satisfaction as they strongly influence13
working performance. For the reason, many bodies of works have addressed the issue across various14
sectors of employment including health [2, 3], telecommunications [4], banking [5, 6], petrochemical15
industry [7], security [8], and education [9]. Those studies found the stress is influenced by various factors16
such as workload, professional recognition, time and resources constraints, interpersonal relationships,17
technology training and support, facilities, and technology literacy. Besides, Ref. [9] found that the18
phenomenon of the stressed lecturers in academia is rather pervasive. In the latter case, it may be19
influenced by student misbehavior, curriculum exposure constraints, and some academic responsibility20
such as publication. We should note that excessive stress may have negative association with physical21
health as established by Ref. [10].22
Understanding the stress level induced by the new policy regarding the scientific publication in In-23
donesia is a crucial and novel issue.24
1
DRAFT
2 ICIC EXPRESS LETTERS, VOL.X, NO.X, 2019
|
Zooming in on a few Asian countries – Quantity
Data Source: Elsevier SciVal, Articles, Conferences, Reviews, July 2018
Pu
blic
atio
n V
olu
me
Year
Figure 1. The number of scientific articles published by some Asian coun-tries from 2004 until 2017.
|
Zooming in on a few Asian countries – Quality
Data Source: Elsevier SciVal, Articles, Conferences, Reviews, July 2018
Ou
tpu
t in
to
p 1
0%
cit
atio
n p
erce
nti
le
Year
Figure 2. The number of highly cited scientific articles published by someAsian countries from 2004 until 2017.
We structure the paper as follow. Section 2, Research Method, describes the data collection and25
analysis methods, and also the adopted theory. Section 3, Research Results, presents the descriptive26
statistics of the respondents and their opinion, the results of the multivariate regression analysis, and27
discussion. Finally, Section 4, Conclusion, presents the most important findings in brief.28
2. Research Method. To the best of our knowledge, five models are widely used in the study of job29
stress and satisfaction. They are Job Demand Resources model, Person-Environment Fit model, Job30
Characteristics model, Diathesis-Stress model, and Effort-Reward Imbalance model.31
Those theories suggest that job stress is closely related to the environment of the workplace where32
complex interaction between individuals and organization occurs. The Job Demand Resouces model is33
also often addressed as Job Demand-Control-Support (JDC-S) model. According to the model, the level34
of job stress depends on demands, control, and support. The function is illustrated in Fig. 3. The job35
stress is higher with the higher job demand, and with lower control and support. The high-stress level36
may seriously affect the employee’s health [11].37

DRAFT
ICIC EXPRESS LETTERS, VOL.X, NO.X, 2019 3
Job Demand
Job Control
Job Supports
Job Stress
Figure 3. The Job Demand Control-Support (JDC-S) model adopted inthis study.
Thus, the study involves four constructs, namely, Job Demand, Job Control, Job Support, and Job38
Stress. The definitions of the constructs strictly follow those given by Ref. [12]. They are defined as the39
following:40
Job Demand: “one’s perceived workload and further narrowed to quantitative measures of one’s41
overloading the job. Work overload creates stress, anger, aggressive behavior, or conflicts, which42
is expected to negatively influence an individual’s mental and physical health through increased43
activation of the hypothalamic-pituitary-adrenocortical system, sleep difficulties.”44
Job Control: “a worker’s perceived freedom in how to meet their job demands and aims at reducing45
uncertainty in the workplace through providing exact instructions on how job tasks must be done.”46
Job Support: “overall levels of helpful social interaction available on the job from both coworkers47
and supervisors.”48
Thus, the following hypotheses are assessed in the current study:
H1 : Job Demand affects Job Stress.
H2 : Job Control affects Job Stress.
H3 : Job Support affects Job Stress.
To statistically evaluate the relationships depicted in Fig. 3, the data of those four constructs are49
collected using questionnaires. The instrument is distributed to academic lecturers residing in Indonesia50
within the time frame of May 2019 until June 2019. Some sources suggest that the number of the total51
Indonesia lecturers is 237 837 individuals. With ten percent precision, the required sample size is about52
100, according to Ref. [13]. The sample is selected randomly. Then, the questionnaires are distributed to53
those individuals online.54
The questionnaires consist of five sections. We note that the questionnaires are administered in In-55
donesia language to the respondents. Section A contains basic information from respondents such as age,56
gender, education, teaching experience, and marital status.57
The remain sections contain questions addressing Job Demand, Job Control, Job Supports, and Job58
Stress. For each of those questions, participants are provided with five options, from which one answer59
must be selected. Those options are Strongly Disagree, Disagree, Neutral, Agree, and Strongly Agree.60
Section B contains four statements to access Job Demand in the individual current position. Those61
statements are:62
• I am overwhelmed in pursuing the targets of scientific publications.63
• I usually work overtime in completing scientific publications.64
• I am disturbed by the obligation of scientific publications.65
• I pay attention to SINTA ranking as an appreciation and self-proof.66
A lower score in Job Demand indicates a lower demand.67
SINTA is a site established by the Ministry of Research, Technology, and Higher Education of the68
Republic of Indonesia for aggregating scientific outcomes and ranking among lecturers. A typical SINTA69
page can be seen in Fig. 4.70
Section C contains four statements to measure the level of Job Control. Those statements are:71

DRAFT
4 ICIC EXPRESS LETTERS, VOL.X, NO.X, 2019
Figure 4. A typical SINTA page. SINTA provides some information ofscientific outcomes. SINTA is established by the Ministry of Research,Technology, and Higher Education of the Republic of Indonesia.
• I can manage the obligations of scientific publications.72
• My working environment is suitable for the writing of scientific publications.73
• I can manage the time for composing scientific articles.74
• I have the freedom to determine the research topic for publication both in national journals or75
international journals76
A lower score in Job Control denotes the condition of less control on the jobs at hand.77
Section D contains four statements to assess Job Supports. Those statements are:78
• I am assisted by institution in financing scientific publications.79
• I am supported by colleagues in writing scientific publications.80
• I am awarded by institution for publishing scientific articles.81
• Institution has supporting facilities for scientific publications.82
• Institution provides training for writing scientific publications.83
A lower score in Job Support indicates less support.84
Finally, section E contains a statement to assess Job Stress. The question is: “How high is your stress85
level due to the obligation of scientific publication?”. A lower score on Job Stress indicates a lower stress86
level.87
The conformity of the three hypotheses to the collected empirical data is evaluated statistically by88
multivariate regression analysis. For the purpose, we establish a linear model of:89
Job Stress = β0 + β1 · Job Demand + β2 · Job Control + β3 · Job Support. (1)
The three hypotheses are accepted on the condition that the t statistics associated with β1, β2, and90
β3 are sufficiently large, exceeding the critical limit of t(α/2,n−d−1), where α denotes the significance level91
and is usually taken as 0.05. Prior to the computation of the t statistics, we perform the ANOVA test to92
determine the importance of Model (1) globally. In this case, we compute and evaluate the F statistic.93
In addition, we also evaluate the model fitness to the data by using the coefficient of determination or94
R2. Finally, we evaluate the residual data, which represent the gap between the model prediction and95
the actual data, to understand the suitability of the model with the basic assumptions from which the96
model is established.97
3. Research Results.98
3.1. Descriptive Statistics. First, we start the discussion with a general description regarding the99
respondent’s responses to the four constructs. The relevant statistics, the means and standard deviations,100
are presented in Table 1. These data suggest that on the average, the demand for publication is considered101
DRAFT
ICIC EXPRESS LETTERS, VOL.X, NO.X, 2019 5
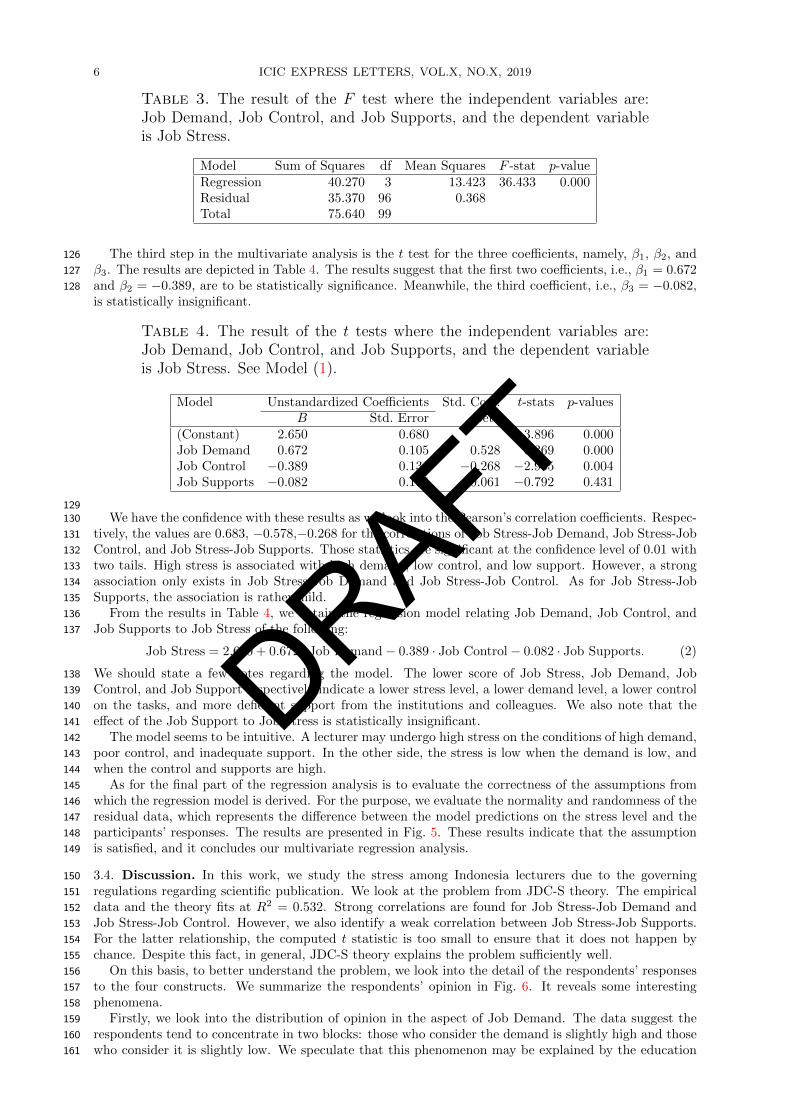
Table 1. The descriptive statistics of the responses to each question. Themeasures scales are Strongly Disagree (1), Disagree (2), Neutral (3), Agree(4), and Strongly Agree (5).
Constructs and Statements Mean Std.Job Demand
I am overwhelmed in pursuing the targets of scientific publications. 2.93 1.008I usually work overtime in completing scientific publications. 3.02 0.995I am disturbed by the obligation of scientific publications. 2.60 0.947I pay attention to SINTA ranking as an appreciation and self-proof. 3.34 0.956
Job ControlI can manage the obligations of scientific publications. 2.26 0.676My working environment is suitable for the writing of scientific publications. 2.49 0.990I can manage the time for composing scientific articles. 2.44 0.833I have the freedom to determine the research topic for publication both innational journals or international journals.
2.23 0.790
Job SupportsI am assisted by institution in financing scientific publications. 2.55 0.999I am supported by colleagues in writing scientific publications. 2.27 0.737I am awarded by institution for publishing scientific articles. 2.78 1.001Institution has supporting facilities for scientific publications. 2.45 0.925Institution provides training for writing scientific publications. 2.24 0.842
Job StressHow high is your stress level due to the obligation of scientific publication? 2.94 0.874
to be moderate by Indonesia lecturers. The participants incline to consider the demand for publication102
to be disturbing.103
As for the second construct, Job Control, the participants’ opinion tends to be negative, suggesting an104
inclination to the condition of lack of control. They tend to disagree with the statement “I can manage105
the obligations of scientific publication”. A similar tendency is also visible on the statement “I have the106
freedom to determine research topics”.107
As for the third construct, Job Support, the participants’ opinion also tends to disagree. They tend108
to disagree to the statement “Institution conduct training for writing scientific publications” and “I am109
supported by colleagues in writing scientific publication”. Generally speaking, they incline to disagree110
with receiving support from their institution and colleagues.111
Finally, they do not consider that the obligation of scientific publication leads to high stress.112
3.2. Reliability of Participants’ Responses. We use Cronbach’s alpha to evaluate the internal con-113
sistency of responses for each construct. Responses are assumed reliable if the associated alpha is higher114
than 0.7. For the current research, the computed Cronbach’s alphas are presented in Table 2, and all115
values are higher than the threshold. Thus, we consider the participants’ responses to be reliable.
Table 2. The computed Cronbach’s alpha for each construct to evaluatethe internal consistency of the participants’ responses.
Constructs Number of Items Coefficient of Reliability Reliability StatusJob Demand 4 0.70 ReliableJob Control 4 0.74 ReliableJob Supports 5 0.82 Reliable
116
3.3. Multivariate Regression Analysis. We begin the multivariate analysis by observing the fitness117
between the data and the assumed model, Model (1). Statistically, the fitness is described by the coef-118
ficient of determination or R2. The result is R2 = 0.532, suggesting that the model reasonably fits the119
data.120
The second statistical analysis is the F test to evaluate the significance of the coefficients β1, β2, and121
β3 in Eq.(1) as a whole. The null hypothesis for the test is β1 = β2 = β3 = 0, and the alternative122
hypothesis is: at least, a coefficient is non zero. As for this test, the results are presented in Table 3123
where the computed F -stat equals to 36.433 at the p-value of 0.000, suggesting the alternative hypothesis124
prevails.125
DRAFT
6 ICIC EXPRESS LETTERS, VOL.X, NO.X, 2019
Table 3. The result of the F test where the independent variables are:Job Demand, Job Control, and Job Supports, and the dependent variableis Job Stress.
Model Sum of Squares df Mean Squares F -stat p-valueRegression 40.270 3 13.423 36.433 0.000Residual 35.370 96 0.368Total 75.640 99
The third step in the multivariate analysis is the t test for the three coefficients, namely, β1, β2, and126
β3. The results are depicted in Table 4. The results suggest that the first two coefficients, i.e., β1 = 0.672127
and β2 = −0.389, are to be statistically significance. Meanwhile, the third coefficient, i.e., β3 = −0.082,128
is statistically insignificant.
Table 4. The result of the t tests where the independent variables are:Job Demand, Job Control, and Job Supports, and the dependent variableis Job Stress. See Model (1).
Model Unstandardized Coefficients Std. Coef. t-stats p-valuesB Std. Error Beta
(Constant) 2.650 0.680 3.896 0.000Job Demand 0.672 0.105 0.528 6.369 0.000Job Control −0.389 0.131 −0.268 −2.965 0.004Job Supports −0.082 0.104 −0.061 −0.792 0.431
129We have the confidence with these results as we look into the Pearson’s correlation coefficients. Respec-130
tively, the values are 0.683, −0.578,−0.268 for the correlations of Job Stress-Job Demand, Job Stress-Job131
Control, and Job Stress-Job Supports. Those statistics are significant at the confidence level of 0.01 with132
two tails. High stress is associated with high demand, low control, and low support. However, a strong133
association only exists in Job Stress-Job Demand and Job Stress-Job Control. As for Job Stress-Job134
Supports, the association is rather mild.135
From the results in Table 4, we obtain the regression model relating Job Demand, Job Control, and136
Job Supports to Job Stress of the following:137
Job Stress = 2.650 + 0.672 · Job Demand − 0.389 · Job Control − 0.082 · Job Supports. (2)
We should state a few notes regarding the model. The lower score of Job Stress, Job Demand, Job138
Control, and Job Support respectively indicate a lower stress level, a lower demand level, a lower control139
on the tasks, and more deficient support from the institutions and colleagues. We also note that the140
effect of the Job Support to Job Stress is statistically insignificant.141
The model seems to be intuitive. A lecturer may undergo high stress on the conditions of high demand,142
poor control, and inadequate support. In the other side, the stress is low when the demand is low, and143
when the control and supports are high.144
As for the final part of the regression analysis is to evaluate the correctness of the assumptions from145
which the regression model is derived. For the purpose, we evaluate the normality and randomness of the146
residual data, which represents the difference between the model predictions on the stress level and the147
participants’ responses. The results are presented in Fig. 5. These results indicate that the assumption148
is satisfied, and it concludes our multivariate regression analysis.149
3.4. Discussion. In this work, we study the stress among Indonesia lecturers due to the governing150
regulations regarding scientific publication. We look at the problem from JDC-S theory. The empirical151
data and the theory fits at R2 = 0.532. Strong correlations are found for Job Stress-Job Demand and152
Job Stress-Job Control. However, we also identify a weak correlation between Job Stress-Job Supports.153
For the latter relationship, the computed t statistic is too small to ensure that it does not happen by154
chance. Despite this fact, in general, JDC-S theory explains the problem sufficiently well.155
On this basis, to better understand the problem, we look into the detail of the respondents’ responses156
to the four constructs. We summarize the respondents’ opinion in Fig. 6. It reveals some interesting157
phenomena.158
Firstly, we look into the distribution of opinion in the aspect of Job Demand. The data suggest the159
respondents tend to concentrate in two blocks: those who consider the demand is slightly high and those160
who consider it is slightly low. We speculate that this phenomenon may be explained by the education161

DRAFT
ICIC EXPRESS LETTERS, VOL.X, NO.X, 2019 7
Regression Standardized Residual
210-1-2-3
Fre
qu
ency
20
15
10
5
0
Histogram
Dependent Variable: Stress
Mean = 5.24E-16Std. Dev. = 0.985N = 100
Page 1
Observed Cum Prob
1.00.80.60.40.20.0
Exp
ecte
d C
um
Pro
b
1.0
0.8
0.6
0.4
0.2
0.0
Normal P-P Plot of Regression Standardized Residual
Dependent Variable: Stress
Page 1
Figure 5. The distribution of the residual data in the form of aprobability-probability plot.
1 2 3 4 50.0
0.1
0.2
0.3
Job Demand
1 2 3 4 50.0
0.1
0.2
0.3
0.4
0.5
0.6Job Control
1 2 3 4 50.0
0.1
0.2
0.3
0.4
0.5Job Supports
1 2 3 4 50.0
0.1
0.2
0.3
Job Stress
Figure 6. The distribution of the participants’s responses to the question-naires. Lower value denotes lower demand, lower control on the job, loweramount of existing supports, and lower stress level.
level of the lecturers. We note that in Indonesia, the law stipulates that the minimum degree to be a162
lecturer in bachelor programs is master degree. Meanwhile, usually, only those who have a doctoral degree163
possess sufficient skillsets for writing research papers. On this basis, we speculate the pressure of scientific164
publication may bring forth higher stress to one with a master degree than to one with a doctoral degree.165
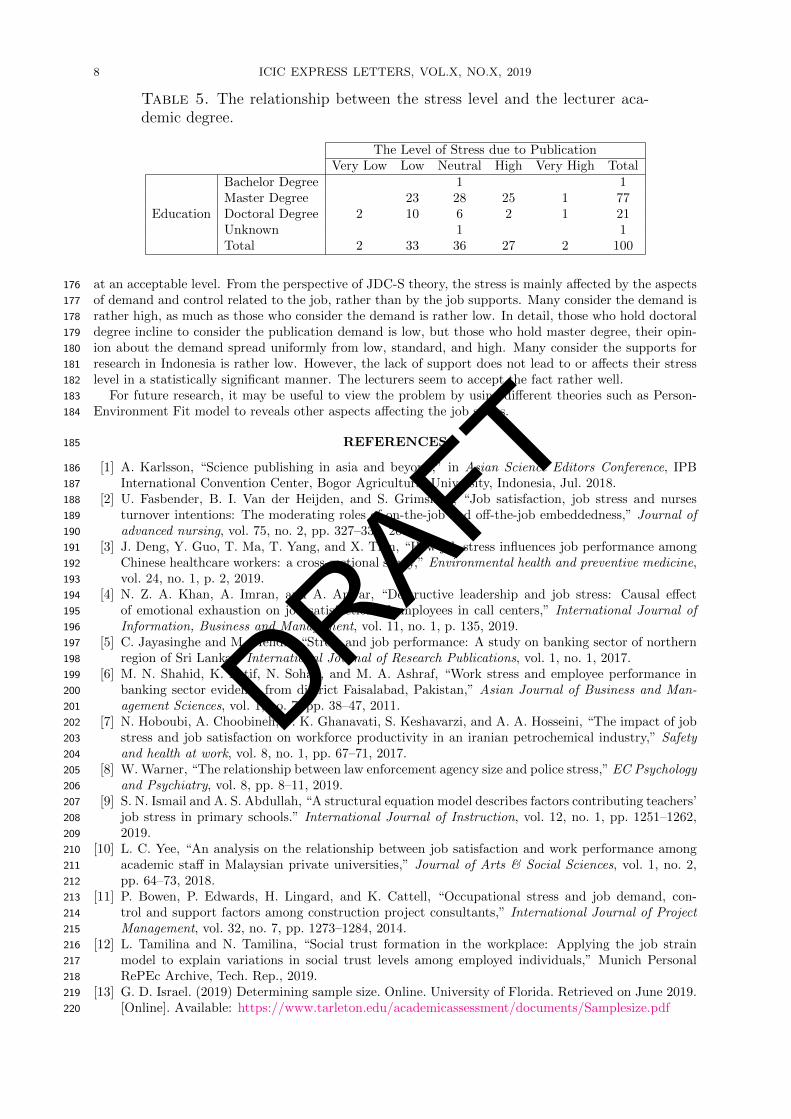
To support this conjecture, we cross-tabulate the data of Job Stress and academic degree, see Table 5.166
It shows the majority of lecturers with doctoral degree believe their stress level is low. Meanwhile, those167
who have a master degree, their opinions about this issue spread rather uniformly from low to high.168
Thus, the stress induced by the publication obligation depends on the academic degree.169
For the cases of Job Control and Job Supports, the majority of the participants agree that both factors170
are rather low. Job Stress is rather normally distributed. Interesting to see that the lack of Job Supports171
does not influence Job Stress, but the lack of Job Control affects Job Stress.172
4. Conclusion. We begin this research with interest to understand the relationship between the obliga-173
tion for scientific publication and the stress level among Indonesia lecturers. The stress level distribution,174
according to the data, tends to follow the normal distribution. For most participants, the stress level is175
DRAFT
8 ICIC EXPRESS LETTERS, VOL.X, NO.X, 2019
Table 5. The relationship between the stress level and the lecturer aca-demic degree.
The Level of Stress due to PublicationVery Low Low Neutral High Very High Total
Education
Bachelor Degree 1 1Master Degree 23 28 25 1 77Doctoral Degree 2 10 6 2 1 21Unknown 1 1Total 2 33 36 27 2 100
at an acceptable level. From the perspective of JDC-S theory, the stress is mainly affected by the aspects176
of demand and control related to the job, rather than by the job supports. Many consider the demand is177
rather high, as much as those who consider the demand is rather low. In detail, those who hold doctoral178
degree incline to consider the publication demand is low, but those who hold master degree, their opin-179
ion about the demand spread uniformly from low, standard, and high. Many consider the supports for180
research in Indonesia is rather low. However, the lack of support does not lead to or affects their stress181
level in a statistically significant manner. The lecturers seem to accept the fact rather well.182
For future research, it may be useful to view the problem by using different theories such as Person-183
Environment Fit model to reveals other aspects affecting the job stress.184
REFERENCES185
[1] A. Karlsson, “Science publishing in asia and beyond,” in Asian Science Editors Conference, IPB186
International Convention Center, Bogor Agricultural University, Indonesia, Jul. 2018.187
[2] U. Fasbender, B. I. Van der Heijden, and S. Grimshaw, “Job satisfaction, job stress and nurses188
turnover intentions: The moderating roles of on-the-job and off-the-job embeddedness,” Journal of189
advanced nursing, vol. 75, no. 2, pp. 327–337, 2019.190
[3] J. Deng, Y. Guo, T. Ma, T. Yang, and X. Tian, “How job stress influences job performance among191
Chinese healthcare workers: a cross-sectional study,” Environmental health and preventive medicine,192
vol. 24, no. 1, p. 2, 2019.193
[4] N. Z. A. Khan, A. Imran, and A. Anwar, “Destructive leadership and job stress: Causal effect194
of emotional exhaustion on job satisfaction of employees in call centers,” International Journal of195
Information, Business and Management, vol. 11, no. 1, p. 135, 2019.196
[5] C. Jayasinghe and M. Mendis, “Stress and job performance: A study on banking sector of northern197
region of Sri Lanka,” International Journal of Research Publications, vol. 1, no. 1, 2017.198
[6] M. N. Shahid, K. Latif, N. Sohail, and M. A. Ashraf, “Work stress and employee performance in199
banking sector evidence from district Faisalabad, Pakistan,” Asian Journal of Business and Man-200
agement Sciences, vol. 1, no. 7, pp. 38–47, 2011.201
[7] N. Hoboubi, A. Choobineh, F. K. Ghanavati, S. Keshavarzi, and A. A. Hosseini, “The impact of job202
stress and job satisfaction on workforce productivity in an iranian petrochemical industry,” Safety203
and health at work, vol. 8, no. 1, pp. 67–71, 2017.204
[8] W. Warner, “The relationship between law enforcement agency size and police stress,” EC Psychology205
and Psychiatry, vol. 8, pp. 8–11, 2019.206
[9] S. N. Ismail and A. S. Abdullah, “A structural equation model describes factors contributing teachers’207
job stress in primary schools.” International Journal of Instruction, vol. 12, no. 1, pp. 1251–1262,208
2019.209
[10] L. C. Yee, “An analysis on the relationship between job satisfaction and work performance among210
academic staff in Malaysian private universities,” Journal of Arts & Social Sciences, vol. 1, no. 2,211
pp. 64–73, 2018.212
[11] P. Bowen, P. Edwards, H. Lingard, and K. Cattell, “Occupational stress and job demand, con-213
trol and support factors among construction project consultants,” International Journal of Project214
Management, vol. 32, no. 7, pp. 1273–1284, 2014.215
[12] L. Tamilina and N. Tamilina, “Social trust formation in the workplace: Applying the job strain216
model to explain variations in social trust levels among employed individuals,” Munich Personal217
RePEc Archive, Tech. Rep., 2019.218
[13] G. D. Israel. (2019) Determining sample size. Online. University of Florida. Retrieved on June 2019.219
[Online]. Available: https://www.tarleton.edu/academicassessment/documents/Samplesize.pdf220