Civil Engineering Journal - Semantic Scholar
17
Available online at www.CivileJournal.org Civil Engineering Journal Vol. 4, No. 2, February, 2018 346 Study the Using of Reed Mats in Asphalt Pavement Layers Lamia Abdul Jaleel Ahmed a , Ammar Fakhir Sabri b* a Assistant Professor, University of Basra Department of Civil engineering, Basra, Iraq. b Graduate Research student, University of Basra Department of Civil engineering, Basra, Iraq. Received 23 December 2017; Accepted 24 February 2018 Abstract During the service life, the asphalt pavement layers subjected to various detrimental types of distresses such as permanent deformation, fatigue, stripping and shoving which lead to the complete failure of the pavement. In Iraq roads the permanent deformation (rutting) is the importance distresses which cause impact on the highway performance and reducing the service life of the pavement. The research aims to utilize locally available materials and environment friendly as reinforcement layer. The program of this research include preparing asphalt mixes represent surface layer by using locally available materials and using the reinforcement layer which made of reed. The permanent deformation test has been done with three temperatures (40˚C, 50˚C and 60˚C) and four locations of the reed mats. The test results of the wheel- Track for the rutting measurement showed that the rut depth decrease in reinforcement layers as compared with unreinforcement layers for all temperature testing. The reed netting embedded bottom and middle of wearing layer has the best amount of improvement (75%, 84% and 85%). Keywords: Asphalt Pavement; Distresses; Permanent Deformation; Reed; Wheel-Track; Improvement. 1. Introduction The asphaltic paving mixture during the service life it is normally subjected to various detrimental types of distresses. These distresses are caused by weather, load, construction practices and deceleration of vehicle at checkpoints, and deficient materials. Some of these serious failure includes permanent deformation or rutting, fatigue, stripping and shoving which lead to the complete failure of the pavement. Such types of failures reduce the performance of asphalt pavements, which does not cause bad ride quality to motorists, but also are caused the higher cost at life cycle, some of the mentioned distresses are related to the asphalt cement binder and it can be controlled significantly by modifying the material with chemical additives [1]. Pavement reinforcement recently became an important part of designing and rehabilitating pavement systems which improve pavement performance, increase the service life, and reduce its current premature failures [2]. Base or subbase reinforcement is defined in flexible pavements to support vehicular traffic over the pavement structure, improve the service life and obtain equivalent performance with a reduced structural section [3]. Signs of distresses in the roads due to high traffic loads and the harsh environment. The environmental variations, especially between day and night as well as between summer and winter, are greatly affected the durability of asphaltic pavement. During summer the high pavement temperature that reduces the stiffness of paving mixture that results in pavement deformation[4]. In Iraq, for a little recent year after construction the pavements, permanent deformation distress was appeared at several locations in the highways, because of the increasing of traffic loading, the hot claimant condition during summer days, and poor quality control as shown in Figure 1 [5]. * Corresponding author: [email protected] http://dx.doi.org/10.28991/cej-030996 This is an open access article under the CC-BY license (https://creativecommons.org/licenses/by/4.0/). © Authors retain all copyrights.
-
Upload
khangminh22 -
Category
Documents
-
view
2 -
download
0
Transcript of Civil Engineering Journal - Semantic Scholar

Available online at www.CivileJournal.org
Civil Engineering Journal
Vol. 4, No. 2, February, 2018
346
Study the Using of Reed Mats in Asphalt Pavement Layers
Lamia Abdul Jaleel Ahmed a, Ammar Fakhir Sabri b*
a Assistant Professor, University of Basra Department of Civil engineering, Basra, Iraq.
b Graduate Research student, University of Basra Department of Civil engineering, Basra, Iraq.
Received 23 December 2017; Accepted 24 February 2018
Abstract
During the service life, the asphalt pavement layers subjected to various detrimental types of distresses such as permanent deformation, fatigue, stripping and shoving which lead to the complete failure of the pavement. In Iraq roads the permanent deformation (rutting) is the importance distresses which cause impact on the highway performance and reducing the service life of the pavement. The research aims to utilize locally available materials and environment friendly as reinforcement layer. The program of this research include preparing asphalt mixes represent surface layer by using locally available materials and using the reinforcement layer which made of reed. The permanent deformation test has been done with three temperatures (40˚C, 50˚C and 60˚C) and four locations of the reed mats. The test results of the wheel- Track for the rutting measurement showed that the rut depth decrease in reinforcement layers as compared with unreinforcement layers for all temperature testing. The reed netting embedded bottom and middle of wearing layer has the best amount of improvement (75%, 84% and 85%).
Keywords: Asphalt Pavement; Distresses; Permanent Deformation; Reed; Wheel-Track; Improvement.
1. Introduction
The asphaltic paving mixture during the service life it is normally subjected to various detrimental types of
distresses. These distresses are caused by weather, load, construction practices and deceleration of vehicle at
checkpoints, and deficient materials. Some of these serious failure includes permanent deformation or rutting,
fatigue, stripping and shoving which lead to the complete failure of the pavement. Such types of failures reduce the
performance of asphalt pavements, which does not cause bad ride quality to motorists, but also are caused the higher
cost at life cycle, some of the mentioned distresses are related to the asphalt cement binder and it can be controlled
significantly by modifying the material with chemical additives [1]. Pavement reinforcement recently became an
important part of designing and rehabilitating pavement systems which improve pavement performance, increase the
service life, and reduce its current premature failures [2]. Base or subbase reinforcement is defined in flexible
pavements to support vehicular traffic over the pavement structure, improve the service life and obtain equivalent
performance with a reduced structural section [3]. Signs of distresses in the roads due to high traffic loads and the
harsh environment. The environmental variations, especially between day and night as well as between summer and
winter, are greatly affected the durability of asphaltic pavement. During summer the high pavement temperature that
reduces the stiffness of paving mixture that results in pavement deformation[4]. In Iraq, for a little recent year
after construction the pavements, permanent deformation distress was appeared at several locations in the highways,
because of the increasing of traffic loading, the hot claimant condition during summer days, and poor quality control
as shown in Figure 1 [5].
* Corresponding author: [email protected]
http://dx.doi.org/10.28991/cej-030996
This is an open access article under the CC-BY license (https://creativecommons.org/licenses/by/4.0/).
© Authors retain all copyrights.

Civil Engineering Journal Vol. 4, No. 2, February, 2018
347
Figure 1. Shows rutting occurring in pavement (the road located in Iraq)
2. Literature Review
Several literature on geogrid such as steel grid and reed mats reinforcing of flexible pavements, showed that the
main aim of the reinforcing. Saad (2003) examined the structural performance of a pavement foundation system
with and without the presence of geo-synthetic reinforcement [6]. The resistance to rutting tends to increase
with an increase in the maximum compressive strain transmitted to the subgrade and it is mainly dependent on the
base depth and the geo-synthetic location. Vacri (2007) [7] collects all the main results obtained from worldwide
researchers carried out by universities around the world on pavements reinforced with steel mesh reinforcements, the
main results of the researchers are: Cagliari University: the reinforcement increases the pavement life by a factor
between 3 and 12. Palermo University: stresses due to shear actions (rutting) are reduced by 50%.
Siriwardane et al. (2010) [8] states the results of an investigation on the effectiveness of geogrid as a
reinforcement of asphalt layers in flexible pavements, the vertical displacement have decreased with the inclusion of
the geogrid within the asphalt layer with an improvement of approximately 38%. Jassim (2012) [9] are using steel
reinforcement grids to study the permanent deformation in wearing course mixes under different temperatures. The
results appear that the increase of testing temperature from 30°C to 45°C decreases the number of cycles by 79.6%,
72% and 67.3% for unreinforced, middle and bottom embedded grid samples respectively. Furthermore, increasing the
temperature from 45°C to 60°C decreases the number of cycles by 75.1%, 62.4% and 58.7% for unreinforced, middle
and bottom embedded grid samples respectively. Meshoah (2012) [10] investigated the benefit of using Reed Mats in
reinforcing Flexible Pavement Section. Loading monotonic and loading repeated tests were performed, the analysis of
the results showed that an increase in the bearing capability of the pavement due to the presence of the reed mats,
where the value of stress at failure was adopted for the normal pavement condition for comparison (bottom layer +
base layer + asphalt layer) and equal to 1780 kPa and gave the following results:
Case 1: A layer of the reed mats is spread between the base layer and the asphalt layer Stress at failure = (2311)
kPa, the increase rate = (30) %.
Case 2: A layer of reed mats placed in the middle of the asphalt layer Stress at failure = (2950) kPa , the
increase rate = 66%.
Case 3: Two layers of the reed mats first between the base layer and the asphalt layer and the second placed in the
middle of asphalt layer, stress at failure = (3257) kPa, the increase rate = (93) %.
Sa'adi. et al., (2013) [11] a field full scale flexible road is constructed and the effects of geotextile reinforcement in
paved road are tested by measuring the occurred rutting. The effect of different numbers and positions of geotextile
reinforcement using seven road sections are evaluated and compared with unreinforced pavement section. It is found
that a maximum reduction of rut depth is 96% when using three reinforcement layers at three different road layers
interfaces, and a minimum reduction is 52% when using one reinforcement layer at interface I ( between wearing and
binder layers) under the effect of maximum load cycles of 10000. Qassim (2014) [12] using Mesh Steel
Reinforcement were prepared and tested in the laboratory, it appears that permanent deformation of asphaltic
pavements decreases by (41.1%) and (19.7%) for coarse and fine aggregate gradations respectively. Mohammed, D.I.,
(2015) [13] prepared a study to improve the pavement performance throughout; experimental and analytical
approaches. The results show that criteria to use two modified pavement models to improve the pavement
performance against rutting, the surface of pavement permanent deformation decreases for the modified models by
(9.3%) and (21.8%) for steel mesh and geogrid model respectively if compared with the raw material model is
recorded at 1600 cycle load. pavement permanent deformation is recorded at 1000 cycle decreases for the modified
models by (18.3%) and (27.3%) for steel mesh and geogrid model respectively if compared with the raw material
model.
Al-Essawi, (2017) [14] Investigated the benefit of Reinforcing Asphalt Concrete Mixtures by Different Geogrid
Types. The study illustrates that geogrid is very effective in reducing the deformation; the geogrid reinforcement

Civil Engineering Journal Vol. 4, No. 2, February, 2018
348
leads to the highest reduction in the permanent deformation when it is placed at the bottom, between or inside layers of
the bituminous concrete layer. The results showed that using the geogrid between and bottom of pavement layer for
three types of geogrid (Tensar SS2 Geogrid , Steel grid ,and Netlon CE121 Geogrid), the rutting percent at (40º C)
has decreased by (34%,44% and 54% ) respectively, the percent at 50º C has decreased by (35%,45% and 55%)
respectively and the percent at 60º C decreased by (38%, 48% and 59%) respectively. The main objectives of the
research is studying the effect of using reed netting in different modes of layering of flexible pavements in order
to improve the resistance of asphalt mixtures against permanent deformation (rutting) and determine the appropriate
position for reed netting.
3. Material Properties
The materials used in this study are widely available and currently used in road paving in Iraq except the reed
netting that are available in local market in Basra.
3.1. Asphalt Cement
The asphalt cement used in this study is of (40-50) penetration grade, and brought from Al- Basra refinery. Table 1.
shows the physical properties of Asphalt Cement.
Table 1. Physical properties of asphalt cement
Test Test Conditions ASTM
Designation Units
Penetration Grade 40-50
Test
Results
SCRB/ R9
Specification 2003
Penetration 100 gm, 25°C, 5 sec.,
(0.1mm) D-5 1/10 mm 43 40-50
Ductility 25°C, 5cm/min D-113 cm >100 >100
Flash Point …… D-92 °C 330 >232
Specific Gravity 25°C D-70 …… 1.02 1.01-1.05
Softening Point (4±1) °C/min. D-36 °C 58 51-62
3.2. Aggregate
The (crushed) aggregate used in this work is brought from AL-Thariat factory. The physical properties of the
aggregate (coarse and fine) are shown in Table 2. One type of mineral filler is used: ordinary Portland cement. It is
thoroughly dry and free from lumps or aggregations of fine particles.
Table 2. Physical properties of aggregates
No. Laboratory Test ASTM Designation Test Results
Coarse Aggregate
1 Bulk Specific Gravity C-127 2.54
2 Apparent Specific Gravity C-127 2.60
3 Percent Water Absorption C-127 0.7
Fine Aggregate
1 Bulk Specific Gravity C-128 2.63
2 Apparent Specific Gravity C-128 2.69
3 Percent Water Absorption C-128 0.71
3.2.1. Aggregate Gradation
The coarse and fine aggregates sieved and separated to various sizes. Trial and error method has been used to find
the aggregates and cement ratios, calculate the limits of the mixing equation as well as the ratios of the mixture
equation for the wearing course as shown in Table 3. and Figure 2. which meets the Iraqi specification limits [SCRB
2003/R9].

Civil Engineering Journal Vol. 4, No. 2, February, 2018
349
Table 3. Selected gradations for asphalt concrete mixtures
Sieve size
(mm)
Course
Aggregate
%
Medium
Aggregate
%
Fine
Aggregate
%
Crushed
Aggregate
%
River
Sand
%
Cement
%
The mixture
Equation
Ratios
The Mixture
Equation
Limits
Iraqi
Specification
Limits
19 100 100 100 100 100 100 100 100 100
12.5 38 100 100 100 100 100 94 90-100 90-100
9.5 ---- 42 100 100 98 100 81 76-87 76-90
4.75 ---- ---- 19 100 95 100 54 46-60 44-74
2.36 ----- ---- ---- 93 85 100 46 42-50 28-58
0.3 ---- ---- ---- 18 5 100 11 7-15 5-21
0.075 ---- ---- ---- 1 ---- 95 5 4-7 4-10
The
supposed
mixture
ratios
10 15 25 30 15 5 ---- ---- ----
Figure 2. Specification limits and selected mid-point gradation of the mixture equation ratios for wearing course layer
3.3. Reed Netting Reinforcement
Types of geo-synthetics are (Geogrids (GG), Geotextiles (GT)) both types are used widely in the reinforcement of
pavement [15]. Geogrids are structured polymeric materials usually made from sheets of high-density polyethylene
(HDPE) or polypropylene (HDPP), the improvement in such material depends on many factors such as the type of
geo-synthetic, the process of manufacturing, mechanical properties, the location of placement in asphalt concrete, and
layering; base course thickness and quality. All the geo-synthetics materials are not available in Iraq and need to
import. The type of reed netting which used in this study is (phragmites gragmites), manufactured as a rectangular
netting to be used as a reinforcement interlayer material as shown in Figure 3. The advantages of reed mats are
obtainable in Iraq, very cheap, environment friendly and don’t need to manufacture. The Properties of reed netting
used and tension test for reed sample are illustrated in Table 4 and Figure 4, respectively.
Figure 3. Reed netting
0
20
40
60
80
100
120
0.01 0.1 1 10 100
Percen
t P
ass
ing
Weig
ht
Of
To
tal
Ag
greg
ate
%
Seive Size (mm)
slected limited
min. limit
max.limit

Civil Engineering Journal Vol. 4, No. 2, February, 2018
350
Table 4. Properties of reed netting used
Item Property Test method Unit Data
1 Dimensions - mm*mm 390*290
2 Thickness - mm 25
3 Mass per unit area - g/m2 1370
4 color - - Shiny yellow
5 Tension Test(load-deformation) Tensile Testing Machine (kN – mm) 33.8 - 21
Figure 4. Tension test for reed samples
3.4. Marshall Mix Design
Marshall Mix design has been used to obtain the optimum binder asphalt content. This method covers the
measurement of the resistance to plastic flow of cylindrical specimens of bituminous paving mixtures loaded on the
lateral surface by means of the Marshall apparatus according to ASTM (D 1559). The optimum asphalt content for
wearing layers is found 5%. Marshall Properties of (wearing) mixes were meeting the standard Iraqi specification
requirements (SCRB, R/9 2003) as shown in Table 5. This optimum content has been adopted in the method of
preparing all the slab specimens of asphalt mixtures to perform the Wheel Tracking Test.
Table 5. Mixtures properties at optimum asphalt contents
Item Test method Results S.C.R.B
Specification Requirements
1 Marshall Stability (kN) 9 Min-8
2 Marshall Flow(mm) 2.8 (2-4)
3 Optimum Asphalt Content 5 (4-6)%
4 Bulk Density (gm/𝑐𝑚3) 2.35 ….
5 Air Voids in Total Mix V.T.M% 3 (3-5)%
6 Void in mineral aggregate V.M.A% 15.75 14 min
7 Void filled with bitumen VFB% 81 (70-85)%
8 Asphalt Grade 40-50
3.5. Calculation of Equivalent Base Thickness for Mold and Moving Plate
Base for mold is made with thickness of 20 mm according to the following calculation for equivalent thickness of
steel instead of two layer of asphalt, layer of subbase and layer of subgrade.
Assume E steel = 3 × 10⁷ psi
E binder = 3.5 × 10⁵ psi and thickness 7 cm
E stabilizer = 3 × 10⁵ psi and thickness 10 cm
E subbase = 5 × 10³ psi and thickness 30 cm
E subgrade = 1.5 × 10³ psi and thickness 50 cm
E steel d3 = E binder d3 + E stabilizer d3 + E subbase d3 + E subgrade d3
Civil Engineering Journal Vol. 4, No. 2, February, 2018
351
3 × 10⁷ × d3 steel = 3.5 × 105 × 2.73 +3× 105*3.93 + 5 × 103 × 11.83 +1.5× 103 × 19.63
d steel = 1.14 inches = 29 mm
It can be seen that 29 mm the thickness required of steel to be equivalent for the layers of asphalt, subbase and
subgrade so that the moving stage is made from plate with thickness 20 mm , the total base will be 50 mm of steel
from calculation , Figure 5 shows the equivalent base for mold.
Figure 5. Equivalent steel base of mold
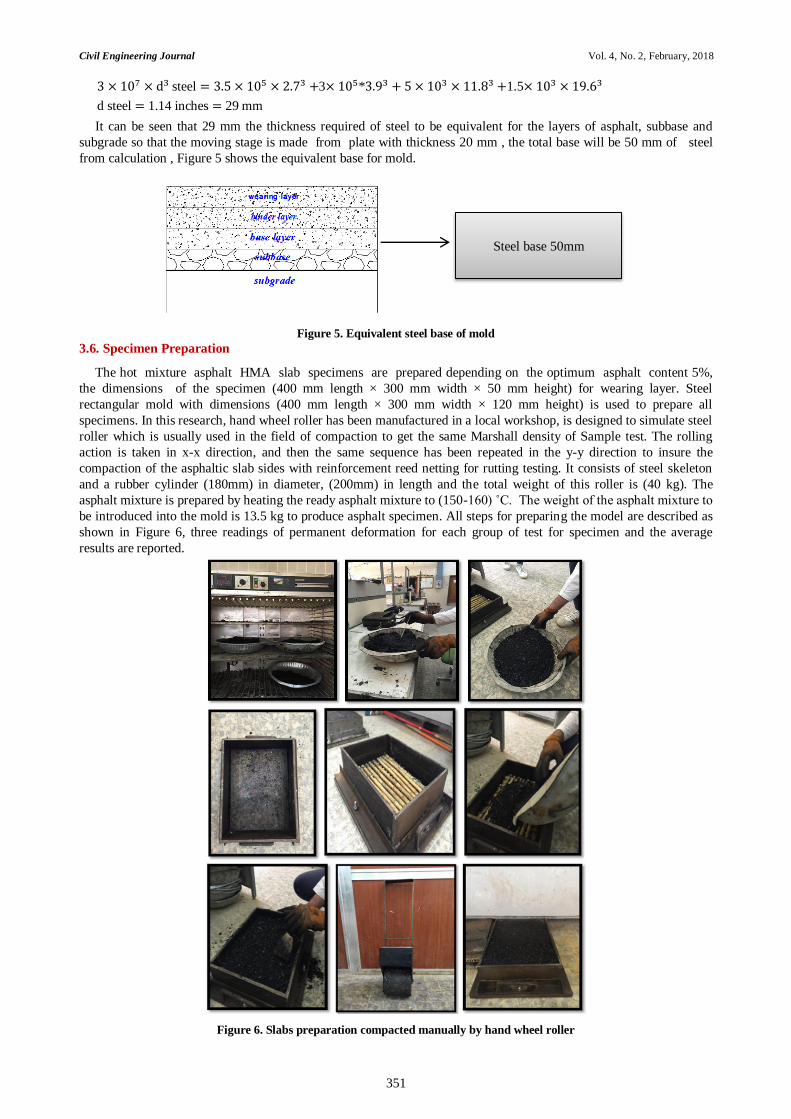
3.6. Specimen Preparation
The hot mixture asphalt HMA slab specimens are prepared depending on the optimum asphalt content 5%,
the dimensions of the specimen (400 mm length × 300 mm width × 50 mm height) for wearing layer. Steel
rectangular mold with dimensions (400 mm length × 300 mm width × 120 mm height) is used to prepare all
specimens. In this research, hand wheel roller has been manufactured in a local workshop, is designed to simulate steel
roller which is usually used in the field of compaction to get the same Marshall density of Sample test. The rolling
action is taken in x-x direction, and then the same sequence has been repeated in the y-y direction to insure the
compaction of the asphaltic slab sides with reinforcement reed netting for rutting testing. It consists of steel skeleton
and a rubber cylinder (180mm) in diameter, (200mm) in length and the total weight of this roller is (40 kg). The
asphalt mixture is prepared by heating the ready asphalt mixture to (150-160) ˚C. The weight of the asphalt mixture to
be introduced into the mold is 13.5 kg to produce asphalt specimen. All steps for preparing the model are described as
shown in Figure 6, three readings of permanent deformation for each group of test for specimen and the average
results are reported.
Figure 6. Slabs preparation compacted manually by hand wheel roller
Steel base 50mm
Civil Engineering Journal Vol. 4, No. 2, February, 2018
352
4. Testing Methods
The experimental program conducted in this work was designed through laboratory tests to investigate and evaluate
the effects of reinforcing asphalt mixtures with reed netting against the main expected distresses in flexible pavement.
Specifically the following test method was considered in the program of this work:
4.1. Permanent Deformation Test
Permanent deformation is considered the major distress in flexible pavements in Iraq and has a major impact on
pavement performance. The accumulation of plastic deformations in asphalt layers is now recognized to be one of the
major components of rutting in flexible pavements due to the increasing of axle loads and climate conditions. The
basic types of rutting are: rutting occurs in HMA and subbase or subgrade rutting when the pavement surface exhibits
wheel path depressions as a result of compaction and inadequate mix design, the permanent deformation of asphalt
mixture occurs. Also, granular material/subgrade rutting occurs when the layers exhibit wheel path depressions caused
by excessive loading. To study the permanent deformation phenomena for both reinforced and unreinforced asphalt
samples, the wheel tracking device was used, so the asphaltic slab samples were prepared for this test.
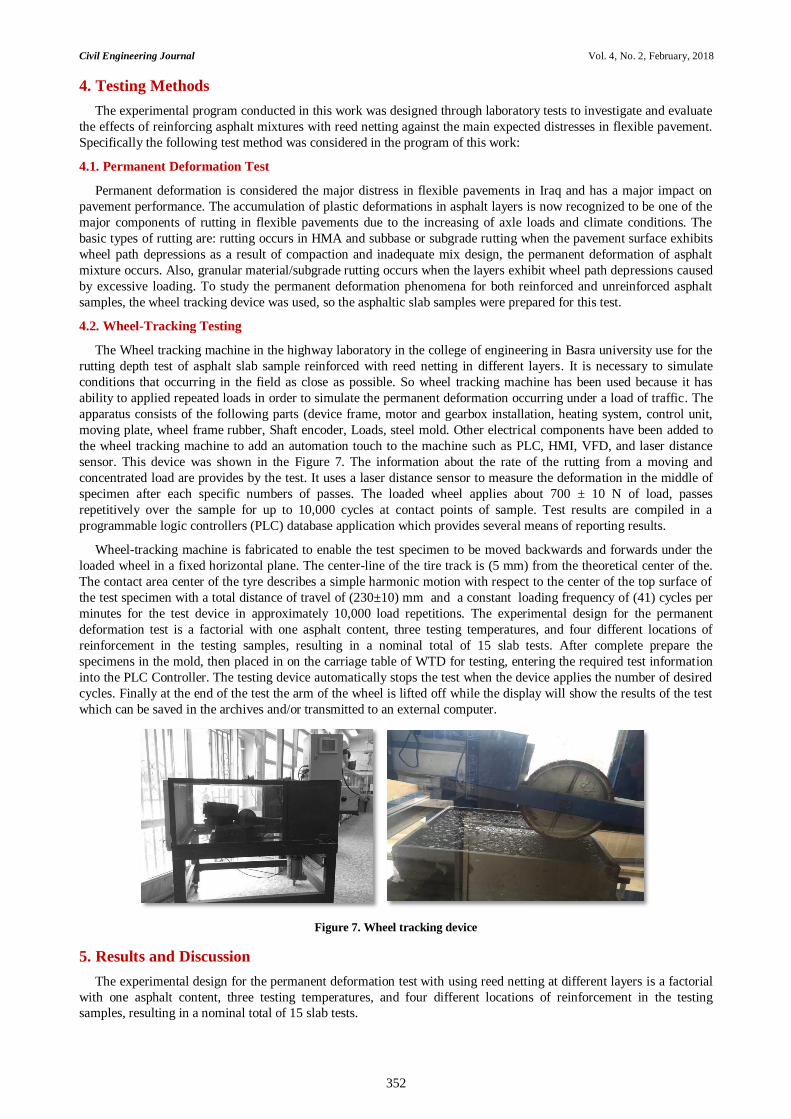
4.2. Wheel-Tracking Testing
The Wheel tracking machine in the highway laboratory in the college of engineering in Basra university use for the
rutting depth test of asphalt slab sample reinforced with reed netting in different layers. It is necessary to simulate
conditions that occurring in the field as close as possible. So wheel tracking machine has been used because it has
ability to applied repeated loads in order to simulate the permanent deformation occurring under a load of traffic. The
apparatus consists of the following parts (device frame, motor and gearbox installation, heating system, control unit,
moving plate, wheel frame rubber, Shaft encoder, Loads, steel mold. Other electrical components have been added to
the wheel tracking machine to add an automation touch to the machine such as PLC, HMI, VFD, and laser distance
sensor. This device was shown in the Figure 7. The information about the rate of the rutting from a moving and
concentrated load are provides by the test. It uses a laser distance sensor to measure the deformation in the middle of
specimen after each specific numbers of passes. The loaded wheel applies about 700 ± 10 N of load, passes
repetitively over the sample for up to 10,000 cycles at contact points of sample. Test results are compiled in a
programmable logic controllers (PLC) database application which provides several means of reporting results.
Wheel-tracking machine is fabricated to enable the test specimen to be moved backwards and forwards under the
loaded wheel in a fixed horizontal plane. The center-line of the tire track is (5 mm) from the theoretical center of the.
The contact area center of the tyre describes a simple harmonic motion with respect to the center of the top surface of
the test specimen with a total distance of travel of (230±10) mm and a constant loading frequency of (41) cycles per
minutes for the test device in approximately 10,000 load repetitions. The experimental design for the permanent
deformation test is a factorial with one asphalt content, three testing temperatures, and four different locations of
reinforcement in the testing samples, resulting in a nominal total of 15 slab tests. After complete prepare the
specimens in the mold, then placed in on the carriage table of WTD for testing, entering the required test information
into the PLC Controller. The testing device automatically stops the test when the device applies the number of desired
cycles. Finally at the end of the test the arm of the wheel is lifted off while the display will show the results of the test
which can be saved in the archives and/or transmitted to an external computer.
Figure 7. Wheel tracking device
5. Results and Discussion
The experimental design for the permanent deformation test with using reed netting at different layers is a factorial
with one asphalt content, three testing temperatures, and four different locations of reinforcement in the testing
samples, resulting in a nominal total of 15 slab tests.

Civil Engineering Journal Vol. 4, No. 2, February, 2018
353
5.1. Effect of Reinforcement Reed Netting Location on Permanent Deformation (Rutting) for Asphalt Concrete
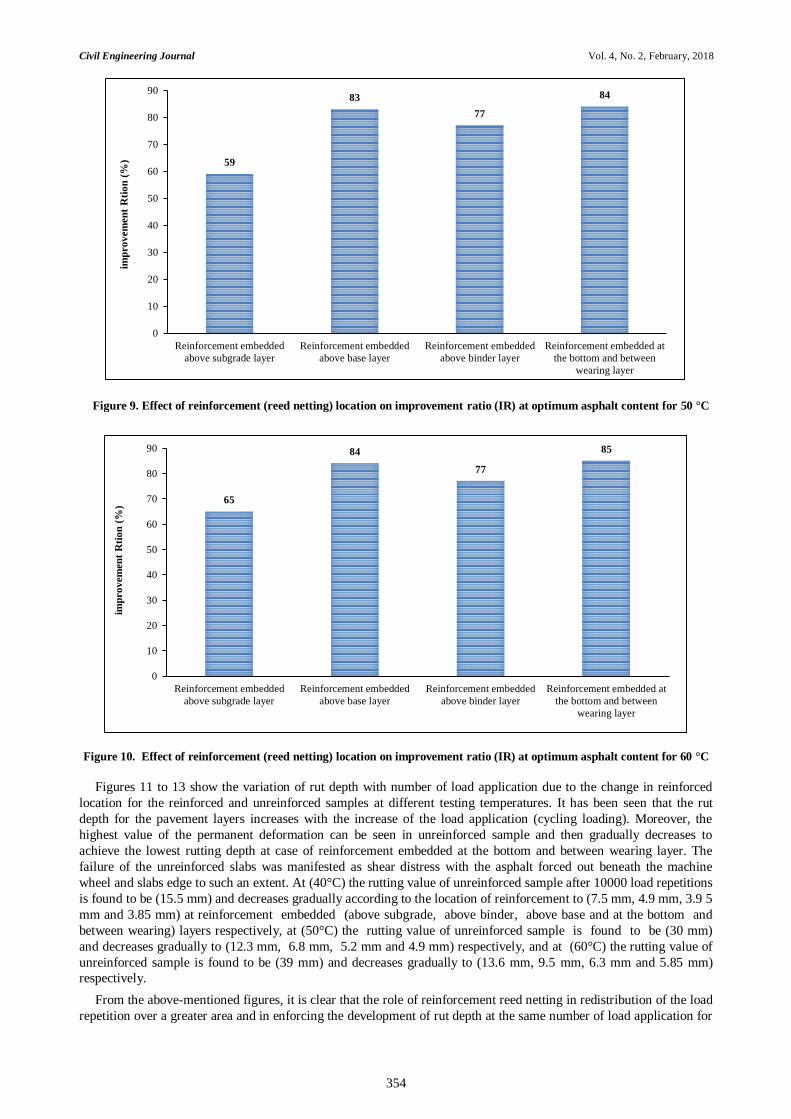
Table 6 explains Improvement Ratio (IR) for the reinforced samples as compared with the unreinforced samples for
the permanent deformation test. Figures 8 to 10. show that the improvement ratio for reinforced specimens at optimum
asphalts content 5% for different temperatures. These figures compare Improvement Ratio at 10000 load repetition of
each reinforcement location in a histogram form. At (40°C) it is clearly showed that the higher improvement ratio can
be noticed in two cases of reinforcement embedded above base layer and embedded at the bottom and between
wearing layer (double reinforcement) (75%), while the lowest improvement ratio can be observed in reinforcement
embedded above subgrade layer (52%), at (50°C) the higher improvement ratio can be noticed in double
reinforcement for wearing layer (84%), while the lowest improvement ratio can be observed in reinforcement
embedded above subgrade layer (59%) and at (60°C) the higher improvement ratio can be noticed also in double
reinforcement for wearing layer (85%), while the lowest improvement ratio can be observed in reinforcement
embedded above subgrade layer (65%). These figures show that an improvement was observed in rutting behavior at
different location of reinforcement for different testing temperatures.
Table 6. Improved ratio for the reinforced samples compared to control samples
Reinforcement Location Temperature (ºC) Cycle (N) Improvement Ratio (IR) (%)
Embedded Above Subgrade layer
40
10000
52
50 59
60 65
Embedded Above Base layer
40 75
50 83
60 84
Embedded Above Binder layer
40 68
50 77
60 77
Embedded at the bottom and between wearing layer (double reinforcement sample)
40 75
50 84
60 85
Figure 8. Effect of reinforcement (reed netting) location on improvement ratio (IR) at optimum asphalt for 40 °C
52
75
68
75
0
10
20
30
40
50
60
70
80
Reinforcement embedded
above subgrade layer
Reinforcement embedded
above base layer
Reinforcement embedded
above binder layer
Reinforcement embedded
at the bottom and between
wearing layer
Imp
ro
vem
en
t R
tio
n (
%)
Civil Engineering Journal Vol. 4, No. 2, February, 2018
354
Figure 9. Effect of reinforcement (reed netting) location on improvement ratio (IR) at optimum asphalt content for 50 °C
Figure 10. Effect of reinforcement (reed netting) location on improvement ratio (IR) at optimum asphalt content for 60 °C
Figures 11 to 13 show the variation of rut depth with number of load application due to the change in reinforced
location for the reinforced and unreinforced samples at different testing temperatures. It has been seen that the rut
depth for the pavement layers increases with the increase of the load application (cycling loading). Moreover, the
highest value of the permanent deformation can be seen in unreinforced sample and then gradually decreases to
achieve the lowest rutting depth at case of reinforcement embedded at the bottom and between wearing layer. The
failure of the unreinforced slabs was manifested as shear distress with the asphalt forced out beneath the machine
wheel and slabs edge to such an extent. At (40°C) the rutting value of unreinforced sample after 10000 load repetitions
is found to be (15.5 mm) and decreases gradually according to the location of reinforcement to (7.5 mm, 4.9 mm, 3.9 5
mm and 3.85 mm) at reinforcement embedded (above subgrade, above binder, above base and at the bottom and
between wearing) layers respectively, at (50°C) the rutting value of unreinforced sample is found to be (30 mm)
and decreases gradually to (12.3 mm, 6.8 mm, 5.2 mm and 4.9 mm) respectively, and at (60°C) the rutting value of
unreinforced sample is found to be (39 mm) and decreases gradually to (13.6 mm, 9.5 mm, 6.3 mm and 5.85 mm)
respectively.
From the above-mentioned figures, it is clear that the role of reinforcement reed netting in redistribution of the load
repetition over a greater area and in enforcing the development of rut depth at the same number of load application for
59
83
77
84
0
10
20
30
40
50
60
70
80
90
Reinforcement embedded
above subgrade layer
Reinforcement embedded
above base layer
Reinforcement embedded
above binder layer
Reinforcement embedded at
the bottom and between
wearing layer
imp
ro
vem
en
t R
tio
n (
%)
65
84
77
85
0
10
20
30
40
50
60
70
80
90
Reinforcement embedded
above subgrade layer
Reinforcement embedded
above base layer
Reinforcement embedded
above binder layer
Reinforcement embedded at
the bottom and between
wearing layer
imp
ro
vem
en
t R
tio
n (
%)

Civil Engineering Journal Vol. 4, No. 2, February, 2018
355
reinforced and unreinforced samples, where the improvement provided by reed netting reinforcement is manifested
primarily at intermediate and high temperatures rather than low temperatures.
Figure 11. Variation of rut depth with number of load application at 40°C
Figure 12. Variation of rut depth with number of load application at 50°C
Figure 13. Variation of rut depth with number of load application at 60°C
0
5
10
15
20
0 2000 4000 6000 8000 10000
Ru
t D
ep
th (
mm
)
No. of Load Application
unreinforced sample
Reinforcement embedded above subgrade layer
Reinforcement embedded above Base Layer
Reed mats above Binder Layer
Reinforcement embedded at the bottom and between wearing layer
0
5
10
15
20
25
30
35
0 2000 4000 6000 8000 10000
Ru
t D
ep
th (
mm
)
NO. of Load Application
unreinforced sample
Reinforcement embedded above subgrade layer
Reinforcement embedded above Base Layer
Reinforcement embedded above Binder Layer
Reinforcement embedded at the bottom and between wearing layer
0
5
10
15
20
25
30
35
40
45
0 2000 4000 6000 8000 10000
Ru
t D
ep
th (
mm
)
No. of Load Appliication
unreinforced sample
Reinforcement embedded above subgrad layer
Reinforcement embedded above Base Layer
Reinforcement embedded above Binder Layer
Reinforcement embedded at the bottom and between wearing layer
Civil Engineering Journal Vol. 4, No. 2, February, 2018
356
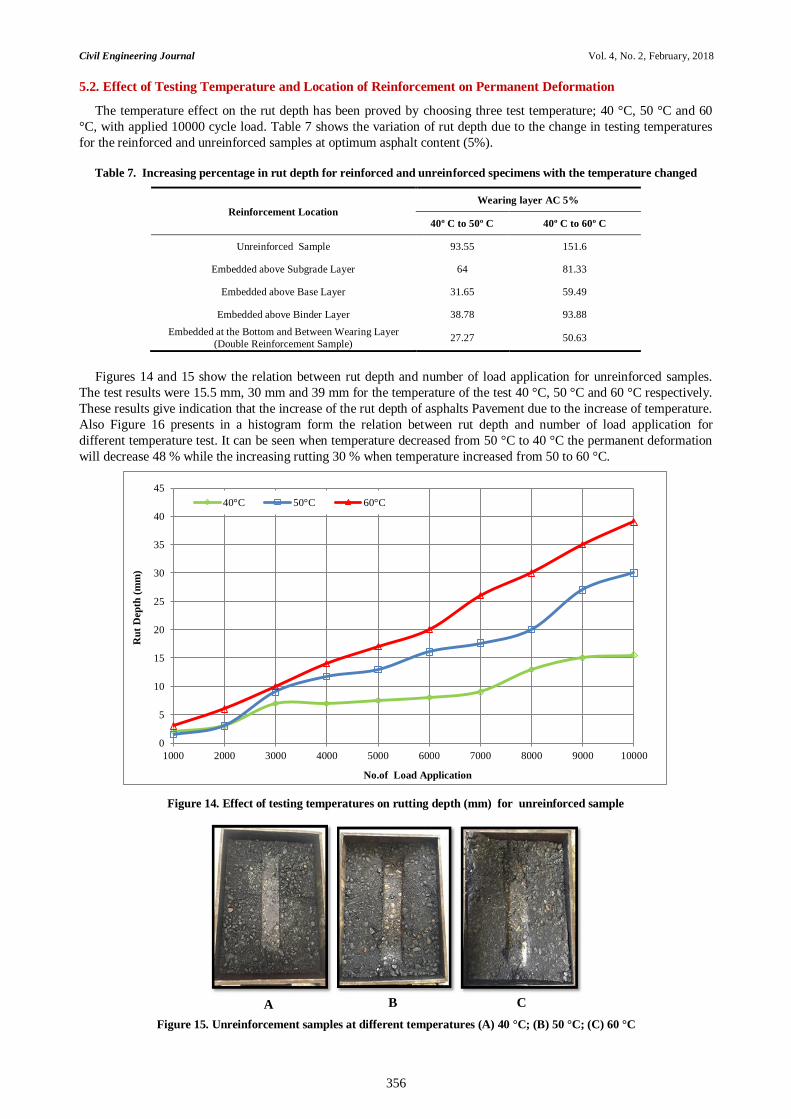
5.2. Effect of Testing Temperature and Location of Reinforcement on Permanent Deformation
The temperature effect on the rut depth has been proved by choosing three test temperature; 40 °C, 50 °C and 60
°C, with applied 10000 cycle load. Table 7 shows the variation of rut depth due to the change in testing temperatures
for the reinforced and unreinforced samples at optimum asphalt content (5%).
Table 7. Increasing percentage in rut depth for reinforced and unreinforced specimens with the temperature changed
Reinforcement Location
Wearing layer AC 5%
40º C to 50º C 40º C to 60º C
Unreinforced Sample 93.55 151.6
Embedded above Subgrade Layer 64 81.33
Embedded above Base Layer 31.65 59.49
Embedded above Binder Layer 38.78 93.88
Embedded at the Bottom and Between Wearing Layer
(Double Reinforcement Sample) 27.27 50.63
Figures 14 and 15 show the relation between rut depth and number of load application for unreinforced samples.
The test results were 15.5 mm, 30 mm and 39 mm for the temperature of the test 40 °C, 50 °C and 60 °C respectively.
These results give indication that the increase of the rut depth of asphalts Pavement due to the increase of temperature.
Also Figure 16 presents in a histogram form the relation between rut depth and number of load application for
different temperature test. It can be seen when temperature decreased from 50 °C to 40 °C the permanent deformation
will decrease 48 % while the increasing rutting 30 % when temperature increased from 50 to 60 °C.
Figure 14. Effect of testing temperatures on rutting depth (mm) for unreinforced sample
Figure 15. Unreinforcement samples at different temperatures (A) 40 °C; (B) 50 °C; (C) 60 °C
0
5
10
15
20
25
30
35
40
45
1000 2000 3000 4000 5000 6000 7000 8000 9000 10000
Ru
t D
ep
th (
mm
)
No.of Load Application
40°C 50°C 60°C
A B C

Civil Engineering Journal Vol. 4, No. 2, February, 2018
357
Figure 16. The relation between rut depth and number of load application for unreinforced samples at different
temperatures
Figures 17 and 18 show the relation between rut depth and number of load application for reinforcement embedded
above subgrade layer. The test results were 7.5, 12.3 and 13.6 mm for the temperature of the test 40°C, 50 °C and 60
°C respectively. These results give indication that the increase of the rut depth of asphalts Pavement due to the
increase of temperature. Also Figure 19. presents in a histogram form the relation between rut depth and number of
load application for different temperature test. It can be seen when temperature decreased from 50 °C to 40 °C the
permanent deformation will decrease 39 % while the increasing rutting 10.6 % when temperature increased from 50 to
60 °C.
Figure 17. Effect of testing temperatures on rutting depth (mm) for reinforcement embedded at above subgrade layer
Figure 18. Reinforcement embedded at above subgrade layer at different temperatures (A) 40 °C; (B) 50 °C; (C) 60 °C
0
5
10
15
20
25
30
35
40
45
1000 2000 3000 4000 5000 6000 7000 8000 9000 10000
Ru
t d
ep
th (
mm
)
No.of Load Application
40°C 50°C 60°C
0
2
4
6
8
10
12
14
16
1000 2000 3000 4000 5000 6000 7000 8000 9000 10000
Ru
t D
ep
th (
mm
)
No.of Load Application
40°C 50°C 60°C
A B C

Civil Engineering Journal Vol. 4, No. 2, February, 2018
358
Figure 19. The relation between rut depth and number of load application for reinforcement embedded above subgrade
layer at different temperatures
Figures 20 and 21 show the relation between rut depth and number of load application for reinforcement embedded
above base layer. The test results were 3.95, 5.2 and 6.3 mm for the temperature of the test 40 °C, 50 °C and 60 °C
respectively. These results give indication that the increase of the rut depth of asphalts Pavement due to the increase of
temperature. Also Figure 22 presents in a histogram form the relation between rut depth and number of load
application for different temperature test. It can be seen when temperature decreased from 50 °C to 40 °C the
permanent deformation will decrease 24 % while the increasing rutting 21 % when temperature increased from 50 to
60 °C.
Figure 20. Effect of testing temperatures on rutting depth (mm) for reinforcement embedded at above base layer
Figure 21. Reinforcement embedded at above base layer at different temperatures (A) 40 °C; (B) 50 °C; (C) 60 °C
0
2
4
6
8
10
12
14
16
1000 2000 3000 4000 5000 6000 7000 8000 9000 10000
Ru
t d
ep
th (
mm
)
No.of Load Application
40°C 50°C 60°C
0
1
2
3
4
5
6
7
1000 2000 3000 4000 5000 6000 7000 8000 9000 10000
Ru
t D
ep
th (
mm
)
No.of Load Application
40°C 50°C 60°C
A B C

Civil Engineering Journal Vol. 4, No. 2, February, 2018
359
Figure 22. The relation between rut depth and number of load application for reinforcement embedded above base layer at
different temperatures
Figure 23 and 24 show the relation between rut depth and number of load application for reinforcement embedded
above binder layer. The test results were 4.9 mm, 6.8 mm and 9.5 mm for the temperature of the test 40, 50 and 60 °C
respectively. These results give indication that the increase of the rut depth of asphalts Pavement due to the increase of
temperature. Also Figure 25 presents in a histogram form the relation between rut depth and number of load
application for different temperature test. It can be seen when temperature decreased from 50 to 40°C the permanent
deformation will decrease 28 % while the increasing rutting 39.7 % when temperature increased from 50 to 60 °C.
Figure 23. Effect of testing temperatures on rutting depth (mm) for reinforcement embedded at above binder layer
Figure 24. Reinforcement embedded at above binder layer at different temperatures (A) 40 °C; (B) 50 °C; (C) 60 °C
0
1
2
3
4
5
6
7
1000 2000 3000 4000 5000 6000 7000 8000 9000 10000
Ru
t d
ep
th (
mm
)
No.of Load Application
40°C 50°C 60°C
0
1
2
3
4
5
6
7
8
9
10
1000 2000 3000 4000 5000 6000 7000 8000 9000 10000
Ru
t D
ep
th (
mm
)
No.of Load Application
40°C 50°C 60°C
A B C

Civil Engineering Journal Vol. 4, No. 2, February, 2018
360
Figure 25. The Relation between Rut Depth and Number of Load Application for Reinforcement Embedded Above Binder
Layer at Different Temperatures
Figures 26 and 27 show the relation between rut depth and number of load application for reinforcement embedded
at bottom and other is embedded at middle of wearing layer. The test results were 3.85, 4.9 and 5.85 mm for the
temperature of the test 40 °C, 50 °C and 60 °C respectively. These results give indication that the increase of the rut
depth of asphalts Pavement due to the increase of temperature. Also Figure 28 presents in a histogram form the
relation between rut depth and number of load application for different temperature test. It can be seen when
temperature decreased from 50 °C to 40 °C the permanent deformation will decrease 21 % while the increasing rutting
19 % when temperature increased from 50 to 60 °C. According to these figures, the reducing in the viscosity of the
binder causing increase in the permanent deformation due to the temperature increasing. The use of reed netting
modified the performance of HMA. Generally, the permanent deformation at higher temperatures occurs due to
pavement consolidation.
Figure 26. Effect of testing temperatures on rutting depth (mm) for reinforcement embedded at bottom and other is
embedded at middle of wearing layer
Figure 27. Reinforcement embedded at bottom and other is embedded at middle of wearing layer at different temperatures
(A) 40 °C; (B) 50 °C; (C) 60 °C
0
1
2
3
4
5
6
7
8
9
10
1000 2000 3000 4000 5000 6000 7000 8000 9000 10000
Ru
t d
epth
(m
m)
No.of Load Application
40°C 50°C 60°C
0
1
2
3
4
5
6
7
1000 2000 3000 4000 5000 6000 7000 8000 9000 10000
Ru
t D
ep
th (
mm
)
No.of Load Application
40°C 50°C 60°C
A B C

Civil Engineering Journal Vol. 4, No. 2, February, 2018
361
Figure 28. The relation between rut depth and number of load application for reinforcement embedded at bottom and other
is embedded at middle of wearing layer at different temperatures
6. Conclusion
From the results of the present study, the important conclusions are as follows:
In general, it is concluded that, the reinforcement reed netting improve the structural performance of flexible
pavement against the main distresses (permanent deformation).
The value of improvement ratio increase when the temperature testing increased.
The best position of the reed netting in all investigated flexible pavement sections at reinforcement
embedded at the bottom and between wearing layer (double reinforcement sample), where the best
improvement ratio in reed netting at 60 ºC was ( 85%), then the reinforcement embedded above binder layer
was (77%).
The study shows that reed netting is very effective in reducing the rut depth, when the reed netting
reinforcement embedded bottom and middle of wearing layer; it leads to the highest reduction in the
permanent deformation. The test results of the wheel- Track for the rutting measurement were showed that,
when placing the reed netting above the subgrade layer the amount of improvement in the layer (52%,
59% and 65%) respectively, for different temperatures. When placing the reed netting above the base
layer the amount of improvement in the layer (75%, 83% and 84%) respectively, for different
temperatures. When placing the reed netting above the binder layer the amount of improvement in the
layer (68%, 77% and 77%) respectively, for different temperatures and the reed netting embedded bottom
and middle of wearing layer the amount of improvement (75%, 84% and 85%).
7. References
[1] Taha, R., G. Ali, and M. Delwar. '' Evaluation of Coke Dust-Modified Asphalt Using Superpave." Journal of materials in civil
engineering, 1998: https://doi.org/10.1061/(asce)0899-1561(1998)10:3(174) .
[2] Al-Qadi I.L. and Appea A.K. '' Eight-Year of Filed Performance of A Secondary Road Incorporating Geosynthetics at the
Subgrade-Base Interface.'' Transportation Research Board, 82rd Annual Meeting, Washington. D.C. (2003):
https://doi.org/10.3141/1849-23
[3] Appea, A.K., “in-situ behavior of geosynthetically stabilized flexible pavement” M.SC. Thesis, Virginia state university, USA,
1997. http://doi=10.1.1.411.374
[4] Al-Moula, Z. I. Q. ''Prediction Model for Pavement Deformation of Superpave Asphalt Concrete Mixtures.'', Ph.D. Dissertation,
College of Engineering, Baghdad University. (2012).
[5] Yassoub, N. “Prediction Model of Rutting Potential in Flexible Pavements”,Ph. D Thesis,Civil Engineering, University of
Baghdad,(2005).
[6] Saad, B.,“Dynamic Finite element Analysis of flexible Pavement system with Geosynthetic reinforcement”, MSC thesis,
Concordia university, Monterial, Canada.(2003). https://spectrum.library.concordia.ca/2080/1/MQ77963.pdf
[7] Vacri M., “Reinforcement with Double Twist Steel Wire Mesh Modeling and Laboratory Experiences to Evaluate the
Improvement of Asphalt Pavements”, 4th International SIIV Congress, Palermo, Italy. (2007).
0
1
2
3
4
5
6
7
1000 2000 3000 4000 5000 6000 7000 8000 9000 10000
Ru
t d
ep
th (
mm
)
No.of Load Application
40°C 50°C 60°C

Civil Engineering Journal Vol. 4, No. 2, February, 2018
362
[8] Siriwardane, H.; Gondle,R.; Bora K. ‘‘Analysis of flexible pavements reinforced with geogrid’’ Geotechnical and
Geological Engineering. Vol .28, p. 287-297. 2010. https://doi.org/10.1007/s10706-008-9241-0
[9] Jassim, N. H., “Experimental Investigation and Analytical Modeling of Reinforced Flexible Pavement.” M.Sc. Thesis,
Highway and Transportation Engineering Department, College of Engineering, Al-Mustansiriya University, Iraq, 2012.
http://businessdocbox.com/amp/67862509-Construction/Experimental-study-on-surface-steel-reinforcement-for-asphalt
pavements.html
[10] Meshoah, O.A. , '' Reinforcing a Selected Flexible Pavement Section using Geogrid Layers or Reed Mats'' , M.Sc.
Thesis, Building and Construction Engineering Department, University Of Technology,Iraq ,2012.
[11] AL Sa'adi, A.H.M., Al-Maimuri , N.M.L., and Al-mamany, D.A.O., ''Effect of Geotextile Reinforcement on
Flexible Pavement Roads'' ,Eng. & Tech. Journal, Vol. Part (A), No. 20, (2013).
[12] Qassim ,Z.,I., ''Contributory Factors Related to Permanent Deformation and Moisture Sensitivity of Hot Mix
Asphalt'' , M.Sc. Thesis, Baghdad University, Iraq, (2014).
[13] Mohammed, D.I., ''Developing a Criteria to Improve Permanent Deformation of Pavement Layers on Weak
Subgrade Soil'', M.Sc. Thesis, Highway and Transportation Engineering Department, College of Engineering, Al-
Mustansiriya University, Iraq, (2015). doi: 10.1016/j.proeng.2016.06.145
[14] Al-Essawi, M.K., ''Investigation of Reinforcing Modified Asphalt Concrete Mixtures by Different Geogrid Types'',
M.Sc.Thesis, Department of Civil Engineering, University of Babylon, Iraq, (2017).
[15] Al-Qadi, I. L., T. L. Brandon, R. J.Valentine, and T. E. Smith. , “Laboratory Evaluation of Geosynthetic Reinforced
Pavement Sections ”Transportation Research Board, 73rd Annual Meeting, Washington DC, (1994).