CITY Y OF I INDEPE ENDENC CE - Pioneer-Sarah Creek ...
140
In par t CIT Y t nership w Me Funding from the C Prep a Y OF I w ith the H a e tro Cons e provided in p Clean Water a red for t I NDEP E by the H ennepin a nd the e rvation D part by the C , Land, and L t he E NDENC Conserv a D istricts Clean Water Legacy Amend C E a tion Dist Fund dment rict
-
Upload
khangminh22 -
Category
Documents
-
view
1 -
download
0
Transcript of CITY Y OF I INDEPE ENDENC CE - Pioneer-Sarah Creek ...
In part
CITY
tnership w
Me
Funding from the C
Prepa
Y OF I
with the H
a
etro Conse
provided in pClean Water
ared for t
INDEPEby the
Hennepin
and the
ervation D
part by the C, Land, and L
the
ENDENC
Conserva
Districts
Clean Water Legacy Amend
CE
ation Dist
Fund dment
rict

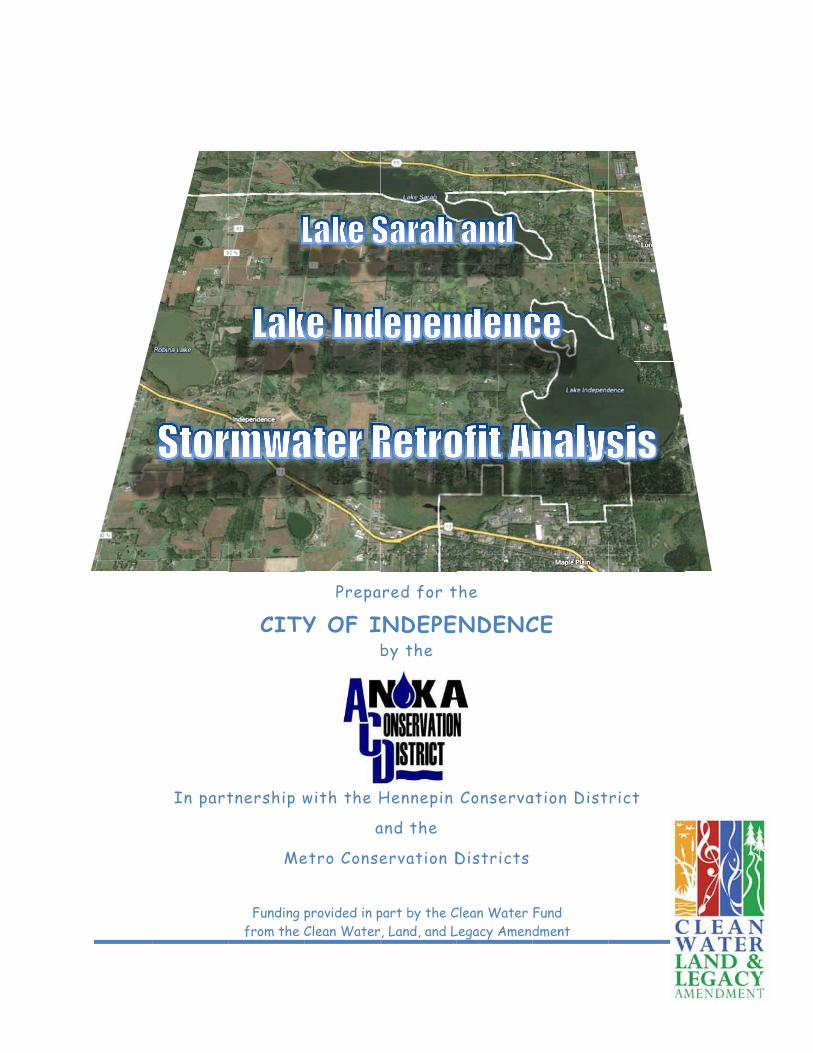
Lake Sarah and Lake Independence Stormwater Retrofit Analysis
May 2014
Cover photos: Google Maps
Lake Sarah and Lake Independence Stormwater Retrofit Analysis
Table of Contents i
Contents
EXECUTIVE SUMMARY 1 SHORT‐TERM IMPLEMENTATION STRATEGY 3 LONG‐TERM IMPLEMENTATION STRATEGY 6 ALTERNATIVE PROJECTS 8
DOCUMENT ORGANIZATION 9 BACKGROUND 9 ANALYTICAL PROCESS 9 ANALYTICAL ELEMENTS 9 PROJECT RANKING, SELECTION & FUNDING 9 PROJECT PROFILES 9 REFERENCES 10 APPENDICES 10
BACKGROUND 11
ANALYTICAL PROCESS 13
ANALYTICAL ELEMENTS 14 TARGET POLLUTANTS 14 POTENTIAL PROJECT TYPES 14 PROJECT CATEGORIES 15 COST ESTIMATES 16 LOCATION IN WATERSHED 17 MODELS AND CALIBRATION 18 PROJECT ALTERNATIVES AND TREATMENT TRAINS 19
PROJECT RANKING, SELECTION AND FUNDING 21 PROJECT RANKING 21 PROJECT SELECTION 23 PROJECT FUNDING 26
PROJECT PROFILES 27 RESIDENTIAL RAIN GARDENS 27 LAKESHORE RESTORATIONS 35 GULLY STABILIZATIONS 51 HYDROLOGIC RESTORATIONS 56 WATER AND SEDIMENT CONTROL BASINS 88 VEGETATED FILTER STRIPS & GRASSED WATERWAYS 93 NEW PONDS & IRON ENHANCED SAND FILTERS 98 SEASONAL PONDING 111
REFERENCES 114
APPENDIX – MODELING METHODS 116 WATER QUALITY MODELS 116 SOIL & WATER ASSESSMENT TOOL (SWAT) 116
Lake Sarah and Lake Independence Stormwater Retrofit Analysis
ii Table of Contents
SIMULATING BMPS IN SWAT 119 SIMULATING BMPS IN WINSLAMM 122 OTHER LOAD ESTIMATION METHODS 127
APPENDIX – PROJECT BUDGET ESTIMATES 130 INTRODUCTION 130 GULLY STABILIZATIONS 130 PONDS 131 IRON ENHANCED SAND FILTERS 133
Table of Figures Table 1: Potential Retrofit Projects Index ..................................................................................................... 3 Table 2: Short‐Term Lake Sarah Projects ...................................................................................................... 5 Table 3: Short‐Term Lake Independence Projects ........................................................................................ 5 Table 4: Cost Saving Opportunities ............................................................................................................... 6 Table 5: Long‐Term Lake Sarah Projects ....................................................................................................... 6 Table 6: Long‐Term Lake Independence Projects ......................................................................................... 7 Table 7: Alternative Projects ......................................................................................................................... 8 Table 8: TMDL Identified Annual Phosphorus Load Reductions for City of Independence ........................ 11 Table 9: Target Pollutants ........................................................................................................................... 14 Table 10: Stormwater Treatment Options .................................................................................................. 14 Table 11: Structural, Vegetative and Cultural Practices ............................................................................. 15 Table 12: Project Cost Estimating ............................................................................................................... 17 Table 13: Model Calibration ........................................................................................................................ 19 Table 14: Lake Sarah Retrofit Projects ........................................................................................................ 21 Table 15: Lake Sarah Projects not in City of Independence ........................................................................ 22 Table 16: Lake Independence Retrofit Projects .......................................................................................... 22 Table 17: Lake Independence Projects Not In City of Independence ......................................................... 23 Table 18: Lake Independence Tier 1 Project Selection Example ................................................................ 25 Table 19: Lake Independence Tier 2 Project Selection Example ................................................................ 25 Table 20: Lake Independence Tier 3 Project Selection Example ................................................................ 26 Table 21: Relative Benefit to Downstream Water Resource ...................................................................... 28 Table 22: Potential Residential Rain Garden Projects ................................................................................ 29 Table 23: Potential Lakeshore Restoration Projects ................................................................................... 36 Table 24: Potential Gully Stabilization Projects .......................................................................................... 52 Table 25: Potential Hydrologic Restoration Projects .................................................................................. 59 Table 26: Potential Water and Sediment Control Basin Projects ............................................................... 89 Table 27: Potential Filter Strip/Grassed Waterway Projects ...................................................................... 94 Table 28: Potential New Ponds and Iron Enhanced Sand Filter Projects .................................................. 100 Table 29: Loretto Creek Subwatershed Breakdown ................................................................................. 101 Table 30: Potential Seasonal Ponding Project .......................................................................................... 112 Table 31: GIS File Sources and Use for ArcSWAT Modeling and Desktop Analysis. ................................. 117 Table 32: ArcSWAT Calibration Parameters ............................................................................................. 118 Table 33: TMDL and SRA Model Output Comparison: TP Load and Drainage Areas ................................ 119 Table 34: ArcSWAT Parameters for the 'Pond' input file (.pnd) ............................................................... 120 Table 35: General WinSLAMM Model Inputs ........................................................................................... 123 Table 36: WinSLAMM Input Parameters for Rain Gardens ...................................................................... 123 Table 37: WinSLAMM Input Parameters for Iron Enhanced Sand Filters ................................................. 126 Table 38: Composition of In‐stream Phosphorus Species Across Various Land Uses and Slopes ............ 126
Lake Sarah and Lake Independence Stormwater Retrofit Analysis
Table of Contents iii
Table 39: Lakeshore Recession Rate Classifications ................................................................................. 128 Table 40: Gully Recession Rate Classifications .......................................................................................... 129 Figure 1: Potential Retrofit Projects Map ..................................................................................................... 2 Figure 2: Short‐Term Projects ....................................................................................................................... 4 Figure 3: Long‐Term Projects ........................................................................................................................ 7 Figure 4: Subwatersheds with LiDAR Base .................................................................................................. 18 Figure 5: Overlapping Treatment ................................................................................................................ 20 Figure 6: Project Selection Aide .................................................................................................................. 23 Figure 7: Curb Cut Rain Garden Example .................................................................................................... 27 Figure 8: Sewage Pump Station .................................................................................................................. 28 Figure 9: Typical Cross Section ‐ Simple Design .......................................................................................... 35 Figure 10: Gully Knickpoint ......................................................................................................................... 51 Figure 11: Various Stabilization Practices Cross Section ............................................................................. 51 Figure 12: Cross Vane ‐ Typical Plan View .................................................................................................. 51 Figure 13: Drain Tile Outlet from Ag. Field ................................................................................................. 56 Figure 14: Channelized Flow in Wetland .................................................................................................... 56 Figure 15: Channel Weir ............................................................................................................................. 56 Figure 16: Box Weir Around Culvert ........................................................................................................... 56 Figure 17: Outlet Control Retrofit ............................................................................................................... 58 Figure 18: Water Control Attached to Drain Tile (illustration courtesy of Illinois NRCS) ........................... 58 Figure 19: Water Control Attached to Drain Tile (illustration courtesy of Illinois NRCS ‐ modified) .......... 88 Figure 20: Filter Strip (illustration courtesy of Ohio State University Extension, web) .............................. 93 Figure 21: MS4 Ponds (courtesy of Hakanson Anderson and Assoc., Inc.) ................................................. 98 Figure 22: Iron Enhanced Sand Filter Concept (Erickson & Gulliver, 2010) ................................................ 99 Figure 23: Loretto Creek Subwatershed Breakdown ................................................................................ 102 Figure 24: Seasonal Ponding Site .............................................................................................................. 111 Figure 25: Corn Planting Date vs. Yield Loss ............................................................................................. 111 Figure 26: Water Control Attached to Drain Tile (illustration courtesy of Illinois NRCS – modified) ....... 112 Figure 27: Biofiltration Control Practice Input Screen: Rain Gardens (WinSLAMM) ................................ 124 Figure 28: Biofiltration Control Practice Input Screen: IESF (WinSLAMM) ............................................... 127

Lake Sarah and Lake Independence Stormwater Retrofit Analysis
Executive Summary 1
Executive Summary The City of Independence contracted Hennepin Conservation District and Anoka Conservation District to complete this stormwater retrofit analysis for the purpose of identifying and ranking water quality improvement projects in those portions of the City of independence that flow into Lake Sarah and Lake Independence. Both lakes have completed Total Maximum Daily Loads (TMDL) and TMDL implementation plans for impairment by phosphorus. The City of Independence has annual phosphorus reduction goals of 143lbs for Lake Sarah and 535 lbs for Lake Independence. These reductions are likely to be met only with an aggressive pursuit of structural and cultural practices.
This analysis is primarily intended to identify projects in the City of Independence to improve water quality in Lake Sarah and Lake Independence to achieve phosphorus waste load reduction goals identified in local water plans and TMDL implementation plans. Some projects were identified that fall outside of the City of Independence boundaries and are included in this analysis because of their close proximity to the lakes or their likely impact on project selection by the City of Independence.
Before identifying treatment opportunities, the watershed must be understood. Field staff must understand how water moves through the system: where it picks up additional pollutants, where pollutants naturally fall out, and if the water that falls on the landscape ever makes it to the lake. The general strategy when looking for water quality improvement practices was to find opportunities to hold water on the land longer, thereby encouraging infiltration, sediment deposition, and nutrient assimilation. This analysis focuses primarily on structural practices that are not dependent on the annually renewed commitment of landowners. As such, land management practices such as manure management, conservation tillage, contour strip farming, and riparian buffers that can provide significant water quality benefits were down played.
For each type of recommended retrofit, conceptual sketches or photos are provided in the project profiles section. The intent of these figures is to provide an understanding of the approach. If a project is selected, site‐specific designs must be prepared. In addition, many of the proposed retrofits (e.g. new ponds) will require engineered plan sets if selected. This typically occurs after committed partnerships are formed to install the project. Committed partnerships must include willing landowners when installed on private property.
Water quality benefits associated with the installation of each identified project were individually modeled using methodologies that varied by project type. Reductions in Total Suspended Solids (TSS), Total Phosphorus (TP), and stormwater volume were modeled. The costs associated with project design, administration, promotion, land acquisition, opportunity costs, construction oversight, installation, and maintenance were estimated. The total costs over the effective life of the project were then divided by the modeled benefits over the same time period to enable ranking by cost‐effectiveness.
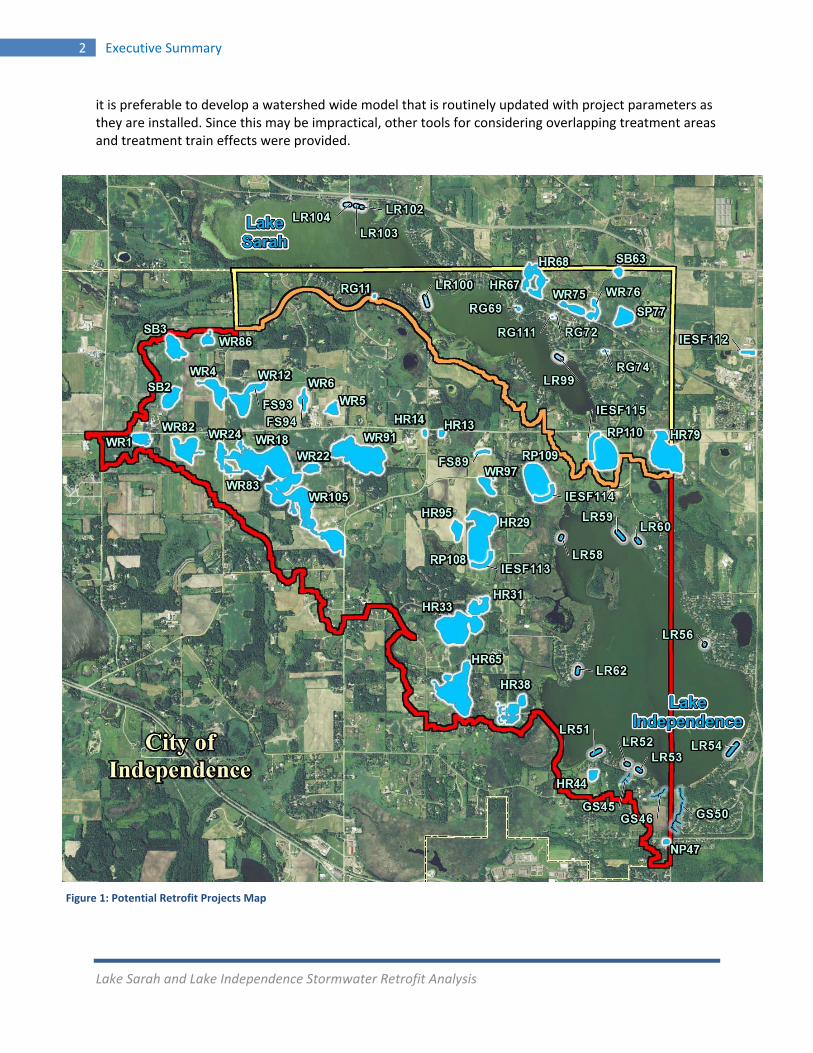
Figure 1 shows all modeled projects throughout the two contributing watersheds. In addition to the projects within the watershed, the entire shoreline of both lakes was inventoried for lakeshore restoration opportunities. In total, 64 identified projects were modeled with installation cost estimates for ranking purposes. A total of 115 potential projects were considered but 51 were eliminated from additional consideration for various reasons. The associated reductions in TP if all modeled projects were installed exceed identified goals within the TMDL implementation plans. Unfortunately, some of those projects are located outside of the City of Independence. Additionally, with the installation of any single project, treatment train impacts will influence downstream project performance. To address this,
Lake Sarah and Lake Independence Stormwater Retrofit Analysis
2 Executive Summary
it is preferable to develop a watershed wide model that is routinely updated with project parameters as they are installed. Since this may be impractical, other tools for considering overlapping treatment areas and treatment train effects were provided.
Figure 1: Potential Retrofit Projects Map

Lake Sarah and Lake Independence Stormwater Retrofit Analysis
Executive Summary 3
Table 1: Potential Retrofit Projects Index
Residential Rain Gardens Hydrologic Restorations Filter Strip/ Grassed Waterway
RG11 pg. 30 RG74 pg. 33 HR13 pg. 61 HR44 pg. 67 FS89 pg. 95
RG69 pg. 31 RG111 pg. 34 HR14 pg. 62 HR65 pg. 68 FS93 pg. 96
RG72 pg. 32 HR29 pg. 63 HR67 & 68 pg. 69 FS94 pg. 97
Lakeshore Restorations HR31 pg. 64 HR79 pg. 70 Ponds/ IESFs
LR51 pg. 37 LR60 pg. 44 HR33 pg. 65 HR95 pg. 71 NP47 pg. 103
LR52 pg. 38 LR62 pg. 45 HR38 pg. 66 RP108 pg. 104
LR53 pg. 39 LR99 pg. 46 Wetland Restorations RP109 pg. 105
LR54 pg. 40 LR100 pg. 47 WR1 pg. 72 WR75 pg. 80 RP110 pg. 106
LR56 pg. 41 LR102 pg. 48 WR4 pg. 73 WR76 pg. 81 IESF112 pg. 107
LR58 pg. 42 LR103 pg. 49 WR5 pg. 74 WR82 pg. 82 IESF113 pg. 108
LR59 pg. 43 LR104 pg. 50 WR6 pg. 75 WR83 pg. 83 IESF114 pg. 109
Gully Stabilizations WR12 pg. 76 WR86 pg. 84 IESF115 pg. 110
GS45 pg. 53 GS50 pg. 55 WR18 pg. 77 WR91 pg. 85 Seasonal Ponding
GS46 pg. 54 WR22 pg. 78 WR97 pg. 86 SP77 pg. 113
WR24 pg. 79 WR105 pg. 87
Water & Sediment Control Basins
SB2 pg. 90 SB63 pg. 92
SB3 pg. 91
An implementation strategy cannot rely solely on pursuing the most cost‐effective projects. Willingness of involved landowners to participate, social acceptability and political support for the type of project, total project budget, ability to leverage outside funds, and opportunities to implement cost saving approaches all play a critical role in project selection. Furthermore, an implementation strategy should include long‐term and a short‐term elements. While the final implementation strategy is the purview of local resource management professionals and civic leaders, we’ve included an example in this Executive Summary as a starting point.
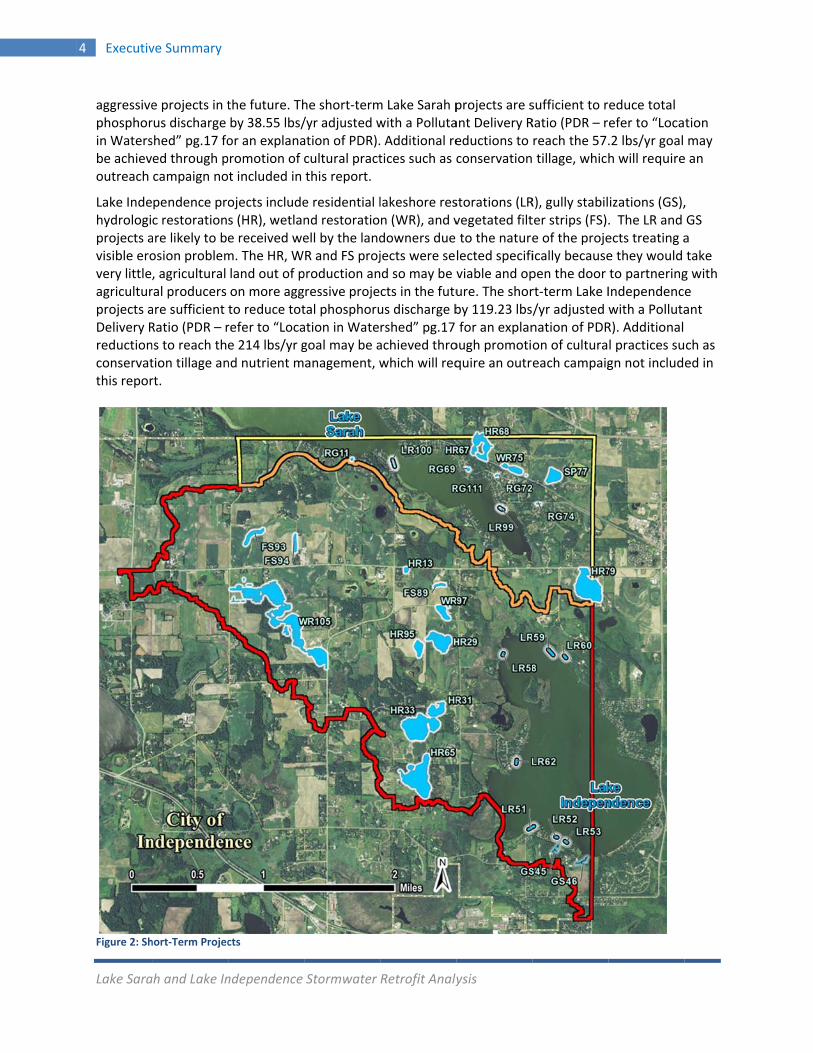
Short‐Term Implementation Strategy The City of Independence has a goal of reducing phosphorus by 40% within the next few years (57.2 lbs/yr. reduction to Lake Sarah and 214 lbs/yr. reduction to Lake Independence). The following projects are selected due to the limited number of involved landowners, ease of project promotion, relatively low cost of installation, and likelihood of installation within a two to three year time frame. By lumping similar projects under a single programmatic umbrella, project design, bidding, administration and construction elements can be combined and simplified by doing them simultaneously. We strongly recommend doing a single round of rain garden installations to install all identified rain garden projects simultaneously. Similarly, all lakeshore restorations should be done at once. Although projects are organized according to the receiving water body in this section, lakeshore restorations for both Lake Sarah and Lake Independence should be completed simultaneously.
Lake Sarah projects include residential rain gardens (RG), lakeshore restorations (LR), hydrologic restorations (HR), seasonal ponding (SP), and wetland restoration (WR). The RG and LR projects are likely to be received well by the landowners due to the nature of the project. The HR, SP and WR projects were selected specifically because they would take very little, if any, agricultural land out of production and so may be viable and open the door to partnering with agricultural producers on more
Lake Sara
4 Executiv
aggressivephosphorin Watersbe achievoutreach
Lake Indehydrologiprojects avisible erovery littleagriculturprojects aDelivery Rreductionconservatthis repor
Figure 2: Sh
ah and Lake In
ve Summary
e projects in trus discharge shed” pg.17 foed through pcampaign no
pendence proc restorationare likely to beosion problem, agricultural ral producers are sufficient Ratio (PDR – rns to reach thetion tillage anrt.
hort‐Term Projec
ndependence
the future. Thby 38.55 lbs/or an explanapromotion of t included in
ojects includes (HR), wetlane received wem. The HR, Wland out of pon more aggto reduce totrefer to “Locae 214 lbs/yr gnd nutrient m
cts
Stormwater
he short‐term/yr adjusted wation of PDR).cultural practthis report.
e residential lnd restoratioell by the landR and FS projproduction anressive projetal phosphoruation in Wategoal may be aanagement, w
Retrofit Analy
m Lake Sarah pwith a Polluta Additional retices such as c
lakeshore resn (WR), and vdowners due jects were sed so may be vcts in the futuus discharge brshed” pg.17achieved throwhich will req
ysis
projects are sant Delivery Reductions to conservation
storations (LRvegetated filt to the naturelected specifiviable and opure. The shorby 119.23 lbsfor an explan
ough promotiquire an outr
sufficient to rRatio (PDR – rreach the 57. tillage, which
R), gully stabilter strips (FS).e of the projeically becausepen the door rt‐term Lake I/yr adjusted nation of PDRon of culturaeach campaig
educe total efer to “Loca.2 lbs/yr goal h will require
izations (GS),. The LR and ects treating ae they would to partneringIndependencwith a PollutaR). Additional l practices sugn not includ
tion may
e an
, GS a take g with e ant
ch as ed in
Lake Sarah and Lake Independence Stormwater Retrofit Analysis
Executive Summary 5
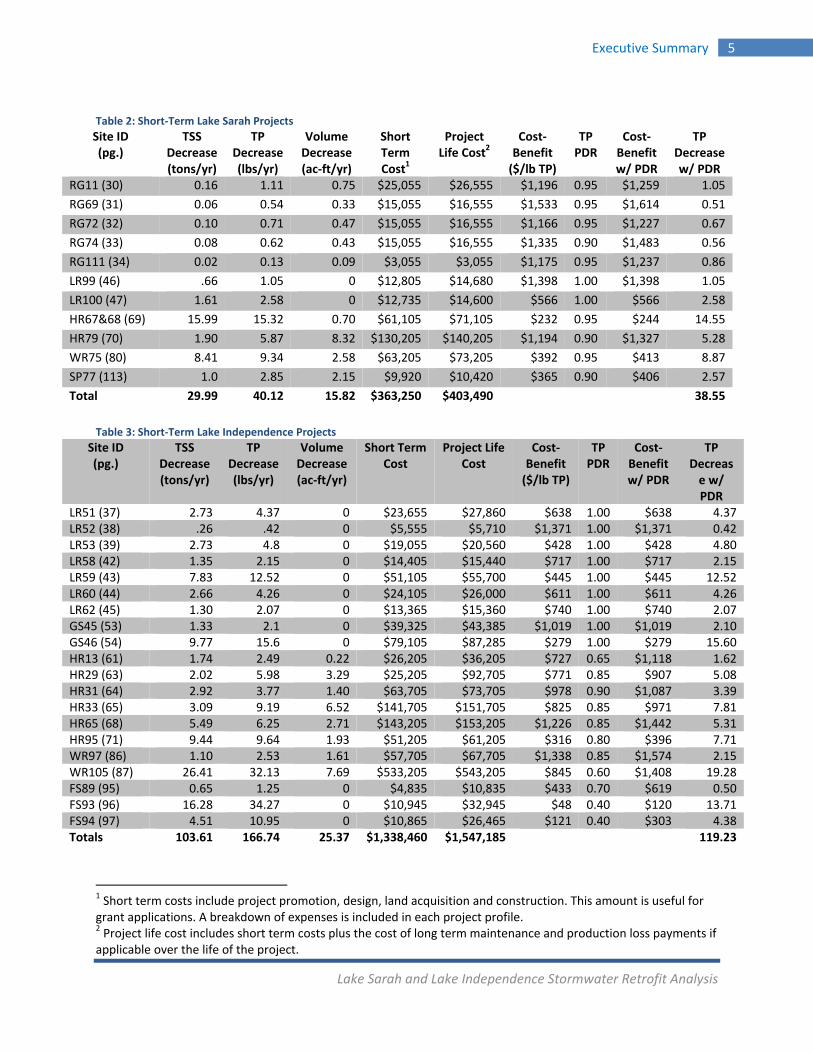
Table 2: Short‐Term Lake Sarah Projects
Table 3: Short‐Term Lake Independence Projects
1 Short term costs include project promotion, design, land acquisition and construction. This amount is useful for grant applications. A breakdown of expenses is included in each project profile. 2 Project life cost includes short term costs plus the cost of long term maintenance and production loss payments if applicable over the life of the project.
Site ID (pg.)
TSS Decrease (tons/yr)
TP Decrease (lbs/yr)
Volume Decrease (ac‐ft/yr)
Short Term Cost1
Project Life Cost2
Cost‐Benefit ($/lb TP)
TP PDR
Cost‐Benefit w/ PDR
TP Decrease w/ PDR
RG11 (30) 0.16 1.11 0.75 $25,055 $26,555 $1,196 0.95 $1,259 1.05
RG69 (31) 0.06 0.54 0.33 $15,055 $16,555 $1,533 0.95 $1,614 0.51
RG72 (32) 0.10 0.71 0.47 $15,055 $16,555 $1,166 0.95 $1,227 0.67
RG74 (33) 0.08 0.62 0.43 $15,055 $16,555 $1,335 0.90 $1,483 0.56
RG111 (34) 0.02 0.13 0.09 $3,055 $3,055 $1,175 0.95 $1,237 0.86
LR99 (46) .66 1.05 0 $12,805 $14,680 $1,398 1.00 $1,398 1.05
LR100 (47) 1.61 2.58 0 $12,735 $14,600 $566 1.00 $566 2.58
HR67&68 (69) 15.99 15.32 0.70 $61,105 $71,105 $232 0.95 $244 14.55
HR79 (70) 1.90 5.87 8.32 $130,205 $140,205 $1,194 0.90 $1,327 5.28
WR75 (80) 8.41 9.34 2.58 $63,205 $73,205 $392 0.95 $413 8.87
SP77 (113) 1.0 2.85 2.15 $9,920 $10,420 $365 0.90 $406 2.57
Total 29.99 40.12 15.82 $363,250 $403,490 38.55
Site ID (pg.)
TSS Decrease (tons/yr)
TP Decrease (lbs/yr)
Volume Decrease (ac‐ft/yr)
Short Term Cost
Project Life Cost
Cost‐Benefit ($/lb TP)
TP PDR
Cost‐Benefit w/ PDR
TP Decrease w/ PDR
LR51 (37) 2.73 4.37 0 $23,655 $27,860 $638 1.00 $638 4.37LR52 (38) .26 .42 0 $5,555 $5,710 $1,371 1.00 $1,371 0.42LR53 (39) 2.73 4.8 0 $19,055 $20,560 $428 1.00 $428 4.80LR58 (42) 1.35 2.15 0 $14,405 $15,440 $717 1.00 $717 2.15LR59 (43) 7.83 12.52 0 $51,105 $55,700 $445 1.00 $445 12.52LR60 (44) 2.66 4.26 0 $24,105 $26,000 $611 1.00 $611 4.26LR62 (45) 1.30 2.07 0 $13,365 $15,360 $740 1.00 $740 2.07GS45 (53) 1.33 2.1 0 $39,325 $43,385 $1,019 1.00 $1,019 2.10GS46 (54) 9.77 15.6 0 $79,105 $87,285 $279 1.00 $279 15.60HR13 (61) 1.74 2.49 0.22 $26,205 $36,205 $727 0.65 $1,118 1.62HR29 (63) 2.02 5.98 3.29 $25,205 $92,705 $771 0.85 $907 5.08HR31 (64) 2.92 3.77 1.40 $63,705 $73,705 $978 0.90 $1,087 3.39HR33 (65) 3.09 9.19 6.52 $141,705 $151,705 $825 0.85 $971 7.81HR65 (68) 5.49 6.25 2.71 $143,205 $153,205 $1,226 0.85 $1,442 5.31HR95 (71) 9.44 9.64 1.93 $51,205 $61,205 $316 0.80 $396 7.71WR97 (86) 1.10 2.53 1.61 $57,705 $67,705 $1,338 0.85 $1,574 2.15WR105 (87) 26.41 32.13 7.69 $533,205 $543,205 $845 0.60 $1,408 19.28FS89 (95) 0.65 1.25 0 $4,835 $10,835 $433 0.70 $619 0.50FS93 (96) 16.28 34.27 0 $10,945 $32,945 $48 0.40 $120 13.71FS94 (97) 4.51 10.95 0 $10,865 $26,465 $121 0.40 $303 4.38Totals 103.61 166.74 25.37 $1,338,460 $1,547,185 119.23
Lake Sarah and Lake Independence Stormwater Retrofit Analysis
6 Executive Summary
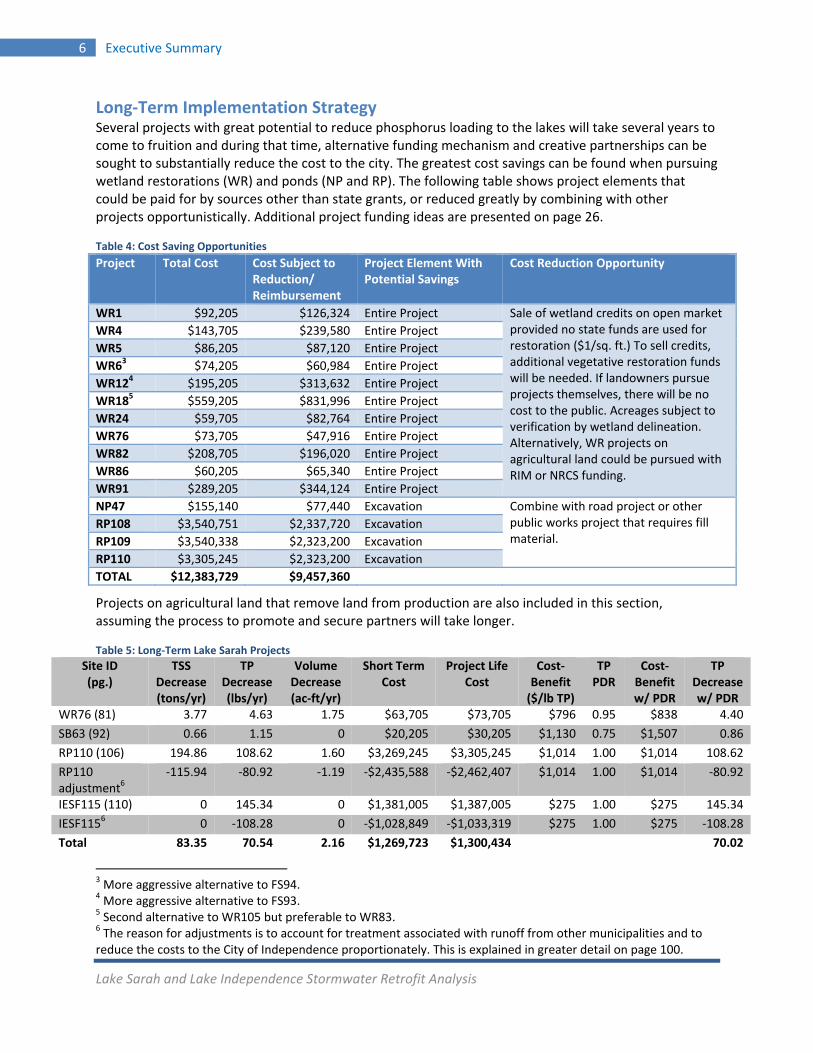
Long‐Term Implementation Strategy Several projects with great potential to reduce phosphorus loading to the lakes will take several years to come to fruition and during that time, alternative funding mechanism and creative partnerships can be sought to substantially reduce the cost to the city. The greatest cost savings can be found when pursuing wetland restorations (WR) and ponds (NP and RP). The following table shows project elements that could be paid for by sources other than state grants, or reduced greatly by combining with other projects opportunistically. Additional project funding ideas are presented on page 26.
Table 4: Cost Saving Opportunities
Project Total Cost Cost Subject to Reduction/ Reimbursement
Project Element With Potential Savings
Cost Reduction Opportunity
WR1 $92,205 $126,324 Entire Project Sale of wetland credits on open market provided no state funds are used for restoration ($1/sq. ft.) To sell credits, additional vegetative restoration funds will be needed. If landowners pursue projects themselves, there will be no cost to the public. Acreages subject to verification by wetland delineation. Alternatively, WR projects on agricultural land could be pursued with RIM or NRCS funding.
WR4 $143,705 $239,580 Entire Project
WR5 $86,205 $87,120 Entire Project
WR63 $74,205 $60,984 Entire Project
WR124 $195,205 $313,632 Entire Project
WR185 $559,205 $831,996 Entire Project
WR24 $59,705 $82,764 Entire Project
WR76 $73,705 $47,916 Entire Project
WR82 $208,705 $196,020 Entire Project
WR86 $60,205 $65,340 Entire Project
WR91 $289,205 $344,124 Entire Project
NP47 $155,140 $77,440 Excavation Combine with road project or other public works project that requires fill material.
RP108 $3,540,751 $2,337,720 Excavation
RP109 $3,540,338 $2,323,200 Excavation
RP110 $3,305,245 $2,323,200 Excavation
TOTAL $12,383,729 $9,457,360
Projects on agricultural land that remove land from production are also included in this section, assuming the process to promote and secure partners will take longer.
Table 5: Long‐Term Lake Sarah Projects
3 More aggressive alternative to FS94. 4 More aggressive alternative to FS93. 5 Second alternative to WR105 but preferable to WR83. 6 The reason for adjustments is to account for treatment associated with runoff from other municipalities and to reduce the costs to the City of Independence proportionately. This is explained in greater detail on page 100.
Site ID (pg.)
TSS Decrease (tons/yr)
TP Decrease (lbs/yr)
Volume Decrease (ac‐ft/yr)
Short Term Cost
Project Life Cost
Cost‐Benefit ($/lb TP)
TP PDR
Cost‐Benefit w/ PDR
TP Decrease w/ PDR
WR76 (81) 3.77 4.63 1.75 $63,705 $73,705 $796 0.95 $838 4.40
SB63 (92) 0.66 1.15 0 $20,205 $30,205 $1,130 0.75 $1,507 0.86
RP110 (106) 194.86 108.62 1.60 $3,269,245 $3,305,245 $1,014 1.00 $1,014 108.62
RP110 adjustment6
‐115.94 ‐80.92 ‐1.19 ‐$2,435,588 ‐$2,462,407 $1,014 1.00 $1,014 ‐80.92
IESF115 (110) 0 145.34 0 $1,381,005 $1,387,005 $275 1.00 $275 145.34
IESF1156 0 ‐108.28 0 ‐$1,028,849 ‐$1,033,319 $275 1.00 $275 ‐108.28
Total 83.35 70.54 2.16 $1,269,723 $1,300,434 70.02
Lake Sarah and Lake Independence Stormwater Retrofit Analysis
Executive Summary 7
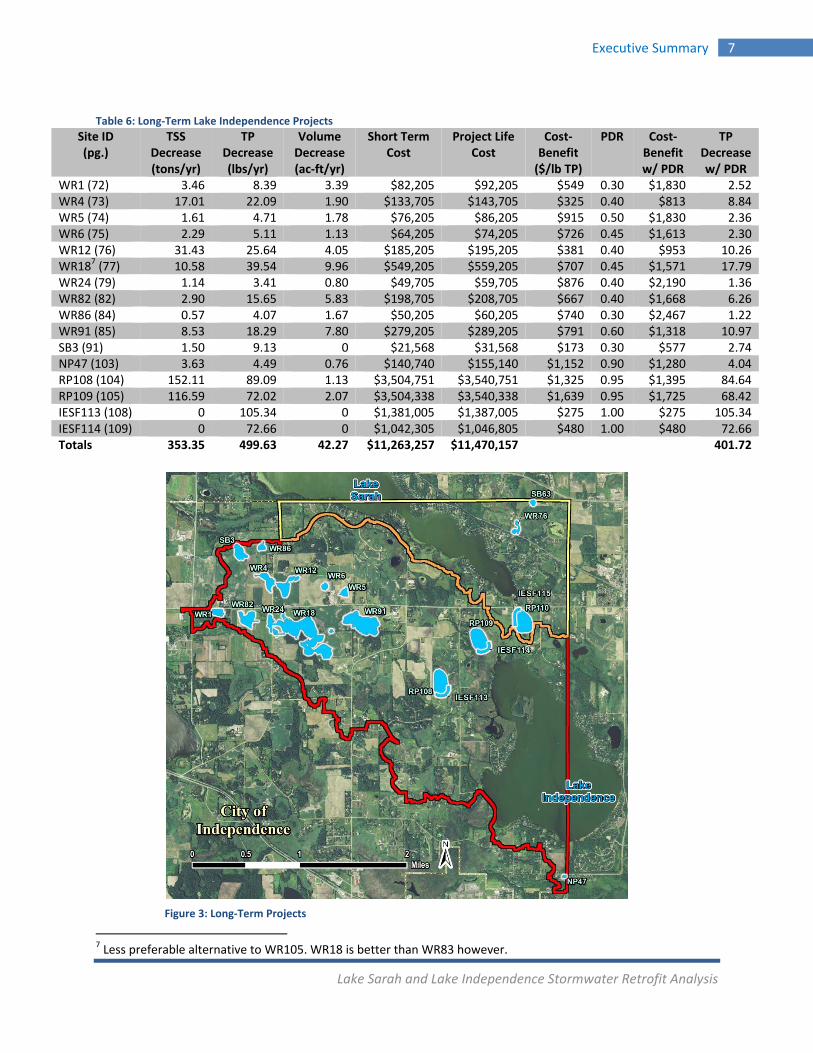
Table 6: Long‐Term Lake Independence Projects
7 Less preferable alternative to WR105. WR18 is better than WR83 however.
Site ID (pg.)
TSS Decrease (tons/yr)
TP Decrease (lbs/yr)
Volume Decrease (ac‐ft/yr)
Short Term Cost
Project Life Cost
Cost‐Benefit ($/lb TP)
PDR Cost‐Benefit w/ PDR
TP Decrease w/ PDR
WR1 (72) 3.46 8.39 3.39 $82,205 $92,205 $549 0.30 $1,830 2.52WR4 (73) 17.01 22.09 1.90 $133,705 $143,705 $325 0.40 $813 8.84WR5 (74) 1.61 4.71 1.78 $76,205 $86,205 $915 0.50 $1,830 2.36WR6 (75) 2.29 5.11 1.13 $64,205 $74,205 $726 0.45 $1,613 2.30WR12 (76) 31.43 25.64 4.05 $185,205 $195,205 $381 0.40 $953 10.26WR187 (77) 10.58 39.54 9.96 $549,205 $559,205 $707 0.45 $1,571 17.79WR24 (79) 1.14 3.41 0.80 $49,705 $59,705 $876 0.40 $2,190 1.36WR82 (82) 2.90 15.65 5.83 $198,705 $208,705 $667 0.40 $1,668 6.26WR86 (84) 0.57 4.07 1.67 $50,205 $60,205 $740 0.30 $2,467 1.22WR91 (85) 8.53 18.29 7.80 $279,205 $289,205 $791 0.60 $1,318 10.97SB3 (91) 1.50 9.13 0 $21,568 $31,568 $173 0.30 $577 2.74NP47 (103) 3.63 4.49 0.76 $140,740 $155,140 $1,152 0.90 $1,280 4.04RP108 (104) 152.11 89.09 1.13 $3,504,751 $3,540,751 $1,325 0.95 $1,395 84.64RP109 (105) 116.59 72.02 2.07 $3,504,338 $3,540,338 $1,639 0.95 $1,725 68.42IESF113 (108) 0 105.34 0 $1,381,005 $1,387,005 $275 1.00 $275 105.34IESF114 (109) 0 72.66 0 $1,042,305 $1,046,805 $480 1.00 $480 72.66Totals 353.35 499.63 42.27 $11,263,257 $11,470,157 401.72
Figure 3: Long‐Term Projects
Lake Sarah and Lake Independence Stormwater Retrofit Analysis
8 Executive Summary
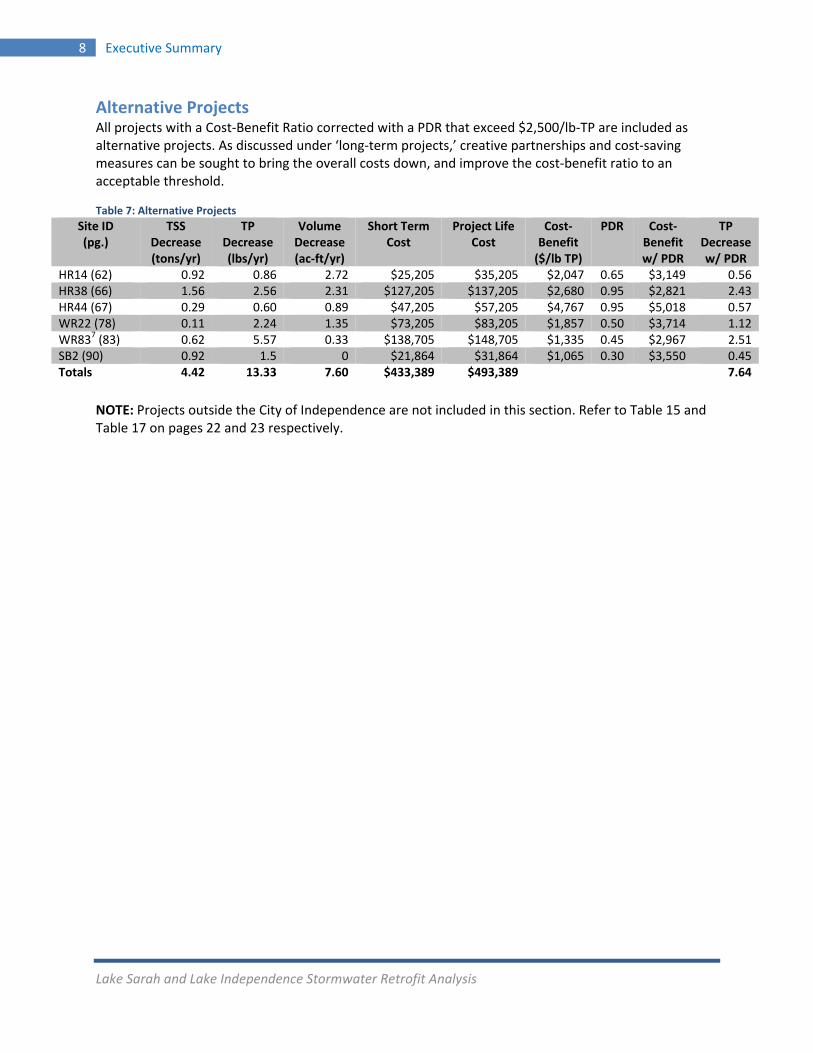
Alternative Projects All projects with a Cost‐Benefit Ratio corrected with a PDR that exceed $2,500/lb‐TP are included as alternative projects. As discussed under ‘long‐term projects,’ creative partnerships and cost‐saving measures can be sought to bring the overall costs down, and improve the cost‐benefit ratio to an acceptable threshold.
Table 7: Alternative Projects
NOTE: Projects outside the City of Independence are not included in this section. Refer to Table 15 and Table 17 on pages 22 and 23 respectively.
Site ID (pg.)
TSS Decrease (tons/yr)
TP Decrease (lbs/yr)
Volume Decrease (ac‐ft/yr)
Short Term Cost
Project Life Cost
Cost‐Benefit ($/lb TP)
PDR Cost‐Benefit w/ PDR
TP Decrease w/ PDR
HR14 (62) 0.92 0.86 2.72 $25,205 $35,205 $2,047 0.65 $3,149 0.56HR38 (66) 1.56 2.56 2.31 $127,205 $137,205 $2,680 0.95 $2,821 2.43HR44 (67) 0.29 0.60 0.89 $47,205 $57,205 $4,767 0.95 $5,018 0.57WR22 (78) 0.11 2.24 1.35 $73,205 $83,205 $1,857 0.50 $3,714 1.12WR837 (83) 0.62 5.57 0.33 $138,705 $148,705 $1,335 0.45 $2,967 2.51SB2 (90) 0.92 1.5 0 $21,864 $31,864 $1,065 0.30 $3,550 0.45Totals 4.42 13.33 7.60 $433,389 $493,389 7.64
Lake Sarah and Lake Independence Stormwater Retrofit Analysis
Document Organization 9
Document Organization This document is organized into five sections, plus references and appendices. Each section is briefly
described below.
Background
The background section provides a brief account of the TMDLs that have been completed and a
description of the landscape characteristics and resultant water quality issues.
Analytical Process
The analytical process section overviews the procedures that were followed when analyzing the
watershed. It overviews the processes of retrofit scoping, desktop analysis, field investigation,
modeling, cost/treatment analysis, project ranking, and project selection. Refer to Appendix A
for a detailed description of the methods.
Analytical Elements
The analytical elements section explains a myriad of other considerations that were taken into
account when developing this work product. Examples include the target pollutants and their
interrelationships, project type and the implication of project selections, cultural as opposed to
structural projects, edge of field and network level benefits, pollutant delivery ratios, model
calibration, treatment train effects, and multiple treatment alternatives for a given site.
Project Ranking, Selection & Funding
The project ranking, selection and funding section describes the methods and rationale for how projects were ranked. There are many possible ways to prioritize projects, and the list provided in this report is merely a starting point. Local resource management professionals will be responsible to select projects to pursue. Several considerations in addition to project cost‐effectiveness for prioritizing installation are included. Project funding opportunities may play a large role in project selection, design and installation.
Project Profiles
For each type of project included in this report, there is a description of the rationale for
including that type of project, the modeling method employed, and the cost calculations used to
estimate associated installation and maintenance expenses. The project type description
concludes with a map of those projects as well as a table summarizing modeled projects, listed
in order of cost‐effectiveness for phosphorus removal. In addition, for each potential project
that was selected for modeling, there is a project profile page that summarizes model results for
removal of TP, TSS and volume if applicable. Each page includes model outputs for various
potential configurations along with a budget for the configuration that was selected. Maps for
each project are included that show the project location in the watershed, the treatment area

Lake Sarah and Lake Independence Stormwater Retrofit Analysis
10 Document Organization
with aerial photo base, and colored LiDAR with shaded relief to convey topography. The maps
also provide parcel lines and property identifications numbers to facilitate outreach to
landowners.
References
This section identifies various sources of information synthesized to produce the protocol
utilized in this analysis.
Appendices
This section provides supplemental information and/or data used during the analysis.
Lake Sarah and Lake Independence Stormwater Retrofit Analysis
Background 11
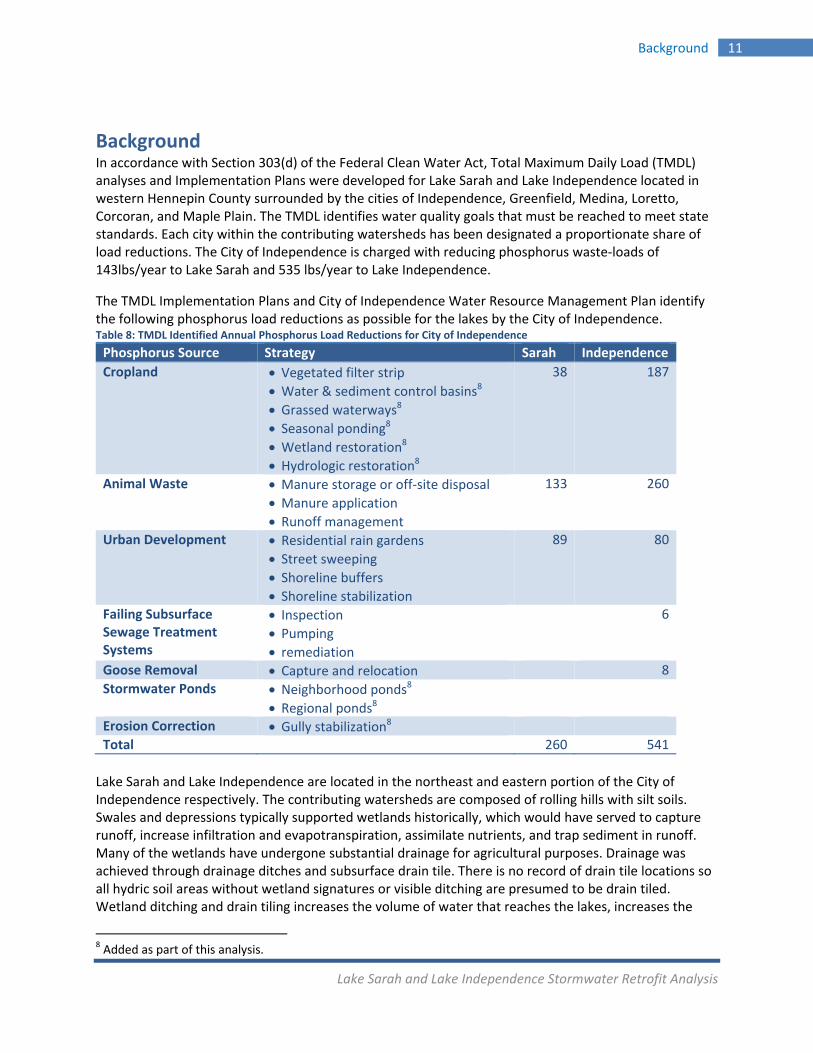
Background In accordance with Section 303(d) of the Federal Clean Water Act, Total Maximum Daily Load (TMDL) analyses and Implementation Plans were developed for Lake Sarah and Lake Independence located in western Hennepin County surrounded by the cities of Independence, Greenfield, Medina, Loretto, Corcoran, and Maple Plain. The TMDL identifies water quality goals that must be reached to meet state standards. Each city within the contributing watersheds has been designated a proportionate share of load reductions. The City of Independence is charged with reducing phosphorus waste‐loads of 143lbs/year to Lake Sarah and 535 lbs/year to Lake Independence.
The TMDL Implementation Plans and City of Independence Water Resource Management Plan identify the following phosphorus load reductions as possible for the lakes by the City of Independence. Table 8: TMDL Identified Annual Phosphorus Load Reductions for City of Independence
Phosphorus Source Strategy Sarah Independence
Cropland Vegetated filter strip Water & sediment control basins8
Grassed waterways8 Seasonal ponding8 Wetland restoration8
Hydrologic restoration8
38 187
Animal Waste Manure storage or off‐site disposal
Manure application
Runoff management
133 260
Urban Development Residential rain gardens Street sweeping Shoreline buffers Shoreline stabilization
89 80
Failing Subsurface Sewage Treatment Systems
Inspection Pumping
remediation
6
Goose Removal Capture and relocation 8
Stormwater Ponds Neighborhood ponds8 Regional ponds8
Erosion Correction Gully stabilization8 Total 260 541
Lake Sarah and Lake Independence are located in the northeast and eastern portion of the City of Independence respectively. The contributing watersheds are composed of rolling hills with silt soils. Swales and depressions typically supported wetlands historically, which would have served to capture runoff, increase infiltration and evapotranspiration, assimilate nutrients, and trap sediment in runoff. Many of the wetlands have undergone substantial drainage for agricultural purposes. Drainage was achieved through drainage ditches and subsurface drain tile. There is no record of drain tile locations so all hydric soil areas without wetland signatures or visible ditching are presumed to be drain tiled. Wetland ditching and drain tiling increases the volume of water that reaches the lakes, increases the
8 Added as part of this analysis.

Lake Sarah and Lake Independence Stormwater Retrofit Analysis
12 Background
speed with which it makes it there, and increases the pollutant load that it carries. Channelization of natural flowages further exacerbates this problem.
Landuse also greatly impacts the quality and volume of stormwater runoff. Landuses that leave soil bare by removing vegetation, that add nutrient or chemical pollutants, or that increase impervious surfaces all tend to reduce downstream water quality. In the City of Independence, most of the land use is composed of row crops, livestock operations, and medium and low density residential. The agricultural areas increase erosion via artificial drainage and exposed soil and increase nutrient loads from livestock and over application of fertilizers. The winter application of manure to agricultural fields has been identified in some areas as a substantial source of nutrient rich early spring runoff. Residential areas are located in close proximity to the lakes. Impervious surface in residential areas is cited as contributing to increased pollutant loading which is due in part to in‐stream erosion accelerated by greater runoff volumes. Lakeshore erosion made worse by on‐lake recreational activities and vegetation removal and upslope mowing also contributes to water quality degradation in the lakes. In general, this analysis looked for opportunities to restore natural hydrology, correct active erosion, revegetate denuded areas, and capture and treat polluted stormwater.
Lake Sarah and Lake Independence Stormwater Retrofit Analysis
Analytical Process 13
Analytical Process This Stormwater Retrofit Analysis is a watershed management tool to identify and prioritize stormwater
retrofit projects by performance and cost effectiveness. This process helps maximize the value of each
dollar spent. Scoping includes identifying the objectives and bounds of the analysis in terms of target pollutant, geography, and practices. Desktop analysis involves the utilization of high resolution aerial photography, digital elevation data (LiDAR), soils, hydrography, parcels, stream and ditch networks, wetlands, culverts, and landuse to narrow the scope of analysis and facilitate field investigation. Field investigation involves driving and walking through the watershed along every public road and parcel to observe field conditions in search of problem sites and opportunities. Problem areas include active erosion, land management practices that contribute to water quality degradation, and artificial drainage. Most problem areas present an opportunity for corrective action, including hydrologic restoration, revegetation, ponding, soil stabilization, and land management practice improvements. As part of the field investigation, an erosion inventory of the entire shoreline of both lakes was completed. Modeling involves several methods to estimate target pollutant removals associated with potential projects. Since no single modeling methodology currently available is suited to model benefits from the variety of project identified in this report, several methodologies had to be employed. They are explained in detail in Appendix A and include; Soil and Water Assessment Tool (SWAT), Source Loading and Management Model for Windows (WinSLAMM), and Board of Water and Soil Resources Pollution Reduction Calculator (BWSR PRC). Cost estimating is critical for the comparison and ranking of projects, development of work plans, and pursuit of grants and other funds. Project installation costs are only one element included in cost estimates provided in this analysis. Engineering, landowner outreach, construction oversight, project administration, land acquisition, production loss, and long term maintenance costs were also considered. In addition to this, expected project life was incorporated into the estimate. All project costs should be verified against local experience. Project ranking is essential to identify which projects to pursue to achieve water quality goals. It isn’t as simple as sorting by cost‐effectiveness however. Since similar projects in different areas of the watershed will have different impacts on the receiving water body, a correction factor called a Pollutant Delivery Ratio (PDR) was used to further refine ranking. Project selection involves considerations other than project ranking, including but not limited to total cost, treatment train effects, social acceptability, and political feasibility.
Lake Sarah and Lake Independence Stormwater Retrofit Analysis
14 Analytical Elements
Analytical Elements
Many elements come into play when developing a stormwater retrofit analysis. Each analysis must be
customized to the target pollutant, locally acceptable practice type, local fiscal capacity, and watershed
characteristics. The following describes how these elements were considered.
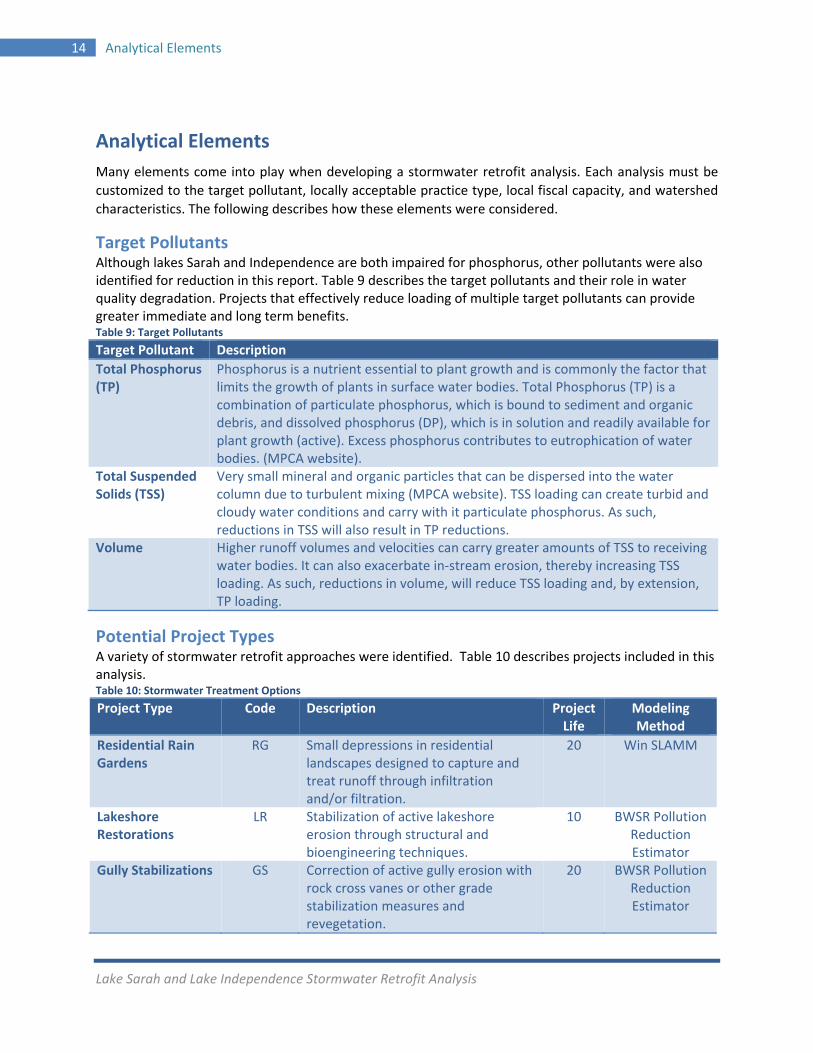
Target Pollutants Although lakes Sarah and Independence are both impaired for phosphorus, other pollutants were also identified for reduction in this report. Table 9 describes the target pollutants and their role in water quality degradation. Projects that effectively reduce loading of multiple target pollutants can provide greater immediate and long term benefits. Table 9: Target Pollutants
Target Pollutant Description
Total Phosphorus (TP)
Phosphorus is a nutrient essential to plant growth and is commonly the factor that limits the growth of plants in surface water bodies. Total Phosphorus (TP) is a combination of particulate phosphorus, which is bound to sediment and organic debris, and dissolved phosphorus (DP), which is in solution and readily available for plant growth (active). Excess phosphorus contributes to eutrophication of water bodies. (MPCA website).
Total Suspended Solids (TSS)
Very small mineral and organic particles that can be dispersed into the water column due to turbulent mixing (MPCA website). TSS loading can create turbid and cloudy water conditions and carry with it particulate phosphorus. As such, reductions in TSS will also result in TP reductions.
Volume Higher runoff volumes and velocities can carry greater amounts of TSS to receiving water bodies. It can also exacerbate in‐stream erosion, thereby increasing TSS loading. As such, reductions in volume, will reduce TSS loading and, by extension, TP loading.
Potential Project Types A variety of stormwater retrofit approaches were identified. Table 10 describes projects included in this analysis. Table 10: Stormwater Treatment Options
Project Type Code Description Project Life
Modeling Method
Residential Rain Gardens
RG Small depressions in residential landscapes designed to capture and treat runoff through infiltration and/or filtration.
20 Win SLAMM
Lakeshore Restorations
LR Stabilization of active lakeshore erosion through structural and bioengineering techniques.
10 BWSR Pollution Reduction Estimator
Gully Stabilizations GS Correction of active gully erosion with rock cross vanes or other grade stabilization measures and revegetation.
20 BWSR Pollution Reduction Estimator
Lake Sarah and Lake Independence Stormwater Retrofit Analysis
Analytical Elements 15
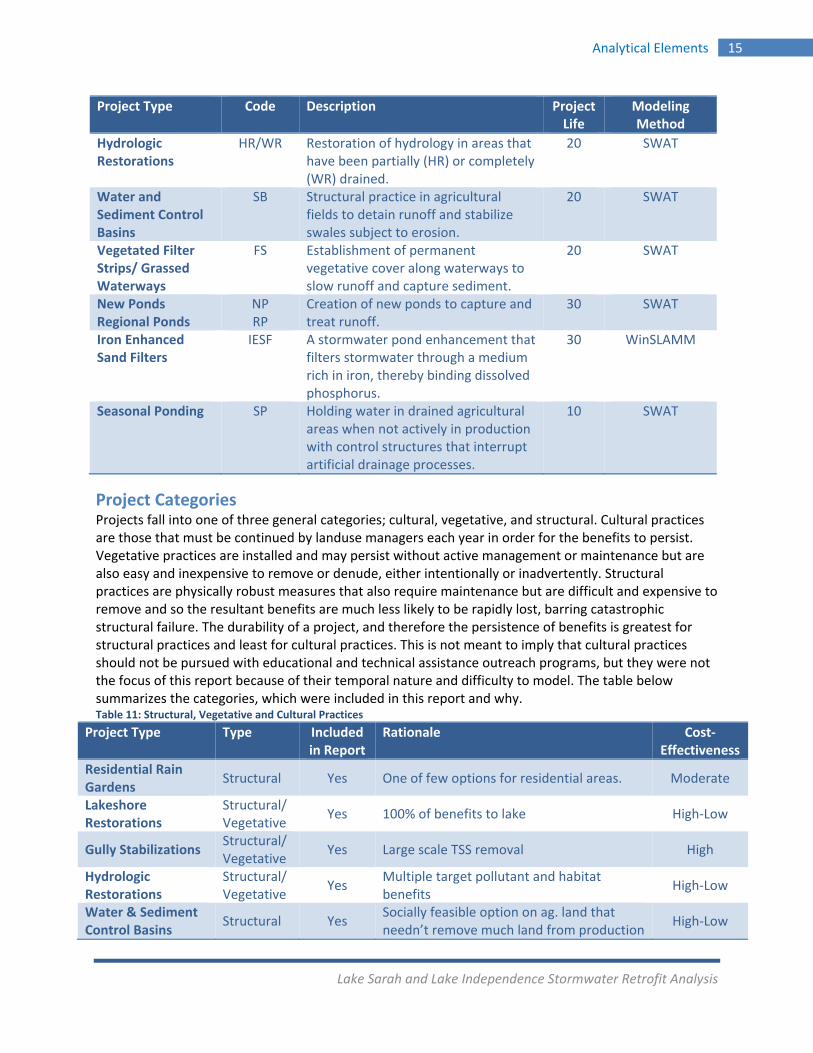
Project Type Code Description Project Life
Modeling Method
Hydrologic Restorations
HR/WR Restoration of hydrology in areas that have been partially (HR) or completely (WR) drained.
20 SWAT
Water and Sediment Control Basins
SB Structural practice in agricultural fields to detain runoff and stabilize swales subject to erosion.
20 SWAT
Vegetated Filter Strips/ Grassed Waterways
FS Establishment of permanent vegetative cover along waterways to slow runoff and capture sediment.
20 SWAT
New Ponds Regional Ponds
NP RP
Creation of new ponds to capture and treat runoff.
30 SWAT
Iron Enhanced Sand Filters
IESF A stormwater pond enhancement that filters stormwater through a medium rich in iron, thereby binding dissolved phosphorus.
30 WinSLAMM
Seasonal Ponding SP Holding water in drained agricultural areas when not actively in production with control structures that interrupt artificial drainage processes.
10 SWAT
Project Categories Projects fall into one of three general categories; cultural, vegetative, and structural. Cultural practices are those that must be continued by landuse managers each year in order for the benefits to persist. Vegetative practices are installed and may persist without active management or maintenance but are also easy and inexpensive to remove or denude, either intentionally or inadvertently. Structural practices are physically robust measures that also require maintenance but are difficult and expensive to remove and so the resultant benefits are much less likely to be rapidly lost, barring catastrophic structural failure. The durability of a project, and therefore the persistence of benefits is greatest for structural practices and least for cultural practices. This is not meant to imply that cultural practices should not be pursued with educational and technical assistance outreach programs, but they were not the focus of this report because of their temporal nature and difficulty to model. The table below summarizes the categories, which were included in this report and why. Table 11: Structural, Vegetative and Cultural Practices
Project Type Type Included in Report
Rationale Cost‐Effectiveness
Residential Rain Gardens
Structural Yes One of few options for residential areas. Moderate
Lakeshore Restorations
Structural/ Vegetative
Yes 100% of benefits to lake High‐Low
Gully Stabilizations Structural/ Vegetative
Yes Large scale TSS removal High
Hydrologic Restorations
Structural/ Vegetative
Yes Multiple target pollutant and habitat benefits
High‐Low
Water & Sediment Control Basins
Structural Yes Socially feasible option on ag. land that needn’t remove much land from production
High‐Low
Lake Sarah and Lake Independence Stormwater Retrofit Analysis
16 Analytical Elements
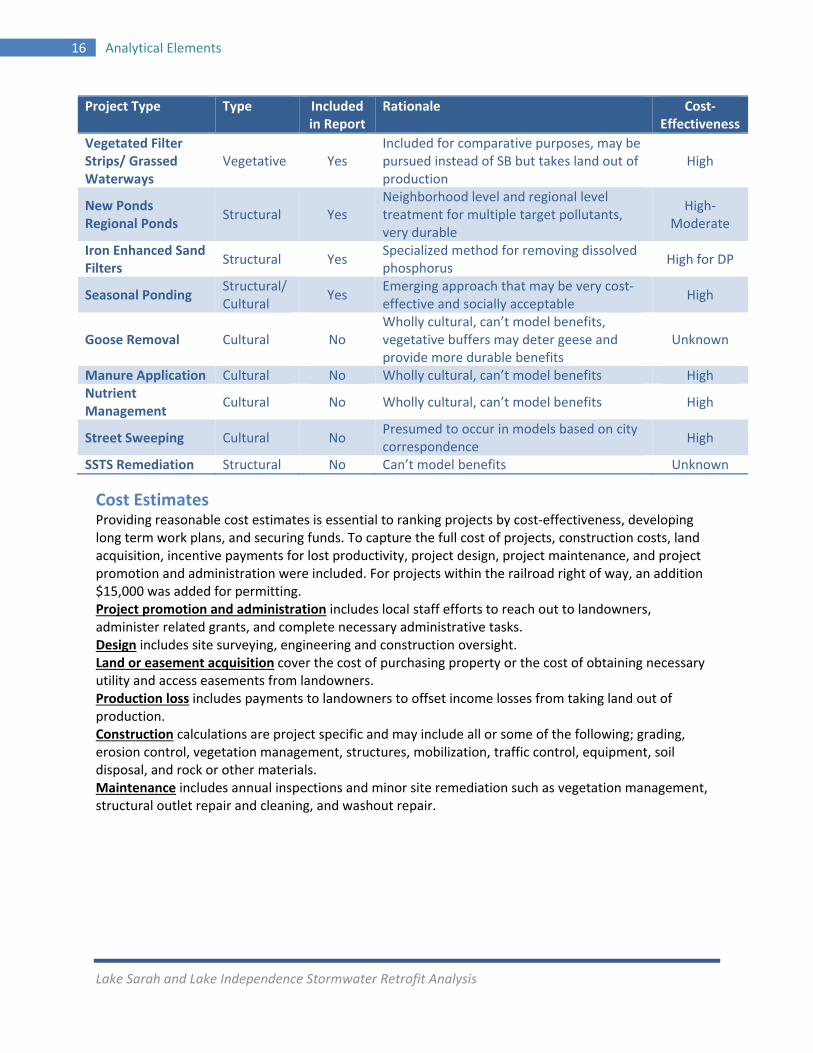
Project Type Type Included in Report
Rationale Cost‐Effectiveness
Vegetated Filter Strips/ Grassed Waterways
Vegetative Yes Included for comparative purposes, may be pursued instead of SB but takes land out of production
High
New Ponds Regional Ponds
Structural Yes Neighborhood level and regional level treatment for multiple target pollutants, very durable
High‐Moderate
Iron Enhanced Sand Filters
Structural Yes Specialized method for removing dissolved phosphorus
High for DP
Seasonal Ponding Structural/ Cultural
Yes Emerging approach that may be very cost‐effective and socially acceptable
High
Goose Removal Cultural No Wholly cultural, can’t model benefits, vegetative buffers may deter geese and provide more durable benefits
Unknown
Manure Application Cultural No Wholly cultural, can’t model benefits High Nutrient Management
Cultural No Wholly cultural, can’t model benefits High
Street Sweeping Cultural No Presumed to occur in models based on city correspondence
High
SSTS Remediation Structural No Can’t model benefits Unknown
Cost Estimates Providing reasonable cost estimates is essential to ranking projects by cost‐effectiveness, developing long term work plans, and securing funds. To capture the full cost of projects, construction costs, land acquisition, incentive payments for lost productivity, project design, project maintenance, and project promotion and administration were included. For projects within the railroad right of way, an addition $15,000 was added for permitting. Project promotion and administration includes local staff efforts to reach out to landowners, administer related grants, and complete necessary administrative tasks. Design includes site surveying, engineering and construction oversight. Land or easement acquisition cover the cost of purchasing property or the cost of obtaining necessary utility and access easements from landowners. Production loss includes payments to landowners to offset income losses from taking land out of production. Construction calculations are project specific and may include all or some of the following; grading, erosion control, vegetation management, structures, mobilization, traffic control, equipment, soil disposal, and rock or other materials. Maintenance includes annual inspections and minor site remediation such as vegetation management, structural outlet repair and cleaning, and washout repair.
Lake Sarah and Lake Independence Stormwater Retrofit Analysis
Analytical Elements 17
Table 12: Project Cost Estimating
Project Type Promo/ Admin (hrs)
Design ($)
Land/ Easement Acquisition
Production Loss
Construction Annual
Maintenance
Residential Rain Gardens
35 $2,500 $20/sq. ft. $75
Lakeshore Restorations
35 $1,500 $70‐$150/lin. ft. $1.5/lin. ft.
Gully Stabilizations
35 $4,000 $65/sq. ft. $.50/sq. ft.
Hydrologic Restorations
85 $10,000 $5,000/ac
$4,000‐$25,000/ control structure
$40/cu. yd. earthwork
$500
Wetland Restoration
85 $10,000 $20,000/ac
$4,000‐$25,000/ control structure
$40/cu. yd. earthwork
$500
Water and Sediment Control Basins
85 $10,000
$4,000/control structure/4000 cu. meters storage $40/cu. yd. earthwork
$500
Vegetated Filter Strips/ Grassed Waterways
65 $6,000 $800/
ac./yr.9$200/ac. $300
New Ponds Regional Ponds
85 $25,000‐$50,000
$20,000/ac $5.50/sq. ft. $100/acre of
pond Iron Enhanced Sand Filters
85 $20,000 $20,000/ac $15/sq. ft. $100/acre of
filter Seasonal Ponding
40 $3,000 $4,000/control
structure $50
Location in Watershed Network level modeling allows calculation of benefits to the receiving water body, not simply at the edge of field. Most projects were modeled to determine their benefits at the edge of the field due to model limitations however. The BWSR Pollutant Reductions Calculators and SWAT are geared toward edge of field modeling in rural landscapes, whereas WinSLAMM is designed to calculate network level benefits in built environments. In order to translate edge of field benefits into benefits to the receiving water body, a pollutant delivery ratio (PDR) is used. PDRs can be highly complex calculations, including factors such as slope, distance to a water course, vegetative cover, distance to the receiving water body, the target pollutant, and intervening water quality treatment along the flow path. Incorporating all of these in a reproducible manner would require complex algorithms that are beyond the scope of this effort. A subjective PDR was provided as an example however. It was intuitively arrived at by a natural resource management professional utilizing maps showing the project location in the watershed,
9 Assumes 160 bushel/acre corn at $5.00/bushel.
Lake Sarah and Lake Independence Stormwater Retrofit Analysis
18 Analytical Elements
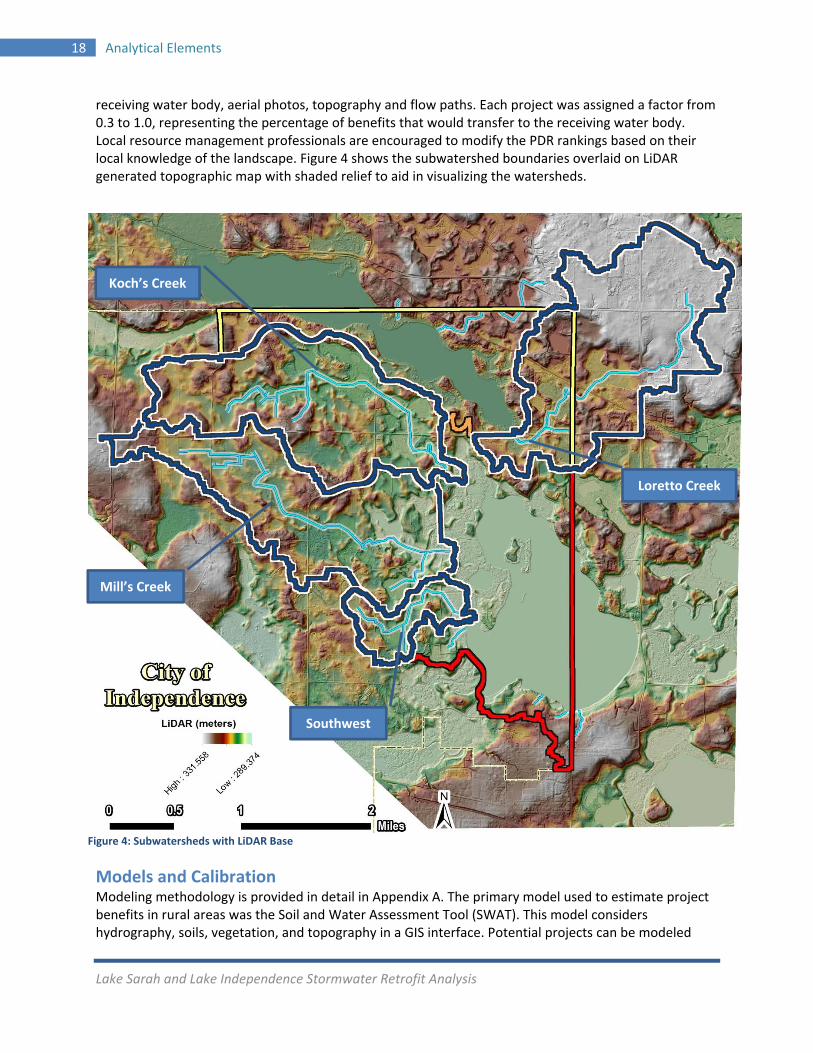
receiving water body, aerial photos, topography and flow paths. Each project was assigned a factor from 0.3 to 1.0, representing the percentage of benefits that would transfer to the receiving water body. Local resource management professionals are encouraged to modify the PDR rankings based on their local knowledge of the landscape. Figure 4 shows the subwatershed boundaries overlaid on LiDAR generated topographic map with shaded relief to aid in visualizing the watersheds.
Models and Calibration Modeling methodology is provided in detail in Appendix A. The primary model used to estimate project benefits in rural areas was the Soil and Water Assessment Tool (SWAT). This model considers hydrography, soils, vegetation, and topography in a GIS interface. Potential projects can be modeled
Figure 4: Subwatersheds with LiDAR Base
Mill’s Creek
Koch’s Creek
Southwest
Loretto Creek
Lake Sarah and Lake Independence Stormwater Retrofit Analysis
Analytical Elements 19
either by inserting a practice at the downstream limit of a defined subwatershed or by altering landuse and/or topography within that watershed. The latter approach is highly time intensive and does not lend itself well to rapidly modeling multiple scenarios. As such, the use of SWAT was limited to edge of field benefits modeling. SWAT was also used by the Three Rivers Park District (TRPD) to model agricultural areas of the Lake Sarah watershed in the Lake Sarah TMDL. TRPD calibrated and validated the model with field monitoring. Those calibrations were applied to this SWAT model. SWAT was run to calculate base conditions for three regional ponds, which are positioned close to the lakes and treat the vast majority of the contributing subwatershed. SWAT modeling results for these watersheds are compared to SWAT model outputs for the Lake Sarah TMDL and calibrated BATHTUB and FLUX models used in the Lake Independence TMDL. Those comparisons are shown in Table 13. Table 13: Model Calibration
Annual Loading TP
Modeled(lbs)
TP TMDL (lbs)
TP Variance
Sarah – Loretto Creek and Portion of Other Direct 746 761 98% Independence ‐ Koch’s Creek 336 314 107% Independence ‐ Mill’s Creek 439 482 91%
SWAT was used to model benefits for all but residential rain gardens (WinSLAMM), gully stabilizations (BWSR PRC), lakeshore restorations (BWSR PRC), and iron enhanced sand filters (WinSLAMM). The other models, as noted in Table 10 and Appendix A, were not calibrated but their application was limited to near‐lake practices and so their results are less likely to have been skewed by watershed influences.
Project Alternatives and Treatment Trains Although there are sufficient projects identified in the Lake Independence and Lake Sarah watersheds to individually remove a total of 680 lbs/yr of TP and 110 lbs/yr of TP respectively, the cumulative benefit of all of those projects in the landscape would be an amount far less than that. This is true because the projects overlap substantially in terms of both contributing watershed and downstream benefits. These overlaps impact how much pollutant loading reduction can actually be achieved on the landscape. The most effective way to take these overlaps into account is through a watershed wide model that incorporates all stormwater treatment structures, cultural practices and landuse changes. This is not currently practical due to limits in technology and staffing. As an alternative, local resource managers should consider this overlap intuitively in two general ways when selecting projects for installation; 1) alternative treatment options presented for the same problem, and 2) treatment train effects.
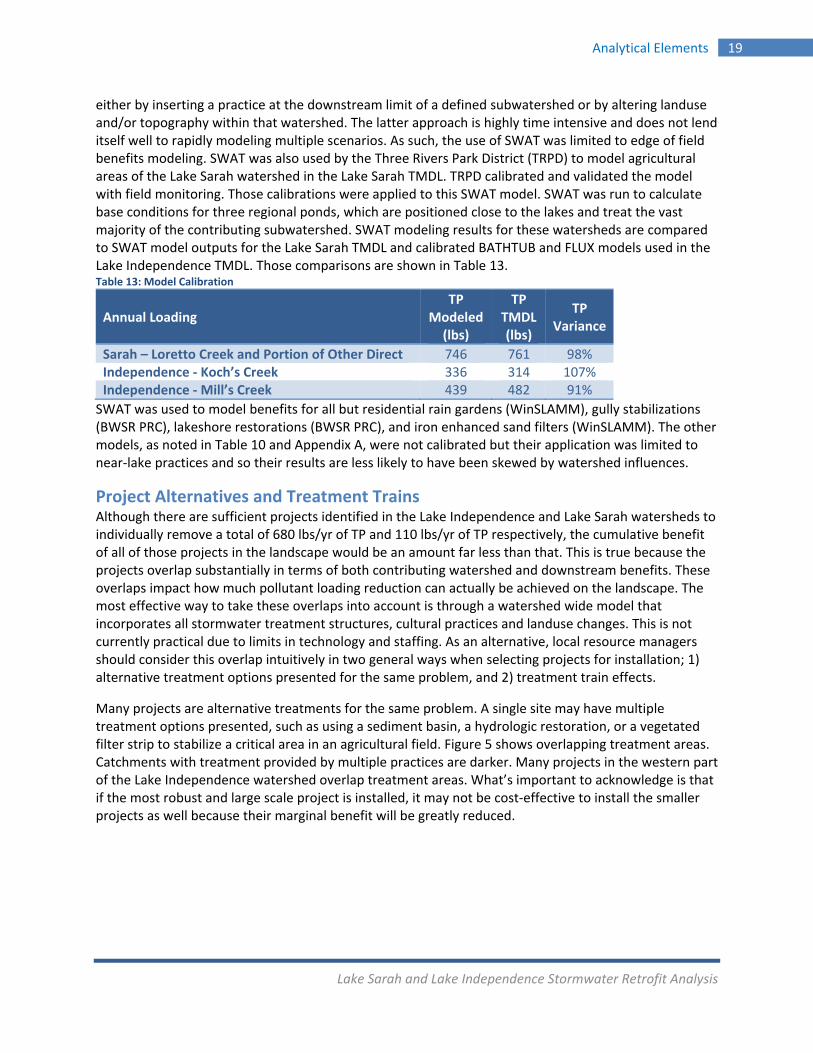
Many projects are alternative treatments for the same problem. A single site may have multiple treatment options presented, such as using a sediment basin, a hydrologic restoration, or a vegetated filter strip to stabilize a critical area in an agricultural field. Figure 5 shows overlapping treatment areas. Catchments with treatment provided by multiple practices are darker. Many projects in the western part of the Lake Independence watershed overlap treatment areas. What’s important to acknowledge is that if the most robust and large scale project is installed, it may not be cost‐effective to install the smaller projects as well because their marginal benefit will be greatly reduced.
Lake Sarah and Lake Independence Stormwater Retrofit Analysis
20 Analytical Elements
Treatment trains are another form of overlapping treatment by treating water in series through multiple practices. The clearest examples in this report are the three regional ponds. Each of these ponds treats stormwater runoff from its entire subwatershed. The modeling completed for the regional ponds to ascertain water quality and volume inputs and outflows presumed current landuse conditions. Within each subwatershed, however, numerous other potential projects have been identified. As these other projects are installed and come on‐line, the water quality entering the regional ponds will be improved and so the marginal treatment provided by the pond may be lower. The reduction in treatment provided by the regional pond is not likely to be equal to the added treatment provided by the upstream practice however, since needed water quality treatment is greater than the capacity of both practices. As long as the regional pond continues to discharge some pollutant loading into the lake, projects installed further upstream will continue to provide some level of benefit.
Figure 5: Overlapping Treatment
Lake Sarah and Lake Independence Stormwater Retrofit Analysis
Project Ranking, Selection and Funding 21
Project Ranking, Selection and Funding The intent of this analysis is to provide the information necessary to enable local natural resource managers to successfully secure funding for the most cost‐effective projects to achieve water quality goals. This analysis ranks projects by cost‐effectiveness to facilitate project selection. There are many possible ways to prioritize projects, and the list provided in this report is merely a starting point. Local resource management professionals will be responsible to select projects to pursue. Several considerations in addition to project cost‐effectiveness for prioritizing installation are included.
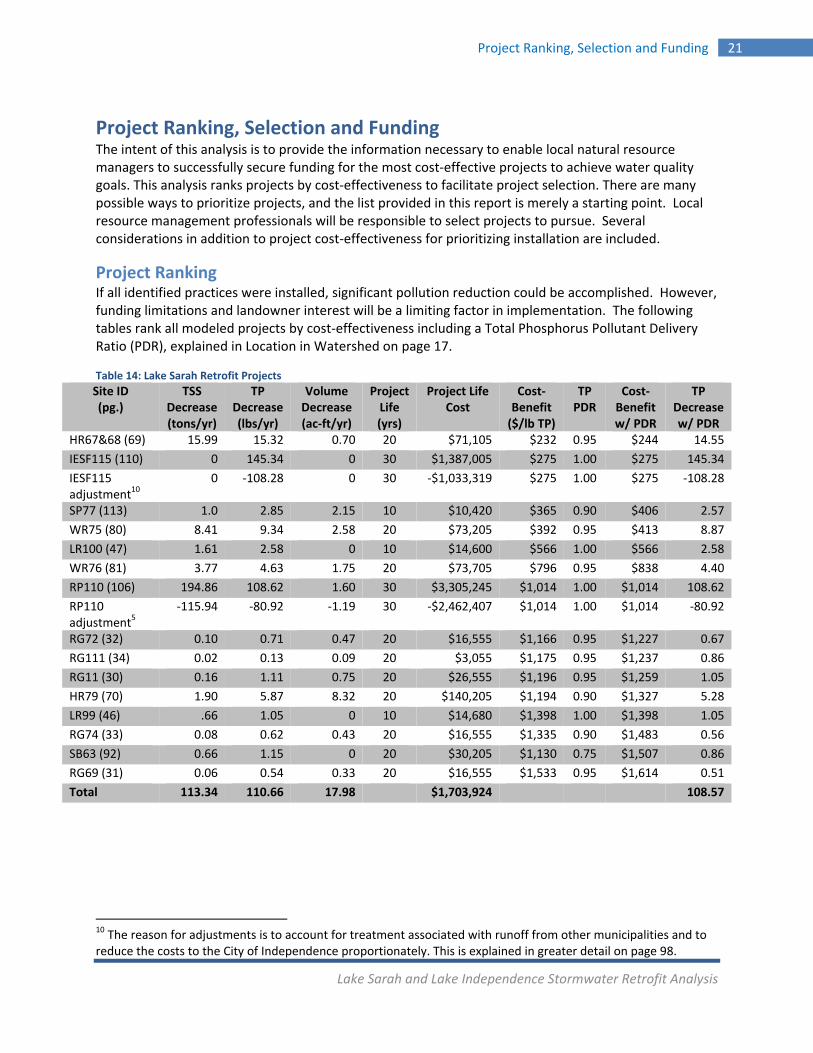
Project Ranking If all identified practices were installed, significant pollution reduction could be accomplished. However, funding limitations and landowner interest will be a limiting factor in implementation. The following tables rank all modeled projects by cost‐effectiveness including a Total Phosphorus Pollutant Delivery Ratio (PDR), explained in Location in Watershed on page 17.
Table 14: Lake Sarah Retrofit Projects
10 The reason for adjustments is to account for treatment associated with runoff from other municipalities and to reduce the costs to the City of Independence proportionately. This is explained in greater detail on page 98.
Site ID (pg.)
TSS Decrease (tons/yr)
TP Decrease (lbs/yr)
Volume Decrease (ac‐ft/yr)
Project Life (yrs)
Project Life Cost
Cost‐Benefit ($/lb TP)
TP PDR
Cost‐Benefit w/ PDR
TP Decrease w/ PDR
HR67&68 (69) 15.99 15.32 0.70 20 $71,105 $232 0.95 $244 14.55
IESF115 (110) 0 145.34 0 30 $1,387,005 $275 1.00 $275 145.34
IESF115 adjustment10
0 ‐108.28 0 30 ‐$1,033,319 $275 1.00 $275 ‐108.28
SP77 (113) 1.0 2.85 2.15 10 $10,420 $365 0.90 $406 2.57
WR75 (80) 8.41 9.34 2.58 20 $73,205 $392 0.95 $413 8.87
LR100 (47) 1.61 2.58 0 10 $14,600 $566 1.00 $566 2.58
WR76 (81) 3.77 4.63 1.75 20 $73,705 $796 0.95 $838 4.40
RP110 (106) 194.86 108.62 1.60 30 $3,305,245 $1,014 1.00 $1,014 108.62
RP110 adjustment5
‐115.94 ‐80.92 ‐1.19 30 ‐$2,462,407 $1,014 1.00 $1,014 ‐80.92
RG72 (32) 0.10 0.71 0.47 20 $16,555 $1,166 0.95 $1,227 0.67
RG111 (34) 0.02 0.13 0.09 20 $3,055 $1,175 0.95 $1,237 0.86
RG11 (30) 0.16 1.11 0.75 20 $26,555 $1,196 0.95 $1,259 1.05
HR79 (70) 1.90 5.87 8.32 20 $140,205 $1,194 0.90 $1,327 5.28
LR99 (46) .66 1.05 0 10 $14,680 $1,398 1.00 $1,398 1.05
RG74 (33) 0.08 0.62 0.43 20 $16,555 $1,335 0.90 $1,483 0.56
SB63 (92) 0.66 1.15 0 20 $30,205 $1,130 0.75 $1,507 0.86
RG69 (31) 0.06 0.54 0.33 20 $16,555 $1,533 0.95 $1,614 0.51
Total 113.34 110.66 17.98 $1,703,924 108.57
Lake Sarah and Lake Independence Stormwater Retrofit Analysis
22 Project Ranking, Selection and Funding
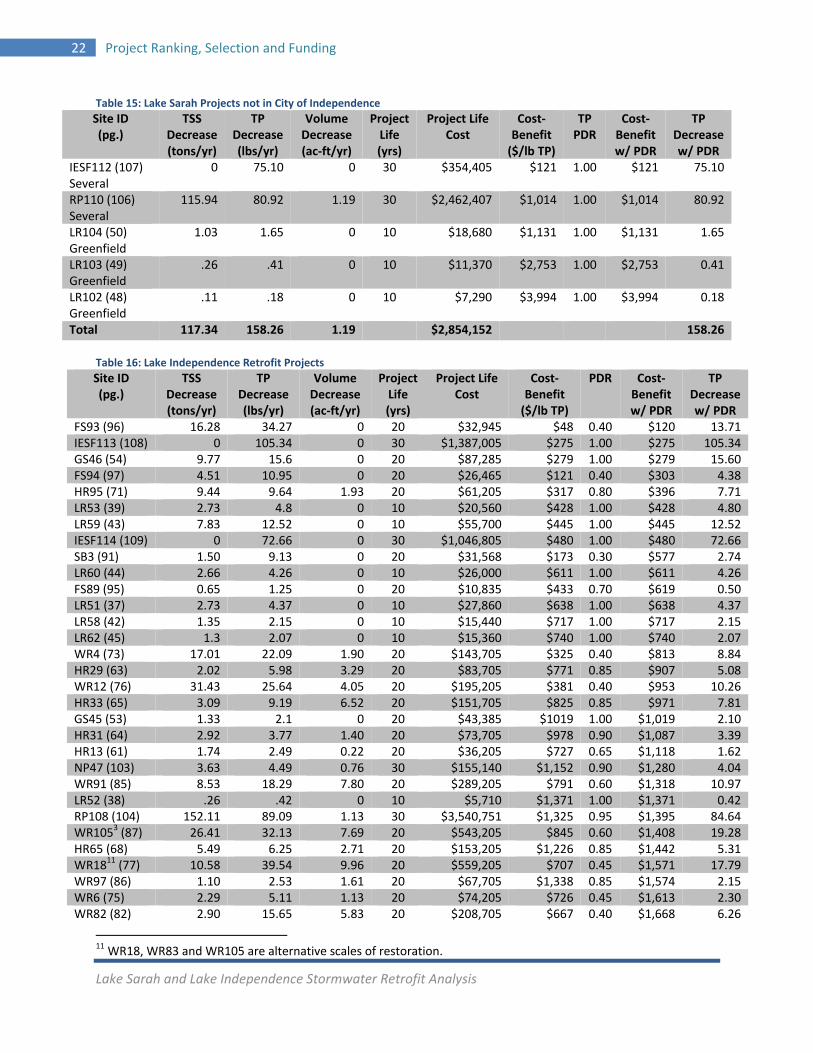
Table 15: Lake Sarah Projects not in City of Independence
Table 16: Lake Independence Retrofit Projects
11 WR18, WR83 and WR105 are alternative scales of restoration.
Site ID (pg.)
TSS Decrease (tons/yr)
TP Decrease (lbs/yr)
Volume Decrease (ac‐ft/yr)
Project Life (yrs)
Project Life Cost
Cost‐Benefit ($/lb TP)
TP PDR
Cost‐Benefit w/ PDR
TP Decrease w/ PDR
IESF112 (107) Several
0 75.10 0 30 $354,405 $121 1.00 $121 75.10
RP110 (106) Several
115.94 80.92 1.19 30 $2,462,407 $1,014 1.00 $1,014 80.92
LR104 (50) Greenfield
1.03 1.65 0 10 $18,680 $1,131 1.00 $1,131 1.65
LR103 (49) Greenfield
.26 .41 0 10 $11,370 $2,753 1.00 $2,753 0.41
LR102 (48) Greenfield
.11 .18 0 10 $7,290 $3,994 1.00 $3,994 0.18
Total 117.34 158.26 1.19 $2,854,152 158.26
Site ID (pg.)
TSS Decrease (tons/yr)
TP Decrease (lbs/yr)
Volume Decrease (ac‐ft/yr)
Project Life (yrs)
Project Life Cost
Cost‐Benefit ($/lb TP)
PDR Cost‐Benefit w/ PDR
TP Decrease w/ PDR
FS93 (96) 16.28 34.27 0 20 $32,945 $48 0.40 $120 13.71IESF113 (108) 0 105.34 0 30 $1,387,005 $275 1.00 $275 105.34GS46 (54) 9.77 15.6 0 20 $87,285 $279 1.00 $279 15.60FS94 (97) 4.51 10.95 0 20 $26,465 $121 0.40 $303 4.38HR95 (71) 9.44 9.64 1.93 20 $61,205 $317 0.80 $396 7.71LR53 (39) 2.73 4.8 0 10 $20,560 $428 1.00 $428 4.80LR59 (43) 7.83 12.52 0 10 $55,700 $445 1.00 $445 12.52IESF114 (109) 0 72.66 0 30 $1,046,805 $480 1.00 $480 72.66SB3 (91) 1.50 9.13 0 20 $31,568 $173 0.30 $577 2.74LR60 (44) 2.66 4.26 0 10 $26,000 $611 1.00 $611 4.26FS89 (95) 0.65 1.25 0 20 $10,835 $433 0.70 $619 0.50LR51 (37) 2.73 4.37 0 10 $27,860 $638 1.00 $638 4.37LR58 (42) 1.35 2.15 0 10 $15,440 $717 1.00 $717 2.15LR62 (45) 1.3 2.07 0 10 $15,360 $740 1.00 $740 2.07WR4 (73) 17.01 22.09 1.90 20 $143,705 $325 0.40 $813 8.84HR29 (63) 2.02 5.98 3.29 20 $83,705 $771 0.85 $907 5.08WR12 (76) 31.43 25.64 4.05 20 $195,205 $381 0.40 $953 10.26HR33 (65) 3.09 9.19 6.52 20 $151,705 $825 0.85 $971 7.81GS45 (53) 1.33 2.1 0 20 $43,385 $1019 1.00 $1,019 2.10HR31 (64) 2.92 3.77 1.40 20 $73,705 $978 0.90 $1,087 3.39HR13 (61) 1.74 2.49 0.22 20 $36,205 $727 0.65 $1,118 1.62NP47 (103) 3.63 4.49 0.76 30 $155,140 $1,152 0.90 $1,280 4.04WR91 (85) 8.53 18.29 7.80 20 $289,205 $791 0.60 $1,318 10.97LR52 (38) .26 .42 0 10 $5,710 $1,371 1.00 $1,371 0.42RP108 (104) 152.11 89.09 1.13 30 $3,540,751 $1,325 0.95 $1,395 84.64WR1053 (87) 26.41 32.13 7.69 20 $543,205 $845 0.60 $1,408 19.28HR65 (68) 5.49 6.25 2.71 20 $153,205 $1,226 0.85 $1,442 5.31WR1811 (77) 10.58 39.54 9.96 20 $559,205 $707 0.45 $1,571 17.79WR97 (86) 1.10 2.53 1.61 20 $67,705 $1,338 0.85 $1,574 2.15WR6 (75) 2.29 5.11 1.13 20 $74,205 $726 0.45 $1,613 2.30WR82 (82) 2.90 15.65 5.83 20 $208,705 $667 0.40 $1,668 6.26
Lake Sarah and Lake Independence Stormwater Retrofit Analysis
Project Ranking, Selection and Funding 23
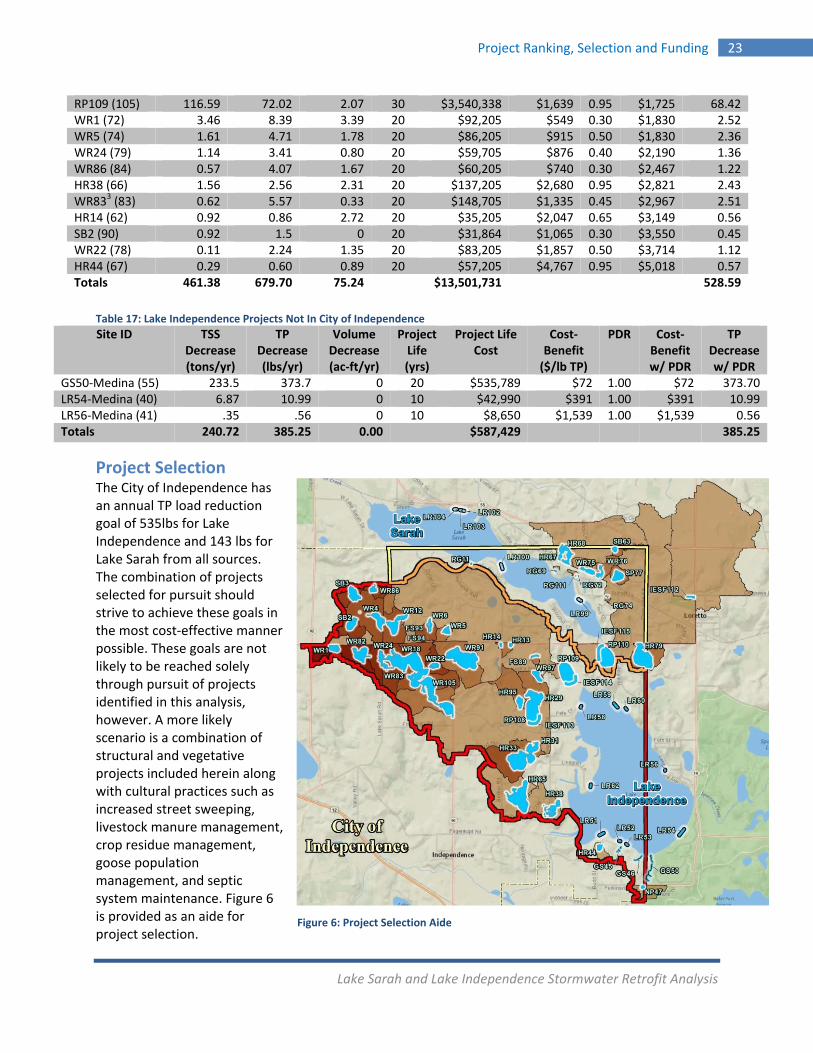
Table 17: Lake Independence Projects Not In City of Independence
Project Selection The City of Independence has an annual TP load reduction goal of 535lbs for Lake Independence and 143 lbs for Lake Sarah from all sources. The combination of projects selected for pursuit should strive to achieve these goals in the most cost‐effective manner possible. These goals are not likely to be reached solely through pursuit of projects identified in this analysis, however. A more likely scenario is a combination of structural and vegetative projects included herein along with cultural practices such as increased street sweeping, livestock manure management, crop residue management, goose population management, and septic system maintenance. Figure 6 is provided as an aide for project selection.
RP109 (105) 116.59 72.02 2.07 30 $3,540,338 $1,639 0.95 $1,725 68.42WR1 (72) 3.46 8.39 3.39 20 $92,205 $549 0.30 $1,830 2.52WR5 (74) 1.61 4.71 1.78 20 $86,205 $915 0.50 $1,830 2.36WR24 (79) 1.14 3.41 0.80 20 $59,705 $876 0.40 $2,190 1.36WR86 (84) 0.57 4.07 1.67 20 $60,205 $740 0.30 $2,467 1.22HR38 (66) 1.56 2.56 2.31 20 $137,205 $2,680 0.95 $2,821 2.43WR833 (83) 0.62 5.57 0.33 20 $148,705 $1,335 0.45 $2,967 2.51HR14 (62) 0.92 0.86 2.72 20 $35,205 $2,047 0.65 $3,149 0.56SB2 (90) 0.92 1.5 0 20 $31,864 $1,065 0.30 $3,550 0.45WR22 (78) 0.11 2.24 1.35 20 $83,205 $1,857 0.50 $3,714 1.12HR44 (67) 0.29 0.60 0.89 20 $57,205 $4,767 0.95 $5,018 0.57Totals 461.38 679.70 75.24 $13,501,731 528.59
Site ID TSS Decrease (tons/yr)
TP Decrease (lbs/yr)
Volume Decrease (ac‐ft/yr)
Project Life (yrs)
Project Life Cost
Cost‐Benefit ($/lb TP)
PDR Cost‐Benefit w/ PDR
TP Decrease w/ PDR
GS50‐Medina (55) 233.5 373.7 0 20 $535,789 $72 1.00 $72 373.70LR54‐Medina (40) 6.87 10.99 0 10 $42,990 $391 1.00 $391 10.99LR56‐Medina (41) .35 .56 0 10 $8,650 $1,539 1.00 $1,539 0.56Totals 240.72 385.25 0.00 $587,429 385.25
Figure 6: Project Selection Aide

Lake Sarah and Lake Independence Stormwater Retrofit Analysis
24 Project Ranking, Selection and Funding
Several other factors affecting project installation decisions should be weighed by resource managers when selecting projects to pursue. These factors include but are not limited to the following;
Total project costs
Cumulative treatment
Availability of funding
Economies of scale
Landowner willingness
Project combinations with treatment train effects
Non‐target pollutant reductions
Timing coordination with other projects to achieve cost savings
Stakeholder input
Number of parcels (landowners) involved
Project visibility
Educational value
Long term impacts on property values and public infrastructure
Because much of the watershed is in agricultural production and commodity prices are very high it may be impractical to install agricultural conservation practices to improve water quality and reduce discharge volumes that remove crop land from production. Strategies to install conservation practices in light of this include:
Focus on residential areas, where landowners are more likely to view projects as mutually beneficial (lakeshore restoration, gully stabilization and rain gardens).
Contact owners of large parcels that are for sale as they may be more willing to consider installing practices such as wetland restorations.
Break all tile lines within areas that are undergoing residential development.
Promote practices such as sediment basins and seasonal ponding that remove very little land from production.
Provide compensation for losses in production for projects like filter strips and grassed waterways that do take land out of production. Lost production payments are included in project cost estimates and they are still cost‐effective.
Promote wetland banking projects in marginal agricultural lands, the funds from which may be financially preferable to commodity prices.
Purchase fee title or easements on land for long term restorations that restore cropland to wetland.
The tables below provide an example of project selection by assigning tiers according to some of the factors and considerations listed above.
Lake Sarah and Lake Independence Stormwater Retrofit Analysis
Project Ranking, Selection and Funding 25
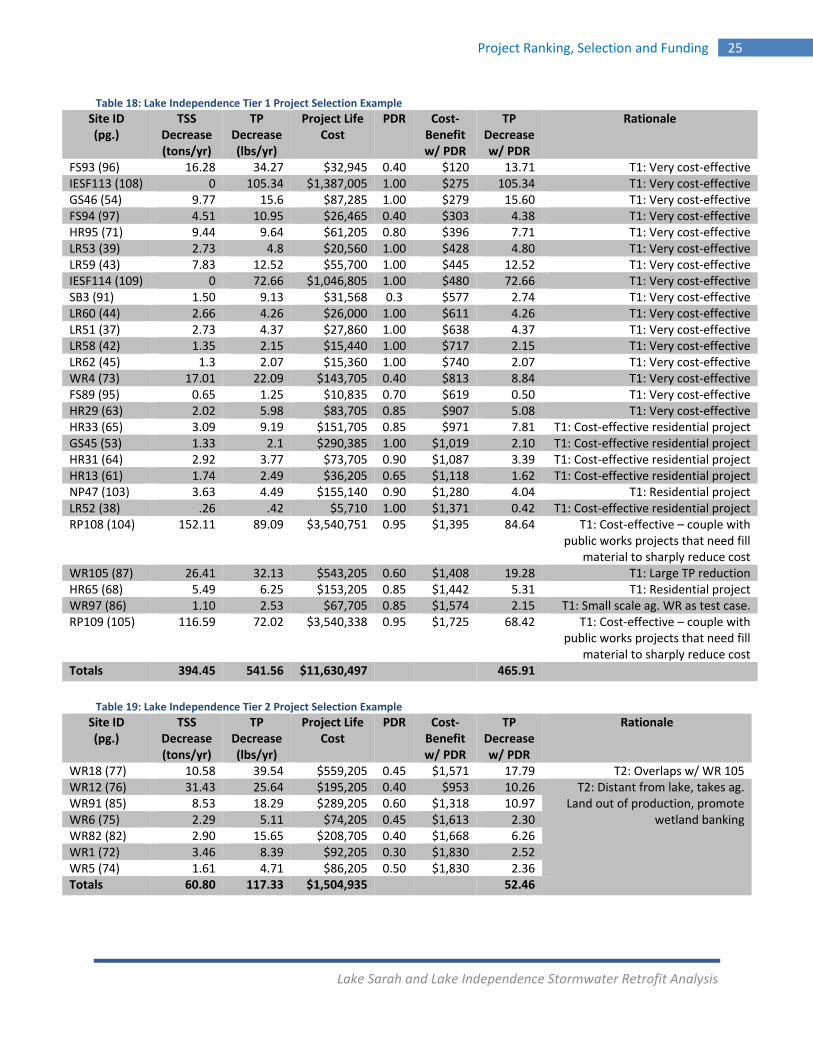
Table 18: Lake Independence Tier 1 Project Selection Example
Table 19: Lake Independence Tier 2 Project Selection Example
Site ID (pg.)
TSS Decrease (tons/yr)
TP Decrease (lbs/yr)
Project Life Cost
PDR Cost‐Benefit w/ PDR
TP Decrease w/ PDR
Rationale
FS93 (96) 16.28 34.27 $32,945 0.40 $120 13.71 T1: Very cost‐effectiveIESF113 (108) 0 105.34 $1,387,005 1.00 $275 105.34 T1: Very cost‐effectiveGS46 (54) 9.77 15.6 $87,285 1.00 $279 15.60 T1: Very cost‐effectiveFS94 (97) 4.51 10.95 $26,465 0.40 $303 4.38 T1: Very cost‐effectiveHR95 (71) 9.44 9.64 $61,205 0.80 $396 7.71 T1: Very cost‐effectiveLR53 (39) 2.73 4.8 $20,560 1.00 $428 4.80 T1: Very cost‐effectiveLR59 (43) 7.83 12.52 $55,700 1.00 $445 12.52 T1: Very cost‐effectiveIESF114 (109) 0 72.66 $1,046,805 1.00 $480 72.66 T1: Very cost‐effectiveSB3 (91) 1.50 9.13 $31,568 0.3 $577 2.74 T1: Very cost‐effectiveLR60 (44) 2.66 4.26 $26,000 1.00 $611 4.26 T1: Very cost‐effectiveLR51 (37) 2.73 4.37 $27,860 1.00 $638 4.37 T1: Very cost‐effectiveLR58 (42) 1.35 2.15 $15,440 1.00 $717 2.15 T1: Very cost‐effectiveLR62 (45) 1.3 2.07 $15,360 1.00 $740 2.07 T1: Very cost‐effectiveWR4 (73) 17.01 22.09 $143,705 0.40 $813 8.84 T1: Very cost‐effectiveFS89 (95) 0.65 1.25 $10,835 0.70 $619 0.50 T1: Very cost‐effectiveHR29 (63) 2.02 5.98 $83,705 0.85 $907 5.08 T1: Very cost‐effectiveHR33 (65) 3.09 9.19 $151,705 0.85 $971 7.81 T1: Cost‐effective residential projectGS45 (53) 1.33 2.1 $290,385 1.00 $1,019 2.10 T1: Cost‐effective residential projectHR31 (64) 2.92 3.77 $73,705 0.90 $1,087 3.39 T1: Cost‐effective residential projectHR13 (61) 1.74 2.49 $36,205 0.65 $1,118 1.62 T1: Cost‐effective residential projectNP47 (103) 3.63 4.49 $155,140 0.90 $1,280 4.04 T1: Residential projectLR52 (38) .26 .42 $5,710 1.00 $1,371 0.42 T1: Cost‐effective residential projectRP108 (104) 152.11 89.09 $3,540,751 0.95 $1,395 84.64 T1: Cost‐effective – couple with
public works projects that need fill material to sharply reduce cost
WR105 (87) 26.41 32.13 $543,205 0.60 $1,408 19.28 T1: Large TP reductionHR65 (68) 5.49 6.25 $153,205 0.85 $1,442 5.31 T1: Residential projectWR97 (86) 1.10 2.53 $67,705 0.85 $1,574 2.15 T1: Small scale ag. WR as test case.RP109 (105) 116.59 72.02 $3,540,338 0.95 $1,725 68.42 T1: Cost‐effective – couple with
public works projects that need fill material to sharply reduce cost
Totals 394.45 541.56 $11,630,497 465.91
Site ID (pg.)
TSS Decrease (tons/yr)
TP Decrease (lbs/yr)
Project Life Cost
PDR Cost‐Benefit w/ PDR
TP Decrease w/ PDR
Rationale
WR18 (77) 10.58 39.54 $559,205 0.45 $1,571 17.79 T2: Overlaps w/ WR 105WR12 (76) 31.43 25.64 $195,205 0.40 $953 10.26 T2: Distant from lake, takes ag.
Land out of production, promote wetland banking
WR91 (85) 8.53 18.29 $289,205 0.60 $1,318 10.97WR6 (75) 2.29 5.11 $74,205 0.45 $1,613 2.30WR82 (82) 2.90 15.65 $208,705 0.40 $1,668 6.26WR1 (72) 3.46 8.39 $92,205 0.30 $1,830 2.52WR5 (74) 1.61 4.71 $86,205 0.50 $1,830 2.36Totals 60.80 117.33 $1,504,935 52.46
Lake Sarah and Lake Independence Stormwater Retrofit Analysis
26 Project Ranking, Selection and Funding
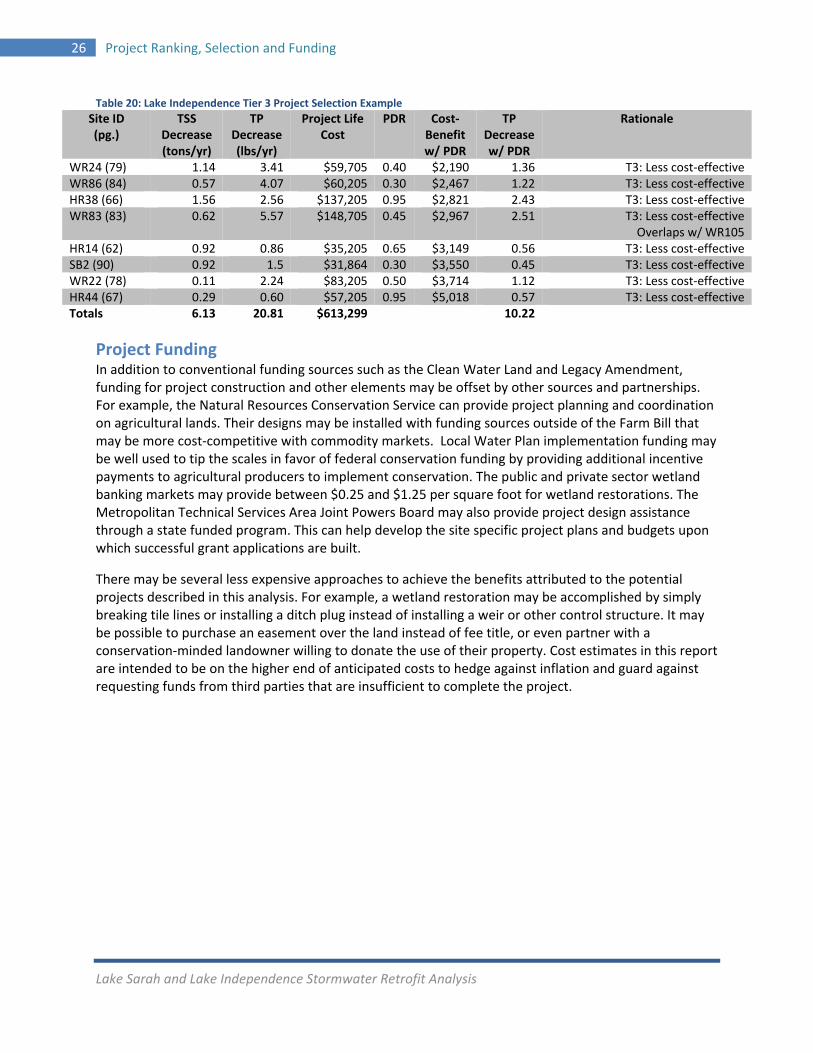
Table 20: Lake Independence Tier 3 Project Selection Example
Project Funding In addition to conventional funding sources such as the Clean Water Land and Legacy Amendment, funding for project construction and other elements may be offset by other sources and partnerships. For example, the Natural Resources Conservation Service can provide project planning and coordination on agricultural lands. Their designs may be installed with funding sources outside of the Farm Bill that may be more cost‐competitive with commodity markets. Local Water Plan implementation funding may be well used to tip the scales in favor of federal conservation funding by providing additional incentive payments to agricultural producers to implement conservation. The public and private sector wetland banking markets may provide between $0.25 and $1.25 per square foot for wetland restorations. The Metropolitan Technical Services Area Joint Powers Board may also provide project design assistance through a state funded program. This can help develop the site specific project plans and budgets upon which successful grant applications are built.
There may be several less expensive approaches to achieve the benefits attributed to the potential projects described in this analysis. For example, a wetland restoration may be accomplished by simply breaking tile lines or installing a ditch plug instead of installing a weir or other control structure. It may be possible to purchase an easement over the land instead of fee title, or even partner with a conservation‐minded landowner willing to donate the use of their property. Cost estimates in this report are intended to be on the higher end of anticipated costs to hedge against inflation and guard against requesting funds from third parties that are insufficient to complete the project.
Site ID (pg.)
TSS Decrease (tons/yr)
TP Decrease (lbs/yr)
Project Life Cost
PDR Cost‐Benefit w/ PDR
TP Decrease w/ PDR
Rationale
WR24 (79) 1.14 3.41 $59,705 0.40 $2,190 1.36 T3: Less cost‐effectiveWR86 (84) 0.57 4.07 $60,205 0.30 $2,467 1.22 T3: Less cost‐effectiveHR38 (66) 1.56 2.56 $137,205 0.95 $2,821 2.43 T3: Less cost‐effectiveWR83 (83) 0.62 5.57 $148,705 0.45 $2,967 2.51 T3: Less cost‐effective
Overlaps w/ WR105 HR14 (62) 0.92 0.86 $35,205 0.65 $3,149 0.56 T3: Less cost‐effectiveSB2 (90) 0.92 1.5 $31,864 0.30 $3,550 0.45 T3: Less cost‐effectiveWR22 (78) 0.11 2.24 $83,205 0.50 $3,714 1.12 T3: Less cost‐effectiveHR44 (67) 0.29 0.60 $57,205 0.95 $5,018 0.57 T3: Less cost‐effectiveTotals 6.13 20.81 $613,299 10.22

Lake Sarah and Lake Independence Stormwater Retrofit Analysis
Project Profiles – Residential Rain Gardens 27
Project Profiles Modeled projects are organized by type instead of subwatershed or catchment. This was done to reduce duplicative reporting within the analysis and facilitate report compilation. For each project modeled, the method of modeling, assumptions made, and cost estimate considerations are described, and are similar for each project type. Furthermore, the mapping conventions and table configurations for each project type are similar but may vary greatly between project types. To facilitate generation of tabular outputs and maps as well as reporting of model and budget elements, a report structured around distinct project types emerged as most efficient. Project types included in the following sections are;
Residential Rain Gardens
Lakeshore Restorations
Gully Stabilizations
Hydrologic Restorations
Water and Sediment Control Basins
Vegetated Filter Strips/ Grassed Waterways
New Ponds (neighborhood and regional)
Iron Enhanced Sand Filters
Seasonal Ponding
Residential rain gardens capture and treat stormwater runoff from roads, driveways and roof tops. There are two general types of rain gardens; rain leader disconnect, and curb cut. The former captures stormwater as it discharges from gutter downspouts and can be incorporated into most properties. The latter captures stormwater that is in roadside gutters and redirects it into shallow road‐side basins.
Both types of rain gardens can function as infiltration basins (bioretention) or filtrations basins (biofiltration). Filtration basins are designed with a buried perforated drain tile that allows water in the basin to discharge to the stormwater drainage system after
having been filtered through the soil. Infiltration basins have no
underdrain, ensuring that all water that enters the basins will either infiltrate into the soil or be evapotranspired into the air. Bioretention provided 100% retention and treatment of captured stormwater, whereas biofiltration basins provide excellent removal of particulate contaminants but limited removal of dissolved contaminants, such as dissolved phosphorus.
The treatment efficacy of a particular project depends on many factors, including but not limited to the pollutant of concern, the quality of water entering the project, the intensity and duration of storm events, project size, position of the project in the landscape, existing down watershed treatment, soil and vegetation characteristics, and project type. Optimally, new rain gardens will capture water that would discharge into priority water body untreated. Many rain leader disconnect rain gardens intercept
Before/24 ‐48 hours after rain During rain
Figure 7: Curb Cut Rain Garden Example
Residential Rain Gardens
2
C
C
R‐
R‐
Lake Sara
28 Project
water thaprovided stormwatconveys t
Table 21: R
For the pucut rain garates, steeand sewastation. T
Each rain WinSLAMrunoff volproposedland uses,considerefrom vario
Rain Garde
Curb Cut ‐ Bior
Curb Cut ‐ Biof
Rain Leader Dis‐ Bioretention
Rain Leader Dis‐ Biofiltration
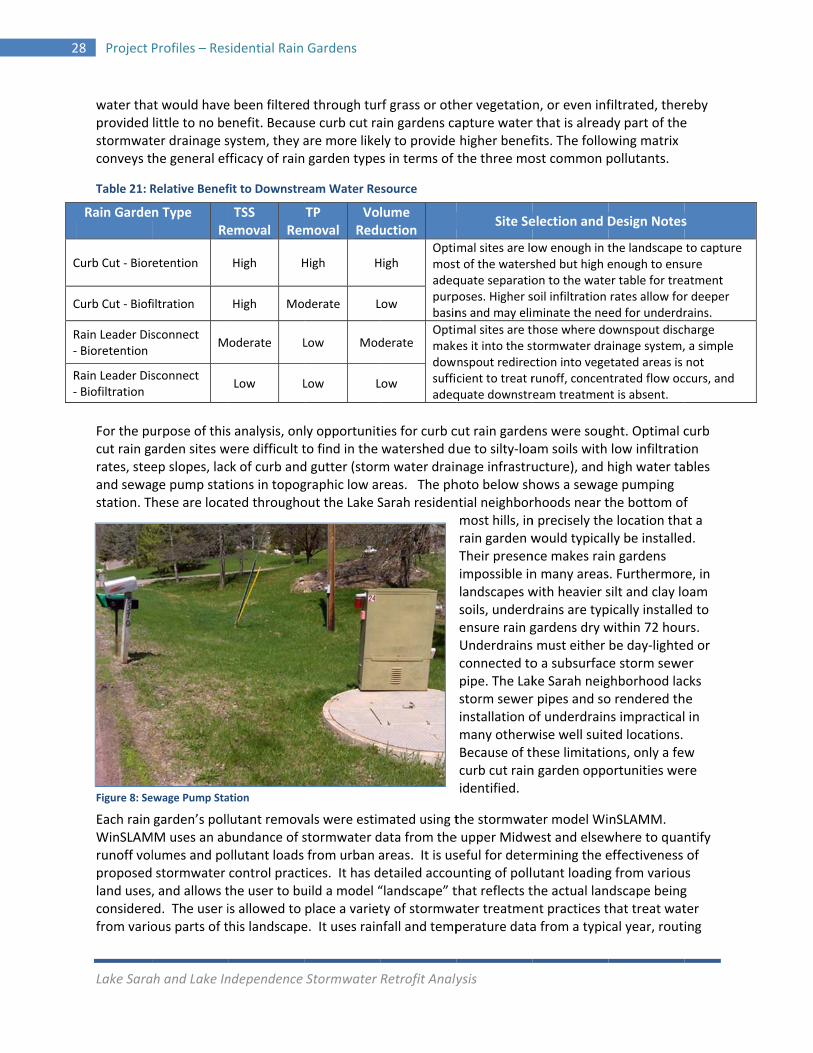
Figure 8: Se
ah and Lake In
Profiles – Res
at would havelittle to no beter drainage she general ef
Relative Benef
urpose of thisarden sites wep slopes, lacge pump stathese are loca
garden’s pollMM uses an ablumes and po stormwater , and allows ted. The user ious parts of t
n Type Re
etention
iltration
sconnect M
sconnect
ewage Pump Sta
ndependence
sidential Rain
e been filteredenefit. Becaussystem, they afficacy of rain
fit to Downstre
s analysis, onwere difficult tck of curb andtions in topogted througho
lutant removbundance of sollutant loads control practthe user to buis allowed to his landscape
TSS emoval Rem
High H
High Mo
oderate L
Low L
ation
Stormwater
Gardens
d through turse curb cut raare more like garden type
eam Water Re
ly opportunitto find in the d gutter (stormgraphic low arout the Lake S
als were estimstormwater dfrom urban atices. It has duild a model “place a variete. It uses rain
TP moval
VoRedu
High H
derate L
Low Mod
Low L
Retrofit Analy
rf grass or othain gardens caly to provide s in terms of
source
ies for curb cwatershed dm water drainreas. The phSarah residen
mated using tdata from theareas. It is usdetailed accou“landscape” tty of stormwanfall and temp
lume uction
High Optimostadeqpurpbasin
Low
derate Optimakedowsuffiadeq
Low
ysis
her vegetatioapture waterhigher benefthe three mo
cut rain gardeue to silty‐loanage infrastruhoto below shntial neighbormost hills, inrain garden wTheir presenimpossible inlandscapes wsoils, underdensure rain gUnderdrainsconnected topipe. The Lakstorm sewerinstallation omany otherwBecause of tcurb cut rainidentified.
the stormwate upper Midwseful for deteunting of pollthat reflects tater treatmenperature data
Site Se
mal sites are lot of the watersquate separatioposes. Higher sns and may eli
mal sites are tes it into the snspout redireccient to treat rquate downstr
n, or even infr that is alreadfits. The folloost common p
ens were sougam soils with ucture), and hhows a sewagrhoods near tn precisely thewould typicalnce makes rain many areaswith heavier sdrains are typgardens dry ws must either o a subsurfacke Sarah neigr pipes and soof underdrainwise well suithese limitation garden oppo
ter model Wiwest and elsewrmining the eutant loadingthe actual lannt practices ta from a typic
election and D
ow enough in tshed but high eon to the watesoil infiltration minate the ne
hose where dotormwater draction into vegerunoff, conceneam treatmen
filtrated, therdy part of thewing matrix pollutants.
ght. Optimal clow infiltratiohigh water tage pumping the bottom ofe location thally be installen gardens s. Furthermorsilt and clay lopically installewithin 72 hoube day‐lightee storm seweghborhood laco rendered thns impracticaled locations. ons, only a feortunities we
nSLAMM. where to quaeffectiveness g from varioudscape beinghat treat watcal year, rout
Design Notes
the landscape enough to enser table for trearates allow fored for underdr
ownspout discainage system,etated areas is ntrated flow ocnt is absent.
reby e
curb on ables
f at a d.
re, in oam ed to rs. ed or er cks e in
w re
ntify of s g ter ing
s
to capture ure atment r deeper rains.
harge , a simple not ccurs, and
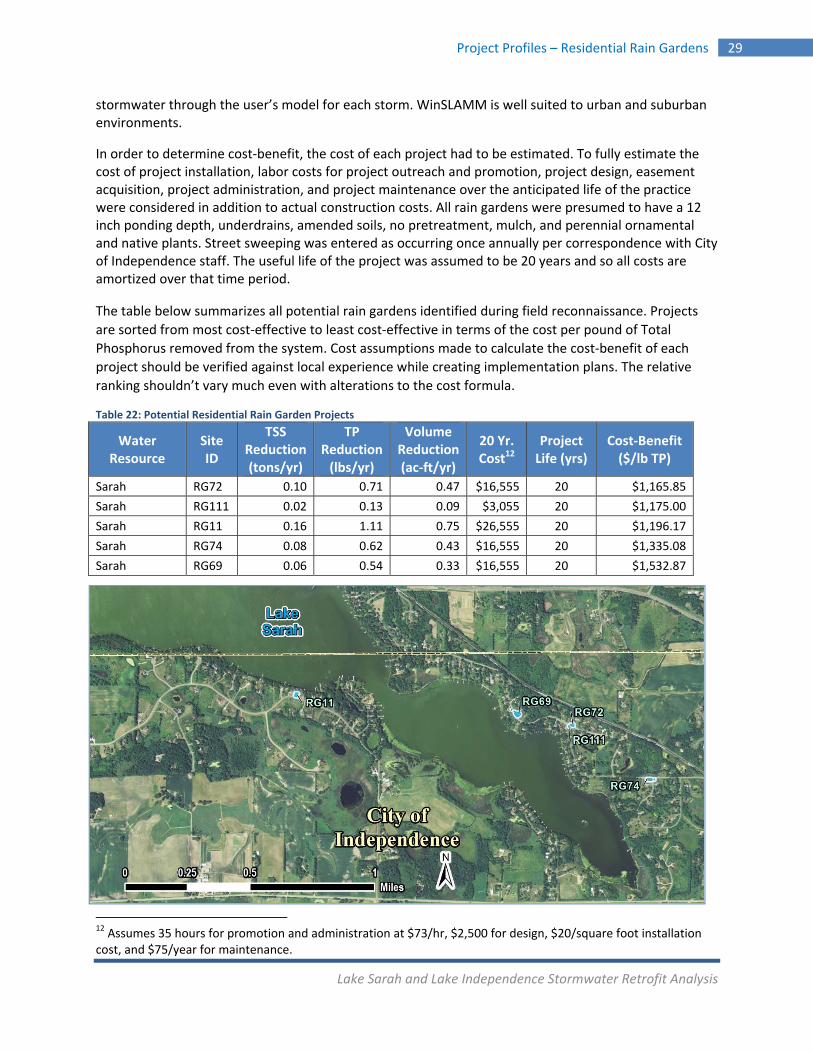
Lake Sarah and Lake Independence Stormwater Retrofit Analysis
Project Profiles – Residential Rain Gardens 29
stormwater through the user’s model for each storm. WinSLAMM is well suited to urban and suburban environments.
In order to determine cost‐benefit, the cost of each project had to be estimated. To fully estimate the cost of project installation, labor costs for project outreach and promotion, project design, easement acquisition, project administration, and project maintenance over the anticipated life of the practice were considered in addition to actual construction costs. All rain gardens were presumed to have a 12 inch ponding depth, underdrains, amended soils, no pretreatment, mulch, and perennial ornamental and native plants. Street sweeping was entered as occurring once annually per correspondence with City of Independence staff. The useful life of the project was assumed to be 20 years and so all costs are amortized over that time period.
The table below summarizes all potential rain gardens identified during field reconnaissance. Projects
are sorted from most cost‐effective to least cost‐effective in terms of the cost per pound of Total
Phosphorus removed from the system. Cost assumptions made to calculate the cost‐benefit of each
project should be verified against local experience while creating implementation plans. The relative
ranking shouldn’t vary much even with alterations to the cost formula.
Table 22: Potential Residential Rain Garden Projects
12 Assumes 35 hours for promotion and administration at $73/hr, $2,500 for design, $20/square foot installation cost, and $75/year for maintenance.
Water Resource
Site ID
TSS Reduction (tons/yr)
TP Reduction(lbs/yr)
Volume Reduction(ac‐ft/yr)
20 Yr. Cost12
Project Life (yrs)
Cost‐Benefit ($/lb TP)
Sarah RG72 0.10 0.71 0.47 $16,555 20 $1,165.85
Sarah RG111 0.02 0.13 0.09 $3,055 20 $1,175.00
Sarah RG11 0.16 1.11 0.75 $26,555 20 $1,196.17
Sarah RG74 0.08 0.62 0.43 $16,555 20 $1,335.08
Sarah RG69 0.06 0.54 0.33 $16,555 20 $1,532.87
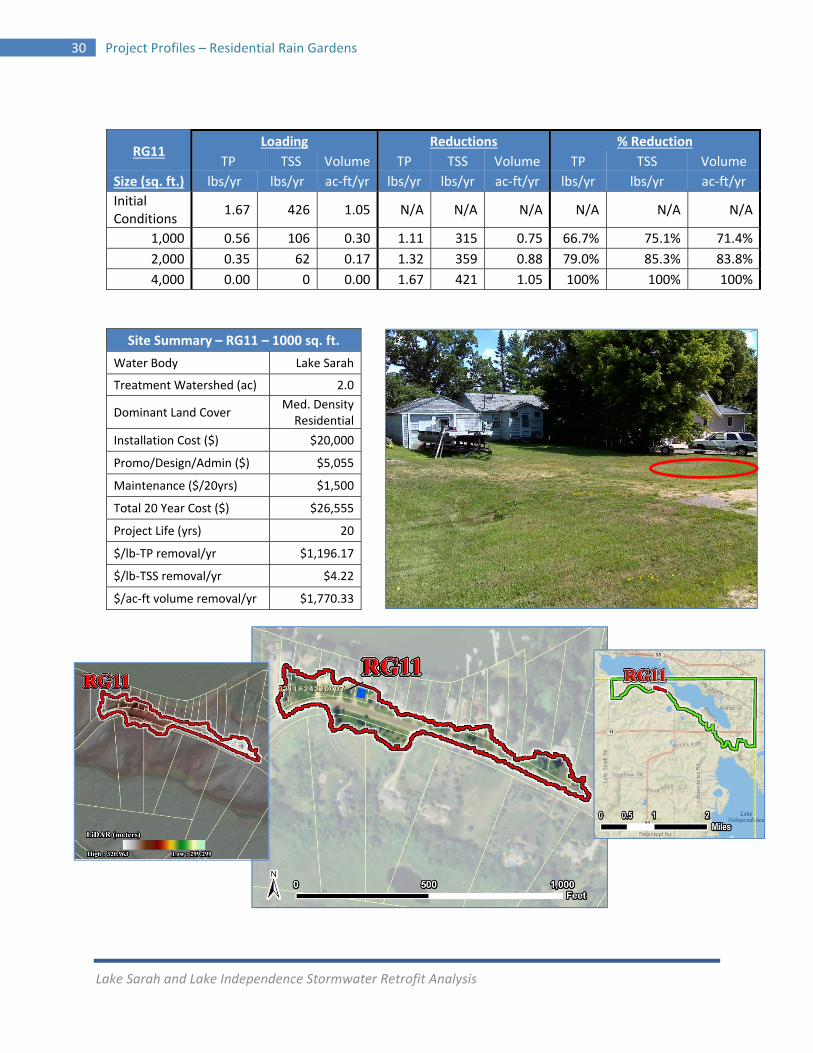
Lake Sarah and Lake Independence Stormwater Retrofit Analysis
30 Project Profiles – Residential Rain Gardens
RG11 Loading Reductions % Reduction
TP TSS Volume TP TSS Volume TP TSS Volume
Size (sq. ft.) lbs/yr lbs/yr ac‐ft/yr lbs/yr lbs/yr ac‐ft/yr lbs/yr lbs/yr ac‐ft/yr
Initial Conditions
1.67 426 1.05 N/A N/A N/A N/A N/A N/A
1,000 0.56 106 0.30 1.11 315 0.75 66.7% 75.1% 71.4%
2,000 0.35 62 0.17 1.32 359 0.88 79.0% 85.3% 83.8%
4,000 0.00 0 0.00 1.67 421 1.05 100% 100% 100%
Site Summary – RG11 – 1000 sq. ft.
Water Body Lake Sarah
Treatment Watershed (ac) 2.0
Dominant Land Cover Med. DensityResidential
Installation Cost ($) $20,000
Promo/Design/Admin ($) $5,055
Maintenance ($/20yrs) $1,500
Total 20 Year Cost ($) $26,555
Project Life (yrs) 20
$/lb‐TP removal/yr $1,196.17
$/lb‐TSS removal/yr $4.22
$/ac‐ft volume removal/yr $1,770.33
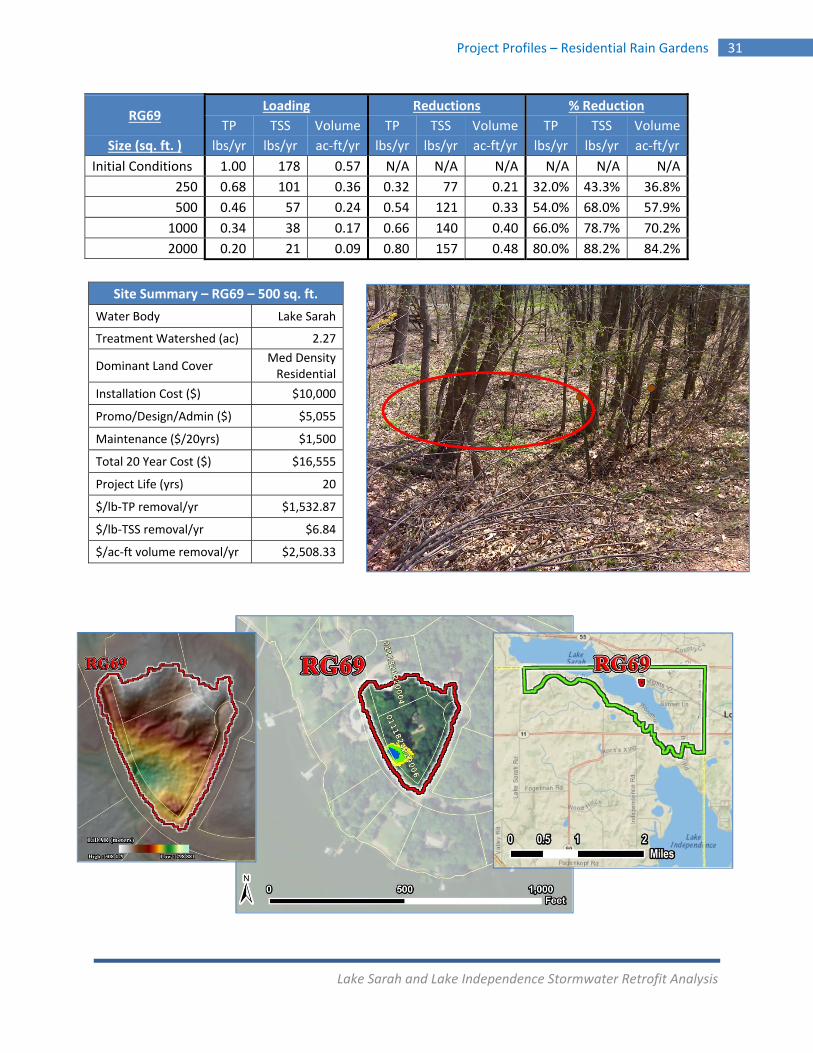
Lake Sarah and Lake Independence Stormwater Retrofit Analysis
Project Profiles – Residential Rain Gardens 31
RG69 Loading Reductions % Reduction
TP TSS Volume TP TSS Volume TP TSS Volume
Size (sq. ft. ) lbs/yr lbs/yr ac‐ft/yr lbs/yr lbs/yr ac‐ft/yr lbs/yr lbs/yr ac‐ft/yr
Initial Conditions 1.00 178 0.57 N/A N/A N/A N/A N/A N/A
250 0.68 101 0.36 0.32 77 0.21 32.0% 43.3% 36.8%
500 0.46 57 0.24 0.54 121 0.33 54.0% 68.0% 57.9%
1000 0.34 38 0.17 0.66 140 0.40 66.0% 78.7% 70.2%
2000 0.20 21 0.09 0.80 157 0.48 80.0% 88.2% 84.2%
Site Summary – RG69 – 500 sq. ft.
Water Body Lake Sarah
Treatment Watershed (ac) 2.27
Dominant Land Cover Med DensityResidential
Installation Cost ($) $10,000
Promo/Design/Admin ($) $5,055
Maintenance ($/20yrs) $1,500
Total 20 Year Cost ($) $16,555
Project Life (yrs) 20
$/lb‐TP removal/yr $1,532.87
$/lb‐TSS removal/yr $6.84
$/ac‐ft volume removal/yr $2,508.33
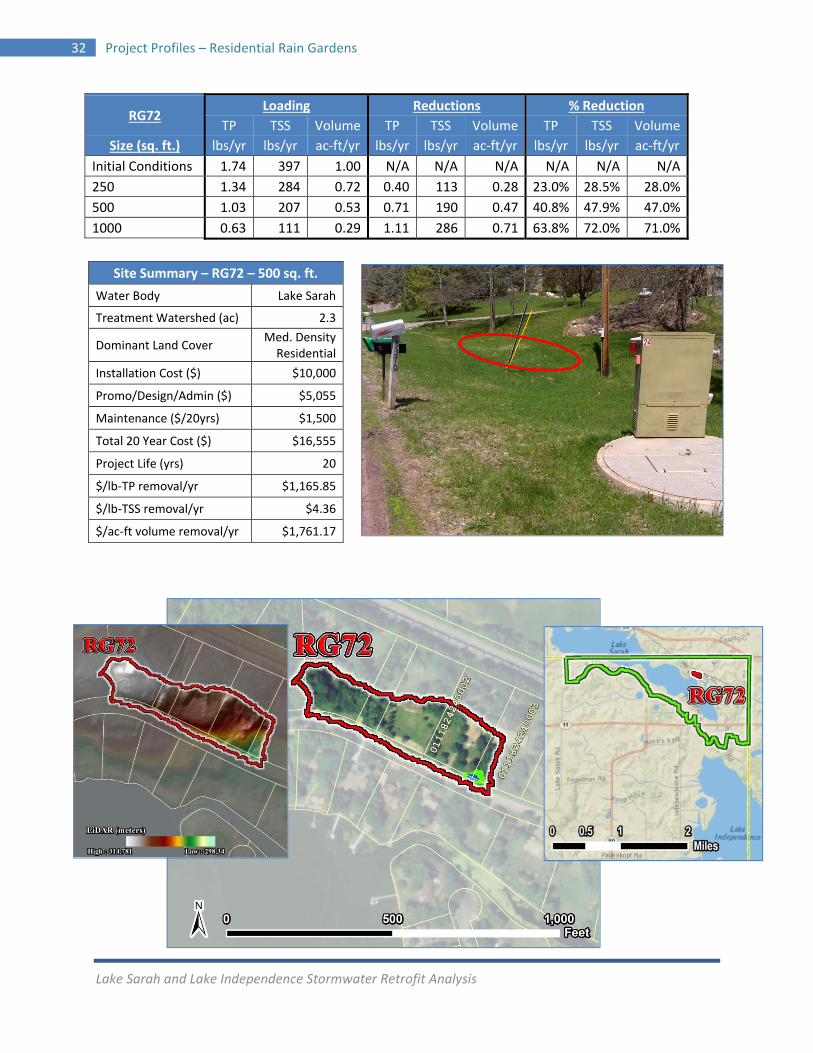
Lake Sarah and Lake Independence Stormwater Retrofit Analysis
32 Project Profiles – Residential Rain Gardens
RG72 Loading Reductions % Reduction
TP TSS Volume TP TSS Volume TP TSS Volume
Size (sq. ft.) lbs/yr lbs/yr ac‐ft/yr lbs/yr lbs/yr ac‐ft/yr lbs/yr lbs/yr ac‐ft/yr
Initial Conditions 1.74 397 1.00 N/A N/A N/A N/A N/A N/A
250 1.34 284 0.72 0.40 113 0.28 23.0% 28.5% 28.0%
500 1.03 207 0.53 0.71 190 0.47 40.8% 47.9% 47.0%
1000 0.63 111 0.29 1.11 286 0.71 63.8% 72.0% 71.0%
Site Summary – RG72 – 500 sq. ft.
Water Body Lake Sarah
Treatment Watershed (ac) 2.3
Dominant Land Cover Med. DensityResidential
Installation Cost ($) $10,000
Promo/Design/Admin ($) $5,055
Maintenance ($/20yrs) $1,500
Total 20 Year Cost ($) $16,555
Project Life (yrs) 20
$/lb‐TP removal/yr $1,165.85
$/lb‐TSS removal/yr $4.36
$/ac‐ft volume removal/yr $1,761.17

Lake Sarah and Lake Independence Stormwater Retrofit Analysis
Project Profiles – Residential Rain Gardens 33
RG74 Loading Reductions % Reduction
TP TSS Volume TP TSS Volume TP TSS Volume
Size (sq. ft.) lbs/yr lbs/yr ac‐ft/yr lbs/yr lbs/yr ac‐ft/yr lbs/yr lbs/yr ac‐ft/yr
Initial Conditions 1.35 296 0.84 N/A N/A N/A N/A N/A N/A
250 0.99 196 0.58 0.36 100 0.26 26.7% 33.8% 31.0%
500 0.73 133 0.41 0.62 163 0.43 45.9% 55.1% 51.3%
1000 0.44 69 0.23 0.91 227 0.61 67.4% 76.7% 72.7%
1500 0.36 54 0.18 0.99 242 0.66 73.3% 81.8% 78.6%
Site Summary – RG74 – 500 sq. ft.
Water Body Lake Sarah
Treatment Watershed (ac) 2.15
Dominant Land Cover Med. Dens. Residential
Installation Cost ($) $10,000
Promo/Design/Admin ($) $5,055
Maintenance ($/20yrs) $1,500
Total 20 Year Cost ($) $16,555
Project Life (yrs) 20
$/lb‐TP removal/yr $1,335.08
$/lb‐TSS removal/yr $5.08
$/ac‐ft volume removal/yr $1,920.53
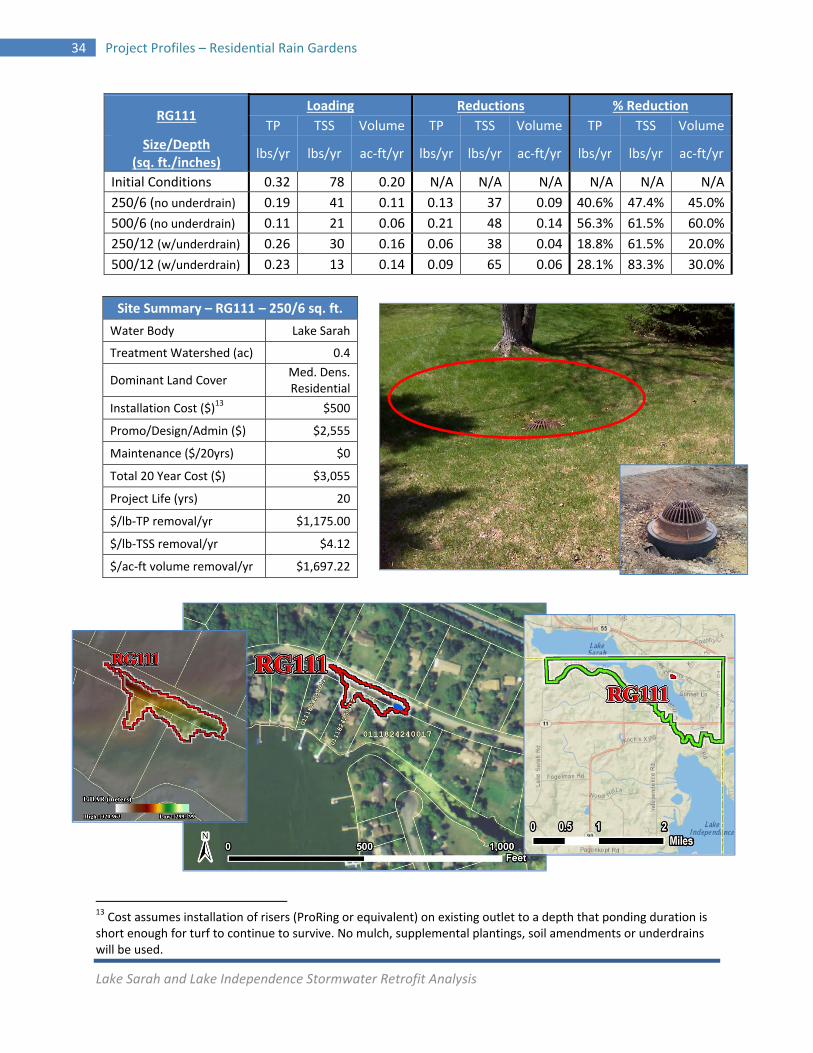
Lake Sarah and Lake Independence Stormwater Retrofit Analysis
34 Project Profiles – Residential Rain Gardens
13 Cost assumes installation of risers (ProRing or equivalent) on existing outlet to a depth that ponding duration is short enough for turf to continue to survive. No mulch, supplemental plantings, soil amendments or underdrains will be used.
RG111 Loading Reductions % Reduction
TP TSS Volume TP TSS Volume TP TSS Volume
Size/Depth (sq. ft./inches)
lbs/yr lbs/yr ac‐ft/yr lbs/yr lbs/yr ac‐ft/yr lbs/yr lbs/yr ac‐ft/yr
Initial Conditions 0.32 78 0.20 N/A N/A N/A N/A N/A N/A
250/6 (no underdrain) 0.19 41 0.11 0.13 37 0.09 40.6% 47.4% 45.0%
500/6 (no underdrain) 0.11 21 0.06 0.21 48 0.14 56.3% 61.5% 60.0%
250/12 (w/underdrain) 0.26 30 0.16 0.06 38 0.04 18.8% 61.5% 20.0%
500/12 (w/underdrain) 0.23 13 0.14 0.09 65 0.06 28.1% 83.3% 30.0%
Site Summary – RG111 – 250/6 sq. ft.
Water Body Lake Sarah
Treatment Watershed (ac) 0.4
Dominant Land Cover Med. Dens. Residential
Installation Cost ($)13 $500
Promo/Design/Admin ($) $2,555
Maintenance ($/20yrs) $0
Total 20 Year Cost ($) $3,055
Project Life (yrs) 20
$/lb‐TP removal/yr $1,175.00
$/lb‐TSS removal/yr $4.12
$/ac‐ft volume removal/yr $1,697.22
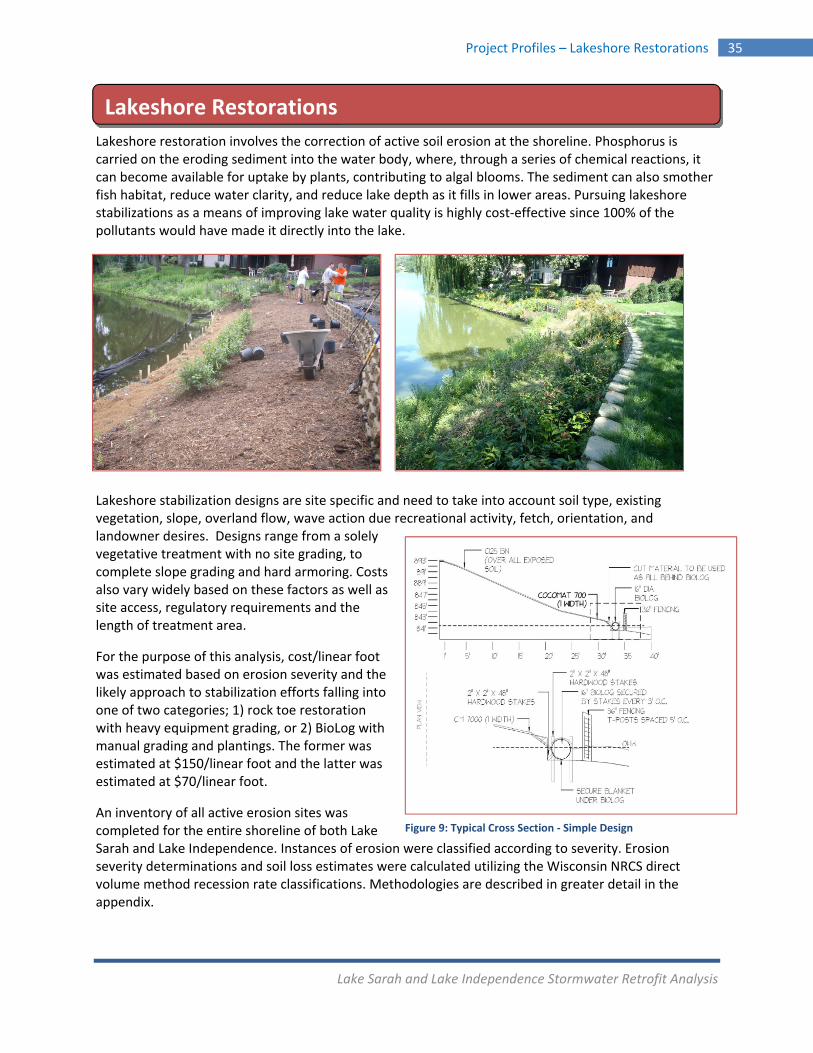
Lake Sarah and Lake Independence Stormwater Retrofit Analysis
Project Profiles – Lakeshore Restorations 35
Lakeshore restoration involves the correction of active soil erosion at the shoreline. Phosphorus is carried on the eroding sediment into the water body, where, through a series of chemical reactions, it can become available for uptake by plants, contributing to algal blooms. The sediment can also smother fish habitat, reduce water clarity, and reduce lake depth as it fills in lower areas. Pursuing lakeshore stabilizations as a means of improving lake water quality is highly cost‐effective since 100% of the pollutants would have made it directly into the lake.
Lakeshore stabilization designs are site specific and need to take into account soil type, existing vegetation, slope, overland flow, wave action due recreational activity, fetch, orientation, and landowner desires. Designs range from a solely vegetative treatment with no site grading, to complete slope grading and hard armoring. Costs also vary widely based on these factors as well as site access, regulatory requirements and the length of treatment area.
For the purpose of this analysis, cost/linear foot was estimated based on erosion severity and the likely approach to stabilization efforts falling into one of two categories; 1) rock toe restoration with heavy equipment grading, or 2) BioLog with manual grading and plantings. The former was estimated at $150/linear foot and the latter was estimated at $70/linear foot.
An inventory of all active erosion sites was completed for the entire shoreline of both Lake Sarah and Lake Independence. Instances of erosion were classified according to severity. Erosion severity determinations and soil loss estimates were calculated utilizing the Wisconsin NRCS direct volume method recession rate classifications. Methodologies are described in greater detail in the appendix.
Lakeshore Restorations
Figure 9: Typical Cross Section ‐ Simple Design
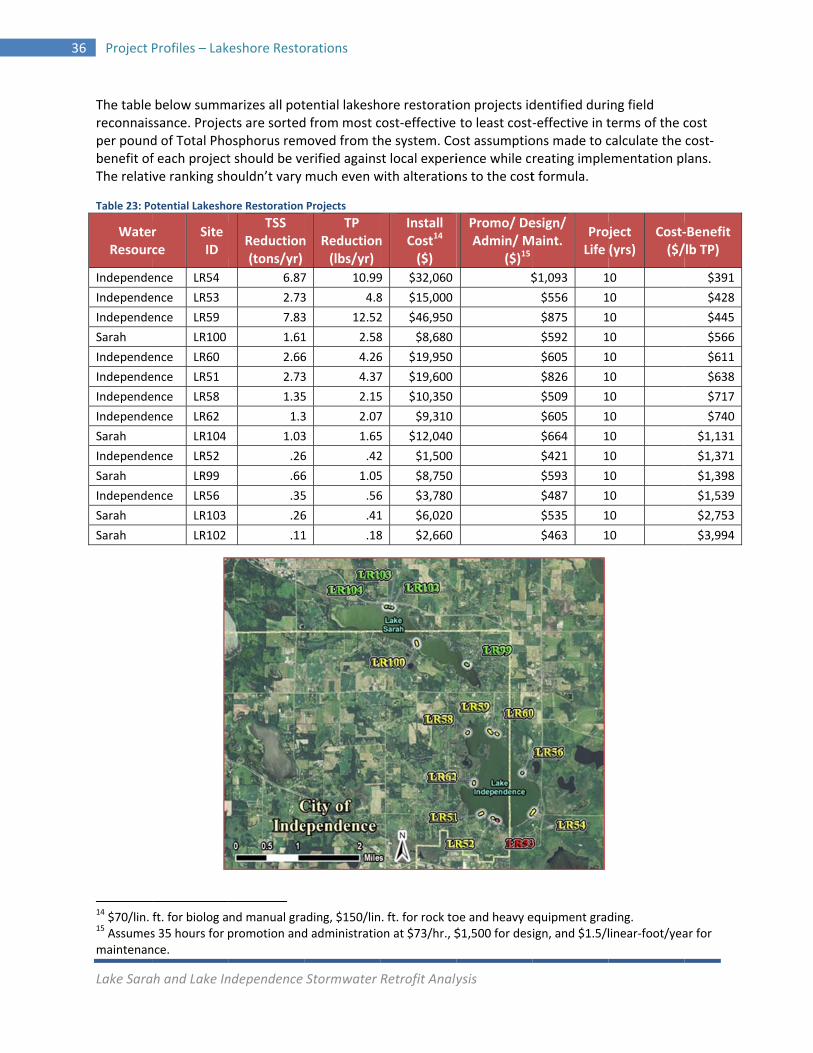
3
Lake Sara
36 Project
The table reconnaisper poundbenefit ofThe relati
Table 23: Po
14 $70/lin. 15 Assumesmaintenan
WateResour
Independe
Independe
Independe
Sarah
Independe
Independe
Independe
Independe
Sarah
Independe
Sarah
Independe
Sarah
Sarah
ah and Lake In
Profiles – Lak
below summssance. Projecd of Total Phof each projectve ranking sh
otential Lakesho
ft. for biolog as 35 hours for nce.
r ce
Site ID
ence LR54
ence LR53
ence LR59
LR100
ence LR60
ence LR51
ence LR58
ence LR62
LR104
ence LR52
LR99
ence LR56
LR103
LR102
ndependence
keshore Resto
marizes all potcts are sortedosphorus remt should be vehouldn’t vary
ore Restoration
nd manual grapromotion and
TSS Reduction(tons/yr)
6.87
2.73
7.83
1.61
2.66
2.73
1.35
1.3
1.03
.26
.66
.35
.26
.11
Stormwater
orations
tential lakeshd from most cmoved from therified againsmuch even w
Projects
ading, $150/lind administratio
n TP
Reduction(lbs/yr)
7 10.99
3 4.8
3 12.52
1 2.58
6 4.26
3 4.37
5 2.15
3 2.07
3 1.65
6 .42
6 1.05
5 .56
6 .41
1 .18
Retrofit Analy
ore restoratiocost‐effective he system. Cost local experiwith alteration
. ft. for rock toon at $73/hr., $
nInstall Cost14 ($)
9 $32,060
8 $15,000
2 $46,950
8 $8,680
6 $19,950
7 $19,600
5 $10,350
7 $9,310
5 $12,040
2 $1,500
5 $8,750
6 $3,780
1 $6,020
8 $2,660
ysis
on projects id to least costost assumptioience while cns to the cost
oe and heavy e$1,500 for des
Promo/ DeAdmin/ M
($)15
$
dentified duri‐effective in tons made to creating implet formula.
equipment gradign, and $1.5/l
esign/ Maint.
ProLife
$1,093 1
$556 1
$875 1
$592 1
$605 1
$826 1
$509 1
$605 1
$664 1
$421 1
$593 1
$487 1
$535 1
$463 1
ing field terms of the ccalculate the ementation p
ding. linear‐foot/yea
oject (yrs)
Cost‐($/
10
10
10
10
10
10
10
10
10
10
10
10
10
10
cost cost‐lans.
ar for
‐Benefit /lb TP)
$391
$428
$445
$566
$611
$638
$717
$740
$1,131
$1,371
$1,398
$1,539
$2,753
$3,994
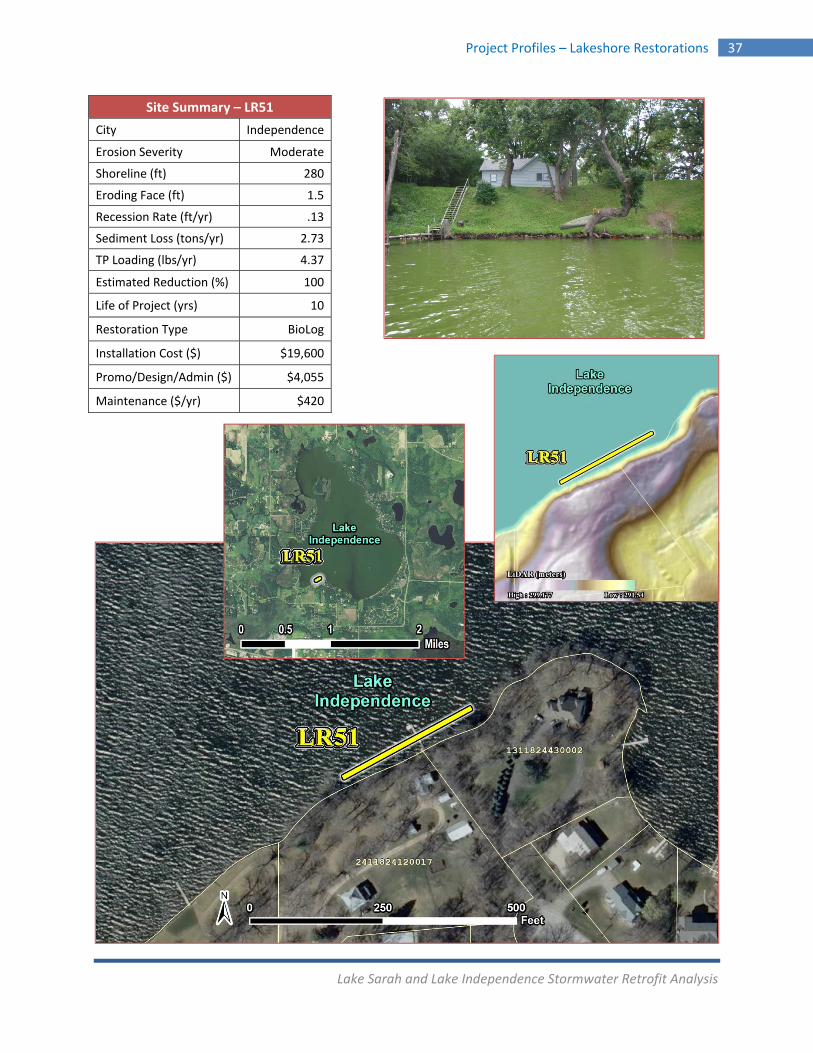
Lake Sarah and Lake Independence Stormwater Retrofit Analysis
Project Profiles – Lakeshore Restorations 37
Site Summary – LR51
City Independence
Erosion Severity Moderate
Shoreline (ft) 280
Eroding Face (ft) 1.5
Recession Rate (ft/yr) .13
Sediment Loss (tons/yr) 2.73
TP Loading (lbs/yr) 4.37
Estimated Reduction (%) 100
Life of Project (yrs) 10
Restoration Type BioLog
Installation Cost ($) $19,600
Promo/Design/Admin ($) $4,055
Maintenance ($/yr) $420
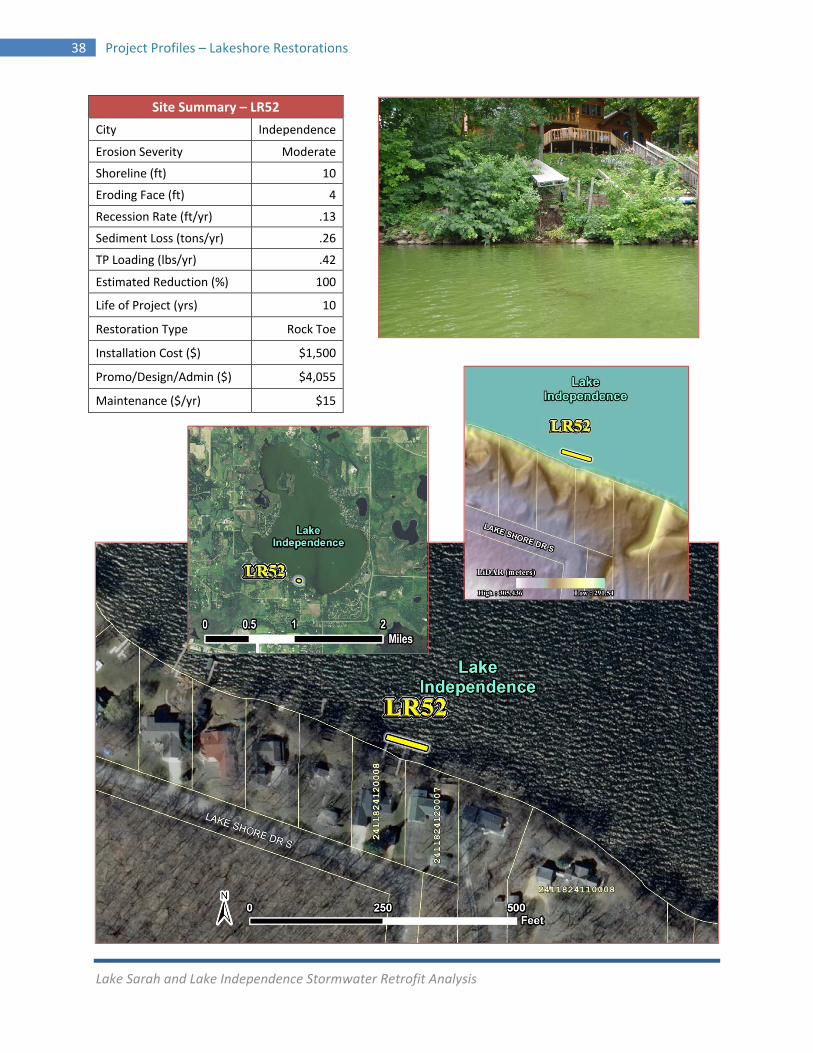
Lake Sarah and Lake Independence Stormwater Retrofit Analysis
38 Project Profiles – Lakeshore Restorations
Site Summary – LR52
City Independence
Erosion Severity Moderate
Shoreline (ft) 10
Eroding Face (ft) 4
Recession Rate (ft/yr) .13
Sediment Loss (tons/yr) .26
TP Loading (lbs/yr) .42
Estimated Reduction (%) 100
Life of Project (yrs) 10
Restoration Type Rock Toe
Installation Cost ($) $1,500
Promo/Design/Admin ($) $4,055
Maintenance ($/yr) $15
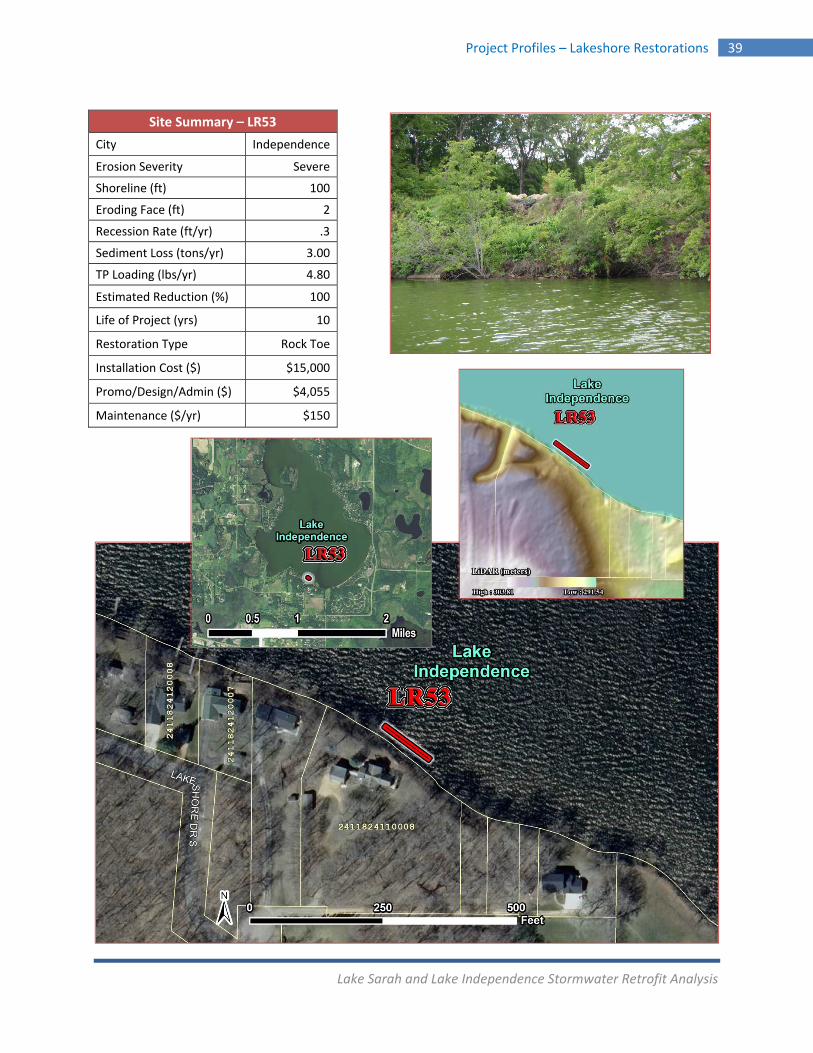
Lake Sarah and Lake Independence Stormwater Retrofit Analysis
Project Profiles – Lakeshore Restorations 39
Site Summary – LR53
City Independence
Erosion Severity Severe
Shoreline (ft) 100
Eroding Face (ft) 2
Recession Rate (ft/yr) .3
Sediment Loss (tons/yr) 3.00
TP Loading (lbs/yr) 4.80
Estimated Reduction (%) 100
Life of Project (yrs) 10
Restoration Type Rock Toe
Installation Cost ($) $15,000
Promo/Design/Admin ($) $4,055
Maintenance ($/yr) $150
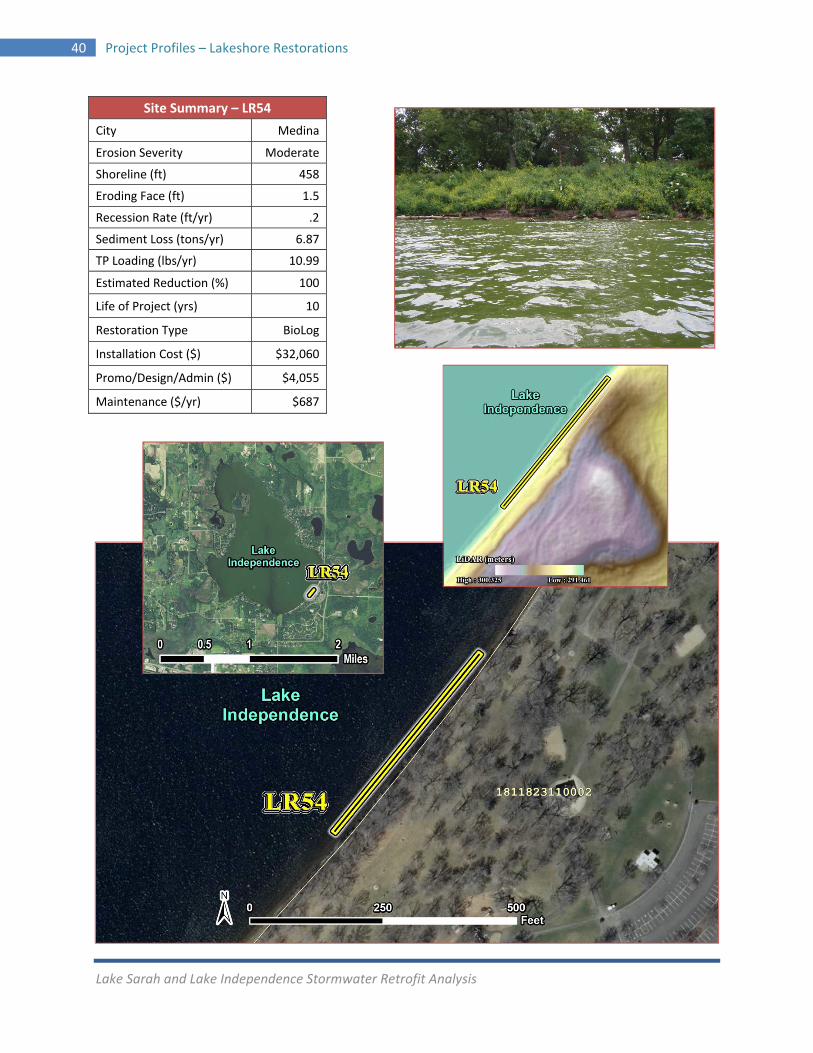
Lake Sarah and Lake Independence Stormwater Retrofit Analysis
40 Project Profiles – Lakeshore Restorations
Site Summary – LR54
City Medina
Erosion Severity Moderate
Shoreline (ft) 458
Eroding Face (ft) 1.5
Recession Rate (ft/yr) .2
Sediment Loss (tons/yr) 6.87
TP Loading (lbs/yr) 10.99
Estimated Reduction (%) 100
Life of Project (yrs) 10
Restoration Type BioLog
Installation Cost ($) $32,060
Promo/Design/Admin ($) $4,055
Maintenance ($/yr) $687
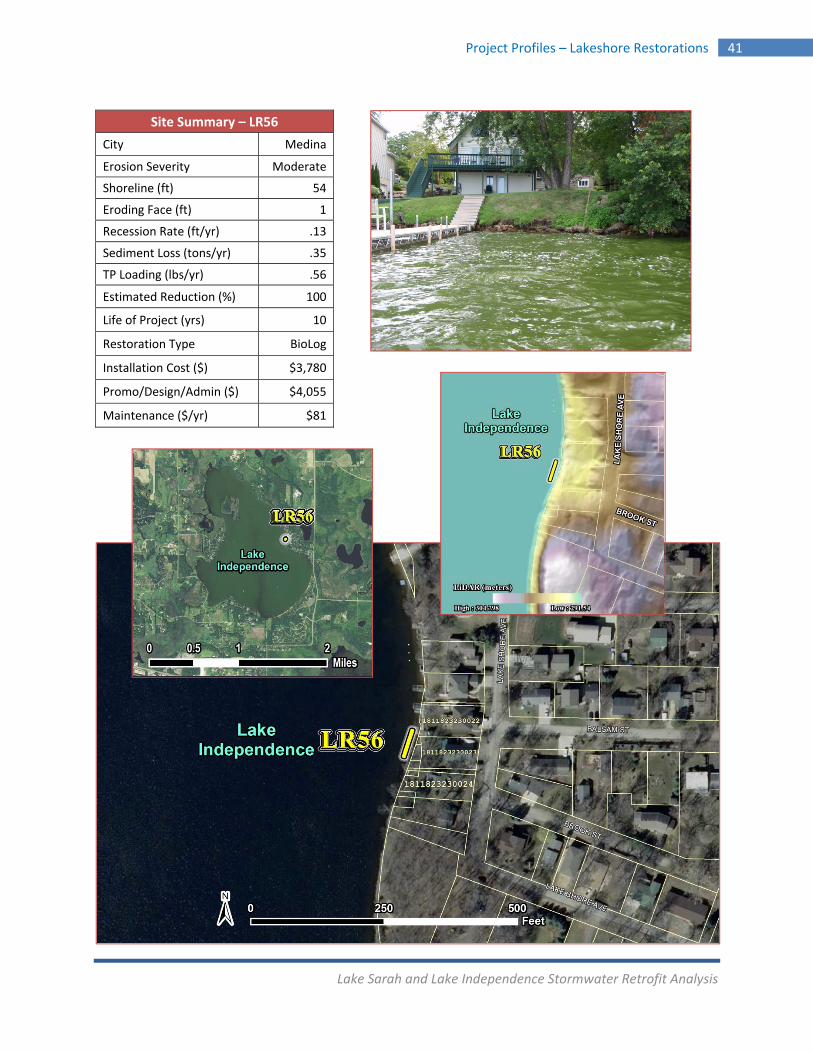
Lake Sarah and Lake Independence Stormwater Retrofit Analysis
Project Profiles – Lakeshore Restorations 41
Site Summary – LR56
City Medina
Erosion Severity Moderate
Shoreline (ft) 54
Eroding Face (ft) 1
Recession Rate (ft/yr) .13
Sediment Loss (tons/yr) .35
TP Loading (lbs/yr) .56
Estimated Reduction (%) 100
Life of Project (yrs) 10
Restoration Type BioLog
Installation Cost ($) $3,780
Promo/Design/Admin ($) $4,055
Maintenance ($/yr) $81
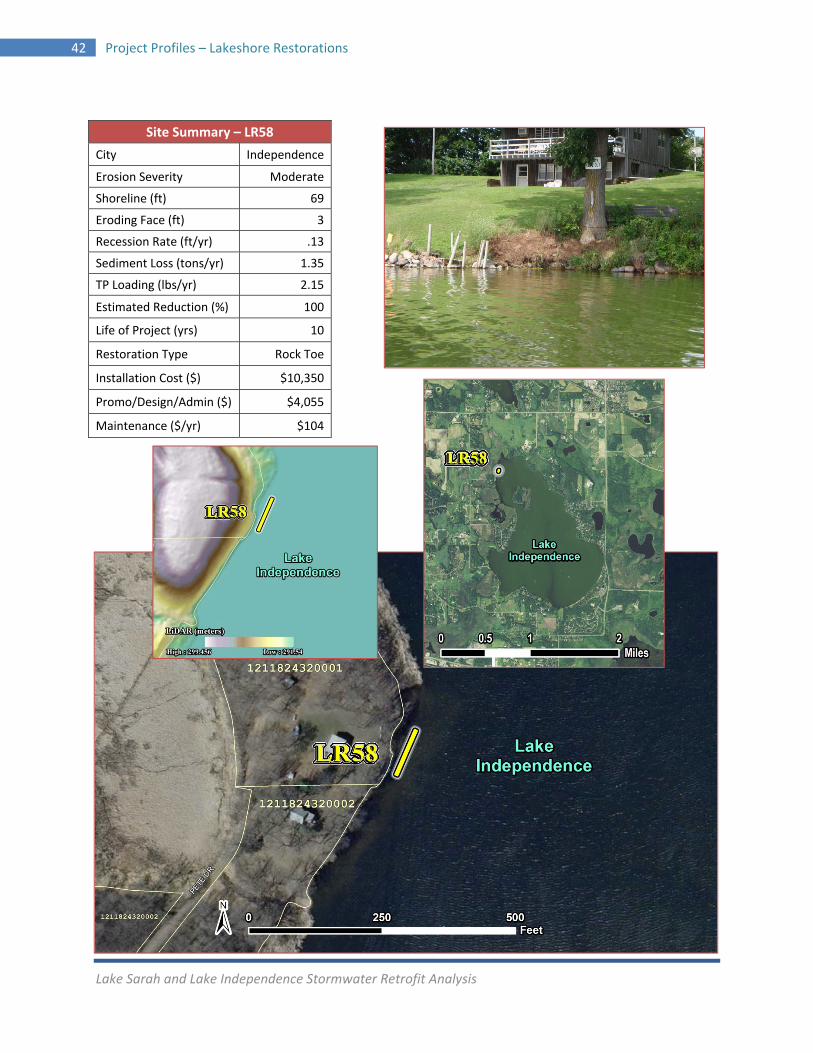
Lake Sarah and Lake Independence Stormwater Retrofit Analysis
42 Project Profiles – Lakeshore Restorations
Site Summary – LR58
City Independence
Erosion Severity Moderate
Shoreline (ft) 69
Eroding Face (ft) 3
Recession Rate (ft/yr) .13
Sediment Loss (tons/yr) 1.35
TP Loading (lbs/yr) 2.15
Estimated Reduction (%) 100
Life of Project (yrs) 10
Restoration Type Rock Toe
Installation Cost ($) $10,350
Promo/Design/Admin ($) $4,055
Maintenance ($/yr) $104
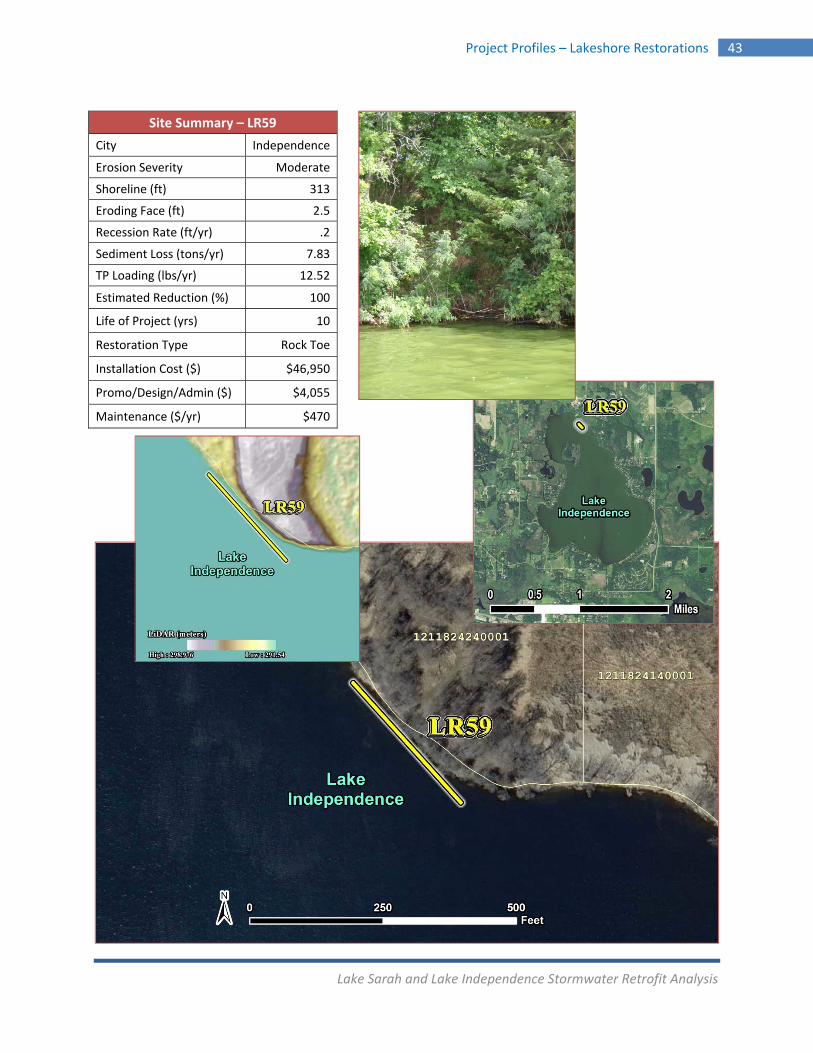
Lake Sarah and Lake Independence Stormwater Retrofit Analysis
Project Profiles – Lakeshore Restorations 43
Site Summary – LR59
City Independence
Erosion Severity Moderate
Shoreline (ft) 313
Eroding Face (ft) 2.5
Recession Rate (ft/yr) .2
Sediment Loss (tons/yr) 7.83
TP Loading (lbs/yr) 12.52
Estimated Reduction (%) 100
Life of Project (yrs) 10
Restoration Type Rock Toe
Installation Cost ($) $46,950
Promo/Design/Admin ($) $4,055
Maintenance ($/yr) $470
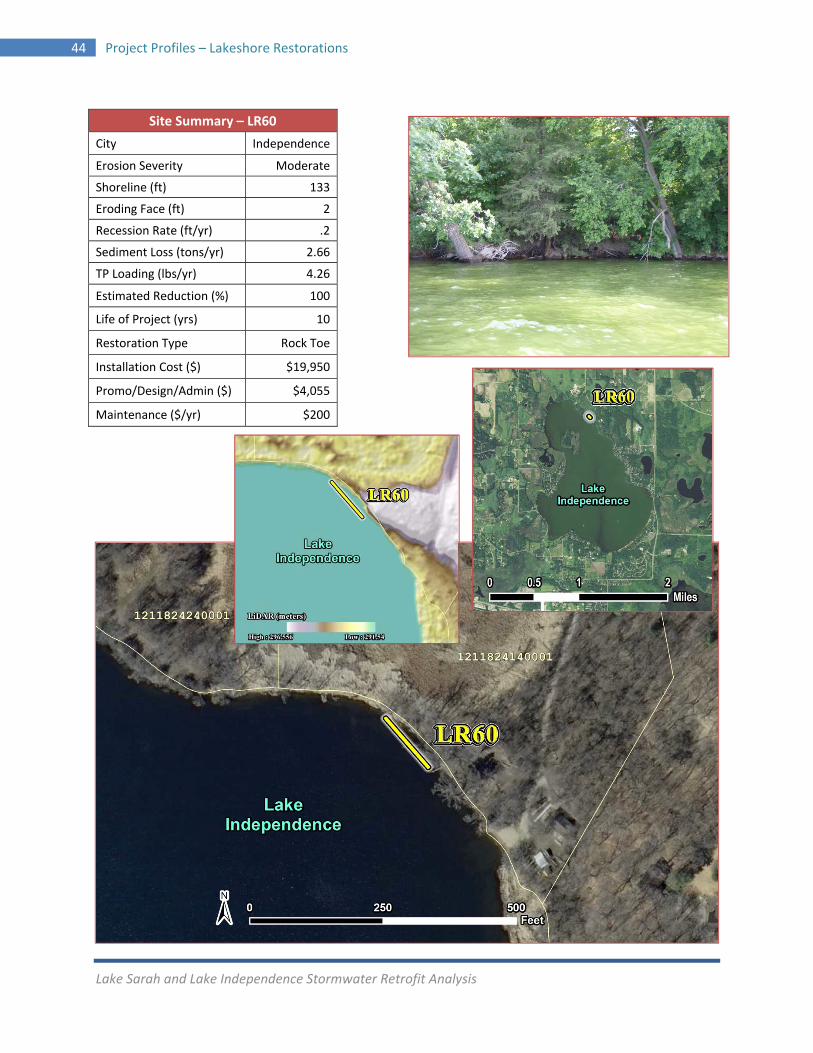
Lake Sarah and Lake Independence Stormwater Retrofit Analysis
44 Project Profiles – Lakeshore Restorations
Site Summary – LR60
City Independence
Erosion Severity Moderate
Shoreline (ft) 133
Eroding Face (ft) 2
Recession Rate (ft/yr) .2
Sediment Loss (tons/yr) 2.66
TP Loading (lbs/yr) 4.26
Estimated Reduction (%) 100
Life of Project (yrs) 10
Restoration Type Rock Toe
Installation Cost ($) $19,950
Promo/Design/Admin ($) $4,055
Maintenance ($/yr) $200
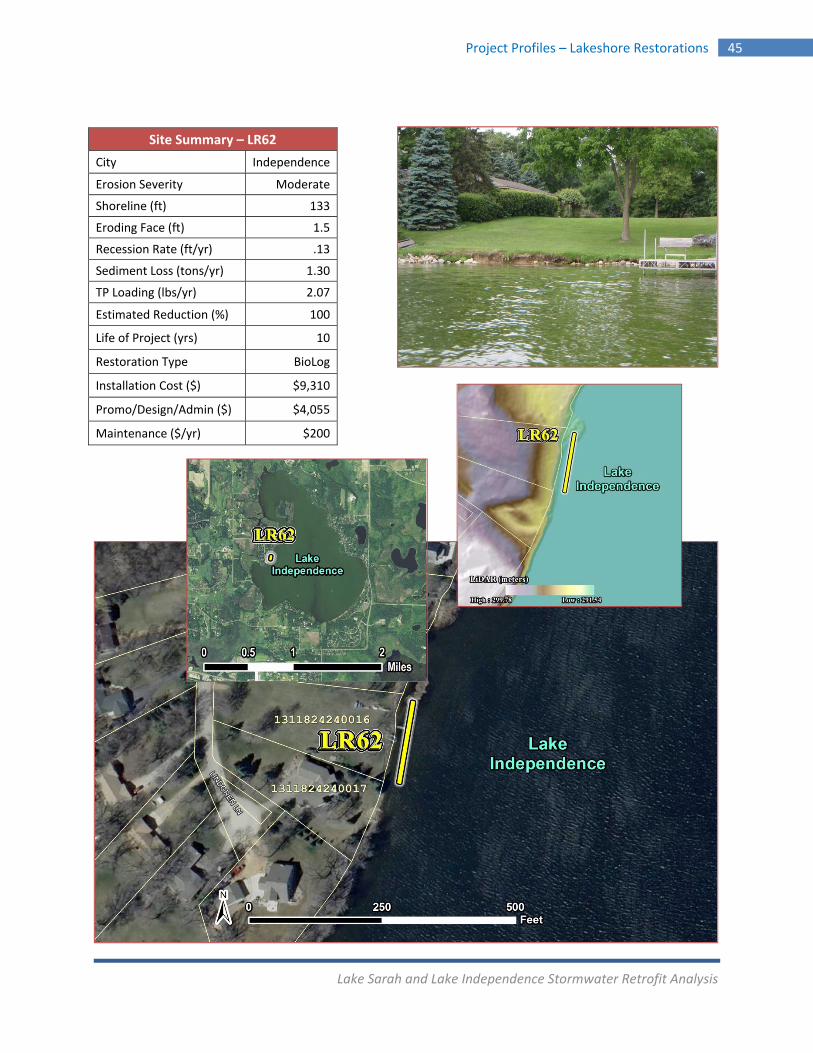
Lake Sarah and Lake Independence Stormwater Retrofit Analysis
Project Profiles – Lakeshore Restorations 45
Site Summary – LR62
City Independence
Erosion Severity Moderate
Shoreline (ft) 133
Eroding Face (ft) 1.5
Recession Rate (ft/yr) .13
Sediment Loss (tons/yr) 1.30
TP Loading (lbs/yr) 2.07
Estimated Reduction (%) 100
Life of Project (yrs) 10
Restoration Type BioLog
Installation Cost ($) $9,310
Promo/Design/Admin ($) $4,055
Maintenance ($/yr) $200

Lake Sarah and Lake Independence Stormwater Retrofit Analysis
46 Project Profiles – Lakeshore Restorations
Site Summary – LR99
City Independence
Erosion Severity Slight
Shoreline (ft) 125
Eroding Face (ft) 3.5
Recession Rate (ft/yr) .03
Sediment Loss (tons/yr) .66
TP Loading (lbs/yr) 1.05
Estimated Reduction (%) 100
Life of Project (yrs) 10
Restoration Type BioLog
Installation Cost ($) $8,750
Promo/Design/Admin ($) $4,055
Maintenance ($/yr) $188
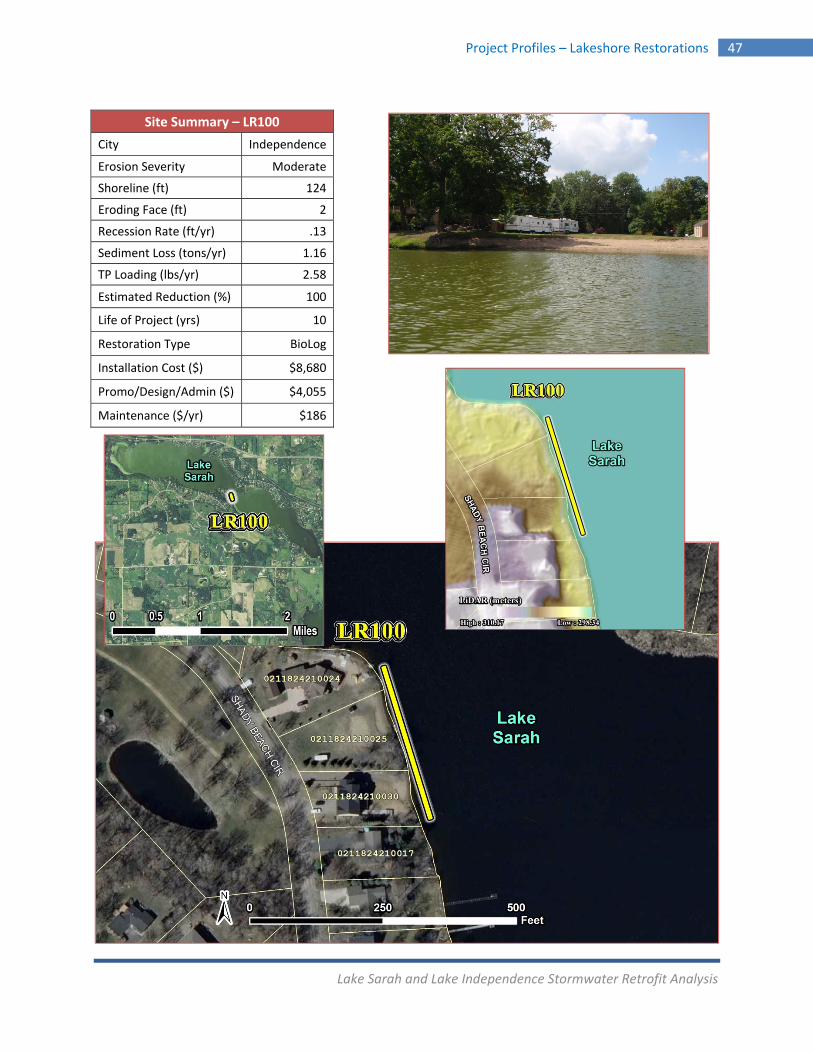
Lake Sarah and Lake Independence Stormwater Retrofit Analysis
Project Profiles – Lakeshore Restorations 47
Site Summary – LR100
City Independence
Erosion Severity Moderate
Shoreline (ft) 124
Eroding Face (ft) 2
Recession Rate (ft/yr) .13
Sediment Loss (tons/yr) 1.16
TP Loading (lbs/yr) 2.58
Estimated Reduction (%) 100
Life of Project (yrs) 10
Restoration Type BioLog
Installation Cost ($) $8,680
Promo/Design/Admin ($) $4,055
Maintenance ($/yr) $186
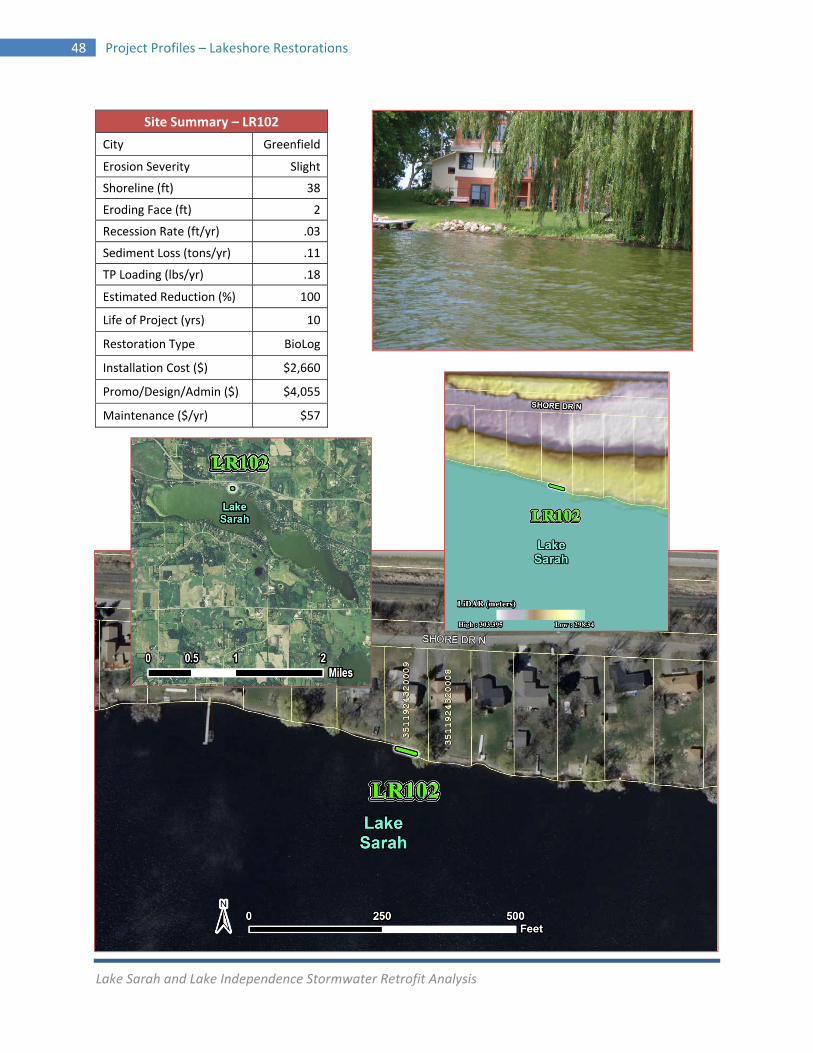
Lake Sarah and Lake Independence Stormwater Retrofit Analysis
48 Project Profiles – Lakeshore Restorations
Site Summary – LR102
City Greenfield
Erosion Severity Slight
Shoreline (ft) 38
Eroding Face (ft) 2
Recession Rate (ft/yr) .03
Sediment Loss (tons/yr) .11
TP Loading (lbs/yr) .18
Estimated Reduction (%) 100
Life of Project (yrs) 10
Restoration Type BioLog
Installation Cost ($) $2,660
Promo/Design/Admin ($) $4,055
Maintenance ($/yr) $57
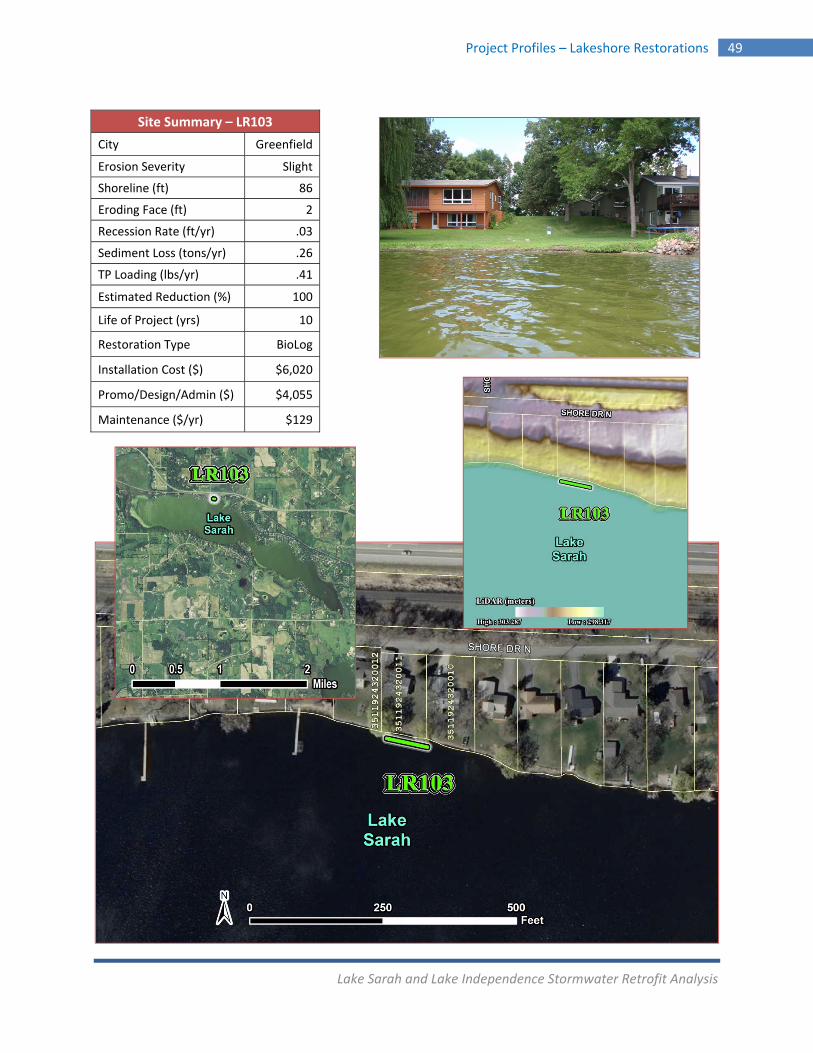
Lake Sarah and Lake Independence Stormwater Retrofit Analysis
Project Profiles – Lakeshore Restorations 49
Site Summary – LR103
City Greenfield
Erosion Severity Slight
Shoreline (ft) 86
Eroding Face (ft) 2
Recession Rate (ft/yr) .03
Sediment Loss (tons/yr) .26
TP Loading (lbs/yr) .41
Estimated Reduction (%) 100
Life of Project (yrs) 10
Restoration Type BioLog
Installation Cost ($) $6,020
Promo/Design/Admin ($) $4,055
Maintenance ($/yr) $129
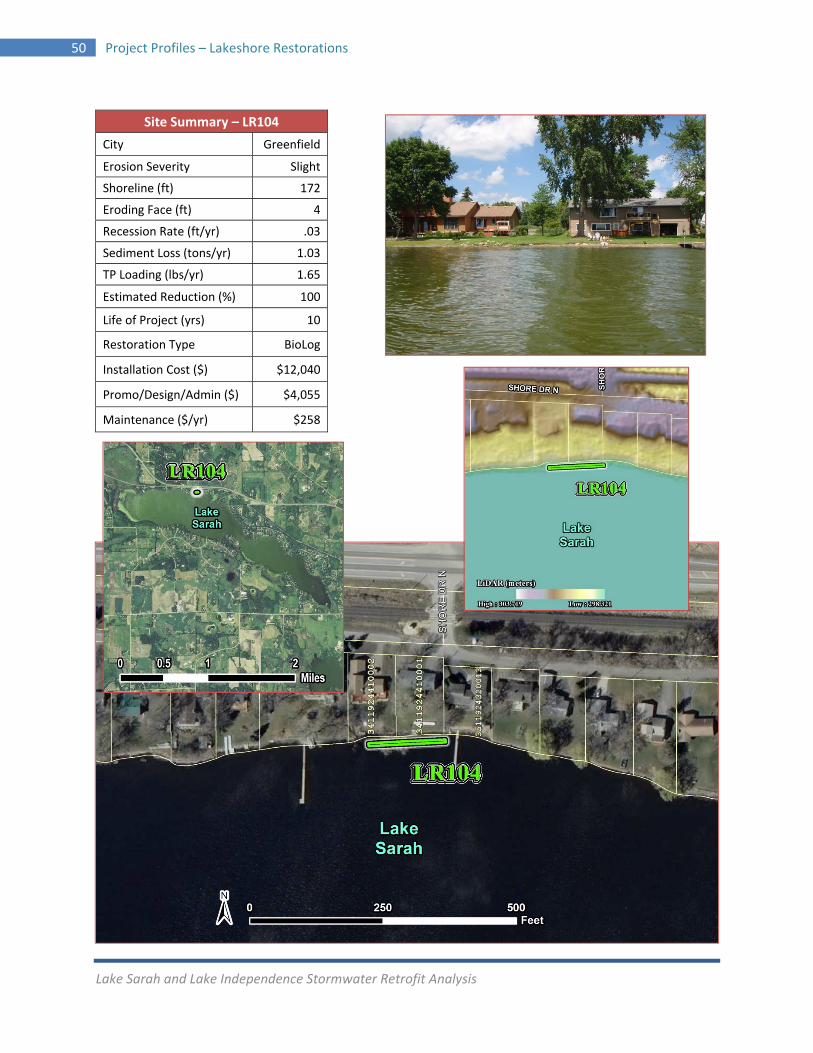
Lake Sarah and Lake Independence Stormwater Retrofit Analysis
50 Project Profiles – Lakeshore Restorations
Site Summary – LR104
City Greenfield
Erosion Severity Slight
Shoreline (ft) 172
Eroding Face (ft) 4
Recession Rate (ft/yr) .03
Sediment Loss (tons/yr) 1.03
TP Loading (lbs/yr) 1.65
Estimated Reduction (%) 100
Life of Project (yrs) 10
Restoration Type BioLog
Installation Cost ($) $12,040
Promo/Design/Admin ($) $4,055
Maintenance ($/yr) $258
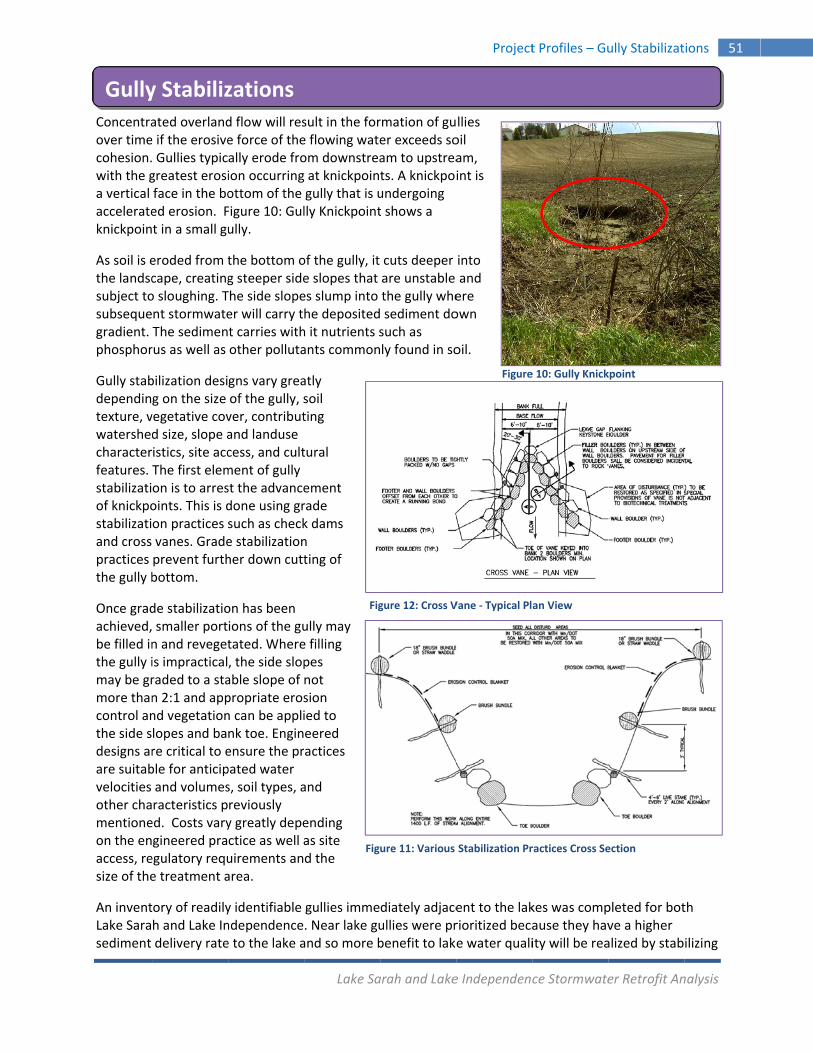
Concentraover timecohesion.with the ga vertical accelerateknickpoin
As soil is ethe landscsubject tosubsequegradient. phosphor
Gully stabdependintexture, vwatershedcharacterfeatures. stabilizatiof knickpostabilizatiand cross practices the gully b
Once gradachieved,be filled inthe gully imay be grmore thancontrol anthe side sdesigns arare suitabvelocities other chamentioneon the enaccess, resize of the
An inventLake Sarasediment
Gullyated overlande if the erosive Gullies typicgreatest erosiface in the boed erosion. Ft in a small gu
eroded from tcape, creatingo sloughing. Tnt stormwateThe sedimenrus as well as
bilization desig on the size vegetative covd size, slope aistics, site accThe first elemon is to arresoints. This is don practices vanes. Gradeprevent furthbottom.
de stabilizatio smaller portn and revegetis impracticalraded to a stan 2:1 and appnd vegetationlopes and bare critical to eble for anticipand volumesracteristics ped. Costs varygineered praegulatory reque treatment a
tory of readilyh and Lake Indelivery rate
y Stabilizd flow will rese force of theally erode froion occurringottom of the Figure 10: Gulully.
the bottom og steeper sideThe side slopeer will carry tt carries withother polluta
gns vary greaof the gully, sver, contributand landuse cess, and cultment of gully st the advancedone using grsuch as checke stabilizationher down cutt
on has been ions of the gutated. Where, the side slopable slope of propriate erosn can be applink toe. Enginensure the prpated water s, soil types, areviously y greatly depectice as well auirements anarea.
y identifiable ndependencee to the lake a
zations
Lake Sa
sult in the fore flowing wateom downstrea at knickpointgully that is ully Knickpoint
of the gully, it e slopes that es slump into he depositedh it nutrients sants common
atly soil ting
tural
ement rade k dams n ting of
ully may e filling pes not sion ied to eered actices
and
ending as site d the
gullies imme. Near lake guand so more b
Fig
Fig
arah and Lake
rmation of guer exceeds soam to upstreats. A knickpoiundergoing t shows a
cuts deeper are unstable the gully whe sediment dosuch as ly found in so
diately adjaceullies were prbenefit to lake
gure 12: Cross V
ure 11: Various
e Independenc
Project
llies oil am, int is
into and ere own
oil.
ent to the lakrioritized becae water quali
Vane ‐ Typical Pl
Stabilization Pr
Figure
ce Stormwate
t Profiles – Gu
kes was compause they havity will be rea
an View
ractices Cross Se
e 10: Gully Knick
er Retrofit An
ully Stabilizat
pleted for botve a higher alized by stab
ection
kpoint
nalysis
ions 51
th
ilizing
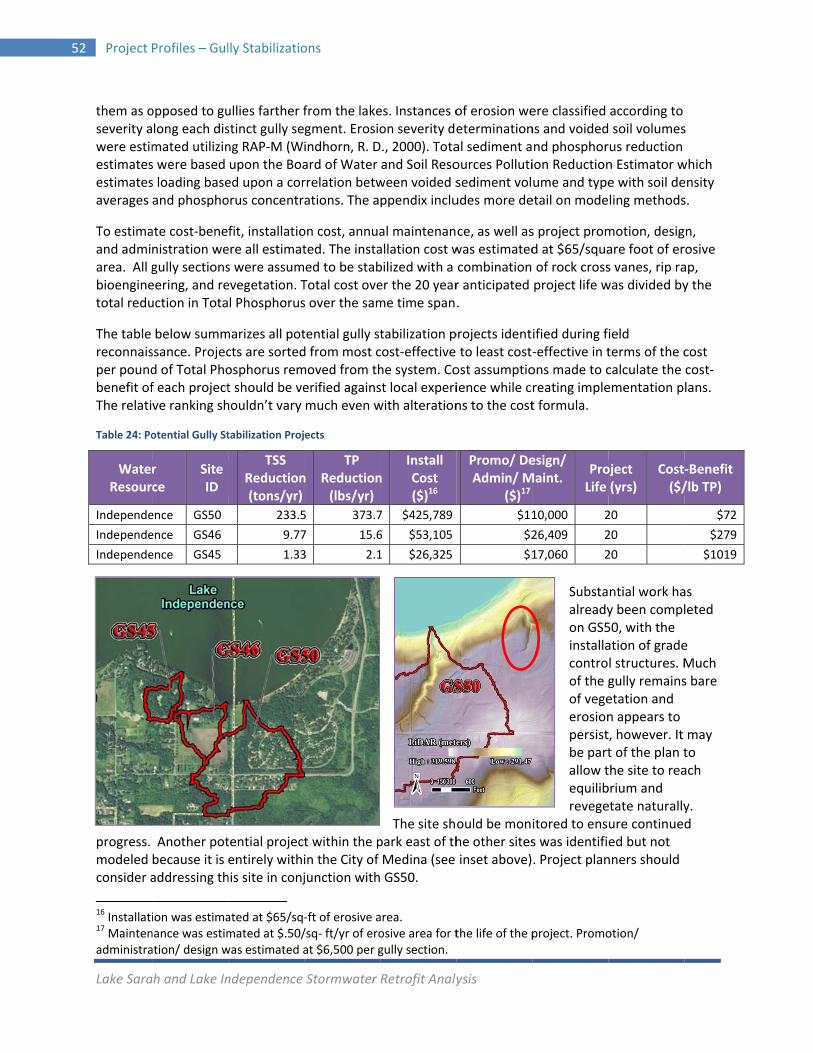
5
Lake Sara
52 Project
them as oseverity awere estimestimatesestimatesaverages
To estimaand admiarea. All gbioenginetotal redu
The table reconnaisper poundbenefit ofThe relati
Table 24: Po
progress. modeled consider a
16 Installati17 Maintenadministra
WateResour
Independe
Independe
Independe
ah and Lake In
Profiles – Gul
opposed to gulong each dismated utilizins were based s loading baseand phospho
ate cost‐benenistration wegully sectionseering, and reuction in Tota
below summssance. Projecd of Total Phof each projectve ranking sh
otential Gully St
Another potbecause it is addressing th
ion was estimanance was estimation/ design w
r ce
Site ID
ence GS50
ence GS46
ence GS45
ndependence
lly Stabilizatio
ullies farther fstinct gully seng RAP‐M (Wupon the Boaed upon a cororus concentr
fit, installatioere all estimats were assumevegetation. Tl Phosphorus
marizes all potcts are sortedosphorus remt should be vehouldn’t vary
tabilization Proj
tential projectentirely withihis site in conj
ated at $65/sq‐mated at $.50/was estimated a
TSS Reduction(tons/yr)
233.5
9.77
1.33
Stormwater
ons
from the lakegment. Erosioindhorn, R. Dard of Water rrelation betwations. The a
on cost, annuated. The instaed to be stabTotal cost oves over the sam
tential gully std from most cmoved from therified againsmuch even w
ects
t within the pin the City of junction with
‐ft of erosive a/sq‐ ft/yr of eroat $6,500 per g
n TP
Reduction(lbs/yr)
5 373.7
7 15.6
3 2.1
Retrofit Analy
es. Instances oon severity deD., 2000). Totaand Soil Resoween voided sppendix inclu
al maintenanallation cost wbilized with a er the 20 yearme time span
tabilization pcost‐effective he system. Cost local experiwith alteration
The site shpark east of thMedina (see GS50.
area. osive area for tgully section.
nInstall Cost ($)16
7 $425,789
6 $53,105
1 $26,325
ysis
of erosion weeterminational sediment aources Pollutisediment voludes more de
ce, as well aswas estimatedcombination r anticipated .
projects ident to least costost assumptioience while cns to the cost
ould be monhe other sitesinset above)
the life of the p
Promo/ DeAdmin/ M
($)17
$11
$2
$1
ere classified ns and voidednd phosphorion Reductionume and typeetail on mode
s project promd at $65/squa of rock crossproject life w
ified during f‐effective in tons made to creating implet formula.
Substaalreadyon GS5installacontroof the gof vegeerosionpersistbe partallow tequilibrevege
itored to enss was identifi. Project plan
project. Promo
esign/ Maint.
ProLife
10,000 2
26,409 2
17,060 2
according to soil volumesrus reduction n Estimator we with soil deling methods
motion, desigare foot of ers vanes, rip rawas divided by
ield terms of the ccalculate the ementation p
ntial work hay been compl50, with the ation of gradel structures. Mgully remainsetation and n appears to t, however. It t of the plan tthe site to reabrium and etate naturallyure continueed but not nners should
otion/
oject (yrs)
Cost($/
20
20
20
s
which ensity s.
n, rosive ap, y the
cost cost‐lans.
as leted
e Much s bare
may to ach
y. d
‐Benefit /lb TP)
$72
$279
$1019
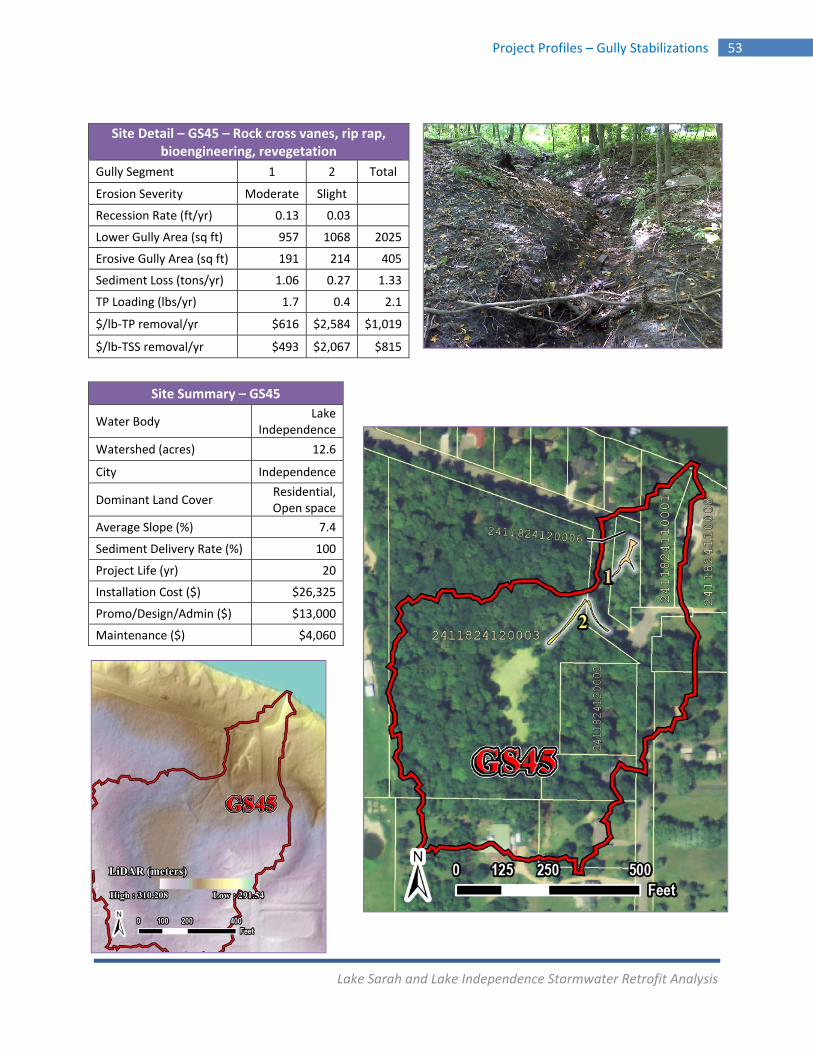
Lake Sarah and Lake Independence Stormwater Retrofit Analysis
Project Profiles – Gully Stabilizations 53
Site Detail – GS45 – Rock cross vanes, rip rap, bioengineering, revegetation
Gully Segment 1 2 Total
Erosion Severity Moderate Slight
Recession Rate (ft/yr) 0.13 0.03
Lower Gully Area (sq ft) 957 1068 2025
Erosive Gully Area (sq ft) 191 214 405
Sediment Loss (tons/yr) 1.06 0.27 1.33
TP Loading (lbs/yr) 1.7 0.4 2.1
$/lb‐TP removal/yr $616 $2,584 $1,019
$/lb‐TSS removal/yr $493 $2,067 $815
Site Summary – GS45
Water Body Lake
Independence
Watershed (acres) 12.6
City Independence
Dominant Land Cover Residential, Open space
Average Slope (%) 7.4
Sediment Delivery Rate (%) 100
Project Life (yr) 20
Installation Cost ($) $26,325
Promo/Design/Admin ($) $13,000
Maintenance ($) $4,060
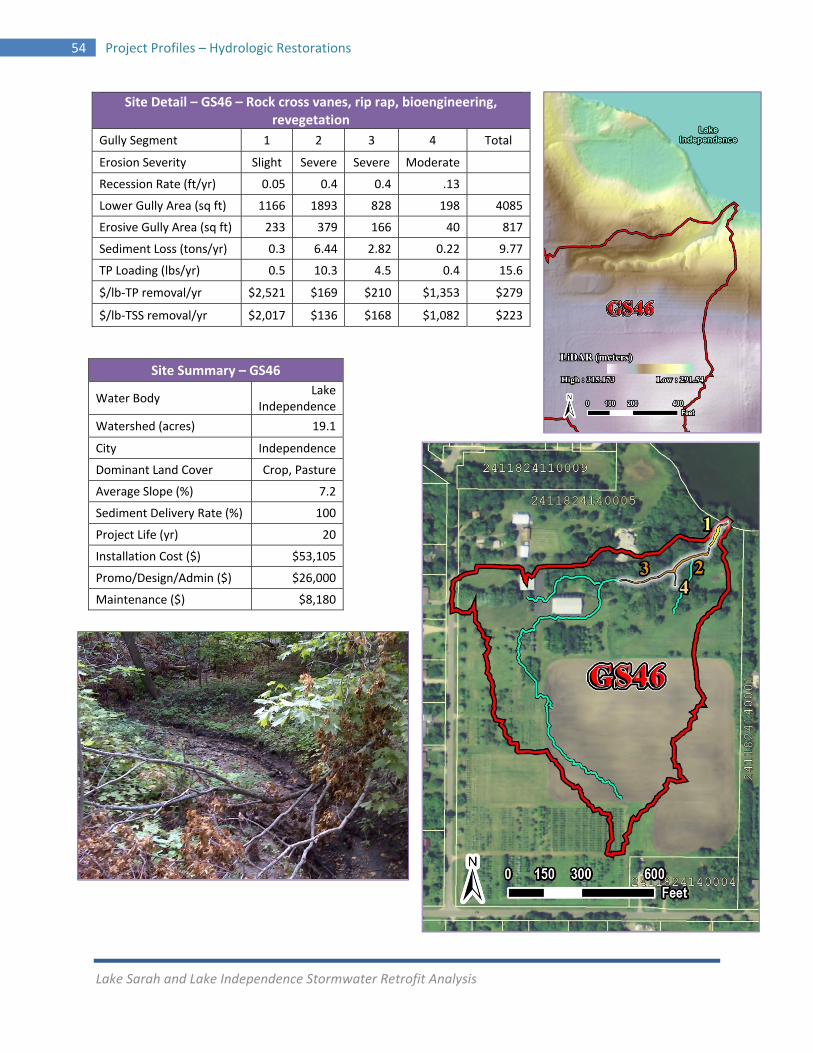
Lake Sarah and Lake Independence Stormwater Retrofit Analysis
54 Project Profiles – Hydrologic Restorations
Site Detail – GS46 – Rock cross vanes, rip rap, bioengineering, revegetation
Gully Segment 1 2 3 4 Total
Erosion Severity Slight Severe Severe Moderate
Recession Rate (ft/yr) 0.05 0.4 0.4 .13
Lower Gully Area (sq ft) 1166 1893 828 198 4085
Erosive Gully Area (sq ft) 233 379 166 40 817
Sediment Loss (tons/yr) 0.3 6.44 2.82 0.22 9.77
TP Loading (lbs/yr) 0.5 10.3 4.5 0.4 15.6
$/lb‐TP removal/yr $2,521 $169 $210 $1,353 $279
$/lb‐TSS removal/yr $2,017 $136 $168 $1,082 $223
Site Summary – GS46
Water Body Lake
Independence
Watershed (acres) 19.1
City Independence
Dominant Land Cover Crop, Pasture
Average Slope (%) 7.2
Sediment Delivery Rate (%) 100
Project Life (yr) 20
Installation Cost ($) $53,105
Promo/Design/Admin ($) $26,000
Maintenance ($) $8,180
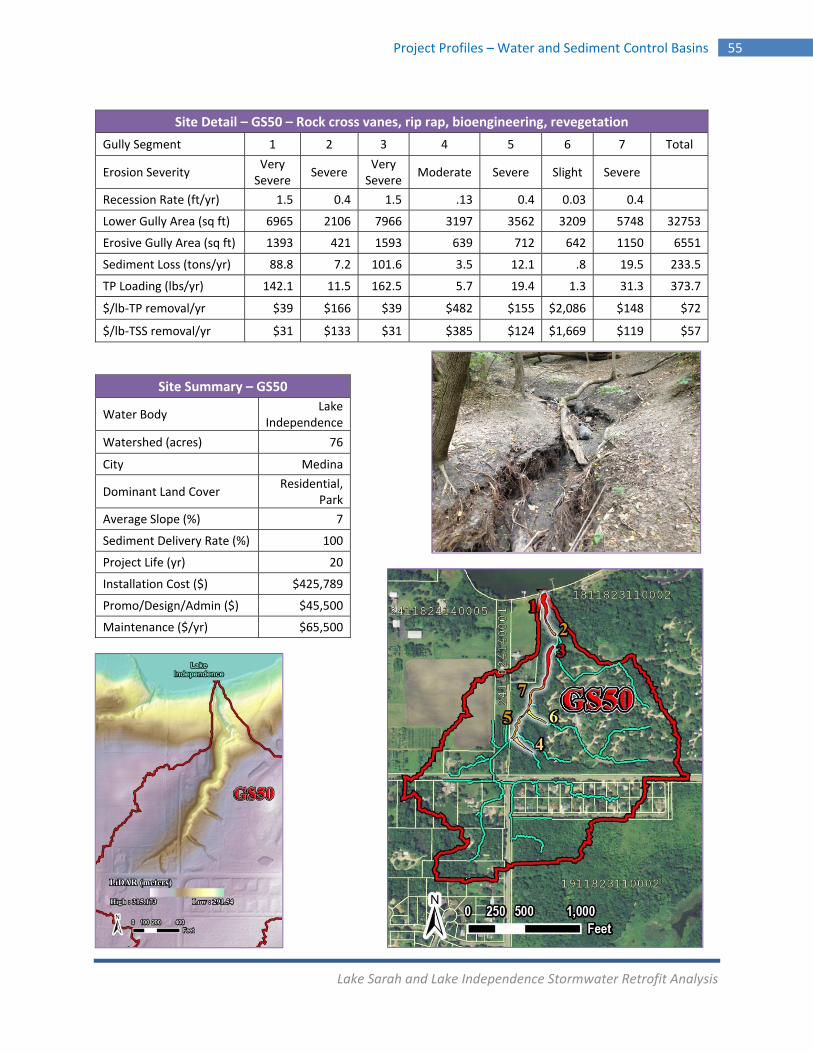
Lake Sarah and Lake Independence Stormwater Retrofit Analysis
Project Profiles – Water and Sediment Control Basins 55
Site Detail – GS50 – Rock cross vanes, rip rap, bioengineering, revegetation
Gully Segment 1 2 3 4 5 6 7 Total
Erosion Severity Very Severe
Severe Very Severe
Moderate Severe Slight Severe
Recession Rate (ft/yr) 1.5 0.4 1.5 .13 0.4 0.03 0.4
Lower Gully Area (sq ft) 6965 2106 7966 3197 3562 3209 5748 32753
Erosive Gully Area (sq ft) 1393 421 1593 639 712 642 1150 6551
Sediment Loss (tons/yr) 88.8 7.2 101.6 3.5 12.1 .8 19.5 233.5
TP Loading (lbs/yr) 142.1 11.5 162.5 5.7 19.4 1.3 31.3 373.7
$/lb‐TP removal/yr $39 $166 $39 $482 $155 $2,086 $148 $72
$/lb‐TSS removal/yr $31 $133 $31 $385 $124 $1,669 $119 $57
Site Summary – GS50
Water Body Lake
Independence
Watershed (acres) 76
City Medina
Dominant Land Cover Residential,
Park
Average Slope (%) 7
Sediment Delivery Rate (%) 100
Project Life (yr) 20
Installation Cost ($) $425,789
Promo/Design/Admin ($) $45,500
Maintenance ($/yr) $65,500
5
Lake Sara
56 Project
The naturbeen altepiping as drainage squickly tobring marput into hquality, flowetlands phosphorhydrologiwater leve
Public profees and/taxes, landescribedfoundatioundergoinon a landonegatively
Current wdownstreencourageencouragenutrient uand time flooding aadvantagelines, insttwo struct
Hydr
Figure 16: B
ah and Lake In
Profiles – Hyd
ral hydrologicred by ditchinshown in thesystem were o prevent proprginal land inthow such projooding, or erwith organic rus because oc regime invoel fluctuation
ojects undertaor taxes chardowners secud in Minnesoton of this law ng project plaowner’s drainy impacts off‐
water manageam impacts. e holding wate infiltration,uptake and seof downstreaand erosion. Reous becausealling water lture concepts
rologic R
Box Weir Aroun
ndependence
drologic Resto
c system throng, tiling, cha figures to thdesign to sheperty damageto crop produjects would imosion. Furthesoils can bec
of bio‐chemicaolves the rightns.
aken to achieged to landowure long terma’s Public Dradates back toanning and denage rights by‐site drainage
ement practicContemporarter on the lan achieve wateediment deteam concentraRestoration oe it can achievevel control ss frequently u
Restorati
d Culvert
Rewe
Stormwater
orations
ughout the stnnelizing, ime right. Manyed water frome due to flooduction. Little mpact downsermore, partiaome large soal processes it degree and
eve drainage gwners. Upon m drainage rigainage Law (Mo the late 180esign, it is crity installing a pe functions.
ces put greatery water manndscape long er quality benntion, and coation to reducof the hydrolove multiple bestructures, anused to resto
ions
emovable eir boards
Retrofit Analy
tudy area haspounding andy features of tm the landscading and to thought was tream water ally drained urces of f their duration of
goals often inpayment of t
ghts. These rigMN Stat. 103e00s. When tical not to infproject that
er emphasis onagement proenough to nefits such asontrol discharce downstreaogic system is enefits. This ind realigning re hydrology.
Figure 15: Ch
ysis
s d the ape
nvolved those ghts are e). The
fringe
on ojects
s rge rates m is done by pludrainage way.
Fig
hannel Weir
Figure 13
ugging ditcheys. The figure
gure 14: Channe
3: Drain Tile Out
s, breaking ties below illust
elized Flow in W
tlet from Ag. Fie
le trate
Wetland
eld

Lake Sarah and Lake Independence Stormwater Retrofit Analysis
Project Profiles – Water and Sediment Control Basins 57
For the purpose of this analysis, field reconnaissance focused on finding opportunities to restore natural hydrology or impound water on properties where few property owners would be involved, no impacts to upstream hydrology were anticipated, and limited negative impacts to residential and agricultural landuses were likely. Identification of surface ditching and channelized water ways is easy. Unfortunately, buried drain tile is much more difficult to identify and there are no public records of their location. To address this, all areas with hydric (wetland) soils that did not show wetland indicators were assumed to be drained with perforated drain tile.
In some instanced, hydrologic restoration can restore hydrology to partially drained systems without significantly expanding the size of the wetland. In other cases, hydrologic restoration will convert effectively drained wetland back into wetland. The former scenarios were classified as hydrologic restoration and identified with an ‘HR,’ while the latter scenarios were classified as wetland restorations and identified with a ‘WR.’ This distinction is important for two reasons; 1) wetlands fall under the jurisdiction of several federal and state laws, and 2) there are additional private and public funding mechanisms and incentives for wetland restoration. Examples of the latter include the state wetland bank, which pays $10,000 per acre for wetland credits to offset impacts due to road projects or the private sector wetland bank, in which wetland credits typically sell for $.75‐$1.25/square foot.
Many wetland restoration opportunities have been identified. In many cases wetland restoration is not practical as it would take farmland out of production. There are several cases, however where wetland restoration can be accomplished on residential properties, properties held by development companies, properties owned by absentee owners, estates managed by trusts, properties that are for sale, and on marginal crop land at the edge of agricultural field. Local resource managers should consider these factors when vetting projects.
Hydrologic restoration has also been identified as a tool. Wetlands that are subject to frequent cycles of wetting and drying can become a large source of phosphorus due to some complex bio‐chemical processes. If wetland hydrology can be managed to maintain saturated conditions without drastically increasing the ponding depth, phosphorus discharge can be dramatically reduced. This can be achieved without making the wetland much larger in landscapes with steep slopes. The degree to which this is effective is highly dependent on each wetland’s chemistry. Pre‐project and post‐project monitoring is strongly recommended to verify project success.
Benefits of hydrologic restoration projects were modeled utilizing the ArcView extension of the Soil & Water Assessment Tool (ArcSWAT). This model combines inputs of hydrography, topography, soils, and land cover in a GIS interface and determines runoff volume and pollutant loading based on these inputs. The model was run with and without the identified project and the difference in pollutant discharge was noted. Each site was modeled at multiple pool restoration depths. The greatest depth that could be achieved without significantly flooding adjacent properties was selected. A detailed account of the methodologies used is included in Appendix A. Professionally engineered designs will be necessary for all hydrologic restoration projects to ensure drainage rights are not infringed upon.
Because modeling was done on very small land units, water quality data were not available to calibrate the model. Model outputs are best estimates based on available data but may vary greatly from observed field conditions. Furthermore, the models predicted benefits at the field edge, not benefits to the receiving water body. For pollutants held in suspension in the water column such as TSS, projects that are closer to the lake or main tributaries to the lake may be preferred to projects farther away even if the project benefits in the table shows greater cost effectiveness for the farther projects. For dissolved pollutants such as dissolved phosphorus or chlorides, the distance from the receiving water body is less
Lake Sarah and Lake Independence Stormwater Retrofit Analysis
58 Project Profiles – Hydrologic Restorations
critical. Rather than estimate the pollutant delivery ratio for each pollutant type, we focused our investigation on sites near the lakes and/or immediately adjacent to the drainage system. This approach will ensure that all identified projects have merit. Ultimately, it will be the purview of watershed management professionals to select projects to pursue. To facilitate this process, maps for each project showing the location in the watershed are provided.
In order to determine cost‐benefit, the cost of each project had to be estimated. To fully estimate the cost of project installation, labor costs for project outreach and promotion, project design, easement acquisition, project administration, and project maintenance over the anticipated life of the practice were considered in addition to actual construction costs. As an example, the outlet control retrofit shown in Figure 17 cost only $8,450 to install, but design engineering, hydraulic modeling, project bidding, construction oversight, landowner outreach and education, and project reporting cost an additional $8,500.
All projects were assumed to use one of three structure types;
box weirs (Figure 16)
channel weirs (Figure 15)
outlet control structure (Figure 18)
Channel weirs are used where flow is through an open ditch. Box weirs are used where flow is through a culvert. Water control structures allow landowners to dynamically manage subsurface drainage and surface ponding to achieve hydrologic goals by raising or lowering the flow mechanism. To pond water, control structures must be coupled with an earthen berm. The installation costs of these practice vary greatly but the cost of design, hydraulic modeling, landowner outreach, project administration, and construction oversight are comparable regardless of the structure type.
The table on the next page summarizes all potential hydrologic restoration projects identified during field reconnaissance. Projects are sorted from most cost‐effective to least cost‐effective in terms of the cost per pound of Total Phosphorus removed at the edge of field. Cost assumptions made to calculate the cost‐benefit of each project should be verified against local experience while creating implementation plans. The relative ranking shouldn’t vary much even with alterations to the cost formula.
Figure 17: Outlet Control Retrofit
Figure 18: Water Control Attached to Drain Tile (illustration courtesy of Illinois NRCS)
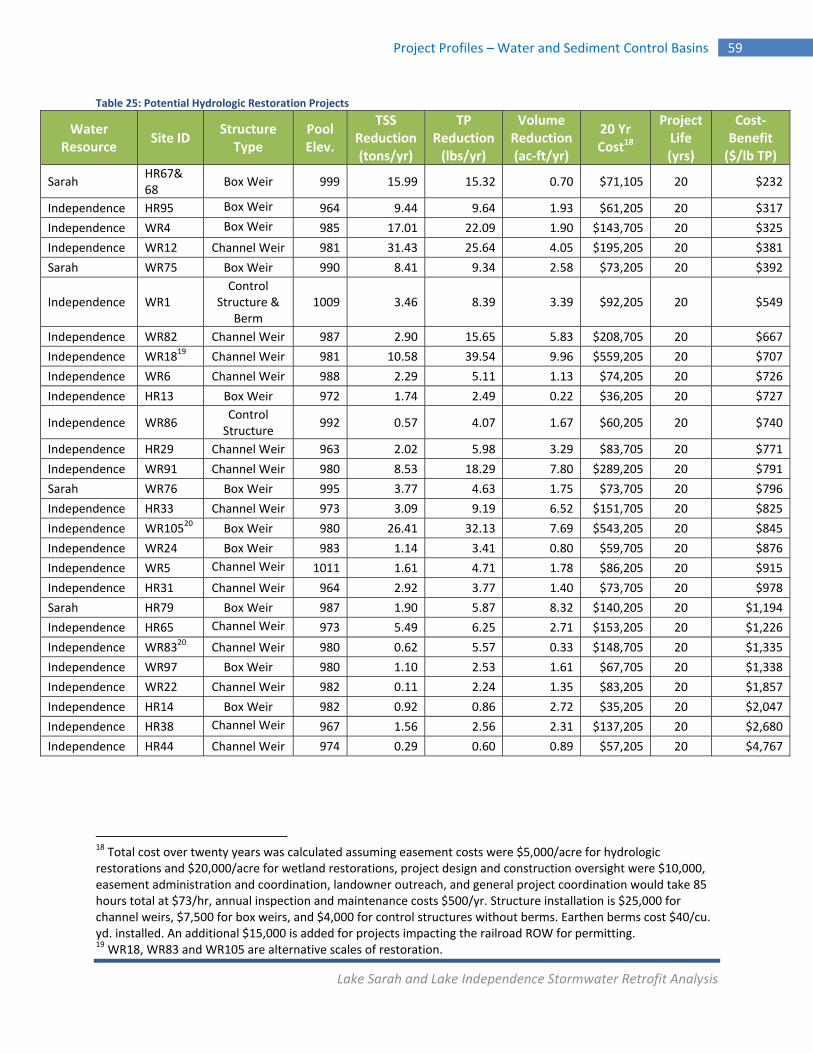
Lake Sarah and Lake Independence Stormwater Retrofit Analysis
Project Profiles – Water and Sediment Control Basins 59
Table 25: Potential Hydrologic Restoration Projects
18 Total cost over twenty years was calculated assuming easement costs were $5,000/acre for hydrologic restorations and $20,000/acre for wetland restorations, project design and construction oversight were $10,000, easement administration and coordination, landowner outreach, and general project coordination would take 85 hours total at $73/hr, annual inspection and maintenance costs $500/yr. Structure installation is $25,000 for channel weirs, $7,500 for box weirs, and $4,000 for control structures without berms. Earthen berms cost $40/cu. yd. installed. An additional $15,000 is added for projects impacting the railroad ROW for permitting. 19 WR18, WR83 and WR105 are alternative scales of restoration.
Water Resource
Site ID Structure Type
Pool Elev.
TSS Reduction (tons/yr)
TP Reduction(lbs/yr)
Volume Reduction (ac‐ft/yr)
20 Yr Cost18
Project Life (yrs)
Cost‐Benefit ($/lb TP)
Sarah HR67& 68
Box Weir 999 15.99 15.32 0.70 $71,105 20 $232
Independence HR95 Box Weir 964 9.44 9.64 1.93 $61,205 20 $317
Independence WR4 Box Weir 985 17.01 22.09 1.90 $143,705 20 $325
Independence WR12 Channel Weir 981 31.43 25.64 4.05 $195,205 20 $381
Sarah WR75 Box Weir 990 8.41 9.34 2.58 $73,205 20 $392
Independence WR1 Control
Structure & Berm
1009 3.46 8.39 3.39 $92,205 20 $549
Independence WR82 Channel Weir 987 2.90 15.65 5.83 $208,705 20 $667
Independence WR1819 Channel Weir 981 10.58 39.54 9.96 $559,205 20 $707
Independence WR6 Channel Weir 988 2.29 5.11 1.13 $74,205 20 $726
Independence HR13 Box Weir 972 1.74 2.49 0.22 $36,205 20 $727
Independence WR86 Control Structure
992 0.57 4.07 1.67 $60,205 20 $740
Independence HR29 Channel Weir 963 2.02 5.98 3.29 $83,705 20 $771
Independence WR91 Channel Weir 980 8.53 18.29 7.80 $289,205 20 $791
Sarah WR76 Box Weir 995 3.77 4.63 1.75 $73,705 20 $796
Independence HR33 Channel Weir 973 3.09 9.19 6.52 $151,705 20 $825
Independence WR10520 Box Weir 980 26.41 32.13 7.69 $543,205 20 $845
Independence WR24 Box Weir 983 1.14 3.41 0.80 $59,705 20 $876
Independence WR5 Channel Weir 1011 1.61 4.71 1.78 $86,205 20 $915
Independence HR31 Channel Weir 964 2.92 3.77 1.40 $73,705 20 $978
Sarah HR79 Box Weir 987 1.90 5.87 8.32 $140,205 20 $1,194
Independence HR65 Channel Weir 973 5.49 6.25 2.71 $153,205 20 $1,226
Independence WR8320 Channel Weir 980 0.62 5.57 0.33 $148,705 20 $1,335
Independence WR97 Box Weir 980 1.10 2.53 1.61 $67,705 20 $1,338
Independence WR22 Channel Weir 982 0.11 2.24 1.35 $83,205 20 $1,857
Independence HR14 Box Weir 982 0.92 0.86 2.72 $35,205 20 $2,047
Independence HR38 Channel Weir 967 1.56 2.56 2.31 $137,205 20 $2,680
Independence HR44 Channel Weir 974 0.29 0.60 0.89 $57,205 20 $4,767
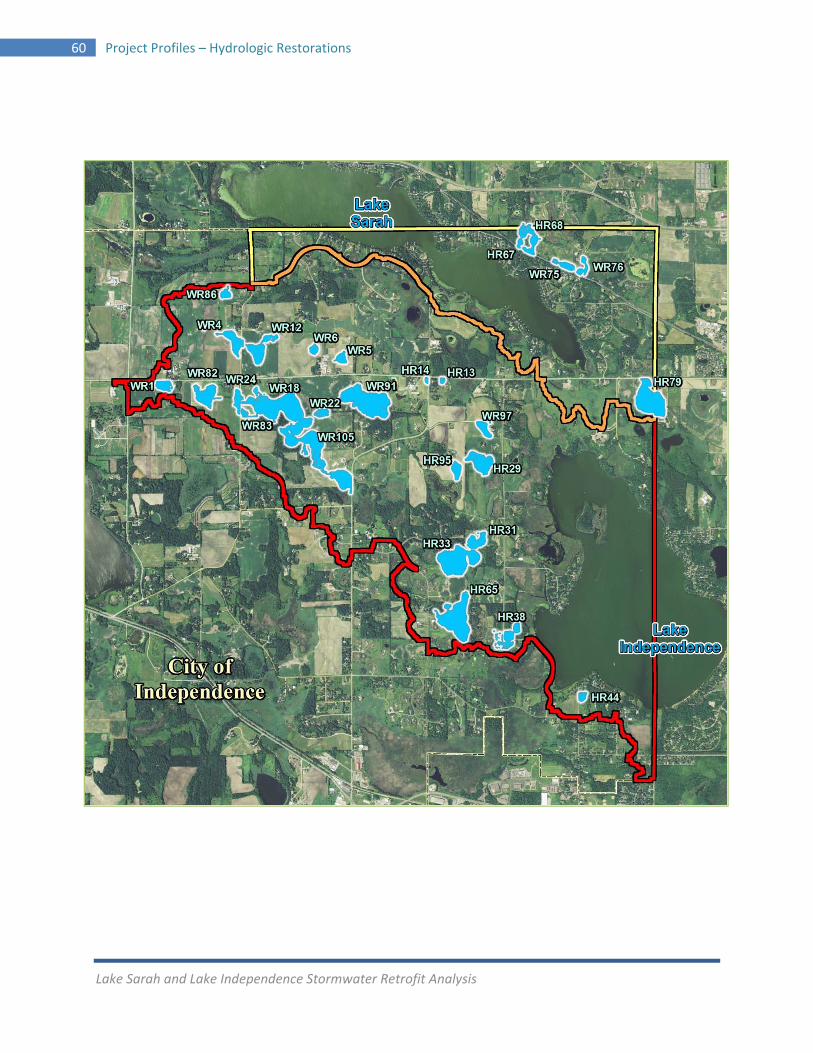
Lake Sarah and Lake Independence Stormwater Retrofit Analysis
60 Project Profiles – Hydrologic Restorations
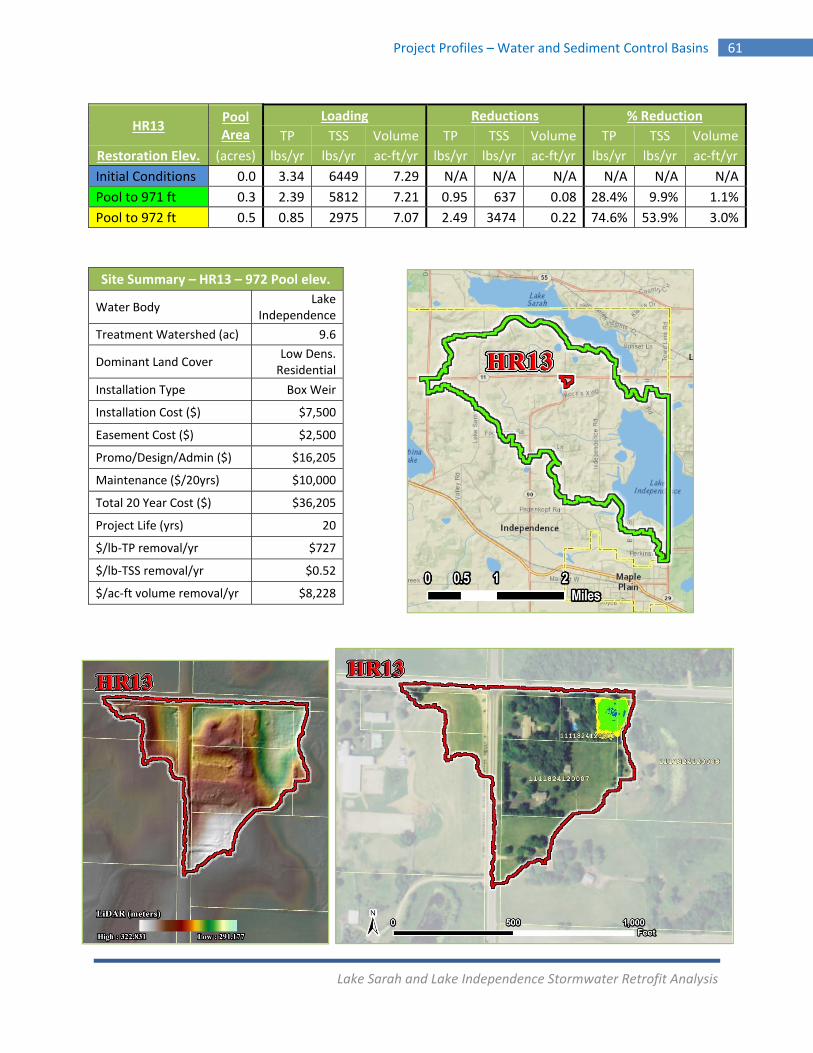
Lake Sarah and Lake Independence Stormwater Retrofit Analysis
Project Profiles – Water and Sediment Control Basins 61
HR13 Pool Area
Loading Reductions % Reduction
TP TSS Volume TP TSS Volume TP TSS Volume
Restoration Elev. (acres) lbs/yr lbs/yr ac‐ft/yr lbs/yr lbs/yr ac‐ft/yr lbs/yr lbs/yr ac‐ft/yr
Initial Conditions 0.0 3.34 6449 7.29 N/A N/A N/A N/A N/A N/A
Pool to 971 ft 0.3 2.39 5812 7.21 0.95 637 0.08 28.4% 9.9% 1.1%
Pool to 972 ft 0.5 0.85 2975 7.07 2.49 3474 0.22 74.6% 53.9% 3.0%
Site Summary – HR13 – 972 Pool elev.
Water Body Lake
Independence
Treatment Watershed (ac) 9.6
Dominant Land Cover Low Dens. Residential
Installation Type Box Weir
Installation Cost ($) $7,500
Easement Cost ($) $2,500
Promo/Design/Admin ($) $16,205
Maintenance ($/20yrs) $10,000
Total 20 Year Cost ($) $36,205
Project Life (yrs) 20
$/lb‐TP removal/yr $727
$/lb‐TSS removal/yr $0.52
$/ac‐ft volume removal/yr $8,228
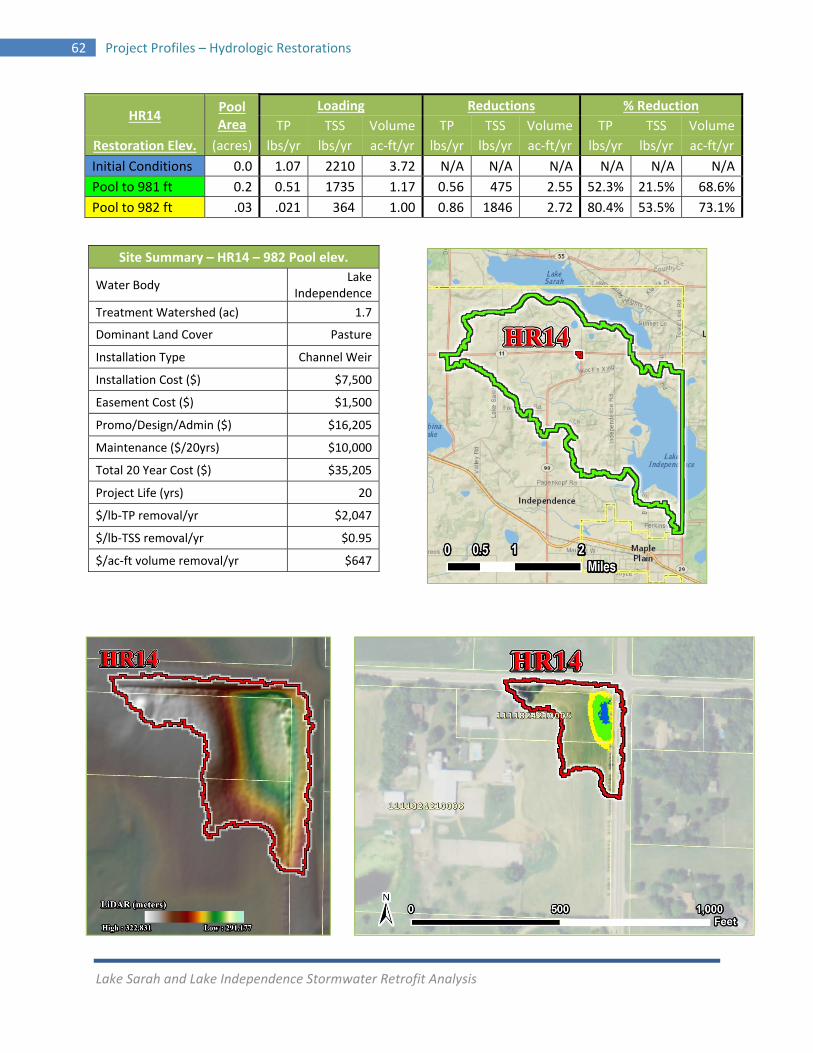
Lake Sarah and Lake Independence Stormwater Retrofit Analysis
62 Project Profiles – Hydrologic Restorations
HR14 Pool Area
Loading Reductions % Reduction
TP TSS Volume TP TSS Volume TP TSS Volume
Restoration Elev. (acres) lbs/yr lbs/yr ac‐ft/yr lbs/yr lbs/yr ac‐ft/yr lbs/yr lbs/yr ac‐ft/yr
Initial Conditions 0.0 1.07 2210 3.72 N/A N/A N/A N/A N/A N/A
Pool to 981 ft 0.2 0.51 1735 1.17 0.56 475 2.55 52.3% 21.5% 68.6%
Pool to 982 ft .03 .021 364 1.00 0.86 1846 2.72 80.4% 53.5% 73.1%
Site Summary – HR14 – 982 Pool elev.
Water Body Lake
Independence
Treatment Watershed (ac) 1.7
Dominant Land Cover Pasture
Installation Type Channel Weir
Installation Cost ($) $7,500
Easement Cost ($) $1,500
Promo/Design/Admin ($) $16,205
Maintenance ($/20yrs) $10,000
Total 20 Year Cost ($) $35,205
Project Life (yrs) 20
$/lb‐TP removal/yr $2,047
$/lb‐TSS removal/yr $0.95
$/ac‐ft volume removal/yr $647

Lake Sarah and Lake Independence Stormwater Retrofit Analysis
Project Profiles – Water and Sediment Control Basins 63
HR29 Pool Area
Loading Reductions % Reduction
TP TSS Volume TP TSS Volume TP TSS Volume
Restoration Elev. (acres) lbs/yr lbs/yr ac‐ft/yr lbs/yr lbs/yr ac‐ft/yr lbs/yr lbs/yr ac‐ft/yr
Initial Conditions .1 8.93 7,495 38.55 N/A N/A N/A N/A N/A N/A
Pool to 961 ft 2.1 6.99 6,990 37.56 1.94 505 0.99 21.7% 6.7% 2.6%
Pool to 962 ft 4.9 4.72 5,727 36.47 4.21 1768 2.08 47.1% 23.6% 5.4%
Pool to 963 ft 8.2 2.95 3,453 35.26 5.98 4042 3.29 67.0% 53.9% 8.5%
Site Summary – HR29 – 963 Pool elev.
Water Body Lake
Independence
Treatment Watershed (ac) 47.2
Dominant Land Cover Crop, Pasture
Installation Type Channel Weir
Installation Cost ($) $25,000
Easement Cost ($) $41,000
Promo/Design/Admin ($) $16,205
Maintenance ($/20yrs) $10,000
Total 20 Year Cost ($) $92,205
Project Life (yrs) 20
$/lb‐TP removal/yr $771
$/lb‐TSS removal/yr $1.14
$/ac‐ft volume removal/yr $1,401
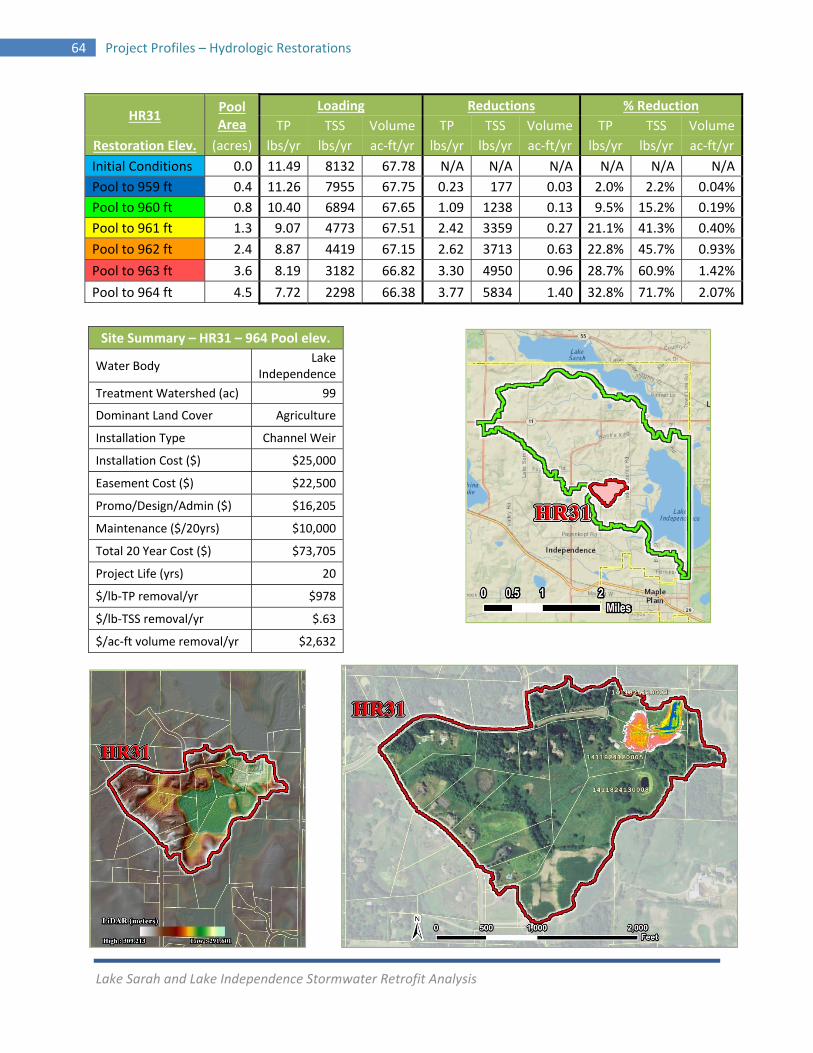
Lake Sarah and Lake Independence Stormwater Retrofit Analysis
64 Project Profiles – Hydrologic Restorations
HR31 Pool Area
Loading Reductions % Reduction
TP TSS Volume TP TSS Volume TP TSS Volume
Restoration Elev. (acres) lbs/yr lbs/yr ac‐ft/yr lbs/yr lbs/yr ac‐ft/yr lbs/yr lbs/yr ac‐ft/yr
Initial Conditions 0.0 11.49 8132 67.78 N/A N/A N/A N/A N/A N/A
Pool to 959 ft 0.4 11.26 7955 67.75 0.23 177 0.03 2.0% 2.2% 0.04%
Pool to 960 ft 0.8 10.40 6894 67.65 1.09 1238 0.13 9.5% 15.2% 0.19%
Pool to 961 ft 1.3 9.07 4773 67.51 2.42 3359 0.27 21.1% 41.3% 0.40%
Pool to 962 ft 2.4 8.87 4419 67.15 2.62 3713 0.63 22.8% 45.7% 0.93%
Pool to 963 ft 3.6 8.19 3182 66.82 3.30 4950 0.96 28.7% 60.9% 1.42%
Pool to 964 ft 4.5 7.72 2298 66.38 3.77 5834 1.40 32.8% 71.7% 2.07%
Site Summary – HR31 – 964 Pool elev.
Water Body Lake
Independence
Treatment Watershed (ac) 99
Dominant Land Cover Agriculture
Installation Type Channel Weir
Installation Cost ($) $25,000
Easement Cost ($) $22,500
Promo/Design/Admin ($) $16,205
Maintenance ($/20yrs) $10,000
Total 20 Year Cost ($) $73,705
Project Life (yrs) 20
$/lb‐TP removal/yr $978
$/lb‐TSS removal/yr $.63
$/ac‐ft volume removal/yr $2,632
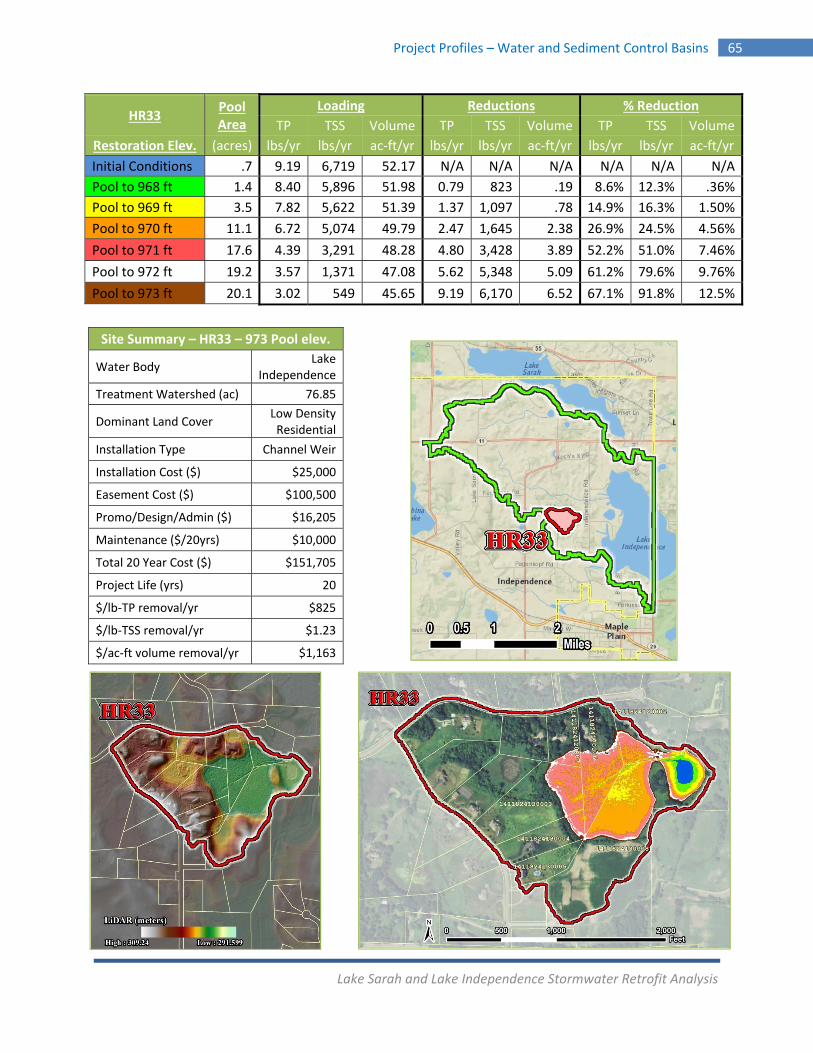
Lake Sarah and Lake Independence Stormwater Retrofit Analysis
Project Profiles – Water and Sediment Control Basins 65
HR33 Pool Area
Loading Reductions % Reduction
TP TSS Volume TP TSS Volume TP TSS Volume
Restoration Elev. (acres) lbs/yr lbs/yr ac‐ft/yr lbs/yr lbs/yr ac‐ft/yr lbs/yr lbs/yr ac‐ft/yr
Initial Conditions .7 9.19 6,719 52.17 N/A N/A N/A N/A N/A N/A
Pool to 968 ft 1.4 8.40 5,896 51.98 0.79 823 .19 8.6% 12.3% .36%
Pool to 969 ft 3.5 7.82 5,622 51.39 1.37 1,097 .78 14.9% 16.3% 1.50%
Pool to 970 ft 11.1 6.72 5,074 49.79 2.47 1,645 2.38 26.9% 24.5% 4.56%
Pool to 971 ft 17.6 4.39 3,291 48.28 4.80 3,428 3.89 52.2% 51.0% 7.46%
Pool to 972 ft 19.2 3.57 1,371 47.08 5.62 5,348 5.09 61.2% 79.6% 9.76%
Pool to 973 ft 20.1 3.02 549 45.65 9.19 6,170 6.52 67.1% 91.8% 12.5%
Site Summary – HR33 – 973 Pool elev.
Water Body Lake
Independence
Treatment Watershed (ac) 76.85
Dominant Land Cover Low Density Residential
Installation Type Channel Weir
Installation Cost ($) $25,000
Easement Cost ($) $100,500
Promo/Design/Admin ($) $16,205
Maintenance ($/20yrs) $10,000
Total 20 Year Cost ($) $151,705
Project Life (yrs) 20
$/lb‐TP removal/yr $825
$/lb‐TSS removal/yr $1.23
$/ac‐ft volume removal/yr $1,163
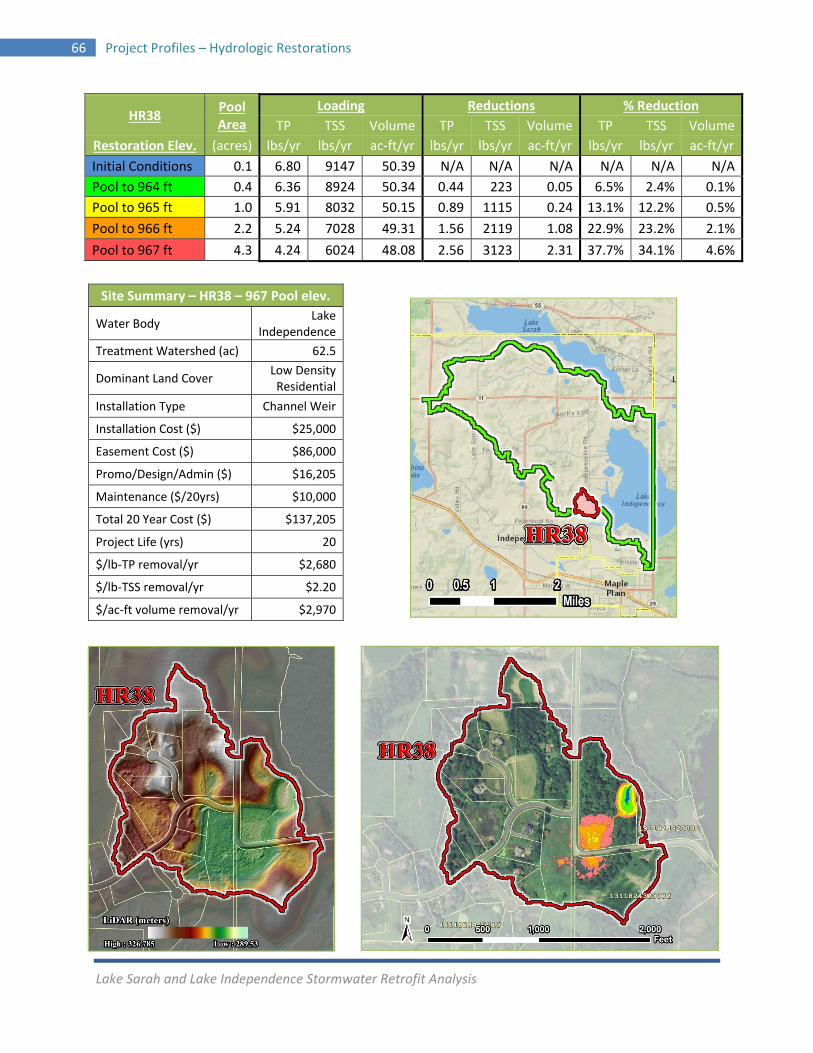
Lake Sarah and Lake Independence Stormwater Retrofit Analysis
66 Project Profiles – Hydrologic Restorations
HR38 Pool Area
Loading Reductions % Reduction
TP TSS Volume TP TSS Volume TP TSS Volume
Restoration Elev. (acres) lbs/yr lbs/yr ac‐ft/yr lbs/yr lbs/yr ac‐ft/yr lbs/yr lbs/yr ac‐ft/yr
Initial Conditions 0.1 6.80 9147 50.39 N/A N/A N/A N/A N/A N/A
Pool to 964 ft 0.4 6.36 8924 50.34 0.44 223 0.05 6.5% 2.4% 0.1%
Pool to 965 ft 1.0 5.91 8032 50.15 0.89 1115 0.24 13.1% 12.2% 0.5%
Pool to 966 ft 2.2 5.24 7028 49.31 1.56 2119 1.08 22.9% 23.2% 2.1%
Pool to 967 ft 4.3 4.24 6024 48.08 2.56 3123 2.31 37.7% 34.1% 4.6%
Site Summary – HR38 – 967 Pool elev.
Water Body Lake
Independence
Treatment Watershed (ac) 62.5
Dominant Land Cover Low Density Residential
Installation Type Channel Weir
Installation Cost ($) $25,000
Easement Cost ($) $86,000
Promo/Design/Admin ($) $16,205
Maintenance ($/20yrs) $10,000
Total 20 Year Cost ($) $137,205
Project Life (yrs) 20
$/lb‐TP removal/yr $2,680
$/lb‐TSS removal/yr $2.20
$/ac‐ft volume removal/yr $2,970
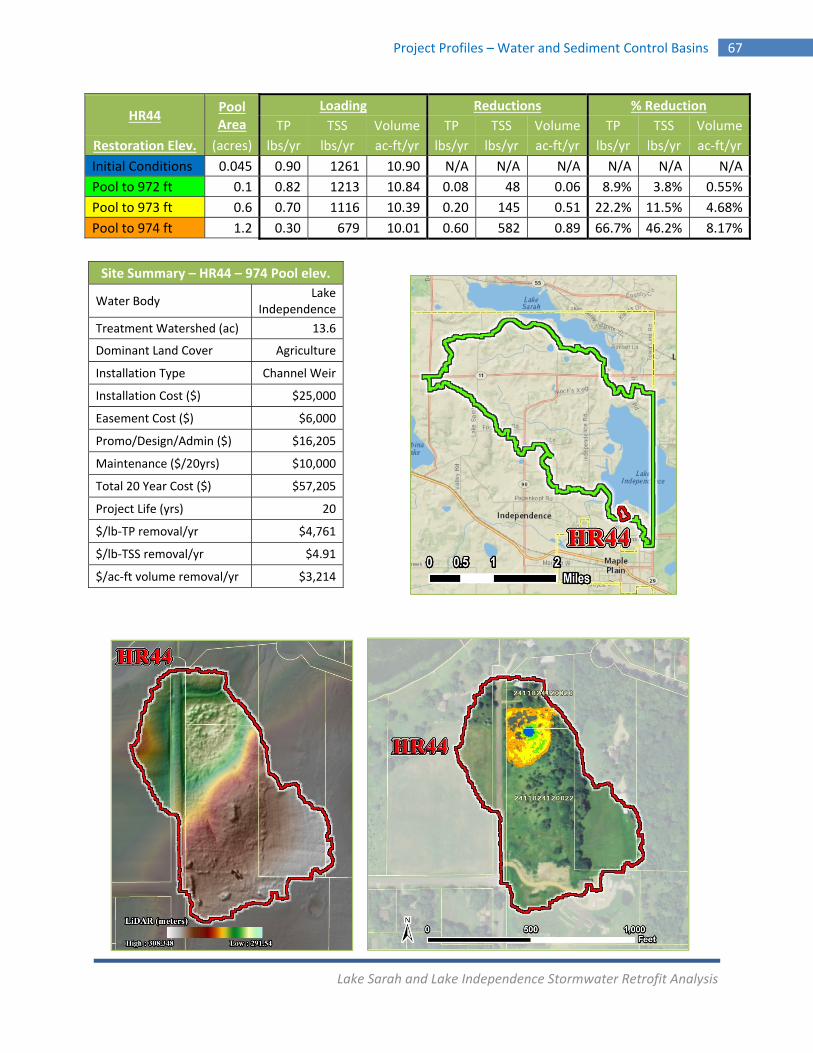
Lake Sarah and Lake Independence Stormwater Retrofit Analysis
Project Profiles – Water and Sediment Control Basins 67
HR44 Pool Area
Loading Reductions % Reduction
TP TSS Volume TP TSS Volume TP TSS Volume
Restoration Elev. (acres) lbs/yr lbs/yr ac‐ft/yr lbs/yr lbs/yr ac‐ft/yr lbs/yr lbs/yr ac‐ft/yr
Initial Conditions 0.045 0.90 1261 10.90 N/A N/A N/A N/A N/A N/A
Pool to 972 ft 0.1 0.82 1213 10.84 0.08 48 0.06 8.9% 3.8% 0.55%
Pool to 973 ft 0.6 0.70 1116 10.39 0.20 145 0.51 22.2% 11.5% 4.68%
Pool to 974 ft 1.2 0.30 679 10.01 0.60 582 0.89 66.7% 46.2% 8.17%
Site Summary – HR44 – 974 Pool elev.
Water Body Lake
Independence
Treatment Watershed (ac) 13.6
Dominant Land Cover Agriculture
Installation Type Channel Weir
Installation Cost ($) $25,000
Easement Cost ($) $6,000
Promo/Design/Admin ($) $16,205
Maintenance ($/20yrs) $10,000
Total 20 Year Cost ($) $57,205
Project Life (yrs) 20
$/lb‐TP removal/yr $4,761
$/lb‐TSS removal/yr $4.91
$/ac‐ft volume removal/yr $3,214
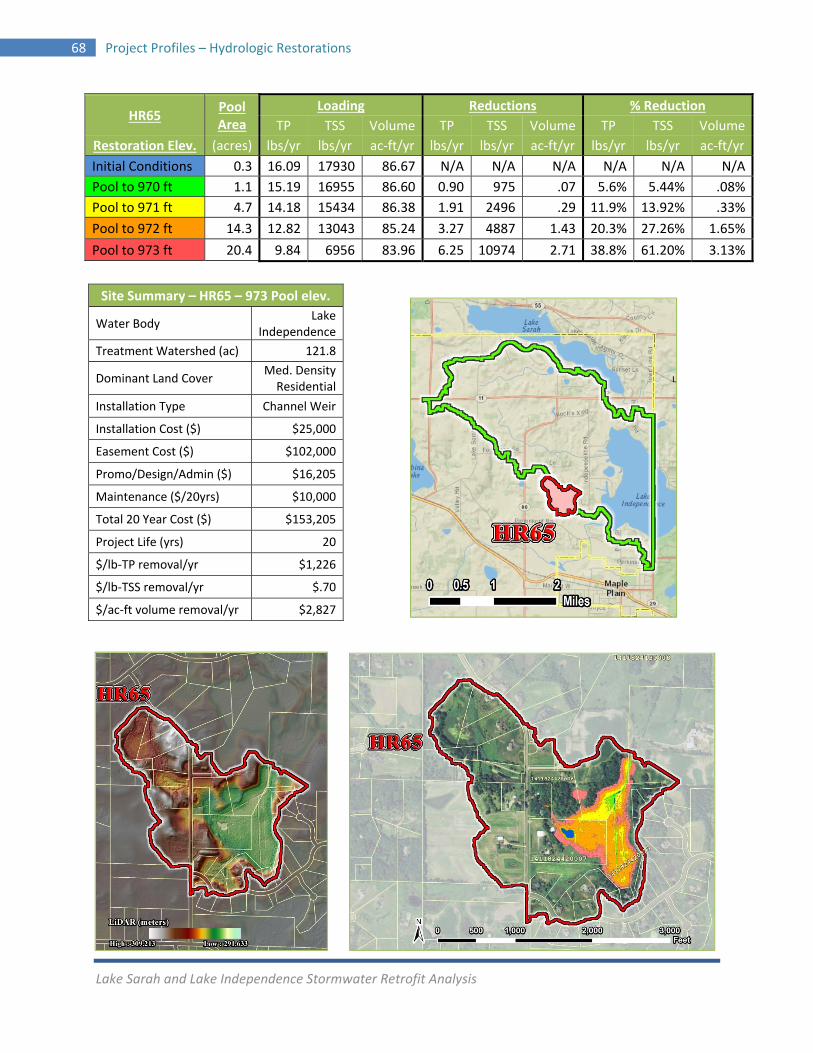
Lake Sarah and Lake Independence Stormwater Retrofit Analysis
68 Project Profiles – Hydrologic Restorations
HR65 Pool Area
Loading Reductions % Reduction
TP TSS Volume TP TSS Volume TP TSS Volume
Restoration Elev. (acres) lbs/yr lbs/yr ac‐ft/yr lbs/yr lbs/yr ac‐ft/yr lbs/yr lbs/yr ac‐ft/yr
Initial Conditions 0.3 16.09 17930 86.67 N/A N/A N/A N/A N/A N/A
Pool to 970 ft 1.1 15.19 16955 86.60 0.90 975 .07 5.6% 5.44% .08%
Pool to 971 ft 4.7 14.18 15434 86.38 1.91 2496 .29 11.9% 13.92% .33%
Pool to 972 ft 14.3 12.82 13043 85.24 3.27 4887 1.43 20.3% 27.26% 1.65%
Pool to 973 ft 20.4 9.84 6956 83.96 6.25 10974 2.71 38.8% 61.20% 3.13%
Site Summary – HR65 – 973 Pool elev.
Water Body Lake
Independence
Treatment Watershed (ac) 121.8
Dominant Land Cover Med. Density Residential
Installation Type Channel Weir
Installation Cost ($) $25,000
Easement Cost ($) $102,000
Promo/Design/Admin ($) $16,205
Maintenance ($/20yrs) $10,000
Total 20 Year Cost ($) $153,205
Project Life (yrs) 20
$/lb‐TP removal/yr $1,226
$/lb‐TSS removal/yr $.70
$/ac‐ft volume removal/yr $2,827
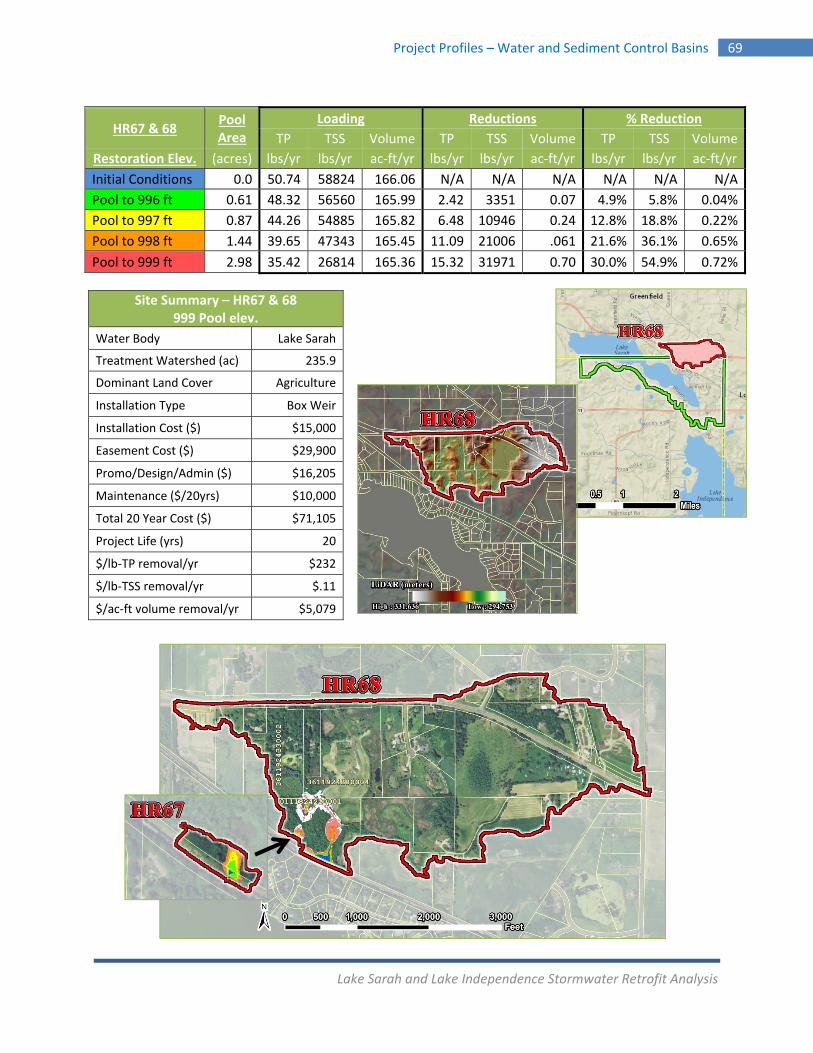
Lake Sarah and Lake Independence Stormwater Retrofit Analysis
Project Profiles – Water and Sediment Control Basins 69
HR67 & 68 Pool Area
Loading Reductions % Reduction
TP TSS Volume TP TSS Volume TP TSS Volume
Restoration Elev. (acres) lbs/yr lbs/yr ac‐ft/yr lbs/yr lbs/yr ac‐ft/yr lbs/yr lbs/yr ac‐ft/yr
Initial Conditions 0.0 50.74 58824 166.06 N/A N/A N/A N/A N/A N/A
Pool to 996 ft 0.61 48.32 56560 165.99 2.42 3351 0.07 4.9% 5.8% 0.04%
Pool to 997 ft 0.87 44.26 54885 165.82 6.48 10946 0.24 12.8% 18.8% 0.22%
Pool to 998 ft 1.44 39.65 47343 165.45 11.09 21006 .061 21.6% 36.1% 0.65%
Pool to 999 ft 2.98 35.42 26814 165.36 15.32 31971 0.70 30.0% 54.9% 0.72%
Site Summary – HR67 & 68 999 Pool elev.
Water Body Lake Sarah
Treatment Watershed (ac) 235.9
Dominant Land Cover Agriculture
Installation Type Box Weir
Installation Cost ($) $15,000
Easement Cost ($) $29,900
Promo/Design/Admin ($) $16,205
Maintenance ($/20yrs) $10,000
Total 20 Year Cost ($) $71,105
Project Life (yrs) 20
$/lb‐TP removal/yr $232
$/lb‐TSS removal/yr $.11
$/ac‐ft volume removal/yr $5,079
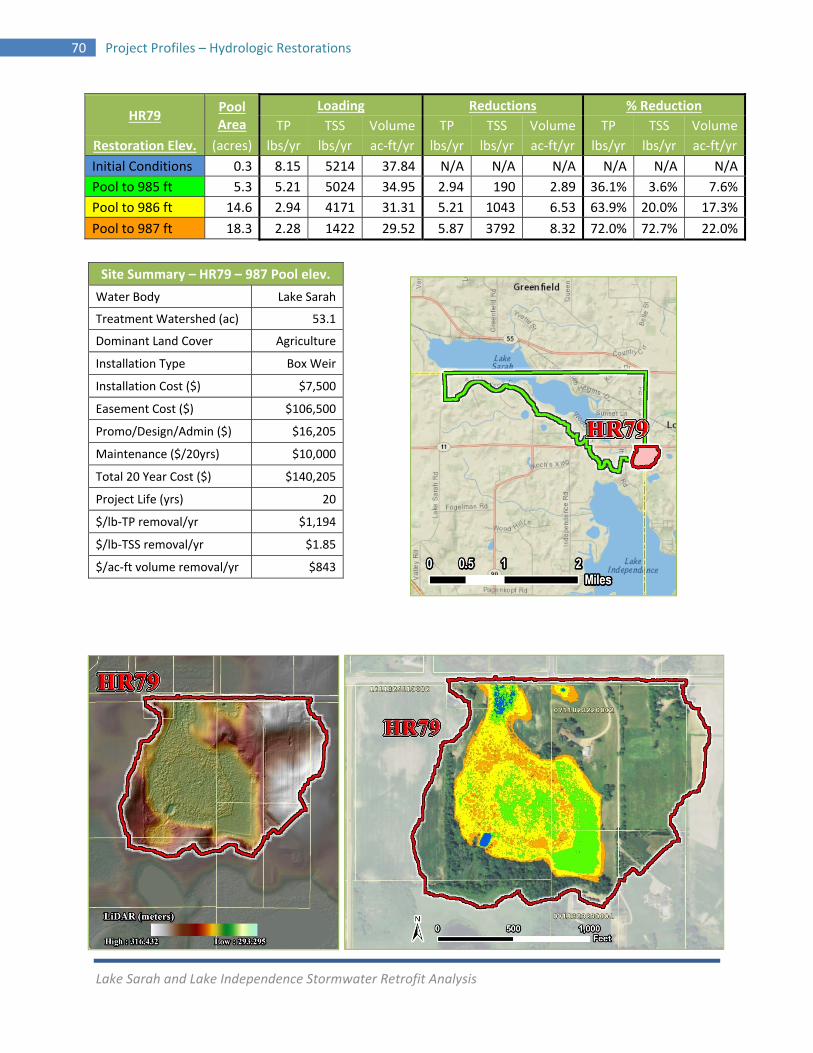
Lake Sarah and Lake Independence Stormwater Retrofit Analysis
70 Project Profiles – Hydrologic Restorations
HR79 Pool Area
Loading Reductions % Reduction
TP TSS Volume TP TSS Volume TP TSS Volume
Restoration Elev. (acres) lbs/yr lbs/yr ac‐ft/yr lbs/yr lbs/yr ac‐ft/yr lbs/yr lbs/yr ac‐ft/yr
Initial Conditions 0.3 8.15 5214 37.84 N/A N/A N/A N/A N/A N/A
Pool to 985 ft 5.3 5.21 5024 34.95 2.94 190 2.89 36.1% 3.6% 7.6%
Pool to 986 ft 14.6 2.94 4171 31.31 5.21 1043 6.53 63.9% 20.0% 17.3%
Pool to 987 ft 18.3 2.28 1422 29.52 5.87 3792 8.32 72.0% 72.7% 22.0%
Site Summary – HR79 – 987 Pool elev.
Water Body Lake Sarah
Treatment Watershed (ac) 53.1
Dominant Land Cover Agriculture
Installation Type Box Weir
Installation Cost ($) $7,500
Easement Cost ($) $106,500
Promo/Design/Admin ($) $16,205
Maintenance ($/20yrs) $10,000
Total 20 Year Cost ($) $140,205
Project Life (yrs) 20
$/lb‐TP removal/yr $1,194
$/lb‐TSS removal/yr $1.85
$/ac‐ft volume removal/yr $843
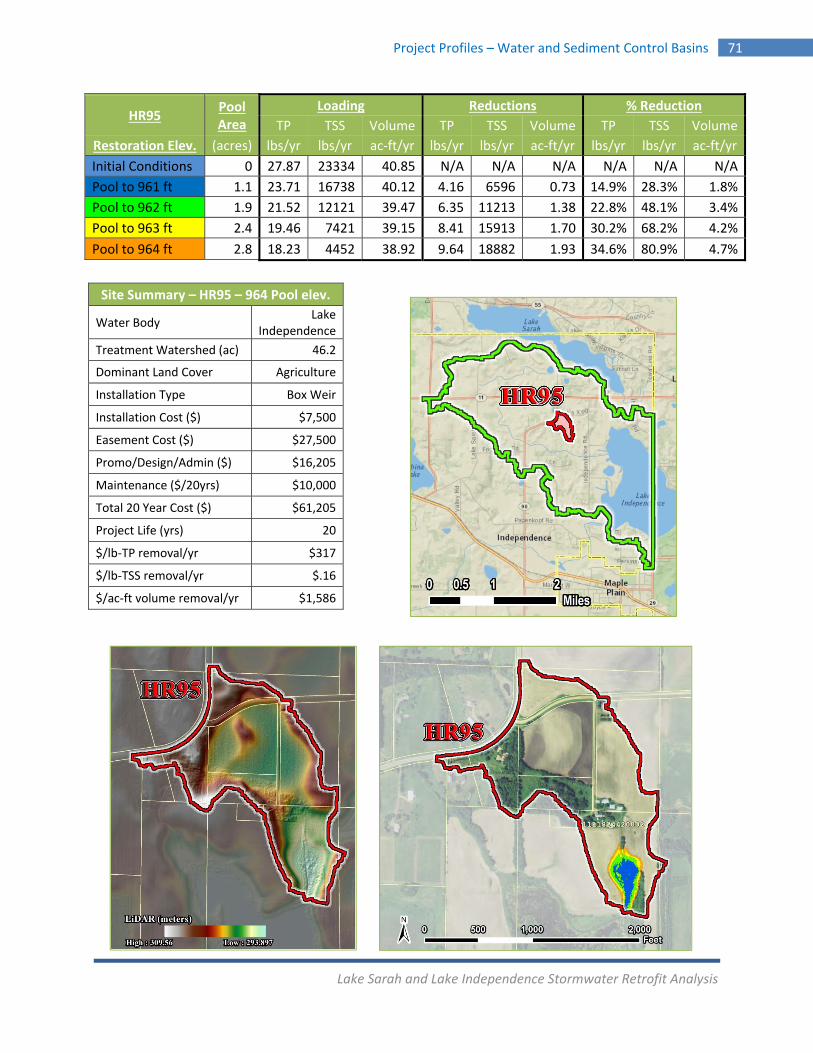
Lake Sarah and Lake Independence Stormwater Retrofit Analysis
Project Profiles – Water and Sediment Control Basins 71
HR95 Pool Area
Loading Reductions % Reduction
TP TSS Volume TP TSS Volume TP TSS Volume
Restoration Elev. (acres) lbs/yr lbs/yr ac‐ft/yr lbs/yr lbs/yr ac‐ft/yr lbs/yr lbs/yr ac‐ft/yr
Initial Conditions 0 27.87 23334 40.85 N/A N/A N/A N/A N/A N/A
Pool to 961 ft 1.1 23.71 16738 40.12 4.16 6596 0.73 14.9% 28.3% 1.8%
Pool to 962 ft 1.9 21.52 12121 39.47 6.35 11213 1.38 22.8% 48.1% 3.4%
Pool to 963 ft 2.4 19.46 7421 39.15 8.41 15913 1.70 30.2% 68.2% 4.2%
Pool to 964 ft 2.8 18.23 4452 38.92 9.64 18882 1.93 34.6% 80.9% 4.7%
Site Summary – HR95 – 964 Pool elev.
Water Body Lake
Independence
Treatment Watershed (ac) 46.2
Dominant Land Cover Agriculture
Installation Type Box Weir
Installation Cost ($) $7,500
Easement Cost ($) $27,500
Promo/Design/Admin ($) $16,205
Maintenance ($/20yrs) $10,000
Total 20 Year Cost ($) $61,205
Project Life (yrs) 20
$/lb‐TP removal/yr $317
$/lb‐TSS removal/yr $.16
$/ac‐ft volume removal/yr $1,586
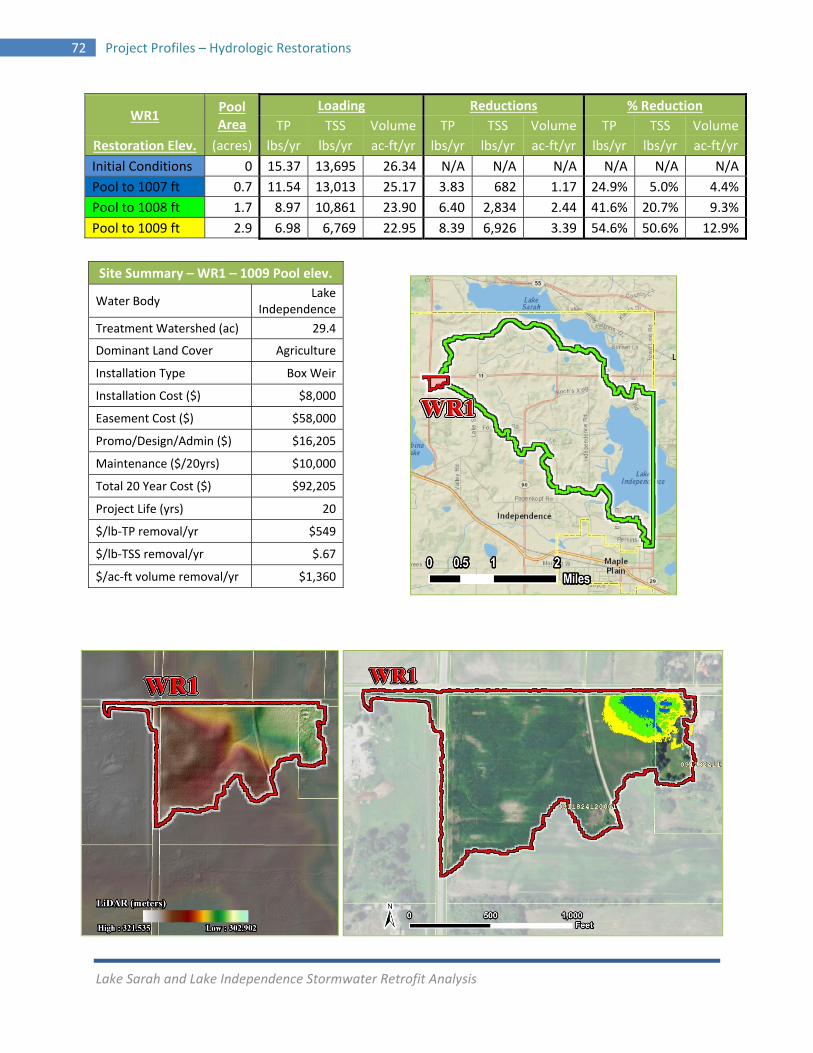
Lake Sarah and Lake Independence Stormwater Retrofit Analysis
72 Project Profiles – Hydrologic Restorations
WR1 Pool Area
Loading Reductions % Reduction
TP TSS Volume TP TSS Volume TP TSS Volume
Restoration Elev. (acres) lbs/yr lbs/yr ac‐ft/yr lbs/yr lbs/yr ac‐ft/yr lbs/yr lbs/yr ac‐ft/yr
Initial Conditions 0 15.37 13,695 26.34 N/A N/A N/A N/A N/A N/A
Pool to 1007 ft 0.7 11.54 13,013 25.17 3.83 682 1.17 24.9% 5.0% 4.4%
Pool to 1008 ft 1.7 8.97 10,861 23.90 6.40 2,834 2.44 41.6% 20.7% 9.3%
Pool to 1009 ft 2.9 6.98 6,769 22.95 8.39 6,926 3.39 54.6% 50.6% 12.9%
Site Summary – WR1 – 1009 Pool elev.
Water Body Lake
Independence
Treatment Watershed (ac) 29.4
Dominant Land Cover Agriculture
Installation Type Box Weir
Installation Cost ($) $8,000
Easement Cost ($) $58,000
Promo/Design/Admin ($) $16,205
Maintenance ($/20yrs) $10,000
Total 20 Year Cost ($) $92,205
Project Life (yrs) 20
$/lb‐TP removal/yr $549
$/lb‐TSS removal/yr $.67
$/ac‐ft volume removal/yr $1,360
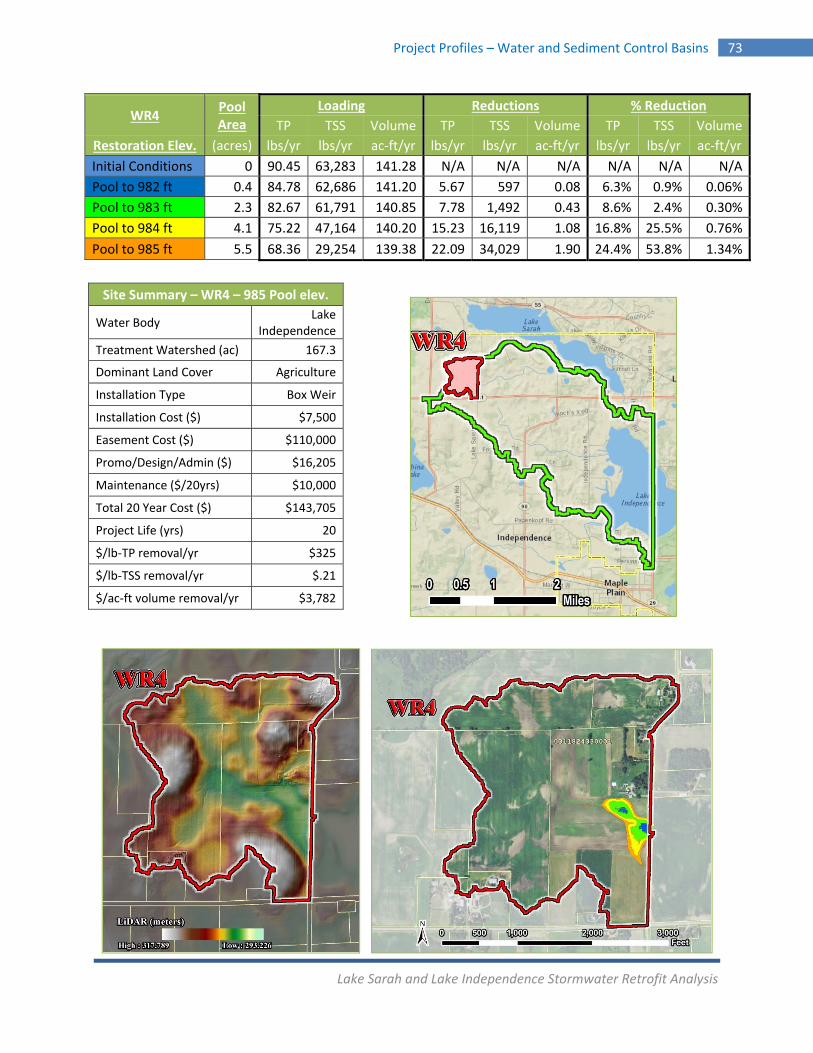
Lake Sarah and Lake Independence Stormwater Retrofit Analysis
Project Profiles – Water and Sediment Control Basins 73
WR4 Pool Area
Loading Reductions % Reduction
TP TSS Volume TP TSS Volume TP TSS Volume
Restoration Elev. (acres) lbs/yr lbs/yr ac‐ft/yr lbs/yr lbs/yr ac‐ft/yr lbs/yr lbs/yr ac‐ft/yr
Initial Conditions 0 90.45 63,283 141.28 N/A N/A N/A N/A N/A N/A
Pool to 982 ft 0.4 84.78 62,686 141.20 5.67 597 0.08 6.3% 0.9% 0.06%
Pool to 983 ft 2.3 82.67 61,791 140.85 7.78 1,492 0.43 8.6% 2.4% 0.30%
Pool to 984 ft 4.1 75.22 47,164 140.20 15.23 16,119 1.08 16.8% 25.5% 0.76%
Pool to 985 ft 5.5 68.36 29,254 139.38 22.09 34,029 1.90 24.4% 53.8% 1.34%
Site Summary – WR4 – 985 Pool elev.
Water Body Lake
Independence
Treatment Watershed (ac) 167.3
Dominant Land Cover Agriculture
Installation Type Box Weir
Installation Cost ($) $7,500
Easement Cost ($) $110,000
Promo/Design/Admin ($) $16,205
Maintenance ($/20yrs) $10,000
Total 20 Year Cost ($) $143,705
Project Life (yrs) 20
$/lb‐TP removal/yr $325
$/lb‐TSS removal/yr $.21
$/ac‐ft volume removal/yr $3,782
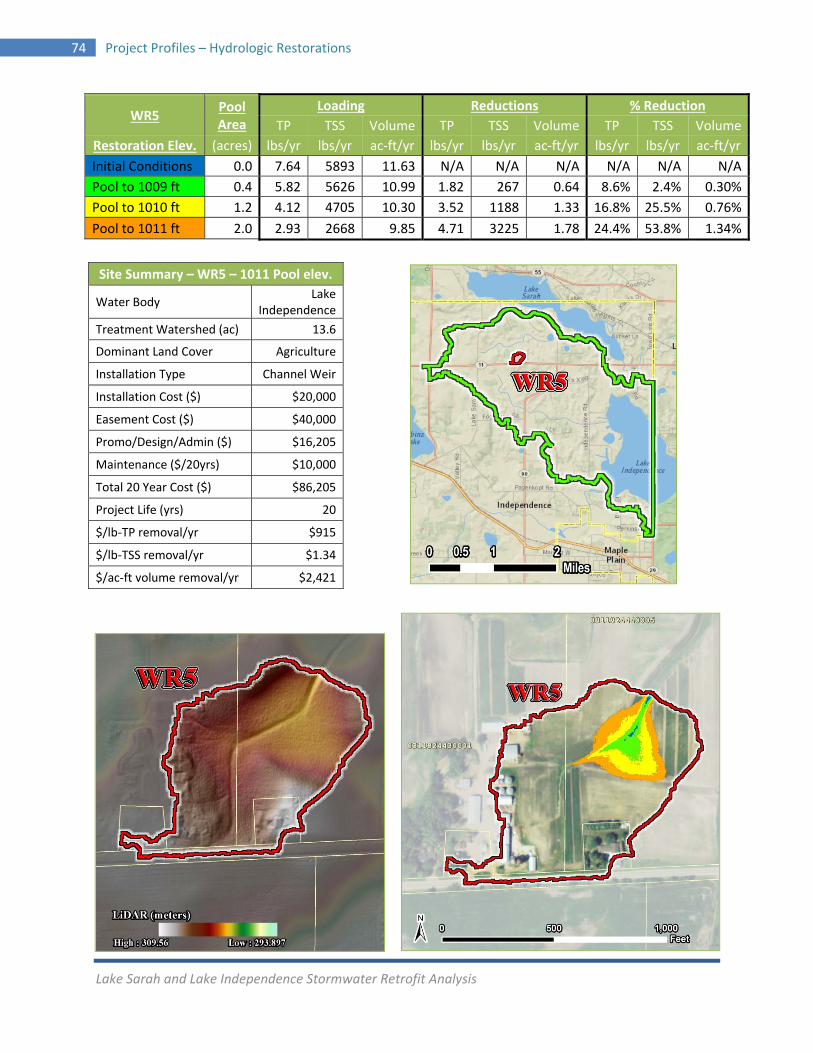
Lake Sarah and Lake Independence Stormwater Retrofit Analysis
74 Project Profiles – Hydrologic Restorations
WR5 Pool Area
Loading Reductions % Reduction
TP TSS Volume TP TSS Volume TP TSS Volume
Restoration Elev. (acres) lbs/yr lbs/yr ac‐ft/yr lbs/yr lbs/yr ac‐ft/yr lbs/yr lbs/yr ac‐ft/yr
Initial Conditions 0.0 7.64 5893 11.63 N/A N/A N/A N/A N/A N/A
Pool to 1009 ft 0.4 5.82 5626 10.99 1.82 267 0.64 8.6% 2.4% 0.30%
Pool to 1010 ft 1.2 4.12 4705 10.30 3.52 1188 1.33 16.8% 25.5% 0.76%
Pool to 1011 ft 2.0 2.93 2668 9.85 4.71 3225 1.78 24.4% 53.8% 1.34%
Site Summary – WR5 – 1011 Pool elev.
Water Body Lake
Independence
Treatment Watershed (ac) 13.6
Dominant Land Cover Agriculture
Installation Type Channel Weir
Installation Cost ($) $20,000
Easement Cost ($) $40,000
Promo/Design/Admin ($) $16,205
Maintenance ($/20yrs) $10,000
Total 20 Year Cost ($) $86,205
Project Life (yrs) 20
$/lb‐TP removal/yr $915
$/lb‐TSS removal/yr $1.34
$/ac‐ft volume removal/yr $2,421
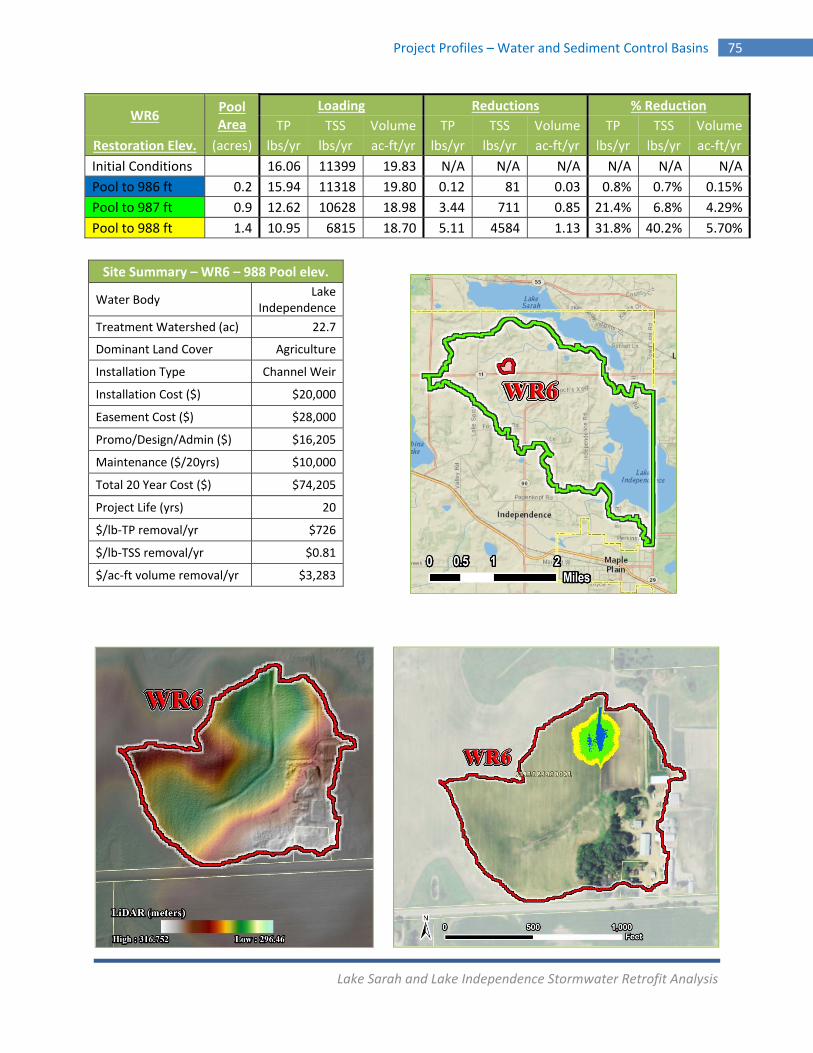
Lake Sarah and Lake Independence Stormwater Retrofit Analysis
Project Profiles – Water and Sediment Control Basins 75
WR6 Pool Area
Loading Reductions % Reduction
TP TSS Volume TP TSS Volume TP TSS Volume
Restoration Elev. (acres) lbs/yr lbs/yr ac‐ft/yr lbs/yr lbs/yr ac‐ft/yr lbs/yr lbs/yr ac‐ft/yr
Initial Conditions 16.06 11399 19.83 N/A N/A N/A N/A N/A N/A
Pool to 986 ft 0.2 15.94 11318 19.80 0.12 81 0.03 0.8% 0.7% 0.15%
Pool to 987 ft 0.9 12.62 10628 18.98 3.44 711 0.85 21.4% 6.8% 4.29%
Pool to 988 ft 1.4 10.95 6815 18.70 5.11 4584 1.13 31.8% 40.2% 5.70%
Site Summary – WR6 – 988 Pool elev.
Water Body Lake
Independence
Treatment Watershed (ac) 22.7
Dominant Land Cover Agriculture
Installation Type Channel Weir
Installation Cost ($) $20,000
Easement Cost ($) $28,000
Promo/Design/Admin ($) $16,205
Maintenance ($/20yrs) $10,000
Total 20 Year Cost ($) $74,205
Project Life (yrs) 20
$/lb‐TP removal/yr $726
$/lb‐TSS removal/yr $0.81
$/ac‐ft volume removal/yr $3,283
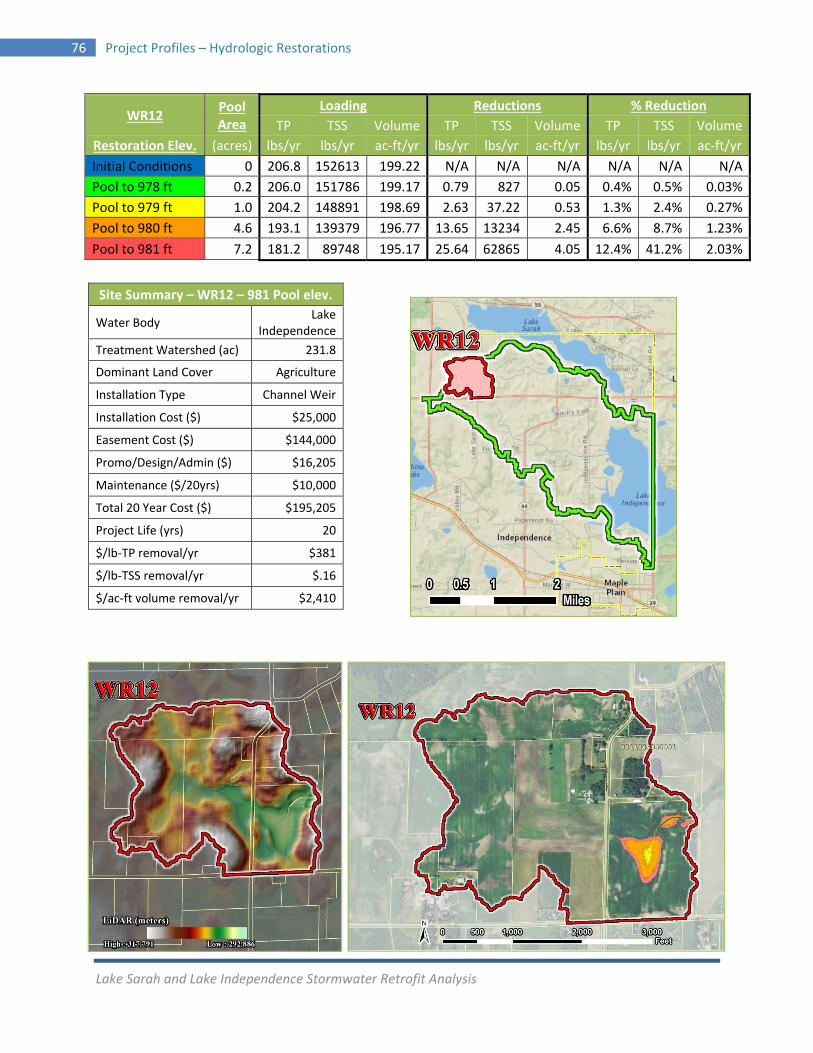
Lake Sarah and Lake Independence Stormwater Retrofit Analysis
76 Project Profiles – Hydrologic Restorations
WR12 Pool Area
Loading Reductions % Reduction
TP TSS Volume TP TSS Volume TP TSS Volume
Restoration Elev. (acres) lbs/yr lbs/yr ac‐ft/yr lbs/yr lbs/yr ac‐ft/yr lbs/yr lbs/yr ac‐ft/yr
Initial Conditions 0 206.8 152613 199.22 N/A N/A N/A N/A N/A N/A
Pool to 978 ft 0.2 206.0 151786 199.17 0.79 827 0.05 0.4% 0.5% 0.03%
Pool to 979 ft 1.0 204.2 148891 198.69 2.63 37.22 0.53 1.3% 2.4% 0.27%
Pool to 980 ft 4.6 193.1 139379 196.77 13.65 13234 2.45 6.6% 8.7% 1.23%
Pool to 981 ft 7.2 181.2 89748 195.17 25.64 62865 4.05 12.4% 41.2% 2.03%
Site Summary – WR12 – 981 Pool elev.
Water Body Lake
Independence
Treatment Watershed (ac) 231.8
Dominant Land Cover Agriculture
Installation Type Channel Weir
Installation Cost ($) $25,000
Easement Cost ($) $144,000
Promo/Design/Admin ($) $16,205
Maintenance ($/20yrs) $10,000
Total 20 Year Cost ($) $195,205
Project Life (yrs) 20
$/lb‐TP removal/yr $381
$/lb‐TSS removal/yr $.16
$/ac‐ft volume removal/yr $2,410
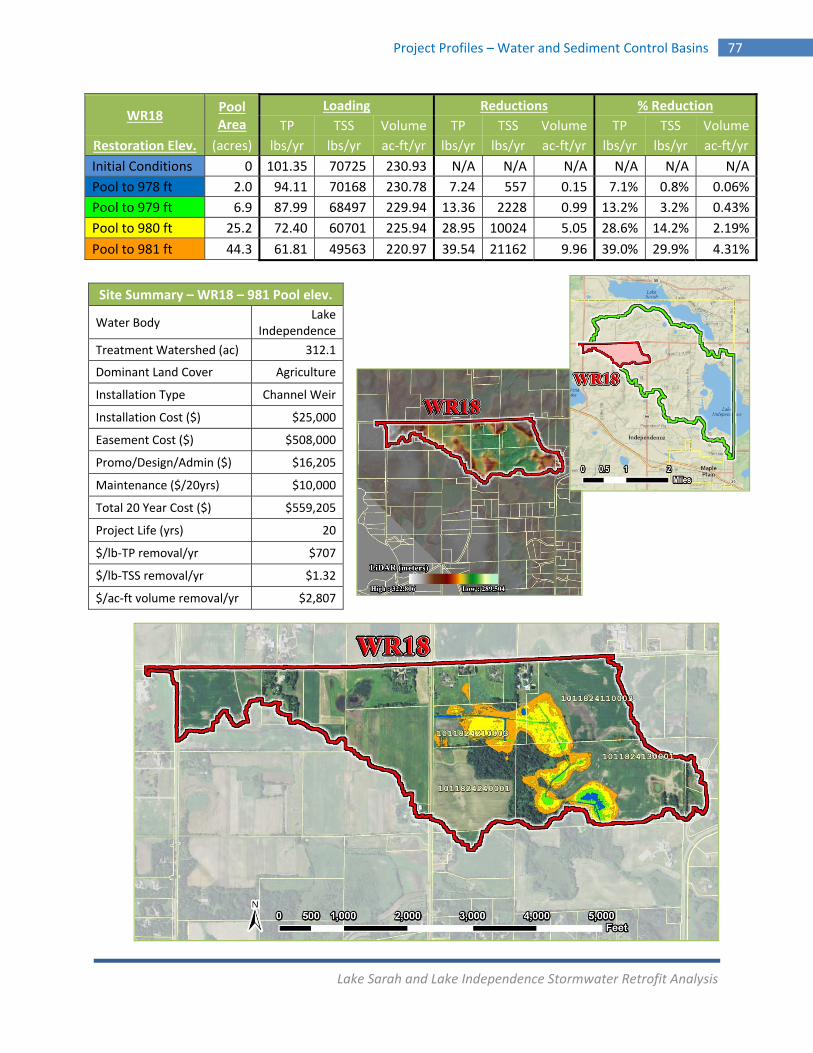
Lake Sarah and Lake Independence Stormwater Retrofit Analysis
Project Profiles – Water and Sediment Control Basins 77
WR18 Pool Area
Loading Reductions % Reduction
TP TSS Volume TP TSS Volume TP TSS Volume
Restoration Elev. (acres) lbs/yr lbs/yr ac‐ft/yr lbs/yr lbs/yr ac‐ft/yr lbs/yr lbs/yr ac‐ft/yr
Initial Conditions 0 101.35 70725 230.93 N/A N/A N/A N/A N/A N/A
Pool to 978 ft 2.0 94.11 70168 230.78 7.24 557 0.15 7.1% 0.8% 0.06%
Pool to 979 ft 6.9 87.99 68497 229.94 13.36 2228 0.99 13.2% 3.2% 0.43%
Pool to 980 ft 25.2 72.40 60701 225.94 28.95 10024 5.05 28.6% 14.2% 2.19%
Pool to 981 ft 44.3 61.81 49563 220.97 39.54 21162 9.96 39.0% 29.9% 4.31%
Site Summary – WR18 – 981 Pool elev.
Water Body Lake
Independence
Treatment Watershed (ac) 312.1
Dominant Land Cover Agriculture
Installation Type Channel Weir
Installation Cost ($) $25,000
Easement Cost ($) $508,000
Promo/Design/Admin ($) $16,205
Maintenance ($/20yrs) $10,000
Total 20 Year Cost ($) $559,205
Project Life (yrs) 20
$/lb‐TP removal/yr $707
$/lb‐TSS removal/yr $1.32
$/ac‐ft volume removal/yr $2,807
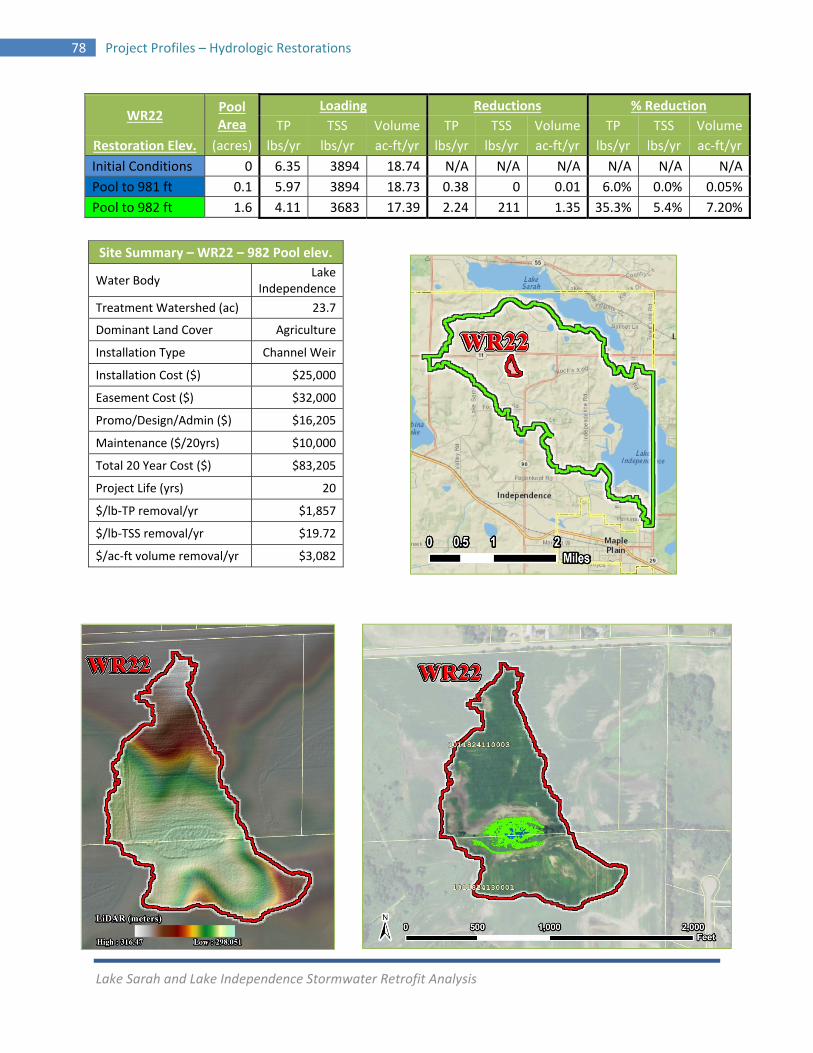
Lake Sarah and Lake Independence Stormwater Retrofit Analysis
78 Project Profiles – Hydrologic Restorations
WR22 Pool Area
Loading Reductions % Reduction
TP TSS Volume TP TSS Volume TP TSS Volume
Restoration Elev. (acres) lbs/yr lbs/yr ac‐ft/yr lbs/yr lbs/yr ac‐ft/yr lbs/yr lbs/yr ac‐ft/yr
Initial Conditions 0 6.35 3894 18.74 N/A N/A N/A N/A N/A N/A
Pool to 981 ft 0.1 5.97 3894 18.73 0.38 0 0.01 6.0% 0.0% 0.05%
Pool to 982 ft 1.6 4.11 3683 17.39 2.24 211 1.35 35.3% 5.4% 7.20%
Site Summary – WR22 – 982 Pool elev.
Water Body Lake
Independence
Treatment Watershed (ac) 23.7
Dominant Land Cover Agriculture
Installation Type Channel Weir
Installation Cost ($) $25,000
Easement Cost ($) $32,000
Promo/Design/Admin ($) $16,205
Maintenance ($/20yrs) $10,000
Total 20 Year Cost ($) $83,205
Project Life (yrs) 20
$/lb‐TP removal/yr $1,857
$/lb‐TSS removal/yr $19.72
$/ac‐ft volume removal/yr $3,082
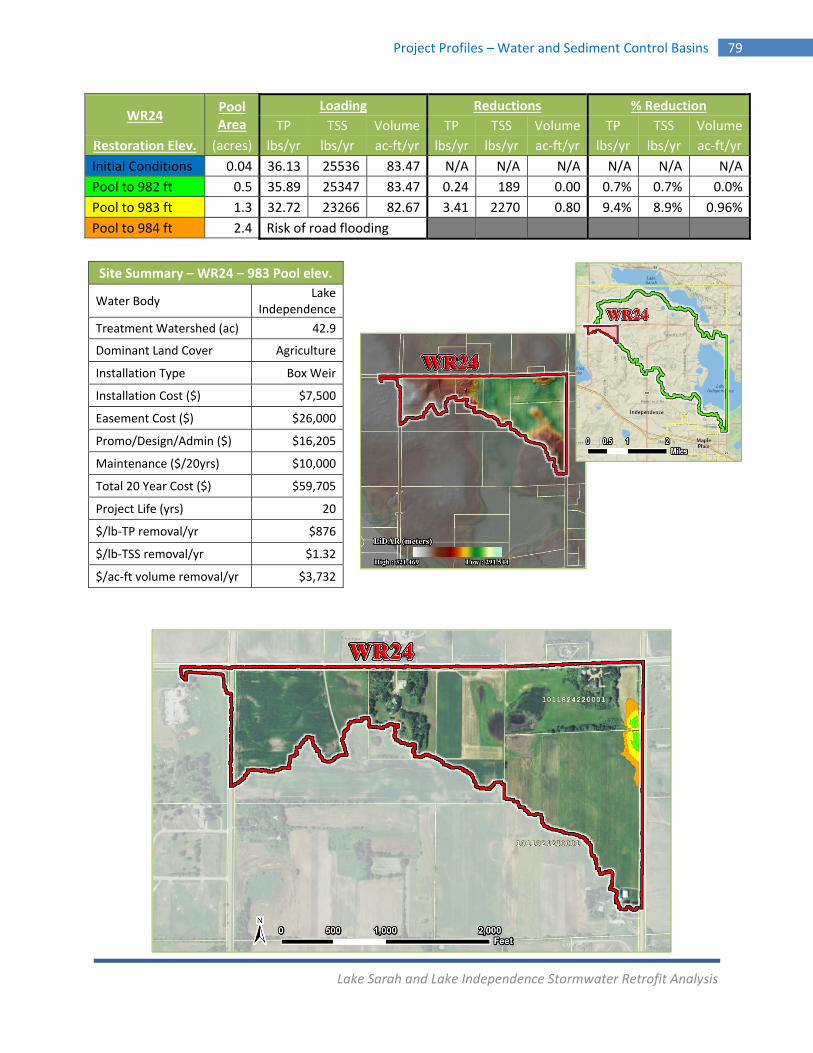
Lake Sarah and Lake Independence Stormwater Retrofit Analysis
Project Profiles – Water and Sediment Control Basins 79
WR24 Pool Area
Loading Reductions % Reduction
TP TSS Volume TP TSS Volume TP TSS Volume
Restoration Elev. (acres) lbs/yr lbs/yr ac‐ft/yr lbs/yr lbs/yr ac‐ft/yr lbs/yr lbs/yr ac‐ft/yr
Initial Conditions 0.04 36.13 25536 83.47 N/A N/A N/A N/A N/A N/A
Pool to 982 ft 0.5 35.89 25347 83.47 0.24 189 0.00 0.7% 0.7% 0.0%
Pool to 983 ft 1.3 32.72 23266 82.67 3.41 2270 0.80 9.4% 8.9% 0.96%
Pool to 984 ft 2.4 Risk of road flooding
Site Summary – WR24 – 983 Pool elev.
Water Body Lake
Independence
Treatment Watershed (ac) 42.9
Dominant Land Cover Agriculture
Installation Type Box Weir
Installation Cost ($) $7,500
Easement Cost ($) $26,000
Promo/Design/Admin ($) $16,205
Maintenance ($/20yrs) $10,000
Total 20 Year Cost ($) $59,705
Project Life (yrs) 20
$/lb‐TP removal/yr $876
$/lb‐TSS removal/yr $1.32
$/ac‐ft volume removal/yr $3,732
Lake Sarah and Lake Independence Stormwater Retrofit Analysis
80 Project Profiles – Hydrologic Restorations
WR75 Pool Area
Loading Reductions % Reduction
TP TSS Volume TP TSS Volume TP TSS Volume
Restoration Elev. (acres) lbs/yr lbs/yr ac‐ft/yr lbs/yr lbs/yr ac‐ft/yr lbs/yr lbs/yr ac‐ft/yr
Initial Conditions 0.0 24.94 25155 35.32 N/A N/A N/A N/A N/A N/A
Pool to 987 ft 0.5 23.07 24795 34.84 1.87 360 0.48 7.5% 1.4% 1.4%
Pool to 988 ft 0.9 19.65 16243 34.39 5.29 8912 0.93 21.2% 35.4% 2.6%
Pool to 989 ft 1.3 16.61 9415 33.47 8.33 15740 1.85 33.4% 62.6% 5.2%
Pool to 990 ft 2.2 15.60 8337 32.74 9.34 16818 2.58 37.4% 66.9% 7.3%
Site Summary – WR75 – 990 Pool elev.
Water Body Lake Sarah
Treatment Watershed (ac) 40.3
Dominant Land Cover Agriculture
Installation Type Box Weir
Installation Cost ($) $7,500
Easement Cost ($) $39,500
Promo/Design/Admin ($) $16,205
Maintenance ($/20yrs) $10,000
Total 20 Year Cost ($) $73,205
Project Life (yrs) 20
$/lb‐TP removal/yr $392
$/lb‐TSS removal/yr $0.22
$/ac‐ft volume removal/yr $1,419
Lake Sarah and Lake Independence Stormwater Retrofit Analysis
Project Profiles – Water and Sediment Control Basins 81
WR76 Pool Area
Loading Reductions % Reduction
TP TSS Volume TP TSS Volume TP TSS Volume
Restoration Elev. (acres) lbs/yr lbs/yr ac‐ft/yr lbs/yr lbs/yr ac‐ft/yr lbs/yr lbs/yr ac‐ft/yr
Initial Condition 0.12 9.81 11777 18.24 N/A N/A N/A N/A N/A N/A
Pool to 993 ft 0.2 8.98 10892 18.21 0.83 885 0.03 8.5% 7.5% 0.2%
Pool to 994 ft 0.6 7.28 8236 17.78 2.53 3541 0.46 25.8% 30.1% 2.5%
Pool to 995 ft 1.7 5.18 4234 16.49 4.63 7543 1.75 47.2% 47.2% 9.6%
Site Summary – WR76 – 987 Pool elev.
Water Body Lake Sarah
Treatment Watershed (ac) 21.6
Dominant Land Cover Agriculture
Installation Type Box Weir
Installation Cost ($) $7,500
Easement Cost ($) $40,000
Promo/Design/Admin ($) $16,205
Maintenance ($/20yrs) $10,000
Total 20 Year Cost ($) $73,705
Project Life (yrs) 20
$/lb‐TP removal/yr $796
$/lb‐TSS removal/yr $0.49
$/ac‐ft volume removal/yr $2,106
Lake Sarah and Lake Independence Stormwater Retrofit Analysis
82 Project Profiles – Hydrologic Restorations
WR82 Pool Area
Loading Reductions % Reduction
TP TSS Volume TP TSS Volume TP TSS Volume
Restoration Elev. (acres) lbs/yr lbs/yr ac‐ft/yr lbs/yr lbs/yr ac‐ft/yr lbs/yr lbs/yr ac‐ft/yr
Initial Conditions 0.3 32.11 23746 61.69 N/A N/A N/A N/A N/A N/A
Pool to 985 ft 0.7 30.36 22127 61.12 1.75 1619 0.57 5.5% 6.8% 0.92%
Pool to 986 ft 3.6 23.21 20373 58.61 8.90 3373 3.08 27.7% 14.2% 4.99%
Pool to 987 ft 8.1 16.46 17945 55.86 15.65 5801 5.83 48.7% 24.4% 9.45%
Site Summary – WR82 – 987 Pool elev.
Water Body Lake
Independence
Treatment Watershed (ac) 75.6
Dominant Land Cover Agriculture
Installation Type Channel Weir
Installation Cost ($) $25,000
Easement Cost ($) $157,500
Promo/Design/Admin ($) $16,205
Maintenance ($/20yrs) $10,000
Total 20 Year Cost ($) $208,705
Project Life (yrs) 20
$/lb‐TP removal/yr $667
$/lb‐TSS removal/yr $1.80
$/ac‐ft volume removal/yr $1,790
Lake Sarah and Lake Independence Stormwater Retrofit Analysis
Project Profiles – Water and Sediment Control Basins 83
WR83 Pool Area
Loading Reductions % Reduction
TP TSS Volume TP TSS Volume TP TSS Volume
Restoration Elev. (acres) lbs/yr lbs/yr ac‐ft/yr lbs/yr lbs/yr ac‐ft/yr lbs/yr lbs/yr ac‐ft/yr
Initial Conditions 0 50.76 39001 125.09 N/A N/A N/A N/A N/A N/A
Pool to 978 ft 0.7 49.83 38691 125.09 0.93 310 0.00 1.8% 0.8% 0.00%
Pool to 979 ft 1.1 49.20 38382 124.98 1.56 619 0.11 3.1% 1.6% 0.09%
Pool to 980 ft 5.4 45.19 37762 124.76 5.57 1239 0.33 11.0% 3.2% 0.26%
Pool to 981 ft Too many parcels involved
Site Summary – WR83 – 980 Pool elev.
Water Body Lake
Independence
Treatment Watershed (ac) 173.5
Dominant Land Cover Agriculture
Installation Type Channel Weir
Installation Cost ($) $25,000
Easement Cost ($) $97,500
Promo/Design/Admin ($) $16,205
Maintenance ($/20yrs) $10,000
Total 20 Year Cost ($) $148,705
Project Life (yrs) 20
$/lb‐TP removal/yr $1,335
$/lb‐TSS removal/yr $6.00
$/ac‐ft volume removal/yr $22,531
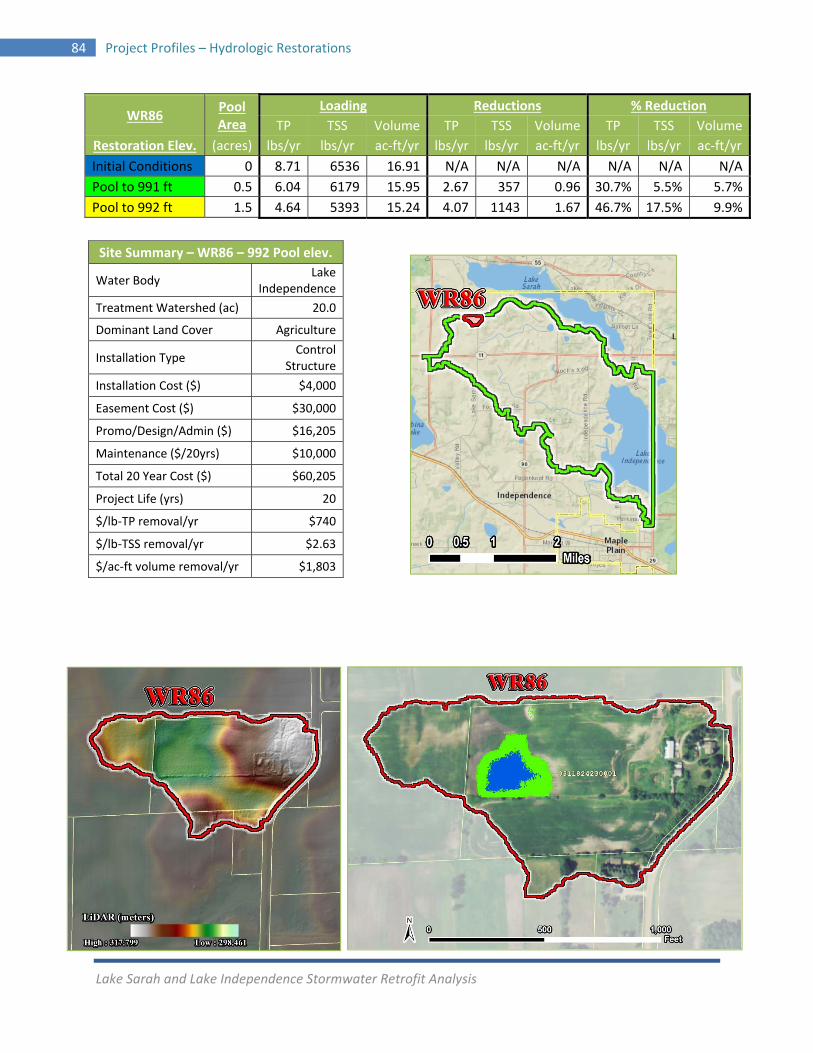
Lake Sarah and Lake Independence Stormwater Retrofit Analysis
84 Project Profiles – Hydrologic Restorations
WR86 Pool Area
Loading Reductions % Reduction
TP TSS Volume TP TSS Volume TP TSS Volume
Restoration Elev. (acres) lbs/yr lbs/yr ac‐ft/yr lbs/yr lbs/yr ac‐ft/yr lbs/yr lbs/yr ac‐ft/yr
Initial Conditions 0 8.71 6536 16.91 N/A N/A N/A N/A N/A N/A
Pool to 991 ft 0.5 6.04 6179 15.95 2.67 357 0.96 30.7% 5.5% 5.7%
Pool to 992 ft 1.5 4.64 5393 15.24 4.07 1143 1.67 46.7% 17.5% 9.9%
Site Summary – WR86 – 992 Pool elev.
Water Body Lake
Independence
Treatment Watershed (ac) 20.0
Dominant Land Cover Agriculture
Installation Type Control
Structure
Installation Cost ($) $4,000
Easement Cost ($) $30,000
Promo/Design/Admin ($) $16,205
Maintenance ($/20yrs) $10,000
Total 20 Year Cost ($) $60,205
Project Life (yrs) 20
$/lb‐TP removal/yr $740
$/lb‐TSS removal/yr $2.63
$/ac‐ft volume removal/yr $1,803
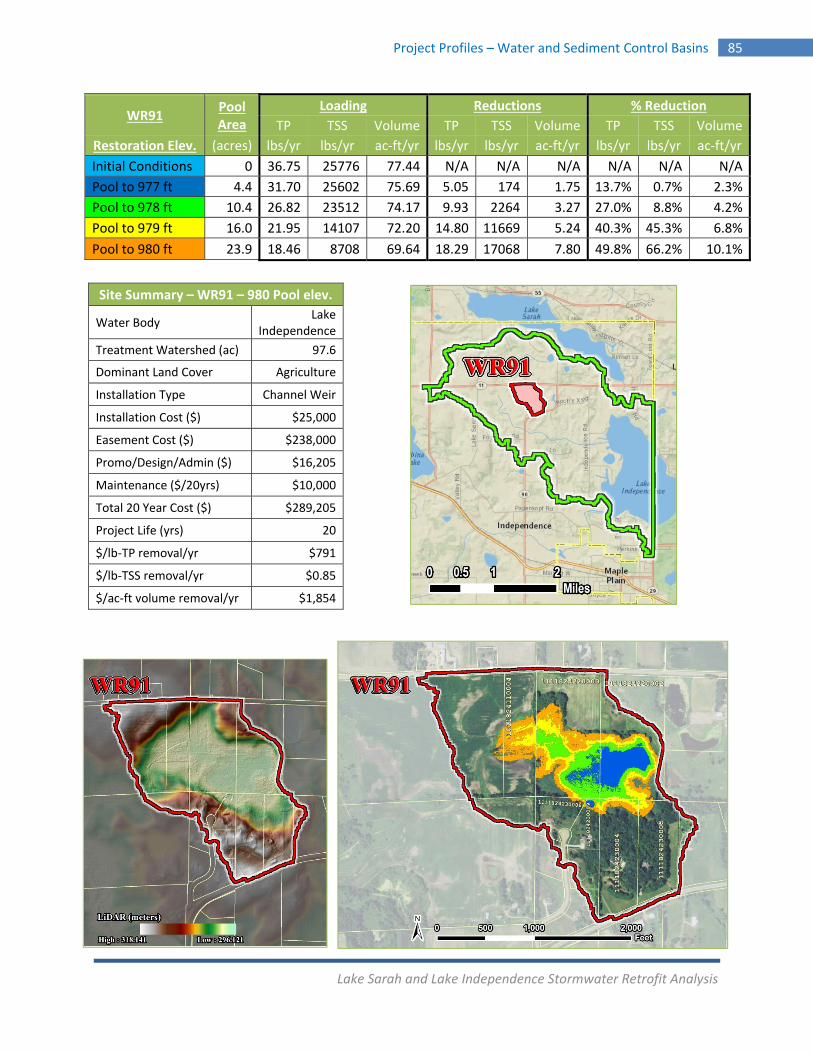
Lake Sarah and Lake Independence Stormwater Retrofit Analysis
Project Profiles – Water and Sediment Control Basins 85
WR91 Pool Area
Loading Reductions % Reduction
TP TSS Volume TP TSS Volume TP TSS Volume
Restoration Elev. (acres) lbs/yr lbs/yr ac‐ft/yr lbs/yr lbs/yr ac‐ft/yr lbs/yr lbs/yr ac‐ft/yr
Initial Conditions 0 36.75 25776 77.44 N/A N/A N/A N/A N/A N/A
Pool to 977 ft 4.4 31.70 25602 75.69 5.05 174 1.75 13.7% 0.7% 2.3%
Pool to 978 ft 10.4 26.82 23512 74.17 9.93 2264 3.27 27.0% 8.8% 4.2%
Pool to 979 ft 16.0 21.95 14107 72.20 14.80 11669 5.24 40.3% 45.3% 6.8%
Pool to 980 ft 23.9 18.46 8708 69.64 18.29 17068 7.80 49.8% 66.2% 10.1%
Site Summary – WR91 – 980 Pool elev.
Water Body Lake
Independence
Treatment Watershed (ac) 97.6
Dominant Land Cover Agriculture
Installation Type Channel Weir
Installation Cost ($) $25,000
Easement Cost ($) $238,000
Promo/Design/Admin ($) $16,205
Maintenance ($/20yrs) $10,000
Total 20 Year Cost ($) $289,205
Project Life (yrs) 20
$/lb‐TP removal/yr $791
$/lb‐TSS removal/yr $0.85
$/ac‐ft volume removal/yr $1,854
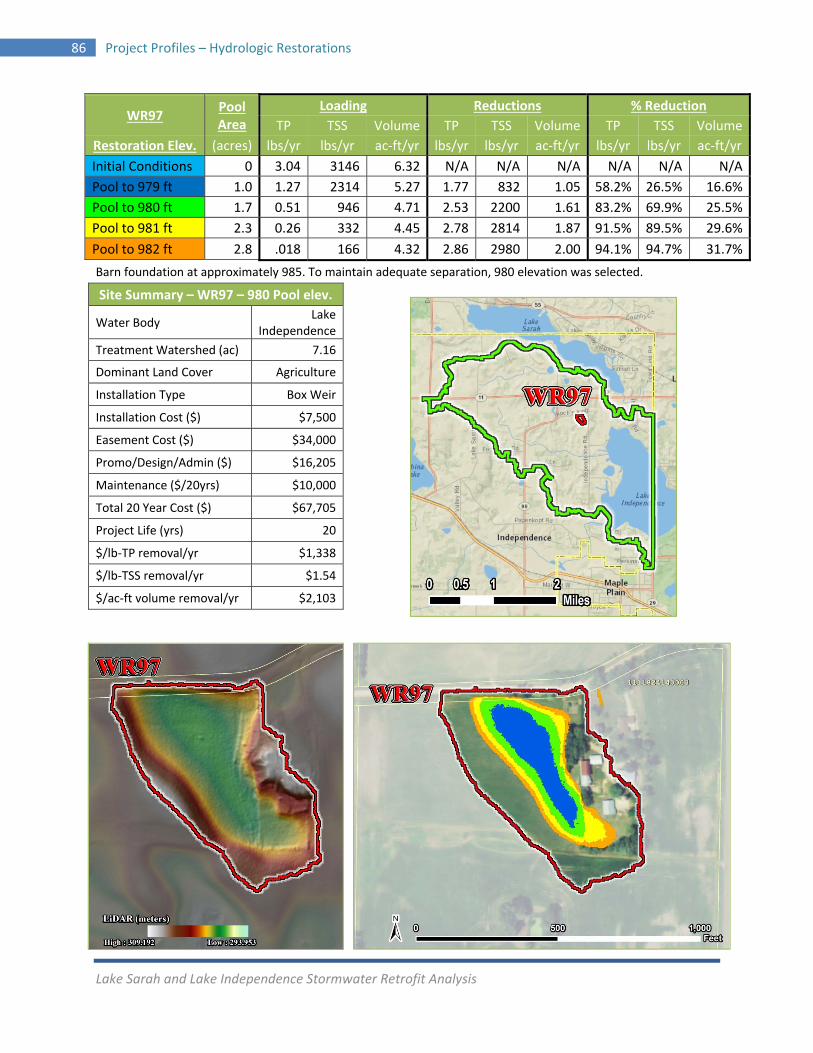
Lake Sarah and Lake Independence Stormwater Retrofit Analysis
86 Project Profiles – Hydrologic Restorations
Barn foundation at approximately 985. To maintain adequate separation, 980 elevation was selected.
WR97 Pool Area
Loading Reductions % Reduction
TP TSS Volume TP TSS Volume TP TSS Volume
Restoration Elev. (acres) lbs/yr lbs/yr ac‐ft/yr lbs/yr lbs/yr ac‐ft/yr lbs/yr lbs/yr ac‐ft/yr
Initial Conditions 0 3.04 3146 6.32 N/A N/A N/A N/A N/A N/A
Pool to 979 ft 1.0 1.27 2314 5.27 1.77 832 1.05 58.2% 26.5% 16.6%
Pool to 980 ft 1.7 0.51 946 4.71 2.53 2200 1.61 83.2% 69.9% 25.5%
Pool to 981 ft 2.3 0.26 332 4.45 2.78 2814 1.87 91.5% 89.5% 29.6%
Pool to 982 ft 2.8 .018 166 4.32 2.86 2980 2.00 94.1% 94.7% 31.7%
Site Summary – WR97 – 980 Pool elev.
Water Body Lake
Independence
Treatment Watershed (ac) 7.16
Dominant Land Cover Agriculture
Installation Type Box Weir
Installation Cost ($) $7,500
Easement Cost ($) $34,000
Promo/Design/Admin ($) $16,205
Maintenance ($/20yrs) $10,000
Total 20 Year Cost ($) $67,705
Project Life (yrs) 20
$/lb‐TP removal/yr $1,338
$/lb‐TSS removal/yr $1.54
$/ac‐ft volume removal/yr $2,103
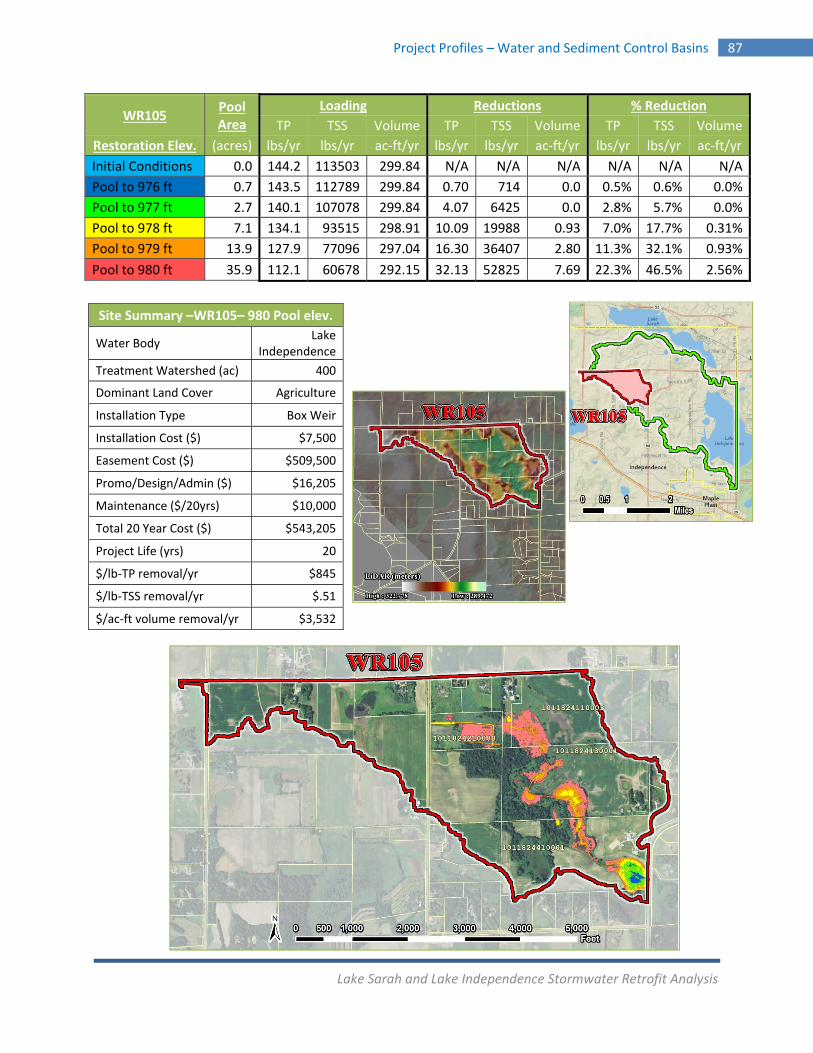
Lake Sarah and Lake Independence Stormwater Retrofit Analysis
Project Profiles – Water and Sediment Control Basins 87
WR105 Pool Area
Loading Reductions % Reduction
TP TSS Volume TP TSS Volume TP TSS Volume
Restoration Elev. (acres) lbs/yr lbs/yr ac‐ft/yr lbs/yr lbs/yr ac‐ft/yr lbs/yr lbs/yr ac‐ft/yr
Initial Conditions 0.0 144.2 113503 299.84 N/A N/A N/A N/A N/A N/A
Pool to 976 ft 0.7 143.5 112789 299.84 0.70 714 0.0 0.5% 0.6% 0.0%
Pool to 977 ft 2.7 140.1 107078 299.84 4.07 6425 0.0 2.8% 5.7% 0.0%
Pool to 978 ft 7.1 134.1 93515 298.91 10.09 19988 0.93 7.0% 17.7% 0.31%
Pool to 979 ft 13.9 127.9 77096 297.04 16.30 36407 2.80 11.3% 32.1% 0.93%
Pool to 980 ft 35.9 112.1 60678 292.15 32.13 52825 7.69 22.3% 46.5% 2.56%
Site Summary –WR105– 980 Pool elev.
Water Body Lake
Independence
Treatment Watershed (ac) 400
Dominant Land Cover Agriculture
Installation Type Box Weir
Installation Cost ($) $7,500
Easement Cost ($) $509,500
Promo/Design/Admin ($) $16,205
Maintenance ($/20yrs) $10,000
Total 20 Year Cost ($) $543,205
Project Life (yrs) 20
$/lb‐TP removal/yr $845
$/lb‐TSS removal/yr $.51
$/ac‐ft volume removal/yr $3,532
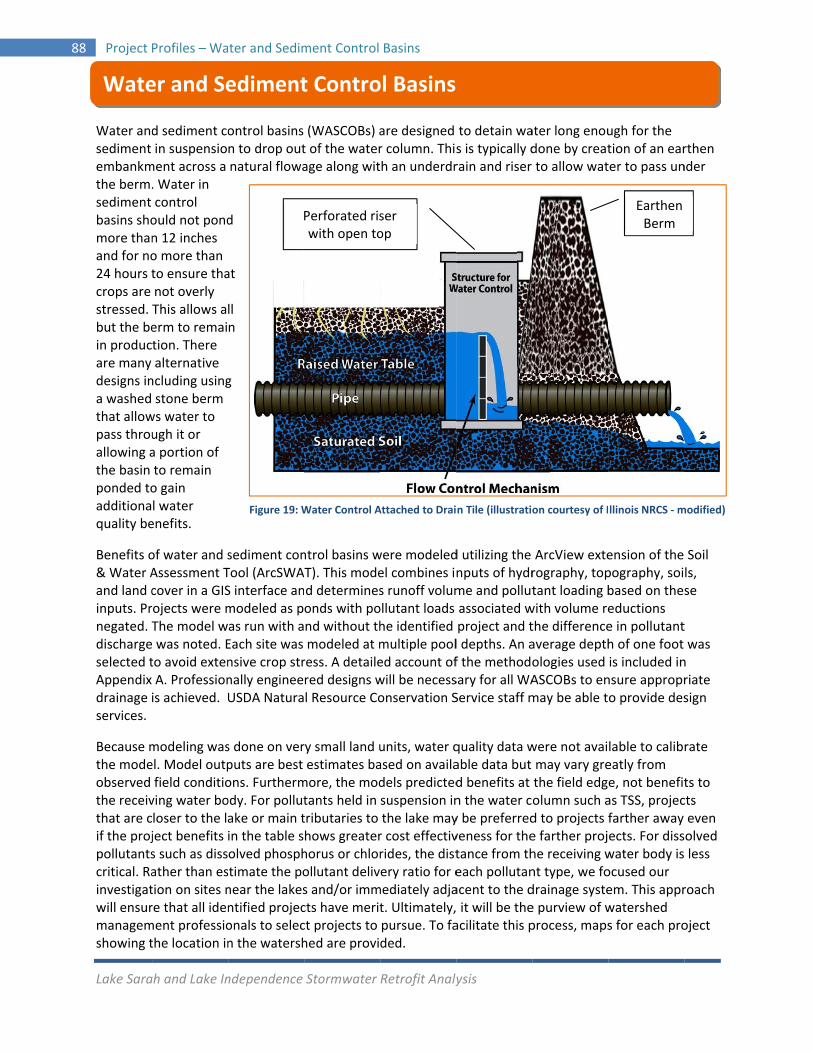
8
Lake Sara
88 Project
Water andsediment embankmthe berm.sediment basins shomore thanand for no24 hours tcrops are stressed. but the bein producare many designs ina washed that allowpass throuallowing athe basin ponded toadditionaquality be
Benefits o& Water Aand land cinputs. Prnegated. Tdischargeselected tAppendix drainage iservices.
Because mthe modeobserved the receivthat are cif the projpollutantscritical. Rainvestigatwill ensurmanagemshowing t
Wate
ah and Lake In
Profiles – Wa
d sediment coin suspensio
ment across a . Water in control ould not pondn 12 inches o more than to ensure thanot overly This allows aerm to remaition. There alternative
ncluding usingstone berm
ws water to ugh it or a portion of to remain o gain l water enefits.
of water and sAssessment Tcover in a GISrojects were mThe model w was noted. Eto avoid extenA. Professionis achieved. U
modeling wasel. Model outpfield conditioving water boloser to the laject benefits s such as dissather than estion on sites nre that all idenment professiothe location in
er and Se
ndependence
ter and Sedim
ontrol basins n to drop outnatural flowa
d
at
ll n
g
sediment conTool (ArcSWAS interface anmodeled as pas run with aEach site was nsive crop strnally engineeUSDA Natura
s done on verputs are best ons. Furthermody. For pollutake or main tin the table solved phosphstimate the ponear the lakesntified projeconals to selecn the watersh
ediment
Figure 19: W
Stormwater
ment Control
(WASCOBs) at of the waterage along wit
ntrol basins wT). This moded determinesonds with pond without thmodeled at mress. A detailered designs wl Resource Co
ry small land uestimates ba
more, the modtants held in tributaries to hows greaterhorus or chlorollutant delivs and/or immcts have meritct projects to hed are provi
t Contro
Water Control A
Perforated riswith open to
Retrofit Analy
Basins
are designed r column. Thish an underdr
were modeledel combines ins runoff volumollutant loads he identified multiple pooled account ofwill be necessonservation S
units, water qased on availadels predictedsuspension inthe lake mayr cost effectivrides, the distery ratio for e
mediately adjat. Ultimately,pursue. To faded.
ol Basins
Attached to Drai
ser op
ysis
to detain was is typically drain and riser
d utilizing the nputs of hydrme and pollutassociated wproject and tl depths. An af the methodosary for all WAService staff m
quality data wable data but d benefits at n the water cy be preferredveness for thetance from theach pollutanacent to the d it will be theacilitate this p
n Tile (illustratio
ater long enoudone by creatto allow wat
ArcView exterography, toptant loading bwith volume rethe differenceaverage depthologies used ASCOBs to enmay be able t
were not avaimay vary grethe field edgolumn such ad to projects fe farther projhe receiving wnt type, we fodrainage systee purview of wprocess, maps
on courtesy of I
ugh for the tion of an earter to pass un
ension of the pography, soibased on theeductions e in pollutanth of one foot is included innsure appropro provide des
lable to calibeatly from e, not benefitas TSS, projecfarther away ects. For disswater body isocused our em. This apprwatershed s for each pro
llinois NRCS ‐ m
Earthen Berm
rthen nder
Soil ls, se
t was
n riate sign
rate
ts to cts even olved less
roach
oject
modified)
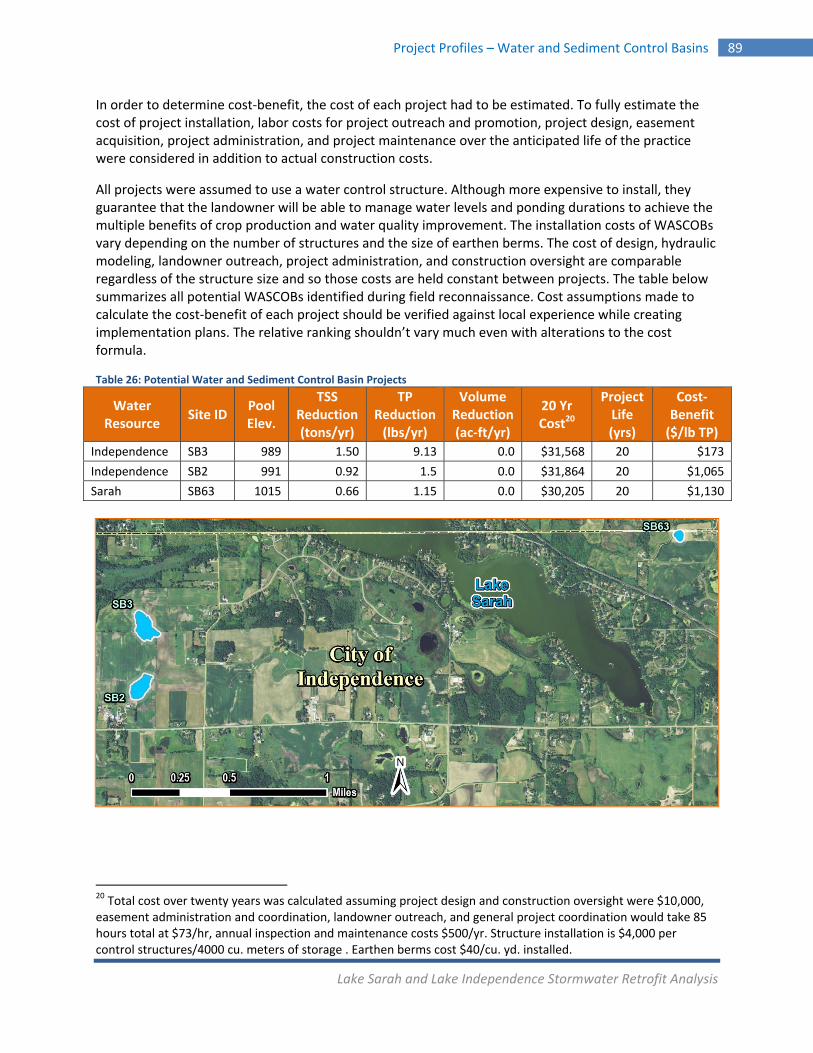
Lake Sarah and Lake Independence Stormwater Retrofit Analysis
Project Profiles – Water and Sediment Control Basins 89
In order to determine cost‐benefit, the cost of each project had to be estimated. To fully estimate the cost of project installation, labor costs for project outreach and promotion, project design, easement acquisition, project administration, and project maintenance over the anticipated life of the practice were considered in addition to actual construction costs.
All projects were assumed to use a water control structure. Although more expensive to install, they guarantee that the landowner will be able to manage water levels and ponding durations to achieve the multiple benefits of crop production and water quality improvement. The installation costs of WASCOBs vary depending on the number of structures and the size of earthen berms. The cost of design, hydraulic modeling, landowner outreach, project administration, and construction oversight are comparable regardless of the structure size and so those costs are held constant between projects. The table below summarizes all potential WASCOBs identified during field reconnaissance. Cost assumptions made to calculate the cost‐benefit of each project should be verified against local experience while creating implementation plans. The relative ranking shouldn’t vary much even with alterations to the cost formula.
Table 26: Potential Water and Sediment Control Basin Projects
20 Total cost over twenty years was calculated assuming project design and construction oversight were $10,000, easement administration and coordination, landowner outreach, and general project coordination would take 85 hours total at $73/hr, annual inspection and maintenance costs $500/yr. Structure installation is $4,000 per control structures/4000 cu. meters of storage . Earthen berms cost $40/cu. yd. installed.
Water Resource
Site ID Pool Elev.
TSS Reduction (tons/yr)
TP Reduction(lbs/yr)
Volume Reduction(ac‐ft/yr)
20 Yr Cost20
Project Life (yrs)
Cost‐Benefit ($/lb TP)
Independence SB3 989 1.50 9.13 0.0 $31,568 20 $173
Independence SB2 991 0.92 1.5 0.0 $31,864 20 $1,065
Sarah SB63 1015 0.66 1.15 0.0 $30,205 20 $1,130
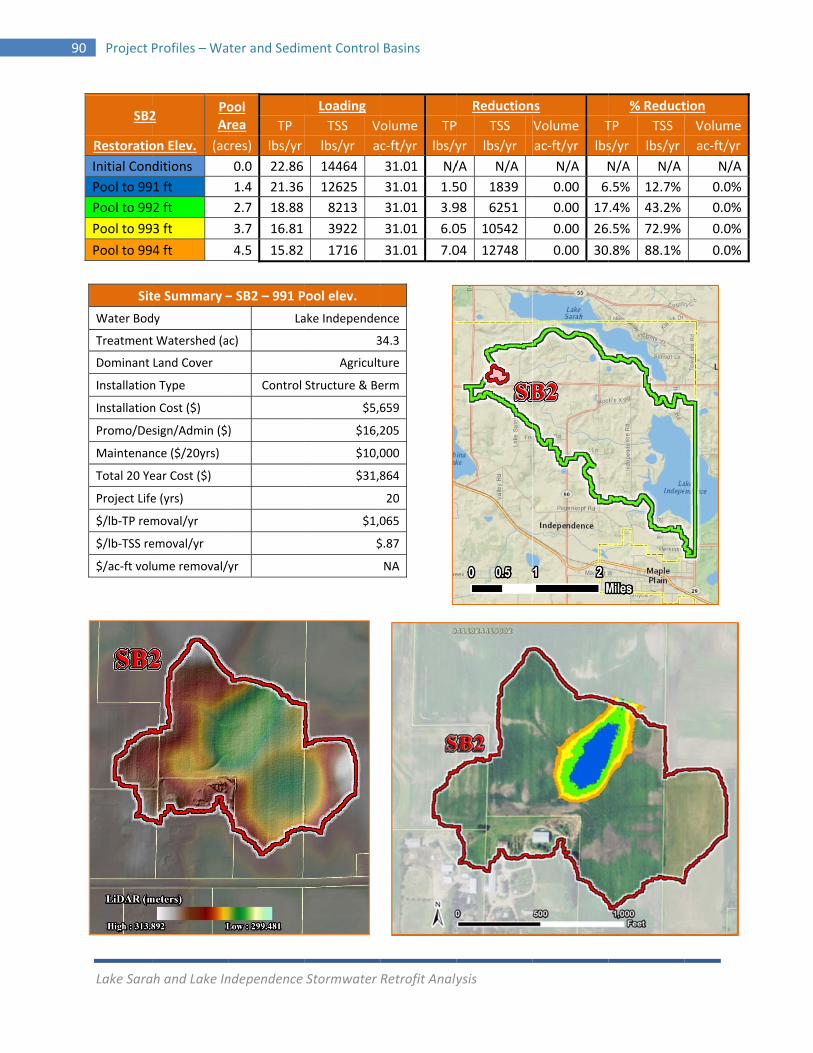
9
Lake Sara
90 Project
SB2
Restoratio
Initial Con
Pool to 99
Pool to 99
Pool to 99
Pool to 99
Sit
Water Bod
Treatment
Dominant
Installation
Installation
Promo/De
Maintenan
Total 20 Ye
Project Life
$/lb‐TP rem
$/lb‐TSS re
$/ac‐ft vol
ah and Lake In
Profiles – Wa
2 PoAr
on Elev. (ac
ditions
1 ft
2 ft
3 ft
4 ft
te Summary –
dy
t Watershed (a
Land Cover
n Type
n Cost ($)
sign/Admin ($
nce ($/20yrs)
ear Cost ($)
e (yrs)
moval/yr
emoval/yr
ume removal/
ndependence
ter and Sedim
ool rea TP
cres) lbs/yr
0.0 22.86
1.4 21.36
2.7 18.88
3.7 16.81
4.5 15.82
– SB2 – 991 P
La
c)
Control
)
yr
Stormwater
ment Control
Loading
TSS V
lbs/yr a
14464
12625
8213
3922
1716
Pool elev.
ake Independe
3
Agricult
Structure & Be
$5,6
$16,2
$10,0
$31,8
$1,0
$
Retrofit Analy
Basins
olume TP
c‐ft/yr lbs/y
31.01 N/
31.01 1.5
31.01 3.9
31.01 6.0
31.01 7.0
nce
34.3
ture
erm
659
205
000
864
20
065
$.87
NA
ysis
Reduction
P TSS
yr lbs/yr
/A N/A
50 1839
98 6251
05 10542
04 12748
ns
Volume T
ac‐ft/yr lbs
N/A N
0.00 6
0.00 17
0.00 26
0.00 30
% Reduct
TP TSS
s/yr lbs/yr
N/A N/A
.5% 12.7%
.4% 43.2%
.5% 72.9%
.8% 88.1%
tion
Volume
ac‐ft/yr
N/A
0.0%
0.0%
0.0%
0.0%
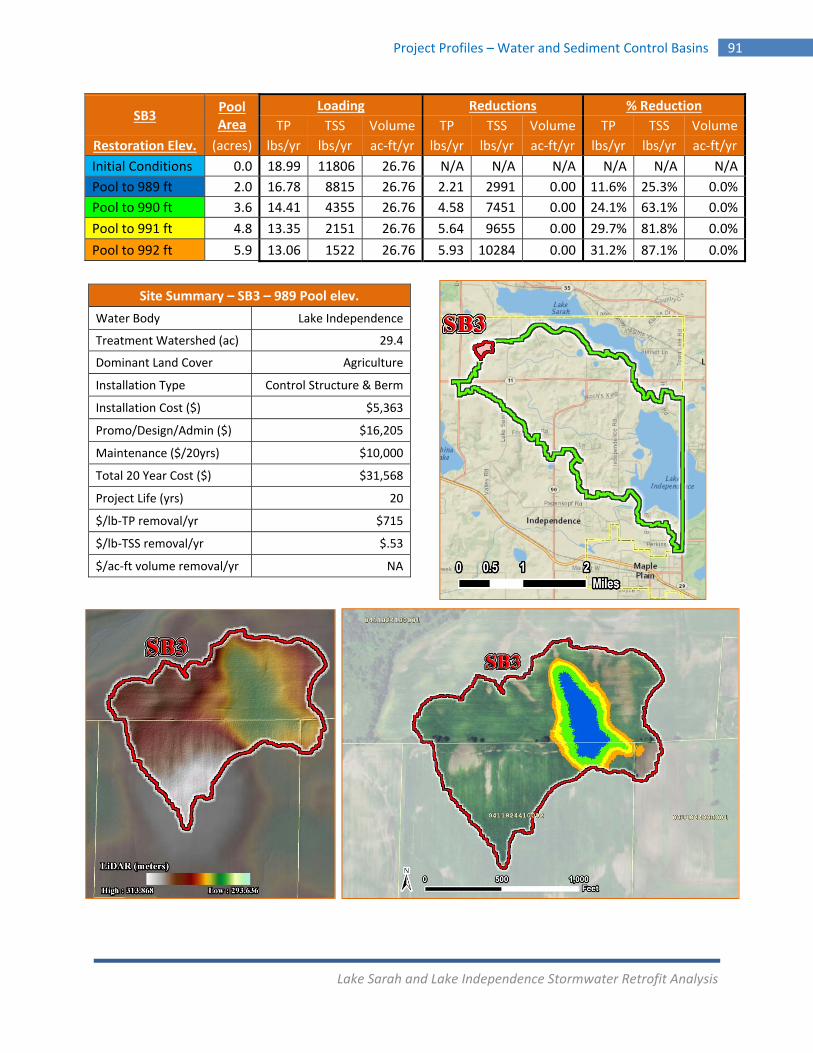
Lake Sarah and Lake Independence Stormwater Retrofit Analysis
Project Profiles – Water and Sediment Control Basins 91
SB3 Pool Area
Loading Reductions % Reduction
TP TSS Volume TP TSS Volume TP TSS Volume
Restoration Elev. (acres) lbs/yr lbs/yr ac‐ft/yr lbs/yr lbs/yr ac‐ft/yr lbs/yr lbs/yr ac‐ft/yr
Initial Conditions 0.0 18.99 11806 26.76 N/A N/A N/A N/A N/A N/A
Pool to 989 ft 2.0 16.78 8815 26.76 2.21 2991 0.00 11.6% 25.3% 0.0%
Pool to 990 ft 3.6 14.41 4355 26.76 4.58 7451 0.00 24.1% 63.1% 0.0%
Pool to 991 ft 4.8 13.35 2151 26.76 5.64 9655 0.00 29.7% 81.8% 0.0%
Pool to 992 ft 5.9 13.06 1522 26.76 5.93 10284 0.00 31.2% 87.1% 0.0%
Site Summary – SB3 – 989 Pool elev.
Water Body Lake Independence
Treatment Watershed (ac) 29.4
Dominant Land Cover Agriculture
Installation Type Control Structure & Berm
Installation Cost ($) $5,363
Promo/Design/Admin ($) $16,205
Maintenance ($/20yrs) $10,000
Total 20 Year Cost ($) $31,568
Project Life (yrs) 20
$/lb‐TP removal/yr $715
$/lb‐TSS removal/yr $.53
$/ac‐ft volume removal/yr NA
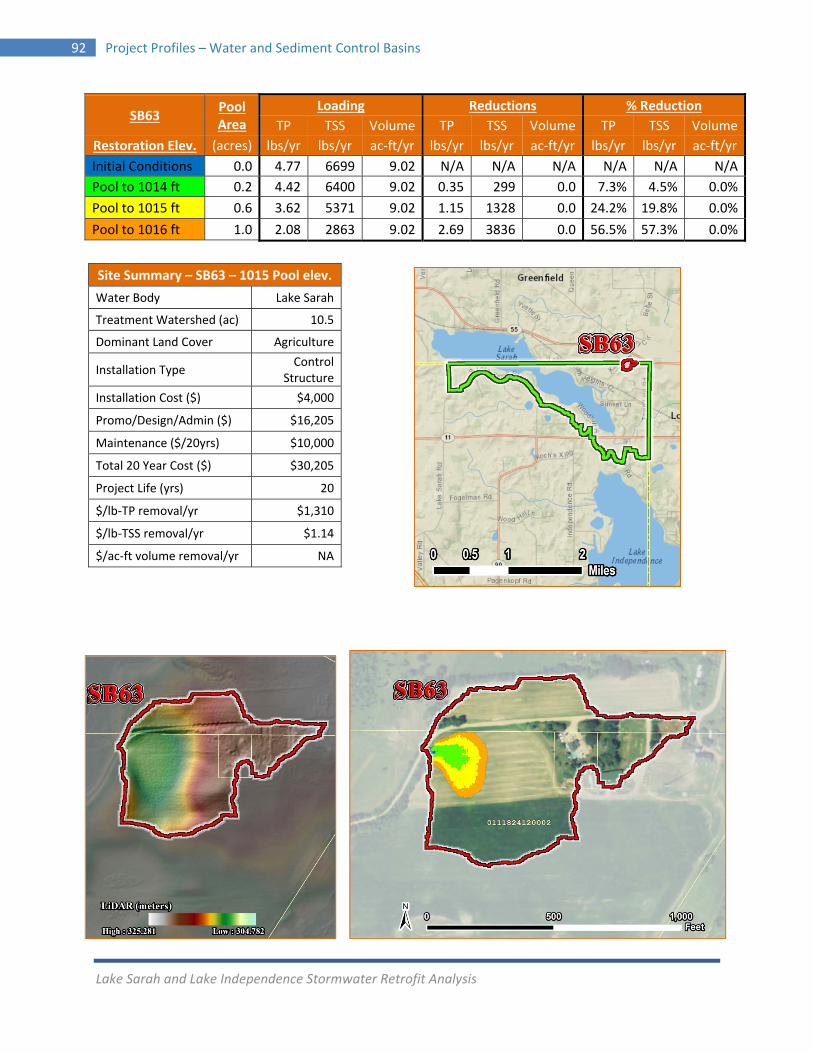
Lake Sarah and Lake Independence Stormwater Retrofit Analysis
92 Project Profiles – Water and Sediment Control Basins
SB63 Pool Area
Loading Reductions % Reduction
TP TSS Volume TP TSS Volume TP TSS Volume
Restoration Elev. (acres) lbs/yr lbs/yr ac‐ft/yr lbs/yr lbs/yr ac‐ft/yr lbs/yr lbs/yr ac‐ft/yr
Initial Conditions 0.0 4.77 6699 9.02 N/A N/A N/A N/A N/A N/A
Pool to 1014 ft 0.2 4.42 6400 9.02 0.35 299 0.0 7.3% 4.5% 0.0%
Pool to 1015 ft 0.6 3.62 5371 9.02 1.15 1328 0.0 24.2% 19.8% 0.0%
Pool to 1016 ft 1.0 2.08 2863 9.02 2.69 3836 0.0 56.5% 57.3% 0.0%
Site Summary – SB63 – 1015 Pool elev.
Water Body Lake Sarah
Treatment Watershed (ac) 10.5
Dominant Land Cover Agriculture
Installation Type Control
Structure
Installation Cost ($) $4,000
Promo/Design/Admin ($) $16,205
Maintenance ($/20yrs) $10,000
Total 20 Year Cost ($) $30,205
Project Life (yrs) 20
$/lb‐TP removal/yr $1,310
$/lb‐TSS removal/yr $1.14
$/ac‐ft volume removal/yr NA
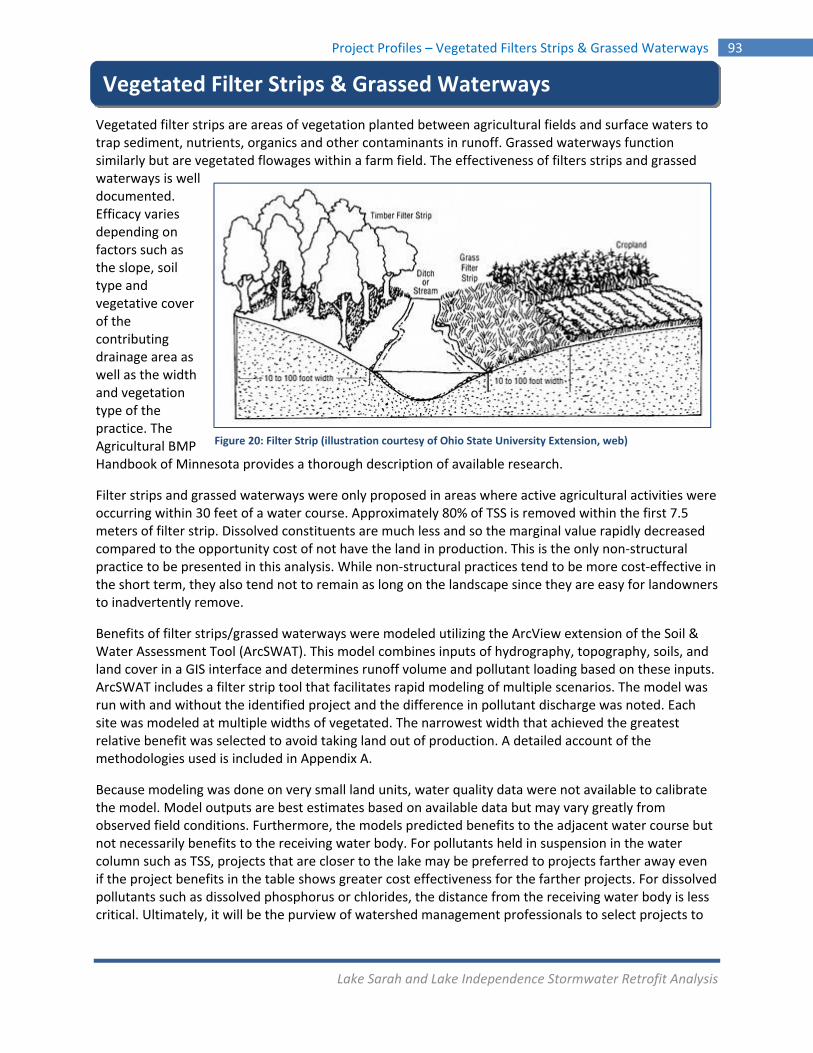
Lake Sarah and Lake Independence Stormwater Retrofit Analysis
Project Profiles – Vegetated Filters Strips & Grassed Waterways 93
Vegetated filter strips are areas of vegetation planted between agricultural fields and surface waters to trap sediment, nutrients, organics and other contaminants in runoff. Grassed waterways function similarly but are vegetated flowages within a farm field. The effectiveness of filters strips and grassed waterways is well documented. Efficacy varies depending on factors such as the slope, soil type and vegetative cover of the contributing drainage area as well as the width and vegetation type of the practice. The Agricultural BMP Handbook of Minnesota provides a thorough description of available research.
Filter strips and grassed waterways were only proposed in areas where active agricultural activities were occurring within 30 feet of a water course. Approximately 80% of TSS is removed within the first 7.5 meters of filter strip. Dissolved constituents are much less and so the marginal value rapidly decreased compared to the opportunity cost of not have the land in production. This is the only non‐structural practice to be presented in this analysis. While non‐structural practices tend to be more cost‐effective in the short term, they also tend not to remain as long on the landscape since they are easy for landowners to inadvertently remove.
Benefits of filter strips/grassed waterways were modeled utilizing the ArcView extension of the Soil & Water Assessment Tool (ArcSWAT). This model combines inputs of hydrography, topography, soils, and land cover in a GIS interface and determines runoff volume and pollutant loading based on these inputs. ArcSWAT includes a filter strip tool that facilitates rapid modeling of multiple scenarios. The model was run with and without the identified project and the difference in pollutant discharge was noted. Each site was modeled at multiple widths of vegetated. The narrowest width that achieved the greatest relative benefit was selected to avoid taking land out of production. A detailed account of the methodologies used is included in Appendix A.
Because modeling was done on very small land units, water quality data were not available to calibrate the model. Model outputs are best estimates based on available data but may vary greatly from observed field conditions. Furthermore, the models predicted benefits to the adjacent water course but not necessarily benefits to the receiving water body. For pollutants held in suspension in the water column such as TSS, projects that are closer to the lake may be preferred to projects farther away even if the project benefits in the table shows greater cost effectiveness for the farther projects. For dissolved pollutants such as dissolved phosphorus or chlorides, the distance from the receiving water body is less critical. Ultimately, it will be the purview of watershed management professionals to select projects to
Vegetated Filter Strips & Grassed Waterways
Figure 20: Filter Strip (illustration courtesy of Ohio State University Extension, web)

Lake Sarah and Lake Independence Stormwater Retrofit Analysis
94 Project Profiles – Vegetated Filter Strips & Grassed Waterways
pursue. To facilitate this process, maps for each project showing the location in the watershed are provided.
In order to determine cost‐benefit, the cost of each project had to be estimated. To fully estimate the cost of project installation, labor costs for project outreach and promotion, project design, easement acquisition, project administration, and project maintenance over the anticipated life of the practice were considered in addition to actual installation costs. The cost of lost agricultural production was also considered. The installation costs vary depending on area of practice to be installed. The cost of design, landowner outreach, project administration, and construction oversight are comparable regardless of the project size and so those costs are held constant between projects. The following table summarizes the potential filter strips/grassed waterways identified during field reconnaissance. Cost assumptions made to calculate the cost‐benefit of each project should be verified against local experience while creating implementation plans. The relative ranking shouldn’t vary much even with alterations to the cost formula.
Table 27: Potential Filter Strip/Grassed Waterway Projects
21 Total cost over twenty years was calculated assuming project design and construction oversight were $6,000, landowner outreach, and general project coordination would take 65 hours total at $73/hr. Lost production costs were valued at $800/acre/year, while filter strip establishment cost was estimated at $200/acre, annual inspection and maintenance costs $300/yr.
Water Resource
Site ID Width (ft)
TSS Reduction (tons/yr)
TP Reduction(lbs/yr)
Volume Reduction(ac‐ft/yr)
20 Yr Cost21
Project Life (yrs)
Cost‐Benefit ($/lb TP)
Independence FS93 20 16.28 34.27 0.0 $32,945 20 $48.07
Independence FS94 10 4.51 10.95 0.0 $26,465 20 $120.84
Independence FS89 50 0.65 1.25 0.0 $10,835 20 $433.40
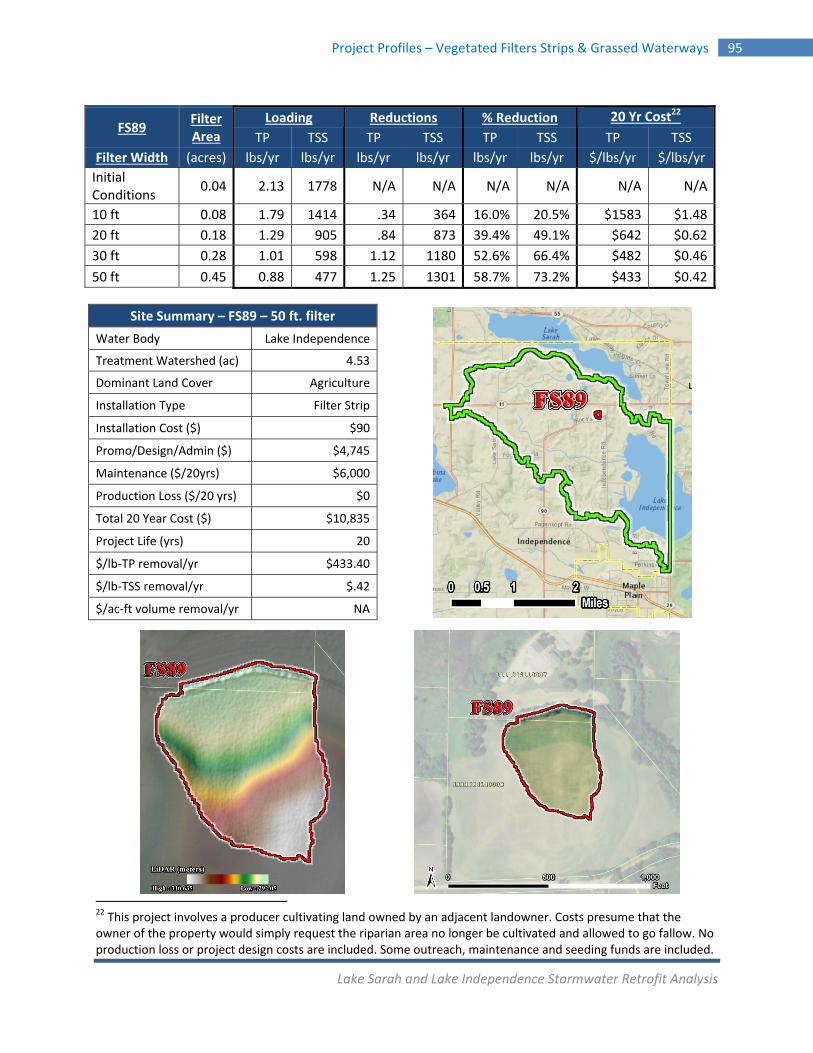
Lake Sarah and Lake Independence Stormwater Retrofit Analysis
Project Profiles – Vegetated Filters Strips & Grassed Waterways 95
22 This project involves a producer cultivating land owned by an adjacent landowner. Costs presume that the owner of the property would simply request the riparian area no longer be cultivated and allowed to go fallow. No production loss or project design costs are included. Some outreach, maintenance and seeding funds are included.
FS89 Filter Area
Loading Reductions % Reduction 20 Yr Cost22
TP TSS TP TSS TP TSS TP TSS
Filter Width (acres) lbs/yr lbs/yr lbs/yr lbs/yr lbs/yr lbs/yr $/lbs/yr $/lbs/yr
Initial Conditions
0.04 2.13 1778 N/A N/A N/A N/A N/A N/A
10 ft 0.08 1.79 1414 .34 364 16.0% 20.5% $1583 $1.48
20 ft 0.18 1.29 905 .84 873 39.4% 49.1% $642 $0.62
30 ft 0.28 1.01 598 1.12 1180 52.6% 66.4% $482 $0.46
50 ft 0.45 0.88 477 1.25 1301 58.7% 73.2% $433 $0.42
Site Summary – FS89 – 50 ft. filter
Water Body Lake Independence
Treatment Watershed (ac) 4.53
Dominant Land Cover Agriculture
Installation Type Filter Strip
Installation Cost ($) $90
Promo/Design/Admin ($) $4,745
Maintenance ($/20yrs) $6,000
Production Loss ($/20 yrs) $0
Total 20 Year Cost ($) $10,835
Project Life (yrs) 20
$/lb‐TP removal/yr $433.40
$/lb‐TSS removal/yr $.42
$/ac‐ft volume removal/yr NA
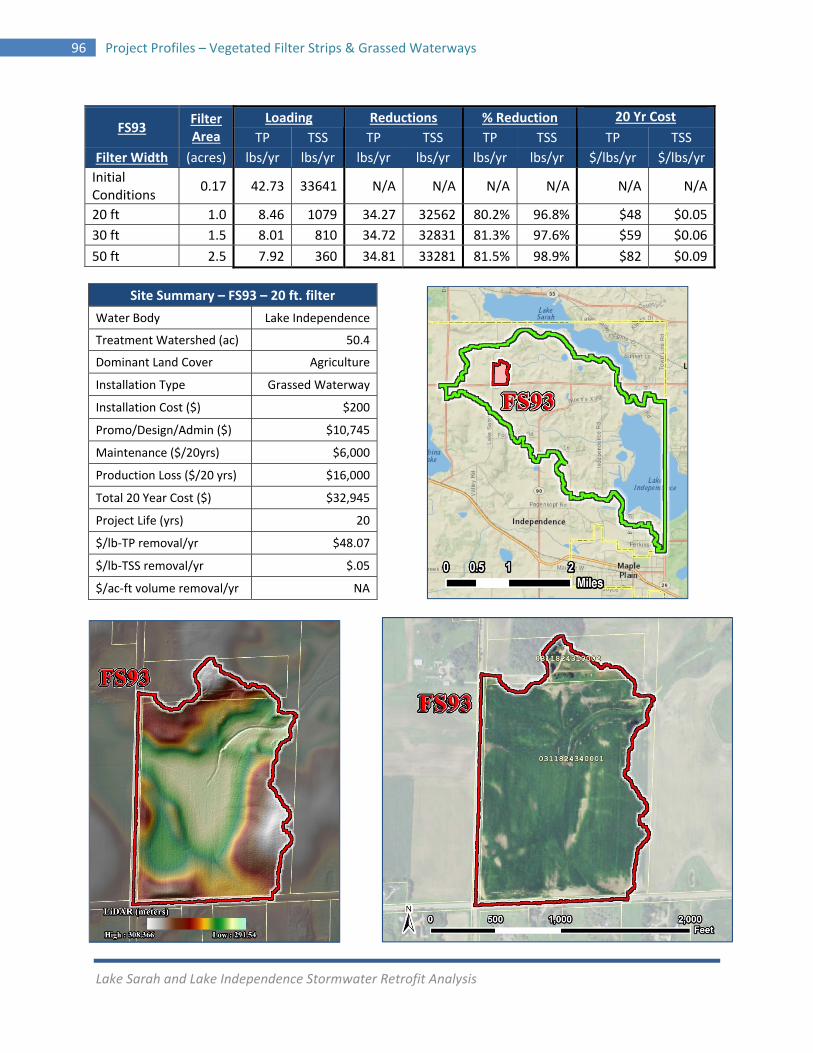
Lake Sarah and Lake Independence Stormwater Retrofit Analysis
96 Project Profiles – Vegetated Filter Strips & Grassed Waterways
FS93 Filter Area
Loading Reductions % Reduction 20 Yr Cost
TP TSS TP TSS TP TSS TP TSS
Filter Width (acres) lbs/yr lbs/yr lbs/yr lbs/yr lbs/yr lbs/yr $/lbs/yr $/lbs/yr
Initial Conditions
0.17 42.73 33641 N/A N/A N/A N/A N/A N/A
20 ft 1.0 8.46 1079 34.27 32562 80.2% 96.8% $48 $0.05
30 ft 1.5 8.01 810 34.72 32831 81.3% 97.6% $59 $0.06
50 ft 2.5 7.92 360 34.81 33281 81.5% 98.9% $82 $0.09
Site Summary – FS93 – 20 ft. filter
Water Body Lake Independence
Treatment Watershed (ac) 50.4
Dominant Land Cover Agriculture
Installation Type Grassed Waterway
Installation Cost ($) $200
Promo/Design/Admin ($) $10,745
Maintenance ($/20yrs) $6,000
Production Loss ($/20 yrs) $16,000
Total 20 Year Cost ($) $32,945
Project Life (yrs) 20
$/lb‐TP removal/yr $48.07
$/lb‐TSS removal/yr $.05
$/ac‐ft volume removal/yr NA
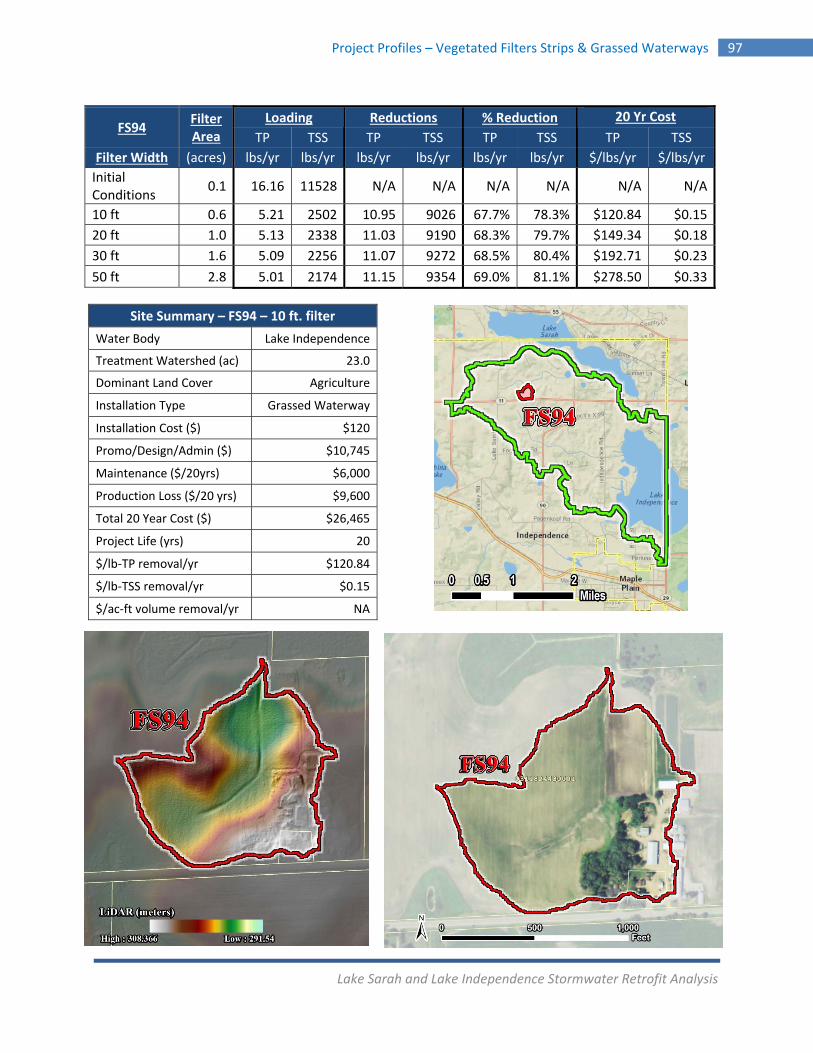
Lake Sarah and Lake Independence Stormwater Retrofit Analysis
Project Profiles – Vegetated Filters Strips & Grassed Waterways 97
FS94 Filter Area
Loading Reductions % Reduction 20 Yr Cost
TP TSS TP TSS TP TSS TP TSS
Filter Width (acres) lbs/yr lbs/yr lbs/yr lbs/yr lbs/yr lbs/yr $/lbs/yr $/lbs/yr
Initial Conditions
0.1 16.16 11528 N/A N/A N/A N/A N/A N/A
10 ft 0.6 5.21 2502 10.95 9026 67.7% 78.3% $120.84 $0.15
20 ft 1.0 5.13 2338 11.03 9190 68.3% 79.7% $149.34 $0.18
30 ft 1.6 5.09 2256 11.07 9272 68.5% 80.4% $192.71 $0.23
50 ft 2.8 5.01 2174 11.15 9354 69.0% 81.1% $278.50 $0.33
Site Summary – FS94 – 10 ft. filter
Water Body Lake Independence
Treatment Watershed (ac) 23.0
Dominant Land Cover Agriculture
Installation Type Grassed Waterway
Installation Cost ($) $120
Promo/Design/Admin ($) $10,745
Maintenance ($/20yrs) $6,000
Production Loss ($/20 yrs) $9,600
Total 20 Year Cost ($) $26,465
Project Life (yrs) 20
$/lb‐TP removal/yr $120.84
$/lb‐TSS removal/yr $0.15
$/ac‐ft volume removal/yr NA
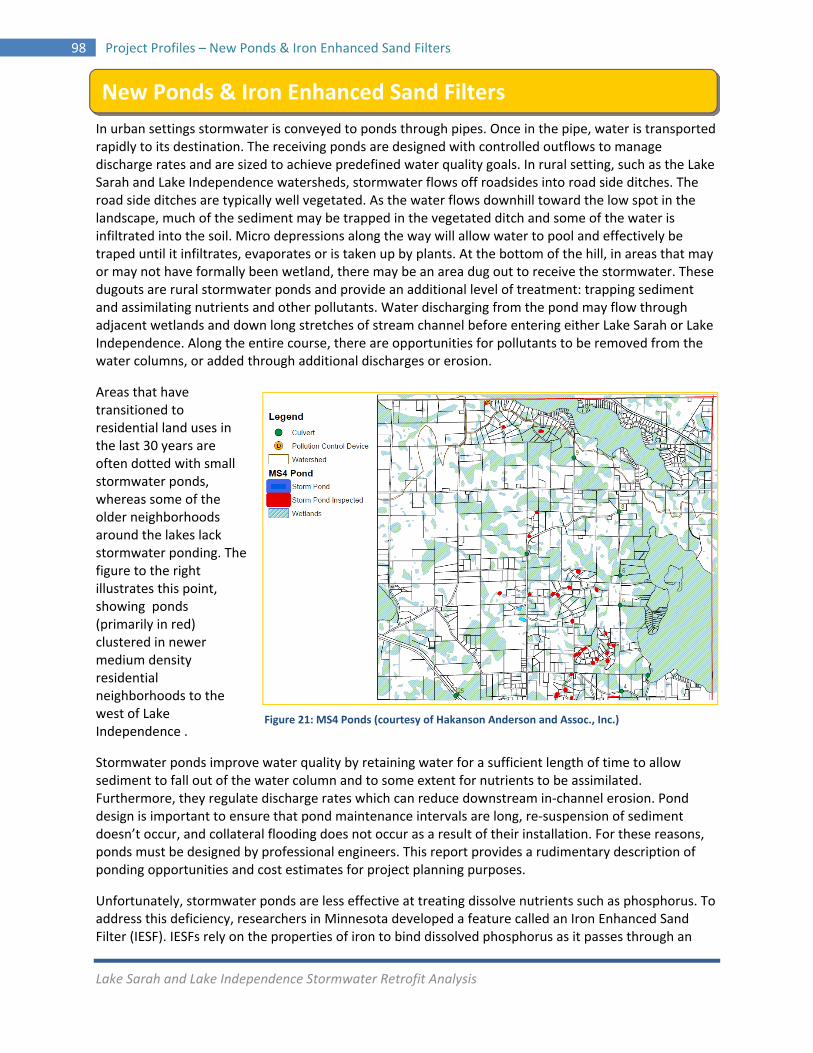
Lake Sarah and Lake Independence Stormwater Retrofit Analysis
98 Project Profiles – New Ponds & Iron Enhanced Sand Filters
In urban settings stormwater is conveyed to ponds through pipes. Once in the pipe, water is transported rapidly to its destination. The receiving ponds are designed with controlled outflows to manage discharge rates and are sized to achieve predefined water quality goals. In rural setting, such as the Lake Sarah and Lake Independence watersheds, stormwater flows off roadsides into road side ditches. The road side ditches are typically well vegetated. As the water flows downhill toward the low spot in the landscape, much of the sediment may be trapped in the vegetated ditch and some of the water is infiltrated into the soil. Micro depressions along the way will allow water to pool and effectively be traped until it infiltrates, evaporates or is taken up by plants. At the bottom of the hill, in areas that may or may not have formally been wetland, there may be an area dug out to receive the stormwater. These dugouts are rural stormwater ponds and provide an additional level of treatment: trapping sediment and assimilating nutrients and other pollutants. Water discharging from the pond may flow through adjacent wetlands and down long stretches of stream channel before entering either Lake Sarah or Lake Independence. Along the entire course, there are opportunities for pollutants to be removed from the water columns, or added through additional discharges or erosion.
Areas that have transitioned to residential land uses in the last 30 years are often dotted with small stormwater ponds, whereas some of the older neighborhoods around the lakes lack stormwater ponding. The figure to the right illustrates this point, showing ponds (primarily in red) clustered in newer medium density residential neighborhoods to the west of Lake Independence .
Stormwater ponds improve water quality by retaining water for a sufficient length of time to allow sediment to fall out of the water column and to some extent for nutrients to be assimilated. Furthermore, they regulate discharge rates which can reduce downstream in‐channel erosion. Pond design is important to ensure that pond maintenance intervals are long, re‐suspension of sediment doesn’t occur, and collateral flooding does not occur as a result of their installation. For these reasons, ponds must be designed by professional engineers. This report provides a rudimentary description of ponding opportunities and cost estimates for project planning purposes.
Unfortunately, stormwater ponds are less effective at treating dissolve nutrients such as phosphorus. To address this deficiency, researchers in Minnesota developed a feature called an Iron Enhanced Sand Filter (IESF). IESFs rely on the properties of iron to bind dissolved phosphorus as it passes through an
New Ponds & Iron Enhanced Sand Filters
Figure 21: MS4 Ponds (courtesy of Hakanson Anderson and Assoc., Inc.)
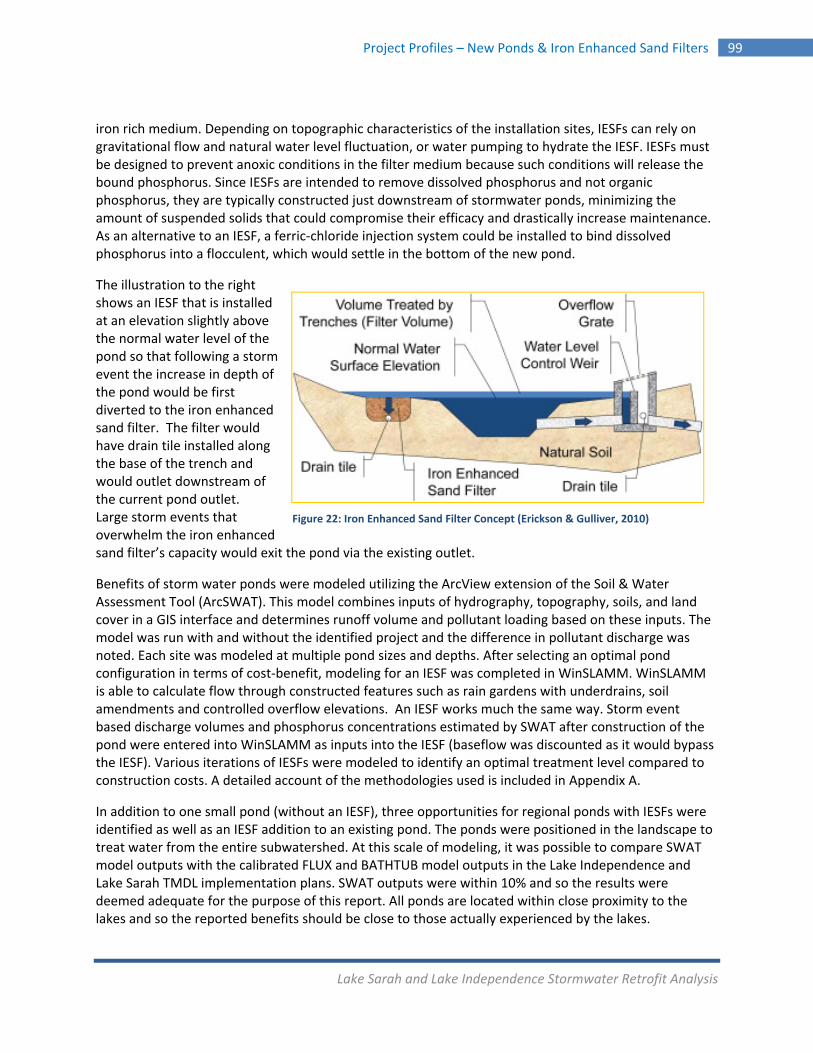
Lake Sarah and Lake Independence Stormwater Retrofit Analysis
Project Profiles – New Ponds & Iron Enhanced Sand Filters 99
iron rich medium. Depending on topographic characteristics of the installation sites, IESFs can rely on gravitational flow and natural water level fluctuation, or water pumping to hydrate the IESF. IESFs must be designed to prevent anoxic conditions in the filter medium because such conditions will release the bound phosphorus. Since IESFs are intended to remove dissolved phosphorus and not organic phosphorus, they are typically constructed just downstream of stormwater ponds, minimizing the amount of suspended solids that could compromise their efficacy and drastically increase maintenance. As an alternative to an IESF, a ferric‐chloride injection system could be installed to bind dissolved phosphorus into a flocculent, which would settle in the bottom of the new pond.
The illustration to the right shows an IESF that is installed at an elevation slightly above the normal water level of the pond so that following a storm event the increase in depth of the pond would be first diverted to the iron enhanced sand filter. The filter would have drain tile installed along the base of the trench and would outlet downstream of the current pond outlet. Large storm events that overwhelm the iron enhanced sand filter’s capacity would exit the pond via the existing outlet.
Benefits of storm water ponds were modeled utilizing the ArcView extension of the Soil & Water Assessment Tool (ArcSWAT). This model combines inputs of hydrography, topography, soils, and land cover in a GIS interface and determines runoff volume and pollutant loading based on these inputs. The model was run with and without the identified project and the difference in pollutant discharge was noted. Each site was modeled at multiple pond sizes and depths. After selecting an optimal pond configuration in terms of cost‐benefit, modeling for an IESF was completed in WinSLAMM. WinSLAMM is able to calculate flow through constructed features such as rain gardens with underdrains, soil amendments and controlled overflow elevations. An IESF works much the same way. Storm event based discharge volumes and phosphorus concentrations estimated by SWAT after construction of the pond were entered into WinSLAMM as inputs into the IESF (baseflow was discounted as it would bypass the IESF). Various iterations of IESFs were modeled to identify an optimal treatment level compared to construction costs. A detailed account of the methodologies used is included in Appendix A.
In addition to one small pond (without an IESF), three opportunities for regional ponds with IESFs were identified as well as an IESF addition to an existing pond. The ponds were positioned in the landscape to treat water from the entire subwatershed. At this scale of modeling, it was possible to compare SWAT model outputs with the calibrated FLUX and BATHTUB model outputs in the Lake Independence and Lake Sarah TMDL implementation plans. SWAT outputs were within 10% and so the results were deemed adequate for the purpose of this report. All ponds are located within close proximity to the lakes and so the reported benefits should be close to those actually experienced by the lakes.
Figure 22: Iron Enhanced Sand Filter Concept (Erickson & Gulliver, 2010)
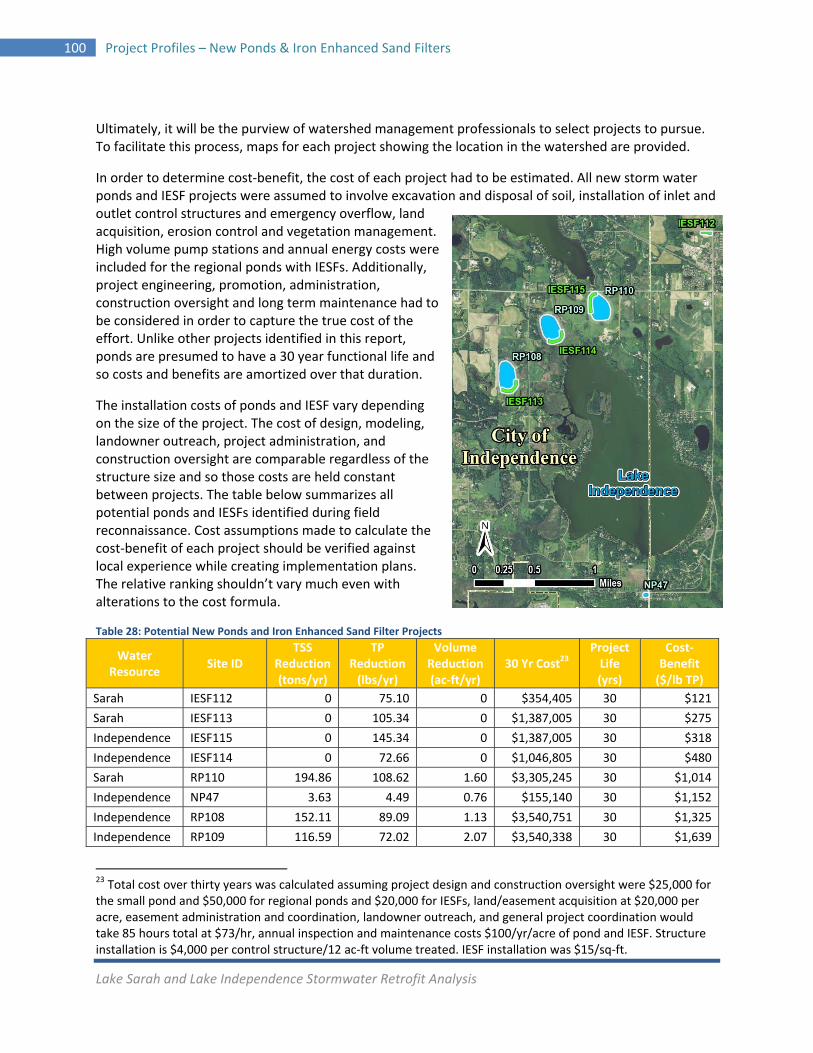
Lake Sarah and Lake Independence Stormwater Retrofit Analysis
100 Project Profiles – New Ponds & Iron Enhanced Sand Filters
Ultimately, it will be the purview of watershed management professionals to select projects to pursue. To facilitate this process, maps for each project showing the location in the watershed are provided.
In order to determine cost‐benefit, the cost of each project had to be estimated. All new storm water ponds and IESF projects were assumed to involve excavation and disposal of soil, installation of inlet and outlet control structures and emergency overflow, land acquisition, erosion control and vegetation management. High volume pump stations and annual energy costs were included for the regional ponds with IESFs. Additionally, project engineering, promotion, administration, construction oversight and long term maintenance had to be considered in order to capture the true cost of the effort. Unlike other projects identified in this report, ponds are presumed to have a 30 year functional life and so costs and benefits are amortized over that duration.
The installation costs of ponds and IESF vary depending on the size of the project. The cost of design, modeling, landowner outreach, project administration, and construction oversight are comparable regardless of the structure size and so those costs are held constant between projects. The table below summarizes all potential ponds and IESFs identified during field reconnaissance. Cost assumptions made to calculate the cost‐benefit of each project should be verified against local experience while creating implementation plans. The relative ranking shouldn’t vary much even with alterations to the cost formula.
Table 28: Potential New Ponds and Iron Enhanced Sand Filter Projects
23 Total cost over thirty years was calculated assuming project design and construction oversight were $25,000 for the small pond and $50,000 for regional ponds and $20,000 for IESFs, land/easement acquisition at $20,000 per acre, easement administration and coordination, landowner outreach, and general project coordination would take 85 hours total at $73/hr, annual inspection and maintenance costs $100/yr/acre of pond and IESF. Structure installation is $4,000 per control structure/12 ac‐ft volume treated. IESF installation was $15/sq‐ft.
Water Resource
Site ID TSS
Reduction (tons/yr)
TP Reduction (lbs/yr)
VolumeReduction (ac‐ft/yr)
30 Yr Cost23 Project Life (yrs)
Cost‐Benefit ($/lb TP)
Sarah IESF112 0 75.10 0 $354,405 30 $121
Sarah IESF113 0 105.34 0 $1,387,005 30 $275
Independence IESF115 0 145.34 0 $1,387,005 30 $318
Independence IESF114 0 72.66 0 $1,046,805 30 $480
Sarah RP110 194.86 108.62 1.60 $3,305,245 30 $1,014
Independence NP47 3.63 4.49 0.76 $155,140 30 $1,152
Independence RP108 152.11 89.09 1.13 $3,540,751 30 $1,325
Independence RP109 116.59 72.02 2.07 $3,540,338 30 $1,639
Lake Sarah and Lake Independence Stormwater Retrofit Analysis
Project Profiles – New Ponds & Iron Enhanced Sand Filters 101
Lake Sarah Ponds and IESFs Clarification The Loretto Creek watershed located east of Lake Sarah and that discharges into the southeast end of the lake includes an existing pond that was recently built in the City of Loretto. As part of this analysis, an additional regional ponding opportunity along with two separate IESFs have been identified to treat water from this drainage area. One of the IESFs (IESF112) is proposed in conjunction with the existing Loretto Pond. The other, IESF115 is proposed in conjunction with the new regional pond, RP110. The existing and proposed ponds and IESFs result in treatment train effects that warrant clarification. The watershed also drains portions of five municipalities; Corcoran, Greenfield, Independence, Loretto, and Medina. Since this analysis is designed to aid the City of Independence to reach its loading goals, it was critical to segregate the loading and reduction by city. Table 29 provides the breakdown or relative drainage area and loading. Note that the percentage contribution of the different drainage areas is variable between parameters. This is because the Loretto pond effectively removes a substantial amount of TSS but is less effective at reducing discharge volumes or TP loading. While the drainage area to the Loretto pond continues to contribute approximately 50% of overall TP and Volume, it contributes only 10% of TSS. Variability between target pollutant loading ratios also arises because the algorithms used in the model considers factors such as slope, soil type and landcover that vary between subwatershed drainage areas. The pollutant loading ratios in Table 29 were used to ascertain the relative benefit associated with the contributing watershed within the City of Independence. Since TP is the target pollutant, only 25.5% of the total benefits and costs for RP110 and IESF115 were included in the City of Independence project tables. The remainder is transferred to the table that shows project identified outside the city boundaries. Table 29: Loretto Creek Subwatershed Breakdown
Results include in‐line Loretto Pond but DO NOT include proposed conditions
Loretto Creek Watershed
Acres % of Total
Corcoran 358 28.8%
Greenfield 27.4 2.2%
Independence 354.7 28.5%
Loretto 109.4 8.8%
Medina 395.1 31.7%
Watershed Size
Cities Treatment Area (ac)
Area % of Total
TP load
(lbs/yr)
TP % of
Total
TSS load
(lbs/yr)
TSS % of Total
Volume (ac‐ft/yr)
Volume % of Total
Entire watershed
Corcoran, Greenfield, Independence, Loretto, Medina
1,245 ‐ 671 ‐ 441,359 ‐ 1,013 ‐
City of Independence only
Independence 333 26.7% 171 25.5% 178,586 40.5% 257 25.4%
Loretto Pond treatment area
Corcoran, Loretto, Medina
431 34.6% 346 51.6% 44,039 10.0% 477 47.1%
Remainder of watershed
Corcoran, Greenfield, Loretto, Medina
481 38.6% 154 23.0% 218,734 49.6% 279 27.5%
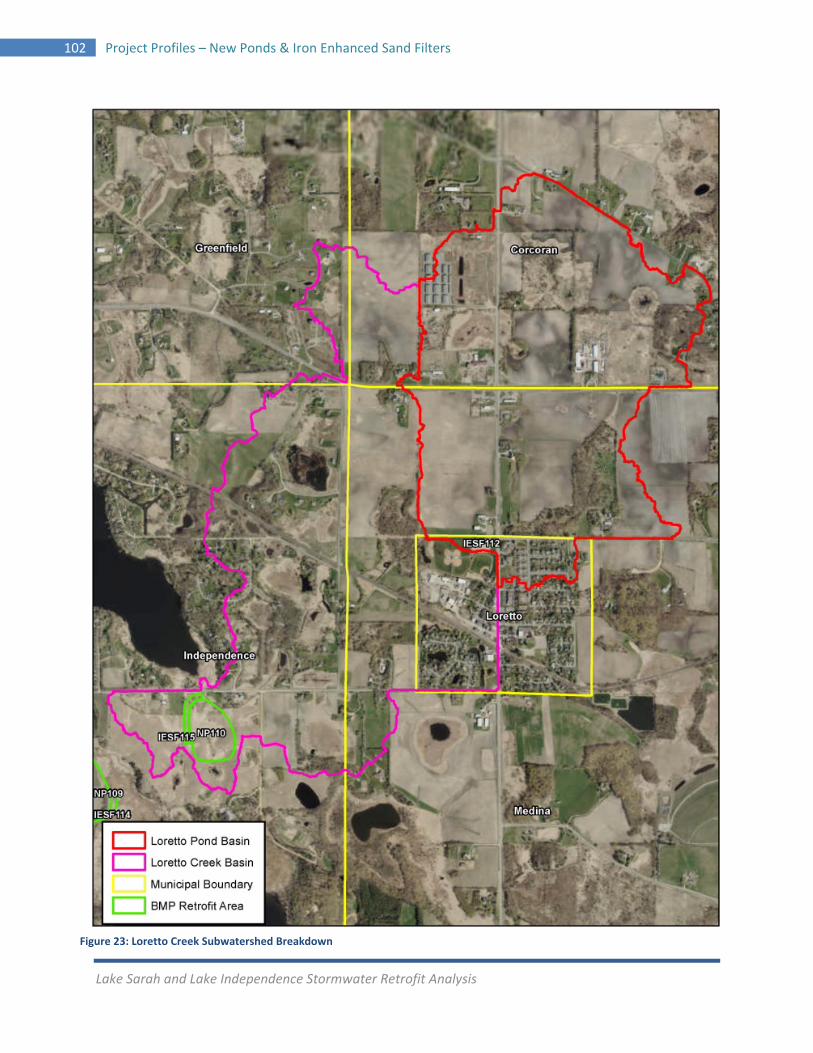
Lake Sarah and Lake Independence Stormwater Retrofit Analysis
102 Project Profiles – New Ponds & Iron Enhanced Sand Filters
Figure 23: Loretto Creek Subwatershed Breakdown
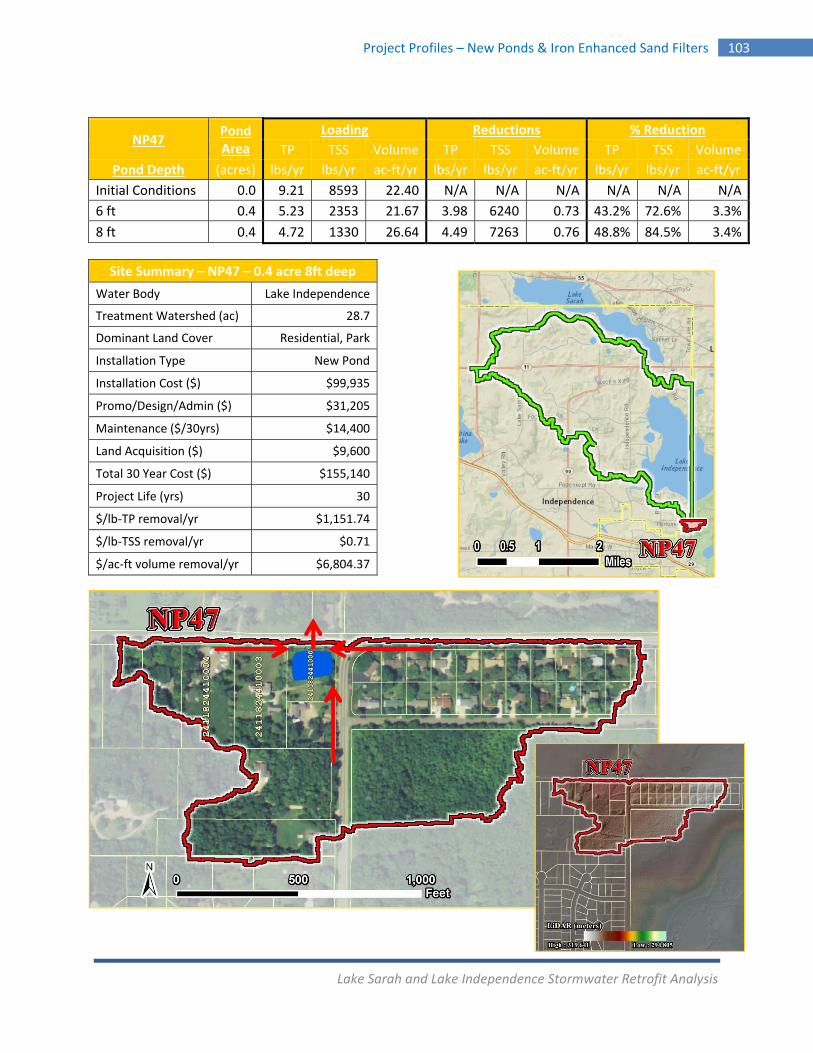
Lake Sarah and Lake Independence Stormwater Retrofit Analysis
Project Profiles – New Ponds & Iron Enhanced Sand Filters 103
NP47 Pond Area
Loading Reductions % Reduction
TP TSS Volume TP TSS Volume TP TSS Volume
Pond Depth (acres) lbs/yr lbs/yr ac‐ft/yr lbs/yr lbs/yr ac‐ft/yr lbs/yr lbs/yr ac‐ft/yr
Initial Conditions 0.0 9.21 8593 22.40 N/A N/A N/A N/A N/A N/A
6 ft 0.4 5.23 2353 21.67 3.98 6240 0.73 43.2% 72.6% 3.3%
8 ft 0.4 4.72 1330 26.64 4.49 7263 0.76 48.8% 84.5% 3.4%
Site Summary – NP47 – 0.4 acre 8ft deep
Water Body Lake Independence
Treatment Watershed (ac) 28.7
Dominant Land Cover Residential, Park
Installation Type New Pond
Installation Cost ($) $99,935
Promo/Design/Admin ($) $31,205
Maintenance ($/30yrs) $14,400
Land Acquisition ($) $9,600
Total 30 Year Cost ($) $155,140
Project Life (yrs) 30
$/lb‐TP removal/yr $1,151.74
$/lb‐TSS removal/yr $0.71
$/ac‐ft volume removal/yr $6,804.37
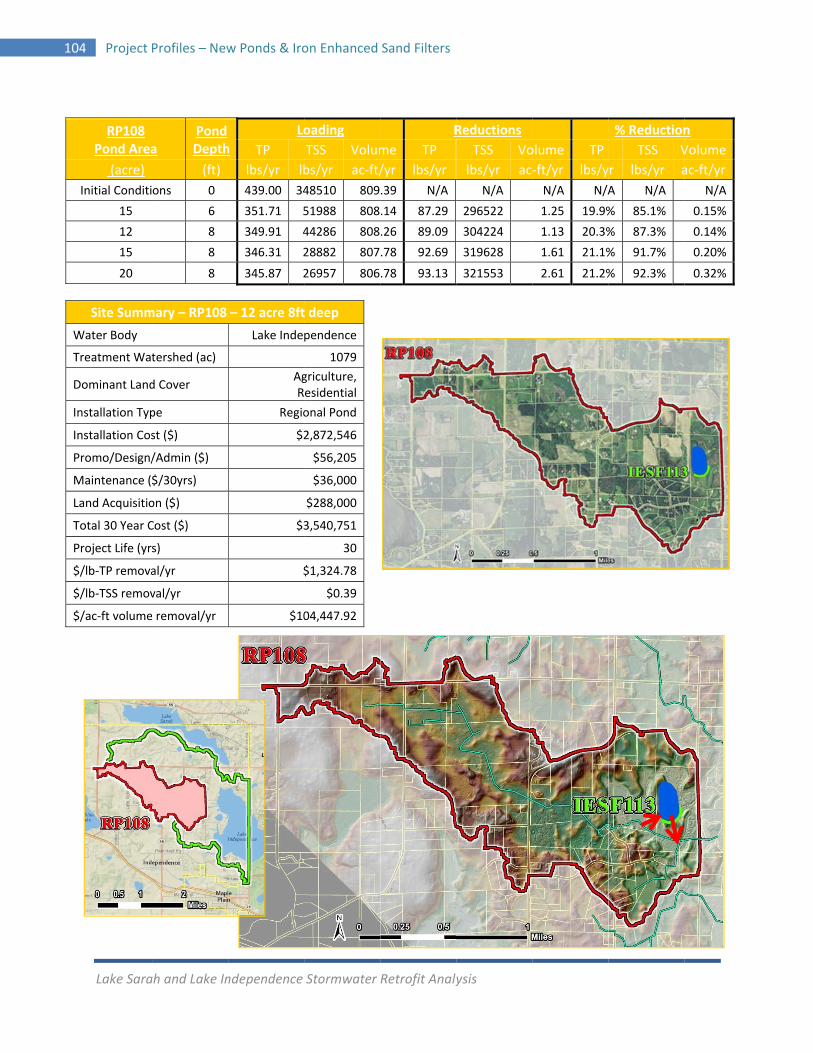
10
W
T
D
I
I
P
M
L
T
P
$
$
$
Lake Sara
04 Project
RP108 Pond Area
(acre)
Initial Conditi
15
12
15
20
Site Summ
Water Body
Treatment Wat
Dominant Land
nstallation Typ
nstallation Cos
Promo/Design/
Maintenance (
Land Acquisitio
Total 30 Year C
Project Life (yrs
$/lb‐TP remova
$/lb‐TSS remov
$/ac‐ft volume
ah and Lake In
Profiles – New
a Pond Depth
(ft)
ons 0
6
8
8
8
mary – RP108
tershed (ac)
d Cover
pe
st ($)
/Admin ($)
$/30yrs)
on ($)
Cost ($)
s)
al/yr
val/yr
removal/yr
ndependence
w Ponds & Iro
h
Lo
TP
lbs/yr lb
439.00 34
351.71 5
349.91 4
346.31 2
345.87 2
– 12 acre 8ft
Lake Inde
AgR
Regio
$2
$3
$
$10
Stormwater
on Enhanced
oading
TSS Volum
bs/yr ac‐ft/
48510 809
51988 808
44286 808
28882 807
26957 806
t deep
pendence
1079
griculture, esidential
onal Pond
2,872,546
$56,205
$36,000
$288,000
3,540,751
30
$1,324.78
$0.39
04,447.92
Retrofit Analy
Sand Filters
R
me TP
/yr lbs/yr
.39 N/A
.14 87.29
.26 89.09
.78 92.69
.78 93.13
ysis
Reductions
TSS Vo
lbs/yr ac
N/A
296522
304224
319628
321553
olume TP
‐ft/yr lbs/y
N/A N/A
1.25 19.9%
1.13 20.3%
1.61 21.1%
2.61 21.2%
% Reduction
TSS V
yr lbs/yr a
A N/A
% 85.1%
% 87.3%
% 91.7%
% 92.3%
n
Volume
ac‐ft/yr
N/A
0.15%
0.14%
0.20%
0.32%
Lake Sarah and Lake Independence Stormwater Retrofit Analysis
Project Profiles – New Ponds & Iron Enhanced Sand Filters 105
RP109 Pond Area
Pond Depth
Loading Reductions % Reduction
TP TSS Volume TP TSS Volume TP TSS Volume
(acre) (ft) lbs/yr lbs/yr ac‐ft/yr lbs/yr lbs/yr ac‐ft/yr lbs/yr lbs/yr ac‐ft/yr
Initial Conditions 0 336.59 273236 854.35 N/A N/A N/A N/A N/A N/A
12 8 264.57 40554 852.28 72.02 233182 2.07 21.4% 85.2% 0.24%
15 8 262.57 32443 851.46 74.02 241293 2.89 22.0% 88.2% 0.34%
20 8 260.59 24332 850.12 76.00 249404 4.23 21.6% 91.1% 0.50%
Site Summary – RP109 – 12 acre 8ft deep
Water Body Lake Independence
Treatment Watershed (ac) 1136
Dominant Land Cover Agriculture, Residential
Installation Type Regional Pond
Installation Cost ($) $2,872,133
Promo/Design/Admin ($) $56,205
Maintenance ($/30yrs) $36,000
Land Acquisition ($) $288,000
Total 30 Year Cost ($) $3,540,338
Project Life (yrs) 30
$/lb‐TP removal/yr $1,638.59
$/lb‐TSS removal/yr $0.51
$/ac‐ft volume removal/yr $57,010.28
Lake Sarah and Lake Independence Stormwater Retrofit Analysis
106 Project Profiles – New Ponds & Iron Enhanced Sand Filters
RP110 Pond Area
Pond Depth
Loading Reductions % Reduction
TP TSS Volume TP TSS Volume TP TSS Volume
(acre) (ft) lbs/yr lbs/yr ac‐ft/yr lbs/yr lbs/yr ac‐ft/yr lbs/yr lbs/yr ac‐ft/yr
Initial Conditions 0 670.60 441359 1012.60 N/A N/A N/A N/A N/A N/A
12 8 561.98 51631 1011.00 108.62 389728 1.60 16.2% 88.3% 0.16%
13 8 559.39 39972 1010.76 111.21 401387 1.84 16.6% 90.9% 0.18%
15 8 558.28 34976 1010.22 112.32 406383 2.38 16.8% 92.1% 0.24%
20 8 556.45 26648 1008.39 114.15 414711 4.21 17.0% 94.0% 0.42%
Site Summary – RP110 – 12 acre 8ft deep
Water Body Lake Sarah
Treatment Watershed (ac) 1244.5
Dominant Land Cover Agriculture, Residential
Installation Type Regional Pond
Installation Cost ($) $2,925,040
Promo/Design/Admin ($) $56,205
Maintenance ($/30yrs) $36,000
Land Acquisition ($) $288,000
Total 30 Year Cost ($) $3,305,245
Project Life (yrs) 30
$/lb‐TP removal/yr $1,014.31
$/lb‐TSS removal/yr $0.28
$/ac‐ft volume removal/yr $68,859.27
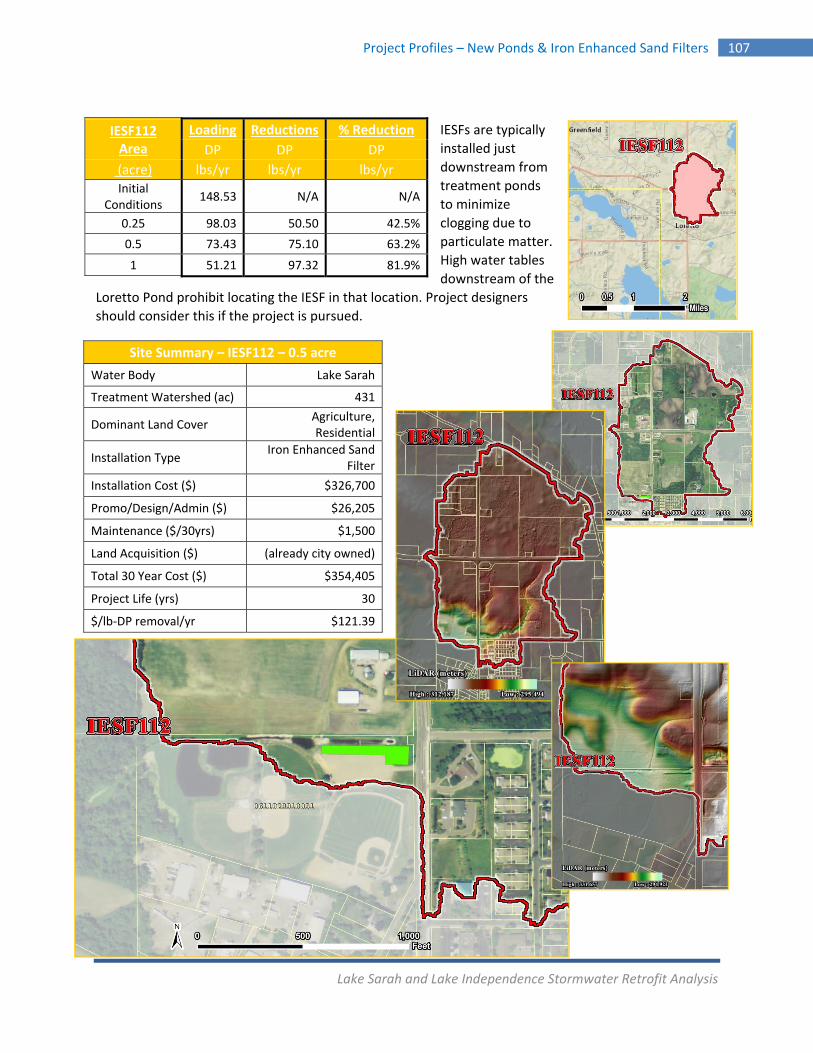
Lake Sarah and Lake Independence Stormwater Retrofit Analysis
Project Profiles – New Ponds & Iron Enhanced Sand Filters 107
IESFs are typically
installed just
downstream from
treatment ponds
to minimize
clogging due to
particulate matter.
High water tables
downstream of the
Loretto Pond prohibit locating the IESF in that location. Project designers
should consider this if the project is pursued.
IESF112 Area
Loading Reductions % Reduction
DP DP DP
(acre) lbs/yr lbs/yr lbs/yr
Initial Conditions
148.53 N/A N/A
0.25 98.03 50.50 42.5%
0.5 73.43 75.10 63.2%
1 51.21 97.32 81.9%
Site Summary – IESF112 – 0.5 acre
Water Body Lake Sarah
Treatment Watershed (ac) 431
Dominant Land Cover Agriculture, Residential
Installation Type Iron Enhanced Sand
Filter
Installation Cost ($) $326,700
Promo/Design/Admin ($) $26,205
Maintenance ($/30yrs) $1,500
Land Acquisition ($) (already city owned)
Total 30 Year Cost ($) $354,405
Project Life (yrs) 30
$/lb‐DP removal/yr $121.39
Lake Sarah and Lake Independence Stormwater Retrofit Analysis
108 Project Profiles – New Ponds & Iron Enhanced Sand Filters
24 Initial conditions include only the Dissolve Phosphorus (DP) that is associated with storm events as only that DP may be treated by a sufficiently large IESF. TP associated with storm events is 70% of overall TP. DP is 50% of TP.
IESF113 Area
Loading Reductions % Reduction
DP DP DP
(acre) lbs/yr lbs/yr lbs/yr
Initial Conditions24
153.65 N/A N/A
0.5 94.03 59.62 48.5%
1 68.47 85.18 69.3%
1.5 54.33 99.32 80.8%
2 48.31 105.34 85.7%
Site Summary – IESF113 – 2 acre
Water Body Lake Independence
Treatment Watershed (ac) 1079
Dominant Land Cover Agriculture, Residential
Installation Type Iron Enhanced Sand
Filter
Installation Cost ($) $1,306,800
Promo/Design/Admin ($) $26,205
Maintenance ($/30yrs) $6,000
Land Acquisition ($) $48,000
Total 30 Year Cost ($) $1,387,005
Project Life (yrs) 30
$/lb‐TP removal/yr $275.32
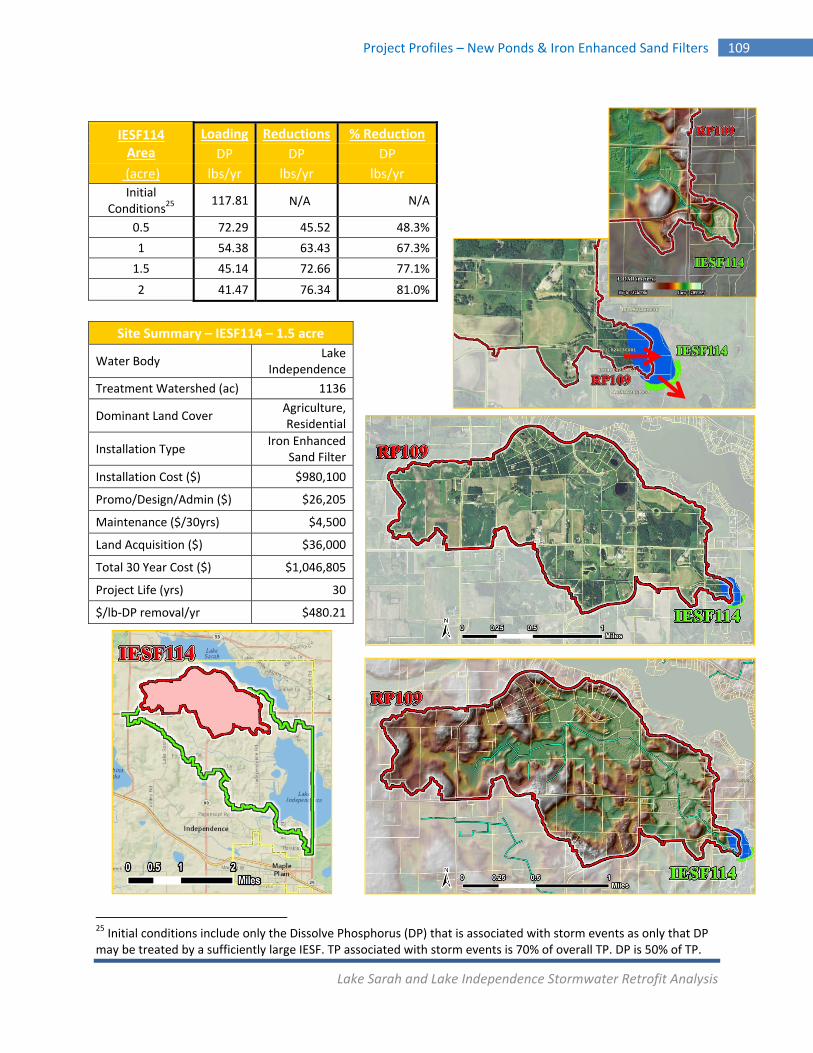
Lake Sarah and Lake Independence Stormwater Retrofit Analysis
Project Profiles – New Ponds & Iron Enhanced Sand Filters 109
25 Initial conditions include only the Dissolve Phosphorus (DP) that is associated with storm events as only that DP may be treated by a sufficiently large IESF. TP associated with storm events is 70% of overall TP. DP is 50% of TP.
IESF114 Area
Loading Reductions % Reduction
DP DP DP
(acre) lbs/yr lbs/yr lbs/yr
Initial Conditions25
117.81 N/ N/A A N/A
0.5 72.29 45.52 48.3%
1 54.38 63.43 67.3%
1.5 45.14 72.66 77.1%
2 41.47 76.34 81.0%
Site Summary – IESF114 – 1.5 acre
Water Body Lake
Independence
Treatment Watershed (ac) 1136
Dominant Land Cover Agriculture, Residential
Installation Type Iron Enhanced
Sand Filter
Installation Cost ($) $980,100
Promo/Design/Admin ($) $26,205
Maintenance ($/30yrs) $4,500
Land Acquisition ($) $36,000
Total 30 Year Cost ($) $1,046,805
Project Life (yrs) 30
$/lb‐DP removal/yr $480.21
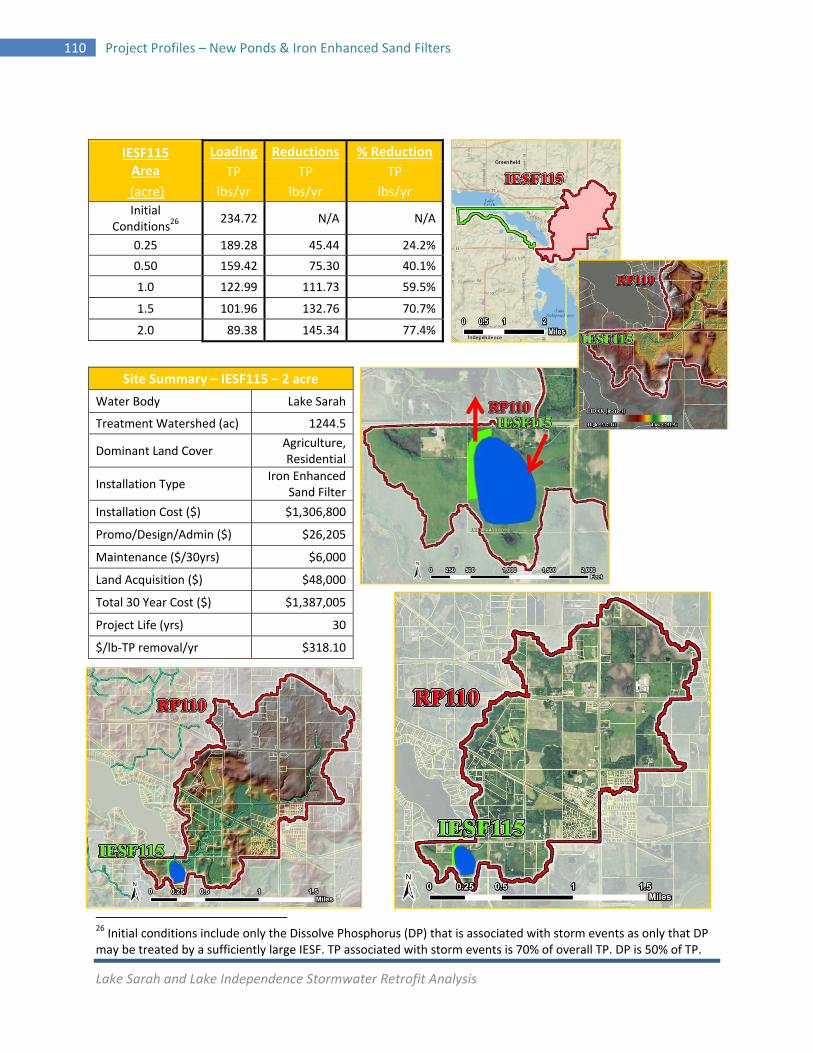
Lake Sarah and Lake Independence Stormwater Retrofit Analysis
110 Project Profiles – New Ponds & Iron Enhanced Sand Filters
26 Initial conditions include only the Dissolve Phosphorus (DP) that is associated with storm events as only that DP may be treated by a sufficiently large IESF. TP associated with storm events is 70% of overall TP. DP is 50% of TP.
IESF115 Area
Loading Reductions % Reduction
TP TP TP
(acre) lbs/yr lbs/yr lbs/yr
Initial Conditions26
234.72 N/A N/A
0.25 189.28 45.44 24.2%
0.50 159.42 75.30 40.1%
1.0 122.99 111.73 59.5%
1.5 101.96 132.76 70.7%
2.0 89.38 145.34 77.4%
Site Summary – IESF115 – 2 acre
Water Body Lake Sarah
Treatment Watershed (ac) 1244.5
Dominant Land Cover Agriculture, Residential
Installation Type Iron Enhanced
Sand Filter
Installation Cost ($) $1,306,800
Promo/Design/Admin ($) $26,205
Maintenance ($/30yrs) $6,000
Land Acquisition ($) $48,000
Total 30 Year Cost ($) $1,387,005
Project Life (yrs) 30
$/lb‐TP removal/yr $318.10
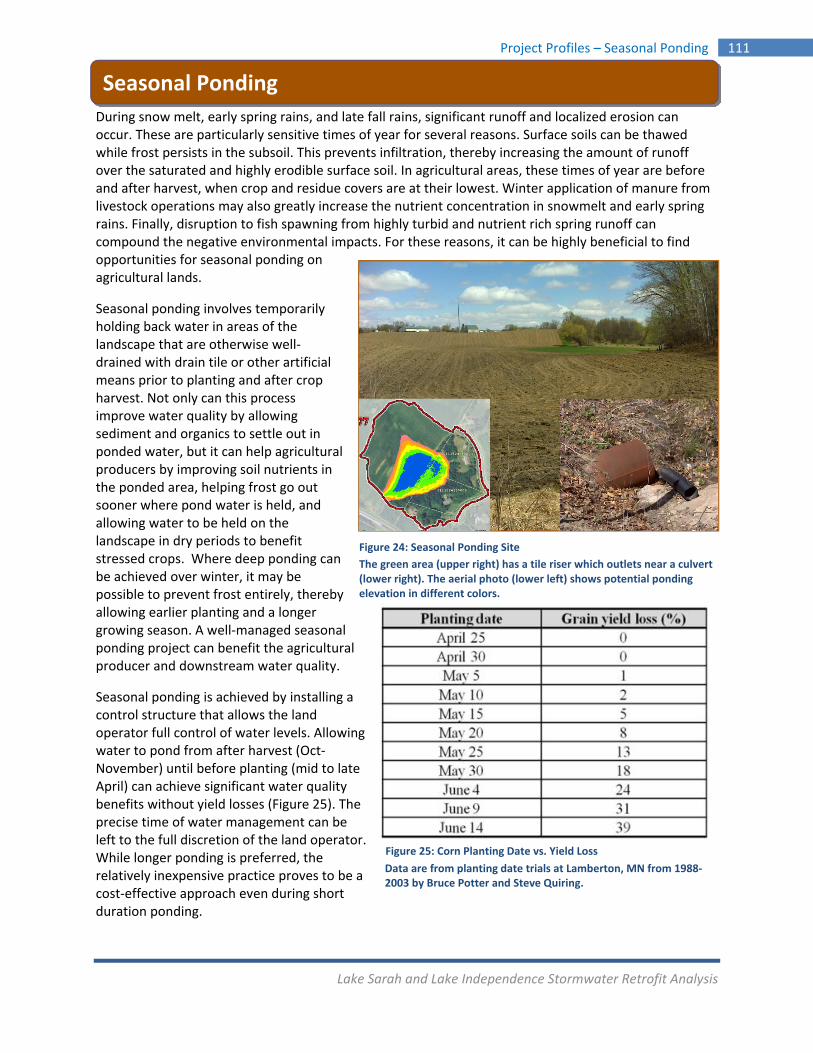
Lake Sarah and Lake Independence Stormwater Retrofit Analysis
Project Profiles – Seasonal Ponding 111
During snow melt, early spring rains, and late fall rains, significant runoff and localized erosion can occur. These are particularly sensitive times of year for several reasons. Surface soils can be thawed while frost persists in the subsoil. This prevents infiltration, thereby increasing the amount of runoff over the saturated and highly erodible surface soil. In agricultural areas, these times of year are before and after harvest, when crop and residue covers are at their lowest. Winter application of manure from livestock operations may also greatly increase the nutrient concentration in snowmelt and early spring rains. Finally, disruption to fish spawning from highly turbid and nutrient rich spring runoff can compound the negative environmental impacts. For these reasons, it can be highly beneficial to find opportunities for seasonal ponding on agricultural lands.
Seasonal ponding involves temporarily holding back water in areas of the landscape that are otherwise well‐drained with drain tile or other artificial means prior to planting and after crop harvest. Not only can this process improve water quality by allowing sediment and organics to settle out in ponded water, but it can help agricultural producers by improving soil nutrients in the ponded area, helping frost go out sooner where pond water is held, and allowing water to be held on the landscape in dry periods to benefit stressed crops. Where deep ponding can be achieved over winter, it may be possible to prevent frost entirely, thereby allowing earlier planting and a longer growing season. A well‐managed seasonal ponding project can benefit the agricultural producer and downstream water quality.
Seasonal ponding is achieved by installing a control structure that allows the land operator full control of water levels. Allowing water to pond from after harvest (Oct‐November) until before planting (mid to late April) can achieve significant water quality benefits without yield losses (Figure 25). The precise time of water management can be left to the full discretion of the land operator. While longer ponding is preferred, the relatively inexpensive practice proves to be a cost‐effective approach even during short duration ponding.
Seasonal Ponding
Figure 24: Seasonal Ponding Site
The green area (upper right) has a tile riser which outlets near a culvert (lower right). The aerial photo (lower left) shows potential ponding elevation in different colors.
Figure 25: Corn Planting Date vs. Yield Loss
Data are from planting date trials at Lamberton, MN from 1988‐2003 by Bruce Potter and Steve Quiring.

Lake Sarah and Lake Independence Stormwater Retrofit Analysis
112 Project Profiles – Seasonal Ponding
The figure to the right illustrates how a drainage tile could be interrupted with a control structure to manage water levels. By simply removing all or some of the restrictors, water levels could be rapidly dropped.
Seasonal pond retrofits were modeled utilizing the ArcView extension of the Soil & Water Assessment Tool (ArcSWAT). This model combines inputs of hydrography, topography, soils, and land cover in a GIS interface and determines runoff volume and pollutant loading based on these inputs. The model was run with and without the identified project and reported in monthly intervals. The difference in pollutant discharge for the months when ponding is anticipated to occur (October – April) were noted. The selected site was modeled at multiple ponding depths. A detailed account of the methodologies used is included in Appendix A.
The seasonal pond is located within close proximity to Lake Sarah and so the reported benefits should be close to those actually experienced by the lake. Ultimately, it will be the purview of watershed management professionals to select projects to pursue. To facilitate this process, maps for each project showing the location in the watershed are provided.
In order to determine cost‐benefit, the cost of each project had to be estimated. Seasonal ponding projects were assumed to involve installation of a control structure to retrofit existing drainage features. Additionally, project design, promotion, administration, construction oversight and long term maintenance had to be considered in order to capture the true cost of the effort.
The table below summarizes the seasonal pond project costs and benefits. Cost assumptions made to calculate the cost‐benefit should be verified against local experience while creating implementation plans.
Table 30: Potential Seasonal Ponding Project
27 Total cost over ten years was calculated assuming project design and construction oversight were $3,000, landowner outreach, and general project coordination would take 40 hours total at $73/hr, annual inspection and maintenance costs $50/yr. Structure installation is $4,000 per control structures .
Water Resource
Site ID Pool Elev.
TSS Reduction (tons/yr)
TP Reduction(lbs/yr)
Volume Reduction(ac‐ft/yr)
10 Yr Cost27
Project Life (yrs)
Cost‐Benefit ($/lb TP)
Sarah SP77 997 1.0 2.85 2.15 $10,420 10 $365.61
Figure 26: Water Control Attached to Drain Tile (illustration courtesy of Illinois NRCS – modified)
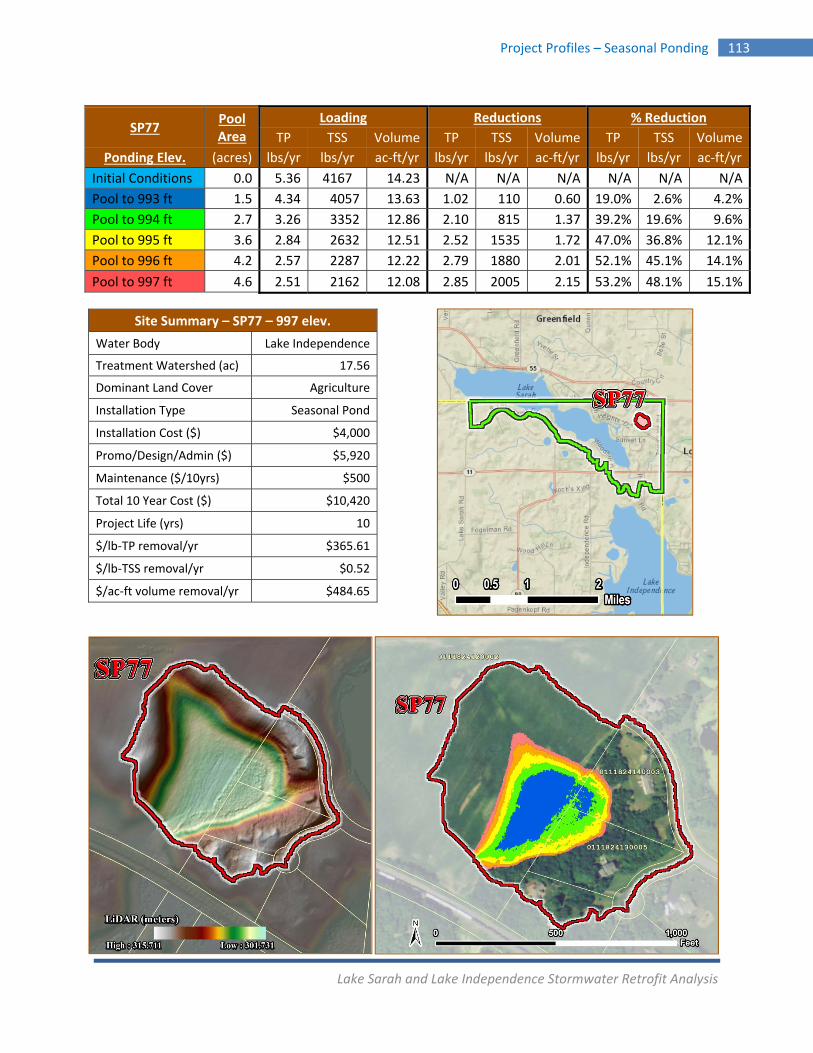
Lake Sarah and Lake Independence Stormwater Retrofit Analysis
Project Profiles – Seasonal Ponding 113
SP77 Pool Area
Loading Reductions % Reduction
TP TSS Volume TP TSS Volume TP TSS Volume
Ponding Elev. (acres) lbs/yr lbs/yr ac‐ft/yr lbs/yr lbs/yr ac‐ft/yr lbs/yr lbs/yr ac‐ft/yr
Initial Conditions 0.0 5.36 4167 14.23 N/A N/A N/A N/A N/A N/A
Pool to 993 ft 1.5 4.34 4057 13.63 1.02 110 0.60 19.0% 2.6% 4.2%
Pool to 994 ft 2.7 3.26 3352 12.86 2.10 815 1.37 39.2% 19.6% 9.6%
Pool to 995 ft 3.6 2.84 2632 12.51 2.52 1535 1.72 47.0% 36.8% 12.1%
Pool to 996 ft 4.2 2.57 2287 12.22 2.79 1880 2.01 52.1% 45.1% 14.1%
Pool to 997 ft 4.6 2.51 2162 12.08 2.85 2005 2.15 53.2% 48.1% 15.1%
Site Summary – SP77 – 997 elev.
Water Body Lake Independence
Treatment Watershed (ac) 17.56
Dominant Land Cover Agriculture
Installation Type Seasonal Pond
Installation Cost ($) $4,000
Promo/Design/Admin ($) $5,920
Maintenance ($/10yrs) $500
Total 10 Year Cost ($) $10,420
Project Life (yrs) 10
$/lb‐TP removal/yr $365.61
$/lb‐TSS removal/yr $0.52
$/ac‐ft volume removal/yr $484.65

Lake Sarah and Lake Independence Stormwater Retrofit Analysis
114 References
References Almedinger, J.E., J. Ulrich. 2010. Constructing a SWAT Model of the Sunrise River Watershed, Eastern
Minnesota. St. Croix Watershed Research Station, Science Museum of Minnesota.
Anoka Conservation District (ACD). 2013. 2012 Anoka Water Almanac: Water Quality and Quantity Conditions of Anoka County, MN. Anoka Conservation District.
City of Independence Water Management Plan. November 2011, Hakanson Anderson Associates, Inc.
Cooke, J.G. 1988. Sources and Sinks of Nutrients in a New Zealand Hill Pasture Catchment II. Phosphorus .
Hydrologic Process. 2:123‐133.
Davies‐Colley, R.J., and J.W. Nagels. 2002. Effects of dairying on water quality of lowland streams in
Westland and Waikato. Proceedings of the New Zealand Grassland Association. 64:103‐205.
Erickson, A.J., and J.S. Gulliver. 2010. Performance Assessment of an Iron‐Enhanced Sand Filtration Trench for Capturing Dissolved Phosphorus. University of Minnesota St. Anthony Falls Laboratory Engineering, Environmental and Geophysical Fluid Dynamics Project Report No. 549. Prepared for the City of Prior Lake, Prior Lake, MN.
Fleming, N.K., and J.W. Cox. 1998. Chemical Losses off Dairy Catchments Located on a Texture‐Contrast Soil: Carbon, Phosphorus, Sulfur, and other chemicals. Aust. Journal of Soil Research. 36:979–995.
Hart, M.R., B.F. Quin, M.L. Nguyen. 2004. Phosphorus Runoff From Agricultural Land and Direct Fertilizer Effects: A Review. Journal of Environmental Quality. 33:1954‐1972
Lake Independence Phosphorus TMDL. 2007. Three Rivers Park District. Minnesota Pollution Control Agency.
Lake Independence TMDL Implementation Plan, 2007. Three Rivers Park District. Minnesota Pollution Control Agency .
Lake Sarah Nutrient TMDL. 2011. Three Rivers Park District. Minnesota Pollution Control Agency.
Lake Sarah Nutrient TMDL Implementation Plan. 2011. Three Rivers Park District. Minnesota Pollution Control Agency .
Miller, T.P., J.R. Peterson, C.F. Lenhart and Y. Nomura. 2012. The Agricultural BMP Handbook for Minnesota. Minnesota Department of Agriculture.
Minnesota Pollution Control Agency (MPCA). 2014. Design Criteria for Stormwater Ponds. Web.
Minnesota Stormwater Steering Committee. 2005. Minnesota Stormwater Manual. Minnesota Pollution Control Agency. St. Paul, MN.
Nieber, J. et. al. 2011. Evaulation of Buffer Width on Hydrologic Function, Water Quality, and Ecologocial Integrity of Wetlands. Minnesota Department of Transportation. St. Paul, Minnesota.
Quin, B.F., A. Braithwaite, L. Nguyen, J. Blennerhassett, and C.J. Watson. 2002. The Modification of Commodity Phosphorus and Nitrogen Fertilizers to Reduce Nutrient Loss to the Environment. p. 115–121. In L.D. Currie and J.A. Hanly (ed.) Tools for Nutrient and Pollutant Management:

Lake Sarah and Lake Independence Stormwater Retrofit Analysis
References 115
Applications to Agriculture and Environmental Quality. Occasional Rep. 17. Fertilizer and Lime Research Center, Massey Univ., Palmerston.
Schueler et. al. 2005. Methods to Develop Restoration Plans for Small Urban Watersheds. Manual 2, Urban Subwatershed Restoration Manual Series. Center for Watershed Protection. Ellicott City, MD.
Schueler et. al. 2007. Urban Stormwater Retrofit Practices. Manual 3, Urban Subwatershed Restoration Manual Series. Center for Watershed Protection. Ellicott City, MD.
Waidler, D., M. White, E. Steglich, S. Wang, J. Williams, C.A. Jones, R. Srinivasan. 2009. Conservation Practice Modeling Guide for SWAT and APEX. Web.
Wilcock, R.J., J.W.Nagels, H.J.E.Rodda, M.B. O’Connor, B.S. Thorrold, and J.W. Barnett. 1999. Water Quality of a Lowland Stream in a New Zealand Dairy Farming Catchment. New Zealand Journal of Marine and Freshwater Research. 33:683–696.
Windhorn, R. D. 2000. Rapid Assessment, Point Method: Inventory and Evaluation of Erosion and Sedimentation for Illinois.

Lake Sarah and Lake Independence Stormwater Retrofit Analysis
116 Appendix
Appendix – Modeling Methods
Water Quality Models Pollutant load and removal efficiency at project locations was estimated using a suite of water quality
models. Different models were used as each has specialized inputs and features that provide reliable,
land use‐specific results, but have less utility in other settings. For example, rain gardens are generally
installed in urban areas where pollutant runoff and retention are influenced by variables such as
impervious surface, development density, traffic volumes, and hydraulic connectivity. The Source
Loading and Management Model for Windows (WinSLAMM), is a water quality model for urban areas
that is well‐suited to evaluate these elements. On the other hand, WinSLAMM has a limited amount of
land use inputs. This makes the model poorly‐suited for characterizing stormwater flow through a rural
landscape that varies from row‐crop agricultural to hay and pasture fields to wooded wetlands. In that
case, a basin‐scale model, such as the Soil & Water Assessment Tool (SWAT), is more appropriate.
The following sections describe each water quality model applied within this analysis, the reason it was
chosen for each BMP, and the inputs necessary to run the model. Sections are organized based on the
model used and BMPs modeled with the software.
Soil & Water Assessment Tool (SWAT)
Background Information and Input Parameters Stormwater runoff generated in rural catchments was estimated using the ArcView extension of the Soil & Water Assessment Tool (ArcSWAT) modeling software. This model combines inputs of hydrography, topography, soils, and land cover in a GIS interface and determines runoff volume and pollutant loading based on these inputs. Beginning with a digital elevation model, ArcSWAT delineated basins for both the Lake Sarah and Lake Independence watersheds based on predefined threshold values for minimum basin size. To improve model efficiency, hydrologic response units (HRUs) were derived within each basin based on a unique combination of land cover and soil type. An area was computed for each HRU, as well as an average slope to deliver runoff directly to the basin’s outlet. For example, a single 10 acre basin may be split into 20 HRUs, each with a specific land cover and soil type.
DEM data was downloaded as 3.25 mi2 tiles from the Minnesota Geospatial Information Office (MNGEO) webpage. Tiles were merged using the “Mosaic to New Raster” tool in the ArcView toolbox. To route overland flow under roadways and driveways, culvert locations were determined through desktop analysis and field surveys and “burned” into the landscape.
Land Cover data were provided by the US Geological Survey’s National Land Cover Database (NLCD). We used the latest year in which an ArcSWAT look‐up table was available: 2006. NLCD 2006 is a 16‐class (in the contiguous 48 states) dataset that allowed for compromise between a large and well defined dataset (e.g. Minnesota Land Cover Classification System with >600 classes) and a smaller one which reduces computational time. Because of annual changes to crop coverage, such as rotations between corn and soybeans, all tilled agricultural fields were evaluated similarly. Soils data were provided by the Hennepin County Digital Soil Survey and were characterized in ArcSWAT using the Soil Survey Geographic Database (SSURGO). Precipitation data from 2004‐2010 were uploaded from the Weather Generator model within ArcSWAT based on readings from local climatic stations over the given period.

Lake Sarah and Lake Independence Stormwater Retrofit Analysis
Appendix 117
Infiltration and surface runoff were determined within SWAT using a modified version of the SCS curve number (CN) method. Erosion and sediment yield were estimated for each HRU using the Modified Universal Soil Loss Equation (MUSLE). ArcSWAT determined phosphorus transport and transformation using a host of processes in both mineral and organic form, which were summed to determine total phosphorus (TP) load.
BMPs were modeled throughout the Lake Sarah and Lake Independence watersheds. “Initial conditions” were run with current topography and land cover to determine the existing pollutant and volume loads for each project site. The area draining to a specific BMP, called the “treatment area,” was determined for each project by setting the BMP location as the basin confluence within ArcSWAT. All inputs, including the DEM, land cover, and soils datasets, were then clipped to this boundary to determine only the loading at that BMP site.
Table 31: GIS File Sources and Use for ArcSWAT Modeling and Desktop Analysis.
Dataset Source Purpose Notes
Digital elevation model
Minnesota Geologic Information Office (MNGEO)
Model input of topography
Horizontal resolution: meets or exceeds 0.6 m; Vertical resolution: meets or exceeds 0.1 m
Soils United State Department of Agriculture (USDA) and the Nature Resources Conservation Service (NRCS) ‐ Soils Survey Geographic Database (SSURGO)
Model input, determining BMP viability, locating hydric soils
Land cover National Land Cover Dataset (NLCD) 2006
Model input
Parcel data Hennepin County Display homeowner information
Downloaded January 2014
Streams Minnesota Department of Natural Resources (DNR)
Model input (flow routing), map display
Public waters inventory, watercourse delineations
Lakes and wetlands
Minnesota Department of Natural Resources (DNR)
Map display Public waters inventory, basin delineations
Aerial photography
USDA National Agriculture Imagery Program (NAIP)
Verify land cover information, map display
Municipal boundary
MNGEO Used City of Independence boundary as research area, map display
Roads The Lawrence Group, Minnesota Department of Transportation (MNDOT), Metropolitan Council
Map display, BMP description
Culverts Desktop analysis and field survey
Model input, BMP siting
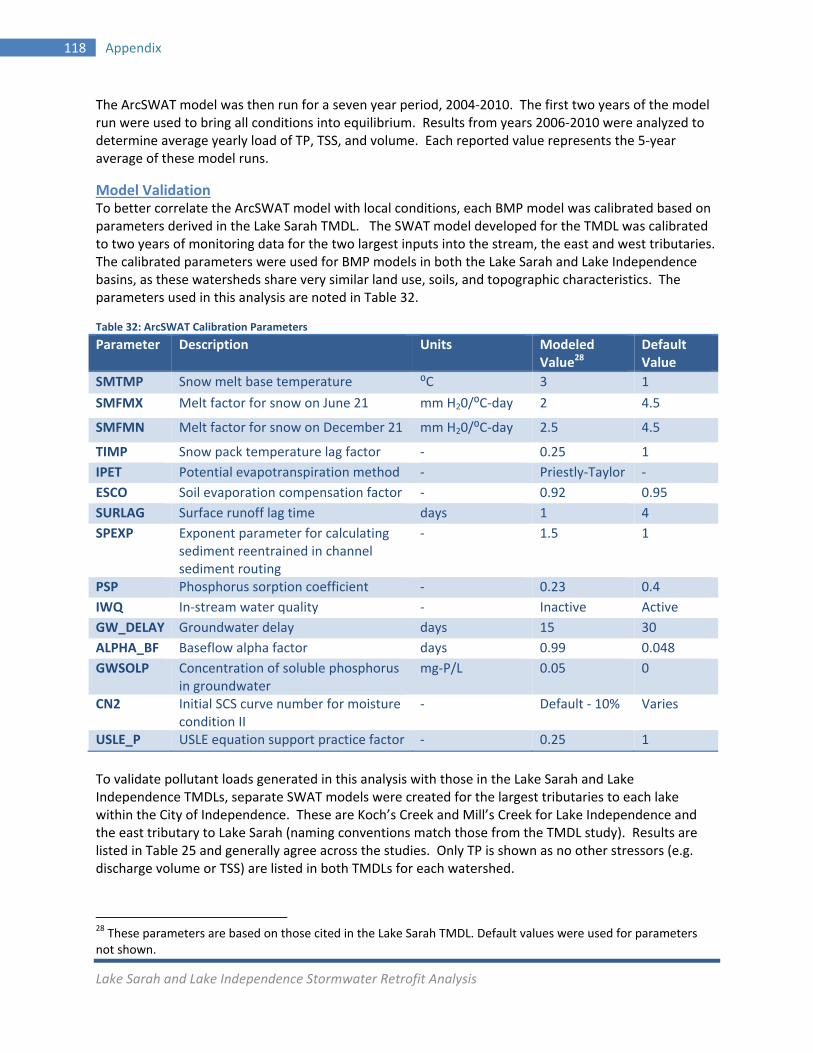
Lake Sarah and Lake Independence Stormwater Retrofit Analysis
118 Appendix
The ArcSWAT model was then run for a seven year period, 2004‐2010. The first two years of the model run were used to bring all conditions into equilibrium. Results from years 2006‐2010 were analyzed to determine average yearly load of TP, TSS, and volume. Each reported value represents the 5‐year average of these model runs.
Model Validation To better correlate the ArcSWAT model with local conditions, each BMP model was calibrated based on parameters derived in the Lake Sarah TMDL. The SWAT model developed for the TMDL was calibrated to two years of monitoring data for the two largest inputs into the stream, the east and west tributaries. The calibrated parameters were used for BMP models in both the Lake Sarah and Lake Independence basins, as these watersheds share very similar land use, soils, and topographic characteristics. The parameters used in this analysis are noted in Table 32.
Table 32: ArcSWAT Calibration Parameters
Parameter Description Units Modeled Value28
Default Value
SMTMP Snow melt base temperature ⁰C 3 1
SMFMX Melt factor for snow on June 21 mm H20/⁰C‐day 2 4.5
SMFMN Melt factor for snow on December 21 mm H20/⁰C‐day 2.5 4.5
TIMP Snow pack temperature lag factor ‐ 0.25 1
IPET Potential evapotranspiration method ‐ Priestly‐Taylor ‐
ESCO Soil evaporation compensation factor ‐ 0.92 0.95
SURLAG Surface runoff lag time days 1 4
SPEXP Exponent parameter for calculating sediment reentrained in channel sediment routing
‐ 1.5 1
PSP Phosphorus sorption coefficient ‐ 0.23 0.4
IWQ In‐stream water quality ‐ Inactive Active
GW_DELAY Groundwater delay days 15 30
ALPHA_BF Baseflow alpha factor days 0.99 0.048
GWSOLP Concentration of soluble phosphorus in groundwater
mg‐P/L 0.05 0
CN2 Initial SCS curve number for moisture condition II
‐ Default ‐ 10% Varies
USLE_P USLE equation support practice factor ‐ 0.25 1
To validate pollutant loads generated in this analysis with those in the Lake Sarah and Lake Independence TMDLs, separate SWAT models were created for the largest tributaries to each lake within the City of Independence. These are Koch’s Creek and Mill’s Creek for Lake Independence and the east tributary to Lake Sarah (naming conventions match those from the TMDL study). Results are listed in Table 25 and generally agree across the studies. Only TP is shown as no other stressors (e.g. discharge volume or TSS) are listed in both TMDLs for each watershed.
28 These parameters are based on those cited in the Lake Sarah TMDL. Default values were used for parameters not shown.
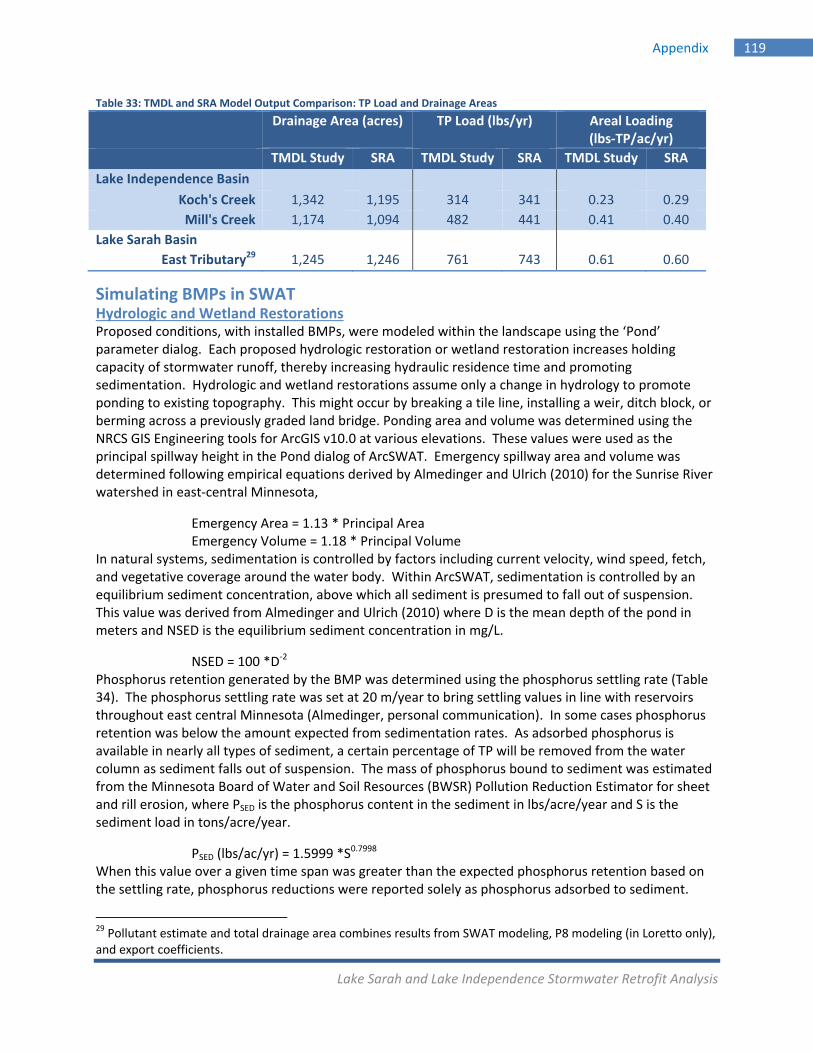
Lake Sarah and Lake Independence Stormwater Retrofit Analysis
Appendix 119
Table 33: TMDL and SRA Model Output Comparison: TP Load and Drainage Areas
Drainage Area (acres) TP Load (lbs/yr) Areal Loading (lbs‐TP/ac/yr)
TMDL Study SRA TMDL Study SRA TMDL Study SRA
Lake Independence Basin
Koch's Creek 1,342 1,195 314 341 0.23 0.29
Mill's Creek 1,174 1,094 482 441 0.41 0.40
Lake Sarah Basin
East Tributary29 1,245 1,246 761 743 0.61 0.60
Simulating BMPs in SWAT Hydrologic and Wetland Restorations Proposed conditions, with installed BMPs, were modeled within the landscape using the ‘Pond’ parameter dialog. Each proposed hydrologic restoration or wetland restoration increases holding capacity of stormwater runoff, thereby increasing hydraulic residence time and promoting sedimentation. Hydrologic and wetland restorations assume only a change in hydrology to promote ponding to existing topography. This might occur by breaking a tile line, installing a weir, ditch block, or berming across a previously graded land bridge. Ponding area and volume was determined using the NRCS GIS Engineering tools for ArcGIS v10.0 at various elevations. These values were used as the principal spillway height in the Pond dialog of ArcSWAT. Emergency spillway area and volume was determined following empirical equations derived by Almedinger and Ulrich (2010) for the Sunrise River watershed in east‐central Minnesota,
Emergency Area = 1.13 * Principal Area Emergency Volume = 1.18 * Principal Volume In natural systems, sedimentation is controlled by factors including current velocity, wind speed, fetch, and vegetative coverage around the water body. Within ArcSWAT, sedimentation is controlled by an equilibrium sediment concentration, above which all sediment is presumed to fall out of suspension. This value was derived from Almedinger and Ulrich (2010) where D is the mean depth of the pond in meters and NSED is the equilibrium sediment concentration in mg/L.
NSED = 100 *D‐2 Phosphorus retention generated by the BMP was determined using the phosphorus settling rate (Table 34). The phosphorus settling rate was set at 20 m/year to bring settling values in line with reservoirs throughout east central Minnesota (Almedinger, personal communication). In some cases phosphorus retention was below the amount expected from sedimentation rates. As adsorbed phosphorus is available in nearly all types of sediment, a certain percentage of TP will be removed from the water column as sediment falls out of suspension. The mass of phosphorus bound to sediment was estimated from the Minnesota Board of Water and Soil Resources (BWSR) Pollution Reduction Estimator for sheet and rill erosion, where PSED is the phosphorus content in the sediment in lbs/acre/year and S is the sediment load in tons/acre/year.
PSED (lbs/ac/yr) = 1.5999 *S0.7998
When this value over a given time span was greater than the expected phosphorus retention based on the settling rate, phosphorus reductions were reported solely as phosphorus adsorbed to sediment.
29 Pollutant estimate and total drainage area combines results from SWAT modeling, P8 modeling (in Loretto only), and export coefficients.
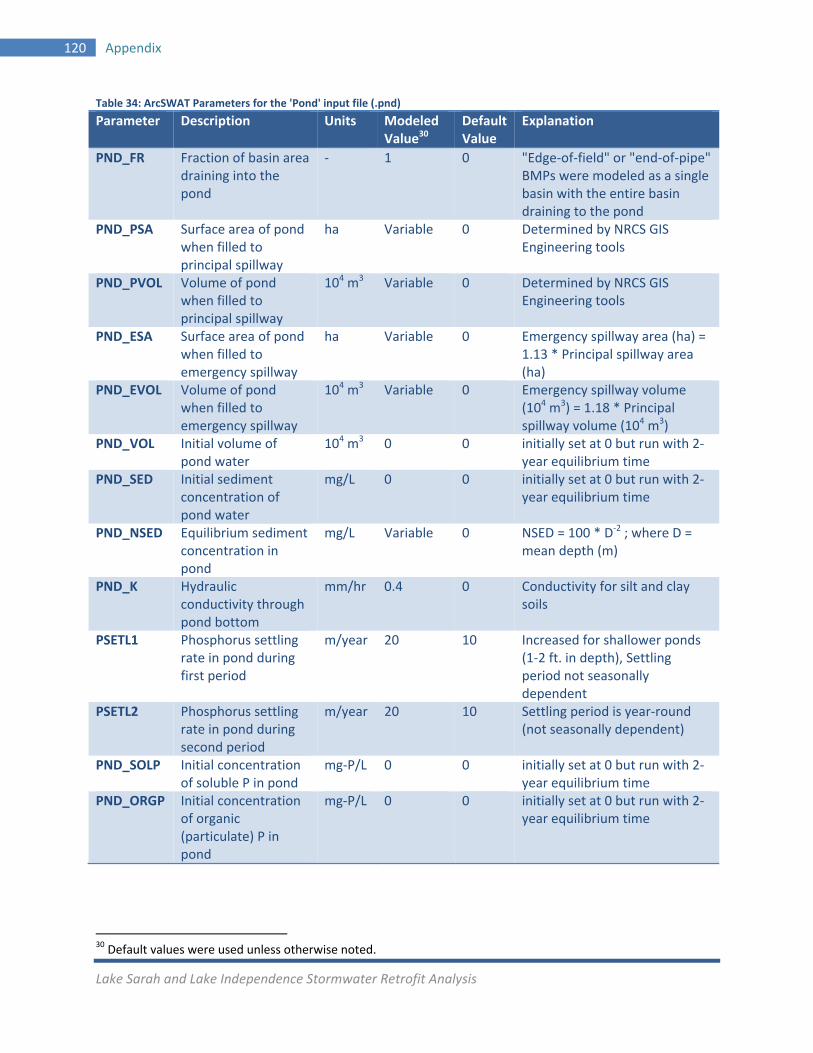
Lake Sarah and Lake Independence Stormwater Retrofit Analysis
120 Appendix
Table 34: ArcSWAT Parameters for the 'Pond' input file (.pnd)
Parameter Description Units Modeled Value30
Default Value
Explanation
PND_FR Fraction of basin area draining into the pond
‐ 1 0 "Edge‐of‐field" or "end‐of‐pipe" BMPs were modeled as a single basin with the entire basin draining to the pond
PND_PSA Surface area of pond when filled to principal spillway
ha Variable 0 Determined by NRCS GIS Engineering tools
PND_PVOL Volume of pond when filled to principal spillway
104 m3 Variable 0 Determined by NRCS GIS Engineering tools
PND_ESA Surface area of pond when filled to emergency spillway
ha Variable 0 Emergency spillway area (ha) = 1.13 * Principal spillway area (ha)
PND_EVOL Volume of pond when filled to emergency spillway
104 m3 Variable 0 Emergency spillway volume (104 m3) = 1.18 * Principal spillway volume (104 m3)
PND_VOL Initial volume of pond water
104 m3 0 0 initially set at 0 but run with 2‐year equilibrium time
PND_SED Initial sediment concentration of pond water
mg/L 0 0 initially set at 0 but run with 2‐year equilibrium time
PND_NSED Equilibrium sediment concentration in pond
mg/L Variable 0 NSED = 100 * D‐2 ; where D = mean depth (m)
PND_K Hydraulic conductivity through pond bottom
mm/hr 0.4 0 Conductivity for silt and clay soils
PSETL1 Phosphorus settling rate in pond during first period
m/year 20 10 Increased for shallower ponds (1‐2 ft. in depth), Settling period not seasonally dependent
PSETL2 Phosphorus settling rate in pond during second period
m/year 20 10 Settling period is year‐round (not seasonally dependent)
PND_SOLP Initial concentration of soluble P in pond
mg‐P/L 0 0 initially set at 0 but run with 2‐year equilibrium time
PND_ORGP Initial concentration of organic (particulate) P in pond
mg‐P/L 0 0 initially set at 0 but run with 2‐year equilibrium time
30 Default values were used unless otherwise noted.
Lake Sarah and Lake Independence Stormwater Retrofit Analysis
Appendix 121
When assessing the results of these BMP models, please keep in mind that: 1) Proposed ponding for each BMP is based on current topography, which has been greatly
altered over the last 150 years through clear‐cutting, drainage, grading, and tilling. If the
goal were to achieve restoration of an area to its natural, pre‐settlement condition, it may
be necessary to replicate landscape features long erased by landuse by installing features
such as dikes, berms, and weirs that exceed design parameters considered in this analysis.
This could result in area and storage conditions that are different from those modeled in this
study. The study results can at least be a guideline for restoration activities and pollutant
reduction potential.
2) Unfortunately, as there is no existing monitoring data at each prospective BMP location,
greater refinement of model calibration could not be performed. If definitive reduction
totals are needed for each BMP, then monitoring water quality at the inlet and outlet of
installed practices should be pursued where practical. These data could then be used to
better calibrate the model to localized conditions and to better design subsequent BMPs.
Filter Strips ArcSWAT contains a separate submodel for filter strips, which can be initiated by creating a scheduled management operations (.ops) file. This file allows for runoff within specified HRUs to flow through the filter strip prior to reaching the drainage channel. The basin was clipped to include only portions of the landscape draining to the filter strip, which allowed for all HRUs within the submodel to similarly drain to the practice. This also ensures that all land use types are included in pollutant retention calculations. Four input parameters are available for specifying filter strip characteristics. Recommended values were provided by the Conservation Practice Modeling Guide for SWAT and APEX:
1) VFSI: Activates filter strip (1 = active; 0 = inactive).
2) VFSRATIO: Field area to filter strip ratio. Field area was determined from delineating the
drainage basin. The proposed filter strip area was measured using ArcGIS. This area
included both sides of the waterway.
3) VFSCON: Fraction of the total runoff from the entire field entering the most concentrated
10% of the filter strip (recommended value of 0.25‐0.75).
4) VFSCH: Fraction of flow through the most concentrated 10% of the filter strip that is fully
channelized (recommended value of 0).
Values for VFSCON and VFSCH were increased to 0.75 and 0.25, respectively, to better mimic regional characteristics of buffers in central Minnesota (Nieber et al., 2011).
Similar to all other BMPs run with ArcSWAT, the model was run for a seven year period, 2004‐2010. The first two years of the model run were used to bring all conditions into equilibrium. Results from years 2006‐2010 were analyzed to determine average yearly load of TP, TSS, and volume. Each reported value represents the 5‐year average of these model runs.
Sediment Basins Sediment basins are often viewed as depressions (natural or man‐made) in the landscape that accept stormwater runoff for the purpose of promoting sedimentation. In this application, standing water would be present for extended periods of time. For this analysis, sediment basins were modeled as structures that slow the runoff of drainage from farm fields but do not hold water indefinitely. When
Lake Sarah and Lake Independence Stormwater Retrofit Analysis
122 Appendix
tied to drain tile, these structures (which are often called Water and Sediment Control Basins (WASCOBs)) will reduce the velocity of the drainage enough for sediment to drop out of suspension while allowing for the stormwater to drain slowly from behind the berm into the tile line. ArcSWAT does not have a submodel for this type of practice. As recommended by the Conservation Practice Modeling Guide for SWAT and APEX, these structures can be modeled as ponds in ArcSWAT. To be comparative to WASCOBs, though, we assumed no retention of water from the structure. It was assumed all water reaching the structure would be advected downstream through the tile system. Pond parameters set within ArcSWAT are comparative to those listed in Table 34. Equilibrium sediment concentration associated with these structures is still based on ponding depth up to either the berm height or riser overflow height (depending on design).
Similar to all other BMPs run with ArcSWAT, the model was run for a seven year period, 2004‐2010. The first two years of the model run were used to bring all conditions into equilibrium. Results from years 2006‐2010 were analyzed to determine average yearly load of TP, TSS, and volume. Each reported value represents the 5‐year average of these model runs.
New Ponds (Seasonal and Regional) Ponds were proposed in the landscape where sufficient drainage area could sustain a permanent pool of water (MPCA, 2014). Ponds were proposed following guidance from the Minnesota Pollution Control Agency, in which depths are equal to or less than 8‐10 ft. to prohibit stratification and at least 1,800 cu‐ft. of pond storage is available for each acre of drainage area.
Ponds were modeled at multiple depths and areas with ArcSWAT, following similar conditions noted in the ‘Hydrologic and Wetland Restorations’ section above. Similar to all other BMPs run with ArcSWAT, the model was run for a seven year period, 2004‐2010. The first two years of the model run were used to bring all conditions into equilibrium. Results from years 2006‐2010 were analyzed to determine average yearly load of TP, TSS, and volume. Each reported value represents the 5‐year average of these model runs.
Seasonal ponds used similar input parameters (Table 34) to both regional and standard wet ponds, but assumed ponding only occurred during non‐growing season months, October‐April. Reported values for TP, TSS, and volume reduction are averages from these months only.
Simulating BMPs in WinSLAMM Pollutant removal from rain gardens and iron‐enhanced sand filters was estimated using the stormwater model Source Load and Management Model for Windows (WinSLAMM). WinSLAMM uses an abundance of stormwater data from the upper‐midwest and elsewhere to quantify runoff volumes and pollutant loads from urban areas. It has detailed accounting of pollutant loading from various land uses, and allows the user to build a model “landscape” that reflects the actual landscape being considered. WinSLAMM uses rainfall and temperature data from a typical year, routing stormwater through the user’s model for each storm. Land use and soils data were from the same files provided in the SWAT modeling section (Table 31) but were clipped within ArcGIS to within the drainage basin boundary (termed the ‘treatment area’). WinSLAMM version 10 was used for this analysis to determine pollutant loading and BMP retention capacity at each project site. Additional inputs for WinSLAMM are provided in Table 35.
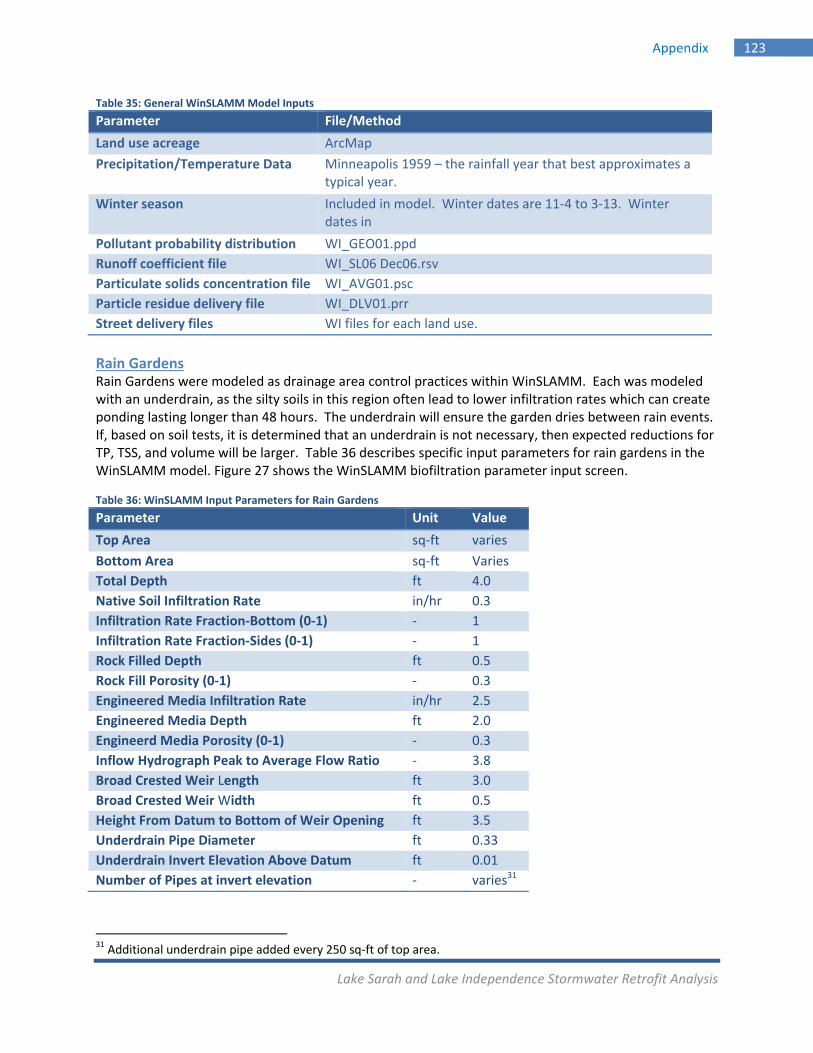
Lake Sarah and Lake Independence Stormwater Retrofit Analysis
Appendix 123
Table 35: General WinSLAMM Model Inputs
Parameter File/Method
Land use acreage ArcMap
Precipitation/Temperature Data Minneapolis 1959 – the rainfall year that best approximates a typical year.
Winter season Included in model. Winter dates are 11‐4 to 3‐13. Winter dates in
Pollutant probability distribution WI_GEO01.ppd
Runoff coefficient file WI_SL06 Dec06.rsv
Particulate solids concentration file WI_AVG01.psc
Particle residue delivery file WI_DLV01.prr
Street delivery files WI files for each land use.
Rain Gardens Rain Gardens were modeled as drainage area control practices within WinSLAMM. Each was modeled with an underdrain, as the silty soils in this region often lead to lower infiltration rates which can create ponding lasting longer than 48 hours. The underdrain will ensure the garden dries between rain events. If, based on soil tests, it is determined that an underdrain is not necessary, then expected reductions for TP, TSS, and volume will be larger. Table 36 describes specific input parameters for rain gardens in the WinSLAMM model. Figure 27 shows the WinSLAMM biofiltration parameter input screen.
Table 36: WinSLAMM Input Parameters for Rain Gardens
Parameter Unit Value
Top Area sq‐ft varies
Bottom Area sq‐ft Varies
Total Depth ft 4.0
Native Soil Infiltration Rate in/hr 0.3
Infiltration Rate Fraction‐Bottom (0‐1) ‐ 1
Infiltration Rate Fraction‐Sides (0‐1) ‐ 1
Rock Filled Depth ft 0.5
Rock Fill Porosity (0‐1) ‐ 0.3
Engineered Media Infiltration Rate in/hr 2.5
Engineered Media Depth ft 2.0
Engineerd Media Porosity (0‐1) ‐ 0.3
Inflow Hydrograph Peak to Average Flow Ratio ‐ 3.8
Broad Crested Weir Length ft 3.0
Broad Crested Weir Width ft 0.5
Height From Datum to Bottom of Weir Opening ft 3.5
Underdrain Pipe Diameter ft 0.33
Underdrain Invert Elevation Above Datum ft 0.01
Number of Pipes at invert elevation ‐ varies31
31 Additional underdrain pipe added every 250 sq‐ft of top area.
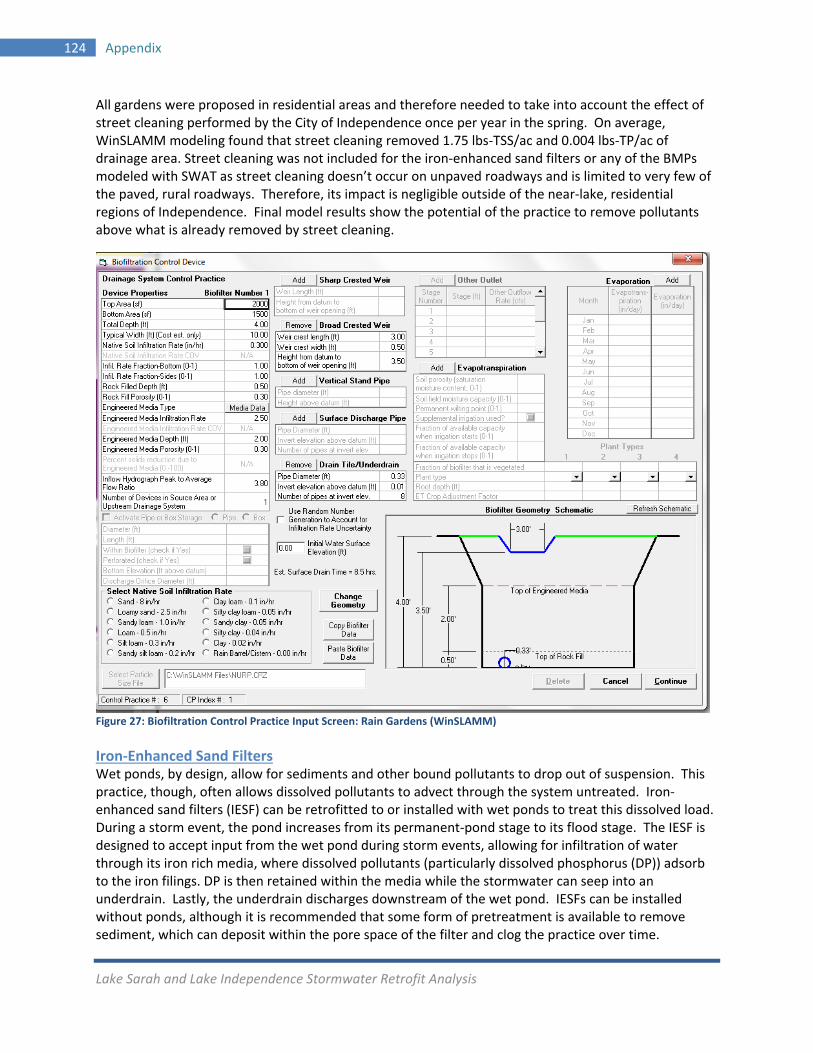
Lake Sarah and Lake Independence Stormwater Retrofit Analysis
124 Appendix
All gardens were proposed in residential areas and therefore needed to take into account the effect of street cleaning performed by the City of Independence once per year in the spring. On average, WinSLAMM modeling found that street cleaning removed 1.75 lbs‐TSS/ac and 0.004 lbs‐TP/ac of drainage area. Street cleaning was not included for the iron‐enhanced sand filters or any of the BMPs modeled with SWAT as street cleaning doesn’t occur on unpaved roadways and is limited to very few of the paved, rural roadways. Therefore, its impact is negligible outside of the near‐lake, residential regions of Independence. Final model results show the potential of the practice to remove pollutants above what is already removed by street cleaning.
Figure 27: Biofiltration Control Practice Input Screen: Rain Gardens (WinSLAMM)
Iron‐Enhanced Sand Filters Wet ponds, by design, allow for sediments and other bound pollutants to drop out of suspension. This practice, though, often allows dissolved pollutants to advect through the system untreated. Iron‐enhanced sand filters (IESF) can be retrofitted to or installed with wet ponds to treat this dissolved load. During a storm event, the pond increases from its permanent‐pond stage to its flood stage. The IESF is designed to accept input from the wet pond during storm events, allowing for infiltration of water through its iron rich media, where dissolved pollutants (particularly dissolved phosphorus (DP)) adsorb to the iron filings. DP is then retained within the media while the stormwater can seep into an underdrain. Lastly, the underdrain discharges downstream of the wet pond. IESFs can be installed without ponds, although it is recommended that some form of pretreatment is available to remove sediment, which can deposit within the pore space of the filter and clog the practice over time.
Lake Sarah and Lake Independence Stormwater Retrofit Analysis
Appendix 125
There is currently no drainage practice input for these features in WinSLAMM or SWAT. As they behave similarly to rain gardens, they can be modeled as such. But, as they often operate in tandem with stormwater ponds, estimating when and how much water and pollutants they will receive can be problematic. To estimate flow into the devices, SWAT was utilized to determine the proportion of streamflow contributed from groundwater and overland flow. The IESF is designed to only come online during storm events. SWAT determines flow to stream systems based on contributions from three regions:
Total Flow = Groundwater Input + Overland Flow + Lateral Flow
where lateral flow is input to the stream from the region between the top of the water table and ground surface. It is assumed that overland and lateral flow is supplied by precipitation events. With this in mind, stream baseflow is sustained by groundwater alone. SWAT model runs determined that stormflow contributed 29‐35% of total flow across all years. The inputs from overland and lateral flow were used as the volumetric input into the IESF. WinSLAMM was then utilized to determine what percentage of this stormflow could be treated by the filter. Stormflow input into the practice is most dependent upon the volume which can be passed through the system’s underdrains. Stormflow treated by the device is a function of total area, depth, infiltration rate, and engineered media characteristics. WinSLAMM input used for this analysis is listed in Table 37.
TP load in stream systems occurs during both baseflow and storm events in two predominant species, dissolved inorganic (usually orthophosphate, generally grouped as DP in this analysis) and particulate organic. The proportion of phosphorus load supplied by storm events was determined by comparing baseflow and storm event TP loads in similar streams of central MN. These data yielded approximately 70% of TP as storm event based (ACD 2013).
To determine what percentage of phosphorus load was in dissolved species (which is what the IESF can treat), a meta‐analysis by Hart et al. (2004) was utilized. This study discovered a large range of DP load as a percentage of TP load in stormflow events of rural streams. Their findings for catchments comparable to the Lake Independence and Lake Sarah basins are summarized in Table 38. For a predominantly agrarian (row‐crop, hay, and pasture) watershed, DP load is most dependent upon average catchment slope, as greater changes in elevation lead to increases in sediment (and particulate phosphorus) erosion and export as compared to DP export. Thus, for lowland watersheds such as Lake Independence and Lake Sarah, where mean slope is less than 7%, DP can compose between 47‐62% of the TP load (Table 38). For simplicity, we used 50% as the fraction of DP in TP load.
Lastly, field tests of installed sand trenches conducted by the University of Minnesota concluded that a sand media mixed with 5% iron filings is capable of retaining 80% (or more) of the DP load of stormwater flowing through the media (Erickson and Gulliver, 2010). Thus, TP retention by the IESF can be determined by the equation,
PRET = 0.8 * PIN * qS
where PRET is the DP load removed by the IESF, PIN is the DP input, and qS is the fraction of stormflow volume passing through the IESF. qS is a function of the storm event duration and intensity, stormwater pond storage (if in‐line with a pond), and IESF storage volume (bottom area, top area, and depth). The 0.8 multiplier assumes the IESF removes only 80% of the DP load. PIN assumes that 70% of the TP load is available during storm events and that only 50% of TP load is in dissolved form, to be treated by the IESF.
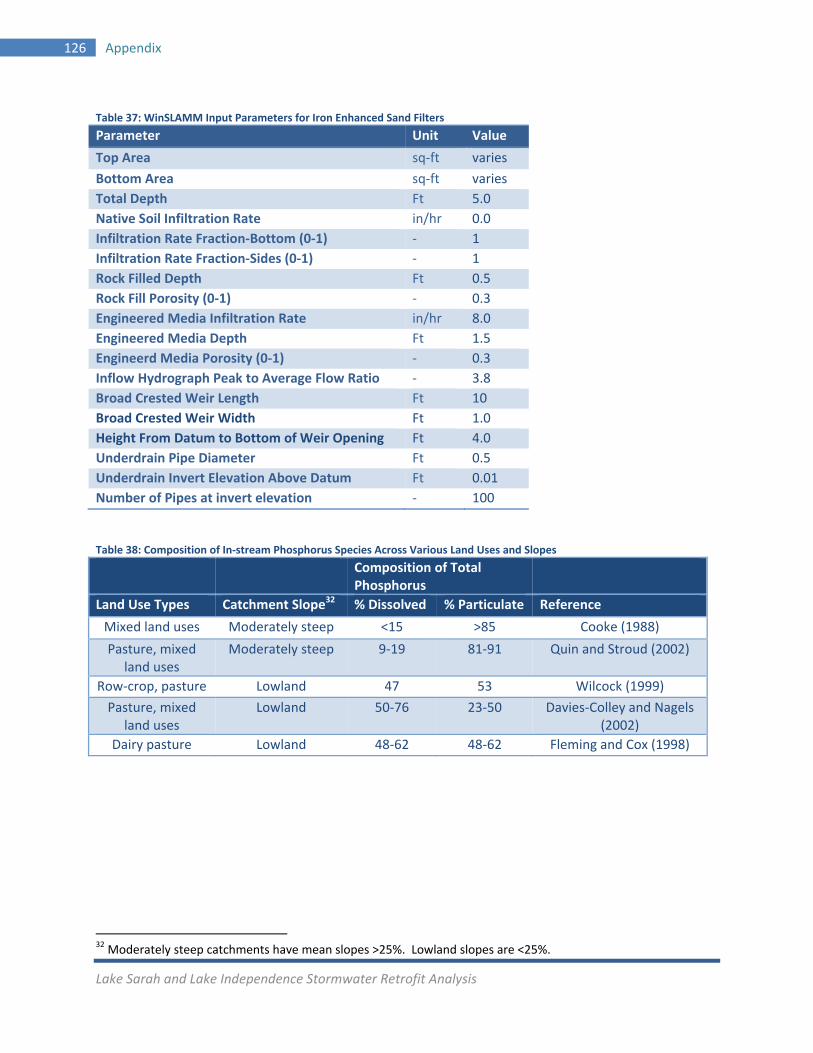
Lake Sarah and Lake Independence Stormwater Retrofit Analysis
126 Appendix
Table 37: WinSLAMM Input Parameters for Iron Enhanced Sand Filters
Parameter Unit Value
Top Area sq‐ft varies
Bottom Area sq‐ft varies
Total Depth Ft 5.0
Native Soil Infiltration Rate in/hr 0.0
Infiltration Rate Fraction‐Bottom (0‐1) ‐ 1
Infiltration Rate Fraction‐Sides (0‐1) ‐ 1
Rock Filled Depth Ft 0.5
Rock Fill Porosity (0‐1) ‐ 0.3
Engineered Media Infiltration Rate in/hr 8.0
Engineered Media Depth Ft 1.5
Engineerd Media Porosity (0‐1) ‐ 0.3
Inflow Hydrograph Peak to Average Flow Ratio ‐ 3.8
Broad Crested Weir Length Ft 10
Broad Crested Weir Width Ft 1.0
Height From Datum to Bottom of Weir Opening Ft 4.0
Underdrain Pipe Diameter Ft 0.5
Underdrain Invert Elevation Above Datum Ft 0.01
Number of Pipes at invert elevation ‐ 100
Table 38: Composition of In‐stream Phosphorus Species Across Various Land Uses and Slopes
Composition of Total Phosphorus
Land Use Types Catchment Slope32 % Dissolved % Particulate Reference
Mixed land uses Moderately steep <15 >85 Cooke (1988)
Pasture, mixed land uses
Moderately steep 9‐19 81‐91 Quin and Stroud (2002)
Row‐crop, pasture Lowland 47 53 Wilcock (1999)
Pasture, mixed land uses
Lowland 50‐76 23‐50 Davies‐Colley and Nagels (2002)
Dairy pasture Lowland 48‐62 48‐62 Fleming and Cox (1998)
32 Moderately steep catchments have mean slopes >25%. Lowland slopes are <25%.
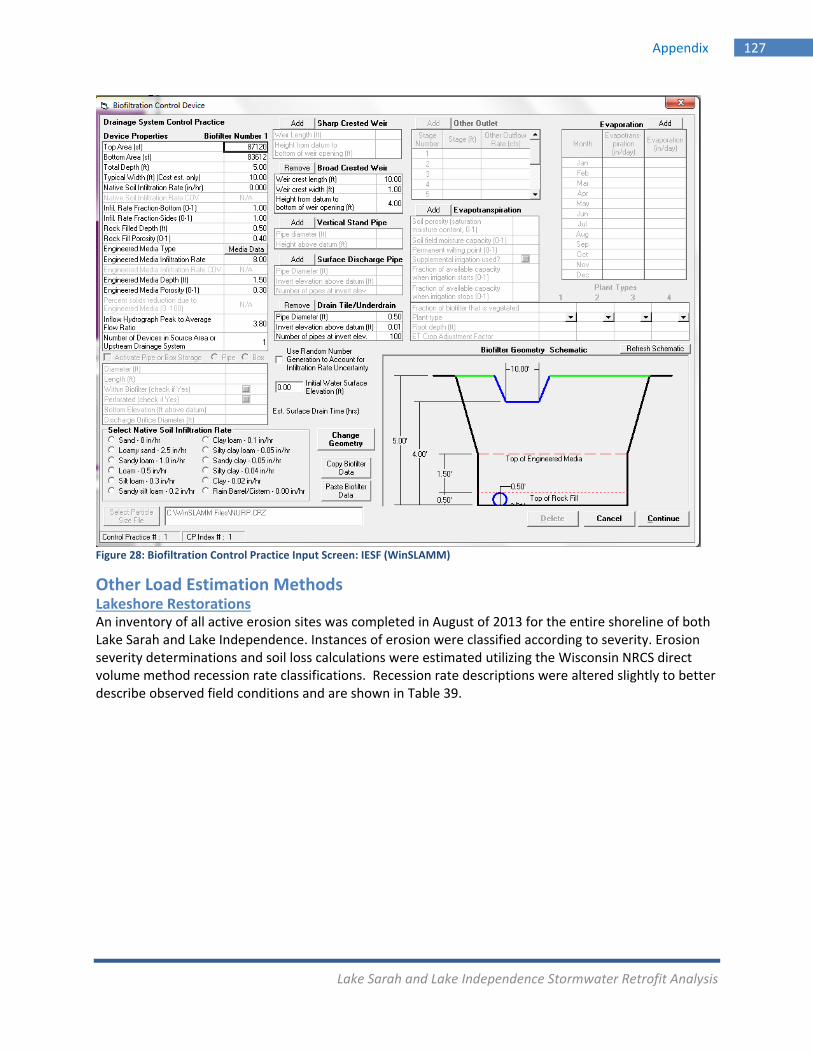
Lake Sarah and Lake Independence Stormwater Retrofit Analysis
Appendix 127
Figure 28: Biofiltration Control Practice Input Screen: IESF (WinSLAMM)
Other Load Estimation Methods Lakeshore Restorations An inventory of all active erosion sites was completed in August of 2013 for the entire shoreline of both Lake Sarah and Lake Independence. Instances of erosion were classified according to severity. Erosion severity determinations and soil loss calculations were estimated utilizing the Wisconsin NRCS direct volume method recession rate classifications. Recession rate descriptions were altered slightly to better describe observed field conditions and are shown in Table 39.
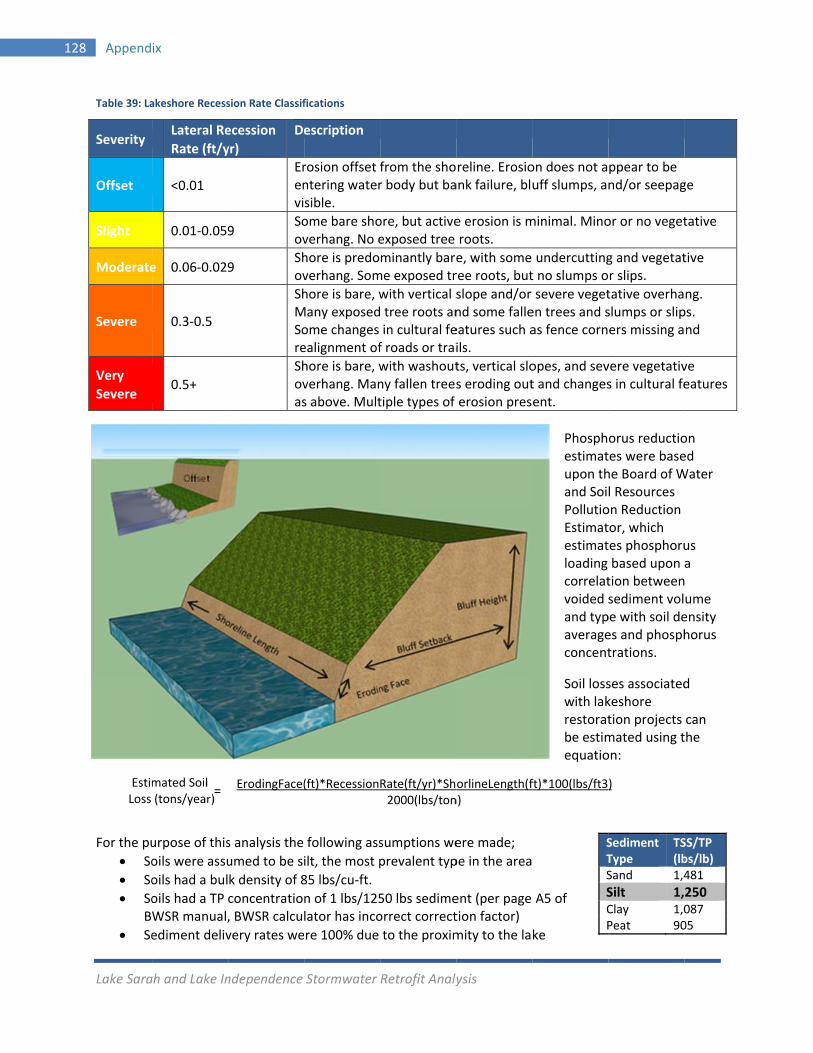
12
Lake Sara
28 Append
Table 39: La
For the pu
So
So
SoB
Se
Severity
Offset
Slight
Moderate
Severe
Very
Severe
EstimLoss
ah and Lake In
ix
akeshore Recess
urpose of this
oils were assu
oils had a bul
oils had a TP WSR manual,
ediment deliv
Lateral Re
Rate (ft/y
<0.01
0.01‐0.059
e 0.06‐0.029
0.3‐0.5
0.5+
mated Soil (tons/year)
=
Offset
ndependence
sion Rate Classif
s analysis the
umed to be si
k density of 8
concentratio, BWSR calcu
very rates we
ecession
yr)
De
Erenvi
9 Soov
9 Shov
ShMSore
Shovas
ErodingFace(
Stormwater
fications
following ass
ilt, the most p
85 lbs/cu‐ft.
n of 1 lbs/125lator has inco
re 100% due
escription
rosion offset fntering watersible.
ome bare shoverhang. No e
hore is predoverhang. Som
hore is bare, wMany exposedome changes ealignment of
hore is bare, wverhang. Mans above. Mult
(ft)*Recession
Retrofit Analy
sumptions we
prevalent typ
50 lbs sedimeorrect correct
to the proxim
from the shor body but ba
ore, but activeexposed tree
minantly bareme exposed tr
with vertical s tree roots anin cultural fef roads or trai
with washoutny fallen treestiple types of
Rate(ft/yr)*Sh2000(lbs/ton
ysis
ere made;
pe in the area
ent (per page tion factor)
mity to the la
reline. Erosioank failure, bl
e erosion is mroots.
e, with some ree roots, but
slope and/or nd some falleeatures such ails.
ts, vertical slos eroding outerosion pres
orlineLength(fn)
Phosphestimatupon thand SoiPollutioEstimatestimatloading correlatvoided sand typaverageconcent
Soil losswith lakrestoratbe estimequatio
A5 of
ke
on does not auff slumps, a
minimal. Mino
undercuttingt no slumps o
severe vegeten trees and sas fence corn
opes, and sevt and changesent.
STS
SCP
ft)*100(lbs/ft3
orus reductiotes were basehe Board of Wl Resources on Reduction tor, which tes phosphorubased upon tion betweensediment volpe with soil dees and phosphtrations.
ses associatedkeshore tion projects mated using ton:
ppear to be nd/or seepag
or or no veget
g and vegetatr slips.
tative overhaslumps or slipers missing a
vere vegetativs in cultural fe
Sediment Type
TS(lb
Sand 1,4
Silt 1,Clay 1,0Peat 90
)
on ed Water
us a ume ensity horus
d
can the
ge
tative
tive
ng. ps. nd
ve eatures
SS/TP bs/lb) 481
250 08705
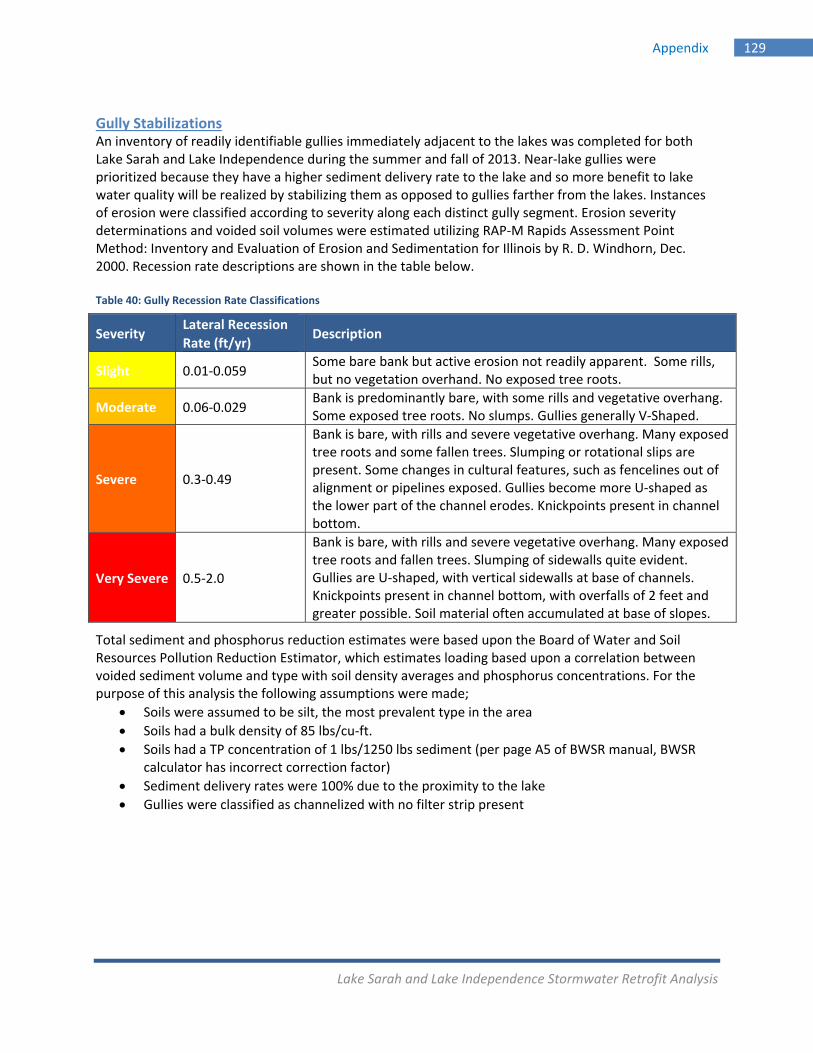
Lake Sarah and Lake Independence Stormwater Retrofit Analysis
Appendix 129
Gully Stabilizations An inventory of readily identifiable gullies immediately adjacent to the lakes was completed for both Lake Sarah and Lake Independence during the summer and fall of 2013. Near‐lake gullies were prioritized because they have a higher sediment delivery rate to the lake and so more benefit to lake water quality will be realized by stabilizing them as opposed to gullies farther from the lakes. Instances of erosion were classified according to severity along each distinct gully segment. Erosion severity determinations and voided soil volumes were estimated utilizing RAP‐M Rapids Assessment Point Method: Inventory and Evaluation of Erosion and Sedimentation for Illinois by R. D. Windhorn, Dec. 2000. Recession rate descriptions are shown in the table below. Table 40: Gully Recession Rate Classifications
Total sediment and phosphorus reduction estimates were based upon the Board of Water and Soil Resources Pollution Reduction Estimator, which estimates loading based upon a correlation between voided sediment volume and type with soil density averages and phosphorus concentrations. For the purpose of this analysis the following assumptions were made;
Soils were assumed to be silt, the most prevalent type in the area
Soils had a bulk density of 85 lbs/cu‐ft.
Soils had a TP concentration of 1 lbs/1250 lbs sediment (per page A5 of BWSR manual, BWSR calculator has incorrect correction factor)
Sediment delivery rates were 100% due to the proximity to the lake
Gullies were classified as channelized with no filter strip present
Severity Lateral Recession
Rate (ft/yr) Description
Slight 0.01‐0.059 Some bare bank but active erosion not readily apparent. Some rills, but no vegetation overhand. No exposed tree roots.
Moderate 0.06‐0.029 Bank is predominantly bare, with some rills and vegetative overhang. Some exposed tree roots. No slumps. Gullies generally V‐Shaped.
Severe 0.3‐0.49
Bank is bare, with rills and severe vegetative overhang. Many exposed tree roots and some fallen trees. Slumping or rotational slips are present. Some changes in cultural features, such as fencelines out of alignment or pipelines exposed. Gullies become more U‐shaped as the lower part of the channel erodes. Knickpoints present in channel bottom.
Very Severe 0.5‐2.0
Bank is bare, with rills and severe vegetative overhang. Many exposed tree roots and fallen trees. Slumping of sidewalls quite evident. Gullies are U‐shaped, with vertical sidewalls at base of channels. Knickpoints present in channel bottom, with overfalls of 2 feet and greater possible. Soil material often accumulated at base of slopes.
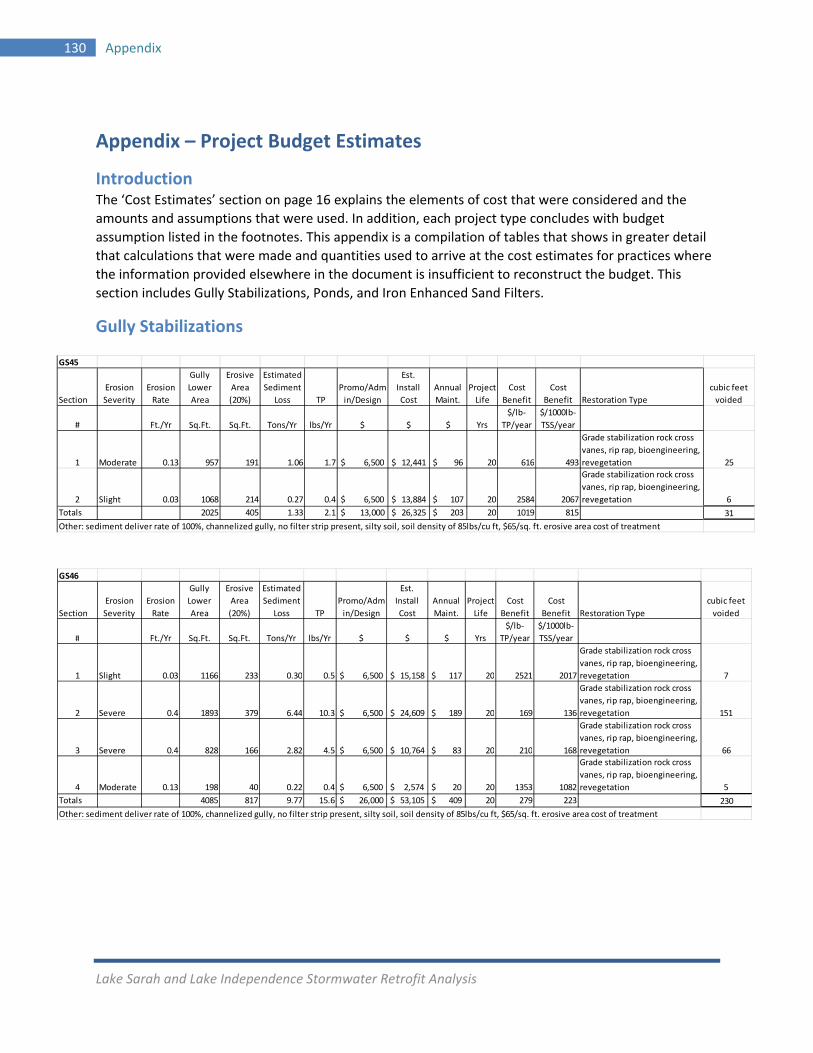
Lake Sarah and Lake Independence Stormwater Retrofit Analysis
130 Appendix
Appendix – Project Budget Estimates
Introduction The ‘Cost Estimates’ section on page 16 explains the elements of cost that were considered and the
amounts and assumptions that were used. In addition, each project type concludes with budget
assumption listed in the footnotes. This appendix is a compilation of tables that shows in greater detail
that calculations that were made and quantities used to arrive at the cost estimates for practices where
the information provided elsewhere in the document is insufficient to reconstruct the budget. This
section includes Gully Stabilizations, Ponds, and Iron Enhanced Sand Filters.
Gully Stabilizations
GS45
Section
Erosion
Severity
Erosion
Rate
Gully
Lower
Area
Erosive
Area
(20%)
Estimated
Sediment
Loss TP
Promo/Adm
in/Design
Est.
Install
Cost
Annual
Maint.
Project
Life
Cost
Benefit
Cost
Benefit Restoration Type
cubic feet
voided
# Ft./Yr Sq.Ft. Sq.Ft. Tons/Yr lbs/Yr $ $ $ Yrs
$/lb‐
TP/year
$/1000lb‐
TSS/year
1 Moderate 0.13 957 191 1.06 1.7 $ 6,500 $ 12,441 $ 96 20 616 493
Grade stabilization rock cross
vanes, rip rap, bioengineering,
revegetation 25
2 Slight 0.03 1068 214 0.27 0.4 $ 6,500 $ 13,884 $ 107 20 2584 2067
Grade stabilization rock cross
vanes, rip rap, bioengineering,
revegetation 6
Totals 2025 405 1.33 2.1 $ 13,000 $ 26,325 $ 203 20 1019 815 31
Other: sediment deliver rate of 100%, channelized gully, no filter strip present, silty soil, soil density of 85lbs/cu ft, $65/sq. ft. erosive area cost of treatment
GS46
Section
Erosion
Severity
Erosion
Rate
Gully
Lower
Area
Erosive
Area
(20%)
Estimated
Sediment
Loss TP
Promo/Adm
in/Design
Est.
Install
Cost
Annual
Maint.
Project
Life
Cost
Benefit
Cost
Benefit Restoration Type
cubic feet
voided
# Ft./Yr Sq.Ft. Sq.Ft. Tons/Yr lbs/Yr $ $ $ Yrs
$/lb‐
TP/year
$/1000lb‐
TSS/year
1 Slight 0.03 1166 233 0.30 0.5 $ 6,500 $ 15,158 $ 117 20 2521 2017
Grade stabilization rock cross
vanes, rip rap, bioengineering,
revegetation 7
2 Severe 0.4 1893 379 6.44 10.3 $ 6,500 $ 24,609 $ 189 20 169 136
Grade stabilization rock cross
vanes, rip rap, bioengineering,
revegetation 151
3 Severe 0.4 828 166 2.82 4.5 $ 6,500 $ 10,764 $ 83 20 210 168
Grade stabilization rock cross
vanes, rip rap, bioengineering,
revegetation 66
4 Moderate 0.13 198 40 0.22 0.4 $ 6,500 $ 2,574 $ 20 20 1353 1082
Grade stabilization rock cross
vanes, rip rap, bioengineering,
revegetation 5
Totals 4085 817 9.77 15.6 $ 26,000 $ 53,105 $ 409 20 279 223 230
Other: sediment deliver rate of 100%, channelized gully, no filter strip present, silty soil, soil density of 85lbs/cu ft, $65/sq. ft. erosive area cost of treatment
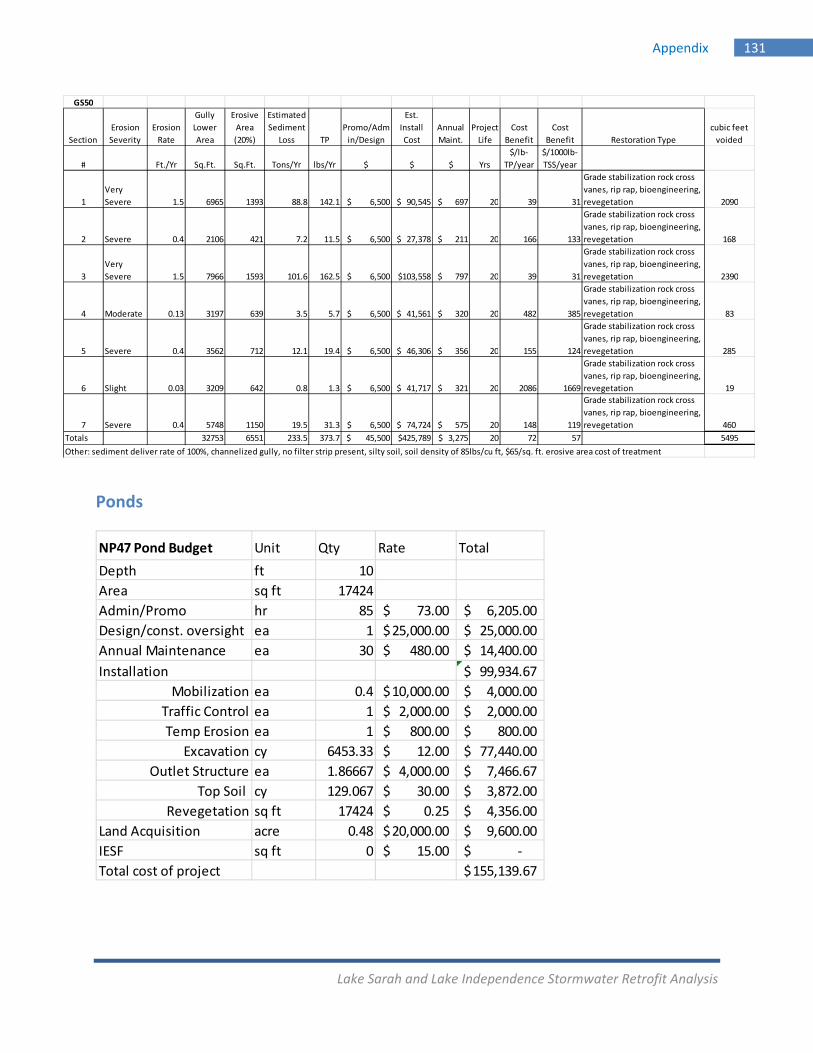
Lake Sarah and Lake Independence Stormwater Retrofit Analysis
Appendix 131
Ponds
NP47 Pond Budget Unit Qty Rate Total
Depth ft 10
Area sq ft 17424
Admin/Promo hr 85 73.00$ 6,205.00$
Design/const. oversight ea 1 25,000.00$ 25,000.00$
Annual Maintenance ea 30 480.00$ 14,400.00$
Installation 99,934.67$
Mobilization ea 0.4 10,000.00$ 4,000.00$
Traffic Control ea 1 2,000.00$ 2,000.00$
Temp Erosion ea 1 800.00$ 800.00$
Excavation cy 6453.33 12.00$ 77,440.00$
Outlet Structure ea 1.86667 4,000.00$ 7,466.67$
Top Soil cy 129.067 30.00$ 3,872.00$
Revegetation sq ft 17424 0.25$ 4,356.00$
Land Acquisition acre 0.48 20,000.00$ 9,600.00$
IESF sq ft 0 15.00$ ‐$
Total cost of project 155,139.67$
GS50
Section
Erosion
Severity
Erosion
Rate
Gully
Lower
Area
Erosive
Area
(20%)
Estimated
Sediment
Loss TP
Promo/Adm
in/Design
Est.
Install
Cost
Annual
Maint.
Project
Life
Cost
Benefit
Cost
Benefit Restoration Type
cubic feet
voided
# Ft./Yr Sq.Ft. Sq.Ft. Tons/Yr lbs/Yr $ $ $ Yrs
$/lb‐
TP/year
$/1000lb‐
TSS/year
1
Very
Severe 1.5 6965 1393 88.8 142.1 $ 6,500 $ 90,545 $ 697 20 39 31
Grade stabilization rock cross
vanes, rip rap, bioengineering,
revegetation 2090
2 Severe 0.4 2106 421 7.2 11.5 $ 6,500 $ 27,378 $ 211 20 166 133
Grade stabilization rock cross
vanes, rip rap, bioengineering,
revegetation 168
3
Very
Severe 1.5 7966 1593 101.6 162.5 $ 6,500 $103,558 $ 797 20 39 31
Grade stabilization rock cross
vanes, rip rap, bioengineering,
revegetation 2390
4 Moderate 0.13 3197 639 3.5 5.7 $ 6,500 $ 41,561 $ 320 20 482 385
Grade stabilization rock cross
vanes, rip rap, bioengineering,
revegetation 83
5 Severe 0.4 3562 712 12.1 19.4 $ 6,500 $ 46,306 $ 356 20 155 124
Grade stabilization rock cross
vanes, rip rap, bioengineering,
revegetation 285
6 Slight 0.03 3209 642 0.8 1.3 $ 6,500 $ 41,717 $ 321 20 2086 1669
Grade stabilization rock cross
vanes, rip rap, bioengineering,
revegetation 19
7 Severe 0.4 5748 1150 19.5 31.3 $ 6,500 $ 74,724 $ 575 20 148 119
Grade stabilization rock cross
vanes, rip rap, bioengineering,
revegetation 460
Totals 32753 6551 233.5 373.7 $ 45,500 $425,789 $ 3,275 20 72 57 5495
Other: sediment deliver rate of 100%, channelized gully, no filter strip present, silty soil, soil density of 85lbs/cu ft, $65/sq. ft. erosive area cost of treatment
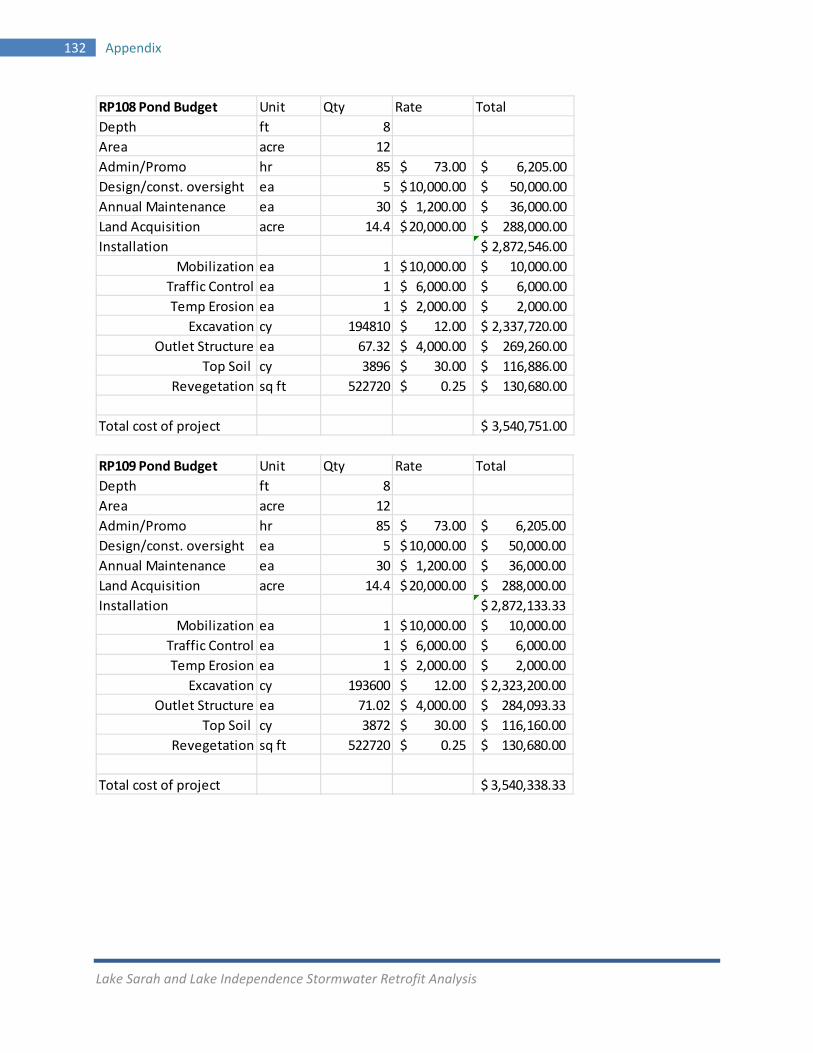
Lake Sarah and Lake Independence Stormwater Retrofit Analysis
132 Appendix
RP108 Pond Budget Unit Qty Rate Total
Depth ft 8
Area acre 12
Admin/Promo hr 85 73.00$ 6,205.00$
Design/const. oversight ea 5 10,000.00$ 50,000.00$
Annual Maintenance ea 30 1,200.00$ 36,000.00$
Land Acquisition acre 14.4 20,000.00$ 288,000.00$
Installation 2,872,546.00$
Mobilization ea 1 10,000.00$ 10,000.00$
Traffic Control ea 1 6,000.00$ 6,000.00$
Temp Erosion ea 1 2,000.00$ 2,000.00$
Excavation cy 194810 12.00$ 2,337,720.00$
Outlet Structure ea 67.32 4,000.00$ 269,260.00$
Top Soil cy 3896 30.00$ 116,886.00$
Revegetation sq ft 522720 0.25$ 130,680.00$
Total cost of project 3,540,751.00$
RP109 Pond Budget Unit Qty Rate Total
Depth ft 8
Area acre 12
Admin/Promo hr 85 73.00$ 6,205.00$
Design/const. oversight ea 5 10,000.00$ 50,000.00$
Annual Maintenance ea 30 1,200.00$ 36,000.00$
Land Acquisition acre 14.4 20,000.00$ 288,000.00$
Installation 2,872,133.33$
Mobilization ea 1 10,000.00$ 10,000.00$
Traffic Control ea 1 6,000.00$ 6,000.00$
Temp Erosion ea 1 2,000.00$ 2,000.00$
Excavation cy 193600 12.00$ 2,323,200.00$
Outlet Structure ea 71.02 4,000.00$ 284,093.33$
Top Soil cy 3872 30.00$ 116,160.00$
Revegetation sq ft 522720 0.25$ 130,680.00$
Total cost of project 3,540,338.33$
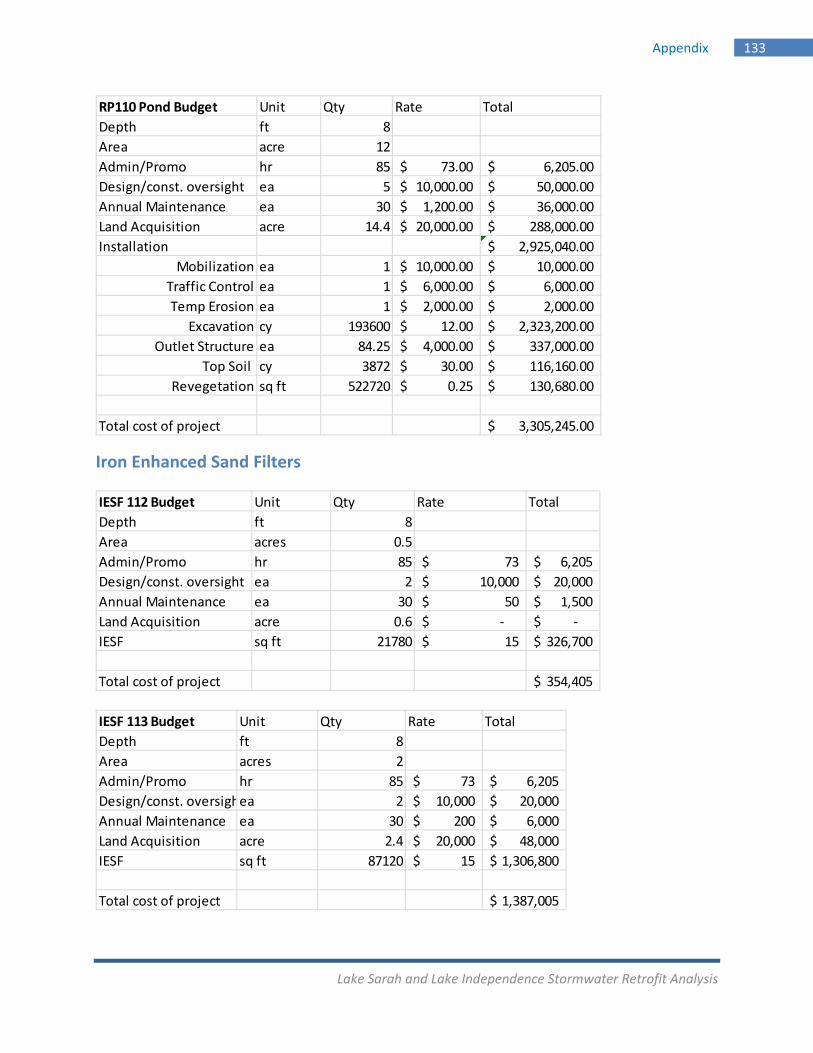
Lake Sarah and Lake Independence Stormwater Retrofit Analysis
Appendix 133
Iron Enhanced Sand Filters
RP110 Pond Budget Unit Qty Rate Total
Depth ft 8
Area acre 12
Admin/Promo hr 85 73.00$ 6,205.00$
Design/const. oversight ea 5 10,000.00$ 50,000.00$
Annual Maintenance ea 30 1,200.00$ 36,000.00$
Land Acquisition acre 14.4 20,000.00$ 288,000.00$
Installation 2,925,040.00$
Mobilization ea 1 10,000.00$ 10,000.00$
Traffic Control ea 1 6,000.00$ 6,000.00$
Temp Erosion ea 1 2,000.00$ 2,000.00$
Excavation cy 193600 12.00$ 2,323,200.00$
Outlet Structure ea 84.25 4,000.00$ 337,000.00$
Top Soil cy 3872 30.00$ 116,160.00$
Revegetation sq ft 522720 0.25$ 130,680.00$
Total cost of project 3,305,245.00$
IESF 112 Budget Unit Qty Rate Total
Depth ft 8
Area acres 0.5
Admin/Promo hr 85 73$ 6,205$
Design/const. oversight ea 2 10,000$ 20,000$
Annual Maintenance ea 30 50$ 1,500$
Land Acquisition acre 0.6 ‐$ ‐$
IESF sq ft 21780 15$ 326,700$
Total cost of project 354,405$
IESF 113 Budget Unit Qty Rate Total
Depth ft 8
Area acres 2
Admin/Promo hr 85 73$ 6,205$
Design/const. oversighea 2 10,000$ 20,000$
Annual Maintenance ea 30 200$ 6,000$
Land Acquisition acre 2.4 20,000$ 48,000$
IESF sq ft 87120 15$ 1,306,800$
Total cost of project 1,387,005$
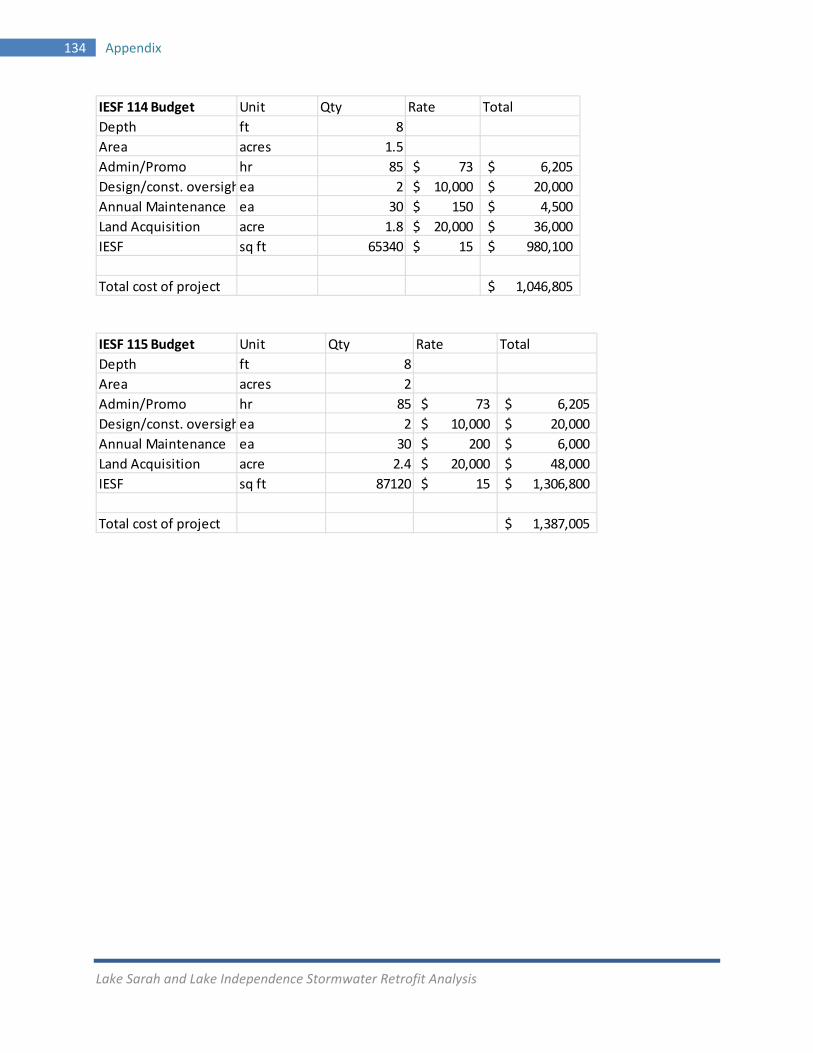
Lake Sarah and Lake Independence Stormwater Retrofit Analysis
134 Appendix
IESF 114 Budget Unit Qty Rate Total
Depth ft 8
Area acres 1.5
Admin/Promo hr 85 73$ 6,205$
Design/const. oversighea 2 10,000$ 20,000$
Annual Maintenance ea 30 150$ 4,500$
Land Acquisition acre 1.8 20,000$ 36,000$
IESF sq ft 65340 15$ 980,100$
Total cost of project 1,046,805$
IESF 115 Budget Unit Qty Rate Total
Depth ft 8
Area acres 2
Admin/Promo hr 85 73$ 6,205$
Design/const. oversighea 2 10,000$ 20,000$
Annual Maintenance ea 30 200$ 6,000$
Land Acquisition acre 2.4 20,000$ 48,000$
IESF sq ft 87120 15$ 1,306,800$
Total cost of project 1,387,005$