City Of St. Albans, West Virginia Firemen's Pension and Relief ...
58
City Of St. Albans, West Virginia Firemen’s Pension and Relief Fund Actuarial Valuation Report for the Year Beginning July 1, 2017
-
Upload
khangminh22 -
Category
Documents
-
view
7 -
download
0
Transcript of City Of St. Albans, West Virginia Firemen's Pension and Relief ...

City Of St. Albans, West Virginia Firemen’s Pension and Relief Fund Actuar ia l Valuat ion Report for the Year Beginning July 1 , 2017

September 19, 2018 Ms. Barbara Hughes Firefighter Brandon Price City Treasurer Pension Board Secretary 1499 MacCorkle Avenue, P.O. Box 1488 City of St. Albans Firemen’s Pension and Relief Fund St. Albans, WV 25177 Subject: City of St. Albans Firemen’s Pension and Relief Fund Actuarial Valuation Report for the Year Beginning July 1, 2017 Dear Ms. Hughes and Firefighter Price: Upon the request of the Municipal Pensions Oversight Board, we have performed an actuarial valuation as of July 1, 2017, for the City of St. Albans, West Virginia Firemen’s Pension and Relief Fund (“Fund” or “Plan”). This actuarial valuation has been performed in accordance with the West Virginia Code Chapter 8, Article 22, Sections 16 through 28, inclusive.
In accordance with West Virginia Code §8‐22‐20, this actuarial valuation report provides information on:
The sponsor’s funding requirements for the fiscal year ending June 30, 2019, based on the selected funding policy, i.e. the Alternative funding policy as defined in West Virginia Code §8‐22‐20(c)(1)
The Fund’s eligibility to receive an allocation of the premium tax for the fiscal year ending June 30, 2019
The Fund’s eligibility to provide supplemental benefits for the plan year beginning July 1, 2019 This report also provides illustrative projections under two other funding policies available to the sponsor – the Optional funding policy as defined in West Virginia Code §8‐22‐20(e), and the Conservation funding policy as defined in West Virginia Code §8‐22‐20(f). West Virginia Code §8‐22‐20 (c)(4), requires (1) a review of the actuarial assumptions and methods at least once every five years and (2) that the Actuary shall provide a report to the oversight board with recommendations on any changes to the actuarial process. Consequently, an experience review was performed for the period July 1, 2009, through June 30, 2014. The assumptions and methods were recommended by the actuary, in the report 2016 Experience Review for the Years July 1, 2009, to July 1, 2014, approved by the Municipal Pensions Oversight Board, and became effective for the actuarial valuation as of July 1, 2015.

Ms. Barbara Hughes and Firefighter Brandon Price City of St. Albans Firemen’s Pension and Relief Fund Page 2
This actuarial valuation is based upon:
Plan Member Data – Data for active members and persons receiving benefits from the Fund as of June 30, 2017, was provided by the Fund’s staff. We have tested this data for reasonableness. Asset Values – A reconciliation of market value of assets during the plan year ended June 30, 2017, and a list of assets held as of June 30, 2017, by investment category, were provided by the Fund. Plan Provisions – A summary of the key plan provisions valued are set forth in Section VII of the report: Summary of Principal Plan Provisions.
Actuarial Methods – Fund liabilities were measured using the Entry‐Age Normal Actuarial Cost Method. The actuarial valuation was based on the market value of assets. The actuarial methods used in the actuarial valuation are set forth in Section VI of the report: Actuarial Assumptions and Methods. Actuarial Assumptions – The actuarial assumptions used include a discount rate of 4.00%. The actuarial assumptions used in the actuarial valuation are set forth in Section VI of the report: Actuarial Assumptions and Methods.
The actuarial valuation results disclosed in this report are based on the data and actuarial assumptions and methods described above, and upon the provisions of the Plan as of the actuarial valuation date. Based on these items, we certify these results to be true and correct. To the best of our knowledge, this actuarial statement is complete and accurate, and has been prepared in accordance with generally accepted actuarial principles and practices. Future actuarial measurements may differ significantly from the current measurements presented in this report due to such factors as the following: plan experience differing from that anticipated by the economic or demographic assumptions; changes in economic or demographic assumptions; increases or decreases expected as part of the natural operation of the methodology used for these measurements (such as the end of an amortization period or additional cost or contribution requirements based on the plan’s funded status); and changes in plan provisions or applicable law. This report should not be relied on for any purpose other than the purpose stated.
Ms. Barbara Hughes and Firefighter Brandon Price City of St. Albans Firemen’s Pension and Relief Fund Page 3
The signing actuaries are independent of the plan sponsor. Alex Rivera and Lance J. Weiss are Members of the American Academy of Actuaries (MAAA) and meet the Qualification Standards of the American Academy of Actuaries to render the actuarial opinion herein. Sincerely,
Alex Rivera, FSA, EA, MAAA, FCA Lance J. Weiss, EA, MAAA, FCA Senior Consultant Senior Consultant

Contents
City of St. Albans Firemen’s Pension and Relief Fund
i
Section Pages Items Transmittal Letter I Actuarial Valuation Results as of July 1, 2017 1‐8 Executive Summary of Valuation Results as of July 1, 2017 9 Schedule A: Summary of Key Valuation Results 10 Schedule B: (Gain)/Loss Analysis 11 Graphs 1A and 1B: Solvency Projections
II Actuarial Projections – Alternative Funding Policy 1 Open Group Basis (with no Additional Solvency Contributions) 2 Closed Group Basis (with no Additional Solvency Contributions) 3 Closed Group Basis (with Additional 15‐Year Solvency Test
Contributions starting in PYE 2019) 4 Open Group Basis (with Recommended Solvency Contributions
starting in PYE 2019) 5 Closed Group Basis (with Recommended Solvency Contributions
starting in PYE 2019)
III 1‐5 Funding Policy Choices Optional Funding Policy Projections Conservation Funding Policy Projections
IV Actuarially Determined Contribution for GASB 67/68 Reporting 1 Schedule C: Funding Progress and Employer Contributions
V Actuarial Valuation Data as of July 1, 2017 1 Schedule D: Reconciliation of Assets 2 Schedule E: Assets Held by Category 3 Schedule F: Summary of Participant Activity 4 Schedule G: Distribution of Actives 5 Schedule H: Participants Summary
VI 1‐5 Actuarial Assumptions and Methods
VII 1‐2 Summary of Principal Plan Provisions
VIII Appendix – Projection Data 1‐2 Optional Funding – 2019 3‐4 Conservation Funding – 2019 5‐6 Optional Funding – N/A 7‐8 Conservation Funding – 2042

SECTION I
AC T UA RI A L VALUATION RESU LTS A S OF
JU LY 1, 2017

Executive Summary
City of St. Albans Firemen’s Pension and Relief Fund
I‐1
Upon the request of the Municipal Pensions Oversight Board (MPOB), we have performed an actuarial valuation as of July 1, 2017, for the City of St. Albans, West Virginia Firemen’s Pension and Relief Fund (“Fund” or “Plan”). In accordance with West Virginia Code §8‐22‐20, this actuarial valuation report provides information on:
The sponsor’s funding requirements for the fiscal year ending June 30, 2019
The Fund’s eligibility to receive an allocation of the premium tax for the fiscal year ending June 30, 2019
The Fund’s eligibility to provide supplemental benefits for the plan year beginning July 1, 2019
This report is based on the sponsor’s election to finance benefit obligations using the Alternative funding policy as defined in West Virginia Code §8‐22‐20 (c)(1). The key features of the Alternative funding policy, effective as of June 30, 1991, are summarized below:
The sponsor’s initial Alternative contribution effective for plan year 1991 is the greater of 107% of the amount contributed for the plan year ended June 30, 1990, or the highest five‐year average of contributions made since 1984.
Sponsor contributions made in subsequent years cannot be less than 107% of the contribution made in the prior fiscal year.
The actuary must certify in writing that the Fund is projected to be solvent under the Alternative funding policy for the next consecutive 15‐year period. A plan is deemed to be solvent if projected assets are greater than zero over the 15‐year projection period.
Beginning September 1, 2003, any municipality which elected the Alternative funding policy has the option of reverting to the Standard funding policy if the plan’s funded ratio is greater than 80%. In this case, the Standard minimum contribution equals the normal cost plus the amortization of the unfunded liability over a period of not more than 40 years commencing from July 1, 1991, less the allocable portion of the state premium tax fund for municipal pension and relief funds.
Plan members hired before January 1, 2010, contribute 7.0% of pay; however, if elected by the Board of Trustees of the Plan, member contributions may be increased up to 9.5% of pay. The Board elected to increase member contributions to 9.5% of pay. Employees hired on or after January 1, 2010, contribute 9.5% of pay.
The Plan also receives premium tax allocation assigned to the Fund for the plan year. This report also provides illustrative projections under two other funding policies available to the sponsor – the Optional funding policy as defined in West Virginia Code §8‐22‐20(e), and the Conservation funding policy as defined in West Virginia Code §8‐22‐20(f).

Executive Summary (Continued)
City of St. Albans Firemen’s Pension and Relief Fund
I‐2
The following table provides the Plan’s funded status:
Funded Status as of: July 1, 2017
Assets $2,576,530
Actuarial Accrued Liability $19,919,903
Unfunded Actuarial Accrued Liability $17,343,373
Funded Ratio 12.93%
The following table provides the employer contributions for the fiscal year ended June 30, 2018, under the Alternative funding policy:
Employer Contributions for FYE: June 30, 2018
FYE 06/30/2017 Alternative Contribution $240,553
7% Increase in Alternative Contribution $16,839
FYE 06/30/2018 Alternative Contribution $257,392
Additional Contribution $0
Final FYE 06/30/2018 Alternative Contribution $257,392
The following table provides the estimated employer contributions for the fiscal year ending June 30, 2019, under the Alternative funding policy:
Estimated Employer Contributions for FYE: June 30, 2019
FYE 06/30/2018 Alternative Contribution $257,392
7% Increase in Alternative Contribution $18,017
FYE 06/30/2019 Alternative Contribution $275,409
Additional Contribution to satisfy 15‐year Solvency Test on an Open
Group Basis (to receive 100% of the State Premium Tax Allocation)$0
Estimated Employer Contribution for FYE 06/30/2019
to receive 100% of the State Premium Tax Allocation$275,409
Additional Contribution to satisfy 15‐year Solvency Test on a Closed
Group Basis (to grant Supplemental Benefits; i.e. COLA increases)$10,349
Estimated Employer Contribution for FYE 06/30/2019
to receive 100% of the State Premium Tax Allocation and
to grant Supplemental Benefits; i.e. COLA increases
$285,758

Executive Summary (Continued)
City of St. Albans Firemen’s Pension and Relief Fund
I‐3
A sponsor using the Alternative funding policy must satisfy the solvency test, as referenced in West Virginia Code section §8‐22‐20 (c)(1) in order to receive 100% of the State premium tax allocation, or grant Supplemental Benefits to plan members. We understand that the minimum requirement to satisfy the statutory solvency test includes a demonstration that the assets are projected to be greater than zero over a 15‐year period. The statutes also require that an actuary perform the projection and certify the solvency test. However, the statutes provide little guidance on the parameters used to perform the solvency projections.
Under the current minimum statutory requirements, a sponsor of a poorly funded plan could provide Supplement Benefits to members, effectively deplete assets over a 15‐year period, and have no available assets reserved to pay the benefits of current or future retirees after the 15‐year period. For this reason, we recommend performing projections that include a margin for conservatism and satisfy the minimum statutory requirement for solvency. For this purpose we recommend performing projections that assume contributions for members hired after the actuarial valuation date will not be used to finance the unfunded liabilities of current members as of the actuarial valuation date. That is, assets and liabilities associated with new plan members are excluded from the solvency projections used to certify the solvency test for purposes of providing Supplemental Benefits. In this report projections that exclude new members are called “Closed Group Projections.”
The statutes also require that the Plan satisfy the solvency test in order to receive the State premium tax allocation. For this purpose we recommend using less conservatism in the projections in order to ensure that the Plan receives the greatest allowable State premium tax allocation. A projection that includes assets and liabilities for members hired after the actuarial valuation would be less conservative. In this report projections that include new members are called “Open Group Projections.”
In accordance with section §8‐22‐26a(f) of the West Virginia Code, and upon of approval of the plan’s board of trustees, plans that do not satisfy the actuarial soundness requirements for purposes of granting Supplemental Benefits, may increase member’s contribution rate from 7.0% up to 9.5%. Consequently, the additional contributions needed to satisfy the minimum standards for actuarial soundness can be based on a combination of increased sponsor and plan member contribution as limited by the West Virginia Code. The Board of Trustees of the Plan elected to increase the contribution rate for members hired before January 1, 2010, to 9.5% of pay. In the solvency projections shown in Tables 1(a) through 1(e), each year the employer contribution is projected to be the greater of:
(1) The fiscal year end June 30, 2019, Alternative contribution plus any additional solvency contribution increased by 7% per year, and
(2) The amount needed to keep the fund’s market value of assets greater than zero. The sponsor is projected to satisfy the 15‐year solvency test by making additional annual contributions in excess of the minimum Alternative contribution starting in fiscal year end June 30, 2019. To receive the State Premium Tax Allocation, no additional contribution is required to remain solvent on an open group basis as shown in Table 1(a). To provide additional supplemental benefits, an additional annual contribution of $10,349 in fiscal year end June 30, 2019, increasing by 7% each year thereafter, is required to remain solvent on a closed group basis as shown in Table 1(c).

Executive Summary (Continued)
City of St. Albans Firemen’s Pension and Relief Fund
I‐4
Because the 15‐year solvency test is not consistent with generally accepted actuarial principles, we recommended making an additional annual contribution in fiscal year end June 30, 2019, of $67,179 instead of $10,349, increasing 7% per year each year thereafter. On a closed group basis, this is projected to maintain assets at no less than 50% of the value as of June 30, 2017, over the 40‐year projection period (to a low of $1,288,282 as of June 30, 2036) as shown in Table 1(e). Under this scenario, the funded ratio is projected to reach a minimum level of 10% in 2025 on an open group projection basis, as shown in Table 1(d).
The Plan provides Deferred Retirement Option Program (“DROP”) benefits to members who were eligible to retire from July 1, 2011, through June 30, 2016. The DROP provisions include:
The member’s benefit at retirement is based on service and final average salary as of the DROP election date,
During the DROP period, the member may defer commencement of retirement for no more than five years before attaining age 65,
During the DROP period, benefits accumulate in the member’s DROP account without interest,
During the DROP period, the member is required to contribute 9.5% of compensation, and
During the DROP period, the member is considered a retired member for purposes of the premium tax allocation and eligibility to earn supplemental pension benefits.
As of June 30, 2017, two members are participating in the DROP.

Executive Summary (Continued)
City of St. Albans Firemen’s Pension and Relief Fund
I‐5
Commentary on Premium Tax Allocation Under §8‐22‐19 of the West Virginia Code, the plan sponsor is required to deposit the statutory contribution on a monthly basis at a rate of one‐twelfth of the annual requirement, in order to receive the premium tax allocation from the Municipal Pensions Security Fund. Revenues which are specifically collected for the Fund, including employee payroll contributions, must be deposited within five days of receipt. Based upon discussions with the MPOB, we understand the annual premium tax allocation is determined by September 1st each year. Municipalities can begin invoicing the MPOB for their share of the premium tax allocation after receiving their state provided actuarial study and after the municipality has made employer contributions to the local Plan. Each municipal treasurer shall use the invoice template provided by the MPOB to begin drawing down the state allocation for the municipal pension plan. This July 1, 2017, Actuarial Report from GRS is to be used by municipal pension plans to draw down the September 1, 2018 State Premium Tax Allocation which is allocated in Fiscal Year 2019. The actuarial valuation and projection results assume the sponsor will make the statutory contributions on a monthly basis in accordance with statutes, including any additional amounts needed to satisfy the 15‐year solvency test on an open group projection basis, and will be eligible to receive the premium tax allocation.
Commentary on Solvency Projections and Supplemental Benefits Under § 8‐22‐26a of the West Virginia Code, all retirees, surviving spouses, and disabled pensioners are eligible for Supplemental Benefits that include automatic cost‐of‐living benefits commencing on the first day of July following two years of retirement. The benefit equals the percentage increase in the Consumer Price Index, limited to 4.0 percent (2.0 percent for certain disabled pensioners), multiplied by the sum of the allowable amount (first $15,000 of initial benefits paid) and the accumulated supplemental pensions paid in prior years. The Court of Appeals decision requires that Supplemental Benefits be provided on “the allowable amount of the first $15,000 of the total annual pension paid in addition to the accumulated supplemental pension from the previous years.” The decision implies that compound cost‐of‐living increases should be applied to both the allowable amount of $15,000 and the accumulated supplemental pension amounts for prior years. Additional Supplemental Benefits are payable only if the Plan satisfies the minimum standard for actuarial soundness as defined in West Virginia Code § 8‐22‐20. This minimum standard requires that the fund remain “solvent” over the next 15‐year projection period. Based on discussions with the West Virginia Municipal Pensions Oversight Board, and our understanding of the administrative practices of other local police and fire pension funds in West Virginia, the “solvency” requirement generally means that the fund’s market value of assets is projected to be greater than zero for all plan years prior to the end of the 15‐year projection period. The projection is based on the most recent actuarial valuation and assumes the plan sponsor will make contributions according to the funding policy elected by the sponsor as defined by West Virginia Code, including any additional amounts needed to satisfy the 15‐year solvency test on a closed group projection basis. Although the 15‐year solvency test may satisfy the minimum standard for actuarial soundness under the statutes, it is not necessarily consistent with generally accepted actuarial principles.

Executive Summary (Continued)
City of St. Albans Firemen’s Pension and Relief Fund
I‐6
The Supplemental benefits for plan year beginning July 1, 2019 will be based on the Consumer Price Index for calendar year 2018, and the projected results of the July 1, 2017 actuarial valuation.
Additional Remarks on the Actuarial Valuation Results Following are additional remarks on the actuarial valuation results as of July 1, 2017:
The actuarial assumptions and methods were recommended by the actuary, in the report 2016 Experience Review for the Years July 1, 2009, to July 1, 2014, and approved by the Municipal Pensions Oversight Board and became effective beginning with the actuarial valuation as of July 1, 2015. The key actuarial assumptions are fully disclosed in Section VI of the report.
The interest rate used to discount liabilities remained the same for the July 1, 2016 and July 1, 2017 actuarial valuations.
o The interest rate assumption was developed by reviewing the Plan’s current funded ratio, the 15‐year projected funded ratio, the ratio of assets to benefits, the percentage of assets allocated to equities and the funding policy selected. The details of the methodology used to select the discount rate are presented in Section VI of the report. As of July 1, 2017, the Plan’s funded ratio of 16% (using a testing interest rate of 5.50% for all plans using the Alternative funding policy), ratio of assets to benefits of 2.62, equity allocation of 46%, and 15‐year projected funded ratio of 8%, resulted in a discount rate assumption of 4.00%.
The Fund experienced an approximate annualized return of 8.58% on the market value of assets during the plan year ended June 30, 2017, which compares to the expected annualized return of 4.00%. The difference in actual versus expected return produced an asset (gain)/loss of ($110,291).
An actuarial valuation is based on the expectation of certain events such as salary increases, retirement, disability, mortality, termination, and cost of living increases. Demographic or liability experience (gains)/losses are generated when the actual occurrence of such events differs from the expectation. During the plan year ended June 30, 2017, the fund experienced a net liability (gain)/loss of ($87,856) due to these events.
Alternative Funding Following are additional remarks on the actuarial valuation projections under the current funding policy. Based on the open group projections shown in Table 1(a), page II‐1 and assuming that the sponsor makes the statutory required contributions, if all actuarial assumptions are realized in the future, including an investment return of 4.00%:
The funded ratio is projected to decrease from 13% at June 30, 2017, to 7% at June 30, 2024, to 4%, at June 30, 2033, and then increase to 42% at 2057.
Employer contributions are expected to increase from $257,392 (or 28% of pay) for the fiscal year end June 30, 2018, to 3,602,145 (or 98% of pay) for fiscal year end June 30, 2057.

Executive Summary (Continued)
City of St. Albans Firemen’s Pension and Relief Fund
I‐7
Please note that a funded ratio of only 13% at June 30, 2017, which declines to 4% at June 30, 2033, means that the plan is severely underfunded.
The Alternative funding policy is not consistent with generally accepted actuarial principles because it does not recognize emerging gains or losses. A funding policy consistent with generally accepted actuarial principles is typically based on the sponsor contributing the normal cost net of employee contributions plus an amortization of the unfunded actuarial accrued liability. The annual amortization amount is generally 6% to 7% of the unfunded actuarial accrued liability. Under state statute, the annual premium tax allocation can only be used to finance the amortization of the unfunded actuarial accrued liability. For fiscal year end 2019, the Alternative funding policy contribution of $275,409 is sufficient to finance only 59% of the net employer normal cost of $468,968. The state premium tax allocation of $227,823 is sufficient to finance only 1.3% of the unfunded actuarial accrued liability of $17,343,373. This actuarial valuation assumes that the City will be able to make future contributions on a timely basis. The ability of the plan to pay the promised benefits is heavily dependent on the City contributing the minimum employer contribution calculated under the Alternative funding policy for each and every future year. We did not perform an analysis of the ability of the City to make future contributions. Such an analysis is not within the scope of our assignment or within our analytical skill set. Failure to receive City contributions on a timely basis could jeopardize the sustainability of the Fund. Please understand that the minimum employer contribution calculated under the Alternative funding policy as defined in West Virginia Code 8‐22‐20 (c)(1) is just that – the minimum that needs to be contributed each and every year. Because this is a severely underfunded plan, we continue to recommend that the plan sponsor consider making additional contributions (in excess of the minimum requirement) to ensure that there are sufficient assets available in the fund in all years to pay the promised benefits. If the minimum employer contributions (calculated under the Alternative funding policy) are not made or investment return is less than the assumption of 4.00%, the funded ratio will be lower and the cash flow strain could be higher. If another significant market downtown occurs while the plan’s funded ratio is declining, the plan may need to liquidate assets in order to pay benefits which could have a further adverse effect on the funded status of the System.
Under the Alternative funding policy, City contributions increase by seven percent and do not change as a result of emerging actuarial experience. However, emerging experience gains and losses could impact the Plan’s funded ratio as follows:
If the actual return on assets is less than the assumed return of 4.00%, then the funded ratio will decrease. Conversely, if the actual return on assets is greater than the assumed return of 4.00%, then the funded ratio will increase.
If salaries increase by more than assumed, the funded ratio could decrease. If salaries decrease by more than assumed, the funded ratio could increase.
If active members retire sooner than expected, the funded ratio will generally decrease. If active members retire later than expected, the funded ratio will generally increase.
If active members become disabled during the year, the funded ratio could decrease.

Executive Summary (Continued)
City of St. Albans Firemen’s Pension and Relief Fund
I‐8
If retired members die later than expected, the funded ratio will decrease. If retired members die sooner than expected, the funded ratio will increase.
If the general inflation is greater than assumed, supplemental benefits will be greater than assumed and the funded ratio will decrease. Conversely, if general inflation is lower than assumed, the funded ratio will increase.
At least once every five years, GRS performs an experience review analysis and updates the actuarial valuation assumptions. For example, if salary increases were consistently lower than assumed during the experience period, then the salary increase rate would likely be lowered. Or if more members retired than assumed, then the retirement rates would likely be increased. Any change in actuarial assumption will also impact the City’s funded ratio. The objective of a change in actuarial assumptions is to reduce the level of experience gains and losses in future actuarial valuations.
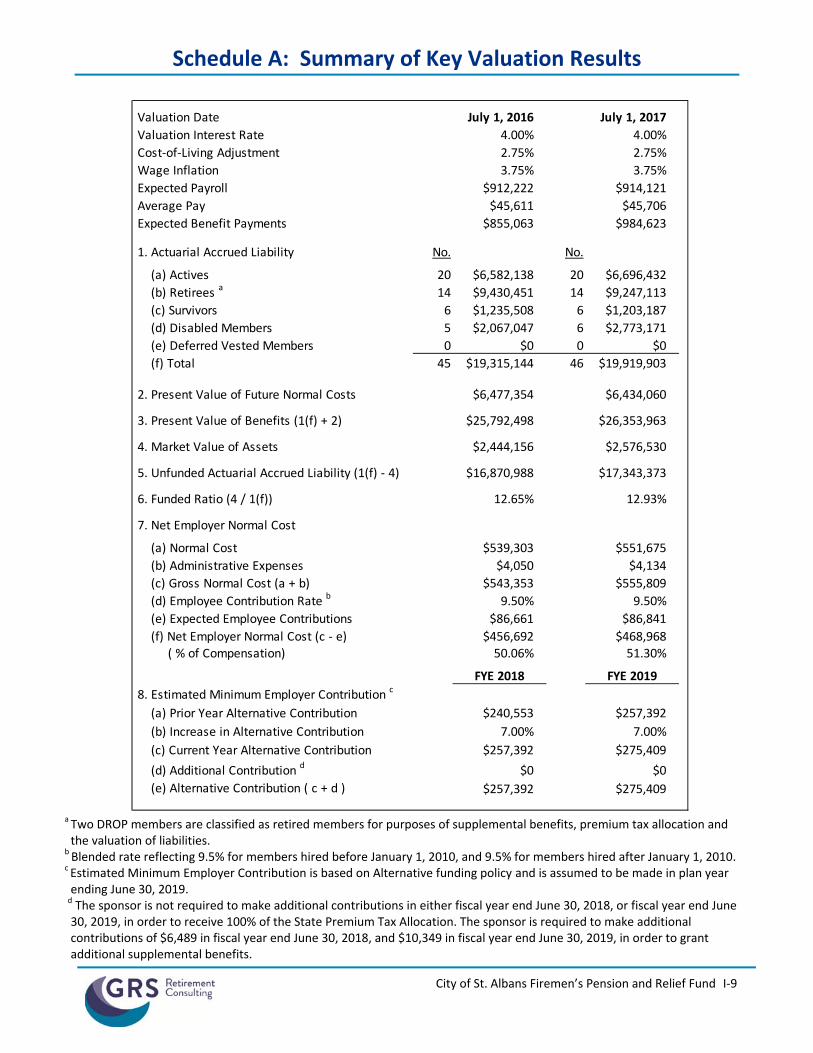
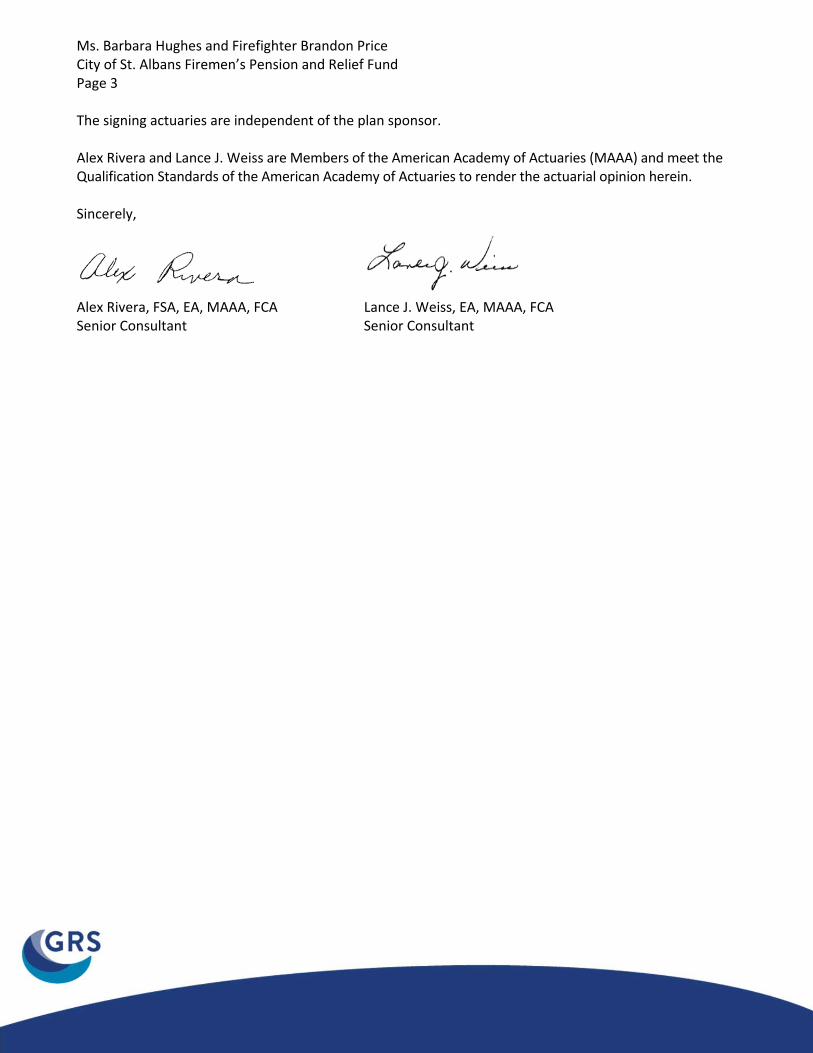
Schedule A: Summary of Key Valuation Results
City of St. Albans Firemen’s Pension and Relief Fund
I‐9
Valuation Date July 1, 2016 July 1, 2017
Valuation Interest Rate 4.00% 4.00%
Cost‐of‐Living Adjustment 2.75% 2.75%
Wage Inflation 3.75% 3.75%
Expected Payroll $912,222 $914,121
Average Pay $45,611 $45,706
Expected Benefit Payments $855,063 $984,623
1. Actuarial Accrued Liability No. No.
(a) Actives 20 $6,582,138 20 $6,696,432
(b) Retirees a 14 $9,430,451 14 $9,247,113
(c) Survivors 6 $1,235,508 6 $1,203,187
(d) Disabled Members 5 $2,067,047 6 $2,773,171
(e) Deferred Vested Members 0 $0 0 $0
(f) Total 45 $19,315,144 46 $19,919,903
2. Present Value of Future Normal Costs $6,477,354 $6,434,060
3. Present Value of Benefits (1(f) + 2) $25,792,498 $26,353,963
4. Market Value of Assets $2,444,156 $2,576,530
5. Unfunded Actuarial Accrued Liability (1(f) ‐ 4) $16,870,988 $17,343,373
6. Funded Ratio (4 / 1(f)) 12.65% 12.93%
7. Net Employer Normal Cost
(a) Normal Cost $539,303 $551,675
(b) Administrative Expenses $4,050 $4,134
(c) Gross Normal Cost (a + b) $543,353 $555,809
(d) Employee Contribution Rate b 9.50% 9.50%
(e) Expected Employee Contributions $86,661 $86,841
(f) Net Employer Normal Cost (c ‐ e) $456,692 $468,968 ( % of Compensation) 50.06% 51.30%
FYE 2018 FYE 2019
8. Estimated Minimum Employer Contribution c
(a) Prior Year Alternative Contribution $240,553 $257,392
(b) Increase in Alternative Contribution 7.00% 7.00%
(c) Current Year Alternative Contribution $257,392 $275,409
(d) Additional Contribution d $0 $0
(e) Alternative Contribution ( c + d ) $257,392 $275,409
a Two DROP members are classified as retired members for purposes of supplemental benefits, premium tax allocation and the valuation of liabilities.
b Blended rate reflecting 9.5% for members hired before January 1, 2010, and 9.5% for members hired after January 1, 2010. c Estimated Minimum Employer Contribution is based on Alternative funding policy and is assumed to be made in plan year ending June 30, 2019.
d The sponsor is not required to make additional contributions in either fiscal year end June 30, 2018, or fiscal year end June 30, 2019, in order to receive 100% of the State Premium Tax Allocation. The sponsor is required to make additional contributions of $6,489 in fiscal year end June 30, 2018, and $10,349 in fiscal year end June 30, 2019, in order to grant additional supplemental benefits.

Schedule B: (Gain)/Loss Analysis
City of St. Albans Firemen’s Pension and Relief Fund
I‐10
Experience (Gain)/Loss for Plan Year Ended June 30, 2017
1. (a) Actuarial Accrued Liability as of 7/1/2016 $19,315,144
(b) Normal Cost due 7/1/2016 $539,303
(c) Interest on (a) and (b) to 6/30/2017 $783,392
(d) Benefit Payments with interest to 6/30/2017 $630,080
(e) Effect of Assumption Changes $0
(f) Expected Liability at 7/1/2017 [(a) + (b) + (c) ‐ (d) + (e)] $20,007,759
(g) Actual Liability at 7/1/2017 $19,919,903
(h) Liability (Gain)/Loss [(g) ‐ (f)] ($87,856)
2. (a) Market Value of Assets as of 7/1/2016 $2,444,156
(b) Interest on (a) to 6/30/2017 $97,766
(c) Contributions with interest to 6/30/2017 $554,397
(d) Benefit Payments with interest to 6/30/2017 $630,080
(e) Expected Assets at 6/30/2017 [(a) + (b) + (c) ‐ (d)] $2,466,239
(f) Actual Assets at 7/1/2017 $2,576,530
(g) Asset (Gain)/Loss [(e) ‐ (f)] ($110,291)
3. Total (Gain)/Loss [1(h) + 2(g)] ($198,147)

Graphs 1A and 1B: Solvency Projections
City of St. Albans Firemen’s Pension and Relief Fund
I‐11
Graph 1A
Graph 1B

SECTION II
ACTUARIAL PROJECTIONS ALTERNATIVE FUNDING POLICY

Alternative Funding on an Open Group Basis, Table 1(a) (with no Additional Solvency Contributions)
City of St. Albans Firemen’s Pension and Relief Fund
II‐1
Valuation
Plan Premium Tax Actuarial
Year End Pay Total Assets Benefit Employer Member Allocation Investment Assets Accrued Unfunded Funded
30‐Jun Active Status Payroll (boy) Payments Expenses Contributions Contributionsa Contributions Income (eoy) Liability Liability Ratio
2017 20 26 $912,222 $2,444,156 $617,725 $750 $241,363 $94,205 $207,958 $207,323 $2,576,530 $19,919,903 $17,343,373 13%
2018 20 26 914,121 2,576,530 984,623 4,134 257,392 96,110 219,396 94,826 2,255,497 20,280,080 18,024,583 11%2019 20 27 934,207 2,255,497 762,678 4,271 275,409 88,967 227,823 86,759 2,167,506 20,886,351 18,718,845 10%
2020 20 28 969,470 2,167,506 798,678 4,476 294,688 92,508 237,787 83,172 2,072,507 21,498,401 19,425,894 10%2021 20 28 1,012,737 2,072,507 819,883 4,638 315,316 96,566 244,055 79,562 1,983,485 22,136,998 20,153,513 9%
2022 20 28 1,055,049 1,983,485 841,755 4,791 337,388 100,561 250,037 76,200 1,901,124 22,802,122 20,900,998 8%2023 20 28 1,108,402 1,901,124 857,923 4,950 361,005 105,675 256,276 73,274 1,834,481 23,507,760 21,673,279 8%2024 20 28 1,150,552 1,834,481 878,618 5,081 386,275 109,673 261,903 70,887 1,779,519 24,245,202 22,465,683 7%
2025 20 29 1,189,108 1,779,519 913,220 5,249 413,314 113,497 268,630 68,744 1,725,235 24,999,131 23,273,896 7%2026 20 29 1,243,461 1,725,235 941,635 5,434 442,246 118,821 275,931 66,829 1,681,993 25,786,461 24,104,468 7%
2027 20 29 1,288,352 1,681,993 969,505 5,584 473,203 123,115 282,399 65,371 1,650,992 26,604,239 24,953,247 6%2028 20 30 1,311,402 1,650,992 1,020,258 5,767 506,327 125,467 290,068 63,977 1,610,806 27,416,404 25,805,598 6%
2029 20 30 1,349,732 1,610,806 1,080,372 6,031 541,770 129,422 300,354 62,158 1,558,107 28,219,713 26,661,606 6%2030 20 31 1,407,354 1,558,107 1,119,157 6,269 579,694 135,012 309,838 60,326 1,517,551 29,047,357 27,529,806 5%
2031 20 31 1,429,691 1,517,551 1,178,172 6,465 620,273 137,173 318,193 58,543 1,467,096 29,860,182 28,393,086 5%2032 20 32 1,451,869 1,467,096 1,256,405 6,751 663,692 139,682 329,543 56,105 1,392,962 30,636,464 29,243,502 5%
2033 20 32 1,500,478 1,392,962 1,317,382 7,037 710,150 144,562 341,379 53,177 1,317,811 31,407,009 30,089,198 4%2034 20 32 1,559,943 1,317,811 1,359,186 7,269 759,861 150,327 351,561 50,639 1,263,744 32,198,914 30,935,170 4%
2035 20 33 1,612,260 1,263,744 1,399,507 7,478 813,051 155,490 361,715 49,030 1,236,045 33,010,512 31,774,467 4%2036 20 32 1,680,673 1,236,045 1,436,040 7,706 869,965 162,325 372,583 48,672 1,245,844 33,856,201 32,610,357 4%2037 20 32 1,742,348 1,245,844 1,465,673 7,895 930,863 168,199 382,266 49,987 1,303,592 34,740,403 33,436,811 4%
2038 20 32 1,814,445 1,303,592 1,495,444 8,110 996,023 174,703 393,344 53,343 1,417,450 35,669,785 34,252,335 4%2039 20 32 1,895,478 1,417,450 1,512,329 8,306 1,065,745 181,789 403,804 59,286 1,607,440 36,661,602 35,054,162 4%
2040 20 32 1,979,721 1,607,440 1,525,088 8,496 1,140,347 189,450 414,294 68,466 1,886,413 37,722,721 35,836,308 5%2041 20 32 2,054,139 1,886,413 1,550,881 8,693 1,220,171 196,275 425,062 81,040 2,249,386 38,838,586 36,589,200 6%
2042 20 32 2,125,203 2,249,386 1,594,101 8,924 1,305,583 202,883 437,135 96,760 2,688,721 39,993,372 37,304,651 7%2043 20 32 2,209,215 2,688,721 1,633,134 9,168 1,396,974 210,687 449,595 115,767 3,219,443 41,200,433 37,980,990 8%
2044 20 32 2,289,082 3,219,443 1,672,010 9,394 1,494,762 217,838 461,614 138,537 3,850,790 42,459,897 38,609,107 9%2045 20 31 2,377,149 3,850,790 1,713,388 9,647 1,599,395 225,887 474,472 165,453 4,592,963 43,774,814 39,181,851 10%
2046 20 31 2,472,241 4,592,963 1,747,859 9,892 1,711,353 234,537 487,168 197,092 5,465,362 45,157,294 39,691,932 12%2047 20 31 2,570,022 5,465,362 1,783,367 10,138 1,831,148 243,065 499,956 234,074 6,480,100 46,610,927 40,130,827 14%
2048 20 31 2,668,092 6,480,100 1,820,516 10,392 1,959,328 251,437 513,188 276,890 7,650,036 48,134,556 40,484,520 16%2049 20 31 2,767,322 7,650,036 1,861,706 10,660 2,096,481 260,334 527,006 326,033 8,987,524 49,725,569 40,738,045 18%2050 20 31 2,870,946 8,987,524 1,909,747 10,941 2,243,235 269,799 541,474 381,955 10,503,299 51,385,167 40,881,868 20%
2051 20 31 2,976,610 10,503,299 1,962,373 11,229 2,400,261 279,063 556,276 445,125 12,210,422 53,114,790 40,904,368 23%2052 20 31 3,082,726 12,210,422 2,017,311 11,529 2,568,279 288,431 571,680 516,133 14,126,105 54,911,501 40,785,396 26%
2053 20 31 3,193,034 14,126,105 2,077,293 11,845 2,748,059 298,551 587,869 595,648 16,267,094 56,774,665 40,507,571 29%2054 20 31 3,307,400 16,267,094 2,143,367 12,170 2,940,423 309,170 604,544 684,323 18,650,017 58,705,390 40,055,373 32%
2055 20 31 3,426,415 18,650,017 2,213,628 12,503 3,146,253 320,274 621,771 782,878 21,295,062 60,706,220 39,411,158 35%2056 20 31 3,549,844 21,295,062 2,286,812 12,843 3,366,491 331,774 639,445 892,164 24,225,281 62,779,522 38,554,241 39%
2057 20 31 3,677,709 24,225,281 2,363,729 13,192 3,602,145 343,732 657,645 1,013,106 27,464,988 64,927,492 37,462,504 42%
a Member contributions include additional amounts for DROP members of $9,269 for plan year end June 30, 2018.
Total AssetsNumber
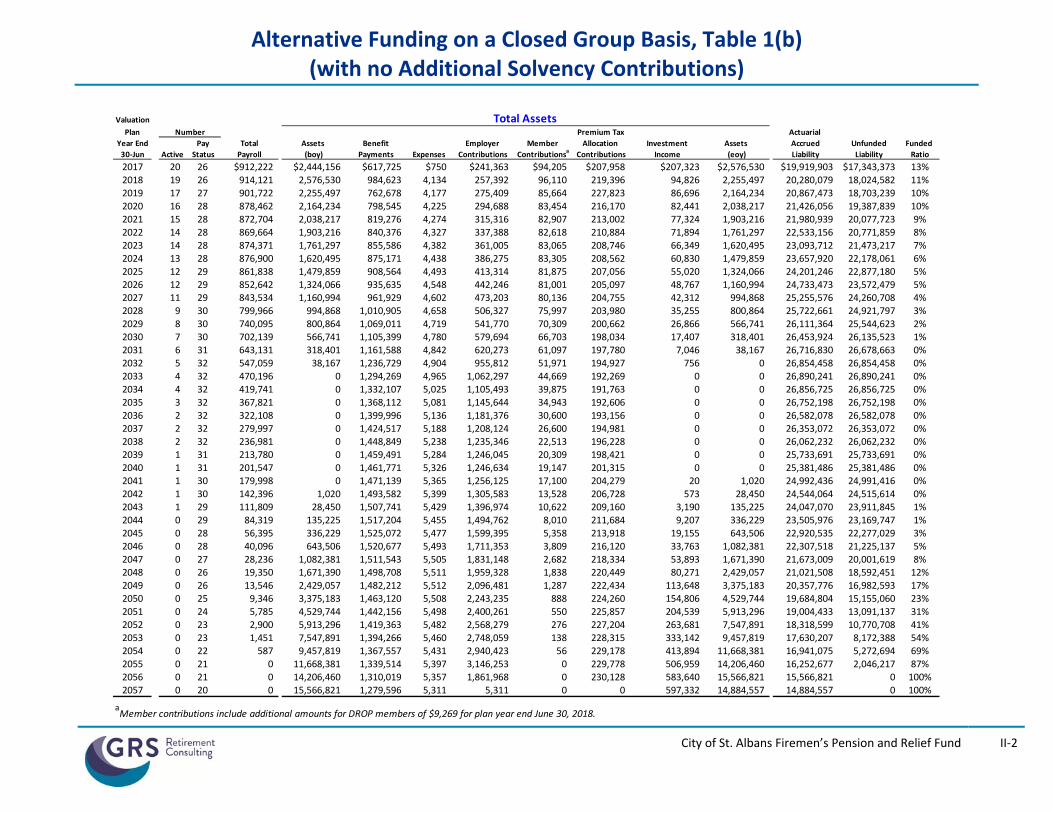
Alternative Funding on a Closed Group Basis, Table 1(b) (with no Additional Solvency Contributions)
City of St. Albans Firemen’s Pension and Relief Fund
II‐2
Valuation
Plan Premium Tax Actuarial
Year End Pay Total Assets Benefit Employer Member Allocation Investment Assets Accrued Unfunded Funded
30‐Jun Active Status Payroll (boy) Payments Expenses Contributions Contributionsa
Contributions Income (eoy) Liability Liability Ratio
2017 20 26 $912,222 $2,444,156 $617,725 $750 $241,363 $94,205 $207,958 $207,323 $2,576,530 $19,919,903 $17,343,373 13%
2018 19 26 914,121 2,576,530 984,623 4,134 257,392 96,110 219,396 94,826 2,255,497 20,280,079 18,024,582 11%
2019 17 27 901,722 2,255,497 762,678 4,177 275,409 85,664 227,823 86,696 2,164,234 20,867,473 18,703,239 10%
2020 16 28 878,462 2,164,234 798,545 4,225 294,688 83,454 216,170 82,441 2,038,217 21,426,056 19,387,839 10%
2021 15 28 872,704 2,038,217 819,276 4,274 315,316 82,907 213,002 77,324 1,903,216 21,980,939 20,077,723 9%
2022 14 28 869,664 1,903,216 840,376 4,327 337,388 82,618 210,884 71,894 1,761,297 22,533,156 20,771,859 8%
2023 14 28 874,371 1,761,297 855,586 4,382 361,005 83,065 208,746 66,349 1,620,495 23,093,712 21,473,217 7%
2024 13 28 876,900 1,620,495 875,171 4,438 386,275 83,305 208,562 60,830 1,479,859 23,657,920 22,178,061 6%
2025 12 29 861,838 1,479,859 908,564 4,493 413,314 81,875 207,056 55,020 1,324,066 24,201,246 22,877,180 5%
2026 12 29 852,642 1,324,066 935,635 4,548 442,246 81,001 205,097 48,767 1,160,994 24,733,473 23,572,479 5%2027 11 29 843,534 1,160,994 961,929 4,602 473,203 80,136 204,755 42,312 994,868 25,255,576 24,260,708 4%
2028 9 30 799,966 994,868 1,010,905 4,658 506,327 75,997 203,980 35,255 800,864 25,722,661 24,921,797 3%
2029 8 30 740,095 800,864 1,069,011 4,719 541,770 70,309 200,662 26,866 566,741 26,111,364 25,544,623 2%
2030 7 30 702,139 566,741 1,105,399 4,780 579,694 66,703 198,034 17,407 318,401 26,453,924 26,135,523 1%
2031 6 31 643,131 318,401 1,161,588 4,842 620,273 61,097 197,780 7,046 38,167 26,716,830 26,678,663 0%
2032 5 32 547,059 38,167 1,236,729 4,904 955,812 51,971 194,927 756 0 26,854,458 26,854,458 0%
2033 4 32 470,196 0 1,294,269 4,965 1,062,297 44,669 192,269 0 0 26,890,241 26,890,241 0%
2034 4 32 419,741 0 1,332,107 5,025 1,105,493 39,875 191,763 0 0 26,856,725 26,856,725 0%
2035 3 32 367,821 0 1,368,112 5,081 1,145,644 34,943 192,606 0 0 26,752,198 26,752,198 0%
2036 2 32 322,108 0 1,399,996 5,136 1,181,376 30,600 193,156 0 0 26,582,078 26,582,078 0%
2037 2 32 279,997 0 1,424,517 5,188 1,208,124 26,600 194,981 0 0 26,353,072 26,353,072 0%2038 2 32 236,981 0 1,448,849 5,238 1,235,346 22,513 196,228 0 0 26,062,232 26,062,232 0%
2039 1 31 213,780 0 1,459,491 5,284 1,246,045 20,309 198,421 0 0 25,733,691 25,733,691 0%
2040 1 31 201,547 0 1,461,771 5,326 1,246,634 19,147 201,315 0 0 25,381,486 25,381,486 0%
2041 1 30 179,998 0 1,471,139 5,365 1,256,125 17,100 204,279 20 1,020 24,992,436 24,991,416 0%
2042 1 30 142,396 1,020 1,493,582 5,399 1,305,583 13,528 206,728 573 28,450 24,544,064 24,515,614 0%
2043 1 29 111,809 28,450 1,507,741 5,429 1,396,974 10,622 209,160 3,190 135,225 24,047,070 23,911,845 1%
2044 0 29 84,319 135,225 1,517,204 5,455 1,494,762 8,010 211,684 9,207 336,229 23,505,976 23,169,747 1%
2045 0 28 56,395 336,229 1,525,072 5,477 1,599,395 5,358 213,918 19,155 643,506 22,920,535 22,277,029 3%
2046 0 28 40,096 643,506 1,520,677 5,493 1,711,353 3,809 216,120 33,763 1,082,381 22,307,518 21,225,137 5%
2047 0 27 28,236 1,082,381 1,511,543 5,505 1,831,148 2,682 218,334 53,893 1,671,390 21,673,009 20,001,619 8%2048 0 26 19,350 1,671,390 1,498,708 5,511 1,959,328 1,838 220,449 80,271 2,429,057 21,021,508 18,592,451 12%
2049 0 26 13,546 2,429,057 1,482,212 5,512 2,096,481 1,287 222,434 113,648 3,375,183 20,357,776 16,982,593 17%
2050 0 25 9,346 3,375,183 1,463,120 5,508 2,243,235 888 224,260 154,806 4,529,744 19,684,804 15,155,060 23%
2051 0 24 5,785 4,529,744 1,442,156 5,498 2,400,261 550 225,857 204,539 5,913,296 19,004,433 13,091,137 31%
2052 0 23 2,900 5,913,296 1,419,363 5,482 2,568,279 276 227,204 263,681 7,547,891 18,318,599 10,770,708 41%
2053 0 23 1,451 7,547,891 1,394,266 5,460 2,748,059 138 228,315 333,142 9,457,819 17,630,207 8,172,388 54%
2054 0 22 587 9,457,819 1,367,557 5,431 2,940,423 56 229,178 413,894 11,668,381 16,941,075 5,272,694 69%
2055 0 21 0 11,668,381 1,339,514 5,397 3,146,253 0 229,778 506,959 14,206,460 16,252,677 2,046,217 87%
2056 0 21 0 14,206,460 1,310,019 5,357 1,861,968 0 230,128 583,640 15,566,821 15,566,821 0 100%
2057 0 20 0 15,566,821 1,279,596 5,311 5,311 0 0 597,332 14,884,557 14,884,557 0 100%
aMember contributions include additional amounts for DROP members of $9,269 for plan year end June 30, 2018.
Total AssetsNumber

Alternative Funding on a Closed Group Basis, Table 1(c) (with Additional 15‐Year Solvency Test Contributions starting in PYE 2019)
City of St. Albans Firemen’s Pension and Relief Fund
II‐3
Valuation
Plan Premium Tax Actuarial
Year End Pay Total Assets Benefit Employer Member Allocation Investment Assets Accrued Unfunded Funded 30‐Jun Active Status Payroll (boy) Payments Expenses Contributions Contributions
aContributions Income (eoy) Liability Liability Ratio
2017 20 26 $912,222 $2,444,156 $617,725 $750 $241,363 $94,205 $207,958 $207,323 $2,576,530 $19,919,903 $17,343,373 13%2018 19 26 914,121 2,576,530 984,623 4,134 257,392 96,110 219,396 94,826 2,255,497 20,280,079 18,024,582 11%
2019 17 27 901,722 2,255,497 762,678 4,177 285,758 85,664 227,823 86,901 2,174,788 20,867,473 18,692,685 10%
2020 16 28 878,462 2,174,788 798,545 4,225 305,761 83,454 216,170 83,082 2,060,485 21,426,056 19,365,571 10%
2021 15 28 872,704 2,060,485 819,276 4,274 327,164 82,907 213,002 78,449 1,938,457 21,980,939 20,042,482 9%
2022 14 28 869,664 1,938,457 840,376 4,327 350,065 82,618 210,884 73,555 1,810,876 22,533,156 20,722,280 8%
2023 14 28 874,371 1,810,876 855,586 4,382 374,570 83,065 208,746 68,601 1,685,891 23,093,712 21,407,821 7%2024 13 28 876,900 1,685,891 875,171 4,438 400,790 83,305 208,562 63,733 1,562,673 23,657,920 22,095,247 7%
2025 12 29 861,838 1,562,673 908,564 4,493 428,845 81,875 207,056 58,640 1,426,031 24,201,246 22,775,215 6%
2026 12 29 852,642 1,426,031 935,635 4,548 458,864 81,001 205,097 53,175 1,283,985 24,733,473 23,449,488 5%
2027 11 29 843,534 1,283,985 961,929 4,602 490,984 80,136 204,755 47,584 1,140,912 25,255,576 24,114,664 5%
2028 9 30 799,966 1,140,912 1,010,905 4,658 525,353 75,997 203,980 41,473 972,152 25,722,661 24,750,509 4%
2029 8 30 740,095 972,152 1,069,011 4,719 562,128 70,309 200,662 34,121 765,642 26,111,364 25,345,722 3%2030 7 30 702,139 765,642 1,105,399 4,780 601,477 66,703 198,034 25,794 547,472 26,453,924 25,906,452 2%
2031 6 31 643,131 547,472 1,161,588 4,842 643,580 61,097 197,780 16,671 300,170 26,716,830 26,416,660 1%
2032 5 32 547,059 300,170 1,236,729 4,904 688,631 51,971 194,927 5,945 11 26,854,458 26,854,447 0%
2033 4 32 470,196 11 1,294,269 4,965 1,062,286 44,669 192,269 0 0 26,890,241 26,890,241 0%
2034 4 32 419,741 0 1,332,107 5,025 1,105,493 39,875 191,763 0 0 26,856,725 26,856,725 0%
2035 3 32 367,821 0 1,368,112 5,081 1,145,644 34,943 192,606 0 0 26,752,198 26,752,198 0%2036 2 32 322,108 0 1,399,996 5,136 1,181,376 30,600 193,156 0 0 26,582,078 26,582,078 0%
2037 2 32 279,997 0 1,424,517 5,188 1,208,124 26,600 194,981 0 0 26,353,072 26,353,072 0%
2038 2 32 236,981 0 1,448,849 5,238 1,235,346 22,513 196,228 0 0 26,062,232 26,062,232 0%
2039 1 31 213,780 0 1,459,491 5,284 1,246,045 20,309 198,421 0 0 25,733,691 25,733,691 0%
2040 1 31 201,547 0 1,461,771 5,326 1,246,634 19,147 201,315 0 0 25,381,486 25,381,486 0%
2041 1 30 179,998 0 1,471,139 5,365 1,266,019 17,100 204,279 216 11,110 24,992,436 24,981,326 0%2042 1 30 142,396 11,110 1,493,582 5,399 1,354,640 13,528 206,728 1,948 88,972 24,544,064 24,455,092 0%
2043 1 29 111,809 88,972 1,507,741 5,429 1,449,465 10,622 209,160 6,650 251,698 24,047,070 23,795,372 1%
2044 0 29 84,319 251,698 1,517,204 5,455 1,550,928 8,010 211,684 14,978 514,639 23,505,976 22,991,337 2%
2045 0 28 56,395 514,639 1,525,072 5,477 1,659,493 5,358 213,918 27,482 890,341 22,920,535 22,030,194 4%
2046 0 28 40,096 890,341 1,520,677 5,493 1,775,658 3,809 216,120 44,910 1,404,668 22,307,518 20,902,850 6%
2047 0 27 28,236 1,404,668 1,511,543 5,505 1,899,954 2,682 218,334 68,147 2,076,737 21,673,009 19,596,272 10%2048 0 26 19,350 2,076,737 1,498,708 5,511 2,032,951 1,838 220,449 97,943 2,925,699 21,021,508 18,095,809 14%
2049 0 26 13,546 2,925,699 1,482,212 5,512 2,175,258 1,287 222,434 135,074 3,972,028 20,357,776 16,385,748 20%
2050 0 25 9,346 3,972,028 1,463,120 5,508 2,327,526 888 224,260 180,349 5,236,423 19,684,804 14,448,381 27%
2051 0 24 5,785 5,236,423 1,442,156 5,498 2,490,453 550 225,857 234,593 6,740,221 19,004,433 12,264,212 35%
2052 0 23 2,900 6,740,221 1,419,363 5,482 2,664,785 276 227,204 298,669 8,506,310 18,318,599 9,812,289 46%
2053 0 23 1,451 8,506,310 1,394,266 5,460 2,851,320 138 228,315 373,524 10,559,881 17,630,207 7,070,326 60%2054 0 22 587 10,559,881 1,367,557 5,431 3,050,912 56 229,178 460,165 12,927,203 16,941,075 4,013,872 76%
2055 0 21 0 12,927,203 1,339,514 5,397 3,264,476 0 229,778 559,653 15,636,199 16,252,677 616,478 96%
2056 0 21 0 15,636,199 1,310,019 5,357 403,915 0 230,128 611,955 15,566,821 15,566,821 0 100%
2057 0 20 0 15,566,821 1,279,596 5,311 5,311 0 0 597,332 14,884,557 14,884,557 0 100%
aMember contributions include additional amounts for DROP members of $9,269 for plan year end June 30, 2018.
Total AssetsNumber

Alternative Funding on an Open Group Basis, Table 1(d) (with Recommended Solvency Contributions starting in PYE 2019)
City of St. Albans Firemen’s Pension and Relief Fund
II‐4
Valuation
Plan Premium Tax Actuarial
Year End Pay Total Assets Benefit Employer Member Allocation Investment Assets Accrued Unfunded Funded
30‐Jun Active Status Payroll (boy) Payments Expenses Contributions Contributionsa Contributions Income (eoy) Liability Liability Ratio
2017 20 26 $912,222 $2,444,156 $617,725 $750 $241,363 $94,205 $207,958 $207,323 $2,576,530 $19,919,903 $17,343,373 13%
2018 20 26 914,121 2,576,530 984,623 4,134 257,392 96,110 219,396 94,826 2,255,497 20,280,080 18,024,583 11%
2019 20 27 934,207 2,255,497 762,678 4,271 342,588 88,967 227,823 88,090 2,236,016 20,886,351 18,650,335 11%
2020 20 28 969,470 2,236,016 798,678 4,476 366,569 92,508 237,787 87,336 2,217,062 21,498,401 19,281,339 10%2021 20 28 1,012,737 2,217,062 819,883 4,638 392,229 96,566 244,055 86,867 2,212,258 22,136,998 19,924,740 10%
2022 20 28 1,055,049 2,212,258 841,755 4,791 419,685 100,561 250,037 86,980 2,222,974 22,802,122 20,579,148 10%
2023 20 28 1,108,402 2,222,974 857,923 4,950 449,063 105,675 256,276 87,892 2,259,007 23,507,760 21,248,753 10%
2024 20 28 1,150,552 2,259,007 878,618 5,081 480,497 109,673 261,903 89,734 2,317,114 24,245,202 21,928,088 10%
2025 20 29 1,189,108 2,317,114 913,220 5,249 514,132 113,497 268,630 92,244 2,387,148 24,999,131 22,611,983 10%
2026 20 29 1,243,461 2,387,148 941,635 5,434 550,121 118,821 275,931 95,442 2,480,394 25,786,461 23,306,067 10%
2027 20 29 1,288,352 2,480,394 969,505 5,584 588,629 123,115 282,399 99,593 2,599,041 26,604,239 24,005,198 10%2028 20 30 1,311,402 2,599,041 1,020,258 5,767 629,833 125,467 290,068 104,345 2,722,729 27,416,404 24,693,675 10%
2029 20 30 1,349,732 2,722,729 1,080,372 6,031 673,921 129,422 300,354 109,252 2,849,275 28,219,713 25,370,438 10%
2030 20 31 1,407,354 2,849,275 1,119,157 6,269 721,095 135,012 309,838 114,773 3,004,567 29,047,357 26,042,790 10%
2031 20 31 1,429,691 3,004,567 1,178,172 6,465 771,572 137,173 318,193 121,020 3,167,888 29,860,182 26,692,294 11%
2032 20 32 1,451,869 3,167,888 1,256,405 6,751 825,582 139,682 329,543 127,342 3,326,881 30,636,464 27,309,583 11%
2033 20 32 1,500,478 3,326,881 1,317,382 7,037 883,373 144,562 341,379 133,964 3,505,740 31,407,009 27,901,269 11%
2034 20 32 1,559,943 3,505,740 1,359,186 7,269 945,209 150,327 351,561 141,827 3,728,209 32,198,914 28,470,705 12%2035 20 33 1,612,260 3,728,209 1,399,507 7,478 1,011,374 155,490 361,715 151,537 4,001,340 33,010,512 29,009,172 12%
2036 20 32 1,680,673 4,001,340 1,436,040 7,706 1,082,170 162,325 372,583 163,486 4,338,158 33,856,201 29,518,043 13%
2037 20 32 1,742,348 4,338,158 1,465,673 7,895 1,157,922 168,199 382,266 178,176 4,751,154 34,740,403 29,989,249 14%
2038 20 32 1,814,445 4,751,154 1,495,444 8,110 1,238,977 174,703 393,344 196,056 5,250,679 35,669,785 30,419,106 15%
2039 20 32 1,895,478 5,250,679 1,512,329 8,306 1,325,705 181,789 403,804 217,764 5,859,107 36,661,602 30,802,495 16%
2040 20 32 1,979,721 5,859,107 1,525,088 8,496 1,418,504 189,450 414,294 244,041 6,591,812 37,722,721 31,130,909 17%
2041 20 32 2,054,139 6,591,812 1,550,881 8,693 1,517,799 196,275 425,062 275,150 7,446,523 38,838,586 31,392,063 19%2042 20 32 2,125,203 7,446,523 1,594,101 8,924 1,624,045 202,883 437,135 310,952 8,418,512 39,993,372 31,574,860 21%
2043 20 32 2,209,215 8,418,512 1,633,134 9,168 1,737,728 210,687 449,595 351,707 9,525,928 41,200,433 31,674,505 23%
2044 20 32 2,289,082 9,525,928 1,672,010 9,394 1,859,369 217,838 461,614 398,017 10,781,362 42,459,897 31,678,535 25%
2045 20 31 2,377,149 10,781,362 1,713,388 9,647 1,989,525 225,887 474,472 450,402 12,198,614 43,774,814 31,576,200 28%
2046 20 31 2,472,241 12,198,614 1,747,859 9,892 2,128,792 234,537 487,168 509,585 13,800,945 45,157,294 31,356,349 31%
2047 20 31 2,570,022 13,800,945 1,783,367 10,138 2,277,807 243,065 499,956 576,343 15,604,611 46,610,927 31,006,316 33%2048 20 31 2,668,092 15,604,611 1,820,516 10,392 2,437,253 251,437 513,188 651,335 17,626,917 48,134,556 30,507,639 37%
2049 20 31 2,767,322 17,626,917 1,861,706 10,660 2,607,861 260,334 527,006 735,235 19,884,987 49,725,569 29,840,582 40%
2050 20 31 2,870,946 19,884,987 1,909,747 10,941 2,790,411 269,799 541,474 828,689 22,394,672 51,385,167 28,990,495 44%
2051 20 31 2,976,610 22,394,672 1,962,373 11,229 2,985,740 279,063 556,276 932,374 25,174,523 53,114,790 27,940,267 47%
2052 20 31 3,082,726 25,174,523 2,017,311 11,529 3,194,742 288,431 571,680 1,047,104 28,247,640 54,911,501 26,663,861 51%
2053 20 31 3,193,034 28,247,640 2,077,293 11,845 3,418,374 298,551 587,869 1,173,784 31,637,080 56,774,665 25,137,585 56%
2054 20 31 3,307,400 31,637,080 2,143,367 12,170 3,657,660 309,170 604,544 1,313,327 35,366,244 58,705,390 23,339,146 60%2055 20 31 3,426,415 35,366,244 2,213,628 12,503 3,913,696 320,274 621,771 1,466,726 39,462,580 60,706,220 21,243,640 65%
2056 20 31 3,549,844 39,462,580 2,286,812 12,843 4,187,655 331,774 639,445 1,635,127 43,956,926 62,779,522 18,822,596 70%
2057 20 31 3,677,709 43,956,926 2,363,729 13,192 4,480,791 343,732 657,645 1,819,773 48,881,946 64,927,492 16,045,546 75%
aMember contributions include additional amounts for DROP members of $9,269 for plan year end June 30, 2018.
Total AssetsNumber

Alternative Funding on a Closed Group Basis, Table 1(e) (with Recommended Solvency Contributions starting in PYE 2019)
City of St. Albans Firemen’s Pension and Relief Fund
II‐5
Valuation
Plan Premium Tax Actuarial
Year End Pay Total Assets Benefit Employer Member Allocation Investment Assets Accrued Unfunded Funded
30‐Jun Active Status Payroll (boy) Payments Expenses Contributions Contributionsa Contributions Income (eoy) Liability Liability Ratio
2017 20 26 $912,222 $2,444,156 $617,725 $750 $241,363 $94,205 $207,958 $207,323 $2,576,530 $19,919,903 $17,343,373 13%
2018 19 26 914,121 2,576,530 984,623 4,134 257,392 96,110 219,396 94,826 2,255,497 20,280,079 18,024,582 11%
2019 17 27 901,722 2,255,497 762,678 4,177 342,588 85,664 227,823 88,026 2,232,743 20,867,473 18,634,730 11%
2020 16 28 878,462 2,232,743 798,545 4,225 366,569 83,454 216,170 86,605 2,182,771 21,426,056 19,243,285 10%
2021 15 28 872,704 2,182,771 819,276 4,274 392,229 82,907 213,002 84,629 2,131,988 21,980,939 19,848,951 10%
2022 14 28 869,664 2,131,988 840,376 4,327 419,685 82,618 210,884 82,675 2,083,147 22,533,156 20,450,009 9%
2023 14 28 874,371 2,083,147 855,586 4,382 449,063 83,065 208,746 80,967 2,045,021 23,093,712 21,048,691 9%
2024 13 28 876,900 2,045,021 875,171 4,438 480,497 83,305 208,562 79,677 2,017,454 23,657,920 21,640,466 9%
2025 12 29 861,838 2,017,454 908,564 4,493 514,132 81,875 207,056 78,520 1,985,979 24,201,246 22,215,267 8%
2026 12 29 852,642 1,985,979 935,635 4,548 550,121 81,001 205,097 77,380 1,959,395 24,733,473 22,774,078 8%2027 11 29 843,534 1,959,395 961,929 4,602 588,629 80,136 204,755 76,534 1,942,917 25,255,576 23,312,659 8%
2028 9 30 799,966 1,942,917 1,010,905 4,658 629,833 75,997 203,980 75,623 1,912,787 25,722,661 23,809,874 7%
2029 8 30 740,095 1,912,787 1,069,011 4,719 673,921 70,309 200,662 73,960 1,857,909 26,111,364 24,253,455 7%
2030 7 30 702,139 1,857,909 1,105,399 4,780 721,095 66,703 198,034 71,854 1,805,417 26,453,924 24,648,507 7%
2031 6 31 643,131 1,805,417 1,161,588 4,842 771,572 61,097 197,780 69,523 1,738,959 26,716,830 24,977,871 7%
2032 5 32 547,059 1,738,959 1,236,729 4,904 825,582 51,971 194,927 66,209 1,636,015 26,854,458 25,218,443 6%
2033 4 32 470,196 1,636,015 1,294,269 4,965 883,373 44,669 192,269 61,897 1,518,988 26,890,241 25,371,253 6%
2034 4 32 419,741 1,518,988 1,332,107 5,025 945,209 39,875 191,763 57,585 1,416,289 26,856,725 25,440,436 5%
2035 3 32 367,821 1,416,289 1,368,112 5,081 1,011,374 34,943 192,606 53,993 1,336,012 26,752,198 25,416,186 5%
2036 2 32 322,108 1,336,012 1,399,996 5,136 1,082,170 30,600 193,156 51,476 1,288,282 26,582,078 25,293,796 5%
2037 2 32 279,997 1,288,282 1,424,517 5,188 1,157,922 26,600 194,981 50,537 1,288,617 26,353,072 25,064,455 5%2038 2 32 236,981 1,288,617 1,448,849 5,238 1,238,977 22,513 196,228 51,617 1,343,865 26,062,232 24,718,367 5%
2039 1 31 213,780 1,343,865 1,459,491 5,284 1,325,705 20,309 198,421 55,333 1,478,858 25,733,691 24,254,833 6%
2040 1 31 201,547 1,478,858 1,461,771 5,326 1,418,504 19,147 201,315 62,558 1,713,285 25,381,486 23,668,201 7%
2041 1 30 179,998 1,713,285 1,471,139 5,365 1,517,799 17,100 204,279 73,733 2,049,692 24,992,436 22,942,744 8%
2042 1 30 142,396 2,049,692 1,493,582 5,399 1,624,045 13,528 206,728 88,827 2,483,838 24,544,064 22,060,226 10%
2043 1 29 111,809 2,483,838 1,507,741 5,429 1,737,728 10,622 209,160 108,153 3,036,330 24,047,070 21,010,740 13%
2044 0 29 84,319 3,036,330 1,517,204 5,455 1,859,369 8,010 211,684 132,472 3,725,206 23,505,976 19,780,770 16%
2045 0 28 56,395 3,725,206 1,525,072 5,477 1,989,525 5,358 213,918 162,440 4,565,898 22,920,535 18,354,637 20%
2046 0 28 40,096 4,565,898 1,520,677 5,493 2,128,792 3,809 216,120 198,925 5,587,374 22,307,518 16,720,144 25%
2047 0 27 28,236 5,587,374 1,511,543 5,505 2,277,807 2,682 218,334 242,938 6,812,087 21,673,009 14,860,922 31%2048 0 26 19,350 6,812,087 1,498,708 5,511 2,437,253 1,838 220,449 295,363 8,262,771 21,021,508 12,758,737 39%
2049 0 26 13,546 8,262,771 1,482,212 5,512 2,607,861 1,287 222,434 357,124 9,963,753 20,357,776 10,394,023 49%
2050 0 25 9,346 9,963,753 1,463,120 5,508 2,790,411 888 224,260 429,185 11,939,869 19,684,804 7,744,935 61%
2051 0 24 5,785 11,939,869 1,442,156 5,498 2,985,740 550 225,857 512,539 14,216,900 19,004,433 4,787,533 75%
2052 0 23 2,900 14,216,900 1,419,363 5,482 3,194,742 276 227,204 608,232 16,822,509 18,318,599 1,496,090 92%
2053 0 23 1,451 16,822,509 1,394,266 5,460 1,303,453 138 228,315 675,518 17,630,207 17,630,207 0 100%
2054 0 22 587 17,630,207 1,367,557 5,431 5,669 56 0 678,131 16,941,075 16,941,075 0 100%
2055 0 21 0 16,941,075 1,339,514 5,397 5,398 0 0 651,115 16,252,677 16,252,677 0 100%
2056 0 21 0 16,252,677 1,310,019 5,357 5,356 0 0 624,164 15,566,821 15,566,821 0 100%
2057 0 20 0 15,566,821 1,279,596 5,311 5,311 0 0 597,332 14,884,557 14,884,557 0 100%
aMember contributions include additional amounts for DROP members of $9,269 for plan year end June 30, 2018.
Total AssetsNumber

Open Group Actuarial Projections – Alternative Funding, Graph 2 (with no Additional Solvency)
City of St. Albans Firemen’s Pension and Relief Fund
II‐6
$0
$10
$20
$30
$40
$50
$60
$70
2017 2022 2027 2032 2037 2042 2047 2052 2057
Mil
lio
ns
Year
Liability and Assets ‐ Alternative Funding Market Value of Assets
Actuarial Accrued Liability

Open Group Actuarial Projections – Alternative Funding, Graph 3 (with no Additional Solvency)
City of St. Albans Firemen’s Pension and Relief Fund
II‐7
0%
20%
40%
60%
80%
100%
2017 2022 2027 2032 2037 2042 2047 2052 2057
Year
Funded Ratio ‐ Alternative Funding

Open Group Actuarial Projections – Alternative Funding, Graph 4 (with no Additional Solvency)
City of St. Albans Firemen’s Pension and Relief Fund
II‐8
$0
$1,000
$2,000
$3,000
$4,000
$5,000
$6,000
$7,000
2018 2023 2028 2033 2038 2043 2048 2053 2058
Tho
usa
nd
s
Year
Cash Flow Comparison - Alternative FundingState Insurance Premium Tax
Employee Contribution
Employer Contribution
Investment Income
Benefit Payments

SECTION III
FUNDING POLICY CHOICES

Actuarial Projections –Alternative/Optional/Conservation Funding
City of St. Albans Firemen’s Pension and Relief Fund
III‐1
Funding Policy Choices West Virginia Code §8‐22‐20 allows a municipality’s governing body (City Council) the choice of changing from the Alternative funding policy to either the Optional funding policy or the Conservation funding policy. The Optional funding policy is defined in West Virginia Code §8‐22‐20(e)(1), and is effective for plan years beginning after January 1, 2010. The Conservation funding policy is defined in West Virginia Code §8‐22‐20(f)(1), and is effective for plan years beginning after April 1, 2011. If the City Council elects either the Optional funding policy or the Conservation funding policy, the existing local Plan is closed, and new employees are covered in the multiple employer statewide plan ‐ Municipal Police Officers and Firefighters Retirement System. Contributions to the statewide plan include:
Employer contributions from 8.5% to 10.5% of pay. Currently, Employers contribute 8.5% of pay.
Employee contributions of 8.5% of pay. If the City Council elects the Optional funding policy, contributions to the closed local Plan include:
Employer contributions equal to the normal cost, net of employee contributions, plus a 40‐year closed period amortization from January 1, 2010, on a level dollar basis, of the unfunded actuarial accrued liability net of premium tax allocation applicable to the plan year.
Employee contributions of 7% of pay if hired before January 1, 2010, which may be increased by up to 2.5% of pay if elected by the Board of trustees of the Plan. Employees hired after January 1, 2010, contribute 9.50% of pay.
The premium tax allocation assigned to the Fund for the plan year. If the City Council elects the Conservation funding policy, contributions to the closed local Plan are made to two asset accounts as follows:
The first asset account (Benefit Payment Account) is used to finance benefits and expenses for the fiscal year on a pay‐as‐you‐go basis. Sources to pay current year benefits and expenses include active member employee contributions in excess of 1.5% of pay, a portion of the premium tax allocation not assigned to the accumulation account as defined below, and employer contributions.
The second account (Accumulation Account) cannot be used to pay benefits and expenses until assets exceed actuarial accrued liabilities. Contributions to the accumulation account include employee contributions of 1.5% of pay and a percentage of the premium tax allocation. The percentage of the premium tax allocation is based on the amounts needed to produce 100% funding of liabilities in 35 years, from adoption, considering assets from both the benefit payment account and the accumulation account. This account also includes the Fund’s assets prior to the adoption of the Conservation funding policy.

Actuarial Projections –Alternative/Optional/Conservation Funding (Continued)
City of St. Albans Firemen’s Pension and Relief Fund
III‐2
For purposes of evaluating the implication of selecting either the Optional funding policy or the Conservation funding policy, we have generated actuarial projections under the following two illustrative scenarios.
Scenario I – The sponsor elects either the Optional funding policy or Conservation funding policy during fiscal year end June 30, 2019, and makes the newly elected contribution in fiscal year end June 30, 2019.
Scenario II – The sponsor elects either the Optional funding policy or the Conservation funding policy at some future date when/if contributions are projected to be less than under the current Alternative funding policy.
It is important to note that the plan sponsor can make only one election to either the Optional funding policy or the Conservation funding policy, and that the election is irrevocable. The projections assume employer contributions of 10.5% of pay for future members covered under the statewide plan.
Given that the funded ratio as of June 30, 2017 is only 12.9% and that the ratio of assets to expected benefits for the year is only 2.62, we strongly recommend that the sponsor make additional contributions in excess of the statutory minimum under both the Alternative and Conservation funding policies.
Scenario I – Sponsor Immediately Elects either the Optional or Conservation Funding Policy
The following table shows the employer contribution for the fiscal year end June 30, 2019, if the sponsor elects either the Optional or Conservation funding policy in fiscal year end June 30, 2019:
Funding Method Amount Percent of Pay Amount Percent of Pay
Alternative $275,409 29.5% NA NA
Optional $1,185,328 131.5% $3,411 10.5%
Conservation $553,226 61.4% $3,411 10.5%
Total Employer Contributions for FYE June 30, 2019
Statewide PlanLocal Plan
Graphs I(1), I(2), and I(3) on the following pages show the projected contribution and funded ratio pattern of the three separate funding policies. If the sponsor continues to make contributions under the Alternative policy, employer contributions are projected to increase from $257,392 in fiscal year end 2018 to $3,602,145 in fiscal year end 2057. In fiscal year end 2057, the plan is projected to be 42% funded.
If the Optional funding policy is selected in fiscal year end 2019, employer contributions to the local plan for fiscal year end 2019 are projected to increase from $275,409 to $1,185,328. However, over the 40‐year projection period, total employer contributions to both the local plan and the statewide plan are projected to decrease from $1,188,739 in fiscal year end 2019 to $719,682 in fiscal year end 2049, and the Plan is projected to be fully funded in 2050.

Actuarial Projections –Alternative/Optional/Conservation Funding (Continued)
City of St. Albans Firemen’s Pension and Relief Fund
III‐3
If the Conservation funding policy is selected in fiscal year end 2019, employer contributions to the local plan for fiscal year end 2019 are projected to increase from $275,409 to $553,226. During the 35‐year projection period, total employer contributions to both the local plan and the statewide plan are projected to increase from $556,637 in fiscal year end 2019 to $1,413,650 in fiscal year end 2051 and the Plan is projected to be fully funded in 2052.
The Optional funding policy is consistent with actuarial standards of practice and produces a relatively stable dollar contribution pattern and reasonable growth in the funded ratio.
The Conservation funding policy produces a less stable contribution pattern and slower growth in the funded ratio when compared to the Optional funding policy. The projections of employer contributions under the Conservation funding policy are dependent on the expected number of retirements, disabilities, and resulting benefit payments. Actual experience could produce a significantly higher number of retirements, disabilities, and benefit payments, which would increase the employer’s required contribution under the Conservation funding policy. Unlike the Optional funding policy, the Conservation funding policy does not have a built‐in feature to smooth out emerging gains and losses.
The Alternative funding policy produces a significantly lower funded ratio when compared to either the Optional funding policy or the Conservation funding policy, and the 7% annual increases in employer contributions may eventually be cost prohibitive.
The details of the Optional and Conservation funding policy projections can be found in the Appendix. The details of the Alternative funding policy projections were presented in Section II.
Scenario II – Sponsor Elects Optional or Conservation Policy if/when Contributions are Lower
Under Scenario II, the plan sponsor is assumed to make contributions under the Alternative funding policy in future years, until the first year that either the Optional or Conservation policy produces a lower contribution. Under this assumption, the employer contributions under the Optional funding policy are not projected to be lower than contributions under the Alternative funding policy. In plan year end 2042, the employer contributions under the Conservation funding policy of $1,280,878 are projected to be lower than contributions under the Alternative funding policy of $1,305,583.
Graphs II(1), II(2), and III(3) show the projected contribution pattern and funded ratio. Based on these projections, the Conservation funding policy has lower projected employer contributions than the Alternative funding policy beginning in 2042. After 2042, the funded ratio under the Conservation funding policy increases at a lower rate than the Alternative funding policy. As stated above, however, the Conservation funding policy is dependent on expected benefits payments when considering the expected number of retirement and disabilities. The ultimate employer contributions depend on the actual number of retirement and disabilities, which could result in a more volatile contribution pattern when compared to the Optional funding policy.
The details of the Scenario II projections can be found in the Appendix.

Actuarial Projections –Alternative/Optional/Conservation Funding a
(Continued)
City of St. Albans Firemen’s Pension and Relief Fund
III‐4
Scenario I
$0
$500
$1,000
$1,500
$2,000
$2,500
$3,000
$3,500
$4,000
$4,500
2018 2023 2028 2033 2038 2043 2048 2053 2058
Tho
usa
nd
s
Year Ending
Graph I(1) Total Employer Contribution ‐ $ Amount bOptional Funding (2019)
Conservation Funding (2019)
Alternative Funding
0%
20%
40%
60%
80%
100%
120%
140%
2018 2023 2028 2033 2038 2043 2048 2053 2058Year Ending
Graph I(2) Total Employer Contribution ‐ % of Pay bOptional Funding (2019)
Conservation Funding (2019)
Alternative Funding
0%
20%
40%
60%
80%
100%
120%
2017 2022 2027 2032 2037 2042 2047 2052 2057Year
Graph I(3) Funded RatioOptional Funding (2019)
Conservation Funding (2019)
Alternative Funding
a Assumes Sponsor elects either the Optional funding policy or Conservation funding policy in fiscal year end June 30, 2019, and makes the newly elected contribution in fiscal year end June 30, 2019. Alternative funding projections based on Table 1(a). b Based on total pay and includes contributions for future members projected to participate in the statewide plan.

Actuarial Projections –Alternative/Optional/Conservation Funding a
(Continued)
City of St. Albans Firemen’s Pension and Relief Fund
III‐5
Scenario II
$0
$500
$1,000
$1,500
$2,000
$2,500
$3,000
$3,500
$4,000
$4,500
2018 2023 2028 2033 2038 2043 2048 2053 2058
Th
ou
san
ds
Year Ending
Graph II(1) Total Employer Contribution ‐ $ Amount b Optional Funding (NA)
Conservation Funding (2042)
Alternative Funding
0%
20%
40%
60%
80%
100%
120%
2018 2023 2028 2033 2038 2043 2048 2053 2058Year Ending
Graph II(2) Total Employer Contribution ‐ % of Pay bOptional Funding (NA)
Conservation Funding (2042)
Alternative Funding
0%
20%
40%
60%
80%
100%
120%
2017 2022 2027 2032 2037 2042 2047 2052 2057Year
Graph II(3) Funded RatioOptional Funding (NA)
Conservation Funding (2042)
Alternative Funding
a Assumes Sponsor elects either the Optional funding policy or Conservation funding policy in the first year that contributions are lower than under the Alternative funding policy. b Based on total pay and includes contributions for future members projected to participate in the statewide plan.

SECTION IV
ACTUARIALLY DETERMINED CONTRIBUTION FOR GASB STATEMENT NOS. 67 AND 68 REPORTING

Actuarially Determined Contribution for GASB Statement Nos. 67 and 68 Reporting
Schedule C: Funding Progress and Employer Contributions
City of St. Albans Firemen’s Pension and Relief Fund
IV‐1
Valuation Date July 1, 2016 July 1, 2017
Valuation Interest Rate 4.00% 4.00% Cost‐of‐Living Adjustment 2.75% 2.75%
Wage Inflation 3.75% 3.75% Actuarial Value of Assets Market Market
Actuarial Cost Method Entry Age Normal Entry Age Normal
Remaining Amortization Period a 24 Years, Level % of Pay 23 Years, Level % of Pay
Schedule of Funding Progress
Actuarial Valuation Date July 1, 2016 July 1, 2017
1. Market Value of Assets $2,444,156 $2,576,530
2. Actuarial Accrued Liability $19,315,144 $19,919,903
3. Unfunded Actuarial Accrued Liability (2 ‐ 1) $16,870,988 $17,343,373
4. Funded Ratio (1/2) 13% 13%
5. Expected Payroll $912,222 $914,121
6. UAAL as Percentage of Covered Payroll (3/5) 1,849% 1,897%
Schedule of Employer Contributions c FYE 2017 FYE 2018
1. Actuarially Determined Contribution
(a) Employer Normal Cost $456,692 $468,968 (b) Amortization of Unfunded Actuarial Accrued Liability $722,585 $774,191
(c) Actuarially Determined Contribution (ADC) (a + b) $1,179,277 $1,243,159
2. Employer Contribution b $241,363 $257,392
3. Premium Tax Allocation $207,958 $219,396
4. Percentage of ADC Contributed [ (2 + 3)/1(c)] 38% 38%
a Suggested amortization policy to comply with GASB Statement Nos. 67 and 68 Standards. b Estimated employer contribution for fiscal year end June 30, 2018. c The Alternative minimum contribution plus the premium tax allocation does not satisfy the Actuarially Determined Contribution as defined by GASB Statement Nos. 67 and 68.

SECTION V
AC T UA RI A L VALUATION DATA A S O F JU LY 1, 2017

Actuarial Valuation Data as of July 1, 2017
Schedule D: Reconciliation of Assets
City of St. Albans Firemen’s Pension and Relief Fund
V‐1
Plan Year Ending June 30, 2016 June 30, 2017
A. Market Value of Assets Beginning of Year $2,615,950 $2,444,156
Adjustment to Market Value of Assets at Beginning of Year $0 $0 Market Value of Assets Beginning of Year $2,615,950 $2,444,156
1. Revenue During Fiscal Year
(a) Employee Contribution $99,072 $94,205 (b) Governmental Contribution
(i) From Local Government $224,816 $241,363 (ii) From State Government $209,613 $207,958 (iii) Reallocation from State Government $0 $0
(iv) Total $434,429 $449,321 (c) Earnings on Investments (i) Net Appreciation/(Depreciation) ($99,658) $144,370 (ii) Bond Interest $15,732 $13,644 (iii) Dividends $36,128 $26,043
(iv) Net Realized Gain (Loss) on Sale/Exchange $12,946 $38,799 (v) Other $0 $0 (vi) Less Investment Expense ($18,217) ($15,533) (vii) Total ($53,069) $207,323
(d) Other Revenue $0 $0 (e) Receivable Investment Income/(Expense) $0 $0
(f) Receivable Contribution a
(i) From Employee Contributions $0 $0 (ii) From Local Government $0 $0 (iii) From State Government $0 $0 (iv) Total $0 $0
(g) Total Revenue (sum of (a) through (f)) $480,432 $750,849
2. Expenditures During Fiscal Year
(a) Benefits Paid $646,025 $617,725 (b) Withdrawals $0 $0 (c) Administrative Expenses $6,201 $750 (d) Payable Benefits and Withdrawals $0 $0
(e) Payable Administrative Expenses $0 $0 (f) Total Expenditures (sum of (a) through (e)) $652,226 $618,475
B. Market Value of Assets End of Year
[A + 1(g) ‐ 2(f)] $2,444,156 $2,576,530
C. Approximate Return on Assets (2.32)% 8.58%
a Receivable contributions for each respective plan year ending.

Actuarial Valuation Data as of July 1, 2017
Schedule E: Assets Held by Category
City of St. Albans Firemen’s Pension and Relief Fund
V‐2
Plan Year Ending June 30, 2016 June 30, 2017
1. Cash and Short‐term Investments $400,006 16% $523,449 20%
2. Government Securities
(a) US Treasury Bills, Notes and Bonds $196,646 $144,892
(b) US State and Local Governmental Debt Securities $0 $229,849
(c) Foreign Governmental Debt Securities $0 $0
(d) Other $219,061 $0
(e) Total Government Securities (sum of (a) through (d) ) $415,707 17% $374,741 15%
3. Corporate Fixed Income
(a) US Bonds $0 $0
(b) US Mortgage or other Asset Backed Securities $0 $0
(c) US Mutual Fund Shares (Bonds) $0 $138,165
(d) US Exchange Traded Funds (Bonds) $0 $0
(e) International Bonds $0 $0
(f) International Mutual Fund Shares (Bonds) $0 $0
(g) International Exchange Traded Funds (Bonds) $0 $0
(h) Total Corporate Fixed Income (sum of (a) through (g) ) $0 0% $138,165 5%
4. Corporate Equity
(a) US Equity $292,477 $62,494
(b) US Mutual Fund Shares (Equity) $0 $0
(c) US Exchange Traded Funds (Equity) $613,396 $655,198
(d) International Equity $388,969 $464,948
(e) International Mutual Fund Shares (Equity) $0 $0
(f) International Exchange Traded Funds (Equity) $0 $5,899
(g) Total Corporate Equity (sum of (a) through (f) ) $1,294,842 53% $1,188,539 46%
5. Alternative Investments
(a) Real Estate Investment Trust $0 $0
(b) Private Equity Fund $0 $0
(c) Hedge Funds $0 $0
(d) Other Alternative Investments $333,601 $351,636 (e) Total Alternative Investments (sum of (a) through (d) ) $333,601 14% $351,636 14%
6. Other $0 0% $0 0%
7. Receivable Contributions $0$
(a) From Employee Contributions $0 $0 (b) From Local Government $0 $0
(c) From State Government $0 $0 (d) Total Receivable Contributions (sum of (a) through (c) ) $0 0% $0 0%
8. Accruals
(a) Receivable (other than State and Local Contributions) $0 $0
(b) Less Payable $0 $0
(c) Total $0 0% $0 0%
Market Value of Assets End of Year $2,444,156 $2,576,530
[ sum of (1) through (8) ]

Actuarial Valuation Data as of July 1, 2017 Schedule F: Summary of Participant Activity
City of St. Albans Firemen’s Pension and Relief Fund
V‐3
Deferred Spouses and
Actives Retirees Disabled Vested Beneficiaries Totals
Total Participants July 1, 2016: 20 14 5 0 6 45
New Actives: 1 1
Returned to Actives Status: 0
Data Corrections/Other Changes: 0
Vested Terminations: 0
Non‐Vested Terminations: 0
Disabled: (1) 1 0
Retirements: 0
Deaths with Beneficiary: 0
Deaths w/o Beneficiary: 0
Expired Annuity or Stop Payment: 0
Net Changes: 0 0 1 0 0 1
Total Participants June 30, 2017: 20 14 6 0 6 46

Actuarial Valuation Data as of July 1, 2017 Schedule G: Distribution of Active Employees by Age and Length of Service
City of St. Albans Firemen’s Pension and Relief Fund
V‐4
Attained Valuation
Age Less than 1 1‐4 5‐9 10‐14 15‐19 20‐24 25‐29 30‐34 Over 35 Totals Payrolla
Under 20 0 $
20‐24 1 1 36,316 $
25‐29 1 1 2 81,991 $
30‐34 1 1 2 81,244 $
35‐39 5 1 2 8 355,183 $
40‐44 1 2 1 4 191,756 $
45‐49 1 1 67,753 $
50‐54 1 1 49,689 $
55‐59 1 1 44,375 $
60‐64 0 $
65‐69 0 $
Over 70 0 $
Totals 1 2 8 1 5 2 1 0 0 20 908,308 $
38.2 years
11.5 years
$45,415 a
aBased on payroll at beginning of plan year.
Annual Pay:
Years of Service to Valuation Date
Age:
Service:
Averages_____________________

Actuarial Valuation Data as of July 1, 2017 Schedule H: Participants Summary
City of St. Albans Firemen’s Pension and Relief Fund
V‐5
Active Participants July 1, 2016 July 1, 2017
Number of Actives 20 20
Total Annual Paya $906,461 $908,308
Average Age 37.8 38.2
Average Service 11.4 11.5
a Excludes annual pay for 2 members participating in the DROP.
Inactive Participants
Type No. Annual Benefit No. Annual Benefit
Retireesc 14 $473,101 14 $476,040
Survivors 6 $92,108 6 $93,237
Disabled Members 5 $122,710 6 $149,769
Deferred Vested
Members0 $0 0 $0
July 1, 2016 July 1, 2017ᵇ
b Data provided includes 2 non‐vested members with accumulated contribution balances of $5,413 as of June 30, 2017 c Retiree data as of July 1, 2016, and as of July 1, 2017, includes 2 members classified as DROP members with accumulated DROP balances of $147,433 as of June 30, 2016, and $245,002 as of June 30, 2017.

SECTION VI
ACTUARIAL ASSUMPTIONS AND METHODS

Actuarial Assumptions and Methods Used in the Valuation as of July 1, 2017
City of St. Albans Firemen’s Pension and Relief Fund
VI‐1
Discount Rate The following table outlines the factors used to determine the discount rate:
Funded Ratio as of
Valuation Date 1
Liquidity Ratio 2
Equity Exposure 3
Projected Funded Ratio
after 15 Years 1
Discount Rate
60% or more 10 50% or more 70% or more 6.5%
40% or more 8 40% or more 60% or more 6.0%
30% or more 6 30% or more 50% or more 5.5%
15% or more 4 n/a 40% or more 5.0%
Less than 15% n/a n/a 15% or more 4.5%
Less than 15% n/a n/a Less than 15% 4.0%
1Funded ratios based on a 6.0% investment return assumption for plans using an actuarially sound policy
(standard or optional) and a 5.5% investment return assumption for other plans (alternative or conservation).
2Liquidity ratio equals assets as of the actuarial valuation date divided by expected benefit payments for the year.
3Based on investment policy.
As of June 30, 2017
Assets $2,576,530
Liabilities using a 5.50% discount rate $16,054,161
Funded Ratio 16%
Expected Benefit Payments $984,623
Liquidity Ratio 2.62
Equity Exposure 46%
Projected Funded Ratio after 15 years 8%
Discount Rate
4.00%

Actuarial Assumptions and Methods Used in the Valuation as of July 1, 2017 (Continued)
City of St. Albans Firemen’s Pension and Relief Fund
VI‐2
The premium tax allocation is projected using the following methodology:
(1) The Base Allocation for all Pension and Relief Funds is a fixed amount equal to
$8,709,689 in all future years. This amount is allocated to each individual Pension
and Relief Fund in proportion to the number of eligible members, which includes
active members covered in either the Pension and Relief Fund or the statewide
plan, Municipal Police Officers and Firefighters Retirement System (“MPFRS”).
(2) The Excess Allocation is equal to the excess of the current year premium tax
assigned to all Pension and Relief Funds over the total Base Allocation. This amount
is allocated to each individual Pension and Relief Fund in proportion to the number
of eligible active and retired members covered in either the Pension and Relief Fund
or the MPFRS.
(3) We have assumed all Pension and Relief Funds will make the minimum statutory
contribution requirement and will receive 100% of both the Base Allocation and the
Excess Allocation assigned to the individual plan. Consequently, the projections do
not include any reallocation of Expired Premium Tax Allocation for plan years
beginning on and after July 1, 2019.
(4) The total available premium tax allocation, net of expenses, as of September 1,
2018, includes a Base Allocation of $8,709,689, an Excess Allocation of $9,570,473,
and an Expired Premium Tax Allocation of $237,031.
(5) For the plan year ending June 30, 2018, all Pension and Relief Funds reported a total
of 1,717 eligible active members and 2,165 eligible retired members. The City of St.
Albans Firemen’s Pension and Relief Fund reported 22 eligible active members and
25 eligible retired members, based on the average number of plan participants for
the 12‐month period ending June 30, 2018. The Fund is eligible to receive a
premium tax allocation of $227,823 for the fiscal year ending June 30, 2019.
(6) The total premium tax allocation was assumed to increase by 2.75% in calendar
years ending on and after 2019.

Actuarial Assumptions and Methods Used in the Valuation as of July 1, 2017 (Continued)
City of St. Albans Firemen’s Pension and Relief Fund
VI‐3
General Inflation 2.75%
Expected Salary Increase Service‐based Increase:
General Inflation: 2.75% plus Wage Inflation Increment: 1.00% plus Years of Service Increase
1 20.00% 2 6.50% 3 3.50% 4 2.75% 5‐9 2.50% 10‐29 2.00% 30‐34 1.25%
after 34 years of service 0.00%
Post‐retirement COLA
2.75% on first $15,000 of Annual Benefit and on the accumulated supplemental pension amounts for prior years. Assumed to be payable to all members receiving payments.
Increase in State Insurance Premium Tax Allocation
2.75% on and after year 1
Cost Method Entry‐Age‐Normal, Level‐Percentage‐of‐Pay
Amortization Policies: Alternative Plans and former Alternative Plans that selected the Conservation Policy Standard Plans and former Standard Plans that selected the Optional Policy Former Alternative Plans that selected the Optional Policy
For GASB 67/68 Accounting: 30 – Year Closed Level‐Percentage‐of‐Pay Amortization (from July 1, 2010 – 23 years remaining as of July 1, 2017). For funding and GASB 67/68 Accounting: 40‐Year Closed Level‐Dollar Amortization (from July 1, 1991 – 14 years remaining as of July 1, 2017) For funding: 40‐Year Closed Level‐Dollar Amortization (from January 1, 2010 – 32.5 years remaining as of July 1, 2017). For GASB 67/68 Accounting: 30‐Year Closed Level‐Percentage‐of‐Pay Amortization (from July 1, 2010 – 23 years remaining as of July 1, 2017)

Actuarial Assumptions and Methods Used in the Valuation as of July 1, 2017 (Continued)
City of St. Albans Firemen’s Pension and Relief Fund
VI‐4
Asset Method Market Value
Turnover
Sample Rates – Age Rates
25 9% 35 4% 45 2% 50 0%
Retirement
Age Ratesa
50 45% 51‐55 30% 56‐59 35% 60 100% aTerminated vested participants are assumed to retire at age 50.
Mortality
Active: RP‐2014 Blue Collar Healthy Employeeb Post‐Retirement: RP‐2014 Blue Collar Healthy Annuitant Disabled: RP‐2014 Blue Collar Healthy Annuitant set forward four years Tables above incorporate generational mortality improvement using MP‐2014 2‐dimensional mortality improvement scales bAssumes 10% of deaths are duty‐related and 90% are non‐duty related.
Disability
Sample Rates – Age Ratesc
30 0.22% 40 0.50% 50 0.79%
c Assumes 60% duty related and 40% non‐duty related. Also assumes 10% of non‐duty disabled members receive a 20% reduction in benefits due to gainful employment.
Percent Married 90%
Spouse Age Females 3 years younger than males

Actuarial Assumptions and Methods Used in the Valuation as of July 1, 2017 (Continued)
City of St. Albans Firemen’s Pension and Relief Fund
VI‐5
Administrative Expenses Administrative expenses used are equal to 0.25% of expected pay plus 0.25% of expected benefits. Future expenses assumed to increase by the general inflation assumption.
Refunds Paid Assumes non‐vested inactive members as of July 1, 2017, with accumulated member contribution balances will receive a refund of their contributions during plan year end June 30, 2018.
Data Adjustments and Assumptions Valued 2 individuals participating in the DROP as retired members. DROP members are assumed to retire as of June 30, 2018, and receive a distribution of their DROP balance as of June 30, 2018.
Child Beneficiaries Future survivor widow benefits are loaded by 12% to estimate impact of benefits provided to survivor children. The load assumes 90% of members are married with two children at time of death, and benefits for each child are paid for approximately 8 years.
General Projection Methodology Open group projections assume: (i) Salaries will increase and members will decrement
as specified in the actuarial assumption section. (ii) Active members who retire, become disabled, die
or terminate during the year are replaced with new entrants such that the number of active members remains stable during the projection period. Pay for new entrants in future years is increased by the wage inflation assumption. The average age of a new entrant is based on observed experience over the last five years.
(iii) Assets grow at the assumed rate of return. (iv) The sponsor makes the statutory required
contribution on a monthly basis. (v) Non‐vested members with accumulated plan
balances as of July 1, 2017, will receive a refund during plan year end June 30, 2018.
Closed group projections are the same as the open group projections except active members who retire, become disabled, die, or terminate are not replaced with new entrants.
Decrement Timing Mid‐Year

SECTION VII
SUMMARY OF PRINCIPAL PLAN PROVISIONS

Summary of Principal Plan Provisions Actuarial Valuation as of July 1, 2017
City of St. Albans Firemen’s Pension and Relief Fund
VII‐1
Employee Eligibility — All compensated employees of the Fire Department are eligible to participate in the Firemen’s Pension and Relief Fund. Average Annual Compensation — The average of any three twelve‐consecutive‐month periods of employment which produces the highest average annual compensation.
Each twelve‐consecutive‐month annual compensation is limited to 120% of the Average Adjusted Salary received by the member in the two consecutive twelve‐consecutive‐month periods immediately preceding the twelve‐consecutive‐month period used in determining benefits.
The Average Adjusted Salary is base salary (exclusive of all overtime and other pay) of the year used in determining benefits multiplied by the ratio of total salary (includes all overtime and other pay) to base salary from the respective preceding twelve‐consecutive‐month period.
Determining Years of Service Credit (Credited Service) — The number of years that the member has contributed to the employees retirement and benefit fund.
Prior Military Service — A city may provide that members who have been honorably discharged from the military shall receive up to two years prior service credit for military service prior to their employment with the city.
Current Military Service — Any current member who has been on qualified military service in the armed forces of the United States with an honorable discharge may, within six months from his or her date of discharge, be given credit for continuous service in the paid police or fire department.
Any member who has served in active duty with the armed forces of the United States, whether prior to or subsequent to becoming a member of a paid police or fire department, shall receive one additional percent for each year so served in active military duty, up to a maximum of four additional percent.
Absence from the service because of sickness or injury for a period of two years or less shall not be construed as time out of service.
Contributions — Participating employees contribute 9.5% of compensation. Participating employees hired on or after January 1, 2010 contribute 9.5% of compensation. The municipality has elected to contribute the minimum employer contribution under the Alternative funding policy. Normal Retirement — Members are eligible at the earlier of age 50 with 20 years of credited service or age 65. Benefit Commencement — Annual retirement pension benefits commence upon retirement or upon the member attaining age fifty, whichever is later, payable in twelve monthly installments.

Summary of Principal Plan Provisions Actuarial Valuation as of July 1, 2017 (Continued)
City of St. Albans Firemen’s Pension and Relief Fund
VII‐2
Accrued Benefit — The annual retirement benefit equals 60% of average annual compensation, not less than $6,000, plus an additional percentage of average annual compensation for service over 20 years equal to 2% for each year of service between 20 and 25 and 1% for each year of service between 25 and 30 years. Employees serving in the military are eligible for an additional 1% of average annual compensation for each year of military service up to four years. The maximum benefit is limited to 75% of average annual compensation. Benefits continue for life. Disability Retirement — Members are eligible after earning five years of service. No service requirement if disability is service related. The monthly disability benefit equals the greater of 60% of monthly salary at disability or $500. Employees serving in the military are eligible for an additional benefit of 1% of monthly salary at disability for each year of military service up to four years. Disability benefits, when aggregated with monthly state workers compensation benefits, shall not exceed 100% of the member’s monthly compensation at the time of disability. Benefits continue for life or until recovery. Death Benefits — Members are eligible after earning five years of service. No service requirement if death is service related. Retirees and terminated vested participants are also eligible. The benefit is equal to 60% of the participant’s benefit, but not less than $300 per month, payable to the spouse until death or remarriage. Other dependents (children, parents, brothers and sisters) are also eligible for death benefits. To each dependent child, 20 percent of the participant’s benefit until the child attains eighteen or marries; to each dependent orphaned child, 25 percent of the participant’s benefit until the child attains 18 or marries; to each dependent parent, 10 percent of the participant’s benefit for life, and to each dependent brother or sister, the sum of fifty dollars per month (but a total not to exceed $100 per month) until such individual attains the age of eighteen years or marries. In no case shall the payments to the surviving spouse and children be reduced below 65 percent of the total amount paid to all dependents. Supplemental Pension Benefits — All retirees, surviving beneficiaries and disability pensioners are eligible for automatic cost‐of‐living benefits commencing on the first day of July following two years of retirement. The benefits equal the percentage increase in the Consumer Price Index, limited to 4% (2% for some disability retirees), multiplied by the sum of the allowable amount which is the first $15,000 of the total annual benefits paid and the accumulated supplemental pension amounts for prior years. Termination Benefits — Any member who terminates employment prior to retirement will be entitled to a refund of contributions without interest. Refunds — Any member who terminates from their department without receiving a retirement pension shall be refunded all deductions made from his salary, without interest. Any member who receives such a refund and subsequently wishes to reenter the department must repay to the pension fund all sums refunded with interest at the rate of eight percent annual.

SECTION VIII
APPENDIX – PROJECTION DATA

Actuarial Projections – Optional Funding in 2019 Table A‐1
City of St. Albans Firemen’s Pension and Relief Fund
VIII‐1
Valuation
Plan Premium Tax Actuarial
Year End Pay Assets Benefit Employer Member Allocation Investment Assets Accrued Unfunded Funded 30‐Jun Active Status (boy) Payments Expenses Contribs. Contribs.
aContribs. Income (eoy) Liability Liability Ratio
2017 20 26 $2,444,156 $617,725 $750 $241,363 $94,205 $207,958 $207,323 $2,576,530 $19,919,903 $17,343,373 13%
2018 19 26 2,576,530 984,623 4,134 257,392 96,110 219,396 94,826 2,255,497 20,280,079 18,024,582 11%
2019 17 27 2,255,497 762,678 4,177 1,185,328 85,664 227,823 104,716 3,092,173 20,867,473 17,775,300 15%
2020 16 28 3,092,173 798,545 4,225 1,220,582 83,454 237,787 138,323 3,969,549 21,426,056 17,456,507 19%
2021 15 28 3,969,549 819,276 4,274 1,203,854 82,907 244,055 172,788 4,849,603 21,980,939 17,131,336 22%
2022 14 28 4,849,603 840,376 4,327 1,193,123 82,618 250,037 207,472 5,738,149 22,533,156 16,795,007 25%
2023 14 28 5,738,149 855,586 4,382 1,183,519 83,065 256,276 242,654 6,643,695 23,093,712 16,450,017 29%
2024 13 28 6,643,695 875,171 4,438 1,179,054 83,305 261,903 278,515 7,566,863 23,657,920 16,091,057 32%
2025 12 29 7,566,863 908,564 4,493 1,173,444 81,875 268,630 314,772 8,492,526 24,201,246 15,708,720 35%
2026 12 29 8,492,526 935,635 4,548 1,158,507 81,001 275,931 351,094 9,418,875 24,733,473 15,314,598 38%
2027 11 29 9,418,875 961,929 4,602 1,147,272 80,136 282,399 387,514 10,349,664 25,255,576 14,905,912 41%
2028 9 30 10,349,664 1,010,905 4,658 1,135,763 75,997 290,068 423,617 11,259,546 25,722,661 14,463,115 44%
2029 8 30 11,259,546 1,069,011 4,719 1,103,886 70,309 300,354 458,319 12,118,684 26,111,364 13,992,680 46%
2030 7 30 12,118,684 1,105,399 4,780 1,061,584 66,703 309,838 491,242 12,937,872 26,453,924 13,516,052 49%
2031 6 31 12,937,872 1,161,588 4,842 1,030,442 61,097 318,193 522,333 13,703,507 26,716,830 13,013,323 51%
2032 5 32 13,703,507 1,236,729 4,904 987,719 51,971 329,543 550,667 14,381,774 26,854,458 12,472,684 54%
2033 4 32 14,381,774 1,294,269 4,965 924,589 44,669 341,379 575,497 14,968,673 26,890,241 11,921,568 56%
2034 4 32 14,968,673 1,332,107 5,025 869,927 39,875 351,561 597,247 15,490,151 26,856,725 11,366,574 58%
2035 3 32 15,490,151 1,368,112 5,081 829,347 34,943 361,715 616,691 15,959,654 26,752,198 10,792,544 60%
2036 2 32 15,959,654 1,399,996 5,136 788,517 30,600 372,583 634,159 16,380,381 26,582,078 10,201,697 62%
2037 2 32 16,380,381 1,424,517 5,188 752,105 26,600 382,266 649,893 16,761,540 26,353,072 9,591,532 64%
2038 2 32 16,761,540 1,448,849 5,238 715,936 22,513 393,344 664,079 17,103,325 26,062,232 8,958,907 66%
2039 1 31 17,103,325 1,459,491 5,284 679,716 20,309 403,804 676,985 17,419,364 25,733,691 8,314,327 68%
2040 1 31 17,419,364 1,461,771 5,326 653,718 19,147 414,294 689,250 17,728,676 25,381,486 7,652,810 70%
2041 1 30 17,728,676 1,471,139 5,365 634,266 17,100 425,062 701,224 18,029,824 24,992,436 6,962,612 72%
2042 1 30 18,029,824 1,493,582 5,399 610,221 13,528 437,135 712,517 18,304,243 24,544,064 6,239,821 75%
2043 1 29 18,304,243 1,507,741 5,429 579,215 10,622 449,595 722,788 18,553,293 24,047,070 5,493,777 77%
2044 0 29 18,553,293 1,517,204 5,455 551,288 8,010 461,614 732,195 18,783,741 23,505,976 4,722,235 80%
2045 0 28 18,783,741 1,525,072 5,477 523,957 5,358 474,472 740,918 18,997,897 22,920,535 3,922,638 83%
2046 0 28 18,997,897 1,520,677 5,493 496,544 3,809 487,168 749,249 19,208,497 22,307,518 3,099,021 86%
2047 0 27 19,208,497 1,511,543 5,505 473,222 2,682 499,956 757,622 19,424,932 21,673,009 2,248,077 90%
2048 0 26 19,424,932 1,498,708 5,511 451,677 1,838 513,188 766,353 19,653,769 21,021,508 1,367,739 93%
2049 0 26 19,653,769 1,482,212 5,512 430,536 1,287 527,006 775,676 19,900,550 20,357,776 457,226 98%
2050 0 25 19,900,550 1,463,120 5,508 11,067 888 464,553 776,374 19,684,804 19,684,804 0 100%
2051 0 24 19,684,804 1,442,156 5,498 7,844 550 0 758,889 19,004,433 19,004,433 0 100%
2052 0 23 19,004,433 1,419,363 5,482 6,638 276 0 732,097 18,318,598 18,318,599 0 100%
2053 0 23 18,318,598 1,394,266 5,460 6,049 138 0 705,146 17,630,206 17,630,207 0 100%
2054 0 22 17,630,206 1,367,557 5,431 5,669 56 0 678,131 16,941,074 16,941,075 0 100%
2055 0 21 16,941,074 1,339,514 5,397 5,398 0 0 651,115 16,252,676 16,252,677 0 100%2056 0 21 16,252,676 1,310,019 5,357 5,356 0 0 624,164 15,566,820 15,566,821 0 100%
2057 0 20 15,566,820 1,279,596 5,311 5,311 0 0 597,332 14,884,555 14,884,557 0 100%aMember contributions include additional amounts for DROP members of $9,269 for plan year end June 30, 2018.
Total AssetsNumber

Actuarial Projections – Optional Funding in 2019 Table A‐2
City of St. Albans Firemen’s Pension and Relief Fund
VIII‐2
Valuation Plan Closed New Premium Tax Optional Statewide
Year End Group Entrant Total Employee Gross Net Employer Amortization Allocation Net Employer Employer Employer30‐Jun
aPayroll Payroll Payroll Contributions Normal Cost Normal Cost of UAAL Contributions Amortization Expenses Contribution Contribution
2018 $914,121 $0 $914,121 $86,841 $551,675 $464,834 $944,183 $227,823 $716,360 $4,134 $1,185,328 $0
2019 901,722 32,484 934,207 85,664 543,119 457,455 996,737 237,787 758,950 4,177 1,220,582 3,411
2020 878,462 91,008 969,470 83,454 527,803 444,349 999,335 244,055 755,280 4,225 1,203,854 9,556
2021 872,704 140,034 1,012,737 82,907 523,069 440,162 998,724 250,037 748,687 4,274 1,193,123 14,704
2022 869,664 185,386 1,055,049 82,618 519,649 437,031 998,437 256,276 742,161 4,327 1,183,519 19,465
2023 874,371 234,031 1,108,402 83,065 521,404 438,339 998,236 261,903 736,333 4,382 1,179,054 24,573
2024 876,900 273,652 1,150,552 83,305 522,631 439,326 998,310 268,630 729,680 4,438 1,173,444 28,733
2025 861,838 327,270 1,189,108 81,875 513,440 431,565 998,379 275,931 722,448 4,493 1,158,507 34,363
2026 852,642 390,820 1,243,461 81,001 508,242 427,241 997,882 282,399 715,483 4,548 1,147,272 41,036
2027 843,534 444,817 1,288,352 80,136 503,797 423,661 997,568 290,068 707,500 4,602 1,135,763 46,706
2028 799,966 511,436 1,311,402 75,997 478,275 402,278 997,304 300,354 696,950 4,658 1,103,886 53,701
2029 740,095 609,637 1,349,732 70,309 441,222 370,913 995,790 309,838 685,952 4,719 1,061,584 64,012
2030 702,139 705,215 1,407,354 66,703 417,143 350,440 993,416 318,193 675,223 4,780 1,030,442 74,048
2031 643,131 786,560 1,429,691 61,097 381,807 320,710 991,710 329,543 662,167 4,842 987,719 82,589
2032 547,059 904,810 1,451,869 51,971 323,759 271,788 989,276 341,379 647,897 4,904 924,589 95,005
2033 470,196 1,030,282 1,500,478 44,669 276,046 231,377 985,145 351,561 633,584 4,965 869,927 108,180
2034 419,741 1,140,202 1,559,943 39,875 244,503 204,628 981,410 361,715 619,695 5,025 829,347 119,721
2035 367,821 1,244,438 1,612,260 34,943 212,223 177,280 978,739 372,583 606,156 5,081 788,517 130,666
2036 322,108 1,358,565 1,680,673 30,600 183,861 153,261 975,975 382,266 593,709 5,136 752,105 142,649
2037 279,997 1,462,352 1,742,348 26,600 157,317 130,717 973,375 393,344 580,031 5,188 715,936 153,547
2038 236,981 1,577,464 1,814,445 22,513 130,010 107,497 970,786 403,804 566,982 5,238 679,716 165,634
2039 213,780 1,681,698 1,895,478 20,309 115,090 94,781 967,947 414,294 553,653 5,284 653,718 176,578
2040 201,547 1,778,174 1,979,721 19,147 107,039 87,892 966,109 425,062 541,047 5,326 634,266 186,708
2041 179,998 1,874,140 2,054,139 17,100 94,098 76,998 964,993 437,135 527,858 5,365 610,221 196,785
2042 142,396 1,982,807 2,125,203 13,528 73,635 60,107 963,304 449,595 513,709 5,399 579,215 208,195
2043 111,809 2,097,407 2,209,215 10,622 57,702 47,080 960,393 461,614 498,779 5,429 551,288 220,228
2044 84,319 2,204,763 2,289,082 8,010 43,419 35,409 957,565 474,472 483,093 5,455 523,957 231,500
2045 56,395 2,320,753 2,377,149 5,358 29,012 23,654 954,581 487,168 467,413 5,477 496,544 243,679
2046 40,096 2,432,145 2,472,241 3,809 20,550 16,741 950,944 499,956 450,988 5,493 473,222 255,375
2047 28,236 2,541,786 2,570,022 2,682 14,385 11,703 947,658 513,188 434,470 5,505 451,677 266,888
2048 19,350 2,648,742 2,668,092 1,838 9,772 7,934 944,097 527,006 417,091 5,511 430,536 278,118
2049 13,546 2,753,776 2,767,322 1,287 6,841 5,554 938,971 464,553 397,497 5,512 11,067 b 289,146
2050 9,346 2,861,601 2,870,946 888 4,720 3,832 0 0 0 5,508 7,844 b 300,468
2051 5,785 2,970,825 2,976,610 550 2,894 2,344 0 0 0 5,498 6,638 b 311,937
2052 2,900 3,079,826 3,082,726 276 1,433 1,157 0 0 0 5,482 6,049 b 323,382
2053 1,451 3,191,583 3,193,034 138 727 589 0 0 0 5,460 5,669 b 335,116
2054 587 3,306,813 3,307,400 56 294 238 0 0 0 5,431 5,398 b 347,215
2055 0 3,426,415 3,426,415 0 0 0 0 0 0 5,397 5,356 b 359,774
2056 0 3,549,844 3,549,844 0 0 0 0 0 0 5,357 5,311 b 372,734
2057 0 3,677,709 3,677,709 0 0 0 0 0 0 5,311 5,260 b 386,159a Assumes employer makes contributions for the applicable valuation plan year in the following fiscal year.
b Amount required to remain at 100% funded.
Employer Contributions

Actuarial Projections – Conservation Funding in 2019 Table A‐3
City of St. Albans Firemen’s Pension and Relief Fund
VIII‐3
Valuation
Plan Premium Tax Actuarial
Year End Pay Assets Benefit Employer Member Allocation Investment Assets Accrued Unfunded Funded
30‐Jun Active Status (boy) Payments Expenses Contribs. Contribs.a
Contribs. Income (eoy) Liability Liability Ratio
2017 20 26 $2,444,156 $617,725 $750 $241,363 $94,205 $207,958 $207,323 $2,576,530 $19,919,903 $17,343,373 13%2018 19 26 2,576,530 984,623 4,134 257,392 96,110 219,396 94,826 2,255,497 20,280,079 18,024,582 11%
2019 17 27 2,255,497 762,678 4,177 553,226 85,664 227,823 92,197 2,447,552 20,867,473 18,419,922 12%
2020 16 28 2,447,552 798,545 4,225 584,814 83,454 237,787 99,948 2,650,785 21,426,056 18,775,271 12%
2021 15 28 2,650,785 819,276 4,274 602,162 82,907 244,055 108,122 2,864,481 21,980,939 19,116,459 13%
2022 14 28 2,864,481 840,376 4,327 619,843 82,618 250,037 116,714 3,088,990 22,533,156 19,444,166 14%
2023 14 28 3,088,990 855,586 4,382 630,857 83,065 256,276 125,743 3,324,963 23,093,712 19,768,749 14%
2024 13 28 3,324,963 875,171 4,438 646,801 83,305 261,903 135,224 3,572,586 23,657,920 20,085,334 15%
2025 12 29 3,572,586 908,564 4,493 677,276 81,875 268,630 145,175 3,832,485 24,201,246 20,368,761 16%
2026 12 29 3,832,485 935,635 4,548 700,604 81,001 275,931 155,623 4,105,460 24,733,473 20,628,013 17%
2027 11 29 4,105,460 961,929 4,602 723,662 80,136 282,399 166,588 4,391,715 25,255,576 20,863,861 17%
2028 9 30 4,391,715 1,010,905 4,658 771,416 75,997 290,068 178,083 4,691,717 25,722,661 21,030,945 18%
2029 8 30 4,691,717 1,069,011 4,719 827,985 70,309 300,354 190,143 5,006,778 26,111,364 21,104,586 19%
2030 7 30 5,006,778 1,105,399 4,780 861,581 66,703 309,838 202,805 5,337,526 26,453,924 21,116,397 20%
2031 6 31 5,337,526 1,161,588 4,842 917,364 61,097 318,193 216,080 5,683,831 26,716,830 21,032,999 21%
2032 5 32 5,683,831 1,236,729 4,904 993,203 51,971 329,543 229,989 6,046,904 26,854,458 20,807,554 23%
2033 4 32 6,046,904 1,294,269 4,965 1,049,602 44,669 341,379 244,578 6,427,899 26,890,241 20,462,343 24%
2034 4 32 6,427,899 1,332,107 5,025 1,085,214 39,875 351,561 259,879 6,827,296 26,856,725 20,029,430 25%
2035 3 32 6,827,296 1,368,112 5,081 1,119,122 34,943 361,715 275,916 7,245,798 26,752,198 19,506,400 27%
2036 2 32 7,245,798 1,399,996 5,136 1,147,969 30,600 372,583 292,724 7,684,542 26,582,078 18,897,536 29%
2037 2 32 7,684,542 1,424,517 5,188 1,169,896 26,600 382,266 310,334 8,143,934 26,353,072 18,209,138 31%
2038 2 32 8,143,934 1,448,849 5,238 1,190,840 22,513 393,344 328,780 8,625,324 26,062,232 17,436,907 33%
2039 1 31 8,625,324 1,459,491 5,284 1,196,888 20,309 403,804 348,107 9,129,657 25,733,691 16,604,034 35%
2040 1 31 9,129,657 1,461,771 5,326 1,193,673 19,147 414,294 368,355 9,658,030 25,381,486 15,723,457 38%
2041 1 30 9,658,030 1,471,139 5,365 1,198,117 17,100 425,062 389,564 10,211,368 24,992,436 14,781,067 41%
2042 1 30 10,211,368 1,493,582 5,399 1,216,104 13,528 437,135 411,777 10,790,931 24,544,064 13,753,134 44%
2043 1 29 10,790,931 1,507,741 5,429 1,225,001 10,622 449,595 435,044 11,398,023 24,047,070 12,649,047 47%
2044 0 29 11,398,023 1,517,204 5,455 1,229,226 8,010 461,614 459,410 12,033,624 23,505,976 11,472,352 51%
2045 0 28 12,033,624 1,525,072 5,477 1,231,363 5,358 474,472 484,922 12,699,191 22,920,535 10,221,344 55%
2046 0 28 12,699,191 1,520,677 5,493 1,220,403 3,809 487,168 511,636 13,396,037 22,307,518 8,911,481 60%
2047 0 27 13,396,037 1,511,543 5,505 1,204,289 2,682 499,956 539,602 14,125,519 21,673,009 7,547,491 65%
2048 0 26 14,125,519 1,498,708 5,511 1,183,952 1,838 513,188 568,878 14,889,156 21,021,508 6,132,351 71%
2049 0 26 14,889,156 1,482,212 5,512 1,159,340 1,287 527,006 599,525 15,688,590 20,357,776 4,669,186 77%
2050 0 25 15,688,590 1,463,120 5,508 1,131,594 888 541,474 631,610 16,525,529 19,684,804 3,159,276 84%
2051 0 24 16,525,529 1,442,156 5,498 1,101,713 550 556,276 665,197 17,401,610 19,004,433 1,602,823 92%
2052 0 23 17,401,610 1,419,363 5,482 1,069,523 276 571,680 700,355 18,318,599 18,318,599 0 100%
2053 0 23 18,318,599 1,394,266 5,460 6,048 138 0 705,146 17,630,205 17,630,207 0 100%
2054 0 22 17,630,205 1,367,557 5,431 5,670 56 0 678,131 16,941,075 16,941,075 0 100%
2055 0 21 16,941,075 1,339,514 5,397 5,397 0 0 651,115 16,252,676 16,252,677 0 100%
2056 0 21 16,252,676 1,310,019 5,357 5,357 0 0 624,164 15,566,821 15,566,821 0 100%
2057 0 20 15,566,821 1,279,596 5,311 5,311 0 0 597,332 14,884,557 14,884,557 0 100%a Member contributions include additional amounts for DROP members of $9,269 for plan year end June 30, 2018.
Total AssetsNumber

Actuarial Projections – Conservation Funding in 2019 Table A‐4
City of St. Albans Firemen’s Pension and Relief Fund
VIII‐4
Plan Net Benefit 8.00%ᵈ of Pay 62.11% of Transfer (To)/From Net Benefit 1.50% of Pay 37.89% of Statewide
Year End Assets Pmts and Employer Member Premium Tax Investment Accumulation Assets Pmts and Employer Member Premium Tax Investment Employer
30‐Jun (boy) Expenses Contribs. Contribs. Allocation Income Account (boy)c
Expenses Contribs. Contribs. Allocation Income Contribution
2018 $2,576,530 $988,757 $257,392 $96,110 $219,396 $94,826 $0 $0 $0 $0 $0 $0 $0 $02019 2,255,497 766,855 553,226 72,138 141,491 90,220 (2,345,717) 2,345,717 0 0 13,526 86,332 1,978 3,411
2020 0 802,770 584,814 70,277 147,679 0 0 2,447,553 0 0 13,177 90,108 99,948 9,556
2021 0 823,550 602,162 69,816 151,572 0 0 2,650,786 0 0 13,091 92,483 108,122 14,704
2022 0 844,703 619,843 69,573 155,287 0 0 2,864,482 0 0 13,045 94,750 116,714 19,465
2023 0 859,968 630,857 69,949 159,162 0 0 3,088,991 0 0 13,116 97,114 125,743 24,573
2024 0 879,609 646,801 70,152 162,656 0 0 3,324,964 0 0 13,153 99,246 135,225 28,733
2025 0 913,057 677,276 68,947 166,834 0 0 3,572,589 0 0 12,928 101,796 145,175 34,363
2026 0 940,183 700,604 68,211 171,368 0 0 3,832,487 0 0 12,790 104,562 155,624 41,036
2027 0 966,531 723,662 67,483 175,386 0 0 4,105,464 0 0 12,653 107,013 166,588 46,706
2028 0 1,015,563 771,416 63,998 180,149 0 0 4,391,718 0 0 11,999 109,920 178,083 53,701
2029 0 1,073,730 827,985 59,208 186,537 0 0 4,691,720 0 0 11,101 113,817 190,143 64,012
2030 0 1,110,179 861,581 56,171 192,427 0 0 5,006,781 0 0 10,532 117,411 202,805 74,048
2031 0 1,166,430 917,364 51,450 197,616 0 0 5,337,529 0 0 9,647 120,577 216,080 82,589
2032 0 1,241,633 993,203 43,765 204,665 0 0 5,683,834 0 0 8,206 124,878 229,989 95,005
2033 0 1,299,234 1,049,602 37,616 212,016 0 0 6,046,907 0 0 7,053 129,364 244,578 108,180
2034 0 1,337,132 1,085,214 33,579 218,339 0 0 6,427,902 0 0 6,296 133,222 259,879 119,721
2035 0 1,373,193 1,119,122 29,426 224,645 0 0 6,827,299 0 0 5,517 137,070 275,916 130,666
2036 0 1,405,132 1,147,969 25,768 231,395 0 0 7,245,801 0 0 4,832 141,188 292,724 142,649
2037 0 1,429,705 1,169,896 22,400 237,409 0 0 7,684,545 0 0 4,200 144,858 310,334 153,547
2038 0 1,454,087 1,190,840 18,958 244,289 0 0 8,143,937 0 0 3,555 149,055 328,780 165,634
2039 0 1,464,775 1,196,888 17,102 250,785 0 0 8,625,327 0 0 3,207 153,019 348,107 176,578
2040 0 1,467,097 1,193,673 16,124 257,300 0 0 9,129,661 0 0 3,023 156,994 368,355 186,708
2041 0 1,476,504 1,198,117 14,400 263,987 0 0 9,658,033 0 0 2,700 161,075 389,565 196,785
2042 0 1,498,981 1,216,104 11,392 271,485 0 0 10,211,372 0 0 2,136 165,650 411,778 208,195
2043 0 1,513,170 1,225,001 8,945 279,224 0 0 10,790,936 0 0 1,677 170,372 435,045 220,228
2044 0 1,522,659 1,229,226 6,745 286,688 0 0 11,398,029 0 0 1,265 174,926 459,410 231,500
2045 0 1,530,549 1,231,363 4,512 294,674 0 0 12,033,630 0 0 846 179,799 484,923 243,679
2046 0 1,526,170 1,220,403 3,208 302,559 0 0 12,699,198 0 0 601 184,610 511,636 255,375
2047 0 1,517,048 1,204,289 2,258 310,501 0 0 13,396,044 0 0 424 189,455 539,602 266,888
2048 0 1,504,219 1,183,952 1,548 318,719 0 0 14,125,526 0 0 290 194,470 568,878 278,118
2049 0 1,487,724 1,159,340 1,084 327,300 0 0 14,889,164 0 0 203 199,706 599,526 289,146
2050 0 1,468,628 1,131,594 748 336,286 0 0 15,688,598 0 0 140 205,188 631,610 300,468
2051 0 1,447,654 1,101,713 463 345,478 0 0 16,525,537 0 0 87 210,798 665,198 311,937
2052 0 1,424,800 1,069,523 232 355,045 0 0 17,401,619 45 0 44 216,635 700,355 323,382
2053 0 0 0 0 0 0 0 18,318,608 1,399,726 6,048 138 0 705,147 335,116
2054 0 0 0 0 0 0 0 17,630,215 1,372,988 5,670 56 0 678,132 347,215
2055 0 0 0 0 0 0 0 16,941,085 1,344,911 5,397 0 0 651,116 359,774
2056 0 0 0 0 0 0 0 16,252,687 1,315,376 5,357 0 0 624,164 372,734
2057 0 0 0 0 0 0 0 15,566,832 1,284,907 5,311 0 0 597,332 386,159a Employer contributions paid from the City’s General Fund are used to finance benefits not covered by the applicable employee contributions or premium tax allocation.
b Assets accumulate in the Pension and Relief Fund.
ᶜ Includes transfer from Benefit Payment Account to Accumulation Account in Plan Year End June 30, 2042.
ᵈ Blended employee contribution rate of 9.50% of pay less 1.50% of pay going into the Accumulation Account.
Benefit Payment Account a Accumulation Account b

Actuarial Projections – Optional Funding in (N/A) Table A‐5
City of St. Albans Firemen’s Pension and Relief Fund
VIII‐5
Valuation
Plan Premium Tax Actuarial
Year End Pay Assets Benefit Employer Member Allocation Investment Assets Accrued Unfunded Funded
30‐Jun Active Status (boy) Payments Expenses Contribs. Contribs. Contribs. Income (eoy) Liability Liability Ratio
2017 20 26 $2,444,156 $617,725 $750 $241,363 $94,205 $207,958 $207,323 $2,576,530 $19,919,903 $17,343,373 13%
2018 20 26 2,576,530 984,623 4,134 257,392 96,110 219,396 94,826 2,255,497 20,280,080 18,024,583 11%
2019 20 27 2,255,497 762,678 4,271 275,409 88,967 227,823 86,759 2,167,506 20,886,351 18,718,845 10%
2020 20 28 2,167,506 798,678 4,476 294,688 92,508 237,787 83,172 2,072,507 21,498,401 19,425,894 10%
2021 20 28 2,072,507 819,883 4,638 315,316 96,566 244,055 79,562 1,983,485 22,136,998 20,153,513 9%
2022 20 28 1,983,485 841,755 4,791 337,388 100,561 250,037 76,200 1,901,124 22,802,122 20,900,998 8%
2023 20 28 1,901,124 857,923 4,950 361,005 105,675 256,276 73,274 1,834,481 23,507,760 21,673,279 8%
2024 20 28 1,834,481 878,618 5,081 386,275 109,673 261,903 70,887 1,779,519 24,245,202 22,465,683 7%
2025 20 29 1,779,519 913,220 5,249 413,314 113,497 268,630 68,744 1,725,235 24,999,131 23,273,896 7%
2026 20 29 1,725,235 941,635 5,434 442,246 118,821 275,931 66,829 1,681,993 25,786,461 24,104,468 7%
2027 20 29 1,681,993 969,505 5,584 473,203 123,115 282,399 65,371 1,650,992 26,604,239 24,953,247 6%
2028 20 30 1,650,992 1,020,258 5,767 506,327 125,467 290,068 63,977 1,610,806 27,416,404 25,805,598 6%
2029 20 30 1,610,806 1,080,372 6,031 541,770 129,422 300,354 62,158 1,558,107 28,219,713 26,661,606 6%
2030 20 31 1,558,107 1,119,157 6,269 579,694 135,012 309,838 60,326 1,517,551 29,047,357 27,529,806 5%
2031 20 31 1,517,551 1,178,172 6,465 620,273 137,173 318,193 58,543 1,467,096 29,860,182 28,393,086 5%
2032 20 32 1,467,096 1,256,405 6,751 663,692 139,682 329,543 56,105 1,392,962 30,636,464 29,243,502 5%
2033 20 32 1,392,962 1,317,382 7,037 710,150 144,562 341,379 53,177 1,317,811 31,407,009 30,089,198 4%
2034 20 32 1,317,811 1,359,186 7,269 759,861 150,327 351,561 50,639 1,263,744 32,198,914 30,935,170 4%
2035 20 33 1,263,744 1,399,507 7,478 813,051 155,490 361,715 49,030 1,236,045 33,010,512 31,774,467 4%
2036 20 32 1,236,045 1,436,040 7,706 869,965 162,325 372,583 48,672 1,245,844 33,856,201 32,610,357 4%
2037 20 32 1,245,844 1,465,673 7,895 930,863 168,199 382,266 49,987 1,303,592 34,740,403 33,436,811 4%
2038 20 32 1,303,592 1,495,444 8,110 996,023 174,703 393,344 53,343 1,417,450 35,669,785 34,252,335 4%
2039 20 32 1,417,450 1,512,329 8,306 1,065,745 181,789 403,804 59,286 1,607,440 36,661,602 35,054,162 4%
2040 20 32 1,607,440 1,525,088 8,496 1,140,347 189,450 414,294 68,466 1,886,413 37,722,721 35,836,308 5%
2041 20 32 1,886,413 1,550,881 8,693 1,220,171 196,275 425,062 81,040 2,249,386 38,838,586 36,589,200 6%
2042 20 32 2,249,386 1,594,101 8,924 1,305,583 202,883 437,135 96,760 2,688,721 39,993,372 37,304,651 7%
2043 20 32 2,688,721 1,633,134 9,168 1,396,974 210,687 449,595 115,767 3,219,443 41,200,433 37,980,990 8%
2044 20 32 3,219,443 1,672,010 9,394 1,494,762 217,838 461,614 138,537 3,850,790 42,459,897 38,609,107 9%
2045 20 31 3,850,790 1,713,388 9,647 1,599,395 225,887 474,472 165,453 4,592,963 43,774,814 39,181,851 10%
2046 20 31 4,592,963 1,747,859 9,892 1,711,353 234,537 487,168 197,092 5,465,362 45,157,294 39,691,932 12%
2047 20 31 5,465,362 1,783,367 10,138 1,831,148 243,065 499,956 234,074 6,480,100 46,610,927 40,130,827 14%
2048 20 31 6,480,100 1,820,516 10,392 1,959,328 251,437 513,188 276,890 7,650,036 48,134,556 40,484,520 16%
2049 20 31 7,650,036 1,861,706 10,660 2,096,481 260,334 527,006 326,033 8,987,524 49,725,569 40,738,045 18%
2050 20 31 8,987,524 1,909,747 10,941 2,243,235 269,799 541,474 381,955 10,503,299 51,385,167 40,881,868 20%
2051 20 31 10,503,299 1,962,373 11,229 2,400,261 279,063 556,276 445,125 12,210,422 53,114,790 40,904,368 23%
2052 20 31 12,210,422 2,017,311 11,529 2,568,279 288,431 571,680 516,133 14,126,105 54,911,501 40,785,396 26%
2053 20 31 14,126,105 2,077,293 11,845 2,748,059 298,551 587,869 595,648 16,267,094 56,774,665 40,507,571 29%
2054 20 31 16,267,094 2,143,367 12,170 2,940,423 309,170 604,544 684,323 18,650,017 58,705,390 40,055,373 32%
2055 20 31 18,650,017 2,213,628 12,503 3,146,253 320,274 621,771 782,878 21,295,062 60,706,220 39,411,158 35%
2056 20 31 21,295,062 2,286,812 12,843 3,366,491 331,774 639,445 892,164 24,225,281 62,779,522 38,554,241 39%
2057 20 31 24,225,281 2,363,729 13,192 3,602,145 343,732 657,645 1,013,106 27,464,989 64,927,492 37,462,503 42%a Member contributions include additional amounts for DROP members of $9,269 for plan year end June 30, 2018.
Total AssetsNumber

Actuarial Projections – Optional Funding in (N/A) Table A‐6
City of St. Albans Firemen’s Pension and Relief Fund
VIII‐6
Valuation Plan Premium Tax Optional Alternative Minimum Statewide
Year End Total Employee Gross Net Employer Amortization Allocation Net Employer Employer Employer Employer Employer30‐Jun
a,bPayroll Contributions Normal Cost Normal Cost of UAAL Contributions Amortization Expenses Contribution Contribution Contribution Contribution
2018 $914,121 $86,841 $551,675 $464,834 $944,183 $227,823 $716,360 $4,134 $1,185,328 $275,409 $275,409 $0
2019 934,207 88,967 561,756 472,789 996,737 237,787 758,950 4,271 1,236,010 294,688 294,688 0
2020 969,470 92,508 580,097 487,589 1,052,381 244,055 808,326 4,476 1,300,391 315,316 315,316 0
2021 1,012,737 96,566 603,697 507,131 1,111,397 250,037 861,360 4,638 1,373,130 337,388 337,388 0
2022 1,055,049 100,561 626,575 526,015 1,174,573 256,276 918,297 4,791 1,449,103 361,005 361,005 0
2023 1,108,402 105,675 656,571 550,896 1,242,282 261,903 980,379 4,950 1,536,225 386,275 386,275 0
2024 1,150,552 109,673 680,922 571,249 1,315,296 268,630 1,046,666 5,081 1,622,996 413,314 413,314 0
2025 1,189,108 113,497 702,917 589,420 1,393,897 275,931 1,117,966 5,249 1,712,635 442,246 442,246 0
2026 1,243,461 118,821 734,672 615,850 1,478,453 282,399 1,196,054 5,434 1,817,338 473,203 473,203 0
2027 1,288,352 123,115 761,784 638,669 1,570,125 290,068 1,280,057 5,584 1,924,310 506,327 506,327 0
2028 1,311,402 125,467 775,107 649,641 1,669,536 300,354 1,369,182 5,767 2,024,590 541,770 541,770 0
2029 1,349,732 129,422 795,095 665,673 1,776,724 309,838 1,466,886 6,031 2,138,590 579,694 579,694 0
2030 1,407,354 135,012 826,701 691,688 1,892,851 318,193 1,574,658 6,269 2,272,615 620,273 620,273 0
2031 1,429,691 137,173 839,000 701,827 2,019,938 329,543 1,690,395 6,465 2,398,687 663,692 663,692 0
2032 1,451,869 139,682 849,825 710,143 2,158,449 341,379 1,817,070 6,751 2,533,963 710,150 710,150 0
2033 1,500,478 144,562 875,282 730,720 2,309,774 351,561 1,958,213 7,037 2,695,971 759,861 759,861 0
2034 1,559,943 150,327 908,129 757,802 2,477,009 361,715 2,115,294 7,269 2,880,365 813,051 813,051 0
2035 1,612,260 155,490 937,055 781,564 2,663,728 372,583 2,291,145 7,478 3,080,188 869,965 869,965 0
2036 1,680,673 162,325 975,633 813,308 2,873,380 382,266 2,491,114 7,706 3,312,128 930,863 930,863 0
2037 1,742,348 168,199 1,010,195 841,996 3,111,454 393,344 2,718,110 7,895 3,568,001 996,023 996,023 0
2038 1,814,445 174,703 1,050,389 875,686 3,384,234 403,804 2,980,430 8,110 3,864,226 1,065,745 1,065,745 0
2039 1,895,478 181,789 1,096,284 914,494 3,700,725 414,294 3,286,431 8,306 4,209,231 1,140,347 1,140,347 0
2040 1,979,721 189,450 1,144,036 954,586 4,073,227 425,062 3,648,165 8,496 4,611,248 1,220,171 1,220,171 0
2041 2,054,139 196,275 1,186,241 989,967 4,518,836 437,135 4,081,701 8,693 5,080,362 1,305,583 1,305,583 0
2042 2,125,203 202,883 1,227,958 1,025,075 5,062,258 449,595 4,612,663 8,924 5,646,662 1,396,974 1,396,974 0
2043 2,209,215 210,687 1,277,505 1,066,817 5,741,693 461,614 5,280,079 9,168 6,356,064 1,494,762 1,494,762 0
2044 2,289,082 217,838 1,324,520 1,106,682 6,620,087 474,472 6,145,615 9,394 7,261,691 1,599,395 1,599,395 0
2045 2,377,149 225,887 1,376,204 1,150,317 7,804,676 487,168 7,317,508 9,647 8,477,472 1,711,353 1,711,353 0
2046 2,472,241 234,537 1,431,153 1,196,617 9,498,647 499,956 8,998,691 9,892 10,205,200 1,831,148 1,831,148 0
2047 2,570,022 243,065 1,487,544 1,244,480 12,137,504 513,188 11,624,316 10,138 12,878,933 1,959,328 1,959,328 0
2048 2,668,092 251,437 1,544,007 1,292,569 16,853,251 527,006 16,326,245 10,392 17,629,206 2,096,481 2,096,481 0
2049 2,767,322 260,334 1,600,967 1,340,633 27,793,162 541,474 27,251,688 10,660 28,602,981 2,243,235 2,243,235 0
2050 2,870,946 269,799 1,660,312 1,390,513 41,544,804 556,276 40,988,528 10,941 42,389,982 2,400,261 2,400,261 0
2051 2,976,610 279,063 1,720,644 1,441,581 41,691,474 571,680 41,119,794 11,229 42,561,650 2,568,279 2,568,279 0
2052 3,082,726 288,431 1,780,875 1,492,445 41,714,420 587,869 41,126,551 11,529 42,469,001 2,748,059 2,748,059 0
2053 3,193,034 298,551 1,843,252 1,544,701 41,593,092 604,544 40,988,548 11,845 42,217,948 2,940,423 2,940,423 0
2054 3,307,400 309,170 1,908,020 1,598,850 41,309,765 621,771 40,687,994 12,170 41,792,073 3,146,253 3,146,253 0
2055 3,426,415 320,274 1,975,666 1,655,391 40,848,612 639,445 40,209,167 12,503 41,172,035 3,366,491 3,366,491 0
2056 3,549,844 331,774 2,046,100 1,714,326 40,191,640 657,645 39,533,995 12,843 40,337,152 3,602,145 3,602,145 0
2057 3,677,709 343,732 2,119,493 1,775,760 39,317,752 676,440 38,641,312 13,192 39,264,568 3,854,295 3,854,295 0
a Assumes sponsor selects Optional funding policy if contributions are lower.
b Assumes employer makes contributions for the applicable valuation plan year in the following fiscal year.
c Amount required to remain at 100% funded.
Employer Contributions Minimum Payment

Actuarial Projections – Conservation Funding in 2042 Table A‐7
City of St. Albans Firemen’s Pension and Relief Fund
VIII‐7
Valuation
Plan Premium Tax Actuarial Year End Pay Assets Benefit Employer Member Allocation Investment Assets Accrued Unfunded Funded
30‐Jun Active Status (boy) Payments Expenses Contribs. Contribs.a Contribs. Income (eoy) Liability Liability Ratio
2017 20 26 $2,444,156 $617,725 $750 $241,363 $94,205 $207,958 $207,323 $2,576,530 $19,919,903 $17,343,373 13%2018 20 26 2,576,530 984,623 4,134 257,392 96,110 219,396 94,826 2,255,497 20,280,080 18,024,583 11%
2019 20 27 2,255,497 762,678 4,271 275,409 88,967 227,823 86,759 2,167,506 20,886,351 18,718,845 10%2020 20 28 2,167,506 798,678 4,476 294,688 92,508 237,787 83,172 2,072,507 21,498,401 19,425,894 10%
2021 20 28 2,072,507 819,883 4,638 315,316 96,566 244,055 79,562 1,983,485 22,136,998 20,153,513 9%2022 20 28 1,983,485 841,755 4,791 337,388 100,561 250,037 76,199 1,901,124 22,802,122 20,900,998 8%
2023 20 28 1,901,124 857,923 4,950 361,005 105,675 256,276 73,274 1,834,481 23,507,760 21,673,279 8%2024 20 28 1,834,481 878,618 5,081 386,275 109,673 261,903 70,887 1,779,520 24,245,202 22,465,682 7%2025 20 29 1,779,520 913,220 5,249 413,314 113,497 268,630 68,744 1,725,236 24,999,131 23,273,895 7%
2026 20 29 1,725,236 941,635 5,434 442,246 118,821 275,931 66,830 1,681,995 25,786,461 24,104,466 7%2027 20 29 1,681,995 969,505 5,584 473,203 123,115 282,399 65,371 1,650,994 26,604,239 24,953,245 6%
2028 20 30 1,650,994 1,020,258 5,767 506,327 125,467 290,068 63,977 1,610,808 27,416,404 25,805,596 6%2029 20 30 1,610,808 1,080,372 6,031 541,770 129,422 300,354 62,158 1,558,109 28,219,713 26,661,604 6%
2030 20 31 1,558,109 1,119,157 6,269 579,694 135,012 309,838 60,326 1,517,553 29,047,357 27,529,804 5%2031 20 31 1,517,553 1,178,172 6,465 620,273 137,173 318,193 58,544 1,467,099 29,860,182 28,393,083 5%2032 20 32 1,467,099 1,256,405 6,751 663,692 139,682 329,543 56,105 1,392,965 30,636,464 29,243,499 5%
2033 20 32 1,392,965 1,317,382 7,037 710,150 144,562 341,379 53,177 1,317,814 31,407,009 30,089,195 4%2034 20 32 1,317,814 1,359,186 7,269 759,861 150,327 351,561 50,639 1,263,747 32,198,914 30,935,167 4%
2035 20 33 1,263,747 1,399,507 7,478 813,051 155,490 361,715 49,030 1,236,048 33,010,512 31,774,464 4%2036 20 32 1,236,048 1,436,040 7,706 869,965 162,325 372,583 48,672 1,245,847 33,856,201 32,610,354 4%
2037 20 32 1,245,847 1,465,673 7,895 930,863 168,199 382,266 49,988 1,303,595 34,740,403 33,436,808 4%2038 20 32 1,303,595 1,495,444 8,110 996,023 174,703 393,344 53,342 1,417,453 35,669,785 34,252,332 4%2039 20 32 1,417,453 1,512,329 8,306 1,065,745 181,789 403,804 59,287 1,607,443 36,661,602 35,054,159 4%
2040 20 32 1,607,443 1,525,088 8,496 1,140,347 189,450 414,294 68,467 1,886,417 37,722,721 35,836,304 5%2041 19 32 1,886,417 1,550,881 8,693 1,220,171 196,275 425,062 81,040 2,249,391 38,838,582 36,589,191 6%
2042 17 32 2,249,391 1,594,101 8,699 1,280,873 193,043 437,135 96,080 2,653,722 39,937,146 37,283,424 7%2043 16 32 2,653,722 1,632,738 8,716 1,317,467 190,157 449,595 112,402 3,081,890 41,021,731 37,939,841 8%
2044 15 32 3,081,890 1,670,462 8,741 1,353,432 187,151 461,614 129,672 3,534,556 42,092,366 38,557,810 8%2045 14 31 3,534,556 1,710,156 8,773 1,391,454 183,688 474,472 147,931 4,013,172 43,142,247 39,129,075 9%2046 14 31 4,013,172 1,742,407 8,811 1,421,559 180,873 487,168 167,228 4,518,782 44,180,824 39,662,042 10%
2047 13 31 4,518,782 1,775,287 8,852 1,452,733 177,582 499,956 187,606 5,052,520 45,206,957 40,154,437 11%2048 12 31 5,052,520 1,809,416 8,896 1,485,771 173,419 513,188 209,113 5,615,699 46,212,475 40,596,776 12%
2049 11 31 5,615,699 1,847,175 8,943 1,522,605 168,744 527,006 231,802 6,209,738 47,185,426 40,975,688 13%2050 10 31 6,209,738 1,891,372 8,992 1,566,057 163,551 541,474 255,731 6,836,188 48,116,818 41,280,630 14%
2051 9 31 6,836,188 1,939,598 9,042 1,614,312 157,367 556,276 280,959 7,496,462 48,999,152 41,502,690 15%2052 9 31 7,496,462 1,989,563 9,093 1,664,909 150,206 571,680 307,545 8,192,146 49,818,829 41,626,683 16%2053 8 31 8,192,146 2,043,959 9,146 1,720,121 142,434 587,869 335,554 8,925,019 50,562,512 41,637,493 18%
2054 7 31 8,925,019 2,103,784 9,198 1,781,083 134,054 604,544 365,055 9,696,773 51,219,354 41,522,581 19%2055 6 31 9,696,773 2,167,197 9,251 1,845,969 125,037 621,771 396,116 10,509,218 51,779,601 41,270,383 20%2056 5 31 10,509,218 2,232,810 9,303 1,913,474 115,341 639,445 428,808 11,364,173 52,233,229 40,869,056 22%2057 5 31 11,364,173 2,301,386 9,355 1,984,393 104,886 657,645 463,205 12,263,561 52,568,589 40,305,028 23%
a Member contributions include additional amounts for DROP members of $9,269 for plan year end June 30, 2018.
Total AssetsNumber

Actuarial Projections – Conservation Funding in 2042 Table A‐8
City of St. Albans Firemen’s Pension and Relief Fund
VIII‐8
Plan Net Benefit 8.00%ᵈ of Pay 36.44% of Net Benefit 1.50% of Pay 63.56% of Conservation Alternative Minimum StatewideYear End Assets Pmts and Employer Member Premium Tax Investment Assets Pmts and Employer Member Premium Tax Investment Employer Employer Alt /Cons Employer
30‐Jun (boy) Expenses Contribs. Contribs. Allocation Income (boy)c Expenses Contribs. Contribs. Allocation Income Cont. Cont. Cont. Contribution
2018 $2,576,530 $988,757 $257,392 $96,110 $219,396 $94,826 $0 $0 $0 $0 $0 $0 NA $257,392 $257,392 $02019 2,255,497 766,949 275,409 88,967 227,823 86,759 0 0 0 0 0 0 NA 275,409 275,409 0
2020 2,167,506 803,154 294,688 92,508 237,787 83,172 0 0 0 0 0 0 NA 294,688 294,688 0
2021 2,072,506 824,521 315,316 96,566 244,055 79,562 0 0 0 0 0 0 NA 315,316 315,316 02022 1,983,484 846,546 337,388 100,561 250,037 76,199 0 0 0 0 0 0 NA 337,388 337,388 0
2023 1,901,123 862,873 361,005 105,675 256,276 73,274 0 0 0 0 0 0 NA 361,005 361,005 0
2024 1,834,480 883,699 386,275 109,673 261,903 70,887 0 0 0 0 0 0 NA 386,275 386,275 02025 1,779,518 918,469 413,314 113,497 268,630 68,744 0 0 0 0 0 0 NA 413,314 413,314 0
2026 1,725,234 947,069 442,246 118,821 275,931 66,830 0 0 0 0 0 0 NA 442,246 442,246 0
2027 1,681,993 975,089 473,203 123,115 282,399 65,371 0 0 0 0 0 0 NA 473,203 473,203 02028 1,650,992 1,026,025 506,327 125,467 290,068 63,977 0 0 0 0 0 0 NA 506,327 506,327 0
2029 1,610,806 1,086,403 541,770 129,422 300,354 62,158 0 0 0 0 0 0 NA 541,770 541,770 0
2030 1,558,107 1,125,426 579,694 135,012 309,838 60,326 0 0 0 0 0 0 NA 579,694 579,694 02031 1,517,551 1,184,637 620,273 137,173 318,193 58,544 0 0 0 0 0 0 NA 620,273 620,273 0
2032 1,467,097 1,263,156 663,692 139,682 329,543 56,105 0 0 0 0 0 0 NA 663,692 663,692 0
2033 1,392,963 1,324,419 710,150 144,562 341,379 53,177 0 0 0 0 0 0 NA 710,150 710,150 02034 1,317,813 1,366,455 759,861 150,327 351,561 50,639 0 0 0 0 0 0 NA 759,861 759,861 0
2035 1,263,745 1,406,985 813,051 155,490 361,715 49,030 0 0 0 0 0 0 NA 813,051 813,051 0
2036 1,236,046 1,443,746 869,965 162,325 372,583 48,672 0 0 0 0 0 0 NA 869,965 869,965 02037 1,245,845 1,473,568 930,863 168,199 382,266 49,988 0 0 0 0 0 0 NA 930,863 930,863 0
2038 1,303,593 1,503,554 996,023 174,703 393,344 53,342 0 0 0 0 0 0 NA 996,023 996,023 0
2039 1,417,451 1,520,635 1,065,745 181,789 403,804 59,287 0 0 0 0 0 0 NA 1,065,745 1,065,745 02040 1,607,441 1,533,584 1,140,347 189,450 414,294 68,467 0 0 0 0 0 0 NA 1,140,347 1,140,347 0
2041 1,886,415 1,559,574 1,220,171 196,275 425,062 81,040 0 0 0 0 0 0 NA 1,220,171 1,220,171 0
2042 2,249,389 1,602,800 1,280,878 162,616 159,306 89,976 2,339,367 0 0 30,427 277,828 6,105 1,280,878 1,305,583 1,280,878 10,1592043 0 1,641,454 1,317,472 160,135 163,847 0 2,653,727 0 0 30,022 285,748 112,403 1,317,472 1,396,974 1,317,472 21,816
2044 0 1,679,203 1,353,437 157,539 168,227 0 3,081,900 0 0 29,612 293,387 129,673 1,353,437 1,494,762 1,353,437 33,067
2045 0 1,718,929 1,391,459 154,557 172,913 0 3,534,572 0 0 29,131 301,559 147,932 1,391,459 1,599,395 1,391,459 45,6812046 0 1,751,218 1,421,564 152,114 177,540 0 4,013,194 0 0 28,759 309,628 167,229 1,421,564 1,711,353 1,421,564 58,274
2047 0 1,784,139 1,452,738 149,201 182,200 0 4,518,810 0 0 28,381 317,756 187,607 1,452,738 1,831,148 1,452,738 71,185
2048 0 1,818,312 1,485,776 145,513 187,023 0 5,052,553 0 0 27,906 326,166 209,114 1,485,776 1,959,328 1,485,776 84,8082049 0 1,856,118 1,522,611 141,449 192,058 0 5,615,739 0 0 27,295 334,948 231,803 1,522,611 2,096,481 1,522,611 99,504
2050 0 1,900,364 1,566,063 136,970 197,331 0 6,209,785 0 0 26,581 344,143 255,733 1,566,063 2,243,235 1,566,063 115,384
2051 0 1,948,640 1,614,318 131,597 202,725 0 6,836,242 0 0 25,770 353,551 280,962 1,614,318 2,400,261 1,614,318 132,1512052 0 1,998,656 1,664,915 125,402 208,339 0 7,496,525 0 0 24,804 363,341 307,548 1,664,915 2,568,279 1,664,915 150,057
2053 0 2,053,105 1,720,127 118,739 214,239 0 8,192,217 0 0 23,695 373,630 335,557 1,720,127 2,748,059 1,720,127 169,403
2054 0 2,112,982 1,781,089 111,577 220,316 0 8,925,099 0 0 22,477 384,228 365,058 1,781,089 2,940,423 1,781,089 189,9412055 0 2,176,448 1,845,975 103,879 226,594 0 9,696,862 0 0 21,158 395,177 396,120 1,845,975 3,146,253 1,845,975 211,670
2056 0 2,242,113 1,913,480 95,598 233,035 0 10,509,317 0 0 19,743 406,410 428,812 1,913,480 3,366,491 1,913,480 234,5342057 0 2,310,741 1,984,399 86,674 239,668 0 11,364,282 0 0 18,212 417,977 463,210 1,984,399 3,602,145 1,984,399 258,678
a Employer contributions paid from the City’s General Fund are used to finance benefits not covered by the applicable employee contributions or premium tax allocation.
b Assets accumulate in the Pension and Relief Fund.
ᶜ Includes transfer from Benefit Payment Account to Accumulation Account in Plan Year End June 30, 2042.
ᵈ Blended employee contribution rate of 9.50% of pay less 1.50% of pay going into the Accumulation Account.
Minimum PaymentBenefit Payment Account a Accumulation Account b