City of Medicine Hat - 2016 Financial Report
117
City of Medicine Hat 2016 Financial Report December 31, 2016 Medicine Hat, Alberta, Canada
-
Upload
khangminh22 -
Category
Documents
-
view
1 -
download
0
Transcript of City of Medicine Hat - 2016 Financial Report
City of Medicine Hat
2016 Financial ReportDecember 31, 2016 Medicine Hat, Alberta, Canada
City of Medicine Hat, Alberta, Canada
2016 FINANCIAL REPORT
For the year ended December 31, 2016
This Financial Report has been prepared and compiled by the City of Medicine Hat Finance
Department in cooperation with all municipal and utilities departments.
Information on the City of Medicine Hat is available via the internet at
www.medicinehat.ca
TABLE OF CONTENTS
City of Medicine Hat, Alberta Page 1 2016 Financial Report
Page
INTRODUCTORY
City Council ............................................................................................................................. 2
2016 Organizational Chart ...................................................................................................... 3
Treasurer’s Report ................................................................................................................. 4
FINANCIAL STATEMENTS
Management’s Report ............................................................................................................. 14
Auditor’s Report ...................................................................................................................... 15
Consolidated Statement of Financial Position ......................................................................... 16
Consolidated Statement of Operations ................................................................................... 17
Consolidated Statement of Change in Net Financial Assets ................................................... 18
Consolidated Statement of Cash Flows .................................................................................. 19
Consolidated Tangible Capital Assets (Schedule 1) ............................................................... 20
Consolidated Schedule of Property and Other Taxes (Schedule 2) ....................................... 21
Consolidated Government Transfers (Schedule 3) ................................................................. 22
Schedule of Segmented Disclosures (Schedule 4) ................................................................. 23
Consolidated Expenses by Object (Schedule 5) ..................................................................... 26
Notes to Consolidated Financial Statements .......................................................................... 27
FINANCIAL & STATISTICAL SCHEDULES (unaudited)
Demographics and Other Information ..................................................................................... 56
Financial Comparison 2012 - 2016 ......................................................................................... 57
Financial Synopsis .................................................................................................................. 59
Taxation and Assessment ....................................................................................................... 60
Summary of Unrestricted Surplus and Restricted Surplus - Reserves ................................... 61
Long Term Debt ...................................................................................................................... 62
Consolidated Expenses by Object .......................................................................................... 63
Schedule of Operating Revenue & Expenses by Department ................................................ 64
Schedule of Capital Segmented Reporting ............................................................................ 94
Schedules of Capital Financing & Expenses by Department .................................................. 95
City of Medicine Hat, Alberta Page 2 2016 Financial Report
STANDING COMMITTEES
Audit Committee Councillor W. Cocks, Chair Councillor J. McIntosh, Vice Chair Councillor B. Varga
Corporate Services Councillor R. Dumanowski, Chair Councillor J. Turner, Vice Chair Councillor B. Varga
Development & Infrastructure Committee Councillor R. Dumanowski, Chair Councillor L. Pearson, Vice Chair Councillor J. Friesen
Energy Committee Councillor W. Cocks, Chair Councillor J. Friesen, Vice Chair Councillor J. McIntosh Mayor T. Clugston
Public Services Committee Councillor J. Friesen, Chair Councillor L. Pearson, Vice Chair Councillor C. Symmonds
Heritage Resource Committee Councillor L. Pearson, Council Representative
Administrative & Legislative Review Committee
Councillor W. Cocks, Chair Councillor L. Pearson, Vice Chair Councillor R. Dumanowski
Administrative Committee
T. Clugston, Mayor M. Heggelund, Chief Administrative Officer – Municipal Services, Chair K. Charlton, Public Services Commissioner B. Mastel, Corporate Services Commissioner S. Schwartzenberger, Development & Infrastructure Commissioner G. Mauch, Acting Utilities Division Commissioner R. Schmitt, City Solicitor A. Cruickshank, City Clerk
SPECIAL COMMITTTEES
Canadian Badlands: Councillor B. Varga and Mayor T. Clugston
Chamber of Commerce: Councillor J. Turner
City Centre Development Agency: Councillor W. Cocks
Cypress View Foundation: Councillors J. Friesen and J. Turner
Friends of Medalta Society: Councillor J. McIntosh
Medicine Hat Community Housing Society: Councillor C. Symmonds
Medicine Hat Exhibition & Stampede: Mayor T. Clugston
Medicine Hat Public Library: Councillor J. McIntosh
Municipal Names Committee: Councillor J. McIntosh
Municipal Planning Commission: Councillors B Varga and J Turner
Palliser Economic Partnership: Councillor J. Turner
Police Commission: Councillors R. Dumanowski and J. Friesen
Shortgrass Library System: Councillor C. Symmonds
Subdivision & Devel. Appeal Board: Councillors Cocks & Symmonds
Tourism Medicine Hat: Councillor L. Pearson
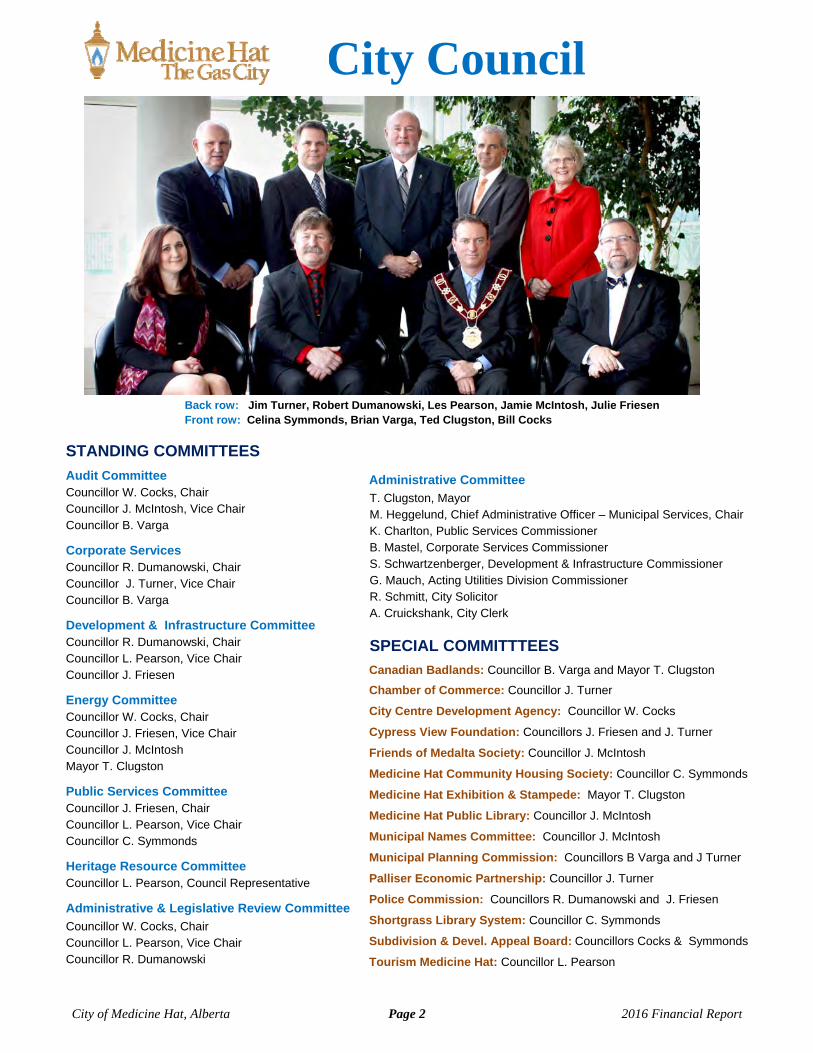
Back row: Jim Turner, Robert Dumanowski, Les Pearson, Jamie McIntosh, Julie Friesen Front row: Celina Symmonds, Brian Varga, Ted Clugston, Bill Cocks
City Council

City of Medicine Hat, Alberta Page 3 2016 Financial Report
AAss aatt DDeecceemmbbeerr 3311,, 22001166
Organizational Structure
City of Medicine Hat, Alberta Page 4 2016 Financial Report
Treasurer’s Report For the year ending December 31, 2016
INTRODUCTION
I am pleased to submit the City of Medicine Hat Consolidated Financial Statements for the fiscal year ended December 31, 2016. KPMG LLP has audited these financial statements and provided an unqualified audit opinion in their report dated April 17, 2017.
The City provides multiple services to the residents and surrounding area. At a municipal level it provides:
Protection to its citizens (Fire, Police and Bylaw Services, 9-1-1 Communications, Social and Family Services),
Recreation and culture activities (Parks and Culture Departments),
Road, bridge, sidewalk and trail maintenance (Municipal Works and Parks),
City planning and development (Planning, Building & Development),
Water, sewer and solid waste management (Environmental Utilities).
The City also operates enterprise business units offering the following services:
Land and property development,
Natural gas exploration and production
Natural gas distribution services (Gas Utility),
Electric generation and distribution services (Electric Utility).
The financial statements bring together the financial results of these activities. In doing so, the City is responsible for both accuracy of the data and completeness and fairness of the presentation, including all disclosures. This report provides users with an overview of the City of Medicine Hat’s financial performance.
The purpose of the Financial Report is to present the readers with clear insight of the financial results for the City for the fiscal year ended December 31, 2016. Administration strives to ensure that this report presents fairly the financial position of this City. The report compares how financial resources were used against budgets and past financial performance. This report is divided into seven sections:
Introduction – Provides an overview of the Treasurer’s Report.
Canadian GFOA Award for Financial Reporting.
Risk Management - Discussion of Risks and Risk Management Strategies.
Management Reporting and Control - Provides an explanation of the planning, budgeting, accounting, auditing and reporting process.
Financial Highlights - Presents a review of the City of Medicine Hat’s activities and financial position for the fiscal year ended December 31, 2016. The analysis is supplementary information to the financial statements and therefore, should be read in conjunction with the consolidated financial statements, accompanying notes and supporting schedules.
Financial Statements - Presents the consolidated financial statements, supporting statements, notes and schedules. These statements and schedules contain comparative results for two prior years, current year results and the approved budget for the operating and capital accounts.
Financial and Statistical Schedules (unaudited) - Presents a variety of statistical and financial information on a multi-year comparative basis.
Brian Mastel Corporate Services Commissioner April 18, 2017

TREASURER’S REPORT FOR THE YEAR ENDED DECEMBER 31, 2016
City of Medicine Hat, Alberta Page 5 2016 Financial Report
CANADIAN GFOA AWARD FOR FINANCIAL REPORTING The Government Finance Officers Association of the United States and Canada (GFOA) awarded a Canadian Award for Financial Reporting to the City of Medicine Hat for its Annual Financial Report for the fiscal year ended December 31, 2015, the fourteenth year in a row. The Canadian Award for Financial Reporting program was established to encourage municipal governments throughout Canada to publish high quality financial reports and to provide peer recognition and technical guidance for officials preparing these reports.
In order to be awarded a Canadian Award for Financial Reporting, a government entity must publish an easily readable and efficiently organized annual financial report with contents conforming to program standards. Such reports should go beyond the minimum requirements of generally accepted accounting principles and demonstrate an effort to clearly communicate the municipal government’s financial picture, enhance an understanding of financial reporting by municipal governments and address user needs.
RISK MANAGEMENT
This section of the report deals with the City’s exposure to risk and uncertainty to enable the reader to make informed judgments about the implications of these risks on the City’s financial position.
(a) Operational Risk Management The City’s operations are insured under a conventional municipal insurance program, which includes
Property, Boiler and Machinery, Liability, Automobile and Oil and Gas Multi-Energy. The insurance program includes a self-retention component for those losses within the various deductible levels.
(b) Public Safety Medicine Hat Police Service continues to keep pace with community growth and the demand for
services from residents. The use of technology, equipment and continued training and development of Police Service personnel ensures public and officer safety.
Fire Services provides life and property protection to the community through rapid response to fire or rescue emergencies, and natural or man-made disasters. They provide community inspections, education and safety programs and preplanning for disasters and emergencies. Fire Services monitors growth patterns and recommend changes and improvements that will provide efficient and effective protection to meet City Council’s established response guidelines to all areas of the city. In 2013, Council approved the Fire Service Response Coverage Optimization Plan which will result in significant response coverage improvements to residents and improved safety for fire fighters. As part of this plan, existing Fire Stations #1 and #2 will be relocated to new locations. The relocation of Fire Station #2 was completed in February 2017 and the construction of the new Fire Station #1 is expected to commence in spring 2017.
The City operates a 9-1-1 Communications Centre, serving as a single point of contact for allocation of emergency and essential services to the residents of Medicine Hat and area. 9-1-1 serves a regional population of approximately 83,000 residents with immediate contact capability for language interpreters, poison control, disaster services, chemical spill information and call trace. The aim is to maintain a level of service that meets or exceeds industry standards with respect to call answer times and protocol compliance.
TREASURER’S REPORT FOR THE YEAR ENDED DECEMBER 31, 2016
City of Medicine Hat, Alberta Page 6 2016 Financial Report
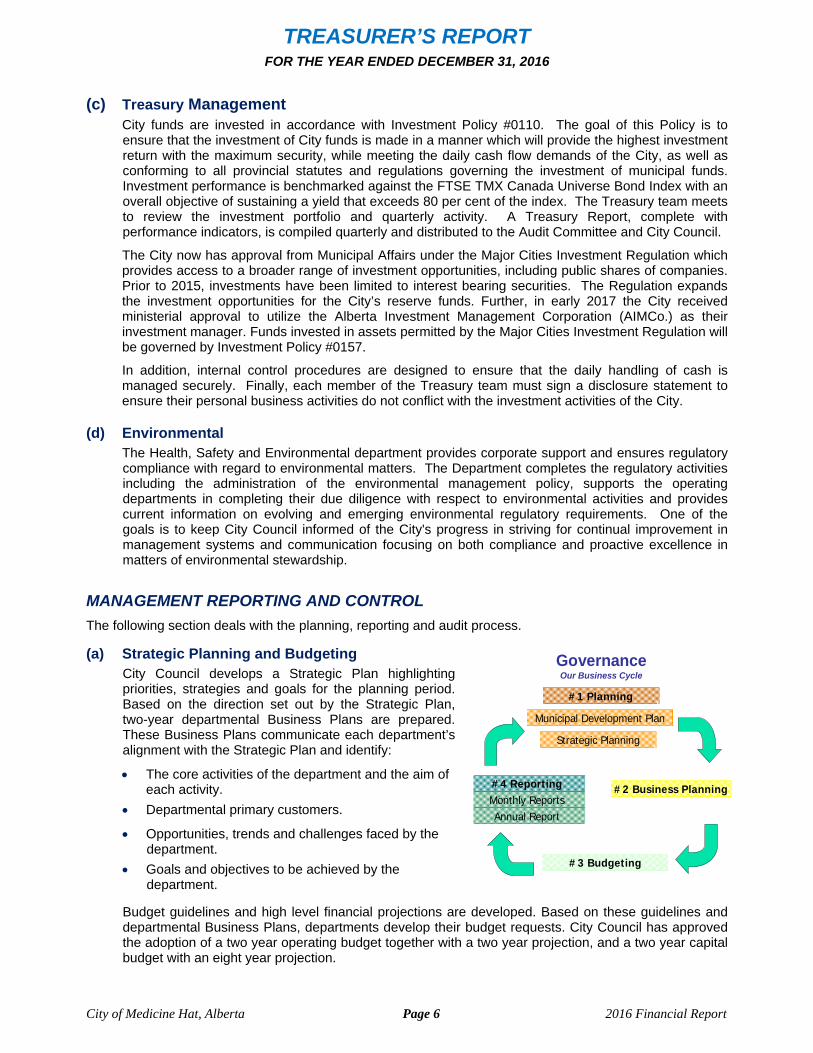
GovernanceOur Business Cycle
MH Planning Cycle
#2 Business Planning
#3 Budgeting
Strategic Planning
Municipal Development Plan
#1 Planning
#4 ReportingMonthly ReportsAnnual Report
(c) Treasury Management City funds are invested in accordance with Investment Policy #0110. The goal of this Policy is to
ensure that the investment of City funds is made in a manner which will provide the highest investment return with the maximum security, while meeting the daily cash flow demands of the City, as well as conforming to all provincial statutes and regulations governing the investment of municipal funds. Investment performance is benchmarked against the FTSE TMX Canada Universe Bond Index with an overall objective of sustaining a yield that exceeds 80 per cent of the index. The Treasury team meets to review the investment portfolio and quarterly activity. A Treasury Report, complete with performance indicators, is compiled quarterly and distributed to the Audit Committee and City Council.
The City now has approval from Municipal Affairs under the Major Cities Investment Regulation which provides access to a broader range of investment opportunities, including public shares of companies. Prior to 2015, investments have been limited to interest bearing securities. The Regulation expands the investment opportunities for the City’s reserve funds. Further, in early 2017 the City received ministerial approval to utilize the Alberta Investment Management Corporation (AIMCo.) as their investment manager. Funds invested in assets permitted by the Major Cities Investment Regulation will be governed by Investment Policy #0157.
In addition, internal control procedures are designed to ensure that the daily handling of cash is managed securely. Finally, each member of the Treasury team must sign a disclosure statement to ensure their personal business activities do not conflict with the investment activities of the City.
(d) Environmental The Health, Safety and Environmental department provides corporate support and ensures regulatory
compliance with regard to environmental matters. The Department completes the regulatory activities including the administration of the environmental management policy, supports the operating departments in completing their due diligence with respect to environmental activities and provides current information on evolving and emerging environmental regulatory requirements. One of the goals is to keep City Council informed of the City's progress in striving for continual improvement in management systems and communication focusing on both compliance and proactive excellence in matters of environmental stewardship.
MANAGEMENT REPORTING AND CONTROL
The following section deals with the planning, reporting and audit process.
(a) Strategic Planning and Budgeting City Council develops a Strategic Plan highlighting priorities, strategies and goals for the planning period. Based on the direction set out by the Strategic Plan, two-year departmental Business Plans are prepared. These Business Plans communicate each department’s alignment with the Strategic Plan and identify:
The core activities of the department and the aim of each activity.
Departmental primary customers.
Opportunities, trends and challenges faced by the department.
Goals and objectives to be achieved by the department.
Budget guidelines and high level financial projections are developed. Based on these guidelines and departmental Business Plans, departments develop their budget requests. City Council has approved the adoption of a two year operating budget together with a two year projection, and a two year capital budget with an eight year projection.
TREASURER’S REPORT FOR THE YEAR ENDED DECEMBER 31, 2016
City of Medicine Hat, Alberta Page 7 2016 Financial Report
The Administrative Committee reviews departmental budgets and when satisfied that budgets are aligned with the Business Plans, the budget recommendation is presented for City Council approval.
The Operating Budget lays out the revenues and expenses for the planning periods that will be required to deliver City services.
A ten year Capital Plan is developed for all departments. The Capital Plans identify proposed capital project expenditures and their sources of funding.
For the 2015/16 budget period the City employed a capital ranking process for the tax supported departments. This process is intended to ensure that limited capital funding is allocated to the projects that will provide the highest value and benefit to the municipality.
(b) Accounting The City of Medicine Hat manages the accounting function in five core divisions: Corporate Services, Public Services, Development and Infrastructure, Natural Gas and Petroleum and Utilities Division. Each division is responsible for managing the delivery of services in accordance with the resources allocated. All divisions share a common accounting and reporting system, and financial and accounting services are administered under the direction of the Commissioner of Corporate Services and delivered to each division based on its requirements.
(c) Auditing The “Municipal Government Act” requires municipal Councils to appoint an independent auditor. In 2015, Medicine Hat City Council appointed KPMG LLP as its external auditor, with the option of renewing for an additional four years. City Council approved KPMG’s appointment for the 2016 audit.
The role of the external auditor is to present an independent opinion on the fair presentation of the City’s financial position and operating results as contained in the Financial Report, and to express an opinion that the financial statements are free from any material misstatements. The auditor advises management and the Audit Committee of any control or operational matters that may have been identified during the audit procedure.
The Audit Committee, comprised of three members of City Council, is a Standing Committee of City Council. The Audit Committee is responsible for recommending the appointment of the independent auditor, reviewing the terms of the engagement and overseeing management’s responsibilities for financial reporting. The Audit Committee meets with management and the independent auditors to discuss the scope and timing of the audit, to review the auditor’s findings and to ensure that management is carrying out its responsibilities.
Financial progress throughout the year is reported to the Audit Committee on a quarterly basis. These progress updates examine financial performance relative to approved budgets and forecast updates.
TREASURER’S REPORT FOR THE YEAR ENDED DECEMBER 31, 2016
City of Medicine Hat, Alberta Page 8 2016 Financial Report
FINANCIAL HIGHLIGHTS
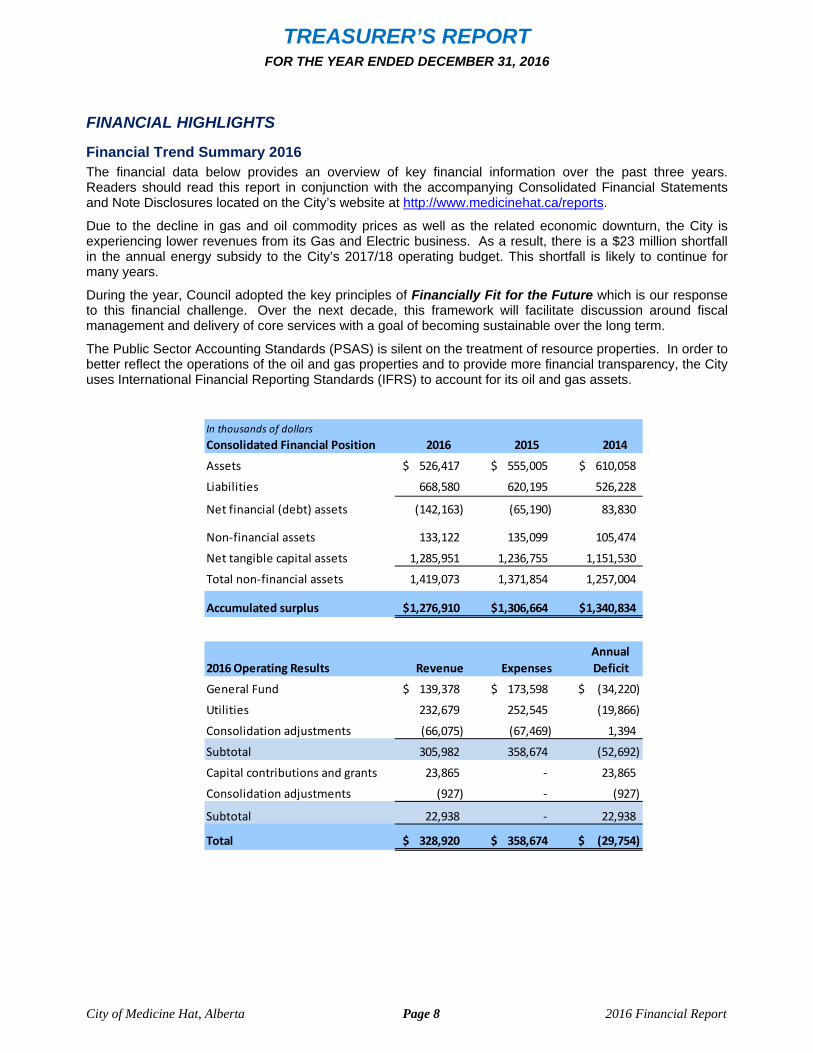
Financial Trend Summary 2016 The financial data below provides an overview of key financial information over the past three years. Readers should read this report in conjunction with the accompanying Consolidated Financial Statements and Note Disclosures located on the City’s website at http://www.medicinehat.ca/reports.
Due to the decline in gas and oil commodity prices as well as the related economic downturn, the City is experiencing lower revenues from its Gas and Electric business. As a result, there is a $23 million shortfall in the annual energy subsidy to the City’s 2017/18 operating budget. This shortfall is likely to continue for many years.
During the year, Council adopted the key principles of Financially Fit for the Future which is our response to this financial challenge. Over the next decade, this framework will facilitate discussion around fiscal management and delivery of core services with a goal of becoming sustainable over the long term.
The Public Sector Accounting Standards (PSAS) is silent on the treatment of resource properties. In order to better reflect the operations of the oil and gas properties and to provide more financial transparency, the City uses International Financial Reporting Standards (IFRS) to account for its oil and gas assets.
In thousands of dollars
Consolidated Financial Position 2016 2015 2014
Assets 526,417$ 555,005$ 610,058$
Liabilities 668,580 620,195 526,228
Net financial (debt) assets (142,163) (65,190) 83,830
Non‐financial assets 133,122 135,099 105,474
Net tangible capital assets 1,285,951 1,236,755 1,151,530
Total non‐financial assets 1,419,073 1,371,854 1,257,004
Accumulated surplus 1,276,910$ 1,306,664$ 1,340,834$
Annual
2016 Operating Results Revenue Expenses Deficit
General Fund 139,378$ 173,598$ (34,220)$
Utilities 232,679 252,545 (19,866)
Consolidation adjustments (66,075) (67,469) 1,394
Subtotal 305,982 358,674 (52,692)
Capital contributions and grants 23,865 ‐ 23,865
Consolidation adjustments (927) ‐ (927)
Subtotal 22,938 ‐ 22,938
Total 328,920$ 358,674$ (29,754)$
TREASURER’S REPORT FOR THE YEAR ENDED DECEMBER 31, 2016
City of Medicine Hat, Alberta Page 9 2016 Financial Report
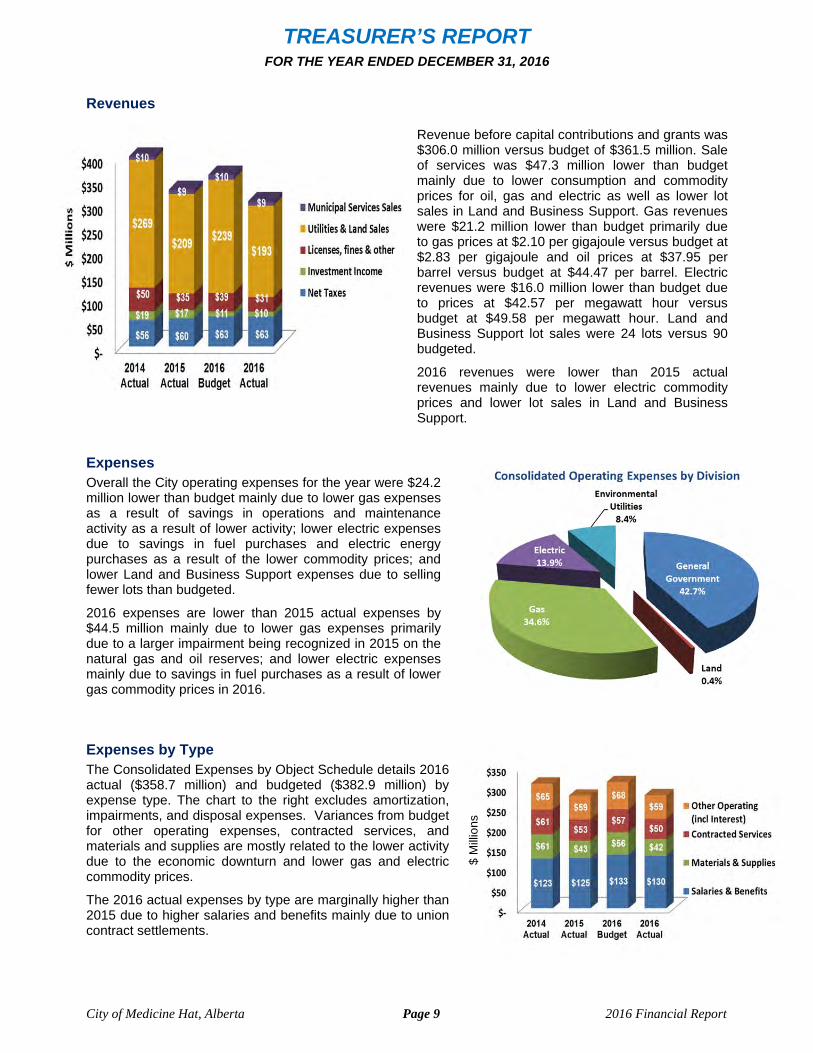
Revenues Revenue before capital contributions and grants was $306.0 million versus budget of $361.5 million. Sale of services was $47.3 million lower than budget mainly due to lower consumption and commodity prices for oil, gas and electric as well as lower lot sales in Land and Business Support. Gas revenues were $21.2 million lower than budget primarily due to gas prices at $2.10 per gigajoule versus budget at $2.83 per gigajoule and oil prices at $37.95 per barrel versus budget at $44.47 per barrel. Electric revenues were $16.0 million lower than budget due to prices at $42.57 per megawatt hour versus budget at $49.58 per megawatt hour. Land and Business Support lot sales were 24 lots versus 90 budgeted.
2016 revenues were lower than 2015 actual revenues mainly due to lower electric commodity prices and lower lot sales in Land and Business Support.
Expenses Overall the City operating expenses for the year were $24.2 million lower than budget mainly due to lower gas expenses as a result of savings in operations and maintenance activity as a result of lower activity; lower electric expenses due to savings in fuel purchases and electric energy purchases as a result of the lower commodity prices; and lower Land and Business Support expenses due to selling fewer lots than budgeted.
2016 expenses are lower than 2015 actual expenses by $44.5 million mainly due to lower gas expenses primarily due to a larger impairment being recognized in 2015 on the natural gas and oil reserves; and lower electric expenses mainly due to savings in fuel purchases as a result of lower gas commodity prices in 2016.
Expenses by Type The Consolidated Expenses by Object Schedule details 2016 actual ($358.7 million) and budgeted ($382.9 million) by expense type. The chart to the right excludes amortization, impairments, and disposal expenses. Variances from budget for other operating expenses, contracted services, and materials and supplies are mostly related to the lower activity due to the economic downturn and lower gas and electric commodity prices.
The 2016 actual expenses by type are marginally higher than 2015 due to higher salaries and benefits mainly due to union contract settlements.
$
Mill
ions
$
Mill
ions

TREASURER’S REPORT FOR THE YEAR ENDED DECEMBER 31, 2016
City of Medicine Hat, Alberta Page 10 2016 Financial Report
2016 Capital Capital expenditures for the year were $123.0 million plus contributions from developers of $2.5 million. While the City’s approved 2016 budget for capital items was $170.7 million, the current expenditures include $93.8 million for projects carried forward from previous budget years.
The 2016 capital expenditures were funded by grants received from the Province of Alberta and the Federal Government of Canada, as well as reserves, operating funds, debenture borrowing, third party contributions and internal loans.
Accumulated Surplus
The accumulated surplus on the Consolidated Statement of Operations represents the total change in all fund and equity balances for the City of Medicine Hat. During 2016 the consolidated fund and equity balances decreased by $29.8 million to $1,276.9 million.
$45.6 million of the accumulated surplus is unrestricted. This unrestricted amount is used as working capital to fund day to day operating activities of the City. The restricted amount is $247.2 million and is largely dedicated to capital activities of the organization.
Equity in the City’s tangible capital assets increased by $15.8 million to $984.1 million this year as a result of an increase in City assets, offset by accumulated amortization and debt.
Investments
Investments, Loans and Advances decreased $24.6 million from 2015 to $432.8 million largely as a result of funds being used for community projects such as flood mitigation and berms, the Family Leisure Center and the construction and relocation of Fire Stations #1 and #2.
The City of Medicine Hat’s investment return for the year ended December 31, 2016 averaged 2.47 per cent, higher than the FTSE TMX Canada Universe Bond benchmark index of 1.24 per cent. The City’s average portfolio return has outperformed the stated benchmark over the last nine years with the exception in 2014 due to the City’s term to maturity being less than the benchmark.

TREASURER’S REPORT FOR THE YEAR ENDED DECEMBER 31, 2016
City of Medicine Hat, Alberta Page 11 2016 Financial Report
Long-Term Debt During 2016, total Long Term Debt increased $33.4 million to $301.9 million as a result of new borrowings exceeding repayments. Total debt principal repayments were $22.8 million and new debt was $56.3 million. New debt represents $16.2 million for improvements to Environmental Utility assets, $38.6 million relate to Electric Utility assets, and $1.5 million for municipal infrastructure.
The Minister of Municipal Affairs has prescribed limits for total debt and debt servicing for municipalities in the province. The debt limit is defined as two times revenue net of capital government transfers, and the debt servicing limit is limited to 35 per cent of revenue net of capital government transfers. For purposes of these calculations actual total debt includes long and short term debt as well as loan guarantees in the amount of $2.1 million.
The City’s 2016 debt limits are as follows:
Use of Municipal Tax Revenue (in thousands of dollars)
Municipal property taxes contributed $63.1 million (41.3%) of the consolidated General Fund operating expenses of $153.0 million. Other revenue sources mainly include investment interest, sales, government grants, fees and permits.
Where our property tax dollars went in 2016.
2016
Debt Limit 612.0$
Actual Total Debt 304.0
Amount Under Limit 308.0$ 50%
Debt Servicing Limit 107.1$
Actual Debt Servicing 33.2
Amount Under Limit 73.9$ 69%
TREASURER’S REPORT FOR THE YEAR ENDED DECEMBER 31, 2016
City of Medicine Hat, Alberta Page 12 2016 Financial Report
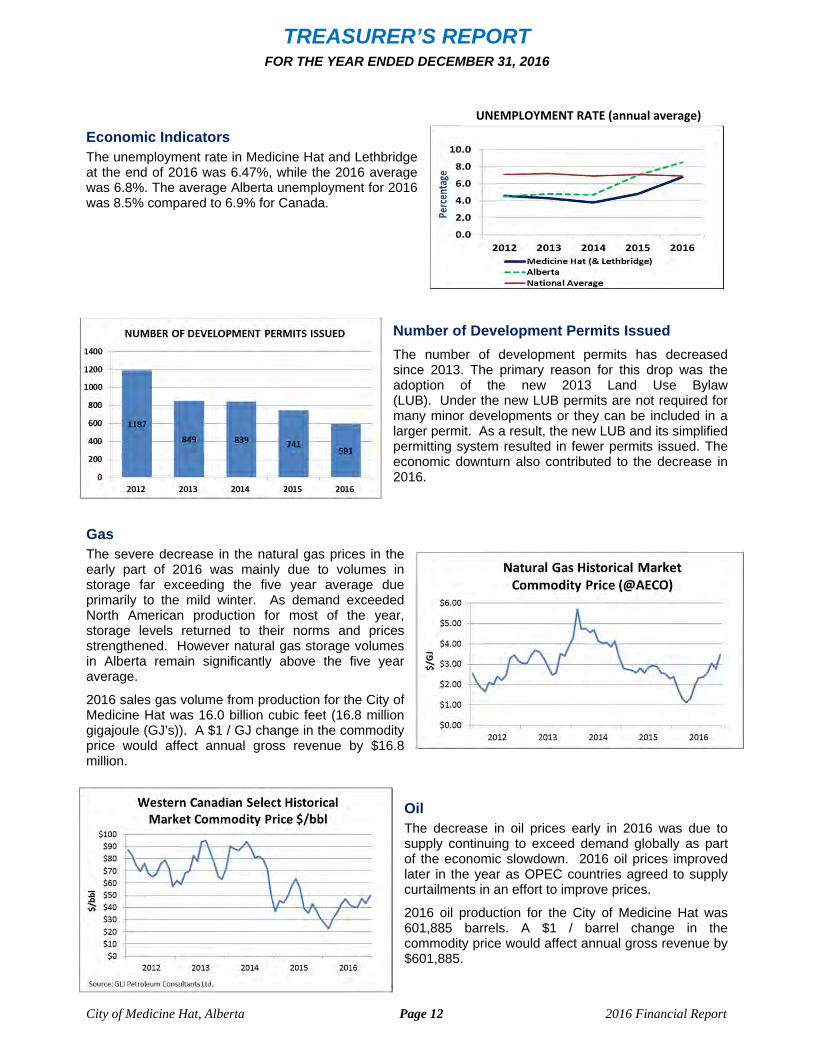
Economic Indicators The unemployment rate in Medicine Hat and Lethbridge at the end of 2016 was 6.47%, while the 2016 average was 6.8%. The average Alberta unemployment for 2016 was 8.5% compared to 6.9% for Canada.
Number of Development Permits Issued
The number of development permits has decreased since 2013. The primary reason for this drop was the adoption of the new 2013 Land Use Bylaw (LUB). Under the new LUB permits are not required for many minor developments or they can be included in a larger permit. As a result, the new LUB and its simplified permitting system resulted in fewer permits issued. The economic downturn also contributed to the decrease in 2016.
Gas The severe decrease in the natural gas prices in the early part of 2016 was mainly due to volumes in storage far exceeding the five year average due primarily to the mild winter. As demand exceeded North American production for most of the year, storage levels returned to their norms and prices strengthened. However natural gas storage volumes in Alberta remain significantly above the five year average.
2016 sales gas volume from production for the City of Medicine Hat was 16.0 billion cubic feet (16.8 million gigajoule (GJ’s)). A $1 / GJ change in the commodity price would affect annual gross revenue by $16.8 million.
Oil The decrease in oil prices early in 2016 was due to supply continuing to exceed demand globally as part of the economic slowdown. 2016 oil prices improved later in the year as OPEC countries agreed to supply curtailments in an effort to improve prices.
2016 oil production for the City of Medicine Hat was 601,885 barrels. A $1 / barrel change in the commodity price would affect annual gross revenue by $601,885.
UNEMPLOYMENT RATE (annual average)
City of Medicine Hat, Alberta Page 14 2016 Financial Report
RESPONSIBILITY FOR FINANCIAL REPORTING
MANAGEMENT’S REPORT
The integrity, relevance and comparability of the data in the accompanying consolidated financial statements are the responsibility of Management. The consolidated financial statements are prepared by management in accordance with Canadian generally accepted accounting principles established by the Public Sector Accounting Board (PSAB) of the Canadian Institute of Chartered Accountants. They necessarily include some amounts that are based on the best estimates and judgments of Management. Financial data elsewhere in the report is consistent with that in the financial statements. Management has developed and maintains an extensive system of internal controls that provide reasonable assurance that all transactions are appropriately authorized, that assets are properly accounted for and safeguarded, that all transactions are accurately recorded and that financial records are reliable for preparation of financial statements. As well, it is the policy of the City to maintain the highest standard of ethics in all its activities. City Council, through its Audit Committee, comprised of three Councilors, oversees management’s responsibilities for financial reporting. The Audit Committee meets regularly with management and independent auditors to discuss auditing and reporting on financial matters and to assure that management is carrying out its responsibilities. The auditors have full and free access to the Audit Committee and management.

City of Medicine Hat, Alberta Page 15 2016 Financial Report
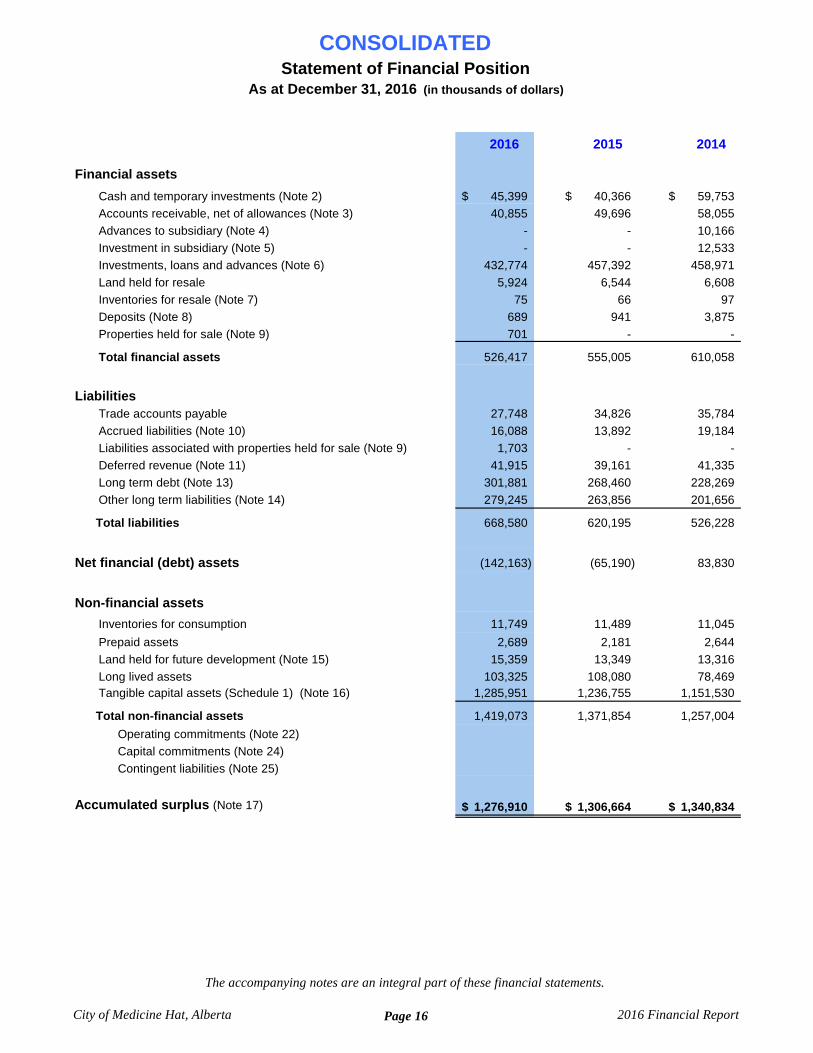
2016 2015 2014
Financial assets
Cash and temporary investments (Note 2) 45,399$ 40,366$ 59,753$ Accounts receivable, net of allowances (Note 3) 40,855 49,696 58,055 Advances to subsidiary (Note 4) - - 10,166 Investment in subsidiary (Note 5) - - 12,533 Investments, loans and advances (Note 6) 432,774 457,392 458,971 Land held for resale 5,924 6,544 6,608 Inventories for resale (Note 7) 75 66 97 Deposits (Note 8) 689 941 3,875 Properties held for sale (Note 9) 701 - -
Total financial assets 526,417 555,005 610,058
LiabilitiesTrade accounts payable 27,748 34,826 35,784 Accrued liabilities (Note 10) 16,088 13,892 19,184 Liabilities associated with properties held for sale (Note 9) 1,703 - - Deferred revenue (Note 11) 41,915 39,161 41,335 Long term debt (Note 13) 301,881 268,460 228,269 Other long term liabilities (Note 14) 279,245 263,856 201,656
Total liabilities 668,580 620,195 526,228
Net financial (debt) assets (142,163) (65,190) 83,830
Non-financial assets
Inventories for consumption 11,749 11,489 11,045
Prepaid assets 2,689 2,181 2,644 Land held for future development (Note 15) 15,359 13,349 13,316 Long lived assets 103,325 108,080 78,469 Tangible capital assets (Schedule 1) (Note 16) 1,285,951 1,236,755 1,151,530
Total non-financial assets 1,419,073 1,371,854 1,257,004
Operating commitments (Note 22)Capital commitments (Note 24)Contingent liabilities (Note 25)
Accumulated surplus (Note 17) 1,276,910$ 1,306,664$ 1,340,834$
CONSOLIDATEDStatement of Financial Position
As at December 31, 2016 (in thousands of dollars)
City of Medicine Hat, Alberta
The accompanying notes are an integral part of these financial statements.
Page 16 2016 Financial Report
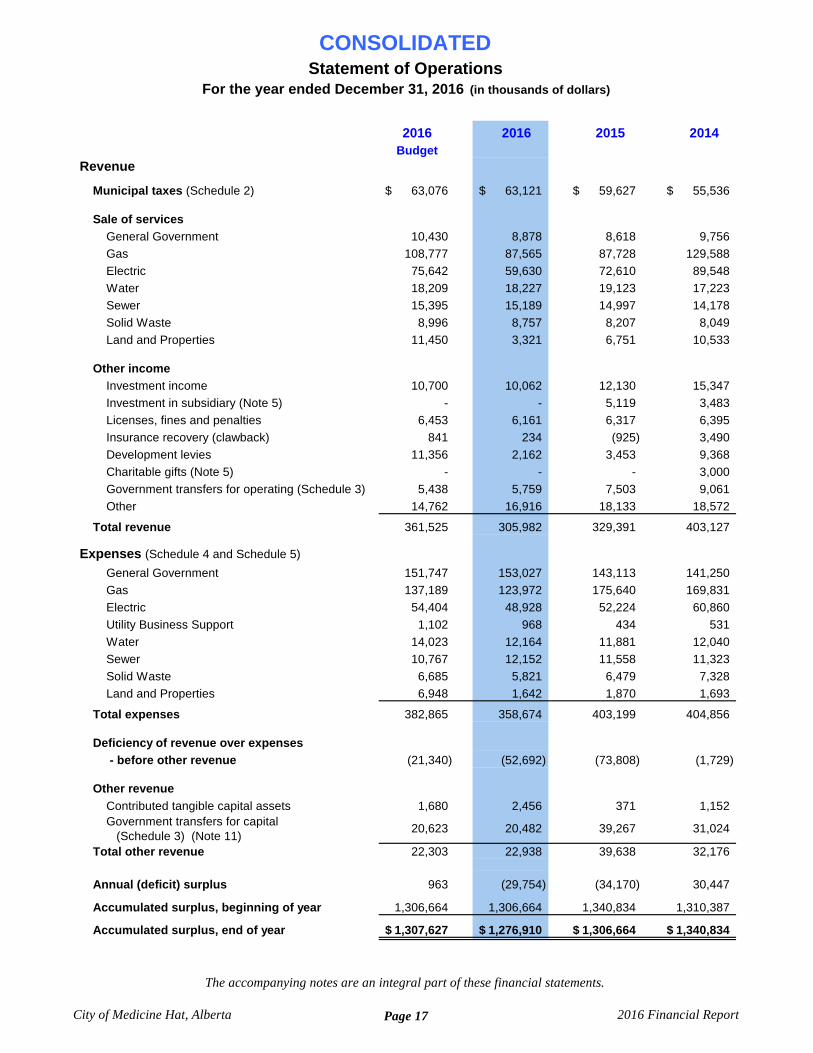
2016 2016 2015 2014Budget
Revenue
Municipal taxes (Schedule 2) 63,076$ 63,121$ 59,627$ 55,536$
Sale of servicesGeneral Government 10,430 8,878 8,618 9,756 Gas 108,777 87,565 87,728 129,588 Electric 75,642 59,630 72,610 89,548 Water 18,209 18,227 19,123 17,223 Sewer 15,395 15,189 14,997 14,178 Solid Waste 8,996 8,757 8,207 8,049 Land and Properties 11,450 3,321 6,751 10,533
Other incomeInvestment income 10,700 10,062 12,130 15,347 Investment in subsidiary (Note 5) - - 5,119 3,483 Licenses, fines and penalties 6,453 6,161 6,317 6,395 Insurance recovery (clawback) 841 234 (925) 3,490 Development levies 11,356 2,162 3,453 9,368 Charitable gifts (Note 5) - - - 3,000 Government transfers for operating (Schedule 3) 5,438 5,759 7,503 9,061 Other 14,762 16,916 18,133 18,572
Total revenue 361,525 305,982 329,391 403,127
Expenses (Schedule 4 and Schedule 5)
General Government 151,747 153,027 143,113 141,250 137,189 123,972 175,640 169,831
Electric 54,404 48,928 52,224 60,860 Utility Business Support 1,102 968 434 531 Water 14,023 12,164 11,881 12,040
10,767 12,152 11,558 11,323 6,685 5,821 6,479 7,328
Land and Properties 6,948 1,642 1,870 1,693
Total expenses 382,865 358,674 403,199 404,856
Deficiency of revenue over expenses - before other revenue (21,340) (52,692) (73,808) (1,729)
Contributed tangible capital assets 1,680 2,456 371 1,152
20,623 20,482 39,267 31,024
Total other revenue 22,303 22,938 39,638 32,176
Annual (deficit) surplus 963 (29,754) (34,170) 30,447
Accumulated surplus, beginning of year 1,306,664 1,306,664 1,340,834 1,310,387
Accumulated surplus, end of year 1,307,627$ 1,276,910$ 1,306,664$ 1,340,834$
Government transfers for capital (Schedule 3) (Note 11)
CONSOLIDATEDStatement of Operations
For the year ended December 31, 2016 (in thousands of dollars)
Other revenue
Sewer Solid Waste
Gas
City of Medicine Hat, Alberta
The accompanying notes are an integral part of these financial statements.
Page 17 2016 Financial Report
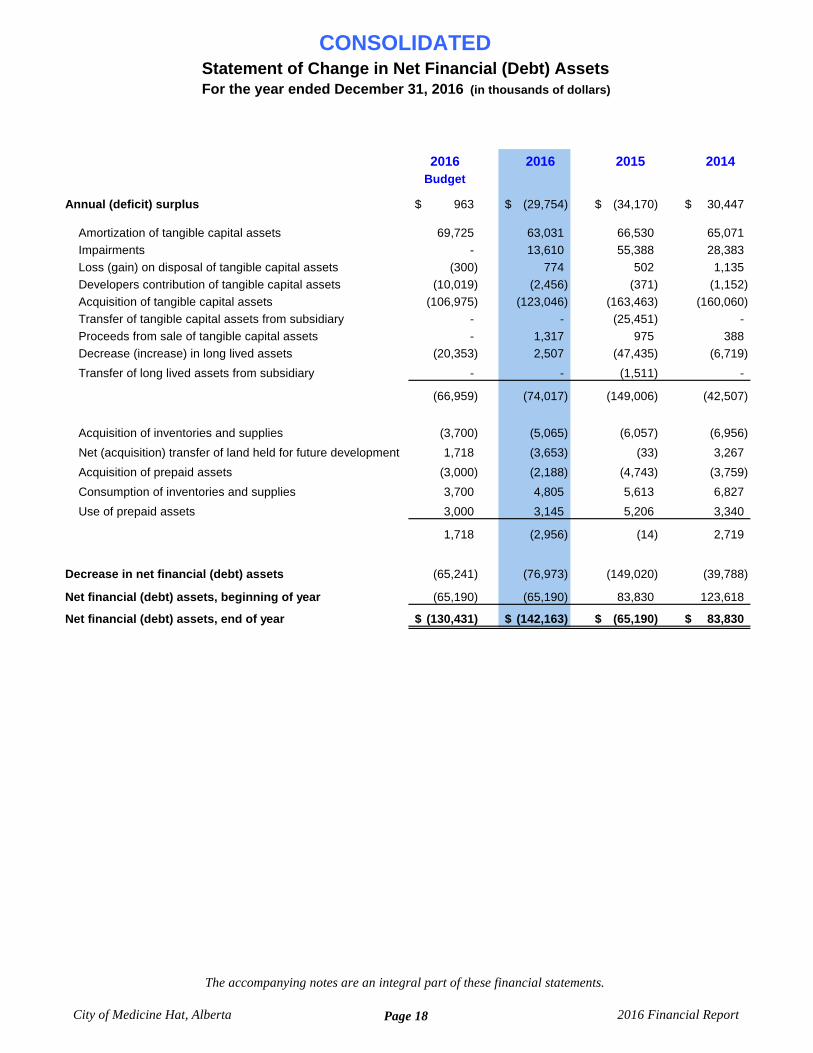
2016 2016 2015 2014Budget
Annual (deficit) surplus 963$ (29,754)$ (34,170)$ 30,447$
Amortization of tangible capital assets 69,725 63,031 66,530 65,071 Impairments - 13,610 55,388 28,383 Loss (gain) on disposal of tangible capital assets (300) 774 502 1,135 Developers contribution of tangible capital assets (10,019) (2,456) (371) (1,152) Acquisition of tangible capital assets (106,975) (123,046) (163,463) (160,060) Transfer of tangible capital assets from subsidiary - - (25,451) - Proceeds from sale of tangible capital assets - 1,317 975 388 Decrease (increase) in long lived assets (20,353) 2,507 (47,435) (6,719)
Transfer of long lived assets from subsidiary - - (1,511) -
(66,959) (74,017) (149,006) (42,507)
Acquisition of inventories and supplies (3,700) (5,065) (6,057) (6,956)
Net (acquisition) transfer of land held for future development 1,718 (3,653) (33) 3,267
Acquisition of prepaid assets (3,000) (2,188) (4,743) (3,759)
Consumption of inventories and supplies 3,700 4,805 5,613 6,827
Use of prepaid assets 3,000 3,145 5,206 3,340
1,718 (2,956) (14) 2,719
Decrease in net financial (debt) assets (65,241) (76,973) (149,020) (39,788)
Net financial (debt) assets, beginning of year (65,190) (65,190) 83,830 123,618
Net financial (debt) assets, end of year (130,431)$ (142,163)$ (65,190)$ 83,830$
CONSOLIDATEDStatement of Change in Net Financial (Debt) AssetsFor the year ended December 31, 2016 (in thousands of dollars)
City of Medicine Hat, Alberta
The accompanying notes are an integral part of these financial statements.
Page 18 2016 Financial Report
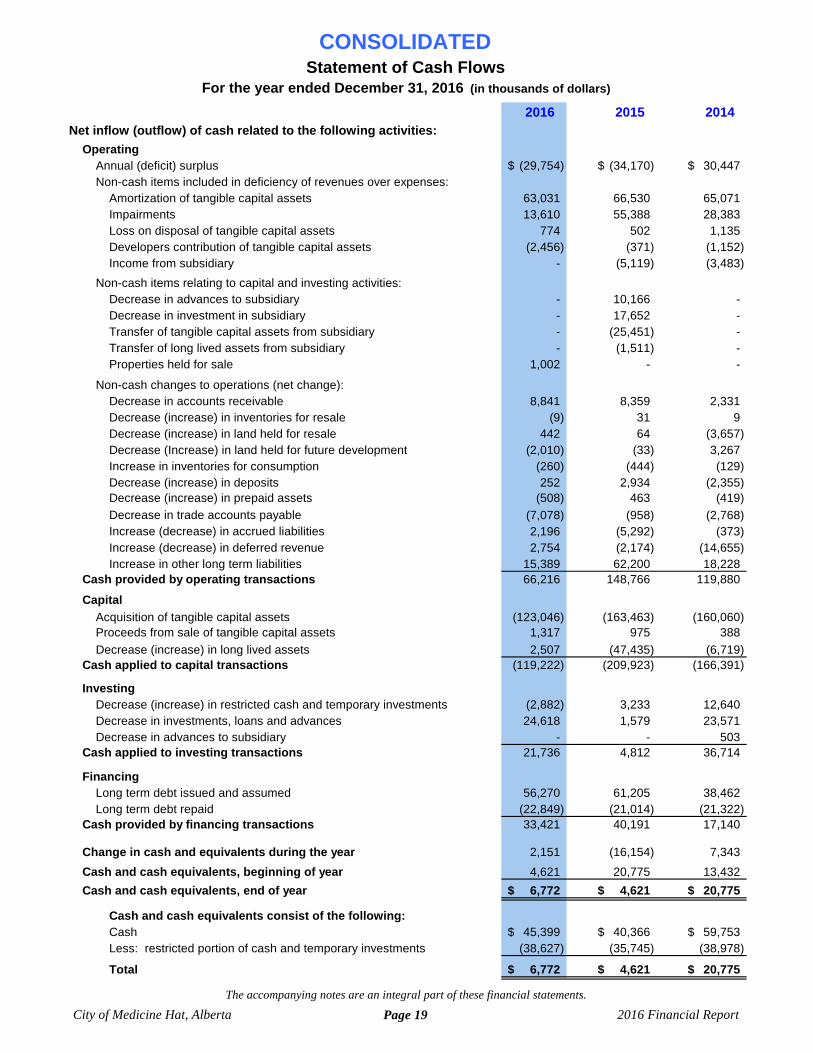
2016 2015 2014
OperatingAnnual (deficit) surplus (29,754)$ (34,170)$ 30,447$ Non-cash items included in deficiency of revenues over expenses:
Amortization of tangible capital assets 63,031 66,530 65,071 Impairments 13,610 55,388 28,383 Loss on disposal of tangible capital assets 774 502 1,135 Developers contribution of tangible capital assets (2,456) (371) (1,152) Income from subsidiary - (5,119) (3,483)
Non-cash items relating to capital and investing activities:Decrease in advances to subsidiary - 10,166 - Decrease in investment in subsidiary - 17,652 - Transfer of tangible capital assets from subsidiary - (25,451) - Transfer of long lived assets from subsidiary - (1,511) - Properties held for sale 1,002 - -
Non-cash changes to operations (net change):Decrease in accounts receivable 8,841 8,359 2,331 Decrease (increase) in inventories for resale (9) 31 9 Decrease (increase) in land held for resale 442 64 (3,657) Decrease (Increase) in land held for future development (2,010) (33) 3,267 Increase in inventories for consumption (260) (444) (129) Decrease (increase) in deposits 252 2,934 (2,355) Decrease (increase) in prepaid assets (508) 463 (419) Decrease in trade accounts payable (7,078) (958) (2,768) Increase (decrease) in accrued liabilities 2,196 (5,292) (373) Increase (decrease) in deferred revenue 2,754 (2,174) (14,655) Increase in other long term liabilities 15,389 62,200 18,228
Cash provided by operating transactions 66,216 148,766 119,880
CapitalAcquisition of tangible capital assets (123,046) (163,463) (160,060) Proceeds from sale of tangible capital assets 1,317 975 388 Decrease (increase) in long lived assets 2,507 (47,435) (6,719)
Cash applied to capital transactions (119,222) (209,923) (166,391)
InvestingDecrease (increase) in restricted cash and temporary investments (2,882) 3,233 12,640 Decrease in investments, loans and advances 24,618 1,579 23,571 Decrease in advances to subsidiary - - 503
Cash applied to investing transactions 21,736 4,812 36,714
FinancingLong term debt issued and assumed 56,270 61,205 38,462 Long term debt repaid (22,849) (21,014) (21,322)
Cash provided by financing transactions 33,421 40,191 17,140
Change in cash and equivalents during the year 2,151 (16,154) 7,343
Cash and cash equivalents, beginning of year 4,621 20,775 13,432
Cash and cash equivalents, end of year 6,772$ 4,621$ 20,775$
Cash and cash equivalents consist of the following:Cash 45,399$ 40,366$ 59,753$ Less: restricted portion of cash and temporary investments (38,627) (35,745) (38,978)
Total 6,772$ 4,621$ 20,775$
Net inflow (outflow) of cash related to the following activities:
CONSOLIDATEDStatement of Cash Flows
For the year ended December 31, 2016 (in thousands of dollars)
The accompanying notes are an integral part of these financial statements.
City of Medicine Hat, Alberta Page 19 2016 Financial Report
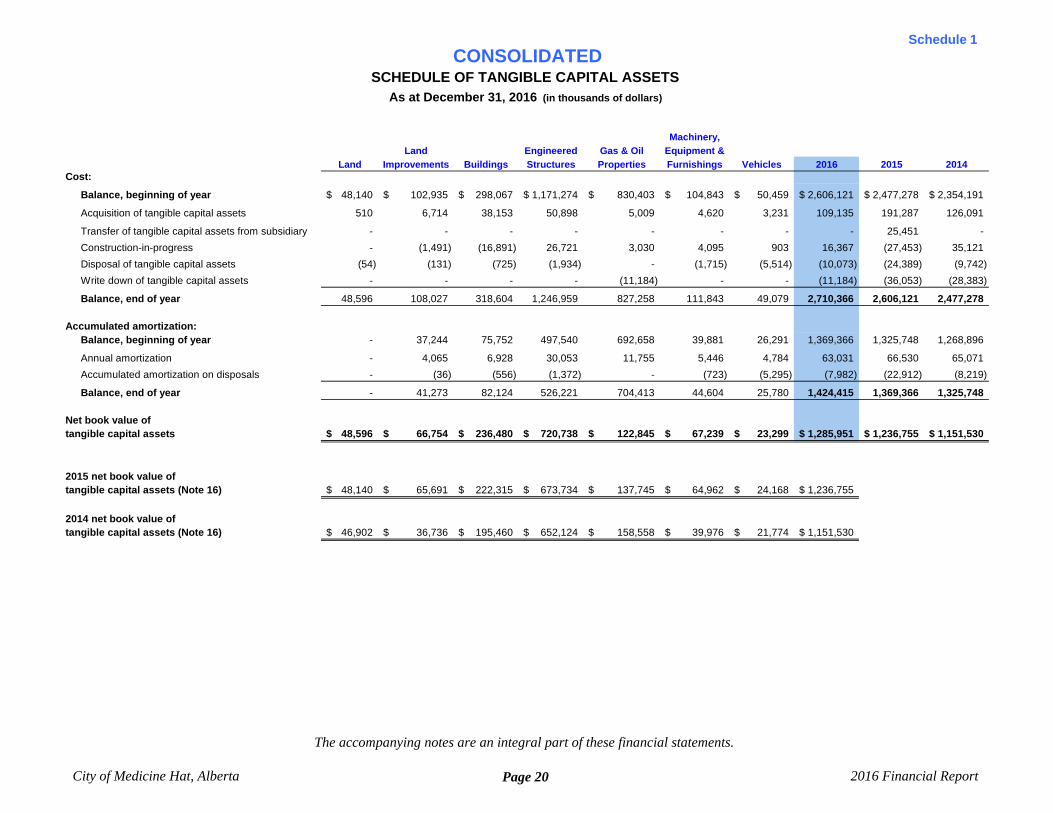
Machinery,Land Engineered Gas & Oil Equipment &
Land Improvements Buildings Structures Properties Furnishings Vehicles 2016 2015 2014Cost:
Balance, beginning of year 48,140$ 102,935$ 298,067$ 1,171,274$ 830,403$ 104,843$ 50,459$ 2,606,121$ 2,477,278$ 2,354,191$
Acquisition of tangible capital assets 510 6,714 38,153 50,898 5,009 4,620 3,231 109,135 191,287 126,091
Transfer of tangible capital assets from subsidiary - - - - - - - - 25,451 -
Construction-in-progress - (1,491) (16,891) 26,721 3,030 4,095 903 16,367 (27,453) 35,121
Disposal of tangible capital assets (54) (131) (725) (1,934) - (1,715) (5,514) (10,073) (24,389) (9,742)
Write down of tangible capital assets - - - - (11,184) - - (11,184) (36,053) (28,383)
Balance, end of year 48,596 108,027 318,604 1,246,959 827,258 111,843 49,079 2,710,366 2,606,121 2,477,278
Accumulated amortization:Balance, beginning of year - 37,244 75,752 497,540 692,658 39,881 26,291 1,369,366 1,325,748 1,268,896
Annual amortization - 4,065 6,928 30,053 11,755 5,446 4,784 63,031 66,530 65,071
Accumulated amortization on disposals - (36) (556) (1,372) - (723) (5,295) (7,982) (22,912) (8,219)
Balance, end of year - 41,273 82,124 526,221 704,413 44,604 25,780 1,424,415 1,369,366 1,325,748
Net book value of tangible capital assets 48,596$ 66,754$ 236,480$ 720,738$ 122,845$ 67,239$ 23,299$ 1,285,951$ 1,236,755$ 1,151,530$
2015 net book value of tangible capital assets (Note 16) 48,140$ 65,691$ 222,315$ 673,734$ 137,745$ 64,962$ 24,168$ 1,236,755$
2014 net book value of tangible capital assets (Note 16) 46,902$ 36,736$ 195,460$ 652,124$ 158,558$ 39,976$ 21,774$ 1,151,530$
CONSOLIDATEDSCHEDULE OF TANGIBLE CAPITAL ASSETS
As at December 31, 2016 (in thousands of dollars)
Schedule 1
City of Medicine Hat, Alberta
The accompanying notes are an integral part of these financial statements.
Page 20 2016 Financial Report
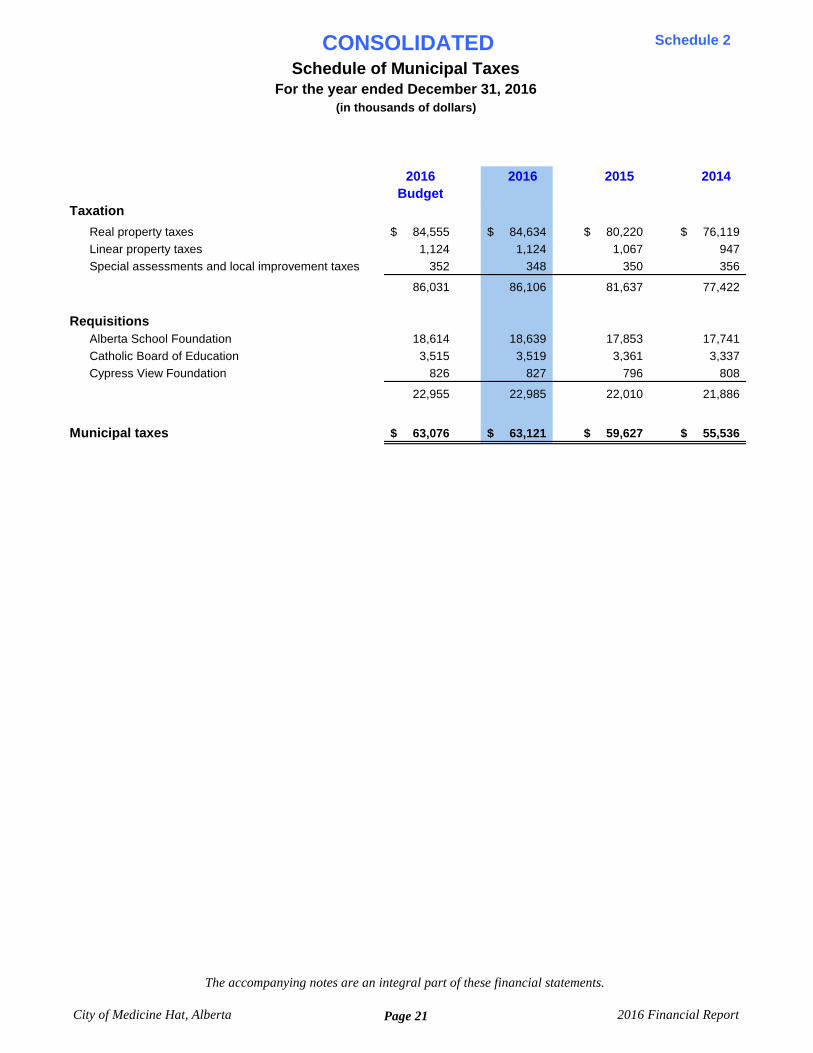
2016 2016 2015 2014Budget
Taxation
Real property taxes 84,555$ 84,634$ 80,220$ 76,119$ Linear property taxes 1,124 1,124 1,067 947 Special assessments and local improvement taxes 352 348 350 356
86,031 86,106 81,637 77,422
RequisitionsAlberta School Foundation 18,614 18,639 17,853 17,741 Catholic Board of Education 3,515 3,519 3,361 3,337 Cypress View Foundation 826 827 796 808
22,955 22,985 22,010 21,886
Municipal taxes 63,076$ 63,121$ 59,627$ 55,536$
CONSOLIDATEDSchedule of Municipal Taxes
For the year ended December 31, 2016(in thousands of dollars)
Schedule 2
City of Medicine Hat, Alberta
The accompanying notes are an integral part of these financial statements.
Page 21 2016 Financial Report
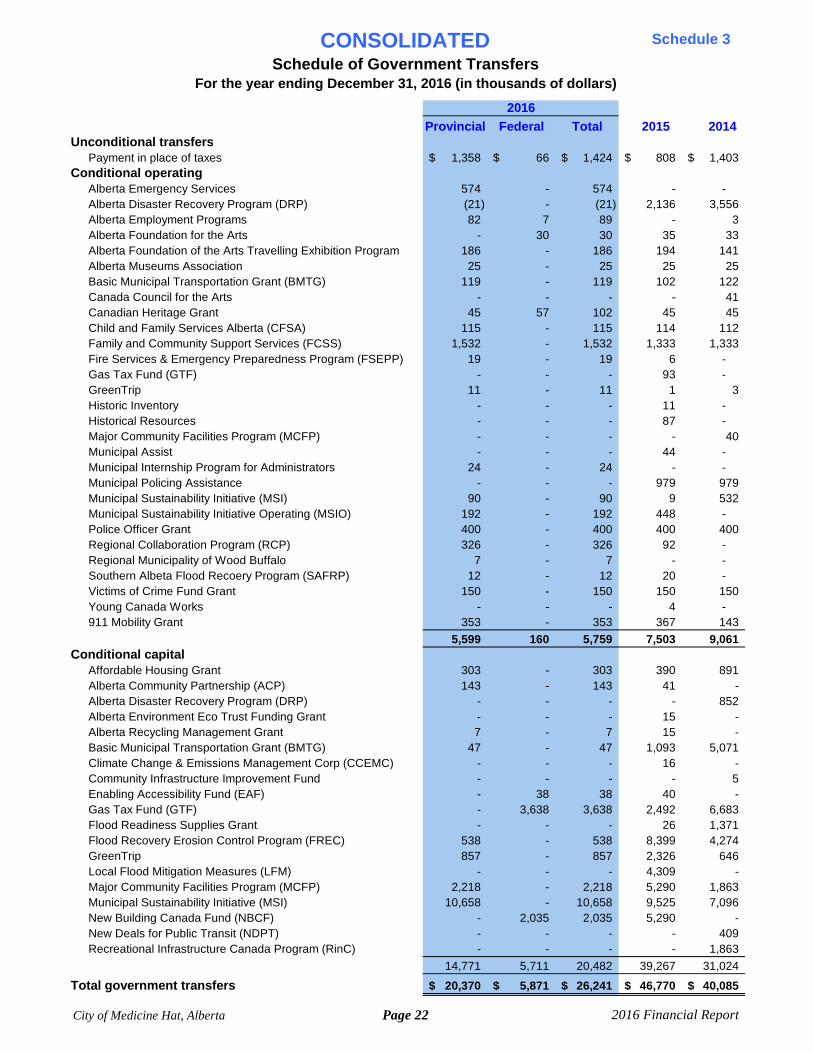
Provincial Federal Total 2015 2014Unconditional transfers
Payment in place of taxes 1,358$ 66$ 1,424$ 808$ 1,403$ Conditional operating
Alberta Emergency Services 574 - 574 - - Alberta Disaster Recovery Program (DRP) (21) - (21) 2,136 3,556 Alberta Employment Programs 82 7 89 - 3 Alberta Foundation for the Arts - 30 30 35 33 Alberta Foundation of the Arts Travelling Exhibition Program 186 - 186 194 141 Alberta Museums Association 25 - 25 25 25 Basic Municipal Transportation Grant (BMTG) 119 - 119 102 122 Canada Council for the Arts - - - - 41 Canadian Heritage Grant 45 57 102 45 45 Child and Family Services Alberta (CFSA) 115 - 115 114 112 Family and Community Support Services (FCSS) 1,532 - 1,532 1,333 1,333 Fire Services & Emergency Preparedness Program (FSEPP) 19 - 19 6 - Gas Tax Fund (GTF) - - - 93 - GreenTrip 11 - 11 1 3 Historic Inventory - - - 11 - Historical Resources - - - 87 - Major Community Facilities Program (MCFP) - - - - 40 Municipal Assist - - - 44 - Municipal Internship Program for Administrators 24 - 24 - - Municipal Policing Assistance - - - 979 979 Municipal Sustainability Initiative (MSI) 90 - 90 9 532 Municipal Sustainability Initiative Operating (MSIO) 192 - 192 448 - Police Officer Grant 400 - 400 400 400 Regional Collaboration Program (RCP) 326 - 326 92 - Regional Municipality of Wood Buffalo 7 - 7 - - Southern Albeta Flood Recoery Program (SAFRP) 12 - 12 20 - Victims of Crime Fund Grant 150 - 150 150 150 Young Canada Works - - - 4 - 911 Mobility Grant 353 - 353 367 143
5,599 160 5,759 7,503 9,061 Conditional capital
Affordable Housing Grant 303 - 303 390 891 Alberta Community Partnership (ACP) 143 - 143 41 - Alberta Disaster Recovery Program (DRP) - - - - 852 Alberta Environment Eco Trust Funding Grant - - - 15 - Alberta Recycling Management Grant 7 - 7 15 - Basic Municipal Transportation Grant (BMTG) 47 - 47 1,093 5,071 Climate Change & Emissions Management Corp (CCEMC) - - - 16 - Community Infrastructure Improvement Fund - - - - 5 Enabling Accessibility Fund (EAF) - 38 38 40 - Gas Tax Fund (GTF) - 3,638 3,638 2,492 6,683 Flood Readiness Supplies Grant - - - 26 1,371 Flood Recovery Erosion Control Program (FREC) 538 - 538 8,399 4,274 GreenTrip 857 - 857 2,326 646 Local Flood Mitigation Measures (LFM) - - - 4,309 - Major Community Facilities Program (MCFP) 2,218 - 2,218 5,290 1,863 Municipal Sustainability Initiative (MSI) 10,658 - 10,658 9,525 7,096 New Building Canada Fund (NBCF) - 2,035 2,035 5,290 - New Deals for Public Transit (NDPT) - - - - 409 Recreational Infrastructure Canada Program (RinC) - - - - 1,863
14,771 5,711 20,482 39,267 31,024
Total government transfers 20,370$ 5,871$ 26,241$ 46,770$ 40,085$
2016
CONSOLIDATEDSchedule of Government Transfers
For the year ending December 31, 2016 (in thousands of dollars)
Schedule 3
City of Medicine Hat, Alberta Page 22 2016 Financial Report
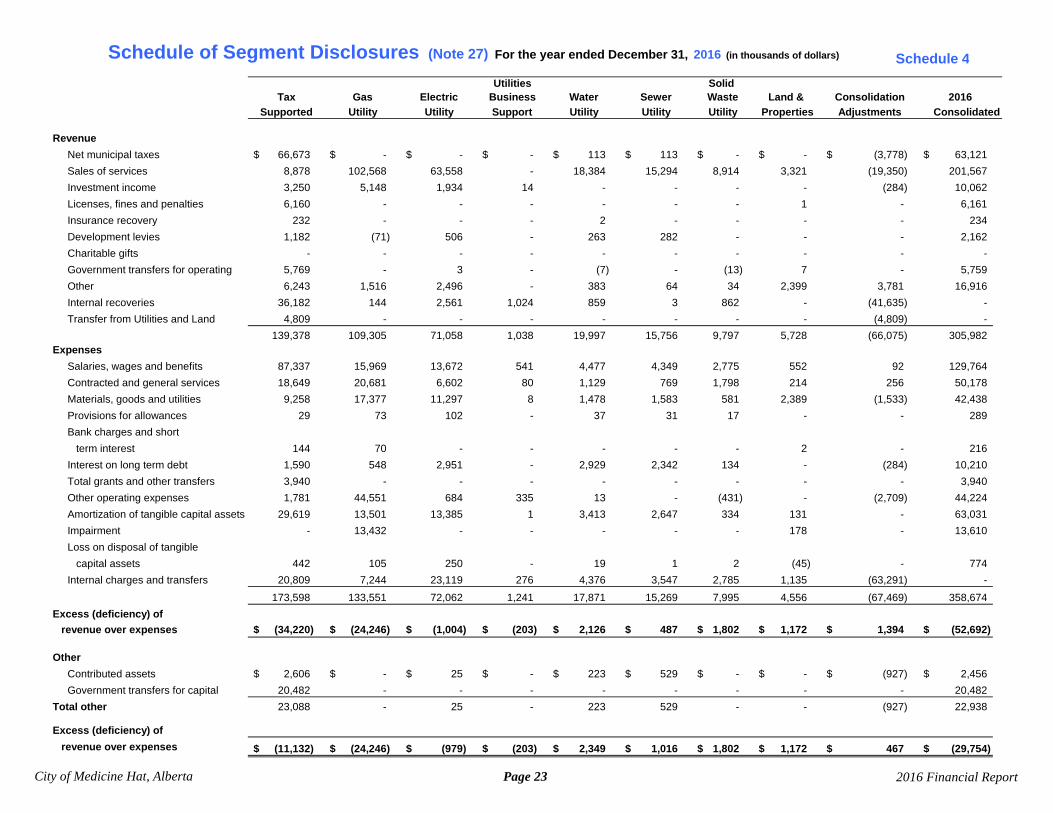
Revenue
Net municipal taxes 66,673$ -$ -$ -$ 113$ 113$ -$ -$ (3,778)$ 63,121$
Sales of services 8,878 102,568 63,558 - 18,384 15,294 8,914 3,321 (19,350) 201,567
Investment income 3,250 5,148 1,934 14 - - - - (284) 10,062
Licenses, fines and penalties 6,160 - - - - - - 1 - 6,161
Insurance recovery 232 - - - 2 - - - - 234
Development levies 1,182 (71) 506 - 263 282 - - - 2,162
Charitable gifts - - - - - - - - - -
Government transfers for operating 5,769 - 3 - (7) - (13) 7 - 5,759
Other 6,243 1,516 2,496 - 383 64 34 2,399 3,781 16,916
Internal recoveries 36,182 144 2,561 1,024 859 3 862 - (41,635) -
Transfer from Utilities and Land 4,809 - - - - - - - (4,809) -
139,378 109,305 71,058 1,038 19,997 15,756 9,797 5,728 (66,075) 305,982 Expenses
Salaries, wages and benefits 87,337 15,969 13,672 541 4,477 4,349 2,775 552 92 129,764
Contracted and general services 18,649 20,681 6,602 80 1,129 769 1,798 214 256 50,178
Materials, goods and utilities 9,258 17,377 11,297 8 1,478 1,583 581 2,389 (1,533) 42,438
Provisions for allowances 29 73 102 - 37 31 17 - - 289
Bank charges and short
term interest 144 70 - - - - - 2 - 216
Interest on long term debt 1,590 548 2,951 - 2,929 2,342 134 - (284) 10,210
Total grants and other transfers 3,940 - - - - - - - - 3,940
Other operating expenses 1,781 44,551 684 335 13 - (431) - (2,709) 44,224
Amortization of tangible capital assets 29,619 13,501 13,385 1 3,413 2,647 334 131 - 63,031
Impairment - 13,432 - - - - - 178 - 13,610
Loss on disposal of tangible
capital assets 442 105 250 - 19 1 2 (45) - 774
Internal charges and transfers 20,809 7,244 23,119 276 4,376 3,547 2,785 1,135 (63,291) -
173,598 133,551 72,062 1,241 17,871 15,269 7,995 4,556 (67,469) 358,674
Excess (deficiency) of revenue over expenses (34,220)$ (24,246)$ (1,004)$ (203)$ 2,126$ 487$ 1,802$ 1,172$ 1,394$ (52,692)$
Other
Contributed assets 2,606$ -$ 25$ -$ 223$ 529$ -$ -$ (927)$ 2,456$
Government transfers for capital 20,482 - - - - - - - - 20,482
Total other 23,088 - 25 - 223 529 - - (927) 22,938
Excess (deficiency) of
revenue over expenses (11,132)$ (24,246)$ (979)$ (203)$ 2,349$ 1,016$ 1,802$ 1,172$ 467$ (29,754)$
Adjustments2016
Consolidated
Solid WasteUtility
Land & PropertiesSupport
WaterUtility
SewerUtilitySupported
GasUtility
ElectricUtility
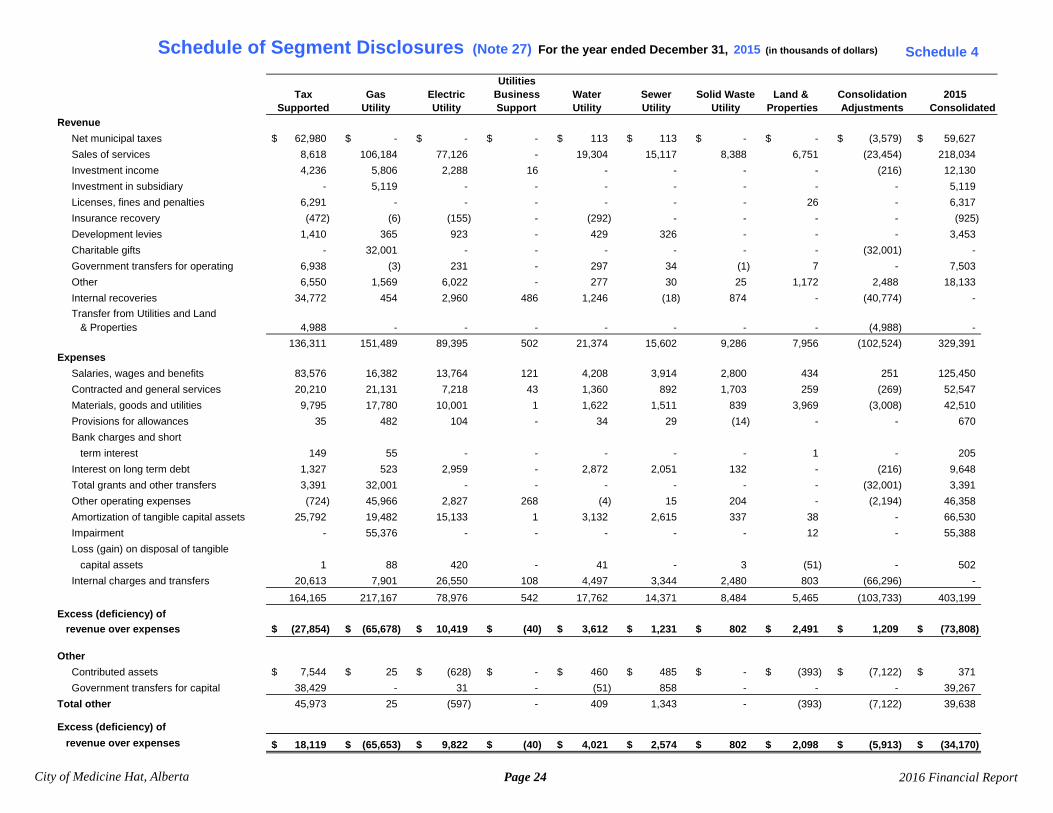
Schedule of Segment Disclosures (Note 27) For the year ended December 31, 2016 (in thousands of dollars)
TaxUtilities
Business Consolidation
Schedule 4
City of Medicine Hat, Alberta Page 23 2016 Financial Report
Land & Properties
Revenue
Net municipal taxes 62,980$ -$ -$ -$ 113$ 113$ -$ -$ (3,579)$ 59,627$
Sales of services 8,618 106,184 77,126 - 19,304 15,117 8,388 6,751 (23,454) 218,034
Investment income 4,236 5,806 2,288 16 - - - - (216) 12,130
Investment in subsidiary - 5,119 - - - - - - - 5,119
Licenses, fines and penalties 6,291 - - - - - - 26 - 6,317
Insurance recovery (472) (6) (155) - (292) - - - - (925)
Development levies 1,410 365 923 - 429 326 - - - 3,453
Charitable gifts - 32,001 - - - - - - (32,001) -
Government transfers for operating 6,938 (3) 231 - 297 34 (1) 7 - 7,503
Other 6,550 1,569 6,022 - 277 30 25 1,172 2,488 18,133
Internal recoveries 34,772 454 2,960 486 1,246 (18) 874 - (40,774) -
Transfer from Utilities and Land & Properties 4,988 - - - - - - - (4,988) -
136,311 151,489 89,395 502 21,374 15,602 9,286 7,956 (102,524) 329,391 Expenses
Salaries, wages and benefits 83,576 16,382 13,764 121 4,208 3,914 2,800 434 251 125,450
Contracted and general services 20,210 21,131 7,218 43 1,360 892 1,703 259 (269) 52,547
Materials, goods and utilities 9,795 17,780 10,001 1 1,622 1,511 839 3,969 (3,008) 42,510
Provisions for allowances 35 482 104 - 34 29 (14) - - 670
Bank charges and short
term interest 149 55 - - - - - 1 - 205
Interest on long term debt 1,327 523 2,959 - 2,872 2,051 132 - (216) 9,648
Total grants and other transfers 3,391 32,001 - - - - - - (32,001) 3,391
Other operating expenses (724) 45,966 2,827 268 (4) 15 204 - (2,194) 46,358
Amortization of tangible capital assets 25,792 19,482 15,133 1 3,132 2,615 337 38 - 66,530
Impairment - 55,376 - - - - - 12 - 55,388
Loss (gain) on disposal of tangible
capital assets 1 88 420 - 41 - 3 (51) - 502
Internal charges and transfers 20,613 7,901 26,550 108 4,497 3,344 2,480 803 (66,296) -
164,165 217,167 78,976 542 17,762 14,371 8,484 5,465 (103,733) 403,199
Excess (deficiency) of revenue over expenses (27,854)$ (65,678)$ 10,419$ (40)$ 3,612$ 1,231$ 802$ 2,491$ 1,209$ (73,808)$
Other
Contributed assets 7,544$ 25$ (628)$ -$ 460$ 485$ -$ (393)$ (7,122)$ 371$
Government transfers for capital 38,429 - 31 - (51) 858 - - - 39,267
Total other 45,973 25 (597) - 409 1,343 - (393) (7,122) 39,638
Excess (deficiency) of
revenue over expenses 18,119$ (65,653)$ 9,822$ (40)$ 4,021$ 2,574$ 802$ 2,098$ (5,913)$ (34,170)$
UtilityConsolidationAdjustments
2015ConsolidatedSupport
WaterUtility
SewerUtilitySupported
GasUtility
ElectricUtility
Schedule of Segment Disclosures (Note 27) For the year ended December 31, 2015 (in thousands of dollars)
Tax Business Solid WasteUtilities
Schedule 4
City of Medicine Hat, Alberta Page 24 2016 Financial Report
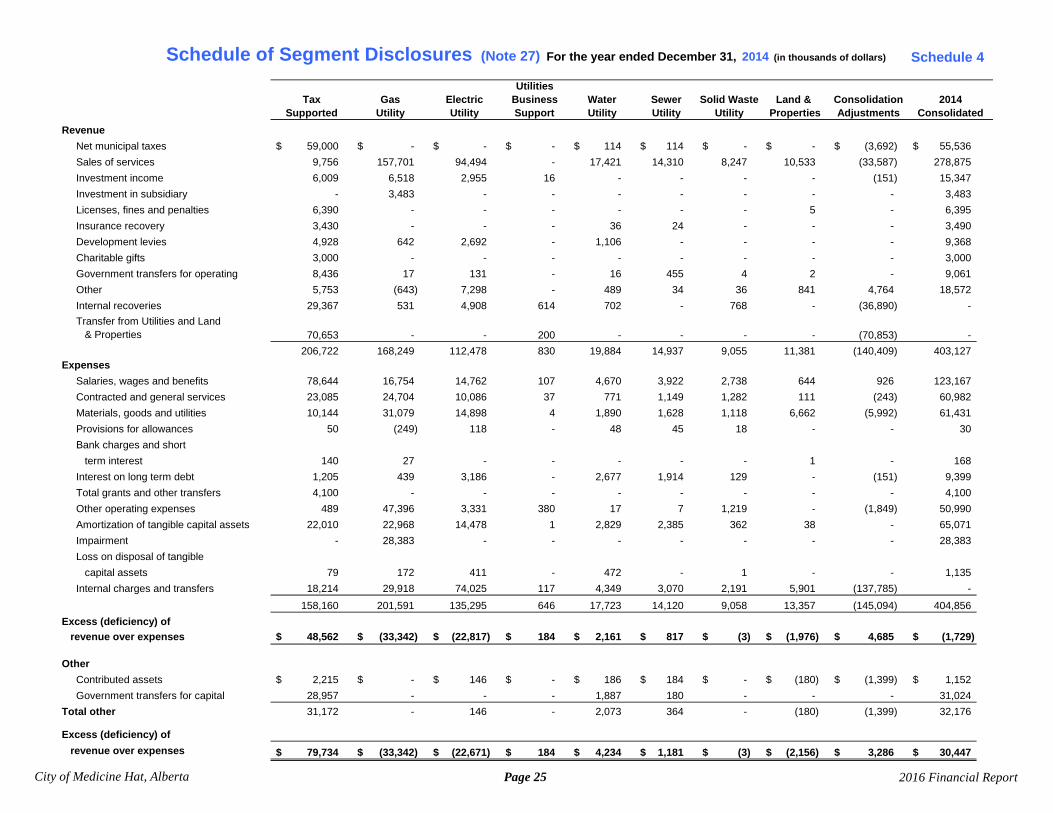
Revenue
Net municipal taxes 59,000$ -$ -$ -$ 114$ 114$ -$ -$ (3,692)$ 55,536$
Sales of services 9,756 157,701 94,494 - 17,421 14,310 8,247 10,533 (33,587) 278,875
Investment income 6,009 6,518 2,955 16 - - - - (151) 15,347
Investment in subsidiary - 3,483 - - - - - - - 3,483
Licenses, fines and penalties 6,390 - - - - - - 5 - 6,395
Insurance recovery 3,430 - - - 36 24 - - - 3,490
Development levies 4,928 642 2,692 - 1,106 - - - - 9,368
Charitable gifts 3,000 - - - - - - - - 3,000
Government transfers for operating 8,436 17 131 - 16 455 4 2 - 9,061
Other 5,753 (643) 7,298 - 489 34 36 841 4,764 18,572
Internal recoveries 29,367 531 4,908 614 702 - 768 - (36,890) -
Transfer from Utilities and Land & Properties 70,653 - - 200 - - - - (70,853) -
206,722 168,249 112,478 830 19,884 14,937 9,055 11,381 (140,409) 403,127 Expenses
Salaries, wages and benefits 78,644 16,754 14,762 107 4,670 3,922 2,738 644 926 123,167
Contracted and general services 23,085 24,704 10,086 37 771 1,149 1,282 111 (243) 60,982
Materials, goods and utilities 10,144 31,079 14,898 4 1,890 1,628 1,118 6,662 (5,992) 61,431
Provisions for allowances 50 (249) 118 - 48 45 18 - - 30
Bank charges and short
term interest 140 27 - - - - - 1 - 168
Interest on long term debt 1,205 439 3,186 - 2,677 1,914 129 - (151) 9,399
Total grants and other transfers 4,100 - - - - - - - - 4,100
Other operating expenses 489 47,396 3,331 380 17 7 1,219 - (1,849) 50,990
Amortization of tangible capital assets 22,010 22,968 14,478 1 2,829 2,385 362 38 - 65,071
Impairment - 28,383 - - - - - - - 28,383
Loss on disposal of tangible
capital assets 79 172 411 - 472 - 1 - - 1,135
Internal charges and transfers 18,214 29,918 74,025 117 4,349 3,070 2,191 5,901 (137,785) -
158,160 201,591 135,295 646 17,723 14,120 9,058 13,357 (145,094) 404,856
Excess (deficiency) of revenue over expenses 48,562$ (33,342)$ (22,817)$ 184$ 2,161$ 817$ (3)$ (1,976)$ 4,685$ (1,729)$
Other
Contributed assets 2,215$ -$ 146$ -$ 186$ 184$ -$ (180)$ (1,399)$ 1,152$
Government transfers for capital 28,957 - - - 1,887 180 - - - 31,024
Total other 31,172 - 146 - 2,073 364 - (180) (1,399) 32,176
Excess (deficiency) of
revenue over expenses 79,734$ (33,342)$ (22,671)$ 184$ 4,234$ 1,181$ (3)$ (2,156)$ 3,286$ 30,447$
2014Consolidated
Schedule of Segment Disclosures (Note 27) For the year ended December 31, 2014 (in thousands of dollars)
UtilityLand &
PropertiesConsolidationAdjustments
TaxSupported
GasUtility
ElectricUtility
Solid WasteBusinessSupport
WaterUtility
SewerUtility
Utilities
Schedule 4
City of Medicine Hat, Alberta Page 25 2016 Financial Report
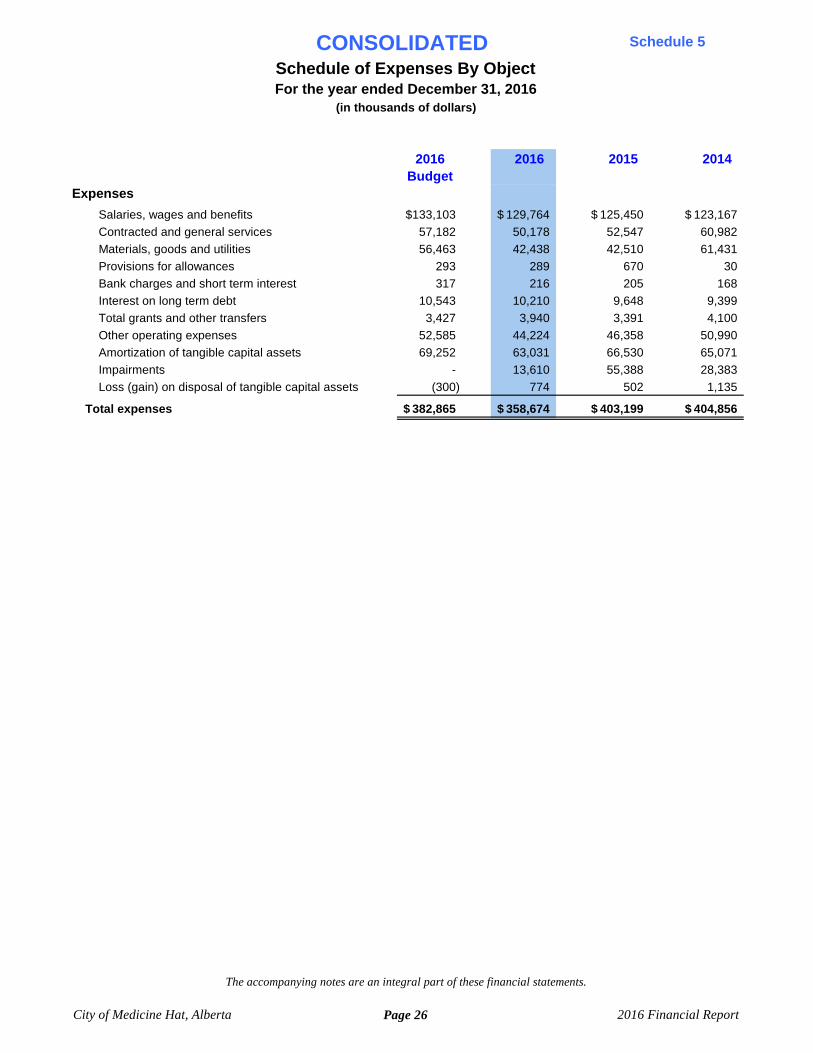
2016 2016 2015 2014Budget
Expenses
Salaries, wages and benefits 133,103$ 129,764$ 125,450$ 123,167$ Contracted and general services 57,182 50,178 52,547 60,982 Materials, goods and utilities 56,463 42,438 42,510 61,431 Provisions for allowances 293 289 670 30 Bank charges and short term interest 317 216 205 168 Interest on long term debt 10,543 10,210 9,648 9,399 Total grants and other transfers 3,427 3,940 3,391 4,100 Other operating expenses 52,585 44,224 46,358 50,990 Amortization of tangible capital assets 69,252 63,031 66,530 65,071 Impairments - 13,610 55,388 28,383 Loss (gain) on disposal of tangible capital assets (300) 774 502 1,135
Total expenses 382,865$ 358,674$ 403,199$ 404,856$
CONSOLIDATED Schedule of Expenses By ObjectFor the year ended December 31, 2016
(in thousands of dollars)
The accompanying notes are an integral part of these financial statements.
Schedule 5
City of Medicine Hat, Alberta Page 26 2016 Financial Report
NOTES For the year ended December 31, 2016
(In thousands of dollars)
City of Medicine Hat, Alberta Page 27 2016 Financial Report
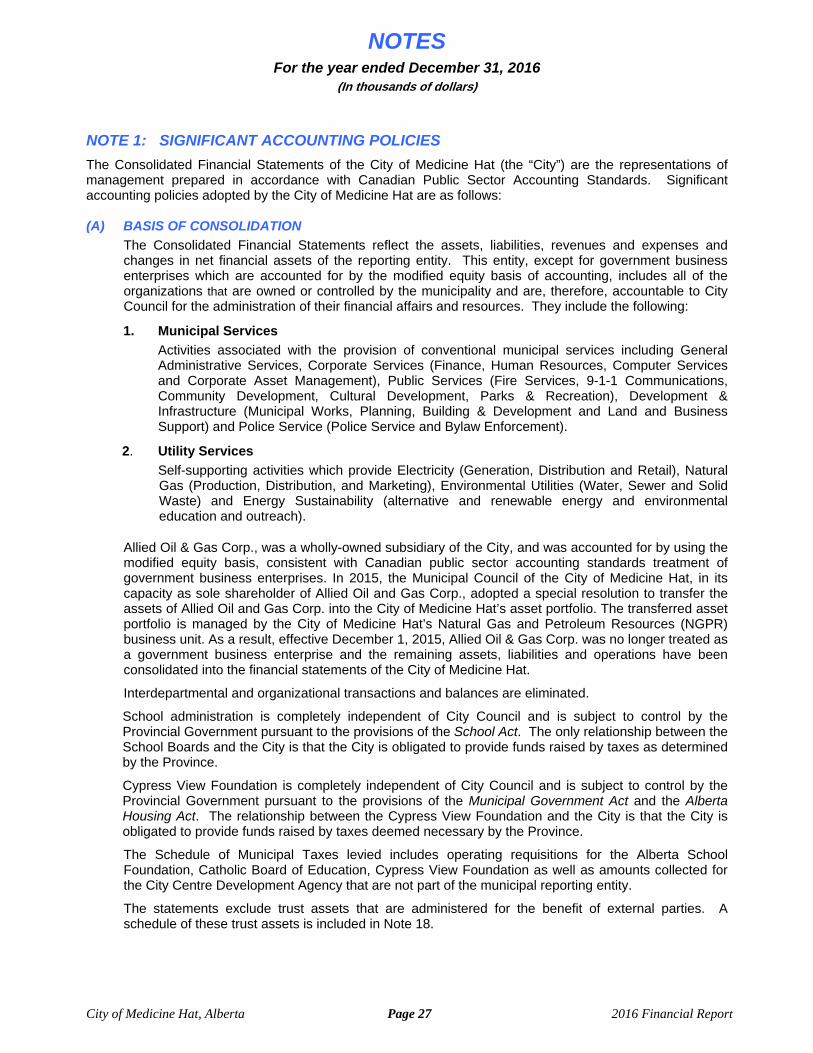
NOTE 1: SIGNIFICANT ACCOUNTING POLICIES
The Consolidated Financial Statements of the City of Medicine Hat (the “City”) are the representations of management prepared in accordance with Canadian Public Sector Accounting Standards. Significant accounting policies adopted by the City of Medicine Hat are as follows:
(A) BASIS OF CONSOLIDATION
The Consolidated Financial Statements reflect the assets, liabilities, revenues and expenses and changes in net financial assets of the reporting entity. This entity, except for government business enterprises which are accounted for by the modified equity basis of accounting, includes all of the organizations that are owned or controlled by the municipality and are, therefore, accountable to City Council for the administration of their financial affairs and resources. They include the following:
1. Municipal Services
Activities associated with the provision of conventional municipal services including General Administrative Services, Corporate Services (Finance, Human Resources, Computer Services and Corporate Asset Management), Public Services (Fire Services, 9-1-1 Communications, Community Development, Cultural Development, Parks & Recreation), Development & Infrastructure (Municipal Works, Planning, Building & Development and Land and Business Support) and Police Service (Police Service and Bylaw Enforcement).
2. Utility Services
Self-supporting activities which provide Electricity (Generation, Distribution and Retail), Natural Gas (Production, Distribution, and Marketing), Environmental Utilities (Water, Sewer and Solid Waste) and Energy Sustainability (alternative and renewable energy and environmental education and outreach).
Allied Oil & Gas Corp., was a wholly-owned subsidiary of the City, and was accounted for by using the modified equity basis, consistent with Canadian public sector accounting standards treatment of government business enterprises. In 2015, the Municipal Council of the City of Medicine Hat, in its capacity as sole shareholder of Allied Oil and Gas Corp., adopted a special resolution to transfer the assets of Allied Oil and Gas Corp. into the City of Medicine Hat’s asset portfolio. The transferred asset portfolio is managed by the City of Medicine Hat’s Natural Gas and Petroleum Resources (NGPR) business unit. As a result, effective December 1, 2015, Allied Oil & Gas Corp. was no longer treated as a government business enterprise and the remaining assets, liabilities and operations have been consolidated into the financial statements of the City of Medicine Hat.
Interdepartmental and organizational transactions and balances are eliminated.
School administration is completely independent of City Council and is subject to control by the Provincial Government pursuant to the provisions of the School Act. The only relationship between the School Boards and the City is that the City is obligated to provide funds raised by taxes as determined by the Province.
Cypress View Foundation is completely independent of City Council and is subject to control by the Provincial Government pursuant to the provisions of the Municipal Government Act and the Alberta Housing Act. The relationship between the Cypress View Foundation and the City is that the City is obligated to provide funds raised by taxes deemed necessary by the Province.
The Schedule of Municipal Taxes levied includes operating requisitions for the Alberta School Foundation, Catholic Board of Education, Cypress View Foundation as well as amounts collected for the City Centre Development Agency that are not part of the municipal reporting entity.
The statements exclude trust assets that are administered for the benefit of external parties. A schedule of these trust assets is included in Note 18.
NOTES For the year ended December 31, 2016
(In thousands of dollars)
City of Medicine Hat, Alberta Page 28 2016 Financial Report
(B) BASIS OF ACCOUNTING
The Consolidated Financial Statements are prepared using the accrual basis of accounting.
1. Revenues
The accrual basis of accounting records revenue as it is earned and measurable. Sales and user fees are accounted for in the period in which the events occurred that gave rise to the revenues.
Revenue from external parties and earnings thereon restricted by agreement or legislation are accounted for as deferred revenue until used for the intended purpose. Government transfers from senior levels of government are recognized in the financial statements in the period that gives rise to the transfer occurring, providing the transfers are authorized, the City has met any eligible criteria and a reasonable estimate of the amounts can be made.
2. Tax Revenues
Tax revenues are recognized once City Council passes the bylaw approving the current year’s tax assessment and tax rate. Tax rate categories include: real property taxes (residential and non-residential), linear property taxes and local improvement taxes. Requisitions operating as flow through arrangements are excluded from revenue.
Taxes receivable are measured once the tax rate bylaw is passed. The property owner’s share of the improvement is recognized as revenue, and recorded as receivable, in the period that the project expenditures are completed. Taxes receivable are measured at their net realizable value. Net realizable value excludes individually identified taxes in arrears considered uncollectable through the tax recovery process. Taxes received in advance of the next tax year are recorded as a customer credit and liability until the bylaw is passed.
3. Expenses
Expenses are recognized as they are incurred and measurable based on receipt of goods and services and/or the creation of a legal obligation to pay with the exception of pension expenses as disclosed in Note 1F.
(C) INVESTMENTS, LOANS AND ADVANCES
Portfolio investments are comprised of investments in qualifying instruments as defined in the City’s Investment Policy #0110. Portfolio investments purchased by the City of Medicine Hat are recorded at cost. The cost of investments includes the applicable amortization of premiums and discounts using the effective interest method. When there has been a loss in value that is other than a temporary decline, the respective investment is written down to recognize the loss.
Loans and advances result from the City providing financing to other entities that provide services which benefit the citizens of the City of Medicine Hat. These loans and advances are recorded at amortized costs using the effective interest rate. Investments in government business enterprises are accounted for using the modified equity basis of accounting. Under this basis, the accounting principles of the government business enterprises are not adjusted to conform to the City’s accounting policies and inter-organizational transactions and balances are not eliminated.
(D) INVENTORIES FOR RESALE / GAS IN STORAGE
Inventories for resale and gas in storage are valued at the lower of cost or net realizable value with cost determined by the average cost method.
NOTES For the year ended December 31, 2016
(In thousands of dollars)
City of Medicine Hat, Alberta Page 29 2016 Financial Report
(E) LAND HELD FOR RESALE
Land held for resale is recorded at the lower of cost or net realizable value. The cost of land held for resale includes costs related to land acquisition and improvements required to prepare the land for servicing such as clearing, stripping and levelling charges. Related development costs incurred to provide infrastructure such as water, sewer, gas, electric, roads, sidewalks and street lighting are recorded as tangible capital assets under their respective function. The cost of land held for resale is determined on a specific item basis.
(F) PENSION EXPENSES
The City participates in multi-employer defined benefit pension plans, wherein contributions for current and past service pension benefits are recorded as expenses in the year in which they become due. These plans are accounted for as defined contribution plans.
(G) JOINT VENTURE ACCOUNTING
Some of the City’s production activities related to oil and gas are contracted jointly with third parties. These statements reflect only the City’s proportionate interest in such activities.
(H) OVER-LEVIES AND UNDER-LEVIES
Over-levies and under-levies arise from the difference between the actual levy made to cover each requisition and the actual amount requisitioned.
If the actual levy exceeds the requisition, the over-levy is accrued as a liability. Where the actual levy is less than the requisition amount, the under-levy is accrued as a receivable. Requisition tax rates in the subsequent year are adjusted for any over-levies or under-levies of the prior year.
(I) DECOMMISSIONING OBLIGATION
The City’s oil and gas production activities give rise to dismantling, decommissioning and site disturbance remediation activities. Provision is made for the estimated cost of abandonment and site restoration and capitalized in the relevant asset category. Decommissioning obligations are measured at the present value of management’s best estimate of the expenditure required to settle the present obligation as at the reporting date. Subsequent to the initial measurement, the obligation is adjusted at the end of each period to reflect the passage of time and changes in the estimated future cash flows underlying the obligation. The increase in the provision due to the passage of time is recognized as accretion whereas the increase/decrease due to changes in the estimated future cash flows or changes in the discount rate are capitalized. Actual costs incurred upon settlement of the decommissioning obligations are charged against the provision to the extent the provision was established.
(J) LANDFILL CLOSURE AND POST-CLOSURE LIABILITY
Pursuant to the Alberta Environmental Protection and Enhancement Act, the City is required to fund the closure of its landfill site and provide for post-closure care of the facility. Closure and post-closure activities include the final clay cover and landscaping, as well as surface and ground water monitoring, leachate control and visual inspection. This requirement is being provided for over the estimated remaining life of the landfill site based on usage.
(K) NON-FINANCIAL ASSETS
Non-financial assets are not available to discharge existing liabilities and are held for use in the provision of goods and services. They have useful lives extending beyond the current year and are not intended for sale in the ordinary course of operations. The change in non-financial assets during the year, together with the excess of revenues over expenses, provides the consolidated change in net financial assets for the year.
NOTES For the year ended December 31, 2016
(In thousands of dollars)
City of Medicine Hat, Alberta Page 30 2016 Financial Report
1. Tangible Capital Assets
Tangible capital assets are recorded at cost which includes all amounts that are directly attributable to acquisition, construction, development or betterment of an asset.
Government contributions for the acquisition of capital assets are recorded as revenue in the Consolidated Statement of Operations and do not reduce the related capital assets costs. Tangible capital assets at cost less residual value, in Municipal Services, the Electric Utility, Environmental Utilities, Land, and non-resource plant, property and equipment in the Gas Utility are amortized on a straight line basis over their estimated useful lives as follows:
Land Improvements 4 to 25 years
Buildings 15 to 50 years
Engineered Structures 7 to 75 years
Machinery & Equipment 5 to 25 years
Vehicles 7 to 20 years
Carrying costs directly attributable to the acquisition, construction, development, or betterment, excluding interest costs, are capitalized to the point in time the asset is substantially complete and ready for use. Assets under construction are not amortized until the asset is available for use.
2. Oil & Gas Exploration and Evaluation (E&E) Assets and Property, Plant and Equipment (PP&E)
As the Public Sector Accounting Standards (PSAS) is silent on the treatment of resource properties; to better reflect the operations of the oil and gas properties and to provide more financial transparency, the City has elected to adopt the guidance provided under International Financial Reporting Standards (IFRS).
(i) Exploration and Evaluation (E&E) Assets
Costs incurred prior to acquiring the legal right to explore an area are charged directly to net income.
Costs incurred after the legal right to explore is obtained but before technical feasibility and commercial viability of the area has been established are capitalized as E&E assets. These costs generally include unproved property acquisition costs, geological and geophysical costs, sampling and appraisals, related drilling and completion costs and directly attributable internal costs.
Once an area is determined to be technically feasible and commercially viable the accumulated costs are tested for impairment. The carrying value, net of any impairment, is then reclassified to PP&E as a Developed and Producing (D&P) asset. If an area is determined not to be technically feasible and commercially viable, or the City discontinues its exploration and evaluation activity, any unrecoverable costs are charged to net income.
(ii) Property, Plant and Equipment (PP&E) Assets
Items of property, plant and equipment, which include oil and gas development and production assets, are measured at cost less accumulated depletion, depreciation and impairment losses. The cost of D&P assets includes transfers from exploration and evaluation assets, the cost to complete and tie-in the wells, facility costs, the cost of recognizing provisions for future restoration and decommissioning geological and geophysical costs, and directly attributable overheads.
D&P assets are grouped into cash generating units (CGU) for impairment testing. The City has grouped its development and production assets into the 11 CGUs. When significant parts of an item of property, plant and equipment, including oil and natural gas interests, have different useful lives, they are accounted for as separate items (major components).
NOTES For the year ended December 31, 2016
(In thousands of dollars)
City of Medicine Hat, Alberta Page 31 2016 Financial Report
Gains and losses on disposal of an item of property, plant and equipment, including oil and natural gas interests, are determined by comparing the proceeds from disposal with the carrying amount of property, plant and equipment and are recognized in the statement of operations.
(iii) Subsequent Costs
Costs incurred subsequent to the determination of technical feasibility and commercial viability and the costs of replacing parts of property, plant and equipment are recognized as oil and natural gas interests only when they increase the future economic benefits embodied in the specific asset to which they relate. All other expenditures are recognized in net earnings as incurred. Such capitalized oil and natural gas interests generally represent costs incurred in developing proved and/or probable reserves and bringing in or enhancing production from such reserves, and are accumulated on a field or geotechnical area basis. The carrying amount of any replaced or sold component is derecognized. The costs of the day-to-day servicing of property, plant and equipment are recognized in operating expenses as incurred.
Depletion and Depreciation
The net carrying value of development and production assets is depleted using the unit of production method by reference to the ratio of production in the period to the related total proved and probable reserves, taking into account estimated future development costs necessary to bring those reserves into production and the estimated salvage value of the assets at the end of their useful lives. Future development costs are estimated taking into account the level of development required to produce the reserves.
Proved and probable reserves are reviewed a minimum of every three years (or sooner if there is a major acquisition or some other significant event) by independent qualified reserve evaluators and represent the estimated quantities of crude oil, natural gas and natural gas liquids which geological, geophysical and engineering data demonstrate with a specified degree of certainty to be recoverable in future years from known reservoirs and which are considered commercially producible.
(iv) Impairment
E&E Assets:
E&E assets are tested for impairment when indicators of impairment exist or when technical feasibility and commercial viability are established and the assets are reclassified to PP&E. The impairment test compares the E&E assets’ carrying value to their recoverable amount plus any excess recoverable amounts on D&P assets. E&E assets that are determined not to be technically feasible and commercially viable are charged to net income.
PP&E:
The carrying amounts of the City’s oil & gas related non-financial assets are reviewed at each reporting date to determine whether there is any indication of impairment. If any such indication exists, then the asset’s recoverable amount is estimated. For the purpose of impairment testing, assets are grouped into cash generating units (CGU), the smallest group of assets that generate cash inflows from continuing use that are largely independent of the cash inflows of other assets or groups or assets. The recoverable amount of an asset or a CGU is the greater of its value in use or its fair value less cost to sell.
Fair value less cost to sell is determined as the amount that would be obtained from the sale of a CGU in an arm’s length transactions between knowledgeable and willing parties. The fair value less cost to sell of oil and gas assets is generally determined as the net present value of the estimated future cash flows expected to arise from the continued use of the CGU, including any expansion prospects, and its eventual disposal, using assumptions that an independent market participant may take into account. These cash flows are discounted by an appropriate discount rate which would be applied by such a market participant to arrive at a net present value of the CGU.
NOTES For the year ended December 31, 2016
(In thousands of dollars)
City of Medicine Hat, Alberta Page 32 2016 Financial Report
Value in use is determined as the net present value of the estimated future cash flows expected to arise from the continued use of the asset in its present form and its eventual disposal. Value in use is determined by applying assumptions specific to the City’s continued use and can only take into account approved future development costs. Estimates of future cash flows used in the evaluation of impairment of assets are made using management’s forecasts of commodity prices and expected production volumes. The latter takes into account assessments of field reservoir performance and includes expectations about proven and unproven volumes, which are risk-weighted utilizing geological, production, recovery and economic projections.
An impairment loss is recognized if the carrying amount of a CGU exceeds its estimated recoverable amount. Impairment losses are recognized in the statement of operations. Impairment losses recognized in respect of CGUs are allocated first to reduce the carrying amount of any goodwill allocated to the CGU and then to reduce the carrying amounts of the other assets in the CGU on a pro rata basis.
Reversals of impairments are recognized when factors or circumstances that triggered the original impairment have changed. Impairments can only be reversed in future periods up to the carrying amount that would have been determined, net of depletion and depreciation, had no impairment losses been previously recognized. Goodwill impairments are not reversed.
3. Contribution of Tangible Capital Assets
Contributions of tangible capital assets are recorded at estimated fair market value at the date of contribution and are recorded as revenue.
4. Historical Assets
The City has works of art, museum collections, archives and various cultural and historic treasures that have aesthetic and historic value that are worth preserving perpetually. These items are not recognized in the tangible capital asset records because a reasonable estimate of the future economic benefit associated with these items cannot be made.
(L) USE OF ESTIMATES AND JUDGEMENT
The preparation of financial statements in conformity with Canadian Public Sector Accounting Standards requires management to make estimates and assumptions that affect the reported amount of assets and liabilities and disclosure of contingent assets and liabilities as at the date of the financial statements, and the reported amounts of revenue and expenses during the year. Significant areas requiring the use of management estimates relate to the determination of employee benefit plans, allowance for doubtful accounts, provision for contingencies and prior year tangible capital asset historical costs and related amortization.
The City uses significant estimates with regards to the accounting for its operations. Significant estimates related to those operations are outlined below. 1. Gas Utility
Amounts recorded for depletion and depreciation and amounts used for impairment calculations are based on estimates of oil and natural gas reserves and future prices and costs required to develop those reserves. The estimates of reserves are subject to measurement uncertainty including estimates of future prices, costs, discount rates and related cash flows. The impact of this measurement uncertainty could be material to the financial statements in future periods. Estimates and underlying assumptions are reviewed on an ongoing basis. Revisions to accounting estimates are recognized in the year in which the estimates are revised and in any future periods affected.
NOTES For the year ended December 31, 2016
(In thousands of dollars)
City of Medicine Hat, Alberta Page 33 2016 Financial Report
Amounts recorded for decommissioning obligations and the related accretion expense requires the use of estimates with respect to the amount and timing of decommissioning expenditures. Other provisions are recognized in the period when it becomes probable that there will be a future cash outflow.
IFRS requires that the City’s oil and gas assets be aggregated into cash generating units, based on their ability to generate largely independent cash flows, which are used to assess the assets for impairment. The determination of the City’s cash generating units is subject to management’s judgment.
Where measurement uncertainty exists, the financial statements have been prepared within reasonable limits of materiality. Actual results could differ from those estimates.
2. Liability for Contaminated Sites
Contaminated sites are a result of contamination being introduced into the air, soil, water or sediment of a chemical, organic or radioactive material or live organism that exceeds an environmental standard. Net costs to remediate include, but are not limited to: assessment costs, maintenance and monitoring costs, and internal and external direct operating and/or capital costs relating to remediation and/or reclamation.
Amounts recorded for remediation efforts on contaminated sites are based on estimates of costs required to assess and risk manage or remediate. The cost, prediction, and timing of future outflow estimates are based on a combination of in house expertise, judgment and assumptions, past experience, and external quotes and are subject to measurement uncertainty. The recognition of the liability assumes the City is responsible or accepts responsibility for the contamination and that it will incur future costs to remediate. The impact of this measurement uncertainty could be material to the financial statements in future periods. Estimates and underlying assumptions are reviewed on an ongoing basis. Revisions to accounting estimates are recognized in the year in which the estimates are revised and in any future periods affected. Where measurement uncertainty exists, the financial statements have been prepared within reasonable limits of materiality. Actual results could differ from those estimates.
Liabilities for contaminated sites are included in other long term liabilities in the Consolidated Statement of Financial Position (note 14C).
(M) FUTURE ACCOUNTING CHANGES
1. Related Party and Inter-Entity Transactions
PSAS approved PS 3420 and PS 2200 which come into effect for fiscal years beginning on or after April 1, 2017. This section is to be adopted prospectively. PS 2200 provides guidance on the recognition, measurement, presentation and disclosure of related party transactions. PS 3420 provides guidance on transactions between public sector entities that comprise a government’s reporting entity from both a provider and recipient perspective. This section is to be adopted prospectively. The City has not yet adopted this standard or determined the effect on the Financial Statements.
2. Assets, Contingent Assets
PSAS approved PS 3210 and 3320 which come into effect for fiscal years beginning on or after April 1, 2017. PS 3210 provides guidance on applying definitions of assets per PS 1000, and establishes disclosure requirements for assets. PS 3320 provides guidance on definitions of and disclosure of contingent assets; possible assets arising from existing conditions or situations involving uncertainty. The City has not yet adopted this standard or determined the effect on the Financial Statements.
NOTES For the year ended December 31, 2016
(In thousands of dollars)
City of Medicine Hat, Alberta Page 34 2016 Financial Report
3. Contractual Rights
PSAS approved PS 3380 which comes into effect for fiscal years beginning on or after April 1, 2017. This section is to be adopted prospectively. PS 3380 provides guidance on the disclosure standards for contractual rights, including the nature of the rights, their extent and timing. The City has not yet adopted this standard or determined the effect on the Financial Statements.
4. Restructuring Transactions
PSAS approved PS 3430 which comes into effect for fiscal years beginning on or after April 1, 2018. PS 3430 provides guidance on how to account for and report restructuring transactions by both transferors and recipients of assets and/or liabilities, along with related operating or program responsibilities. This section is to be adopted prospectively. The City has not yet adopted this standard or determined the effect on the Financial Statements.
5. Financial Instruments, Foreign Currency Translation and Financial Statement Presentation
PSAS 1201 comes into effect for fiscal years beginning on or after April 1, 2019. This includes adoption of PS 3450, Financial Instruments, PS 2601, Foreign Currency Translation and PS 1201 Financial Statement Presentation. While early adoption is permitted, all three of the standards must be adopted in the same year. PS 3450 provides guidance on the recognition, measurement, presentation and disclosure of financial instruments including derivative instruments. The standard requires fair value measurements of derivative instruments and equity instruments; all other financial instruments can be measured at either cost or fair value depending upon elections made by the City. Unrealized gains and losses will be presented on the new statement of re-measurement gains and losses arising from the adoption of PS 1201. There will also be a requirement to disclose the nature and extent of risks arising from financial instruments and clarification is given for de-recognition of financial liabilities.
PS 2601 Foreign Currency Translation establishes guidance on the recognition, measurement, presentation and disclosure of assets and liabilities denominated in foreign currencies. The Section requires monetary assets and liabilities, denominated in a foreign currency and non-monetary items at fair value denominated in a foreign currency to be adjusted to reflect the exchange rates in effect at the financial statement date. The resulting unrealized gains and losses are to be presented in the new statement of re-measurement gains and losses.
PS 1201 Financial Statement Presentation includes the addition of a new statement outlining re-measurement gains and losses. This new statement will include the unrealized gains and losses arising from the re-measurement of financial instruments and items denominated in foreign currency. The City has not yet adopted these standards or determined the effect on the Financial Statements.
6. Portfolio Investments
PSAS 3041 comes into effect for fiscal years beginning on or after April 1, 2019. Early adoption is permitted, however this standard must be adopted at the same time as PSAS Section 2601 and PSAS Section 3450. This section is to be adopted prospectively. This section replaces the existing PSAS Section 3040 Portfolio Investments. This section is similar to PSAS Section 3040 with amendments to conform with PSAS Section 3450 referred to above. The new sections provide for the removal of the distinction between temporary and portfolio investments, with the implication that when temporary investments are not cash equivalents they are accounted for as portfolio investments. This section also provides for pooled investment funds to be included within this section. When the City adopts PSAS Section 3450, it will need to account for any interest in pooled investment funds in accordance with this section as well as Section 3450. This entails an examination of the rights associated with units within a pooled investment fund, rather than the funds underlying the investment. The City has not yet adopted these standards or determined the effect on the Financial Statements.
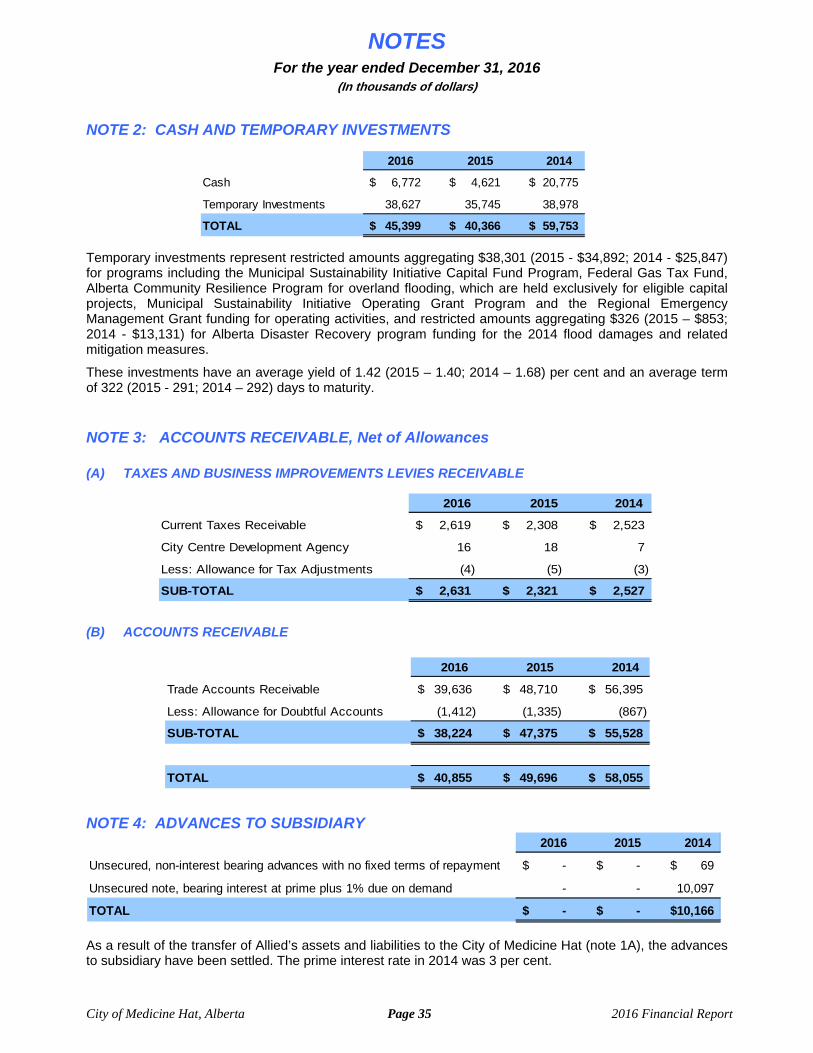
NOTES For the year ended December 31, 2016
(In thousands of dollars)
City of Medicine Hat, Alberta Page 35 2016 Financial Report
NOTE 2: CASH AND TEMPORARY INVESTMENTS
Temporary investments represent restricted amounts aggregating $38,301 (2015 - $34,892; 2014 - $25,847) for programs including the Municipal Sustainability Initiative Capital Fund Program, Federal Gas Tax Fund, Alberta Community Resilience Program for overland flooding, which are held exclusively for eligible capital projects, Municipal Sustainability Initiative Operating Grant Program and the Regional Emergency Management Grant funding for operating activities, and restricted amounts aggregating $326 (2015 – $853; 2014 - $13,131) for Alberta Disaster Recovery program funding for the 2014 flood damages and related mitigation measures.
These investments have an average yield of 1.42 (2015 – 1.40; 2014 – 1.68) per cent and an average term of 322 (2015 - 291; 2014 – 292) days to maturity.
NOTE 3: ACCOUNTS RECEIVABLE, Net of Allowances
(A) TAXES AND BUSINESS IMPROVEMENTS LEVIES RECEIVABLE
(B) ACCOUNTS RECEIVABLE
NOTE 4: ADVANCES TO SUBSIDIARY
As a result of the transfer of Allied’s assets and liabilities to the City of Medicine Hat (note 1A), the advances to subsidiary have been settled. The prime interest rate in 2014 was 3 per cent.
2016 2015 2014
Cash 6,772$ 4,621$ 20,775$
Temporary Investments 38,627 35,745 38,978
TOTAL 45,399$ 40,366$ 59,753$
2016 2015 2014
Current Taxes Receivable 2,619$ 2,308$ 2,523$
City Centre Development Agency 16 18 7
Less: Allowance for Tax Adjustments (4) (5) (3)
SUB-TOTAL 2,631$ 2,321$ 2,527$
2016 2015 2014
Trade Accounts Receivable 39,636$ 48,710$ 56,395$
Less: Allowance for Doubtful Accounts (1,412) (1,335) (867)
SUB-TOTAL 38,224$ 47,375$ 55,528$
TOTAL 40,855$ 49,696$ 58,055$
2016 2015 2014
Unsecured, non-interest bearing advances with no fixed terms of repayment -$ -$ 69$
Unsecured note, bearing interest at prime plus 1% due on demand - - 10,097
TOTAL -$ -$ 10,166$
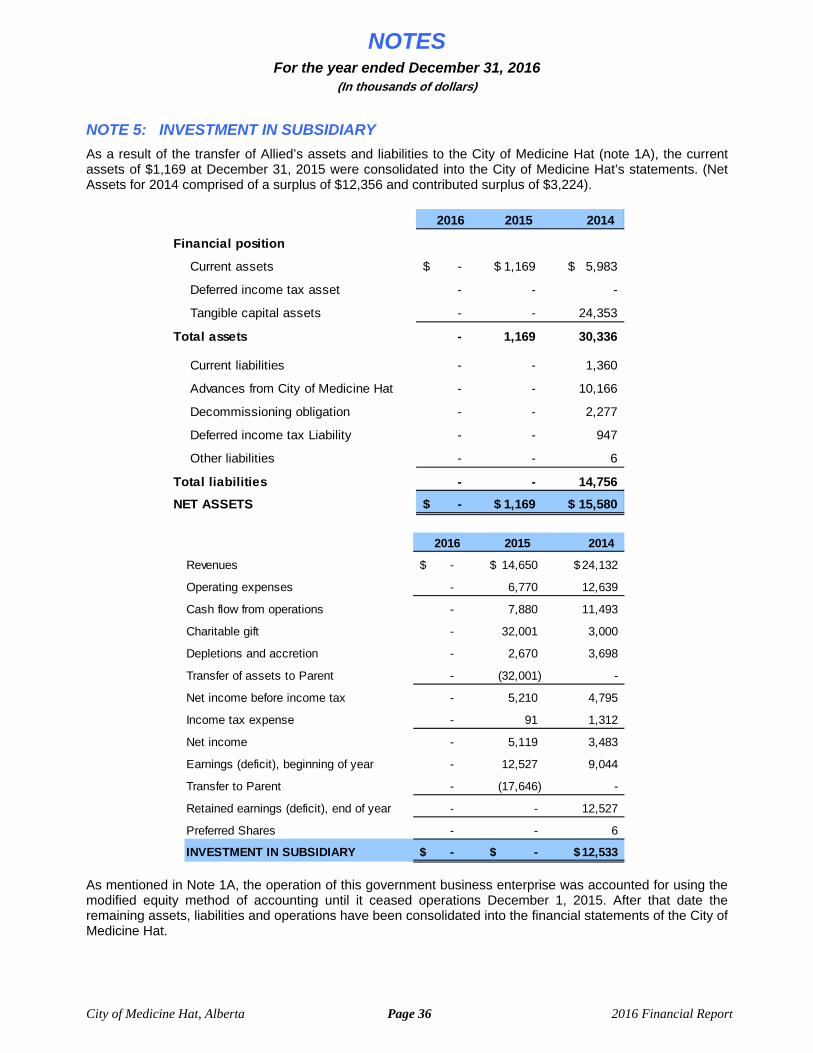
NOTES For the year ended December 31, 2016
(In thousands of dollars)
City of Medicine Hat, Alberta Page 36 2016 Financial Report
NOTE 5: INVESTMENT IN SUBSIDIARY
As a result of the transfer of Allied’s assets and liabilities to the City of Medicine Hat (note 1A), the current assets of $1,169 at December 31, 2015 were consolidated into the City of Medicine Hat’s statements. (Net Assets for 2014 comprised of a surplus of $12,356 and contributed surplus of $3,224).
As mentioned in Note 1A, the operation of this government business enterprise was accounted for using the modified equity method of accounting until it ceased operations December 1, 2015. After that date the remaining assets, liabilities and operations have been consolidated into the financial statements of the City of Medicine Hat.
2016 2015 2014
Financial position
Current assets -$ 1,169$ 5,983$
Deferred income tax asset - - -
Tangible capital assets - - 24,353
Total assets - 1,169 30,336
Current liabilities - - 1,360
Advances from City of Medicine Hat - - 10,166
Decommissioning obligation - - 2,277
Deferred income tax Liability - - 947
Other liabilities - - 6
Total liabilities - - 14,756
NET ASSETS -$ 1,169$ 15,580$
2016 2015 2014
Revenues -$ 14,650$ 24,132$
Operating expenses - 6,770 12,639
Cash flow from operations - 7,880 11,493
Charitable gift - 32,001 3,000
Depletions and accretion - 2,670 3,698
Transfer of assets to Parent - (32,001) -
Net income before income tax - 5,210 4,795
Income tax expense - 91 1,312
Net income - 5,119 3,483
Earnings (deficit), beginning of year - 12,527 9,044
Transfer to Parent - (17,646) -
Retained earnings (deficit), end of year - - 12,527
Preferred Shares - - 6
INVESTMENT IN SUBSIDIARY -$ -$ 12,533$
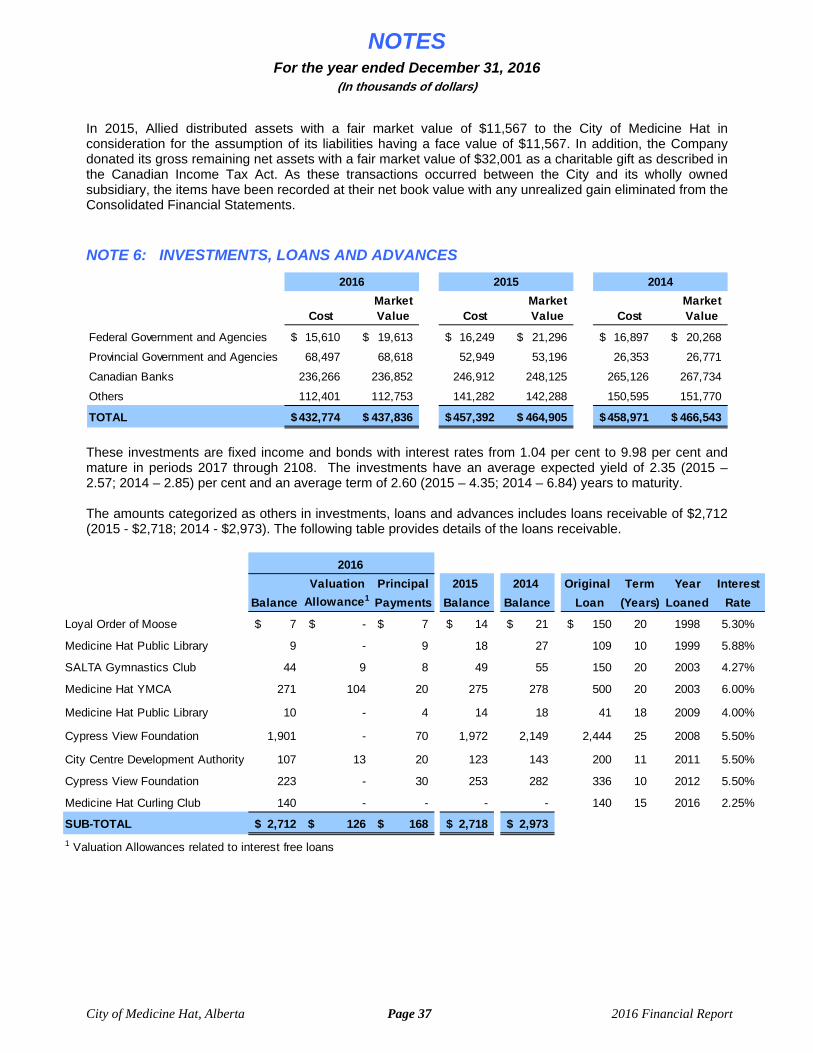
NOTES For the year ended December 31, 2016
(In thousands of dollars)
City of Medicine Hat, Alberta Page 37 2016 Financial Report
In 2015, Allied distributed assets with a fair market value of $11,567 to the City of Medicine Hat in consideration for the assumption of its liabilities having a face value of $11,567. In addition, the Company donated its gross remaining net assets with a fair market value of $32,001 as a charitable gift as described in the Canadian Income Tax Act. As these transactions occurred between the City and its wholly owned subsidiary, the items have been recorded at their net book value with any unrealized gain eliminated from the Consolidated Financial Statements.
NOTE 6: INVESTMENTS, LOANS AND ADVANCES
These investments are fixed income and bonds with interest rates from 1.04 per cent to 9.98 per cent and mature in periods 2017 through 2108. The investments have an average expected yield of 2.35 (2015 – 2.57; 2014 – 2.85) per cent and an average term of 2.60 (2015 – 4.35; 2014 – 6.84) years to maturity. The amounts categorized as others in investments, loans and advances includes loans receivable of $2,712 (2015 - $2,718; 2014 - $2,973). The following table provides details of the loans receivable.
Market Market Market Cost Value Cost Value Cost Value
Federal Government and Agencies 15,610$ 19,613$ 16,249$ 21,296$ 16,897$ 20,268$
Provincial Government and Agencies 68,497 68,618 52,949 53,196 26,353 26,771
Canadian Banks 236,266 236,852 246,912 248,125 265,126 267,734
Others 112,401 112,753 141,282 142,288 150,595 151,770
TOTAL 432,774$ 437,836$ 457,392$ 464,905$ 458,971$ 466,543$
20142016 2015
Valuation Principal 2015 2014 Original Term Year Interest
Balance Allowance1 Payments Balance Balance Loan (Years) Loaned Rate
Loyal Order of Moose 7$ -$ 7$ 14$ 21$ 150$ 20 1998 5.30%
Medicine Hat Public Library 9 - 9 18 27 109 10 1999 5.88%
SALTA Gymnastics Club 44 9 8 49 55 150 20 2003 4.27%
Medicine Hat YMCA 271 104 20 275 278 500 20 2003 6.00%
Medicine Hat Public Library 10 - 4 14 18 41 18 2009 4.00%
Cypress View Foundation 1,901 - 70 1,972 2,149 2,444 25 2008 5.50%
City Centre Development Authority 107 13 20 123 143 200 11 2011 5.50%
Cypress View Foundation 223 - 30 253 282 336 10 2012 5.50%
Medicine Hat Curling Club 140 - - - - 140 15 2016 2.25%
SUB-TOTAL 2,712$ 126$ 168$ 2,718$ 2,973$
1 Valuation Allowances related to interest free loans
2016
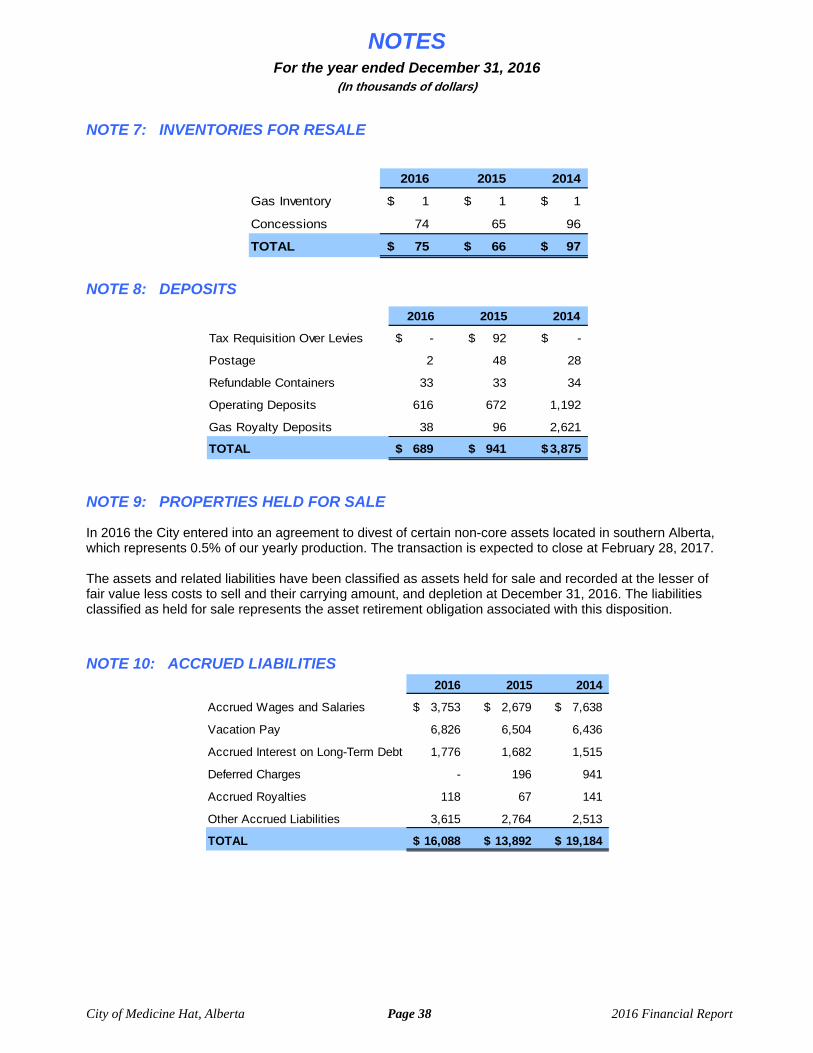
NOTES For the year ended December 31, 2016
(In thousands of dollars)
City of Medicine Hat, Alberta Page 38 2016 Financial Report
NOTE 7: INVENTORIES FOR RESALE
NOTE 8: DEPOSITS
NOTE 9: PROPERTIES HELD FOR SALE In 2016 the City entered into an agreement to divest of certain non-core assets located in southern Alberta, which represents 0.5% of our yearly production. The transaction is expected to close at February 28, 2017. The assets and related liabilities have been classified as assets held for sale and recorded at the lesser of fair value less costs to sell and their carrying amount, and depletion at December 31, 2016. The liabilities classified as held for sale represents the asset retirement obligation associated with this disposition. NOTE 10: ACCRUED LIABILITIES
2016 2015 2014
Gas Inventory 1$ 1$ 1$
Concessions 74 65 96
TOTAL 75$ 66$ 97$
2016 2015 2014
Tax Requisition Over Levies -$ 92$ -$
Postage 2 48 28
Refundable Containers 33 33 34
Operating Deposits 616 672 1,192
Gas Royalty Deposits 38 96 2,621
TOTAL 689$ 941$ 3,875$
2016 2015 2014
Accrued Wages and Salaries 3,753$ 2,679$ 7,638$
Vacation Pay 6,826 6,504 6,436
Accrued Interest on Long-Term Debt 1,776 1,682 1,515
Deferred Charges - 196 941
Accrued Royalties 118 67 141
Other Accrued Liabilities 3,615 2,764 2,513
TOTAL 16,088$ 13,892$ 19,184$
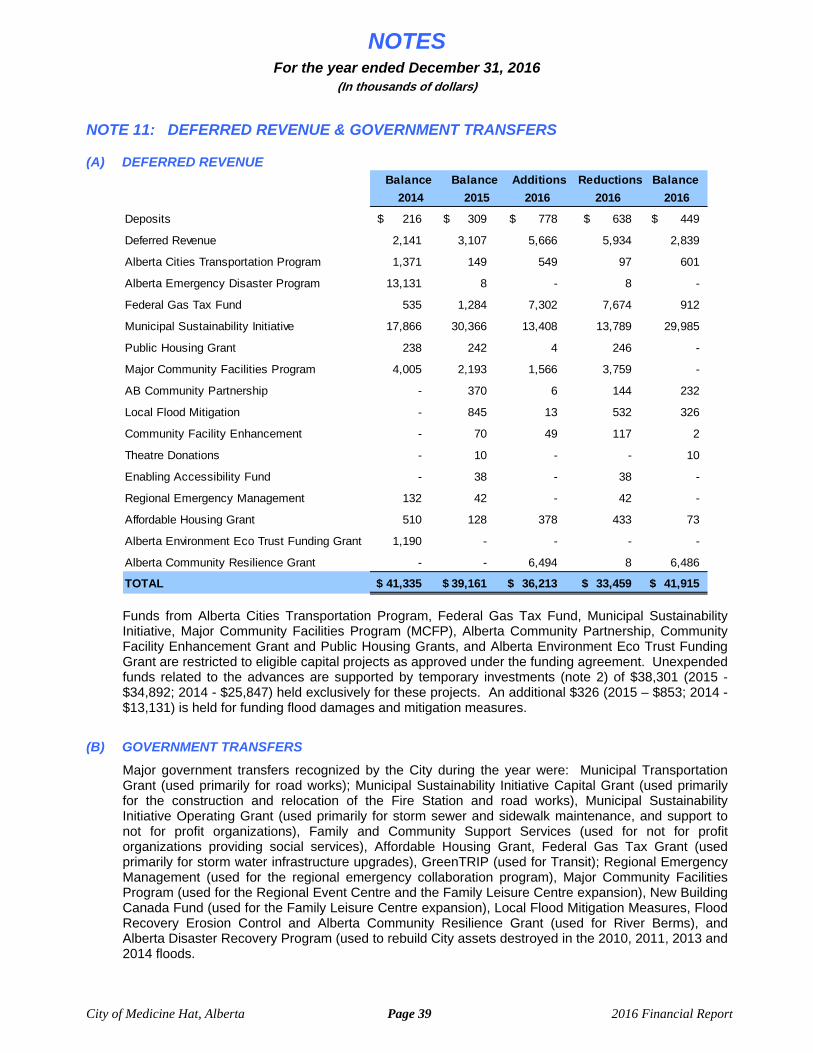
NOTES For the year ended December 31, 2016
(In thousands of dollars)
City of Medicine Hat, Alberta Page 39 2016 Financial Report
NOTE 11: DEFERRED REVENUE & GOVERNMENT TRANSFERS
(A) DEFERRED REVENUE
Funds from Alberta Cities Transportation Program, Federal Gas Tax Fund, Municipal Sustainability Initiative, Major Community Facilities Program (MCFP), Alberta Community Partnership, Community Facility Enhancement Grant and Public Housing Grants, and Alberta Environment Eco Trust Funding Grant are restricted to eligible capital projects as approved under the funding agreement. Unexpended funds related to the advances are supported by temporary investments (note 2) of $38,301 (2015 - $34,892; 2014 - $25,847) held exclusively for these projects. An additional $326 (2015 – $853; 2014 - $13,131) is held for funding flood damages and mitigation measures.
(B) GOVERNMENT TRANSFERS
Major government transfers recognized by the City during the year were: Municipal Transportation Grant (used primarily for road works); Municipal Sustainability Initiative Capital Grant (used primarily for the construction and relocation of the Fire Station and road works), Municipal Sustainability Initiative Operating Grant (used primarily for storm sewer and sidewalk maintenance, and support to not for profit organizations), Family and Community Support Services (used for not for profit organizations providing social services), Affordable Housing Grant, Federal Gas Tax Grant (used primarily for storm water infrastructure upgrades), GreenTRIP (used for Transit); Regional Emergency Management (used for the regional emergency collaboration program), Major Community Facilities Program (used for the Regional Event Centre and the Family Leisure Centre expansion), New Building Canada Fund (used for the Family Leisure Centre expansion), Local Flood Mitigation Measures, Flood Recovery Erosion Control and Alberta Community Resilience Grant (used for River Berms), and Alberta Disaster Recovery Program (used to rebuild City assets destroyed in the 2010, 2011, 2013 and 2014 floods.
2014 2015
Deposits 216$ 309$ 778$ 638$ 449$
Deferred Revenue 2,141 3,107 5,666 5,934 2,839
Alberta Cities Transportation Program 1,371 149 549 97 601
Alberta Emergency Disaster Program 13,131 8 - 8 -
Federal Gas Tax Fund 535 1,284 7,302 7,674 912
Municipal Sustainability Initiative 17,866 30,366 13,408 13,789 29,985
Public Housing Grant 238 242 4 246 -
Major Community Facilities Program 4,005 2,193 1,566 3,759 -
AB Community Partnership - 370 6 144 232
Local Flood Mitigation - 845 13 532 326
Community Facility Enhancement - 70 49 117 2
Theatre Donations - 10 - - 10
Enabling Accessibility Fund - 38 - 38 -
Regional Emergency Management 132 42 - 42 -
Affordable Housing Grant 510 128 378 433 73
Alberta Environment Eco Trust Funding Grant 1,190 - - - -
Alberta Community Resilience Grant - - 6,494 8 6,486
TOTAL 41,335$ 39,161$ 36,213$ 33,459$ 41,915$
Additions Reductions
2016 2016
Balance
2016
Balance Balance
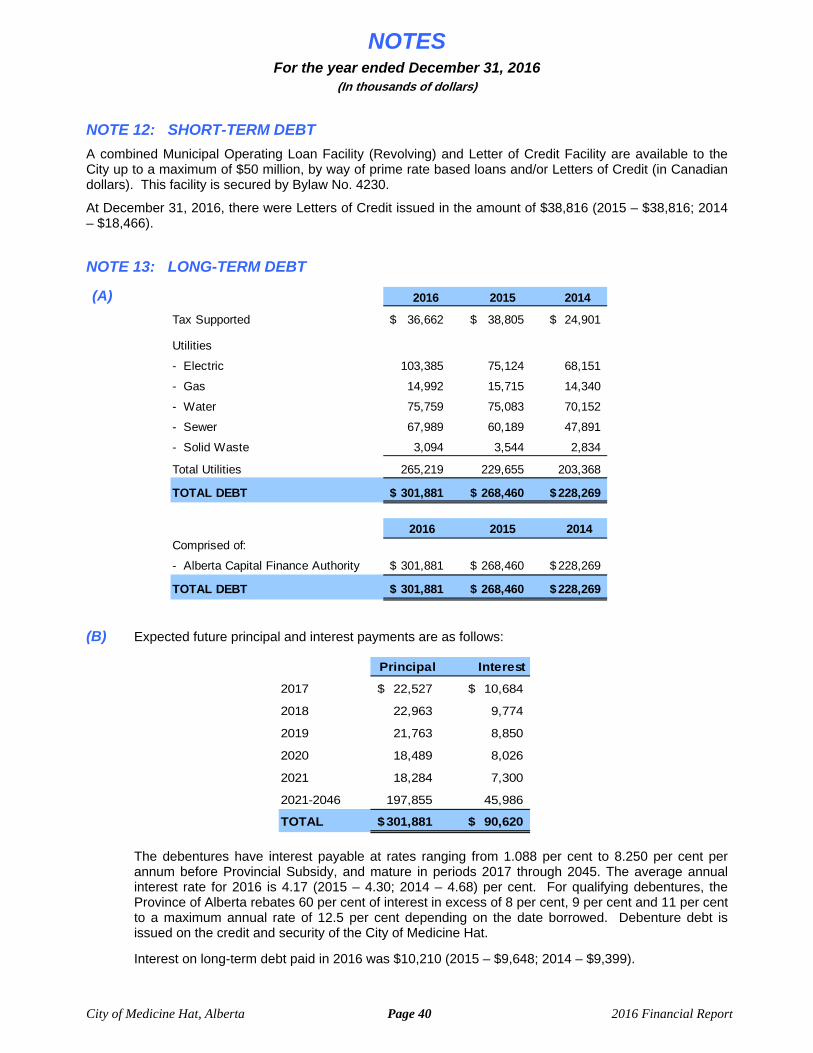
NOTES For the year ended December 31, 2016
(In thousands of dollars)
City of Medicine Hat, Alberta Page 40 2016 Financial Report
NOTE 12: SHORT-TERM DEBT
A combined Municipal Operating Loan Facility (Revolving) and Letter of Credit Facility are available to the City up to a maximum of $50 million, by way of prime rate based loans and/or Letters of Credit (in Canadian dollars). This facility is secured by Bylaw No. 4230.
At December 31, 2016, there were Letters of Credit issued in the amount of $38,816 (2015 – $38,816; 2014 – $18,466).
NOTE 13: LONG-TERM DEBT
(A)
(B) Expected future principal and interest payments are as follows:
The debentures have interest payable at rates ranging from 1.088 per cent to 8.250 per cent per annum before Provincial Subsidy, and mature in periods 2017 through 2045. The average annual interest rate for 2016 is 4.17 (2015 – 4.30; 2014 – 4.68) per cent. For qualifying debentures, the Province of Alberta rebates 60 per cent of interest in excess of 8 per cent, 9 per cent and 11 per cent to a maximum annual rate of 12.5 per cent depending on the date borrowed. Debenture debt is issued on the credit and security of the City of Medicine Hat.
Interest on long-term debt paid in 2016 was $10,210 (2015 – $9,648; 2014 – $9,399).
Principal Interest
2017 22,527$ 10,684$
2018 22,963 9,774
2019 21,763 8,850
2020 18,489 8,026
2021 18,284 7,300
2021-2046 197,855 45,986
TOTAL 301,881$ 90,620$
2016 2015 2014
Tax Supported 36,662$ 38,805$ 24,901$
Utilities
- Electric 103,385 75,124 68,151
- Gas 14,992 15,715 14,340
- Water 75,759 75,083 70,152
- Sewer 67,989 60,189 47,891
- Solid Waste 3,094 3,544 2,834
Total Utilities 265,219 229,655 203,368
TOTAL DEBT 301,881$ 268,460$ 228,269$
2016 2015 2014Comprised of:
- Alberta Capital Finance Authority 301,881$ 268,460$ 228,269$
TOTAL DEBT 301,881$ 268,460$ 228,269$
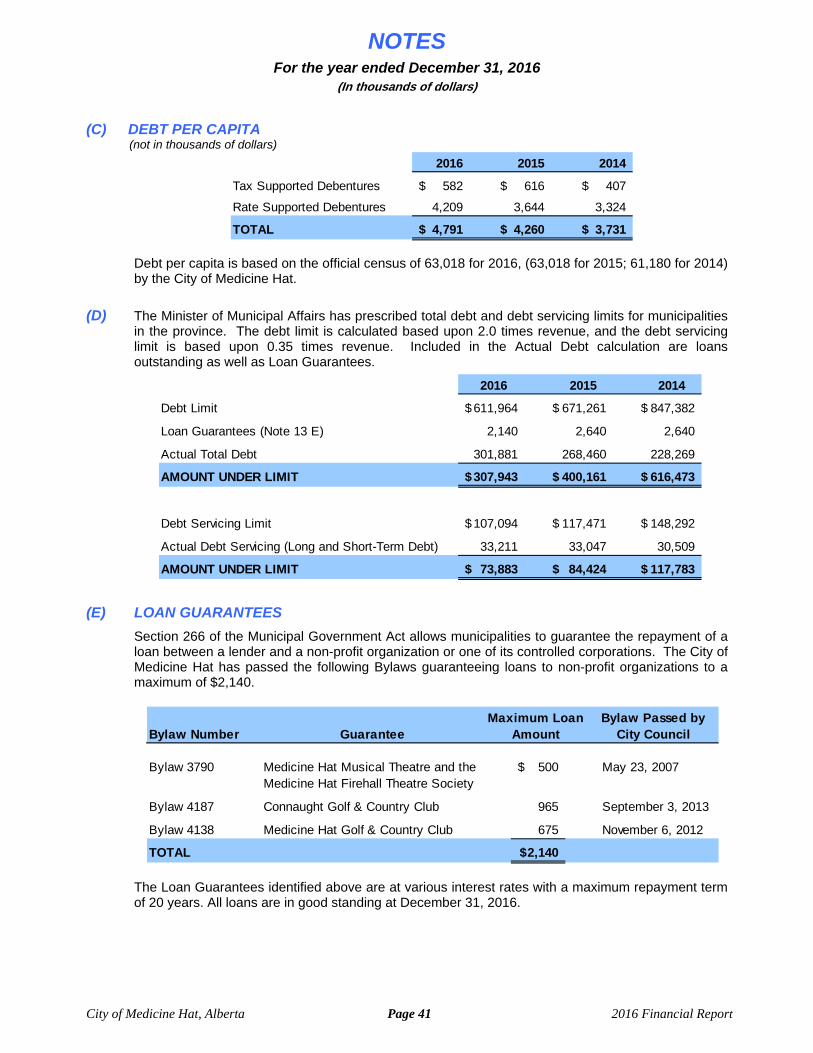
NOTES For the year ended December 31, 2016
(In thousands of dollars)
City of Medicine Hat, Alberta Page 41 2016 Financial Report
(C) DEBT PER CAPITA (not in thousands of dollars)
Debt per capita is based on the official census of 63,018 for 2016, (63,018 for 2015; 61,180 for 2014) by the City of Medicine Hat.
(D) The Minister of Municipal Affairs has prescribed total debt and debt servicing limits for municipalities in the province. The debt limit is calculated based upon 2.0 times revenue, and the debt servicing limit is based upon 0.35 times revenue. Included in the Actual Debt calculation are loans outstanding as well as Loan Guarantees.
(E) LOAN GUARANTEES
Section 266 of the Municipal Government Act allows municipalities to guarantee the repayment of a loan between a lender and a non-profit organization or one of its controlled corporations. The City of Medicine Hat has passed the following Bylaws guaranteeing loans to non-profit organizations to a maximum of $2,140.
The Loan Guarantees identified above are at various interest rates with a maximum repayment term of 20 years. All loans are in good standing at December 31, 2016.
2016 2015 2014
Tax Supported Debentures 582$ 616$ 407$
Rate Supported Debentures 4,209 3,644 3,324
TOTAL 4,791$ 4,260$ 3,731$
2016 2015 2014
Debt Limit 611,964$ 671,261$ 847,382$
Loan Guarantees (Note 13 E) 2,140 2,640 2,640
Actual Total Debt 301,881 268,460 228,269
AMOUNT UNDER LIMIT 307,943$ 400,161$ 616,473$
Debt Servicing Limit 107,094$ 117,471$ 148,292$
Actual Debt Servicing (Long and Short-Term Debt) 33,211 33,047 30,509
AMOUNT UNDER LIMIT 73,883$ 84,424$ 117,783$
Bylaw Number GuaranteeBylaw Passed by
City Council
Bylaw 3790 Medicine Hat Musical Theatre and the Medicine Hat Firehall Theatre Society
500$ May 23, 2007
Bylaw 4187 Connaught Golf & Country Club 965 September 3, 2013
Bylaw 4138 Medicine Hat Golf & Country Club 675 November 6, 2012
TOTAL 2,140$
Maximum Loan Amount

NOTES For the year ended December 31, 2016
(In thousands of dollars)
City of Medicine Hat, Alberta Page 42 2016 Financial Report
NOTE 14: OTHER LONG-TERM LIABILITIES
(A)
(B) At December 31, 2016 the estimated undiscounted cash flows required to settle the decommissioning obligations with respect to the Gas Utility were $426,552 (2015 - $400,387; 2014 – $314,349), calculated using an inflation rate of 1.88 (2015 - 2.16; 2014 – 2.26) per cent per annum. The estimated fair value of this liability was $265,275 (2015 - $247,956; 2014 – $186,069) after discounting the estimated cash flows at a rate of 5.34 (2015 - 5.18; 2014 – 5.36) per cent. At December 31, 2016, the expected timing of payment for settlement of the obligations ranges from 1 to 43 years.
(C) At December 31, 2016 the estimated undiscounted cash flows required to settle the contaminated sites were $300 (2015 – $365: 2014 – $0), calculated using an inflation rate of 1.88 (2015 – 1.10; 2014 – 0) per cent per annum. The estimated fair value of this liability was $289 (2015 – $347; 2014 – $0) after discounting the estimated cash flows at a rate of 2.31 (2015 – 2.15; 2014 – 0) per cent. The amount of anticipated recoveries included in this estimate is $nil.
The sources of the contamination for which the liability has been recorded include: a site where underground storage tanks with gas and diesel have leaked, a snow dump site where Tier 1 guidelines have been exceeded (contamination exceeds environmental standards for residential building), and a site where soil contaminated with Benzene has been identified. At December 31, 2016, the expected timing of payment for settlement of the obligations ranges from 1 to 10 years.
Another snow dump site has been identified as contaminated and will be assessed and remediated within the next few years. A liability for this site has not been recognized as estimated costs to clean up the site are not readily available or obtainable through analysis of historical or similar operations. The City of Medicine Hat will monitor the site until more information is revealed about the extent of such costs.
Operational sites which are still being used productively (Water Treatment Plant, Power Plant, Airport, fuelling stations) will be revaluated annually to determine if a decommissioning obligation is required. Factors which would require a decommissioning liability include, but are not limited to: a communicated plan to decommission, technological improvements, legislation changes, and the ability to sell or rent the operations to a third party.
(D) The accrued liability for closure and post closure costs of the City’s Landfill is recognized over the life
of the cells, using the net present value of the total estimated costs of closure and post closure care, prorated on the basis of the current air space utilized (in cubic meters), over the total estimated air space of the site. The net present value of the estimated closure and post closure costs was calculated using a rate of return equal to 3.37 (2015 - 3.19; 2014 - 3.18) per cent assuming inflation of 1.88 (2015 - 2.16; 2014 - 2.26) per cent.
2016 2015 2014
Offsite Contributions 1,930$ 3,011$ 3,088$
Asset Retirement Obligation - Gas 265,275 247,956 186,069
Contaminated Sites Abandonment & Restoration 289 347 -
Deferred Charges 1,379 1,330 1,732
Employee Retirement Benefits Liability (Note 21) 5,618 6,027 5,776
Sanitary Landfill - Site Abandonment and Restoration 4,754 5,185 4,991
TOTAL 279,245$ 263,856$ 201,656$

NOTES For the year ended December 31, 2016
(In thousands of dollars)
City of Medicine Hat, Alberta Page 43 2016 Financial Report
(E) The following summarizes the total net present value for the estimated costs of Sanitary Landfill closure and post closure care:
The total capacity of the site is estimated at 4,525,000 cubic meters. The estimated remaining capacity of the landfill site is 1,835,078 (2015 – 1,917,074; 2014 – 2,052,890) cubic meters. The existing landfill site is expected to reach capacity in approximately the year 2035. The City has not designated assets for settling closure or post closure liabilities.
NOTE 15: LAND HELD FOR FUTURE DEVELOPMENT
Land held for future development consists of costs relating to the acquisition and development of land the City plans to subdivide and sell in future years. Land included in this category is still in the planning and development stage and is not expected to be sold in the short-term.
NOTE 16: TANGIBLE CAPITAL ASSETS
The net book value of capital assets not being amortized and under construction changed by $16,367 (2015 – ($27,453); 2014 – $35,121). Contributed capital assets received and recognized in the year from developers for various infrastructure works and related land and parks, and recorded on the consolidated financial statements is $2,456 (2015 - $371; 2014 – $1,152). 2016 contributed capital assets relate primarily to private subdivision developers contributing storm systems, roads, curbs and sidewalks.
In 2016, the City did not capitalize any interest. The City did recognize an impairment of $13.6 million (2015 - $55.4 million; 2014 - $28.4 million) of which $13.4 million is related to the oil and gas assets as a result of the continually declining current and forward market commodity price for natural gas and oil; and $0.2 million is related to Land and Property assets as a result of flood damage.
2016 2015 2014
Estimated Closure Costs 9,360$ 8,935$ 8,935$
Estimated Post Closure Costs 3,685 3,667 3,718
Estimated Total Costs 13,045 12,602 12,653
Estimated Capacity remaining m3 (000's) 1,835 1,917 2,026
Portion of Total Liability remaining to be recognized 8,291 7,417 7,662
Estimated Capacity used m3 (000's) 2,690 2,608 2,499
ACCRUED LIABILITY PORTION 4,754$ 5,185$ 4,991$
Land 48,596$ 48,140$ 46,902$
Land Improvements 66,754 65,691 36,736
Buildings 236,480 222,315 195,460
Engineering Structures 720,738 673,734 652,124
Gas and Oil Properties 122,845 137,745 158,558
Machinery, Equipment and Furnishings 67,239 64,962 39,976
Vehicles 23,299 24,168 21,774
TOTAL 1,285,951$ 1,236,755$ 1,151,530$
2016 NetBook Value
2014 NetBook Value
2015 NetBook Value
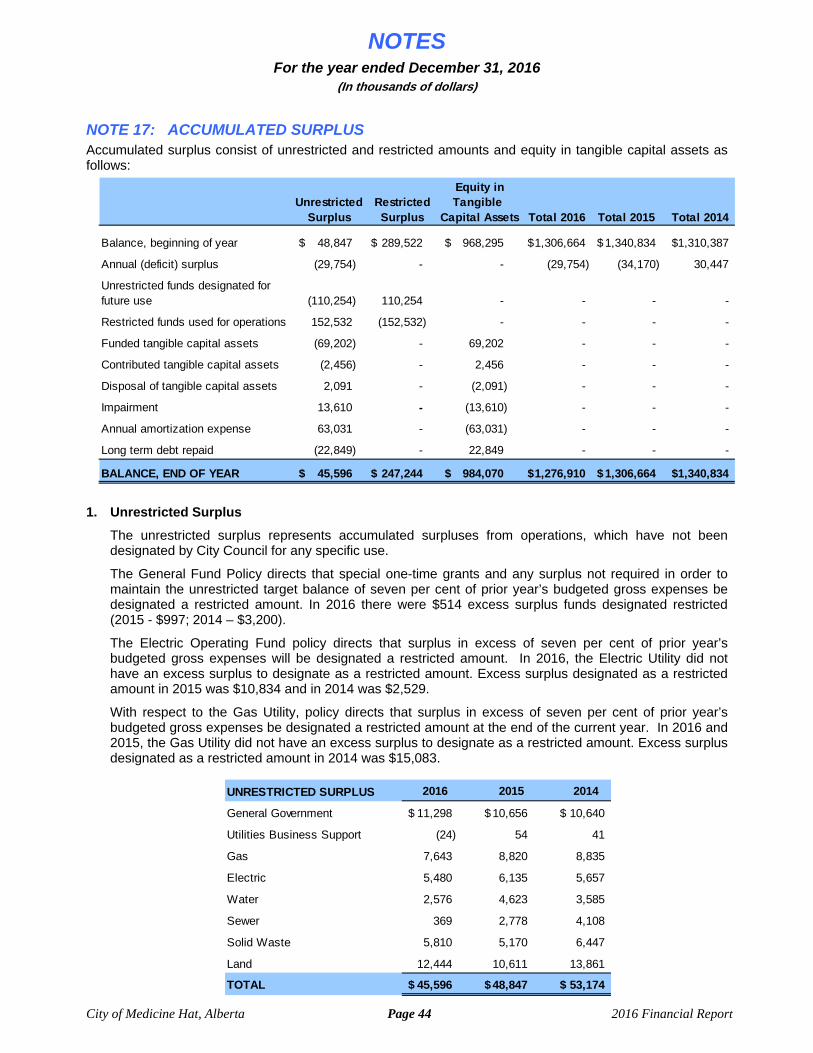
NOTES For the year ended December 31, 2016
(In thousands of dollars)
City of Medicine Hat, Alberta Page 44 2016 Financial Report
NOTE 17: ACCUMULATED SURPLUS Accumulated surplus consist of unrestricted and restricted amounts and equity in tangible capital assets as follows:
1. Unrestricted Surplus
The unrestricted surplus represents accumulated surpluses from operations, which have not been designated by City Council for any specific use.
The General Fund Policy directs that special one-time grants and any surplus not required in order to maintain the unrestricted target balance of seven per cent of prior year’s budgeted gross expenses be designated a restricted amount. In 2016 there were $514 excess surplus funds designated restricted (2015 - $997; 2014 – $3,200).
The Electric Operating Fund policy directs that surplus in excess of seven per cent of prior year’s budgeted gross expenses will be designated a restricted amount. In 2016, the Electric Utility did not have an excess surplus to designate as a restricted amount. Excess surplus designated as a restricted amount in 2015 was $10,834 and in 2014 was $2,529.
With respect to the Gas Utility, policy directs that surplus in excess of seven per cent of prior year’s budgeted gross expenses be designated a restricted amount at the end of the current year. In 2016 and 2015, the Gas Utility did not have an excess surplus to designate as a restricted amount. Excess surplus designated as a restricted amount in 2014 was $15,083.
Total 2016 Total 2015 Total 2014
Balance, beginning of year 48,847$ 289,522$ 968,295$ 1,306,664$ 1,340,834$ 1,310,387$
Annual (deficit) surplus (29,754) - - (29,754) (34,170) 30,447
(110,254) 110,254 - - - -
Restricted funds used for operations 152,532 (152,532) - - - -
Funded tangible capital assets (69,202) - 69,202 - - -
Contributed tangible capital assets (2,456) - 2,456 - - -
Disposal of tangible capital assets 2,091 - (2,091) - - -
Impairment 13,610 - (13,610) - - -
Annual amortization expense 63,031 - (63,031) - - -
Long term debt repaid (22,849) - 22,849 - - -
BALANCE, END OF YEAR 45,596$ 247,244$ 984,070$ 1,276,910$ 1,306,664$ 1,340,834$
Unrestricted funds designated for future use
Unrestricted Tangible RestrictedSurplus Capital AssetsSurplus
Equity in
UNRESTRICTED SURPLUS 2016 2015 2014
General Government 11,298$ 10,656$ 10,640$
Utilities Business Support (24) 54 41
Gas 7,643 8,820 8,835
Electric 5,480 6,135 5,657
Water 2,576 4,623 3,585
Sewer 369 2,778 4,108
Solid Waste 5,810 5,170 6,447
Land 12,444 10,611 13,861
TOTAL 45,596$ 48,847$ 53,174$
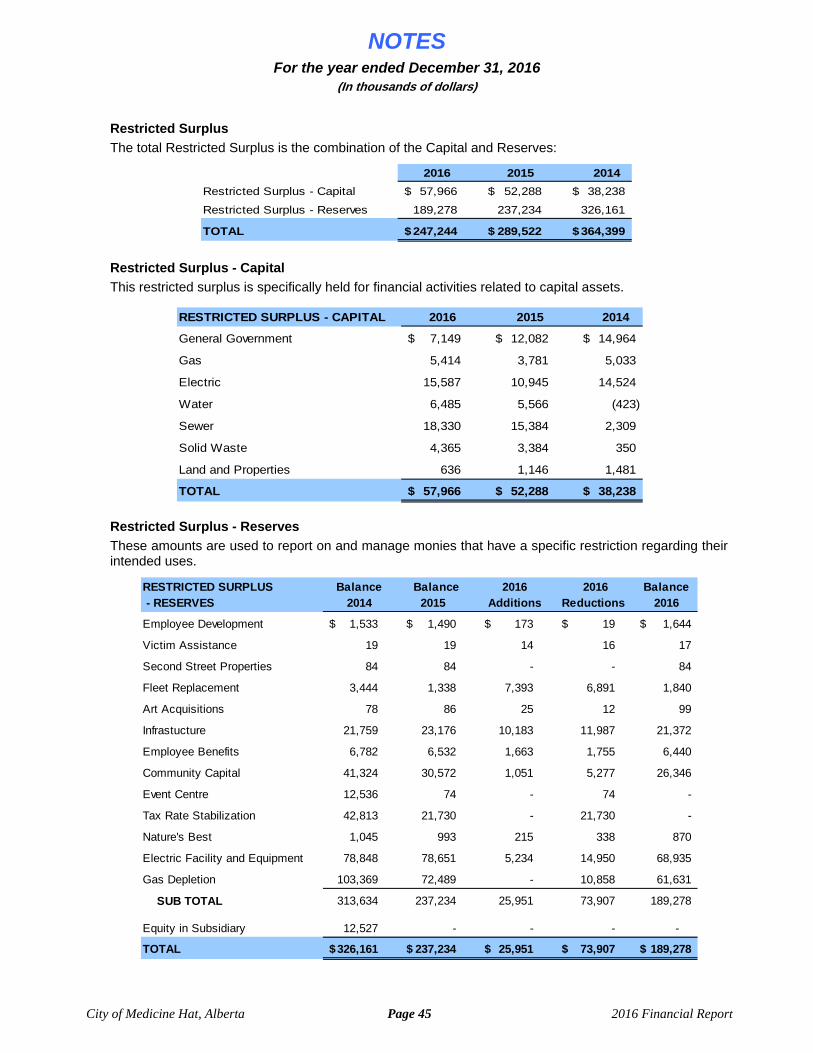
NOTES For the year ended December 31, 2016
(In thousands of dollars)
City of Medicine Hat, Alberta Page 45 2016 Financial Report
Restricted Surplus
The total Restricted Surplus is the combination of the Capital and Reserves:
Restricted Surplus - Capital
This restricted surplus is specifically held for financial activities related to capital assets.
Restricted Surplus - Reserves
These amounts are used to report on and manage monies that have a specific restriction regarding their intended uses.
2016 2015 2014
Restricted Surplus - Capital 57,966$ 52,288$ 38,238$
Restricted Surplus - Reserves 189,278 237,234 326,161
TOTAL 247,244$ 289,522$ 364,399$
RESTRICTED SURPLUS - CAPITAL 2016 2015 2014
General Government 7,149$ 12,082$ 14,964$
Gas 5,414 3,781 5,033
Electric 15,587 10,945 14,524
Water 6,485 5,566 (423)
Sewer 18,330 15,384 2,309
Solid Waste 4,365 3,384 350
Land and Properties 636 1,146 1,481
TOTAL 57,966$ 52,288$ 38,238$
RESTRICTED SURPLUS Balance Balance 2016 2016 Balance - RESERVES 2014 2015 Additions Reductions 2016
Employee Development 1,533$ 1,490$ 173$ 19$ 1,644$
Victim Assistance 19 19 14 16 17
Second Street Properties 84 84 - - 84
Fleet Replacement 3,444 1,338 7,393 6,891 1,840
Art Acquisitions 78 86 25 12 99
Infrastucture 21,759 23,176 10,183 11,987 21,372
Employee Benefits 6,782 6,532 1,663 1,755 6,440
Community Capital 41,324 30,572 1,051 5,277 26,346
Event Centre 12,536 74 - 74 -
Tax Rate Stabilization 42,813 21,730 - 21,730 -
Nature's Best 1,045 993 215 338 870
Electric Facility and Equipment 78,848 78,651 5,234 14,950 68,935
Gas Depletion 103,369 72,489 - 10,858 61,631
SUB TOTAL 313,634 237,234 25,951 73,907 189,278
Equity in Subsidiary 12,527 - - - -
TOTAL 326,161$ 237,234$ 25,951$ 73,907$ 189,278$
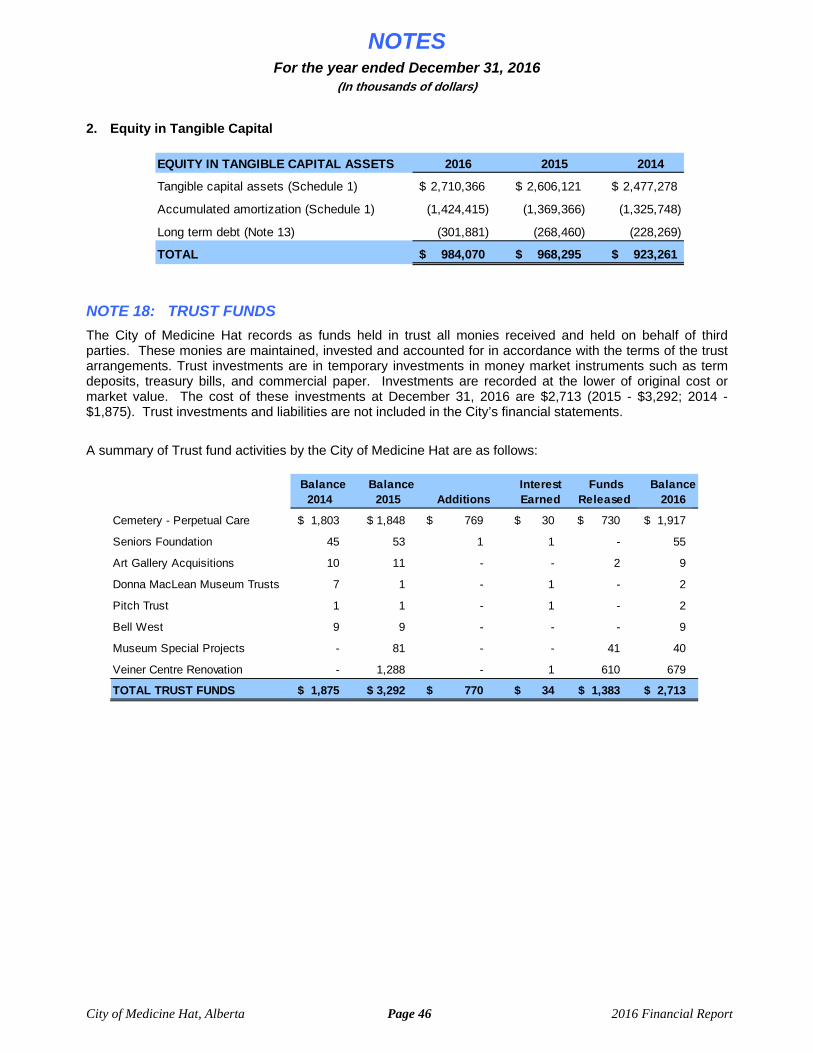
NOTES For the year ended December 31, 2016
(In thousands of dollars)
City of Medicine Hat, Alberta Page 46 2016 Financial Report
2. Equity in Tangible Capital
NOTE 18: TRUST FUNDS
The City of Medicine Hat records as funds held in trust all monies received and held on behalf of third parties. These monies are maintained, invested and accounted for in accordance with the terms of the trust arrangements. Trust investments are in temporary investments in money market instruments such as term deposits, treasury bills, and commercial paper. Investments are recorded at the lower of original cost or market value. The cost of these investments at December 31, 2016 are $2,713 (2015 - $3,292; 2014 - $1,875). Trust investments and liabilities are not included in the City’s financial statements.
A summary of Trust fund activities by the City of Medicine Hat are as follows:
EQUITY IN TANGIBLE CAPITAL ASSETS 2016 2015 2014
Tangible capital assets (Schedule 1) 2,710,366$ 2,606,121$ 2,477,278$
Accumulated amortization (Schedule 1) (1,424,415) (1,369,366) (1,325,748)
Long term debt (Note 13) (301,881) (268,460) (228,269)
TOTAL 984,070$ 968,295$ 923,261$
Balance Balance Funds 2014 2015
Cemetery - Perpetual Care 1,803$ 1,848$ 769$ 30$ 730$ 1,917$
Seniors Foundation 45 53 1 1 - 55
Art Gallery Acquisitions 10 11 - - 2 9
Donna MacLean Museum Trusts 7 1 - 1 - 2
Pitch Trust 1 1 - 1 - 2
Bell West 9 9 - - - 9
Museum Special Projects - 81 - - 41 40
Veiner Centre Renovation - 1,288 - 1 610 679
TOTAL TRUST FUNDS 1,875$ 3,292$ 770$ 34$ 1,383$ 2,713$
Additions Earned Released 2016 Interest Balance
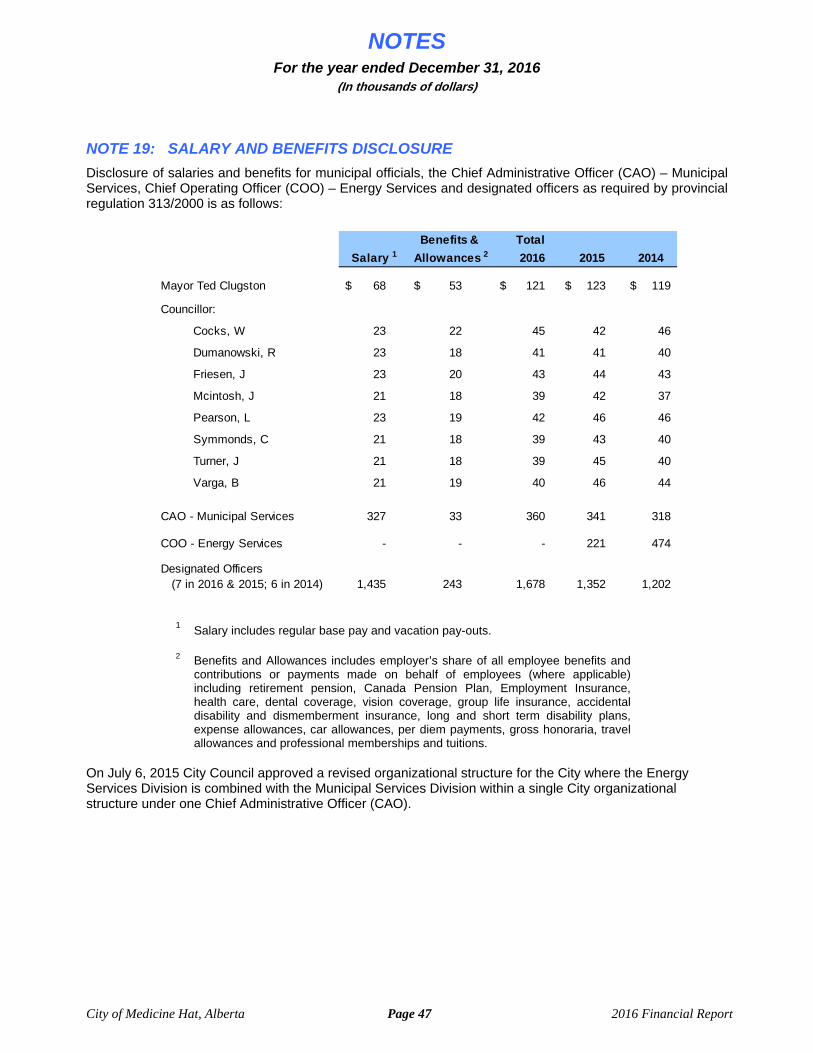
NOTES For the year ended December 31, 2016
(In thousands of dollars)
City of Medicine Hat, Alberta Page 47 2016 Financial Report
NOTE 19: SALARY AND BENEFITS DISCLOSURE
Disclosure of salaries and benefits for municipal officials, the Chief Administrative Officer (CAO) – Municipal Services, Chief Operating Officer (COO) – Energy Services and designated officers as required by provincial regulation 313/2000 is as follows:
1 Salary includes regular base pay and vacation pay-outs.
2 Benefits and Allowances includes employer’s share of all employee benefits and contributions or payments made on behalf of employees (where applicable) including retirement pension, Canada Pension Plan, Employment Insurance, health care, dental coverage, vision coverage, group life insurance, accidental disability and dismemberment insurance, long and short term disability plans, expense allowances, car allowances, per diem payments, gross honoraria, travel allowances and professional memberships and tuitions.
On July 6, 2015 City Council approved a revised organizational structure for the City where the Energy Services Division is combined with the Municipal Services Division within a single City organizational structure under one Chief Administrative Officer (CAO).
2014
Mayor Ted Clugston 68$ 53$ 121$ 123$ 119$
Councillor:
Cocks, W 23 22 45 42 46
Dumanowski, R 23 18 41 41 40
Friesen, J 23 20 43 44 43
Mcintosh, J 21 18 39 42 37
Pearson, L 23 19 42 46 46
Symmonds, C 21 18 39 43 40
Turner, J 21 18 39 45 40
Varga, B 21 19 40 46 44
CAO - Municipal Services 327 33 360 341 318
COO - Energy Services - - - 221 474
1,435 243 1,678 1,352 1,202 Designated Officers (7 in 2016 & 2015; 6 in 2014)
Benefits & Total
Salary 1 Allowances 2 2016 2015
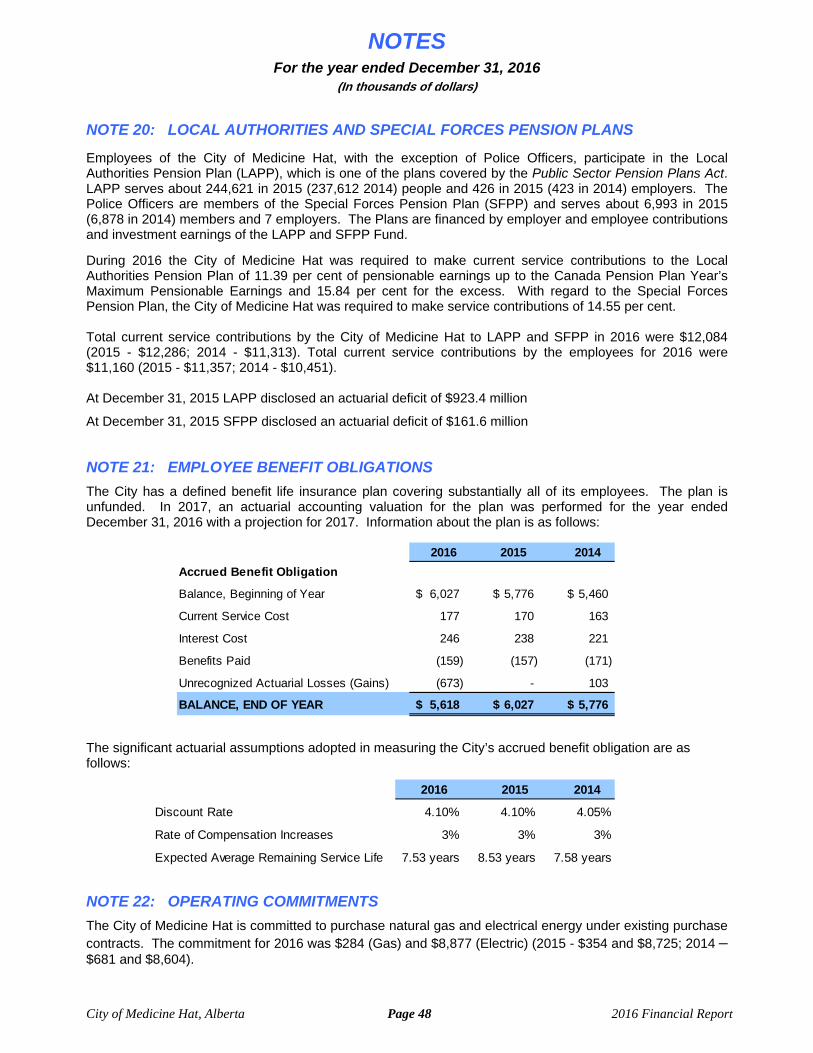
NOTES For the year ended December 31, 2016
(In thousands of dollars)
City of Medicine Hat, Alberta Page 48 2016 Financial Report
NOTE 20: LOCAL AUTHORITIES AND SPECIAL FORCES PENSION PLANS
Employees of the City of Medicine Hat, with the exception of Police Officers, participate in the Local Authorities Pension Plan (LAPP), which is one of the plans covered by the Public Sector Pension Plans Act. LAPP serves about 244,621 in 2015 (237,612 2014) people and 426 in 2015 (423 in 2014) employers. The Police Officers are members of the Special Forces Pension Plan (SFPP) and serves about 6,993 in 2015 (6,878 in 2014) members and 7 employers. The Plans are financed by employer and employee contributions and investment earnings of the LAPP and SFPP Fund.
During 2016 the City of Medicine Hat was required to make current service contributions to the Local Authorities Pension Plan of 11.39 per cent of pensionable earnings up to the Canada Pension Plan Year’s Maximum Pensionable Earnings and 15.84 per cent for the excess. With regard to the Special Forces Pension Plan, the City of Medicine Hat was required to make service contributions of 14.55 per cent. Total current service contributions by the City of Medicine Hat to LAPP and SFPP in 2016 were $12,084 (2015 - $12,286; 2014 - $11,313). Total current service contributions by the employees for 2016 were $11,160 (2015 - $11,357; 2014 - $10,451). At December 31, 2015 LAPP disclosed an actuarial deficit of $923.4 million
At December 31, 2015 SFPP disclosed an actuarial deficit of $161.6 million
NOTE 21: EMPLOYEE BENEFIT OBLIGATIONS
The City has a defined benefit life insurance plan covering substantially all of its employees. The plan is unfunded. In 2017, an actuarial accounting valuation for the plan was performed for the year ended December 31, 2016 with a projection for 2017. Information about the plan is as follows:
The significant actuarial assumptions adopted in measuring the City’s accrued benefit obligation are as follows:
NOTE 22: OPERATING COMMITMENTS
The City of Medicine Hat is committed to purchase natural gas and electrical energy under existing purchase contracts. The commitment for 2016 was $284 (Gas) and $8,877 (Electric) (2015 - $354 and $8,725; 2014 – $681 and $8,604).
2016 2015 2014
Accrued Benefit Obligation
Balance, Beginning of Year 6,027$ 5,776$ 5,460$
Current Service Cost 177 170 163
Interest Cost 246 238 221
Benefits Paid (159) (157) (171)
Unrecognized Actuarial Losses (Gains) (673) - 103
BALANCE, END OF YEAR 5,618$ 6,027$ 5,776$
2016 2015 2014
Discount Rate 4.10% 4.10% 4.05%
Rate of Compensation Increases 3% 3% 3%
Expected Average Remaining Service Life 7.53 years 8.53 years 7.58 years
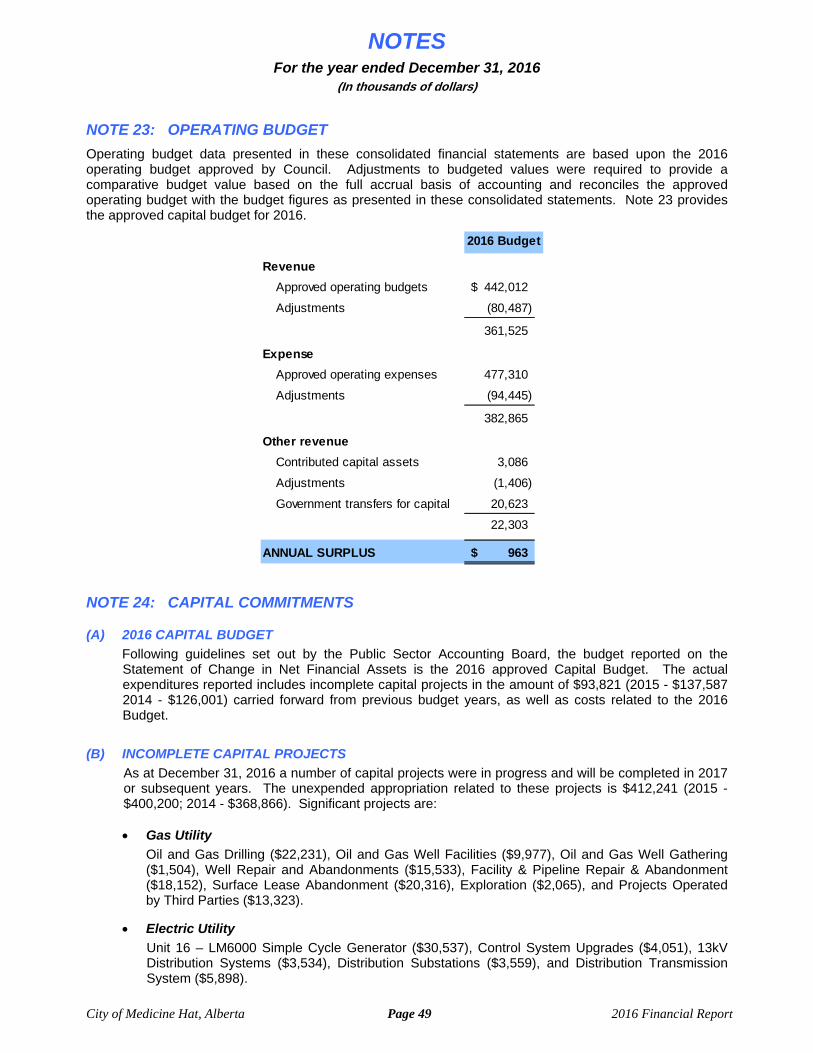
NOTES For the year ended December 31, 2016
(In thousands of dollars)
City of Medicine Hat, Alberta Page 49 2016 Financial Report
NOTE 23: OPERATING BUDGET
Operating budget data presented in these consolidated financial statements are based upon the 2016 operating budget approved by Council. Adjustments to budgeted values were required to provide a comparative budget value based on the full accrual basis of accounting and reconciles the approved operating budget with the budget figures as presented in these consolidated statements. Note 23 provides the approved capital budget for 2016.
NOTE 24: CAPITAL COMMITMENTS
(A) 2016 CAPITAL BUDGET
Following guidelines set out by the Public Sector Accounting Board, the budget reported on the Statement of Change in Net Financial Assets is the 2016 approved Capital Budget. The actual expenditures reported includes incomplete capital projects in the amount of $93,821 (2015 - $137,587 2014 - $126,001) carried forward from previous budget years, as well as costs related to the 2016 Budget.
(B) INCOMPLETE CAPITAL PROJECTS
As at December 31, 2016 a number of capital projects were in progress and will be completed in 2017 or subsequent years. The unexpended appropriation related to these projects is $412,241 (2015 - $400,200; 2014 - $368,866). Significant projects are: Gas Utility
Oil and Gas Drilling ($22,231), Oil and Gas Well Facilities ($9,977), Oil and Gas Well Gathering ($1,504), Well Repair and Abandonments ($15,533), Facility & Pipeline Repair & Abandonment ($18,152), Surface Lease Abandonment ($20,316), Exploration ($2,065), and Projects Operated by Third Parties ($13,323).
Electric Utility
Unit 16 – LM6000 Simple Cycle Generator ($30,537), Control System Upgrades ($4,051), 13kV Distribution Systems ($3,534), Distribution Substations ($3,559), and Distribution Transmission System ($5,898).
Revenue
Approved operating budgets 442,012$
Adjustments (80,487)
361,525
Expense
Approved operating expenses 477,310
Adjustments (94,445)
382,865
Other revenue
Contributed capital assets 3,086
Adjustments (1,406)
Government transfers for capital 20,623
22,303
ANNUAL SURPLUS 963$
2016 Budget
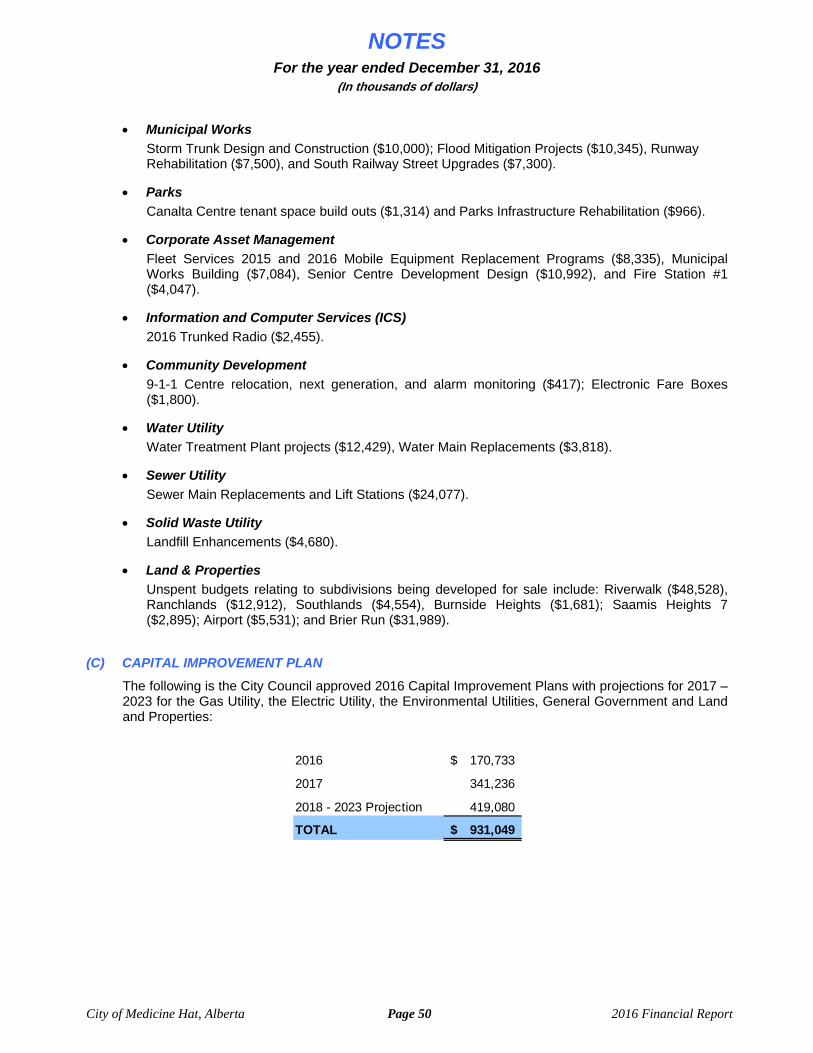
NOTES For the year ended December 31, 2016
(In thousands of dollars)
City of Medicine Hat, Alberta Page 50 2016 Financial Report
Municipal Works
Storm Trunk Design and Construction ($10,000); Flood Mitigation Projects ($10,345), Runway Rehabilitation ($7,500), and South Railway Street Upgrades ($7,300).
Parks
Canalta Centre tenant space build outs ($1,314) and Parks Infrastructure Rehabilitation ($966).
Corporate Asset Management
Fleet Services 2015 and 2016 Mobile Equipment Replacement Programs ($8,335), Municipal Works Building ($7,084), Senior Centre Development Design ($10,992), and Fire Station #1 ($4,047).
Information and Computer Services (ICS)
2016 Trunked Radio ($2,455).
Community Development
9-1-1 Centre relocation, next generation, and alarm monitoring ($417); Electronic Fare Boxes ($1,800).
Water Utility
Water Treatment Plant projects ($12,429), Water Main Replacements ($3,818).
Sewer Utility
Sewer Main Replacements and Lift Stations ($24,077).
Solid Waste Utility
Landfill Enhancements ($4,680).
Land & Properties
Unspent budgets relating to subdivisions being developed for sale include: Riverwalk ($48,528), Ranchlands ($12,912), Southlands ($4,554), Burnside Heights ($1,681); Saamis Heights 7 ($2,895); Airport ($5,531); and Brier Run ($31,989).
(C) CAPITAL IMPROVEMENT PLAN
The following is the City Council approved 2016 Capital Improvement Plans with projections for 2017 – 2023 for the Gas Utility, the Electric Utility, the Environmental Utilities, General Government and Land and Properties:
2016 170,733$
2017 341,236
2018 - 2023 Projection 419,080
TOTAL 931,049$
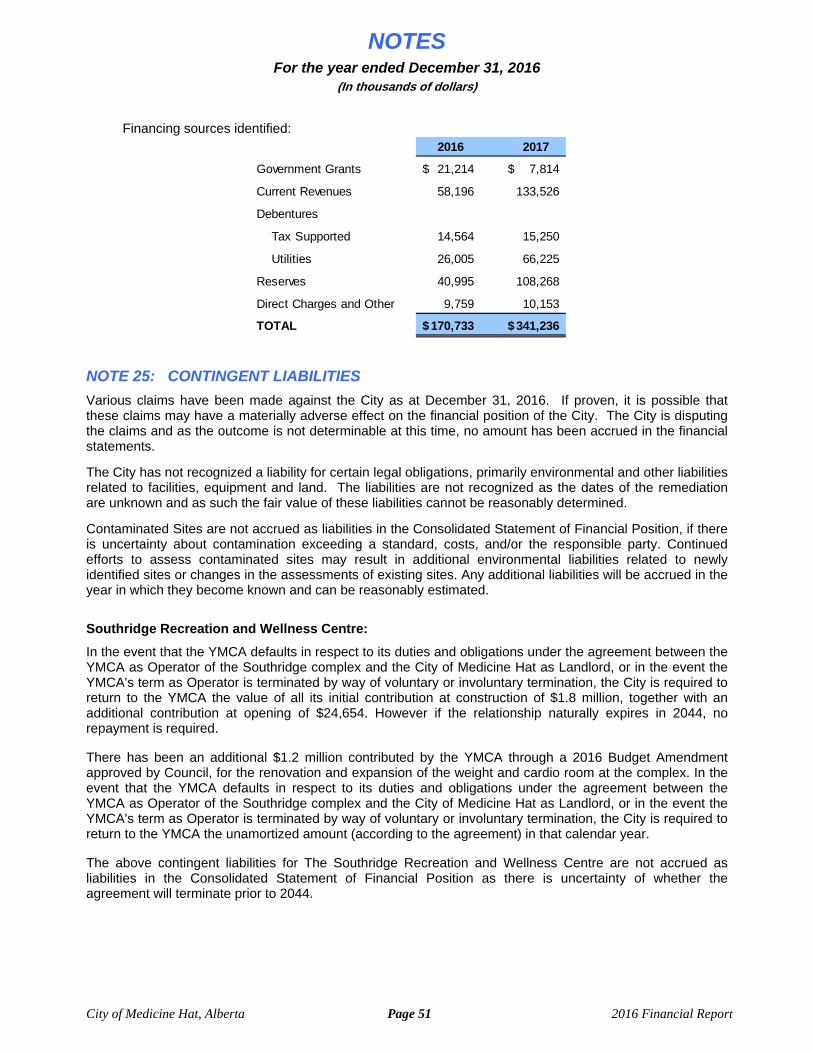
NOTES For the year ended December 31, 2016
(In thousands of dollars)
City of Medicine Hat, Alberta Page 51 2016 Financial Report
Financing sources identified:
NOTE 25: CONTINGENT LIABILITIES
Various claims have been made against the City as at December 31, 2016. If proven, it is possible that these claims may have a materially adverse effect on the financial position of the City. The City is disputing the claims and as the outcome is not determinable at this time, no amount has been accrued in the financial statements.
The City has not recognized a liability for certain legal obligations, primarily environmental and other liabilities related to facilities, equipment and land. The liabilities are not recognized as the dates of the remediation are unknown and as such the fair value of these liabilities cannot be reasonably determined.
Contaminated Sites are not accrued as liabilities in the Consolidated Statement of Financial Position, if there is uncertainty about contamination exceeding a standard, costs, and/or the responsible party. Continued efforts to assess contaminated sites may result in additional environmental liabilities related to newly identified sites or changes in the assessments of existing sites. Any additional liabilities will be accrued in the year in which they become known and can be reasonably estimated.
Southridge Recreation and Wellness Centre:
In the event that the YMCA defaults in respect to its duties and obligations under the agreement between the YMCA as Operator of the Southridge complex and the City of Medicine Hat as Landlord, or in the event the YMCA's term as Operator is terminated by way of voluntary or involuntary termination, the City is required to return to the YMCA the value of all its initial contribution at construction of $1.8 million, together with an additional contribution at opening of $24,654. However if the relationship naturally expires in 2044, no repayment is required. There has been an additional $1.2 million contributed by the YMCA through a 2016 Budget Amendment approved by Council, for the renovation and expansion of the weight and cardio room at the complex. In the event that the YMCA defaults in respect to its duties and obligations under the agreement between the YMCA as Operator of the Southridge complex and the City of Medicine Hat as Landlord, or in the event the YMCA's term as Operator is terminated by way of voluntary or involuntary termination, the City is required to return to the YMCA the unamortized amount (according to the agreement) in that calendar year. The above contingent liabilities for The Southridge Recreation and Wellness Centre are not accrued as liabilities in the Consolidated Statement of Financial Position as there is uncertainty of whether the agreement will terminate prior to 2044.
2016 2017
Government Grants 21,214$ 7,814$
Current Revenues 58,196 133,526
Debentures
Tax Supported 14,564 15,250
Utilities 26,005 66,225
Reserves 40,995 108,268
Direct Charges and Other 9,759 10,153
TOTAL 170,733$ 341,236$

NOTES For the year ended December 31, 2016
(In thousands of dollars)
City of Medicine Hat, Alberta Page 52 2016 Financial Report
NOTE 26: FINANCIAL INSTRUMENTS
The City, as part of its operations, carries a number of financial instruments. It is management’s opinion that the City is not exposed to significant interest, currency or credit risk arising from these financial instruments, except as otherwise disclosed. Unless otherwise noted, the fair value of these financial instruments approximates their carrying values.
NOTE 27: SEGMENT DISCLOSURES
Segment disclosures (Schedule 4) are intended to enable users to better understand the government reporting entity and the major expense and revenue activities of the City. For each reported segment, revenues and expenses represent both amounts directly attributable to the segment and amounts that are allocated on a reasonable basis. The segments have been selected based on a presentation similar to that adopted for the municipal financial planning and budget processes. Segments include: a) Tax supported programs consist of those that are directly supported by property taxes, including the
tax allocation proved directly to other operations as follows:
Legislative is comprised of Mayoral and Aldermanic services.
General Government is comprised of corporate administration, City Clerk and Legal, Health Safety & Environment, and Corporate Communications.
Corporate Services is comprised of Finance, Information and Computer Services and Corporate Asset Management (Building Services and Fleet Services) Human Resources.
Development & Infrastructure is comprised of Planning, Building and Development, Municipal Works (municipal operations and airport) and Business Support.
Public Services is comprised of Fire Services, Community Development (social development, senior services, transit and 9-1-1 Communications), Cultural Development (cultural administration, art gallery, Esplanade theatre, archives and cultural history), and Parks & Recreation (facilities maintenance and management, arboriculture, horticulture, campground and cemetery, and indoor recreation and leisure).
Police Service comprised of all police services and bylaw enforcement.
b) Gas Utility produces, sells to market and distributes natural gas to customers within its franchise boundary in a safe and reliable manner. The Gas Utility is operated on a self-sustaining basis.
c) Electric Utility produces and provides safe, reliable, cost effective electric energy to the customers of Medicine Hat and surrounding area and provides other related services within the city corporate structure. The Electric Utility is operated on a self-sustaining basis.
d) Utility Business Support provides corporate and community focus on energy conservation and renewable energy education, incentives and leadership through a variety of initiatives.
e) Water Utility treats and distributes potable water to City of Medicine Hat water customers. The Water department ensures all treated water meets the rigid safety, quality, monitoring, recording and reporting parameters of Federal, Provincial, water industry and local standards. The Water Utility is operated on a self-sustaining basis.
f) Sewer Utility collects and treats sanitary wastewater from City of Medicine Hat sewer customers. The Sewer department ensures all treated waste water meets the rigid safety, environmental, monitoring, recording and reporting parameters of Federal, Provincial, waste water industry and local standards. The Sewer Utility is operated on a self-sustaining basis.
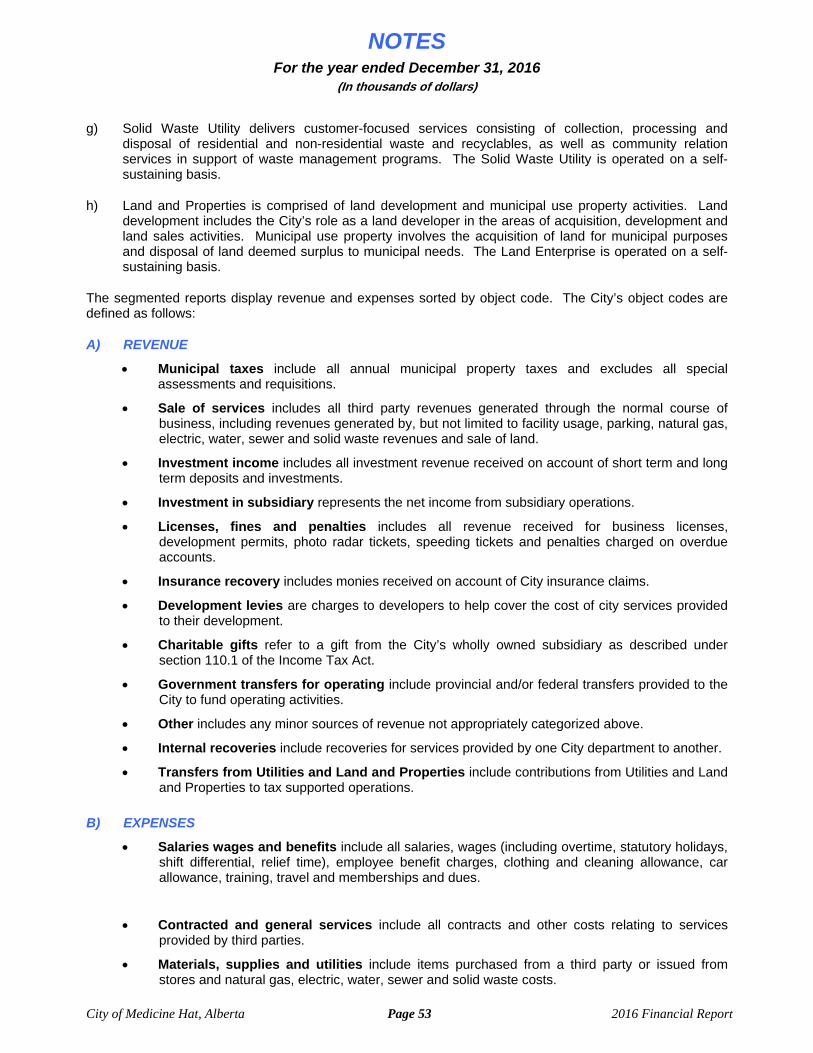
NOTES For the year ended December 31, 2016
(In thousands of dollars)
City of Medicine Hat, Alberta Page 53 2016 Financial Report
g) Solid Waste Utility delivers customer-focused services consisting of collection, processing and disposal of residential and non-residential waste and recyclables, as well as community relation services in support of waste management programs. The Solid Waste Utility is operated on a self-sustaining basis.
h) Land and Properties is comprised of land development and municipal use property activities. Land development includes the City’s role as a land developer in the areas of acquisition, development and land sales activities. Municipal use property involves the acquisition of land for municipal purposes and disposal of land deemed surplus to municipal needs. The Land Enterprise is operated on a self-sustaining basis.
The segmented reports display revenue and expenses sorted by object code. The City’s object codes are defined as follows:
A) REVENUE
Municipal taxes include all annual municipal property taxes and excludes all special assessments and requisitions.
Sale of services includes all third party revenues generated through the normal course of business, including revenues generated by, but not limited to facility usage, parking, natural gas, electric, water, sewer and solid waste revenues and sale of land.
Investment income includes all investment revenue received on account of short term and long term deposits and investments.
Investment in subsidiary represents the net income from subsidiary operations.
Licenses, fines and penalties includes all revenue received for business licenses, development permits, photo radar tickets, speeding tickets and penalties charged on overdue accounts.
Insurance recovery includes monies received on account of City insurance claims.
Development levies are charges to developers to help cover the cost of city services provided to their development.
Charitable gifts refer to a gift from the City’s wholly owned subsidiary as described under section 110.1 of the Income Tax Act.
Government transfers for operating include provincial and/or federal transfers provided to the City to fund operating activities.
Other includes any minor sources of revenue not appropriately categorized above.
Internal recoveries include recoveries for services provided by one City department to another.
Transfers from Utilities and Land and Properties include contributions from Utilities and Land and Properties to tax supported operations.
B) EXPENSES
Salaries wages and benefits include all salaries, wages (including overtime, statutory holidays, shift differential, relief time), employee benefit charges, clothing and cleaning allowance, car allowance, training, travel and memberships and dues.
Contracted and general services include all contracts and other costs relating to services provided by third parties.
Materials, supplies and utilities include items purchased from a third party or issued from stores and natural gas, electric, water, sewer and solid waste costs.

NOTES For the year ended December 31, 2016
(In thousands of dollars)
City of Medicine Hat, Alberta Page 54 2016 Financial Report
Provisions for allowances include provisions made for anticipated uncollectible accounts receivable.
Bank charges and short term interest include regular bank charges on the City’s bank accounts, automated teller machines at various facility sites and interest charges on our line of credit.
Interest on long term debt includes interest charge on the principle portion of loans.
Total grants and other transfers include grants from the City to other organizations or individuals as well as transfers on behalf of other organizations.
Other operating expenses include any minor operating expenses not appropriately categorized above.
Amortization of tangible capital assets is a way of representing, for accounting purposes, how capital assets decline in value over time because of wear and obsolescence. Hard assets such as roads and machinery depreciate over time, and must eventually be replaced. Depreciation shows the cost of the “use of the asset” each year over the life of the asset.
Impairment Is the expense recorded to reduce the value of assets when the assets are worth less on the market than the value listed on the company’s balance sheet. A test is completed each year to compare the carrying amount of the asset to the market value. If the carrying amount is higher than the market value then the asset is considered impaired and must be written down to its fair value.
Loss (gain) on disposal of tangible capital assets reflects the difference between the net proceeds on disposal of a tangible capital asset and the net carrying amount of that asset. If the net carrying amount is higher than the net proceeds on disposal, there is a loss on disposal. If the net carrying amount is lower than the net proceeds on disposal, there is a gain on disposal.
Internal charges and transfers include costs of services provided by one department to another, as well as transfers between City departments.
NOTE 28: SUBSEQUENT EVENTS
Subsequent to year end, the City of Medicine Hat has entered into an agreement to sell approximately 25% of its natural gas wells and related assets and retirement obligations to a third party with the effective date of the sale being January 1, 2017. Proceeds of the disposition totaled $53.5 million including liabilities assumed. The proceeds will exceed the net carrying value of the related assets and liabilities resulting in a gain on disposition of $28.7 million.
NOTE 29: APPROVAL OF FINANCIAL STATEMENTS
These financial statements were approved by Council.
Peace Tree International invites teachers and students around the world to celebrate peace
and diversity under local schools. Peace trees on Peace Tree Day!
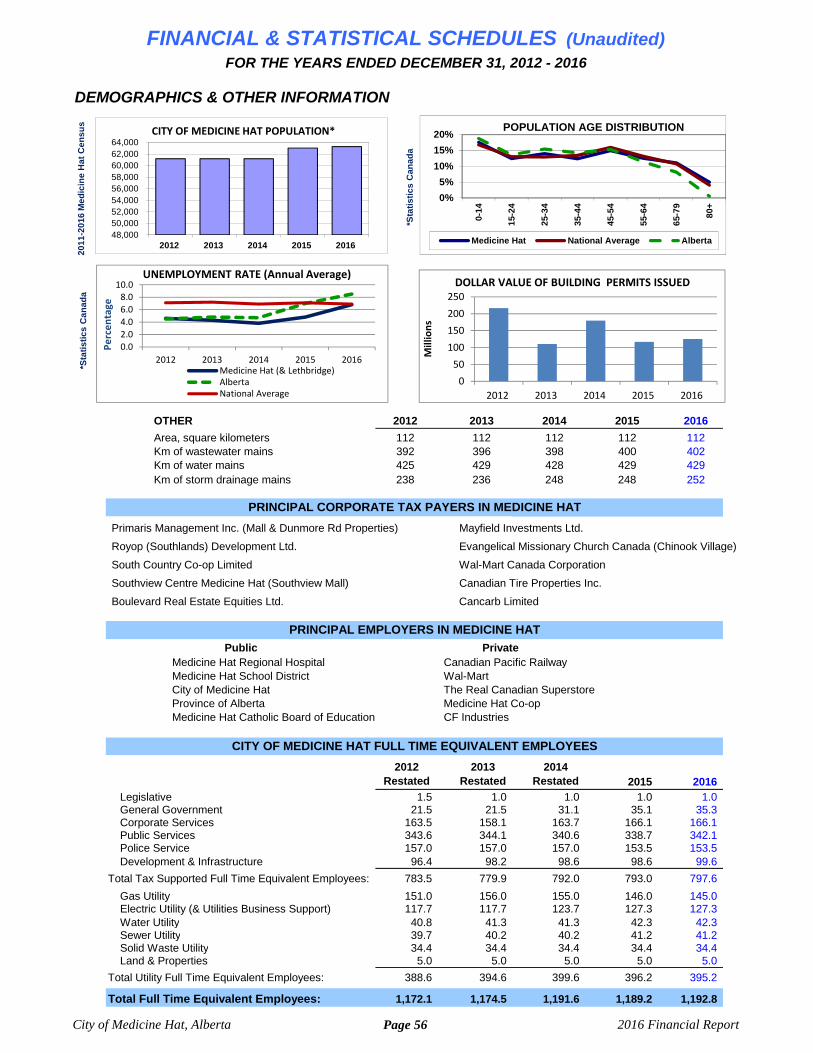
DEMOGRAPHICS & OTHER INFORMATION
OTHER 2012 2013 2014 2015 2016
Area, square kilometers 112 112 112 112 112 Km of wastewater mains 392 396 398 400 402 Km of water mains 425 429 428 429 429
238 236 248 248 252
Primaris Management Inc. (Mall & Dunmore Rd Properties) Mayfield Investments Ltd.
Royop (Southlands) Development Ltd. Evangelical Missionary Church Canada (Chinook Village)
South Country Co-op Limited Wal-Mart Canada Corporation
Southview Centre Medicine Hat (Southview Mall) Canadian Tire Properties Inc.
Boulevard Real Estate Equities Ltd. Cancarb Limited
Medicine Hat Regional Hospital Canadian Pacific Railway Medicine Hat School District Wal-Mart City of Medicine Hat The Real Canadian Superstore Province of Alberta Medicine Hat Co-op Medicine Hat Catholic Board of Education CF Industries
2012 Restated
2013 Restated
2014 Restated 2015 2016
Legislative 1.5 1.0 1.0 1.0 1.0 General Government 21.5 21.5 31.1 35.1 35.3 Corporate Services 163.5 158.1 163.7 166.1 166.1 Public Services 343.6 344.1 340.6 338.7 342.1 Police Service 157.0 157.0 157.0 153.5 153.5 Development & Infrastructure 96.4 98.2 98.6 98.6 99.6
Total Tax Supported Full Time Equivalent Employees: 783.5 779.9 792.0 793.0 797.6
Gas Utility 151.0 156.0 155.0 146.0 145.0 Electric Utility (& Utilities Business Support) 117.7 117.7 123.7 127.3 127.3 Water Utility 40.8 41.3 41.3 42.3 42.3 Sewer Utility 39.7 40.2 40.2 41.2 41.2 Solid Waste Utility 34.4 34.4 34.4 34.4 34.4 Land & Properties 5.0 5.0 5.0 5.0 5.0
Total Utility Full Time Equivalent Employees: 388.6 394.6 399.6 396.2 395.2
Total Full Time Equivalent Employees: 1,172.1 1,174.5 1,191.6 1,189.2 1,192.8
FINANCIAL & STATISTICAL SCHEDULES (Unaudited)FOR THE YEARS ENDED DECEMBER 31, 2012 - 2016
Km of storm drainage mains
CITY OF MEDICINE HAT FULL TIME EQUIVALENT EMPLOYEES
Public Private
PRINCIPAL CORPORATE TAX PAYERS IN MEDICINE HAT
PRINCIPAL EMPLOYERS IN MEDICINE HAT
48,00050,00052,00054,00056,00058,00060,00062,00064,000
2012 2013 2014 2015 2016
UNEMPLOYMENT RATE* (Average Annual)
CITY OF MEDICINE HAT POPULATION* POPULATION AGE DISTRIBUTION
*Sta
tis
tic
sC
an
ad
a
*Sta
tis
tic
sC
an
ad
a
0%
5%
10%
15%
20%
0-1
4
15
-24
25
-34
35
-44
45
-54
55
-64
65
-79
80
+
Medicine Hat National Average Alberta
20
11
-20
16
Me
dic
ine
Ha
t C
en
su
s
0.0
2.0
4.0
6.0
8.010.0
2012 2013 2014 2015 2016Medicine Hat (& Lethbridge)AlbertaNational Average
UNEMPLOYMENT RATE (Annual Average)
Percentage
0
50
100
150
200
250
2012 2013 2014 2015 2016
Millions
DOLLAR VALUE OF BUILDING PERMITS ISSUED
City of Medicine Hat, Alberta Page 56 2016 Financial Report
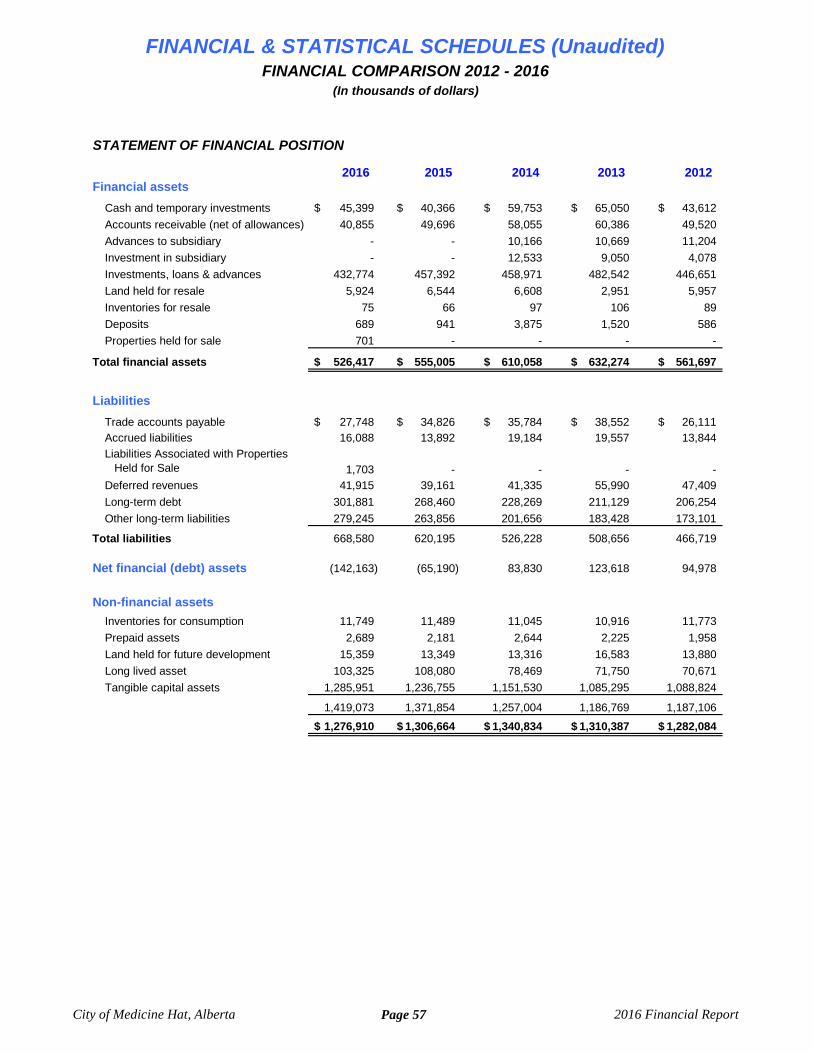
STATEMENT OF FINANCIAL POSITION
2016 2015 2014 2013 2012
Cash and temporary investments 45,399$ 40,366$ 59,753$ 65,050$ 43,612$
Accounts receivable (net of allowances) 40,855 49,696 58,055 60,386 49,520
Advances to subsidiary - - 10,166 10,669 11,204
Investment in subsidiary - - 12,533 9,050 4,078
Investments, loans & advances 432,774 457,392 458,971 482,542 446,651
Land held for resale 5,924 6,544 6,608 2,951 5,957
Inventories for resale 75 66 97 106 89
Deposits 689 941 3,875 1,520 586
Properties held for sale 701 - - - -
Total financial assets 526,417$ 555,005$ 610,058$ 632,274$ 561,697$
Trade accounts payable 27,748$ 34,826$ 35,784$ 38,552$ 26,111$ Accrued liabilities 16,088 13,892 19,184 19,557 13,844
Liabilities Associated with Properties Held for Sale 1,703 - - - - Deferred revenues 41,915 39,161 41,335 55,990 47,409
Long-term debt 301,881 268,460 228,269 211,129 206,254
Other long-term liabilities 279,245 263,856 201,656 183,428 173,101
Total liabilities 668,580 620,195 526,228 508,656 466,719
Net financial (debt) assets (142,163) (65,190) 83,830 123,618 94,978
Non-financial assets
Inventories for consumption 11,749 11,489 11,045 10,916 11,773
Prepaid assets 2,689 2,181 2,644 2,225 1,958
Land held for future development 15,359 13,349 13,316 16,583 13,880
Long lived asset 103,325 108,080 78,469 71,750 70,671
Tangible capital assets 1,285,951 1,236,755 1,151,530 1,085,295 1,088,824
1,419,073 1,371,854 1,257,004 1,186,769 1,187,106
1,276,910$ 1,306,664$ 1,340,834$ 1,310,387$ 1,282,084$
Liabilities
Financial assets
FINANCIAL & STATISTICAL SCHEDULES (Unaudited)FINANCIAL COMPARISON 2012 - 2016
(In thousands of dollars)
City of Medicine Hat, Alberta Page 57 2016 Financial Report
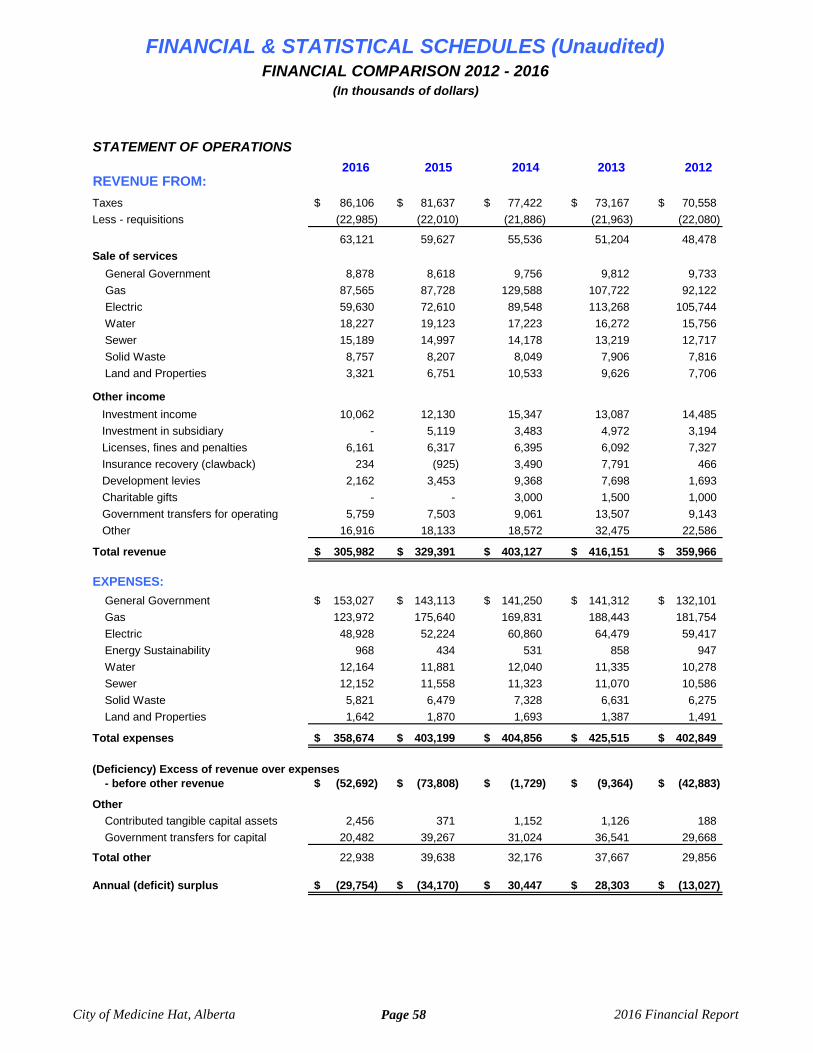
FINANCIAL & STATISTICAL SCHEDULES (Unaudited)FINANCIAL COMPARISON 2012 - 2016
(In thousands of dollars)
STATEMENT OF OPERATIONS
2016 2015 2014 2013 2012REVENUE FROM:
Taxes 86,106$ 81,637$ 77,422$ 73,167$ 70,558$
Less - requisitions (22,985) (22,010) (21,886) (21,963) (22,080)
63,121 59,627 55,536 51,204 48,478
Sale of services
General Government 8,878 8,618 9,756 9,812 9,733
Gas 87,565 87,728 129,588 107,722 92,122
Electric 59,630 72,610 89,548 113,268 105,744
Water 18,227 19,123 17,223 16,272 15,756
Sewer 15,189 14,997 14,178 13,219 12,717
Solid Waste 8,757 8,207 8,049 7,906 7,816
Land and Properties 3,321 6,751 10,533 9,626 7,706
Other income
Investment income 10,062 12,130 15,347 13,087 14,485
Investment in subsidiary - 5,119 3,483 4,972 3,194
Licenses, fines and penalties 6,161 6,317 6,395 6,092 7,327
Insurance recovery (clawback) 234 (925) 3,490 7,791 466
Development levies 2,162 3,453 9,368 7,698 1,693
Charitable gifts - - 3,000 1,500 1,000
Government transfers for operating 5,759 7,503 9,061 13,507 9,143
Other 16,916 18,133 18,572 32,475 22,586
Total revenue 305,982$ 329,391$ 403,127$ 416,151$ 359,966$
EXPENSES:
General Government 153,027$ 143,113$ 141,250$ 141,312$ 132,101$
Gas 123,972 175,640 169,831 188,443 181,754
Electric 48,928 52,224 60,860 64,479 59,417
Energy Sustainability 968 434 531 858 947
Water 12,164 11,881 12,040 11,335 10,278
Sewer 12,152 11,558 11,323 11,070 10,586
Solid Waste 5,821 6,479 7,328 6,631 6,275
Land and Properties 1,642 1,870 1,693 1,387 1,491
Total expenses 358,674$ 403,199$ 404,856$ 425,515$ 402,849$
(Deficiency) Excess of revenue over expenses- before other revenue (52,692)$ (73,808)$ (1,729)$ (9,364)$ (42,883)$
Other
Contributed tangible capital assets 2,456 371 1,152 1,126 188
Government transfers for capital 20,482 39,267 31,024 36,541 29,668
Total other 22,938 39,638 32,176 37,667 29,856
Annual (deficit) surplus (29,754)$ (34,170)$ 30,447$ 28,303$ (13,027)$
City of Medicine Hat, Alberta Page 58 2016 Financial Report
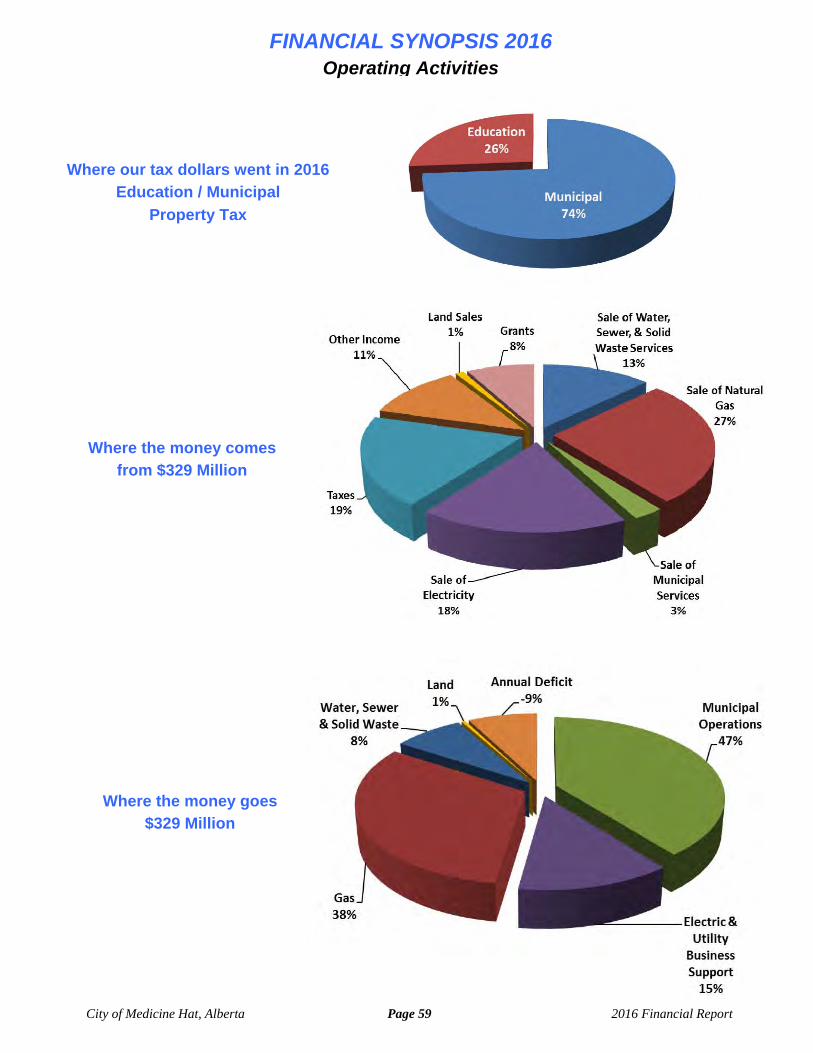
City of Medicine Hat, Alberta Page 59 2016 Financial Report
FINANCIAL SYNOPSIS 2016 Operating Activities
Where our tax dollars went in 2016
Education / Municipal
Property Tax
Where the money comes
from $329 Million
Where the money goes
$329 Million
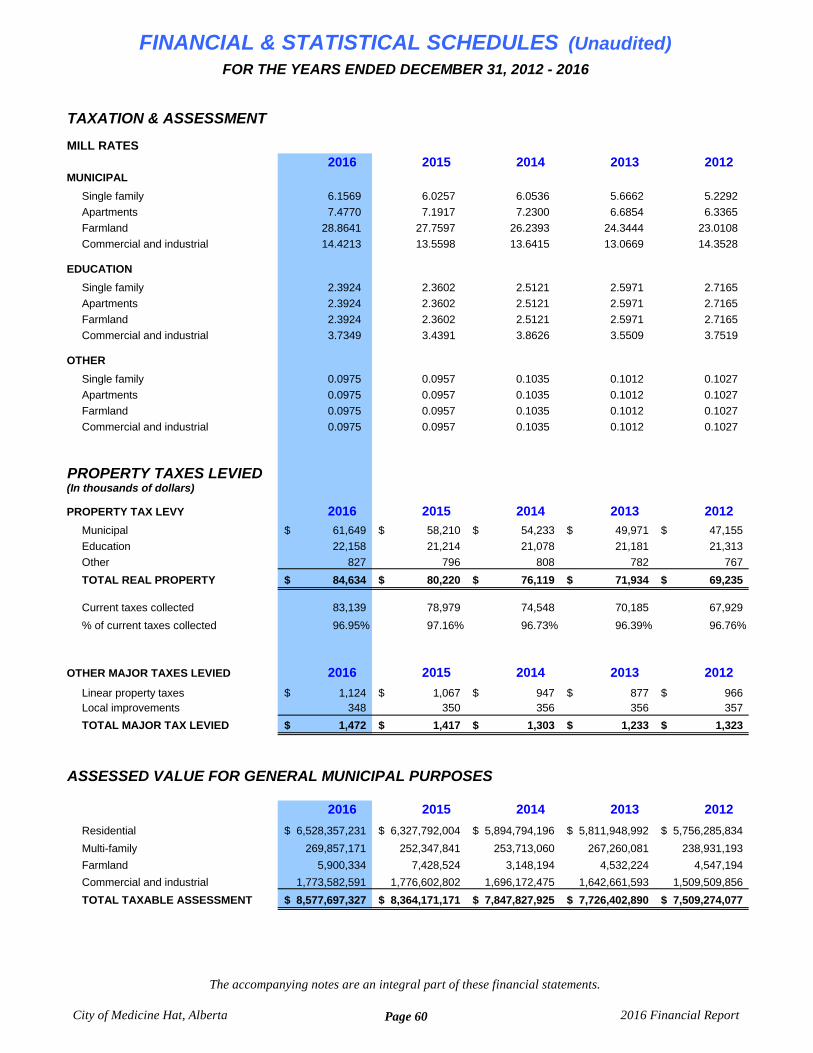
TAXATION & ASSESSMENT
MILL RATES
2016 2015 2014 2013 2012MUNICIPAL
Single family 6.1569 6.0257 6.0536 5.6662 5.2292
Apartments 7.4770 7.1917 7.2300 6.6854 6.3365
Farmland 28.8641 27.7597 26.2393 24.3444 23.0108
Commercial and industrial 14.4213 13.5598 13.6415 13.0669 14.3528
EDUCATION
Single family 2.3924 2.3602 2.5121 2.5971 2.7165
Apartments 2.3924 2.3602 2.5121 2.5971 2.7165
Farmland 2.3924 2.3602 2.5121 2.5971 2.7165
Commercial and industrial 3.7349 3.4391 3.8626 3.5509 3.7519
OTHER
Single family 0.0975 0.0957 0.1035 0.1012 0.1027
Apartments 0.0975 0.0957 0.1035 0.1012 0.1027
Farmland 0.0975 0.0957 0.1035 0.1012 0.1027
Commercial and industrial 0.0975 0.0957 0.1035 0.1012 0.1027
PROPERTY TAXES LEVIED(In thousands of dollars)
PROPERTY TAX LEVY 2016 2015 2014 2013 2012
Municipal 61,649$ 58,210$ 54,233$ 49,971$ 47,155$
Education 22,158 21,214 21,078 21,181 21,313
Other 827 796 808 782 767
TOTAL REAL PROPERTY 84,634$ 80,220$ 76,119$ 71,934$ 69,235$
Current taxes collected 83,139 78,979 74,548 70,185 67,929
% of current taxes collected 96.95% 97.16% 96.73% 96.39% 96.76%
OTHER MAJOR TAXES LEVIED 2016 2015 2014 2013 2012
Linear property taxes 1,124$ 1,067$ 947$ 877$ 966$ Local improvements 348 350 356 356 357
TOTAL MAJOR TAX LEVIED 1,472$ 1,417$ 1,303$ 1,233$ 1,323$
ASSESSED VALUE FOR GENERAL MUNICIPAL PURPOSES
2016 2015 2014 2013 2012
Residential 6,528,357,231$ 6,327,792,004$ 5,894,794,196$ 5,811,948,992$ 5,756,285,834$
Multi-family 269,857,171 252,347,841 253,713,060 267,260,081 238,931,193
Farmland 5,900,334 7,428,524 3,148,194 4,532,224 4,547,194
Commercial and industrial 1,773,582,591 1,776,602,802 1,696,172,475 1,642,661,593 1,509,509,856
TOTAL TAXABLE ASSESSMENT 8,577,697,327$ 8,364,171,171$ 7,847,827,925$ 7,726,402,890$ 7,509,274,077$
FOR THE YEARS ENDED DECEMBER 31, 2012 - 2016
FINANCIAL & STATISTICAL SCHEDULES (Unaudited)
City of Medicine Hat, Alberta
The accompanying notes are an integral part of these financial statements.
Page 60 2016 Financial Report
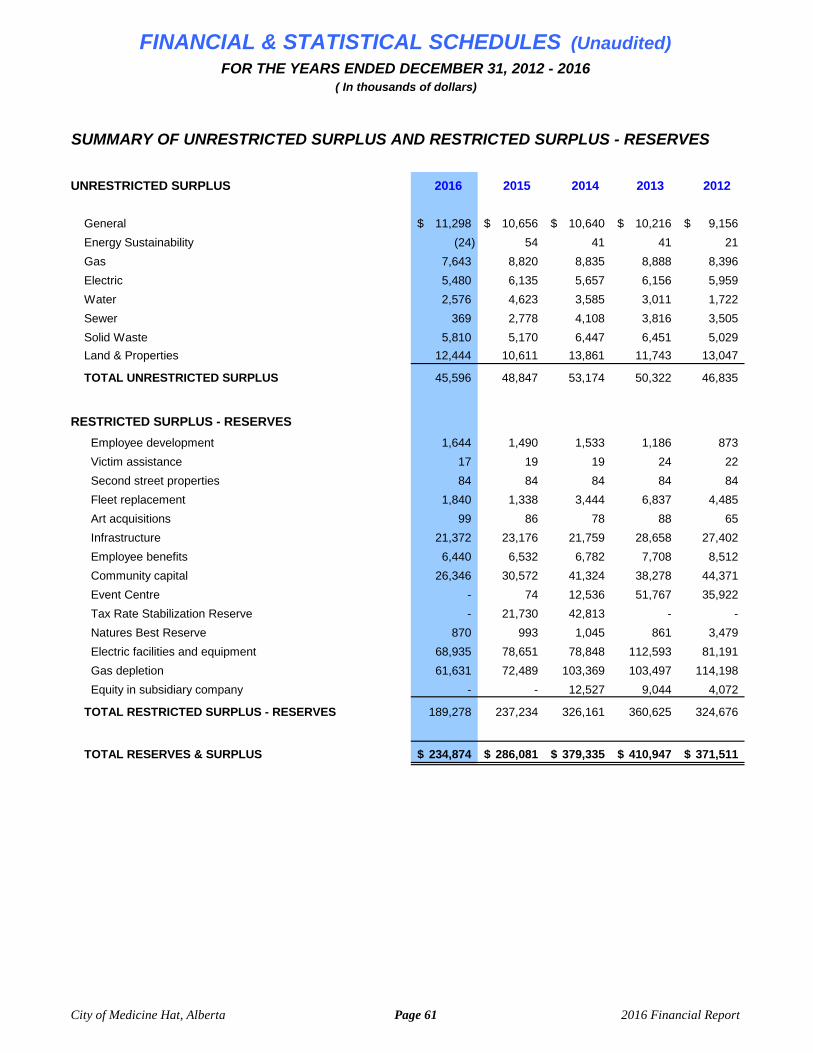
FINANCIAL & STATISTICAL SCHEDULES (Unaudited)FOR THE YEARS ENDED DECEMBER 31, 2012 - 2016
( In thousands of dollars)
SUMMARY OF UNRESTRICTED SURPLUS AND RESTRICTED SURPLUS - RESERVES
UNRESTRICTED SURPLUS 2016 2015 2014 2013 2012
General 11,298$ 10,656$ 10,640$ 10,216$ 9,156$
Energy Sustainability (24) 54 41 41 21
Gas 7,643 8,820 8,835 8,888 8,396
Electric 5,480 6,135 5,657 6,156 5,959
Water 2,576 4,623 3,585 3,011 1,722
Sewer 369 2,778 4,108 3,816 3,505
Solid Waste 5,810 5,170 6,447 6,451 5,029
Land & Properties 12,444 10,611 13,861 11,743 13,047
TOTAL UNRESTRICTED SURPLUS 45,596 48,847 53,174 50,322 46,835
RESTRICTED SURPLUS - RESERVES
Employee development 1,644 1,490 1,533 1,186 873
Victim assistance 17 19 19 24 22
Second street properties 84 84 84 84 84
Fleet replacement 1,840 1,338 3,444 6,837 4,485
Art acquisitions 99 86 78 88 65
Infrastructure 21,372 23,176 21,759 28,658 27,402
Employee benefits 6,440 6,532 6,782 7,708 8,512
Community capital 26,346 30,572 41,324 38,278 44,371
Event Centre - 74 12,536 51,767 35,922
Tax Rate Stabilization Reserve - 21,730 42,813 - -
Natures Best Reserve 870 993 1,045 861 3,479
Electric facilities and equipment 68,935 78,651 78,848 112,593 81,191
Gas depletion 61,631 72,489 103,369 103,497 114,198
Equity in subsidiary company - - 12,527 9,044 4,072
TOTAL RESTRICTED SURPLUS - RESERVES 189,278 237,234 326,161 360,625 324,676
TOTAL RESERVES & SURPLUS 234,874$ 286,081$ 379,335$ 410,947$ 371,511$
City of Medicine Hat, Alberta Page 61 2016 Financial Report
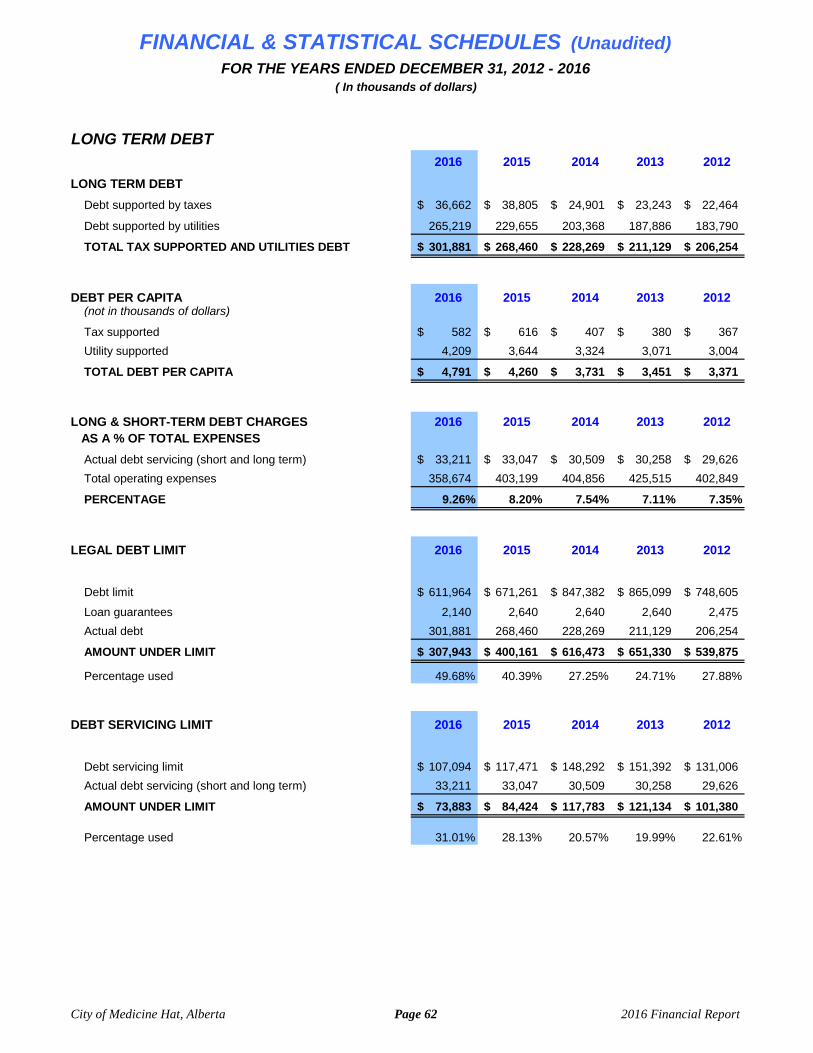
FINANCIAL & STATISTICAL SCHEDULES (Unaudited)FOR THE YEARS ENDED DECEMBER 31, 2012 - 2016
( In thousands of dollars)
LONG TERM DEBT 2016 2015 2014 2013 2012
LONG TERM DEBT
Debt supported by taxes 36,662$ 38,805$ 24,901$ 23,243$ 22,464$
Debt supported by utilities 265,219 229,655 203,368 187,886 183,790
TOTAL TAX SUPPORTED AND UTILITIES DEBT 301,881$ 268,460$ 228,269$ 211,129$ 206,254$
DEBT PER CAPITA 2016 2015 2014 2013 2012(not in thousands of dollars)
Tax supported 582$ 616$ 407$ 380$ 367$
Utility supported 4,209 3,644 3,324 3,071 3,004
TOTAL DEBT PER CAPITA 4,791$ 4,260$ 3,731$ 3,451$ 3,371$
LONG & SHORT-TERM DEBT CHARGES 2016 2015 2014 2013 2012 AS A % OF TOTAL EXPENSES
Actual debt servicing (short and long term) 33,211$ 33,047$ 30,509$ 30,258$ 29,626$
Total operating expenses 358,674 403,199 404,856 425,515 402,849
PERCENTAGE 9.26% 8.20% 7.54% 7.11% 7.35%
LEGAL DEBT LIMIT 2016 2015 2014 2013 2012
Debt limit 611,964$ 671,261$ 847,382$ 865,099$ 748,605$
Loan guarantees 2,140 2,640 2,640 2,640 2,475
Actual debt 301,881 268,460 228,269 211,129 206,254
AMOUNT UNDER LIMIT 307,943$ 400,161$ 616,473$ 651,330$ 539,875$
Percentage used 49.68% 40.39% 27.25% 24.71% 27.88%
DEBT SERVICING LIMIT 2016 2015 2014 2013 2012
Debt servicing limit 107,094$ 117,471$ 148,292$ 151,392$ 131,006$
Actual debt servicing (short and long term) 33,211 33,047 30,509 30,258 29,626
AMOUNT UNDER LIMIT 73,883$ 84,424$ 117,783$ 121,134$ 101,380$
Percentage used 31.01% 28.13% 20.57% 19.99% 22.61%
City of Medicine Hat, Alberta Page 62 2016 Financial Report
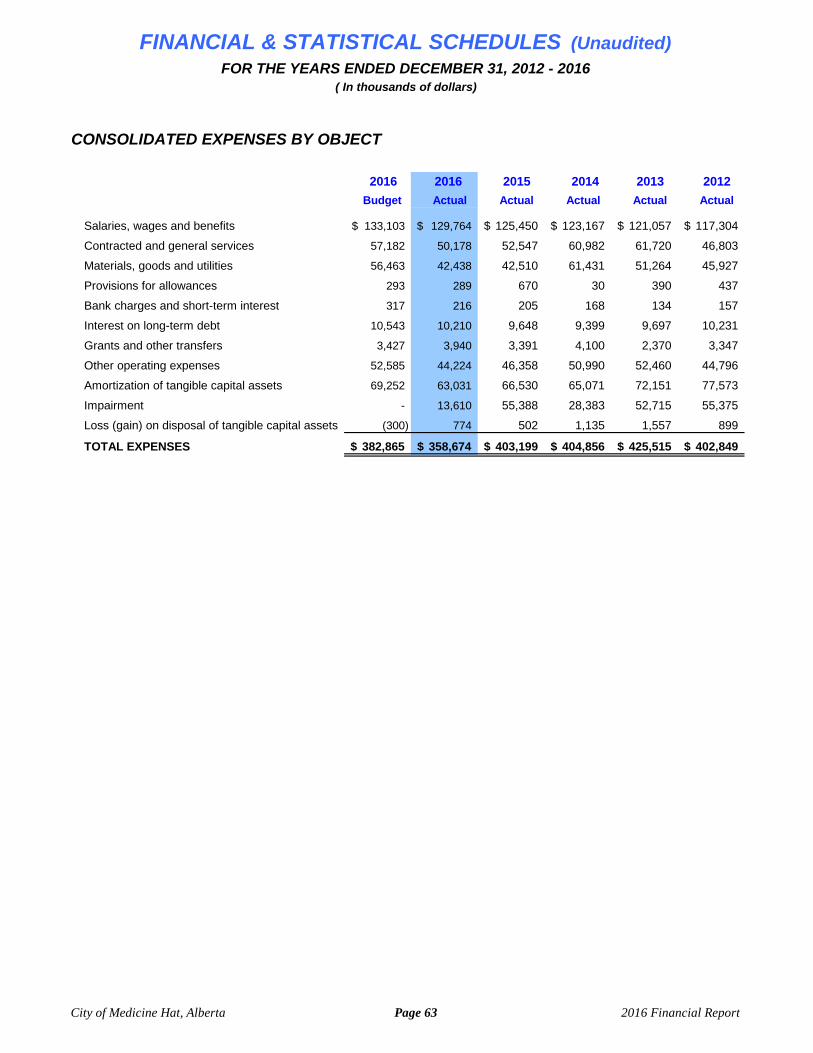
CONSOLIDATED EXPENSES BY OBJECT
2016 2016 2015 2014 2013 2012
Budget Actual Actual Actual Actual Actual
Salaries, wages and benefits 133,103$ 129,764$ 125,450$ 123,167$ 121,057$ 117,304$
Contracted and general services 57,182 50,178 52,547 60,982 61,720 46,803
Materials, goods and utilities 56,463 42,438 42,510 61,431 51,264 45,927
Provisions for allowances 293 289 670 30 390 437
Bank charges and short-term interest 317 216 205 168 134 157
Interest on long-term debt 10,543 10,210 9,648 9,399 9,697 10,231
Grants and other transfers 3,427 3,940 3,391 4,100 2,370 3,347
Other operating expenses 52,585 44,224 46,358 50,990 52,460 44,796
Amortization of tangible capital assets 69,252 63,031 66,530 65,071 72,151 77,573
Impairment - 13,610 55,388 28,383 52,715 55,375
Loss (gain) on disposal of tangible capital assets (300) 774 502 1,135 1,557 899
TOTAL EXPENSES 382,865$ 358,674$ 403,199$ 404,856$ 425,515$ 402,849$
City of Medicine Hat, Alberta Page 63 2016 Financial Report
FINANCIAL & STATISTICAL SCHEDULES (Unaudited)FOR THE YEARS ENDED DECEMBER 31, 2012 - 2016
( In thousands of dollars)
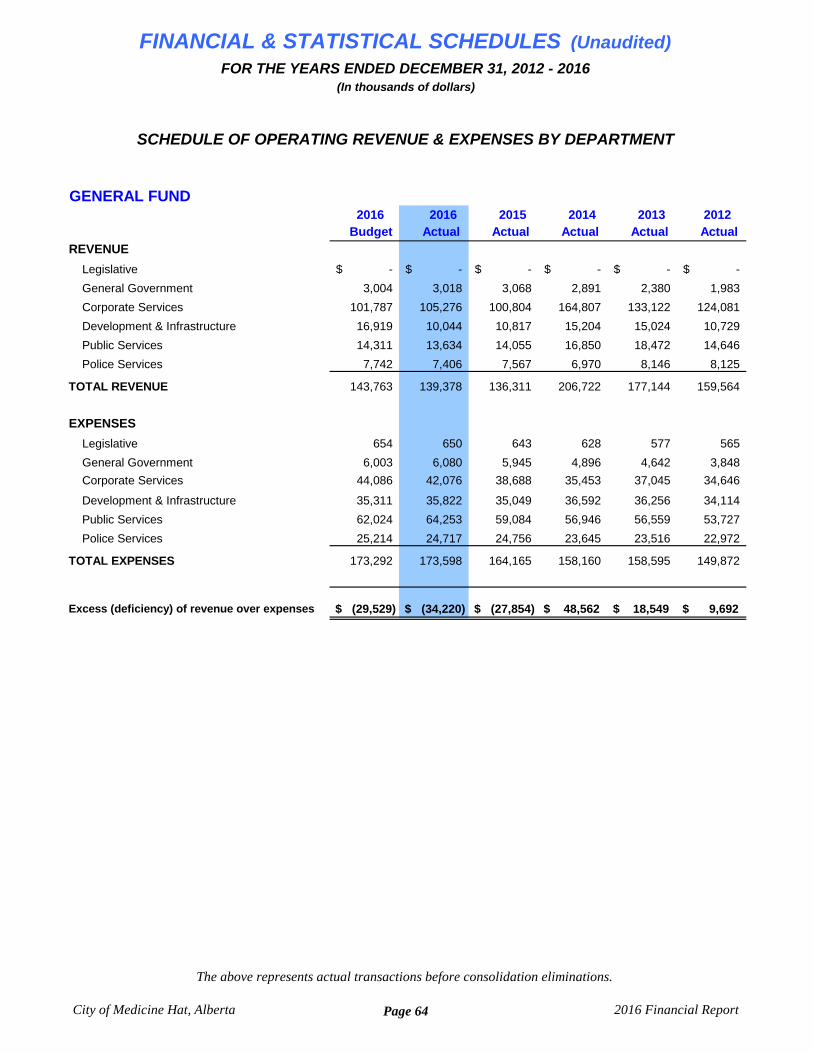
FINANCIAL & STATISTICAL SCHEDULES (Unaudited)FOR THE YEARS ENDED DECEMBER 31, 2012 - 2016
(In thousands of dollars)
GENERAL FUND 2016 2016 2015 2014 2013 2012 Budget Actual Actual Actual Actual Actual
REVENUE
Legislative -$ -$ -$ -$ -$ -$
General Government 3,004 3,018 3,068 2,891 2,380 1,983
Corporate Services 101,787 105,276 100,804 164,807 133,122 124,081
Development & Infrastructure 16,919 10,044 10,817 15,204 15,024 10,729
Public Services 14,311 13,634 14,055 16,850 18,472 14,646
Police Services 7,742 7,406 7,567 6,970 8,146 8,125
TOTAL REVENUE 143,763 139,378 136,311 206,722 177,144 159,564
EXPENSES
Legislative 654 650 643 628 577 565
General Government 6,003 6,080 5,945 4,896 4,642 3,848
Corporate Services 44,086 42,076 38,688 35,453 37,045 34,646
Development & Infrastructure 35,311 35,822 35,049 36,592 36,256 34,114
Public Services 62,024 64,253 59,084 56,946 56,559 53,727
Police Services 25,214 24,717 24,756 23,645 23,516 22,972
TOTAL EXPENSES 173,292 173,598 164,165 158,160 158,595 149,872
Excess (deficiency) of revenue over expenses $ (29,529) $ (34,220) $ (27,854) $ 48,562 $ 18,549 $ 9,692
SCHEDULE OF OPERATING REVENUE & EXPENSES BY DEPARTMENT
City of Medicine Hat, Alberta
The above represents actual transactions before consolidation eliminations.
Page 64 2016 Financial Report

FINANCIAL & STATISTICAL SCHEDULES (Unaudited)FOR THE YEARS ENDED DECEMBER 31, 2012 - 2016
(In thousands of dollars)
LEGISLATIVE Mayor, Councillors
2016 2016 2015 2014 2013 2012 Budget Actual Actual Actual Actual Actual
REVENUE
Mayor -$ -$ -$ -$ -$ -$
Aldermen - - - - - -
TOTAL REVENUE - - - - - -
EXPENSES
Mayor 296 310 304 281 229 243
Aldermen 358 340 339 347 348 322
TOTAL EXPENSES 654 650 643 628 577 565
Excess (deficiency) of revenue over expenses $ (654) $ (650) $ (643) $ (628) $ (577) $ (565)
$ - $ -
MAYOR, COUNCILLORSGeneral Government
2016 2016 2015 2014 2013 2012 Budget Actual Actual Actual Actual Actual
REVENUE
Other Income
Internal recovery -$ -$ -$ -$ -$ -$
Insurance recovery - - - - - -
Other revenue - - - - -
TOTAL REVENUE - - - - - -
EXPENSES
Salaries, wages and benefits 564 579 578 552 491 506
Other personnel costs 46 23 26 37 39 21
Contracted and general services 22 25 20 23 25 24
Materials and supplies 4 7 6 8 11 6
Internal charges 18 16 13 8 11 8
TOTAL EXPENSES 654 650 643 628 577 565
Excess (deficiency) of revenue over expenses $ (654) $ (650) $ (643) $ (628) $ (577) $ (565)
SCHEDULE OF OPERATING REVENUE & EXPENSES BY OBJECT
SCHEDULE OF OPERATING REVENUE & EXPENSES BY DEPARTMENT
City of Medicine Hat, Alberta
The above represents actual transactions before consolidation eliminations.
Page 65 2016 Financial Report

FINANCIAL & STATISTICAL SCHEDULES (Unaudited)FOR THE YEARS ENDED DECEMBER 31, 2012 - 2016
(In thousands of dollars)
GENERAL GOVERNMENT CAO & Commissioners, Legislative, City Solicitor & City Clerk; Corporate Communications; HS&E
2016 2016 2015 2014 2013 2012 Budget Actual Actual Actual Actual Actual
REVENUE
CAO & Commissioners 424$ 417$ 412$ 381$ 368$ 363$
City Solicitor & City Clerk 1,152 1,153 1,201 1,370 1,380 1,257
Corporate Communications 342 349 359 337 337 330
Health, Safety & Environment 1,086 1,099 1,096 803 295 33
TOTAL REVENUE 3,004 3,018 3,068 2,891 2,380 1,983
EXPENSES
CAO & Commissioners 1,830 1,774 1,732 1,619 1,825 1,638
City Solicitor & City Clerk 1,650 1,678 1,722 1,602 1,949 1,679
Corporate Communications 611 614 555 495 419 416
Health, Safety & Environment 1,912 2,014 1,936 1,180 449 115
TOTAL EXPENSES 6,003 6,080 5,945 4,896 4,642 3,848
Excess (deficiency) of revenue over expenses $ (2,999) $ (3,062) $ (2,877) $ (2,005) $ (2,262) $ (1,865)
SCHEDULE OF OPERATING REVENUE & EXPENSES BY DEPARTMENT
City of Medicine Hat, Alberta
The above represents actual transactions before consolidation eliminations.
Page 66 2016 Financial Report
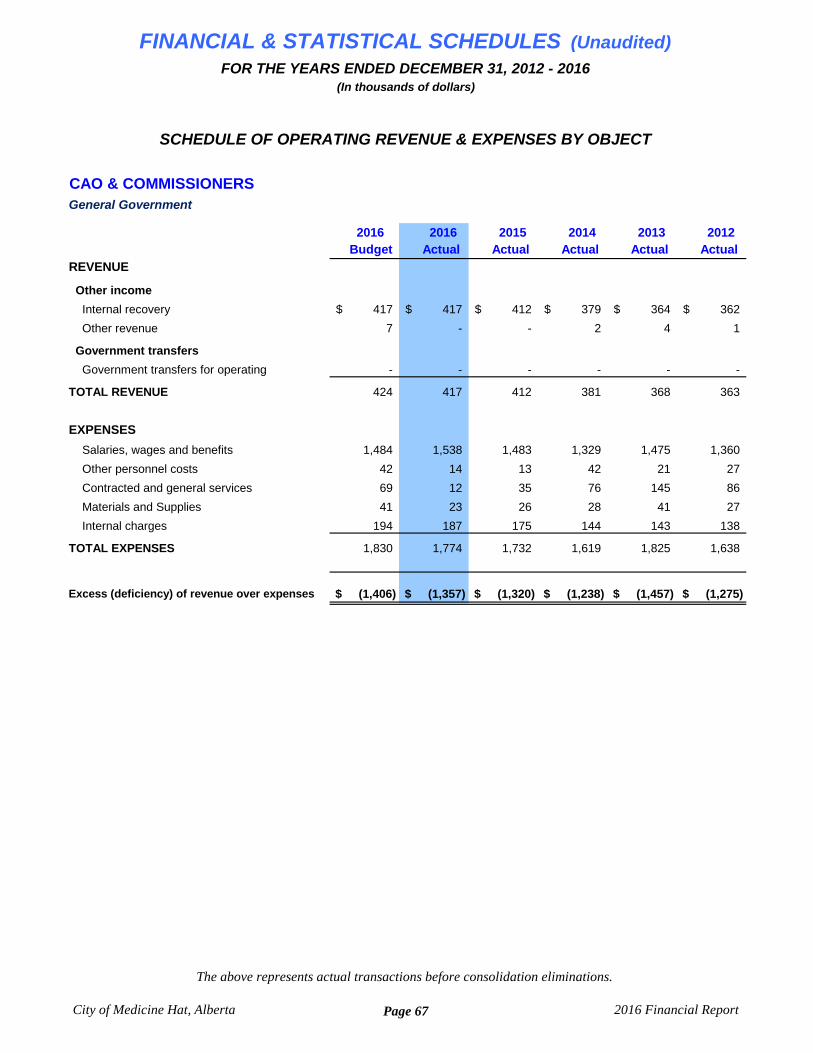
FINANCIAL & STATISTICAL SCHEDULES (Unaudited)FOR THE YEARS ENDED DECEMBER 31, 2012 - 2016
(In thousands of dollars)
CAO & COMMISSIONERSGeneral Government
2016 2016 2015 2014 2013 2012 Budget Actual Actual Actual Actual Actual
REVENUE
Other income
Internal recovery 417$ 417$ 412$ 379$ 364$ 362$
Other revenue 7 - - 2 4 1
Government transfers
Government transfers for operating - - - - - -
TOTAL REVENUE 424 417 412 381 368 363
EXPENSES
Salaries, wages and benefits 1,484 1,538 1,483 1,329 1,475 1,360
Other personnel costs 42 14 13 42 21 27
Contracted and general services 69 12 35 76 145 86
Materials and Supplies 41 23 26 28 41 27
Internal charges 194 187 175 144 143 138
TOTAL EXPENSES 1,830 1,774 1,732 1,619 1,825 1,638
Excess (deficiency) of revenue over expenses $ (1,406) $ (1,357) $ (1,320) $ (1,238) $ (1,457) $ (1,275)
SCHEDULE OF OPERATING REVENUE & EXPENSES BY OBJECT
City of Medicine Hat, Alberta
The above represents actual transactions before consolidation eliminations.
Page 67 2016 Financial Report
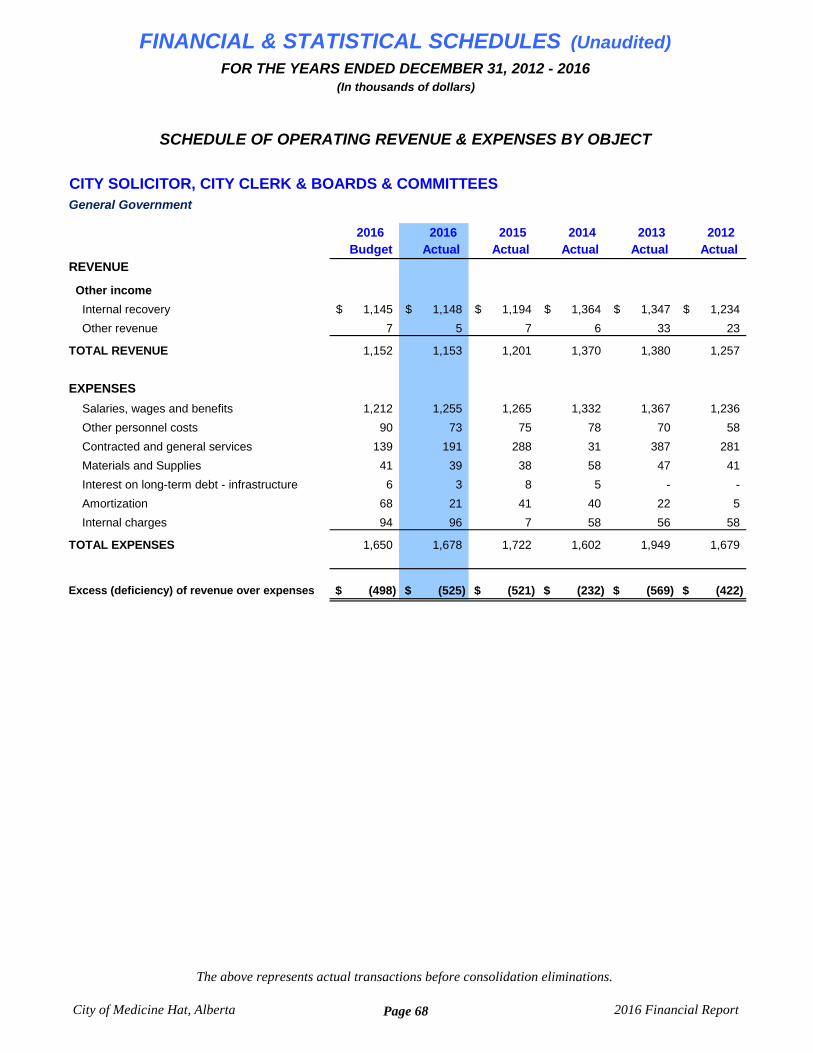
FINANCIAL & STATISTICAL SCHEDULES (Unaudited)FOR THE YEARS ENDED DECEMBER 31, 2012 - 2016
(In thousands of dollars)
CITY SOLICITOR, CITY CLERK & BOARDS & COMMITTEESGeneral Government
2016 2016 2015 2014 2013 2012 Budget Actual Actual Actual Actual Actual
REVENUE
Other income
Internal recovery 1,145$ 1,148$ 1,194$ 1,364$ 1,347$ 1,234$
Other revenue 7 5 7 6 33 23
TOTAL REVENUE 1,152 1,153 1,201 1,370 1,380 1,257
EXPENSES
Salaries, wages and benefits 1,212 1,255 1,265 1,332 1,367 1,236
Other personnel costs 90 73 75 78 70 58
Contracted and general services 139 191 288 31 387 281
Materials and Supplies 41 39 38 58 47 41
Interest on long-term debt - infrastructure 6 3 8 5 - -
Amortization 68 21 41 40 22 5
Internal charges 94 96 7 58 56 58
TOTAL EXPENSES 1,650 1,678 1,722 1,602 1,949 1,679
Excess (deficiency) of revenue over expenses $ (498) $ (525) $ (521) $ (232) $ (569) $ (422)
SCHEDULE OF OPERATING REVENUE & EXPENSES BY OBJECT
City of Medicine Hat, Alberta
The above represents actual transactions before consolidation eliminations.
Page 68 2016 Financial Report

FINANCIAL & STATISTICAL SCHEDULES (Unaudited)FOR THE YEARS ENDED DECEMBER 31, 2012 - 2016
(In thousands of dollars)
CORPORATE COMMUNICATIONSGeneral Government
2016 2016 2015 2014 2013 2012 Budget Actual Actual Actual Actual Actual
REVENUE
Other income
Internal recovery 342$ 348$ 358$ 332$ 327$ 330$
Other revenue - 1 1 - 2 -
Government transfers
Government transfers for operating - - - 5 8 -
TOTAL REVENUE 342 349 359 337 337 330
EXPENSES
Salaries, wages and benefits 463 493 427 396 316 340
Other personnel costs 9 5 5 5 3 4
Contracted and general services 100 77 78 62 69 44
Materials and supplies 8 7 11 11 9 5
Internal charges 31 32 34 21 22 23
TOTAL EXPENSES 611 614 555 495 419 416
Excess (deficiency) of revenue over expenses $ (269) $ (265) $ (196) $ (158) $ (82) $ (86)
SCHEDULE OF OPERATING REVENUE & EXPENSES BY OBJECT
City of Medicine Hat, Alberta
The above represents actual transactions before consolidation eliminations.
Page 69 2016 Financial Report
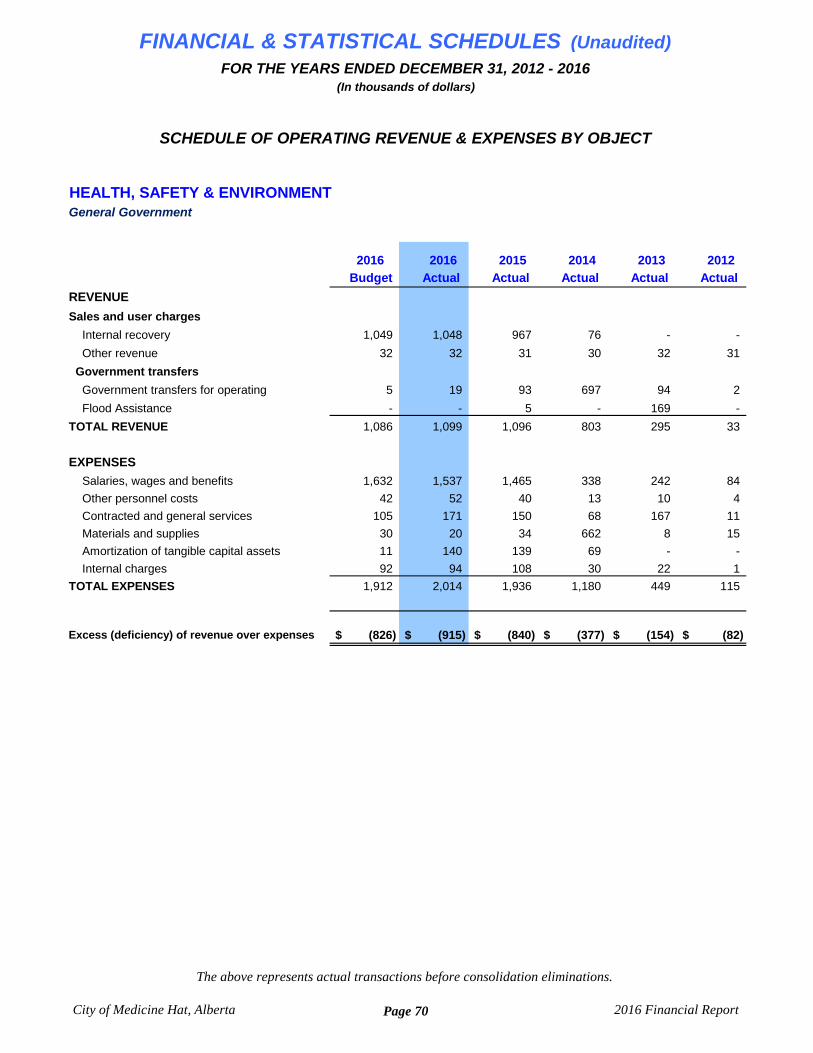
FINANCIAL & STATISTICAL SCHEDULES (Unaudited)FOR THE YEARS ENDED DECEMBER 31, 2012 - 2016
(In thousands of dollars)
HEALTH, SAFETY & ENVIRONMENTGeneral Government
2016 2016 2015 2014 2013 2012
Budget Actual Actual Actual Actual Actual
REVENUE
Sales and user charges
Internal recovery 1,049 1,048 967 76 - -
Other revenue 32 32 31 30 32 31
Government transfers
Government transfers for operating 5 19 93 697 94 2
Flood Assistance - - 5 - 169 -
TOTAL REVENUE 1,086 1,099 1,096 803 295 33
EXPENSES
Salaries, wages and benefits 1,632 1,537 1,465 338 242 84
Other personnel costs 42 52 40 13 10 4
Contracted and general services 105 171 150 68 167 11
Materials and supplies 30 20 34 662 8 15
Amortization of tangible capital assets 11 140 139 69 - -
Internal charges 92 94 108 30 22 1
TOTAL EXPENSES 1,912 2,014 1,936 1,180 449 115
Excess (deficiency) of revenue over expenses $ (826) $ (915) $ (840) $ (377) $ (154) $ (82)
SCHEDULE OF OPERATING REVENUE & EXPENSES BY OBJECT
City of Medicine Hat, Alberta
The above represents actual transactions before consolidation eliminations.
Page 70 2016 Financial Report
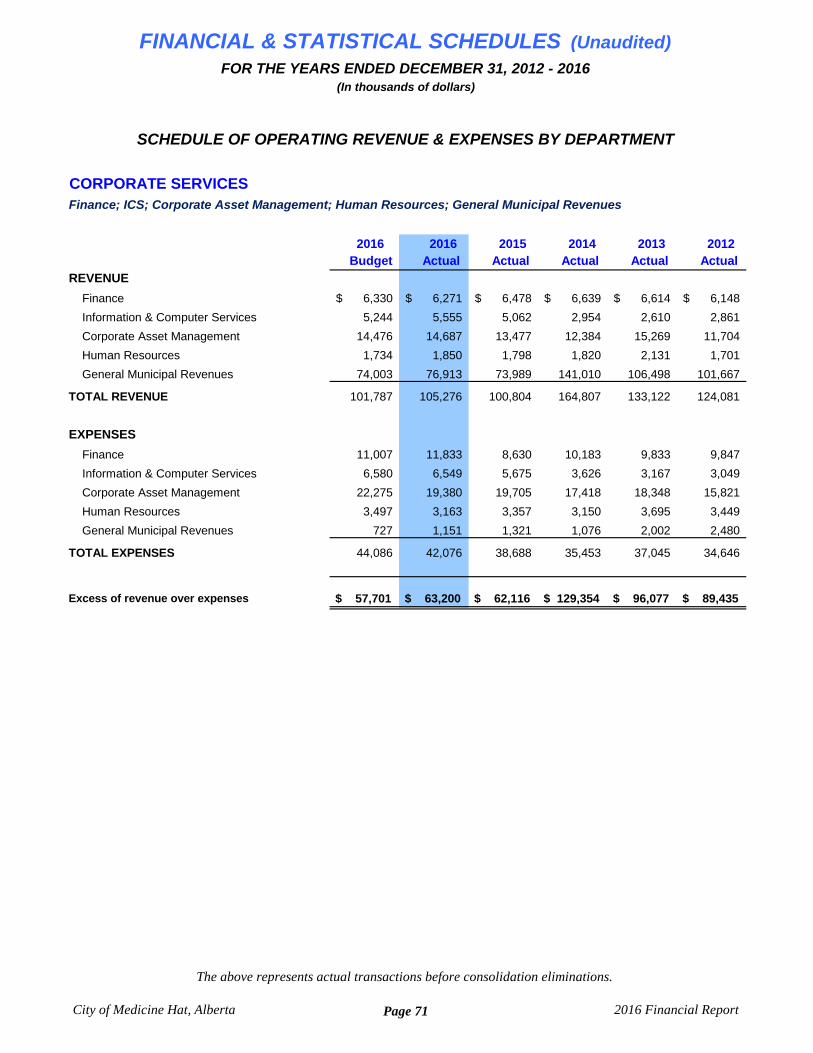
FINANCIAL & STATISTICAL SCHEDULES (Unaudited)FOR THE YEARS ENDED DECEMBER 31, 2012 - 2016
(In thousands of dollars)
CORPORATE SERVICES Finance; ICS; Corporate Asset Management; Human Resources; General Municipal Revenues
2016 2016 2015 2014 2013 2012 Budget Actual Actual Actual Actual Actual
REVENUE
Finance 6,330$ 6,271$ 6,478$ 6,639$ 6,614$ 6,148$
Information & Computer Services 5,244 5,555 5,062 2,954 2,610 2,861
Corporate Asset Management 14,476 14,687 13,477 12,384 15,269 11,704
Human Resources 1,734 1,850 1,798 1,820 2,131 1,701
General Municipal Revenues 74,003 76,913 73,989 141,010 106,498 101,667
TOTAL REVENUE 101,787 105,276 100,804 164,807 133,122 124,081
EXPENSES
Finance 11,007 11,833 8,630 10,183 9,833 9,847
Information & Computer Services 6,580 6,549 5,675 3,626 3,167 3,049
Corporate Asset Management 22,275 19,380 19,705 17,418 18,348 15,821
Human Resources 3,497 3,163 3,357 3,150 3,695 3,449
General Municipal Revenues 727 1,151 1,321 1,076 2,002 2,480
TOTAL EXPENSES 44,086 42,076 38,688 35,453 37,045 34,646
Excess of revenue over expenses $ 57,701 $ 63,200 $ 62,116 $ 129,354 $ 96,077 $ 89,435
$ 89,233
SCHEDULE OF OPERATING REVENUE & EXPENSES BY DEPARTMENT
City of Medicine Hat, Alberta
The above represents actual transactions before consolidation eliminations.
Page 71 2016 Financial Report
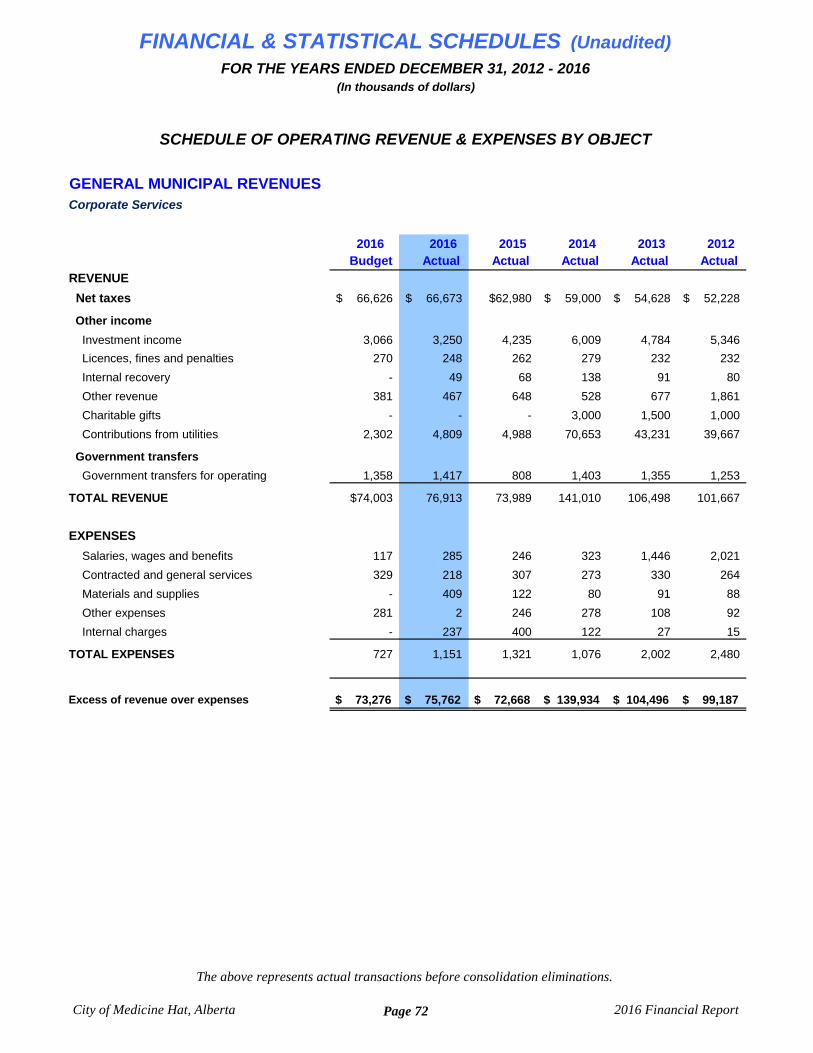
FINANCIAL & STATISTICAL SCHEDULES (Unaudited)FOR THE YEARS ENDED DECEMBER 31, 2012 - 2016
(In thousands of dollars)
GENERAL MUNICIPAL REVENUESCorporate Services
2016 2016 2015 2014 2013 2012 Budget Actual Actual Actual Actual Actual
REVENUE
Net taxes 66,626$ 66,673$ $62,980 59,000$ 54,628$ 52,228$
Other income
Investment income 3,066 3,250 4,235 6,009 4,784 5,346
Licences, fines and penalties 270 248 262 279 232 232
Internal recovery - 49 68 138 91 80
Other revenue 381 467 648 528 677 1,861
Charitable gifts - - - 3,000 1,500 1,000
Contributions from utilities 2,302 4,809 4,988 70,653 43,231 39,667
Government transfers
Government transfers for operating 1,358 1,417 808 1,403 1,355 1,253
TOTAL REVENUE $74,003 76,913 73,989 141,010 106,498 101,667
EXPENSES
Salaries, wages and benefits 117 285 246 323 1,446 2,021
Contracted and general services 329 218 307 273 330 264
Materials and supplies - 409 122 80 91 88
Other expenses 281 2 246 278 108 92
Internal charges - 237 400 122 27 15
TOTAL EXPENSES 727 1,151 1,321 1,076 2,002 2,480
Excess of revenue over expenses $ 73,276 $ 75,762 $ 72,668 $ 139,934 $ 104,496 $ 99,187
SCHEDULE OF OPERATING REVENUE & EXPENSES BY OBJECT
City of Medicine Hat, Alberta
The above represents actual transactions before consolidation eliminations.
Page 72 2016 Financial Report

FINANCIAL & STATISTICAL SCHEDULES (Unaudited)FOR THE YEARS ENDED DECEMBER 31, 2012 - 2016
(In thousands of dollars)
FINANCECorporate Services
2016 2016 2015 2014 2013 2012 Budget Actual Actual Actual Actual Actual
REVENUE
Other income
Internal recovery 5,653$ 5,538$ 5,730$ 5,898$ 5,874$ 5,441$
Insurance recovery - - - - 15 -
Other revenue 677 702 708 717 706 707
Government transfers
Grants - federal and provincial - 12 20 - - -
Government transfers for operating - 19 20 24 19 -
TOTAL REVENUE 6,330 6,271 6,478 6,639 6,614 6,148
EXPENSES
Salaries, wages and benefits 7,692 7,738 7,619 7,861 7,462 7,228
Other personnel costs 135 101 113 133 117 105
Contracted and general services 606 709 402 377 605 695
Materials and supplies 398 326 252 261 304 228
Provision for allowances 27 27 27 50 26 25
Bank charges 61 1,510 (1,482) 46 (11) 55
Interest on long-term debt - ACFA 40 26 - - - -
Interest on long-term debt - infrastructure 45 29 52 37 27 37
Other operating expenses 26 52 340 (17) 20 101
Amortization of tangible capital assets 629 47 46 124 205 205
Internal charges 1,348 1,268 1,261 1,311 1,078 1,168
TOTAL EXPENSES 11,007 11,833 8,630 10,183 9,833 9,847
Excess (deficiency) of revenue over expenses $ (4,677) $ (5,562) $ (2,152) $ (3,544) $ (3,219) $ (3,699)
$ (666)
SCHEDULE OF OPERATING REVENUE & EXPENSES BY OBJECT
City of Medicine Hat, Alberta
The above represents actual transactions before consolidation eliminations.
Page 73 2016 Financial Report
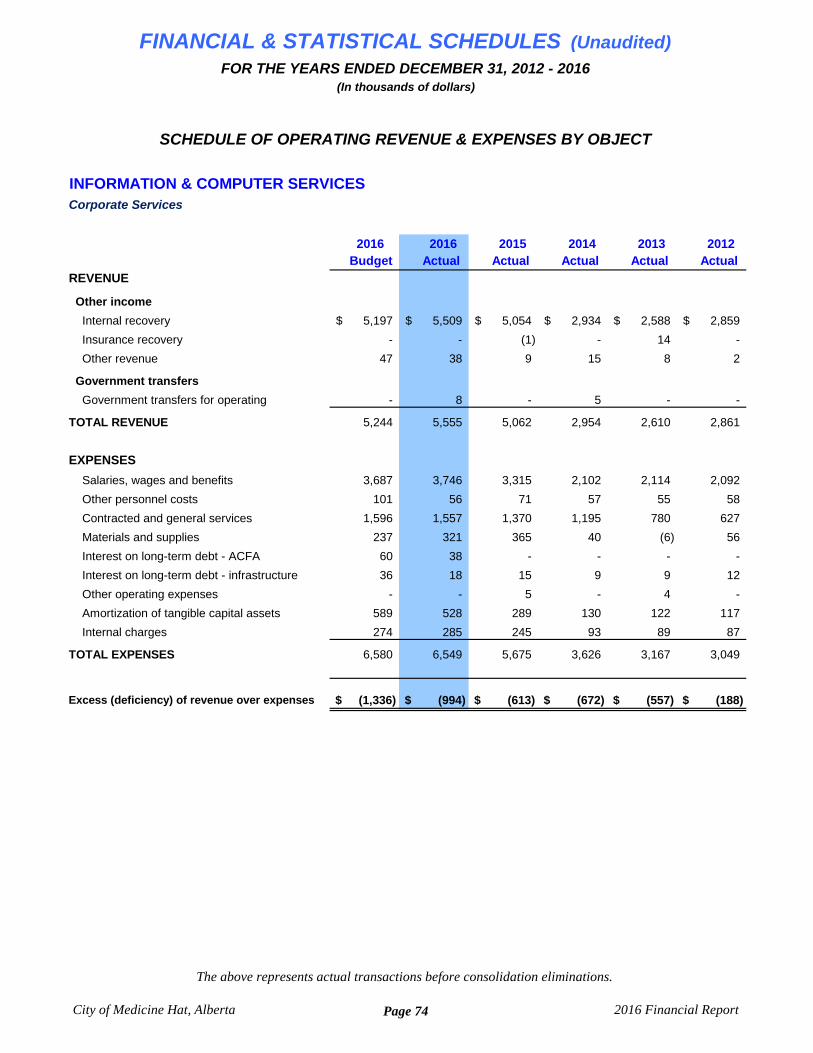
FINANCIAL & STATISTICAL SCHEDULES (Unaudited)FOR THE YEARS ENDED DECEMBER 31, 2012 - 2016
(In thousands of dollars)
INFORMATION & COMPUTER SERVICESCorporate Services
2016 2016 2015 2014 2013 2012 Budget Actual Actual Actual Actual Actual
REVENUE
Other income
Internal recovery 5,197$ 5,509$ 5,054$ 2,934$ 2,588$ 2,859$
Insurance recovery - - (1) - 14 -
Other revenue 47 38 9 15 8 2
Government transfers
Government transfers for operating - 8 - 5 - -
TOTAL REVENUE 5,244 5,555 5,062 2,954 2,610 2,861
EXPENSES
Salaries, wages and benefits 3,687 3,746 3,315 2,102 2,114 2,092
Other personnel costs 101 56 71 57 55 58
Contracted and general services 1,596 1,557 1,370 1,195 780 627
Materials and supplies 237 321 365 40 (6) 56
Interest on long-term debt - ACFA 60 38 - - - -
Interest on long-term debt - infrastructure 36 18 15 9 9 12
Other operating expenses - - 5 - 4 -
Amortization of tangible capital assets 589 528 289 130 122 117
Internal charges 274 285 245 93 89 87
TOTAL EXPENSES 6,580 6,549 5,675 3,626 3,167 3,049
Excess (deficiency) of revenue over expenses $ (1,336) $ (994) $ (613) $ (672) $ (557) $ (188)
SCHEDULE OF OPERATING REVENUE & EXPENSES BY OBJECT
City of Medicine Hat, Alberta
The above represents actual transactions before consolidation eliminations.
Page 74 2016 Financial Report
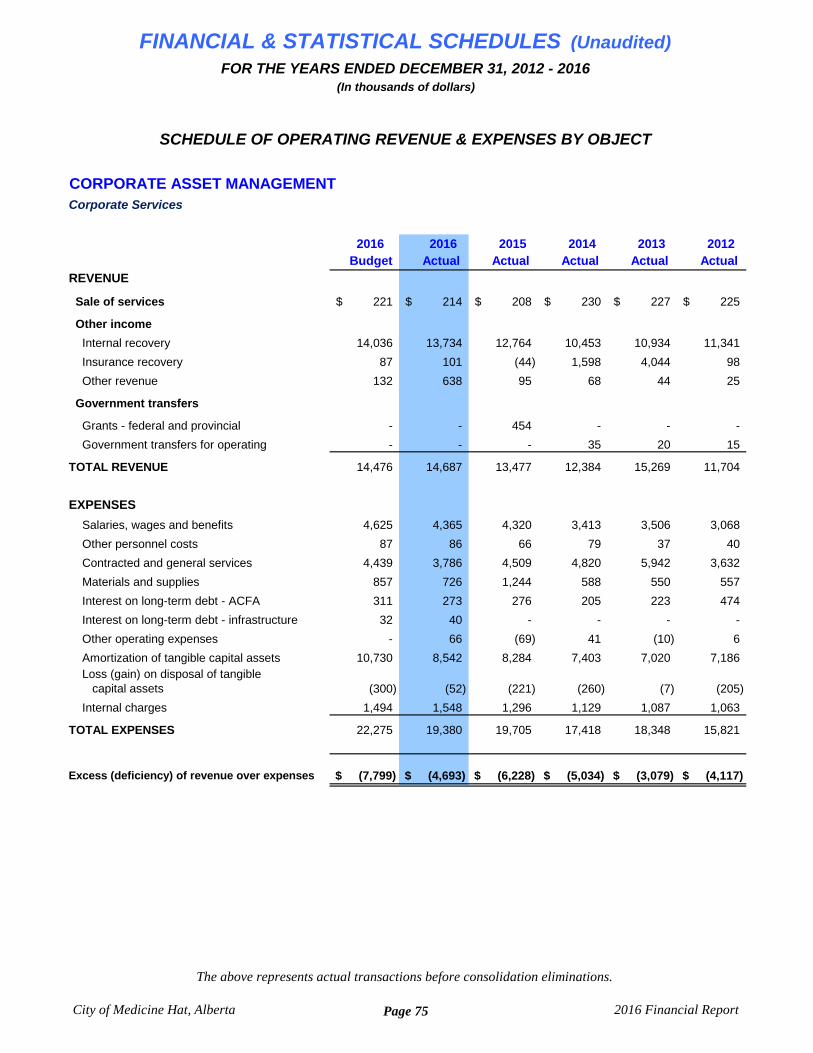
FINANCIAL & STATISTICAL SCHEDULES (Unaudited)FOR THE YEARS ENDED DECEMBER 31, 2012 - 2016
(In thousands of dollars)
CORPORATE ASSET MANAGEMENT Corporate Services
2016 2016 2015 2014 2013 2012 Budget Actual Actual Actual Actual Actual
REVENUE
Sale of services 221$ 214$ 208$ 230$ 227$ 225$
Other income
Internal recovery 14,036 13,734 12,764 10,453 10,934 11,341
Insurance recovery 87 101 (44) 1,598 4,044 98
Other revenue 132 638 95 68 44 25
Government transfers
Grants - federal and provincial - - 454 - - -
Government transfers for operating - - - 35 20 15
TOTAL REVENUE 14,476 14,687 13,477 12,384 15,269 11,704
EXPENSES
Salaries, wages and benefits 4,625 4,365 4,320 3,413 3,506 3,068
Other personnel costs 87 86 66 79 37 40
Contracted and general services 4,439 3,786 4,509 4,820 5,942 3,632
Materials and supplies 857 726 1,244 588 550 557
Interest on long-term debt - ACFA 311 273 276 205 223 474
Interest on long-term debt - infrastructure 32 40 - - - -
Other operating expenses - 66 (69) 41 (10) 6
Amortization of tangible capital assets 10,730 8,542 8,284 7,403 7,020 7,186 Loss (gain) on disposal of tangible capital assets (300) (52) (221) (260) (7) (205)
Internal charges 1,494 1,548 1,296 1,129 1,087 1,063
TOTAL EXPENSES 22,275 19,380 19,705 17,418 18,348 15,821
Excess (deficiency) of revenue over expenses $ (7,799) $ (4,693) $ (6,228) $ (5,034) $ (3,079) $ (4,117)
$ 667
SCHEDULE OF OPERATING REVENUE & EXPENSES BY OBJECT
City of Medicine Hat, Alberta
The above represents actual transactions before consolidation eliminations.
Page 75 2016 Financial Report
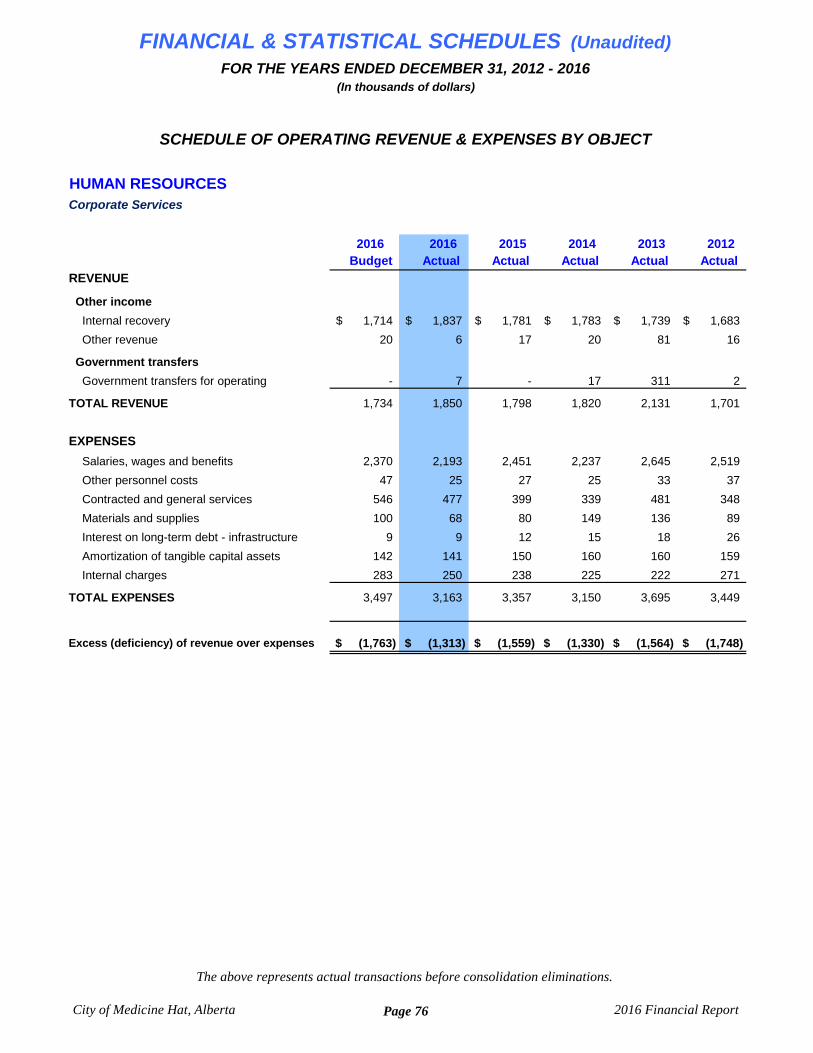
FINANCIAL & STATISTICAL SCHEDULES (Unaudited)FOR THE YEARS ENDED DECEMBER 31, 2012 - 2016
(In thousands of dollars)
HUMAN RESOURCESCorporate Services
2016 2016 2015 2014 2013 2012 Budget Actual Actual Actual Actual Actual
REVENUE
Other income
Internal recovery 1,714$ 1,837$ 1,781$ 1,783$ 1,739$ 1,683$
Other revenue 20 6 17 20 81 16
Government transfers
Government transfers for operating - 7 - 17 311 2
TOTAL REVENUE 1,734 1,850 1,798 1,820 2,131 1,701
EXPENSES
Salaries, wages and benefits 2,370 2,193 2,451 2,237 2,645 2,519
Other personnel costs 47 25 27 25 33 37
Contracted and general services 546 477 399 339 481 348
Materials and supplies 100 68 80 149 136 89
Interest on long-term debt - infrastructure 9 9 12 15 18 26
Amortization of tangible capital assets 142 141 150 160 160 159
Internal charges 283 250 238 225 222 271
TOTAL EXPENSES 3,497 3,163 3,357 3,150 3,695 3,449
Excess (deficiency) of revenue over expenses $ (1,763) $ (1,313) $ (1,559) $ (1,330) $ (1,564) $ (1,748)
SCHEDULE OF OPERATING REVENUE & EXPENSES BY OBJECT
City of Medicine Hat, Alberta
The above represents actual transactions before consolidation eliminations.
Page 76 2016 Financial Report
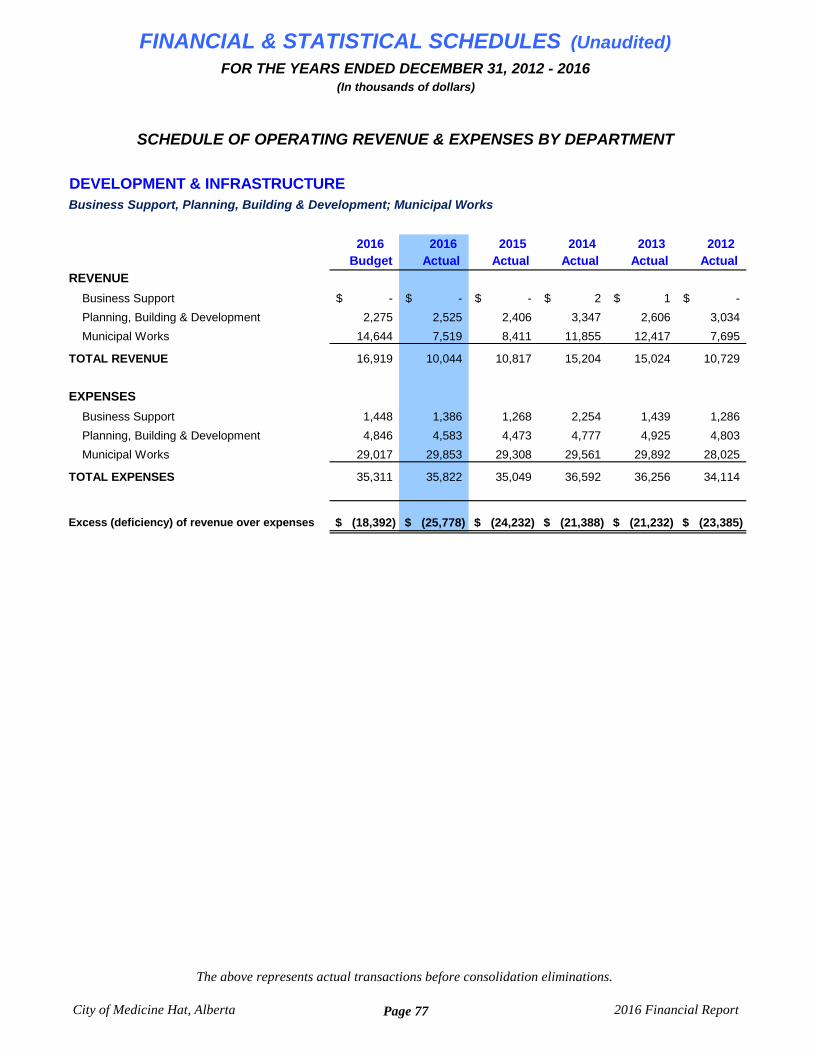
FINANCIAL & STATISTICAL SCHEDULES (Unaudited)FOR THE YEARS ENDED DECEMBER 31, 2012 - 2016
(In thousands of dollars)
DEVELOPMENT & INFRASTRUCTUREBusiness Support, Planning, Building & Development; Municipal Works
2016 2016 2015 2014 2013 2012 Budget Actual Actual Actual Actual Actual
REVENUE
Business Support -$ -$ -$ 2$ 1$ -$
Planning, Building & Development 2,275 2,525 2,406 3,347 2,606 3,034
Municipal Works 14,644 7,519 8,411 11,855 12,417 7,695
TOTAL REVENUE 16,919 10,044 10,817 15,204 15,024 10,729
EXPENSES
Business Support 1,448 1,386 1,268 2,254 1,439 1,286
Planning, Building & Development 4,846 4,583 4,473 4,777 4,925 4,803
Municipal Works 29,017 29,853 29,308 29,561 29,892 28,025
TOTAL EXPENSES 35,311 35,822 35,049 36,592 36,256 34,114
Excess (deficiency) of revenue over expenses $ (18,392) $ (25,778) $ (24,232) $ (21,388) $ (21,232) $ (23,385)
SCHEDULE OF OPERATING REVENUE & EXPENSES BY DEPARTMENT
City of Medicine Hat, Alberta
The above represents actual transactions before consolidation eliminations.
Page 77 2016 Financial Report
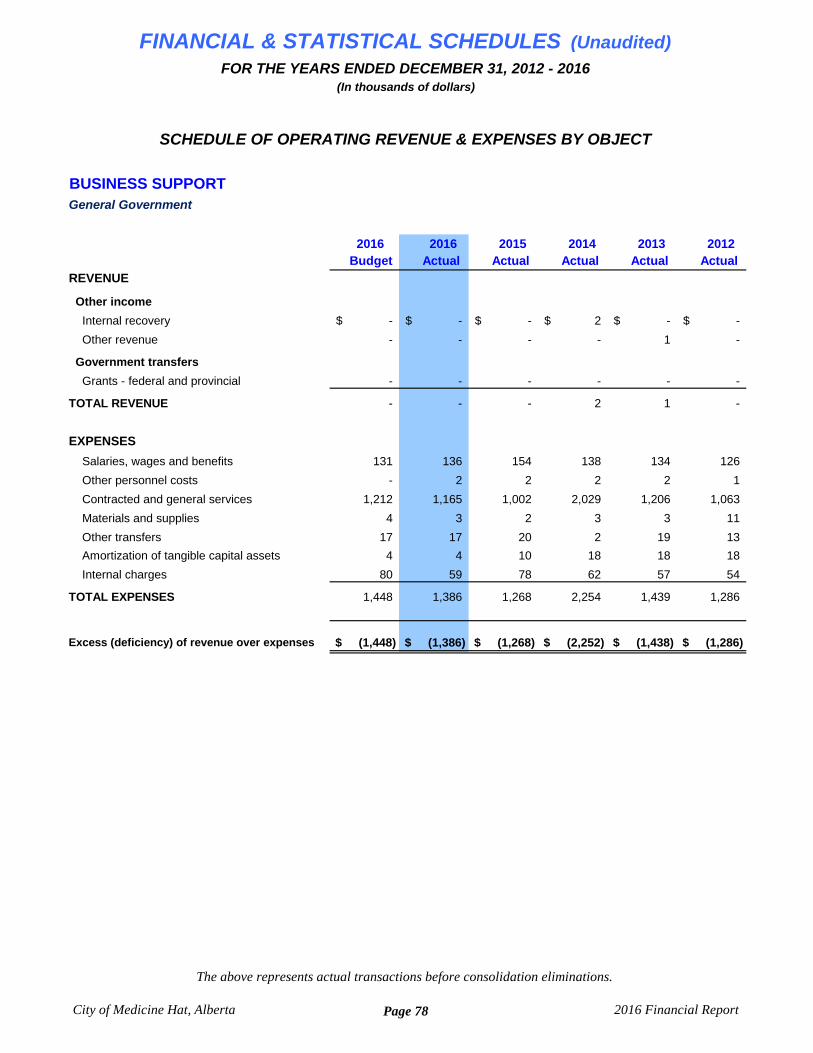
FINANCIAL & STATISTICAL SCHEDULES (Unaudited)FOR THE YEARS ENDED DECEMBER 31, 2012 - 2016
(In thousands of dollars)
BUSINESS SUPPORTGeneral Government
2016 2016 2015 2014 2013 2012 Budget Actual Actual Actual Actual Actual
REVENUE
Other income
Internal recovery -$ -$ -$ 2$ -$ -$
Other revenue - - - - 1 -
Government transfers
Grants - federal and provincial - - - - - -
TOTAL REVENUE - - - 2 1 -
EXPENSES
Salaries, wages and benefits 131 136 154 138 134 126
Other personnel costs - 2 2 2 2 1
Contracted and general services 1,212 1,165 1,002 2,029 1,206 1,063
Materials and supplies 4 3 2 3 3 11
Other transfers 17 17 20 2 19 13
Amortization of tangible capital assets 4 4 10 18 18 18
Internal charges 80 59 78 62 57 54
TOTAL EXPENSES 1,448 1,386 1,268 2,254 1,439 1,286
Excess (deficiency) of revenue over expenses $ (1,448) $ (1,386) $ (1,268) $ (2,252) $ (1,438) $ (1,286)
SCHEDULE OF OPERATING REVENUE & EXPENSES BY OBJECT
City of Medicine Hat, Alberta
The above represents actual transactions before consolidation eliminations.
Page 78 2016 Financial Report
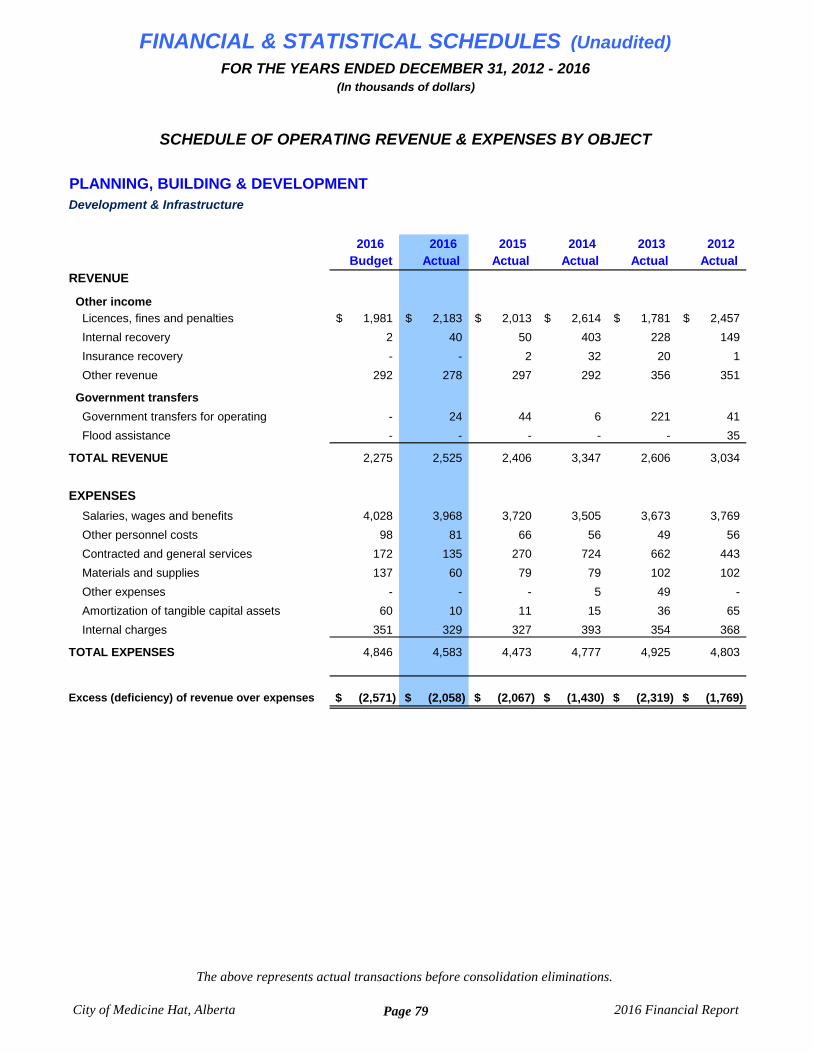
FINANCIAL & STATISTICAL SCHEDULES (Unaudited)FOR THE YEARS ENDED DECEMBER 31, 2012 - 2016
(In thousands of dollars)
PLANNING, BUILDING & DEVELOPMENTDevelopment & Infrastructure
2016 2016 2015 2014 2013 2012 Budget Actual Actual Actual Actual Actual
REVENUE
Other income
Licences, fines and penalties 1,981$ 2,183$ 2,013$ 2,614$ 1,781$ 2,457$
Internal recovery 2 40 50 403 228 149
Insurance recovery - - 2 32 20 1
Other revenue 292 278 297 292 356 351
Government transfers
Government transfers for operating - 24 44 6 221 41
Flood assistance - - - - - 35
TOTAL REVENUE 2,275 2,525 2,406 3,347 2,606 3,034
EXPENSES
Salaries, wages and benefits 4,028 3,968 3,720 3,505 3,673 3,769
Other personnel costs 98 81 66 56 49 56
Contracted and general services 172 135 270 724 662 443
Materials and supplies 137 60 79 79 102 102
Other expenses - - - 5 49 -
Amortization of tangible capital assets 60 10 11 15 36 65
Internal charges 351 329 327 393 354 368
TOTAL EXPENSES 4,846 4,583 4,473 4,777 4,925 4,803
Excess (deficiency) of revenue over expenses $ (2,571) $ (2,058) $ (2,067) $ (1,430) $ (2,319) $ (1,769)
SCHEDULE OF OPERATING REVENUE & EXPENSES BY OBJECT
City of Medicine Hat, Alberta
The above represents actual transactions before consolidation eliminations.
Page 79 2016 Financial Report
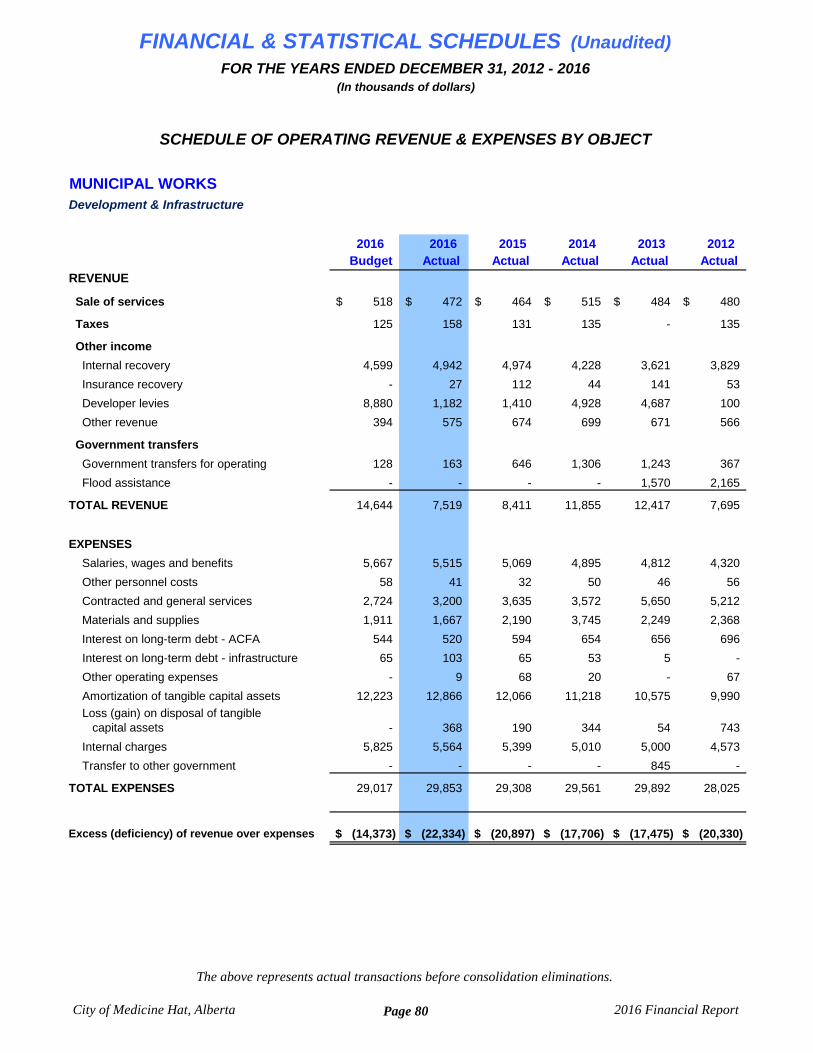
FINANCIAL & STATISTICAL SCHEDULES (Unaudited)FOR THE YEARS ENDED DECEMBER 31, 2012 - 2016
(In thousands of dollars)
MUNICIPAL WORKSDevelopment & Infrastructure
2016 2016 2015 2014 2013 2012 Budget Actual Actual Actual Actual Actual
REVENUE
Sale of services 518$ 472$ 464$ 515$ 484$ 480$
Taxes 125 158 131 135 - 135
Other income
Internal recovery 4,599 4,942 4,974 4,228 3,621 3,829
Insurance recovery - 27 112 44 141 53
Developer levies 8,880 1,182 1,410 4,928 4,687 100
Other revenue 394 575 674 699 671 566
Government transfers
Government transfers for operating 128 163 646 1,306 1,243 367
Flood assistance - - - - 1,570 2,165
TOTAL REVENUE 14,644 7,519 8,411 11,855 12,417 7,695
EXPENSES
Salaries, wages and benefits 5,667 5,515 5,069 4,895 4,812 4,320
Other personnel costs 58 41 32 50 46 56
Contracted and general services 2,724 3,200 3,635 3,572 5,650 5,212
Materials and supplies 1,911 1,667 2,190 3,745 2,249 2,368
Interest on long-term debt - ACFA 544 520 594 654 656 696
Interest on long-term debt - infrastructure 65 103 65 53 5 -
Other operating expenses - 9 68 20 - 67
Amortization of tangible capital assets 12,223 12,866 12,066 11,218 10,575 9,990
Loss (gain) on disposal of tangible capital assets - 368 190 344 54 743
Internal charges 5,825 5,564 5,399 5,010 5,000 4,573
Transfer to other government - - - - 845 -
TOTAL EXPENSES 29,017 29,853 29,308 29,561 29,892 28,025
Excess (deficiency) of revenue over expenses $ (14,373) $ (22,334) $ (20,897) $ (17,706) $ (17,475) $ (20,330)
SCHEDULE OF OPERATING REVENUE & EXPENSES BY OBJECT
City of Medicine Hat, Alberta
The above represents actual transactions before consolidation eliminations.
Page 80 2016 Financial Report

FINANCIAL & STATISTICAL SCHEDULES (Unaudited)FOR THE YEARS ENDED DECEMBER 31, 2012 - 2016
(In thousands of dollars)
PUBLIC SERVICESCommunity Development; Parks & Recreation; Fire Services; Public Organizations; Culture
2016 2016 2015 2014 2013 2012 Budget Actual Actual Actual Actual Actual
REVENUE
Community Development 7,092$ 6,427$ 6,622$ 6,897$ 7,927$ 6,984$
Parks & Recreation 6,848 6,766 7,008 9,537 10,036 7,230
Fire Services 371 441 425 416 509 432
Public Organizations - - - - - -
TOTAL REVENUE 14,311 13,634 14,055 16,850 18,472 14,646
EXPENSES
Community Development 19,588 19,334 18,649 18,913 19,001 18,567
Parks & Recreation 25,003 27,409 24,001 21,966 22,872 20,475
Fire Services 14,496 14,334 13,709 13,222 12,021 12,050
Public Organizations 2,937 3,176 2,725 2,845 2,665 2,635
TOTAL EXPENSES 62,024 64,253 59,084 56,946 56,559 53,727
Excess (deficiency) of revenue over expenses $ (47,713) $ (50,619) $ (45,029) $ (40,096) $ (38,087) $ (39,081)
$ (37,030)
SCHEDULE OF OPERATING REVENUE & EXPENSES BY DEPARTMENT
City of Medicine Hat, Alberta
The above represents actual transactions before consolidation eliminations.
Page 81 2016 Financial Report

FINANCIAL & STATISTICAL SCHEDULES (Unaudited)FOR THE YEARS ENDED DECEMBER 31, 2012 - 2016
(In thousands of dollars)
COMMUNITY DEVELOPMENTPublic Services
2016 2016 2015 2014 2013 2012 Budget Actual Actual Actual Actual Actual
REVENUE
Sale of services 3,918$ 3,383$ 3,638$ 3,894$ 4,080$ 4,359$
Other income
Internal recovery 151 146 142 139 128 118
Insurance recovery - 26 28 5 223 23
Other revenue 603 532 554 759 593 661
Government transfers
Government transfers for operating 2,420 2,340 2,260 2,100 1,991 1,823
Flood Assistance - - - - 912 -
TOTAL REVENUE 7,092 6,427 6,622 6,897 7,927 6,984
EXPENSES
Salaries, wages and benefits 10,546 10,593 10,013 9,974 9,643 9,576
Other personnel costs 173 107 93 88 98 93
Contracted and general services 2,988 2,582 2,950 3,378 3,532 3,430
Materials and supplies 1,922 2,093 2,148 2,447 2,493 2,165
Other expenses 11 22 129 1 30 20
Bank charges 61 62 58 63 63 62
Interest on long-term debt - ACFA - - - 5 - -
Interest on long-term debt - infrastructure 25 14 12 - - -
Grants and other transfers 310 489 173 187 192 179
Amortization of tangible capital assets 441 476 369 260 302 319
Loss (gain) on disposal of tangible capital assets - - - (2) - 6
Internal charges 3,111 2,896 2,704 2,512 2,648 2,717
TOTAL EXPENSES 19,588 19,334 18,649 18,913 19,001 18,567
Excess (deficiency) of revenue over expenses $ (12,496) $ (12,907) $ (12,027) $ (12,016) $ (11,074) $ (11,583)
SCHEDULE OF OPERATING REVENUE & EXPENSES BY OBJECT
City of Medicine Hat, Alberta
The above represents actual transactions before consolidation eliminations.
Page 82 2016 Financial Report
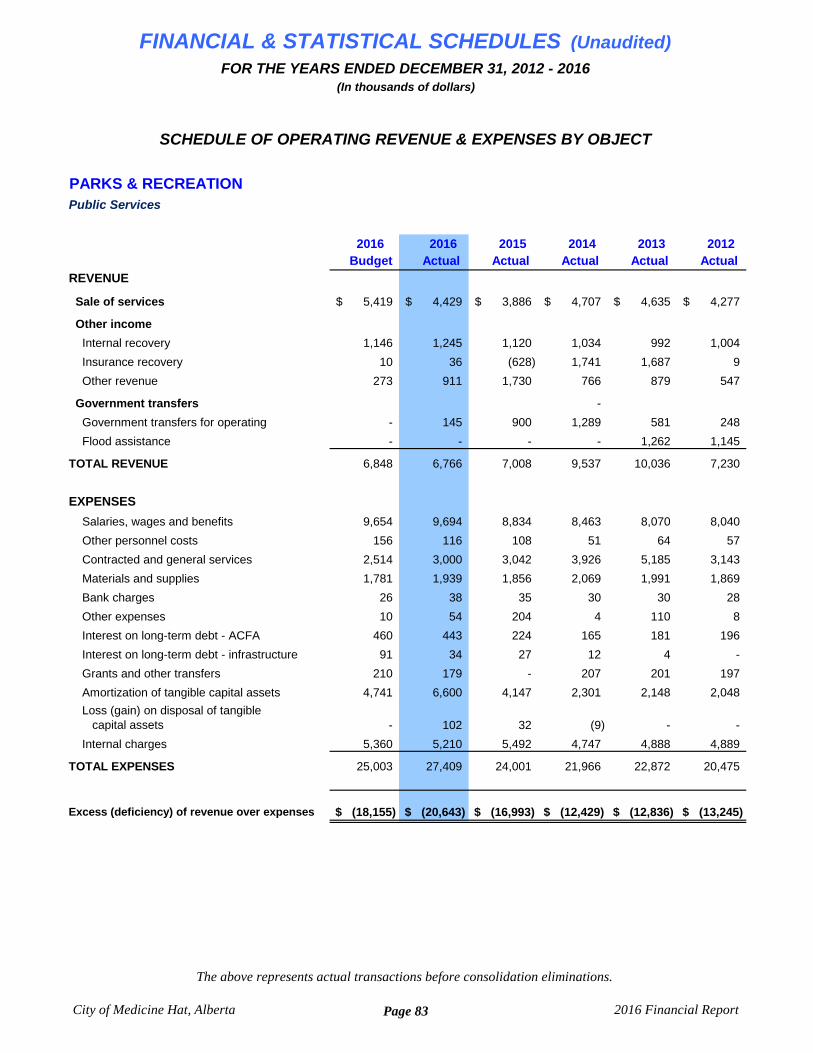
FINANCIAL & STATISTICAL SCHEDULES (Unaudited)FOR THE YEARS ENDED DECEMBER 31, 2012 - 2016
(In thousands of dollars)
PARKS & RECREATIONPublic Services
2016 2016 2015 2014 2013 2012 Budget Actual Actual Actual Actual Actual
REVENUE
Sale of services 5,419$ 4,429$ 3,886$ 4,707$ 4,635$ 4,277$
Other income
Internal recovery 1,146 1,245 1,120 1,034 992 1,004
Insurance recovery 10 36 (628) 1,741 1,687 9
Other revenue 273 911 1,730 766 879 547
Government transfers -
Government transfers for operating - 145 900 1,289 581 248
Flood assistance - - - - 1,262 1,145
TOTAL REVENUE 6,848 6,766 7,008 9,537 10,036 7,230
EXPENSES
Salaries, wages and benefits 9,654 9,694 8,834 8,463 8,070 8,040
Other personnel costs 156 116 108 51 64 57
Contracted and general services 2,514 3,000 3,042 3,926 5,185 3,143
Materials and supplies 1,781 1,939 1,856 2,069 1,991 1,869
Bank charges 26 38 35 30 30 28
Other expenses 10 54 204 4 110 8
Interest on long-term debt - ACFA 460 443 224 165 181 196
Interest on long-term debt - infrastructure 91 34 27 12 4 -
Grants and other transfers 210 179 - 207 201 197
Amortization of tangible capital assets 4,741 6,600 4,147 2,301 2,148 2,048
Loss (gain) on disposal of tangible capital assets - 102 32 (9) - -
Internal charges 5,360 5,210 5,492 4,747 4,888 4,889
TOTAL EXPENSES 25,003 27,409 24,001 21,966 22,872 20,475
Excess (deficiency) of revenue over expenses $ (18,155) $ (20,643) $ (16,993) $ (12,429) $ (12,836) $ (13,245)
SCHEDULE OF OPERATING REVENUE & EXPENSES BY OBJECT
City of Medicine Hat, Alberta
The above represents actual transactions before consolidation eliminations.
Page 83 2016 Financial Report
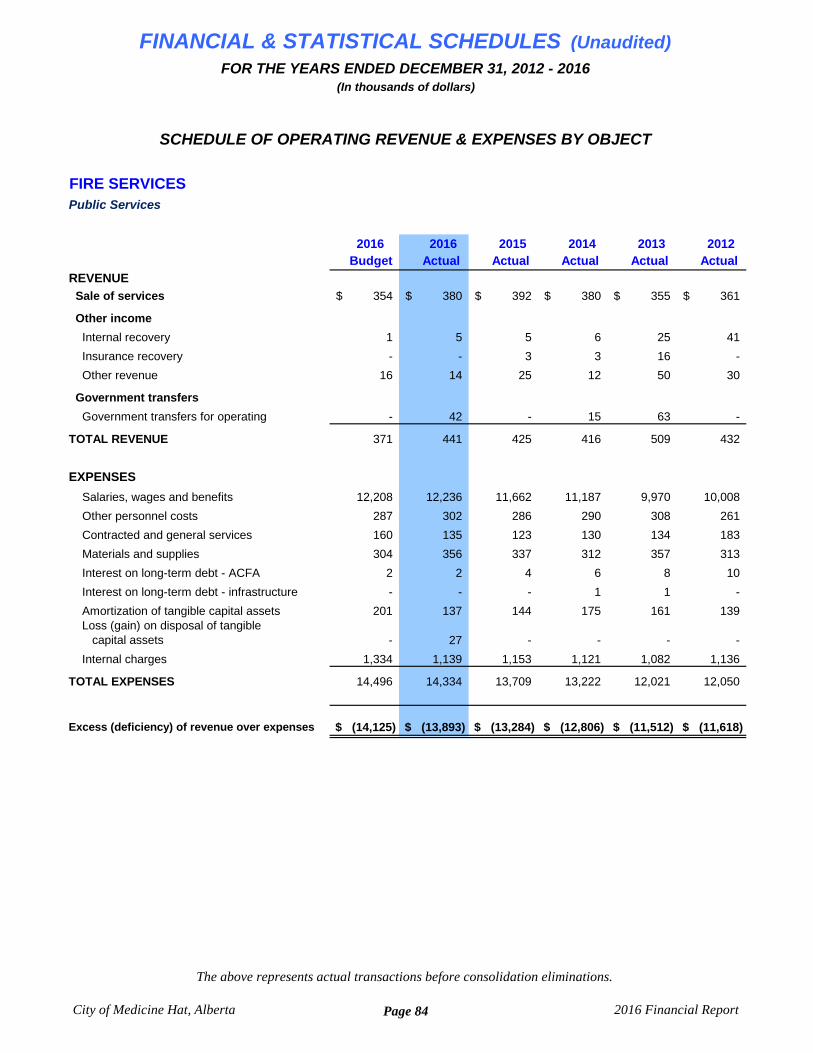
FINANCIAL & STATISTICAL SCHEDULES (Unaudited)FOR THE YEARS ENDED DECEMBER 31, 2012 - 2016
(In thousands of dollars)
FIRE SERVICES Public Services
2016 2016 2015 2014 2013 2012 Budget Actual Actual Actual Actual Actual
REVENUE
Sale of services 354$ 380$ 392$ 380$ 355$ 361$
Other income
Internal recovery 1 5 5 6 25 41
Insurance recovery - - 3 3 16 -
Other revenue 16 14 25 12 50 30
Government transfers
Government transfers for operating - 42 - 15 63 -
TOTAL REVENUE 371 441 425 416 509 432
EXPENSES
Salaries, wages and benefits 12,208 12,236 11,662 11,187 9,970 10,008
Other personnel costs 287 302 286 290 308 261
Contracted and general services 160 135 123 130 134 183
Materials and supplies 304 356 337 312 357 313
Interest on long-term debt - ACFA 2 2 4 6 8 10
Interest on long-term debt - infrastructure - - - 1 1 -
Amortization of tangible capital assets 201 137 144 175 161 139 Loss (gain) on disposal of tangible capital assets - 27 - - - -
Internal charges 1,334 1,139 1,153 1,121 1,082 1,136
TOTAL EXPENSES 14,496 14,334 13,709 13,222 12,021 12,050
Excess (deficiency) of revenue over expenses $ (14,125) $ (13,893) $ (13,284) $ (12,806) $ (11,512) $ (11,618)
SCHEDULE OF OPERATING REVENUE & EXPENSES BY OBJECT
City of Medicine Hat, Alberta
The above represents actual transactions before consolidation eliminations.
Page 84 2016 Financial Report
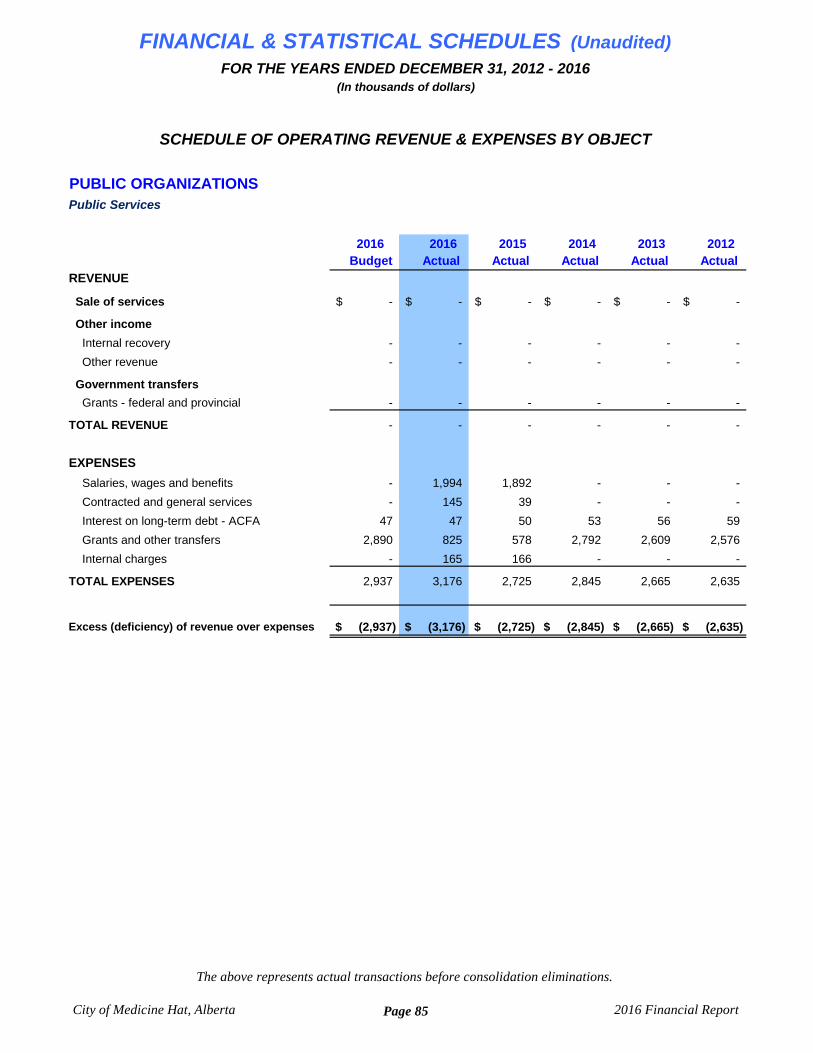
FINANCIAL & STATISTICAL SCHEDULES (Unaudited)FOR THE YEARS ENDED DECEMBER 31, 2012 - 2016
(In thousands of dollars)
PUBLIC ORGANIZATIONSPublic Services
2016 2016 2015 2014 2013 2012 Budget Actual Actual Actual Actual Actual
REVENUE
Sale of services -$ -$ -$ -$ -$ -$
Other income
Internal recovery - - - - - -
Other revenue - - - - - -
Government transfers
Grants - federal and provincial - - - - - -
TOTAL REVENUE - - - - - -
EXPENSES
Salaries, wages and benefits - 1,994 1,892 - - -
Contracted and general services - 145 39 - - -
Interest on long-term debt - ACFA 47 47 50 53 56 59
Grants and other transfers 2,890 825 578 2,792 2,609 2,576
Internal charges - 165 166 - - -
TOTAL EXPENSES 2,937 3,176 2,725 2,845 2,665 2,635
Excess (deficiency) of revenue over expenses $ (2,937) $ (3,176) $ (2,725) $ (2,845) $ (2,665) $ (2,635)
SCHEDULE OF OPERATING REVENUE & EXPENSES BY OBJECT
City of Medicine Hat, Alberta
The above represents actual transactions before consolidation eliminations.
Page 85 2016 Financial Report
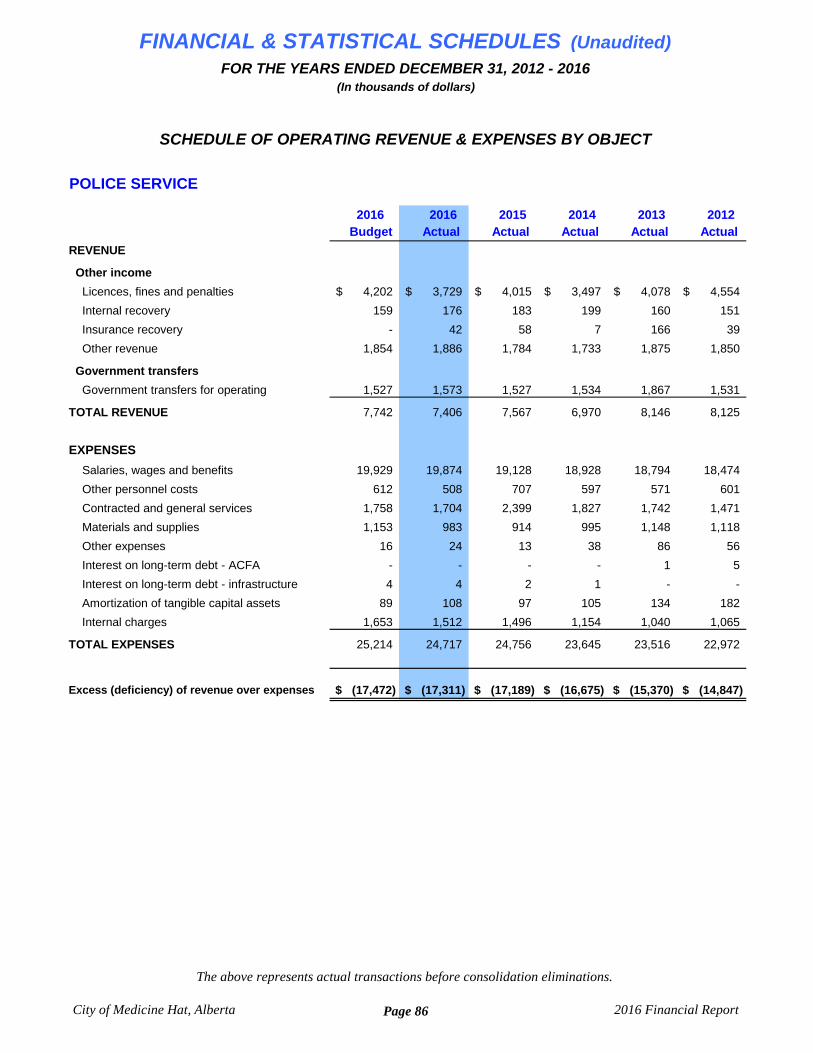
FINANCIAL & STATISTICAL SCHEDULES (Unaudited)FOR THE YEARS ENDED DECEMBER 31, 2012 - 2016
(In thousands of dollars)
POLICE SERVICE
2016 2016 2015 2014 2013 2012 Budget Actual Actual Actual Actual Actual
REVENUE
Other income
Licences, fines and penalties 4,202$ 3,729$ 4,015$ 3,497$ 4,078$ 4,554$
Internal recovery 159 176 183 199 160 151
Insurance recovery - 42 58 7 166 39
Other revenue 1,854 1,886 1,784 1,733 1,875 1,850
Government transfers
Government transfers for operating 1,527 1,573 1,527 1,534 1,867 1,531
TOTAL REVENUE 7,742 7,406 7,567 6,970 8,146 8,125
EXPENSES
Salaries, wages and benefits 19,929 19,874 19,128 18,928 18,794 18,474
Other personnel costs 612 508 707 597 571 601
Contracted and general services 1,758 1,704 2,399 1,827 1,742 1,471
Materials and supplies 1,153 983 914 995 1,148 1,118
Other expenses 16 24 13 38 86 56
Interest on long-term debt - ACFA - - - - 1 5
Interest on long-term debt - infrastructure 4 4 2 1 - -
Amortization of tangible capital assets 89 108 97 105 134 182
Internal charges 1,653 1,512 1,496 1,154 1,040 1,065
TOTAL EXPENSES 25,214 24,717 24,756 23,645 23,516 22,972
Excess (deficiency) of revenue over expenses $ (17,472) $ (17,311) $ (17,189) $ (16,675) $ (15,370) $ (14,847)
SCHEDULE OF OPERATING REVENUE & EXPENSES BY OBJECT
City of Medicine Hat, Alberta
The above represents actual transactions before consolidation eliminations.
Page 86 2016 Financial Report
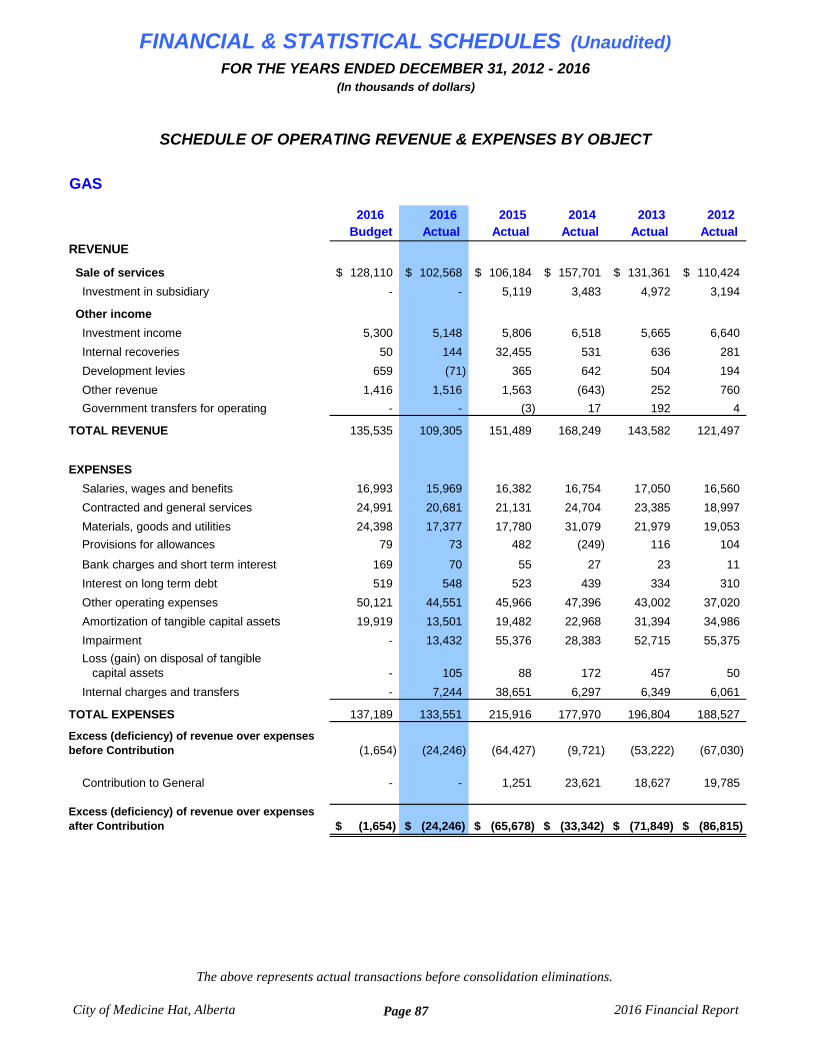
FINANCIAL & STATISTICAL SCHEDULES (Unaudited)FOR THE YEARS ENDED DECEMBER 31, 2012 - 2016
(In thousands of dollars)
GAS
2016 2016 2015 2014 2013 2012 Budget Actual Actual Actual Actual Actual
REVENUE
Sale of services 128,110$ 102,568$ 106,184$ 157,701$ 131,361$ 110,424$
Investment in subsidiary - - 5,119 3,483 4,972 3,194
Other income
Investment income 5,300 5,148 5,806 6,518 5,665 6,640
Internal recoveries 50 144 32,455 531 636 281
Development levies 659 (71) 365 642 504 194
Other revenue 1,416 1,516 1,563 (643) 252 760
Government transfers for operating - - (3) 17 192 4
TOTAL REVENUE 135,535 109,305 151,489 168,249 143,582 121,497
EXPENSES
Salaries, wages and benefits 16,993 15,969 16,382 16,754 17,050 16,560
Contracted and general services 24,991 20,681 21,131 24,704 23,385 18,997
Materials, goods and utilities 24,398 17,377 17,780 31,079 21,979 19,053
Provisions for allowances 79 73 482 (249) 116 104
Bank charges and short term interest 169 70 55 27 23 11
Interest on long term debt 519 548 523 439 334 310
Other operating expenses 50,121 44,551 45,966 47,396 43,002 37,020
Amortization of tangible capital assets 19,919 13,501 19,482 22,968 31,394 34,986
Impairment - 13,432 55,376 28,383 52,715 55,375
Loss (gain) on disposal of tangible capital assets - 105 88 172 457 50
Internal charges and transfers - 7,244 38,651 6,297 6,349 6,061
TOTAL EXPENSES 137,189 133,551 215,916 177,970 196,804 188,527
Excess (deficiency) of revenue over expenses before Contribution (1,654) (24,246) (64,427) (9,721) (53,222) (67,030)
Contribution to General - - 1,251 23,621 18,627 19,785
Excess (deficiency) of revenue over expenses after Contribution $ (1,654) $ (24,246) $ (65,678) $ (33,342) $ (71,849) $ (86,815)
SCHEDULE OF OPERATING REVENUE & EXPENSES BY OBJECT
City of Medicine Hat, Alberta
The above represents actual transactions before consolidation eliminations.
Page 87 2016 Financial Report
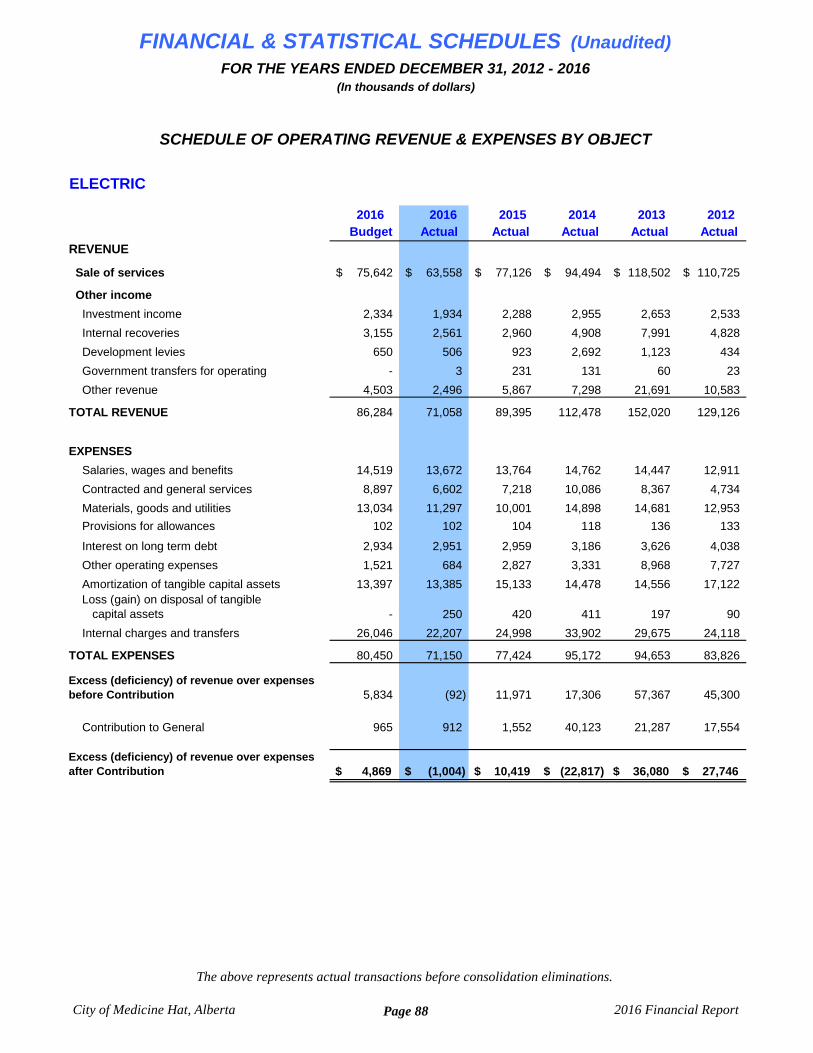
FINANCIAL & STATISTICAL SCHEDULES (Unaudited)FOR THE YEARS ENDED DECEMBER 31, 2012 - 2016
(In thousands of dollars)
ELECTRIC
2016 2016 2015 2014 2013 2012 Budget Actual Actual Actual Actual Actual
REVENUE
Sale of services 75,642$ 63,558$ 77,126$ 94,494$ 118,502$ 110,725$
Other income
Investment income 2,334 1,934 2,288 2,955 2,653 2,533
Internal recoveries 3,155 2,561 2,960 4,908 7,991 4,828
Development levies 650 506 923 2,692 1,123 434
Government transfers for operating - 3 231 131 60 23
Other revenue 4,503 2,496 5,867 7,298 21,691 10,583
TOTAL REVENUE 86,284 71,058 89,395 112,478 152,020 129,126
EXPENSES
Salaries, wages and benefits 14,519 13,672 13,764 14,762 14,447 12,911
Contracted and general services 8,897 6,602 7,218 10,086 8,367 4,734
Materials, goods and utilities 13,034 11,297 10,001 14,898 14,681 12,953
Provisions for allowances 102 102 104 118 136 133
Interest on long term debt 2,934 2,951 2,959 3,186 3,626 4,038
Other operating expenses 1,521 684 2,827 3,331 8,968 7,727
Amortization of tangible capital assets 13,397 13,385 15,133 14,478 14,556 17,122 Loss (gain) on disposal of tangible capital assets - 250 420 411 197 90
Internal charges and transfers 26,046 22,207 24,998 33,902 29,675 24,118
TOTAL EXPENSES 80,450 71,150 77,424 95,172 94,653 83,826
Excess (deficiency) of revenue over expenses before Contribution 5,834 (92) 11,971 17,306 57,367 45,300
Contribution to General 965 912 1,552 40,123 21,287 17,554
Excess (deficiency) of revenue over expenses after Contribution $ 4,869 $ (1,004) $ 10,419 $ (22,817) $ 36,080 $ 27,746
SCHEDULE OF OPERATING REVENUE & EXPENSES BY OBJECT
City of Medicine Hat, Alberta
The above represents actual transactions before consolidation eliminations.
Page 88 2016 Financial Report
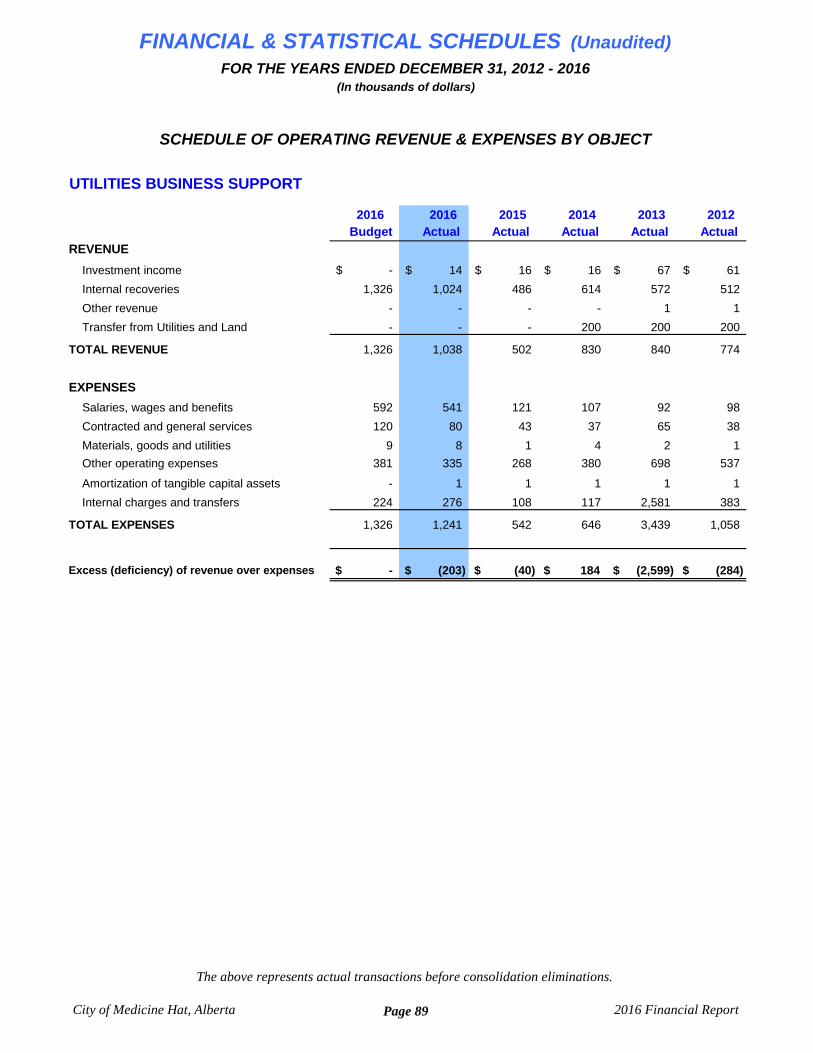
FINANCIAL & STATISTICAL SCHEDULES (Unaudited)FOR THE YEARS ENDED DECEMBER 31, 2012 - 2016
(In thousands of dollars)
UTILITIES BUSINESS SUPPORT
2016 2016 2015 2014 2013 2012 Budget Actual Actual Actual Actual Actual
REVENUE
Investment income -$ 14$ 16$ 16$ 67$ 61$
Internal recoveries 1,326 1,024 486 614 572 512
Other revenue - - - - 1 1
Transfer from Utilities and Land - - - 200 200 200
TOTAL REVENUE 1,326 1,038 502 830 840 774
EXPENSES
Salaries, wages and benefits 592 541 121 107 92 98
Contracted and general services 120 80 43 37 65 38
Materials, goods and utilities 9 8 1 4 2 1
Other operating expenses 381 335 268 380 698 537
Amortization of tangible capital assets - 1 1 1 1 1
Internal charges and transfers 224 276 108 117 2,581 383
TOTAL EXPENSES 1,326 1,241 542 646 3,439 1,058
Excess (deficiency) of revenue over expenses $ - $ (203) $ (40) $ 184 $ (2,599) $ (284)
SCHEDULE OF OPERATING REVENUE & EXPENSES BY OBJECT
City of Medicine Hat, Alberta
The above represents actual transactions before consolidation eliminations.
Page 89 2016 Financial Report
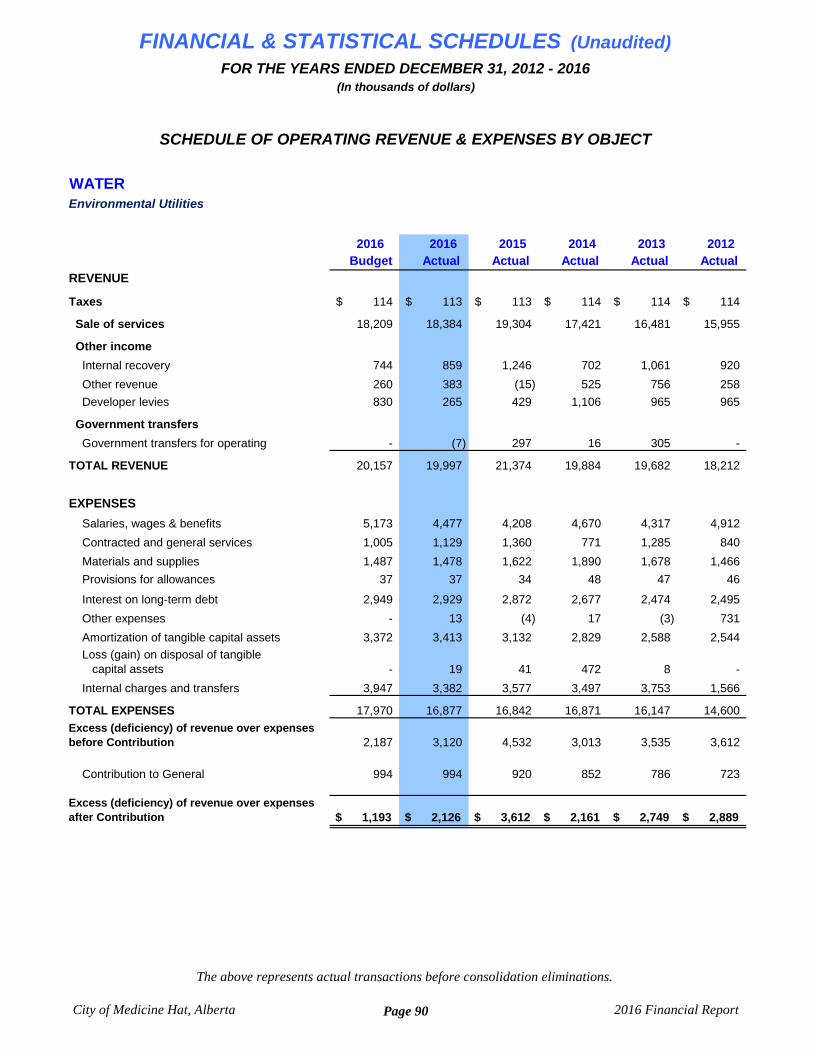
FINANCIAL & STATISTICAL SCHEDULES (Unaudited)FOR THE YEARS ENDED DECEMBER 31, 2012 - 2016
(In thousands of dollars)
WATER Environmental Utilities
2016 2016 2015 2014 2013 2012 Budget Actual Actual Actual Actual Actual
REVENUE
Taxes 114$ 113$ 113$ 114$ 114$ 114$
Sale of services 18,209 18,384 19,304 17,421 16,481 15,955
Other income
Internal recovery 744 859 1,246 702 1,061 920
Other revenue 260 383 (15) 525 756 258
Developer levies 830 265 429 1,106 965 965
Government transfers
Government transfers for operating - (7) 297 16 305 -
TOTAL REVENUE 20,157 19,997 21,374 19,884 19,682 18,212
EXPENSES
Salaries, wages & benefits 5,173 4,477 4,208 4,670 4,317 4,912
Contracted and general services 1,005 1,129 1,360 771 1,285 840
Materials and supplies 1,487 1,478 1,622 1,890 1,678 1,466
Provisions for allowances 37 37 34 48 47 46
Interest on long-term debt 2,949 2,929 2,872 2,677 2,474 2,495
Other expenses - 13 (4) 17 (3) 731
Amortization of tangible capital assets 3,372 3,413 3,132 2,829 2,588 2,544
Loss (gain) on disposal of tangible capital assets - 19 41 472 8 -
Internal charges and transfers 3,947 3,382 3,577 3,497 3,753 1,566
TOTAL EXPENSES 17,970 16,877 16,842 16,871 16,147 14,600
Excess (deficiency) of revenue over expenses before Contribution 2,187 3,120 4,532 3,013 3,535 3,612
Contribution to General 994 994 920 852 786 723
Excess (deficiency) of revenue over expenses after Contribution $ 1,193 $ 2,126 $ 3,612 $ 2,161 $ 2,749 $ 2,889
SCHEDULE OF OPERATING REVENUE & EXPENSES BY OBJECT
City of Medicine Hat, Alberta
The above represents actual transactions before consolidation eliminations.
Page 90 2016 Financial Report
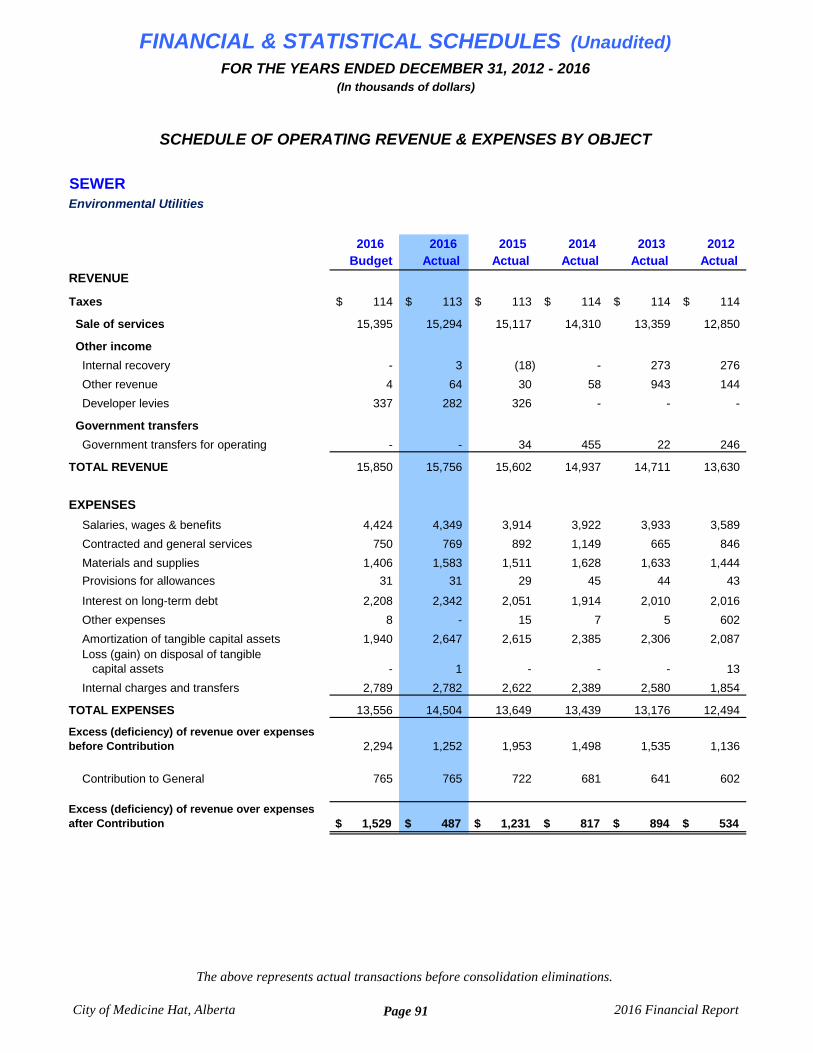
FINANCIAL & STATISTICAL SCHEDULES (Unaudited)FOR THE YEARS ENDED DECEMBER 31, 2012 - 2016
(In thousands of dollars)
SEWEREnvironmental Utilities
2016 2016 2015 2014 2013 2012 Budget Actual Actual Actual Actual Actual
REVENUE
Taxes 114$ 113$ 113$ 114$ 114$ 114$
Sale of services 15,395 15,294 15,117 14,310 13,359 12,850
Other income
Internal recovery - 3 (18) - 273 276
Other revenue 4 64 30 58 943 144
Developer levies 337 282 326 - - -
Government transfers
Government transfers for operating - - 34 455 22 246
TOTAL REVENUE 15,850 15,756 15,602 14,937 14,711 13,630
EXPENSES
Salaries, wages & benefits 4,424 4,349 3,914 3,922 3,933 3,589
Contracted and general services 750 769 892 1,149 665 846
Materials and supplies 1,406 1,583 1,511 1,628 1,633 1,444
Provisions for allowances 31 31 29 45 44 43
Interest on long-term debt 2,208 2,342 2,051 1,914 2,010 2,016
Other expenses 8 - 15 7 5 602
Amortization of tangible capital assets 1,940 2,647 2,615 2,385 2,306 2,087 Loss (gain) on disposal of tangible capital assets - 1 - - - 13
Internal charges and transfers 2,789 2,782 2,622 2,389 2,580 1,854
TOTAL EXPENSES 13,556 14,504 13,649 13,439 13,176 12,494
Excess (deficiency) of revenue over expenses before Contribution 2,294 1,252 1,953 1,498 1,535 1,136
Contribution to General 765 765 722 681 641 602
Excess (deficiency) of revenue over expenses after Contribution $ 1,529 $ 487 $ 1,231 $ 817 $ 894 $ 534
SCHEDULE OF OPERATING REVENUE & EXPENSES BY OBJECT
City of Medicine Hat, Alberta
The above represents actual transactions before consolidation eliminations.
Page 91 2016 Financial Report
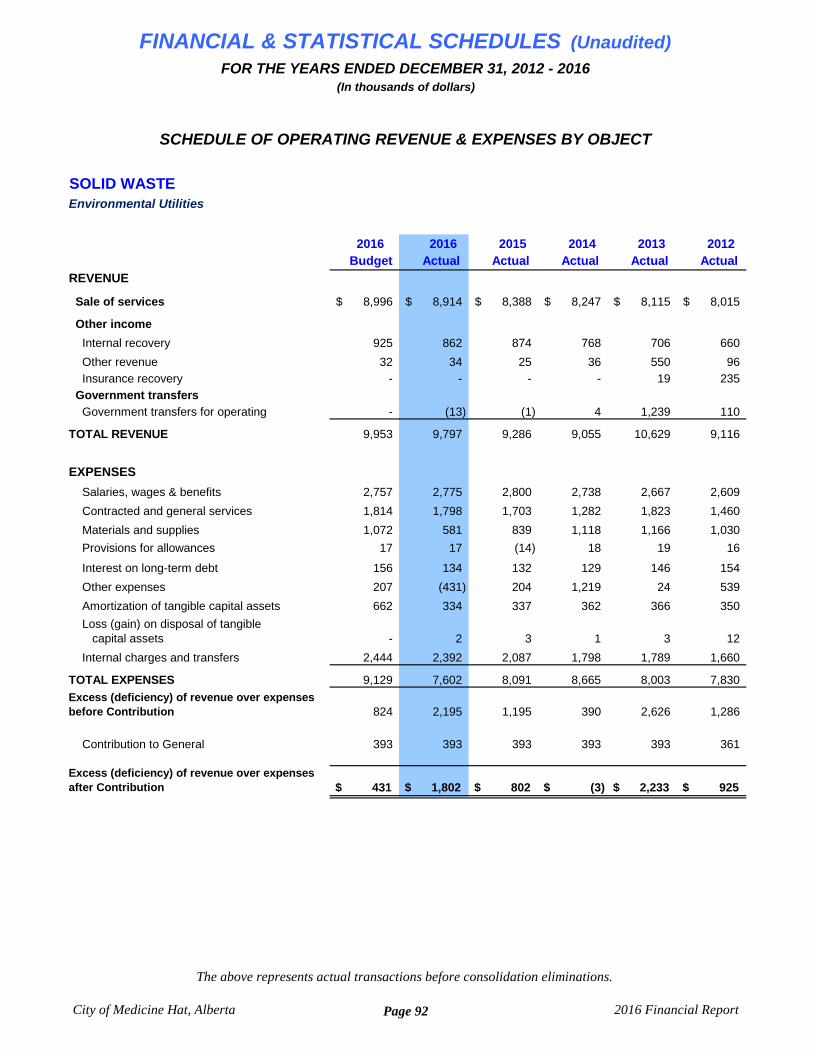
FINANCIAL & STATISTICAL SCHEDULES (Unaudited)FOR THE YEARS ENDED DECEMBER 31, 2012 - 2016
(In thousands of dollars)
SOLID WASTEEnvironmental Utilities
2016 2016 2015 2014 2013 2012 Budget Actual Actual Actual Actual Actual
REVENUE
Sale of services 8,996$ 8,914$ 8,388$ 8,247$ 8,115$ 8,015$
Other income
Internal recovery 925 862 874 768 706 660
Other revenue 32 34 25 36 550 96
Insurance recovery - - - - 19 235
Government transfers
Government transfers for operating - (13) (1) 4 1,239 110
TOTAL REVENUE 9,953 9,797 9,286 9,055 10,629 9,116
EXPENSES
Salaries, wages & benefits 2,757 2,775 2,800 2,738 2,667 2,609
Contracted and general services 1,814 1,798 1,703 1,282 1,823 1,460
Materials and supplies 1,072 581 839 1,118 1,166 1,030
Provisions for allowances 17 17 (14) 18 19 16
Interest on long-term debt 156 134 132 129 146 154
Other expenses 207 (431) 204 1,219 24 539
Amortization of tangible capital assets 662 334 337 362 366 350
Loss (gain) on disposal of tangible capital assets - 2 3 1 3 12
Internal charges and transfers 2,444 2,392 2,087 1,798 1,789 1,660
TOTAL EXPENSES 9,129 7,602 8,091 8,665 8,003 7,830
Excess (deficiency) of revenue over expenses before Contribution 824 2,195 1,195 390 2,626 1,286
Contribution to General 393 393 393 393 393 361
Excess (deficiency) of revenue over expenses after Contribution $ 431 $ 1,802 $ 802 $ (3) $ 2,233 $ 925
SCHEDULE OF OPERATING REVENUE & EXPENSES BY OBJECT
City of Medicine Hat, Alberta
The above represents actual transactions before consolidation eliminations.
Page 92 2016 Financial Report

FINANCIAL & STATISTICAL SCHEDULES (Unaudited)FOR THE YEARS ENDED DECEMBER 31, 2012 - 2016
(In thousands of dollars)
LAND & PROPERTIES
2016 2016 2015 2014 2013 2012 Budget Actual Actual Actual Actual Actual
REVENUE
Sale of services 11,450$ 3,321$ 6,751$ 10,533$ 9,626$ 7,826$
Other income
Licences fines and penalties - 1 26 5 1 84
Other revenue 235 2,399 1,172 841 376 359
Government transfers
Provincial - 7 - - - -
Flood assistance - - 7 2 3 -
TOTAL REVENUE 11,685 5,728 7,956 11,381 10,006 8,269
EXPENSES
Salaries, wages and benefits 655 552 434 644 567 548
Contracted and general services 126 214 259 111 103 76
Materials and supplies 7,888 2,389 3,969 6,662 5,458 4,962
Other expenses 3 2 1 1 28 -
Amortization of tangible capital assets 34 131 38 38 36 40
Impairment - 178 12 - - -
Gain \ loss on sale of assets - (45) (51) - - -
Internal charges and transfers 796 1,135 803 868 716 694
TOTAL EXPENSES 9,502 4,556 5,465 8,324 6,908 6,320
Excess (deficiency) of revenue over expenses before Contribution 2,183 1,172 2,491 3,057 3,098 1,949
Contribution to General - - - 5,033 1,549 692
Excess (deficiency) of revenue over expenses after Contribution $ 2,183 $ 1,172 $ 2,491 $ (1,976) $ 1,549 $ 1,257
SCHEDULE OF OPERATING REVENUE & EXPENSES BY OBJECT
City of Medicine Hat, Alberta
The above represents actual transactions before consolidation eliminations.
Page 93 2016 Financial Report

Financing
Contributed assets - private 1,680$ -$ -$ -$ 223$ 528$ -$ -$ -$ 2,431$
Debt - ACFA 1,510 - 28,236 - 4,950 11,200 - - - 45,896
Debt - infrastructure reserve 4,184 - - - - - - - - 4,184
Developer levies - (71) 506 - - - - - - 435
Government transfers for capital 20,482 - - - - - - - - 20,482
Land Sales 926 - 25 - - 1 - - - 952
Operations 4,809 2,464 10,566 - 3,327 2,144 1,028 30 - 24,368
Other 2,155 - - - - - - - - 2,155
Reserves 8,887 9,461 11,931 - - - - - - 30,279
44,633 11,854 51,264 - 8,500 13,873 1,028 30 - 131,182
Expenses
Engineered structures 12,885 9,807 45,296 - 7,001 10,663 6 - - 85,658
Buildings 20,447 - 921 - - - (105) - - 21,263
Machinery and equipment 7,103 415 382 - 607 119 64 26 - 8,716
Land Improvements 4,997 - 23 - (27) 145 82 4 - 5,224
Land - - - - - - - 510 - 510
Mobile equipment 4,133 - - - - - - - - 4,133
Major operating expenses - - - - - - - - - -
49,565 10,222 46,622 - 7,581 10,927 47 540 - 125,504
Change in Capital Fund (4,932)$ 1,632$ 4,642$ -$ 919$ 2,946$ 981$ (510)$ -$ 5,678$
SCHEDULE OF CAPITAL SEGMENTED REPORTINGFOR THE YEAR ENDED DECEMBER 31, 2016 (In thousands of dollars)
Total Tax
Supported
Gas
Utility
Electric
Utility
Utilities Business
Support
Water
Utility
Sewer
Utility
Solid Waste 2016
ConsolidatedUtility
Land &
Properties
Consolidation
Adjustments
City of Medicine Hat, Alberta Page 94 2016 Financial Report
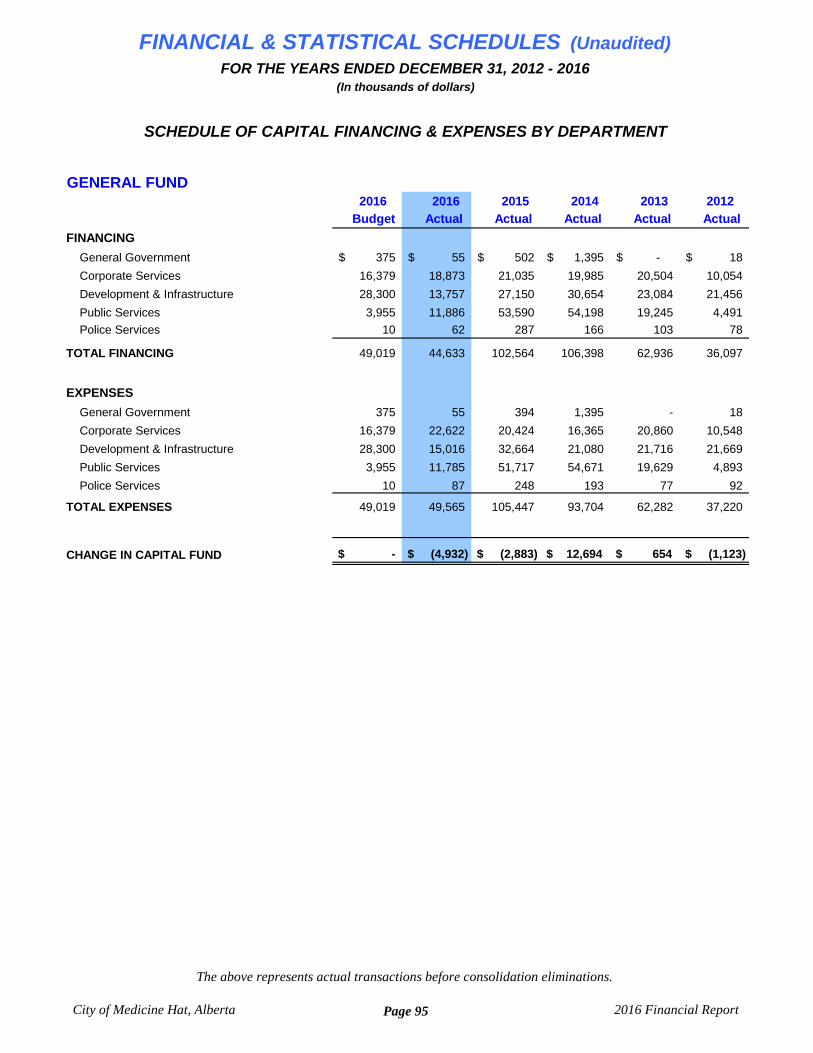
GENERAL FUND 2016 2016 2015 2014 2013 2012
Budget Actual Actual Actual Actual Actual
FINANCING
General Government 375$ 55$ 502$ 1,395$ -$ 18$
Corporate Services 16,379 18,873 21,035 19,985 20,504 10,054
Development & Infrastructure 28,300 13,757 27,150 30,654 23,084 21,456
Public Services 3,955 11,886 53,590 54,198 19,245 4,491
Police Services 10 62 287 166 103 78
TOTAL FINANCING 49,019 44,633 102,564 106,398 62,936 36,097
EXPENSES
General Government 375 55 394 1,395 - 18
Corporate Services 16,379 22,622 20,424 16,365 20,860 10,548
Development & Infrastructure 28,300 15,016 32,664 21,080 21,716 21,669
Public Services 3,955 11,785 51,717 54,671 19,629 4,893
Police Services 10 87 248 193 77 92
TOTAL EXPENSES 49,019 49,565 105,447 93,704 62,282 37,220
CHANGE IN CAPITAL FUND $ - $ (4,932) $ (2,883) $ 12,694 $ 654 $ (1,123)
FINANCIAL & STATISTICAL SCHEDULES (Unaudited)FOR THE YEARS ENDED DECEMBER 31, 2012 - 2016
(In thousands of dollars)
SCHEDULE OF CAPITAL FINANCING & EXPENSES BY DEPARTMENT
City of Medicine Hat, Alberta
The above represents actual transactions before consolidation eliminations.
Page 95 2016 Financial Report
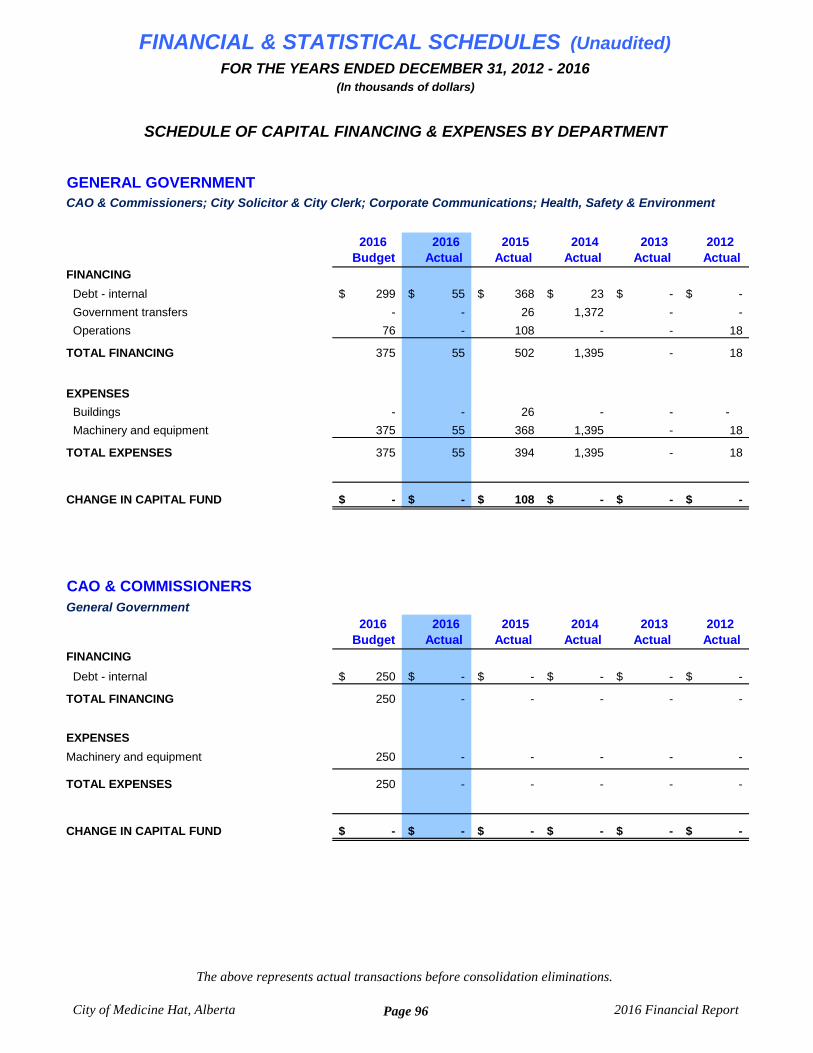
FINANCIAL & STATISTICAL SCHEDULES (Unaudited)FOR THE YEARS ENDED DECEMBER 31, 2012 - 2016
(In thousands of dollars)
SCHEDULE OF CAPITAL FINANCING & EXPENSES BY DEPARTMENT
GENERAL GOVERNMENT CAO & Commissioners; City Solicitor & City Clerk; Corporate Communications; Health, Safety & Environment
2016 2016 2015 2014 2013 2012 Budget Actual Actual Actual Actual Actual
FINANCING
Debt - internal 299$ 55$ 368$ 23$ -$ -$
Government transfers - - 26 1,372 - -
Operations 76 - 108 - - 18
TOTAL FINANCING 375 55 502 1,395 - 18
EXPENSES
Buildings - - 26 - - -
Machinery and equipment 375 55 368 1,395 - 18
TOTAL EXPENSES 375 55 394 1,395 - 18
CHANGE IN CAPITAL FUND -$ -$ 108$ -$ -$ -$
CAO & COMMISSIONERSGeneral Government
2016 2016 2015 2014 2013 2012 Budget Actual Actual Actual Actual Actual
FINANCING
Debt - internal 250$ -$ -$ -$ -$ -$
TOTAL FINANCING 250 - - - - -
EXPENSES
Machinery and equipment 250 - - - - -
TOTAL EXPENSES 250 - - - - -
CHANGE IN CAPITAL FUND -$ -$ -$ -$ -$ -$
City of Medicine Hat, Alberta
The above represents actual transactions before consolidation eliminations.
Page 96 2016 Financial Report
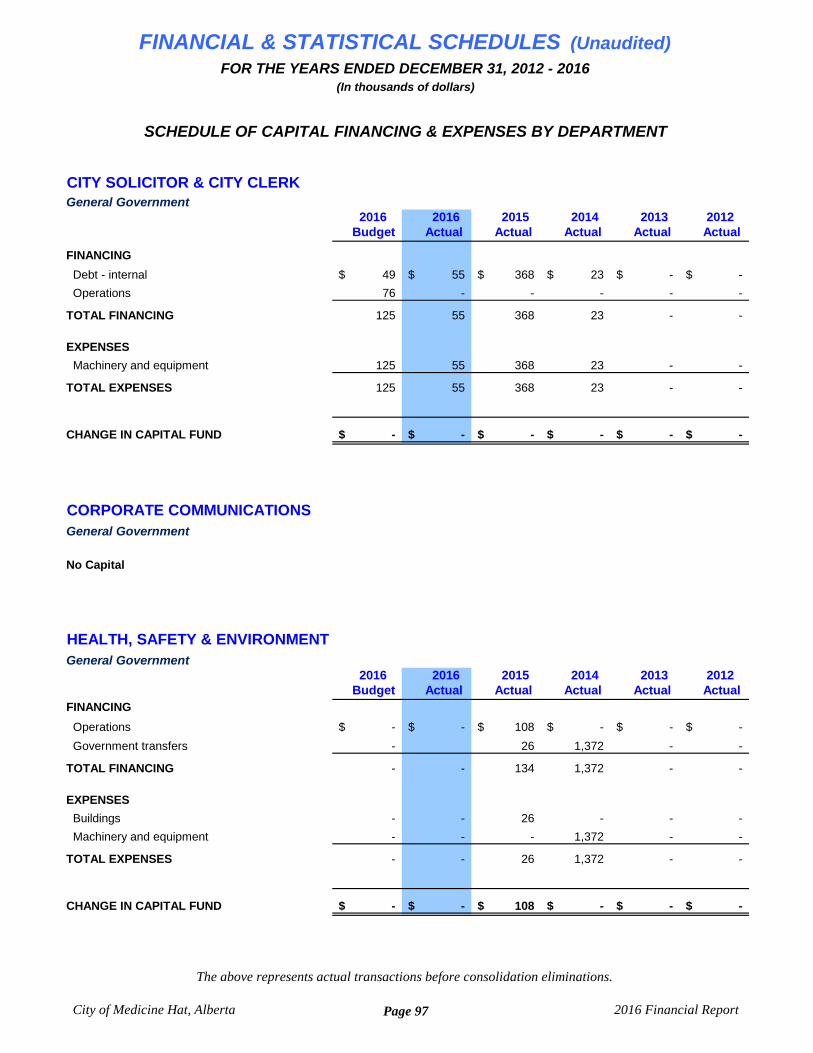
FINANCIAL & STATISTICAL SCHEDULES (Unaudited)FOR THE YEARS ENDED DECEMBER 31, 2012 - 2016
(In thousands of dollars)
SCHEDULE OF CAPITAL FINANCING & EXPENSES BY DEPARTMENT
CITY SOLICITOR & CITY CLERKGeneral Government
2016 2016 2015 2014 2013 2012 Budget Actual Actual Actual Actual Actual
FINANCING
Debt - internal 49$ 55$ 368$ 23$ -$ -$
Operations 76 - - - - -
TOTAL FINANCING 125 55 368 23 - -
EXPENSES
Machinery and equipment 125 55 368 23 - -
TOTAL EXPENSES 125 55 368 23 - -
CHANGE IN CAPITAL FUND -$ -$ -$ -$ -$ -$
CORPORATE COMMUNICATIONSGeneral Government
No Capital
HEALTH, SAFETY & ENVIRONMENTGeneral Government
2016 2016 2015 2014 2013 2012 Budget Actual Actual Actual Actual Actual
FINANCING
Operations -$ -$ 108$ -$ -$ -$
Government transfers - 26 1,372 - -
TOTAL FINANCING - - 134 1,372 - -
EXPENSES
Buildings - - 26 - - -
Machinery and equipment - - - 1,372 - -
TOTAL EXPENSES - - 26 1,372 - -
CHANGE IN CAPITAL FUND -$ -$ 108$ -$ -$ -$
City of Medicine Hat, Alberta
The above represents actual transactions before consolidation eliminations.
Page 97 2016 Financial Report

FINANCIAL & STATISTICAL SCHEDULES (Unaudited)FOR THE YEARS ENDED DECEMBER 31, 2012 - 2016
(In thousands of dollars)
SCHEDULE OF CAPITAL FINANCING & EXPENSES BY DEPARTMENT
CORPORATE SERVICES Corporate Asset Management; Finance; Human Resources; & Information & Computer Services
2016 2016 2015 2014 2013 2012 Budget Actual Actual Actual Actual Actual
FINANCING
Debt - ACFA 7,220$ (325)$ 6,450$ 3,550$ 500$ -$
Debt - internal 615 2,733 1,367 1,860 1,009 144
Government transfers 6,239 10,096 6,006 5,716 14,093 6,139
Operations 1,070 1,675 970 790 1,094 1,114
Other 550 608 - 1,236 1,595 29
Reserves 685 4,086 6,242 6,833 2,213 2,628
TOTAL FINANCING 16,379 18,873 21,035 19,985 20,504 10,054
EXPENSES
Buildings 11,709 12,362 7,853 5,323 16,736 7,151
Machinery and equipment 3,985 4,447 4,076 1,624 1,592 869
Mobile equipment 685 5,813 8,495 9,418 2,532 2,528
TOTAL EXPENSES 16,379 22,622 20,424 16,365 20,860 10,548
CHANGE IN CAPITAL FUND -$ (3,749)$ 611$ 3,620$ (356)$ (494)$
CORPORATE ASSET MANAGEMENTCorporate Services
2016 2016 2015 2014 2013 2012 Budget Actual Actual Actual Actual Actual
FINANCING
Debt - ACFA 4,220$ (325)$ 2,450$ 3,550$ -$ -$
Debt - internal - 1,320 1,105 342 172 94
Government transfers 6,239 10,096 6,006 5,716 14,093 6,139
Other 550 608 - 1,236 1,595 29
Operations 700 35 895 752 1,065 821
Reserves 685 4,089 6,239 6,833 2,212 2,643
TOTAL FINANCING 12,394 15,823 16,695 18,429 19,137 9,726
EXPENSES
Buildings 11,709 12,362 7,853 5,323 16,736 7,151
Machinery and equipment - - - 246 201 504
Mobile equipment 685 5,813 8,495 9,418 2,532 2,528
TOTAL EXPENSES 12,394 18,175 16,348 14,987 19,469 10,183
CHANGE IN CAPITAL FUND -$ (2,352)$ 347$ 3,442$ (332)$ (457)$
City of Medicine Hat, Alberta
The above represents actual transactions before consolidation eliminations.
Page 98 2016 Financial Report
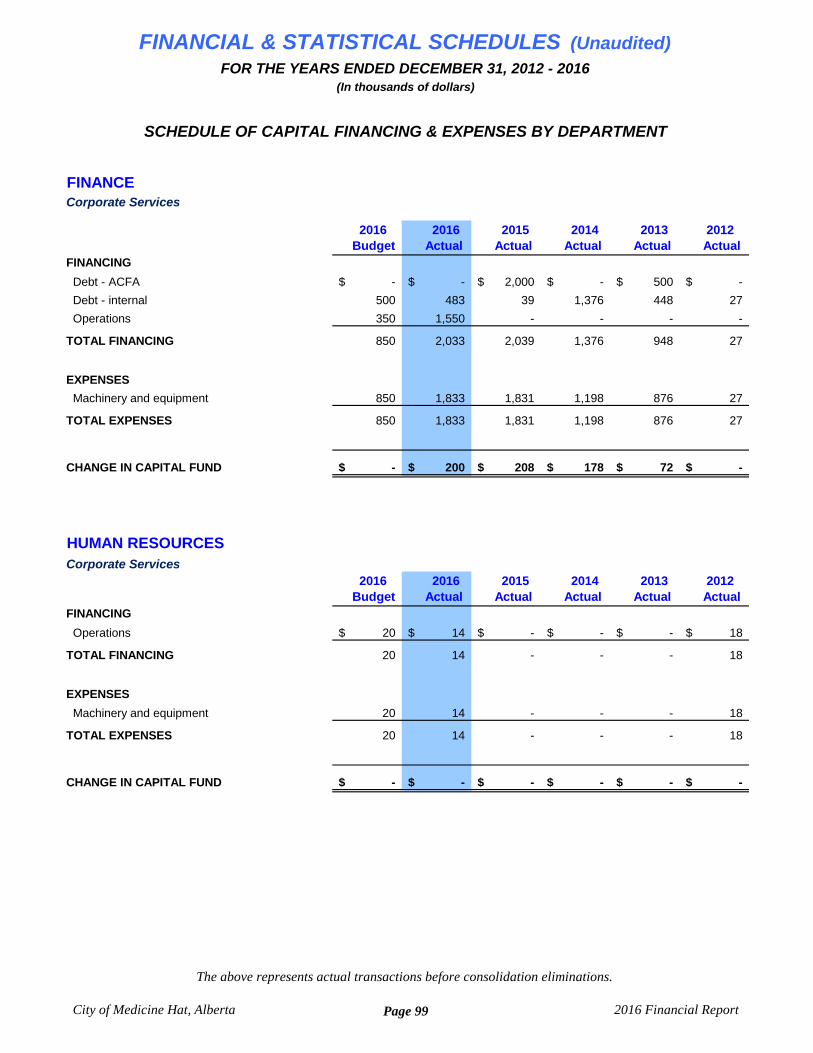
FINANCIAL & STATISTICAL SCHEDULES (Unaudited)FOR THE YEARS ENDED DECEMBER 31, 2012 - 2016
(In thousands of dollars)
SCHEDULE OF CAPITAL FINANCING & EXPENSES BY DEPARTMENT
FINANCECorporate Services
2016 2016 2015 2014 2013 2012 Budget Actual Actual Actual Actual Actual
FINANCING
Debt - ACFA -$ -$ 2,000$ -$ 500$ -$
Debt - internal 500 483 39 1,376 448 27
Operations 350 1,550 - - - -
TOTAL FINANCING 850 2,033 2,039 1,376 948 27
EXPENSES
Machinery and equipment 850 1,833 1,831 1,198 876 27
TOTAL EXPENSES 850 1,833 1,831 1,198 876 27
CHANGE IN CAPITAL FUND -$ 200$ 208$ 178$ 72$ -$
HUMAN RESOURCESCorporate Services
2016 2016 2015 2014 2013 2012 Budget Actual Actual Actual Actual Actual
FINANCING
Operations 20$ 14$ -$ -$ -$ 18$
TOTAL FINANCING 20 14 - - - 18
EXPENSES
Machinery and equipment 20 14 - - - 18
TOTAL EXPENSES 20 14 - - - 18
CHANGE IN CAPITAL FUND -$ -$ -$ -$ -$ -$
City of Medicine Hat, Alberta
The above represents actual transactions before consolidation eliminations.
Page 99 2016 Financial Report

FINANCIAL & STATISTICAL SCHEDULES (Unaudited)FOR THE YEARS ENDED DECEMBER 31, 2012 - 2016
(In thousands of dollars)
SCHEDULE OF CAPITAL FINANCING & EXPENSES BY DEPARTMENT
INFORMATION & COMPUTER SERVICES Corporate Services
2016 2016 2015 2014 2013 2012 Budget Actual Actual Actual Actual Actual
FINANCING
Debt - ACFA 3,000$ -$ 2,000$ -$ -$ -$
Debt - internal 115 930 223 142 389 23
Reserves - (3) 3 - 1 (15)
Operations - 76 75 38 29 275
TOTAL FINANCING 3,115 1,003 2,301 180 419 283
EXPENSES
Machinery and equipment 3,115 2,600 2,245 180 515 320
TOTAL EXPENSES 3,115 2,600 2,245 180 515 320
CHANGE IN CAPITAL FUND -$ (1,597)$ 56$ -$ (96)$ (37)$
City of Medicine Hat, Alberta
The above represents actual transactions before consolidation eliminations.
Page 100 2016 Financial Report
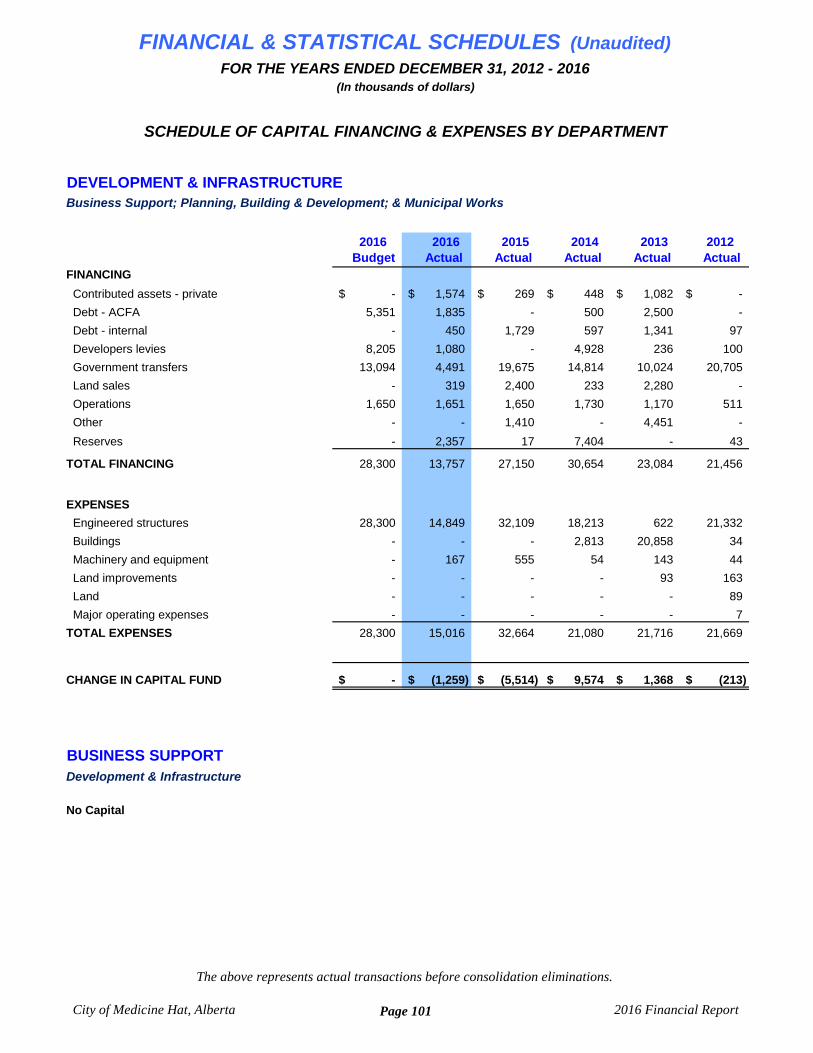
FINANCIAL & STATISTICAL SCHEDULES (Unaudited)FOR THE YEARS ENDED DECEMBER 31, 2012 - 2016
(In thousands of dollars)
SCHEDULE OF CAPITAL FINANCING & EXPENSES BY DEPARTMENT
DEVELOPMENT & INFRASTRUCTUREBusiness Support; Planning, Building & Development; & Municipal Works
2016 2016 2015 2014 2013 2012 Budget Actual Actual Actual Actual Actual
FINANCING
Contributed assets - private -$ 1,574$ 269$ 448$ 1,082$ -$
Debt - ACFA 5,351 1,835 - 500 2,500 -
Debt - internal - 450 1,729 597 1,341 97
Developers levies 8,205 1,080 - 4,928 236 100
Government transfers 13,094 4,491 19,675 14,814 10,024 20,705
Land sales - 319 2,400 233 2,280 -
Operations 1,650 1,651 1,650 1,730 1,170 511
Other - - 1,410 - 4,451 -
Reserves - 2,357 17 7,404 - 43
TOTAL FINANCING 28,300 13,757 27,150 30,654 23,084 21,456
EXPENSES
Engineered structures 28,300 14,849 32,109 18,213 622 21,332
Buildings - - - 2,813 20,858 34
Machinery and equipment - 167 555 54 143 44
Land improvements - - - - 93 163
Land - - - - - 89
Major operating expenses - - - - - 7
TOTAL EXPENSES 28,300 15,016 32,664 21,080 21,716 21,669
CHANGE IN CAPITAL FUND -$ (1,259)$ (5,514)$ 9,574$ 1,368$ (213)$
BUSINESS SUPPORTDevelopment & Infrastructure
No Capital
City of Medicine Hat, Alberta
The above represents actual transactions before consolidation eliminations.
Page 101 2016 Financial Report
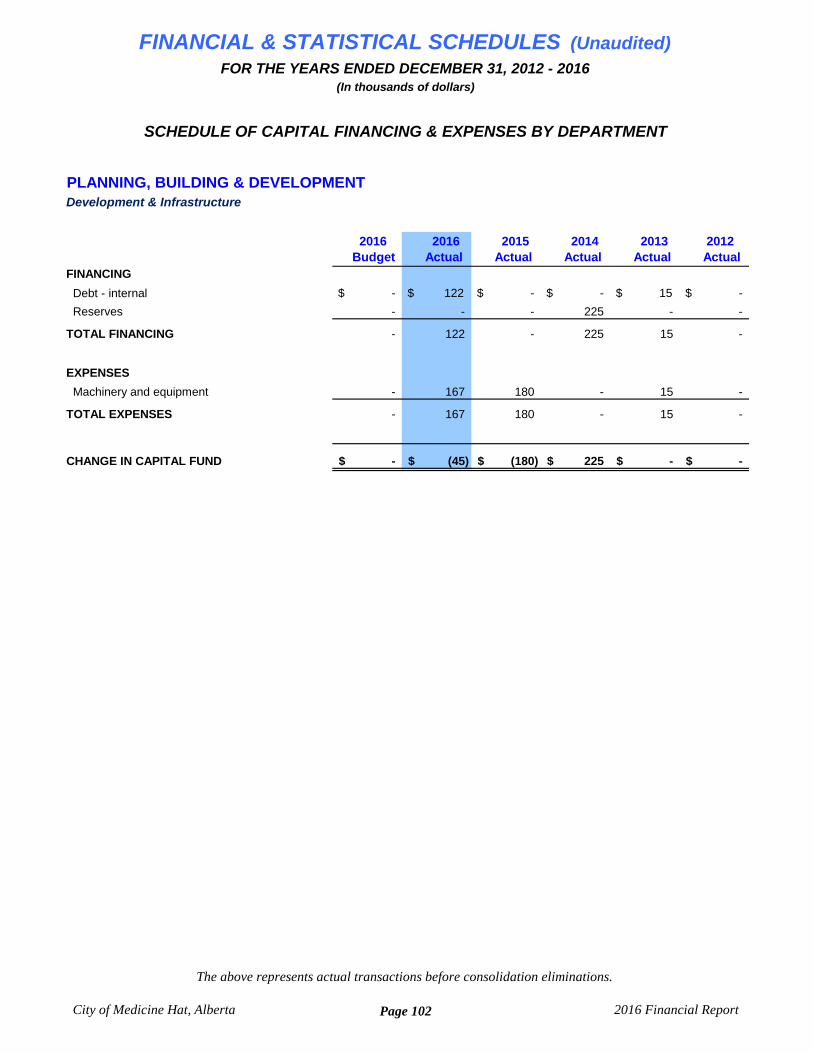
FINANCIAL & STATISTICAL SCHEDULES (Unaudited)FOR THE YEARS ENDED DECEMBER 31, 2012 - 2016
(In thousands of dollars)
SCHEDULE OF CAPITAL FINANCING & EXPENSES BY DEPARTMENT
PLANNING, BUILDING & DEVELOPMENTDevelopment & Infrastructure
2016 2016 2015 2014 2013 2012 Budget Actual Actual Actual Actual Actual
FINANCING
Debt - internal $ - $ 122 $ - $ - $ 15 $ -
Reserves - - - 225 - -
TOTAL FINANCING - 122 - 225 15 -
EXPENSES
Machinery and equipment - 167 180 - 15 -
TOTAL EXPENSES - 167 180 - 15 -
CHANGE IN CAPITAL FUND -$ (45)$ (180)$ 225$ -$ -$
City of Medicine Hat, Alberta
The above represents actual transactions before consolidation eliminations.
Page 102 2016 Financial Report
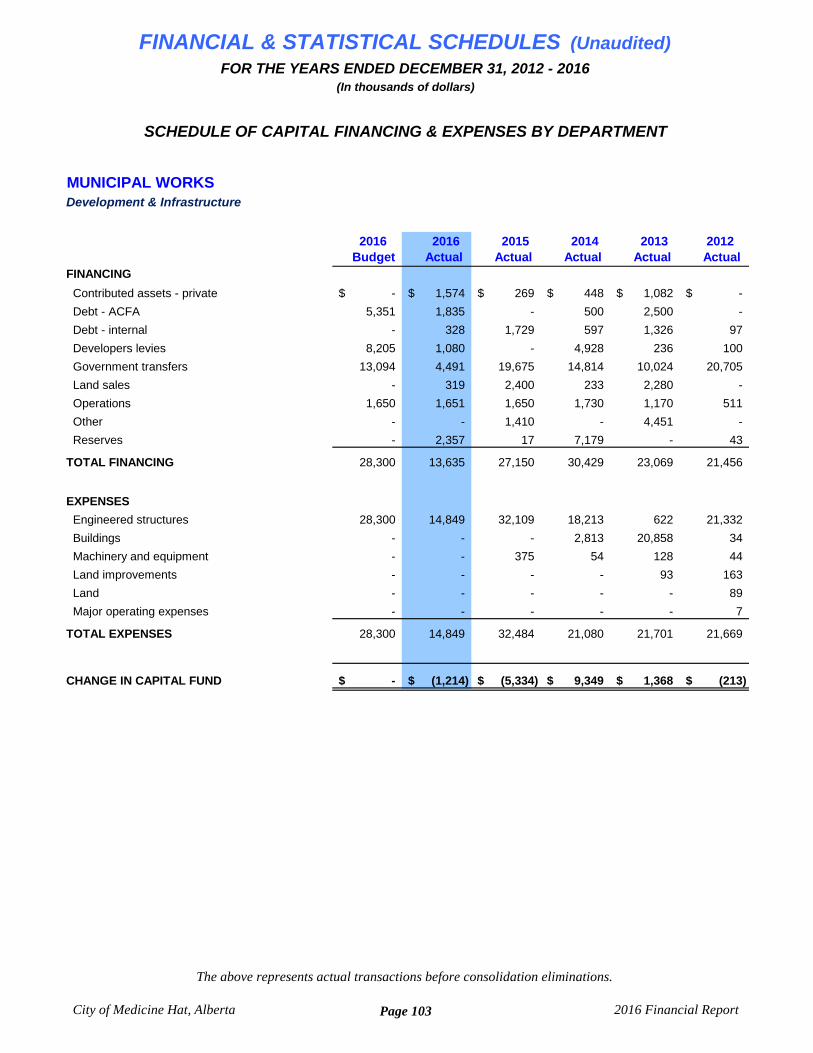
FINANCIAL & STATISTICAL SCHEDULES (Unaudited)FOR THE YEARS ENDED DECEMBER 31, 2012 - 2016
(In thousands of dollars)
SCHEDULE OF CAPITAL FINANCING & EXPENSES BY DEPARTMENT
MUNICIPAL WORKSDevelopment & Infrastructure
2016 2016 2015 2014 2013 2012 Budget Actual Actual Actual Actual Actual
FINANCING
Contributed assets - private -$ 1,574$ 269$ 448$ 1,082$ -$
Debt - ACFA 5,351 1,835 - 500 2,500 -
Debt - internal - 328 1,729 597 1,326 97
Developers levies 8,205 1,080 - 4,928 236 100
Government transfers 13,094 4,491 19,675 14,814 10,024 20,705
Land sales - 319 2,400 233 2,280 -
Operations 1,650 1,651 1,650 1,730 1,170 511
Other - - 1,410 - 4,451 -
Reserves - 2,357 17 7,179 - 43
TOTAL FINANCING 28,300 13,635 27,150 30,429 23,069 21,456
EXPENSES
Engineered structures 28,300 14,849 32,109 18,213 622 21,332
Buildings - - - 2,813 20,858 34
Machinery and equipment - - 375 54 128 44
Land improvements - - - - 93 163
Land - - - - - 89
Major operating expenses - - - - - 7
TOTAL EXPENSES 28,300 14,849 32,484 21,080 21,701 21,669
CHANGE IN CAPITAL FUND -$ (1,214)$ (5,334)$ 9,349$ 1,368$ (213)$
City of Medicine Hat, Alberta
The above represents actual transactions before consolidation eliminations.
Page 103 2016 Financial Report
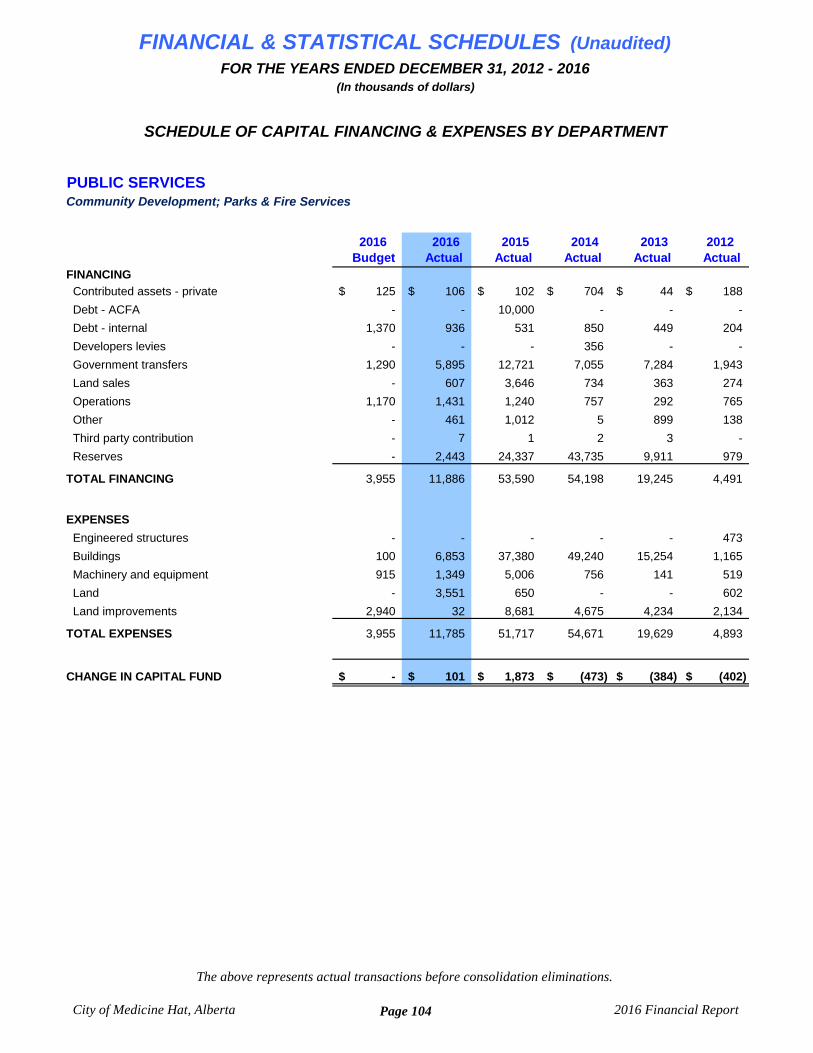
FINANCIAL & STATISTICAL SCHEDULES (Unaudited)FOR THE YEARS ENDED DECEMBER 31, 2012 - 2016
(In thousands of dollars)
SCHEDULE OF CAPITAL FINANCING & EXPENSES BY DEPARTMENT
PUBLIC SERVICESCommunity Development; Parks & Fire Services
2016 2016 2015 2014 2013 2012 Budget Actual Actual Actual Actual Actual
FINANCING
Contributed assets - private 125$ 106$ 102$ 704$ 44$ 188$
Debt - ACFA - - 10,000 - - -
Debt - internal 1,370 936 531 850 449 204
Developers levies - - - 356 - -
Government transfers 1,290 5,895 12,721 7,055 7,284 1,943
Land sales - 607 3,646 734 363 274
Operations 1,170 1,431 1,240 757 292 765
Other - 461 1,012 5 899 138
Third party contribution - 7 1 2 3 -
Reserves - 2,443 24,337 43,735 9,911 979
TOTAL FINANCING 3,955 11,886 53,590 54,198 19,245 4,491
EXPENSES
Engineered structures - - - - - 473
Buildings 100 6,853 37,380 49,240 15,254 1,165
Machinery and equipment 915 1,349 5,006 756 141 519
Land - 3,551 650 - - 602
Land improvements 2,940 32 8,681 4,675 4,234 2,134
TOTAL EXPENSES 3,955 11,785 51,717 54,671 19,629 4,893
CHANGE IN CAPITAL FUND -$ 101$ 1,873$ (473)$ (384)$ (402)$
City of Medicine Hat, Alberta
The above represents actual transactions before consolidation eliminations.
Page 104 2016 Financial Report
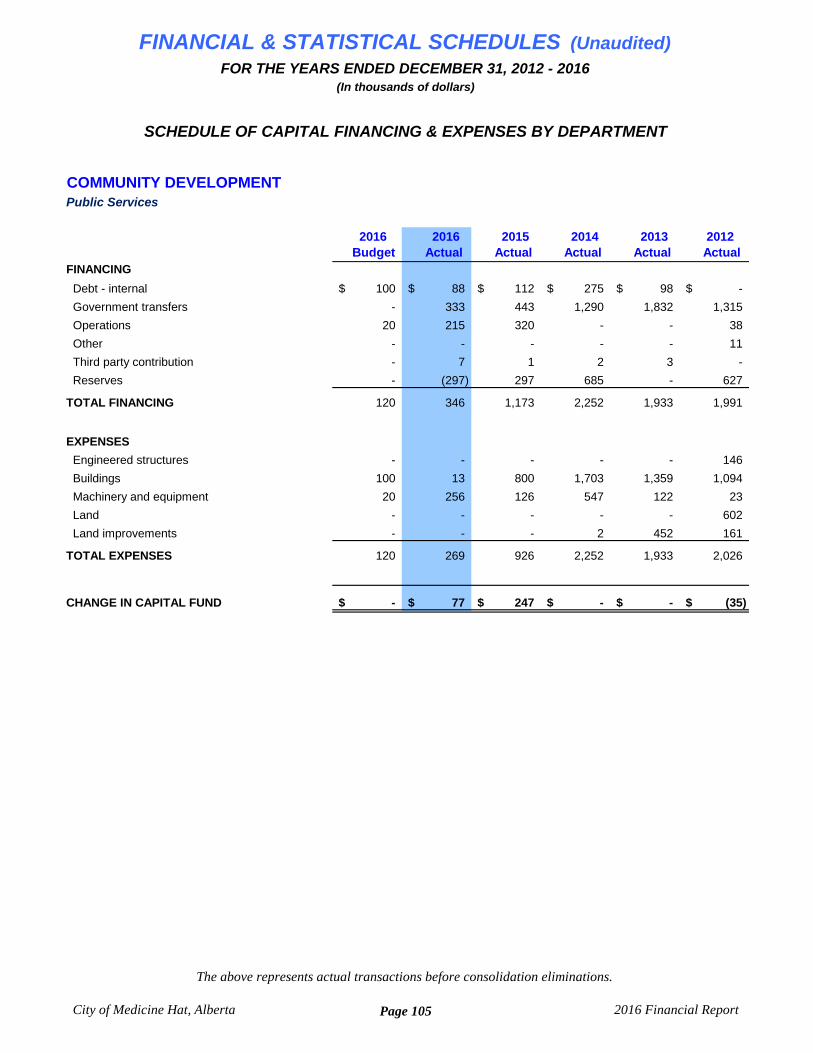
FINANCIAL & STATISTICAL SCHEDULES (Unaudited)FOR THE YEARS ENDED DECEMBER 31, 2012 - 2016
(In thousands of dollars)
SCHEDULE OF CAPITAL FINANCING & EXPENSES BY DEPARTMENT
COMMUNITY DEVELOPMENT Public Services
2016 2016 2015 2014 2013 2012 Budget Actual Actual Actual Actual Actual
FINANCING
Debt - internal 100$ 88$ 112$ 275$ 98$ -$
Government transfers - 333 443 1,290 1,832 1,315
Operations 20 215 320 - - 38
Other - - - - - 11
Third party contribution - 7 1 2 3 -
Reserves - (297) 297 685 - 627
TOTAL FINANCING 120 346 1,173 2,252 1,933 1,991
EXPENSES
Engineered structures - - - - - 146
Buildings 100 13 800 1,703 1,359 1,094
Machinery and equipment 20 256 126 547 122 23
Land - - - - - 602
Land improvements - - - 2 452 161
TOTAL EXPENSES 120 269 926 2,252 1,933 2,026
CHANGE IN CAPITAL FUND -$ 77$ 247$ -$ -$ (35)$
City of Medicine Hat, Alberta
The above represents actual transactions before consolidation eliminations.
Page 105 2016 Financial Report
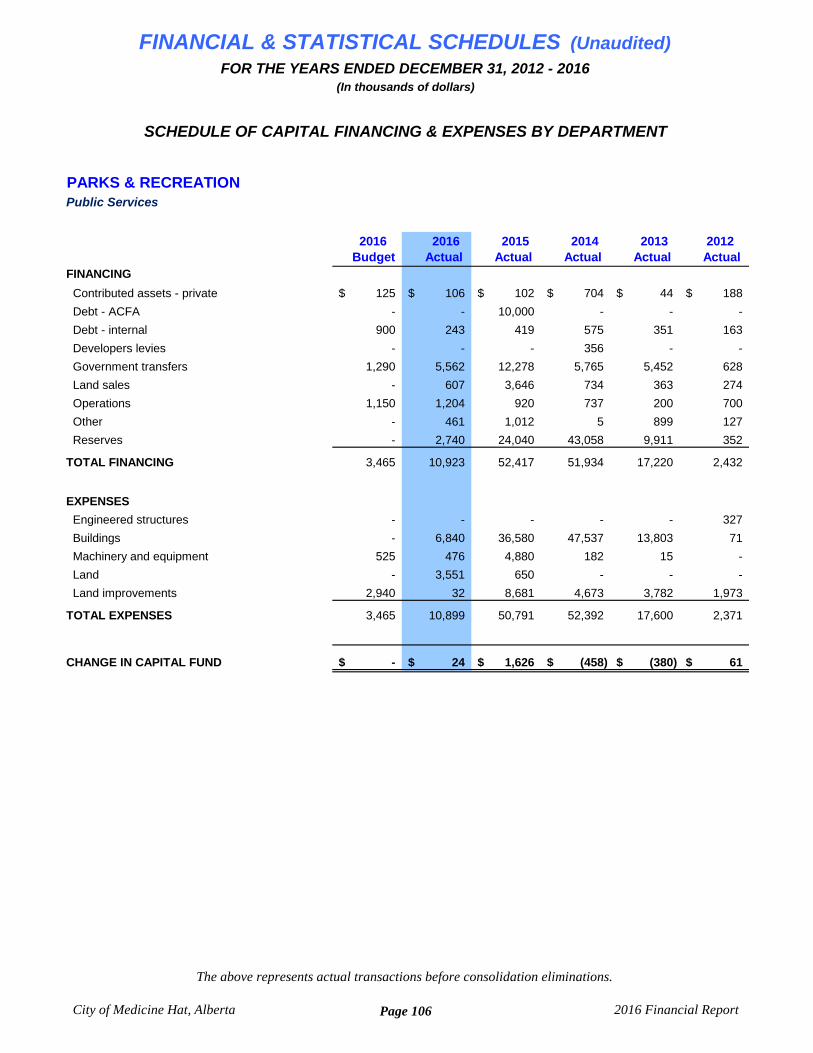
FINANCIAL & STATISTICAL SCHEDULES (Unaudited)FOR THE YEARS ENDED DECEMBER 31, 2012 - 2016
(In thousands of dollars)
SCHEDULE OF CAPITAL FINANCING & EXPENSES BY DEPARTMENT
PARKS & RECREATIONPublic Services
2016 2016 2015 2014 2013 2012 Budget Actual Actual Actual Actual Actual
FINANCING
Contributed assets - private 125$ 106$ 102$ 704$ 44$ 188$
Debt - ACFA - - 10,000 - - -
Debt - internal 900 243 419 575 351 163
Developers levies - - - 356 - -
Government transfers 1,290 5,562 12,278 5,765 5,452 628
Land sales - 607 3,646 734 363 274
Operations 1,150 1,204 920 737 200 700
Other - 461 1,012 5 899 127
Reserves - 2,740 24,040 43,058 9,911 352
TOTAL FINANCING 3,465 10,923 52,417 51,934 17,220 2,432
EXPENSES
Engineered structures - - - - - 327
Buildings - 6,840 36,580 47,537 13,803 71
Machinery and equipment 525 476 4,880 182 15 -
Land - 3,551 650 - - -
Land improvements 2,940 32 8,681 4,673 3,782 1,973
TOTAL EXPENSES 3,465 10,899 50,791 52,392 17,600 2,371
CHANGE IN CAPITAL FUND -$ 24$ 1,626$ (458)$ (380)$ 61$
City of Medicine Hat, Alberta
The above represents actual transactions before consolidation eliminations.
Page 106 2016 Financial Report
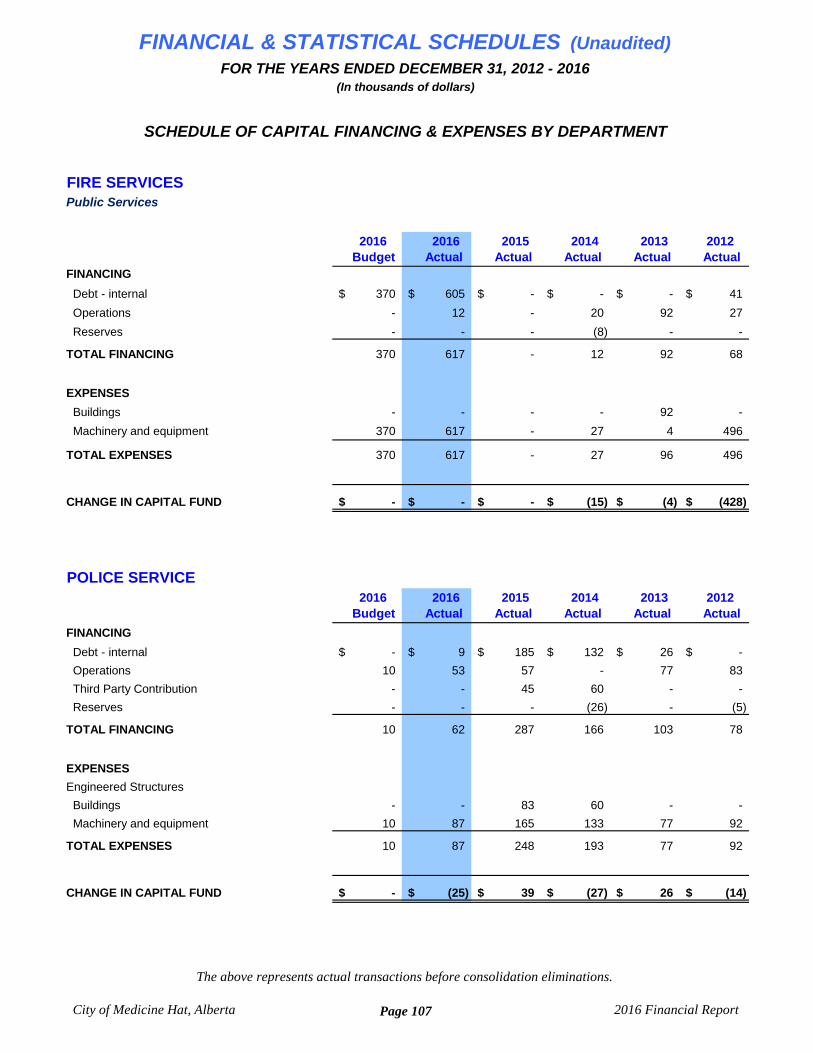
FINANCIAL & STATISTICAL SCHEDULES (Unaudited)FOR THE YEARS ENDED DECEMBER 31, 2012 - 2016
(In thousands of dollars)
SCHEDULE OF CAPITAL FINANCING & EXPENSES BY DEPARTMENT
FIRE SERVICESPublic Services
2016 2016 2015 2014 2013 2012 Budget Actual Actual Actual Actual Actual
FINANCING
Debt - internal 370$ 605$ -$ -$ -$ 41$
Operations - 12 - 20 92 27
Reserves - - - (8) - -
TOTAL FINANCING 370 617 - 12 92 68
EXPENSES
Buildings - - - - 92 -
Machinery and equipment 370 617 - 27 4 496
TOTAL EXPENSES 370 617 - 27 96 496
CHANGE IN CAPITAL FUND -$ -$ -$ (15)$ (4)$ (428)$
POLICE SERVICE 2016 2016 2015 2014 2013 2012 Budget Actual Actual Actual Actual Actual
FINANCING
Debt - internal -$ 9$ 185$ 132$ 26$ -$
Operations 10 53 57 - 77 83
Third Party Contribution - - 45 60 - -
Reserves - - - (26) - (5)
TOTAL FINANCING 10 62 287 166 103 78
EXPENSES
Engineered Structures
Buildings - - 83 60 - -
Machinery and equipment 10 87 165 133 77 92
TOTAL EXPENSES 10 87 248 193 77 92
CHANGE IN CAPITAL FUND -$ (25)$ 39$ (27)$ 26$ (14)$
City of Medicine Hat, Alberta
The above represents actual transactions before consolidation eliminations.
Page 107 2016 Financial Report
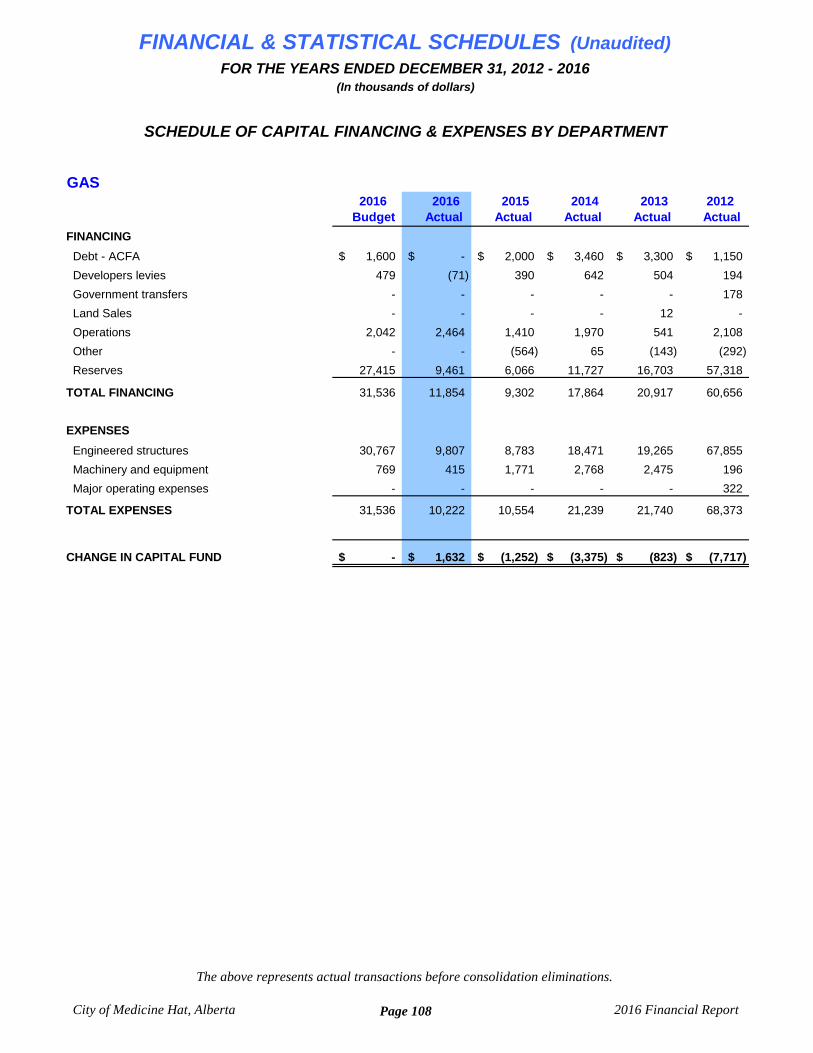
FINANCIAL & STATISTICAL SCHEDULES (Unaudited)FOR THE YEARS ENDED DECEMBER 31, 2012 - 2016
(In thousands of dollars)
SCHEDULE OF CAPITAL FINANCING & EXPENSES BY DEPARTMENT
GAS 2016 2016 2015 2014 2013 2012 Budget Actual Actual Actual Actual Actual
FINANCING
Debt - ACFA 1,600$ -$ 2,000$ 3,460$ 3,300$ 1,150$
Developers levies 479 (71) 390 642 504 194
Government transfers - - - - - 178
Land Sales - - - - 12 -
Operations 2,042 2,464 1,410 1,970 541 2,108
Other - - (564) 65 (143) (292)
Reserves 27,415 9,461 6,066 11,727 16,703 57,318
TOTAL FINANCING 31,536 11,854 9,302 17,864 20,917 60,656
EXPENSES
Engineered structures 30,767 9,807 8,783 18,471 19,265 67,855
Machinery and equipment 769 415 1,771 2,768 2,475 196
Major operating expenses - - - - - 322
TOTAL EXPENSES 31,536 10,222 10,554 21,239 21,740 68,373
CHANGE IN CAPITAL FUND -$ 1,632$ (1,252)$ (3,375)$ (823)$ (7,717)$
City of Medicine Hat, Alberta
The above represents actual transactions before consolidation eliminations.
Page 108 2016 Financial Report

FINANCIAL & STATISTICAL SCHEDULES (Unaudited)FOR THE YEARS ENDED DECEMBER 31, 2012 - 2016
(In thousands of dollars)
SCHEDULE OF CAPITAL FINANCING & EXPENSES BY DEPARTMENT
ELECTRIC 2016 2016 2015 2014 2013 2012 Budget Actual Actual Actual Actual Actual
FINANCING
Debt - ACFA $ 32,939 $ 28,236 $ 6,950 $ 8,792 $ 4,545 $ 3,724
Developers levies 650 531 923 2,692 1,123 434
Government transfers - - 31 - 5,040 902
Land Sales 300 - 125 62 65 -
Operations 13,476 10,566 13,771 4,359 3,322 3,038
Other - - (788) (3,287) 1,395 301
Reserves 8,460 11,931 11,030 11,924 2,943 13,824
TOTAL FINANCING 55,825 51,264 32,042 24,542 18,433 22,223
EXPENSES
Engineered structures 16,815 45,296 32,961 18,473 13,464 3,858
Buildings 150 921 997 1,844 300 947
Machinery and equipment 1,035 382 1,442 3,018 3,381 3,191
Land improvements - 23 221 (171) 497 191
Land - - - 555 - -
TOTAL EXPENSES 18,000 46,622 35,621 23,719 17,642 8,187
CHANGE IN CAPITAL FUND 37,825$ 4,642$ (3,579)$ 823$ 791$ 14,036$
City of Medicine Hat, Alberta
The above represents actual transactions before consolidation eliminations.
Page 109 2016 Financial Report

FINANCIAL & STATISTICAL SCHEDULES (Unaudited)FOR THE YEARS ENDED DECEMBER 31, 2012 - 2016
(In thousands of dollars)
SCHEDULE OF CAPITAL FINANCING & EXPENSES BY DEPARTMENT
UTILITIES BUSINESS SUPPORT
No Capital
WATEREnvironmental Utilities
2016 2016 2015 2014 2013 2012Budget Actual Actual Actual Actual Actual
FINANCING
Debt - ACFA $ 13,000 $ 4,950 $ 8,751 $ 14,760 $ 12,175 $ 4,560
Developers levies - 223 429 1,106 - -
Government transfers - - (51) 1,887 86 30
Land sales - - 460 186 583 -
Operations 3,325 3,327 1,921 300 300 374
Other - - (429) (1,106) 15 -
TOTAL FINANCING 16,325 8,500 11,081 17,133 13,159 4,964
EXPENSES
Engineered structures 15,825 7,001 3,339 11,949 11,230 4,638
Buildings 150 - - 18 536 961
Machinery and equipment 350 607 610 3,175 3,994 (420)
Land improvements - (27) 1,123 - - -
Land - - 20 - - -
TOTAL EXPENSES 16,325 7,581 5,092 15,142 15,760 5,179
CHANGE IN CAPITAL FUND -$ 919$ 5,989$ 1,991$ (2,601)$ (215)$
City of Medicine Hat, Alberta
The above represents actual transactions before consolidation eliminations.
Page 110 2016 Financial Report

FINANCIAL & STATISTICAL SCHEDULES (Unaudited)FOR THE YEARS ENDED DECEMBER 31, 2012 - 2016
(In thousands of dollars)
SCHEDULE OF CAPITAL FINANCING & EXPENSES BY DEPARTMENT
SEWEREnvironmental Utilities
2016 2016 2015 2014 2013 2012 Budget Actual Actual Actual Actual Actual
FINANCING
Debt - ACFA 8,500$ 11,200$ 15,100$ 7,400$ 1,870$ 6,510$
Developers levies - 528 326 - - -
Government transfers - - 858 180 15 (229)
Land sales - 1 485 184 454 -
Operations 2,150 2,144 2,270 95 201 254
Other - - (224) - - -
TOTAL FINANCING 10,650 13,873 18,815 7,859 2,540 6,535
EXPENSES
Engineered structures 10,650 10,663 4,160 4,865 4,413 3,254
Buildings - - - 18 787 961
Machinery and equipment - 119 53 110 - -
Land Improvements - 145 1,527 - - -
TOTAL EXPENSES 10,650 10,927 5,740 4,993 5,200 4,215
CHANGE IN CAPITAL FUND -$ 2,946$ 13,075$ 2,866$ (2,660)$ 2,320$
City of Medicine Hat, Alberta
The above represents actual transactions before consolidation eliminations.
Page 111 2016 Financial Report
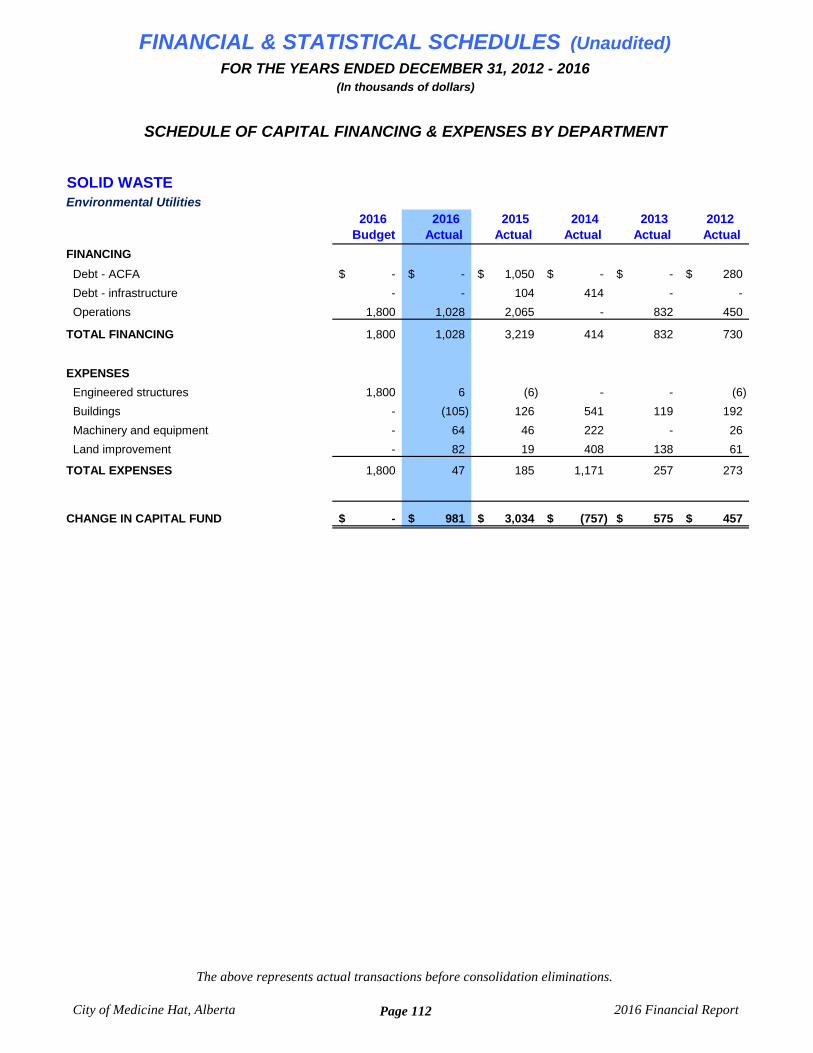
FINANCIAL & STATISTICAL SCHEDULES (Unaudited)FOR THE YEARS ENDED DECEMBER 31, 2012 - 2016
(In thousands of dollars)
SCHEDULE OF CAPITAL FINANCING & EXPENSES BY DEPARTMENT
SOLID WASTEEnvironmental Utilities
2016 2016 2015 2014 2013 2012 Budget Actual Actual Actual Actual Actual
FINANCING
Debt - ACFA -$ -$ 1,050$ -$ -$ 280$
Debt - infrastructure - - 104 414 - -
Operations 1,800 1,028 2,065 - 832 450
TOTAL FINANCING 1,800 1,028 3,219 414 832 730
EXPENSES
Engineered structures 1,800 6 (6) - - (6)
Buildings - (105) 126 541 119 192
Machinery and equipment - 64 46 222 - 26
Land improvement - 82 19 408 138 61
TOTAL EXPENSES 1,800 47 185 1,171 257 273
CHANGE IN CAPITAL FUND -$ 981$ 3,034$ (757)$ 575$ 457$
City of Medicine Hat, Alberta
The above represents actual transactions before consolidation eliminations.
Page 112 2016 Financial Report
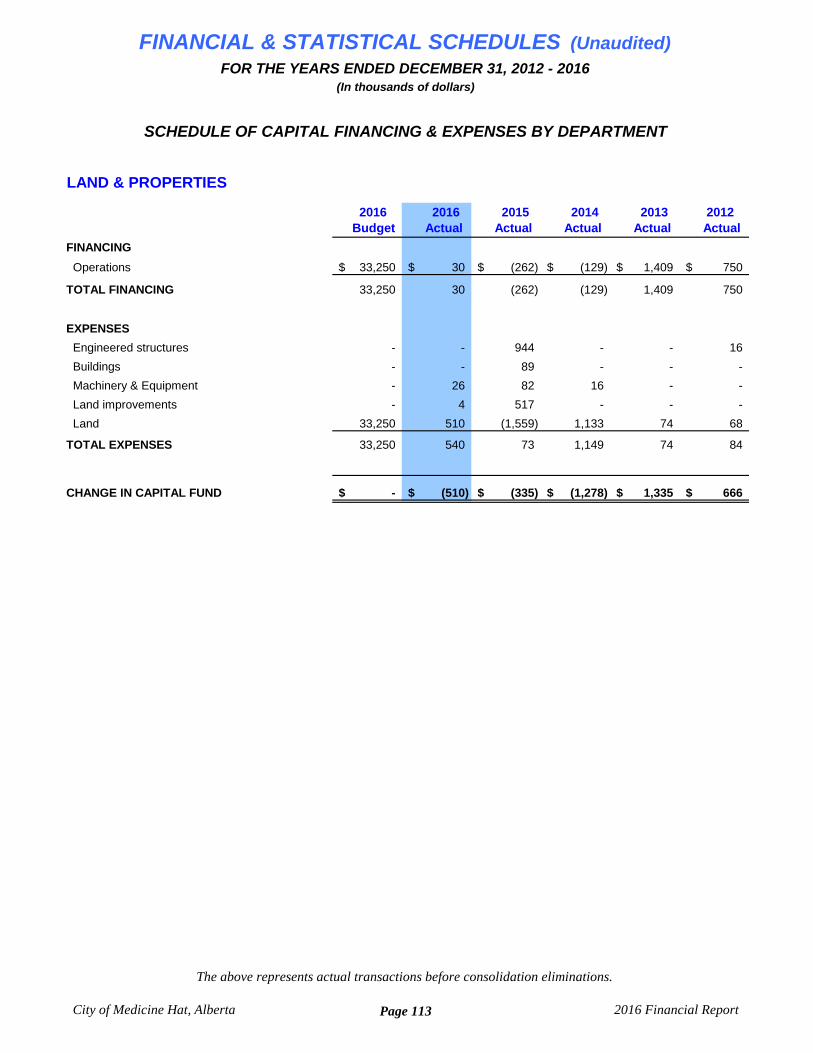
FINANCIAL & STATISTICAL SCHEDULES (Unaudited)FOR THE YEARS ENDED DECEMBER 31, 2012 - 2016
(In thousands of dollars)
SCHEDULE OF CAPITAL FINANCING & EXPENSES BY DEPARTMENT
LAND & PROPERTIES
2016 2016 2015 2014 2013 2012 Budget Actual Actual Actual Actual Actual
FINANCING
Operations 33,250$ 30$ (262)$ (129)$ 1,409$ 750$
TOTAL FINANCING 33,250 30 (262) (129) 1,409 750
EXPENSES
Engineered structures - - 944 - - 16
Buildings - - 89 - - -
Machinery & Equipment - 26 82 16 - -
Land improvements - 4 517 - - -
Land 33,250 510 (1,559) 1,133 74 68
TOTAL EXPENSES 33,250 540 73 1,149 74 84
CHANGE IN CAPITAL FUND -$ (510)$ (335)$ (1,278)$ 1,335$ 666$
City of Medicine Hat, Alberta
The above represents actual transactions before consolidation eliminations.
Page 113 2016 Financial Report

Six strategic priorities:
Economic Development
Infrastructure and amenities
Social wellness
Image and profile
Fiscal management
City government
Medicine Hat Council’s
Strategic Plan
2014-2018