
City of Council Bluffs, Iowa
165
City of Council Bluffs, Iowa Comprehensive Annual Financial Report For the Fiscal Year Ended June 30, 2018
-
Upload
khangminh22 -
Category
Documents
-
view
3 -
download
0
Transcript of City of Council Bluffs, Iowa
City of Council Bluffs, Iowa
Comprehensive Annual Financial Report For the Fiscal Year Ended June 30, 2018

Comprehensive Annual Financial Report For the Fiscal Year Ended June 30, 2018
City of Council Bluffs, Iowa
Prepared by the City of Council Bluffs Finance Department

City of Council Bluffs Table of Contents
June 30, 2018
Introductory Section
Letter of Transmittal .............................................................................................................................................. 1 Certificate of Achievement for Excellence in Financial Reporting ....................................................................... 5 City Organizational Chart ...................................................................................................................................... 6 Officials.................................................................................................................................................................. 7
Financial Statements
Independent Auditor’s Report ................................................................................................................................ 8 Management Discussion and Analysis ................................................................................................................ 11 Basic Financial Statements
Government-Wide Financial Statements: Statement of Net Position ............................................................................................................................ 22 Statement of Activities ................................................................................................................................. 24
Governmental Fund Financial Statements: Balance Sheet - Governmental Funds to the Statement of Net Position ...................................................... 25 Reconciliation of the Balance Sheet – Governmental Funds to the Statement of Net Position ................... 26 Statement of Revenues, Expenditures, and Changes in Fund Balances....................................................... 27 Reconciliation of the Statement of Revenues, Expenditures, and Changes in Fund Balances – Governmental Funds to the Statement of Activities .................................................................................... 28
Proprietary Fund Financial Statements: Statement of Net Position – Proprietary Funds ............................................................................................ 29 Statement of Revenues, Expenses, and Changes in Fund Net Position – Proprietary Funds ...................... 30 Statement of Cash Flows – Proprietary Funds ............................................................................................. 31
Notes to Financial Statements .......................................................................................................................... 33 Required Supplementary Information
Budgetary Comparison Schedule of Revenues, Expenditures, and Changes in Balances – Budget and Actual – Governmental Funds and Enterprise Funds .................................................................................................. 70 Notes to Required Supplementary Information – Budgetary Reporting .......................................................... 71 Schedule of the City’s Proportionate Share of the Net Pension Liability ........................................................ 72 Schedule of the City Contributions .................................................................................................................. 73 Notes to Required Supplementary Information – Pension Liability ................................................................ 74 Schedule of Changes in the City’s Total OPEB Liability, Related Ratios and Notes ..................................... 75
Other Supplementary Information Combining Financial Statements ..................................................................................................................... 76 Combining Balance Sheet – Nonmajor Governmental Funds ......................................................................... 77 Combining Statement of Revenues, Expenditures, and Changes in Fund Balances – Nonmajor Governmental Funds ................................................................................................................................................................ 78 Council Bluffs Public Library Foundation – Financial Statements ................................................................. 79
Statistical Section (Unaudited)
Table of Contents ................................................................................................................................................. 80 Schedule 1 – Net Position by Component ........................................................................................................... 81 Schedule 2 – Changes in Net Position ................................................................................................................. 82 Schedule 3 – Fund Balances of Governmental Funds ......................................................................................... 84 Schedule 4 – Changes in Fund Balances of Governmental Funds ....................................................................... 85 Schedule 5 – Governmental Activities Tax Revenues By Source ....................................................................... 86 Schedule 6 – Assessed and Taxable Value of Property ....................................................................................... 87 Schedule 7 – Direct and Overlapping Governments ............................................................................................ 88 Schedule 8 – Principal Area Taxpayers ............................................................................................................... 89

Schedule 9 – Property Tax Levies and Collections ............................................................................................. 90 Schedule 10 – Ratios of Outstanding Debt by Type ............................................................................................ 91 Schedule 11 – Ratios of General Bonded Debt Outstanding ............................................................................... 92 Schedule 12 – Direct and Overlapping Governmental Activities Debt ............................................................... 93 Schedule 13 – Legal Debt Margin Information ................................................................................................... 94 Schedule 14 – Pledged Revenue Coverage .......................................................................................................... 95 Schedule 15 – Demographic and Economic Statistics ......................................................................................... 96 Schedule 16 – Principal Area Employers ............................................................................................................ 97 Schedule 17 – Full-time Equivalent City Government Employees by Function/Program .................................. 98 Schedule 18 – Operating Indicators by Function/Program .................................................................................. 99 Schedule 19 – Capital Asset Statistics by Function/Program ............................................................................ 102
Information Provided to Comply with Governmental Auditing Standards and the Uniform Guidance
Independent Auditor’s Report on Internal Control over Financial Reporting and on Compliance and Other Matters Based on an Audit of Financial Statements Performed in Accordance with Government Auditing Standards ........................................................................................................................................................... 103 Independent Auditor’s Report on Compliance for the Major Federal Program and Report on Internal Control over Compliance Required by the Uniform Guidance ....................................................................................... 105 Schedule of Expenditures of Federal Awards .................................................................................................... 107 Notes to the Schedule of Expenditures of Federal Awards ................................................................................ 110 Schedule of Findings and Questioned Costs ...................................................................................................... 111

Introductory Section June 30, 2018
City of Council Bluffs

1
December 5, 2018 To the Honorable Mayor, Members of the City Council and Citizens of the City of Council Bluffs: State law requires cities to publish a complete set of financial statements and the financial condition and transactions be examined annually by the Auditor of State or by a certified public accountant. Pursuant to that requirement, we hereby issue the Comprehensive Annual Financial Report of the City of Council Bluffs for the fiscal year ended June 30, 2018. The financial statements are presented in conformity with the United States of America generally accepted accounting principles (GAAP). This report was prepared by members of the management of the City and constitutes their representations concerning the financial condition and financial activities of the City. As such, management assumes full responsibility for the completeness and reliability of the information presented in this report. To provide a reasonable basis for making these representations, management of the City established a system of internal control procedures designed to protect the City’s assets from loss, theft or misuse and to compile sufficient reliable information from which the City’s annual financial statements are prepared in conformity with GAAP. This internal control framework is designed to provide reasonable, but not absolute, assurance these objectives are met. Reasonable assurance considers the cost of an internal control should not exceed the intended benefits and the valuation of costs and benefits associated with internal controls require estimates and judgments by management. As members of management, we assert, to the best of our knowledge and belief, the financial report is complete and reliable in all material respects. The City’s financial statements have been audited by Eide Bailly, LLP. The objective of an independent audit is to provide reasonable assurance the basic financial statements of the City for the year ended June 30, 2018 are free of material misstatement. The independent audit involved examining evidence supporting the amounts and disclosures in the basic financial statements on a test basis. Additionally, the audit assessed the City’s accounting principles, significant estimates made by management, and evaluated the overall presentation of the basic financial statements. Based on their audit, the independent auditors concluded there was a reasonable basis to give an unmodified opinion the City’s financial statements for the year ended June 30, 2018 are fairly presented in conformity with GAAP. The independent auditor’s report is presented as the first item of the Financial Section of this report. The independent audit of the financial statements of the City is part of a broader, federally mandated “Single Audit” designed to meet the special needs of federal grantor agencies. The standards governing Single Audit engagements require the independent auditor to report not only on the fair presentation of the financial statements, but also on the audited governments internal controls and compliance with legal requirements, with special emphasis on internal controls and legal requirements involving the administration of federal awards. The results of the City’s Single Audit for the fiscal year ended June 30, 2018 provided no instances of material weaknesses in the internal control over compliance or significant violations of applicable laws, regulations, contracts and grants. The results of the Single Audit are reported in the Financial Assistance Section of this report.

2
Generally accepted accounting principles require that management provide a narrative introduction overview, and analysis to accompany the basic financial statements in the form of a Management’s Discussion and Analysis (MD&A). This letter of transmittal is designed to complement Management’s Discussion and Analysis and should be read in conjunction with it. The MD&A is located immediately after the Independent Auditor’s Report in the Financial Section. Profile of the City The City of Council Bluffs is the county seat of Pottawattamie County, situated on the Missouri River in Western Iowa, adjacent to Omaha, Nebraska and 125 miles west of the State Capital, Des Moines, Iowa. The City encompasses 40.97 square miles and serves a population of 62,316 (United States Census Bureau 2017 estimate based on 2010 census). The United States Census Bureau estimate of the Omaha-Council Bluffs Metropolitan 2016 estimated population was 915,312. The diverse business community includes gaming, railroad transportation, food processing and production, hospitality and health care. The City is governed by a “strong-Mayor” form of government. The Mayor and five City Council members are elected on a non-partisan basis every four years. The Mayor presides at all meetings of the City Council, is responsible for the administration of the City. The City Council appoints the City Attorney and the City Clerk. The Mayor appoints the Chiefs of Staff, Police and Fire and the Directors of Community Development, Finance, Human Resources, Information Technology, Library, Parks and Public Works. The City provides a full range of services including police and fire protection; solid waste collection; construction and maintenance of streets, sewers and bridges; sewage collection and treatment; planning and zoning; and culture and recreation which include two swimming pools, an eighteen hole golf course, 594 acres of parks, 43 miles of walking and biking trails and various historic landmarks. The City owns and leases a commercial building to the Bass Pro Shop. Council Bluffs also owns the Mid America Center, a full service convention center and a 7,000 plus seat arena facility. In addition, the City reports the Council Bluffs Airport Authority and the Council Bluffs Library Foundation as component units. The annual budget serves as the comprehensive financial plan for each fiscal year. The budget is developed by the Department Heads as coordinated by the Chief of Staff and the Director of Finance under the direction of the Mayor. Department heads, the Mayor and the Chief of Staff identify key services the City intends to provide in the upcoming fiscal year. Additionally, the Chief of Staff coordinates an ongoing five-year capital improvement plan with Department Heads. Department Heads and the Director of Finance project revenue based on taxing information, volumes and amounts of fees for services and other revenue. The budget is presented and adopted by the City Council and then forwarded to the Iowa Department of Management prior to March 15 for the fiscal year beginning the following July 1. In the event City administration finds it necessary to deviate from the approved budget, the Director of Finance identifies the cause of the deviation, prepares a budget amendment and presents the amendment to the City Council for approval for proper appropriation of funding. Factors Affecting Financial Condition Greater understanding of the information in the financial statements may be gained when considered in the broader perspective of the environment in which the City operates.

3
Local Economy – Council Bluffs is not only the largest city in southwest Iowa but it also has an alternate identity as the largest suburb in the metropolitan Omaha area. The City supports a large agricultural community in Pottawattamie County, is developing as a technology center due to favorable utility rates and ready access to utility providers, and will benefit from its’ strategic location at the intersection of east/west Interstate 80 and north/south Interstate 29. The City is undergoing an initiative to develop the western edge of Council Bluffs, the Missouri riverfront, to incorporate parks, housing and a corporate office center to boost the City’s tax base and to highlight the City’s front door from the West. A private development company has begun Phase I of a new development to establish 388 new homes on the east side of Council Bluffs. The metropolitan area has seen the unemployment rate drop to 2.9% in 2018 from 3.9% in 2010. The City of Council Bluffs is committed to developing the riverfront into a greenspace which has enhanced the natural setting. This includes the Bob Kerry Pedestrian Bridge between Omaha and Council Bluffs and Tom Hanafan River’s Edge Park. The City has received numerous awards recognizing the park for its environmental impact and design. The City is also committed to increase it’s tax base by promoting economic development. A major development at River’s Edge will include a 67,000 square foot office building and a 743 space-parking garage and is scheduled to be complete by January 1, 2019. Additionally, a 230-apartment complex and a 6,300 square foot retail area is under construction. The tax base composition is diverse, consisting of 48.45% residential, 24.95% utilities, 20.05% commercial, 1.96% industrial and 4.58% agricultural, multi-residential, railroad and other. The largest taxpayer accounts for 5.09% of total value and the remaining nine leading taxpayers account for a combined total of 13.49% of the taxable value. Budget Challenges – Recent year’s budget processes have faced the challenges presented by the current state and national economies. Challenges include State shared revenue reductions, increased cost of health care, and increased costs of liability and property insurance. Long-term financial planning and major initiatives –The City has adopted a Capital Improvement Plan (CIP) to manage and direct the growth and maintenance of public infrastructure. The Plan includes provisions for streets, parks and recreational facilities, trails, property improvements, levee reconstruction, and sewer infrastructure. Projects in the CIP demonstrate the importance of developing long range financial planning strategies to facilitate the growth and prosperity of the City. The process assists with both short and long range financial planning needs by: Prioritizing and scheduling capital projects and acquisitions over the next five years; Estimating cash flow needs and timing; and Identifying funding sources for capital projects and acquisitions. Highlights of the fiscal year 2019 Capital Improvement Plan are as follows: Mid America Center Improvements - $2,700,000 East Beltway road construction - $6,145,000 First Avenue revitalization - $1,450,000 West Broadway road reconstruction - $6,800,000 Levee Accreditation project - $4,400,000

4
City Awards The Government Finance Officers Association of the United States and Canada (GFOA) again awarded a Certificate of Achievement for Excellence in Financial Reporting to the City of Council Bluffs, Iowa for its Comprehensive Annual Financial Report for the year ended June 30, 2017. This was the seventh consecutive year the City has achieved this award. In order to be awarded a Certificate of Achievement, a government must publish an easily readable and efficiently organized Comprehensive Annual Financial Report. This report must satisfy both generally accepted accounting principles and applicable legal requirements. A Certificate of Achievement is valid for a period of one year only. We believe our current Comprehensive Annual Financial Report continues to meet the Certificate of Achievement Program requirements. The City will submit this report to the GFOA to determine eligibility for another certificate. The City is proud to have received several major awards during recent years which demonstrates the City’s desire to promote its image as a great place to live. The following awards were received:
1. All American City – Community collaboration to increase grade level reading 2. Iowa Tourism – Best Website for www.unleashcb.com, Best Event for Loessfest 2017, and
Outstanding Community 3. Iowa Great Places Designation – For the PACE Harvester II Project to promote arts 4. Money Magazine – Top 100 Places to live 5. PRSA Paper Anvil Award for the 100 Block Initiative 6. National Center for Arts Research named the Omaha-Council Bluffs metro area for medium
communities recognizing Council Bluffs for our public art displays, South Main district, and the Hoff Family Art Culture Center
Acknowledgements Elected officials and staff take great pride in providing high quality municipal services, including transparent and clear financial reporting and budgeting. The City’s recognition of reporting excellence by the GFOA and the City’s AA2 bond rating is reflective of the City’s competency, efficiency and attention to detail. Preparation of this report would not be possible without the contributions of many persons committed to providing our residents with quality financial information. This includes all Department Heads, City Council members, the Chief of Staff and the Mayor who support and encourage the commitment to internal controls, cooperation among departments and a complete flow of financial information to the public. Preparation of this report was accomplished through the dedicated services provided by the Finance Department staff. Respectfully submitted,
Kathryn Knott Director of Finance

5

6

7
City of Council Bluffs Officials
June 30, 2018
Title Term Expires
Melissa Head City Council
Roger Sandau City Council
Nate Watson City Council
Sharon White City Council
Mike Wolf City Council
Matt Walsh Mayor
Council Appointed Officials
Richard Wade City Attorney
Jodi Quakenbush City Clerk
December 2019
December 2021
December 2021
Name
December 2021
December 2019
December 2019

(This page left blank intentionally.)

Financial Statements June 30, 2018
City of Council Bluffs

What inspires you, inspires us. | eidebailly.com1545 Associates Dr., Ste. 101 | Dubuque, IA 52002-2299 | T 563.556.1790 | F 563.557.7842 | EOE
8
Independent Auditor’s Report To the Honorable Mayor and Members of the City Council City of Council Bluffs, Iowa Report on the Financial Statements We have audited the accompanying financial statements of the governmental activities, the business-type activities, the aggregate discretely presented component units, each major fund, and the aggregate remaining fund information of the City of Council Bluffs, Iowa, as of and for the year ended June 30, 2018, and the related notes to the financial statements, which collectively comprise the City’s basic financial statements as listed in the table of contents. Management’s Responsibility for the Financial Statements Management is responsible for the preparation and fair presentation of these financial statements in accordance with accounting principles generally accepted in the United States of America; this includes the design, implementation, and maintenance of internal control relevant to the preparation and fair presentation of financial statements that are free from material misstatement, whether due to fraud or error. Auditor’s Responsibility Our responsibility is to express opinions on these financial statements based on our audit. We did not audit the financial statements of the Council Bluffs Airport Authority, which represents 70 percent, 69 percent, and 58 percent, respectively, of the assets, net position, and revenues of the aggregate discretely presented component units. Those financial statements were audited by auditors whose report thereon has been furnished to us, and our opinion, insofar as it relates to the amounts included in the Council Bluffs Airport Authority, is based solely on the reports of other auditors. We conducted our audit in accordance with auditing standards generally accepted in the United States of America and the standards applicable to financial audits contained in Government Auditing Standards, issued by the Comptroller General of the United States. Those standards require that we plan and perform the audit to obtain reasonable assurance about whether the financial statements are free from material misstatement.

9
An audit involves performing procedures to obtain audit evidence about the amounts and disclosures in the financial statements. The procedures selected depend on the auditor’s judgment, including the assessment of the risks of material misstatement of the financial statements, whether due to fraud or error. In making those risk assessments, the auditor considers internal control relevant to the entity’s preparation and fair presentation of the financial statements in order to design audit procedures that are appropriate in the circumstances, but not for the purpose of expressing an opinion on the effectiveness of the entity’s internal control. Accordingly, we express no such opinion. An audit also includes evaluating the appropriateness of accounting policies used and the reasonableness of significant accounting estimates made by management, as well as evaluating the overall presentation of the financial statements. We believe that the audit evidence we have obtained is sufficient and appropriate to provide a basis for our audit opinions. Opinions In our opinion, based on our audit and the report of other auditors, the financial statements referred to above present fairly, in all material respects, the respective financial position of the governmental activities, the business-type activities, the aggregate discretely presented component units, each major fund, and the aggregate remaining fund information of the City of Council Bluffs, Iowa, as of June 30, 2018, and the respective changes in financial position and, where applicable, cash flows thereof for the year then ended in accordance with accounting principles generally accepted in the United States of America. Emphasis of Matter As discussed in Notes 1 and 21 to the financial statements, the City has adopted the provisions of GASB Statement No. 75, Accounting and Financial Reporting for Other Postemployment Benefits Other Than Pensions, which has resulted in a restatement of the net position as of July 1, 2017. Our opinions are not modified with respect to this matter. Emphasis of Matter As discussed in Note 21 to the financial statements, the City has identified and corrected errors in its accounting for land held for resale. Accordingly, adjustments were made to restate beginning equity balances. Our opinions are not modified with respect to this matter. Other Matters Required Supplementary Information Accounting principles generally accepted in the United States of America require that the management’s discussion and analysis and the other required supplementary information listed in the table of contents be presented to supplement the basic financial statements. Such information, although not a part of the basic financial statements, is required by the Governmental Accounting Standards Board, who considers it to be an essential part of financial reporting for placing the basic financial statements in an appropriate operational, economic, or historical context. We have applied certain limited procedures to the required supplementary information in accordance with auditing standards generally accepted in the United States of America, which consisted of inquires of management about the methods or preparing the information and comparing the information for consistency with management’s responses to our inquires, the basic financial statements, and other knowledge we obtained during our audit of the basic financial statements. We do not express an opinion or provide any assurance on the information because the limited procedures do not provide us with sufficient evidence to express an opinion or provide any assurance.

10
Other Information Our audit was conducted for the purpose of forming opinions on the financial statements that collectively comprise the City of Council Bluffs, Iowa’s financial statements. The introductory section, combining nonmajor fund financial statements, Library Foundation financial statements, and statistical section are presented for purposes of additional analysis and are not a required part of the financial statements. The accompanying Schedule of Expenditures of Federal Awards is presented for purposes of additional analysis as required by the audit requirements of Title 2 U.S. Code of Federal Regulations (CFR) Part 200, Uniform Administrative Requirements, Cost Principles, and Audit Requirements for Federal Awards (Uniform Guidance), and is not a required part of the financial statements. The combining nonmajor fund financial statements, Library Foundation financial statements, and the schedule of expenditures of federal awards are the responsibility of management and were derived from and relate directly to the underlying accounting and other records used to prepare the basic financial statements. Such information has been subjected to the auditing procedures applied in the audit of the basic financial statements and certain additional procedures, including comparing and reconciling such information directly to the underlying accounting and other records used to prepare the basic financial statements or to the basic financial statements themselves, and other additional procedures in accordance with auditing standards generally accepted in the United States of America. In our opinion, the combining nonmajor fund financial statements, Library Foundation financial statements, and the schedule of expenditures of federal awards are fairly stated, in all material respects, in relation to the basic financial statements as a whole. The introductory and statistical sections have not been subjected to the auditing procedures applied in the audit of the basic financial statements and, accordingly, we do not express an opinion or provide any assurance on them. Other Reporting Required by Government Auditing Standards In accordance with Government Auditing Standards, we have also issued our report dated December 5, 2018 on our consideration of the City of Council Bluffs, Iowa’s internal control over financial reporting and on our tests of its compliance with certain provisions of laws, regulations, contracts, and grant agreements and other matters. The purpose of that report is solely to describe the scope of our testing of internal control over financial reporting and compliance and the results of that testing, and not to provide an opinion on the effectiveness of the City’s internal control over financial reporting or on compliance. That report is an integral part of an audit performed in accordance with Government Auditing Standards in considering the City’s internal control over financial reporting and compliance.
Dubuque, Iowa December 5, 2018

(This page left blank intentionally.)

11
City of Council Bluffs Management’s Discussion and Analysis
This portion of the Comprehensive Annual Financial Report (CAFR) of the City of Council Bluffs, Iowa (the City) provides administration’s narrative overview and analysis of the City’s financial activities based on currently known facts, decisions and conditions related to the fiscal year that ended June 30, 2018. We encourage readers to consider information in this section along with information we presented in the letter of transmittal found on pages 1 through 4. FINANCIAL HIGHLIGHTS The assets and deferred outflows of resources of the City of Council Bluffs exceeded the liabilities and deferred
inflows of resources at June 30, 2018 by $467,512,093. The City’s net position, based on non-restatement of fiscal year 2017, increased $29,682,285 during the year.
The net position associated with governmental activities increased $26,477,286 and the net position associated with business type activities increased $3,204,972. The City restated fiscal year 2017 net position due to the implementation of GASB 75 and change in accounting for “land held for sale”. See Note 21.
The City’s overall long-term liabilities increased to $120,520,925, an increase of $15,306,202 during the year. The governmental activities general obligation bond/note portion of indebtedness increased $20,495,858 during the year and the net pension liability was $45,289,842, at June 30, 2018. The City’s direct debt ratio to 100% property valuation is 1.37%, one of the lowest in the State of Iowa.
OVERVIEW OF THE FINANCIAL STATEMENTS Our discussion and analysis is intended to introduce and then lead into the City’s basic financial statements – of which there are three components. They are: (1) government-wide financial statements, (2) the fund financial statements and (3) notes to financial statements. Additionally, this report presents required supplementary information and supplementary information. An explanation of each is provided below. REPORTING THE CITY AS A WHOLE The Statement of Net Position and the Statement of Activities Government-wide financial statements are intended to provide readers of the financial statements with a broad picture of the City and present a longer-term view of the City’s finances. These statements are similar to those used by private sector companies. The Statement of Net Position is similar to a balance sheet in the sense it presents information regarding all the City’s assets, deferred outflows of resources, liabilities and deferred inflows of resources that can be used to evaluate the financial condition of the City. Unlike private-sector balance sheets, a Statement of Net Position presents the difference between total assets and deferred outflows of resources and total liabilities and deferred inflows of resources as net position. Over time, changes in net position may be an indication of whether the City’s financial condition is improving or deteriorating. The Statement of Activities presents information regarding the revenues and expenses of the City for the current fiscal year on the accrual basis of accounting. This basis records revenue at the time it is earned rather than when it is received. Expenses are recorded at the time goods or services are received rather than at the time payment is made. Reporting activity in this way means many transactions will be recorded before the actual cash flow from those transactions. The Statement of Activities distinguishes governmental activities from business-type activities. Governmental activities are those that will be carried out using tax revenue, funds from other governments or user fees.

12
City of Council Bluffs Management’s Discussion and Analysis
Examples of governmental activities include public safety, public works, health and social services, culture and recreation, community and economic development and general government. Business-type activities are those intended to be financed primarily by charges for goods and services and without material support from tax revenues. Council Bluffs’ business-type activities for the fiscal year were (1) the operation of a sanitary sewer utility and (2) refuse removal and recycling operations. In both the Statement of Net Position and the Statement of Activities, the City reports the financial information of two discretely presented component units – the Council Bluffs Airport Authority and the Council Bluffs Library Foundation. Component units are separate legal entities apart from the City of Council Bluffs for which the City has a degree of financial accountability. One of the most important questions asked about the City’s finances is, “Is the City of Council Bluffs as a whole better or worse off as a result of the year’s activities?” The Statement of Net Position and the Statement of Activities report information about the City as a whole and about its activities in a way which helps answer this question. GOVERNMENT-WIDE FINANCIAL ANALYSIS As stated earlier, net position may serve over time as a useful indicator of a government’s financial position. The largest portion of the City’s net position is invested in capital assets (land, street and sewer networks, buildings, improvements and equipment), less the related debt used to acquire those assets which is still outstanding. The City uses these capital assets to provide services to citizens. Consequently, these assets are not available for future spending. Although the City’s investment in its capital assets is reported net of related debt, it should be noted the resources needed to repay this debt must be provided from other sources since the capital assets themselves cannot be used to liquidate these liabilities. The analysis that follows shows the City’s total net position at June 30, 2018 and 2017.
2017 2017 20172018 (not restated) 2018 (not restated) 2018 (not restated)
Current and Other Assets 137,492,649$ 127,270,118$ 10,898,887$ 10,285,198$ 148,391,536$ 137,555,316$ Capital Assets 342,759,162 304,656,065 160,113,253 157,752,649 502,872,415 462,408,714
Total Assets 480,251,811 431,926,183 171,012,139 168,037,847 651,263,951 599,964,030
Deferred Outflows of Resources 13,945,098 16,819,324 1,000,673 877,736 14,945,771 17,697,060
Long-Term Liabilities 112,895,331 97,581,273 7,625,594 7,633,450 120,520,925 105,214,723 Other Liabilities 21,468,930 21,475,630 1,162,338 1,341,262 22,631,269 22,816,892
Total Liabilites 134,364,262 119,056,903 8,787,932 8,974,712 143,152,194 128,031,615
Deferred Inflows of Resources 55,428,042 51,761,286 117,391 38,354 55,545,433 51,799,640
Net Position:Net investment in
capital assets 292,236,238 257,012,906 156,034,553 153,340,629 448,270,791 410,353,535 Restricted 35,171,789 45,270,638 - - 35,171,789 45,270,638 Unrestricted (23,003,423) (24,356,226) 7,072,937 6,561,888 (15,930,486) (17,794,338) Total net position 304,404,604$ 277,927,318$ 163,107,489$ 159,902,517$ 467,512,093$ 437,829,835$
Governmental Activities Business-Type Activities Total

13
City of Council Bluffs Management’s Discussion and Analysis
Net position of governmental activities increased approximately $26.5 million, or 9.53%, from fiscal year 2017. Net position of business type activities increased approximately $3.2 million, or 2.00%, over fiscal year 2017. Capital assets of governmental activities increased $38.1 million, or 12.5%, from fiscal year 2017, primarily due to the reconstruction of West Broadway, the major street through the City of Council Bluffs and the construction of a new police headquarters. $7.6 million of the increase is attributable to the change in accounting for “land held for sale”. Capital assets of business type activities increased approximately $2.4 million, or 1.5%, over fiscal year 2017, primarily due to improvements to sanitary and storm sewer infrastructure to the Lake Manawa area and for donated infrastructure received for a new 400 home housing subdivision. The largest portion of the City’s net position is invested in capital assets (e.g. land, infrastructure, buildings and equipment), less the related debt. Restricted net position represents resources subject to external restrictions, constitutional provisions or enabling legislation on how they can be used. Restricted net position decreased approximately $10.1 million, or 22.3%, from fiscal year 2017. This is primarily due to an increase in the net investment in capital assets due to the construction of the police headquarters. Total unrestricted net position, the part of net position that can be used to finance day-to-day operations without constraints established by debt covenants, legislation or other legal requirements, is at a deficit of approximately $15.9 million. This is an increase of approximately $1.9 million over the prior year unrestricted net position, which was at a deficit of approximately $17.8 million.

14
City of Council Bluffs Management’s Discussion and Analysis
2017 2017 20172018 (not restated) 2018 (not restated) 2018 (not restated)
RevenuesProgram revenues
Charges for service 20,924,310$ 15,260,719$ 12,561,419$ 12,244,095$ 33,485,729$ 27,504,814$ Operating grants,
contributions, andrestricted interest 11,199,345 14,842,261 - - 11,199,345 14,842,261
Capital grants, contributions,and restricted interest 21,525,788 21,156,838 - - 21,525,788 21,156,838
General revenuesProperty tax levied for
General purposes 37,232,760 36,523,359 - - 37,232,760 36,523,359 Debt service 5,965,762 5,821,780 - - 5,965,762 5,821,780
Tax increment financing 4,764,496 3,595,822 - - 4,764,496 3,595,822 Local option sales tax 9,110,364 9,244,522 - - 9,110,364 9,244,522 Hotel motel tax 2,770,278 2,679,842 - - 2,770,278 2,679,842 Gaming wager tax 3,032,676 2,992,120 - - 3,032,676 2,992,120 Other city tax 3,105,127 3,040,308 - - 3,105,127 3,040,308 Commercial/industrial replacement 1,985,426 1,999,663 - - 1,985,426 1,999,663 Gain on disposition of
capital assets 56,520 2,153 35,718 42,161 92,238 44,314 Miscellaneous 979,373 1,434,680 - 7,485 979,373 1,442,165
Total revenues 122,652,226 118,594,067 12,597,138 12,293,741 135,249,363 130,887,808
Program expensesPublic safety 33,774,151 32,875,871 - - 33,774,151 32,875,871 Public works 11,087,605 21,559,209 - - 11,087,605 21,559,209 Health and social services 541,850 113,485 - - 541,850 113,485 Culture and recreation 13,517,440 14,276,235 - - 13,517,440 14,276,235 Comm and economic dev 11,736,307 13,635,684 - - 11,736,307 13,635,684 General government 14,342,124 10,182,146 - - 14,342,124 10,182,146 Interest on long-term debt 1,874,944 1,820,873 - - 1,874,944 1,820,873 Sewer - - 9,996,297 8,978,896 9,996,297 8,978,896 Refuse and disposal - - 5,437,869 5,416,587 5,437,869 5,416,587
Total expenses 86,874,421 94,463,503 15,434,167 14,395,483 102,308,588 108,858,986
Excess (deficiency) of revenuesover (under) expenses 35,777,805 24,130,564 (2,837,029) (2,101,742) 32,940,776 22,028,822
Transfers, net (6,084,302) (5,661,111) 6,084,302 5,661,111 - -
Change in net position 29,693,503 18,469,453 3,247,272 3,559,369 32,940,776 22,028,822 Net position beginning of year,
as restated 274,711,101 259,457,865 159,860,216 156,343,148 434,571,317 415,801,013
Net position end of year 304,404,604$ 277,927,318$ 163,107,488$ 159,902,517$ 467,512,093$ 437,829,835$
Governmental Activities Business-Type Activities Total

15
City of Council Bluffs Management’s Discussion and Analysis
Total revenues reported for the primary government for the year ended June 30, 2018 were $135,249,363. Program revenues totaled $66,210,862 for the year ended June 30, 2018. Governmental activities provided $53,649,443 and business type activities provided $12,561,419 of program revenues. Revenue from charges for service during fiscal year 2018 was $33,485,729 accounting for 51% of total program revenues. The following charts break down program revenues by source:
Charge for service 51%
Operating grants and contributions
17%
Capital grants and contributions
32%
FY18 PROGRAM REVENUES
General revenues for the year ended June 30, 2018 totaled $69,038,501. Governmental activities provided $69,002,783 and business type activities provided $35,718 of general revenues. Property tax revenue for fiscal year 2018 totaled $43,198,522 accounting for 63% of general revenues. The following chart illustrates general revenues by source:
Property tax levied for general purposes
54%
Property tax levied for debt service 9%
Tax increment financing 7%
Local option sales tax 13%
Hotel motel tax 4%
Gaming wager tax 4%
Other city tax 5%
Commercial/industrial 3%
Miscellaneous 1%
FY18 GENERAL REVENUES

16
City of Council Bluffs Management’s Discussion and Analysis
Overall revenues increased approximately $4.36 million, or 3.33%, from fiscal year 2017. The year over year change is primarily due to higher permit fees collected in fiscal 2018 for the construction of additional buildings in a large data center complex. Expenses for the primary government for the year ended June 30, 2018 totaled $102.3 million. This is a decrease of $6.6 million or 6.0% from the prior year total of $108.9 million. The decrease was driven by the completion of the infrastructure in the River’s Edge development area and completion of a public pavilion in the River’s Edge Park in fiscal 2017. Expenses for governmental activities totaled $86.9 million, accounting for 84.9% of total expenses. Business type activities expenses totaled $15.4 million, or 15.1% of the total. The following chart breaks down expenses by function/program:
Public safety 33%
Public works 11%
Health and social services .1%
Culture and recreation 13%
Comm and economic dev 11%
General government 14%
Interest on long‐term debt 2%
Sewer 10%
Refuse and disposal 5%
FY 18 EXPENSES BY FUNCTION/PROGRAM
The following table shows the activities included within each function/program: Function/Program Activity
Public safety Individual and community protection, and physical health
Public works Public service, utilities and transportationHealth and social services Health regulation and inspectionCulture and recreation Education and recreationCommunity and economic Environmental preservation, housing and
development community developmentGeneral government Policy and administration, including in-house
services provided to City departments.

17
City of Council Bluffs Management’s Discussion and Analysis
Governmental Activities To aid in understanding the Statement of Activities, some additional explanation is given. Of particular interest is the format which is significantly different than a typical Statement of Revenues, Expenses and Changes in Fund Balances. Please note the expenses are listed in the first column with revenues from that particular program reported to the right. The result is a net (expense) revenue calculation. This format highlights the respective financial burden each of the functions place on the taxpayers. For example, for community and economic development, the City spent $11.7 million and received $6.8 million in revenue due to the timing of the receipt of revenue. Public Works revenue exceeded expenditures partially due to the timing of the receipt of revenue and due to a developer donated streets and sewer valued at over $6.6 million in fiscal 2018. This format identifies how much each function draws from general revenues or is self-sustaining through fees or grants. Some of the individual line item revenues reported for each function are:
Function Program Revenues Public safety Fines, fees and federal and state grants Community and economic development HUD, CDBG and nongovernmental grants General government Internal charges for service
The total cost of governmental activities this year was $86,874,421. Of these costs, $20,924,310 was paid by those who directly benefited from the programs. Costs paid by other governments and organizations which subsidized certain programs with operating and capital grants and contributions were $32,725,133 leaving a net expense of $33,224,978 for governmental activities. These expenses were primarily financed by tax revenues and other general revenues. The Statement of Activities provides further detail. The net (expense) revenue for governmental activities is as follows:
Governmental Activities 2018 2017(not restated)
Function/ProgramPublic safety (24,727,212)$ (27,969,327)$ Public works 11,902,663 (71,289) Health and social services (316,770) 84,333 Culture and recreation (6,191,594) (5,322,731) Community and economic development (4,983,583) (3,687,544) General government (7,033,538) (4,416,254) Interest on long-term debt (1,874,944) (1,820,873)
Net (expense) revenue of governmental activities (33,224,978) (43,203,685) General revenues and transfers 62,918,481 61,673,138 Change in net position 29,693,503$ 18,469,453$
Changes in Net PositionNet (Expense) Revenue and
Resources available during the year to finance governmental activities totaled $394,927,318, consisting of net position at July 1, 2017, of $277,927,318, program revenues of $53,649,443 and general revenues and transfers of $62,918,481. During the year, governmental activities expenses totaled $86,874,421. Governmental activities net position increased $29,693,503 to $304,404,604.

18
City of Council Bluffs Management’s Discussion and Analysis
Business-Type Activities The cost of all business type activities for the year was $15,434,167 as shown in the Statement of Activities. The amount charged to users of the systems was $12,561,419. Net expense for business type activities was $2,872,748. The net (expense) revenue by business type activity for the years ended June 30, 2018 and 2017 is as follows:
Business-Type Activities 2018 2017(not restated)
Sewer (3,062,708)$ (2,464,681)$ Refuse and disposal 189,960 313,293 Total net (expense) revenue (2,872,748) (2,151,388) General revenues and transfers 6,120,020 5,710,757 Change in net position 3,247,272$ 3,559,369$
Net (Expense) Revenue andChanges in Net Position
Resources available during the year to finance business-type activities totaled $178,583,956, consisting of net position at July 1, 2017 of $159,902,517 program revenues of $12,561,419, and general revenues and transfers of $6,120,020. During the year, business-type activities expenses totaled $15,434,167 and business-type activities net position increased $3,247,272 to $163,107,488. FINANCIAL ANALYSIS OF THE CITY’S FUNDS GOVERNMENTAL FUND HIGHLIGHTS As noted earlier, the City uses fund accounting to ensure and demonstrate compliance with finance-related legal requirements. The focus of the City’s governmental funds is to provide information on near-term inflows, outflows and balances of spendable resources. Such information is useful in assessing financing requirements. Unassigned fund balances may serve as a useful measure of net resources available for spending at the end of a fiscal year. The City’s governmental funds reported combined ending fund balances of $70,075,008. The combined governmental fund balances increased by $9,855,012 from the prior year. The following are the major reasons for the changes in fund balances of the major governmental funds from the prior year: The General fund balance decreased $658,323 or 2.76%, from the prior year. Revenues increased $5,771,078, or 8.9%. Expenditures increased $2,468,474 or 4.1%, from the prior year. The fund balance decrease is primarily due to reimbursement to the Road Use fund for employee benefit expenditures and an additional investment of $2,000,000 in the River’s Edge parking garage. The Special Revenue, Bass Pro fund balance increased $574,821 or 219.1% from the prior year. The fund balance increased to provide reserves for the property tax payment payable in the upcoming fiscal year. The Special Revenue, Tax Increment Financing Fund Balance increased $33,729 due to timing of expenditures. The Special Revenue, Local Option Sales Tax (LOST) fund balance increased $1,565,557 or 16.25% from the prior year. The City budgeted fewer projects for LOST funding in Fiscal 2018 due to the continuation of the levee project which will be subsidized by LOST in future years.

19
City of Council Bluffs Management’s Discussion and Analysis
The Debt Service fund balance increased $15,081 or 1.3% from the prior year. Timing difference of the collection of delinquent taxes affect the fund balance. The Capital Project fund balance increased $13,523,340 or 230.9% from the prior year due to the issuance of $17.1 million of general obligations bonds for capital projects which included funding for the police headquarters which will be completed by January 1, 2019. The Non-major Governmental Fund balance increased $3,691,902 or 38.6% from the prior year, primarily due to the reimbursement to the road use fund for employee benefit expenditures. PROPRIETARY FUND HIGHLIGHTS The Enterprise, Sewer Fund, which accounts for the operation and maintenance of the City’s wastewater treatment and sanitary sewer system, ended fiscal year 2018 with a $156,722,977 net position compared to the prior year ending net position of $153,582,252, an increase of $3,140,725, or 2.04%. The change is primarily due to increased sewer fees phased in over the past several years and the contribution of infrastructure completed in fiscal year 2018.
The Enterprise, Refuse and Disposal Fund ended fiscal year 2018 with a $6,384,512 net position compared to the prior year ending net position of $6,320,265 an increase of $64,247, or 1.0%. BUDGETARY HIGHLIGHTS The City adopted one budget amendment in the fiscal year ended June 30, 2018. In May 2018, City officials reviewed year to date operations, projected activity to the end of the year and determined adjustments to the budget for: (1) revenues for franchise fees were increased $460,000, (2) bond proceeds were increased $17,945,000 to adjust for the timing of the issuance of the 2018A bonds and to allow for the refunding of the 2009B and 2010C outstanding bonds for $6,920,000, (3) costs related to the issuance of the 2018A bonds for $82,100, and (4) interfund transfers to align revenue and expenditures. In the fiscal year, ended June 30, 2018, actual revenues of $131,844,370 exceeded the amended budget revenue of $121,439,437 by $10,404,933. Revenue exceeded expectations for license and permits fees due to the construction of additional buildings for data center operations by a global technology company, due to unanticipated higher revenue collected for franchise fees from local utility companies, and due to the receipt of a large grant which was not included in the budget. Overall, total expenditures were $1,763,028 lower than budgeted amounts. Expenditures during the year ended June 30, 2018 totaled $149,016,864. The amended expenditure budget was $150,779,892. Actual expenditures were lower than budgeted for Economic Development due to lower costs associated with the Bass Pro facility and delayed expenditures for improvements planned for the Lake Manawa SMIDD area. Expenditures were also lower than anticipated for the operation of the Mid America Center in fiscal 2018. The City is currently in the process of developing an operating budget for the fiscal year ending June 30, 2020 that will plan to have revenues approximate expenditures for all funds, including the General Fund.

20
City of Council Bluffs Management’s Discussion and Analysis
CAPITAL ASSETS AND DEBT ADMINISTRATION Capital Assets The City’s investment in capital assets, including land, buildings and improvements, equipment, streets, sewer systems, lighting systems, traffic signals and other infrastructure, represents the value of the resources utilized to provide services to our citizens. Capital assets at June 30, 2018 were $502,872,412 (net of accumulated depreciation). See Note 3 to the financial statements for more information about the City’s capital assets. During the fiscal year ending June 30, 2018, the City’s investment in capital assets included public safety equipment, which included police vehicles and an ambulance. Capital assets increased for street infrastructure due to ongoing street improvements and due to $6,629,122 of donated infrastructure received for a new 400 home housing development known as Whispering Oaks. Additional increases in capital assets were due to the ongoing construction of a new police headquarters, levee improvement construction, improvements to parks, and information technology infrastructure upgrades. Capital improvements in business type activities included investments to upgrade the storm sewer for the Lake Manawa area, installation of storm sewers in the West Broadway corridor as well as ongoing upgrades to sewer pump stations. Long-term Debt At June 30, 2018, the City had approximately $64.48 million of general obligation bonds and notes outstanding versus approximately $43.98 million last year. The increase is a result of current year borrowing partially offset by principal payments on existing bonds. $11.7 million of the 2018 bond proceeds will be used for the construction of the new police headquarters. The remaining bond funds are for streets and sewer infrastructure improvements, park rehabilitation projects, and fire station improvements. The City continues to operate well under the State debt capacity limitation. The State limits the amount of general obligation debt outstanding to 5% of the assessed value of all taxable property in the City. More detailed information about the City’s long-term debt is presented in Note 4 to the financial statements. ECONOMIC FACTORS The City’s operating plan for fiscal year 2019 calls for revenue and other financing activity of $129,983,224 and expenditures of $145,746,460. The funding for the expenditures for fiscal year 2019 include bond proceeds received at the end of fiscal year 2018. As the year progresses, actual revenue and expenses are aligned with the budget. Major expansion of Interstate Highways 80 and 29 is generating a great deal of both construction activity and economic growth. The reconstruction of the Interstate System includes a new interchange onto Broadway, which is the main corridor into Council Bluffs from downtown Omaha. In addition, the State of Iowa transferred control of Broadway to the City of Council Bluffs, which has allowed the City to reconstruct the roadway and add storm sewer and safety enhancements. The vital interstate interchange and reconstruction of this major artery has stimulated significant development of the western edge of the City. The City has entered into a major private-public development for the area known as River’s Edge, which includes a large public park along the Missouri River, an office park and residential housing. Included in the development is a 67,000 square feet office building, a 743 space-parking garage, apartments and condominiums. Total private investment is expected to exceed $400 million for the development. The City anticipates significant property tax growth with the River’s Edge development, which may offset the impact of lower retail valuations due to online sales. The City’s new state of the art Police Headquarters will open in fiscal year 2019.
21
City of Council Bluffs Management’s Discussion and Analysis
CONTACTING THE CITY’S FINANCIAL MANAGEMENT This financial report is designed to provide our citizens, taxpayers, customers, investors and creditors with a general overview of the City’s finances and operating activities. If you have questions or require additional financial information, please contact Kathryn Knott, Director of Finance at 712-890-5313.

(This page left blank intentionally.)

Basic Financial Statements June 30, 2018
City of Council Bluffs

(This page left blank intentionally.)

See Notes to Financial Statements
Governmental Business-TypeActivities Activities Total
AssetsCurrent Assets
Cash, cash equivalents and pooled investments 68,542,779$ 8,586,040$ 77,128,819$ Receivables
Delinquent property tax 158,758 - 158,758 Succeeding year property tax 50,029,593 - 50,029,593 Succeeding year tax increment financing 4,176,848 - 4,176,848 Accounts 2,966,218 101,433 3,067,651 Special and drainage assessments 173,551 - 173,551 Customer accounts and unbilled usage - 1,737,762 1,737,762 Loans 1,690,357 - 1,690,357
Due from other governments 5,738,923 143,897 5,882,820 Inventories 1,417,509 329,754 1,747,263 Prepaid items 775,081 - 775,081
Total current assets 135,669,617 10,898,887 146,568,504
Noncurrent AssetsLand held for resale 1,823,032 - 1,823,032 Capital assets-nondepreciable 113,952,401 10,370,218 124,322,619 Capital assets-depreciable (net) 228,806,761 149,743,035 378,549,796
Total noncurrent assets 344,582,194 160,113,253 504,695,447
Total Assets 480,251,811 171,012,139 651,263,951
Deferred Outflows of ResourcesPension related deferred outflows- IPERS 3,296,468 949,860 4,246,328 Pension related deferred outflows- MFPRSI 10,233,694 - 10,233,694 OPEB related deferred outflows 414,936 50,813 465,749
Total deferred outflows of resources 13,945,098 1,000,673 14,945,771
LiabilitiesCurrent Liabilities
Accounts payable 8,163,944 477,601 8,641,544 Salaries and benefits payable 1,759,908 178,239 1,938,147 Accrued interest payable 265,888 - 265,888 Deposits - - - General obligation bonds/notes-net 7,135,000 - 7,135,000 Revenue bonds/notes - 227,000 227,000 Term loan notes 1,221,053 - 1,221,053 Settlement agreement 528,571 - 528,571 Iowa Finance Authority loan 265,000 - 265,000 Notes payable - 71,700 71,700 Termination benefit liability - 4,702 4,702 Compensated absences 2,129,567 203,096 2,332,663
Total current liabilities 21,468,930 1,162,338 22,631,269
Primary Government

22
City of Council Bluffs Statement of Net Position
June 30, 2018
Airport Library Authority Foundation
960,707$ 10,144,730$
- - - - - -
5,749 188,907 - - - - - -
202,761 - - -
34,021 - 1,203,238 10,333,637
- - 2,913,548 -
20,154,506 - 23,068,054 -
24,271,292 10,333,637
50,176 - - - - -
50,176 -
118,770 - 10,223 -
2,009 - 6,612 -
- - - - - - - - - -
230,000 - - - - -
367,614 -
Component Units

See Notes to Financial Statements
Governmental Business-TypeActivities Activities Total
Primary Government
Noncurrent Liabilities
General obligation bonds/notes-net 57,340,858$ -$ 57,340,858$ Revenue bonds/notes - 3,715,000 3,715,000 Settlement agreement 1,257,142 - 1,257,142 Iowa Finance Authority loan 4,410,000 - 4,410,000 Notes payable - 65,000 65,000 Compensated absences 956,506 123,590 1,080,096 Total OPEB liability 3,387,641 414,852 3,802,493 Termination benefit liability 253,342 82,022 335,364 Net pension liability - IPERS 11,192,739 3,225,130 14,417,869 Net pension liability - MFPRSI 34,097,103 - 34,097,103
Total noncurrent liabilities 112,895,331 7,625,594 120,520,925
Total Liabilities 134,364,262 8,787,932 143,152,194
Deferred Inflows of ResourcesSucceding year property tax 50,029,593 - 50,029,593 Succeeding year tax increment financing 4,176,848 - 4,176,848 Pension related deferred inflows- IPERS 407,402 117,391 524,793 Pension related deferred inflows- MFPRSI 814,199 - 814,199
Total deferred inflows of resources 55,428,042 117,391 55,545,433
Net Position
Net investment in capital assets 292,236,238 156,034,553 448,270,791 Restricted for
NonexpendablePermanent Fund 61,360 - 61,360
ExpendableDebt service 2,121,270 - 2,121,270 Street and sewer maintenance and improvements 21,147,128 - 21,147,128 Community development block grant programs 1,112,044 - 1,112,044 Capital projects 6,434,479 - 6,434,479 Employee benefits and Insurance 1,706,019 - 1,706,019 Library - - - Other purposes 2,589,489 - 2,589,489
Unrestricted (23,003,423) 7,072,937 (15,930,486) Total net position 304,404,604$ 163,107,489$ 467,512,093$

23
City of Council Bluffs Statement of Net Position
June 30, 2018
Airport Library Authority Foundation
Component Units
-$ -$ - - - - - -
1,215,000 - - - - - - -
176,311 - - -
1,391,311 -
1,758,925 -
- - - -
11,320 - - -
11,320 -
21,623,054 -
- 41,635
- - - - - - - - - - - 10,292,002 - -
928,169 - 22,551,223$ 10,333,637$

See Notes to Financial Statements
Operating Capital GrantsCharges for Grants and and
Expenses Service Contributions ContributionsFunctions/ProgramsGovernmental Activities
Public safety 33,774,151$ 8,577,055$ 189,215$ 280,670$ Public works 11,087,605 321,237 8,936,414 13,732,618 Health and social services 541,850 71,663 153,417 - Culture and recreation 13,517,440 5,182,883 648,850 1,494,113 Community and economic development 11,736,307 871,668 585,214 5,295,841 General government 14,342,124 5,899,804 686,236 722,546 Interest on long-term debt 1,874,944 - - -
Total governmental activities 86,874,421 20,924,310 11,199,345 21,525,788
Business-Type ActivitiesSewer 9,996,297 6,933,590 - - Refuse and disposal 5,437,869 5,627,830 - -
Total business type activities 15,434,167 12,561,419 - -
Total primary government 102,308,588$ 33,485,729$ 11,199,345$ 21,525,788$
Component UnitsAirport Authority 1,404,615$ 309,240$ -$ 678,493$ Library Foundation 245,962 - 613,709 -
Total component units 1,650,577$ 309,240$ 613,709$ 678,493$
General RevenuesProperty and other County tax levied for:
General purposesDebt service
Tax increment financingLocal option sales taxHotel/motel taxGaming wager taxOther city taxCommercial/industrial replacementUnrestricted investment earningsInterest IncomeGain on disposition of capital assetsMiscellaneous
Tranfers Total general revenues and transfers
Change in Net Position
Net Position Beginning of Year, as restated
Net Position End of Year
Program Revenues

24
City of Council Bluffs Statement of Activities
Year Ended June 30, 2018
Governmental Business-Type Airport LibraryActivities Activities Total Authority Foundation
(24,727,212)$ -$ (24,727,212)$ -$ -$ 11,902,663 - 11,902,663 - -
(316,770) - (316,770) - - (6,191,594) - (6,191,594) - - (4,983,583) - (4,983,583) - - (7,033,538) - (7,033,538) - - (1,874,944) - (1,874,944) - -
(33,224,978) - (33,224,978) - -
- (3,062,708) (3,062,708) - - - 189,960 189,960 - - - (2,872,748) (2,872,748) - -
(33,224,978)$ (2,872,748)$ (36,097,725)$ -$ -$
-$ -$ -$ (416,882)$ -$ - - - - 367,747 -$ -$ -$ (416,882)$ 367,747$
37,232,760$ -$ 37,232,760$ 712,278$ -$ 5,965,762 - 5,965,762 - - 4,764,496 - 4,764,496 - - 9,110,364 - 9,110,364 - - 2,770,278 - 2,770,278 - - 3,032,676 - 3,032,676 - - 3,105,127 - 3,105,127 - - 1,985,426 - 1,985,426 - -
- - - - 677,325 - - - 487 -
56,520 35,718 92,238 39,500 - 979,373 - 979,373 57,585 -
(6,084,302) 6,084,302 - - - 62,918,481 6,120,020 69,038,501 809,850 677,325
29,693,503 3,247,273 32,940,776 392,968 1,045,072
274,711,101 159,860,216 434,571,317 22,158,255 9,288,565
304,404,604$ 163,107,489$ 467,512,093$ 22,551,223$ 10,333,637$
Primary Government Component Units

See Notes to Financial Statements
CityTax Increment Local Option
General Bass Pro Shop Financing Sales TaxAssetsCash, Cash Equivalents and Pooled Investments 19,374,651$ 1,488,023$ 1,042,650$ 10,411,430$ Receivables
Property TaxDelinquent 137,799 - - - Succeeding year propery taxes 42,321,591 - - -
Succeeding year tax increment financing - - 4,176,848 - Accounts (net) 2,065,536 - - 161,928 Special and drainage assessments - - - - Loans 1,445,000 - - -
Due From Other Governments 1,669,068 - 20,007 1,453,558 Due from Other Funds 11,631 - - - Inventories 445,312 - - - Prepaid Items 775,081 - - - Land Held for Resale 1,572,721 - - -
Total Assets 69,818,390$ 1,488,023$ 5,239,505$ 12,026,916$
Liabilities, Deferred Inflows of Resources and Fund Balances
LiabilitiesAccounts payable 2,321,120$ 650,872$ -$ 375,772$ Salaries and benefits payable 1,612,093 - - - Due to other funds - - - -
Total Liabilities 3,933,213 650,872 - 375,772
Deferred Inflows of ResourcesUnavailable revenues
Succeeding year property tax 42,321,591 - - - Succeeding year tax increment financing - - 4,176,848 - Other 385,370 - - 452,275
Total deferred inflows of resources 42,706,961 - 4,176,848 452,275
Fund BalancesNonspendable
Cementary perpetual care - - - - Inventories 445,312 - - - Prepaid items 775,081 - - - Land held for sale 1,572,721 - - - Long term loan receivable 1,445,000 - - -
Restricted - Street and sewer maintenance and
and improvements - - - 11,198,869 Debt service - - 948,593 - Community development block grant program - - - - Capital projects - - - - Other purposes 1,706,019 837,151 114,064 -
Unassigned 17,234,082 - - - Total fund balances 23,178,215 837,151 1,062,657 11,198,869 Total liabilities, deferred inflowsof resources and fund balances 69,818,389$ 1,488,023$ 5,239,505$ 12,026,916$
Special Revenue

25
City of Council Bluffs Balance Sheet
Governmental Funds June 30, 2018
Debt Service Capital Projects Nonmajor Total
1,094,558$ 23,222,772$ 11,908,695$ 68,542,779$
20,960 - - 158,758 7,708,002 - - 50,029,593
- - - 4,176,848 - 693,466 45,288 2,966,218 - - 173,551 173,551 - - 245,357 1,690,357
64,920 1,877,601 653,770 5,738,923 - - - 11,631 - - 972,197 1,417,509 - - - 775,081 - 250,311 - 1,823,032
8,888,441$ 26,044,150$ 13,998,857$ 137,504,280$
7,762$ 4,435,684$ 372,734$ 8,163,944$ - - 147,815 1,759,908 - - 11,631 11,631
7,762 4,435,684 532,179 9,935,482
7,708,002 - - 50,029,593 - - - 4,176,848
20,960 2,228,943 199,801 3,287,349 7,728,962 2,228,943 199,801 57,493,790
- - 61,360 61,360 - - 972,197 1,417,509 - - - 775,081 - - - 1,572,721 - - - 1,445,000
- - 9,495,984 20,694,853 1,151,717 - - 2,100,310
- - 1,112,044 1,112,044 - 19,379,523 - 19,379,523 - - 1,638,275 4,295,508 - - (12,983) 17,221,099
1,151,717 19,379,523 13,266,876 70,075,008
8,888,441$ 26,044,150$ 13,998,857$ 137,504,280$

See Notes to Financial Statements 26
City of Council Bluffs Reconciliation of the Balance Sheet
Governmental Funds to the Statement of Net Position June 30, 2018
Total Governmental Fund Balances 70,075,008$
Amounts Reported for Governmental Activities in the Statement of NetPosition are different because:
Capital assets used in governmental activities are not current financial resources and, therefore, are not reported in the governmental funds.
These assets consist of:Capital assets, net of accumulated depreciation 342,759,162
Other long-term assets are not available to pay current periodexpenditures and, therefore, are unavailable in the governmentalfunds. 3,287,349
Pension and OPEB related deferred outflows of resources and deferredinflows of resources are not due and payable in the current year and,therefore, are not reported in the governmental funds, as follows:
Deferred outflows of resources- IPERS 3,296,468$ Deferred outflows of resources- MFPRSI 10,233,694 Deferred outflows of resources- OPEB 414,936 Deferred inflows of resources- IPERS (407,402) Deferred inflows of resources- MFPRSI (814,199)
12,723,496 Long-term liabilities applicable to the City's governmental
activities are not due and payable in the current period and,therefore, are not reported as fund liabilities. Interest onlong-term debt is not accrued in governmental funds, butrather is recognized as an expenditure when due. Allliabilities - both current and long-term - are reported in the Statement of Net Position. Balances at June 30, 2018, are:
General obligation bonds/notes (64,475,858) Urban renewal term loan note (1,221,053) Settlement agreement (1,785,713) Iowa Finance Authority (4,675,000) Compensated abscences (3,086,073) Total OPEB liability (3,387,641) Termination benefit liability (253,343) Net pension liability- IPERS (11,192,739) Net pension liability- MFPRSI (34,097,103) Accrued interest payable (265,888)
Total long-term liabilities (124,440,411)
Net Position of Governmental Activities 304,404,604$

(This page left blank intentionally.)

See Notes to Financial Statements
Tax City LocalBass Pro Increment Option
General Shop Financing Sales TaxRevenues
Property tax 37,232,760$ -$ -$ -$ Tax increment financing - - 4,764,496 - Other city tax 12,376,865 - - 8,751,686 License and permits 5,685,836 - - - Use of money and property 533,779 630,990 4,516 - Intergovernmental 3,380,216 192,560 - 1,800,777 Local grants 639,472 2,147,315 - 753,451 Charge for service 6,435,001 - - - Special and drainage assessments - - - - Miscellaneous 4,367,266 - - 100,951
Total revenues 70,651,196 2,970,865 4,769,012 11,406,865
ExpendituresCurrent
Public safety 33,056,957 - - - Public works 1,866,513 - - - Health and social services 553,808 - - - Culture and recreation 11,758,933 - - - Community and economic development 648,021 650,873 2,065,035 - General government 14,571,617 - - -
Debt servicePrincipal redeemed - 2,442,105 - - Interest paid - 90,524 - - Miscellaneous debt expenditures - - - -
Capital projects - - - 7,475,394 Total expenditures 62,455,849 3,183,501 2,065,035 7,475,394
Excess (Deficiency) of Revenues Over(Under) Expenditures 8,195,347 (212,637) 2,703,978 3,931,471
Other Financing Sources (Uses)General obligation bonds issued - - - - Issuance of refunding bonds - - - - Premium on general obligation bonds issued - - - - Transfers in 450,154 787,458 - - Transfers out (8,118,714) - (2,670,249) (2,365,915)
Total other financing sources (uses) (7,668,560) 787,458 (2,670,249) (2,365,915)
Net Change in Fund Balances 526,787 574,821 33,729 1,565,557 Fund Balances Beginning of Year,
as restated 22,651,428 262,330 1,028,928 9,633,312
Fund Balances End of Year 23,178,215$ 837,151$ 1,062,657$ 11,198,869$
Special Revenue

27
City of Council Bluffs Statement of Revenues, Expenditures, and Changes in Fund Balances
Governmental Funds Year Ended June 30, 2018
Debt CapitalService Projects Nonmajor Total
5,962,464$ -$ -$ 43,195,224$ - - - 4,764,496
409,983 - - 21,538,534 - - 88,140 5,773,976 - - - 1,169,285
330,323 7,405,059 9,001,861 22,110,797 - 4,198,465 7,738,704 - - 7,230 6,442,231 - - 305,146 305,146 - 1,242,236 534,108 6,244,561
6,702,769 12,845,760 9,936,484 119,282,952
- - 78,681 33,135,638 - - 7,904,827 9,771,341 - - - 553,808 - - 248,509 12,007,442 - - 1,429,291 4,793,219 - - - 14,571,617
13,585,000 - - 16,027,105 1,524,798 - - 1,615,322
43,927 - - 43,927 - 33,587,883 - 41,063,277
15,153,726 33,587,883 9,661,309 133,582,697
(8,450,957) (20,742,123) 275,175 (14,299,745)
- 25,875,000 - 25,875,000 6,270,000 - - 6,270,000
669,678 1,297,684 - 1,967,362 1,526,360 7,656,956 3,541,677 13,962,604
- (564,177) (124,949) (13,844,004) 8,466,037 34,265,462 3,416,727 34,230,962
15,081 13,523,340 3,691,902 19,931,216
1,136,636 5,856,183 9,574,975 50,143,792
1,151,717$ 19,379,523$ 13,266,877$ 70,075,008$

See Notes to Financial Statements 28
City of Council Bluffs Reconciliation of the Statement of Revenues, Expenditures, and Changes in Fund Balances
Governmental Funds to the Statement of Activities Year Ended June 30, 2018
Net Change in Fund Balances - Total Governmental Funds 19,931,216$
Amounts Reported for Governmental Activities in the Statement of Activities are different because
Governmental funds report capital outlays as expenditures whilegovernmental activities report depreciation/amortization expense toallocate those expenditures over the life of the assets. Capital outlayexpenditures exceeded depreciation/amortization expense in thecurrent year, as follows:
Expenditures for capital assets 42,423,290$ Depreciation/amortization expense (11,839,183)
30,584,107 In the statement of activities, only the gain or loss on the sale of capital assets is reported,
whereas in the governmental funds, the entire proceeds from the sale increasefinancial resources. Thus, the change in net position differs from the change in fundbalances by the book value of the asset being disposed. (121,437)
Because some revenues will not be collected for several months after the City'sfiscal year ends, they are not considered "available" revenues and are deferredin the governmental funds. Deferred inflows of resources decreasedby these amounts this year:
Other (2,712,191)
Proceeds from issuing long-term liabilities provide current financialresources to governmental funds, but issuing debt increases long-termliabilities in the Statement of Net Position. Repayment of long-termliabilities is an expenditure in the governmental funds, but therepayment reduces long-term liabilities in the Statement of Net Position.
Repaid 17,030,677 Issued (34,112,362)
The current year City's share of IPERS and MFPRSI contributions are reportedas expenditures in the governmental funds, but are reported as deferred outflows ofresources in the Statement of Net Position.
IPERS 1,131,894 MFPRSI 4,341,885
5,473,779 Some expenses reported in the Statement of Activities do not require use of
current financial resources and therefore, are not reported as expenditures inthe governmental funds, as follows:
Compensated absences 152,664 Total OPEB expense (272,578) Termination benefit liability 446,933 Pension expense - IPERS (1,508,079) Pension expense - MFPRSI (5,185,276) Interest on long-term debt (45,457) Bond Premium Amortization 31,504
(6,380,289)
Change in Net Position of Governmental Activities 29,693,501$

(This page left blank intentionally.)

See Notes to Financial Statements 29
City of Council Bluffs Statement of Net Position
Proprietary Funds June 30, 2018
Non-major
Refuseand
Sewer Disposal TotalAssetsCurrent Assets
Cash, cash equivalents and pooled investments 4,421,516$ 4,164,523$ 8,586,040$ Receivables
Accounts 52,793 48,640 101,433 Customer accounts and unbilled usage 917,015 820,748 1,737,762
Due from other governments 3,984 139,913 143,897 Inventories 294,411 35,343 329,754
Total current assets 5,689,719 5,209,168 10,898,887
Noncurrent AssetsCapital assets-nondepreciable 10,009,595 360,622 10,370,218 Capital assets-depreciable (net) 147,681,481 2,061,554 149,743,035
Total noncurrent assets 157,691,077 2,422,176 160,113,253
Total assets 163,380,796 7,631,344 171,012,139
Deferred Outflows of ResourcesIPERS pension related deferred outflows 735,172 214,688 949,860 OPEB related deferred outflows 39,868 10,945 50,813
Total deferred outflows of resources 775,040 225,633 1,000,673
LiabilitiesCurrent Liabilities
Accounts payable 92,349 385,252 477,601 Salaries and benfits payable 147,965 30,274 178,239 Revenue notes and loans 227,000 - 227,000 Notes payable - 71,700 71,700 Compensated absences 168,137 34,959 203,096 Termination benefit liability 4,702 - 4,702
Total current liabilities 640,153 522,185 1,162,338
Noncurrent LiabilitiesRevenue notes and loans 3,715,000 - 3,715,000 Notes payable - 65,000 65,000 Compensated absences 87,812 35,778 123,590 Total OPEB liability 325,493 89,359 414,852 Termination benefit liability 77,359 4,663 82,022 Net IPERS pension liability 2,496,183 728,947 3,225,130
Total noncurrent liabilities 6,701,847 923,747 7,625,594
Total liabilities 7,342,000 1,445,932 8,787,932
Deferred Inflows of ResourcesIPERS pension related deferred inflows 90,858 26,533 117,391
Net PositionNet Investment in Capital Assets 153,749,080 2,285,473 156,034,553 Unrestricted 2,973,897 4,099,039 7,072,936
Total net position 156,722,977$ 6,384,512$ 163,107,489$

See Notes to Financial Statements 30
City of Council Bluffs Statement of Revenues, Expenses, and Changes in Fund Net Position
Proprietary Funds Year Ended June 30, 2018
Non-majorRefuse
andSewer Disposal Total
Operating RevenuesCharges for service 6,895,315$ 5,612,824$ 12,508,139$ Miscellaneous 38,275 15,006 53,281
Total operating revenues 6,933,590 5,627,830 12,561,420
Operating ExpensesSewer system and sewage disposal 6,037,606 - 6,037,606 Refuse disposal - 5,207,565 5,207,565 Depreciation 3,823,976 230,305 4,054,281
Total operating expenses 9,861,582 5,437,869 15,299,452
Operating Income (Loss) (2,927,993) 189,960 (2,738,032)
Non-Operating Revenues (Expenses):Gain on asset disposal 22,027 13,691 35,718 Interest expense (124,310) - (124,310) Miscalleneous debt expense (10,405) - (10,405)
Total non-operating revenues (expenses) (112,688) 13,691 (98,997)
Net Income (Loss) Before Contributions (3,040,681) 203,652 (2,837,028)
Capital Contributions 6,202,902 - 6,202,902 Transfers Out - (118,600) (118,600)
Total contributions and transfers 6,202,902 (118,600) 6,084,302
Change in Net Position 3,162,221 85,052 3,247,273
Net Position Beginning of Year, as restated 153,560,756 6,299,460 159,860,216 Net Position End of Year 156,722,977$ 6,384,512$ 163,107,489$

See Notes to Financial Statements 31
City of Council Bluffs Statement of Cash Flows
Proprietary Funds Year Ended June 30, 2018
Non-majorRefuse
and Sewer Disposal Total
Cash Flows from Operating ActivitiesCash received from customers and users 6,753,087$ 5,673,880 12,426,967$ Cash received from other sources 39,498 (300) 39,198 Cash paid to employees (4,164,766) (1,103,471) (5,268,237) Cash paid to suppliers (1,802,720) (4,108,967) (5,911,687)
Net cash flows from operating activities 825,099 461,142 1,286,241
Cash Flows from Noncapital Financing ActivitiesLand rent - (118,600) (118,600)
Cash Flows from Capital and Related Financing ActivitiesAcquisition of capital assets (158,156) (36,312) (194,468)
Proceeds from the sale of capital assets 6,052 12,155 18,207 Principal payments (220,000) (113,320) (333,320) Interest and fees (134,715) - (134,715)
Net cash used in capital and related financingactivities (506,819) (137,477) (644,296)
Net Increase in Cash and Cash Equivalents 318,280 205,065 523,345
Cash and Cash Equivalents Beginning of Year 4,103,236 3,959,458 8,062,694
Cash and Cash Equivalents End of Year 4,421,516$ 4,164,523$ 8,586,039$

See Notes to Financial Statements 32
City of Council Bluffs Statement of Cash Flows
Proprietary Funds Year Ended June 30, 2018
Non-majorRefuse
and Sewer Disposal Total
Reconciliation of Operating Income (Loss) to Net CashProvided by Operating Activities
Operating income (loss) (2,927,993)$ 189,960$ (2,738,033)$ Adjustments to reconcile operating income (loss)
to net cash provided by operating activitiesDepreciation 3,823,976 230,305 4,054,281 Changes in assets, deferred outflows,
liabilities, and deferred inflowsAccounts receivable and unbilled usage (142,228) 61,056 (81,172) Due from other governments 1,223 (15,305) (14,082) Inventories (9,091) 13,421 4,330 IPERS deferred outflows (94,500) (28,437) (122,937) Accounts payable (93,617) (18,003) (111,620) Prepaid items 403 175 578 Salaries and benefits payable (3,663) (14,233) (17,896) Compensated absences 3,146 (20,767) (17,621) OPEB liability 66,058 18,135 84,193 Termination benefit liability 28,054 (11,237) 16,817 IPERS net pension liability 112,209 38,157 150,366 IPERS deferred inflows 61,121 17,916 79,037 Total adjustments 3,753,092 271,182 4,024,274
Net cash provided byoperating activities 825,099$ 461,142$ 1,286,241$
Noncash Capital and Related Financing ActivitiesContributions of capital assets from Governmental
Activities 6,202,902$ -$ 6,202,902$
33
City of Council Bluffs Notes to Financial Statements
June 30, 2018 Note 1 - Summary of Significant Accounting Policies The City of Council Bluffs is a political subdivision of the State of Iowa located in Pottawattamie County. It was first incorporated in 1853 and operates under the Home Rule provisions of the Constitution of Iowa. The City operates under the Mayor-Council form of government with the Mayor and Council Members elected on a non-partisan basis. Council Bluffs provides numerous services to citizens, including public safety, public works, health and social services, culture and recreation, community and economic development and general government services. It also operates an airport and provides sewer and sanitation utilities for its citizens. The financial statements of the City of Council Bluffs have been prepared in conformity with U.S. generally accepted accounting principles (GAAP) as prescribed by the Governmental Accounting Standards Board. Reporting Entity For financial reporting purposes, the City of Council Bluffs has included all funds, organizations, agencies, boards, commissions and authorities. The City has also considered all potential component units for which it is financially accountable and other organizations for which the nature and significance of their relationship with the City are such that exclusion would cause the City’s financial statements to be misleading or incomplete. The Governmental Accounting Standards Board has set forth criteria to be considered in determining financial accountability. These criteria include appointing a voting majority of an organization’s governing body and (1) the ability of the City to impose its will on that organization or (2) the potential for the organization to provide specific benefits to or impose specific financial burdens on the City. These financial statements present the City of Council Bluffs (the primary government) and its component units. The component units discussed below are included in the City’s reporting entity because of the significance of their operational or financial relationship with the City. Discretely Presented Component Units The Council Bluffs Airport Authority (Authority) was established pursuant to Chapter 330A of the Code of Iowa to operate the City’s airport facility. The Authority is governed by a seven member board appointed by the Mayor, with concurrence of a majority of the City Council. The board members serve at the pleasure of the City. The City annually provides significant operating subsidies to the Authority and collects and remits the tax levied by the Authority. In accordance with criteria set forth by the Governmental Accounting Standards Board, the Authority meets the definition of a component unit which should be discretely presented. Complete financial statements of the Council Bluffs Airport Authority can be obtained from its office at 101 McCandless Lane, Council Bluffs, Iowa 51503. The Council Bluffs Public Library Foundation (Foundation) has been incorporated under the provisions of the Iowa Nonprofit Corporation Act to operate exclusively for charitable, educational and literary purposes for the enhancement and improvement of the Council Bluffs Public Library. In accordance with criteria set by the Governmental Accounting Standards Board, the Foundation meets the definition of a component unit which should be discretely presented. Based on these criteria, the economic resources received or held by the Foundation are substantially for the direct benefit of the City of Council Bluffs Library. The Foundation does not issue separate financial statements.

34
City of Council Bluffs Notes to Financial Statements
June 30, 2018 Jointly Governed Organizations The City participates in several jointly governed organizations that provide goods or services to the citizenry of the City but do not meet the criteria of a joint venture since there is no ongoing financial interest or responsibility by the participating governments. City officials are members of the following boards and commissions: Pottawattamie County Assessor’s Conference Board, Metropolitan Area Planning Agency, Pottawattamie County Emergency Management Commission and Pottawattamie County E911 Service Board. Related Organizations and Organizations with Joint Venture Characteristics The City participates in several related organizations or related organizations with joint venture characteristics for which the City is not financially accountable even though the City appoints a voting majority of the organization’s governing board or the organization’s financial activity is reported in the City’s financial statements and in another participating government’s financial statements. City officials are members of or appoint representatives to the following organizations: Municipal Housing Agency, Convention and Visitors Bureau, the Pottawattamie County Communications Center Commission, the Southwest Iowa Solid Waste Management Association and the Council Bluffs Municipal Waterworks. Basis of Presentation Government-wide Financial Statements – The Statement of Net Position and the Statement of Activities report information on all of the nonfiduciary activities of the primary government and its component units. For the most part, the effect of interfund activity has been removed from these statements. Governmental activities, which are supported by property tax and intergovernmental revenues, are reported separately from business-type activities, which rely to a significant extent on fees and charges for service. The Statement of Net Position presents the City’s nonfiduciary assets, deferred outflows of resources, liabilities and deferred inflows of resources, with the difference reported as net position. Net position is reported in the following categories: Net investment in capital assets consists of capital assets, net of accumulated depreciation/amortization and reduced by outstanding balances for bonds, notes and other debt attributable to the acquisition, construction or improvement of those assets. Nonexpendable restricted net position is subject to externally imposed stipulations which require them to be maintained permanently by the City, including the City’s Permanent Fund. Restricted net position results when constraints placed on net position use are either externally imposed or are imposed by law through constitutional provisions or enabling legislation. Enabling legislation did not result in any restricted net position. Unrestricted net position consists of net position not meeting the definition of the preceding categories. Unrestricted net position is often subject to constraints imposed by management which can be removed or modified.

35
City of Council Bluffs Notes to Financial Statements
June 30, 2018 The Statement of Activities demonstrates the degree to which the direct expenses of a given function are offset by program revenues. Direct expenses are those clearly identifiable with a specific function. Program revenues include 1) charges to customers or applicants who purchase, use or directly benefit from goods, services or privileges provided by a given function and 2) grants, contributions and interest restricted to meeting the operational or capital requirements of a particular function. Property tax and other items not properly included among program revenues are reported instead as general revenues. Fund Financial Statements – Separate financial statements are provided for governmental and proprietary funds. Major individual governmental and proprietary funds are reported as separate columns in the fund financial statements. All remaining governmental funds are aggregated and reported as nonmajor governmental funds. The City reports the following major governmental funds: The General Fund is the general operating fund of the City. All general tax revenues from general and emergency levies and other revenues not allocated by law or contractual agreement to some other fund are accounted for in this fund. From the fund are paid the general operating expenditures, the fixed charges and the capital improvement costs not paid from other funds. Special Revenue: The Bass Pro Shop Fund is used to account for revenues from rent and City, County and Iowa West Foundation contributions and used for the payment of interest and principal on the City’s urban renewal term loan note debt and maintenance of the Bass Pro Shop. The Tax Increment Financing Fund is used to account for the revenues from the tax authorized by ordinance in the urban renewal district and used to pay indebtedness incurred for urban renewal projects. The City Local Option Sales Tax Fund is used to account for revenues from the tax authorized by referendum and used for maintenance and improvements to the City’s sewer and street systems. The Debt Service Fund is used to account for property tax and other revenues to be used for the payment of interest and principal on the City’s general long-term debt. The Capital Projects Fund is used to account for all resources used in the acquisition and construction of capital facilities and other capital assets. The City reports the following major proprietary fund: Enterprise: The Sewer Fund is used to account for the operation and maintenance of the City’s wastewater treatment and sanitary sewer system. The City also reports the Refuse and Disposal Fund as a nonmajor enterprise fund. This fund is used to account for the operation and maintenance of the City’s solid waste collection and recycling system.

36
City of Council Bluffs Notes to Financial Statements
June 30, 2018 Measurement Focus and Basis of Accounting The government-wide and proprietary fund financial statements are reported using the economic resources measurement focus and the accrual basis of accounting. Revenues are recorded when earned and expenses are recorded when a liability is incurred, regardless of the timing of related cash flows. Property tax is recognized as revenue in the year for which it is levied. Grants and similar items are recognized as revenue as soon as all eligibility requirements imposed by the provider have been satisfied. Governmental fund financial statements are reported using the current financial resources measurement focus and the modified accrual basis of accounting. Revenues are recognized as soon as they are both measurable and available. Revenues are considered to be available when they are collectible within the current year or soon enough thereafter to pay liabilities of the current period. For this purpose, the City considers revenues to be available if they are collected within 60 days after year end. Property tax, local option sales tax, intergovernmental revenues (shared revenues, grants and reimbursements from other governments) and interest are considered to be susceptible to accrual. All other revenue items are considered to be measurable and available only when cash is received by the City. Expenditures generally are recorded when a liability is incurred, as under accrual accounting. However, principal and interest on long-term debt, claims and judgments and compensated absences are recognized as expenditures only when payment is due. Capital asset acquisitions are reported as expenditures in governmental funds. Proceeds of general long-term debt and acquisitions under capital leases are reported as other financing sources. When an expenditure is incurred in governmental funds which can be paid using either restricted or unrestricted resources, the City’s policy is generally to first apply the expenditure toward restricted fund balance and then to less-restrictive classifications – committed, assigned and then unassigned fund balances. Under terms of grant agreements, the City funds certain programs by a combination of specific cost-reimbursement grants, categorical block grants and general revenues. Thus, when program expenses are incurred, there are both restricted and unrestricted net position available to finance the programs. It is the City’s policy to first apply cost-reimbursement grant resources to such programs, followed by categorical block grants and then by general revenues. Proprietary funds distinguish operating revenues and expenses from non-operating items. Operating revenues and expenses generally result from providing services and producing and delivering goods in connection with a proprietary fund’s principal ongoing operations. The principal operating revenues of the City’s Enterprise Funds are charges to customers for sales and services. Operating expenses for Enterprise Funds include the cost of sales and services, administrative expenses and depreciation on capital assets. All revenues and expenses not meeting this definition are reported as non-operating revenues and expenses. Assets, Deferred Outflows of Resources, Liabilities, Deferred Inflows of Resources and Fund Equity The following Accounting policies are followed in preparing the financial statements: Cash, Cash Equivalents and Pooled Investments – The cash balances of most City funds are pooled and invested in interest-bearing cash accounts or certificates of deposit. Interest on the pooled cash investments is recognized as revenue when earned and allocated to the funds on a systematic basis, or as provided by law. Investments are stated at fair value except for the investments in the Iowa Public Agency Investment Trust which are valued at amortized cost.

37
City of Council Bluffs Notes to Financial Statements
June 30, 2018 For purposes of the Statement of Cash Flows, all short-term cash investments that are highly liquid are considered to be cash equivalents. Cash equivalents are readily convertible to known amounts of cash and, at the day of purchase, have a maturity date no longer than three months. Property Tax Receivable, Including Tax Increment Financing – Property tax, including tax increment financing, in governmental funds is accounted for using the modified accrual basis of accounting. Property tax receivable is recognized in these funds on the lien date, which is the date the tax asking is certified by the City to the County Board of Supervisors. Current year property tax receivable represent taxes collected by the County but not remitted to the City at June 30, 2018 and unpaid taxes. The succeeding year property tax receivable represents taxes certified by the City to be collected in the next fiscal year for the purposes set out in the budget for the next fiscal year. By statute, the City is required to certify its budget to the County Auditor by March 15 of each year for the subsequent fiscal year. However, by statute, the tax asking and budget certification for the following fiscal year becomes effective on the first day of that year. Although the succeeding year property tax receivable has been recorded, the related revenue is unavailable in both the government-wide and fund financial statements and will not be recognized as revenue until the year for which it is levied. Property tax revenues recognized in these funds become due and collectible in September and March of the current fiscal year with a 1½% per month penalty for delinquent payments; is based on January 1, 2016 assessed property valuations; is for the tax accrual period July 1, 2017 through June 30, 2018 and reflects the tax asking contained in the budget certified to the County in March 2017. Customer Accounts and Unbilled Usage – Accounts receivable are recorded in the Enterprise Funds at the time the service is billed. Unbilled usage for service consumed between periodic scheduled billing dates is estimated and is recognized as revenue in the period in which the service is provided. Special and Drainage Assessments Receivable – Special and drainage assessments receivable represents the amounts assessed to individuals for work done which benefits their property. These assessments are payable by individuals in not less than 10 nor more than 20 annual installments. Each annual installment with interest on the unpaid balance is due on September 30 and is subject to the same interest and penalties as other tax. Assessments receivable represent assessments which are due and payable but have not been collected. Due from and Due to Other Funds – During the course of its operations, the City has numerous transactions between funds. To the extent certain transactions between funds had not been paid or received as of June 30, 2018, balances of interfund amounts receivable or payable have been recorded in the fund financial statements. Due From Other Governments – Due from other governments represents amounts due from the State of Iowa, various shared revenues, grants and reimbursements from other governments. Inventories – Inventories are valued at cost using the first-in/first-out method. Inventories consist of expendable supplies held for consumption. Inventories are recorded as expenditures when consumed rather than when purchased. Prepaid Items – Payments made to vendors for services that will benefit periods beyond June 30 are recorded as prepaid items in both government-wide and fund financial statements. In governmental funds, prepaid items are accounted for using the consumption method and a portion of fund balance equal to the prepaid items has been reported as nonspendable to indicate that it is not available for appropriation.

38
City of Council Bluffs Notes to Financial Statements
June 30, 2018 Capital Assets – Capital assets, which include property, equipment and vehicles, intangibles and infrastructure assets acquired after July 1, 1980 (e.g. roads, bridges, curbs, gutters, sidewalks and similar items which are immovable and of value only to the City) are reported in the applicable governmental or business-type activities columns in the government-wide Statement of Net Position and in the Proprietary Funds Statement of Net Position. Capital assets are recorded at historical cost if purchased or constructed. Donated capital assets are recorded at acquisition value at the date of donation. The costs of normal maintenance and repair not adding to the value of the asset or materially extending asset lives are not capitalized. Reportable capital assets are defined by the City as assets with initial, individual costs in excess of the following thresholds and estimated useful lives in excess of two years. Asset Class Threshold
Land, buildings, and improvements 25,000$ Machinery, equipment and vehicles 5,000 Infrastructure 50,000 Intangibles 50,000
Estimated
Useful LivesAsset Class (In Years)
Buildings and improvements 40-50Land improvements 10-20Machinery and equipment 5-30Vehicles 5-10Infrastructure 20-65Intangibles 5-15
Deferred Outflows of Resources – Deferred outflows of resources represent a consumption of net position that applies to a future period(s) and will not be recognized as an outflow of resources (expense/expenditure) until then. Deferred outflows of resources consist of unrecognized items not yet charged to pension expense and to OPEB expense, and contributions from the employer after the measurement date but before the end of the employer’s reporting period. Compensated Absences – City employees accumulate a limited amount of earned but unused vacation and sick leave benefits and compensatory time for subsequent use or for payment upon termination, death or retirement. A liability is recorded when incurred in the government-wide and proprietary fund financial statements. A liability for these amounts is reported in governmental fund financial statements only for employees who have resigned or retired. The compensated absences liability has been computed based on rates of pay in effect at June 30, 2018. The compensated absences liability attributable to the governmental activities will be paid primarily by the General Fund.

39
City of Council Bluffs Notes to Financial Statements
June 30, 2018 Long-Term Liabilities – In the government-wide financial statements, long-term debt obligations are reported as liabilities in the statement of net position. If deemed material, bonds payable are reported net of the applicable bond premium or discount which are deferred and amortized over the life of the bonds using the effective interest method. Governmental funds recognize bond premiums and discounts, as well as bond issuance costs, in the period issued. The face amount of debt issued is reported as other financing sources. Premiums received on debt issuances are reported as other financing sources and discounts on debt issuances are reported as other financing uses. Issuance costs, whether or not withheld from the actual debt proceeds received, are reported as expenditures. Interest is reported as an expenditure in the period in which the related payment is made. Pensions – For purposes of measuring the net pension liability, deferred outflows of resources and deferred inflows of resources related to pensions and pension expense, information about the fiduciary net position of the Iowa Public Employees’ Retirement System and the Municipal Fire and Police Retirement System (Systems’) and additions to/deductions from the Systems’ fiduciary net position have been determined on the same basis as they are reported by the Systems. For this purpose, benefit payments (including refunds of employee contributions) are recognized when due and payable in accordance with the benefit terms. Investments are reported at fair value. The net pension liability attributable to the governmental activities will be paid primarily by the General Fund. Total OPEB Liability – For purposes of measuring the total OPEB liability, deferred outflows of resources related to OPEB and OPEB expense, information has been determined based on the City’s actuary report. For this purpose, benefit payments are recognized when due and payable in accordance with the benefit terms. The total OPEB liability attributable to the governmental activities will be paid primarily by the General Fund. Deferred Inflows of Resources – Deferred inflows of resources represent an acquisition of net position that applies to a future period(s) and will not be recognized as an inflow of resources (revenue) until that time. Although certain revenues are measurable, they are not available. Available means collected within the current year or expected to be collected soon enough thereafter to be used to pay liabilities of the current year. Deferred inflows of resources in the governmental fund financial statements represent the amount of assets that have been recognized, but the related revenue has not been recognized since the assets are not collected within the current year or expected to be collected soon enough thereafter to be used to pay liabilities of the current year. Deferred inflows of resources consist of property tax receivable and other receivables not collected within sixty days after year end. Deferred inflows of resources in the Statement of Net Position consist of succeeding year property tax and tax increment financing receivable that will not be recognized as revenue until the year for which they are levied and other unrecognized items not yet credited to pension expense. Fund Equity – In the governmental fund financial statements, fund balances are classified as follows: Nonspendable – Amounts which cannot be spent either because they are in a nonspendable form or because they are legally or contractually required to be maintained intact. Restricted – Amounts restricted to specific purposes when constraints placed on the use of the resources are either externally imposed by creditors, grantors or state or federal laws or are imposed by law through constitutional provisions or enabling legislation. Unassigned – All amounts not included in the preceding classifications. The general fund is the only fund that reports a positive unassigned fund balance amount.

40
City of Council Bluffs Notes to Financial Statements
June 30, 2018 Budgets and Budgetary Accounting The budgetary comparison and related disclosures are reported as Required Supplementary Information. During the year ended June 30, 2018, expenditures exceeded the amounts budgeted in the public works, general government, capital projects and debt service functions. Implemtation to GASB Statement No. 75 - As of July 1 2017, the City adopted GASB Statement No. 75, Accounting and Financial Reporting for Other Postemployment Benefits Other Than Pensions. The implementation of this standard replaces the requirements of GASB Statement No. 45 Accounting and Financial Reporting by Employers for Postemployment Benefits Other Than Pensions, and requires governments calculate and report the costs and obligations associated with postemployment benefits other than pensions (OPEB) in their basic financial statements. Employers are required to recognize OPEB amounts for all benefits provided through the plan which include the Total OPEB Liability, deferred outflows of resources, deferred inflows of resources, and OPEB expense. The effect of the implementation of this standard on beginning net position is disclosed in Note 21 and the additional disclosures required by this standard are included in Note 9. Note 2 - Cash and Investments The City’s deposits in banks at June 30, 2018 were entirely covered by federal depository insurance or by the State Sinking Fund in accordance with Chapter 12C of the Code of Iowa. This chapter provides for additional assessments against the depositories to ensure there will be no loss of public funds. The City is authorized by statute to invest public funds in obligations of the United States government, its agencies and instrumentalities; certificates of deposit or other evidences of deposit at federally insured depository institutions approved by the City Council; prime eligible bankers acceptances; certain high rated commercial paper; perfected repurchase agreements; certain registered open-end management investment companies; certain joint investment trusts; and warrants or improvement certificates of a drainage district. The following is a reconciliation of cash and investments as shown on the financial statements: Cash Deposits and Petty Cash 47,723,241$ Money Market Accounts 9,271,332 IPAIT Diversified Fund 20,134,246
77,128,819$
Governmental Funds/Governmental Activities 68,542,779$ Enterprise Funds/Business Type Activities 8,586,040
77,128,819$
At June 30, 2018, the City had investments in the Iowa Public Agency Investment Trust which are valued at an amortized cost of $20,134,246, which approximates fair value, pursuant to Rule 2a-7 under the Investment Company Act of 1940. There were no limitations or restrictions on withdrawals for the IPAIT investments.
41
City of Council Bluffs Notes to Financial Statements
June 30, 2018 Interest Rate Risk – As a means of limiting its exposure to fair value losses arising from rising interest rates, the City’s investment policy limits the investment of operating funds (funds reasonably expected to be expended during the current budget year or within 13 months of receipt) to instruments that mature within 397 days. Funds not identified as operating funds may be invested in investments with maturities longer than 397 days. However, all investments of the City shall have maturities consistent with the needs and uses of the City. Credit Risk – The City’s investments in the Iowa Public Agency Investment Trust are unrated. Concentration of Credit Risk – The City’s investment policy has the following limitations: no more than 10% of the investment portfolio may be invested in prime banker’s acceptances, commercial paper or other short-term corporate debt, no more than 5% of the investment portfolio may be invested in the securities of a single issuer and no more than 5% of all amounts invested in commercial paper or other short-term corporate debt shall be invested in paper and debt rated in the second highest classification. When possible, it is the City’s policy to diversify its investment portfolio to eliminate the risk of loss resulting from over concentration of assets in a specific maturity, specific issuer or a specific class of securities. Discretely Presented Component Unit – Library Foundation The City of Council Bluffs Library Foundation possesses mutual funds which mandate disclosure requirements under Governmental Accounting Standards Board Statement No.72, Fair Value Measurement and Application. The Foundation uses the fair value hierarchy established by generally accepted accounting principles based on the valuation inputs used to measure the fair value of the asset. Level 1 inputs are quoted prices in active markets for identical assets. Level 2 inputs are significant other observable inputs. Level 3 inputs are significant unobservable inputs. The Council Bluffs Public Library Foundation’s investments at June 30, 2018 consist of mutual funds with a fair value of $10,121,973. The recurring fair value measurement for these mutual funds was determined using the last reported sales price at current exchange rates (Level 1 inputs).

42
City of Council Bluffs Notes to Financial Statements
June 30, 2018
Note 3 - Capital Assets
Beginning Balances Endingas restated Increases Decreases Balances
Governmental ActivitiesCapital assets not being depreciated
Land 46,281,970$ 282,488$ -$ 46,564,458$ Construction in progress 40,285,142 34,523,174 7,420,373 67,387,943
Total capital assets not being depreciated 86,567,112 34,805,662 7,420,373 113,952,401
Capital assets being depreciatedBuildings 128,913,547 403,831 - 129,317,378 Improvements other than buildings 28,183,086 6,840,874 - 35,023,960
Equipment and vehicles 30,389,915 3,334,678 1,623,577 32,101,016 Infrastucture, road network 199,228,361 4,458,619 - 203,686,980 Intangibles 1,579,255 - - 1,579,255
Total capital assets being depreciated 388,294,164 15,038,002 1,623,577 401,708,589
Less accumulated depreciation forBuildings 39,446,246 2,920,656 - 42,366,902 Improvements other than buildings 19,821,489 1,385,766 - 21,207,255 Equipment and vehicles 21,512,602 2,596,199 1,502,140 22,606,661 Infrastucture, road network 80,961,529 4,702,348 - 85,663,877 Intangibles 822,919 234,214 - 1,057,133
Total accumulated depreciation 162,564,785 11,839,183 1,502,140 172,901,828
Total capital assets, net 312,296,491$ 38,004,481$ 7,541,810$ 342,759,162$
Business-Type ActivitiesCapital assets not being depreciated:
Land 6,443,672 -$ -$ 6,443,672$ Construction in progress 1,476,687 3,277,283 827,425 3,926,545
Total capital assets not being depreciated 7,920,359 3,277,283 827,425 10,370,217
Buildings 22,798,184 - - 22,798,184 Improvements other than buildings 6,884,135 - - 6,884,135 Equipment and vehicles 15,355,495 331,435 248,461 15,438,469 Infrastructure, sewer network 166,874,358 3,705,171 - 170,579,529 Intangibles 60,373 - - 60,373
Total capital assets being depreciated 211,972,545 4,036,606 248,461 215,760,690
Less accumulated depreciation forBuildings 12,368,065 402,720 - 12,770,785 Improvements other than buildings 1,932,176 98,879 - 2,031,055 Equipment and vehicles 10,572,814 690,300 176,877 11,086,237 Infrastructure, sewer network 37,243,051 2,850,306 - 40,093,357 Intangibles 24,150 12,074 - 36,224
Total accumulated depreciation 62,140,256 4,054,279 176,877 66,017,658
Total capital assets, net 157,752,648$ 3,259,610$ 899,009$ 160,113,249$

43
City of Council Bluffs Notes to Financial Statements
June 30, 2018 Depreciation/amortization was charged to functions of the primary government as follows: Governmental Activities:
Public safety 1,418,142$ Public works 4,985,322 Health and social services 10,065 Culture and recreation 2,883,982 Community and economic development 2,180,958 General government 360,714
Total depreciation expense - governmental activities 11,839,183$
Business-Type Activities:Sewer 3,823,975$ Refuse and disposal 230,304
Total depreciation expense - business-type activities 4,054,279$
Balance Balance
Beginning of End Year Increases Decreases of Year
Discretely Presented Component Unit:Airport Authority
Capital assets not being depreciated:Land 2,192,064$ -$ -$ 2,192,064$ Construction in progress 175,843 683,916 138,275 721,484
Total capital assets not being depreciated 2,367,907 683,916 138,275 2,913,548
Capital assets being depreciated:Buildings 7,603,576 1,208 - 7,604,784 Improvements other than buildings 21,005,839 138,275 - 21,144,114 Equipment and vehicles 427,377 63,076 102,363 388,090
Total capital assets being depreciated 29,036,792 202,559 102,363 29,136,988
Less accumulated depreciation forBuildings 2,235,729 182,590 - 2,418,319 Improvements other than buildings 5,679,280 676,193 - 6,355,473 Equipment and vehicles 276,442 34,611 102,363 208,690
Total accumulated depreciation 8,191,451 893,394 102,363 8,982,482
Total capital assets being depreciated, net 20,845,341 (690,835) - 20,154,506
Discretely presented component unitcapital assets, net 23,213,248$ (6,919)$ 138,275$ 23,068,054$
Total depreciation expense- discretely presented component unit 893,394$

44
City of Council Bluffs Notes to Financial Statements
June 30, 2018
Note 4 - Long-Term Liabilities
Beginning DueBalances, Ending Withinas restated Increases Decreases Balances One Year
Governmental ActivitiesBonds Payable
General obligation bonds/notes 43,980,000$ 32,145,000$ 13,585,000$ 62,540,000$ Premiums - 1,967,362 31,504 1,935,858
Total bonds payable 43,980,000 34,112,362 13,616,504 64,475,858 7,135,000$
Term loan note 3,663,159 - 2,442,106 1,221,053 1,221,053 Settlement agreement 2,314,284 - 528,571 1,785,713 528,571 Iowa Finance Authority loan 5,150,000 - 475,000 4,675,000 265,000 Compensated absences 3,238,738 2,018,445 2,171,110 3,086,073 2,129,567 Total OPEB liability, as restated 2,700,127 687,514 - 3,387,641 - Termination benefit liability 700,275 - 446,933 253,342 - Net pension liability- IPERS 10,904,246 288,493 - 11,192,739 - Net pension liability- MFPRSI 36,999,659 - 2,902,556 34,097,103 -
Total 109,650,488$ 37,106,814$ 22,582,780$ 124,174,522$ 11,279,191$
Business-Type ActivitiesSewer revenue capital loan notes 4,162,000$ -$ 220,000$ 3,942,000$ 227,000$ Recycling closed loop fund note 125,020 - 83,320 41,700 41,700 Recycling solid waste alternative
note 125,000 - 30,000 95,000 30,000 Compensated absences 344,307 200,880 218,501 326,686 203,096 Total OPEB liability, as restated 330,659 84,193 - 414,852 - Termination benefit liability 69,907 16,817 - 86,724 4,702 Net pension lability- IPERS 3,074,764 150,366 - 3,225,130 -
8,231,657$ 452,256$ 551,821$ 8,132,092$ 506,498$
For the governmental activities, termination benefit liabilities, compensated absences, OPEB liabilities and net pension liabilities are generally liquidated by the General Fund. General Obligation Bonds/Notes Payable General obligation bonds/notes have been issued for governmental activities. The portion of unmatured general obligation bonds/notes accounted for in governmental activities and serviced by the Debt Service Fund totaled $62,540,000 at June 30, 2018. General obligation bonds/notes bear interest at rates ranging from .50% to 5.0% per annum and mature in varying annual amounts ranging from $100,000 to $2,000,000, with final maturities due in the year ending June 1, 2038. On August 3, 2017, the City issued $9,540,000 of general obligation bonds; $2,330,000 was for capital improvement projects and $7,210,000 was allocated to the construction of a new Police Headquarters. On June 11, 2018, the City issued $22,605,000 of general obligation bonds; $5,100,000 was for capital improvement projects and $11,235,000 was allocated to the construction of the new Police Headquarters and $6,270,000 was to refund bonds. $3,225,000 is for current refunding of $3,530,000 bonds issued June 9, 2009. $3,045,000 is for current refunding of $3,390,000 bonds issued August 11, 2010. The City refunded the bonds to reduce total debt service payments by approximately $337,000 and to obtain an economic gain (difference between the present value of debt services payments on the old and new debt) of approximately $300,000.

45
City of Council Bluffs Notes to Financial Statements
June 30, 2018 During the year ended June 30, 2018, principal payments of $13,585,000 and interest payments of $1,516,572 were made by the City on general obligation bonds/notes. Details of general obligation bonds/notes payable at June 30, 2018 are as follows:
Amount PrincipalOriginally Oustanding
Date of Issue Interest Rates Final Due Date Annual Payments Issued June 30, 2018General Obligation bonds:
Essential Corporate purpose Oct 12, 2011 2.000 June 1, 2019 $ 415,000-490,000 3,165,000$ 490,000$ Essential Corporate purpose Nov 28, 2012 2.000-3.000 June 1, 2027 825,000-1,945,000 14,880,000 8,725,000 Essential Corporate purpose Apr 29, 2014 2.000-3.000 June 1, 2026 270,000-1,000,000 7,630,000 4,990,000 Essential Corporate purpose Mar 24, 2015 3.000 June 1, 2030 360,000-1,535,000 8,145,000 5,240,000 Essential Corporate purpose Mar 24, 2015 2.000-4.000 June 1, 2021 660,000-775,000 3,620,000 2,265,000 Essential Corporate purpose Dec 13, 2016 2.000-2.500 June 1, 2026 100,000-1,060,000 6,095,000 5,995,000 Essential Corporate purpose Dec 13, 2016 1.100-1.900 June 1, 2021 290,000-855,000 2,810,000 1,985,000 Essential Corporate purpose Aug 03, 2017 3.000-4.000 June 1, 2037 360,000-690,000 9,540,000 8,850,000Essential Corporate purpose June 11, 2018 3.000-5.000 June 1, 2038 615,000-2,000,000 22,605,000 22,605,000
General Obligation capital loan notes:Essential Corporate purpose Apr 24, 2012 0.500-1.500 June 1, 2019 505,000-1,065,000 4,095,000 505,000 Essential Corporate purpose May 15, 2013 2.000 June 1, 2020 395,000-450,000 2,535,000 890,000
Total Governmental Activities 62,540,000$
Obligation/Purpose
Principal Interest Total7,135,000$ 2,047,424$ 9,182,424$ 6,305,000 1,857,289 8,162,289 5,945,000 1,657,654 7,602,654 5,195,000 1,460,394 6,655,394 5,390,000 1,276,719 6,666,719
20,225,000 3,677,469 23,902,469 6,925,000 1,453,506 8,378,506 5,420,000 514,063 5,934,063
Total 62,540,000$ 13,944,518$ 76,484,518$
202020212022
2024-2028
2034-2038
General Obligation Bonds/NotesYears Ending June 30,
2019
2023
2029-2033
Term Loan Note On March 28, 2014, the City issued a $11,600,000 term loan note through U.S. Bank National Association, the proceeds of which were used to retire the outstanding urban renewal capital loan note. The term loan note bears interest at a variable rate, adjusted monthly. Principal and interest payments are amortized over fifty-seven (57) months and are due in monthly installments of principal in the amount of $203,509, together with interest, beginning on April 20, 2014 and continuing on the twentieth (20th) day of each month thereafter. The total unpaid principal balance and all accrued but unpaid interest on the Term Loan Note shall be paid on December 20, 2018. Principal and interest on this note are secured as follows: (1) Bass Pro Shop lease rental payments, (2) Mortgage and Security Agreement, in favor of the holder of the note, granting a first lien on the project
improvements and land, (3) County annual appropriation economic development grant, (4) Iowa West Foundation, Inc. guaranty
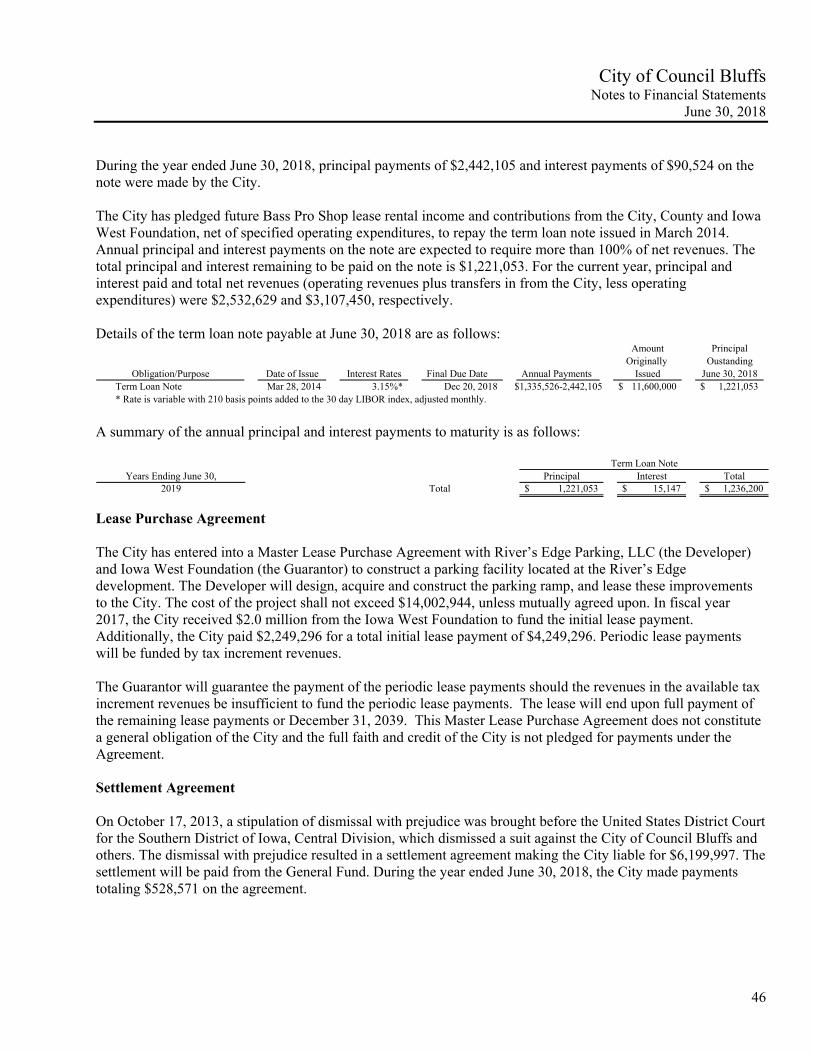
46
City of Council Bluffs Notes to Financial Statements
June 30, 2018 During the year ended June 30, 2018, principal payments of $2,442,105 and interest payments of $90,524 on the note were made by the City. The City has pledged future Bass Pro Shop lease rental income and contributions from the City, County and Iowa West Foundation, net of specified operating expenditures, to repay the term loan note issued in March 2014. Annual principal and interest payments on the note are expected to require more than 100% of net revenues. The total principal and interest remaining to be paid on the note is $1,221,053. For the current year, principal and interest paid and total net revenues (operating revenues plus transfers in from the City, less operating expenditures) were $2,532,629 and $3,107,450, respectively. Details of the term loan note payable at June 30, 2018 are as follows:
Amount PrincipalOriginally Oustanding
Date of Issue Interest Rates Final Due Date Annual Payments Issued June 30, 2018Term Loan Note Mar 28, 2014 3.15%* Dec 20, 2018 $1,335,526-2,442,105 11,600,000$ 1,221,053$ * Rate is variable with 210 basis points added to the 30 day LIBOR index, adjusted monthly.
Obligation/Purpose
A summary of the annual principal and interest payments to maturity is as follows:
Principal Interest TotalTotal 1,221,053$ 15,147$ 1,236,200$
Years Ending June 30,Term Loan Note
2019
Lease Purchase Agreement The City has entered into a Master Lease Purchase Agreement with River’s Edge Parking, LLC (the Developer) and Iowa West Foundation (the Guarantor) to construct a parking facility located at the River’s Edge development. The Developer will design, acquire and construct the parking ramp, and lease these improvements to the City. The cost of the project shall not exceed $14,002,944, unless mutually agreed upon. In fiscal year 2017, the City received $2.0 million from the Iowa West Foundation to fund the initial lease payment. Additionally, the City paid $2,249,296 for a total initial lease payment of $4,249,296. Periodic lease payments will be funded by tax increment revenues. The Guarantor will guarantee the payment of the periodic lease payments should the revenues in the available tax increment revenues be insufficient to fund the periodic lease payments. The lease will end upon full payment of the remaining lease payments or December 31, 2039. This Master Lease Purchase Agreement does not constitute a general obligation of the City and the full faith and credit of the City is not pledged for payments under the Agreement. Settlement Agreement On October 17, 2013, a stipulation of dismissal with prejudice was brought before the United States District Court for the Southern District of Iowa, Central Division, which dismissed a suit against the City of Council Bluffs and others. The dismissal with prejudice resulted in a settlement agreement making the City liable for $6,199,997. The settlement will be paid from the General Fund. During the year ended June 30, 2018, the City made payments totaling $528,571 on the agreement.

47
City of Council Bluffs Notes to Financial Statements
June 30, 2018 Details of the settlement agreement payable at June 30, 2018 are as follows:
Total528,571 528,571 728,571
Total 1,785,713$
201920202021
Years Ending June 30,
Loan from Iowa Finance Authority On May 5, 2015, the Iowa Finance Authority (IFA) issued $5,950,000 in economic development revenue bonds and loaned the proceeds thereof to the City, which the City used to make an economic development grant in accordance with the Marketplace Urban Renewal plan, fund a debt service reserve for the bonds and pay the costs of issuing the bonds. The loan is payable solely from the bond proceeds, tax increment financing (TIF) receipts generated by increased property values in the designated portions of the Marketplace urban renewal area, credited to the Special Revenue, Tax Increment Financing Fund and paid to the trustee pursuant to the financing agreement and moneys in the debt reserve trust account. TIF receipts are generally projected to produce 100% of the debt service requirements over the life of the bonds. Pursuant to the financing agreement, the City established a Trust Account through the Bank of Kansas City (BOKF) as trustee. Funds in the trust account are to be used to retire the IFA bonds. The IFA bonds bear interest at rates ranging from 4.25% to 5.25% per annum and mature in varying annual amounts ranging from $95,000 to $880,000, with final maturities due in the year ending June 30, 2030. Principal payments will be applied to the first $2,750,000 of the bonds which bear interest at 4.25% and will then be applied to the remaining $3,200,000 of the bonds which bear interest at 5.25%. During the year ended June 30, 2018, principal payments of $475,000 and interest payments of $245,669 were made by the City. As set forth in the grant and development agreement, subject to annual appropriation, the City shall transfer 90% of the eligible tax increment collected by the City with respect to the property as the June 1 and December 1 TIF rebates commencing with the June 1, 2015 rebate and continuing for so long as the IFA bonds are outstanding, but in no event after the June 1, 2029 TIF rebate has been transferred to the trustee. The payment of such tax increment revenues do not constitute a continuing obligation of the City in any fiscal year beyond the fiscal year for which funds have been appropriated. Accordingly, only the appropriated amount payable in the succeeding year is subject to the constitutional debt limitation. A summary of the City’s June 30, 2018 loan from Iowa Finance Authority is as follows:
Principal Interest Total265,000$ 230,688$ 495,688$ 285,000 219,425 504,425 305,000 207,313 512,313 330,000 194,350 524,350 355,000 180,325 535,325
2,225,000 602,831 2,827,831 910,000 57,094 967,094
Total 4,675,000$ 1,692,026$ 6,367,026$ 2029-2030
Years Ending June 30,201920202021
2024-2028
20222023

48
City of Council Bluffs Notes to Financial Statements
June 30, 2018 Sewer Revenue Capital Loan Notes On May 2, 2012, the City entered into an agreement with the Iowa Finance Authority (IFA) for $5,160,000 of sewer revenue capital loan notes with interest at 3% per annum and mature in varying annual amounts ranging from $187,000 to $344,000, with the final maturity due June 1, 2032. The agreement also requires the City to annually pay a .25% servicing fee on the outstanding principal balance. The notes were issued pursuant to the provisions of Chapters 384.24A and 384.83 of the Code of Iowa to pay the cost of constructing improvements and extensions to the sewer utility system. The City has pledged future sewer customer revenue, net of specified operating expenses, to repay the sewer revenue capital loan notes. The notes are payable solely from sewer customer net revenues. Annual principal and interest payments on the notes are expected to require more than 100% of net revenues. The total amount of principal and interest remaining to be paid on the notes at June 30, 2018 is $4,890,060. For the current year, principal and interest paid and total net revenue, (operating revenues less operating expenses plus depreciation expense), were $344,860 and $895,983, respectively. The resolution providing for the issuance of the sewer revenue capital loan notes issued under the loan agreement between the City, the Iowa Finance Authority and the Iowa Department of Natural Resources includes the following provisions: (1) The notes will only be redeemed from the future earnings of the enterprise activity and the note holder holds a lien on the future earnings of the funds. (2) User rates shall be established at a level which produces and maintains net revenues at a level not less than 110% of the amount of principal and interest on the notes falling due in the same year. Details of the sewer revenue capital loan notes payable at June 30, 2018 are as follows:
Amount PrincipalOriginally Oustanding
Date of Issue Interest Rates Final Due Date Annual Payments Issued June 30, 2018Sewer revenue May 2, 2012 3.00% June 1,2032 $187,000-344,000 5,160,000$ 3,942,000$
capital loan note
Obligation/Purpose
A summary of the annual principal and interest payments to maturity is as follows:
Principal Interest Total227,000$ 118,260$ 345,260$ 234,000 111,450 345,450 242,000 104,430 346,430 250,000 97,170 347,170 258,000 89,670 347,670
1,420,000 327,150 1,747,150 1,311,000 99,930 1,410,930
Total 3,942,000$ 948,060$ 4,890,060$
Sewer Capital Loan Note
2029-2032
20232024-2028
Years Ending June 30,20192020
20222021

49
City of Council Bluffs Notes to Financial Statements
June 30, 2018
Recycling Closed Loop Fund Note On July 13, 2015, the City entered into an agreement with Closed Loop Fund, LP, for $250,000 of notes payable with interest at 0% per annum and mature in annual amounts of $41,700 - $83,320, with the final maturity due December 31, 2018. The note was issued for the purpose of purchasing a horizontal baler. A summary of the annual payments to maturity is as follows:
PrincipalTotal 41,700$
Years Ending June 30,2019
Recycling Solid Waste Alternative Note On July 13, 2015, the City entered into an agreement with Iowa Department of Natural Resources, for $170,000 of notes payable with interest at 0% per annum and mature in annual amounts of $30,000 - $35,000, with the final maturity due October 15, 2020. The note was issued for the purpose of purchasing a horizontal baler. A summary of the annual payments to maturity is as follows:
Principal30,000$ 30,000 35,000
Total 95,000$
201920202021
Years Ending June 30,
At June 30, 2018, the general obligation debt issued by the City did not exceed its legal debt margin, computed as follows:
Actual Assessed Value as of January 1, 2016 (Unaudited) 4,839,011,160$
Debt Limit- 5% of Total Actual Valuation 241,950,558$ Less Debt Applicable to Debt Limit
General obligation debt outstanding (62,540,000) Tax increment indebtedness (4,249,238) Term Loan Note (1,221,053) Legal settlement (1,785,713)
Plus Funds on Hand Available to Service DebtDebt Service Fund balance 1,151,717 Tax Increment Financing Fund balance 1,062,657
Legal debt margin 174,368,928$

50
City of Council Bluffs Notes to Financial Statements
June 30, 2018 Note 5 - Restricted Fund Balances The detail of fund balances restricted for specific purposes at June 30, 2018 is as follows:
Tax IncrementGeneral Bass Pro Financing Nonmajor Total
Employee benefits and Insurance 1,706,019$ -$ -$ -$ 1,706,019$ Bass Pro Loan - 837,151 - - 837,151 Drainage - - - 1,250,148 1,250,148 Targeted Jobs - - - 69,000 69,000 CD Installment Loans - - - 211,746 211,746 Home Program 107,380 107,380 Developer Agreements - - 114,064 - 114,064
Total 1,706,019$ 837,151$ 114,064$ 1,638,275$ 4,295,508$
Purpose
Note 6 - Interfund Transfers The detail of interfund transfers for the year ended June 30, 2018 is as follows: Transfer to Transfer from Amount
General Capital Project 450,154$
Bass Pro Shop Tax Increment Financing 787,458
Debt Sevice Tax Increment Financing 1,526,360
Capital Project General 4,809,910 Tax Increment Financing 356,431 Local Option Sales Tax 2,365,915 Nonmajor Governmental Funds 6,100 Business Type Activity - Refuse and Disposal 118,600
7,656,956 Nonmajor Governmental Funds Road Use General 3,308,804
CD-Installment Loans Capital Project 114,024 Nonmajor Governmental Fund:
CDBG Grant 118,849 3,541,677
Total 13,962,604$

51
City of Council Bluffs Notes to Financial Statements
June 30, 2018
Transfers generally move resources from the fund statutorily required to collect the resources to the fund statutorily required to expend the resources.
Note 7 - Interfund Assets/Liabilities
The detail of the due to/from other funds is as follows: Receivable Fund Payable Fund Amount
General Non-major: Library 11,631$
The balance represents the payable fund’s negative pooled cash balance as of June 30, 2018.

52
City of Council Bluffs Notes to Financial Statements
June 30, 2018 Note 8 - Pension Plan
The primary government participates in two public pension systems, Iowa Public Employees’ Retirement System (IPERS) and Municipal Fire and Police Retirement System of Iowa (MFPRSI), The following sections outline the pension related disclosures for each pension. The aggregate amount of recognized pension expense for the period associated with the net pension liability for both plans is $7,161,221. Other aggregate amounts related to pension are separately displayed in the financial statements. Iowa Public Employees Retirement System Plan Description. IPERS membership is mandatory for employees of the City, except for those covered by another retirement system. Employees of the City are provided with pensions through a cost-sharing multiple employer defined benefit pension plan administered by the Iowa Public Employees’ Retirement System (IPERS). IPERS issues a stand-alone financial report which is available to the public by mail at 7401 Register Drive P.O. Box 9117, Des Moines, Iowa 50306-9117 or at www.ipers.org. IPERS benefits are established under Iowa Code chapter 97B and the administrative rules thereunder. Chapter 97B and the administrative rules are the official plan documents. The following brief description is provided for general informational purposes only. Refer to the plan documents for more information. Pension Benefits – A Regular member may retire at normal retirement age and receive monthly benefits without an early-retirement reduction. Normal retirement age is age 65, any time after reaching age 62 with 20 or more years of covered employment, or when the member’s years of service plus the member’s age at the last birthday equals or exceeds 88, whichever comes first. (These qualifications must be met on the member’s first month of entitlement to benefits.) Members cannot begin receiving retirement benefits before age 55. The formula used to calculate a Regular member’s monthly IPERS benefit includes:
• A multiplier (based on years of service).
• The member’s highest five-year average salary, except members with service before June 30, 2012 will use the highest three year average salary as of that date if it is greater than the highest five-year average salary.
If a member retires before normal retirement age, the member’s monthly retirement benefit will be permanently reduced by an early-retirement reduction. The early-retirement reduction is calculated differently for service earned before and after July 1, 2012. For service earned before July 1, 2012, the reduction is 0.25% for each month the member receives benefits before the member’s earliest normal retirement age. For service earned on or after July 1, 2012, the reduction is 0.50% for each month the member receives benefits before age 65. Generally, once a member selects a benefit option, a monthly benefit is calculated and remains the same for the rest of the member’s lifetime. However, to combat the effects of inflation, retirees who began receiving benefits prior to July 1990 receive a guaranteed dividend with their regular November benefit payments. Disability and Death Benefits - A vested member who is awarded federal Social Security disability or Railroad Retirement disability benefits is eligible to claim IPERS benefits regardless of age. Disability benefits are not reduced for early retirement. If a member dies before retirement, the member’s beneficiary will receive a lifetime annuity or a lump-sum payment equal to the present actuarial value of the member’s accrued benefit or calculated with a set formula, whichever is greater. When a member dies after retirement, death benefits depend on the benefit option the member selected at retirement.

53
City of Council Bluffs Notes to Financial Statements
June 30, 2018 Contributions – Contribution rates are established by IPERS following the annual actuarial valuation which applies IPERS’ Contribution Rate Funding Policy and Actuarial Amortization method. State statute limits the amount rates can increase or decrease each year to 1 percentage point. IPERS Contribution Rate Funding Policy requires the actuarial contribution rate be determined using the “entry age normal” actuarial cost method and the actuarial assumptions and methods approved by the IPERS Investment Board. The actuarial contribution rate covers normal cost plus the unfunded actuarial liability payment based on a 30-year amortization period. The payment to amortize the unfunded actuarial liability is determined as a level percentage of payroll, based on the Actuarial Amortization Method adopted by the Investment Board. In fiscal year 2018, pursuant to the required rate, Regular members contributed 5.95% of pay and the City contributed 8.93% for a total rate of 14.88%. The City’s total contributions to IPERS for the year ended June 30, 2018 were $1,442,481. Net Pension Liabilities, Pension Expense, and Deferred Outflows of Resources and Deferred Inflows of Resources Related to Pensions – At June 30, 2018, the City reported a liability of $14,417,869 for its proportionate share of the net pension liability. The net pension liability was measured as of June 30, 2017, and the total pension liability used to calculate the net pension liability was determined by an actuarial valuation as of that date. The City’s proportion of the net pension liability was based on the City’s share of contributions to IPERS relative to the contributions of all IPERS participating employers. At June 30, 2017, the City’s collective proportion was .21644347%, which was a decrease of .005681% from its proportion measured as of June 30, 2016. For the year ended June 30, 2018, the City recognized pension expense of $1,975,945. At June 30, 2018, the City reported deferred outflows of resources and deferred inflows of resources related to IPERS from the following sources:
Deferred DeferredOutflows of Inflows ofResources Resources
Differences Between Expected and Actual Experience 132,370$ 124,920$ Changes of Assumptions 2,505,161 - Net Difference Between Projected and Actual Earnings on Pension
Plan Investments - 150,590 Changes in Proportion and Differences Between City Contributions
and Proportionate Share of Contributions 166,316 249,283 City Contributions Subsequent to the Measurement Date 1,442,481 -
4,246,328$ 524,793$

54
City of Council Bluffs Notes to Financial Statements
June 30, 2018 $1,442,481 reported as deferred outflows of resources related to pensions resulting from the City contributions subsequent to the measurement date will be recognized as a reduction of the net pension liability in the year ended June 30, 2019. Other amounts reported as deferred outflows of resources and deferred inflows of resources related to pensions will be recognized in pension expense as follows: Years Ended June 30, Total
342,181$ 1,105,489
645,974 31,984
153,427 2,279,055$
2023
2019202020212022
Actuarial Assumptions – The total pension liability in the June 30, 2017 actuarial valuation was determined using the following actuarial assumptions, applied to all periods included in the measurement: Rate of inflation
(effective June 30, 2017) 2.60% per annumRates of salary increase 3.25 to 16.25%, average, including inflation. Rates
(effective June 30, 2017) vary by membership group.Long-term investment rate of return 7.00% compounded annually, net of investment
(effective June 30, 2017) expense, including inflation.Wage Growth Assumption 3.25% per annum based on 2.60% inflation
(effective June 30, 2017) and 0.65% real wage inflation. The actuarial assumptions used in the June 30, 2017 valuation were based on the results of actuarial experience study dated March 24, 2017. Mortality rates were based on the RP-2000 Mortality Table for Males or Females, as appropriate, with adjustments for mortality improvements based on Scale AA.

55
City of Council Bluffs Notes to Financial Statements
June 30, 2018 The long-term expected rate of return on pension plan investments was determined using a building-block method in which best-estimate ranges of expected future real rates (expected returns, net of pension plan investment expense and inflation) are developed for each major asset class. These ranges are combined to produce the long-term expected rate of return by weighting the expected future real rates of return by the target asset allocation percentage and by adding expected inflation. The target allocation and best estimates of arithmetic real rates of return for each major asset class are summarized in the following table:
Long-Term ExpectedAsset Class Asset Allocation Real Rate of Return
Domestic Equity 24.0% 6.25%International Equity 16.0 6.71Core Plus Fixed Income 27.0 2.25Public credit 3.5 3.46Public real assets 7.0 3.27Cash 1.0 (0.31)Private equity 11.0 11.15Private real assets 7.5 4.18Private credit 3.0 4.25
Total 100.0%
Discount Rate – The discount rate used to measure the total pension liability was 7.00%. The projection of cash flows used to determine the discount rate assumed employee contributions will be made at the contractually required rate and contributions from the City will be made at contractually required rates, actuarially determined. Based on those assumptions, IPERS’ fiduciary net position was projected to be available to make all projected future benefit payments of current active and inactive employees. Therefore, the long-term expected rate of return on IPERS’ investments was applied to all periods of projected benefit payments to determine the total pension liability. Sensitivity of the City’s Proportionate Share of the Net Pension Liability to Changes in the Discount Rate – The following presents the City’s proportionate share of the net pension liability calculated using the discount rate of 7.0%, as well as what the City’s proportionate share of IPERS net pension liability would be if it were calculated using a discount rate that is 1% lower (6.0%) or 1% higher (8.0%) than the current rate.
1% Discount 1%Decrease Rate Increase
6.00% 7.00% 8.00%City's Proportionate Share of the Net
Pension Liability 23,754,866$ 14,417,869$ 6,573,000$
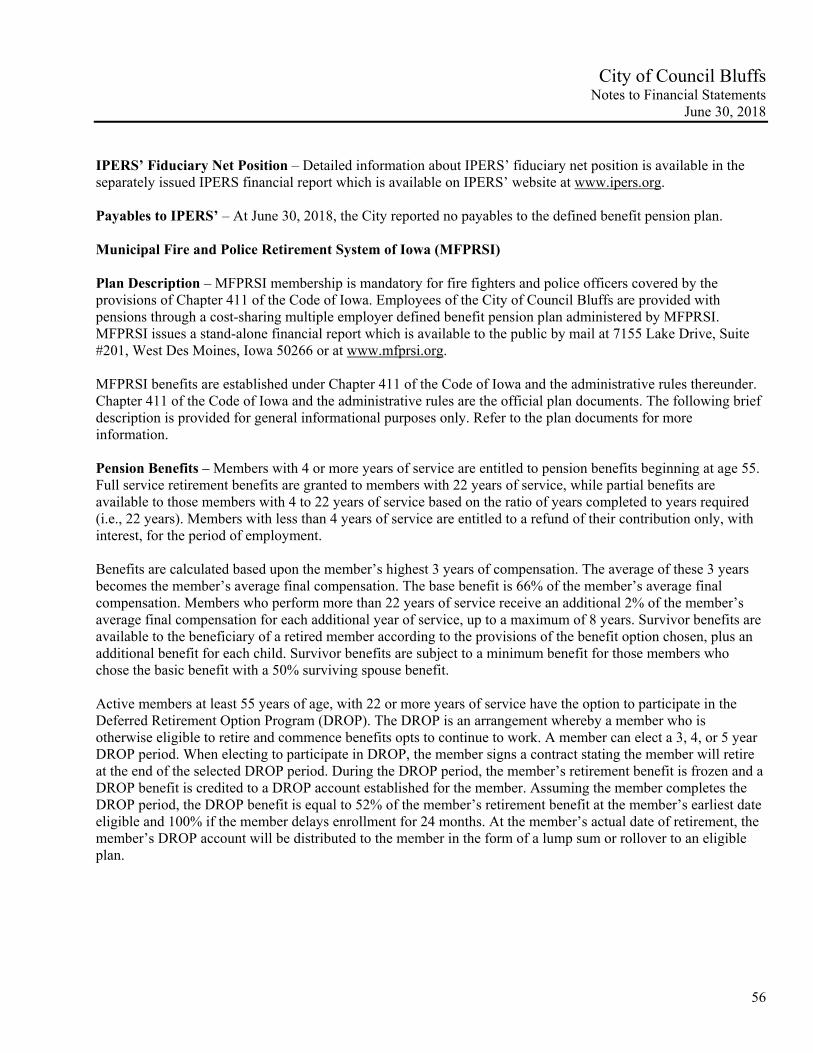
56
City of Council Bluffs Notes to Financial Statements
June 30, 2018 IPERS’ Fiduciary Net Position – Detailed information about IPERS’ fiduciary net position is available in the separately issued IPERS financial report which is available on IPERS’ website at www.ipers.org. Payables to IPERS’ – At June 30, 2018, the City reported no payables to the defined benefit pension plan. Municipal Fire and Police Retirement System of Iowa (MFPRSI) Plan Description – MFPRSI membership is mandatory for fire fighters and police officers covered by the provisions of Chapter 411 of the Code of Iowa. Employees of the City of Council Bluffs are provided with pensions through a cost-sharing multiple employer defined benefit pension plan administered by MFPRSI. MFPRSI issues a stand-alone financial report which is available to the public by mail at 7155 Lake Drive, Suite #201, West Des Moines, Iowa 50266 or at www.mfprsi.org. MFPRSI benefits are established under Chapter 411 of the Code of Iowa and the administrative rules thereunder. Chapter 411 of the Code of Iowa and the administrative rules are the official plan documents. The following brief description is provided for general informational purposes only. Refer to the plan documents for more information. Pension Benefits – Members with 4 or more years of service are entitled to pension benefits beginning at age 55. Full service retirement benefits are granted to members with 22 years of service, while partial benefits are available to those members with 4 to 22 years of service based on the ratio of years completed to years required (i.e., 22 years). Members with less than 4 years of service are entitled to a refund of their contribution only, with interest, for the period of employment. Benefits are calculated based upon the member’s highest 3 years of compensation. The average of these 3 years becomes the member’s average final compensation. The base benefit is 66% of the member’s average final compensation. Members who perform more than 22 years of service receive an additional 2% of the member’s average final compensation for each additional year of service, up to a maximum of 8 years. Survivor benefits are available to the beneficiary of a retired member according to the provisions of the benefit option chosen, plus an additional benefit for each child. Survivor benefits are subject to a minimum benefit for those members who chose the basic benefit with a 50% surviving spouse benefit. Active members at least 55 years of age, with 22 or more years of service have the option to participate in the Deferred Retirement Option Program (DROP). The DROP is an arrangement whereby a member who is otherwise eligible to retire and commence benefits opts to continue to work. A member can elect a 3, 4, or 5 year DROP period. When electing to participate in DROP, the member signs a contract stating the member will retire at the end of the selected DROP period. During the DROP period, the member’s retirement benefit is frozen and a DROP benefit is credited to a DROP account established for the member. Assuming the member completes the DROP period, the DROP benefit is equal to 52% of the member’s retirement benefit at the member’s earliest date eligible and 100% if the member delays enrollment for 24 months. At the member’s actual date of retirement, the member’s DROP account will be distributed to the member in the form of a lump sum or rollover to an eligible plan.

57
City of Council Bluffs Notes to Financial Statements
June 30, 2018 Disability and Death Benefits – Disability benefits may be either accidental or ordinary. Accidental disability is defined as permanent disability incurred in the line of duty, with benefits equivalent to the greater of 60% of the member’s average final compensation or the member’s service retirement benefit calculation amount. Ordinary disability occurs outside the call of duty and pays benefits equivalent to the greater of 50% of the member’s average final compensation, for those with 5 or more years of service, or the member’s service retirement benefit calculation amount and 25% of average final compensation for those with less than 5 years of service. Death benefits are similar to disability benefits. Benefits for accidental death are 50% of the average final compensation of the member plus an additional amount for each child, or the provisions for ordinary death. Ordinary death benefits consist of a pension equal to 40% of the average final compensation of the member plus an additional amount for each child, or a lump-sum distribution to the designated beneficiary equal to 50% of the previous year’s earnable compensation of the member or equal to the amount of the member’s total contributions plus interest. Benefits are increased annually in accordance with Chapter 411.6 of the Code of Iowa, which provides a standard formula for the increases. The surviving spouse or dependents of an active member who dies due to a traumatic personal injury incurred in the line of duty receives a $100,000 lump-sum payment. Contributions – Member contribution rates are set by state statute. In accordance with Iowa Code Chapter 411of the Code of Iowa, the contribution rate was 9.40% of earnable compensation for the year ended June 30, 2018. Employer contribution rates are based upon an actuarially determined normal contribution rate and set by state statute. The required actuarially determined contributions are calculated on the basis of the entry age normal method as adopted by the Board of Trustees as permitted under Chapter 411 of the Code of Iowa. The normal contribution rate is provided by state statute to be the actuarial liabilities of the plan less current plan assets, with such total divided by 1% of the actuarially determined present value of prospective future compensation of all members, further reduced by member contributions and state appropriations. Under the Code of Iowa, the City’s contribution rate cannot be less than 17.00% of earnable compensation. The contribution rate was 25.68% for the year ended June 30, 2018. The City’s contributions to MFPRSI for the year ended June 30, 2018 was $4,341,885. If approved by the State Legislature, state appropriation may further reduce the City’s contribution rate, but not below the minimum statutory contribution rate of 17.00% of earnable compensation. The State of Iowa, therefore, is considered to be a nonemployer contributing entity in accordance with the provisions of the Governmental Accounting Standards Board Statement No. 67, Financial Reporting for Pension Plans. There were no state appropriations to MFPRSI during the fiscal year ended June 30, 2018.

58
City of Council Bluffs Notes to Financial Statements
June 30, 2018 Net Pension Liability, Pension Expense, Deferred Outflows of Resources and Deferred Inflows of Resources Related to Pensions – At June 30, 2018, the City reported a liability of $34,097,103 for its proportionate share of the net pension liability. The net pension liability was measured as of June 30, 2017, and the total pension liability used to calculate the net pension liability was determined by an actuarial valuation as of that date. The City’s proportion of the net pension liability was based on the City’s share of contributions to MFPRSI relative to the contributions of all MFPRSI participating employers. At June 30, 2017, the City’s proportion was 5.813905%, which was a decrease of .10357% from its proportion measured as of June 30, 2016. For the year ended June 30, 2018, the City recognized pension expense of $5,185,276. At June 30, 2018, the City reported deferred outflows of resources and deferred inflows of resources related to MFPRSI from the following sources:
Deferred DeferredOutflows of Inflows ofResources Resources
Differences Between Expected and Actual Experience 1,308,482$ 20,746$ Changes of Assumptions 2,897,519 387,275 Net Difference Between Projected and Actual Earnings on Pension
Plan Investments 1,397,090 - Changes in Proportion and Differences Between City Contributions
and Proportionate Share of Contributions 288,718 406,178 City Contributions Subsequent to the Measurement Date 4,341,885 -
10,233,694$ 814,199$
$4,341,885 reported as deferred outflows of resources related to pensions resulting from City contributions subsequent to the measurement date will be recognized as a reduction of the net pension liability in the year ending June 30, 2018. Other amounts reported as deferred outflows of resources and deferred inflows of resources related to pensions will be recognized in pension expense as follows:
Total
786,694$ 3,121,475 1,597,425 (617,770) 189,784
5,077,608$ 2023
Years Ended June 30,
2019202020212022

59
City of Council Bluffs Notes to Financial Statements
June 30, 2018 Actuarial Assumptions – The total pension liability in the June 30, 2017 actuarial valuation was determined using the following actuarial assumptions, applied to all periods included in the measurement:
Rate of inflation 3.00%Salary increases 4.50 to 15.11%, including inflation.Investment rate of return 7.50%, net of investment expense,
including inflation.
The actuarial assumptions used in the June 30, 2017 valuation were based on the results of an actuarial experience study for the period from July 1, 2002 to June 30, 2012. Postretirement mortality changed to the RP-2000 Blue Collar combined Healthy Mortality Table with males set-back two years, females set-forward one year and disabled individuals set-forward one year (male only rates), with five years projection of future mortality improvement with Scale BB. The long-term expected rate of return on MFPRSI plan investments was determined using a building-block method in which best-estimate ranges of expected future real rates (i.e., expected returns, net of investment expense and inflation) are developed for each major asset class. These ranges are combined to produce the long-term expected rate of return by weighting the expected future real rates of return by the target asset allocation percentage and by adding expected inflation. The best estimates of geometric real rates of return for each major asset class are summarized in the following table:
Long-Term ExpectedAsset Class Real Rate of Return Large cap 5.5%Small cap 5.8International large cap 7.3Emerging markets 9.0Emerging markets debt 6.3Private non-core real estate 8.0Master limited partnerships 9.0Private equity 9.0Core plus fixed income 3.3Private core real estate 6.0Tactical asset allocation 6.4

60
City of Council Bluffs Notes to Financial Statements
June 30, 2018 Discount Rate – The discount rate used to measure the total pension liability was 7.50%. The projection of cash flows used to determine the discount rate assumed contributions will be made at 9.40% of covered payroll and the City’s contributions will be made at rates equal to the difference between actuarially determined rates and the member rate. Based on those assumptions, MFPRSI’s fiduciary net position was projected to be available to make all projected future benefit payments of current plan members. Therefore, the long-term expected rate of return on MFPRSI investments was applied to all periods of projected benefit payments to determine the total pension liability. Sensitivity of City’s Proportionate Share of the Net Pension Liability to Changes in the Discount Rate – The following presents the City’s proportionate share of the net pension liability calculated using the discount rate of 7.50%, as well as what the City’s proportionate share of the’net pension liability would be if it were calculated using a discount rate that is 1% lower (6.50%) or 1% higher (8.50%) than the current rate.
1% Discount 1%Decrease Rate Increase
6.50% 7.50% 8.50%City's Proportionate Share of the Net
Pension Liability 56,036,536$ 34,097,103$ 15,849,098$
MFPRSI’s Fiduciary Net Position – Detailed information about the MFPRSI’s fiduciary net position is available in the separately issued MFPRSI financial report which is available on MFPRSI’s website at www.mfprsi.org. Payables to the Pension Plan – At June 30, 2018, the City reported no payables to the defined benefit pension plan for legally required employer contributions. There were no legally required employee contributions which had been withheld from employee wages but not yet remitted to MFPRSI. Note 9 - Other Postemployment Benefits (OPEB)
Plan Description – The City operates a single-employer health benefit plan which provides medical/prescription drug and dental benefits for employees, retirees and their spouses. Group insurance benefits are established under Iowa Code Chapter 509A.13. No assets are accumulated in a trust that meets the criteria in paragraph 4 of GASB Statement No. 75. The Plan does not issue a stand alone financial report. OPEB Benefits - Individuals who are employed by the City and are eligible to participate in the group health plan and eligible to continue healthcare benefits upon retirement. Retires under age 65 pay the same premium for the medical, prescription drug and dental benefits as active employees, which results in an implicit rate of subsidy and an OPEB liability. Retired participants must be age 55 or older at retirement. At June 30, 2018, the following employees were covered by the benefit terms: Inactive employees or beneficiaries currently receiving benefit payments 41Active Employees 441
Total 482

61
City of Council Bluffs Notes to Financial Statements
June 30, 2018 Total OPEB Liability – The City’s total OPEB liability of $3,802,493 was measured as of June 30, 2018, and was determined by an actuarial valuation as of July 1, 2016. Actuarial Assumptions – The total OPEB liability in the July 1, 2016 actuarial valuation was determined using the following actuarial assumptions and the entry age normal actuarial cost method, applied to all periods included in the measurement. Rate of inflation 3.00% per annumSalary increases 3.00% per annumDiscount rate 3.58% per annumHealthcare cost trend rate 5.00% all years Discount rate – The discount rate used to measure the total pension liability was 3.58% which reflects the index rate for 20-year tax-exempt general obligation municipal bonds with an average rating of AA/Aa or higher as of the measurement date. Mortality rates are from the RP 2014 annuitant distinct mortality table adjusted to 2016 with MP 2016 generational projection of future mortality improvement. The actuarial assumptions used in the July1, 2016 valuation were based on the results of an actuarial experience study with the dates corresponding to those listed above. Changes in the Total OPEB Liability
Total OPEBLiability
Total OPEB liability beginning of year, as restated 3,030,786$ Changes for the year:
Service cost 353,825 Interest 135,388 Changes of assumptions 511,863 Benefit payments (229,369) Net changes 771,707
Total OPEB liability end of year 3,802,493
Change of assumptions reflect a change in the discount rate from 5.0% in fiscal year 2017 to 3.58% in fiscal year 2018. Sensitivity of the City’s Total OPEB Liability to Changes in the Discount Rate – The following presents the total OPEB liability, calculated using the current discount rate of 3.58%, as well as the total OPEB liability calculated using a discount rate that is 1% lower (2.58%) or 1% higher (4.58%) than the current rate:
1% Discount 1%Decrease Rate Increase
2.58% 3.58% 4.58%
Total OPEB liability 4,100,076$ 3,802,493$ 3,528,708$

62
City of Council Bluffs Notes to Financial Statements
June 30, 2018 Sensitivity of the City’s Total OPEB Liability to Changes in the Healthcare Cost Trend Rate – The following presents the total OPEB liability, calculated using the current healthcare cost trend rate of 5.0%, as well as the total OPEB liability calculated using a healthcare cost trend rate that is 1% lower (4.0%) or 1% higher (6.0%) than the current rate:
Current1% Healthcare Cost 1%
Decrease Trend Rate Increase5.5% decreasing 6.5% decreasing 7.5% decreasing
to 4.0% to 5.0% to 6.0%
Total OPEB liability 3,427,910$ 3,802,493$ 4,241,538$ OPEB Expense and Deferred Outflows of Resources Related to OPEB – For the year ended June 30, 2018, the City recognized OPEB expense of $535,327. At June 30, 2018, the City reported deferred outflows of resources related to OPEB from the following resources:
Deferred Outflowsof Resources
Change of assumptions 465,749$ The amount reported as deferred outflows of resources related to OPEB will be recognized as OPEB expense as follows:
Year endingJune 30, Amount
2019 46,114$ 2020 46,114 2021 46,114 2022 46,114 2023 46,114
Thereafter 235,179 Total 465,749$

63
City of Council Bluffs Notes to Financial Statements
June 30, 2018 Note 10 - Industrial Development Revenue Bonds The City has issued a total of $47,780,000 of industrial development revenue bonds under the provisions of Chapter 419 of the Code of Iowa. The bonds and related interest are payable solely from the rents payable by tenants of the properties constructed and the bond principal and interest do not constitute liabilities of the City. Note 11 - Deficit Balances At June 30, 2018, funds with deficit balances were as follows: Special Revenue:
Library 12,983$
The deficit balance is the result of payments made prior to the collection of grant revenues. Note 12 - Employee Health Insurance Plan The Iowa Governmental Health Care Plan was established to account for the partial self-funding of the City’s health insurance benefit plan. The plan is funded by both employee and City contributions and is administered through a service agreement with Iowa Governmental Health Care Plan. The agreement is subject to automatic renewal provisions. The City assumes liability for claims up to the deductible of $2,500/$5,000 per single/family plan with a maximum out of pocket expense of $5,000/$10,000 per single/family plan. The deductible and maximum out of pocket expense for the City is reduced by the deductible amount paid by the employee of $100/$300 per single/family plan and employee maximum out of pocket expense of $1,250/$2,500 per single/family plan. Claims in excess of deductibles are covered by Iowa Governmental Health Care Plan. Monthly payments of service fees and plan contributions to the Iowa Governmental Health Care Plan Fund are recorded as expenditures from the operating funds. Under the administrative services agreement, monthly payments of service fees and claims processed are paid to Employee Benefit Systems, who administers the plan. The City records the plan assets and related liabilities of the health plan in the General Fund. The City’s contribution to the plan for the year ended June 30, 2018 was $8,204,890. Amounts payable from the Iowa Governmental Health Care Plan at June 30, 2018 total $174,000, which is for incurred but not reported (IBNR) and reported but not paid claims, which is included in accounts payable in these financial statements. The amounts are based on actuarial estimates of the amounts necessary to pay prior year and current year claims and to establish a reserve for catastrophic losses. A liability has been established based on the requirements of Governmental Accounting Standards Board Statement No. 10, which requires a liability for claims be reported if information prior to the issuance of the financial statements indicates it is probable a liability has been incurred at the date of the financial statements and the amount of the loss can be reasonably estimated. Settlements have not exceeded the stop-loss coverage in any of the past three years.

64
City of Council Bluffs Notes to Financial Statements
June 30, 2018 A reconciliation of changes in the aggregate liabilities for claims for the years ended June 30, 2018 and June 30, 2017 is as follows:
2018 2017
Unpaid Claims as of Beginning of Year 213,000$ 213,000$ Incurred Claims (including claims incurred but not reported as of June 30) 9,729,628 8,763,031 Payments on Claims (9,768,628) (8,763,031) Unpaid Claims as of Year End 174,000$ 213,000$
Note 13 - Construction Commitments Construction commitments at June 30, 2018 totaling $16,764,495 will be paid as work on the projects progresses. These projects will be funded through general obligation notes, grants, and local funds on hand. Note 14 - Risk Management The City is exposed to various risks of loss related to torts; theft, damage to and destruction of assets; errors and omissions; injuries to employees; and natural disasters. These risks are covered by the purchase of commercial insurance and $500,000 self-insured retention on liability and auto coverage only and $600,000 on worker’s compensation. The City assumes liability for any deductibles and claims in excess of coverage limitations. Settled claims from these risks did not exceed commercial insurance coverage during the past 3 fiscal years. Note 15 - CDBG Grant Fund and CD Installment Loan Fund During the year ended June 30, 1977, the City received funding for an individual housing rehabilitation loan program from the U.S. Department of Housing and Urban Development. The City also received funding from the Iowa West Foundation to provide loans to individuals for home improvements. The loans are accounted for in the Special Revenue, CDBG Grant Fund and the Special Revenue, CD Installment Loan Fund. Loans carry an interest rate from 0% to 3% per annum and have terms ranging from 10 to 20 years. At June 30, 2018, there were 36 active loans with a total outstanding principal balance of $245,357 which is included in loans receivable in these financial statements.

65
City of Council Bluffs Notes to Financial Statements
June 30, 2018
Note 16 - Urban Renewal Development Agreements
The City has entered into various development agreements for urban renewal projects. The agreements require the City to rebate portions of the incremental property tax paid by the developer in exchange for infrastructure improvements, rehabilitation and development of commercial projects by the developer. The total to be paid by the City under the agreements is not to exceed $32,345,432. Certain agreements include provisions for the payment of interest. During the year ended June 30, 2018, the City rebated $1,343,366 of incremental property tax to developers, also $3,254,811 for principal and $105,864 for interest. The total cumulative principal amount rebated on the agreements is $4,704,041. The outstanding balance on the agreements at June 30, 2018 was $27,527,327. The agreements are not general obligations of the City and, due to their nature, are not recorded as a liability in the City’s financial statements. However, the agreements are subject to the constitutional debt limitation of the City. Certain agreements include an annual appropriation clause and, accordingly, only the amount payable in the succeeding year on the agreements is subject to the constitutional debt limitation. Note 17 - Tax Abatements Governmental Accounting Standards Board Statement No. 77 defines tax abatements as a reduction in tax revenues that results from an agreement between one or more governments and an individual or entity in which (a) one or more governments promise to forgo tax revenues to which they are otherwise entitled and (b) the individual or entity promises to take a specific action after the agreement has been entered into that contributes to economic development or otherwise benefits the governments or the citizens of those governments. City Tax Abatements The City provides tax abatements for urban renewal and economic development projects with tax increment financing as provided for in Chapters 15A and 403 of the Code of Iowa. For these types of projects, the City enters into agreements with developers which require the City, after developers meet the terms of the agreements, to rebate a portion of the property tax paid by the developers, to pay the developers an economic development grant or to pay the developers a predetermined dollar amount. No other commitments were made by the City as part of these agreements. For the year ended June 30, 2018, $1,969,838 of property tax was diverted from the City under urban renewal and economic development projects.

66
City of Council Bluffs Notes to Financial Statements
June 30, 2018 Note 18 - Economic Development Agreements Bass Pro Outdoor World, L.L.C. On October 22, 2004, the City entered into an agreement with Pottawattamie County, the Iowa West Foundation, the Southwest Iowa Foundation and the Council Bluffs Community Betterment Foundation (CBF) to develop an outdoor world retail facility. The project was financed and constructed by the CBF for use and occupancy by Bass Pro Outdoor World, L.L.C., lessee (Bass Lease). As part of this agreement, the City will own and maintain the facility and issued a $17,000,000 urban renewal revenue capital loan note to reimburse CBF for some of the project costs. In February 2011, the City issued a $14,500,000 urban renewal term loan note to retire the $17,000,000 urban renewal capital loan note. As discussed in Note 4, in March 2014, the City issued a $11,600,000 term loan note to retire the $14,500,000 urban renewal term loan note. The term loan note is secured in various forms by the development agreement participants. Pursuant to the loan agreement, the City established a Trust account through US National Bank as trustee. Deposits into this account include all sources of funding securing the note and all lease payments required under the Bass Lease. Funds in the trust account are to be used to pay real estate tax on the property, retire the urban renewal term loan note and pay operating and maintenance expenses related to the facility. This trust account is reported by the City in the Special Revenue, Bass Pro Shop Fund. During the year ended June 30, 2018, the City transferred $787,458 into this fund from the Special Revenue, Tax Increment Financing Fund to fulfill part of its obligation under the agreement. Council Bluffs Convention and Visitors Bureau The City of Council Bluffs dedicates hotel/motel tax receipts to the Convention and Visitor’s Bureau for the purpose of promoting the City as both a convention site, a sports venue and a visitor attraction. The City committed $600,000 in the year ended June 30, 2018.

67
City of Council Bluffs Notes to Financial Statements
June 30, 2018 Note 19 - Mid America Center The Mid-America Center (MAC) provides space for conventions, concerts, sporting events, meetings and other performances. The MAC was built with funding from the Southwest Iowa Foundation and, upon completion, ownership of the MAC was transferred to the City. The City has entered into a management agreement with Harrah’s Iowa Arena Management, LLC (Harrah’s) to manage the operations of the MAC. The City is contractually obligated to fund all liabilities and expenses of the MAC. Following is a condensed operating statement for activities of the MAC for the year ended June 30, 2018. Operating Revenues
Event revenue 2,329,847$ Food & beverage revenue 1,398,062
Total revenue 3,727,909
Operating ExpensesEvent costs 183,907 FooCost of sales- events 297,265 LabCost of sales- other retail 2,157,193 Marketing and promotions 142,570 Property operations 868,382 Administrative and general 41,841 Miscellaneous 82,284
Total event operating expenses 3,773,442
Operating Result (Loss) (45,533)
Management fee 327,233 Income/(Loss) (372,766)$
The management agreement between the City and Harrah’s provides for Harrah’s to earn a management fee equal to 50% of the amount by which the net operating income (loss) for such fiscal year exceeds the net operating loss threshold of $700,000. Management Fee Calculation
Net operating loss (45,533)$ Net operating loss threshold 700,000
Net operating loss less than netoperating loss threshold 654,467$
50% of the amount the net operating loss exceeds the net operating loss threshold 327,233$

68
City of Council Bluffs Notes to Financial Statements
June 30, 2018 Note 20 - Dodge Riverside Golf Course
On March 1, 2018 the City entered into a management agreement with Landscapes Management Company, LLC to manage the operations of the City owned Dodge Riverside Golf Course. Landscapes Management Company, LLC specializes in managing golf course operations. The City is contractually obligated to fund all liabilities and expenses of the golf course. The base management fee is $5,000 per month, adjusted beginning January 1, 2019 and each January thereafter to increase 3% per year. A contingent management fee will be paid at the end of the first full fiscal year and is defined as 20% of any net operating income over $0. Following is a condensed operating statement for activities for Dodge Riverside Golf Course managed by Landscapes Management Company, LLC for 4 months ended June 30, 2018. Results for 4 months ended June 30, 2018:
Operating RevenuesCourse & Shop revenue 275,432$ Food & beverage revenue 120,884
Total revenue 396,316
Operating ExpensesCourse & Shop expenses 66,547 FooCost of sales- events 51,192 LabCost of sales- other retail 174,237 Administrative & general 47,330 Base Management fee 20,000
Total event operating expenses 359,306
Operating Result 37,010$

69
City of Council Bluffs Notes to Financial Statements
June 30, 2018 Note 21 - Prior Period Restatement - Accounting Change
Governmental Accounting Standards Board Statement No. 75, Accounting and Financial Reporting for Postemployment Benefits Other Than Pensions (OPEB), was implemented during fiscal year 2018. The revised requirements establish new financial reporting requirements which provide their employees with OPEB benefits, including additional note disclosure and required supplementary information. In addition, GASB Statement No. 75 requires a state or local government employer to use the entry age normal actuarial cost method, and requires deferred outflows of resources and deferred inflows of resources which arise from other types of events related to OPEB to be recognized. During the transition year, as permitted, beginning balances for deferred outflows of resources and deferred inflows of resources are not reported. Beginning net position for governmental and business type activities was restated to retroactively report the change in valuation of the beginning total OPEB liability, as follows. The City has created and implemented a new database for the tracking and review of City-owned property. This has resulted in an improved understanding and management of City-owned property. Upon the implementation of this new tracking database, the City determined that it was not appropriate to financially treat the property as ‘land held for sale’ with a cost basis. This approach, although recommended by prior external auditors, resulted in an overstatement of ‘land held for sale’. The change in accounting resulted in a prior period adjustment for the ‘land held for sale’ at net realizable value and the treatment of land held as a capital asset and therefore, reported as Governmental Activities rather than as “land held for sale” in the General, Capital Project or Non-Major fund classifications.
Nonmajor Other Total Total TotalGeneral Governmental Governmental Governmental Governmental Business Type
Fund Capital Projects Funds Funds Funds Activities Sewer Refuse Activities
Fund Balance/Net position June 30, 2017, as previously reported 23,836,538$ 14,301,436$ 10,020,816 12,061,206$ 60,219,996$ 277,927,318$ 153,582,252$ 6,320,265$ 159,902,517$ Net OPEB obligation measured under previous standards - - - - - 1,919,688 237,939 50,419 288,358 Total OPEB liability at June 30, 2017 - - - - - (2,700,127) (259,435) (71,224) (330,659) Land Held for Sale - Appraised Value Previously Reported (2,630,000) - - - (2,630,000) (2,630,000) - - -
Land Held for Sale - Net Realizable Value at June 30, 2017 1,444,890 - - - 1,444,890 1,444,890 - - -
Land Held for Sale - Transferred to Capital Assets at June 30, 2017 - (7,198,756) (441,669) - (7,640,425) - - - -
Land Held for Sale - Under Capital Asset Thresold at June 30, 2017 - (1,246,496) (4,172) - (1,250,668) (1,250,668) - - - Fund Balance/Net Position July 1, 2017, as restated 22,651,428$ 5,856,184$ 9,574,975$ 12,061,206$ 50,143,793$ 274,711,101$ 153,560,756$ 6,299,460$ 159,860,216$
Business Type Activities

Required Supplementary Information June 30, 2018
City of Council Bluffs

(This page left blank intentionally.)

Governmental EnterpriseFund Types Fund Type Total
Actual Actual ActualReceipts
Property tax 43,195,224$ -$ 43,195,224$ Tax increment financing 4,764,496 - 4,764,496 Other city tax 21,538,534 - 21,538,534 Licenses and permits 5,773,976 - 5,773,976 Use of money and property 1,169,285 - 1,169,285 Intergovernmental 22,110,797 - 22,110,797 Local Grants 7,738,704 - 7,738,704 Charges for service 6,442,231 12,508,139 18,950,369 Special and drainage assessments 305,146 - 305,146 Miscellaneous 6,244,561 53,281 6,297,842
Total receipts 119,282,952 12,561,420 131,844,372
DisbursementsPublic safety 33,135,638 - 33,135,638 Public works 9,771,341 - 9,771,341 Health and social services 553,808 - 553,808 Culture and recreation 12,007,442 - 12,007,442 Community and economic
development 4,793,219 - 4,793,219 General government 14,571,617 - 14,571,617 Debt service 17,686,355 - 17,686,355 Capital projects 41,063,277 - 41,063,277 Business type activities - 15,434,167 15,434,167
Total disbursements 133,582,697 15,434,167 149,016,864
Excess (defiency) of receipts overexpenditures (14,299,745) (2,872,747) (17,172,492)
Other Financing Sources 34,230,962 6,120,020 40,350,982
Net change in fund balances 19,931,216 3,247,273 23,178,490
Fund Balances, Beginning of Year 50,143,792 159,860,216 210,004,008 Fund Balances, End of Year 70,075,008$ 163,107,489$ 233,182,497$

70
City of Council Bluffs Budgetary Comparison Schedule of Revenues, Expenditures, and Changes in Balances – Budget and Actual –
Governmental Funds and Enterprise Funds Required Supplementary Information
June 30, 2018
Final toActual
Original Final Variance
43,306,269$ 43,306,269$ (111,045)$ 4,743,176 4,743,176 21,320
17,340,355 17,800,355 3,738,179 4,383,430 4,383,430 1,390,546
929,300 929,300 239,985 24,522,388 24,522,388 (2,411,591)
- - 7,738,704 20,251,719 20,251,719 (1,301,350)
166,000 166,000 139,146 5,336,800 5,336,800 961,042
120,979,437 121,439,437 10,404,935
34,240,721 34,240,721 1,105,083 9,541,858 9,541,858 (229,483)
684,910 684,910 131,102 12,759,173 12,759,173 751,731
6,652,687 6,652,687 1,859,468 12,881,029 12,881,029 (1,690,588) 10,700,043 17,620,043 (66,312) 40,111,000 40,193,100 (870,177) 16,206,371 16,206,371 772,204
143,777,792 150,779,892 1,763,028
(22,798,355) (29,340,455) 12,167,963
14,965,000 32,910,000 7,440,982
(7,833,355) 3,569,545 19,608,945
216,603,256 216,603,256 (6,599,248) 208,769,901$ 220,172,801$ 13,009,696$
Budget Amounts

71
City of Council Bluffs Notes to Required Supplementary Information – Budgetary Reporting
June 30, 2018 The budgetary comparison is presented as Required Supplementary Information in accordance with Governmental Accounting Standards Board Statement No. 41 for governments with significant budgetary perspective differences resulting from not being able to present budgetary comparisons for the General Fund and each major Special Revenue Fund. In accordance with the Code of Iowa, the City Council annually adopts a budget following required public notice and hearing for all funds. The annual budget may be amended during the year utilizing similar statutorily prescribed procedures. The City’s budget is prepared on a GAAP basis. Formal and legal budgetary control is based upon nine major classes of expenditures/expenses known as functions, not by fund. These nine functions are: public safety, public works, health and social services, culture and recreation, community and economic development, general government, debt service, capital projects and business-type activities. Function expenditures/expenses required to be budgeted include expenditures/expenses for the General Fund, the Special Revenue Funds, the Debt Service Fund, the Capital Projects Fund, the Permanent Fund and the Enterprise Funds. Although the budget document presents function expenditures/expenses by fund, the legal level of control is at the aggregated functions level, not by fund. During the year, the budget amendment increased budgeted expenditures by $7,002,100. This budget amendment is reflected in the final budgeted amounts. During the year ended June 30, 2018, expenditures in the public works, general government, capital projects and debt service functions exceeded the amounts budgeted.

72
City of Council Bluffs Schedule of the City’s Proportionate Share of the Net Pension Liability
Iowa Public Employee’s Retirement System and Municipal Fire and Police Retirement System Last Four Fiscal Years
Required Supplementary Information Iowa Public Employees' Retirement System
2018 2017 2016 2015City's Collective Proportion of the Net Pension
Liability 0.2164434% 0.2221247% 0.2207700% 0.2319287%
City's Collective Proportionate Share of the NetPension Liability 14,418$ 13,979$ 10,907$ 8,857$
City's Covered Payroll 16,148$ 15,940$ 15,129$ 15,175$
City's Collective Proportionate Share of the NetPension Liability as a Percentage of Its Covered Payroll 89.29% 87.70% 72.09% 58.37%
Plan Fiduciary Net Position as a Percentage of the 82.21% 81.82% 85.19% 87.61%Total Pension Liability
Municipal Fire and Police Retirement System of Iowa2018 2017 2016 2015
City's Collective Proportion of the Net PensionLiability 5.813905% 5.917475% 5.879931% 5.824948%
City's Collective Proportionate Share of the NetPension Liability 34,097$ 36,999$ 27,625$ 21,115$
City's Covered Payroll 16,386$ 16,036$ 15,407$ 14,875$
City's Collective Proportionate Share of the NetPension Liability as a Percentage of Its Covered Payroll 208.09% 230.72% 179.30% 141.95%
Plan Fiduciary Net Position as a Percentage of the 80.60% 78.20% 83.04% 86.27%Total Pension Liability
In accordance with GASB Statement No. 68, the amount presented for each fiscal year were determined as of June 30th of the preceding year. Note: GASB Statement No. 68 requires ten years of information to be presented in this table; however, until a full 10-year trend is compiled, the City will present information for those years for which information is available.
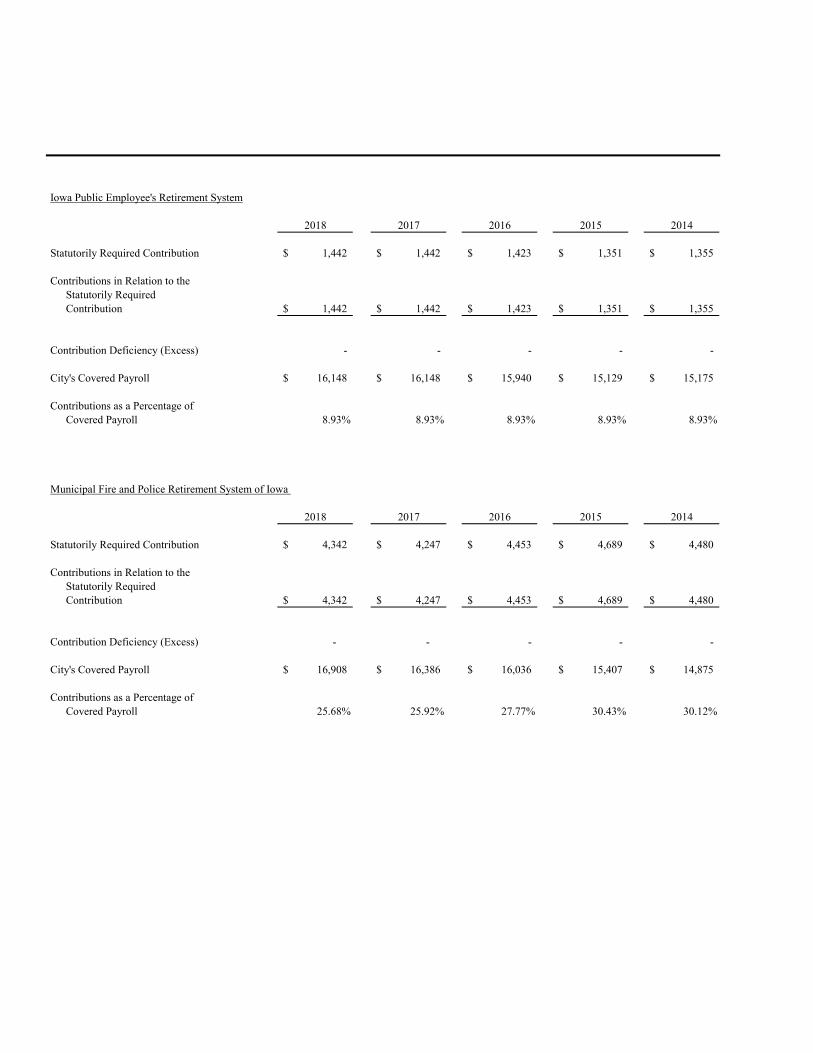
Iowa Public Employee's Retirement System
2018 2017 2016 2015 2014
Statutorily Required Contribution 1,442$ 1,442$ 1,423$ 1,351$ 1,355$
Contributions in Relation to the Statutorily RequiredContribution 1,442$ 1,442$ 1,423$ 1,351$ 1,355$
Contribution Deficiency (Excess) - - - - -
City's Covered Payroll 16,148$ 16,148$ 15,940$ 15,129$ 15,175$
Contributions as a Percentage ofCovered Payroll 8.93% 8.93% 8.93% 8.93% 8.93%
Municipal Fire and Police Retirement System of Iowa
2018 2017 2016 2015 2014
Statutorily Required Contribution 4,342$ 4,247$ 4,453$ 4,689$ 4,480$
Contributions in Relation to the Statutorily RequiredContribution 4,342$ 4,247$ 4,453$ 4,689$ 4,480$
Contribution Deficiency (Excess) - - - - -
City's Covered Payroll 16,908$ 16,386$ 16,036$ 15,407$ 14,875$
Contributions as a Percentage ofCovered Payroll 25.68% 25.92% 27.77% 30.43% 30.12%

73
City of Council Bluffs Schedule of the City Contributions
Iowa Public Employee’s Retirement System and Municipal Fire and Police Retirement System Last Ten Fiscal Years
Required Supplementary Information
2013 2012 2011 2010 2009
1,276$ 1,165$ 986$ 958$ 833$
1,276$ 1,165$ 986$ 958$ 833$
- - - - -
14,726$ 14,437$ 14,202$ 14,403$ 15,981$
8.66% 8.07% 6.94% 6.65% 5.21%
2013 2012 2011 2010 2009
3,769$ 3,454$ 2,722$ 2,335$ 2,358$
3,769$ 3,454$ 2,722$ 2,335$ 2,358$
- - - - -
14,330$ 13,949$ 13,679$ 13,738$ 12,577$
26.30% 24.76% 19.90% 17.00% 18.75%

74
City of Council Bluffs Notes to Required Supplementary Information – Pension Liability
Year Ended June 30, 2018 Iowa Public Employees’ Retirement System Changes of benefit terms:
Legislation passed in 2010 modified benefit terms for current Regular members. The definition of final average salary changed from the highest three to the highest five years of covered wages. The vesting requirement changed from four years of service to seven years. The early retirement reduction increased from 3% per year measured from the member’s first unreduced retirement age to a 6% reduction for each year of retirement before age 65. Changes of assumptions:
The 2017 valuation implemented the following refinements as a result of an experience study dated March 24, 2017:
• Decreased the inflation assumption from 3.00% to 2.60%. • Decreased the assumed rate of interest on member accounts from 3.75% to 3.50% per year. • Decreased the discount rate from 7.50% to 7.00%. • Decreased the wage growth assumption from 4.00% t0 3.25%. • Decreased the payroll growth assumption from 4.00% to 3.25%.
The 2014 valuation implemented the following refinements as a result of a quadrennial experience study:
• Decreased the inflation assumption from 3.25% to 3.00% • Decreased the assumed rate of interest on member accounts from 4.00% to 3.75% per year. • Adjusted male mortality rates for retires in the Regular membership group. • Reduced retirement rates for sheriffs and deputies between the ages of 55 and 64. • Moved from an open 30-year amortization period to a closed 30-year amortization period for the
UAL (unfunded actuarial liability) beginning June 30, 2014. Each year thereafter, changes in the UAL from plan experience will be amortized on a separate closed 20-year period.
The 2010 valuation implemented the following refinements as a result of a quadrennial experience study:
• Adjusted retiree mortality assumptions. • Modified retirement rates to reflect fewer retirements. • Lowered disability rates at most ages. • Lowered employment termination rates. • Generally increased the probability of terminating members receiving a deferred retirement
benefit. • Modified salary increase assumptions based on various service duration.
Municipal Fire and Police Retirement System of Iowa Changes of benefit terms:
There were no significant changes of benefit terms. Changes of assumptions:
Postretirement mortality changed to the RP-2000 Blue Collar combined Healthy Mortality Table with males set-back two years, females set-forward one year and disabled individuals set-forward one year (male only rates), with five years projection of future mortality improvement with Scale BB.

75
City of Council Bluffs Schedule of Changes in the City’s Total OPEB Liability, Related Ratios and Notes
Year Ended June 30, 2018
2018Service Cost 353,825$ Interest Cost 135,388 Difference between expected and actual experiences - Changes in assumptions 511,863 Benefit payments (229,369) Net change in total OPEB liability 771,707 Total OPEB liability beginning of year, as restated 3,030,786 Total OPEB liability end of year 3,802,493
Covered-employee payroll 29,491,541 Total OPEB liability as a percentage 12.89% of covered-employee payroll
Notes to Schedule of Changes in the Total OPEB Liability and Related Ratios No assets are accumulated in a trust that meets the criteria in paragraph 4 of GASB Statement 75. Changes in benefit terms:
There were no significant changes in benefit terms. Change in assumptions:
Changes in assumptions and other inputs reflect the effects of changes in the discount rate each period. The following are the discount rates used in each period: Year ended June 30, 2018 3.58% Year ended June 30, 2017 5.00% Note: GASB 75 requires ten years of information to be presented in this table. However, until a full 10-year trend is compiled, the City will present information for those years for which information is available.

(This page left blank intentionally.)

Other Supplementary Information June 30, 2018
City of Council Bluffs

76
City of Council Bluffs Combining Financial Statements
Nonmajor Special Revenue Funds Special Revenue Funds are used to account for specific revenues legally restricted to expenditure for particular purposes. The Road Use Tax Fund accounts for the operation of street maintenance. Financing is provided by the City’s share of state gasoline taxes received on a per capita basis. The Targeted Jobs Fund accounts for tax withholding funds paid by employers to be directed toward economic development projects. The CDBG Grant Fund accounts for community development grant and other resources to provide resources to community based organizations for program and administrative costs. Funding is provided by federal community development block grants and a portion of the recurring monthly payments from property owners in the program. The HOME Program Fund accounts for loans made to participants in the community home loan program. Ongoing funding for this program is provided by recurring monthly payments of principal and interest from property owners in the program. The CD Installment Loan Fund accounts for costs of property insurance and property tax on residential properties financed by the community home loan program. Funding for these expenses is provided by a portion of the recurring monthly payments from property owners in the program. The Mosquito Creek #22 Fund accounts for costs of maintenance and operations in the Mosquito Creek drainage district. Funding is provided from assessments to the property owners in the district. The Sieck #32 Fund accounts for costs of maintenance and operations in the Sieck drainage district. Funding is provided from assessments to the property owners in the district. The West Lewis #35 Fund accounts for costs of maintenance and operations in the West Lewis drainage district. Funding is provided from assessments to the property owners in the district. The Lake Manawa SSMID Fund accounts for the maintenance and repair operations of the Lake Manawa special improvement district, a retail and commercial area. Funding is provided by assessments to property owners within the district. The Library Memorial and Gifts Fund accounts for supplemental costs of operations and acquisitions of materials for the Council Bluffs Public Library. Financing for the fund is provided by gifts and memorials from private citizens and organizations. Nonmajor Permanent Fund Permanent Funds are used to report resources legally restricted to the extent only earnings, and not principal, may be used for purposes to support the City’s programs. The Fairview Cemetery Perpetual Care Fund accounts for funds received and held for improvements to the Fairview Cemetery.

CDRoad Use CDBG Home Installment
Tax Targeted Jobs Grant Program LoanAssetsCash, Cash equivalents and pooled investments 9,261,240$ 69,000$ 989,925$ 117,380$ 113,202$ Receivables
Accounts (net) - 45,288 - - - Special and drainage assessments - - - - - Loans - - 145,769 - 99,589
Due from other governments 594,728 - 55,882 - - Inventories 972,197 - - - -
Total Assets 10,828,165$ 114,288$ 1,191,576$ 117,380$ 212,791$
Liabilities, Deferred Inflows of Resources and Fund Balances
LiabilitiesAccounts payable 225,257$ 45,288$ 42,074$ 10,000$ 1,044$ Salaries and benefits payable 134,727 - 11,208 - - Due to other funds - - - - -
Total Liabilities 359,984 45,288 53,282 10,000 1,044
Deferred inflows of resources:Unavailable revenues
Other - - 26,250 - -
Fund BalancesNonspendable
Cementary perpetual care - - - - - Inventories 972,197 - - - -
RestrictedStreet and sewer maintenance
and improvements 9,495,984 - - - - Community development block grant - - 1,112,044 - - Other purposes - 69,000 - 107,380 211,746
Unassigned - - - - - Total fund balances 10,468,181 69,000 1,112,044 107,380 211,746
Total liabilities, deferred inflows of resources and fund balances 10,828,165$ 114,288$ 1,191,576$ 117,380$ 212,791$
Special Revenue

77
City of Council Bluffs Combining Balance Sheet
Nonmajor Governmental Funds June 30, 2018
PermanentLake Library Fairview
Mosquito West Manawa Memorials CemetaryCreek #22 Sieck #32 Lewis #35 SSMID and Gifts Total Perpetual Total
336,190$ 127,549$ 445,728$ 387,120$ -$ 11,847,335$ 61,360$ 11,908,695$
- - - - - 45,288 - 45,288 72,158 36,416 64,977 - - 173,551 - 173,551
- - - - - 245,357 - 245,357 652 686 1,821 - - 653,770 - 653,770
- - - - - 972,197 - 972,197 409,000$ 164,651$ 512,526$ 387,120$ -$ 13,937,497$ 61,360$ 13,998,857$
-$ 3,276$ -$ 44,442$ 1,353$ 372,734$ -$ 372,734$ 627 627 627 - - 147,815 - 147,815
- - - - 11,631 11,631 - 11,631 627 3,903 627 44,442 12,983 532,179 - 532,179
72,158 36,416 64,977 - - 199,801 - 199,801
- - - - - - 61,360 61,360 - - - - - 972,197 - 972,197
- - - - - 9,495,984 - 9,495,984 - - - - - 1,112,044 - 1,112,044
336,215 124,332 446,922 342,678 - 1,638,275 - 1,638,275 - - - - (12,983) (12,983) - (12,983)
336,215 124,332 446,922 342,678 (12,983) 13,205,517 61,360 13,266,876
409,000$ 164,651$ 512,526$ 387,120$ -$ 13,937,497$ 61,360$ 13,998,857$
Drainage Districts

CDRoad Use Home installment
Tax Targeted Jobs CDBG grant Program LoanRevenues
License and permits 88,140$ -$ -$ -$ -$ Intergovernmental 7,727,171 - 827,918 440,000 - Charge for service 4,100 - 3,130 - - Special and drainage assessments - - - - - Miscellaneous 83,693 372,345 181 29,999 (9,454)
Total revenues 7,903,103 372,345 831,230 469,999 (9,454)
ExpendituresCurrent
Public safety - - - - - Public works 7,904,827 - - - - Culture and recreation - - - - - Community and economic development - 334,345 905,680 94,819 19,331
Total expenditures 7,904,827 334,345 905,680 94,819 19,331
Excess (deficiency) of revenues over(under) expenditures (1,724) 38,000 (74,451) 375,180 (28,785)
Other Financing SourcesTransfers In 3,308,804 - - - 232,873 Transfers Out - - (118,849) - -
Total other financing sources (uses) 3,308,804 - (118,849) - 232,873
Net Change in Fund Balances 3,307,079 38,000 (193,300) 375,180 204,088
Fund balances Beginning of Year, as restated 7,161,102 31,000 1,305,344 (267,800) 7,658
Fund Balances End of Year 10,468,181$ 69,000$ 1,112,044$ 107,380$ 211,746$
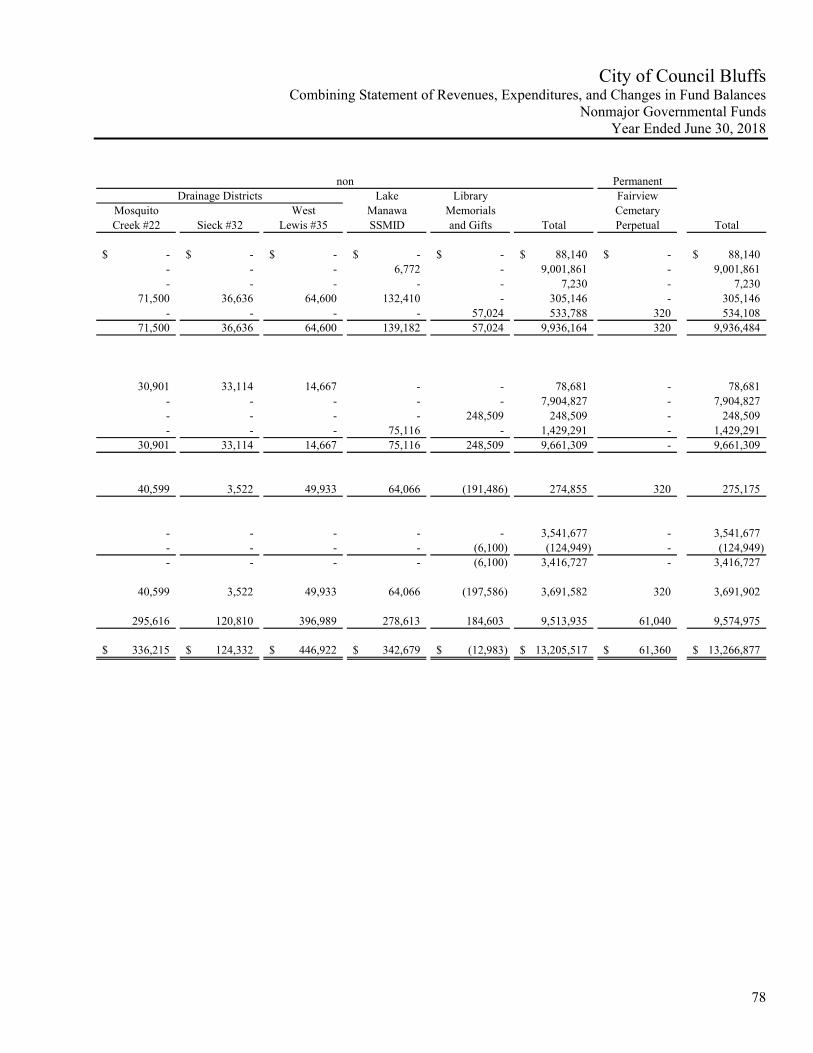
78
City of Council Bluffs Combining Statement of Revenues, Expenditures, and Changes in Fund Balances
Nonmajor Governmental Funds Year Ended June 30, 2018
PermanentLake Library Fairview
Mosquito West Manawa Memorials CemetaryCreek #22 Sieck #32 Lewis #35 SSMID and Gifts Total Perpetual Total
-$ -$ -$ -$ -$ 88,140$ -$ 88,140$ - - - 6,772 - 9,001,861 - 9,001,861 - - - - - 7,230 - 7,230
71,500 36,636 64,600 132,410 - 305,146 - 305,146 - - - - 57,024 533,788 320 534,108
71,500 36,636 64,600 139,182 57,024 9,936,164 320 9,936,484
30,901 33,114 14,667 - - 78,681 - 78,681 - - - - - 7,904,827 - 7,904,827 - - - - 248,509 248,509 - 248,509 - - - 75,116 - 1,429,291 - 1,429,291
30,901 33,114 14,667 75,116 248,509 9,661,309 - 9,661,309
40,599 3,522 49,933 64,066 (191,486) 274,855 320 275,175
- - - - - 3,541,677 - 3,541,677 - - - - (6,100) (124,949) - (124,949) - - - - (6,100) 3,416,727 - 3,416,727
40,599 3,522 49,933 64,066 (197,586) 3,691,582 320 3,691,902
295,616 120,810 396,989 278,613 184,603 9,513,935 61,040 9,574,975
336,215$ 124,332$ 446,922$ 342,679$ (12,983)$ 13,205,517$ 61,360$ 13,266,877$
nonDrainage Districts

79
City of Council Bluffs Council Bluffs Public Library Foundation
Financial Statements Year Ended June 30, 2018
Council Bluffs Public Library Foundation Financial Statements: Statement of Net Position
AssetsCurrent Assets Cash 22,757$ Investments 10,121,973 Bequest receivable 188,907 Total assets 10,333,637
Net PositionRestricted - Nonexpendable 41,635 Restricted - Expendable 10,292,002 Total net position 10,333,637$
Statement of Revenues, Expenses, and Changes in Net Position
Operating Revenues Contributions 613,710$
Operating Expenses Contributions to City 235,313 Miscellaneous 10,649 Total operating expenses 245,962
Operating Income 367,747
Non-Operating Revenue Investment earnings 677,325
Change in Net Position 1,045,072
Net Position Beginning of Year 9,288,565 Net Position End of Year 10,333,637$

Statistical Section (Unaudited) June 30, 2018
City of Council Bluffs

80
City of Council Bluffs Statistical Section Table of Contents
This part of the City of Council Bluffs’ comprehensive annual financial report presents detailed information as a context for understanding what the information in the financial statements, note disclosures and required supplementary information says about the City’s overall financial health.
Contents Schedule Financial Trends These schedules contain trend information to help the reader understand how the City’s financial performance and well-being have changed over time. 1-4 Revenue Capacity These schedules contain information to help the reader assess the City’s most Significant local revenue source, the property tax. 5-9 Debt Capacity These schedules present information to help the reader assess the affordability of the City’s current level of outstanding debt and the City’s ability to issue additional debt in the future. 10-14 Demographic and Economic Information These schedules offer demographic and economic indicators to help the reader understand the environment within which the City’s financial activities take place. 15-16 Operating Information These schedules contain service and infrastructure data to help the reader understand how the information in the City’s financial report related to the services the City provides and the activities it performs. 17-19 Sources: Unless otherwise noted, the information in these schedules is derived from the annual financial reports for the relevant year.

2018 2017 2016 2015Governmental Activities
Net investment in capital assets 292,236,238$ 257,012,906$ 244,666,094$ 234,964,843$ Restricted 35,171,789 45,270,638 44,378,329 31,773,393 Unrestricted (23,003,423) (24,356,226) (29,586,558) (40,249,786)
Total Governmental Activities Net Position 304,404,604$ 277,927,318$ 259,457,865$ 226,488,450$
Business-Type ActivitiesNet investment in capital assets 156,034,553$ 153,340,629$ 150,532,508$ 144,959,497$ Unrestricted 7,072,937 6,561,888 5,810,640 5,739,898
Total Business-Type Activities Net Position 163,107,489$ 159,902,517$ 156,343,148$ 150,699,395$
Primary GovernmentNet investment in capital assets 448,270,791$ 410,353,535$ 395,198,602$ 379,924,340$ Restricted 35,171,789 45,270,638 44,378,329 31,773,393 Unrestricted (15,930,486) (17,794,338) (23,775,918) (34,509,888)
Total Primary Government Net Position 467,512,093$ 437,829,835$ 415,801,013$ 377,187,845$

81
City of Council Bluffs Schedule 1 – Net Position by Component
Last Ten Fiscal Years (Accrual Basis of Accounting)
2014 2013 2012 2011 2010 2009
246,057,967$ 242,739,159$ 239,751,252$ 231,096,351$ 219,535,725$ 212,224,136$ 25,626,688 30,005,228 35,772,486 30,061,361 23,003,292 21,301,756
(12,404,934) (7,197,379) (7,121,573) (10,787,191) (263,805) (4,916,787) 259,279,721$ 265,547,008$ 268,402,165$ 250,370,521$ 242,275,212$ 228,609,105$
140,083,921$ 131,121,021$ 131,806,236$ 128,435,537$ 118,755,228$ 107,488,837$ 5,623,922 6,135,403 1,660,104 2,448,896 5,261,436 9,469,103
145,707,843$ 137,256,424$ 133,466,340$ 130,884,433$ 124,016,664$ 116,957,940$
386,141,888$ 373,860,180$ 371,557,488$ 359,531,888$ 338,290,953$ 319,712,973$ 25,626,688 30,005,228 35,772,486 30,061,361 23,003,292 21,301,756 (6,781,012) (1,061,976) (5,461,469) (8,338,295) 4,997,631 4,552,316
404,987,564$ 402,803,432$ 401,868,505$ 381,254,954$ 366,291,876$ 345,567,045$

2018 2017 2016 2015
ExpensesGovernmental Activities
Public safety 33,774,151$ 32,875,871$ 32,306,014$ 30,124,650$ Public works 11,087,605 21,559,209 17,093,394 16,468,963 Health and social services 541,850 113,485 727,678 638,134 Culture and recreation 13,517,440 14,276,235 16,375,706 15,348,323 Community and economic development 11,736,307 13,635,684 8,730,016 17,476,764 General government 14,342,124 10,182,146 14,200,473 15,571,464 Interest on long term debt 1,874,944 1,820,873 2,108,862 1,750,993
Total Governmental Activities Expenses 86,874,421 94,463,503 91,542,143 97,379,291
Business-Type ActivitiesSewer system and sewage disposal 9,996,297 8,978,896 9,601,503 9,365,727 Refuse and disposal 5,437,869 5,416,587 5,480,632 5,449,198 Other - - - -
Total Business-Type Activities Expenses 15,434,167 14,395,483 15,082,135 14,814,925
Total Primary Government Expenses 102,308,588$ 108,858,986$ 106,624,278$ 112,194,216$
Program RevenuesGovernmental Activities
Charges for service:Public safety 8,577,055$ 3,911,816$ 4,246,795$ 6,781,118$ Public works 321,237 477,870 339,287 260,674 Health and social services 71,663 108,662 125,267 204,936 Culture and recreation 5,182,883 4,894,254 5,506,381 5,311,670 Community and economic development 871,668 595,836 835,578 773,600 General government 5,899,804 5,272,281 4,999,209 4,565,622 Interest on long term debt - - - -
Operating grants and contributions 11,199,345 14,842,261 13,620,858 14,683,571 Capital grants and contributions 21,525,788 21,156,838 34,746,417 8,392,730
Total Governmental Activities Program Revenues 53,649,443 51,259,818 64,419,792 40,973,921
Business-Type ActivitiesCharges for service:
Sanitary sewer 6,933,590 6,514,215 5,955,328 5,141,442 Refuse and disposal 5,627,830 5,729,880 5,654,115 5,757,378 Other - - - -
Operating grants and contributions - - - - Capital grants and contributions - - - -
Total Business-Type Activities Program Revenues 12,561,419 12,244,095 11,609,443 10,898,820
Total Primary Government Program Revenues 66,210,862$ 63,503,913$ 76,029,235$ 51,872,741$
Net (Expense)/RevenueGovernmental activities (33,224,978)$ (43,203,685)$ (27,122,351)$ (56,405,370)$ Business-type activities (2,872,748) (2,151,388) (3,472,692) (3,916,105)
Total Primary Government Net Expense (36,097,725)$ (45,355,073)$ (30,595,043)$ (60,321,475)$

82
City of Council Bluffs Schedule 2 – Changes in Net Position
For the Last Ten Fiscal Years (Accrual Basis of Accounting)
2014 2013 2012 2011 2010 2009
31,070,833$ 30,176,722$ 28,913,039$ 28,501,970$ 26,540,090$ 25,796,311$ 15,609,496 13,994,363 12,088,663 12,492,324 11,298,900 11,071,569
676,455 649,660 516,001 573,385 550,421 563,295 14,374,266 11,472,144 8,733,154 11,915,556 8,348,868 9,504,036 10,386,218 10,053,869 7,809,473 7,816,996 6,801,616 7,514,563 15,094,903 21,785,632 26,117,159 14,435,524 10,959,589 10,555,074 1,600,705 1,320,753 2,057,277 2,119,475 2,158,068 2,611,834
88,812,876 89,453,143 86,234,766 77,855,230 66,657,552 67,616,682
9,085,454 8,511,229 8,468,164 8,325,469 7,231,802 8,560,437 5,394,055 4,953,069 4,895,323 4,652,239 4,518,258 4,386,055
- - - - 67,195 2,500 14,479,509 13,464,298 13,363,487 12,977,708 11,817,255 12,948,992
103,292,385$ 102,917,441$ 99,598,253$ 90,832,938$ 78,474,807$ 80,565,674$
4,042,165$ 3,714,888$ 3,911,323$ 3,783,890$ 4,320,041$ 3,059,464$ 380,451 426,878 259,818 432,461 467,447 927,074 214,352 223,651 106,368 75,729 106,412 51,734
4,480,358 3,735,755 1,176,034 1,366,821 1,525,874 1,467,869 745,089 788,312 785,428 816,575 797,523 853,071
5,095,615 4,351,014 3,686,329 2,888,110 3,575,089 3,448,875 - - - - 108,432 -
11,770,641 10,902,095 22,012,492 12,021,377 10,296,448 11,473,259 3,457,434 3,891,282 11,925,631 10,968,177 10,812,521 22,074,207
30,186,105 28,033,875 43,863,423 32,353,140 32,009,787 43,355,553
4,945,306 5,219,683 5,033,254 5,290,548 5,452,663 5,292,190 5,539,480 5,000,428 5,458,948 5,211,310 4,654,118 4,595,669
- - - - 41,479 28,216 9,691 - - 33,257 247,134 369,002
- 2,182,683 750,000 369,760 - 2,732,966
10,494,477 12,402,794 11,242,202 10,904,875 10,395,394 13,018,043
40,680,582$ 40,436,669$ 55,105,625$ 43,258,015$ 42,405,181$ 56,373,596$
(58,626,771)$ (61,419,268)$ (42,371,343)$ (45,502,090)$ (34,647,765)$ (24,261,129)$ (3,985,032) (1,061,504) (2,121,285) (2,072,833) (1,421,861) 69,051
(62,611,803)$ (62,480,772)$ (44,492,628)$ (47,574,923)$ (36,069,626)$ (24,192,078)$

2018 2017 2016 2015
General Revenue and Other Changes in Net PositionGovernmental Activities
Property tax levied for general purposes 37,232,760$ 36,523,359$ 34,568,770$ 32,682,818$ Property tax levied for debt service 5,965,762 5,821,780 5,840,540 6,109,993 Tax increment financing 4,764,496 3,595,822 4,845,542 5,966,145 Local option sales tax 9,110,364 9,244,522 8,373,886 11,394,035 Hotel motel tax 2,770,278 2,679,842 2,805,846 2,889,262 Gaming wager tax 3,032,676 2,992,120 3,079,108 3,091,006 Other city tax 3,105,127 3,040,308 3,642,031 4,310,624 Commercial/Industrial replacement 1,985,426 1,999,663 2,207,727 1,071,331 Unrestricted investment earnings - - 247,577 294,173 Miscellaneous 979,373 1,434,680 1,810,130 3,402,514 Gain on disposition of capital assets 56,520 2,153 - - Transfers (6,084,302) (5,661,111) (9,076,531) (11,562,737)
Total Governmental Activities 62,918,481 61,673,138 58,344,626 59,649,164
Business-Type ActivitiesLocal option sales tax - - - - Unrestricted investment earnings - - - - Miscellaneous - 7,485 7,065 7,065 Gain on disposition of capital assets 35,718 42,161 32,848 13,932 Transfers 6,084,302 5,661,111 9,076,531 11,562,737
Total Business-Type Activities 6,120,020 5,710,757 9,116,444 11,583,734
Total Primary Government 69,038,501$ 67,383,895$ 67,461,070$ 71,232,898$
Changes in Net PositionGovernmental activities 29,693,503$ 18,469,453$ 31,222,275$ 3,243,794$ Business-type activities 3,247,272 3,559,369 5,643,752 7,667,629
Total Primary Government 32,940,776$ 22,028,822$ 36,866,027$ 10,911,423$

83
City of Council Bluffs Schedule 2 – Changes in Net Position
For the Last Ten Fiscal Years (Accrual Basis of Accounts)
2014 2013 2012 2011 2010 2009
32,503,566$ 31,858,165$ 32,146,836$ 30,867,270$ 29,870,765$ 26,464,281$ 6,327,266 6,940,528 6,706,224 7,006,599 7,210,156 6,804,838 5,466,119 5,251,542 4,780,377 6,058,673 3,223,820 4,983,734 8,921,770 7,911,136 8,410,893 8,589,061 7,024,557 3,540,379 2,679,437 2,539,232 2,579,387 2,269,329 2,200,766 2,263,735 3,125,722 3,539,033 3,695,712 3,670,039 3,821,147 4,199,317 3,490,785 3,463,114 3,646,472 3,543,543 2,700,871 3,174,102
- - - - - - 266,405 238,082 168,082 279,466 341,243 733,812
2,006,609 1,672,512 2,967,288 116,206 91,724 132,778 - - - - - -
(12,428,195) (4,849,233) (4,698,284) (8,802,887) (11,320,521) (4,104,134)
52,359,484 58,564,111 60,402,987 53,597,299 45,164,528 48,192,842
- - - - - 4,646,303 - - - 180 1,423 49,787
2,355 2,355 2,355 10,397 85,790 82,562 5,901 - 2,553 127,138 - 2,445
12,428,195 4,849,233 4,698,284 8,802,887 11,320,521 4,104,134
12,436,451 4,851,588 4,703,192 8,940,602 11,407,734 8,885,231
64,795,935$ 63,415,699$ 65,106,179$ 62,537,901$ 56,572,262$ 57,078,073$
(6,267,287)$ (2,855,157)$ 18,031,644$ 8,095,209$ 10,516,763$ 23,931,713$ 8,451,419 3,790,084 2,581,907 6,867,769 9,985,873 8,954,282
2,184,132$ 934,927$ 20,613,551$ 14,962,978$ 20,502,636$ 32,885,995$

2018 2017 2016 2015General Fund
Unreserved -$ -$ -$ -$ Reserved - - - - Nonspendable 4,238,115 5,698,516 1,259,388 1,739,776 Restricted 1,706,019 4,540,791 5,274,353 3,836,594 Unassigned 17,234,082 13,597,231 14,044,979 15,848,353
Total General Fund 23,178,215$ 23,836,538$ 20,578,720$ 21,424,723$
All Other Governmental FundsReserved -$ -$ -$ -$ Unreserved reported in:
Special revenue funds - - - - Debt service funds - - - - Capital projects funds - - - -
Nonspendable 1,033,556 1,073,586 1,056,630 1,122,907 Restricted 45,876,219 35,577,672 26,798,917 33,420,995 Unassigned (12,983) (267,800) (1,588,060) -
Total All Government Funds 46,896,793$ 36,383,458$ 26,267,487$ 34,543,902$
Total Governmental Funds 70,075,008$ 60,219,996$ 46,846,207$ 55,968,625$
Note: In 2011, the City implemented new accounting presentations under GASB Statement No. 54, Fund Balance Reporting and Governmental Fund Type Definitions, which requires new presentation of fund balances.

84
City of Council Bluffs Schedule 3 – Fund Balances of Governmental Funds
For the Last Ten Fiscal Years (Modified Accrual Basis of Accounting
2014 2013 2012 2011 2010 2009
-$ -$ -$ -$ 2,727,002$ 2,543,090$ - - - - 12,639,788 7,710,769
1,773,540 1,817,606 1,814,002 2,814,123 - - 5,233,950 5,681,823 8,976,226 7,125,557 - -
12,313,458 14,793,480 13,158,934 10,859,733 - - 19,320,948$ 22,292,909$ 23,949,162$ 20,799,413$ 15,366,790$ 10,253,859$
-$ -$ -$ -$ 6,662,488$ 13,998,654$
- - - - 17,211,816 15,814,057 - - - - (271,325) - - - - - (3,673,134) 1,640,977
1,047,663 904,790 1,121,924 1,189,228 - - 26,939,241 32,107,949 26,298,322 23,406,432 - -
(91,975) - (6,134,110) (8,275,436) - - 27,894,929$ 33,012,739$ 21,286,136$ 16,320,224$ 19,929,845$ 31,453,688$
47,215,877$ 55,305,648$ 45,235,298$ 37,119,637$ 35,296,635$ 41,707,547$

2018 2017 2016 2015
RevenuesProperty tax 43,195,224$ 41,921,743$ 40,275,978$ 39,380,229$ Tax increment financing 4,764,496 3,595,822 4,845,542 5,966,145 Other city tax 21,538,534 18,085,806 18,238,768 21,108,930 Licenses and permits 5,773,976 5,169,186 4,317,612 7,092,387 Use of money and property 1,169,285 2,177,534 972,078 928,968 Intergovernmental 22,110,797 28,225,302 31,249,447 17,402,351
Local Grants 7,738,704 Charges for service 6,442,231 7,436,609 8,201,411 7,762,686 Special and drainage assessments 305,146 303,855 304,272 295,971 Miscellaneous 6,244,561 12,918,740 10,544,509 11,410,345
Total 119,282,952 119,834,597 118,949,617 111,348,012
ExpendituresOperating
Public safety 33,135,638 35,412,513 32,951,305 32,591,928 Public works 9,771,341 11,414,463 13,006,548 8,194,438 Health and social services 553,808 583,813 700,896 662,595 Culture and recreation 12,007,442 12,042,346 13,215,594 12,903,068 Community and economic
development 4,793,219 4,881,613 6,739,013 13,099,040 General government 14,571,617 14,364,151 14,764,869 15,889,942
Debt servicePrincipal 16,027,105 7,902,105 12,397,105 12,237,105 Interest 1,615,322 1,468,432 1,797,113 1,724,014 Debt related expense 43,927 124,208 5,511 616,446
Capital projects 41,063,277 27,485,199 31,463,466 19,383,101 Total 133,582,697 115,678,843 127,041,420 117,301,677
Excess (Deficit) of Revenue Over(Under) Expenditures (14,299,745) 4,155,754 (8,091,803) (5,953,665)
Other Financing Sources (Uses)General obligation bonds issued 25,875,000 8,905,000 - 17,715,000 General obligation capital loan notes issued - - - - Premium (discount) on general obligation
bonds/notes issued 1,967,362 313,035 - 591,413 Urban renewal note issued - - - - Term loan note issued - - - - HUD loan proceeds - - - - Sale of capital assets - - - - Capital lease purchase agreement - - - - General obligation bonds/notes refunded 6,270,000 - - - Urban renewal revenue note redeemed - - - - Transfers in 13,962,604 7,076,147 2,444,419 3,386,922 Transfers out (13,844,004) (7,076,147) (2,444,419) (6,986,922)
Total Other Financing Sources (Uses) 34,230,962 9,218,035 - 14,706,413
Net Change in Fund Balances 19,931,216$ 13,373,789$ (8,091,803)$ 8,752,748$
Debt Service as a Percentage of Noncapital Expenditures 19.4% 13.0% 13.6% 12.6%

85
City of Council Bluffs Schedule 4 – Changes in Fund Balances of Governmental Funds
For the Last Ten Fiscal Years (Modified Accrual Basis of Accounting)
2014 2013 2012 2011 2010 2009
38,953,560$ 38,696,748$ 38,829,292$ 37,867,393$ 37,103,962$ 33,308,384$ 5,466,119 5,251,749 4,780,170 6,059,684 3,222,809 4,983,734
18,217,714 17,857,809 17,790,350 17,937,503 15,726,929 13,203,713 4,377,773 4,213,087 3,529,560 3,289,876 3,199,381 3,345,559
870,341 895,147 829,778 922,502 968,615 1,422,391 13,460,987 13,479,981 25,879,633 20,417,261 13,332,409 10,693,866
6,873,760 5,761,464 3,295,521 3,561,999 3,543,339 3,827,025 293,198 292,432 295,695 161,225 341,278 220,241
8,084,758 7,823,739 12,459,968 6,059,423 7,399,559 6,319,096 96,598,210 94,272,156 107,689,967 96,276,866 84,838,281 77,324,009
30,955,660 29,365,778 28,235,501 27,054,108 25,267,311 24,800,095 7,807,055 7,679,021 5,945,192 7,116,807 6,354,312 6,974,369
646,717 609,935 584,156 544,420 524,986 515,800 11,381,218 9,517,123 6,347,573 6,188,577 6,029,643 7,180,312
7,365,202 6,743,807 5,399,216 5,525,461 4,346,981 5,181,333 18,352,414 15,924,535 26,036,435 13,862,324 10,022,944 9,146,234
22,065,526 12,746,667 7,161,667 7,354,755 10,374,393 9,518,793 1,824,213 1,989,654 2,063,224 2,077,776 2,171,805 2,604,476
78,641 275,202 121,321 39,243 85,635 24,157 23,528,484 17,602,500 21,841,438 33,015,979 29,890,156 19,216,601
124,005,130 102,454,222 103,735,723 102,779,450 95,068,166 85,162,170
(27,406,920) (8,182,066) 3,954,244 (6,502,584) (10,229,885) (7,838,161)
7,630,000 14,880,000 3,165,000 7,300,000 3,685,000 9,600,000 - 2,535,000 4,095,000 - - -
315,046 949,057 109,056 (5,981) 60,965 16,484 - - - 14,500,000 - -
11,600,000 - - - - - - - - - - - - - - - - - - - - - - 120,302 - - (3,165,000) - (3,700,000) (2,400,000) - - - (14,326,210) - -
11,490,611 9,028,345 10,910,089 9,870,682 15,429,490 18,290,724 (11,718,508) (9,139,986) (10,952,728) (9,012,905) (14,583,631) (17,400,670) 19,317,149 18,252,416 4,161,417 8,325,586 891,824 8,226,840
(8,089,771)$ 10,070,350$ 8,115,661$ 1,823,002$ (9,338,061)$ 388,679$
20.8% 16.0% 10.5% 11.3% 16.0% 17.1%

Local OptionFiscal Property Sales Hotel Motel Utility ExciseYear Tax Tax Tax Tax
2009 33,269,119$ 8,186,682$ 2,263,735$ 3,195,266$
2010 37,080,921 7,024,557 2,200,766 3,324,177
2011 37,867,393 8,589,061 2,269,329 3,312,717
2012 38,853,060 8,410,893 2,579,387 3,373,996
2013 38,798,693 7,911,136 2,539,232 3,374,122
2014 38,830,832 8,921,770 2,679,437 3,490,785
2015 38,792,811 11,394,035 2,889,262 4,310,624
2016 40,409,310 8,373,886 2,805,846 3,642,031
2017 42,345,139 9,244,522 2,679,842 3,040,308
2018 43,198,522 9,110,364 2,770,278 3,105,127

86
City of Council Bluffs Schedule 5 – Governmental Activities Tax Revenues By Source
For the Last Ten Fiscal Years Year Ended June 30, 2018
Gaming Wager Pari-mutuelTax Wager Tax Total
4,199,317$ 72,282$ 51,186,401$
3,821,147 35,784 53,487,352
3,670,039 96,357 55,804,896
3,695,712 135,659 57,048,707
3,539,033 88,992 56,251,208
3,059,131 66,591 57,048,546
3,007,350 83,656 60,477,738
3,036,726 42,382 58,310,181
2,985,118 7,002 60,301,931
2,995,861 36,815 61,216,968
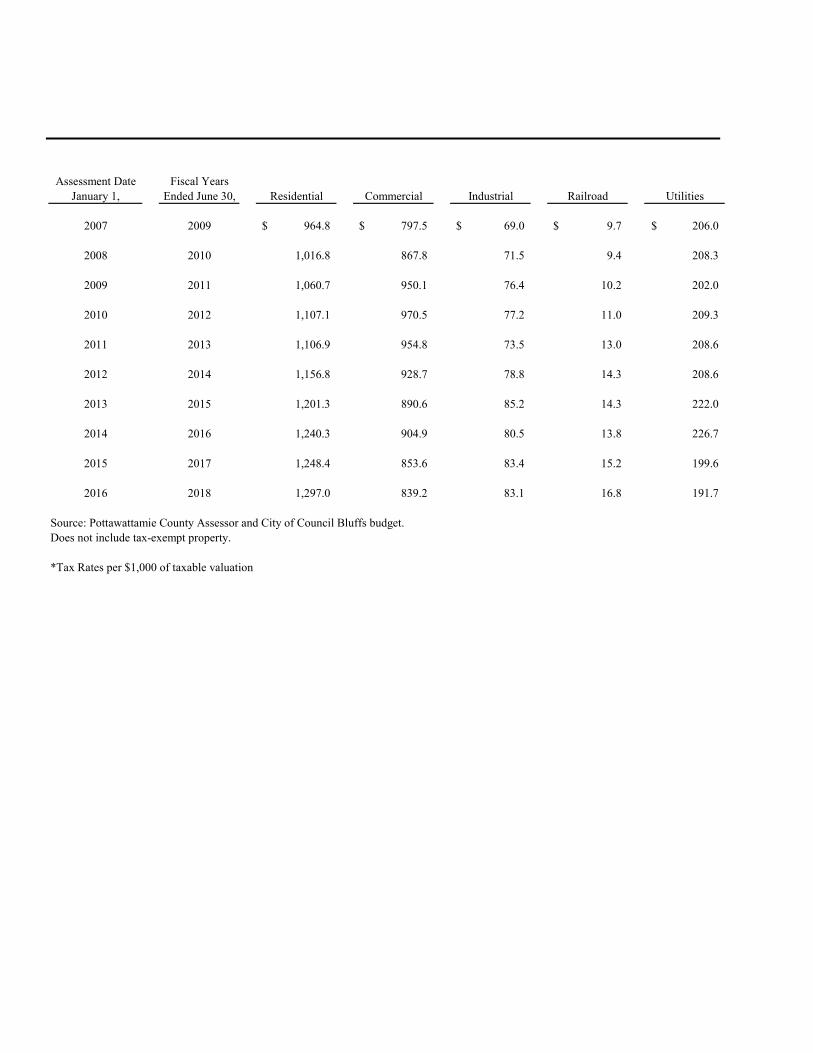
Assessment Date Fiscal YearsJanuary 1, Ended June 30, Residential Commercial Industrial Railroad Utilities
2007 2009 964.8$ 797.5$ 69.0$ 9.7$ 206.0$
2008 2010 1,016.8 867.8 71.5 9.4 208.3
2009 2011 1,060.7 950.1 76.4 10.2 202.0
2010 2012 1,107.1 970.5 77.2 11.0 209.3
2011 2013 1,106.9 954.8 73.5 13.0 208.6
2012 2014 1,156.8 928.7 78.8 14.3 208.6
2013 2015 1,201.3 890.6 85.2 14.3 222.0
2014 2016 1,240.3 904.9 80.5 13.8 226.7
2015 2017 1,248.4 853.6 83.4 15.2 199.6
2016 2018 1,297.0 839.2 83.1 16.8 191.7
Source: Pottawattamie County Assessor and City of Council Bluffs budget.Does not include tax-exempt property.
*Tax Rates per $1,000 of taxable valuation

87
City of Council Bluffs Schedule 6 – Assessed and Taxable Value of Property
For the Last Ten Fiscal Years (Expressed in Millions)
Total Taxable
Total Taxable Total Direct Tax Total Assessed Value as % ofOther Exempt Property Assessed Value Rate * Value Assessed Value
-$ (6.6)$ 2,040.4$ 18.0879$ 4,428.8$ 46.1%
- (6.5) 2,167.3 17.9732 4,142.7 52.3%
- (6.4) 2,293.0 17.8511 4,367.6 52.5%
- (6.3) 2,368.8 17.8511 4,352.6 54.4%
- (6.2) 2,350.6 17.8504 4,253.2 55.3%
1.2 (6.0) 2,382.4 17.7500 4,385.5 54.3%
1.1 (5.9) 2,408.6 17.7500 4,373.8 55.1%
1.1 (5.6) 2,461.7 17.7500 4,598.9 53.5%
1.1 (5.3) 2,396.0 17.7500 4,658.9 51.4%
1.1 (5.1) 2,423.8 17.9072 4,839.0 50.1%

Overlapping
Operating Levy Debt Service Total City Operating Debt Service Total CountyFiscal Years Ended Rate * Levy Rate * Levy Rate * Levy Rate * Levy Rate * Levy Rate *
2009 14.5879$ 3.5000$ 18.0879$ 6.4546$ 0.5352$ 6.9898$
2010 14.5120 3.4612 17.9732 6.4472 0.8319 7.2791
2011 14.7430 3.1081 17.8511 6.4621 0.9279 7.3900
2012 14.9121 2.9390 17.8511 6.5070 0.8674 7.3744
2013 14.8234 3.0270 17.8504 6.6585 0.8595 7.5180
2014 15.0209 2.7291 17.7500 6.8790 0.7878 7.6668
2015 15.1607 2.5893 17.7500 8.0906 0.8342 8.9248
2016 15.3000 2.4500 17.7500 7.7709 0.9203 8.6912
2017 15.5428 2.2072 17.7500 7.5537 0.7932 8.3468
2018 15.5428 2.3644 17.9072 7.5502 0.5956 8.1458
Council BluffsYear Over Year City of Council Pottawattamie Community
Change in Levy Rate Bluffs County Schools
2009 -0.6% 1.0% 0.7%
2010 -0.6% 4.1% 0.0%
2011 -0.7% 1.5% 10.6%
2012 0.0% -0.2% 0.0%
2013 0.0% 1.9% -7.7%
2014 -0.6% 2.0% 0.0%
2015 0.0% 16.4% -0.6%
2016 0.0% -2.6% -1.2%
2017 0.0% -4.0% 0.0%
2018 0.9% -2.4% 0.9%
Source: City of Council Bluffs tax rates from the Iowa Department of Management tax levy certification reports; County Auditor tax levy reports; Pottawattamie County - other overlapping jurisdictions.
* Per $1,000 of taxable valuation
City of Council Bluffs, Iowa Pottawattamie County, Iowa

88
City of Council Bluffs Schedule 7 – Direct and Overlapping Governments
For the Last Ten Fiscal Years Rates
Council Bluffs Community School District
Iowa Western Total Direct &Operating Debt Service Total (CB) School Comm. College Overlapping
Levy Rate * Levy Rate * Levy Rate * and other levies * Levy Rates *
16.1872$ 0.6135$ 16.8007$ 1.2064$ 43.0848$
16.1500 0.6503 16.8003 1.2705 43.3231
18.0591 0.5273 18.5864 1.1381 44.9656
18.0768 0.5084 18.5852 1.1498 44.9605
16.6510 0.5066 17.1576 1.4623 43.9883
16.6658 0.4918 17.1576 1.3611 43.9355
16.5767 0.4809 17.0576 1.5487 45.2811
16.6194 0.2373 16.8567 1.5038 44.8017
16.8569 - 16.8569 1.8869 44.8406
17.0031 - 17.0031 1.7266 44.7827
All Other Total TaxLevies Levy
-7.2% 0.0%
5.3% 0.6%
-10.4% 3.8%
1.0% 0.0%
27.2% -2.2%
-6.9% -0.1%
13.8% 3.1%
-2.9% -1.1%
25.5% 0.1%
-8.5% -0.1%

2018
Taxable Value % of TotalTaxpayer Also Known As 01/01/2017 Rank Taxable Value
Mid American Energy*formally Mid American Production* 138.6$ 1 5.09%
HBR Reality Company, Inc. Horseshoe Casino 69.5 2 2.55%Gable Corp. Google 63.9 3 2.35%Pinnacle Entertainment, Inc. Ameristar Casino 51.8 4 1.90%Harrah's Council Bluffs LLC Harrahs Casino 49.0 5 1.80%W-PT Metro Center Owner VIII LLC Metro Crossing 37.8 6 1.39%Walmart Real Estate Business 32.1 7 1.18%Ootzie Properties-CB LLC Ootzie Properties 24.3 8 0.89%Tetra LLC Google 22.0 9 0.81%Menards Inc. 16.8 10 0.62%Dearborn Properties, LLC Mall of the Bluffs - - - Bass Pro Shops - - - Blue Star Foods ConAgra Foods - - - CBV Limited Ptsp - - - IBP - - - Central Iowa Power Co-Op - - -
Source of 2018 data: Series 2018A - Official Statement dated May 15, 2018Source of 2009 data: Series 2009B - Official Statement dated May 14, 2009

89
City of Council Bluffs Schedule 8 – Principal Area Taxpayers
Current Year and Nine Years Ago (Expressed in Millions)
2009
Taxable Value % of Total01/01/2008 Rank Taxable Value
146.0$ 1 6.74%80.0 2 3.69%
- - - 66.8 3 3.08%54.1 4 2.50%
- - - - - -
- - - - - - -
47.0 5 2.17%29.1 6 1.34%16.6 7 0.77%12.0 8 0.55%11.2 9 0.52%11.0 10 0.51%

Percent of Total % Collected - Assessment Date Fiscal Years Total Tax Tax Collections Trailing Three
of January 1, Ended Total Tax Levy Collections to Tax Levy Years
1/1/2007 2009 37.27$ 36.71$ 98.5% 97.8%
1/1/2008 2010 39.36 39.64 100.7% 99.7%
1/1/2009 2011 41.45 41.19 99.4% 99.5%
1/1/2010 2012 42.79 42.22 98.7% 99.6%
1/1/2011 2013 42.51 42.17 99.2% 99.1%
1/1/2012 2014 42.87 42.44 99.0% 99.0%
1/1/2013 2015 43.35 43.13 99.5% 99.2%
1/1/2014 2016 44.19 44.06 99.7% 99.4%
1/1/2015 2017 45.59 45.18 99.1% 99.4%
1/1/2016 2018 46.47 46.24 99.5% 99.4%
* Taxable valuations can be found in Schedule 6.** Tax Levy Rates can be found in Schedule 7
Note Information not available on delinquent collections by levy year. .

90
City of Council Bluffs Schedule 9 – Property Tax Levies and Collections
For the Last Ten Fiscal Years (Expressed in Millions)
Year Over Year Year Over Year Year Over YearChange in Levied Change In Change in City
Taxes Taxable Valuation * Levy Tax Rate **
8.0% 8.6% -0.6%
5.6% 6.2% -0.6%
5.3% 5.8% -0.7%
3.2% 3.3% 0.0%
-0.7% -0.8% 0.0%
0.8% 1.3% -0.6%
1.1% 1.4% 0.0%
1.9% 1.4% 0.0%
3.2% 2.2% 0.0%
1.9% -2.7% 0.0%

General GeneralFiscal year ended Obligation Obligation Capital Other
June 30, Bonds Notes Leases Debt
2009 46.49$ 9.36$ 0.25$ 15.17$ -$ 0.73$
2010 39.93 6.12 0.14 14.58 - 0.72
2011 43.49 3.00 0.06 14.26 - 0.70
2012 38.02 6.37 - 13.29 - 0.69
2013 41.85 8.17 - 12.33 - 6.68
2014 42.16 6.36 - - 10.99 4.36
2015 46.38 4.11 - - 8.55 9.80
2016 37.31 3.23 - - 6.11 8.38
2017 41.66 2.32 - - 3.66 7.46
2018 61.15 1.40 - - 1.22 6.46
Urban Renewal Term
Loan Note
Governmental Activities
Term Loan Note

91
City of Council Bluffs Schedule 10 – Ratios of Outstanding Debt by Type
For the Last Ten Fiscal Years (Expressed in Millions)
Debt Per CapitaPer Capita Income
-$ -$ 72.00$ 2.72% 1,196$ 41,512
- - 61.49 2.46% 1,021 42,600
- - 61.51 2.32% 988 44,472
- - 58.37 2.10% 934 44,466
- 4.97 56.70 2.68% 1,192 46,575
- 4.78 68.65 2.38% 1,108 48,821
- 4.58 73.42 2.42% 1,179 48,821
0.36 4.38 59.77 1.96% 955 48,821
0.25 4.16 59.51 1.89% 921 50,481
0.14 3.94 74.31 2.29% 1,156 52,066
Percentage of Personal
Income
Revenue Capital
Loan Notes
Business Type Activities
General Obligation
Notes
Total Primary
Government

92
City of Council Bluffs Schedule 11 – Ratios of General Bonded Debt Outstanding
For the Last Ten Fiscal Years (Expressed in Millions)
General Less Amounts Net Net BondedFiscal Years Ended Obligation Available in Bonded Total Taxable Debt as % of Net Bonded
June 30, Bonds/Notes Debt Service Fund Debt Assessed Value Assessed Value Debt per Capita Population
2009 55.85$ 0.72$ 55.13$ 2,040.4$ 2.70% 914$ 60,318
2010 46.05 - 46.05 2,167.3 2.12% 763 60,391
2011 46.49 0.96 45.53 2,292.9 1.99% 732 62,230
2012 44.39 7.13 37.26 2,368.8 1.57% 596 62,466
2013 50.02 4.86 45.16 2,350.6 1.92% 727 62,115
2014 48.52 2.25 46.27 2,382.4 1.94% 747 61,969
2015 50.49 4.78 45.71 2,408.6 1.90% 734 62,245
2016 40.54 0.93 39.61 2,461.5 1.61% 633 62,597
2017 43.98 1.14 42.84 2,547.7 1.68% 685 62,524
2018 62.55 1.51 61.04 2,569.1 2.38% 980 62,316

93
City of Council Bluffs Schedule 12 – Direct and Overlapping Governmental Activities Debt
As of June 30, 2018 (Expressed in Millions)
EstimatedEstimated Share of
Debt Percentage OverlappingOutstanding Applicable Debt
City of Council Bluffs direct debt 72.16$ 100.00% 72.16$
Overlapping:
Pottawattamie County 8 66.7% * 5
Council Bluffs Community Schools 60 89.6% ** 54
Lewis Central Community Schools 2 84.5% ** 2
Iowa Western Community College 105 28.10% *** 29 Subtotal, overlapping debt 175 90
Total direct and overlapping debt 246.79$ 162.32$
Source: Pottawattamie County Auditor
* Percentage of Pottawattamie County residents residing within the City of Council Bluffs.** Calculated as the number of resident students within the district divided by the district's certified enrollment.*** Percentage of residents within Iowa Western Community College's district who reside within the City of Council Bluffs. The college's district includes the following counties: Adair, Adams, Audubon, Cass, Crawford, Fremont, Harrison, Mills, Monona, Montgomery, Page, Pottawattamie, and Shelby.
into account. However, this does not imply that every taxpayer is a resident, and thereforeresponsible for repaying the debt, of each overlapping government.
Governmental Unit
Note: Overlapping governments are those that coincide, at least in part, with the geographicboundaries of the City. This schedule estimates the portion of the outstanding debt of thoseoverlapping governments that is borne by the residents and businesses of the City of CouncilBluffs. This process recognizes that, when considering the City's ability to issue and repaylong-term debt, the entire debt burden borne by the residents and businesses should be taken

2018 2017 2016 2015
Debt Limit 241.95$ 232.95$ 229.94$ 218.69$
Total Net Debt applicable to limit 67.59 52.53 51.96 60.88
Legal Debt Margin 174.36$ 180.42$ 177.98$ 157.81$
Total Net Debt Applicable to the Limit as a Percentage of Debt Limit 27.9% 22.5% 22.6% 27.8%
Note: Under the State of Iowa Constitution, a City's outstanding general obligation debt shall not exceed 5% of total assessed property value

94
City of Council Bluffs Schedule 13 – Legal Debt Margin Information
For the Last Ten Fiscal Years (Expressed in Millions)
2014 2013 2012 2011 2010 2009
219.27$ 212.66$ 217.63$ 218.89$ 207.13$ 221.44$
73.31 79.22 69.33 81.30 70.59 79.26
145.96$ 133.44$ 148.30$ 137.59$ 136.54$ 142.18$
33.4% 37.3% 31.9% 37.1% 34.1% 35.8%
Legal Debt Margin Calculation for Fiscal Year 2018
Actual Assessed valuation as of January 1, 2016 4,839.01$ Debt Limit - 5% of assessed valuation 241.95 Debt applicable to debt limit: General obligation bonds/notes 62.54 Settlement agreement 1.79 Term Loan Note 1.22 Tax increment indebtedness 4.25 Balance in Debt Service Fund (1.15) Balance in Special Revenue, Tax Increment Financing Fund (1.06)
Total net debt applicable to limit 67.59 Legal Debt margin 174.36$

95
City of Council Bluffs Schedule 14 – Pledged Revenue Coverage
For the Last Ten Fiscal Years (Expressed in Thousands)
Urban Renewal Term Loan and Term Loan Notes:
Less:Applicable Net Revenue Debt
Fiscal Gross Operating Available for ServiceYear Revenue Expenses Debt Service Requirements Coverage
2009 1,621 1,120 501 986 0.50812010 1,972 1,129 843 800 1.05382011 2,112 1,417 695 731 0.95082012 2,634 1,343 1,291 1,295 0.99692013 2,378 1,145 1,233 1,268 0.97242014 2,683 1,147 1,536 1,601 0.95942015 3,914 1,168 2,746 2,669 1.02902016 3,850 2,087 1,763 2,623 0.67212017 4,164 734 3,430 2,582 1.32842018 3,758 651 3,107 2,533 1.2266
Note: Details regarding the City's outstanding urban renewal capital loan and term loan note debt can be found in Note 4 of the notes to financial statements. Gross revenue includes both operating and non-operating revenue and transfers from the City of Council Bluffs. Operating expenses do not include interest expense or depreciation.
Sewer Revenue Capital Loan Notes:
Less:Applicable Net Revenue Debt
Fiscal Gross Operating Available for ServiceYear Revenue Expenses Debt Service Requirements Coverage
2013 4,945$ 5,645$ (700)$ 342$ -
2015 5,141 5,742 (601) 343 -
2016 5,955 5,820 135 344 0.3924
2017 6,514 5,028 1,486 344 4.3198
2018 6,934 6,038 896 344 2.6047
Note: Details regarding the City's outstanding sewer revenue capital loan notes can be found in Note 4 of the notes to financial statements. Gross revenue includes operating revenue. Operating expenses exclude depreciation.
The City had no sewer revenue debt prior to fiscal year 2013.

(This page left blank intentionally.)

PersonalIncome Council Bluffs
Per Capita (Expressed Median Unemployment SchoolYear Population Personal Income in millions) Age Rate Enrollment
2008 60,318 43,984$ 2,653$ 35.6 3.6% 9,296
2009 60,391 41,512 2,507 35.6 5.1% 9,212
2010 62,230 42,600 2,651 35.9 5.2% 9,207
2011 62,466 44,472 2,778 37.5 5.0% 9,125
2012 62,115 44,466 2,762 37.5 4.5% 8,945
2013 61,969 46,575 2,886 36.1 4.3% 8,996
2014 62,245 48,821 3,039 36.7 3.0% 9,101
2015 62,597 48,821 3,056 36.7 3.3% 9,126
2016 62,524 50,481 3,156 37.9 3.0% 9,257
2017 62,316 53,613 3,341 36.8 2.9% 9,125
Sources: Population Data: 2010 to 2017 data from United States Census Bureau - (quickfacts.census.gov)Population Data: 2008 to 2009 data from United States Census Bureau - (Quicklinks - Population Estimates (quickfacts.census.gov)Personal Income Data: Per capita for Omaha - Council Bluffs Metropolitan Area - Saint Louis Federal Reserve Bank Economic Research (research.stlouisfed.org)Median Age - City-data.comUnemployment Rate Data: Omaha - Council Bluffs Metropolitan Area - Saint Louis Federal Reserve Bank Economic Research (research.stlouisfed.org)School Enrollment Data: Certified Enrollment per Iowa Department of Education (educateiowa.gov)

96
City of Council Bluffs Schedule 15 – Demographic and Economic Statistics
For the Last Ten Calendar Years
Lewis Central CombinedSchool School
Enrollment Enrollment
2,559 11,855
2,582 11,794
2,586 11,793
2,613 11,738
2,596 11,541
2,550 11,546
2,560 11,661
2,587 11,713
2,495 11,751
2,476 11,601

2018
Full Time Equivalent % of Total CityEmployer Employees Rank Employment (1)
Council Bluffs Community Schools 1,250 1 4.0%Tyson Fresh Meats 1,200 2 3.8%Harrah's Casino 920 3 2.9%Ameristar Casino and Hotel 850 4 2.7%Jennie Edmundson Memorial Hospital 840 5 2.7%ConAgra Frozen Foods 800 6 2.5%Iowa Western Community College 625 7 2.0%City of Council Bluffs 474 8 1.5%Walmart 450 9 1.4%JBS USA Foods 450 10 1.4%Horseshoe Casino/Harrah's Entertainment 0.0%Alegent Health/Mercy Hospital 0.0%Pottawattamie County 0.0%Griffin Pipe Products 0.0%
(1) Based on resident total employment of 31,400 per the Iowa Department of Workforce Development, Labor Market Department(2) Based on resident total employment of 30,000. per the Iowa Department of Workforce Development, Labor Market DepartmentSource of 2018 data: Series 2018A - Official Statement dated May 15, 2018. Source of 2009 data: Series 2009B - Official Statement dated May 14, 2009.

97
City of Council Bluffs Schedule 16 – Principal Area Employers
Current Year and Nine Years Ago
2009
% of Total CityEmployees Rank Employment (2)
1,175 3 3.9%1,280 2 4.3%
734 9 2.4%1,025 4 3.4%
900 6 3.0%825 8 2.8%
1,325 1 4.4%450 12 1.5%610 10 2.0%
- 14 0.0%960 5 3.2%862 7 2.9%458 11 1.5%450 12 1.5%

98
City of Council Bluffs Schedule17 – Full Time Equivalent City Government Employees by Function/Program
For the Last Ten Years Function/Program 2018 2017 2016 2015 2014 2013 2012 2011 2010 2009
Public Safety Police 136.25 133.50 133.50 135.8 142.2 142.2 140.3 137.9 139.3 137.9 Fire 107.00 109.00 109.00 106.0 107.9 107.7 107.9 107.7 109.9 100.0 Animal Control 5.60 4.85 4.85 5.9 6.3 6.7 7.1 7.3 7.8 5.8 Building Inspections 12.00 10.00 10.00 8.0 7.1 7.0 6.7 7.0 5.9 8.0
Public Works 63.25 62.25 64.25 56.0 54.3 54.4 54.4 55.1 54.4 65.7
Health and Social Services 3.00 6.00 7.00 8.0 6.2 6.0 5.9 6.1 6.4 5.7
Culture and Recreation Library 22.00 21.75 22.00 26.0 24.1 24.0 22.6 23.1 23.1 23.0 Parks and Recreation 18.00 21.00 20.00 24.0 23.5 28.5 28.3 27.5 27.4 23.7
Community and Economic Development 8.00 9.00 9.00 9.0 9.0 9.0 9.3 10.5 10.4 9.5
General Government Mayor's Office 5.00 5.00 6.00 5.0 2.0 2.1 2.0 2.0 2.1 2.0 City Clerk, Finance & Treasurer 11.45 12.45 18.45 19.4 19.3 21.3 21.5 21.5 21.5 20.6 Information Technology* 9.00 10.00 City Attorney 4.00 5.00 6.00 6.0 6.7 5.6 5.8 6.0 6.3 7.6 Human Resources 5.00 5.00 5.00 4.0 2.6 3.0 3.0 3.0 3.1 3.0 Building Maintenance 7.00 7.80 5.80 5.8 5.8 5.6 6.3 6.3 5.8 5.0
Business Type Activity Sewer Operations 40.00 41.00 40.00 49.0 51.0 51.6 52.4 51.4 50.1 52.3 Sanitation and Recycling 11.00 11.00 12.00 10.0 12.7 12.3 12.4 12.4 11.5 12.4
Total Full Time Equivalents 467.55 474.60 472.9 477.9 480.7 487.0 485.9 484.8 485.0 482.2
Data is based on amounts budgeted annually.Source of 2009 data: City of Council Bluffs annual budget package.Source of 2010-2014 data: City of Council Bluffs payroll recordsSource of 2015-2018 data: City of Council Bluffs Human Resource DepartmentData for years 2009 is based on budgeted FTE equivalents, which does not include overtime hours.Data for years 2010-2018 is based on total hours worked, which includes overtime hours.* Information Technology reported with City Clerk, Finance & Treasurer prior to 2017

(This page left blank intentionally.)

2017 2016 2015 2014
Public Safety Police Traffic accidents 2,136 1,976 2,005 1,999 Traffic citations 7,910 7,684 6,923 8,372 Traffic warnings 3,690 3,550 2,533 2,953 Parking violations 2,289 3,925 3,884 2,383 Cases 1,833 1,910 1,823 1,636 Arrests and charges 4,293 5,030 5,254 5,197
Fire Fire responses 234 284 270 310 Medical responses 7,294 6,919 6,359 6,135 HazMat responses 324 201 188 186 False alarms 514 585 592 492 Mutual aid responses 60 46 33 46 Other responses 377 430 1,415 1,096 Total responses 8,803 8,465 8,857 8,265
Responses per day 24.1 23.2 24.3 22.6
Fire Department average response time 4 min. 47 sec. 4 min. 53 sec. 5 min. 6 sec. 5 min. 23 sec.
Building Inspections: Permits issued 3,100 3,046 4,734 5,672 Value of permits (millions) 325.9 132.0 156.8 329.1
Culture and Recreation Library: Attendance 304,150 279,006 320,838 344,422 Circulation 426,476 1,016,908 538,555 573,557 Collection size 224,417 202,362 149,502 154,705 Registered borrowers 46,008 41,830 46,899 46,454 Meeting room use by community organizations 729 584 570 234 Reference questions 54,685 56,553 44,749 41,357
Attendance per day 869 790 912 944 Circulation per day 1,218 2,881 1,530 1,571
Function/Program
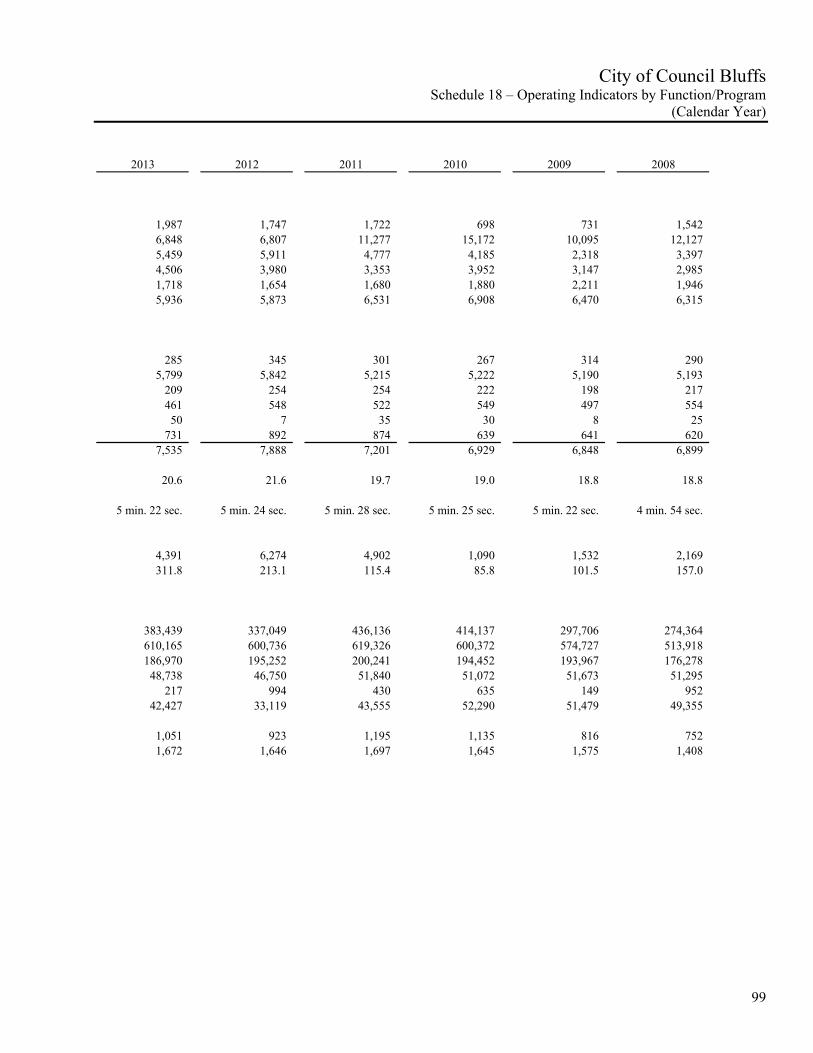
99
City of Council Bluffs Schedule 18 – Operating Indicators by Function/Program
(Calendar Year)
2013 2012 2011 2010 2009 2008
1,987 1,747 1,722 698 731 1,542 6,848 6,807 11,277 15,172 10,095 12,127 5,459 5,911 4,777 4,185 2,318 3,397 4,506 3,980 3,353 3,952 3,147 2,985 1,718 1,654 1,680 1,880 2,211 1,946 5,936 5,873 6,531 6,908 6,470 6,315
285 345 301 267 314 290 5,799 5,842 5,215 5,222 5,190 5,193
209 254 254 222 198 217 461 548 522 549 497 554 50 7 35 30 8 25
731 892 874 639 641 620 7,535 7,888 7,201 6,929 6,848 6,899
20.6 21.6 19.7 19.0 18.8 18.8
5 min. 22 sec. 5 min. 24 sec. 5 min. 28 sec. 5 min. 25 sec. 5 min. 22 sec. 4 min. 54 sec.
4,391 6,274 4,902 1,090 1,532 2,169 311.8 213.1 115.4 85.8 101.5 157.0
383,439 337,049 436,136 414,137 297,706 274,364 610,165 600,736 619,326 600,372 574,727 513,918 186,970 195,252 200,241 194,452 193,967 176,278 48,738 46,750 51,840 51,072 51,673 51,295
217 994 430 635 149 952 42,427 33,119 43,555 52,290 51,479 49,355
1,051 923 1,195 1,135 816 752 1,672 1,646 1,697 1,645 1,575 1,408

2017 2016 2015 2014Parks and recreation participation Golf complex attendance 29,142 28,965 48,129 33,527 Swimming pool attendance 44,793 50,253 46,332 50,542 Youth softball teams 131 121 108 111 Adult softball teams 89 90 91 102 Tournaments conducted 29 19 18 18 Youth soccer teams - - - 6 Youth football teams - 19 21 19 Bayliss Park concerts 9 12 10 25 Bayliss Park movies series 8 10 8 11
Zoning Board of Adjustments Regular meetings 7 9 9 11 Variance 7 5 6 13 Conditional Use Permit 7 10 4 7 Conditional Use Permit Revocation 1 2 5 - Administrative Appeal - 1 1 1 Total meetings and cases 22 27 25 32
Historic Preservation Commission Regular Meetings 4 7 6 4 HP Design Review 5 12 10 4 Total meetings and cases 9 19 16 8
Administrative Actions Lot Line Adjustments 12 14 17 6 Parcel Splits 2 7 4 7 Offers to Buy City Property 8 20 10 5 Zoning Compliants Investigated 110 241 106 97 Review of Existing CU Permits - 143 91 55 Total administrative actions 132 425 228 170

100
City of Council Bluffs Schedule 18 – Operating Indicators by Function/Program
(continued)
2013 2012 2011 2010 2009 2008
48,789 44,370 40,000 90,460 - - 55,752 55,385 58,080 57,794 - -
105 110 131 98 - - 101 106 91 110 - - 17 19 32 34 - - 8 12 - 378 - -
21 22 29 31 - - 23 14 16 10 - - 11 11 10 10 - -
12 8 7 7 10 6 5 9 9 8 9 3 8 6 7 3 4 6 2 1 10 2 28 33 - - - - 1 -
27 24 33 20 52 48
6 4 6 9 8 9 5 7 5 10 16 15
11 11 11 19 24 24
15 7 18 16 12 20 2 3 4 3 5 1 6 13 7 7 6 9
145 208 234 159 195 236 - - - 147 150 154
168 231 263 332 368 420

City Planning Commission 2017 2016 2015 2014 Regular meetings 12 7 11 10 Subdivisions (Prelim, Final, Replat) 4 2 11 17 Planned Commercial 2 1 4 2 Planned Residential 2 3 1 - Zoning Text Amendments 6 - 2 2 Subdivision Text Amendments - - - - Rezoning 7 7 20 12 Street & Alley Vacations 7 8 10 8 Historic Preservation - - - - Miscellaneous Cases 1 1 3 5 Urban Renewal - 2 2 3 Urban Revitalization 2 2 2 4 Annexation 1 - 1 1 Comp Plan Amendments - - 2 - Appeals - - - 1 Right-of-Way Encroachemnts - - - 1 Temporary Use Permits 7 5 7 7 Total CPC Meetings and Cases 51 38 76 73
Sewer Sewer system customers 20,709 20,503 21,603 21,842
Commisison and Board meetings - City of Council Bluffs Planning and Community Development Department records Sewer - Council Bluffs Water Works
Note: Beginning year 2014, all data presented on a calendar year basis. Prior to 2014, Library was reported on fiscal year basis.
Data not presented was not readily available
Library - City's information filings to the State Library of Iowa
observations of attendance for Bayliss Park Events
Police - Reports published annually by the Council Bluffs Police Department and New World Software DatabaseFire - Data maintained by the Council Bluffs Fire Department and filed annually with the State
of Iowa Fire Marshall, National Fire Protection Agency, and National Fire AssociationBuilding - Council Bluffs Building Department's "Blue Prince", an information gathering system
Parks - Internal operating records based on registration data, point of sale system data, and
Sources:

101
City of Council Bluffs Schedule 18 – Operating Indicators by Function/Program
(continued)
2013 2012 2011 2010 2009 200810 9 9 10 10 11 2 - 3 3 6 6 3 2 - 1 1 6 - 1 1 - - 6 5 3 3 8 2 1 3 - - - - -
11 6 9 12 9 15 9 6 2 10 8 10 1 - - - - - - - - 3 4 4 - - - 3 2 2 1 - - 4 - - - 1 - 2 1 1 1 - - 1 - - 1 - - 1 - - - - - 1 1 - - - - 2 - -
47 28 27 61 44 62
20,428 20,386 21,499 - - -

2018 2017 2016 2015 2014
Public Safety Police Stations 1 1 1 1 1
Fire/Ambulance Stations 5 5 5 5 5 Engines in service 5 5 5 5 4 Quints in service 2 2 2 2 3 Ambulances in service 3 3 3 3 3 Special use apparatus 6 6 6 6 6
Public Works Miles of streets - paved 310 303 303 301 301 Miles of streets - unpaved 3 3 1 1 1 Miles of Federal levees 28 28 28 28 28 Street lights 4,700 * 4,700 * 4,700 * 4,698 4,599 Intersections with traffic signals 95 95 95 95 95 Pedestrian crossings with signals 13 13 13 13 13
Culture & Recreation City parks 39 39 39 30 39 Historic monuments 11 11 11 11 11 Football fields 5 5 5 5 5 Golf courses 2 2 2 2 2 Swimming pools 2 2 2 2 2 Soccer fields 23 23 23 23 23 Baseball diamonds 20 20 20 20 20 Tennis courts 13 13 13 15 16 Skate parks 2 2 2 2 2 Trails (miles) 43 43 42 41 40 Library buildings 1 1 1 1 1
Sewer Miles of sanitary sewer 281 281 281 281 281
* 999 street lights within Council Bluffs are owned by the City of Council Bluffs and 3,701 are owned by Mid-American Energy, but operated by the City.
Sources: Police - Reports published annually by the Council Bluffs Police Department Fire - Data maintained by the Council Bluffs Fire Department and filed annually with the State of Iowa Fire Marshall, National Fire Protection Agency, and National Fire Association. Parks - Internal operating records based on registration data, point of sale system data. Data not presented was not readily available
Function/Program

102
City of Council Bluffs Schedule 19 – Capital Asset Statistics by Function/Program
For the Last Ten Years
2013 2012 2011 2010 2009
1 1 1 1 1
5 5 5 5 5 4 4 4 4 4 3 3 3 3 3 3 3 3 3 3 6 6 6 6 6
301 301 297 - - 1 1 1 - -
28 28 28 - - 4,309 4,207 4,000 - -
94 94 94 - - 14 14 14 - -
39 26 26 26 - 11 10 10 10 -
5 4 4 4 - 2 2 2 2 - 2 2 2 2 -
23 23 23 23 - 20 20 20 20 - 16 15 15 15 -
2 2 2 2 - 40 37 37 40 -
1 1 1 1 1
279 279 274 - -

(This page left blank intentionally.)

Information Provided to Comply with Governmental Auditing Standards and the Uniform Guidance June 30, 2018
City of Council Bluffs

What inspires you, inspires us. | eidebailly.com1545 Associates Dr., Ste. 101 | Dubuque, IA 52002-2299 | T 563.556.1790 | F 563.557.7842 | EOE
103
Independent Auditor’s Report on Internal Control over Financial Reporting and on Compliance and Other Matters Based on an Audit of Financial Statements
Performed in Accordance with Government Auditing Standards To the Honorable Mayor and Members of City Council City of Council Bluffs, Iowa We have audited, in accordance with auditing standards generally accepted in the United States of America and the standards applicable to financial audits contained in Government Auditing Standards, issued by the Comptroller General of the United States, the financial statements of the governmental activities, the business-type activities, the aggregate discretely presented component units, each major fund, and the aggregate remaining fund information of the City of Council Bluffs, Iowa, (City) as of and for the year ended June 30, 2018, and the related notes to the financial statements, which collectively comprise the City’s basic financial statements, and have issued our report thereon dated December 5, 2018. Other auditors audited the financial statements of the Council Bluffs Airport Authority (presented as a discretely presented component unit), as described in our report on the financial statements. This report does not include the results of the other auditors’ testing of internal control over financial reporting on compliance and other matters that are reported on separately by those auditors. Internal Control over Financial Reporting In planning and performing our audit of the financial statements, we considered the City's internal control over financial reporting (internal control) to determine the audit procedures that are appropriate in the circumstances for the purpose of expressing our opinions on the financial statements, but not for the purpose of expressing an opinion on the effectiveness of the City’s internal control. Accordingly, we do not express an opinion on the effectiveness of the City’s internal control. Our consideration of internal control over financial reporting was for the limited purpose described in the preceding paragraph and was not designed to identify all deficiencies in internal control over financial reporting that might be material weaknesses or significant deficiencies and therefore, material weaknesses or significant deficiencies may exist that have not been identified. However, as described in the accompanying schedule of findings and questioned costs, we identified a certain deficiency in internal control that we consider to be a material weakness.

104
A deficiency in internal control exists when the design or operation of a control does not allow management or employees, in the normal course of performing their assigned functions, to prevent, or detect and correct, misstatements on a timely basis. A material weakness is a deficiency, or a combination of deficiencies, in internal control, such that there is a reasonable possibility that a material misstatement of the entity’s financial statements will not be prevented, or detected and corrected on a timely basis. We consider the deficiency, described as item 2018-A in the accompanying schedule of findings and questioned costs, to be a material weakness. A significant deficiency is a deficiency, or a combination of deficiencies, in internal control that is less severe than a material weakness, yet important enough to merit attention by those charged with governance. Compliance and Other Matters As part of obtaining reasonable assurance about whether the City's financial statements are free from material misstatement, we performed tests of its compliance with certain provisions of laws, regulations, contracts, and grant agreements, noncompliance with which could have a direct and material effect on the determination of financial statement amounts. However, providing an opinion on compliance with those provisions was not an objective of our audit, and accordingly, we do not express such an opinion. The results of our tests disclosed no instances of noncompliance or other matters that are required to be reported under Government Auditing Standards. Comments involving statutory and other legal matters about the City’s operations for the year ended June 30, 2018, are based exclusively on knowledge obtained from procedures performed during our audit of the financial statements of the City and are reported in Part IV of the accompanying schedule of findings and questioned costs. Since our audit was based on tests and samples, not all transactions that might have had an impact on the comments were necessarily audited. The comments involving statutory and other legal matters are not intended to constitute legal interpretations of those statutes. City’s Responses to Findings The City’s responses to the findings identified in our audit are described in the accompanying schedule of findings and questioned costs. The City’s responses were not subjected to the auditing procedures applied in the audit of the financial statements and, accordingly, we express no opinion on them. Purpose of this Report The purpose of this report is solely to describe the scope of our testing of internal control and compliance and the results of that testing, and not to provide an opinion on the effectiveness of the City’s internal control or on compliance. This report is an integral part of an audit performed in accordance with Government Auditing Standards in considering the entity’s internal control and compliance. Accordingly, this communication is not suitable for any other purpose.
Dubuque, Iowa December 5, 2018

What inspires you, inspires us. | eidebailly.com1545 Associates Dr., Ste. 101 | Dubuque, IA 52002-2299 | T 563.556.1790 | F 563.557.7842 | EOE
105
Independent Auditor’s Report on Compliance for Each Major Federal Program and Report on Internal Control over Compliance Required by the Uniform Guidance
To the Honorable Mayor and Members of the City Council City of Council Bluffs, Iowa Report on Compliance for Each Major Federal Program We have audited the City of Council Bluffs, Iowa’s (City) compliance with the types of compliance requirements described in the OMB Compliance Supplement that could have a direct and material effect on each of the City’s major federal programs for the year ended June 30, 2018. The City’s major federal programs are identified in the summary of auditor’s results section of the accompanying schedule of findings and questioned costs. Management’s Responsibility Management is responsible for compliance with federal statutes, regulations, and the terms and conditions of its federal awards applicable to its federal programs. Auditor’s Responsibility Our responsibility is to express an opinion on the compliance for each of the City’s major federal programs based on our audit of the types of compliance requirements referred to above. We conducted our audit of compliance in accordance with auditing standards generally accepted in the United States of America; the standards applicable to financial audits contained in Government Auditing Standards, issued by the Comptroller General of the United States; and the audit requirements of Title 2 U.S. Code of Federal Regulations Part 200, Uniform Administrative Requirements, Cost Principles, and Audit Requirements for Federal Awards (Uniform Guidance). Those standards and the Uniform Guidance require that we plan and perform the audit to obtain reasonable assurance about whether noncompliance with the compliance requirements referred to above that could have a direct and material effect on a major federal program occurred. An audit includes examining, on a test basis, evidence about the City’s compliance with those requirements and performing such other procedures as we considered necessary in the circumstances. We believe that our audit provides a reasonable basis for our opinion on compliance for each major federal program. However, our audit does not provide a legal determination of the City’s compliance.

106
Opinion on Each Major Federal Program In our opinion, the City complied, in all material respects, with the types of compliance requirements referred to above that could have a direct and material effect on each of its major federal programs for the year ended June 30, 2018. Report on Internal Control over Compliance Management of the City is responsible for establishing and maintaining effective internal control over compliance with the compliance requirements referred to above. In planning and performing our audit of compliance, we considered the City’s internal control over compliance with the types of requirements that could have a direct and material effect on each major federal program to determine the auditing procedures that are appropriate in the circumstances for the purpose of expressing an opinion on compliance for each major federal program and to test and report on internal control over compliance in accordance with the Uniform Guidance, but not for the purpose of expressing an opinion on the effectiveness of internal control over compliance. Accordingly, we do not express an opinion on the effectiveness of the City’s internal control over compliance. A deficiency in internal control over compliance exists when the design or operation of a control over compliance does not allow management or employees, in the normal course of performing their assigned functions, to prevent, or detect and correct, noncompliance with a type of compliance requirement of a federal program on a timely basis. A material weakness in internal control over compliance is a deficiency, or a combination of deficiencies, in internal control over compliance, such that there is a reasonable possibility that material noncompliance with a compliance requirement will not be prevented, or detected and corrected, on a timely basis. A significant deficiency in internal control over compliance is a deficiency, or a combination of deficiencies, in internal control over compliance with a type of compliance requirement of a federal program that is less severe than a material weakness in internal control over compliance, yet important enough to merit attention by those charged with governance. Our consideration of internal control over compliance was for the limited purpose described in the first paragraph of this section and was not designed to identify all deficiencies in internal control that might be material weaknesses or significant deficiencies and therefore, material weaknesses and significant deficiencies may exist that have not been identified. We did not identify any deficiencies in internal control over compliance that we consider to be material weaknesses. However, we identified a certain deficiency in internal control over compliance, as described in the accompanying schedule of findings and questioned costs as item 2018-001 that we consider to be a significant deficiency.
The City’s response to the internal control over compliance finding identified in our audit is described in the accompanying schedule of findings and questioned costs. The City’s response was not subjected to the auditing procedures applied in the audit of compliance and, accordingly, we express no opinion on the response.
The purpose of this report on internal control over compliance is solely to describe the scope of our testing of internal control over compliance and the results of that testing based on the requirements of the Uniform Guidance. Accordingly, this report is not suitable for any other purpose.
Dubuque, Iowa December 5, 2018

107
City of Council Bluffs Schedule of Expenditures of Federal Awards
Year Ended June 30, 2018
Pass- Through
Federal Entity Amounts Passed-Federal Grantor/Pass-Through CFDA Identifying Through toGrantor/Program or Cluster Title Number Number Expenditures Subrecipients
U.S. Department of Housing and Urban Development:Direct Program:
CDBG - Entitlement Grants Cluster:Community Development Block Grants/ 14.218
Entitlement Grants 135,544$ 17,550$ Community Development Block Grants/ 14.218
Entitlement Grants 4,918 - Community Development Block Grants/ 14.218
Entitlement Grants 92,118 - Community Development Block Grants/ 14.218
Entitlement Grants 637,024 133,137 Total U.S. Department of Housing and Urban Development: 869,604 150,687
U.S. Department of Justice:Direct Program:
Joint Law Enforcement Operations Program 16.111 5,743 - Joint Law Enforcement Operations Program 16.111 8,400 - Joint Law Enforcement Operations Program 16.111 4,848 -
18,991 - Bulletproof Vest Partnership Program 16.607 358 -
Pass-Through Program From:Governor's Office of Drug Control Policy:
Edward Byrne Memorial Justice AssistanceGrant Program 16.738 15-JAG-
195932 63,762 21,749 Total U.S. Department of Justice: 83,111 21,749
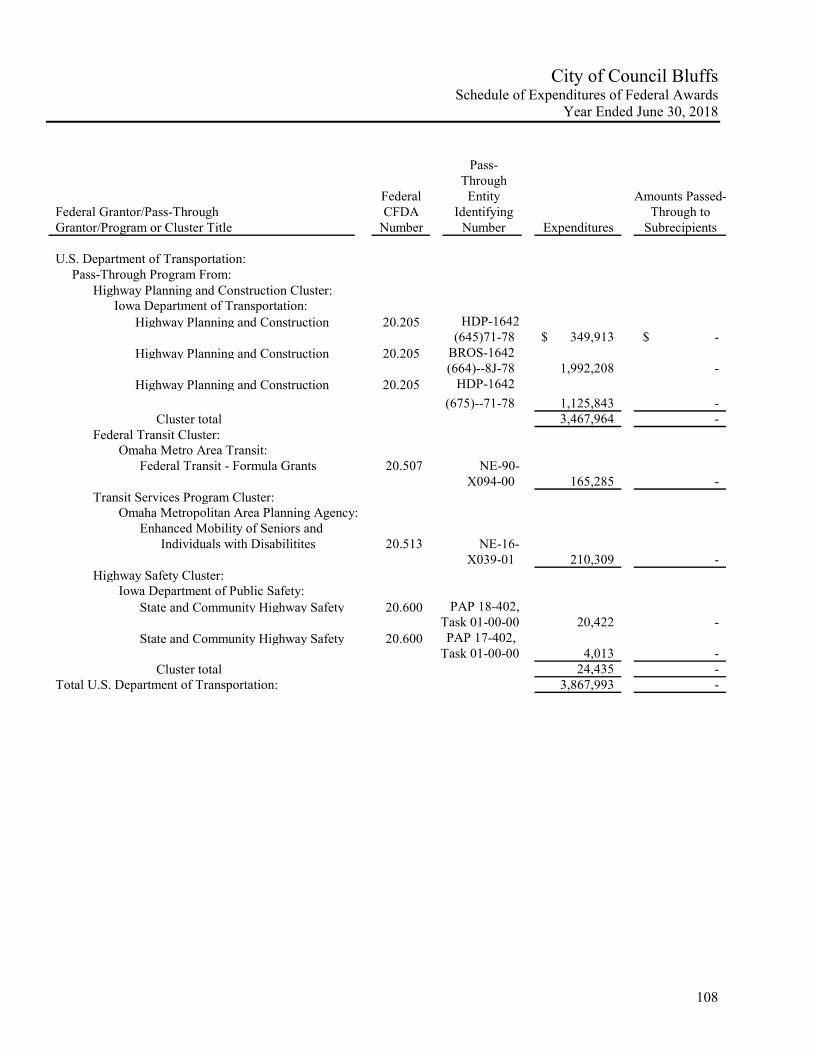
108
City of Council Bluffs Schedule of Expenditures of Federal Awards
Year Ended June 30, 2018
Pass- Through
Federal Entity Amounts Passed-Federal Grantor/Pass-Through CFDA Identifying Through toGrantor/Program or Cluster Title Number Number Expenditures Subrecipients
U.S. Department of Transportation:Pass-Through Program From:
Highway Planning and Construction Cluster:Iowa Department of Transportation:
Highway Planning and Construction 20.205 HDP-1642 (645)71-78 349,913$ -$
Highway Planning and Construction 20.205 BROS-1642(664)--8J-78 1,992,208 -
Highway Planning and Construction 20.205 HDP-1642
(675)--71-78 1,125,843 - Cluster total 3,467,964 -
Federal Transit Cluster:Omaha Metro Area Transit:
Federal Transit - Formula Grants 20.507 NE-90- X094-00 165,285 -
Transit Services Program Cluster:Omaha Metropolitan Area Planning Agency:
Enhanced Mobility of Seniors and Individuals with Disabilitites 20.513 NE-16-
X039-01 210,309 - Highway Safety Cluster:
Iowa Department of Public Safety:State and Community Highway Safety 20.600 PAP 18-402,
Task 01-00-00 20,422 - State and Community Highway Safety 20.600 PAP 17-402,
Task 01-00-00 4,013 - Cluster total 24,435 -
Total U.S. Department of Transportation: 3,867,993 -

109
City of Council Bluffs Schedule of Expenditures of Federal Awards
Year Ended June 30, 2018
Pass- Through
Federal Entity Amounts Passed-Federal Grantor/Pass-Through CFDA Identifying Through toGrantor/Program or Cluster Title Number Number Expenditures Subrecipients
U.S. Department of Health and Human Services:Pass-Through Program From:
Iowa Department of Public Health:Immunization Cooperative Agreements 93.268 5886I420 14,790$ -$
Centers for Disease Control and Prevention - Investigations and Technical Assistance 93.283 MOU-2018-
ELC03 3,600 - HIV Prevention Activities - Health
Department Based 93.940 2018-588 AP05 62,625 16,017
HIV Prevention Activities - Health Department Based 93.940 2017-5886
AP05 41,781 - 104,406 16,017
Total U.S. Department of Health and Human Services: 122,796 16,017
U.S. Executive Office of the President:Direct program:
High Intensity Drug Trafficking Areas Program 95.001 286 -
High Intensity Drug Trafficking Areas Program 95.001 28,528 -
High Intensity Drug Trafficking Areas Program 95.001 4,450 -
Total U.S. Executive Office of the President: 33,264 -
Total Expenditures of Federal Awards 4,976,768$ 188,453$

110
City of Council Bluffs Notes to the Schedule of Expenditures of Federal Awards
Year Ended June 30, 2018 Note 1 - Basis of Presentation The accompanying schedule of expenditures of federal awards (the schedule) includes the federal award activity of the City of Council Bluffs, Iowa (City) under programs of the federal government for the year ended June 30, 2018. The information is presented in accordance with the requirements of Title 2 U.S. Code of Federal Regulations Part 200, Uniform Administrative Requirements, Cost Principles, and Audit Requirements for Federal Awards (Uniform Guidance). Because the schedule presents only a selected portion of the operations of the City, it is not intended to and does not present the financial position, changes in net position and fund balances, or cash flows of the City. Note 2 - Summary of Significant Accounting Policies Expenditures reported in the schedule are reported on the modified accrual basis of accounting. Such expenditures are recognized following the cost principles contained in the Uniform Guidance, wherein certain types of expenditures are not allowable or are limited as to reimbursement.
Note 3 - Indirect Cost Rate The City has not elected to use the 10% de minimis cost rate.

111
City of Council Bluffs Schedule of Findings and Questioned Costs
Year Ended June 30, 2018 Part I: Summary of Independent Auditor’s Results: Financial Statements
Type of auditor's report issued Unmodified
Internal control over financial reporting:Material weaknesses identified YesSignificant deficiencies identified not
considered to be material weaknesses None Reported
Noncompliance material to financial statements noted? No
Federal Awards
Internal control over major programs:Material weakness identified NoSignificant deficiencies identified not
considered to be a material weakness Yes
Type of auditor's report issued on compliance for major program: Unmodified
Any audit findings disclosed that are required to be reported in accordance with Uniform Guidance 2 CFR 200.516: Yes
Identification of major programs:
Name of Federal Program CFDA Number
CDBG - Entitlement Grants Cluster:Community Development Block Grants/ 14.218
Entitlement Grants
Highway Planning and Construction Cluster:Highway Planning and Construction 20.205
Dollar threshold used to distinguish between type A and type B programs: 750,000$
Auditee qualified as low-risk auditee? No

112
City of Council Bluffs Schedule of Findings and Questioned Costs
Year Ended June 30, 2018 Part II: Findings Related to the Financial Statements: Material Weakness 2018-A Material Audit Adjustment and Restatement for Correction of Errors
Criteria: A properly designed system of internal control over financial reporting allows entities to initiate, authorize, record, process, and report financial data reliably in accordance with generally accepted accounting principles (GAAP). Condition: During the course of our engagement, we proposed a material audit adjustment to the governmental activities equity balances that was not identified as a result of the City’s existing internal controls and, therefore, could have resulted in a material misstatement of the City’s financial statements. In addition, as part of the City implementing additional internal controls related to City-owned property in the current year, the City identified and corrected prior year errors related to its land held for resale and capital asset balances. The correction of the errors resulted in a restatement of beginning equity balances. Cause: There is a limited number of office employees with varying levels of experience with the reporting requirements. This significantly limits the City’s review procedures. Effect: The effect of this condition was financial data not in accordance with generally accepted accounting principles. Recommendation: The City has made significant improvements to its review procedures over the last few years. We recommend the City continue to implement further review procedures. Views of Responsible Officials: The City Finance team has reviewed the American Institute of CPA’s course on Governmental reporting. Going forward, the Finance team will rely less on prior year audited financials and more on formal course information when completing the year-end financial statements. Additionally, the correction of land held for sale resulting in restatement of beginning equity balances, is an improvement in the representation of the City’s assets and implementation of proper accounting procedures.
Part III: Findings and Questioned Costs for Federal Awards: 2018-001 U.S. Department of Housing and Urban Development
CFDA 14.218, B-14-MC-19-0005, B-15-MC-19-0005, B-16-MC-19-0005, B-17-MC-19-0005, Year Ended June 30, 2018 Community Development Block Grants/Entitlement Grants Procurement and Suspension and Debarment and Subrecipient Monitoring Significant Deficiency in Internal Control over Compliance Criteria: The Uniform Guidance, Section 200.303 Internal Controls, requires the non-federal entity must establish and maintain effective internal controls over federal awards that provide reasonable assurance that awards are being managed in compliance with federal statues, regulations and the terms and conditions of the federal award.

113
City of Council Bluffs Schedule of Findings and Questioned Costs
Year Ended June 30, 2018
Part III: Findings and Questioned Costs for Federal Awards: (continued)
Non-federal entities are also prohibited from contracting with or making subawards under covered transactions to parties that are suspended or debarred. “Covered transactions” include those procurement contracts for goods and services awarded under a non-procurement transaction (e.g., grant or cooperative agreement) that are expected to equal or exceed $25,000 or meet other criteria as specified in 2 CFR section 180.220. All non-procurement transactions entered into by a recipient (i.e., subawards to subrecipients), irrespective of award amount, are considered covered transactions, unless they are exempt as provided in 2 CFR section 180.215. When a non-federal entity enters into a covered transaction with an entity at a lower tier, the nonfederal entity must verify that the entity, as defined in 2 CFR section 180.995 and agency adopting regulations, is not suspended or debarred or otherwise excluded from participating in the transaction. This verification may be accomplished by (1) checking the Excluded Parties List System (EPLS) maintained by the General Services Administration (GSA) and available at https://www.sam.gov/portal/public/SAM/, (2) collecting a certification from that entity, or (3) adding a clause or condition to the covered transaction with that entity. Condition: We tested compliance and internal controls over suspension and debarment and subrecipient monitoring and noted two vendors and five subrecipients in which there was no documentation to support the contractor or subrecipient was not suspended or debarred. Cause: There is a lack of controls over the suspension, debarment, and subrecipient monitoring. Effect: Failure to provide documentation of the suspension and debarment check being performed may result in disallowed cost. Questioned Costs: None reported. Context/Sampling: A nonstatistical sample of five vendors out of 15 vendors were selected for suspension and debarment testing. A nonstatistical sample of five subrecipients out of seven subrecipients were selected for subrecipient monitoring testing. Repeat Finding from Prior Years: No. Recommendation: We recommend that management review and improve the approval and documentation process for program expenditures to identify “covered transactions” and ensure suspension and debarment checks are performed. View of Responsible Officials: The City of Council Bluffs already checks the System for Award Management (SAM) for prime contractors and both general and lower-tier contractors. We have amended our practices to include verifying that all vendors and sub recipients are not on the list.

114
City of Council Bluffs Schedule of Findings and Questioned Costs
Year Ended June 30, 2018 Part IV: Other Findings Related to Required Statutory Reporting: 2018-IA-A Certified Budget – Disbursements exceeded amounts budgeted at the June 30, 2018 in the public
works, general government, capital projects, and debt service functions. Recommendation – The budget should have been amended in accordance with Chapter 384.18 of
the Code of Iowa before disbursements were allowed to exceed the budget. View of Responsible Officials – The City agrees with the recommendation. 2018-IA-B Questionable Expenditures – We noted no expenditures that we believe may not meet the
requirements of public purpose as defined in an Attorney General’s opinion dated April 25, 1979. 2018-IA-C Travel Expense – No expenditures of City money for travel expenses of spouses of City officials
or employees were noted. 2018-IA-D Business Transactions – Business transactions between the City and City officials or employees
are detailed as follows: Name, Title, and Business Connection Transaction Description Amount Margie Johnson, Revenue Clerk, Services $ 404,430 Husband is part owner in Echo Electric Roger Sandau, City Council Member, Services 1,018 owner of Sandau Bros Sign Co. In accordance with Chapter 362.5(3)(j)) of the Code of Iowa, the transactions with Sandau Bros
Sign Co. do not appear to represent a conflict of interest since the total of the transactions were less than $1,500 during the fiscal year. The transactions with Echo Electric may represent a conflict of interest since they were not entered into through competitive bidding in accordance with Chapter 362.5(3)(d) of the Code of Iowa.
Recommendation – We recommend the City review the transactions with Echo Electric with legal
counsel. View of Responsible Officials – The employee is a part-time Account Clerk 1 in the revenue area
of Finance. She is not involved in the Procurement or Payables processes with the City. Upon further review, $289,057.87 of the above amount is related to targeted jobs credit. The remaining spend is related to supplies and services across approximately 15 different organizations in the City. The City Attorney concurs the employee lacks the ability to be involved in procurement of services with Echo Electric.
2018-IA-E Bond Coverage – Surety bond coverage of City officials and employees is in accordance with
statutory provisions. The amount of coverage should be reviewed annually to ensure the coverage is adequate for current operations.
2018-IA-F City Council Minutes– No transactions were found that we believe should have been approved in
the minutes but were not.

115
City of Council Bluffs Schedule of Findings and Questioned Costs
Year Ended June 30, 2018 Part IV: Other Findings Related to Required Statutory Reporting: (continued) 2018-IA-G Deposits and Investments– No instances of non-compliance with the deposit and investment
provisions of Chapters 12B and 12C of the Code of Iowa and the City’s investment policy were noted.
2018-IA-H Revenue Notes– No instances of non-compliance with revenue debt provisions were noted. 2018-IA-I Annual Urban Renewal Report – The annual urban renewal report was properly approved and
certified to the Iowa Department of Management on or before December 1.

(This page left blank intentionally.)