City of Berkeley 2015-2023 Housing Element
352
City of Berkeley 2015-2023 Housing Element
-
Upload
khangminh22 -
Category
Documents
-
view
0 -
download
0
Transcript of City of Berkeley 2015-2023 Housing Element

City of Berkeley
2015-2023 Housing Element


City of Berkeley
2015-2023 Housing Element
Reviewed by the City of Berkeley
Planning, Housing Advisory and Homeless Commissions
Prepared by the City of Berkeley
Departments of Planning and Development
and Health, Housing & Community Services
Eric Angstadt, Planning Director
Jane Micallef, Director of Health, Housing & Community Services Department Carol Johnson, Planning Manager
Alex Amoroso, Principal Planner
Jordan Harrison, Associate Planner/Project Manager
Leslie Mendez, Associate Planner/Project Manager
Amy Davidson, Senior Management Analyst
Be Tran, Associate Planner
Nicole Montojo, Planning Intern
Nicholas McIlroy, Planning Intern


i
2015-2023 Berkeley Housing Element
Table of Contents
1 - Introduction ....................................................................................................................... 1 A. Purpose of the Housing Element ..................................................................................... 1 B. Regulatory Framework .................................................................................................... 2 C. Organization of the Housing Element .............................................................................. 4 D. Community Participation .................................................................................................. 5 E. Evaluation of the Previous Housing Element ................................................................... 6 F. Consistency with the General Plan and Other Planning Documents ................................ 9
2 - Community Profile and Housing Needs Assessment ....................................................11 Purpose .................................................................................................................................11 A. Population and Household Characteristics .....................................................................12 B. Housing Stock Characteristics ........................................................................................26 C. Income, Employment and Housing Costs .......................................................................30
3 - Projected Housing Need and Land Resources ..............................................................43 Purpose .................................................................................................................................43 A. Regional Housing Need Allocation (RHNA) ....................................................................44 B. Site Inventory and Residential Capacity Analysis ...........................................................45 C. Other State Requirements ..............................................................................................49
4 - Potential Constraints to Housing Production ................................................................55 A. Governmental Constraints ..............................................................................................55 B. Non Governmental Constraints ......................................................................................75
5 - Objectives, Policies and Actions .....................................................................................79 A. Objectives ......................................................................................................................79 B. Policies and Actions .......................................................................................................80
6 - Housing Programs and Quantified Objectives ...............................................................93 Purpose .................................................................................................................................93 A. Programs Addressing State Law Requirements .............................................................93 B. Programs Addressing Berkeley Objectives .....................................................................99 C. Summary of Quantified Objectives ............................................................................... 102 D. Program Descriptions ................................................................................................... 102
Appendix A1: Site Inventory and Capacity Analysis Background by Area ..................... 205 A. Summary ...................................................................................................................... 206 B. Downtown Area Opportunity Sites and Residential Analysis ......................................... 207 D. Southside Plan Opportunity Sites and Residential Capacity Analysis ........................... 216 E. Commercial Corridor Opportunity Sites and Residential Capacity Analysis .................. 220 F. Residential Neighborhood Opportunity Sites and Residential Capacity Analysis ........................................................................................................................ 229 G. Progress Towards 2014-2022 RHNA ........................................................................... 245
ii
Appendix A2: Site Inventory and Capacity Analysis Background by Area (Maps) ......... 247 Appendix B: Summary of Development Standards (Residential and Conmercial Districts) ......................................................................................... 257 Appendix C: Zoning District and General Plan Designation Background ...................... 261 General Plan Land Use Designations .................................................................................. 262 Zoning District Purposes ...................................................................................................... 265
Appendix D: Community Participation Background ........................................................ 275

iii
List of Tables Table 1-1: City of Berkeley Housing Unit Production for 2007-2014 Regional Housing Needs
Determination .......................................................................................................... 8 Table 1-2: Units Repaired or Rehabilitated, 2007 - 2014 .......................................................... 8 Table 1-1: City of Berkeley Housing Unit Production for 2007-2014 Regional Housing Needs
Determination .......................................................................................................... 8 Table 1-2: Units Repaired or Rehabilitated, 2007 - 2014 .......................................................... 8 Table 2-1: Berkeley Historical Population Growth, 1890-2010 .................................................13 Table 2-2: Population Changes in Berkeley and Neighboring Cities, 1990-2010 .....................13 Table 2-3: Age Distribution in Berkeley, 2000 and 2010 ..........................................................14 Table 2-4: Race/Ethnicity Composition of Berkeley, 1990-2010 ...............................................15 Table 2-5: Berkeley Household Trends, 1970 to 2010 .............................................................16 Table 2-6: Berkeley Household Characteristics, 2012 .............................................................16 Table 2-7: Overcrowding in Berkeley and Alameda County, 2012 ...........................................17 Table 2-8: Overcrowding by Tenure, Berkeley and Alameda County, 2012 .............................17 Table 2-9: Occupied Housing Units and Vacancy Rates, 1970 to 2010 ...................................18 Table 2-10: Berkeley Residents Reporting a Disability by Age Group, 2012 ............................22 Table 2-11: Types of Disabilities Reported by Berkeley Residents ..........................................22 Table 2-12: Elderly Households in Berkeley by Income Level, 2012 ........................................24 Table 2-13: Single Parents, Berkeley and Alameda County, 2012 ...........................................26 Table 2-14: Number of Bedrooms in Unit by Tenure, 2012 ......................................................28 Table 2-15: Age of Housing Stock, Berkeley, Alameda County, and California ........................29 Table 2-16: Age of Berkeley's Occupied Housing Units by Building Size .................................29 Table 2-17: Household Income Distribution by Tenure and Income Level, 2007-2011 .............30 Table 2-18: Top 10 Berkeley Employers, 4th Quarter, 2013 .....................................................32 Table 2-19: City of Berkeley Employment by Sector, September 2013 ....................................32 Table 2-20: Average Annual Salary by Job Type, Oakland, Fremont, Hayward Metro Area, 1st
Quarter 2013 ..........................................................................................................33 Table 2-21: Employment Projections for the City of Berkeley by Industry, Number of Jobs .....34 Table 2-22: Average Market Rents for New Tenancies in Units Subject to Rent Stabilization
(2009 and 2013) .....................................................................................................35 Table 2-23: Average Market Rents for New Multifamily Developments (2010 and 2014) .........36 Table 2-24: Affordability of Market-Rate Rental Housing in Berkeley, 2014 .............................37 Table 2-25: Affordability of Market Rate Housing in Berkeley, 2009-2010 ...............................39 Table 2-26: Affordability of Market Rate Condominiums in Berkeley, 2014 ..............................40 Table 2-27: Percent of Berkeley Households Overpaying for Housing .....................................41 Table 3-1: City of Berkeley RHNA Capacity Requirement 2014-2022 ......................................44 Table 3-2: Progress towards 2014-2022 RHNA: Approved Units January 1, 2014 – September 1, 2014 ..................................................................................................45 Table 3-3: Summary of Residential Capacity ...........................................................................46 Table 4-1: Berkeley General Plan Land Use Classifications: Density Ranges .........................56 Table 4-2: Maximum Allowable Density in Nearby Cities .........................................................56 Table 4-3: Density of Approved Mixed-Use Projects, 1999 - 2009 ..........................................58 Table 4-4: Density of Approved Mixed-Use Projects, 2010 - 2014 ...........................................59 Table 4-5: Density of Pending Mixed-Use Projects, 2010 - 2014 ...........................................59 Table 4-6: Parking space requirements for new dwelling units .................................................60 Table 4-7: Estimated Planning, Building, and Impact Fees ......................................................71

iv
Table 4-8: Residential Construction Costs (Condo) – Gross square foot .................................77 Table 6-1: Quantified Objectives, 2015-2023 ......................................................................... 100 Table 6-2: BHA Payment Standards, November 2014 ........................................................... 106 Table 6-3: Summary of Berkeley Condominium Conversions, 2009-2014* ............................ 110 Table 6-4: Community Energy Services Corporation Home Repairs Completed, FY 2009 – FY
2014 ..................................................................................................................... 115 Table 6-5: EBCLC Accomplishments by Fiscal Year, FY 2012- FY 2014 ............................... 118 Table 6-6: Center for Independent Living’s Residential Access for Disabled Persons Program,
FY 2009 – FY 2014 .............................................................................................. 124 Table 6-7: Units Repaired by Rebuilding Together’s Safe Home Project, FY 2009 – ........................................................................................................ FY 2014 124 Table 6-8: Community Agency Contracts, FY 2015 ............................................................... 129 Table 6-9: Current Inventory of Emergency Shelters ............................................................. 131 Table 6-10: Current Inventory of Transitional Housing ........................................................... 132 Table 6-11: Current Inventory of Permanent Housing for People Who Are Currently or Formerly
Homeless ............................................................................................................. 133 Table 6-12: Rehabilitation of Emergency and Transitional Housing Facilities by HUD Program
Year of Federal Funds Allocated .......................................................................... 134 Table 6-13: Housing Retention Program, FY 2014 ................................................................ 140 Table 6-14: ESG-Assisted Activity Beneficiary Data FY2014 ................................................. 143 Table 6-15: Shelter Plus Care Grant History .......................................................................... 147 Table 6-16: Affordable Housing In-Lieu Impact Fee for Large-Scale Non-Residential
Development Projects (as of June 3, 2014) .......................................................... 154 Table 6-17: Housing Trust Fund Cumulative Funds Received and Committed as of June 30,
2014 ..................................................................................................................... 157 Table 6-18: Developments with Housing Trust Fund Financing Completed 2010 – 2014, Total
City Financing ...................................................................................................... 159 Table 6-19: Developments with Housing Trust Fund Financing Completed By Income Level,
2010 – 2014 ......................................................................................................... 160 Table 6-20: HTF Allocations as of November 2014 ................................................................ 160 Table 6-21: All City of Berkeley Housing Trust Fund Developments 1990 to 2014 ................. 161 Table 6-22: Units in Projects at Risk of Conversion to Market Rate Housing, 2014-2024 ...... 175 Table 6-23: Properties at Risk of Converting to Market Rate by Total Units and Restricted
Units, 2014-2024 .................................................................................................. 176 Table 6-24: Properties at Risk of Converting to Market Rate by Size of Units, 2014-2024 ..... 176 Table 6-25: Affordable Housing Organizations Interested in Acquiring and Managing At-Risk
Rental Housing in the City of Berkeley ................................................................. 183 Table 6-26: Sources of Funding for Acquiring and Rehabilitating At-Risk Housing in the City of
Berkeley ............................................................................................................... 183 Table 6-27: Assisted Developments in Berkeley with HUD Project-Based Subsidies or Low
Income Housing Tax Credits from 1987-1989 Without Housing Trust Fund Loans 186
Table 6-28: Inventory of Developments in Berkeley with a Federally-Funded Project-Based Operating Subsidy ................................................................................................ 187
Table 6-29: 2014 “Market” rent compared to rent for 2006, 2009 and pre-1999 “Controlled” tenancies* ............................................................................................................ 195
Table 6-30: Affordability Due to Rent Stabilization ................................................................. 197 Table 6-31: Seismic Tax Rebate 2009-2014 .......................................................................... 201 Table 6-32: Senior and Disabled Home Rehabilitation Loan Program, FY 2007 – FY 2014 ... 203
v
Table A-1: Summary of Residential Capacity ......................................................................... 206 Table A-2: Downtown Area Housing Opportunity Site Inventory and Residential Capacity
Analysis - 2012 C-DMU Regulations .................................................................... 210 Table A-3: Southside Area Housing Opportunity Site Inventory and Residential Capacity
Analysis ................................................................................................................ 218 Table A-4: Capacity Estimates by Zoning District Commercial Corridors (2014-2022) ........... 223 Table A-5: Summary of Projects 1999-2009 Basis for Density Assumptions .......................... 223 Table A-6: Commercial Corridors Housing Opportunity Site Inventory and Residential Capacity
Analysis ................................................................................................................ 224 Table A-7: Density Assumptions for Residential Zoning Districts* .......................................... 230 Table A-8: Vacant Residential Lots and Estimated Residential Capacity ............................... 230 Table A-9: Estimate of new units in Residential Districts by Unit Type (2015-2023) ............... 231 Table A-10: Residential Area Housing Opportunity Site Inventory and Residential Capacity
Analysis ................................................................................................................ 231 Table A-11: Progress towards 2014-2022 RHNA: Units approved 2014 ................................ 245 Table B-1: Residential District Development Standards ......................................................... 258 Table B-2: Commercial District Development Standards for Mixed-Use Buildings* ................ 259
List of Figures Figure 2-1: Berkeley Population Growth and Projections, 1890-2040 ........................................14 Figure 2-2: Berkeley’s Homeless Population .............................................................................21 Figure 2-3: Berkeley’s Chronic Homelessness ..........................................................................21 Figure 2-4: Berkeley's Housing Stock by Number of Units in Building, 2012 .............................27 Figure 2-5: Berkeley's Housing Stock by Bedrooms in Unit, 2012 .............................................27 Figure 2-6: Berkeley's Housing Stock Comparison, 2000 Census .............................................28 Figure 2-7: Household Income Distribution in Berkeley, ACS 2008-20012 Estimates ...............31 Figure 2-8: Berkeley Market Rents, New Tenancies, Units Subject to Rent Stabilization, 1999-2013 ...............................................................................................................36 Figure 2-9: Median Home Sales Prices, Berkeley and Alameda County, 2005-2014.................39


2015-2023 Berkeley Housing Element
1 – Introduction
1
1 - Introduction Decent and affordable housing is a basic human right. The 2015-2023 City of Berkeley Housing
Element addresses this right and the statewide housing goal of “attaining decent housing and
suitable living environments for every California family.” The statutory planning period for this
Housing Element is January 31, 2015 to January 31, 2023.
Note to readers: The 2015 Element is an update to the Housing Element adopted by the City of
Berkeley in October 2010. The 2009-2014 Housing Element was the result of an extensive two
year effort and included a comprehensive revision of the previous (2001-2006) Element. Given
the changes adopted in 2010, the 2015 Element represents an update with minor adjustments
to address current Census and American Community Survey data, the new Regional Housing
Needs Allocation (RHNA), and progress towards achieving Element goals. As such, the
changes are presented as highlighted text to orient the reader to new information.
A. Purpose of the Housing Element
The Berkeley Housing Element serves as a policy guide to address the comprehensive housing
needs of the City. State Housing Element law requires that local jurisdictions outline the
housing needs of their community, the barriers or constraints to providing that housing, and
actions proposed to address these concerns over an eight-year planning period. In addition,
Housing Element law requires each city and county to accommodate its “fair share” of the
region’s projected housing need over the Element planning period. Cities and counties must
demonstrate that adequate sites are available to accommodate this need, and that the
jurisdiction allows for development of a variety of housing types. This housing need requirement
is known as the RHNA and apportions to each jurisdiction its portion of the Bay Area’s projected
need.1
The purpose of the Housing Element is to:
1 The 8.8-year housing needs projection period (Regional Housing Needs Allocation) is from January 2,
2014 to October 31, 2022. The nine county Bay Area includes Alameda, Contra Costa, Marin, Napa, San
Francisco, San Mateo, Santa Clara, Solano, and Sonoma counties. The regional council of governments
(COG) for the Bay Area, which administers the RHNA process, is the Association of Bay Area
Governments (ABAG).

2015-2023 Berkeley Housing Element
1 – Introduction
2
Determine the existing and projected housing needs of Berkeley residents;
Identify adequate parcels via the site inventory process to facilitate the development of
housing for various income levels to accommodate Berkeley’s share of regional need;
Establish goals and policies that guide decision-making to address housing needs; and
Describe programs that will implement the City’s housing objectives.
B. Regulatory Framework
California Government Code Title 7, Division 1, Article 10.6 requires that each city and county
adopt a Housing Element as one of the seven required elements of the General Plan. The
Housing Element is different from the other required elements of the General Plan in that it must
be updated regularly and is subject to detailed statutory requirements. The City’s previous
Housing Element, adopted in 2010, addressed the period 2009 to 2014. Unlike other elements,
the Housing Element must be submitted to the California State Department of Housing and
Community Development (HCD) for review and certification. A Housing Element is certified by
HCD when it is found to be in compliance with all requirements of state Housing Element law.
The main required components of a Housing Element are listed below:
1. Population and demographic trends, including employment and income information and
household and housing stock characteristics, to identify community housing needs.
2. Public participation.
3. Assessment of below-market units at-risk of converting to market rate.
4. Assessment of special needs populations, defined as the homeless, elderly, disabled,
mentally ill, large families, single parent families.
5. Review of the effectiveness of the previous Housing Element.
6. Analysis of constraints on housing production.
7. Inventory of available sites for housing development.
8. Analysis of capacity for housing on available sites and capacity to accommodate all
income levels and a variety of housing types.
9. Programs and policies to address housing need and encourage affordable housing.
10. Quantified objectives for the number of housing units by income level to be constructed,
rehabilitated and conserved.
Recent Changes in Housing Element Law
The Housing Element must also address compliance with recent changes to Housing Element
law. The changes, and how this Element addresses the requirements, are summarized below:
Sustainable Communities Strategy and Housing Element timing (Senate Bill 375, 2008)
requires that each region plan for future housing needs and complementary land uses
with adoption of a Sustainable Communities Strategy (SCS), which in turn must be
supported by a transportation investment strategy in the regional transportation plan
(RTP). SB 375 revised the element update cycle to every eight years instead of every

2015-2023 Berkeley Housing Element
1 – Introduction
3
five years. This synchronizes the land-use and housing assumptions used in the
regional housing needs assessment (RHNA) with those used in the RTP in order to
coordinate transportation projects with growth strategies. In the Bay Area, the SCS and
RHNA methodology are mutually reinforcing and were developed together to meet the
overlapping objectives of SB 375 and Housing Element Law. The Association of Bay
Area Governments (ABAG) and the Metropolitan Transportation Commission (MTC)
collaborated to develop Plan Bay Area, the SCS for the bay region.
Persons with developmental disabilities (SB 812, 2010) requires local governments to
include an analysis of the special housing needs of persons with developmental
disabilities.
Provisions for transitional housing, supportive housing, and SRO housing for the
homeless (SB 2, 2007) requires local jurisdictions to strengthen provisions for
addressing the housing needs of the homeless, including the identification of a zone or
zones where emergency shelters are allowed as a ‘by-right’ permitted use without a
conditional use permit; and the regulation of transitional and supportive housing types as
residential uses.
Berkeley complied with this law in 2012 by adopting new definitions and designating
districts where emergency shelters are permitted as-of-right, as discussed in Chapter 6,
Housing Programs and Quantified Objectives.
Housing for Extremely Low Income Households (AB 2634, 2006 requires quantification
and analysis of existing and projected housing needs of extremely low income (ELI)
households, which are defined as those with incomes lower than 30% of area median
income. Elements must also identify zoning to encourage and facilitate supportive
housing and single room occupancy (SRO) units.
The Element assesses the needs of Berkeley’s homeless population, which are
generally ELI, in Chapter 2. Consistent with AB 2634, the projected ELI housing needs
based on the RHNA are identified in Chapter 3. That chapter also discusses sites
suitable for supportive housing and SRO projects. Chapter 6 describes programs and
services to assist the ELI population, including an inventory of emergency shelters,
supportive and transitional housing, and zoning to permit emergency shelters as-of-right.
Water and Sewer Provider Notification (SB 1087, 2005) requires local governments to
provide a copy of the adopted housing element to water and sewer providers. In
addition, water and sewer providers must grant priority for service allocations to
proposed developments that include housing units affordable to lower-income
households.
Berkeley will forward the adopted housing element to the East Bay Municipal Utility
District upon adoption. Additionally, the City used the draft site inventory and estimate of
new housing unit capacity (Chapter 3) in the preparation of a master plan for upgrade of
2015-2023 Berkeley Housing Element
1 – Introduction
4
the City’s sewer system.
Timely Implementation of the Housing Element (AB 1233) applies to jurisdictions that
failed to identify or implement adequate sites for their RHNA-projected housing need in
their previous element by requiring rezoning to meet this need within one year of update.
The 2001 and 2009 Berkeley Housing Element identified adequate sites; therefore, this
provision is not applicable.
Adequate Sites Analysis (AB 2348, 2004) requires a more detailed inventory of sites to
accommodate projected housing needs and provide greater development certainty than
previously required.
Berkeley’s inventory of suitable sites and realistic development capacity are discussed in
Chapter 3 and Appendix A.
Second-Units (AB 1866, 2002) requires jurisdictions to permit the creation of second-
units without discretionary review.
Berkeley adopted a second unit ordinance in 2003, as described in Chapter 6.
Housing for Persons with Disabilities (SB 520, 2001) requires the Housing Element to
address constraints to housing for persons with disabilities.
Berkeley adopted a Reasonable Accommodation Ordinance in 2001, as described in
Chapter 6. Berkeley programs addressing fair housing and providing home modifications
for accessibility are also discussed in Chapter 6.
C. Organization of the Housing Element
The Berkeley Housing Element consists of six key components that fulfill the State
requirements.
Chapter 1: Introduction, describes Housing Element requirements and the community
process to prepare this Housing Element update; an evaluation of the prior Housing
Element; and consistency with the General Plan.
Chapter 2: Community Profile and Housing Needs Assessment, provides a study of the
existing housing needs within the community, including population, employment and
income statistics; information on extremely low income housing needs; characteristics of
the existing housing stock; and special needs populations, including the elderly,
disabled, homeless, large families and female headed households.
Chapter 3: Projected Housing Need and Land Resources, provides a discussion of the
inventory of land suitable for residential development to accommodate Berkeley’s
identified fair share of housing need, a variety of housing types, and housing for low
income households.

2015-2023 Berkeley Housing Element
1 – Introduction
5
Chapter 4: Potential Constraints to Housing Production, includes a discussion of
constraints on the development of housing in Berkeley and programs to mitigate those
constraints.
Chapter 5: Objectives, Policies, and Actions, includes the goals and steps Berkeley will
take to promote housing opportunities for all Berkeley residents.
Chapter 6: Housing Programs and Quantified objectives, describes the programs
Berkeley will use to meet existing and projected housing needs, including those
addressing publicly assisted housing developments that may convert to non-assisted
housing (“at-risk” units); opportunities for energy conservation; and a statement of
quantified objectives that estimates the number of housing units by income level to be
constructed, rehabilitated, and conserved in Berkeley by 2023.
Appendices: Background and supporting materials for the above chapters, including a
detailed opportunity sites inventory, a summary of development standards, zoning and
general plan background, and a summary of the public participation process.
D. Community Participation
The inclusion of community stakeholders in the Housing Element public participation process
helps to ensure that appropriate housing strategies are evaluated, developed, and implemented.
The public outreach process consisted of the following:
Community Meetings –The Planning Commission oversaw preparation of the 2015-2023
Housing Element, with input from the Homeless Commission and Housing Advisory
Commission. From June 2014 to December 2014, the Commissions hosted seven
publicly noticed meetings. A list of the meetings and public comments from the meetings
are provided in Appendix C.
Outreach to Berkeley Commissions – In addition to review by three Berkeley
commissions, eight other Berkeley commissions were invited to participate in the update
process by providing comment on the draft element. The commissions included on the
Housing Element update email list are listed below:
o Commission on Disability
o Commission on Aging
o Transportation Commission
o Energy Commission
o Mental Health Commission
o Zoning Adjustments Board
o Berkeley Rent Stabilization Board
o Berkeley Housing Authority
Outreach to stakeholder groups – Using the extensive Housing Element email list
prepared for the 2009 element, the City contacted stakeholders directly to solicit input
and invite participation in the Housing Element process, including local non-profit and
for-profit housing developers and homeless service providers.
Outreach to lower-income residents - Berkeley included 58 affordable housing locations
on the Housing Element distribution list and sent emails inviting participation in the

2015-2023 Berkeley Housing Element
1 – Introduction
6
Housing Element review process. Berkeley made use of the list of interest groups
compiled during the previous element update.
World Wide Web - Berkeley maintained a web page to keep the community informed
about the preparation of the 2015-2023 Element. This web page provided links to the
previous element, background materials related to Housing Element law, and documents
from each community meeting.
Mail and E-mail Outreach – Berkeley used an email list of 450 groups and individuals
and invited them to each public meeting. The City utilized the email distribution lists of
the Berkeley commissions listed above to compile a list representing a broad cross
section of interested parties. The City also utilized distribution lists from past projects
that addressed housing policy issues, such as the density bonus subcommittee list and
the commercial corridors interest group. The City included the Berkeley Chamber of
Commerce and Downtown Business Association, neighborhood groups, the Berkeley
Property Owners Association, homeless services providers, disability services groups,
fair housing agencies, and local non-profit and for-profit housing developers. A list of
groups included in the distribution lists is provided in Appendix C.
E. Evaluation of the Previous Housing Element
Government Code Section 65588 requires that each local jurisdiction review its past
accomplishments as part of their Housing Element update. Specifically, each locality must
assess:
The appropriateness of the housing goals, objectives, and policies in contributing to
the attainment of the state housing goal;
The effectiveness of the housing element in attainment of the community's housing
goals and objectives; and
The progress of the city, county, or city and county in implementing the housing
element.
Appropriateness
The State of California’s major housing goal is outlined in California planning law:
“The availability of housing is of vital statewide importance and the early attainment of decent
housing and a suitable living environment for every California family is a priority of the highest
order.”
Berkeley’s goals and programs help achieve the state’s housing goal by facilitating the
development of affordable housing, encouraging quality housing development, promoting repair
and improvement of the existing housing stock, and providing housing and services to the
homeless and formerly homeless population. Through our goals and programs, Berkeley
provides housing opportunities for a range of income levels. Berkeley also provides support to
low income residents to help them stay housed and improve the condition of their housing.
Berkeley housing goals and programs are consistent with and work to attain the state’s housing

2015-2023 Berkeley Housing Element
1 – Introduction
7
goal by focusing on housing unit production, particularly housing affordable to the lowest income
households, and on repair of the existing housing stock.
Revisions to the 2009 Housing Element Objectives, Policies and Actions
Throughout the preparation of both the 2009 and 2015-2023 Berkeley Housing Elements, the
City evaluated the past performance of goals and programs and assessed their continued
applicability. With the 2009 Housing Element update, Berkeley retained the objectives and most
polices from the 2001 Housing Element. The 2001 policies were revised to simplify, clarify and
update language to reflect current terminology and City activities. The nine objectives of the
2001 Element were reorganized and renamed and three new objectives were added: Energy
Efficiency, Adequate Sites, and Governmental Constraints.
Reorganizing, updating and consolidating the actions reduced the number of policies and
actions from the 2001 Element. For example, the 2001 Housing Element included separate,
parallel recommendations under Special Needs Housing on people with disabilities, people
living with HIV/AIDS, and people with alcohol and other drug dependence. Staff combined these
to a single consistent policy regarding all people with disabilities.
Because of the extensive review in 2009, the City did not make substantial changes to the
2015-2023 Housing Element objectives, policies and actions.
Effectiveness
The effectiveness of Berkeley’s Housing Element can be measured by the level of achievement
in the development of new housing and the success of Berkeley’s programs for rehabilitation
and conservation of existing housing units. The summary that follows of the units constructed,
rehabilitated or preserved/conserved since preparation of the previous Housing Element in 2010
demonstrates the effectiveness of Berkeley’s programs.
New Unit Construction
One way the effectiveness of the Housing Element can be gauged is by evaluating the
effectiveness of the Housing Element goals and programs in encouraging the development of
housing for all income groups in the City. As is shown in the following table, Berkeley
constructed 51% of the City’s “fair share” of housing allocated by ABAG for the 2007-2014
Regional Housing Needs Allocation. The table below summarizes units produced in Berkeley
from 2007 to 2014 by income level. The development success occurred in spite of the recent
recession and housing market crash. The 2009 California Appellate Court ruling Palmer/Sixth
Street Properties LP v. City of Los Angeles overturned previous understandings of the validity of
inclusionary housing ordinances as applied to market rate rental units, which combined with the
housing crash, accounts for the drop in affordable units in 2010. The City responded quickly by
adopting an Affordable Housing Mitigation Fee program enabling Berkeley to continue to
address the housing needs of all income levels.

2015-2023 Berkeley Housing Element
1 – Introduction
8
Table 1-1: City of Berkeley Housing Unit Production for 2007-2014 Regional Housing Needs Determination
Building Permits by calendar year
Total Units
Very Low Income
Low Income
Moderate Income
Above Moderate Income
2007 258 5 35 5 213
2008 280 23 15 6 236
2009 304 23 23 0 258
2010 5 0 0 0 5
2011 24 10 1 0 13
2012 136 11 10 1 114
2013 39 0 3 7 29
2014 144 4 0 3 137
GRAND TOTAL 2007-2014 1,190 76 87 22 1,005
07-14 Regional Fair Share Goal 2,431 328 424 549 1,130
Percent of Goal Achieved 51% 23% 21% 4% 89%
Source: City of Berkeley Planning Department
Rehabilitation
Berkeley has a number of programs that result in repair or rehabilitation of the existing housing
stock (discussed in detail in Chapter 6). These programs result in both minor repairs and more
substantial rehabilitation of existing units. The table below summarizes the number of units the
City estimates were repaired or rehabilitated based on each program during the prior Housing
Element planning period. For some programs, the City does not have available data about the
number of units repaired; however they are included in order to illustrate the scope of programs
offering assistance with home repairs. The figures are based on the accomplishments reported
for each program in Chapter 6.
Table 1-2: Units Repaired or Rehabilitated, 2007 - 2014
Program Name Number of units Repair or Rehabilitated Condominium Conversion Ordinance 155 units
CESC Home Repairs* 147 major home repairs
Rebuilding Together* 162 units
Housing Code Enforcement (unknown)
HTF* 232units
Problem Properties Task Force (unknown)
Seismic Preparedness Programs (unknown)
Senior and Disabled Home Loans* 35 units
Total 731 units
* Indicates the program is reserved for moderate or lower income households.
Conservation/Preservation
Berkeley has a number of below-market rate units subject to affordability restrictions. Between
2009 and 2014, 271 units in three properties that were eligible to convert to market rate have
2015-2023 Berkeley Housing Element
1 – Introduction
9
been preserved by extending the income restrictions through a Housing Trust Fund (HTF)
regulatory agreement. Berkeley’s preservation achievements since 2009, as well as the City’s
resources for preservation, are discussed in detail in Chapter 6 under “Preserving Restricted
Units at Risk of Conversion to Market Rate.” The section also discusses why units considered
at-risk of conversion in the 2001 Housing Element are not considered at risk for this Element’s
planning period based on income restrictions that extend past 2024.
Progress
Berkeley’s numerous housing programs are described in Chapter 6. Each program description
includes an “accomplishments” section which outlines recent progress in program
implementation.
Berkeley’s programs have proven successful in achieving Berkeley’s housing goals and,
therefore, have been retained and improved over the years. The 2009 Housing Element update
extensively reorganized the programs chapter. The reorganized programs chapter was updated
to reflect program accomplishments and progress since adoption of the 2009 Housing Element.
F. Consistency with the General Plan and Other Planning
Documents
State law requires the elements of the General Plan to be consistent. The 2015-2023 Berkeley
Housing Element is consistent with all of the other elements of the 2002 General Plan in that it
does not require any changes to the other Plan elements, modify or relocate density, or
recommend policies or action programs that would create housing at the expense of other goals
and policies within the General Plan. The Housing Element goals should be interpreted and
implemented consistent with those in other sections of the General Plan. As the General Plan
may be amended over time, objectives, policies, and actions in other General Plan elements will
be comprehensively reviewed for internal consistency. Various policies in Chapter 5,
Objectives, Policies and Actions, are cross-referenced with supporting policies in the other
elements of the General Plan.
While preparing the Housing Element update staff consulted the City’s most recent
Consolidated Plan, the EveryOne Home Plan, and the Climate Action Plan. The Housing
Element is consistent with the policies and goals of each of these documents.

10
<Page Intentionally Left Blank>

2015-2023 Berkeley Housing Element
2 – Community Profile and Housing Needs Assessment
11
2 - Community Profile and Housing Needs Assessment
Purpose
The purpose of this chapter is to identify characteristics of Berkeley’s population and housing
stock in order to understand the City's housing needs. These include the unmet need of existing
residents and future needs resulting from anticipated demographic changes.
This chapter is organized as follows:
A. Population and Household Characteristics
B. Housing Stock Characteristics
C. Income, Employment, and Housing Costs
Summary of Key Findings
Berkeley's population grew by 9% from 2000 to 2010, to 112,580 people. ABAG
projects that the City will grow 24% by 2040, to 140,100.
Berkeley’s age trends continue: the percentage of the population aged 55+ rose from
19% to 23% over the past decade; the percentage aged 18-24 rose from 22% to 27%.
The largest change to Berkeley’s ethnic diversity is that the Black/African-American
population decreased by roughly 13% to 10% of the overall population between 2000
and 2010. This is a continuation of a trend reflected in the last decennial census and the
region as a whole.
Overcrowding of housing units is not particularly prevalent in Berkeley according to the
American Community Survey, despite the increase in housing costs.
After a slight dip during the recession, housing costs have been rising since 2011.
Median rents for studios and one-bedroom units in new developments are roughly 25%
higher than in 2010; for two-bedroom units, rents are 37% higher.
Sources The City used a variety of sources to collect the information that follows, including the U.S.
Census Bureau’s Decennial Census (referred to as “Census”), the U.S. Census Bureau’s
American Community Survey (ACS), the California Department of Finance (DOF) population
estimates, the State of the Cities Data Systems (SOCDS) Comprehensive Housing Affordability

2015-2023 Berkeley Housing Element
2 – Community Profile and Housing Needs Assessment
12
Strategy (CHAS) reports (which are based on the Decennial Census and the ACS), and data
from the California Employment Development Department (EDD).
Some of these sources provide data on the same topic, but because of different methodologies,
the resulting data differ. For example, the decennial census and ACS report slightly different
estimates for the total population, number of households, number of housing units, and
household size. This is in part because ACS provides estimates based on a small survey of the
population taken over the course of the whole year.1 Because of the survey size and seasonal
population shifts, some information provided by the ACS is less reliable. Moreover, the 2000
Census was collected in an aberrant year, the very peak of the real estate cycle. For this
reason, we urge readers to keep in mind the potential for data errors when drawing conclusions
based on the ACS data used in this chapter. The information is included because it provides an
indication of possible trends in Berkeley. The analysis in this chapter limits the use of ACS data
to subjects that do not have another source, and makes comparisons between ACS data and
the decennial census data only when appropriate according to U.S. Census Bureau
publications.
A. Population and Household Characteristics
1. Population and Demographic Changes
The City of Berkeley’s population grew rapidly up until the middle of the last century and then
leveled off for a few decades. Starting in the 1970s the population declined at a rate of just over
one percent per year. From 1980-2000 the population was fairly steady at just over 100,000
people. In the ten years following the 2000 Census, the population rose by almost nine percent
to 112,580 according to the 2010 Decennial Census.
1 The American Community Survey is sent to approximately 250,000 addresses in the United States
monthly (or 3 million per year). It regularly gathers information previously contained only in the long form of the decennial census. This information is then averaged to create an estimate reflecting a 1, 3, or 5-year reporting period (referred to as a “5-year estimate”). The longer the reporting period, the smaller the margin of error.

2015-2023 Berkeley Housing Element
2 – Community Profile and Housing Needs Assessment
13
Table 2-1: Berkeley Historical Population Growth, 1890-2010
Year Total Population Population Change Percent Change
1890 5,101 - -
1900 13,214 8,113 159.0%
1910 40,434 27,220 206.0%
1920 56,036 15,602 38.6%
1930 82,109 26,073 46.5%
1940 85,547 3,438 4.2%
1950 113,805 28,258 33.0%
1960 111,268 -2,537 -2.2%
1970 116,716 5,448 4.9%
1980 103,328 -13,388 -11.5%
1990 102,724 -604 -0.6%
2000 102,743 19 0.0%
2010 112,580 9,837 8.74%
Sources: U.S. Decennial Census
As shown in the following table, compared to other cities, the County, and the State, Berkeley’s
population growth was at a similar rate as the state between 2000 and 2010, about twice the
rate of growth in Alameda County, and was faster than most nearby cities, including San
Francisco.
Table 2-2: Population Changes in Berkeley and Neighboring Cities, 1990-2010
Jurisdiction 1990 2000
Change
(1990-2000)
2010
Change
(2000-2010)
Number Percent Number Percent
California 29,760,021 33,871,648 4,111,627 13.8% 37,253,956 3,382,308 9.08%
Alameda County 1,279,182 1,443,741 164,559 12.9%
1,510,271 66,530 4.41%
Berkeley 102,724 102,743 19 0.0% 112,580 9,837 8.74%
Oakland 372,242 399,484 27,242 7.3% 390,724 -8,760 -2.24%
Fremont 173,339 203,413 30,074 17.3% 214,089 10,676 4.99%
San Francisco 723,959 776,733 52,774 7.3%
805,235 28,502 3.54%
San Leandro 68,223 79,452 11,229 16.5% 84,950 5,498 6.47%
Hayward 111,498 140,030 28,532 25.6% 144,186 4,156 2.88%
Concord 111,348 121,780 10,432 9.4% 122,067 287 0.24%
Sources: U.S. Decennial Census SF1:P1
According to the Association of Bay Area Government (ABAG) 2013 projections, Berkeley’s
population is projected to grow 24.4% between 2010 and 2040, to about 140,100 people.
2015-2
02
3 B
erk
ele
y H
ousin
g E
lem
ent
2 –
Com
munity
Pro
file a
nd H
ousin
g N
eeds A
ssessm
ent
14
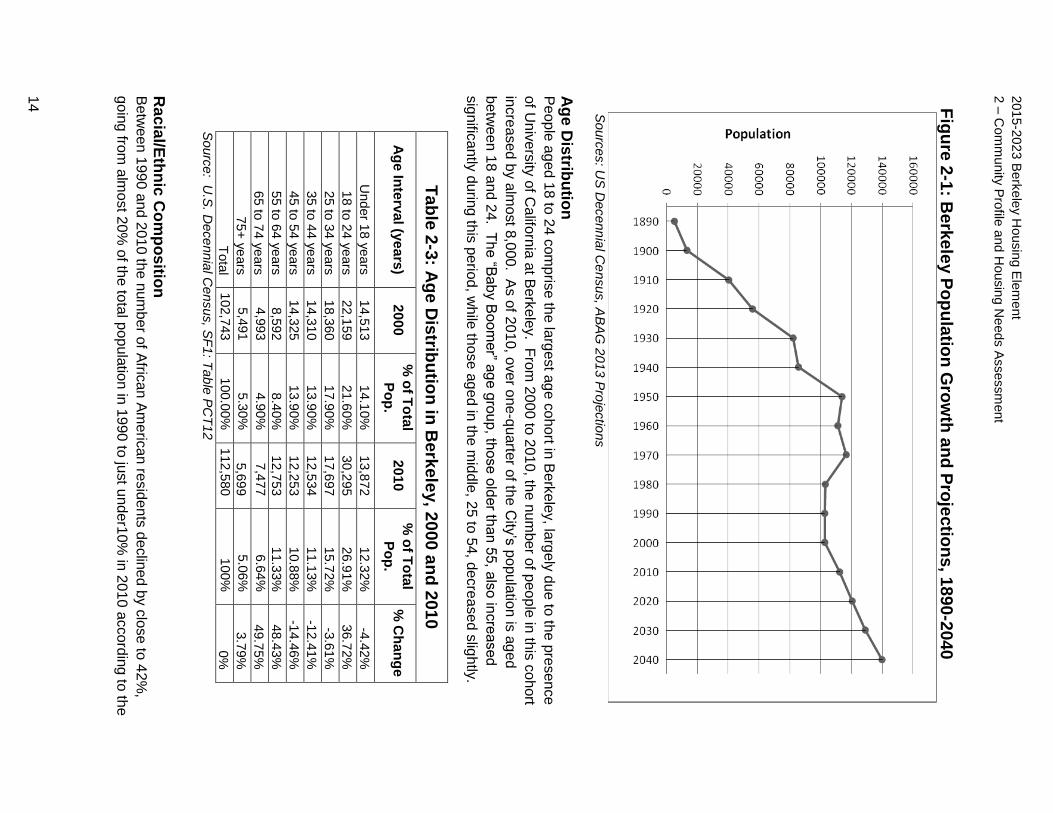
Fig
ure
2-1
: Berk
ele
y P
op
ula
tion
Gro
wth
an
d P
roje
ctio
ns, 1
890
-2040
S
ourc
es: U
S D
ecenn
ial C
ensus, A
BA
G 2
013
Pro
jectio
ns
Ag
e D
istrib
utio
n
Pe
op
le a
ged 1
8 to
24 c
om
pris
e th
e la
rge
st a
ge c
oho
rt in B
erk
ele
y, la
rge
ly d
ue
to th
e p
resen
ce
of U
niv
ers
ity o
f Ca
liforn
ia a
t Be
rke
ley. F
rom
200
0 to
20
10
, the n
um
be
r of p
eo
ple
in th
is c
ohort
incre
ase
d b
y a
lmo
st 8
,000
. As o
f 201
0, o
ve
r one
-qu
arte
r of th
e C
ity’s
popu
latio
n is
ag
ed
betw
een
18
and
24. T
he “B
aby B
oom
er” a
ge
gro
up, th
ose
old
er th
an
55, a
lso
incre
ase
d
sig
nific
antly
durin
g th
is p
erio
d, w
hile
those a
ge
d in
the m
iddle
, 25 to
54, d
ecre
ase
d s
ligh
tly.
Ta
ble
2-3
: Ag
e D
istrib
utio
n in
Berk
ele
y, 2
000
an
d 2
01
0
Ag
e In
terv
al (y
ea
rs)
20
00
% o
f To
tal
Po
p.
20
10
% o
f To
tal
Po
p.
% C
ha
ng
e
Under 1
8 y
ears
14,5
13
14.1
0%
13,8
72
12.3
2%
-4
.42%
18 to
24 y
ears
22,1
59
21.6
0%
30,2
95
26.9
1%
36.7
2%
25 to
34 y
ears
18,3
60
17.9
0%
17,6
97
15.7
2%
-3
.61%
35 to
44 y
ears
14,3
10
13.9
0%
12,5
34
11.1
3%
-1
2.4
1%
45 to
54 y
ears
14,3
25
13.9
0%
12,2
53
10.8
8%
-1
4.4
6%
55 to
64 y
ears
8,5
92
8.4
0%
12,7
53
11.3
3%
48.4
3%
65 to
74 y
ears
4,9
93
4.9
0%
7,4
77
6.6
4%
49.7
5%
75+
ye
ars
5,4
91
5.3
0%
5,6
99
5.0
6%
3.7
9%
Tota
l 102,7
43
100.0
0%
112,5
80
100%
0%
Sourc
e: U
.S. D
ece
nn
ial C
en
sus, S
F1: T
ab
le P
CT
12
Rac
ial/E
thn
ic C
om
po
sitio
n
Be
twe
en
19
90 a
nd
20
10 th
e n
um
ber o
f Afric
an A
me
rican
resid
en
ts d
eclin
ed b
y c
lose to
42%
,
go
ing
from
alm
ost 2
0%
of th
e to
tal p
op
ula
tion in
19
90
to ju
st u
nder1
0%
in 2
010 a
ccord
ing
to th
e
1890
1900
1910
1920
1930
1940
1950
1960
1970
1980
1990
2000
2010
2020
2030
2040
Population
..... ..... ..... ..... N .,. Cl") co 0 N .,. er, 0 0 0 0 0 0 0 0 0 0 0 0 0 0 0 0 0 0 0 0 0 0 0 0
0 0 0 0 0 0 0 0 0
_\
' ~ -,
"' \ ' i'...
~
\.. r
\ \ \ \

2015-2023 Berkeley Housing Element
2 – Community Profile and Housing Needs Assessment
15
decennial census. The Hispanic population increased by 42% during this same period, and now
comprises almost 11% of the total population. The Asian population also increased, from 14 to
19% of the total population. The White population increased in number, but remained at just
under 60% of the total population.
Table 2-4: Race/Ethnicity Composition of Berkeley, 1990-2010
Race
1990 2000 2010 Percent
Change,
1990-2010 # % # % # %
White 59,865 58.3% 56,691 55.2% 61,539 54.7% 2.8%
Black or African-American 18,700 18.2% 13,707 13.3% 10,896 9.7% -41.7%
Asian, Native Hawaiian/Pacific Islander 14,755 14.4% 16,861 16.4% 21,669 19.2% 46.9%
Other Races, Including American Indian 815 0.8% 891 0.9% 731 0.6% -10.3%
Two or more races n/a n/a 4,592 4.5% 5,536 4.9% n/a
Hispanic Latino 8,589 8.4% 10,001 9.7% 12,209 10.8% 42.1%
Total 102,724 102,743 112,580 9.6%
Source: U.S. Decennial Census, SF1: Tables P3, P6
2. Household Size and Composition
Households are defined as occupied housing units. Household growth is therefore a
reasonable estimate of housing unit production. Populations can grow and shrink at different
rates than households. Household size refers to the number of people per household. Changes
to household size reflect a variety of factors, including age of the population, unit sizes, cultural
background, and housing costs.
Household Size Between 1970 and 2000 the number of households remained fairly level but the population
declined. Therefore, average household size decreased during this period. Between 2000 and
2010, the total population and the number of households increased, but the average household
size remained fairly level at 2.17 persons per household.
The rate of owner-occupancy rose steadily between 1970 and 2000. In 2010, 41% of housing
units were owner-occupied, down very slightly from 43% in 2000. Family households are also
about 41% of all households in Berkeley according to the Decennial Census.

2015-2023 Berkeley Housing Element
2 – Community Profile and Housing Needs Assessment
16
Table 2-5: Berkeley Household Trends, 1970 to 2010
1970 1980 1990 2000 2010
Occupied Housing Units or Households 44,494 44,704 43,453 44,955 46,029
Number of Homeowner Households 15,979 16,883 18,998 19,207 18,846
Number of Tenant Households 28,515 27,821 24,455 25,748 27,183
Average Household Size (Persons per Household) 2.32 2.11 2.10 2.16 2.17
Percent of Units Owner-Occupied 36% 38% 44% 43% 41%
Source: U.S. Decennial Census, SF1: Tables H32, H017A, H18, P27, QT-H3
Households are larger in owner-occupied units, family households, and single-family units,
which reflects that family households are usually in owner-occupied, single-family units.
Table 2-6: Berkeley Household Characteristics, 2012
Household (HH) Type Percent of All Households
Single person 36.1%
Family, no kids 25.4%
Family with kids 17.9%
Multi-person, nonfamily 20.6%
Total households 44,877
Average Family Size 2.89 persons per HH
Owners Average HH Size 2.49 persons per HH
Renters Average HH Size 2.09 persons per HH
Sources: U.S. Census Bureau, ACS 2008-2012 5-Year Estimates., Tables DP02,
DP04, B08201
Based on the 2008 to 2012 American Community Survey (ACS) five year estimate, 86.4% of the
households in Berkeley are comprised of three or fewer people, and 13.6% have four or more
people. By comparison, in Alameda County, 25.5% of households have four or more people.
Overcrowding Overcrowding occurs when a household’s living area is too small to meet the needs of the
household. The U.S. Department of Housing and Urban Development (HUD) defines
“overcrowded” units as having more than one person per room (excluding bathrooms and
kitchens) and “severely overcrowded” units as having more than two persons per room. Based
on this definition, a two-bedroom unit with a living room housing a family of four would be
classified as "overcrowded" (1.33 person per room).
The ACS estimates the number of overcrowded households. Based on the 2008-2012 survey,
Berkeley did not see a high incidence of overcrowding in 2012. Of the 44,877 occupied housing
units estimated in the ACS, 2.6% (1,176 units) met the census definition of overcrowded. Of
those, 1.2% were severely overcrowded. Furthermore, Berkeley’s overcrowding rates are much
lower than those of Alameda County. Alameda County’s overcrowded units accounted for 5.6%
of all occupied units (3.8% overcrowded, 1.7% severely overcrowded). However, pressure on

2015-2023 Berkeley Housing Element
2 – Community Profile and Housing Needs Assessment
17
the housing stock manifests itself in other ways, such as the use of garage conversions as
informal housing.
Table 2-7: Overcrowding in Berkeley and Alameda County, 2012
Persons per Room Berkeley Alameda County
HHs % HHs %
Not Overcrowded (1 person per room or less) 43,701 97.4% 509,143 94.4%
Overcrowded (1 to 1.5 persons per room) 651 1.5% 20,635 3.8%
Severely Overcrowded (Over 1.5 persons per room) 525 1.2% 9,401 1.7%
Total 44,877 539,179
Total Percent Overcrowded 2.6% 5.6%
Source: U.S. Census Bureau ACS 2008-2012 5-year estimates, Table B25014
Overcrowding in Berkeley is higher among renter households (3.7%) compared to owner-
occupied households (1.2%). These are much lower than rates in Alameda County (8.5% and
3.0%, respectively). Based on comparisons to Alameda County, Berkeley does not consider
overcrowding to be of significant concern.
Table 2-8: Overcrowding by Tenure, Berkeley and Alameda County, 2012
Owner Renter
Berkeley Alameda County Berkeley Alameda County
HHs % HHs % HHs % HHs %
Not Overcrowded (1 person
per room or less) 18,953 98.8% 281,000 97.0% 24,748 96.3%
228,143
91.5%
Overcrowded (1 to 1.5 persons
per room) 127 0.7% 6,682 2.3% 524 2.0% 13,953 5.6%
Severely Overcrowded
(Over 1.5 persons per room)
101 0.5% 2,076 0.7% 424 1.6% 7,325 2.9%
Total 19,181 100% 289,758 100% 25,696 100% 249,42
1 100%
Percent Overcrowded by
Tenure 1.2% 3.0% 3.7% 8.5%
Source: U.S. Census Bureau, ACS 2008-2012 5- year estimate, Table B25014
Group Quarters Group quarters are a distinct type of housing unit. In Berkeley, most group quarters are
associated with the University in the form of dormitories and other student housing. Other types
of group quarters include emergency and transitional housing, skilled nursing facilities, group
homes for juveniles or adults, residential treatment centers, correctional institutions, and in-

2015-2023 Berkeley Housing Element
2 – Community Profile and Housing Needs Assessment
18
patient hospice programs. According to the decennial census, the percentage of the total
Berkeley population living in group quarters grew between 2000 and 2010 from 5.7 to 11.4
percent. This growth may be a result of undercounting the group quarters population in 2000
and the addition of new residential dorms built by the University.
Vacancy Rates Vacancy rates in Berkeley were relatively level at around four percent from 1970-2000 and
increased to seven percent in 2010 according to the decennial census. Many California cities
report an increased vacancy rate from 2000 to 2010. For example, Oakland’s rate doubled from
4.3 to 9.4 percent and San Francisco’s rate increased from 4.9 to 8.3 percent. There are several
possible explanations, such as the timing of the Census count coinciding with new housing units
becoming available and with the regional decline in housing demand due to the economic
downturn. However, it seems unlikely that this could explain the magnitude of the change, and
it is therefore possible that reporting errors may also be a contributing factor.
A vacancy rate of 3.1% is shown for all properties in Berkeley that are included in the
realAnswers inventory, a private data vendor, which surveys 1,054 rental units in nine
properties. All Berkeley properties in the realAnswers inventory consist of 50 units or more and
were constructed between 2001 and 2012. Based on the low vacancy rate in new multifamily
developments, which have higher rents than older construction, it is reasonable to conclude the
vacancy rate among older units is also lower than that reported by the 2010 Census.
Conventional wisdom is that a “normal” vacancy rate is about two percent for owner-occupied
housing, six to seven percent for rental housing, and about five percent overall.2 Many
ordinances use a five percent long-term vacancy rate as the measure of a healthy rental market.
Table 2-9: Occupied Housing Units and Vacancy Rates, 1970 to 2010
1970 1980 1990 2000 2010
Number of Housing Units 46,160 46,334 45,735 46,875 49,454
Occupied Housing Units or Households 44,494 44,704 43,453 44,955 46,029
Vacant Housing Units 1,666 1,630 2,282 1,920 3,425
Vacancy Rate 3.6% 3.5% 5.0% 4.1% 6.9%
Source: U.S. Decennial Census Table QT:H1
3. Special Needs Populations
Populations with special housing needs are defined by the State as the homeless, people with
disabilities, the elderly, large families, and single-parent families. State Housing Element law
2 Although it is difficult to pinpoint one original source of this conventional wisdom, an internet search of
“normal vacancy rate” finds numerous references in real estate reports, housing studies, academic
research, and other documents to a “normal” vacancy rate for a housing market in balance as being
about five percent overall, two percent for ownership housing, and six or seven percent for rental housing.
2015-2023 Berkeley Housing Element
2 – Community Profile and Housing Needs Assessment
19
requires an assessment of these populations and programs that help address their housing
needs. Programs are discussed in Chapter 6.
Homeless The most comprehensive data currently available on Berkeley’s homeless population comes
from a 2009 Alameda Countywide Homeless Count.3 The 2013 count did not provide Berkeley-
specific data. Overall, the total number of people homeless in Berkeley in a given week has
remained fairly steady since 2003. A total of 835 people were counted in 2003, compared to 824
in 2009, and an estimated 688 in 2013. The 2009 count combines statistical analysis of people
staying in emergency shelter and transitional housing with surveys of people using various
daytime service sites include drop-in centers, meal programs, and food pantries.
The 2009 count found a total of 824 people homeless in Berkeley. This included 680 people
who were homeless at that time, and another 144 in certain temporary situations. Specifically,
the 2009 count found:
680 literally homeless people, meaning people without permanent housing: residing on the streets, places not meant for human habitation, in shelters or in transitional housing programs. This included 526 adults without dependents, and 125 people in families.
276 chronically homeless adults in Berkeley, a subset of the literally homeless—adults unaccompanied by children, who have at least one disability and have been homeless for over a year or four or more times in the last year.
144 hidden homeless people, meaning people in precarious housing situations: living temporarily with a friend or relative, in a motel, or facing eviction within seven days.
The 2009 count also found that Berkeley’s homeless population was more likely to be disabled
than homeless people in other parts of the county, which is not surprising since people in
Berkeley are more likely to be chronically homeless, and the HUD definition of chronic
homelessness includes at least one disability. The following statistics are based on the
respondent’s self-report, not an assessment4:
41% of Berkeley’s literally homeless were severely mentally ill, compared to 30% countywide.
40% of Berkeley’s literally homeless were chronic substance abusers, similar to 36% countywide.
3 As a condition of the more than $22 million in homeless housing and services funding that Alameda
County programs receive annually, the U.S. Department of Housing and Urban Development (HUD)
requires a countywide homeless count every other year, but does not require city-level data. Although
that data is very useful for planning, obtaining it is very resource-intensive and therefore not done at every
count.
4 2009 Alameda Countywide Homeless Count and Survey, Table A6-4: Alcohol dependence, drug abuse
and dependence, and mental illness by region.

2015-2023 Berkeley Housing Element
2 – Community Profile and Housing Needs Assessment
20
Half of Berkeley’s chronically homeless population had both a mental illness and alcohol or other drug dependence.
20% of Berkeley’s homeless population is veterans, similar to 17% countywide. Although 23% of veterans did not serve in a war zone, the most commonly reported war zones were Vietnam (46% of veterans), Korea (8%), Europe (7%), and the Persian Gulf (6%). Less than one percent reported Iraq or Afghanistan.
Analysis of changes from the 2003 to 2009 homeless counts found:
The number of chronically homeless people (a subset of the literally homeless)
decreased significantly from 529 in 2003 to 276 in 2009.5
Berkeley’s share of the countywide chronically homeless population decreased from
41% in 2003 to 27% in 2009.
People who are residing on the streets, places not meant for human habitation, in
shelters or in transitional housing programs (the “literally homeless”) decreased by 17%
since 2003, from 821 to 680. The decrease was mainly among adults with no
dependents, by 28% from 727 to 526, while individuals in families increased from 94 to
125, or one-third.
Since 2003, the number of Berkeley’s hidden homeless (living temporarily with a friend
or relative, in a motel, or facing eviction within seven days) increased from 14 to 144
people (equal to 10 times).
In Berkeley, the hidden homeless constitute a much smaller proportion of all homeless
(17%) than countywide (41%).
The following graphs illustrate changes in Berkeley between 2003 and 2009 counts.
5 HUD defines people as being chronically homeless if they have been homeless a long time or
frequently, are single, and have at least one disability.

2015-2023 Berkeley Housing Element
2 – Community Profile and Housing Needs Assessment
21
Figure 2-2: Berkeley’s Homeless Population
529
276
198
250
94
125
14
144
0
100
200
300
400
500
600
700
800
900
2003 2009
Berkeley's homeless population decreased slightly but changed significantly from 2003 to 2009
Hidden homeless adults and families
Adults and children in families, literally homeless
Other literally homeless adults without dependent children
Figure 2-3: Berkeley’s Chronic Homelessness
276
1,026
125
1,478
250
1,609
144
3,042
0%
10%
20%
30%
40%
50%
60%
70%
80%
90%
100%
Berkeley Alameda County
Chronic homelessness is still more common in Berkeley than in other areas of Alameda County
Hidden homeless
Other literally homeless
adults without dependent
childrenAdults and children in
families, literally homeless
Source: City of Berkeley Housing Department
People with Disabilities People with disabilities often have special housing requirements due to the need for
accessibility, frequently fixed low incomes, and higher health care costs associated with a
D
D
D
D
D
D

2015-2023 Berkeley Housing Element
2 – Community Profile and Housing Needs Assessment
22
disability. According to the 2008-2012 ACS population estimate, 8% of the total Berkeley
population had one or more disabilities, compared to 9.2% in Alameda County.6
Table 2-10: Berkeley Residents Reporting a Disability by Age Group, 2012
Age Range Under 18 18 to 64 65+ Total
Number with disability in age range 316 4,787 3,933 9,036
Total population in age range 14,580 84,402 13,353 112,335
Percent of population with disability 2.2% 5.7% 29.5% 8.0%
Source: American Community Survey 2008-2012 5-Year Estimates Table DP02
Of individuals over 18 with a disability, approximately 2,000 had incomes at or below 50% of the
area median income, roughly 2% of Berkeley residents. Many within this population must rely
on Supplemental Security Income (SSI) as a sole source of income and thus face difficulties
affording housing. In 2013, the monthly California SSI payment for a single person with a
disability was $866.40 while the median rent for a rent-stabilized studio in Berkeley was $1,000,
which means a person who depended on SSI as a sole source of income would not be able to
afford to rent a studio apartment in Berkeley. Housing that would be considered affordable to
someone on SSI, under the U.S. Department of Housing and Urban Development’s standard of
30% of gross income, would cost $260 per month.
Table 2-11: Types of Disabilities Reported by Berkeley Residents
Disability Type Hearing
Difficulty
Vision
Difficulty
Cognitive
Difficulty
Ambulatory
Difficulty
Self-Care
Difficulty
(age 18+)
Independent
Living Difficulty
(age 18+)
Number of persons 2301 1691 3681 4558 2138 3810
Percent of Total Population 2% 2% 3% 4% 2% 3%
Source: U.S. Census Bureau, ACS 2008-2012 5-Year Estimates, Table S1810 Note: Total tallied disabilities in this chart exceed the total disabled population due to instances in which one person reported more than one disability.
Ambulatory and Self-Care Difficulties
Individuals with disabilities in Berkeley have varied housing needs based on their type of
disability. The 2008-2012 American Community Survey estimates that 3,173 non-senior
individuals have ambulatory and/or self-care difficulties, which are defined by the Census
Bureau as having serious difficulty walking or climbing stairs and having difficulty bathing or
6 The percentage of Berkeley residents reporting a disability in the 2008-2012 American Community
Survey is significantly lower than that of the 2000 Census, which was reported in the City of Berkeley’s
2009-2014 Housing Element. There is evidence of error in the way people responded to the 2000
Census questions about disability, resulting in an overestimate of the population with disabilities. In
addition, data from the 2008-2012 ACS include margins of error. Thus, the figures reported here should
not be compared to those included in the previous Housing Element.

2015-2023 Berkeley Housing Element
2 – Community Profile and Housing Needs Assessment
23
dressing, respectively. Members of this population frequently require accessibility features
within their homes. Since 90% of Berkeley’s housing stock was built before 1970, assistance
with adaptation of older units is often needed. People with disabilities also need a range of unit
sizes. For example, a single adult may need a two-bedroom unit to accommodate a live-in
attendant. Other people with disabilities have families or may choose to live with roommates,
thus needing larger units.
Cognitive Difficulties
The 2008-2012 American Community Survey reports that 3,681 Berkeley residents have
cognitive difficulties, which are defined by the Census Bureau as difficulties remembering,
concentrating, or making decisions due to a physical, mental, or emotional problem. Although a
cognitive difficulty alone may not result in housing needs related to the physical housing unit,
people with cognitive difficulties may need access to mental health and other social services in
order to remain in their homes, as well as having the affordable housing needs described
above.
Developmental Disabilities
The Developmental Disabilities Board Area 5, the Bay Area’s office of the State Council on
Developmental Disabilities, recently estimated a need for housing opportunities for 688 people
with developmental disabilities, which translates to 232 housing units, in Berkeley from 2015 to
2023.7 Although at one time people with developmental disabilities were housed in large
institutions, housing types identified by the Developmental Disabilities Board Area 5 range from
affordable rental housing in all types of developments and single family housing to tax credit
financed special needs housing and housing specially modified for the Medically Fragile (SB
962 Homes). This reflects both current best practices defined by social services, state policy
such as the Lanterman Developmental Disabilities Act (AB 846), as well as legal rulings
including the federal Olmstead Decision (1999), mandating the "maximum possible integration
into the general community." Regardless of the type, affordability is a key issue since an
estimated 80% of people with developmental disabilities are unable to earn a substantial income
and rely on disability income (SSI), which is not sufficient to afford market rate housing in
Berkeley, as outlined in this chapter.
Seniors The 2008-2012 American Community Survey reports that 12% of Berkeley’s population is over
65, and that 21% of all Berkeley households are led by a senior householder. This is equivalent
to 9,427 senior-headed households, 73% of which are owner-occupied.
7 This estimated housing need factor was developed and provided by the Developmental Disabilities Area
Board 5 applying national prevalence statistics from the U.S. Administration on Developmental Disabilities
to current U.S. Census population estimates, and assuming that 20 to 50% of the population, depending
on age cohort, needs housing. These need assumptions were developed based on the people with
developmental disabilities currently receiving services locally.

2015-2023 Berkeley Housing Element
2 – Community Profile and Housing Needs Assessment
24
Some of the main housing issues facing seniors are housing cost and mobility. Of the senior-
headed households, 18% had income levels below the federal poverty guidelines. Seniors often
have fixed incomes so they have difficulty with increased rental and utility costs or housing
maintenance costs. In 2012, an estimated 34.6% of all senior-headed households in Berkeley
were extremely low-income (ELI) or very low-income (VLI) households, earning less than 50%
of area median income.
Table 2-12: Elderly Households in Berkeley by Income Level, 2012
Income Level Number of Elderly HHs Percentage of
all Elderly HHs
Extremely Low Income (0-30% AMI) 2,164 23.0%
Very Low Income (31-50% AMI) 1,095 11.6%
Low Income (51-80% AMI) 1,232 13.1%
Moderate Income (81-120% AMI) 1,493 15.8%
Above Moderate Income (121%+) 3,443 36.5%
Total Elderly Households 9,427 100%
Source: American Community Survey 2008-2012 5-Year Estimates Table S0103
According to the 2008-2012 ACS estimate, in 2012 approximately 73.5% of senior households
owned homes, and approximately 26.5% were renters. In terms of housing cost burden, the
2008-2012 American Community Survey estimates that 27.5% of senior homeowner
households and 54.7% of senior renter households were overpaying for housing, which is
defined as paying more than 30% of their income on housing costs.
The prevalence of disabilities in the population increases as the population ages, with 29.5% of
the senior population reporting one or more disability in in 2012. Ambulatory and independent
living difficulties are most common within the senior population. Between 2008 and 2012, 33.6%
of all elderly households had ambulatory and independent living limitations.
As seniors make up a larger segment of Berkeley’s population, seniors’ housing needs will
represent an increasing proportion of all local housing needs. The housing needs and
preferences of Berkeley’s seniors are as diverse as the population. Both nationally and locally,
there is increasing emphasis placed on the preference of many seniors to “age in place”: to stay
in their existing home and community as they age rather than relocating to housing or a
healthcare facility exclusively for seniors. Aging in place may require supportive services,
assistance with rehabilitation or accessibility modifications, or financial assistance. Other senior
housing needs include affordable housing opportunities, assisted care, and workforce housing
for people employed in senior services.
Transition Age Youth In recent years there has been increasing documentation and public awareness at the local and
state level of the great un-met housing and services needs of youth aged 16 to 24, particularly
those who have become homeless under the age of 18, who have been in foster care, and/or
who have a disability. This population is referred to as “transition age youth.” Support during
these critical ages can help youth transition successfully to adulthood, affecting their lives for

2015-2023 Berkeley Housing Element
2 – Community Profile and Housing Needs Assessment
25
decades to come. Youth without adequate support, particularly those who have been in foster
care and those with a disability, are at increased risk of becoming homeless. Once homeless,
youth face multiple barriers to accessing needed supports and transitioning to healthy
adulthoods.
There is mounting evidence that participation in foster care as a youth is linked to adult
homelessness. For example, the 2009 comprehensive countywide homelessness survey found
that 1 in 5 homeless adults (20%) in Alameda County was in an institution before age 18,
including 14% who had been in foster care. More than a third of homeless adults younger than
30 had been in an institution including foster care as a minor. The 2013 count found 10% of the
total homeless population in Alameda County were transition-age youth.
The California Department of Social Services reported that 65% of California youth graduating
from foster care in FY 2000-2001 were in need of safe and affordable housing at the time of
graduation.8 Approximately 220 youth emancipate from foster care in Alameda County every
year.9 An analysis of California Department of Social Services data found that 63% of foster
youth statewide received publicly funded mental health services prior to emancipation.10
There are many youth under the age of 24 in Berkeley, in large part due to the presence of UC
Berkeley. Many youth in college have support from family although they are living
independently. It is therefore difficult to assess the youth population with special needs in
Berkeley from the Census data. Based on Alameda County and state-level data and information
from local service providers, it is clear that transition age youth in Berkeley are in need of
affordable housing opportunities with supportive services.
Single Parent Families Based on the 2012 ACS five year estimate, Berkeley and Alameda County as a whole had
similar percentages of single parent families as a percentage of all families (5% and 8.7%,
respectively). This represented a decrease in the prevalence of single parent households in
Berkeley in 2000 (14%), which may be a reflection of the survey methodology rather than a
significant change in household composition. Generally speaking, families need housing units
with three or more bedrooms. In particular, Berkeley needs family housing units affordable to
lower income households. See also the discussion of household size and overcrowding.
8 California Department of Social Services, Independent Living Program Policy Unit, Child and Youth
Permanency, Report on the Survey of the Housing Needs of Emancipated Foster/Probation Youth, 2002.
Cited in Campaign for Safe Transitions: Housing for Former Foster Youth handout, 4/25/2005. 9 Amanda Richards, Housing, Services, and Support: A Comprehensive Housing Continuum for Youth
Aging Out of Foster Care in Alameda County, May 2004, p. 8. 10
Barbara Needell, Stephanie Cuccaro-Alamin, Alan Brookhart, William Jackman, and Aron Shlonsky,
Youth Emancipating from Foster Care in California: Findings Using Linked Administrative Data, pp. 27-29,
Center for Social Services Research, University of California at Berkeley, May 2002.

2015-2023 Berkeley Housing Element
2 – Community Profile and Housing Needs Assessment
26
Table 2-13: Single Parents, Berkeley and Alameda County, 2012
Number of Single Parent Households
2000 2012
Male Female Total Male Female Total
Berkeley 652 1,974 2,626 471 1,788 2,259
Alameda County 10,853 35,482 46,335 11,686 35,300 46,986
Source: Decennial Census and ACS 2008-2012 5 Year Estimate Table DP02
B. Housing Stock Characteristics
Most of Berkeley’s buildings were constructed between 1875 and 1940. The story of how
Berkeley developed can largely be read by just viewing the urban landscape. Building styles,
which are usually quite traceable to particular periods, vary from area to area and often from
street to street. In some places, different stages of development are revealed by an occasional
remnant Victorian, or by the area’s general mixture of later styles. The early transportation hubs
can still be detected by the evidence of commercial centers and building clusters from different
decades.
Broadly speaking, the areas close to the University and Downtown had their initial construction
in the 19th Century, though many of them were later substantially rebuilt. West Berkeley, and
the village of Lorin in South Berkeley, also had their start in the 19th Century. The initial pattern
was a response to the original transportation system of boats, streetcars, and trains. The areas
in between remained largely open for some time then filled in, especially in the 20th Century’s
first three decades. The expanded suburban development in the hills followed the opening of
new streetcar lines, the 1906 earthquake, and ultimately the common use of the automobile.
Densities are greatest in the areas close to the University and Downtown, where there are multi-
unit apartment buildings and large single-family homes converted to rooming houses or
apartments. Density can also be found along the main arterials of the city in both older and new
apartment buildings. The majority of the city is characterized by small lots with one to four units.
1. Housing Units
Building Types In 2012 as in 2000, almost half of all of Berkeley’s housing stock was in single-family units.
According to the 2008-2012 ACS estimates, roughly 43% of Berkeley’s housing units are owner-
occupied. Of the multi-family units, an estimated 7,398 units are in buildings with 20 or more
units.

2015-2023 Berkeley Housing Element
2 – Community Profile and Housing Needs Assessment
27
Figure 2-4:
Source: US Census, ACS 2008-2012 5-Year Estimate., Table B25024
Unit Size About two-thirds of the housing units in Berkeley are studios, one-bedroom or two-bedroom
units. Looking at 2008-2012 ACS data, we see that Berkeley has fewer three and four bedroom
units as a percentage of all units than California and Alameda County. Berkeley has a similar
percentage of two bedroom units and a higher percentage of studios and one-bedroom units
than the state and county, which is similar to the unit composition in San Francisco.
Figure 2-5:
Source: U.S. Census, ACS 2008-2012 5-Year Estimate, Table B25041
Berkeley's Housing Stock by Number of Units in Building, 2012
20+ Units ............_
15% "-...
10-19 Units
9%
5-9 Units
8%
12%
2 U n its
9%
1 Unit
47%
Berkeley's Housing Stock by Bedrooms in Unit, 2012
5 or more bedrooms '\
4% \
4bedrooms 10%
3 bedrooms 20%
8%
1 bedroom l/%
----2 bedrooms 31%

2015-2023 Berkeley Housing Element
2 – Community Profile and Housing Needs Assessment
28
Figure 2-6:
0.0%
5.0%
10.0%
15.0%
20.0%
25.0%
30.0%
35.0%
None 1 2 3 4 5+
Number of Bedrooms
Berkeley Housing Stock Comparison, 2000 CensusPercentage of Units by Number of Bedrooms
California
Alameda County
Berkeley
San Francisco
Source: U.S. Census Table H41
Larger units are predominantly owner-occupied. According to the ACS, in 2012 just over 50%
of renters were in studios or one-bedroom units while 65% of owner-occupied units were three,
four, or five bedroom units.
Table 2-14: Number of Bedrooms in Unit by Tenure, 2012
Owner
Occupied
% of Owner
Occupied
Renter
Occupied
% of Renter
Occupied
No bedroom 100 0.52% 3,078 11.98%
1 bedroom 1,046 5.45% 10,532 40.99%
2 bedrooms 5,581 29.10% 8,379 32.61%
3 bedrooms 6,955 36.26% 2,477 9.64%
4 bedrooms 3,903 20.35% 713 2.77%
5 or more bedrooms 1,596 8.32% 517 2.01%
Total 19,181 100.00% 25,696 100.00%
Source: U.S. Census, ACS 2008-2012 5-Year Estimate, Table B25042
Unit sizes are reflected in Berkeley’s average household size (2.17) and smaller proportion of
family households, especially families with five or more people. This suggests a possible need
for larger units in order to add to the diversity of household sizes. Although the City has not
collected data on the bedroom composition in new construction, the City estimates most of the
units are two bedrooms or fewer.
f- f-
f- f-
f- f-
~ - f- f-
~ - f- f-
-
l -
I rn1l.
D
D
•

2015-2023 Berkeley Housing Element
2 – Community Profile and Housing Needs Assessment
29
Age of Housing Stock and Housing Condition Eighty-three percent of Berkeley’s housing stock was built before 1970, compared to 57% in
Alameda County and 44% in California. According to city records, approximately 1,500 new
units were built after 2000.
Table 2-15: Age of Housing Stock, Berkeley, Alameda County, and California
Berkeley City Alameda County California
Estimate Percent Estimate Percent Estimate Percent
Built 2010 or later 30 0.06% 948 0.16% 26,855 0.20%
Built 2000 to 2009 1,949 4.01% 42,032 7.22% 1,582,291 11.58%
Built 1990 to 1999 1,155 2.38% 48,271 8.30% 1,448,198 10.60%
Built 1980 to 1989 1,788 3.68% 63,985 11.00% 2,098,797 15.36%
Built 1970 to 1979 3,142 6.47% 97,253 16.71% 2,512,508 18.38%
Built 1960 to 1969 4,704 9.68% 80,606 13.85% 1,883,730 13.78%
Built 1950 to 1959 5,864 12.07% 78,516 13.49% 1,917,277 14.03%
Built 1940 to 1949 4,943 10.17% 49,069 8.43% 891,198 6.52%
Built 1939 or earlier 25,008 51.47% 121,179 20.83% 1,306,372 9.56%
Total 48,583 100% 581,859 100% 13,667,226 100%
Source: U.S. Census, ACS 2008-2012 5 Year Estimate, Table B25034 Note: There is a discrepancy between ACS data and the City’s records regarding the number of new units built since 2000. However, ACS data is reported here to allow for consistent comparison between Berkeley, Alameda County, and California.
Despite the prevalence of older units in Berkeley, the City’s housing stock is in very good
condition. This is likely due to the amount of owner-occupied, single family units and high
property values.
Table 2-16: Age of Berkeley's Occupied Housing Units by Building Size
Units in Building
Year Built 1 2-4 5-19 20+ Other
2000 or later 261 96 120 1305 9
Built 1980 to 1999 903 391 671 824 45
Built 1960 to 1979 4369 1292 2382 2114 124
Built 1940 to 1959 4369 2448 2095 1182 45
Built 1939 or earlier 14107 4926 2158 1364 28
Total 24,009 9,153 7,426 6,789 251
Source: U.S. Census, ACS 2008-2012 5 Year Estimate, Table B25127
Over time the City has implemented a variety of programs to upgrade the quality of housing
units in the City, including home rehabilitation loan programs and the Rental Housing Safety
Program. Based on the experience with these programs, and the rapid increase in property
values in Berkeley over the last decade coupled with availability of home equity loans for home
rehab, the City believes a very small number of housing units in Berkeley have significant
rehabilitation needs.

2015-2023 Berkeley Housing Element
2 – Community Profile and Housing Needs Assessment
30
2. Units At-risk for Conversion
Affordable housing developments in Berkeley that have subsidies or restrictions expiring in the
next ten years and may be at risk for converting to market rate are discussed in Chapter 6,
Housing Programs and Quantified Objectives, under “Preserving Restricted Units at Risk of
Conversion to Market Rate.”
C. Income, Employment and Housing Costs
Income The U.S. Department of Housing and Urban Development (HUD) and California Planning and
Zoning Laws (Government Code Sections 65584(a)(1) and 65584(e)), used by both the
Department of Housing and Community Development (HCD) and Association of Bay Area
Governments (ABAG) characterize households as “extremely low-income,” “very low-income,”
“low-income,” “moderate-income”, or “above-moderate income” based on percentages of the
Area Median Income (AMI).11 The income categories are defined below:
Extremely Low-Income: Up to 30 percent of AMI
Very Low- Income: 31 percent to 50 percent of AMI
Low-Income: 51 percent to 80 percent of AMI
Moderate-Income: 81 percent to 120 percent of AMI
Above-Moderate Income: More than 120 percent of AMI
As shown in the table below, according to the ACS 5-year estimate, as of 2011 approximately
56% of Berkeley households had incomes above 80% of area median, and are therefore
considered to be of moderate and above-moderate income. Twenty-percent of Berkeley
households were considered to have extremely low incomes, at or below 30% of the area
median. This is a decrease compared to levels measured by the 2000 Decennial Census.
Table 2-17: Household Income Distribution by Tenure and Income Level, 2007-2011
Household Income Level
Renters Home Owners Total
HHs % HHs % HHs %
Extremely Low Income (0-30% AMI)
7,865 31.0% 1,025 4.0% 8,890 19.8%
Very Low Income (31-50% AMI)
3,650 38.2% 1,270 8.2% 4,920 11.0%
Low Income (51-80% AMI)
4,305 45.0% 1,670 10.7% 5,972 13.3%
Moderate and Upper Income (81%+ AMI)
9,565 37.7% 15,555 61.3% 25,120 55.9%
Total 25,385 100% 25,385 100% 44,905 100%
Source: Comprehensive Housing Affordability Strategy (CHAS), based on 2007-2011 ACS
11 The Moderate (80-120% of AMI) and Above Moderate (over 120% of AMI) income categories are not
used by HUD.

2015-2023 Berkeley Housing Element
2 – Community Profile and Housing Needs Assessment
31
The 2014 median family income estimate for the Alameda County, according to the U.S.
Department of Housing and Urban Development (HUD), is $88,500 for a family of four. Based
on this median income, HUD establishes income limits by family size for program eligibility. The
median income is based in part on the survey results of the American Community Survey.
In Berkeley, the median household income in 2012 was $63,505 according to the ACS 5-year
estimate. This includes all household sizes and types. The median income for a family
household was $106,583, which excludes households with more than one person who are not
related. The median income for non-family households was $40,832. The differences in income
based on household type are in part a reflection of student residents, who are in non-family
households and report low incomes.
The pie chart below illustrates the income breakdown of Berkeley households based on the
2008-2012 American Community Survey.
Figure 2-7: Household Income Distribution in Berkeley, ACS 2008-20012 Estimates
Source: ACS 2008-2012 5-year estimates, Table S1901
Employment The largest employment sector in Berkeley in 2013 was government and university, with several
of the top 10 employers in Berkeley in this sector, dominated by the University of California
Berkeley, with 14,800 employees. The second largest sector was health care and social
assistance, which includes the Alta Bates Medical Center.
Above Moderate Income (>$92,566)
37"
Very Low Income ($23,142-$38,569)
11%

2015-2023 Berkeley Housing Element
2 – Community Profile and Housing Needs Assessment
32
Table 2-18: Top 10 Berkeley Employers, 4th Quarter, 2013
Employer
Number of
Employees Rank
Percentage of Total
City Employment
University of California Berkeley 14,808 1 22.6%
Lawrence Berkeley National Laboratory 3,443 2 5.3%
Alta Bates Medical center 2,393 3 3.6%
City of Berkeley 1,772 4 2.7%
Bayer Corporation 1,574 5 2.4%
Berkeley Unified School district 1,208 6 1.8%
Kaiser Permanente Medical group 585 7 0.9%
Pacific Steel Casting Company 532 8 0.8%
Berkeley Bowl 504 9 0.8%
Andronico's Market 403 10 0.6%
Total 65,575 41.51%
Source: EDD, State of California Employment Development Department, Retrieved 10/2014 *Includes full and part time workers
The table below illustrates how many employees there are in Berkeley by job sector. This is a
reflection of the jobs available in Berkeley.
Table 2-19: City of Berkeley Employment by Sector, September 2013
Sector Employees Percent of Total
Government & University 22,197 35.2%
Health Care & Social Assistance 7137 11.3%
Accommodation & Food Services 6714 10.7%
Retail Trade 5763 9.1%
Professional, Scientific, & Technical Services 5114 8.1%
Manufacturing 3379 5.4%
Other Services 2577 4.1%
Educational Services 1854 2.9%
Construction 1462 2.3%
Information 1374 2.2%
Wholesale Trade 1332 2.1%
Admin & Support & Waste Mgmt & Remediation 1048 1.7%
Real Estate & Rental & Leasing 874 1.4%
Arts, Entertainment, & Recreation 863 1.4%
Finance & Insurance 827 1.3%
Management Of Companies And Enterprises 237 0.4%
Non-Classified 168 0.3%
Transportation & Warehousing 103 0.2%
Agriculture, Forestry, Fishing & Hunting 13 0.0%
Total 63,036 100%
Sources: CA Employment Development Department, City of Berkeley Office of Economic Development

2015-2023 Berkeley Housing Element
2 – Community Profile and Housing Needs Assessment
33
The table below provides average annual salary by job type for five of the job sectors that make
up most of the Berkeley workforce. This information is based on annual surveys conducted by
the CA Employment Development Department. A comparison of the 2013 salaries with the
2008 salaries shows that some of these jobs types have seen wage gains in the past five years,
such as registered nurses (from $93,585 to $122,458), while others have not, such as office and
administrative support workers (from $37,245 to $36,696), and retail salespersons (from
$27,236 to $28,825). Generally speaking, the wage gains are in the higher-skilled job
categories.
Table 2-20: Average Annual Salary by Job Type, Oakland, Fremont, Hayward Metro Area,
1st Quarter 2013 Job Title Avg. Annual Salary
Health Care
Physicians and Surgeons, All Other > $203,051
Registered Nurses $122,458
Physician Assistants $107,636
Pharmacy Technicians $50,535
Healthcare Support Workers, All Other $49,022
Home Health Aides $31,802
Higher Education Engineering Teachers, Postsecondary $111,076
History Teachers, Postsecondary $98,592
Social Science Research Assistants $54,683
Graduate Teaching Assistants $30,028
Local Government Urban and Regional Planners $85,419
Fire Fighters $88,704
Parking Enforcement Workers $50,796
Other Office
Receptionists and Information Clerks $35,734
Office and Administrative Support Workers, All Other $36,696
Retail and Service
Waiters and Waitresses $22,723
Dishwashers $21,372
Retail Salespersons $28,825
Source: CA Employment Development Department, Occupational Employment Statistics (OES) Survey Results
As part of the Plan Bay Area planning process, the Association of Bay Area Governments
(ABAG) and the Metropolitan Transportation Commission (MTC) projected employment growth
and distribution for the Bay Area through 2040. Their analysis concluded that the professional
services, health and education, and leisure and hospitality sectors are expected to represent 73
percent of total Bay Area employment added from 2010 to 2040.12 Job growth in the higher
paying high-tech sectors will result in more higher-income residents who will require services,
12 Plan Bay Area, July 2013, Final Forecast of Jobs, Population and Housing, page 16

2015-2023 Berkeley Housing Element
2 – Community Profile and Housing Needs Assessment
34
such as retail, nursing and child care, education, fire and police, etc. Therefore, lower- and
middle-income jobs will also be retained and created.
Most of these new jobs are expected to locate in the region’s larger cities (such as San
Francisco, Oakland and San Jose) and Priority Development Areas. In Berkeley, job growth of
29% is projected from 2010 to 2040.13 The table below reflects the ABAG 2007 projected job
growth by sector in Berkeley, and is consistent ABAG’s 2013 projections.
Table 2-21: Employment Projections for the City of Berkeley by Industry, Number of Jobs
Industry 2010 2015 2020 2025 2030 2035
%
Increase,
2010-2035
Agriculture and Natural Resources 40 40 40 40 40 40 0.0%
Manufacturing, Wholesale, and Transportation 6,800 6,800 6,800 6,810 6,810 6,870 1.0%
Retail 6,650 6,830 6,920 7,040 7,160 7,260 9.2%
Financial and Professional Service 14,850 15,270 15,580 15,870 16,210 16,450 10.8%
Health, Educational and Recreational Service 41,310 42,970 43,960 45,040 46,320 47,610 15.3%
Other 8,730 8,830 8,850 8,860 8,870 8,920 2.2%
Total Jobs 78,380 80,740 82,150 83,660 85,410 87,150 11.2%
Source: ABAG Projections 2007
Housing Costs Rental Units. As discussed the Chapter 6 under “Rent Stabilization and Tenant Protections,”
the City’s Rent Stabilization Ordinance limits annual rental increases for units built before 1980.
Since 2005, the annual adjustment for rents has been 65 percent of the percentage increase in
the Consumer Price Index for the metropolitan area. In compliance with the 1995 Costa-
Hawkins Act, landlords are allowed to establish market rate rents when a unit is vacated and
leased to a new tenant in units constructed before enactment of the law (known as “vacancy
decontrol”).
The following graph illustrates the Rent Board’s data for average market rent in new tenancies
on an annual basis from 1999 to 2013. This data reflects the average rents for all new tenancies
each year for units that are subject to rent stabilization. As a result of the economic downturn,
rents dipped slightly in 2008 but began to rise again in 2011.
13 Plan Bay Area, July 2013, Final Forecast of Jobs, Population and Housing, Table 8, page 29

2015-2023 Berkeley Housing Element
2 – Community Profile and Housing Needs Assessment
35
Figure 2-8: Berkeley Market Rents, New Tenancies, Units Subject to Rent Stabilization, 1999-2013
As shown in the tables below, monthly rents in new developments (post-1995) are substantially
higher than rents in older units (subject to rent stabilization). Due to vacancy decontrol, new
tenancies in units subject to rent stabilization reflect market rent in older construction.
Table 2-22: Average Market Rents for New Tenancies in Units Subject to Rent Stabilization (2009 and 2013)
Number of Bedrooms 2009 2013
Studio $975 $1,100
One-Bedroom $1,275 $1,460
Two-Bedroom $1,765 $2,046
Three-Bedroom $2,450 $2,895
Source: Berkeley Rent Stabilization Board
3500
3000
2500
2000 ...., C <l.J er: >
..c 1500 ...., C 0 ~
1000
500
0
. ----------• ~-- • ----- • • • • .--- .. .......... I I .---..---· I I • I I
1999 2000 2001 2002 2003 2004 2005 2006 2007 2008 2009 2010 2011 2012 2013
....... studio - lBR ---2BR ....... 3BR

2015-2023 Berkeley Housing Element
2 – Community Profile and Housing Needs Assessment
36
Table 2-23: Average Market Rents for New Multifamily Developments (2010 and 2014)
Number of Bedrooms 2010 (a)
2014 (b)
Studio $1,819 $2,239
One-Bedroom $1,930 $2,537
Two-Bedroom $2,508 $3,434
Three-Bedroom $3,900 $4,200
Source: Bay Area Economics, 2010 and 2014 (a) Rents reported for four new rental developments: Acton Courtyard, Library Gardens, Stadium Place, and Hillside Village. (b) Rents reported for five new rental developments, second quarter 2014: Berkeley Central, Fourth & U, New Californian, Hillside Village, and Library Gardens.
Preliminary analysis of current market rents suggests that rental housing in Berkeley is
generally affordable to moderate-income households earning 80-120% of AMI, particularly
households that can be accommodated in smaller units.14 For example, a single-person
household would need to earn $45,564 per year, or 76% of AMI, to afford a studio apartment
based on average market rent. However, as shown in the table below, in 2014 average market
rents exceed maximum affordable rent for all lower-income households (80% of AMI and
below).15
14 Housing is considered “affordable” if it costs no more than 30% of the household’s gross income,
including utilities. 15
Bay Area Economics, DRAFT Affordable Housing Nexus Study, 2014..

2015-2023 Berkeley Housing Element
2 – Community Profile and Housing Needs Assessment
37
Table 2-24: Affordability of Market-Rate Rental Housing in Berkeley, 2014
Household (Unit) Size
1 Person
2 Person
3 Person
4 Person
(Studio)
(1 Bedroom)
(2 Bedrooms)
(3 Bedrooms)
Average Market-Rate Rent (a)
$1,105
$1,529
$2,171
$2,914
Utility Costs (b)
$34
$48
$62
$75
Maximum Affordable Monthly Rent Extremely Low Income (up to 30% AMI) Household Income at Midpoint of Income Range (c) $9,825
$11,225
$12,625
$14,025
Max. Affordable Monthly Rent (d)
$212
$233
$254
$276
Amount Above (Below) Market Rate Rent
($893)
($1,297)
($1,917)
($2,638)
Very Low Income (31-50% AMI) Household Income at Midpoint of Income Range (c) $26,200
$29,925
$33,675
$37,400
Max. Affordable Monthly Rent (d)
$621
$700
$780
$860
Amount Above (Below) Market Rate Rent
($484)
($829)
($1,391)
($2,054)
Low Income (51-80% AMI) Household Income at Midpoint of Income Range (c) $40,050
$45,750
$51,475
$57,175
Max. Affordable Monthly Rent (d)
$967
$1,096
$1,225
$1,354
Amount Above (Below) Market Rate Rent
($138)
($434)
($946)
($1,560)
Moderate Income (81-120% AMI) Household Income at Midpoint of Income Range (c) $62,950
$71,925
$80,925
$89,900
Max. Affordable Monthly Rent (d)
$1,540
$1,750
$1,961
$2,173
Amount Above (Below) Market Rate Rent
$435
$221
($210)
($741)
Notes: (a) Based on a weighted average of rents among rent-controlled properties and among newer properties. Average
rents for rent-controlled properties are based on rents for new tenancies in the first quarter of 2014, as reported by the
Rent Stabilization Board. Average rents for newer properties are based on information reported by realAnswers,
which collects data on properties with 50 units or more, including 9 properties with a total of 1,054 units in Berkeley, all
of which were built in 2001 or later. (b) Utility costs based on utility allowance for multifamily dwellings established by the Berkeley Housing Authority in
2014. Utility cost estimates assume that water, sewer, and trash collection costs are included in monthly rental amount.
(c) Household income limits published by the California Department of Housing and Community Development for Alameda
County, 2014. Shows mid-point of income range. (d) Assumes 30 percent of income spent on rent and utilities.
Sources: California Department of Housing and Community Development, 2014; Berkeley Housing Authority, 2014; BAE, 2014
For-Sale Units. As shown in the graph below, with the economic downturn there was a
decrease in home-sales prices starting in 2008, but with the recovery, prices have returned to
pre-downturn levels.

2015-2023 Berkeley Housing Element
2 – Community Profile and Housing Needs Assessment
38
Figure 2-9: Median Home Sales Prices, Berkeley and Alameda County, 2005-2014
Sources: DataQuick, 2014; BAE, 2014. Note: (a) The July 2014 median sale price is for a single month only and is therefore not directly comparable to the annual medians.
Analysis of the affordability of for-sale housing in 2010 indicates that single-family homes and
condominiums in Berkeley were largely unaffordable for low-income households earning less
than 80 percent of AMI.16 Moderate-income households earning up to 120 percent of AMI had
substantially greater ability to purchase single-family homes and condominiums in the City.
Recent analysis of the affordability of market rate condominiums indicates that in 2014 fewer
condominiums are affordable to moderate and lower income households than were in 2010.17
Condominium sales prices in Berkeley are largely unaffordable for households with low or
moderate incomes based on affordability scenarios for a three-person household, meaning
household income needs to exceed 120% of AMI.
16 Bay Area Economics Affordable Housing Fee Nexus Study, July 2010, Appendix A.
17 Bay Area Economics Affordable Housing Fee Nexus Study, forthcoming.
$900,000 ~----------------------------$-78-5-,0-0-0
$soo,ooo +.-=7"'0"'""0,""'oo""o,---,..7"'0"'0",0""oo~'r1-"l-ftftft-:.$=59=s,....,,o=o=o-----------------<R=r-qft-AflA------.-
$700,ooo +-----------...::-----~~'tAft----....,.-;=,,,-;=-:;"""'~~----$600,ooo 1 ----..----------~---~iiiioiii---"'iiiiiii;;;;:::;;;;;.;~..,c...------.--$500,000 ~~-l:fl:H:~=,J.)J.U.L----l'=~'-'3',,;,--------------------=--~R"rf')Afl-
$400,000 +-----------"""""'-.::-;;;;::::::::~;;;;;:;:::::::::::::;..-=--9 48€~1:J-----$300,000 +-----------------A-A1')A-----.,.,,;,,,..,.n"'l"r------
$200,000 +------------------------------
$100,000 +-------------------------------
$0 +-------------------------------2005 2006 2007 2008 2009 2010 2011
- Berkeley - Alameda County
2012 2013 July 2014 (a)

2015-2023 Berkeley Housing Element
2 – Community Profile and Housing Needs Assessment
39
Table 2-25: Affordability of Market Rate Housing in Berkeley, 2009-2010 Single-Family Residences
Percent of 3-BR
Income Max. Affordable SFRS sold within
Income Level Limit (a) Sale Price (b) Price Range (c)
Extremely Low-Income (Up to 30% AMI) $26,800 $128,700 1.8%
Very Low-Income (Up to 50% AMI) $44,650 $214,400 3.6%
Low-Income (Up to 80% AMI) $66,250 $318,200 14.3%
Moderate Income (Up to 120% AMI) $107,150 $514,600 33.9%
Median Sale Price $598,000
Number of Units Sold 56
Condominiums
Percent of 2-BR+
Income Max. Affordable Condos sold within
Income Level Limit (a) Sale Price (b) Price Range (c)
Extremely Low-Income (Up to 30% AMI) $26,800 $81,100 0.0%
Very Low-Income (Up to 50% AMI) $44,650 $168,800 0.0%
Low-Income (Up to 80% AMI) $66,250 $274,900 7.4%
Moderate Income (Up to 120% AMI) $107,150 $475,800 48.1%
Median Sale Price $481,000
Number of Units Sold 27
Notes:
(a) Income limits published by CA Department of Housing and Community Development for four-person household in Alameda County, 2009.
(b) Assumptions used to calculate affordable sales price:
Mortgage terms:
Annual Interest Rate (Fixed) 4.99% March 25, 2010 Freddie Mac Average Fixed Rate Interest Rate
Term of mortgage (Years) 30
Percent of sale price as down payment 20.0%
Initial property tax (annual) 1.25%
Mortgage Insurance as percent of loan amount 0.00%
Annual homeowner's insurance rate as % of sale price CA Dept. of Insurance website
Single-Family 0.29%
Condominium 0.13%
PITI = Principal, Interest, Taxes, and Insurance
Percent of household income available for PITI 35.0%
Homeowners Association Fee $300 Estimate based on HOA fees of Berkeley condos on market
(c) Single-Family Residential analysis based on all full and verified sales between November 1, 2009 and March 23, 2010.
Single- family residential analysis includes 3-bedroom units only. Condominium analysis based on sales occurring between
July 1, 2009 and March 23, 2010. Condominium analysis includes 2-,3-, and 4-bedroom units due to lower number of sales.
Sources: Dataquick, 2010; California Department of Housing and Community Development, 2009; Freddie Mac, 2010;
California Department of Insurance, 2010; BAE, 2010.

2015-2023 Berkeley Housing Element
2 – Community Profile and Housing Needs Assessment
40
Table 2-26: Affordability of Market Rate Condominiums in Berkeley, 2014
Percent of Condos
Income
Max. Affordable
on Market Within
Income Level
Limit (a)
Sale Price (b)
Price Range (d)
Extremely Low-Income (Up to 30% AMI) $25,250
$50,145
0.0%
Very Low-Income (Up to 50% AMI)
$42,100
$128,020
1.0%
Low-Income (Up to 80% AMI)
$60,850
$214,675
5.2%
Median-Income (Up to 100% AMI)
$84,150
$322,360
12.4%
Moderate-Income (Up to 120% AMI)
$101,000
$400,235
26.8%
Median Sale Price
$507,000
Number of Units Sold
97
Notes:
(a) Income limits published by California Department of Housing and Community Development for a
three-person household in Alameda County, 2014. (b) Mortgage terms:
Annual Interest Rate (fixed)
4.13%
Term of mortgage (years)
30
Percent of sale price as down payment
20%
Initial property tax (annual)
1.27%
Mortgage Insurance as percent of loan amount
N/A
Annual homeowner's insurance rate as percent of sale price
0.57%
Homeowners Association Fee (monthly, condominiums only)
$360
Percent of household income available for housing costs
30%
(c) Consists of all full and verified sales of single-family residences in the 95035 between 1/1/2013
and 8/15/2013 (d) Consists of all full and verified sales of condominiums in Berkeley between 7/1/2013 and
7/31/2014. Sources: DataQuick, 2014; Freddie Mac, 2014; California Department of Insurance, 2014; Alameda
County Auditor-Controller, 2014; Condos.com, 2014; Zillow.com, 2014; BAE, 2014.

2015-2023 Berkeley Housing Element
2 – Community Profile and Housing Needs Assessment
41
Overpaying Households. As a result of relatively high housing costs, many people with low,
very low, and extremely low incomes meet HUD’s criteria for being housing cost burdened or
severely housing cost burdened, meaning paying more than 30% or more than 50% of income
for their housing costs. The following table shows rent burden data from the 2007-2011 ACS.
Compared to owner households, a greater percentage of renter households are faced with
housing cost burdens. Nearly one-third of renter households were paying more than 50% of
their income on rent The lower the household’s income, the more likely it is to be paying a large
portion of income for housing. About two-thirds of the extremely low-income renter households
were paying more than half their income for housing costs in 2011 (5,406 households).
Table 2-27: Percent of Berkeley Households Overpaying for Housing
Renters Owners All Households
Paying >
30% Paying >
50% Paying >
30% Paying >
50% Paying >
30% Paying > 50%
Percentage of Households 54.5% 32.3% 33.1% 15.8% 45.3% 25.2%
Sources: Comprehensive Housing Affordability Strategy (CHAS) 2007-2011, ACS 5-year Estimates

42
<Page Intentionally Left Blank>

2015-2023 Berkeley Housing Element 3 – Projected Housing Needs and Land Resources
43
3 - Projected Housing Need and Land Resources Purpose A required component of the Housing Element is a list of sites suitable for residential development that can accommodate the City’s “fair share” of housing needs. Every city and county in the state is allocated a certain number of housing units by affordability level that must be accommodated in its Housing Element to help plan to meet its share of projected adequate housing for the state. If a municipality cannot show there is an adequate capacity, it is required to rezone areas to allow for the projected growth. The projected growth is determined by the regional Council of Governments through the Regional Housing Needs Allocation (RHNA) process. Based on this process, Berkeley needs to demonstrate capacity for 2,959 new units for the current planning period.1 Through the City’s Site Inventory and Residential Capacity Analysis process (described in this chapter), the City of Berkeley has shown there is adequate capacity for the RHNA-projected growth with the current zoning regulations. The analysis has shown that the City of Berkeley has a capacity for approximately 5,328 new units on underutilized parcels throughout the City. Further, the City has already issued building permits for 137 units for this current RHNA planning period (since January 1, 2014), which count as progress towards our RHNA goal. This chapter is organized as follows:
A. The Regional Housing Needs Allocation (RHNA) process, a description of the Berkeley’s projected housing needs.
B. The Site Inventory and Residential Capacity Analysis, a description of where there is adequate capacity in Berkeley to meet our RHNA.
C. Other State Requirements, including zoning to accommodate lower income households and a variety of housing types.
1 The current RHNA is for an 8.8-year period, from January 1, 2014 through October 31, 2022. The 8-year Housing Element planning period is from January 31, 2014 through January 31, 2022.

2015-2023 Berkeley Housing Element 3 – Projected Housing Needs and Land Resources
44
A. Regional Housing Need Allocation (RHNA) The RHNA is a state-required process for determining how many housing units, by levels of affordability, each community must plan to accommodate during the RHNA cycle; the current allocation is for January 1, 2014 through October 31, 2022. The California Department of Housing and Community Development (HCD) determines the total housing need for the region, and the Association of Bay Area Governments’ (ABAG) distributes this need between the local governments within the nine-county Bay Area. ABAG worked with the local governments, including the City of Berkeley, to develop a methodology to allocate housing units among the different cities and counties.2 As a result of this process, the City of Berkeley has been allocated 2,959 housing units. The units are broken down into income categories to encourage cities to plan for an equitable distribution of low-income housing. The breakdown by income is shown in the table below.
Table 3-1: City of Berkeley RHNA Capacity Requirement 2014-2022 Income Category Income Range No. of units % of Total
Extremely Low Income (ELI) Up to 30 % of AMI 266 9% Very Low Income (VLI) 31% - 50% of AMI 266 9% Low Income (LI) 51% - 80% of AMI 442 14.9% Moderate Income (MOD) 81% - 120% of AMI 584 19.7% Above Moderate Income (Above MOD) Above 120% of AMI 1,401 47.4% Total 2,959 100%
Source: Association of Bay Area Governments Regional Housing Needs Allocation. AMI = Area Median Income; for a family of four in Alameda County AMI is $92,300 (Housing and Urban Development (HUD) Department, 2011). Actual income limits based on household size. The City has a RHNA allocation of 532 very low income units inclusive of extremely low income units. Pursuant to CA Government Code Section 65583 (a)(1), the City must project the number of extremely low income housing units needed and may assume 50 percent of the very low income units as extremely low.
1. Current Progress towards meeting RHNA
Recent construction can be applied as progress towards the total number of allocated units, thus reducing the need to plan for future housing. For the City of Berkeley, housing units which have been issued building permits on or after January 1, 2014 may be credited towards the 2014-2022 RHNA. From January 1, 2014 through September 1, 2014, the City has issued building permits for 137 dwelling units. Additionally, between January 1, 2014 and September 1, 2014, Berkeley has approved conditional use permits for an additional 165 housing units. There are another 1,103 dwelling units approved within the City over the past decade that have not yet been exercised (i.e. building permits have not been issued). These are considered “pending projects,” and demonstrate that additional units are likely to be built during the RHNA planning period. 2 http://www.abag.ca.gov/planning/housingneeds/methodology.html

2015-2023 Berkeley Housing Element 3 – Projected Housing Needs and Land Resources
45
Table 3-2 below lists the housing units approved by affordability level and percentage of RHNA goal achieved. Appendix A lists projects by address with both approved building permits and land use entitlements since January 1, 2014.
Table 3-2: Progress towards 2014-2022 RHNA: Approved Units January 1, 2014 – September 1, 2014
Building Permit Action Year
Income Level Ext. Low / Very Low
Low Income
Moderate Above Moderate
Total
2014 4 0 3 59 137
RHNA 532 442 584 1,401 2,959 Percent of Goal Achieved 0.8% 0% 0.5% 4.2% 4.6%
Remaining RHNA Capacity Requirement
528 442 581 1,342 2,822
Source: City of Berkeley Planning Department
B. Site Inventory and Residential Capacity Analysis Potential for new housing units exists throughout the City. For the purpose of the Site Inventory and Residential Capacity Analysis, the City identified four main areas with the greatest potential for new units and a track record of units being built. These are the downtown, the southside area, the commercial corridors, and vacant lots in the residential districts. For the southside area, the estimated number of housing units is based on the planning process for the 2011 Southside Plan. For the downtown, the capacity estimate is based on sites identified during the Downtown Area Plan planning process. For the commercial corridors, the City developed a methodology for selecting sites and estimating capacity for the Housing Element analysis. In the residential districts, housing capacity estimates are based on the allowed residential density and the average of past development densities. The methodology for identifying housing opportunity sites and estimating residential capacity for each of the four areas is summarized below and described in more detail in Appendix A. In addition, the University of California provides housing for students, staff and faculty, and plans to build additional housing during the planning period. Table 3-3 summarizes the results of this analysis by indicating the estimated residential capacity of the four areas. Map A-1 in Appendix A illustrates the four areas.

2015-2023 Berkeley Housing Element 3 – Projected Housing Needs and Land Resources
46
Table 3-3: Summary of Residential Capacity
Inventory Area Total Estimated
Capacity (Number of Units)
Estimated Capacity towards current
RHNA Commercial Corridors 2,461 1,794 Downtown Plan Area 2,121 997 Southside Plan Area 430 430 Residential Districts 316* 237
Total Unit Capacity Estimate 5,328* 3,458
Remaining RHNA Capacity Requirement (from Table 3-2)
2,822
Estimated Excess Capacity 636 * Does not include sites that are underdeveloped. See discussion under Residential Neighborhood Opportunity Sites and Residential Capacity Analysis below.
1. Downtown Area Plan
In March 2012, the City adopted the Downtown Area Plan (DAP). The DAP is intended to guide development in the downtown area through 2030. The DAP increased the development capacity of the downtown, which provides exceptional opportunity for mixed-use, transit-oriented development. The DAP process identified a list of sites that provide opportunities for new housing construction. An analysis of these opportunity sites prepared for the Housing Element estimated a capacity of 2,130 units over the twenty-year planning period of the DAP using the adopted Downtown Mixed Use District (C-DMU) zoning. Within the Housing Element’s planning period of 2015 to 2023, the City estimates that 860 housing units will be built in the downtown. Appendix A describes the process used to identify the DAP opportunity sites and the assumptions used to estimate housing unit capacity.
2. Southside Plan
The Southside Plan (SSP) was jointly prepared by the City of Berkeley and the University of California, Berkeley to address the area south of the UC campus. The University agreed to work with the City to create the plan, and in turn, use the Southside Plan as a guide for future UC development in the area. The City adopted the Southside Plan in September 2011. The Southside Plan EIR estimated the planning area (southside) can accommodate 472 new private dwelling units by 2020. By the end of 2020, the City estimates 439 new dwelling units can be

2015-2023 Berkeley Housing Element 3 – Projected Housing Needs and Land Resources
47
developed in the Southside and count towards this current RHNA cycle.3 Appendix A describes the process used to identify the SSP opportunity sites and the assumptions used to estimate housing unit capacity.
3. Underutilized Sites on Commercial Corridors
Berkeley’s commercial corridors have experienced the greatest amount of mixed-use residential development in past years. For this reason, staff estimates the greatest capacity for new units will be on the remaining underutilized sites in the commercial districts. The commercial zoning districts C-1, C-SA, C-N, C-NS, C-E, C-SO, and C-W are along the City’s commercial corridors. The City identified underutilized sites in these zoning districts based on lot size and existing floor area ratio (FAR) using the following thresholds:
• For 10,000 to 20,000 square foot parcels, a maximum existing FAR 0.2 • For 20,000+ square foot parcels, a maximum existing FAR 0.7
The City then estimated the potential number of units that can be built on the underutilized sites. The estimates were based on average densities from development over the past 10 years in each district. To avoid overestimating potential unit yield, the density bonus units were deducted from the average densities of past projects. The resulting densities were applied to each opportunity site on a district-by-district basis. The total estimated capacity for new units on the commercial corridors is 2,461 units. Appendix A describes the process used to identify the commercial corridor opportunity sites and the assumptions used to estimate housing unit capacity.
4. Residential Districts
Most parcels in the City’s residential zoning districts are currently developed with housing. There are an estimated 239 remaining vacant parcels that are zoned for residential development. Ninety percent are in the City’s hillside district, which generally has reduced development potential due to environmental and physical constraints. Most residentially-zoned lots are already developed with homes; however, some lots have capacity for additional units. Berkeley allows “accessory dwelling units” (ADUs) with ministerial approval (“by-right”) in all residential districts on lots that are occupied by one single family dwelling. Furthermore, some parcels have development potential for additional “main” dwelling units, which require use permit approval in most cases. Therefore, staff estimated the potential for new housing units in the residential zoning districts from three sources: (1) remaining vacant lots, (2) additional main dwelling units on already developed lots, and (3) ADUs. The City estimates capacity for roughly 237 new units in the residential districts from these sources, as summarized below. Appendix A provides an explanation of the 3 The University of California also has plans for significant housing development in the southside. However, this development capacity is not included in the projected growth for the southside.

2015-2023 Berkeley Housing Element 3 – Projected Housing Needs and Land Resources
48
process used to identify residentially-zoned parcels with potential for new housing units and estimate the capacity of those lots.
• 157 units on vacant lots, • 24 units from the addition of main units to already-developed lots, and • 56 accessory dwelling units.
5. University of California Housing Production
The University of California both creates demand for housing in Berkeley and also provides housing for students and faculty. Students living in the City and in University housing are counted in the Census. The RHNA is based in part on Census information about the population and income of Berkeley residents. Thus, the City’s overall need and its projected need for housing affordable to lower income households includes housing needs resulting from UC Berkeley’s student and faculty population. The RHNA is also based in part on employment in Berkeley, a significant share of which is related to the University. Therefore, the City’s RHNA includes the demand for housing caused by University of California students and employees. In the past, housing provided by the University of California has not been considered towards meeting the City’s share of regional housing need. The City of Berkeley has asserted that some consideration should be given for the provision of University housing in the City, including group living accommodations. Although the City generally met its overall housing production goals during the last RHNA cycle, the City would have considerably exceeded those goals if the construction of group living accommodations by the University were considered housing units. ABAG estimated that 5.7 percent of Berkeley residents lived in group quarters in 2005, while the regional average was 2 percent.4 The percentage is derived from ABAG’s estimate that there were 5,900 people in group quarters in Berkeley in 2005. This number is much lower than the actual “bed-count” reported by the University of California at Berkeley in its Long Range Development Plan. The University counted 6,004 beds in group quarters in 2003 (counting all dorms, co-ops, fraternities and sororities as beds in group quarters) with an additional 1,110 under construction (and now completed). Because there is a very small vacancy rate for student housing, it seems reasonable to assume that the group quarter population will approximate the number of beds. In addition to the now 7,234 beds in group quarters, there are a number of beds in assisted living facilities of one kind or another in Berkeley. In other words, the number of people in group quarters is almost twice what was estimated for those quarters in 2005 by ABAG. This implies that the proportion of residents in group quarters in Berkeley may be about 10 percent of the population, or five times the regional average.
4 ABAG Projections, 2007. The Department of Finance estimated that 6.3% of the Berkeley population lived in group quarters in 2008.
2015-2023 Berkeley Housing Element 3 – Projected Housing Needs and Land Resources
49
The City of Berkeley’s position is that in communities such as Berkeley, which are disproportionately affected by universities and colleges, there should be recognition of the role that universities and colleges play in providing housing. Group quarters house a significant percentage of the population, but are not considered housing units meeting projected need in the RHNA. While the University population results in a higher RHNA allocation, the City receives no credit in the RHNA process for the housing provided by the University. While group quarters present one special situation, many colleges and universities are now developing apartments and, in many instances, faculty housing. The University has indicated that at least some of the housing it intends to build in the next five years will be apartments (units with kitchens). The City will count apartments and faculty housing built by the University towards our RHNA goals. Depending on whether that housing is income-restricted, the City may also count University-provided housing toward meeting our share of affordable housing needs. The City holds the position that group quarters should be credited towards meeting the City’s RHNA goals. The City will work with HCD to determine how group housing may be better accounted for in the RHNA process.
C. Other State Requirements In addition to demonstrating adequate capacity for the City’s share of regional housing needs, state law requires analysis of the inventory of land suitable for residential development to demonstrate the following:
• Sites on the inventory can accommodate housing for lower income households; and
• Sites on the inventory can provide a variety of housing types.
1. Zoning to Accommodate Housing for Lower-Income Households
State law requires cities to demonstrate that sites in their land inventory can accommodate some portion of their share of units for lower income households. California Government Code Section 65583.2(c) establishes minimum or “default” densities that are deemed appropriate to accommodate housing for lower income households. This is based on the recognition that higher densities provide the potential for lower construction costs through economies of scale and reduced per-unit land cost, which can then lower the rental or sale price of the units. For Berkeley, sites that allow at least 30 units per acre are deemed appropriate to accommodate housing for lower income household s [Government Code Section 65583.2(c)(3)(B)(iv)]. Berkeley does not have minimum density standards and most Zoning Districts do not have maximum density standards either. However, as shown in Appendix A, in the past 10 years Berkeley has consistently approved projects with densities that exceed 30 units per acre. Past development has averaged over 100 units-per-acre. Most of these sites are in the commercial districts, which have an estimated capacity of roughly 2,461

2015-2023 Berkeley Housing Element 3 – Projected Housing Needs and Land Resources
50
units. Additionally, Berkeley has higher-density multifamily residential zoning districts, as discussed below. Therefore, sites identified in Berkeley’s land inventory allow densities that encourage and facilitate the development of housing for lower-income households.
2. Zoning for a Variety of Housing Types
California Government Code Sections 65583(c)(1) and 65583.2(c) require cities to demonstrate that sites within their land inventory can provide for a variety of housing types, including: multifamily rental housing, factory-built housing/mobile homes, housing for agricultural employees, supportive housing, single-room occupancy units, emergency shelters, and transitional housing. Multifamily Residential Housing Multifamily residential housing is a type of housing in which multiple (two or more) separate households are contained within one building. As shown in Appendix A and discussed in Chapter 4, there have been a number multifamily residential housing projects constructed in Berkeley in the past 10 years. Multifamily construction is allowed in the R-1A, R-2, R-2A, R-3, R-4, R-5, R-S, and R-SMU residential zoning districts, the mixed-use residential district (MU-R) and all of the City’s commercial zoning districts (C-1, C-E, C-N, C-NS, C-SA, C-SO, C-T, C-W, C-DMU). The only zoning districts where multifamily housing is not allowed are R-1, ES-R, M, MM, and MU-LI.. Appendix A includes a list of vacant sites within the residential zoning districts. There are 21 vacant developable sites in the R-1A, R-2, R-2A, R-3, R-4 combined. Further, there is capacity for additional units to be constructed at already developed sites in these districts. There are 166 opportunity sites that can accommodate multifamily housing in the commercial districts identified in Appendix A. Factory-Built Housing The Berkeley zoning ordinance does not treat factory built housing units differently from other housing units. Factory built, manufactured, or “pre-fab,” housing is allowed in all districts residential units are allowed. The Berkeley zoning ordinance definition relevant to factory built housing is as follows:
Berkeley Municipal Code Section 23F.10 Manufactured Home: A structure, designed or altered to be used as a dwelling unit, which is transportable in one (1) or more sections and is built on a frame or chassis to which wheels may be attached so as to be transported, including mobile homes meeting the standards of the National Manufactured Housing Construction and Safety Act of 1974. If a Manufactured Home is mounted on a permanent foundation and connected to all utilities required for a dwelling unit built on the site, it is considered a dwelling unit.
Agricultural Employees Agricultural workers can create a seasonal increase in the housing demand and can create strains on the housing supply. Although agriculture is an approved use in the

2015-2023 Berkeley Housing Element 3 – Projected Housing Needs and Land Resources
51
MM and MU-LI zoning districts, as a built urban environment, the City does not have large tracts of available land for agriculture that would require a seasonal workforce. Therefore, agricultural employees do not require special housing within Berkeley. Emergency Shelters, Transitional Housing, Supportive Housing The City of Berkeley currently has about 115 emergency shelter beds available year round and about 170 available in winter months. Pursuant to SB2, in 2013 the City adopted zoning to allow emergency shelters as-of-right. Zoning districts that allow for emergency shelters include the C-DMU (Downtown), C-1 (University and Telegraph Avenues), C-SA (Shattuck and Adeline), C-T (Telegraph commercial district), and R-4 (multifamily residential district located north, west and south of the University of California campus). These districts include 113 housing opportunity sites and a total of 1,404,414 square feet. Under SB2, Berkeley and all other cities in the state received an allotment of shelter beds to be “planned for” in their jurisdiction; in Berkeley that amount is 371 beds. The opportunity sites are adequate to meet Berkeley’s need for 371 shelter beds. Berkeley also has a number of transitional housing and permanent supportive housing projects and programs serving people who are homeless or with special needs. An inventory of Berkeley’s existing housing for the homeless is provided in Chapter 6, Housing Programs and Quantified Objectives, in the Homeless Housing and Service Programs section. Based on the Berkeley zoning ordinance definitions, transitional or supportive housing would be considered either “dwelling units” or “group living accommodations” depending on the size of the facility and the zoning district in which they are located. Shelters and transitional or supportive housing require approval of a use permit with a public hearing. Dwelling units are allowed in all residential zoning districts. Group living accommodations are allowed in the R-3, R-4, R-5, R-S, and R-SMU residential zoning districts, the mixed-use residential district (MU-R) and all of the City’s commercial zoning districts (C-1, C-E, C-N, C-NS, C-SA, C-SO, C-T, C-W, C-DMU). Just as any other housing project, shelters and transitional or supportive housing facilities are subject to the zoning district development standards in terms of height, density, number of stories, and setbacks. The Berkeley zoning ordinance definitions are provided below:
Berkeley Municipal Code Section 23F.10 Shelter, Homeless or Women’s: See Transitional Housing. Transitional Housing: Any dwelling unit or a Group Living Accommodation designed or operated as temporary living quarters or residence for homeless persons or victims of abuse. Such housing includes, but is not limited to, shelters for the homeless, women’s shelters and refuges for battered persons. This does not include any facility licensed as a Community Care Facility by the California State Department of Social Services (SDSS) or defined as such in this Chapter.

2015-2023 Berkeley Housing Element 3 – Projected Housing Needs and Land Resources
52
Group Living Accommodations: A building or portion of a building designed for or accommodating Residential Use by persons not living together as a Household, but excluding Hospitals, Nursing Homes and Tourist Hotels. Dwelling Unit: A building or portion of a building designed for, or occupied exclusively by, persons living as one (1) household. Hotel, Residential: A building which provides rooms for rent for residential purposes, including Single Residential Occupancy (SRO) Hotels. Residential Hotels are a type of Group Living Accommodation. Single Residential Occupancy (SRO) Room: A room for residential or sleeping purposes in a Residential Hotel which is designed for occupancy of one (1) person only.
Emergency shelters, transitional housing, and supportive housing are currently permitted in certain multi-family residential districts and all commercial zoning districts. The inventory of housing opportunity sites identified 167 underutilized sites in the commercial districts and 7 in the R-3 and R-4 multi-family residential districts. Therefore, the inventory of sites includes sites suitable for development of emergency shelters, transitional housing, and supportive housing.
By-Right Emergency Shelters. In all districts, a conditional use permit is required for dwelling units or group living accommodations, including shelters and transitional or supportive housing facilities. On December 17, 2013, the City adopted an Emergency Shelter Ordinance pursuant to Government Code section 65583(a), which allows the establishment of emergency shelters without discretionary review in appropriate locations. Emergency shelters are allowed “by right” in the R-4, R-5, R-S, and R-SMU residential districts, and in all commercially zoned districts. Single Room Occupancy (SRO) Units SRO units are one-room units intended for occupancy by a single individual. They are distinct from a studio or efficiency unit, in that a studio is a one-room unit that must contain a kitchen and bathroom. Although SRO units are not required to have a kitchen or bathroom, many SROs have one or the other. SRO units are also called residential hotels, and are defined as “group living accommodations” in the Berkeley zoning ordinance (see definitions above). Therefore, they are allowed to be built in the in the R-3, R-4, R-5, R-S, and R-SMU residential zoning districts, the mixed-use residential district (MU-R) and all of the City’s commercial zoning districts. They are subject to the development standards of the district in which they are located, and are subject to a use permit.
Conclusion Through a combination of mixed-use zoning districts and residential infill, the above analysis shows that the City of Berkeley has a capacity for approximately 5,328 new units on underutilized parcels throughout the City. Additionally, the City can take credit for 137 units that have already been issued building permits. As a result, the City of Berkeley has excess capacity for new housing.

2015-2023 Berkeley Housing Element 3 – Projected Housing Needs and Land Resources
53
The opportunity sites identified for new housing allow housing of a variety of types, including multifamily residential, single family, and second units. The sites allow housing at densities that facilitate the production of housing affordable to lower income households.

54
<Page Intentionally Left Blank>

2015-2023 Berkeley Housing Element
4 – Potential Constraints to Housing Production
55
4 - Potential Constraints to Housing Production This chapter of the Housing Element analyzes potential constraints to housing production in
Berkeley. The state government code defines two categories of constraints: governmental and
non-governmental. The former category includes local ordinances, policies, and procedures
that may make it more difficult or expensive to build housing in the City. The latter category
includes a wide variety of factors, such as the cost of land and building materials, availability of
financing, physical constraints, and infrastructure limitations. The government code requires
that these constraints be analyzed as part of the Housing Element. If constraints are identified,
the City is required to take action to remove or address them. To identify potential constraints to
housing production, City staff analyzed the specific constraint categories as described in state
law and discussed the City’s regulations with local developers.
As described in detail below, most constraints are addressed by existing City programs. The
development record and densities of approved projects are the best evidence that there are not
significant constraints to housing production in Berkeley. Additionally, housing policies have
been designed to minimize potential constraints including: consideration of revisions to the
accessory dwelling unit and demolition control regulations; identification and consideration of
options to reduce potential constraints to existing infill opportunities; and continued improvement
to the development review process.
This chapter is organized as follows:
A. Governmental Constraints
B. Non-Governmental Constraints
A. Governmental Constraints
Planning and zoning regulations establish rules for how land may be used, thereby limiting the
amount of development in a city. Although local ordinances and policies are typically adopted
to protect the health, safety, and welfare of residents, they may have the consequence of
creating constraints to the development of housing. This consequence may be intentional (as is
the case with growth control ordinances) or unintentional (such as with certain zoning
requirements or fees).

2015-2023 Berkeley Housing Element
4 – Potential Constraints to Housing Production
56
Potential governmental constraints in Berkeley are discussed below. A description and analysis
of each is provided and is followed by a conclusion about whether there is a governmental
constraint and, if so, steps the City should consider in order to mitigate the constraint.
General Plan
Analysis:
Several goals from Berkeley’s General Plan, adopted in 2001, directly support production and
maintenance of housing. In particular, the General Plan calls for increasing the supply of
affordable housing, encouraging appropriate residential and mixed-use development downtown
and along transit corridors, and taking steps to create a disaster-resistant community that can
survive and recover from a natural disaster.
The General Plan land use classifications describe a range of land uses and intensities over
relatively large areas, and are not used as standards to determine the maximum allowable
density on a specific parcel. This approach gives the City more flexibility in its analysis of
specific projects, while also providing consistency with the General Plan. The Land Use
Element residential densities described in the following table are typical of other cities in the
lower density classifications and are generally similar to or higher than the medium and high
density classifications in nearby cities. While Berkeley’s General Plan density ranges are not
the highest in the area, the numbers below do not include density bonuses for affordable
housing provided for in state law.
Table 4-1: Berkeley General Plan Land Use Classifications: Density Ranges
General Plan Land Use Classification
Density Range (per net acre)
Low Density Residential 1 – 10 dwelling units
Low Medium Density Residential 10 - 20 dwelling units
Medium Density Residential 20 - 40 dwelling units
High Density Residential 40 - 100 dwelling units
Table 4-2: Maximum Allowable Density in Nearby Cities
City Maximum Allowable Density Per Zoning or General Plan
(du/acre) Berkeley 100, based on General Plan, however, not used as the
standard on a site-specific basis. See discussion below regarding zoning densities.
Oakland 290
Hayward 110
Richmond 54.5
Albany 63
San Leandro 22
Emeryville 135 (includes affordable housing bonus)

2015-2023 Berkeley Housing Element
4 – Potential Constraints to Housing Production
57
Conclusions:
The General Plan is not a governmental constraint to housing development. Policies strongly
support provision and maintenance of housing, and allowable densities are high enough to
encourage development of multiple-family housing. As demonstrated by Berkeley’s
development activity, the City typically approves projects on commercial corridors and within the
Downtown Mixed-Use District (C-DMU) at densities close to or exceeding 100 units per acre.
Land Use Controls: Development Standards, Density, Parking,
Second Residential Units, Demolition Controls, Affordable Housing
Incentive Programs
Analysis:
Berkeley’s zoning ordinance provides for a diverse array of physical types of housing, from
single-family dwellings that are regulated by typical zoning standards to multiple-family buildings
constructed at high densities along the City’s commercial corridors. Density is a key factor in
identifying potential constraints to development of housing. The more cities limit density, the
fewer units are constructed and, in general, the more expensive they are on a per-unit basis.
Most lots in Berkeley are developed. Therefore, the greatest potential to meet its share of
regional housing needs is along commercial and transit corridors where sites are underutilized
and higher densities are allowed. Aspects of Berkeley’s zoning ordinance that could constrain
housing production are described below.
Density and Development Standards: Most of Berkeley’s zoning districts allow residential uses.
The only districts that do not allow any type of housing are the Mixed Use Light Manufacturing
(MU-LI), Manufacturing (M), and Mixed-Manufacturing (MM) Districts. Thus, housing is allowed
in most of the City, except portions of West Berkeley that are developed with and planned for
manufacturing uses.
The residential and mixed-use development standards contained in the zoning ordinance are
summarized in Appendix B. For most zoning districts, residential development standards, such
as lot size, setbacks, lot coverage, etc. are similar to standards in other nearby cities. There are
not many vacant lots and construction of new single-family dwellings has been limited—
between 2009 and 2013, 10 new single-family dwellings were approved or constructed on
vacant lots).1 Single-family development tends to provide above-moderate income housing, so
to the extent that this is a constraint, it is not on the development of affordable units.
Berkeley has numerous medium and high density residential zoning districts. There is likely
some additional capacity for housing on developed lots in these residential districts. This type of
infill development (adding units to developed lots) occurs throughout the City. The Planning
Department has begun to keep records of this type of development; the City approved seven
new infill dwelling units in the time frame of 2013-2014.
1 City of Berkeley Planning Department records.

2015-2023 Berkeley Housing Element
4 – Potential Constraints to Housing Production
58
As previously indicated, residential growth has concentrated on commercial corridors, with
recent development densities ranging from 69 to 202 dwelling units/acre. The Berkeley zoning
ordinance does not rely on per-acre density standards in commercial districts where multiple-
family and mixed-use projects are allowed. The densities of larger mixed-use projects approved
since 2009 are provided in Table 4-3 to demonstrate that Berkeley’s zoning regulations and
permit process have not constrained development of high density housing along the City’s
commercial corridors.
Table 4-3: Density of Approved Mixed-Use Projects, 1999 - 2009
Address Total Number of Units Density (Units/acre)
651 Addison 94 112
2002 Addison 21 137
3222 Adeline 19 65
2116 Allston 91 279
2161 Allston 60 219
1200 Ashby 98 125
2076 Ashby 11 96
2500 Benvenue 12 N/A
2508 Benvenue 6 47
2041 Center 143 266
2525 Channing 30 142
2526 Durant 44 185
2310 Fulton 75 157
1414 Harmon 5 19
711 Harrison 6 N/A
2020 Kittredge 176 119
2175 Kittredge (2020 Oxford) 97 91
2489 MLK 21 105
2909 Ninth (1001 Ashby) 54 117
1910 Oxford 56 230
2517 Sacramento 40 55
1800 San Pablo 51 109
1201 San Pablo 27 90
2577 San Pablo 28 164
2700 San Pablo 30 77
2720 San Pablo 18 81
2747 San Pablo 39 98
2748 San Pablo 27 118
3020 San Pablo 29 139
1797 Shattuck 65 146
1801 Shattuck 29 102
2451 Shattuck 100 169
2701 Shattuck 24 89
2620 Telegraph 20 91
2628 Telegraph 15 94
3075 Telegraph 10 25
700 University 171 100
1122 University 81 134

2015-2023 Berkeley Housing Element
4 – Potential Constraints to Housing Production
59
1392 University 71 139
1535 University 80 127
1698 University 25 109
1719 University 27 125
1885 University 148 147
2004 University 35 199
2119 University 44 146
Total Units 2353
Average Density 127
Median Density 117
Table 4-4: Density of Approved Mixed-Use Projects, 2010 - 2014
2323 Shattuck 2011 C-2(1)
15 69
651 Addison 2012 C-W 94 112
3001 Telegraph 2012 C-1 38 136
2489 Martin Luther King Jr. 2013 C-N 21 105
800 University 2014 C-W 58 202
Total Units 226
Average Density 125
Median Density 112 (1) Currently zoned C-DMU, project was approved under the previous zoning standards of the C-2 District
Table 4-5: Density of Pending Mixed-Use Projects, 2010 - 2014
Address Year
Entitled Zoning District
Total Number of Units
Density (Units/acre)
2600 Shattuck 2011 C-SA, R-2A 155 153
2107 Dwight 2012 C-DMU 99 194
1931-35 Addison 2013 C-DMU 69 208
2201 Dwight 2013 R-S 77 160
2133 University 2013 C-DMU 98 87
2024 Durant 2014 C-DMU 79 152
1808-14 University 2014 C-1 44 278
1974 University 2014 C-DMU 98 185
Total Units 719
Average Density 177
Median Density 172
The large mixed-use projects have been approved throughout the City under various zoning
districts: Commercial Downtown Mixed-Use (formerly Central Commercial C-2), General
Commercial District (C-1), West-Berkeley Commercial District (C-W), Neighborhood
Commercial District (C-N), South Area Commercial (C-SA) District, and the Residential
Southside (R-S) District. There are no density standards in any of these districts;2 instead
maximum density is determined by setback, height, FAR, parking, and useable open space
2 The R-S District has a density standard for persons residing in a Group Living Accommodation (GLA),
but not for dwelling units, BMC §23E.48.070.B.

2015-2023 Berkeley Housing Element
4 – Potential Constraints to Housing Production
60
standards. In general, these standards are not a constraint to development – there is no
maximum lot coverage standard, height and FAR are generous, and setbacks are generally not
required.3 Additionally, in the majority of the commercial districts (C-1, C-N, C-E, C-SA and C-
SO Districts), parking and useable open space requirements can be modified by the Zoning
Adjustments Board (ZAB) if the modification promotes any of the purposes of the District. In the
C-DMU, a project applicant may choose to pay an in-lieu fee for required parking and useable
open space. While the flexibility of Berkeley’s zoning ordinance and the lack of specific density
standards may be seen as providing less certainty than more traditional zoning, it is clear from
the record of development that specific density standards are not needed to produce housing of
sufficient density that is financially feasible and attractive to developers.
Parking: As shown in Table 4-5, the City’s residential parking requirements are generally low
and are not a constraint to development. The zoning regulations for mixed-use projects also
provide flexibility to the parking standards. For example, the City allows parking reductions for
projects located in the downtown and along major transit corridors. Many mixed-use projects
have been built with less than one parking space per dwelling unit. Some have been approved
with no parking for the residential component, and several downtown projects that were allowed
a parking reduction have discovered that there is less tenant demand than expected.
In addition, Berkeley was one of the first cities in the country to allow double and triple stack lifts
to satisfy the City’s residential parking requirements. This can eliminate the need for expensive
below-grade parking and/or leave more leasable ground floor area by minimizing the space
needed for parking.
Table 4-6: Parking space requirements for new dwelling units Zoning District(s) Number of Parking Spaces Required
R-1, R-1A, R-2, R-2A 1 space / unit
R-3 and R-4 1 space / unit for multiple dwelling groups of <10 units 1 space / 1,000 square feet for multiple dwelling groups of >10 units
R-5 1 space / unit for multiple dwelling groups of <10 units 1 space / 1,200 square feet for multiple dwelling groups of >10 units under same ownership
R-S 0 in Car-Free Housing Overlay, elsewhere per R-4
R-SMU 0
C-1, C-N, C-E, C-SO, C-NS
Per R-3
C-SA Per R-4
C-T 0
C-W, MU-R 1 space / unit
C-DMU 1 space / 3 units (can be reduced or waived through in-lieu fee)
Second Residential Units: Provision of small, accessory dwelling units in low density areas can
be a good way to add housing units outside of the commercial corridors and higher density
residential districts, while also meeting personal or financial needs of property owners. For
3 The two exceptions are the 2-story, 28-foot height limit in the Elmwood Commercial (C-E) and Solano
Commercial (C-SO) Districts.

2015-2023 Berkeley Housing Element
4 – Potential Constraints to Housing Production
61
example, a second unit on a single-family property can provide an opportunity for an older
owner to remain at home, either with a caretaker in the second unit or by renting the house to a
family and the owner moving into the smaller unit.
In July 2003, the City adopted a second unit ordinance allowing ministerial approval of
Accessory Dwelling Units (ADUs) subject to certain development standards. New units meeting
the specific standards listed below are allowed in all residential zoning districts as of right.
There is only one unit currently on the lot.
The ADU is limited to between 300 and 640 square feet, and no larger than 25% of the
floor area of the main dwelling on the lot.
The ADU cannot be converted into a condominium.
The property owner must occupy either the primary dwelling unit or the accessory unit.
When the unit is created from a portion of the main building or an addition to the main
building, it must have a separate entrance that does not face the street; any addition
must be lower than 14 feet in height.
When the unit is created in a new or existing detached accessory building, the lot must
be at least 4,500 square feet, the building may not exceed 12 feet in height, and the
building is subject to the setback requirements applicable to the main building, which
range from 15-20 feet for the front and rear setback and are 4 feet for side-yard
setbacks.
One off-street parking space is required.
An ADU that does not meet certain requirements may be permitted with approval of an AUP, a
discretionary permit reviewed and approved by the Zoning Officer.
Increasing the supply of ADUs could help meet the City's housing needs. It is not uncommon
for property owners considering an ADU to not pursue projects because they cannot meet the
by-right standards. In some cases, the relaxation of certain restrictions provided with an AUP
does not address the constraints on their property. In other cases the property owner does not
want to pursue a project requiring discretionary review. Staff does not track how often this
occurs, however, more permissive standards such as changing the minimum lot size or other
development standards would increase the number of ADUs in the City
On April 30, 2013 the City Council referred to the Planning Commission a set of 10
recommendations intended to reduce barriers to the development of residential Accessory
Dwelling Units. Planning Department staff analyzed the referral and presented options for
zoning amendments to the Planning Commission at two meetings in 2014. The Planning
Commission recommended a package of zoning changes to the City Council on June 4, 2014.
The changes included:
Lowering the minimum lot size,
Allowing larger ADUs,
Reducing required setbacks, and
Waiving parking when the new ADU is close to transit.

2015-2023 Berkeley Housing Element
4 – Potential Constraints to Housing Production
62
The City Council considered the changes on September 16, 2014 and continued the item to a
workshop on March 24, 2015 to discuss the changes in more detail.
Demolition Controls: The City regulates demolition of dwelling units to protect the affordable
housing supply and existing tenants. In general, the Zoning Adjustments Board (ZAB) may
approve a use permit to demolish dwelling units only if the units are replaced by new
construction or if the structure is hazardous, unusable or infeasible to repair. However, if
elimination of a rent-controlled unit is proposed, the requirements are more stringent. In
particular, the use permit may only be approved if the dwelling unit to be eliminated is neither
occupied nor has a rent set at a level that is affordable to a very low, low, or moderate income
household; if its elimination will not adversely affect the supply of housing; and if the applicant
cannot make a fair return on investment by maintaining the dwelling unit. There is an exception
to allow elimination of a controlled rental unit if all of the following apply: (1) the dwelling unit is
in a building that is seriously deteriorated beyond the conditions which might reasonably be
expected due to normal use in the written determination of the Building Official and will be
rehabilitated to meet City housing code requirements; (2) the replacement unit will be provided
to a very-low or lower-income household; (3) the elimination of the dwelling unit will not cause
displacement of any tenant against that tenant’s will; and (4) a statement supporting the
application is filed and signed by all of the tenants whose units will be physically modified and
from all tenants who may be required to move temporarily. The issue is further complicated by
interpretation of other ordinances, including the Rent Stabilization and Eviction for Good Cause
Ordinance, the Relocation Ordinance, and the Ellis Ordinance. Due to the restrictive nature of
these exceptions and their interaction with other City ordinances, the controls on demolition of
rent-controlled units can be a constraint to development. Housing Policy H-34.D proposes that
the City consider revisions to the demolition controls that would provide better coordination
designed to protect tenants and continue to meet affordable housing needs. A subcommittee of
the City Council is currently working on revisions.
Affordable Housing Incentive Programs:
Inclusionary housing was originally adopted as City policy as part of the Neighborhood
Preservation Ordinance in 1973. The inclusionary housing requirements (“Inclusionary
Ordinance”) are codified in Chapter 23C.12 of the zoning ordinance, which took effect in
February 1987. In 2009, the Palmer/Sixth Street Properties vs. City of Los Angeles court ruling
found that inclusionary housing requirements on rental developments violate the Costa-Hawkins
Rental Act of 1995, thereby invalidating the City’s inclusionary requirements for rental housing.
In order to continue to provide income-restricted units in Berkeley, Council adopted an
affordable housing mitigation fee on new market-rate rental units (Ordinance 7,192-N.S.) on
June 28, 2011. The fee was established by an impact fee nexus study, which quantified the
need for affordable housing created by the development of new market rate rental housing.
In response to current market conditions and the 2013 Sterling Park, L.P. v. City of Palo Alto
ruling, the City is currently updating the nexus study to include potential affordable housing
mitigation fees for ownership housing.

2015-2023 Berkeley Housing Element
4 – Potential Constraints to Housing Production
63
The affordable housing impact fee (Fee) is deposited in the City’s Housing Trust Fund. The fee
applies to new rental housing projects of 5 or more dwelling units.4,5 An applicant for a
development project that is subject to the Fee may elect to avoid the Fee by providing, for the
life of the project, a number of units equal to 10% of the market rate units in the project at rental
rates affordable to very low-income households.6
Conclusions:
Between 2009 and July 31, 2014, the City issued building permits for 9 projects that included
dedicated BMR units. These nine projects represent a total of 533 units, including 37 low-
income (>50% - 80% AMI) and 48 very low-income (<50% AMI) units. Five of these projects
included a density bonus.
During this time frame, the City entitled (i.e. use permit) nine additional projects (building permit
issuance is pending), that represent a total of 828 units, 87 of which are dedicated as very low-
income. Five of these projects include density bonus units.
As demonstrated by development activity in Berkeley, the zoning standards, including density,
parking and affordable housing requirements, have not constrained approval of housing projects
or development of affordable units. The residential zoning standards are appropriate for
residential areas, and flexibility is provided for high density projects on commercial corridors.
The affordable housing mitigation fee (AHMF), or provision of on-site units available to very low-
income households, has not deterred new residential development, as can be seen with the
number of applications the City has received and the continued interest in new multi-family
construction. The fee per unit is roughly equivalent to the cost of providing the income restricted
units on site, and unlike the fee formula under the Inclusionary Ordinance, the fee is a known
variable that housing developers can calculate in a project’s pro forma. The 2010 nexus study
found the AHMF would bring the fees charged per unit in Berkeley within comparable range of
other East Bay cities such as Oakland and Hayward.7 The requirement for payment of the
AHMF or provision of very low-income units on site is, therefore, not considered a constraint on
housing development in Berkeley.
4 For group living accommodations the equivalency rate is one new rental unit per two bedrooms, such
that one-half the adopted fee shall be imposed on each bedroom.
5 The following projects are exempt from the fee: cooperative student housing developed by the Berkeley
Student Cooperative; units built to replace units destroyed through no fault of the applicant, provided the
applicant files a complete permit application within two years; and rehabilitated rental units unless they
have been vacant more than two years before the applicant files a complete permit application;
6 An applicant may provide less than 10% of market rate units as very low-income units and pay a
proportionately reduced Fee at a rate of [(A-B) x Fee] – [(B/((A-B) x 10%)) x ((A-B) x Fee)] where A =
Total number of units in the project and B= Number of very low-income units provided in the project.
7 Affordable Housing Fee Nexus Study, prepared by Bay Area Economics, October 2010

2015-2023 Berkeley Housing Element
4 – Potential Constraints to Housing Production
64
Berkeley’s demolition regulations are not a constraint to housing development, as demolition of
units is permissible upon replacement of at least the same number of dwelling units as the
demolished structure.8
While the City’s accessory dwelling unit requirements meet state law, they may be a constraint
to development of additional units; therefore, the Housing Element includes a housing program
to evaluate the regulations and consider changes to development standards for ADUs — a
process that is currently underway. Additionally, while the zoning ordinance includes five multi-
family zoning districts and the City has seen a number of multi-family development projects,
Housing Policy H-34 encourages the review of infill development regulations in residential
districts to identify and change possible constraints.
Processing and Permit Procedures
Analysis:
The majority of new residential development in Berkeley requires discretionary approval, either
with an administrative use permit – with public notice, action by the Zoning Officer, and potential
appeal to the Zoning Adjustment Board (ZAB) – or a use permit, which requires notice, public
hearing, action by the ZAB, and potential appeal to the City Council. Projects permitted “by
right” include mixed-use developments with less than 5,000 square feet in the South-Shattuck
Area Commercial District (C-SA) and accessory dwelling units (ADUs) that meet zoning
standards.
When discretionary approval is required, findings must be made that the project conforms with
zoning standards and that the proposed development will not cause detriment to the “health,
safety, peace, morals, comfort or general welfare of persons residing or working in the area or
neighborhood of such proposed use or be detrimental to property and improvements of the
adjacent properties, the surrounding area or neighborhood or to the general welfare of the City.”
In a mostly built-out city where almost every project will have an impact on a neighbor, and
where the zoning ordinance establishes very broad standards, discretion is often needed to
ensure that projects can be adjusted to minimize detrimental impacts on neighbors.
The Neighborhood Preservation Ordinance (NPO), adopted in 1973, limits the City’s ability to
approve projects “by-right” because it was adopted by initiative. In particular, the Neighborhood
Preservation Ordinance established the requirement for most new residential construction to
obtain a use permit, as well as required the “non-detriment” finding for approval. Because most
new housing is subject to a use permit, proposals are often scrutinized for their impacts on the
surrounding neighborhood. The use permit process requires additional time which can impose
some additional project development costs.
8 Additionally, demolition of a controlled rental unit is permissible only if the replacement dwelling unit is
available for occupancy to low-income or very low-income households.

2015-2023 Berkeley Housing Element
4 – Potential Constraints to Housing Production
65
However, the discretionary review process also protects neighbors, which is particularly
important in a built-out city and in a city which values community participation. In addition, the
permit process ensures that neighborhoods do not decline as a result of bad development, thus
protecting the quality of the housing stock.
In response to concerns that the permit process was a constraint, the City initiated a process to
identify the constraints and mitigations. A “Mayor’s Task Force on the Permit Process” resulted
in a variety of actions. As described below, the City has taken many steps to improve the
development review process with the specific intent to provide more direction and certainty to
applicants.
To provide early feedback to applicants, the City implemented the following changes:
o Applicants are required to meet with neighbors prior to submittal of a use permit
application for projects in residential districts and large-scale development
projects located in commercial districts. This early consultation helps the
applicant by providing an opportunity to air issues and minimize future conflict.
o Applicants are required to post a yellow informational sign in front of the project
location prior to submitting their application. The sign must be maintained
throughout the project review process and must include basic project facts, public
meeting dates, major decisions, and contact information.
o Pre-application meetings with staff are available.
o The City offers applicants “pre-application review,” an opportunity to present their
project to the ZAB informally prior to submittal of an application. This preview
process provides valuable feedback to applicants directly from the ZAB and
allows them to adjust projects prior to submittal.
o City staff hold a “roundtable” meeting with various departments that make
recommendations on applications. Various City departments identify issues and
address code compliance early in the design process. This also provides
improved coordination and communication between the departments. The
Planning Department recently began inviting applicants to the meetings, which
has also improved identification of issues and communication.
To provide faster processing of Use Permits, an applicant can request and pay for
expedited processing. This allows staff resources to be allocated fairly while also
providing an opportunity for faster review.
To improve communication and provide clear, consistent information to applicants, the
City took the following steps:
o Planning Department staff undertook extensive public outreach between 2005
and 2008. In particular, presentations were made to three working groups:
remodeling contractors, developers, and commercial leasing agents and realtors.
Detailed information and flow charts of the zoning and building permit process
were provided in binders for attendees.
o The Planning Department’s website was improved and now includes more
detailed information about the permit process, forms, and pending applications.

2015-2023 Berkeley Housing Element
4 – Potential Constraints to Housing Production
66
o Applicants are encouraged to request zoning research letters to get definitive
answers to complex questions; this provides better information than can be
received over-the-counter.
The Planning Department developed density bonus guidelines to assist with the
determination of the “base project” for the purpose of computing a project’s density
bonus award. This allows more transparency in the process, which helps both the public
and the applicants better understand the City’s analysis and outcomes.
Design Review: Design review ensures high quality buildings that fit into their neighborhood.
The design review process provides an opportunity for neighbors to communicate with the
developer and influence the design of the project. Redesign of the interface between a new
building and the adjacent neighbors can mitigate land use conflicts inherent in the transition
between medium-density residential neighborhoods and high-density mixed-use buildings. For
this reason, the City believes design review is essential in a nearly built-out city with a strong
sense of community character and citizen participation. Development within all commercial,
manufacturing, mixed use and all other non-residential Districts; all commercial and mixed use
projects in the R-4 District; all commercial, mixed use and community and institutional projects
in the R-SMU and R-S Districts; and all mixed use and community and institutional projects in
the R-3 District within the boundaries of the Southside Plan are subject to design review. Design
review is conducted by the Design Review Committee (DRC) if the project is subject to ZAB
approval, or by staff if only administrative approval is needed. The DRC is advisory to the ZAB;
the DRC does not approve or deny the project, but recommends design for approval or
conditional approval. Design review is based on City-wide design guidelines, which provide
direction to project applicants and define the scope of review by the DRC.
The Committee level design review process is comprised of two phases: preliminary design
review and final design review. Generally, preliminary review takes two to three meetings
depending on the size of the project. The result of preliminary review is a recommended project
design to the ZAB and in some cases conditions to be met during final design review. The final
design review stage generally takes one meeting and involves review of more detailed plans to
confirm the design conditions have been met.
Potential Constraints & Mitigation.
Costs – In order to give appropriate feedback to a developer, the preliminary design review
phase requires project plans at a greater level of detail than might otherwise be required for a
use permit entitlement. The City’s design review submittal requirements do not differ
significantly from other communities’ requirements for design review plans. Preparation of plans
at this level of detail will generally require a higher level of initial investment in design drawings
than might otherwise be required for a Use Permit. However, the level of plan detail is required
for any project that a developer intends to ultimately build. For this reason, and because of the
benefits gained from early review and high quality design, the City does not consider the up-
front cost of preparing design review plans to be a constraint on development.
Timing - In order to avoid delay resulting from the design review process, the Planning
Department administers the design review and land use review processes concurrently. In most

2015-2023 Berkeley Housing Element
4 – Potential Constraints to Housing Production
67
cases, preliminary design review requires two to three meetings for larger, more complex
projects. This is typically completed with the time frame of Use Permit preparation and review
process (from complete application to action by the ZAB). Cases with lengthy design review are
rare, and are generally caused by project applicants who are unresponsive to direction from the
DRC. Concurrent review processes enable a more streamlined Zoning Adjustments Board
(ZAB) review that typically takes one or two meetings. Additionally, preparation of construction
documents for building permit review is generally done concurrent with final design review. By
running these reviews concurrently, the design review process does not delay the project review
process and therefore is not a constraint on development of new multi-family housing.
Certainty - The DRC is advisory to the ZAB, and the review is not a discretionary process;
therefore, design review does not impact project certainty. Design guidelines, staff advice, and
the ZAB preview all increase project certainty for applicants and enable them to prepare a
design proposal that will meet the expectations of the community, DRC and ZAB. Additionally,
the City plans to develop area-specific design guidelines for San Pablo Avenue and the
downtown. The guidelines would make the review process more consistent and timely for those
areas, both of which have a number of housing opportunity sites identified in the site inventory.
In summary, the Berkeley Planning Department uses the following procedures to mitigate the
potential impact of the design review process:
The design review process is administered concurrently with the land use and building
permit entitlement process, and generally can be accomplished within the standard time
frames. Specifically, the preliminary design review process is concurrent to the use
permit (UP) or administrative use permit (AUP) process and the construction documents
are usually prepared concurrent with the final design review process.
To provide more certainty to applicants and to focus issues subject to DRC discretion,
the ZAB often provides direction early in the process on the bulk and massing of a
project prior to design review. This “preview” process is generally used for large
projects, especially if the project exceeds the development envelope allowed by the
zoning ordinance as part of a density bonus concession.
To facilitate development in the downtown core, the City is considering preparing a “fast-
track” review process.
The City is considering the development of area-specific design guidelines to provide
better direction to applicants, including San Pablo Avenue and the downtown area.
Historic Preservation: The City first adopted a Landmarks Preservation Ordinance (LPO) in
1974. The LPO establishes the duties of the Landmarks Preservation Commission (LPC). The
LPO gives the LPC authority to make landmark, structure of merit, and historic district
designations, subject to appeal to the City Council. The LPC also reviews permit applications
for alteration, construction, or demolition of landmarks, structures or merit, and structures in
historic districts, also subject to Council appeal.

2015-2023 Berkeley Housing Element
4 – Potential Constraints to Housing Production
68
The 1974 ordinance remained in effect with little change until December 2006 when a revised
ordinance was adopted by the City Council. That revised ordinance was subject to referendum
and repealed by the voters in the November 4, 2008 General Municipal Election.
Preservation Designations. Proposals for designation can be initiated by private application or
petition, by the LPC itself, or by the City Council, Planning Commission, or Civic Arts
Commission. Under the LPO, 50 signatures are needed for a member of the public to initiate a
site or structure for designation. From the time a site is initiated, the LPC has 70 days to open
the public hearing and 180 days to act after the public hearing is closed. The criteria for site
designation are briefly summarized below.
BMC Chapter 3.24.110 Landmarks, historic districts and structures of merit –
Designation – Criteria for consideration:
1. Landmarks and historic districts:
Architectural merit
Cultural value
Educational value
Historic value
2. Structures of merit (SOM): General criteria shall be architectural merit and/or cultural,
educational, or historic interest or value. If upon assessment of a structure, the
commission finds that the structure does not currently meet the criteria as set out for a
landmark, but it is worthy of preservation as part of a neighborhood, a block or a street
frontage, or as part of a group of buildings which includes landmarks, that structure may
be designated a structure of merit.
Structural Alteration Permits. Once a site is designated as a landmark or structure of merit, or
as part of historic district, alterations to the exterior of the building are subject to a structural
alteration permit from the LPC. The LPC uses the Secretary of the Interior standards as criteria
for alteration permits. The scope of the alteration permit is limited to the historic attributes on the
exterior of the building that are identified in the site designation. The provisions of the
designation, such as particular design features of the structure, are specified in the designation
action by the LPC.
Potential Constraints & Mitigation: In cases where the site subject to initiation is also a site with
a pending application for a residential development project, the landmark review process may
delay the development project review process. This could prevent the City from reviewing a
project within the required timeline of the Permit Streamlining Act (PSA). Additionally, if the
result of the initiation is to designate the site a historic resource, an applicant would be subject
to unanticipated environmental review for potential impacts to a historic resource. As a result,
initiation of a site with a pending project as a historic resource could potentially constrain
development of housing on that site due to uncertainty about the historic status and delay in the
project review process. In order to mitigate the uncertainty and delay resulting from
unanticipated initiation of a site as a historic resource, the Berkeley Planning Department uses

2015-2023 Berkeley Housing Element
4 – Potential Constraints to Housing Production
69
the following procedures to identify potential historic resources early in the project review
process:
Notify the LPC of all pending projects. The Zoning Ordinance was modified in 2006 to
require notification of the LPC of all pending permits and placement of all properties on
the LPC agenda for potential initiation by the Commission. Specifically, BMC Section
23B.24.030.B states: “A list of all pending applications for Permits shall be provided to
the Landmarks Preservation Commission at every regular meeting thereof. Each
property that is the subject of an application included in that list shall be placed on the
agenda for potential initiation…”
All applications to demolish a structure located in a non-residential district that is more
than 40 years old are referred to the LPC for comment prior to consideration of the
permit to demolish. BMC Section 23C.08.050 states: “the LPC may initiate a landmark
or structure-of-merit designation or may choose solely to forward to the Board its
comments on the application.” It is Department policy to refer demolitions applications
with basic background information on the property as early as possible in the permit
review process.
For sites subject to initiation, staff make every effort to facilitate the designation review
process as quickly as possible.
Periodic training of the landmarks commissioners. In May 2008 the LPC and interested
community members received training in historic preservation from the local historic
preservation firm Architectural Resources Group. The training included federal, state and
local criteria for evaluation of historic resources, the Secretary of the Interior’s standards,
CEQA, and the role of the LPC in the decision-making process.
Hiring of staff to the Landmarks Commission with significant background in historic
resources. Starting in 2007 the City staffed the LPC with a professional historic
preservation planner. The planner provides the Commission with detailed
recommendations on historic resource initiations and review of structural alteration
permits.
Conclusions:
The permit process in Berkeley may be considered a constraint to housing production.
Although, based on the amount of affordable and market-rate development that has been
approved and the density of those projects, it does not appear to have deterred new
development, and the City met most of its previous RHNA targets. However, Policy H-34 calls
for the City to continue to improve and streamline the development review process and to
evaluate regulations to identify and reduce unnecessary impediments to housing development
and affordable housing projects.
Fees and Exactions
Analysis:
Like all cities, Berkeley collects development fees to recover the costs of providing services and
processing applications. When fees are adopted by the City Council, an analysis is provided to

2015-2023 Berkeley Housing Element
4 – Potential Constraints to Housing Production
70
demonstrate that they do not exceed the reasonable cost of providing the service. Berkeley’s
fees to process use permits and other land use permits only cover approximately 50% of the
actual cost.
Unlike many cities, housing projects are not charged impact fees for transportation, parks,
schools, or other capital improvements. In the downtown, the Streetscape and Open Space
Improvement Plan (SOSIP) fee is charged of new developments. As discussed above, the City
also charges an affordable housing mitigation fee of new rental development projects on a per-
unit basis to fund permanently affordable housing units in the community. The only local
infrastructure fee that applies to all projects is for sewer connection and service. The East Bay
Municipal Water District (EBMUD) and Pacific Gas & Electric also collect fees for their services.
Estimated planning and construction fees are shown below for a new 2,500 square foot single-
family dwelling and for a 78-unit multi-family project, with 780 square foot units. Environmental
review costs were not included because infill housing is often exempt from CEQA. The total
per-unit building permit, planning review, and sewer connection fees total $28,398 for the single-
family dwelling and $10,518 per unit for the multiple-family dwelling. The impact fees applicable
to the mixed-use project include the Affordable Housing Mitigation Fee of $20,000 per unit and
the Streetscape and the Open Space Improvement Fee (SOSIP; downtown projects only) of
$2,010 per unit, for a total cost of $32,527 per unit in the multi-family building.
The City Council has the authority to grant building permit fee deferrals or waivers for projects
with at least 25% low or moderate-income housing. The Housing Programs Section of this
Housing Element provides a detailed description of this program.
Because fees cover the cost of service and a waiver of fees would place that burden on other
projects, fees are not waived unless funding is provided from another source, such as the
General Fund. However, it is not uncommon for fees to be deferred, which assists applicants by
postponing the expense until occupancy. Since 2000, the City has deferred at least $2 million in
permit fees for 12 to 15 residential projects.

2015-2023 Berkeley Housing Element
4 – Potential Constraints to Housing Production
71
Table 4-7: Estimated Planning, Building, and Impact Fees Assumptions Single Family Residential Multi-family Residential
Sq Ft/unit 2,500 780
Units 1 79
Value per sq ft $160 $123
Value per unit $400,000 $148,061
Full value $400,000 $11,704,700
Full sq ft (incl. parking) 2,500 95,066
BUILDING PERMIT FEES
Permit Fee $8,834 $257,554
Plan Check Fee $5,742 $167,403
Filing Fee $22 $22
Title 24: Energy Fee1
$1,060 $30,905
Title 24: Disabled Access Fee1
$1,060 $30,905
Fire and Life Safety Fee $618 $18,028
California SMIP Fee1
$52 $1,521
Technology Fee $442 $12,877
Sustained Development Fee $530 $15,453
State Building Standards Fee1
$16 $469
Community Planning Fee $442 $12,877
Subtotal $18,819 $548,005
PLANNING FEES
Use Permit $6,043 $25,851
Design Review - $10,147
CEQA - Mit Neg Dec - -
Subtotal $6,043 $35,998
IMPACT FEES
Art N/A N/A
Childcare N/A N/A
Affordable Housing – Commercial N/A N/A
Affordable Housing – Residential
2
$1,580,000
SOSIP (Downtown only) N/A $158,760
Transportation N/A N/A
Schools N/A N/A
Sewer Connection Fee $3,536 $246,881
Subtotal $3,536 $1,985,641
Total Cost $28,398 $2,569,644
Per Unit $28,398 $32,527
(1) State of California fees. (2) The Affordable Housing Mitigation fee was adopted in 2011 in response to the inability to require inclusionary rental units after the Palmer court decision. See discussion above.
Conclusions:
Fees are not generally a significant part of construction costs, are not excessive in Berkeley,
and are not a constraint to housing production. The fee deferral program will continue and no
further mitigation is required. Building and Use Permit fees did not increase significantly from
2010 to 2014. Impact fees did increase, including the Affordable Housing Mitigation Fee. This
fee is in-lieu of inclusionary housing and is commensurate with the cost of providing inclusionary
below-market units. The Streetscape and Open Space Improvement Fee (SOSIP) is a new

2015-2023 Berkeley Housing Element
4 – Potential Constraints to Housing Production
72
impact fee for the downtown area only. As discussed in the SOSIP Nexus Study, the fee is
proportionate to the increased demand created by new downtown occupants and was
introduced to provide needed open space amenities for the increased residential density
allowed with the 2012 Downtown Area Plan.
On and Off-Site Improvement Requirements and Infrastructure
Constraints – Road, Water, and Sewer
Analysis:
Most housing opportunity sites in Berkeley are infill sites that already have infrastructure and
services in place and are located along fully developed streets. On and off-site improvement
requirements can include frontage improvements to streets and sidewalks if needed, and
sanitary and storm water sewer connections. In addition, the City’s sewer lateral program,
developed to reduce the amount of water flowing into the sewer system, applies to property
sales and remodeling, but would not be a constraint to new development, which would need to
develop new sewer laterals.
In general, as documented in the 2001 General Plan Environmental Impact Report and the 2009
Downtown Area Plan Environmental Impact Report, the City’s sewer and storm water collection
systems, EBMUD’s treatment and disposal facilities, and water supplies are adequate and are
not a constraint to development of housing. To the extent that infrastructure must be enlarged
or repaired as a result of new residential construction, the City requires developers to pay costs
directly associated with improving infrastructure. Increased water demand from new
construction under current zoning regulations have been anticipated in the EBMUD water
demand projections, as published in the Districts’ 2005 Urban Water Management Plan. As
discussed in Chapter 3 and Appendix A, the City’s current zoning regulations provide adequate
capacity for Berkeley’s projected housing needs in the RHNA. Therefore, there is sufficient
water capacity to support the City’s RHNA units.
The 2001 General Plan EIR identified future water needs as a potential impact to be addressed
by implementation of a recycled water ordinance upon notification by the EBMUD of availability
of recycled water in Berkeley. The EBMUD East Bayshore Recycled water project will
eventually serve portions of Berkeley near I-80, at which time the City will adopt an ordinance to
route recycled water to industrial and landscaping uses in the service area. In addition, the City
recently adopted a water efficient landscape ordinance consistent with State law, which will
reduce demand for potable water used for landscaping on developed lots and with new
construction.
The EBMUD treatment plant has adequate capacity to accommodate additional development. In
particular, the plant can provide secondary treatment up to a maximum flow of 168 MGD (with
additional peak capacity via storage basins), and the average daily dry-weather flow is currently
approximately 80 MGD, leaving an available capacity of 88 MGD. The City’s on-going efforts to
reduce infiltration (including the sewer lateral program) reduces the peak wet weather flows and

2015-2023 Berkeley Housing Element
4 – Potential Constraints to Housing Production
73
would, therefore, also reduce potential impacts to the overall wastewater collection system
associated with development.
Panoramic Hill is the only geographic area in Berkeley that has significant infrastructure
constraints and which is particularly vulnerable to natural disasters because of its extremely
poor emergency access, location in a very high fire hazard zone, proximity to the Hayward fault,
and substandard water resources for fire suppression. On June 17, 2008 the City Council
adopted an urgency ordinance imposing a moratorium on most development in the Panoramic
Hill area. There are 14 legally-established vacant lots in the Panoramic Hill area, most of which
do not meet minimum lot size.
The purpose of the moratorium is to provide time to identify, formulate, and begin to implement
a series of actions to address the serious threats to public safety that exist in the Panoramic Hill
neighborhood. The scope of the initiative includes actions that the City can take in the near
term as well as developing a strategy for undertaking long-range planning for Panoramic Hill to
address the area’s underlying infrastructure and safety deficiencies. Near-term actions include
modifications to the zoning ordinance, which may limit any development with potential for
increasing the number of Panoramic Hill residents at risk until the severe existing infrastructure
problems are resolved.
Conclusions:
With the exception of the Panoramic Hill area, all Berkeley parcels where housing opportunities
are possible can be served by the City’s water, sewer, and road systems. While the sewer,
water, and road infrastructure issues in the Panoramic Hill area are a constraint to the
production of housing, the purpose of the moratorium is to develop a plan to overcome these
constraints and very few properties are affected.
Codes and Enforcement
Analysis:
The building regulations are the California Building Code, based on the International Building
Code as amended and adopted by the City of Berkeley. Local amendments that could apply to
residential construction include:
Live-work occupancies regulations codifying existing practice in applying state code
standards to these occupancies that are not defined in the state code
Restrictions in the Fire Zones enacting additional fire protection measures for buildings
in Berkeley’s hillside areas threatened by wildland fire
Wood Burning Appliances amendment to reduce the health risks caused by wood smoke
in Berkeley’s climatic conditions
Except for the fire protection requirements, the local building code amendments do not
adversely impact the cost of construction or constrain housing production. These requirements
address basic health and safety considerations for residences in the areas with the highest fire
danger.

2015-2023 Berkeley Housing Element
4 – Potential Constraints to Housing Production
74
As described further below, new buildings are required to meet all disabled access
requirements. No restrictions are in place that would constrain the development of housing for
persons with disabilities.
Building code enforcement is handled primarily on a complaint-basis by building inspectors;
neighborhood complaints are handled by the City’s Code Enforcement staff. In addition, housing
inspectors respond to housing code complaints initiated by Berkeley tenants or by other City
programs; however, if substandard conditions pose an immediate threat to the health and safety
of the tenant, they are referred to the City's Building Official for immediate follow up. City policy
is to resolve residential code violations without displacing residents whenever possible;
however, when tenants must move, the City has an ordinance that requires the owner to provide
relocation assistance.
Conclusions:
Neither the building code nor code enforcement create constraints to the production of housing.
Both ensure compliance with Housing Element policies for construction and maintenance of
housing to protect public health, safety and welfare.
Housing for Persons with Disabilities
Analysis: Housing Element law requires cities to analyze constraints to the development of
housing for persons with disabilities and to demonstrate efforts to remove such constraints. The
City actively enforces California Building Standards Code provisions that regulate the access
and adaptability of buildings to accommodate persons with disabilities. Government Code
Section 12955.1 provides standards for multi-family buildings regarding adaptable design
features; access to the primary entry, all rooms on the primary entry level, common use areas,
and parking; and provision of at least one bathroom on the primary entry level.
In 2001 the Berkeley zoning ordinance was amended to include a “Reasonable
Accommodation” chapter (23B.52), which outlines a process for addressing requests for
modification of aspects of zoning or subdivision law that may act as barriers to fair housing
opportunities due to a resident’s disability. Regulations can be modified by the Zoning Officer,
the Zoning Adjustments Board, or the Planning Commission, depending on who has
responsibility for permit approval. No fees are charged for requests for reasonable
accommodation. (See Chapter 6, Housing Programs and Quantified Objectives for a description
of the ordinance).
Community care facilities are an allowed use in all residential districts subject to the same
discretionary review standards as a single family home. Specifically, conversion of an existing
dwelling unit to a community care facility, regardless of the number of residents, is allowed by-
right. Construction of a new community care facility is subject to a Use Permit. This is the same
requirement applicable to construction of a new single family home. The Zoning Ordinance’s
definition of community care facility is included below.

2015-2023 Berkeley Housing Element
4 – Potential Constraints to Housing Production
75
The definition of family and household does not require occupants to be related to one another,
and therefore does not present an obstacle to group housing for special needs populations. In
addition, the zoning ordinance does not include any siting, separation or minimum distance
requirements for community care facilities or other types of special needs housing. The
definitions of family and household are shown below.
Community Care Facility: Any facility, place or building where non-medical care and
supervision of children, adolescents, adults or elderly persons is conducted under
license from the California State Department of Social Services (SDSS), but not
including medical care institutions, skilled nursing facilities, nursing homes, foster
homes, family day care homes, child care facilities or transitional housing.
Family: See Household.
Household: One or more persons, whether or not related by blood, marriage or adoption,
sharing a dwelling unit in a living arrangement usually characterized by sharing living
expenses, such as rent or mortgage payments, food costs and utilities, as well as
maintaining a single lease or rental agreement for all members of the Household and
other similar characteristics indicative of a single Household.
The City’s Housing Trust Fund provided funding for the University Neighborhood Apartments,
one of the first apartments in the country that was designed with seniors and people with
disabilities in mind. The City also provides financial assistance to agencies and non-profits
serving local people with disabilities including, but not limited to Ed Roberts Center, Center for
Independent Living, and Easy Does It Emergency Services. For more discussion of City
programs for accessible and fair housing assistance, see Chapter 6, Housing Programs and
Quantified Objectives.
Conclusions:
Berkeley’s zoning and land use ordinances do not impede the development of housing for
people with disabilities. Potential constraints to the development of housing for persons with
disabilities have been addressed through multiple City programs and through the regulations
described above. Although further mitigation is not required, Policies H-23, Fair Housing; H-24,
Americans with Disabilities Act; and H-25, Accessible Housing provide direction for the City to
continue to improve accessibility, including by identifying and removing any regulatory barriers
to rehabilitation of existing housing for accessibility.
B. Non Governmental Constraints
Physical and Environmental Constraints
Analysis:
The City does not have large tracts of vacant land available for residential construction. The
only large undeveloped area of Berkeley is the waterfront area west of Interstate 80, which the
City has designated for open space and low-density waterfront-oriented commercial

2015-2023 Berkeley Housing Element
4 – Potential Constraints to Housing Production
76
development. Housing development is not environmentally feasible in this area due to a
combination of environmental sensitivity and seismic/soil stability problems in an area
composed mostly of landfill materials.
Flooding is not an environmental constraint that affects production of housing because the
areas that are within the 100-year floodplain area (the waterfront and near Codornices Creek)
are not zoned for high-density residential housing. The City updated the Flood Zone
Development Ordinance (BMC Chapter 17.12) in 2009 to conform with FEMA flood plain
management requirements.
Toxics contamination is an environmental constraint on some sites. The City’s Toxics
Management Division, which is part of the Planning and Development Department, participates
in the development review process and thereby assists with early identification of toxics issues.
Standard processes and conditions ensure that contamination is remediated to allow
redevelopment.
The only geographic area in Berkeley with significant physical constraints is Panoramic Hill, or
the Environmental Safety-Residential District (ES-R). After a two-year moratorium on
construction, in 2010 the City passed an ordinance prohibiting any new residential units in this
district until the City Council has adopted a specific plan in compliance with all applicable law
that shows the proposed distribution, location, and extent of land uses in the ES-R zone and the
location and extent of the public facilities and services required to serve the land uses described
in the Panoramic Hill Specific Plan (the Plan). There is no specified timeline for development of
the Plan.
Conclusions:
In general, physical and environmental constraints are not constraints to the production of
housing. Adequate sites without environmental constraints are available to meet development
needs and toxics issues are addressed during project review. While no new residential units are
permitted in Panoramic Hill, only 14 vacant lots are affected – a negligible percentage of
citywide housing production opportunities. For the purpose of the Housing Element analysis of
constraints to the production of housing, no mitigation is required.
Seismic Hazards
Analysis:
Geologists warn repeatedly of the high risk of a major earthquake in the San Francisco Bay
Area, including the northern section of the Hayward Fault that runs through the Berkeley Hills
east of the University of California. The effects of a strong earthquake along any portion of the
Hayward fault would devastate the area. The Association of Bay Area Governments (ABAG)
estimates that about 13,000 units would be uninhabitable following a major earthquake. As
described in Chapter 6, under “Seismic Preparedness Programs,” Berkeley has policies and
programs to mitigate the risk to existing units. In addition, the zoning ordinance allows certain
residential structures destroyed by an involuntary cause such as fire, flood, or earthquake to be
rebuilt with a zoning certificate.

2015-2023 Berkeley Housing Element
4 – Potential Constraints to Housing Production
77
Seismic constraints are not perceived to be a significant factor limiting the City’s ability to
produce housing. The Berkeley Hillside area is the most seismically vulnerable and most
vulnerable to landslides. Since only single-family dwellings are allowed in this area and the
amount of vacant land is limited, such hazards are not a significant constraint to new
development. Similarly, lands subject to liquefaction are located in West Berkeley, where
housing options are generally limited by zoning and nearby industrial uses.
Conclusions:
Seismic constraints are not considered a significant constraint. The building code requires
seismically-resistant construction practices.
Cost of Development
Analysis:
The cost of developing residential housing has escalated significantly in recent years due to the
increasing cost of land, building materials, labor, and other items such as remediation and
construction defects liability insurance. Research conducted for the City by AECOM in July
2014 showed that sales prices for downtown land averaged $200 per square foot mid-block and
$250 per square foot on corner lots.
Construction costs vary depending on project size, construction type (wood frame vs. steel), the
number of funding sources involved, and the level of amenities or services provided in the
project. The 2011 AECOM Development Feasibility Study included the following information
about construction costs (the update to that study prepared in 2014 assumed an 8.6% increase
in development costs):
Table 4-8: Residential Construction Costs (Condo) – Gross square foot1
Building Height 2011 2014 (est. 8.6% increase)
60 feet $237 $257
120 feet $253 $275
–180 feet $259 $281
Source: Downtown Berkeley Development Feasibility Study, AECOM, 2011
(1) Excludes parking construction costs.
Construction financing issues are no different in Berkeley than in other California cities. The
City has no control over financial feasibility of a project, however, it is anticipated that demand
for housing will continue and thus financing should similarly be available to meet market
demand.
Availability of Financing:
The availability of financing affects a person’s ability to purchase or improve a home. The cost
of borrowing money for residential development affects the financial viability of new
development. Interest rates are determined by national policies and economic conditions, and
there is very little a local government can do to affect these rates. Jurisdictions can offer down

2015-2023 Berkeley Housing Element
4 – Potential Constraints to Housing Production
78
payment assistance programs for first-time homebuyers, a program which the City of Berkeley
has previously participated in.
In the early 2000s, the country as a whole experienced historically low interest rates and an
increase in unconventional mortgages, which contributed to the rise in housing costs by fueling
supply. Beginning in 2006, housing prices declined and interest rates rose, resulting in an
increased number of foreclosures, particularly for sub-prime loans and loans with variable rates
that converted to higher fixed-rates. The crisis has significantly lessened, foreclosures are no
longer as common, and interest rates are again very low. As a result of the mortgage crisis, the
federal government has updated mortgage lending rule, aiming to end some of the worst
mortgage lending abuses of the past. With stricter underwriting stipulations, mortgage financing
options have been reduced, and processing times have increased in recent years.
Conclusions:
While the cost of development is generally a constraint in Berkeley as it is throughout California,
state density bonus provisions and local regulations that allow high densities on commercial
corridors mitigate the impact as much as possible. In addition, the City’s Housing Trust Fund
provides assistance for affordable housing projects. See Chapter 6 for a discussion of programs
in Berkeley that mitigate the cost of developing affordable housing.

2015-2023 Berkeley Housing Element
5 – Objectives, Policies and Actions
79
5 - Objectives, Policies and Actions
Purpose
This chapter presents the City’s housing goals in the form of ten main objectives, policies that
enact those objectives, and actions to implement those policies. The objectives and policies
guide decision-making to address the housing needs identified in Chapters 2, 3 and 4. The
actions are achieved through implementation of the programs described in Chapter 6.
A. Objectives
1. Housing Affordability
Berkeley residents should have access to quality housing at a range of prices and rents.
Housing is least affordable for people at the lowest income levels, and City resources should
focus on this area of need.
2. Maintenance of Existing Housing
Existing housing should be maintained and improved. Improvements that will prepare buildings
for a major seismic event should be encouraged.
3. Expansion of the Housing Supply
New housing should be developed to expand housing opportunities in Berkeley to meet the
needs of all income groups.
4. Special Needs Housing and Homelessness Prevention
Berkeley should expand the supply of housing for special needs groups, including housing
affordable to households and individuals with extremely low incomes.
5. Relationship with Other Institutions
The City should continue working with the Berkeley Housing Authority and the University of
California to address affordable housing needs.

2015-2023 Berkeley Housing Element
5 – Objectives, Policies and Actions
80
6. Fair and Accessible Housing
The City should continue to enforce fair housing laws and encourage housing that is universally
accessible.
7. Public Participation
Berkeley should continue to improve the role of neighborhood residents and community
organizations in housing and community development decision-making.
8. Energy Efficiency
The City should promote energy efficiency in new and existing residential buildings in order to
improve building comfort and safety, reduce energy costs, provide quality housing, and reduce
Greenhouse Gas Emissions.
9. Adequate Sites
Berkeley should retain adequate housing opportunity sites to meet its future housing needs.
10. Governmental Constraints
Berkeley should identify and mitigate barriers to the construction of new housing of all types.
B. Policies and Actions
The following policies and actions are grouped by the ten objectives described above.
1. Housing Affordability
Policy H-1 Extremely Low, Very Low, Low and Moderate-Income Housing
Increase the number of housing units affordable to Berkeley residents with lower income levels.
(Also see Land Use Policies LU-18 and LU-25)
Actions:
A. Continue to support and implement programs to encourage below-market-rate
housing with incentives for affordable housing development including, but not limited
to, density bonuses under state law, fee deferrals, and below-market-rate
development loans.
B. Amend the zoning ordinance to allow increases in density to promote the production
of below market rate housing consistent with state density bonus law.
C. Use existing City programs, such as the Housing Trust Fund, to provide housing to
households at the lowest income levels, including extremely low-income households,
and units that are deeply affordable housing for people with disabilities, the
homeless, the elderly, and very low-income families.

2015-2023 Berkeley Housing Element
5 – Objectives, Policies and Actions
81
D. Ensure that below-market-rate housing is distributed as evenly as possible
throughout the community.
E. Advocate for the California legislature to restore cities’ abilities to require below-
market-rate rental and ownership units in new housing developments. Consider all
available options to provide alternatives to inclusionary housing (see Policy H-2).
Policy H-2 Funding Sources
Aggressively search out, advocate for, and develop additional sources of funds for permanently
affordable housing, including housing for people with extremely low incomes and special needs.
(Also see Land Use Policy LU-28.)
Actions:
A. Look for all available funding sources, including but not limited to local bond
financing and local, state and federal tax sources, such as a special tax and/or the
real property transfer tax, to generate additional resources for the Housing Trust
Fund and other housing programs.
B. Continue to utilize the existing housing mitigation fee applicable to commercial
projects. Consider revisions to the fee, including but not limited to updating the fee
and applying it to new hotel or conference center uses.
C. Continue to charge housing mitigation fees applicable to residential projects and
update periodically as the housing market shifts.
D. Work to ensure that local funding is planned and administered in a way that allows
project sponsors to maximize their leveraged funding and meet the requirements of
other funding sources while accomplishing local goals.
E. Support increased funding at the federal and state levels to support the production
and operation of permanent, affordable housing.
F. Continue to use condominium conversion mitigation fees to support the
development, preservation, and maintenance of affordable housing.
Policy H-3 Permanent Affordability
Ensure that below market rate rental housing remains affordable for the longest period that is
economically and legally feasible.
Actions:
A. Prioritize the use of City resources to assist nonprofits with preserving existing
affordable housing in the event that rental restrictions and/or rental subsidy
contracts, such as project-based Section 8, expire.
B. Monitor units funded by the Housing Trust Fund or that were created by the
Inclusionary Ordinance to ensure long-term health, safety, and affordability of these
units.
C. Encourage the preservation and rehabilitation of residential hotel rooms and single
room occupancy units that currently house very low-income tenants to continue
providing housing for this population.

2015-2023 Berkeley Housing Element
5 – Objectives, Policies and Actions
82
D. Maintain continued affordability of below-market-rate units to the maximum extent
possible.
E. Maintain and publicize a consolidated list of below-market-rate units within the City to
serve as a resource for lower-income households.
Policy H-4 Economic Diversity
Encourage inclusion of households with a range of incomes in housing developments through
both regulatory requirements and incentives.
Policy H-5 Rent Stabilization
Protect tenants from large rent increases, arbitrary evictions, hardship from relocation, and the
loss of their homes.
Actions:
A. Support the Rent Stabilization Program and enforcement of the Rent Stabilization
and Eviction for Good Cause Ordinance in order to protect tenants from large rent
increases and loss of their homes.
B. Continue to oppose measures that weaken the City’s autonomy to stabilize rents and
support measures that increase the City’s autonomy to stabilize rents.
C. Support state legislation consistent with the original language of the Ellis Act
promoting rental housing conservation.
Policy H-6 Rental Housing Conservation and Condominium Conversion
Preserve existing rental housing by limiting conversion of rental properties to condominiums.
Actions:
A. Continue applying a 100-unit per year cap on condominium conversions and
evaluate the cap regularly, along with other aspects of condominium conversion
ordinance regulations.
B. Continue tenant protections contained in the condominium conversion ordinance.
C. Continue mitigation fee policies of the condominium conversion ordinance and
evaluate their performance regularly.
Policy H-7 Low-Income Homebuyers
Support efforts that provide opportunities for successful home ownership for residents and
workers in the City of Berkeley.
Actions:
A. Continue the City’s participation in Alameda County’s mortgage certificate program,
providing subsidies for limited equity co-operatives, deed-restricted condominiums
and other forms of ensuring continued affordability, evaluating homebuyer programs
for extremely low and very low-income households, and improving educational
materials on how to take advantage of these programs.

2015-2023 Berkeley Housing Element
5 – Objectives, Policies and Actions
83
B. Require pre-purchase homebuyer counseling and encourage post-purchase
counseling for any new homebuyer programs that include City funding.
C. Work with limited equity co-operatives and land trusts to develop a set of best
practices for purchasing and operating homeownership communities.
D. Develop partnerships with certified counseling agencies that provide assistance with
foreclosure prevention and mortgage workout strategies.
E. Explore the feasibility of encouraging limited equity co-operatives.
2. Maintenance of Existing Housing
Policy H-8 Maintain Housing
Maintain and preserve the existing supply of housing in the City.
Policy H-9 Code Requirements and the Rental Housing Safety Program
Enforce code requirements to ensure that existing housing meets health and safety standards.
Actions:
A. Continue to provide information and outreach to property owners and tenants
regarding applicable regulations.
B. Continue and improve the City’s program of periodic inspection of rental units for
health and safety code compliance.
Policy H-10 Deterioration, Blight and Deferred Maintenance
Prevent blight and the deterioration of housing units resulting from deferred maintenance.
Actions:
A. Continue interdepartmental coordination to address problem properties.
B. Pursue all legal and administrative remedies to require owners of problem-plagued
residential properties to repair and return their properties to active use in the housing
market.
C. Develop programs and identify funding to assist low-income homeowners with
maintenance costs and assist property owners with maintenance of low-income
rental properties.
D. Encourage preservation of historic residential structures by helping property owners
obtain financial assistance for rehabilitation, such as Mills Act funding.
E. Continue to assist low-income homeowners with rehabilitation through the Senior
and Disabled Home Rehabilitation Program and weatherization programs.
Policy H-11 Seismic Reinforcement
Maintain housing supply and reduce the loss of life and property caused by earthquakes by
requiring structural strengthening and hazard mitigation in Berkeley housing. (Also see Disaster
Preparedness and Safety Policies S-15, 17, 18, and 20.)
Actions:

2015-2023 Berkeley Housing Element
5 – Objectives, Policies and Actions
84
A. Continue to encourage retrofitting of seismically unsafe buildings, such as
unreinforced masonry buildings and soft-story buildings through incentive programs
and requirements.
B. Reduce the seismic threat to Berkeley’s housing stock without necessitating
substantial rent increases by identifying ways to minimize the financial impact of
retrofits, such as offering fee deferrals, waivers for certain zoning regulations, and
special funding programs.
C. Seek grant funding for post-disaster recovery planning.
D. Establish specific findings and procedures that can be used to expeditiously and
efficiently approve reconstruction of preexisting, legal, non-conforming residential
structures after a major natural disaster.
3. Expansion of the Housing Supply
Policy H-12 Transit-Oriented New Construction
Encourage construction of new medium and high-density housing on major transit corridors and
in proximity to transit stations consistent with zoning, applicable area plans, design review
guidelines, and the Climate Action Plan. (Also see Land Use Policies LU-18, 23, 25 and
Transportation Policy T-16.)
Actions:
A. Consistent with the Climate Action Plan, encourage new residential development that
promotes modes of transportation other than privately-owned cars and trucks,
including walking, biking, car share, and public transportation, thereby reducing the
need for parking and reducing the overall cost of providing housing.
B. Consider a variety of incentives, such as a waiver or partial waiver of parking
requirements, in exchange for investment in transportation demand management
measures, such as increased bicycle parking or other bike amenities, parking for
alternative fuel vehicles, Eco-Passes for residents, or car share parking.
C. Continue to encourage developers to separate the actual costs for renting or
purchasing parking from the costs of new rental housing for the tenants in market-
rate projects.
D. Consider implementing parking maximums.
E. Consider adjusting zoning to allow for greater residential density and specified
commercial uses along certain transit corridors and in proximity to the Downtown
Berkeley, Ashby, and North Berkeley BART stations.
Policy H-13 Second Units
Encourage and facilitate addition of second and small “in-law” units on properties with single-
family homes, but not in areas with limited parking and vehicular access or that are especially
vulnerable to natural disaster. (Also see Disaster Preparedness and Safety Policy S-16..
Actions:
2015-2023 Berkeley Housing Element
5 – Objectives, Policies and Actions
85
A. Evaluate the accessory dwelling unit (ADU) regulations to identify and remove
possible constraints to new ADUs.
B. Consider adjusting zoning to allow for more ADUs and second units, particularly in
areas well-served by public transit.
4. Special Needs Housing and Homelessness Prevention
Policy H-14 Homelessness and Crisis Prevention
Support programs and actions that prevent homelessness and other housing crises by making
appropriate services available.
Actions:
A. Support the increase of enrollment of eligible individuals in SSI, Medi-Cal, SNAP,
and other benefits programs. Full use of benefits will help stabilize eligible
households and can prevent homelessness and other housing crises.
B. Increase availability of age-appropriate services for youth exiting state or local care,
including basic life skills development, job training, services, coordination, legal
representation and advocacy, mental health and substance use treatment, and
access to medical care.
C. Continue to support the Housing Retention Program, which helps low-income people
retain their housing and avoid homelessness.
D. Maintain City funding for anti-poverty programs, including employment services,
childcare, healthcare, and nutrition that serve very low-income residents to enable
them to increase self-sufficiency and remain housed.
E. Encourage and support eviction prevention and other fair housing outreach
programs, and continue enforcement of the Rent Stabilization Ordinance to avoid
evictions that could lead to homelessness.
Policy H-15 Homeless Housing
Seek solutions to the problems of individuals and families who are homeless, with the goal of
first providing them with permanently affordable housing.
Actions:
A. Increase availability of supportive housing units in Berkeley that are affordable to
households whose incomes do not exceed 30 percent of the Area Median Income
(AMI) and serve people who are formerly homeless or have severe disabilities by
creating 20 to 30 units per year (with an overall goal of 350 units over 15 years).
B. Continue existing rent subsidy programs such as the Public Commons for Everyone
Initiative Square One program and Shelter Plus Care, and seek out new sources of
funding to expand or create new programs to maximize permanent housing
opportunities for the homeless. Programs may provide deep or shallow subsidies,
and may be linked to affordable housing developments, as in Project-Based Section
8 vouchers and the Mental Health Services Act Housing Program, or be available for
private market rentals like Tenant-Based Section 8 vouchers.

2015-2023 Berkeley Housing Element
5 – Objectives, Policies and Actions
86
C. Ensure that Berkeley's allocation of Mental Health Services Act Housing Program
funding, administered by the California Housing Finance Agency in conjunction with
the California Department of Mental Health, is fully utilized for housing development.
D. Ensure that affordable housing units can well serve homeless and special needs
populations by linking their housing with flexible and appropriate supportive services.
E. Analyze successful, innovative and supportive housing models in other communities
in order to determine whether they can be implemented in Berkeley.
F. Coordinate with service providers to ensure that up-to-date information about
affordable housing and permanent supportive housing opportunities is widely
accessible.
Policy H-16 Family Housing
Support and encourage housing projects that include units affordable and suitable for
households with children and large families.
Actions:
A. Identify obstacles to and incentives for development of housing suitable for families
with children or family member(s) requiring assistance and multi-generational
families.
B. Consider incentives for construction of housing suitable for families with adequate
amenities such as access to outdoor space, transit, and access to neighborhood
goods and services.
C. Encourage the development of childcare opportunities by supporting the provision of
childcare centers in residential neighborhoods and in new residential projects.
Consider offering incentives for inclusion of childcare in appropriate projects.
Policy H-17 Housing for Seniors
Support housing programs that increase the ability of senior households to remain in their
homes or neighborhoods, and if necessary, to locate other suitable affordable housing to rent or
purchase.
Actions:
A. Continue the Senior and Disabled Home Rehabilitation Program.
B. Develop incentives for a range of senior housing types including, but not limited to,
second units or ADUs to help seniors age in their homes, in a universally-accessible
ADU on their property, or to provide on-site housing for caregivers.
C. Continue to provide, and expand as possible, funding for a range of senior housing
and service types.
Policy H-18 Housing for People with Disabilities
Encourage provision of an adequate supply of suitable housing to meet the needs of people
with disabilities, including developmental, behavioral health (mental health as well as alcohol
and other drug dependence), and physical (including HIV/AIDS) disabilities. (See also policies
and actions under Fair and Accessible Housing and under Homeless Housing.)

2015-2023 Berkeley Housing Element
5 – Objectives, Policies and Actions
87
Policy H-19 Emergency Shelters and Transitional Housing
Recognizing that the City’s priority for new homeless housing opportunities is for permanent
housing, to the extent feasible and until they can access permanent housing, provide
emergency shelter and transitional housing to homeless individuals and families, including
people with mental, physical, and developmental disabilities, victims of domestic violence,
youth, and seniors.
Actions:
A. As required by SB2, maintain zoning districts where emergency shelters shall be
allowed as of right, including a year-round emergency shelter.
5. Relationship with Other Institutions and Regional Cooperation
Policy H-20 Berkeley Housing Authority
Continue working with the Housing Authority to make quality affordable housing opportunities
available to Berkeley residents.
Actions:
A. Encourage the BHA to continue posting information regarding availability of Section
8 voucher units on the BHA website and to coordinate with countywide housing-
information services, such as “2-1-1”.
B. Assist the BHA with distribution of information.
C. Collaborate with the BHA and affordable housing developers in applying for an
additional allocation of Project-Based Section 8 funding for use in connection with
the development of new affordable housing units throughout the City.
D. Encourage the Berkeley Housing Authority and other owners of publicly subsidized
rental housing work with tenants to maintain a high quality living environment.
E. Partner with BHA to plan and provide financial support through general funds and
other mechanisms.
Policy H-21 University of California
Urge the University of California to maximize the supply of appropriately located, affordable
housing for its students and also to expand housing opportunities for faculty and staff. (Also see
Land Use Policies LU-37 and 38 Action A.)
Actions:
A. Encourage and promote construction of additional housing for students, staff and
faculty, particularly family housing, within walking distance of campus, and work with
the University, private developers and nonprofits to increase the supply of affordable
housing for faculty and staff. Encourage the University to undertake private-public
partnerships such that this housing pays its fair share of taxes towards meeting City
service needs.
B. Encourage development of satellite housing near transit more distant from the
campus (including other municipalities).

2015-2023 Berkeley Housing Element
5 – Objectives, Policies and Actions
88
C. Work with other jurisdictions to advocate for changes in state legislation that would:
1) require the University of California to provide adequate housing for students and
minimize housing impacts in the area from the University; and 2) count University-
provided beds towards our regional housing needs assessment.
D. Encourage the University and other institutions to maintain residential uses in
residential buildings, convert back to residential use residential buildings that have
been converted to non-residential use when appropriate, and convert to residential
use any unused buildings and underutilized sites where appropriate.
Policy H-22 Inter-Jurisdictional Coordination
Pursue opportunities to work with other jurisdictions to address issues of mutual interest and
priority.
Actions:
A. Develop and coordinate multi-agency, regional, and cross-jurisdictional approaches
to reducing homelessness and sustain participation in EveryOne Home, the county-
wide initiative to end homelessness.
B. Form alliances with other jurisdictions to advocate for actions and resources from all
levels of government (regional, county, state, and federal) that will address housing
needs in Berkeley and the Bay Area.
C. Advocate regional integration of housing planning with planning for open space and
environmental protection.
D. Advocate regional cooperation and coordination to encourage more efficient use of
land and increased construction of affordable housing in job-rich and transit-rich
communities in the Bay Area.
Policy H-23 Partnerships with Non-Profits
Continue to pursue opportunities to partner with non-profit housing agencies to rehabilitate,
preserve, and build below-market-rate housing units.
6. Fair and Accessible Housing
Policy H-24 Fair Housing
Ensure compliance with federal, state, and local Fair Housing and anti-discrimination laws and
ordinances. Federal, state, and local Fair Housing laws make it illegal to discriminate against
any person because of race, color, religion, gender, disability, familial status, national origin,
ancestry, marital status, sexual orientation, source of income, or age in the rental or sale,
financing, advertising, appraisal, provision of real estate brokerage services, etc., and land-use
practices.
Actions:
A. Continue to provide Fair Housing education, outreach, testing, mediation, and
referral services, making information available in English, Spanish, and Chinese.
B. Continue to support the provision of related legal services.

2015-2023 Berkeley Housing Element
5 – Objectives, Policies and Actions
89
Policy H-25 Americans with Disabilities Act (ADA) and CA Title 24 Disabled Access
Regulations
Exceed California Title 24 Disabled Access Regulations to increase the proportion of housing
throughout Berkeley that is accessible or adaptable for use by Berkeley citizens with physical
disabilities.
Actions:
A. Continue outreach activities to inform the community about Fair Housing laws and
rights, the Americans with Disabilities Act (ADA), and California Title 24 Disabled
Access Regulations, such as workshops for builders, architects and developers.
B. Educate additional City staff in the land use planning and building divisions on
California Title 24 Disabled Access Regulations, ADA requirements and universal
design features.
Policy H-26 Accessible Housing
Exceed the accessibility requirements of the ADA and California Title 24 Disabled Access
Regulations by encouraging incorporation into new construction and rehabilitation the use of
technologies and design features that create universal accessibility.
Actions:
A. Identify suitable universal accessibility standards for multi-family housing projects
and study potential for applying them in Berkeley.
B. Develop incentives to encourage construction of a variety of housing types suitable
for people with disabilities, including residents with developmental disabilities and
housing suitable for families or larger households with a disabled member.
C. Encourage housing types that are environmentally and chemically safe.
D. Continue and expand programs that help modify homes for accessibility to support
people with disabilities to remain in their homes, such as the Center for Independent
Living’s program, Rebuilding Together’s Safe Home Project, and the City’s Senior
and Disabled Home Rehabilitation Program.
E. Identify and remove regulatory barriers to the rehabilitation of existing housing for
accessibility.
Policy H-27 Affordable Accessible Housing
Encourage new construction and rehabilitation of accessible housing units that are permanently
affordable, in particular to extremely low-income households.
7. Public Participation and Future Housing Element Revisions
Policy H-28 Neighborhood Planning
Encourage and facilitate opportunities for housing developers and neighborhood residents and
organizations to collaborate on affordable housing projects that address neighborhood
concerns. (Also see Land Use policy LU-5, Urban Design and Preservation Policy UD-22, and
Citizen Participation Policies CP-5, 6, 7 and 8.)
2015-2023 Berkeley Housing Element
5 – Objectives, Policies and Actions
90
Actions:
A. Continue to strengthen opportunities for constructive participation by neighborhood
organizations in planning and development decisions that affect their constituencies
through use of the City’s website and other outreach efforts.
Policy H-29 Public Participation
Use public participation to seek attainment of common housing goals and for sharing
information about community needs in general.
Actions:
A. Encourage community support of affordable housing and special needs housing by
explaining advantages of affordable and special needs housing through active
community outreach and education.
B. Follow guidance provided in the General Plan Citizen Participation Element and the
Citizen Participation Plan contained in the City’s Consolidated Plan for Housing and
Community Development.
Policy H-30 Housing Element Revisions
The City should maintain an up-to-date Housing Element by conducting a public review and
update of the Housing Element consistent with state law to examine whether major changes in
policies may be necessary in order to achieve General Plan goals.
8. Energy Efficiency
Policy H-31 Energy Efficiency and Waste Reduction
Implement provisions of Berkeley’s Climate Action Plan to improve building comfort and safety,
reduce energy costs, provide quality housing, and reduce Greenhouse Gas Emissions. (Also
see Environmental Management Policies EM-3, 38, 39 and Urban Design and Preservation
Policy UD-33.)
Actions:
A. Improve local energy and green building standards for new residential construction
and renovations.
B. Continue to support energy efficiency practices in new construction and renovations
through consultation, education, incentives and outreach services.
C. Develop then phase in programs to encourage owners of existing single and multi-
family residential buildings to reduce energy use by providing incentives and
developing energy services, such as comprehensive energy audits, energy efficiency
upgrades, and education.
D. Continue and expand weatherization programs that assist low-income homeowners
and renters to reduce their energy use.
E. Continue and expand residential recycling and composting in single and multi-family
dwellings through improved assistance and education services, with emphasis on
outreach to tenants in multi-family dwellings.

2015-2023 Berkeley Housing Element
5 – Objectives, Policies and Actions
91
F. Continue and expand recycling of building materials and construction and demolition
debris resulting from both new construction and renovations through improved
assistance and education services.
9. Adequate Sites
Policy H-32 Publicly Owned Sites
Encourage use of publicly owned or controlled sites for affordable housing and/or mixed-use
residential projects with a substantial portion of affordable units consistent with the provisions of
Measure L. (Also see Land Use Policy LU-32.)
Policy H-33 Regional Housing Needs
Encourage adequate housing production to meet City needs and the City’s share of regional
housing needs.
Policy H-34 High-Density Zoning
Maintain sufficient land zoned for high and medium-density residential development to allow
sufficient new construction to meet Berkeley’s fair share of regional housing needs.
Actions:
A. Continue to require that developers and City staff work with neighborhood groups to
ensure adequate notification of proposals and steps to address concerns.
B. Ensure that development on dense, transit-served corridors transitions well into
adjacent lower-density residential zones in order to minimize impacts on the
character of interior neighborhoods.
10. Governmental Constraints
Policy H-35 Mitigate Governmental Constraints
Ensure that potential governmental constraints are identified and mitigated.
Actions:
A. Continue to improve and streamline the project review process.
B. Regularly evaluate City regulations and ordinances to identify and reduce
unnecessary impediments to housing development and affordable housing projects.
C. Identify and consider options to reduce potential constraints to existing infill
opportunities in residential districts, consistent with residential densities specified in
the Zoning Ordinance, as a way to provide housing with a neighborhood feel.
D. Consider changes to the demolition ordinance contained in the Zoning Ordinance and related regulations to establish consistent and reasonable criteria for demolition and replacement of residential units.

92
<Page Intentionally Left Blank>

2015-2023 Berkeley Housing Element 6 - Housing Programs and Quantified Objectives
93
6 - Housing Programs and Quantified
Objectives
Purpose
Berkeley has numerous housing-related programs that implement the community’s objectives,
policies, and actions as outlined in Chapter 5, Objectives, Policies and Actions. The State of
California requires Housing Elements to illustrate how cities achieve their community goals
through programs. The state also requires cities to address specific housing needs with
programs.
In Berkeley, our programs address both our community goals and state requirements. This
chapter identifies Berkeley programs that address state requirements and community goals,
describes the programs, outlines recent accomplishments, and identifies future actions. The
program descriptions identify agencies responsible for implementation, actions that will be
taken, and the timeframes under which they will proceed.
This chapter is organized as follows:
A. Programs Addressing State Law Requirements
B. Programs Addressing Berkeley Objectives
C. Summary of Quantified Objectives
D. Program Descriptions
A. Programs Addressing State Law Requirements
California Government Code Section 65583(c) requires municipalities to comply with housing
program requirements in several areas and to provide a summary of these programs. These
requirements include:
Providing adequate sites (Government Code §65583(c)(1));
Assisting in the development of adequate housing to meet the needs of low and
moderate income households (Government Code §65583(c)(2));
Addressing and, where appropriate and legally possible, removing governmental
constraints (Government Code §65583(c)(3)), such as land use controls, building
codes, site improvement requirements, fees and exactions, processing and permit

2015-2023 Berkeley Housing Element 6 - Housing Programs and Quantified Objectives
94
procedures, and providing reasonable accommodation for housing designed for
persons with disabilities;
Conserving and improving the condition of the existing affordable housing stock
(Government Code §65583(c)(4));
Identifying programs promoting equal housing opportunities (Government Code
§65583(c)(5)); and
Preserving affordable housing units that are at risk of converting to market rates
(Government Code §65583(c)(6)).
Berkeley programs addressing these state requirements are listed below under each
requirement.
1. Provide adequate sites (65583(c)(1)):
Chapter 3, Projected Housing Need and Land Resources, concludes the City has adequate
capacity to accommodate our regional housing need. The chapter provides a discussion of the
City’s inventory of housing opportunity sites and indicates the City has capacity both to
accommodate our regional need and to facilitate and encourage a variety of housing types for
all income levels, including, emergency shelters and transitional and supportive housing. In
addition, the inventory of housing opportunity sites is published on the City’s website:
http://www.cityofberkeley.info/ContentDisplay.aspx?id=37820
Rezoning for compliance with Government Code Section 65583(a)(4) / SB 2: In 2007
the California legislature adopted changes to state planning law requiring jurisdictions to
modify their local regulations to identify zones allowing emergency shelters without
discretionary review. The program named “Emergency Shelters / Compliance with SB2”
describes these requirements and how Berkeley meets them, including adequate
opportunity sites within zones that allow emergency shelters as-of-right.
2. Assist in the development of adequate housing to meet the needs of extremely
low-, very low-, low- and moderate-income households (65583(c)(2)):
Berkeley has long assisted and encouraged development of housing for low- and moderate-
income households. In addition, Berkeley provides numerous services to low-income residents
that help them remain housed. Berkeley considers those service programs integral to the
provision of affordable housing, and therefore lists those programs as contributing to provision
of adequate housing to meet the needs of extremely low, very low, low and moderate-income
households. The major programs Berkeley uses to develop adequate affordable housing
include:
a. Housing Trust Fund
Sources for Berkeley’s Housing Trust Fund Include:
▫ Federal HOME Partnership for Investment Program (HOME Program) allocations.
▫ Allocated Community Development Block Grant (CDBG) funds.

2015-2023 Berkeley Housing Element 6 - Housing Programs and Quantified Objectives
95
▫ Housing fees provided by commercial and residential development projects and for
condominium conversions.
b. Inclusionary Housing Ordinance and State Density Bonus Law Implementation
c. Housing Mitigation Fees Charged to Non-Residential Development
d. Second Units (Accessory Dwelling Units)
e. Berkeley Housing Authority (Section 8 Housing Assistance Programs)
f. Mortgage Credit Certificate Program (for first time homebuyers)
g. Permit Fee Deferrals for Affordable Housing (BMC Chapter 19.62)
h. Homeless Housing and Service Programs
3. Address governmental constraints and provide reasonable accommodation
(65583(c)(3)):
Please see Chapter 4, Potential Constraints to Housing Production, for a detailed discussion of
possible governmental constraints and the City programs that mitigate them. Berkeley has a
number of Planning and Development Department programs to assist projects through the land
use entitlement and code compliance process, including the programs listed below. Programs a.
- d. are discussed in Chapter 4.
a. Zoning Project Roundtable
b. Expedited Project Services
c. Pre-application Review
d. Building Permits 101 training
e. Project Review Outreach Efforts
f. Permit Fee Deferrals for Affordable Housing (BMC Chapter 19.62)
g. Second Unit (Accessory Dwelling Units)
h. Mitigating Governmental Constraints
The state requires programs to remove constraints to, and provide reasonable accommodation
for, housing designed for persons with disabilities. Chapter 4, Potential Constraints to Housing
Production, discusses the actions Berkeley has taken to remove constraints and assist with the
provision of housing and services for persons with disabilities. In addition, Berkeley has the
following programs:
a. Reasonable Accommodation Ordinance, (BMC Chapter 23B.52)
b. Senior and Disabled Home Improvement Loan Program
c. Home Modifications for Accessibility (Center for Independent Living and Rebuilding
Together)
4. Conserve and improve the condition of the existing affordable housing stock
(65583(c)(4))
The City of Berkeley considers conservation of affordable housing to have two dimensions:
physical conservation, meaning protection and rehabilitation of actual buildings facing
deterioration or dilapidation; and conservation of the price at which housing is traded in the
marketplace (in other words, affordable rents and home prices). The City of Berkeley operates a
number of programs to conserve the existing affordable housing stock, including:

2015-2023 Berkeley Housing Element 6 - Housing Programs and Quantified Objectives
96
a. Rent Stabilization and Tenant Protections
b. Residential Seismic Preparedness Programs
c. Housing Trust Fund
d. Priority Properties Team
e. Housing Code Enforcement and Rental Housing Safety Program
f. Senior and Disabled Home Improvement Loan Program
g. Home Modifications for Accessibility and Safety (Center for Independent Living and
Rebuilding Together)
h. Energy Conservation Opportunities and Programs
i. Lead Poisoning Prevention Program
j. Berkeley Tool Lending Library
k. Demolition Controls and Replacement Requirement
l. Condominium Conversion Ordinance
5. Program to promote equal housing opportunities (65583(c)(5))
Fair housing laws prohibit discrimination in the sale, rental, or financing of dwellings because of
race, color, national origin, religion, sex, familial status (families with children under the age of
18) or handicap (disability). In addition to the fair housing laws established at the federal and
state levels, Berkeley Municipal Code (Chapter 13.24) prohibits discrimination against families
with children and student households including illegal acts such as eviction, harassment,
surcharges or unreasonable rules, based upon the presence of children. Berkeley Municipal
Code (Chapter 13.28.040) prohibits discrimination based on sexual orientation. Berkeley
Municipal Code (Chapter 13.30.050) prohibits discrimination based on the fact of having AIDS
or associated conditions. Berkeley has a number of programs that actively further fair housing
practices, including:
a. Addressing Impediments To Fair Housing
b. Fair Housing Assistance, Education, and Outreach (East Bay Community Law Center)
c. Home Modifications for Accessibility and Safety (Center for Independent Living and
Rebuilding Together)
d. Reasonable Accommodation Ordinance, (BMC Chapter 23B.52)
e. Permit Fee Deferrals for Affordable Housing (BMC Chapter 19.62)
f. Senior and Disabled Home Improvement Loan Program
g. Homeless Housing and Service Programs
6. Preserve lower income units at-risk of conversion to market rate (65583(c)(6)(d))
Affordable housing is provided using a variety of funding mechanisms, most of which involve
restricted housing prices for a limited period of time. When those affordable rates time out, the
units are at risk of converting to market rate housing, thus reducing the supply of affordable
housing and jeopardizing the ability of current tenants to remain in their homes or communities.
State law requires cities, through their Housing Elements, to take stock of the risk of affordable
units converting to market rate and develop mitigation strategies to avoid the loss of below-
market-rate housing.
2015-2023 Berkeley Housing Element 6 - Housing Programs and Quantified Objectives
97
a. Preserving Restricted Units at Risk of Conversion to Market Rate
B. Programs Addressing Berkeley Objectives
All of the programs discussed in Section A of this chapter assist Berkeley in the implementation
of our community housing objectives as well as address state requirements. Some programs
address community goals but are not directly related to state requirements. These programs
implement our community housing objectives related to coordination with other agencies and
public participation. To illustrate the connection between Berkeley’s community goals and
Berkeley’s programs, the programs are grouped below with the most relevant Objective from
Chapter 5 of the Housing Element, Objectives, Policies and Actions.
1. Housing Affordability
Berkeley residents should have access to quality housing at a range of prices and rents.
Housing is least affordable for people at the lowest income levels, and City resources should
focus on this area of need.
a. Berkeley Housing Authority (Section 8 Housing Assistance Program)
b. Condominium Conversion Ordinance
c. Homeless Housing and Service Programs
d. Housing Mitigation Fees Charged to Non-Residential Development
e. Housing Trust Fund
f. Inclusionary Housing Ordinance and State Density Bonus Law Implementation
g. Second Units (Accessory Dwelling Units)
h. Mortgage Credit Certificate Program
i. Permit Fee Deferrals for Affordable Housing
j. Preserving Restricted Units at Risk of Conversion to Market Rate
2. Maintenance of Existing Housing
Existing housing should be maintained and improved. Improvements that will prepare buildings
for a major seismic event should be encouraged.
a. Demolition Controls and Unit Replacement Requirement
b. Energy Conservation Opportunities and Programs
c. Home Modifications for Accessibility (Center for Independent Living and Rebuilding
Together)
d. Housing Code Enforcement and the Rental Housing Safety Program
e. Lead Poisoning Prevention Program
f. Priority Properties Team
g. Residential Seismic Preparedness Programs
h. Senior and Disabled Home Improvement Loan Programs
i. Tool Lending Library
3. Expansion of the Housing Supply

2015-2023 Berkeley Housing Element 6 - Housing Programs and Quantified Objectives
98
New housing should be developed to expand housing opportunities in Berkeley to meet the
needs of all income groups.
a. Housing Mitigation Fees Charged to Non-Residential Development
b. Housing Trust Fund
c. Inclusionary Housing Ordinance and State Density Bonus Law Implementation
d. Second Units (Accessory Dwelling Units)
e. Homeless Housing and Service Programs
Additionally, the City maintains adequate sites to accommodate our RHNA, as discussed in
Chapter 3, which enables the expansion of the housing supply.
4. Special Needs Housing and Homelessness Prevention
Berkeley should expand the supply of housing for special needs groups, including housing
affordable to households and individuals with extremely low incomes.
a. Berkeley Housing Authority (Section 8 Housing Assistance Program)
b. Homeless Housing and Service Programs
c. Inclusionary Housing Ordinance and State Density Bonus Law Implementation
d. Housing Trust Fund
5. Relationship with Other Institutions
The City should continue working with the Berkeley Housing Authority and the University of
California to address affordable housing needs.
a. Berkeley Housing Authority (Section 8 Housing Assistance Program)
b. Priority Development Area Program
c. Area planning coordination with UC Berkeley
6. Fair and Accessible Housing
The City should continue to enforce fair housing laws and encourage housing that is universally
accessible.
a. Fair Housing Assistance, Outreach and Education
b. Home Modification for Accessibility (Center for Independent Living and Rebuilding
Together)
c. Addressing Impediments to Fair Housing
d. Reasonable Accommodation Ordinance
e. Rent Stabilization and Tenant Protections
7. Public Participation
Berkeley should continue to improve the role of neighborhood residents and community
organizations in housing and community development decision-making.

2015-2023 Berkeley Housing Element 6 - Housing Programs and Quantified Objectives
99
a. Area planning coordination with UC Berkeley
b. Boards and Commissions
c. Project review outreach efforts
8. Energy Efficiency
The City should promote energy efficiency in new and existing residential buildings in order to
improve building comfort and safety, reduce energy costs, provide quality housing, and reduce
Greenhouse Gas Emissions.
a. Energy Conservation Opportunities and Programs
9. Adequate Sites
Berkeley should retain adequate housing opportunity sites to meet our future housing needs.
Please see Chapter 3, Projected Housing Need and Land Resources, for a discussion of the
inventory of housing opportunity sites to accommodate our regional need and analysis of site
capacity to facilitate and encourage a variety of housing types for all income levels, including,
emergency shelters and transitional and supportive housing.
10. Governmental Constraints
Berkeley should identify and mitigate barriers to the construction of new housing of all types.
a. Zoning Project Roundtable
b. Expedited Project Services
c. Pre-application Review
d. Building Permits 101 Training
e. Project Review Outreach Efforts
f. Permit Fee Deferrals for Affordable Housing (BMC Chapter 19.62)
g. Second Units (Accessory Dwelling Units)
h. Mitigating Governmental Constraints
C. Summary of Quantified Objectives
The table below illustrates the quantified objectives for the City of Berkeley. These figures are an estimate of the number of units likely to be constructed, rehabilitated or conserved/preserved by income level during the planning period.

2015-2023 Berkeley Housing Element 6 - Housing Programs and Quantified Objectives
100
Table 6-1: Quantified Objectives, 2015-2023
Income Category New Construction Rehabilitation Conservation/
Retention
Extremely Low 266 56 -
Very-Low Income 266 128 354
Low 442 408 -
Moderate 584 29 -
Above Moderate 1401 42 -
Totals 2,959 663 354
The sources of information for Table 6-1 are as follows:
New Construction. The “new construction” objectives are specified by the Association of Bay
Area Governments (ABAG) during their regional housing needs allocation process. ABAG has
designated a total of 2,959 units of housing as the City’s areas “fair share” of housing within the
nine county Bay Area region. (For more information about the ABAG housing allocation, see
Chapter 3, Projected Housing Need and Land Resources.) The City anticipates a combination
of Housing Trust Fund (HTF)-funded construction and income-restricted units in density bonus
projects will facilitate the construction of these below-market-rate units.
Berkeley generally met its overall housing production goals for the past RHNA periods. Like
other Cities, Berkeley has not met all of the low, very low, and extremely low-income production
goals. Part of the reason for this is that recent changes to state law severely limit the tools
available to produce income-restricted units.
The State of California Court of Appeals decision in Palmer/Sixth Street Properties v. City of Los
Angeles (2009) 175 Cal. App. 4th 1396 reduces the City’s ability to produce permanently
affordable rental housing by limiting the City’s ability to restrict rents in new construction. The
California Supreme Court decision in Sterling Park, L.P. v. City of Palo Alto (2013), had the
same effect on ownership development projects, limiting the City’s ability to require inclusionary
for-sale units under local ordinance. The three main tools that remain are the Housing Trust
Fund (HTF), Affordable Housing Mitigation Fee, and State Density Bonus law. Both programs
are described in this chapter. Berkeley is committed to identifying new funding sources for the
HTF and improving the implementation of density bonus law in order to produce as many lower-
income units as possible.
Rehabilitation. The rehabilitation goals for the eight-year planning period based on the HTF
guidelines and the number of rehabilitated units funded by the HTF in the past are as follows:
ELI – 56 units (7 units/year)
VLI – 128 units (16 units/year)
LI – 40 units (5 units/year)
Additionally, rehabilitation goals based on the past performance of Berkeley rehabilitation
programs are listed below. The condominium conversions are assumed to be in the above

2015-2023 Berkeley Housing Element 6 - Housing Programs and Quantified Objectives
101
moderate-income category. The Senior and Disabled Home Loans are in the moderate-income
category. All others are assumed to rehabilitate housing for low- income households.1
Condominium Conversion Ordinance: 42 units (6 units/year)
CESC Major Home Repairs: 200 units (25 units/year)
Rebuilding Together: 168 units (21 units/year)
Senior and Disabled Home Loans: 28 units (5.6 units /year)
Conservation/Retention. The conservation objectives reflect the 354 units of affordable housing
at risk of conversion to market rate due to annual renewal of project-based Section 8 subsidies.
“Preserving Restricted Units at Risk of Conversion to Market Rate,” in Chapter 6, discusses the
at-risk units and Berkeley’s resources for preservation of the units.
1 Rebuilding Together and CESC assist households with incomes up to 80% of AMI, however, typically
the majority households are below 50% of AMI.

2015-2023 Berkeley Housing Element 6 - Housing Programs and Quantified Objectives
102
D. Program Descriptions
The City of Berkeley has numerous programs for attaining our community housing goals as well
as addressing the requirements of state housing law. Detailed descriptions of each program
are provided on the following pages.
Programs Table of Contents:
Area Planning Coordination with UC Berkeley ............................................................................ 104 Berkeley Housing Authority (Section 8 Housing Assistance Program) ....................................... 105 Boards and Commissions ............................................................................................................ 108 Condominium Conversion Ordinance .......................................................................................... 109 Demolition Controls and Unit Replacement Requirement ........................................................... 111 Energy Conservation Opportunities and Programs ..................................................................... 112 Fair Housing Assistance, Outreach and Education ..................................................................... 117 Addressing Impediments to Fair Housing .................................................................................... 119 Home Modifications for Accessibility and Safety (Center for Independent Living and Rebuilding Together) ....................................................................................................... 123 Homeless Housing and Service Programs (HHSP) ..................................................................... 125 HHSP: The EveryOne Home Plan, Berkeley’s Homeless Policy Framework ............................. 125 HHSP: Community Agency Contracting ...................................................................................... 127 HHSP: Homeless Housing Locations .......................................................................................... 131 HHSP: Emergency Shelters / Compliance with SB 2 .................................................................. 135 HHSP: Centralized Shelter Bed Reservation System .................................................................. 138 HHSP: Housing Retention Program ............................................................................................. 139 HHSP: Energy Bill Payment Assistance (Discontinued) .............................................................. 141 HHSP: Priority Home Partnership Program ................................................................................. 142 HHSP: Relocation Services ......................................................................................................... 144 HHSP: Reverse Mortgage Counseling (Discontinued) ................................................................ 146 HHSP: Shelter Plus Care ............................................................................................................. 146 HHSP: Square One Supportive Housing Program ...................................................................... 148 HHSP: Mental Health Services Act (MHSA) Housing Program ................................................... 149 Housing Code Enforcement and the Rental Housing Safety Program ........................................ 151 Housing Mitigation Fees Charged to Non-Residential Development........................................... 154 Housing Trust Fund ...................................................................................................................... 155 Inclusionary Housing Ordinance and State Density Bonus Law Implementation ........................ 163 Lead Poisoning Prevention Program ........................................................................................... 167 Mitigating Governmental Constraints ........................................................................................... 169 Mortgage Credit Certificate Program ........................................................................................... 172 Permit Fee Deferrals for Affordable Housing ............................................................................... 173 Preserving Restricted Units at Risk of Conversion to Market Rate ............................................. 174 Priority Development Area Program ............................................................................................ 187 Priority Properties Team .............................................................................................................. 189 Project Review Outreach Efforts .................................................................................................. 190 Reasonable Accommodation Ordinance ..................................................................................... 191 The Successor Agency to the Former Redevelopment Agency .................................................. 193 Rent Stabilization and Tenant Protections ................................................................................... 193 Second Units (Accessory Dwelling Units) .................................................................................... 198 Seismic Preparedness Programs ................................................................................................ 200 Senior and Disabled Home Improvement Loan Program ............................................................ 202 Tool Lending Library .................................................................................................................... 204

2015-2023 Berkeley Housing Element 6 - Housing Programs and Quantified Objectives
103
Programs Tables:
Table 6-1: Quantified Objectives, 2015-2023 .............................................................................. 100 Table 6-2: BHA Payment Standards, November 2014 ................................................................ 106 Table 6-3: Summary of Berkeley Condominium Conversions, 2009-2014* ................................ 110 Table 6-4: Community Energy Services Corporation Home Repairs Completed,
FY 2009 – FY 2014 .................................................................................................... 115 Table 6-5: EBCLC Accomplishments by Fiscal Year, FY 2012- FY 2014 ................................... 118 Table 6-6: Center for Independent Living’s Residential Access for Disabled Persons Program,
FY 2009 – FY 2014 .................................................................................................... 124 Table 6-7: Units Repaired by Rebuilding Together’s Safe Home Project, FY 2009 – FY 2014 .. 124 Table 6-8: Community Agency Contracts, FY 2015 .................................................................... 129 Table 6-9: Current Inventory of Emergency Shelters .................................................................. 131 Table 6-10: Current Inventory of Transitional Housing ................................................................ 132 Table 6-11: Current Inventory of Permanent Housing for People Who Are Currently or Formerly
Homeless .................................................................................................................. 133 Table 6-12: Rehabilitation of Emergency and Transitional Housing Facilities by HUD Program
Year of Federal Funds Allocated .............................................................................. 134 Table 6-13: Housing Retention Program, FY 2014 ...................................................................... 140 Table 6-14: ESG-Assisted Activity Beneficiary Data FY2014 ...................................................... 143 Table 6-15: Shelter Plus Care Grant History ............................................................................... 147 Table 6-16: Affordable Housing In-Lieu Impact Fee for Large-Scale Non-Residential Development
Projects (as of June 3, 2014) .................................................................................... 154 Table 6-17: Housing Trust Fund Cumulative Funds Received and Committed as
of June 30, 2014 ........................................................................................................ 157 Table 6-18: Developments with Housing Trust Fund Financing Completed 2010 – 2014,
Total City Financing ................................................................................................... 159 Table 6-19: Developments with Housing Trust Fund Financing Completed By Income Level,
2010 – 2014 ............................................................................................................... 160 Table 6-20: HTF Allocations as of November 2014 ..................................................................... 160 Table 6-21: All City of Berkeley Housing Trust Fund Developments 1990 to 2014 ..................... 161 Table 6-22: Units in Projects at Risk of Conversion to Market Rate Housing, 2014-2024 .......... 175 Table 6-23: Properties at Risk of Converting to Market Rate by Total Units and Restricted Units,
2014-2024................................................................................................................. 176 Table 6-24: Properties at Risk of Converting to Market Rate by Size of Units, 2014-2024 ......... 176 Table 6-25: Affordable Housing Organizations Interested in Acquiring and Managing At-Risk Rental
Housing in the City of Berkeley ................................................................................ 183 Table 6-26: Sources of Funding for Acquiring and Rehabilitating At-Risk Housing in the City
of Berkeley ................................................................................................................ 183 Table 6-27: Assisted Developments in Berkeley with HUD Project-Based Subsidies or Low Income
Housing Tax Credits from 1987-1989 Without Housing Trust Fund Loans ............. 186 Table 6-28: Inventory of Developments in Berkeley with a Federally-Funded Project-Based Operating
Subsidy ..................................................................................................................... 187 Table 6-29: 2014 “Market” rent compared to rent for 2006, 2009 and pre-1999 “Controlled” tenancies*
.................................................................................................................................. 195 Table 6-30: Affordability Due to Rent Stabilization ...................................................................... 197 Table 6-31: Seismic Tax Rebate 2009-2014 ............................................................................... 201 Table 6-32: Senior and Disabled Home Rehabilitation Loan Program, FY 2007 – FY 2014 ...... 203

2015-2023 Berkeley Housing Element 6 - Housing Programs and Quantified Objectives
104
Area Planning Coordination with UC Berkeley
Update: Staff from UC Berkeley and the City of Berkeley continue to meet on a monthly basis to
monitor implementation of the Downtown Area Plan and Southside Area Plan and to keep each
other informed of proposed and pending development projects.
The City of Berkeley has worked with UC Berkeley on two area plans covering the geographic
areas close to the UC campus: Southside and Downtown. A description of recent activities and
development in these plan areas are described below.
Downtown Area Plan
Development is occurring in the Downtown Plan area as a result of the implemented Plan.
Recent development include private market housing designed for students, a new Target store
marketing to student needs and a number of new eating establishments to attract students and
faculty to Downtown.
Southside Plan
In 2014, the City implemented zoning changes in the Telegraph Avenue Commercial District (C-
T) to support the development of office uses above the first floor, as well as increased Floor
Area Ratios (FARs). These two changes combine to support the need for office and additional
housing in proximity to the CAL campus.
Accomplishments
The noted zoning changes and development in the Plans area can be seen as
accomplishments of the City and University coordination.
Looking Ahead
The City will continue to coordinate long-range planning for areas adjacent to the UC Berkeley
campus with the University.
Anticipated new development of a hotel, completion of the University Art Museum and changes
to the Shattuck corridor further the implementation of the Downtown Area Plan. These projects
are in various stages of readiness to completion. Each project better connects the City and the
University.
Timeframe
Ongoing
Responsible agency
City of Berkeley Planning Department
UC Berkeley planning staff
Funding sources
General Fund
Funding from UC

2015-2023 Berkeley Housing Element 6 - Housing Programs and Quantified Objectives
105
Berkeley Housing Authority (Section 8 Housing Assistance Program)
The Berkeley Housing Authority (BHA), established in 1966, operates the Section 8 Housing
Choice Voucher program, the Section 8 Project-Based Voucher program, Single Room
Occupancy program, and Moderate Rehabilitation program (Mod Rehab). The programs are
administered by the U.S. Department of Housing and Urban Development (HUD). They provide
rental assistance for low-income families, the elderly, people with disabilities, and others.
Until July 1, 2007, BHA was a division of the City of Berkeley, but it has since become an
independent entity with its own Board, appointed by the Mayor. While structurally a separate
entity, the City of Berkeley provides the BHA with IT support.
Housing Choice Voucher Program
Berkeley Housing Authority currently provides rental assistance to approximately 1,935
households through HUD’s Section 8 Housing Choice Voucher program. During the past year
BHA awarded new assistance vouchers to more than 65 households that had been on both the
Section 8 Housing Choice Voucher wait list and the Section 8 Project-Based Voucher wait list.
The vast majority of vouchers provide a tenant-based subsidy, meaning program participants
can use the vouchers to rent privately owned housing and take the vouchers with them when
they move to a different property.
Households generally pay between 30-40% of adjusted monthly income for rent unless they are
over-housed. BHA pays the difference directly to the landlord. The Housing Authority
establishes a payment standard, which is the maximum subsidy amount the Housing Authority
will pay, based on the unit size. HUD allows housing authorities to set the payment standard
between 90% and 110% of the region’s “fair market rent” (FMR) by bedroom size. The BHA sets
the payment standard at 110% of the FMR. The FMR is adjusted annually to keep pace with the
increasing cost of rent and utilities.
The contract rents for individual units in the Section 8 program are generally capped at the
payment standard for the particular bedroom size. To avoid artificially inflating rental costs, the
approved rent for any contract must first be determined “reasonable” in comparison to similar,
unassisted units. After the first year there is no HUD imposed cap, but there are triggers of the
local Rent Control Ordinance if the rent exceeds the payment standard for the unit size.
The current Payment Standards for units of different sizes are shown in Table 6-2.

2015-2023 Berkeley Housing Element 6 - Housing Programs and Quantified Objectives
106
Table 6-2: BHA Payment Standards, November 2014 Number of Bedrooms Payment Standard
0 Bedrooms $1,142
1 Bedroom $1,386
2 Bedrooms $1,743
3 Bedrooms $2,434
4 Bedrooms $2,987
Source: Berkeley Housing Authority
To be eligible, an applicant’s income must be at or below 50 percent of AMI (area median
income). A minimum of 75% of BHAs admissions must have income below 30% AMI; the
remaining 25% of admissions can have income up to 50% AMI. Other assets (savings,
investments, retirement funds, etc.) are also evaluated. A family or individual issued a voucher
is responsible for finding a suitable rental unit that meets minimum Housing Quality Standards
(HUD’s inspections standards for units being rented with Section 8 subsidy). When the
participant locates a unit to rent with a landlord that is willing to participate, the owner executes
a Request for Tenancy Approval which is submitted to BHA. BHA inspects the dwelling, and
when the inspection passes, and the owner and family execute a lease, BHA and the owner
enter into a Housing Assistance Payment (HAP) agreement. BHA then pays a rental subsidy
directly to the landlord and the tenant pays the difference between the actual rent charged and
the subsidy amount, typically 30 percent of adjusted household income (less the applicable
utility allowance).
Waiting List
In 2010, BHA successfully completed an intake process for the Section 8 Housing Choice
Voucher (Tenant-Based) and Project-Based wait lists from March 1 to 5. During this five day
period, BHA received over 37,000 applications; this speaks to the tremendous demand for
rental assistance for low-income families in the Bay Area. 1,500 applicants were randomly
selected on March 22, 2010 and placed on the Section 8Tenant-Based Voucher wait list. An
additional 1,500 names were randomly selected and placed on the Section 8 Project-Based
Voucher wait list. In accordance with HUD regulations, preferences are identified in BHA’s
administrative plan, which are used to weigh all applicants for their eligibility and ranking on the
waiting list. The BHA plans to allow on-line applications when the wait list is opened.
Additionally, BHA opened the Project-Based wait list in 2012 for the following categories:
seniors 62 or older (637 applications received); youth emancipated from the foster care system
(627 applications received); those with HIV or AIDS (282 applications received); families
qualifying for 3 bedroom units (1,100 applications received); and families qualifying for 4
bedroom units (224 applications received).
Lease-up Rate
The lease-up rate is the percentage of the available vouchers actually under contract. In August
2002, the lease-up rate was 1,410 out of 1,841 allocated units (77%). As of May 2009, the
lease-up rate was 92% and climbing, 1,683 out of 1,841 allocated units. The current lease-up
rate as of October 2014 is 1791 (93%). BHA remains concerned and alarmed by the current

2015-2023 Berkeley Housing Element 6 - Housing Programs and Quantified Objectives
107
rental market condition in Berkeley, which makes it difficult to compete for units in the open
market. The success rate of new voucher holders is 43%; this is due in large part to the high
rent demands, and the increased competition for rental units from UC students and commuters
to San Francisco, who can meet the owner rent demands without Section 8 assistance. The
success of the Section 8 Voucher program is critical to the City’s ability to retain a diversified
population. BHA remains committed to strategies designed to retain and expand owner
participation.
Project-Based Section 8 Units
In 1999, BHA began “project-basing” a portion of the vouchers by allocating vouchers to
selected development projects to ensure that units in rehabilitated or new construction buildings
are affordable to people at extremely low incomes. Under HUD rules, BHA can project base up
to 20% of the allocated vouchers. With Project-Based Section 8 units, the Housing Authority
enters a master HAP contract with a landlord that guarantees Section 8 rents for a period of 15
years. Project-Based vouchers have effectively assisted in the creation of 187 new, and 114
rehabilitated rental units in senior, disabled, family and mixed-use developments. These awards
remain a critical element in financial feasibility of the creation and substantial rehabilitation of
affordable housing activity. Families are selected from the Project-Based waitlist (managed by
BHA), and those that choose to reside at the property may request transfer to the Tenant-Based
Voucher and move off site with rental assistance after the first year. At the end of the fifteen-
year period, the landlord may choose to continue renting to families with Tenant-Based
Vouchers individually, or convert the units to market rate, or BHA may offer to have the master
contract extended for some or all of the Project-Based units for an additional 1 to 15 years.
BHA currently has 201 units of Section 8 Project-Based assistance under contract and 100 units
committed, including units at the former low-income public housing scattered sites, once owned
by BHA but now transitioned to the Project-Based program, and Strawberry Creek Lodge, both
of which are currently undergoing rehabilitation.
Moderate Rehabilitation Program
Berkeley Housing Authority provides subsidy for 98 units of Single Room Occupancy (SRO)
housing in Berkeley via HUD’s Moderate Rehabilitation Housing Program. The units offer safe,
decent, housing plus on site services for the formerly homeless population, including disabled
individuals.
Accomplishments
The Housing Authority has been a Certified “High” performer under SEMAP (Section 8
Management Assessment Program) since 2010.
The disposition deal for the 75 former units of Low Income Public Housing was realized,
and the units are currently undergoing a major rehabilitation under the Project-Based
Program.
In an effort to streamline payment of landlords, BHA has moved to a direct deposit
program for HAP funds.

2015-2023 Berkeley Housing Element 6 - Housing Programs and Quantified Objectives
108
Looking Ahead
The Housing Authority will be working to attract new properties to the Tenant-based Section 8
Program, by reaching out to existing owners and potential new owners, including those with
Below Market Rent (BMR) commitments. We are contemplating the possibility of going to a
higher Payment Standard of 115% or 120% of the FMR. Additionally, BHA is considering a
program to help the formerly homeless individuals living in the Moderate Rehabilitation units
transition to permanent mainstreamed housing. Lastly, BHA is beginning to conceptualize
implementation of the Family Self-sufficiency (FSS) Program, as BHA’s waiver (from operating
the FSS program) from HUD expires in early 2016. BHA will be exploring expanded scoring
criteria for evaluating proposals for project based voucher in the Administrative Plan which may
include preferences for rehabilitation and new construction of fully accessible units.
Implementation Steps
Continue to provide rental assistance to households with incomes lower than 50% of
AMI during the planning period.
Timeframe:
Ongoing
Responsible Agency:
Berkeley Housing Authority
Funding Source:
HUD - Section 8
Boards and Commissions
Berkeley’s government is characterized in part by a strong commitment to citizen input into City
decisions. The City accomplishes this task by having over 40 citizen advisory commissions
dealing with a wide variety of issues. The main commissions that address housing-related
issues are:
Commission on Aging
Commission on Disability
Homeless Commission
Housing Advisory Commission
Human Welfare & Community Action Commission
Mental Health Commission
Planning Commission
Zoning Adjustments Board
Implementation Steps
Continue facilitating community input through Berkeley’s boards and commissions.
Timeframe
Ongoing

2015-2023 Berkeley Housing Element 6 - Housing Programs and Quantified Objectives
109
Responsible agency
City of Berkeley Planning Department, Health, Housing & Community Services Department
Funding sources
General Fund
Condominium Conversion Ordinance
The City’s condominium conversion ordinance (CCO) (BMC Chapter 21.28) governs conversion
of rental apartments and “tenancy in common” (TIC) buildings to condominiums, community
apartments, and other types of mutual or cooperative housing. The CCO allows condominium
conversion of TIC and rental units up to a 100 unit annual maximum. The CCO also protects
the rights of sitting tenants and mitigates the loss of rental units through an affordable housing
mitigation fee. This fee is put into the City of Berkeley Housing Trust Fund (HTF) to fund
various affordable housing projects (see HTF program description).
From 1980 to 1992 the City of Berkeley did not permit conversion from rental housing units to
condominiums. Condominium conversion removes rental units from the market and reduces
affordability, both directly by increasing the monthly cost of converted units, and indirectly by
increasing the cost of other rental units through reduced supply relative to demand. However,
conversion adds some affordable ownership units to the market.
Despite the condominium ban, conversion to owner-occupancy continued through TICs, which
allow people to use joint ownership of multi-unit buildings to become owner-occupants without
actually subdividing the property. In TICs, people share ownership of a property with multiple
units and agree among themselves on each part-owners’ right to occupy one unit. Being part of
a TIC is legally and financially different from owning a condominium. As part of a TIC, all
owners are responsible if a part-owner defaults on their loan. Condominiums are separate and
divided interests in a property, with each buyer purchasing a unit free and clear of the others. As
an owner of a condominium, individual owners are not responsible if someone in the same
building defaults on their loan.
In 1992, the City simultaneously started to permit very limited conversion from rental housing
units to condominiums while prohibiting creation of new TICs in properties over three units. The
ban came about due to the loss of an estimated 1,000 to 1,500 rental housing units to TIC
conversions in the late 1980s and early 1990’s and the legal and financial difficulties the TIC
owners encountered.
In mid 2005, the prohibition against TICs was repealed in response to a 2004 California Court of
Appeal decision in which a similar regulation in San Francisco was declared unconstitutional. At
the same time, the City enacted regulations to allow quota-limited condominium conversion as
an alternative to creation of TICs. Through payment of a mitigation fee and limited to 100 units
per year, the City aims to slow the rate of conversion and mitigate the loss of the more
affordable rental units by using the mitigation fees to create permanent affordable rental

2015-2023 Berkeley Housing Element 6 - Housing Programs and Quantified Objectives
110
housing. The City expects that the benefits of condominium conversion will lead property
owners to convert to a condo rather than a TIC.
The CCO was amended several times between 2005 and 2007 and most recently amended in
early 2009 following a two-year planning process that included over 20 public meetings with the
Housing Advisory Commission, the Rent Stabilization Board and the City Council. The most
recent amendments removed the previous quota exemption for 2-4 unit condominium
conversions, changed the mitigation fee structure, and clarified administration of the ordinance
and inspection process.
Under the current ordinance, there is:
A maximum of 100 conversions a year.
A mitigation fee to offset the loss of affordable rental housing. If converters agree to
limit future rent increases for the life of the property to any resident tenant at the time of
conversion to no more than 65% of the increase in the Consumer Price Index for all Bay
Area Consumers, the fee is capped at 4% of the sale price if there are two units and at
8% if there are three or more units. Reductions are given if the owner has lived in the
unit for at least five consecutive years or if the fee is paid at the time of conversion.
Conditions to protect tenants that discourage displacement and offer the exclusive right
to purchase the rental unit after it becomes a condominium for the period of one year.
A requirement that at the time of conversion, the housing unit must correct all Life and
Safety code violations.
Accomplishments
Under the previous ordinance, the City approved over 1,100 units for conversion but only three
units were required to pay the mitigation fee for a total of $47,072.33. By contrast, since
implementation of the new CCO in 2009, the City has approved the conversion of 142 units to
condominiums, and has received a total of $1,489,085 associated affordable housing mitigation
fees from a total of 59 units: 26 units paid at the time of application approval, 15 at the time of
refinance, and 18 at the time of sale.
Table 6-3 below summarizes by calendar year overall condominium conversions in Berkeley
since 2009.
Table 6-3: Summary of Berkeley
Condominium Conversions, 2009-2014*
Year Units Approved for Conversion
2009 66
2010 19
2011 11
2012 20
2013 15
2014* 11
Total 142
Source: City of Berkeley Planning and Development Department.
*Data from January 1, 2009 through July 31, 2014.

2015-2023 Berkeley Housing Element 6 - Housing Programs and Quantified Objectives
111
Looking Ahead
With the upturn in the economy and availability of financing for residential condominiums, the
City expects the program to process a greater volume of unit conversions in the upcoming
years. Additionally, as the majority of approved units deferred payment of the affordable housing
mitigation fee until either refinance or sale, the City projects a robust Affordable Housing
Mitigation Fee Fund into the near future.
Implementation Steps
Continue to permit up to 100 condominium conversions annually and collect conversion
fees for production of permanently affordable housing.
Timeframe
Ongoing
Responsible agency
City of Berkeley Planning and Development Department
City of Berkeley Health, Housing & Community Services Department
Funding sources
Condominium Conversion Ordinance Fees
General Fund
Demolition Controls and Unit Replacement Requirement
The City’s Demolition and Dwelling Unit Controls (BMC Chapter 23C.08) limits the ability of
property owners to demolish or eliminate existing housing units and requires one-to-one
replacement of removed units. It also disallows removal of rent-controlled units. The provisions
of this section are summarized below.
Berkeley’s zoning ordinance restricts the demolition of housing units by limiting demolitions to
cases where:
The structure is either “hazardous, unusable or infeasible to repair”, as determined by
our Building Official, or
The demolition is necessary to permit construction of at least as many units as will be
demolished.
Elimination of units through the process of converting the building to a use other than residential
is also restricted to cases where:
The residential density of the lot exceeds allowable density of the district; or
The conversion will create common space in a co-housing community; or
The change will not result in a reduction of housing supply essential to the City or
neighborhood; or
The units are situated in an environment unsuitable for residential occupancy and
suitable housing will be made available to the present occupants.

2015-2023 Berkeley Housing Element 6 - Housing Programs and Quantified Objectives
112
Units subject to rent control require specific findings to be eliminated in addition to the findings
summarized above. In sum, a controlled rental unit cannot be eliminated if a low income family
occupies the unit or if tenants will be displaced against their will. Also, the owner must
demonstrate a fair return on investment is not possible, the dwelling must be seriously
deteriorated and replacement units must be available for lower income households. .
Removal of residential hotel rooms is only permitted if they are replaced with a common area for
the tenants or are being removed for seismic or ADA upgrades. Replacement rooms for the
existing tenant of comparable size, quality, and cost to tenant must be found, or payment made
to the City’s HTF in an amount sufficient to replace the rooms.
Implementation Steps
Maintain existing number of housing units in Berkeley.
Consider changes to the zoning ordinance to establish consistent and reasonable
criteria for demolition and replacement of controlled rental residential units.
Timeframe
Ongoing
Responsible agency
City of Berkeley Planning Department
Funding sources
General Fund
Energy Conservation Opportunities and Programs
The City of Berkeley has various requirements and services to promote energy conservation
and energy efficiency in new and existing residential buildings.
Climate Action Plan
In June 2009, the City adopted the Climate Action Plan (CAP), a community-wide plan to reduce
Berkeley’s greenhouse gas (GHG) emissions. The Climate Action Plan calls for reducing overall
GHG emissions by 80% by 2050 and an interim goal of reducing GHG by 33% by 2020. The
Land Use and Transportation and Building Energy Use strategies are the main policy initiatives
of the CAP that relate to residential energy conservation opportunities.
Land Use and Transportation Chapter
As of 2012, gasoline and diesel vehicle trips in the City of Berkeley accounted for approximately
53% of Berkeley’s total GHG emissions. The CAP aims to reduce this by 33 % by 2020, in large
part by reducing vehicle miles traveled (VMT). Many of the CAP policies promote alternative
transportation, including: encouraging better bus service, car sharing, enhanced bike and
pedestrian amenities, improved parking management, and compact development near transit.
Building Energy Use Chapter

2015-2023 Berkeley Housing Element 6 - Housing Programs and Quantified Objectives
113
As of 2012, residential electricity and natural gas consumption accounted for approximately
20% of Berkeley’s GHG emissions. Natural gas accounted for 80% of total residential energy
consumption. The main sources of residential natural gas consumption are water heating and
space heating. The CAP has set a goal to reduce the emissions that result from building energy
use (both residential and non-residential buildings) by 33% by 2020. The CAP includes policies
to set minimum energy standards, remove barriers to green building, and develop incentives
promoting energy efficiency and other green building measures in new and existing buildings.
Cost effective energy improvements include sealing air leaks, insulating the attic and walls,
upgrading lighting and appliances, and reducing losses from phantom energy loads (i.e.,
appliances and electronic devices that consume energy even when turned off).
Green Building and Building Energy Use
Green buildings provide healthy, comfortable building interiors that maximize savings through
the efficient use of energy and water and limit construction impacts on the natural environment.
Berkeley started the Best Builders Program in 2001 by providing resources to promote green
building. In addition, Berkeley has supplemental green building polices that ensure that
buildings are built and maintained sustainably, that construction waste is diverted from landfills,
and energy and water are used efficiently in buildings.
The main components of the City’s current green building and energy conservation programs
are as follows:
Green Building for Downtown Projects: New buildings and additions in the
downtown are required to achieve a Leadership in Energy and Environmental Design
(LEED) Gold certification (or equivalent).
Green Building Consultation: The Planning Department offers free, voluntary green
building consultations to applicants in order to encourage green building practices in the
design, siting, construction and operation of buildings.
Green Building Checklist: Large-scale development projects (10,000 square feet or
more) and new buildings with one or more dwelling units are required to complete a
“green building checklist” (either LEED or GreenPoint Rated) and update it throughout
the project.
Construction Waste Reduction: Projects must divert construction and demolition
debris away from the landfill through reuse and compost.
Residential Energy Conservation Ordinance (RECO): RECO, adopted in 1980,
requires that every home or apartment building sold or transferred in Berkeley or
undergoing renovations with a total value of $50,000 or more must meet a prescriptive
list of energy and water efficiency requirements for a range of building systems and
features, including: toilets, showerheads, water heaters, attic insulation, exterior door
weather stripping and common area lighting (for multi-unit buildings). This ordinance is
in the process of being updated. As of this writing, the replacement draft ordinance,
entitled Building Energy Saving Ordinance (BESO), is under consideration by the City
Council.
Weatherization Program: In 2011 the City discontinued the weatherization program.
See Program HHSP: Energy Bill Payment Assistance for a discussion of this change.

2015-2023 Berkeley Housing Element 6 - Housing Programs and Quantified Objectives
114
Money for Energy Efficiency (ME2) Program: In July 2010, the City offered cash
incentives through the Money for Energy Efficiency (ME2) Program to individuals who
were interested in increasing the energy efficiency of their home. The ME2 program
was funded by federal stimulus money awarded to Berkeley from the U.S. Department
of Energy. This was a pilot program that served as a model for the statewide Energy
Upgrade California program.
Energy Upgrade California: Berkeley participates in the statewide rebate program for
energy upgrades for homes. It incentivizes homeowners to make their homes more
energy efficient.
Multifamily Green: Multifamily Green, a program of Energy Upgrade California for
multifamily properties, offers energy efficiency rebates and free technical assistance to
multifamily property owners. Reduced energy use lowers operating costs for property
owners and increases comfort and affordability for tenants.
Green House Calls: Rising Sun Energy Center, a local nonprofit, administers the
California Youth Energy Services (CYES) program that trains and employs local youth
in the summer to make free energy assessments and install energy-saving devices in
homes through their Green House Call service.
Solar Energy
Increasing the amount of clean renewable energy is a critical component of Berkeley community
efforts to reduce greenhouse gases and grow the green economy. Berkeley has innovative
programs to encourage solar and solar/thermal systems.
Smart Solar: The Smart Solar program, administered by local nonprofit Community
Energy Services Corporation (CESC), provides free, independent guidance and
resources to help property owners understand their solar options. Smart Solar advises
on homeowners’ solar potential, bid comparisons, permitting and financing.
Berkeley FIRST (Financing Initiative for Renewable and Solar Technology): In
2008, the City of Berkeley launched the Berkeley FIRST pilot program to promote solar
photovoltaic (PV) installations using a pioneering financing mechanism. The now
concluded pilot program served as a model for Property Assessed Clean Energy
(PACE) programs across the country. Berkeley FIRST enabled property owners to pay
for solar installations through an annual assessment on their property tax bill. The
program is no longer in operation, but these services are offered by California FIRST.
PACE (Property Assessed Clean Energy) Financing: Building on the success of
Berkeley FIRST, PACE funding is now available through California FIRST and HERO
programs. PACE loans provide financing for renewable energy installations, energy and
water efficiency improvement and electric vehicle charging infrastructure on private
properties. Property owners repay the cost of the financing on their property tax bills.
Residential PACE loans in Berkeley were suspended due to actions of the Federal
Housing Finance Agency (FHFA). A new State loan-loss-reserve program will enable
the resumption of PACE loans in the community. Berkeley is participating in PACE
programs through partnerships with California FIRST and HERO programs.

2015-2023 Berkeley Housing Element 6 - Housing Programs and Quantified Objectives
115
Solar Map: In April 2009 the City launched an online Solar Map. The interactive web
tool allows anyone to view the locations of existing solar installations throughout
Berkeley.
Community Energy Services Corporation
CESC is a not-for-profit 501(c)(3) organization established in 1985 by the Berkeley City Council
with a mission to “support, facilitate and participate in efforts involving the use of energy and
physical resources."
Berkeley Home Safety and Repair Program is a program of Community Energy Services
Corporation (CESC) which provides low-income Berkeley homeowners with free minor home
repairs and mobility access improvements.”
Accomplishments
Green Buildings: As of the end of 2013, 20 buildings in Berkeley are LEED certified by
the U.S. Green Building Council, 8 are GreenPoint Rated, and 2 projects were built as
Enterprise Green Communities Developments. Within the last three years the number
of LEED buildings more than doubled (from 9 buildings in 2010 to 20 in 2013).
Residential Energy Use: While the number of households in Berkeley increased
approximately 2.3% between 2000 and 2012, total residential sector energy
consumption (electricity and natural gas combined) decreased 13% in that same time
period.
Solar Installations: As of 2013, 1253 solar PV systems and 88 solar thermal systems
have been installed in Berkeley.
The following table reports on the major and minor home repairs completed by CESC from FY
2009 to FY 2014.
Table 6-4: Community Energy Services Corporation
Home Repairs Completed, FY 2009 – FY 2014
Fiscal Year Major home
repairs
Minor home
repairs Clients
FY 2014 15 140 88
FY 2013 27 241 122
FY 2012 33 254 137
FY 2011 N/A N/A 354
FY 2010 N/A N/A 179
FY 2009 23 252 229
Total 98 887 1,109
Sources: City of Berkeley Planning Department, CESC contract monitor via email March 2009; City of Berkeley Health, Housing and Community Services; Health, Housing & Community Services Department July 2009 and October 2014
2015-2023 Berkeley Housing Element 6 - Housing Programs and Quantified Objectives
116
Looking Ahead
Updating Residential Energy Conservation Ordinance Update (RECO): RECO serves as
Berkeley’s minimum requirements for energy efficiency in existing homes and businesses. In
September 2013 City Council directed staff to update the ordinance and to incorporate
energy information disclosure as a market mechanism to accelerate energy improvements.
The replacement draft ordinance, entitled Building Energy Saving Ordinance (BESO), BESO
is scheduled to go to City Council in late 2014. BESO will affect all existing buildings in
Berkeley. It is designed to be user-friendly, consistent with Title 24 California Energy Code,
have measurable outcomes, create transparent disclosure tools to better understand
building energy information, and be affordable.
Property Assessed Clean Energy (PACE): A new State loan-loss-reserve program will
enable the resumption of PACE loans in the community. Berkeley is participating in PACE
programs through partnerships with California FIRST and HERO programs.
Community Choice Aggregation (CCA): The success of the Marin Clean Energy program
has generated more interest in acquiring cleaner electrical energy through CCA. The
Alameda County Board of Supervisors will be considering a resolution to explore CCA and it
may be possible for Berkeley and other communities to participate in the process. Staff
continues to look for opportunities for a CCA that would minimize the City’s financial
exposure and provide the community with access to cleaner electricity sources.
Climate Adaptation and Resiliency: The Rockefeller Foundation named Berkeley as a
grantee of the 100 Resilient Cities. As part of the 100 Resilient Cities Network, Berkeley will
receive access to tools, technical support, and resources for implementing a comprehensive
resilience plan and further the City’s work on ensuring that residents and our local
infrastructure are prepared for emergencies and the effects of climate change.
Implementation Steps
Implement CAP policies and track performance indicators
Continue green building services and remove barriers to green building
Develop energy efficiency standards.
Develop local, clean, decentralized renewable energy supply to meet a larger portion of
community’s needs
Timeframe
Ongoing
Responsible agency
City of Berkeley Planning Department
City of Berkeley Office of Energy and Sustainable Development
Community Energy Services Corporation
City of Berkeley Health, Housing & Community Services Department
Funding sources
General fund
Community Development Block Grants (CDBG)
American Reinvestment and Recovery Act of 2009 (ARRA)

2015-2023 Berkeley Housing Element 6 - Housing Programs and Quantified Objectives
117
Federal/California Low Income Home Energy Assistance Program (LIHEAP)
California Low-Income Energy Efficiency (LIEE)
Fair Housing Assistance, Outreach and Education
The City contracts with the East Bay Community Law Center to provide fair housing services,
including education and outreach, investigation and resolution of complaints, and legal services. 2
East Bay Community Law Center (EBCLC)
The City has contracted with EBCLC since July 2011. This non-profit legal services agency
provides the following services:
Outreach: EBCLC staff present and provide written information in English, Spanish and
Chinese. EBCLC also ensures that outreach staff has the capacity to provide information in
languages other than English, particularly Spanish, Cantonese and Mandarin.
Educational Trainings: EBCLC provides trainings on fair housing issues for realtors and
lending institutions, property managers and owners, and for community-based
organizations. EBCLC prioritizes trainings to agencies that serve Berkeley residents whose
primary language is Spanish or Chinese.
Fair Housing Counseling: EBCLC provides fair housing counseling services within 48
business hours of residents request for information, to Berkeley households. Counseling
services include an assessment of the situation, identification of issues, determination if
issue is covered by law/regulation, discussion of options with client and determination of
next steps. Counseling sessions and outcomes will be documented in client files.
Investigation of Fair Housing Complaints: EBCLC conducts housing discrimination complaint
investigations. Investigations include research on property, interviewing witnesses and/or
initiating testing, analysis of owner practices and resident documents. EBCLC discusses the
analysis and options with the client and determines next steps including assistance with
filing a complaint with Housing and Urban Development Office of Fair Housing and Equal
Opportunity, Department of Fair Housing and Employment or referral to related legal
services. Investigation activities, documents and outcomes will to be documented in client
file.
Tenant/Landlord Mediation: EBCLC provides mediation sessions to resolve conflicts
between landlords and tenants.
Audits/Testing: EBCLC conducts audits each year. If it is determined that discrimination is
occurring, EBCLC will provide training and follow-up to non-compliant property owners
and/or property managers. Audit information, analysis, results and follow up are
documented and provided to the City as part of the quarterly reporting schedule.
2 Prior to FY2012, the City contracted with Housing Rights, Inc. until this non-profit went out of business in
June 2011.

2015-2023 Berkeley Housing Element 6 - Housing Programs and Quantified Objectives
118
Accomplishments
The following table lists Housing Rights Inc.’s annual accomplishments by fiscal year for FY
2012 through FY 2014.
Table 6-5: EBCLC Accomplishments by Fiscal Year, FY 2012- FY 2014
Year Accomplishments
FY 2012
A total of 76 people were served: 81% had fair housing issues related to disability, 2%
to familial status, 3% to gender, 2% to marital status, 3% to national origin, 6% to race,
and 3% to source of income (SSI,SSDI).
76 people received fair housing counseling
33 fair housing issues were investigated. Of those, 22 merited mediation and 17
matters were successfully mediated.
Four trainings were conducted and outreach to 303 stakeholders was made
(community based agency staff, Berkeley Housing Authority, property owners
and property managers).
Three audits testing for discrimination on the basis of race and disability were
conducted.
FY 2013
A total of 56 people were served; 70% had fair housing issues related to disability, 9%
age, 4% gender, 2% marital status, 7% national origin, 5% race, 2% sexual orientation
and 2% source of income (SSI, SSDI).
56 people received fair housing counseling
27 cases were mediated and 19 fair housing issues were investigated.
Staff provided four trainings and conducted outreach to 167 stakeholders (community
based agency staff, Berkeley Housing Authority, property owners and property
managers).
One test for gender discrimination was conducted.
FY 2014
49 Berkeley residents were served. 73% had fair housing issues related to disability,
6% age, 12% national origin, 6% race, and 2% source of income.
All 49 received fair housing counseling
25 fair housing issues were investigated and 14 cases were mediated
Staff provided four trainings and conducted outreach to 45 stakeholders (community
based agency staff, Berkeley Housing Authority, property owners and property
managers).
Staff conducted 3 tests for race discrimination.
Looking Ahead
EBCLC’s City funding allocation for FY 2015 is $35,544. The scope of work will include
investigation of 20 housing complaints; providing general housing counseling to another 60
households, and outreach to agencies that serve low- and very low-income adults and families,
such as childcare agencies, shelters, non-profit housing, and City programs.
Implementation Steps
Continue to provide fair housing services as required as a condition of federal funding
and as local priorities indicate.

2015-2023 Berkeley Housing Element 6 - Housing Programs and Quantified Objectives
119
Continue funding for legal resources for the resolution of fair housing complaints.
Timeframe
Ongoing
Responsible agency
City of Berkeley Health, Housing & Community Services Department
Funding sources
General Funds
Federal Community Development Block Grant (CDBG)
Addressing Impediments to Fair Housing
Maintaining the diversity of Berkeley’s population is a primary planning goal. The City actively
promotes reducing impediments to fair housing and discourages housing discrimination as a
means to protecting this diversity. The City’s primary programs addressing fair housing are
provided through contracts with the East Bay Community Law Center, which are described in
more detail under Fair Housing Assistance, Outreach, and Education.
City activities to further fair housing include:
Continue to refine the City's Analysis of Impediments to Fair Housing as needed.
Assist in creation/maintenance of affordable housing.
Provide rental eviction assistance through the East Bay Community Law Center.
Provide Rent Board funding to tenant/landlord mediation and organizing efforts.
Hold workshop(s) with agencies so that staff are more knowledgeable of the 1988 ADA
law and sensitive to problems faced by those with disabilities.
Analysis of Impediments to Fair Housing in Berkeley
The Department of Housing and Urban Development (HUD) requires the City to affirmatively
further fair housing in order to eliminate discriminatory practices in housing. As required by
HUD of all jurisdictions it funds, Berkeley developed an Analysis of Impediments to Fair Housing
Choice in the City that was included in the 2010 Consolidated Plan.
The City prepared an updated Analysis of Impediments to Fair Housing Choice in the 2010
Consolidated Plan. Per HUD guidelines, the analysis reviewed City laws, policies, regulations,
and procedures that directly or indirectly relate to fair housing, as well as assessed both public
and private conditions in the City that affect fair access to housing, including market factors. It
assessed how laws and other factors affect the location, availability, and accessibility of
housing. The fair housing plan set out the City of Berkeley’s strategies for overcoming identified
impediments and developing of a monitoring system to record activities undertaken to reduce or
overcome the identified impediments. The plan is available online at:
http://www.ci.berkeley.ca.us/ContentDisplay.aspx?id=12160
HUD defines Impediments to Fair Housing Choice as:

2015-2023 Berkeley Housing Element 6 - Housing Programs and Quantified Objectives
120
Any actions, omissions or decisions taken because of race, color, religion, sex,
disability, familial status or national origin which restrict housing choices or the
availability of housing choices; or
Any actions, omissions or decisions that have the effect of restricting housing choices
on the basis of race, color, religion, sex, disability, familial status or national origin.
Federal law defines a ‘disability’ or ‘handicap’ as being:
A physical or mental impairment which substantially limits one or more of such person’s
major life activities;
A record of having such an impairment; or;
Being regarded as having such an impairment.
Title VIII of the Civil Rights Act of 1968 prohibits housing discrimination based on race, color,
national origin or ancestry, sex, or religion. The 1988 Fair Housing Amendments Act added
familial status and mental and physical handicap as protected classes. California law (Rumford
Housing Act) prohibits housing discrimination toward all classes protected under Title VIII, and
adds marital status as a protected class. The Unruh Civil Rights Act prohibits discrimination in
all business establishments, including housing, based on any arbitrary reason.
Accomplishments
The following factors are impediments to fair housing choice that the City has identified and
created programs to address. The City’s actions in response are listed with each impediment
below.
Fair housing services
Impediment: Tenants, homebuyers, property owners and sellers may not be aware of all fair
housing laws and their resulting rights and responsibilities.
City’s actions: The City has funded the East Bay Community Law Center to provide outreach,
information and referral, mediation, and advocacy related to fair housing issues, as detailed in
Fair Housing Assistance, Outreach, And Education.
Shortage of affordable housing
Impediment: The Bay Area is one of the most expensive housing markets in the country.
Berkeley’s housing costs rose steadily for more than a decade, and despite the recession, they
remain high. As a result, the most significant barrier to fair housing is the lack of affordable
housing. Because national data shows that minorities are more likely than non-minorities to
have a low income, and people with disabilities are more likely than people without disabilities to
have a low income, the housing problems of low-income people are most acutely experienced
by minority and disabled households. While the City of Berkeley has historically placed a priority
on funding affordable housing, the needs continue to outstrip available resources.
City’s Actions: Berkeley has multiple programs addressing housing affordability. These include
(profiled in this section):
Housing Trust Fund
Five Shelter Plus Care grants

2015-2023 Berkeley Housing Element 6 - Housing Programs and Quantified Objectives
121
Public Commons for Everyone Square One supportive housing rental subsidy program
Inclusionary Ordinance which has made a great variety of housing accessible to
Section 8 voucher holders
Senior and Disabled Home Rehabilitation Loan program, which enables seniors and
people with disabilities to stay in their homes by making repairs for health and safety as
well as accessibility adaptations
Funding the Center for Independent Living’s Residential Access Project, Rebuilding
Together, and the Community Energy Services Corporation.
Collaboration with the Berkeley Housing Authority.
In addition, the City will work with other jurisdictions through EveryOne Home to provide unified
and comprehensive sources of information regarding housing resources. Service providers
working with classes protected under fair housing laws have repeatedly identified a lack of
information about affordable and accessible housing options as an impediment. The countywide
211 program allows people to call toll-free for information about housing available, and has
been funded by the City of Berkeley along with other jurisdictions.
Shortage of physically accessible units
Impediment: New construction in Berkeley complies with the Americans with Disabilities Act.
However, older units may not be accessible, and renters and homeowners with disabilities may
benefit from a variety of adaptations.
City’s Actions: The City has operated the Senior and Disabled Home Rehabilitation program
continuously since 2001. The City has continued to fund the Center for Independent Living’s
Residential Access Project and Rebuilding Together to provide accessibility modifications for
people with disabilities. Universal design was added to the HTF guidelines in a 2009 update.
These guidelines encourage developers to exceed the minimum accessibility requirements.
Shortage of supportive services that help seniors and people with disabilities live
independently
Impediment. The federal Olmstead Decision supported the right of people with disabilities to live
in the most independent setting possible, integrated into their community. For many people with
developmental and behavioral health disabilities, supportive services can be the key to living
independently in the community. Services needed range from transportation assistance to case
management to intensive behavioral health treatment. For some, the limited availability of
support services limits their housing choices to more institutional or congregate settings, and in
some cases results in cycling between homelessness and hospitalization.
City’s Actions: The City funds a wide variety of support services for a diverse population of
Berkeley residents through its General Fund, Community Development Block Grant (CDBG),
and Community Services Block Grant (CSBG) funds. For FY 2015, the City funded programs
serving people with disabilities at $1,294,491. In addition, the City funded community agency
programs for seniors at $29,063, and operates an Aging Services division of the Health,
Housing & Community Services Department that includes three daytime senior service centers.

2015-2023 Berkeley Housing Element 6 - Housing Programs and Quantified Objectives
122
Finally, the City funded permanent supportive housing services for formerly homeless people at
$284,763.
Mortgage lending practices
Impediment: Although a recent analysis of Home Mortgage Disclosure Act (HMDA) data
specifically for Berkeley is not available, it is reasonable to assume that national and state
mortgage lending trends apply in Berkeley as well. Multiple evaluations indicate that
discrimination in mortgage lending persists. Specifically, African American and Hispanic
mortgage applicants consistently have higher denial rates and more expensive loans than white
and Asian borrowers. The Federal Reserve Board has identified numerous potential causes for
the differences, including measures of credit history, loan-to-value ratios, debt-to-income ratios,
differences in choice of loan product, and discrimination.3 Several studies have shown that
African American and Hispanic borrowers nationwide received a disproportionate share of
subprime mortgage loans, and are therefore disproportionately impacted by the foreclosure
crisis.
City’s Actions: The City considered Home Mortgage Disclosure Act data and other sources of
homeownership data as part of the Analysis of Impediments to Fair Housing Choice in the 2010
Consolidated Plan, and it plans to revisit this data for the 2015 update to the Analysis of
Impediments to Fair Housing.
Affirmative Marketing of Vacant Subsidized Units
The City’s Housing Trust Fund program and Inclusionary Zoning Ordinance require property
owners to commit to affirmative marketing.
When affordable housing developers receive loans through the City’s Housing Trust Fund, the
loan terms require the developers to market vacant subsidized units in a way that will make the
units equally available to the community’s diverse population. Developers must submit an
affirmative marketing plan that addresses the venue and media through which units will be
marketed and the steps they will take in selecting tenants to ensure equal access.
Developers of inclusionary housing units under the City’s Inclusionary Zoning Ordinance must
sign a regulatory agreement that contains ordinance language requiring the developer to
affirmatively market units to low-income households on an equal opportunity basis.
Staff monitoring efforts have to date disclosed no discriminatory practices among the owners of
City-subsidized housing units.
Looking Ahead
The City prepared an Analysis of Impediments to Fair Housing Choice in May 2010 for the 2010
Consolidated Plan. The next five-year Analysis of Impediments to Fair Housing Choice will be
produced in FY2015.
3 http://www.cbanet.org/files/FileDownloads/BankAlerts/HMDA2.pdf

2015-2023 Berkeley Housing Element 6 - Housing Programs and Quantified Objectives
123
Implementation Steps
Continued analysis and mitigation of impediments to fair housing.
New 2015-2020 Analysis of Impediments.
Continued monitoring of the marketing of affordable subsidized units.
Timeframe
2015-2020
Responsible Agency
City of Berkeley Health, Housing & Community Services Department
Funding Sources
General Funds
Federal Community Development Block Grant (CDBG)
Home Modifications for Accessibility and Safety (Center for Independent Living and Rebuilding Together)
The City provides funding to two nonprofit organizations that assist with the remodeling of
existing housing to be suitable for people with disabilities.
Center for Independent Living’s Housing/Residential Access Program
Berkeley continues to contract with the Center for Independent Living (CIL) to operate the
Residential Access for Disabled Persons Program (RADP), which increases residential access
for people with disabilities by providing minor interior and exterior modifications (such as grab
bars, hand railings, bedrails, and widened doorways) as well as disabled access ramps,
wheelchair lifts, and other accessibility improvements at the homes of disabled Berkeley
residents. This program is funded using Community Development Block Grant (CDBG) funds.
The program serves those with incomes below 80% of the area median.
Rebuilding Together’s Safe Home Project
Rebuilding Together is a national organization that brings volunteers and communities together
to improve the homes and lives of low-income homeowners by providing free repair services for
low-income homeowners. Rebuilding Together East Bay-North is an independent nonprofit
501(c)(3) organization that is part of a network of approximately 250 Rebuilding Together
affiliates across the country. Utilizing volunteer labor, Rebuilding Together’s Safe Home Project
makes health and safety improvements that allow families, seniors, and people with disabilities
to remain safely at home.
Accomplishments
Center for Independent Living. From FY 2009 through FY 2014, the Center for Independent
Living provided a total of 167 minor interior and exterior home rehabilitations as well as installed
38 ramps and lifts.

2015-2023 Berkeley Housing Element 6 - Housing Programs and Quantified Objectives
124
Table 6-6: Center for Independent Living’s Residential
Access for Disabled Persons Program, FY 2009 – FY 2014
Year Interior/ exterior
modifications Ramps Total Households
FY 2014 30 4 30
FY 2013 27 6 31
FY 2012 30 8 28
FY 2011 27 6 33
FY 2010 26 8 34
FY 2009 27 6 34
Total 167 38 *
Source: Center for Independent Living
*A multiyear unduplicated client count is not available.
Rebuilding Together. From FY 2009 through FY 2014, Rebuilding Together repaired 125 homes
in Berkeley using volunteer labor.
Table 6-7: Units Repaired by Rebuilding Together’s
Safe Home Project, FY 2009 – FY 2014
Fiscal Year Homes Repaired
FY 2014 18
FY 2013 21
FY 2012 18
FY 2011 23
FY 2010 19
FY 2009 26
Total 125
Looking Ahead
The City awards Community Development Block Grant to community agencies on a competitive
basis annually. The Center for Independent Living and Rebuilding Together have competed
successfully for this funding in the past. In FY 2014, CDBG funding for CIL’s program was
$140,219. Rebuilding Together’s funding for FY 2014 was $98,279.
Implementation Steps
Continue to support housing modifications for accessibility and home repair services as
funding allows.
Timeframe
Ongoing
Responsible agency
City of Berkeley Health, Housing & Community Services Department

2015-2023 Berkeley Housing Element 6 - Housing Programs and Quantified Objectives
125
Funding sources
Federal Community Development Block Grant (CDBG)
Homeless Housing and Service Programs (HHSP)
The City of Berkeley has several programs providing services to homeless individuals and
families. A list of these programs is provided below, followed by a description of each program:
EveryOne Home Plan: Berkeley’s Homeless Policy Framework
Community Agency Contracting
Homeless Housing Locations
By-Right Emergency Shelters/Compliance with SB2
Centralized Shelter Bed Reservation System
Housing Retention Program
Priority Home Partnership (PHP)
Homeless Prevention and Rapid Rehousing Program
Relocation Services
Shelter Plus Care
Square One Supportive Housing
Mental Health Services Act (MHSA) Housing Program
HHSP: The EveryOne Home Plan, Berkeley’s Homeless Policy Framework
The City of Berkeley adopted the EveryOne Home Plan in May 2006 with Resolution No.
63,301-N.S., which directed the City Manager to use the Plan as a guide for allocating
resources within programs assisting those who are homeless or living with a serious mental
illness or HIV/AIDS. The resolution established the following goals:
1. To increase the amount and range of affordable housing opportunities in Berkeley for
extremely low-income and disabled residents;
2. Strengthen the continuum of services the City provides to ensure that residents can be
successful in their housing;
3. Inform relevant advisory commissions of Council’s intent that the Plan be used to guide
City policy; and
4. Broaden the City’s approach to services and housing to allow for better outcomes
among people with long-term homeless histories and severe disabling conditions.
The Plan
The EveryOne Home Plan was initiated in 2004 when three systems of care—homeless
services, mental health, and HIV/AIDS—came together to develop a joint housing plan, in
recognition that each served a population with similar challenges and frequently the same
people.

2015-2023 Berkeley Housing Element 6 - Housing Programs and Quantified Objectives
126
The EveryOne Home Plan envisions a housing and services system that partners with
consumers, families and advocates; provides appropriate services in a timely fashion to all who
need them; and ensures that individuals and families are safely, supportively and permanently
housed. To achieve those objectives, the plan is structured around five major goals that outline
multi-faceted solutions for a multi-dimensional problem:
Prevent homelessness and other housing crises. The most effective way to end
homelessness is to prevent it in the first place by making appropriate services
accessible at the time they are needed. In particular, people leaving institutions such as
foster care, hospitals, jails and prisons need interventions and planning that will prevent
them from exiting into homelessness.
Increase housing opportunities for the plan’s target populations. Increasing
affordable and supportive housing opportunities requires creative use of existing
resources, developing new resources and using effective models of housing and
services. This plan identifies a need for 15,000 units of housing for people who are
homeless or living with HIV/AIDS or mental illness over the next 15 years.
Deliver flexible services to support stability and independence. Culturally
competent, coordinated support services must accompany housing. Direct service
providers in all systems throughout the county must have a degree of knowledge about
and access to a range of housing resources and supportive services.
Measure success and report outcomes. Evaluating outcomes will allow systems and
agencies to identify successful programs and target resources toward best practices.
Develop long-term leadership and build political will. The goals of EveryOne Home
will only be achieved by developing a long-term leadership structure that can sustain
systems change activities. Implementation of this plan will also require building and
sustaining political and community support for its vision and activities.
By June 2009, the Plan had been adopted by thirteen cities in Alameda County and endorsed
by numerous community and County agencies. The full plan is available online at
www.everyonehome.org.
In addition to the broad policy goals outlined above, Everyone Home has established specific
system-wide objectives to achieve by working in collaboration countywide by 2020. These
objectives include:
1. Obtained permanent housing for 15,000 homeless households
2. Reduction of the average length of time between a household’s initial disclosure of
homelessness and placement in permanent housing from months or even years to
weeks.
3. Maintained permanent housing for at least one year by 85% of those that obtain it and
for at least three years by 65%.
While adoption of the plan does not obligate the City to any specific implementation actions, the
City did adopt the plan as a policy framework for future actions related to homelessness and
housing for people with serious mental illness or living with HIV/AIDS.

2015-2023 Berkeley Housing Element 6 - Housing Programs and Quantified Objectives
127
The Organization
In January 2008, EveryOne Home became a community-based organization under the fiscal
sponsorship of the Tides Foundation with the charge of coordinating implementation of the
EveryOne Home Plan countywide. EveryOne Home currently consists of two staff people who
work in the office space of the Alameda County Housing and Community Development. The
organization’s activities are guided by a Leadership Board, which includes permanent seats for
Berkeley’s Health, Housing & Community Services Department, as well as elected seats.
Currently two Berkeley-based community based organizations participate on the Board, along
with one formerly homeless resident of Berkeley.
EveryOne Home acts as a central coordinating point for a variety of committees and initiatives
geared toward implementing the plan.
Implementation Steps
Utilize the adopted EveryOne Home Plan goals to guide the allocation of resources
within Berkeley programs.
Participate in EveryOne Home’s Leadership Board.
Collaborate with other jurisdictions and community stakeholders to achieve the Plan’s
goals.
Timeframe
Through 2020
Responsible agency:
City of Berkeley Health, Housing & Community Services Department
EveryOne Home
Funding sources:
The City of Berkeley supports EveryOne Home as an organization annually with General Funds.
The City of Berkeley supports Everyone Home Plan implementation activities with a variety of
funding sources, as applicable (including General Funds, Community Development Block Grant,
and Emergency Solutions Grant).
The City of Berkeley provides the following programs and services to address homeless and
special needs housing. While many were established prior to the adoption of the EveryOne
Home Plan, and most are shaped by restrictions of one or more funding sources, with the
adoption of EveryOne Home, the following programs can be considered activities implementing
EveryOne Home.
HHSP: Community Agency Contracting
The City of Berkeley has a long history of funding community agencies to provide a wide variety
of housing and service programs for Berkeley’s diverse population and has invested deeply in
providing a comprehensive array of social services using City General Funds. Since
consolidating the community agency contracting process in 2003, the City releases a request for

2015-2023 Berkeley Housing Element 6 - Housing Programs and Quantified Objectives
128
proposals (RFP) for all available funding sources annually. Funds available include Community
Development Block Grant, Emergency Solutions Grant, Community Services Block Grant, and
City General Funds. Berkeley engages the participation of multiple citizen Commissions—
including the Housing Advisory Commission, the Homeless Commission, the Human Welfare
and Community Action Commission, and the Children, Youth & Recreation Commission—to
review proposals and make recommendations on the allocation of funding.
Accomplishments
The total level of funding available to community agencies has increased steadily over time. In
FY 2015, the City had $7.8 million in contracts with 67 community organizations, including $2.8
million for homeless programs at 19 organizations. Funding is awarded every two years
through a competitive funding process that includes an RFP, reviews by staff and multiple
Commissions, public hearings, and City Council action.
The City categorizes programs for reporting purposes, but it has not allocated funds to specific
targeted areas. Some community services address homeless needs specifically and are
included under the category Homeless. Other services support Berkeley’s diverse population in
remaining stably housed by addressing a wide range of social services needs. Categories of
programs serving special needs populations and/or the City’s housing stock include at a
minimum:
Childcare: funds affordable childcare programs.
Community facilities improvements: includes repairs and upgrades for community
service facilities as allowed in the federal Community Development Block Grant
program
Disability programs: includes services for people with disabilities, notably emergency
transportation services for the seriously disabled. Other programs include independent
living skills for the blind and daytime services for people who have a serious mental
illness and co-occurring substance abuse, as well as the Center for Independent
Living’s Residential Access for the Disabled program, profiled separately in this
Housing Element.
Employment training: includes employment training and job placement programs.
Housing development and rehabilitation: includes the Community Energy Services
Corporation and Rebuilding Together programs profiled elsewhere in this report.
Health: includes primary care programs for low-income Berkeley residents, such as the
Berkeley Free Clinic, elder care at the Over 60 Clinic, and the hypertension program.
Legal and advocacy: includes fair housing services, housing advocacy, and a criminal
record clean slate clinic.
Seniors: includes daytime services for seniors.

2015-2023 Berkeley Housing Element 6 - Housing Programs and Quantified Objectives
129
The table below shows the City’s contracts with community agencies in FY 2015, by area of
focus and by funding source.
Table 6-8: Community Agency Contracts, FY 2015
Program Category General
Funds
Federal
Funds
Other
Funds All Sources
Childcare $518,991 - - $518,991
Community Facilities Improvements - $102,108 - $102,108
Disability Programs $140,868 $140,219 $1,013,404 $1,294,491
Employment Training $207,595 $50,852 - $258,447
Health $276,609 - - $276,609
Homeless $2,221,941 $536,763 $20,000 $2,778,704
Housing Dev & Rehab $14,819 $380,613 - $395,432
Legal/ Advocacy $48,078 $34,932 - $83,010
Seniors $29,063 - - $29,063
TOTAL $3,457,964 $1,245,487 $1,033,404 $5,736,855
As part of EveryOne Home plan implementation, City staff analyzed funding for the Homeless
category of funded programs by segment of the homeless service system.
In FY 2015, $1.7 million in City funding went to emergency assistance programs for homeless
individuals and families, including $760,546 for the operation of emergency shelter and
$861,648 for daytime drop in centers. Other emergency assistance provided was through meal
programs. Another $670,000 went into intensive, targeted homeless programs, including
$165,452 for the operation of transitional housing, and $241,839 for addiction recovery
programs for homeless adults. Other intensive services were SSI advocacy and job training
and placement for homeless adults. Finally, another $600,000 went into permanent housing
services, including services in the Public Commons for Everyone program (profiled later in this
section), other supportive services in permanent housing, and administration of Shelter Plus
Care services by community agencies.
Looking Ahead
Implementation Steps Related to Homeless Services
The Health, Housing & Community Services Department hired consultants in April 2014 to help
facilitate a process to design a more coordinated homeless system that is more efficient for
consumers and more effectively targets resources to those who need it most. This kind of
Coordinated Access System (CAS) is a Federal requirement for all homeless Continuums of
Care (CoC), established by the U.S. Department of Housing and Urban Development (HUD) as
part of the 2009 HEARTH Act.
The system envisions a single point of entry called the Housing Crisis Resolution Center, where
clients are triaged based on housing situation. There are two primary goals of the Housing
Crisis Resolution Center. The first is to “divert” people who are not actually homeless from

2015-2023 Berkeley Housing Element 6 - Housing Programs and Quantified Objectives
130
entering shelter and other traditional homeless services by assisting them to resolve issues that
are causing them to need to leave their current housing situation and to provide limited financial
assistance to keep their housing. The second goal is to assess clients who are actually
homeless and offer services matched to their need, prioritizing services for those with the
highest need. The Housing Crisis Resolution Center acts as the access point into emergency
shelter and transitional housing, and provides housing search assistance and other housing
supports. Referrals are also made through this front door to other existing services in the
community.
The next RFP for community agency funding, including homeless funding, will be issued in
December 2014. The RFP would allow competitors to submit proposals to provide services as
part of a new CAS.
Timeframe
Ongoing
Responsible agency
City of Berkeley Health, Housing & Community Services Department
Funding sources
Community Development Block Grant (CDBG)
Emergency Solutions Grant
Community Services Block Grant
City General Funds

2015-2023 Berkeley Housing Element 6 - Housing Programs and Quantified Objectives
131
HHSP: Homeless Housing Locations
As a result of Berkeley’s historic investment in homeless housing programs, Berkeley has a
variety of emergency shelter, transitional housing, and permanent supportive housing programs
serving people who are homeless and people with special needs.
Table 6-9: Current Inventory of Emergency Shelters
Provider Name Address Facility
Name Population
Family
Beds
Individual
Beds
Year
Round
Seasonal
Only
Berkeley Food
& Housing
Project (BFHP)
1931 Center St
Men's
Overnight
Assistance
Single M 0 36 36 0
Berkeley Food
& Housing
Project (BFHP)
2140 Dwight
Way
Dwight
Way
Shelter
for Women
& Children
Single F &
Families 5 24 29 0
Building
Opportunities
for Self-
Sufficiency
(BOSS)
711 Harrison
St
Harrison
House
Single
M&F 0 50 50 0
Dorothy Day
House
St Mark's
Episcopal
Church 2300
Bancroft Way
Emergency
Storm
Shelter
Single
M&F 0 0 0 65
City of Berkeley
Winter Voucher
Program
Hotel vouchers Winter
Voucher
Singles
and
Families
0 0 0 30
Youth
Emergency
Assistance
Hostels
Lutheran
Church of the
Cross 1744
University Ave.
YEAH! Youth 0 0 0 40
Totals 5 110 115 170
Source: City of Berkeley Health, Housing & Community Services Department

2015-2023 Berkeley Housing Element 6 - Housing Programs and Quantified Objectives
132
Table 6-10: Current Inventory of Transitional Housing
Provider Name Address Facility Name Population Units Family
Beds
Individual
Beds
Year
Round
Berkeley Food
& Housing Project
(BFHP)
2140
Dwight
Way
Transitional
House
Single F &
Families 7 16 23
Berkeley Food &
Housing Project
(BFHP)
1931
Center St
Men's
Overnight
Assistance
Veterans 0 0 12 12
Bonita House, Inc.
1410
Bonita
Street
Bonita House Single M&F 0 0 15 15
Building
Opportunities for
Self Sufficiency
(BOSS)
2111
McKinley
Street
McKinley
Family
Transitional
House
Families 7 24 0 24
Building
Opportunities for
Self Sufficiency
(BOSS)
711
Harrison
Street
Harrison
House Families 9 26 0 26
Building
Opportunities for
Self Sufficiency
(BOSS)
701
Harrison
Street
Ursula
Sherman
Village -
Sankofa
House
Families 4 30 0 30
Fred Finch Youth
Center
3404 King
Street Turning Point Youth M&F 0 0 18 18
Resources for
Community
Development
(RCD)
1621
Ashby
Ave.
Ashby House Single
Veterans 0 0 10 10
Women's Daytime
Drop-In Center
2218
Acton St. Bridget House Families 4 12 0 12
Totals 24 99 75 158
Source: City of Berkeley Health, Housing & Community Services Department
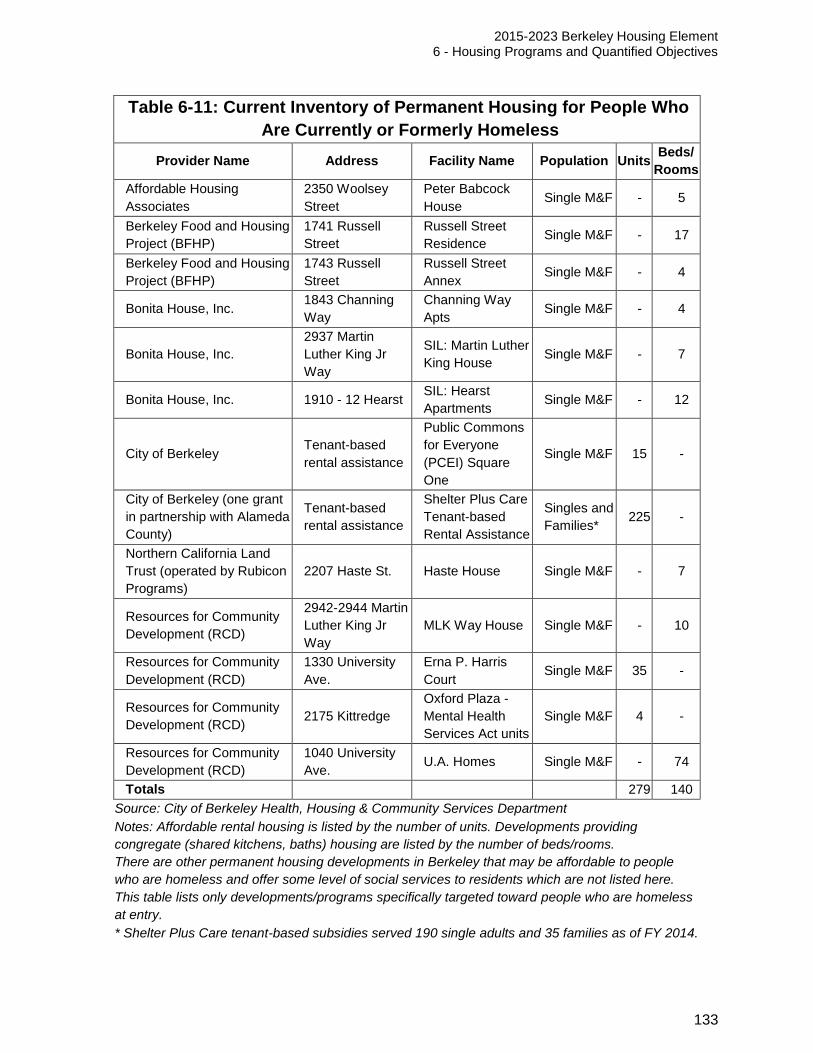
2015-2023 Berkeley Housing Element 6 - Housing Programs and Quantified Objectives
133
Table 6-11: Current Inventory of Permanent Housing for People Who
Are Currently or Formerly Homeless
Provider Name Address Facility Name Population Units Beds/
Rooms
Affordable Housing
Associates
2350 Woolsey
Street
Peter Babcock
House Single M&F - 5
Berkeley Food and Housing
Project (BFHP)
1741 Russell
Street
Russell Street
Residence Single M&F - 17
Berkeley Food and Housing
Project (BFHP)
1743 Russell
Street
Russell Street
Annex Single M&F - 4
Bonita House, Inc. 1843 Channing
Way
Channing Way
Apts Single M&F - 4
Bonita House, Inc.
2937 Martin
Luther King Jr
Way
SIL: Martin Luther
King House Single M&F - 7
Bonita House, Inc. 1910 - 12 Hearst SIL: Hearst
Apartments Single M&F - 12
City of Berkeley Tenant-based
rental assistance
Public Commons
for Everyone
(PCEI) Square
One
Single M&F 15 -
City of Berkeley (one grant
in partnership with Alameda
County)
Tenant-based
rental assistance
Shelter Plus Care
Tenant-based
Rental Assistance
Singles and
Families* 225 -
Northern California Land
Trust (operated by Rubicon
Programs)
2207 Haste St. Haste House Single M&F - 7
Resources for Community
Development (RCD)
2942-2944 Martin
Luther King Jr
Way
MLK Way House Single M&F - 10
Resources for Community
Development (RCD)
1330 University
Ave.
Erna P. Harris
Court Single M&F 35 -
Resources for Community
Development (RCD) 2175 Kittredge
Oxford Plaza -
Mental Health
Services Act units
Single M&F 4 -
Resources for Community
Development (RCD)
1040 University
Ave. U.A. Homes Single M&F - 74
Totals 279 140
Source: City of Berkeley Health, Housing & Community Services Department
Notes: Affordable rental housing is listed by the number of units. Developments providing
congregate (shared kitchens, baths) housing are listed by the number of beds/rooms.
There are other permanent housing developments in Berkeley that may be affordable to people
who are homeless and offer some level of social services to residents which are not listed here.
This table lists only developments/programs specifically targeted toward people who are homeless
at entry.
* Shelter Plus Care tenant-based subsidies served 190 single adults and 35 families as of FY 2014.

2015-2023 Berkeley Housing Element 6 - Housing Programs and Quantified Objectives
134
Accomplishments
The City continues to allocate funding to rehabilitate emergency shelter, transitional housing,
and permanent housing through its community agency competitive capital funding process, in
addition to funding made available through the Housing Trust Fund. Many of the rehabilitation
projects involve accessibility improvements. The table below lists housing facilities funded
through this process, the HUD program year of the federal funds allocated, with the type and
total of funds allocated.
Table 6-12: Rehabilitation of Emergency and Transitional Housing
Facilities by HUD Program Year of Federal Funds Allocated
Federal Fund
Source
Funding
Allocated
2009 $59,440
BOSS - McKinley House CDBG $15,769
BOSS – McKinley House ESG $43,671
2010 $45,297
Berkeley Food And Housing Project Women’s Shelter CDBG $5,297
Berkeley Food And Housing Project Women’s Shelter ESG $40,000
2011 $63,703
Berkeley Food And Housing Project Women’s Shelter CDBG $20,000
Berkeley Food And Housing Project Women’s Shelter ESG $3,703
Women’s Daytime Drop-In Center CDBG $40,000
2012 $133,228
Berkeley Food And Housing Project Shelter CDBG 92,406
BOSS - McKinley House ESG $30,582
Fred Finch Youth Transitional Housing – ADA Bathroom CDBG $10,240
2013 $64,500
Fred Finch Youth Transitional Housing $24,500
Berkeley Food And Housing Project Women’s Shelter CDBG $40,000
Total PY 2009 - 2013 $366,168
Source: City of Berkeley Health, Housing & Community Services Department
Note: HUD Program Year is numbered one year earlier than the City’s fiscal year (July 1, 2014
to June 30, 2015 is City Fiscal Year 2015 and HUD Program Year 2014).
Looking Ahead
Consistent with goals outlined in the Everyone Home Plan, the City’s objective is to sustain
existing housing opportunities for people who are homeless or have special needs. The City
also invests most of its Emergency Solutions Grant each year in rental assistance to rapidly re-
house homeless individuals and families as part of its Priority Home Partnership Program,
described in more depth later in this chapter.
The City will also work to increase other permanent housing opportunities. In 2009, the City
Council adopted updated Housing Trust Fund guidelines, which, among other changes,
explicitly call out the need to review service plans and the qualifications of supportive housing
service and property management providers in order to ensure that future supportive housing is
well-planned. The guidelines also now state that the City of Berkeley “will give preference to

2015-2023 Berkeley Housing Element 6 - Housing Programs and Quantified Objectives
135
projects that address chronic homelessness and/or housing for extremely low-income
households, or households whose income does not exceed 30% AMI as described above.”
The City has taken several other steps to increase the permanent housing available for people
who are homeless, and it will continue to do so as opportunities are identified. City actions
profiled elsewhere in this chapter include:
The Public Commons for Everyone Square One program, and
Mental Health Services Act funds for housing development
Implementation Steps
Continue to make funding available to develop, rehabilitate, and operate homeless
housing.
Timeframe:
Ongoing
Responsible agency:
City of Berkeley Health, Housing & Community Services Department
Funding sources:
General Fund
Federal Community Development Block Grant (CDBG)
Federal/State of California Community Services Block Grant (CSBG)
Emergency Solutions Grant
Other funds as available
HHSP: Emergency Shelters / Compliance with SB 2
Changes to Government code section 65583(a), adopted in 2007 with Senate Bill 2 (SB 2),
require the City to identify at least one zoning district where emergency shelters (see definition
below) are allowed as of right, meaning without a conditional or discretionary permit. This
includes allowing at least one year-round shelter. The law specifies that the City must amend
the zoning ordinance to be consistent with these requirements within one year of adoption of the
Housing Element, or prior to adoption of the next Housing Element update.
Senate Bill 2 also requires cities to define and treat transitional and supportive housing (see
definitions below) as a residential uses subject to the same restrictions and regulations of other
residential uses in the zoning district. Such uses may be subject to discretionary review if other
residential uses are.
On December 3, 2013, the City Council adopted a package of zoning amendments for
emergency homeless shelters that included:
1. Year-round emergency homeless shelters allowed as-of-right in all commercial zoning
districts except Neighborhood Commercial (C-N);

2015-2023 Berkeley Housing Element 6 - Housing Programs and Quantified Objectives
136
2. Facility standards and operations requirements for new emergency shelters;
3. Revised definitions of transitional housing, supportive housing, and emergency shelters; and
4. Winter season only shelters allowed in high-density residential districts.
Transitional housing and supportive housing units are allowed in Berkeley with a conditional use
permit. Based on the revised zoning ordinance definitions, transitional or supportive housing
are considered either “dwelling units” or “group living accommodations” depending on the size
of the facility and the development standards of the zoning district. Dwelling units are allowed in
all residential zoning districts. Group living accommodations are allowed in the R-3, R-4, and R-
5 residential zoning districts, the mixed-use residential district (MU-R) and all of the City’s
commercial zoning districts (C-1, C-2, C-N, C-NS, C-SA, C-SO, C-T, C-W).
Just as any other housing project, transitional or supportive housing facilities are subject to the
development standards of the zoning district in which they are located in terms of height,
density, number of stories, and setbacks. Therefore, the Berkeley zoning ordinance is
consistent with SB 2 with regard to transitional and supportive housing.
Berkeley Zoning Ordinance Definitions, Section 23F.10
Group Living Accommodations: A building or portion of a building designed for or
accommodating Residential Use by persons not living together as a Household, but
excluding Hospitals, Nursing Homes and Tourist Hotels.
Dwelling Unit: A building or portion of a building designed for, or occupied exclusively by,
persons living as one (1) household.
Emergency Shelters (from Health and Safety Code Section 50801(e): Temporary lodging
for homeless persons with minimal supportive services that may be limited to occupancy of
six months or less.
Supportive Housing (Health and Safety Code 50675.14(b): Any dwelling unit or a Group
Living Accommodation, that is occupied by the target population as defined in subdivision (d)
of Section 53260 of the CA Health and Safety Code with no limit on length of stay, that is
linked to on- or off-site services that assist the supportive housing residents in retaining the
housing, improving his or her health status, and maximizing his or her ability to live and,
when possible, work in the community.
Transitional Housing (from Health and Safety Code Section 50675.2)(h): Any dwelling
unit or a Group Living Accommodation configured as a rental housing development, but
operated under program requirements that call for the termination of assistance and
recirculation of the assisted units to another eligible program recipient at some
predetermined future point in time.
Accomplishments
The City of Berkeley provides about 115 emergency shelter beds available year round, and
about 170 available in winter months. Berkeley also has a number of transitional housing and

2015-2023 Berkeley Housing Element 6 - Housing Programs and Quantified Objectives
137
permanent supportive housing programs serving people who are homeless or with special
needs. An inventory of Berkeley’s existing homeless housing is provided above.
In 2013 the City adopted zoning to allow emergency shelters as-of-right. The zoning allows
shelters close to support services, such as the community health clinic, the homeless resource
center, employment service centers, food banks, and public transportation, which are generally
located near or along Shattuck, Adeline, Telegraph, and University Avenues.
Zoning districts that allow for emergency shelters include the C-DMU (Downtown), C-1
(University and Telegraph Avenues), C-SA (Shattuck and Adeline), C-T (Telegraph commercial
district), and R-4 (multi-family residential district located north, west and south of the University
of California campus). These districts include 113 housing opportunity sites and a total of
1,404,414 square feet, as shown in the opportunity site inventory discussed in Chapter 3 and
Appendix A of this Element.
The average lot size of nine emergency shelters and transitional housing currently located
within the City is 16,500 square feet. The lots range in size from 5,063 square feet to 45,500
square feet. The larger sites are institutional uses (churches or civic buildings) that also serve
as shelters, and are around 20,000 to 40,000 square feet. The smaller sites are usually around
5,000-7,000 square feet, generally are not dual-purpose buildings, and are mostly located in
residential areas.
Review of the 113 housing opportunity sites located in the zoning districts listed above
illustrates that most of the sites are around 15,000 square feet, with all exceeding 10,000
square feet, and thus would be adequately sized to facilitate an emergency shelter use based
on the examples of existing shelters. Under SB 2, Berkeley and all other cities in the state
received an allotment of shelter beds to be “planned for” in their jurisdiction; in Berkeley that
amount is 371 beds. It is based on the most recent point-in-time survey of homeless persons
for which the city has data (2009). As described above, the districts that allow shelters as-of-
right include enough geographic area within the city to show that emergency shelters could be
established given the right funding and land availability. Based on the Housing Element
analysis, there are adequate opportunity sites within most of the city’s commercial districts to
meet Berkeley’s need for 371 shelter beds.
Looking Ahead
The City has adopted zoning compliant with SB 2. The City recently selected a development
team to enter into an exclusive negotiating rights agreement for the development of the city-
owned Berkeley Way parking lot at 2012 Berkeley Way. The project will include permanent
affordable supportive housing and will consider inclusion of an emergency shelter, community
space, and supportive services.
Consistent with SB 745 (2014), the City will revise the definitions of “supportive housing” and
“transitional housing” to remove obsolete references.
Implementation Steps
Continue to work with service providers and citizen groups to address shelter need.

2015-2023 Berkeley Housing Element 6 - Housing Programs and Quantified Objectives
138
Timeframe
Ongoing
Responsible agency
City of Berkeley Planning Department
City of Berkeley Health, Housing & Community Services Department
Funding sources
General Fund
HHSP: Centralized Shelter Bed Reservation System
The Public Commons for Everyone Initiative (PCEI) created a range of programs, four of which
specifically address homelessness. The emergency shelter Centralized Bed Reservation
System was launched in January 2009. This program allows people seeking shelter in Berkeley
to find out about availability and sign up for openings by calling a single number. Previously,
people seeking shelter needed to call each shelter individually. If a person had a bed
reservation but did not show up, the bed might go empty all night because there wasn’t a
uniform mechanism for filling beds later in the day.
Accomplishments
The Centralized Shelter Reservation Program has increased shelter occupancy from a low of
77% in 2007, to an occupancy rate of 94% for all year-round Berkeley Shelters in 2013 (the
latest period for which data was available). This is primarily due to the fact that shelters began a
practice of accepting additional people at a second reservation time in the evening to fill any
empty beds.
Looking Ahead
Berkeley plans to continue to provide centralized access to shelter beds through the
Coordinated Access System. The system operator will also fully implement available technology
to fill beds so that shelter providers and staff making placements have real-time access to bed
availability.
Implementation Steps
Contract with community agencies to provide a centralized shelter bed reservation
system to reduce nightly vacancies in Berkeley’s emergency shelters.
Link this system with other homelessness prevention resources through a coordinated
access system to provide a more comprehensive response to people experiencing a
housing crisis in Berkeley.
Timeframe
Ongoing
Responsible Agency
City of Berkeley Health, Housing & Community Services Department

2015-2023 Berkeley Housing Element 6 - Housing Programs and Quantified Objectives
139
Funding Sources138
General Fund
HHSP: Housing Retention Program
The EveryOne Home Plan identified homelessness prevention as one of five critical strategies.
After its adoption, the City moved to revamp the Homelessness Prevention Program that the
City has funded in various forms since 1993. Specifically, changes were made to the program to
link it more closely to supportive services, so that the homeless prevention intervention had a
more robust result and was not just delaying homelessness for participants. Launched in
February 2008, the program is currently operated in partnership with the City's Division on
Aging, Berkeley Mental Health’s Family Youth and Children Services Division, Public Health
Nurses, and five community-based organizations, which both refer applicants and provide other
services to promote housing retention. The Housing Retention Program provides up to $1,500 in
assistance with back rent for Berkeley residents experiencing a temporary financial setback in
order to prevent homelessness. The City also has an allocation of Emergency Solutions Grant
funding which can be used to provide homeless prevention assistance. This program – Priority
Home Partnership – is described later.
Accomplishments
The Housing Retention Program served 30 households in FY 2014.
Agency partners include:
City of Berkeley Aging Services- Senior Centers
City of Berkeley Health Department, Mental Health Division, Family, Youth and Children
Services
City of Berkeley Public Health
East Bay Community Law Center
LifeLong Medical Services
Rubicon
Toolworks (Supportive Services at AHA sites)
Woman's Daytime Drop-in Center
Looking Ahead
The HRP program will likely change in the future as a result of the development of a
Coordinated Access System. Recent analysis of data from the Homeless Management
Information System indicates that in 2013, about 19% of clients who enter the homeless system
are not homeless. A program to provide financial assistance and services to these clients to
help them keep their housing would use resources currently available for the HRP for flexible
financial assistance.
Implementation Steps
Continue to provide financial resources and support services to help Berkeley residents
keep their housing as part of the Coordinated Access System.

2015-2023 Berkeley Housing Element 6 - Housing Programs and Quantified Objectives
140
Timeframe
Ongoing
Responsible Agency
City of Berkeley Health, Housing & Community Services Department
Funding Sources:
General Fund
Table 6-13: Housing Retention Program, FY 2014
Totals
# of Households Served 30
# of Grants 30
Amount of Grants: $57,416
Balance Remaining $27,147
Average Household Grant $1,009
Average per Month $2,522
Demographics
Age of Applicant Number Percentage
18-24 0 0%
25-44 11 37%
45-54 8 27%
55-61 4 13%
62+ 7 23%
Unknown 0 0%
Race
African American 17 57%
Caucasian 3 10%
Latino 3 10%
Asian 0 0%
Other 0 0%
Unknown 7 23%
Gender & Other Characteristics
Female Head of Household 19 63%
Male Head of Household 11 37%
Income Level
Poverty 12 41%
Extremely Low (30% of AMI) 6 20%
Low (31-50% of AMI) 7 23%
Moderate (51-80% of AMI) 4 13%
Above Moderate (81% + of AMI) 1 3%
Grant Range $150-$1,500
# of $1,500 grants 7 23%
Source: City of Berkeley Health, Housing & Community Services Department

2015-2023 Berkeley Housing Element 6 - Housing Programs and Quantified Objectives
141
HHSP: Energy Bill Payment Assistance (Discontinued)
The City of Berkeley ended operation of this program as of December 31, 2011.
The City of Berkeley operated an Energy Bill Payment Assistance program and weatherization
program to assist low income households since the late 1970s. The program was supported by
outside sources in addition to the direct funding from the federal government. For more than 30
years most of the federal funding for weatherization has come from the Low Income Home
Energy Assistance Program (LIHEAP), a program of the Department of Health and Human
Services, along with a much smaller Weatherization Assistance Program (WAP), a program of
the Department of Energy. The funding was passed through to the City by the California
Department of Community Services and Development (CSD).
LIHEAP had two components: utility bill payment assistance for low income households and the
installation of energy efficiency measures in low income households. WAP is limited to the
installation of energy efficiency measures. Until 2008, the total federal funding for both LIHEAP
and WAP averaged in the range of $200,000 to $225,000.
Although neither program requires a match from the City, the cost of operating the program
greatly exceeded the federal grants for the program and the program was heavily subsidized
with City of Berkeley General Funds and Community Development Block Grant Funding to a
combined total amount of approximately $500,000 annually.
HC&S made the recommendation to discontinue operating the weatherization program at the
end of its contract with the State in 2011. First, throughout the State of California, most
weatherization programs are carried out by nonprofit Community Action Agencies which can
operate with smaller permanent staffing than the City and which are able to better adjust their
staffing to meet irregular or unstable funding situations by taking on temporary workers as
needed. The timing associated with hiring City workers makes it difficult to modify our programs
with a similar level of expediency. Second, the City’s need to plan for program funding on a
biennial basis forces HC&S to assure an adequate level of funding well in advance of budget
approval by the Council. At this time, all four of the sources for the low income weatherization
program (LIHEAP, DOE, City General Funds and Community Development Block Grants) are
expected to have reduced funding for the foreseeable future while the cost of running our
weatherization program continues to increase. The primary costs for the program are for City
personnel and both the salaries and benefits are higher than for similar weatherization programs
throughout our area which are run by nonprofit agencies. Finally, the discontinuation of the
operation of the program by the City does not mean the elimination of the program for
Berkeley’s low-income households. CSD transferred the program to Spectrum Community
Services, Inc. based in Hayward with an office in Oakland.

2015-2023 Berkeley Housing Element 6 - Housing Programs and Quantified Objectives
142
HHSP: Priority Home Partnership Program
In February 2013, EveryOne Home partners finalized a county-wide prevention and rapid re-
housing program with Emergency Solutions Grant (ESG) funds, modeled on the Homelessness
Prevention and Rapid Re-Housing Program (HPRP), that utilizes common assessment tools
and policies, is an integral part of the current system of care, is simple for clients to access and
provides common outcome data and measurable results. This program is called Priority Home
Partnership. Given that the resources provided under ESG are a fraction of that available under
HPRP, PHP is a significantly scaled-down system, utilizing existing homeless provider
resources and focusing on rapid re-housing and shelter diversion.
Program standards have been developed by a multi-jurisdictional working group with community
feedback, based on the Priority Home Partnership (PHP) standards created for HPRP. The
standards for the Priority Home Program have been modified to take into account the smaller
resources and even greater targeting needed for ESG. These written standards for prevention
and rapid re-housing are considered interim for the period until a broader coordinated
assessment system and written standards for assistance have been developed and adopted
across the Continuum.
The City of Berkeley has encouraged its network of providers of homeless services to focus
their efforts on rapidly re-housing their clients. Providers have re-tooled staffing to focus case
management efforts on preparing clients for stabilization in housing. City General Funds already
support these efforts.
ESG funds have been used since FY 2013 to support homeless prevention and rapid re-
housing efforts. These include financial assistance and housing relocation and stabilization
services for homeless individuals and families. Of these, approximately 75% are literally
homeless, will have sought daytime or nighttime shelter at existing homeless agencies in
Berkeley, and ESG funds will be provided to help them become rapidly re-housed. An additional
25% individuals or families, who are at imminent risk of homelessness, seeking shelter, and
who do not have a current lease, ownership interest or occupancy agreement, and whose
household income is below 30% of Area Median Income, will be provided with financial
assistance to prevent them from becoming homeless. Homeless service providers, funded with
City General Funds, assist clients with case management and housing search assistance. City
of Berkeley staff review and approve applications for assistance, enter client information into
HMIS, coordinate and review housing inspections, coordinate rental assistance activities, and
hold regular coordination meetings. Berkeley Food and Housing Project staff administer
financial assistance for these clients. Tenant-based rental assistance is limited to three months,
but exceptions may be granted under limited circumstances.
In FY2014, ESG funds were used to provide assistance to 60 households. Demographics are
shown in Table 6-14.

2015-2023 Berkeley Housing Element 6 - Housing Programs and Quantified Objectives
143
Table 6-14: ESG-Assisted Activity Beneficiary Data FY2014
Persons Assisted Homeless
Prevention Rapid-Re-Housing Shelter
Total All
Activities
Adults 5 55 0 60
Children 3 21 0 24
Don’t Know/Refused 0 0 0 0
Missing Information 1 4 0 5
Total 9 80 0 89
Gender
Total All
Activities Race/Ethnicity Total
Male 30 White/Caucasian 7
Female 54 African/American/Black 63
Transgender 0 Asian 0
Unknown 7
American
Indian/Alaskan Native 6
Total 89 Other Multi-Racial 6
Missing Data 7
Total 89
Age
Total All
Activities Hispanic 15
Under 18 24
18-24 9
Over 24 51
Don’t Know / Refused 0
Missing Information 5
Total 89
Special Subpopulations
Served
Total Served
– Homeless
Prevention
Total Served – Rapid
Re-Housing
Total
Served –
Emergency
Shelters
Total
Veterans 0 1 0 1
Victims of Domestic Violence 3 10 0 13
Elderly 0 8 0 8
HIV/AIDS 0 0 0 0
Chronically Homeless 0 8 0 8
Persons with Disabilities:
Severely Mentally Ill 2 17 0 19
Chronic Substance Abuse 0 5 0 5
Other Disability 0 11 0 11
In FY 2014 the PHP program provided the 60 households with $146,894 in rental assistance
including security deposits.

2015-2023 Berkeley Housing Element 6 - Housing Programs and Quantified Objectives
144
Looking Ahead
Rapid Re-Housing has been prioritized by the Federal Department of Housing and Urban
Development (HUD) as an important component of homeless permanent housing options. The
City will continue to operate the PHP program to be utilized as a housing resource as part of a
new Coordinated Access System. Approximately $372,000 is projected to be available for the
PHP program in FY2015. Implementation Steps
Evaluate and continue to implement the PHP program.
Timeframe
Ongoing
Responsible Agency
City of Berkeley Health, Housing & Community Services Department
Funding Sources
Emergency Solutions Grant funding
Community Development Block Grant funding
HHSP: Relocation Services
The City monitors compliance with the Federal Uniform Relocation Act, which provides
protections for tenants displaced by federally funded programs and administers Section 13.84 of
the Berkeley Municipal Code, which provides protections for tenants who must temporarily
relocate due to repairs necessary to bring the unit into code compliance. The Relocation
Services include:
Information and referrals for tenants and property owners in Berkeley regarding their
rights and responsibilities under the City’s Relocation Ordinance;
Relocation assistance to elderly homeowners who live in blighted properties and whose
houses are being repaired through the City’s Senior and Disabled Housing
Rehabilitation Program.
Monitoring by Health, Housing & Community Development staff for compliance with
HUD relocation requirements in housing development projects that involve acquisition,
demolition, or rehabilitation.
Typically, tenants and rental property owners are referred to the Health, Housing & Community
Services Department for information about their relocation rights through the Rent Stabilization
Board, the Code Enforcement Division, the Building and Safety Division, the Fire Department,
and from local community agencies that provide housing counseling and advocacy. In the
situations in which temporary relocation is necessary, relocation staff strive to ensure that an
appropriate relocation plan is developed and that tenants who may have special needs receive
appropriate services and do not experience undue hardship as a result of being temporarily
displaced. The City’s Relocation Specialist maintains a log to track the number of tenants and

2015-2023 Berkeley Housing Element 6 - Housing Programs and Quantified Objectives
145
property owners who receive assistance, the address of the property, and the type of assistance
provided.
Accomplishments
City staff provided relocation assistance to 66 tenants and 17 property owners, and apprised them
of their rights and responsibilities regarding temporary relocation under Section 13.84 of the
Berkeley Municipal Code.
In addition, the City Relocation staff completed the following activities:
Participated in interagency emergency response with Fire Department and the Red Cross
and UC Berkeley staff to assist 32 tenants (mostly UC Berkeley students) displaced due to
a fire at 2322 Haste Street.
Worked extensively with the City Attorney’s office, City Manager’s office and Rent
Stabilization Board to resolve a complex relocation issue regarding a landlord who was
unable/unwilling to comply with the Relocation Ordinance (2526 Shattuck Avenue).
Attended HUD’s Uniform Relocation Act training.
Attended inter-departmental meetings to address problem properties, when tenants may
be displaced due to City code enforcement action.
Staff engaged in ongoing coordination with the Rent Stabilization Program to respond to
landlord/tenant inquiries and mediation to resolve disagreements regarding the terms of
relocation.
Looking Ahead
The City’s Relocation Program staff will continue to provide relocation services on an as-needed
basis and collaborate with other City departments and the Rent Stabilization program.
Implementation Steps
Continue to provide relocation services on an as-needed basis.
Timeframe
Ongoing
Responsible Agency
City of Berkeley Health, Housing & Community Services Department
Funding Sources
General Funds
Federal Community Development Block Grant (CDBG)

2015-2023 Berkeley Housing Element 6 - Housing Programs and Quantified Objectives
146
HHSP: Reverse Mortgage Counseling (Discontinued)
The City no longer provides contracts with Eden Council for Hope and Opportunity (ECHO) to
provide information and counseling regarding reverse mortgages and other alternatives to low-
income senior homeowners.
HHSP: Shelter Plus Care
The City of Berkeley administers six Shelter Plus Care grants, which are a key component of
Berkeley’s inventory of permanent housing for homeless individuals and families, particularly
those with disabilities. The program combines federal funding for rental subsidies with linked
supportive services provided by 13 community-based organization partners. Two grants are a
sponsor-based subsidy in partnership with community-based organizations that own supportive
housing. City staff work closely with private property managers, supportive services providers,
and participants to ensure that grant funds are fully utilized and participants remain stably
housed.
Accomplishments
The City’s first Shelter Plus Care grant was award in 1995, and included subsidy for 129 units.
The City has been awarded five more grants since then through competitive selection
processes, bringing the total up to 212 units of funding. Through careful grant management, the
City has been able to use the awarded subsidies to house an even greater number of
participants, totaling 255 households in 2014.
During FY 2014, the Shelter Plus Care Program provided housing for a total of 249 households.
Housing outcomes are available for the 28 households who exited the program during this
period.
Of those households who exited the program, 100% retained their housing for at least
six months; 27 (96%) retained their housing for at least one year; 14 (50%) retained
their housing for at least 5 years.
Of the 28 households exiting the program: 15 left for other permanent housing, one
entered shelter; four died; two were in jail; one entered residential treatment; and two
were staying with family or friends temporarily.
During FY 2011, the Berkeley Housing Department partnered with the City’s Division on Aging
to apply for a new Shelter Plus Care grant to create 12 tenant-based subsidies for chronically
homeless older adults. Called the Berkeley Housing for Older Adults Project (HOAP), HUD
awarded the City $824,700 to provide 12 housing certificates serving homeless older adults.
The program now serves 15 older adults.
Due to its size and proven effectiveness in ending homelessness, the Shelter Plus Care
program plays an important role in the City’s implementation of the Everyone Home plan.

2015-2023 Berkeley Housing Element 6 - Housing Programs and Quantified Objectives
147
Table 6-15: Shelter Plus Care Grant History
Grant Begin Date End Date Award Grant Units
Tenant-Based Rental
Assistance
7/1/1995 5/23/2002 $5,069,880 129
5/24/2002 5/23/2003 $1,372,000 129
5/24/2003 5/23/2004 $1,745,160 129
5/24/2004 5/23/2005 $1,909,116 129
5/24/2005 5/23/2006 $1,909,116 129
5/24/2006 5/23/2007 $1,954,452 129
5/24/2007 5/23/2008 $1,985,736 129
5/24/2008 5/23/2009 $1,936,656 129
5/24/2009 5/23/2010 $1,814,400 129
5/24/2010 5/23/2011 $1,929,120 129
5/24/2011 5/23/2012 $1,952,112 129
5/24/2012 5/23/2013 $1,964,016 129
5/24/2013 5/23/2014 $1,971,274 129
Sponsor-Based Rental
Assistance,
Bonita House
Pathways Project
6/20/2000 5/31/2006 $308,280 7
6/1/2006 5/31/2007 $115,068 11
6/1/2007 5/31/2008 $112,908 11
6/1/2008 5/31/2009 $116,244 11
6/1/2009 5/31/2010 $114,468 11
6/1/2010 5/31/2011 $121,704 11
6/1/2011 5/31/2012 $123,192 11
6/1/2012 5/31/2013 $123,900 11
6/1/2013 5/31/2014 $121,004 11
Sponsor-Based Rental
Assistance,
Resources for
Community
Development
5/28/2003 5/27/2008 $312,840 6
5/28/2008 5/27/2009 $119,628 12
5/28/2009 5/27/2010 $117,648 12
5/28/2010 5/27/2011 $125,088 12
5/28/2011 5/27/2012 $126,624 12
5/28/2012 5/27/2013 $127,344 12
5/28/2013 5/27/2014 $124,291 12
Tenant-Based Rental
Assistance, COACH
12/14/2005 12/13/2010 $1,426,320 21
12/14/2010 12/13/2011 $449,784 33
12/14/2011 12/13/2012 $455,196 33
12/14/2012 12/13/2013 $457,908 33
12/14/2013 12/13/2014 $449,002 33
Tenant-Based Rental
Assistance,
Subcontract with
Alameda County and
Alameda County
Collaborative
2/1/2004 1/31/2005 $218,088 15
2/1/2005 1/31/2006 $218,652 15
2/1/2006 2/28/2007 $218,652 15
3/1/2007 2/29/2008 $216,394 15
3/1/2008 2/28/2009 $216,894 15
3/1/2009 2/28/2010 $225,932 15
3/1/2010 2/28/2011 $231,672 15
3/1/2011 2/29/2012 $234,416 15
3/1/2012 2/28/2013 $241,057 15

2015-2023 Berkeley Housing Element 6 - Housing Programs and Quantified Objectives
148
3/1/2013 2/28/2014 $256,222 15
Tenant-Based Rental
Assistance,
Housing for Older Adults
Project (HOAP) 11/1/2010 10/31/2015 $824,700 12
Source: City of Berkeley Health, Housing & Community Services Department
Note: Shelter Plus Care grant funds are initially awarded in a five-year contract, and subsequently
renewed on an annual basis.
Looking Ahead
The City will continue to operate the Shelter Plus Care program to maximize use of this federal
resource and to achieve continued high retention outcomes. The City may compete for
additional grants as opportunities arise and staffing allows.
Implementation Steps
Continue administering federal rental subsidies for formerly homeless individuals and
families.
Continue partnering with community based organizations that provide the supportive
services match needed to keep participants stably housed.
Timeframe:
Ongoing
Responsible Agency:
City of Berkeley Health, Housing & Community Services Department
Funding Sources:
Federal Shelter Plus Care funds
Matching services may be funded in the Community Agency Funding described above
HHSP: Square One Supportive Housing Program
On November 27, 2007 the Berkeley City Council approved a package of measures referred to
as the Public Commons for Everyone Initiative (PCEI), which was designed to improve
Berkeley’s public areas to make them safer and healthier for everyone. The Council packet is
available here:
http://www.ci.berkeley.ca.us/citycouncil/2007citycouncil/packet/112707/11-27s.htm
The Public Commons for Everyone Initiative created a range of programs, four of which
specifically address homelessness, to be funded from parking meter revenue. The supportive
housing program model, called Square One, drew from proven national programs, including
Pathways in New York City and Washington DC. The program targets homeless adults who
frequently have multiple disabilities and have been homeless for long periods. A key feature of
the program is a locally-funded permanent housing rental subsidy, modeled on the U.S.
Department of Housing and Urban Development’s Shelter Plus Care program. This is the first
2015-2023 Berkeley Housing Element 6 - Housing Programs and Quantified Objectives
149
locally-funded rental housing subsidy program in Alameda County. Square One also includes
outreach from Berkeley Mental Health’s Homeless Outreach Team, and intensive services for
10 to 15 people provided by LifeLong Medical.
Accomplishments
As of July 2014, 15 individuals targeted for the Square One Program have been successfully
engaged in services and are housed. Three of these individuals also had long-term partners
with them while on the streets, and their partners have been included in their households. Of
the 15 Square One clients served in FY2014, nine have been housed for four or more years,
three have been housed for more than one year and three for six to twelve months. One client
was evicted from housing (after having been housed more than 3 years) and is still enrolled in
the program. The case manager is continuing to work with the client to attempt to re-house.
Most of the Square One clients were not receiving primary care or mental health services at the
time of their enrollment. One of the strengths of the program is that the case management
provider, LifeLong Medical Care (LMC), also provides healthcare and mental health services.
Consequently, LMC has been able to assure that all of the people enrolled in the program are
connected with primary medical care, and ten of the participants are now also receiving mental
health services through LMC.
Looking Ahead
Square One is proving to be a successful strategy for ending homelessness for chronically
homeless people in Berkeley. The City recognizes the importance of the rental subsidy and
supportive services in keeping participants housed. Continuation of the program depends on
local parking meter revenue.
Implementation Steps
Provide permanent supportive housing for 10-15 individuals. Evaluate program
outcomes and availability of parking meter revenue to support continued operations.
Continue operation of program as General Fund availability permits.
Timeframe:
Ongoing
Responsible Agency:
City of Berkeley Health, Housing & Community Services Department
City of Berkeley Health Department Mental Health Division
Funding Sources
General Fund
HHSP: Mental Health Services Act (MHSA) Housing Program
Affordable housing was one of the primary needs for people with serious mental illness
identified during the Berkeley/Albany Mental Health Services Act Community Services and

2015-2023 Berkeley Housing Element 6 - Housing Programs and Quantified Objectives
150
Supports planning process, an extensive process involving many stakeholders. As a result, the
City is working to fully utilize the housing resources available through the Mental Health
Services Act.
The Mental Health Services Act (MHSA) is California State legislation approved by the voters in
November 2004 for the purpose of transforming and expanding public mental health services.
This Act placed a 1% tax on personal income over $1 million. Funds are allocated to local
mental health jurisdictions, like the City of Berkeley, according to formulas, for a variety of
targeted uses.
Statewide tax revenues received under the MHSA exceeded what was originally projected. As
a result, all mental health jurisdictions were awarded “one-time funds” from FY 2005-06. The
City of Berkeley’s MHSA Community Services and Supports (CSS) Plan, dated March 14, 2006,
allocated $300,000 of the one-time funds for housing activities. Later, the Department of Health
and Human Services Mental Health Division set aside an additional $200,000 in unspent FY
2006-07 MHSA funds for housing development.
In August 2007, the California Housing Finance Agency (CalHFA) released the application for
the California MHSA Housing Program, making available $115 million statewide for the
development and operation of affordable housing for people with serious mental illness who are
homeless or at risk of homelessness. Each mental health jurisdiction can submit applications
on behalf of non-profit developers up to a designated limit. To be eligible, the units must be
connected to that jurisdiction’s MHSA services. Berkeley can submit applications for up to $1.2
million, which CalHFA will provide in the form of loans directly to nonprofit sponsors.
Accomplishments
The City has collaborated with Alameda County, the countywide mental health jurisdiction, to
reach out to local developers and work toward finding related development projects. In
December 2007, the City Council approved a local policy for MHSA housing development funds
from the City’s local MHSA one-time funds and a Request for Proposals for up to $500,000 for
housing development was released.
Affordable Housing Associates’ Harmon Gardens project, located at 3240 Sacramento Street
was selected. The City Council approved submitting an application to CalHFA and DMH for the
Harmon Gardens project on July 23, 2009. CalHFA issued a conditional approval in August
2009.
A remaining balance of $758,600 was used for renovations at University Avenue Homes.
University Avenue Homes (UA Homes) is an existing affordable housing development located at
1040 University Avenue. The development consists of 74 Single Room Occupancy (SRO) units,
all of which are available at deeply affordable levels and restricted to individuals who are
homeless. Resources for Community Development (RCD) used MHSA and other HUD funding
to rehab the building. Seven units have been set aside for mental health consumers served
through the Mental Health Services Act (MHSA). On-site service providers, in addition to
offering a variety of services at UA Homes, help connect tenants with these many other local

2015-2023 Berkeley Housing Element 6 - Housing Programs and Quantified Objectives
151
resources. This rehabilitation project will help ensure UA Homes’ long-term viability as an
affordable housing resource for the community.
The units at UA Homes are reserved for homeless individuals with incomes below 30% of the
Area Median Income (30 units) or 50% of the Area Median Income (44 units). Of the 74 units at
UA Homes, 73 are part of the Berkeley Housing Authority’s Section 8 Moderate Rehabilitation
Program for Single Room Occupancy Dwellings for Homeless Individuals. This rental subsidy
program allows rents to be fixed at 30% of tenants’ incomes, ensuring affordability for the
residents.
UA Homes’ MHSA units serve adults who are certified by the Berkeley Mental Health Division
as severely mentally ill and are certified as homeless. The MHSA units consist of seven (7)
SRO apartments and will target households with incomes below 30% of AMI. The Section 8
rental subsidy will ensure affordability for MHSA households by limiting their rental payment to
30% of their income. MHSA tenants at UA Homes are assigned to the Berkeley Mental Health -
Full Service Partnership (FSP), which involves intensive, collaborative, wraparound services by
a team of licensed clinicians.
Looking Ahead
MHSA funds for capital improvements and technology will be used for upgrades to the Mental
Health Clinic for the upcoming cycle; funds will not be used for housing investment.
Implementation Steps:
Continue to utilize any future allocation of Mental Heal Services Act Housing Program funding to
support housing development.
Timeframe:
Ongoing
Responsible Agency:
City of Berkeley Health Department Mental Health Division
California Housing Finance Agency
California Department of Mental Health
Funding Sources
MHSA Housing Program funds
Housing Code Enforcement and the Rental Housing Safety Program
The Planning and Development Department’s Housing Code Enforcement staff is responsible
for enforcing the housing code in residential rental housing and for administering the Rental
Housing Safety Program (RHSP). Activities to accomplish this are in four program components.

2015-2023 Berkeley Housing Element 6 - Housing Programs and Quantified Objectives
152
Reactive/Complaint Inspection Program
The reactive/complaint inspection program refers to the state-mandated housing code
inspections that are conducted in response to tenant complaints, requests made to other City
departments, or referrals from other City departments The rules governing local application and
enforcement of the state housing code are mandated in Health and Safety Code Section 17961,
the California Code of Regulations (25 CCR, Article 5: Existing Buildings), and the City’s
adopted Berkeley Housing Code, BMC Chapter 19.40.
When the Planning and Development Department’s Housing Code Enforcement staff receives a
complaint, an inspection is scheduled and an inspector completes an investigation of the unit. If
any code violations are identified, a notice of required corrections is issued and a re-inspection
scheduled within 30 days. If the violation has been corrected at the inspector’s return visit, no
inspection fees are charged to the owner. However, if the violation has not been corrected, the
property owner is charged $300 for the inspection. Inspections are then repeated on an
approximate 30-day schedule until the correction has been completed, with another $300 fee for
the second follow-up inspection and $400 for each subsequent inspection.
Proactive Inspection Program
The Proactive Inspection Program refers to inspections of rental units that are performed on
randomly selected residential rental properties, intended to identify existing housing code
violations before they potentially become serious health and safety risks to tenants, increasing
the quality and safety of the rental housing stock in Berkeley. This component was incorporated
into the overall RHSP program (BMC Chapter 12.48), adopted by City Council on July 24, 2002.
Safety Certification Checklist (Schedule A form)
The City’s RHSP Safety Certification Checklist (Schedule A form) (BMC Chapter 12.48) requires
owners of residential rental properties to annually inspect their units and certify that specific
housing safety standards are being met using the City’s RHSP Safety Certification Checklist
(Schedule A form). Property owners must supply a copy of the completed checklist to the tenant
annually. Additionally, if at any time there is an inspection of a residential rental unit either at
the tenant’s request or through the proactive inspection program property owners are required
to produce a copy of the completed RHSP Safety Certification Checklist (Schedule A form) for
the unit(s) scheduled for inspection. Failure to do so may result in the issuance of an
Administrative Citation to the property owner that carries a minimum fine of $200 per unit or
room.
This requirement applies to almost all rental housing in Berkeley, currently more than 26,000
apartments and more than 3,000 rooms for rent. Staff activities include advising property
owners and tenants of checklist requirements via the Rent Board’s newsletter, responding to
inquiries from property owners and tenants, preparing and mailing information materials
annually, and maintaining information on the City’s website regarding program requirements.
Annual per Unit/Room Fee
Owners of all residential rental buildings, and residential hotels and boarding houses with five or
more rooms are required to pay an annual fee for each rental unit/room to support outreach,
education, enforcement activities and program administration. The Council adopted the current
2015-2023 Berkeley Housing Element 6 - Housing Programs and Quantified Objectives
153
per unit and per room fee schedule in May 2009, per Resolution No. 64,455-N.S. Late penalty
fees were adopted per Resolution No. 62,990-N.S. on July 12, 2005. Annual fees are $26.00
per apartment and $13.00 per room for rent. These billing statements are sent out in October of
each year by the Finance Department.
Accomplishments
Reactive inspections: Housing Code Enforcement staff responds to all tenant complaints,
performing “reactive inspections.” In FY 2009 through FY 2014, the Planning and Development
Department’s Housing Code Enforcement staff inspected an average of 194 new cases per
year, followed by an average of 587 re-inspections, with an average of 148 cases closed each
year.
Proactive inspections: Between FY 2009 and FY 2014, an average of 226 new proactive cases
have been opened annually. An average of 237 re-inspections for corrections have been
conducted, with an average of 189 cases closed annually.
Safety Certification Checklist (Schedule A form): In the fall of 2009, Housing Code Enforcement
staff met with stakeholders to develop, change and update the City’s RHSP Safety Certification
Checklist (Schedule A form).
Gas Heating Certification: The Gas Heating Certification Program was repealed by the City
Council effective July 2012 with one of the reasons being the new State mandated installation of
carbon monoxide devices in all residential properties. This program successfully achieved a
91% compliance rate.
Annual Per Unit/Room Fee: The RHSP annual per unit/room fees were raised in May 2009 to
$26.00 per unit or $13.00 per room with the City’s goal being for the RHSP to become financial
self-supporting. The increase successfully achieved that goal.
Looking Ahead
In July 2013 Housing Code Enforcement was relocated from the Health, Housing & Community
Services Department to the Planning & Development Department, and with the hiring of a new
inspector in June 2014, is currently fully staffed. The City plans to continue the Rental Housing
Safety Program, making both reactive and proactive inspections available. The City is planning
to maintain–if not increase—the focus of the RHSP toward proactive rather than reactive
inspections.
The City anticipates implementing the issuing of administrative citations for non-compliance with
the City’s RHSP Safety Certification Checklist (Schedule A form) requirements within the next 3
years. Currently, Housing Code Enforcement is actively continuing with outreach and
education.
Implementation Steps
Continue to operate the Rental Housing Safety Program.
Evaluate program changes that will help the program continue to be self-supporting,
while still increasing the safety of rental housing in Berkeley.

2015-2023 Berkeley Housing Element 6 - Housing Programs and Quantified Objectives
154
Timeframe
Ongoing
Responsible agency
City of Berkeley Planning and Development Department
Funding sources
The RHSP annual per unit/room fee, re-inspection fees and citations
Housing Mitigation Fees Charged to Non-Residential Development
The City of Berkeley adopted Ordinance No. 6179 (BMC Chapter 22.20) in 1993 to assure that
non-residential development projects mitigate and/or compensate for the increased demand for
affordable housing attributable to and generated by such development. These “linkage”
policies—updated based on a nexus study prepared by an outside economic consultant and
adopted by the City as Resolution No. 66,617-N.S. on June 3, 2014—require developers of non-
residential projects (office, retail, industrial and/or other commercial new construction in which
the net additional, newly constructed floor area is over 7,500 square feet) either to provide
affordable housing directly or pay a mitigation fee to the City’s Housing Trust Fund. In this way,
non-residential development mitigates the impacts the project causes with respect to the need
for affordable housing generated by new jobs.
The Resolution provides non-residential developers the option of either creating housing units
affordable to households with income at or below 30% of the area AMI or paying an in-lieu fee
to the City’s Housing Trust Fund. Most applicants pay the in-lieu fee which previously could not
exceed $4.00 per square foot of office or retail floor area or $2.00 per square foot of industrial
floor area. Resolution No. 66,617-N.S., both updated the fees to reflect a use’s actual long-term
employment capacity, as well as included non-residential uses that were previously exempt
(e.g. restaurants, hotels/lodging, Research and Development (R&D), storage).
Table 6-16: Affordable Housing In-Lieu Impact Fee for Large-Scale
Non-Residential Development Projects (as of June 3, 2014)
Use Affordable Housing Unit Fee
Office or Research and Development Space 1 unit / 52, 859 gross
square feet
$4.50 / gross
square foot
Retail/Restaurant or Hotel/Lodging Space 1 unit / 52,859 gross square
feet
$4.50 / gross
square foot
Industrial/Manufacturing or
Warehouse/Storage (except “self-storage”—
see below)
1 unit / 105,719 gross
square feet
$2.25 / gross
square foot
Self-storage Space classified in NAICS as
industry 531130
1 unit / 54,432 gross square
feet
$4.37 / gross
square foot

2015-2023 Berkeley Housing Element 6 - Housing Programs and Quantified Objectives
155
The Ordinance provides that the mitigation and/or fees may be reduced for a variety of reasons,
including if the requirement would make the project infeasible or if the project benefits outweigh
its burdens in terms of increased demand for affordable housing. If a reduction in the fee is
requested by the applicant, the Office of Economic Development analyzes the request and a
recommendation is provided to the Zoning Adjustment Board or Zoning Officer.
Accomplishments
Since 2009, the City has approved four commercial and mixed-use projects that will contribute a
total of $346,399 to the Housing Trust Fund:
331 Seventh Street: 8,437 new square foot industrial; 28,121 new square foot office
740 Heinz: 8,200 new square foot industrial
North Shattuck Safeway: 17,250 new square foot retail
Weatherford BMW: 30,456 new square foot retail/showroom
Looking Ahead
The City of Berkeley anticipates commercial development will continue providing housing in-lieu
fees to the City’s Housing Trust Fund into the foreseeable future.
Implementation Steps
Continue to collect fees to fund affordable housing development.
Timeframe
Ongoing
Responsible Agency
City of Berkeley Planning and Development Department
City of Berkeley Office of Economic Development
Funding Sources
Commercial development fees
Housing Trust Fund
The City of Berkeley created its Housing Trust Fund (HTF) in 1990 to help achieve the City's
General Plan (including the Housing Element) and Consolidated Plan goals of developing and
preserving long-term below market rate housing. The HTF pools funds for affordable housing
construction from a variety of sources with different requirements, makes them available
through one single application process to local developers, then monitors development and
operation of the funded housing. Berkeley established guidelines for the HTF to maximize
coordination of affordable housing development and resources and to allocate funds through a
consistent request for proposals (RFP) process. The guidelines were most recently revised in
2009 and adopted by City Council on April 21, 2009. Current guidelines are available online at:
http://www.ci.berkeley.ca.us/uploadedFiles/Housing/CouncilAdopted2009HTFGuidelines.pdf

2015-2023 Berkeley Housing Element 6 - Housing Programs and Quantified Objectives
156
Sources of Funding
Funding sources include the following specified in the Housing Trust Fund guidelines:
Federal HOME Partnership for Investment Program (HOME Program). A U.S.
Department of Housing and Urban Development-administered program providing grants
to participating jurisdictions for low-income housing through rental assistance, housing
rehabilitation, and new construction.
Allocated Community Development Block Grant (CDBG) funds. A federal grant
program, administered by the U.S. Department of Housing and Urban Development,
authorized under Title I of the Housing and Community Development Act of 1974 and
administered by state and local governments. CDBG funds may be used in various
ways to support community development, including acquisition, construction,
rehabilitation, and/or operation of public facilities and housing.
Housing mitigation fees provided by commercial development projects. Berkeley
charges housing mitigation fees to commercial projects of a certain size to help offset
the demand created for affordable housing. Housing mitigation fees are administered by
the Economic Development Department. See program description for Housing
Mitigation Fees charged to Non-Residential Development.
Condominium conversion mitigation fees. Subject to Berkeley’s Condominium
Conversion Ordinance, Berkeley charges mitigation fees for rental housing and tenancy
in common (TIC) properties that convert to condominiums. See program description for
Condominium Conversion Ordinance.
Affordable housing mitigation fees provided by residential development projects.
Subject to the Inclusionary Ordinance, BMC Chapter 23C.12 and related fee
Ordinances, new construction may opt to pay a fee in-lieu of including below-market–
rate units in housing projects of five or more dwelling units. This fee money is used to
fund affordable housing through the HTF. The fees are administered by Health,
Housing & Community Services. See program description for Inclusionary Housing
Ordinance and Density Bonus Implementation.
Funds from other sources authorized by the City Council, the Berkeley Housing
Authority, the Rent Stabilization Board, and the voters. These have included the
California Housing Trust Fund Program, which provided matching funds to local
housing trust funds, the California HELP Loan Program, which provided funds for site
acquisition, and City General Funds, which are otherwise unrestricted City funds.
Berkeley Redevelopment Agency Tax Increment Set-Aside Funds. See program
description for Redevelopment Agency Tax Increment Set-Aside Funds for Housing
Activity.
Payments of interest and principal due to the City from borrowers of previous
HTF loans.
The table below shows the cumulative funds received and committed, along with the fund
balance, for the Housing Trust Fund from its beginning until June 30, 2014.

2015-2023 Berkeley Housing Element 6 - Housing Programs and Quantified Objectives
157
Table 6-17: Housing Trust Fund Cumulative Funds Received and
Committed as of June 30, 2014
Source
Cumulative Funds
Received Since
7/1/1991
Cumulative Funds
Committed Fund Balance
HUD HOME $22,128,899 $21,657,491 $471,408
General Fund/ Berkeley Capital
Improvement Fund $9,936,911 $9,838,203 $98,708
HUD Community Development
Block Grant (CDBG) $5,063,774 $4,707,739 $356,035
California HELP $3,094,000 $3,094,000 -
Redevelopment Agency $2,445,049 $2,445,049 -
Housing Mitigation Fees $2,079,355 $1,801,355 $278,000
California Housing Trust Fund $1,000,000 $1,000,000 -
Inclusionary & Condominium
Conversion Fees $362,658 $37,658 $325,000
Total $46,110,646 $44,581,495 $1,529,151
Source: City of Berkeley Health, Housing & Community Services Department
Allocation of Funds
Berkeley allocates Housing Trust Funds according to the process established in the Housing
Trust Fund guidelines and consistent with federal requirements. When the City Manager
determines that sufficient funds are available, the Heath, Housing & Community Services
Department issues a request for proposals for the amount of funding available. Developers and
project sponsors may submit acquisition, rehabilitation, and new construction proposals subject
to the terms of the Housing Trust Fund guidelines. Funding is awarded through a competitive
process that includes staff review, evaluation by the Housing Advisory Commission (HAC) and
other public commissions, and review and action by the City Council, as established in the
Housing Trust Fund guidelines.
Development Loans
Funds are made available in the form of a loan accompanied by 55 years of affordability
requirements recorded on the property in a Regulatory Agreement. To develop property in a
high-cost area like Berkeley and make units affordable to the income levels required in the
Housing Trust Fund guidelines is not a profit-generating activity. Therefore, the main goal of the
Housing Trust Fund loans is ensuring the long-term affordability of high quality housing, not
generating income from the investment.
When the City approves a loan, staff will execute a contract called a “Development Loan
Agreement” (DLA) with the borrower, frequently a nonprofit housing developer. The DLA
contains the loan terms (usually 55 years at 3% interest), the rent and income restrictions on the
rental units funded, a budget for the disbursement of loan proceeds, a promissory note, and
other standard City contract language. Clauses also require the borrower to disclose
information on tenant incomes, rents, asset management, and financial records to the City for
purposes of review and evaluation. This agreement also provides the basis for the City's

2015-2023 Berkeley Housing Element 6 - Housing Programs and Quantified Objectives
158
monitoring activities. Federal regulations on the funding sources require monitoring activities.
Pre-development loans can also be made to a developer to assist in the early stages of the
project’s development. Loans are typically repaid from a portion of the development’s net
income once they achieve positive cash flow. These are known as “residual receipts” loans.
Affordable Housing Finance
Typically the HTF loan represents from 12% to 20% of a development’s total financing. The
remaining 80% to 88% comes from a variety of sources, including:
The Federal Low Income Housing Tax Credit Program, administered in California by the
California Tax Credit Allocation Committee;
Tax-exempt bond financing administered in California by the California Debt Limit
Allocation Committee (CDLAC);
California programs at the Housing and Community Development Department and at
the California Housing Finance Agency (CalHFA);
The Federal Home Loan Bank;
The U.S. Department of Housing and Urban Development (HUD) Section 202 and
Section 811 programs, which provide capital and operating funding for developments
targeting senior and disabled residents, respectively;
Federal Housing Opportunities for Persons with AIDS (HOPWA) funding, administered
locally by Alameda County, and
Private lenders and foundations.
The Housing Department also administers HUD Section 108 loans, which use City CDBG funds
to back loans for commercial space in mixed-use (housing and commercial space)
developments. HUD Brownfields Economic Development Initiative (BEDI) grants have been
available to developments with Section 108 financing on brownfields. Project-Based Section 8,
available through the Berkeley Housing Authority, makes it possible to cover operating costs
and obtain more permanent financing while housing extremely low-income tenants by providing
an ongoing rental subsidy to dedicated units.
Funding History
Since its creation in 1990, the Housing Trust Fund has:
Funded 57 housing developments with a total of 1,188 units
Provided a total of $45 million in funding for affordable housing developments
Leveraged more than $123 million in non-City funds
The following table includes the development projects that were completed from 2010 through
2014, with the level of City financing provided and some notes on special needs populations
served.

2015-2023 Berkeley Housing Element 6 - Housing Programs and Quantified Objectives
159
Table 6-18: Developments with Housing Trust Fund Financing Completed
2010 – 2014, Total City Financing
Project Total City
Financing Notes on Project
Amistad House $300,000 Replace windows and other interior improvements to
60 units of affordable senior housing
Erna P Harris Apartments $400,000
Rehab of 35 studio and one-bedroom units. Rehab
included site drainage and unit improvements, and
energy efficiency upgrades.
Harmon Gardens $900,000
New construction of 16 units for homeless youth and
youth at risk of homelessness, with linked mental
health services and California MHSA funding
Regent House $90,259
Renovate a 6-unit group permanent housing facility for
formerly homeless and disabled single men and
women
Savo Island Cooperative
Homes $435,000
Rehab of 57-unit property, including energy efficiency
upgrades, accessibility improvements, and other
interior and exterior improvements
U.A. Homes $778,816
Refinance and rehab building with 74 single room
occupancy units for homeless adults, and 5 commercial
spaces.
Total $2,904,075
Source: City of Berkeley Health, Housing & Community Services Department
The next table lists each project completed in from 2010 through 2014 by development type
(new construction or acquisition and rehabilitation), with the number of Project-Based Housing
Choice Vouchers (Section 8) or other HUD operating subsidy and the number of units restricted
by income level. As described earlier, the Berkeley Housing Authority has allocated project-
based Section 8 to development projects in Berkeley, which are also funded by the Housing
Trust Fund. In all cases, the units with a Project-Based Section 8 subsidy were also funded by
the Housing Trust Fund. By providing on-going rental subsidies for units in a development,
Project-Based Section 8 makes units affordable to people with extremely low incomes, who
otherwise could not afford to pay enough rent even to cover the operating costs.
In addition to the extremely low, very low, low, moderate, and above moderate-income
categories used by the State of California for Housing Elements, the City of Berkeley uses a
60% of Area Median Income (AMI) restricted category in its Housing Trust Fund guidelines.
Although 60% of Area Median Income could be considered a subset of low-income, for clarity it
is listed separately in the chart below, between very low-income and low-income.

2015-2023 Berkeley Housing Element 6 - Housing Programs and Quantified Objectives
160
Table 6-19: Developments with Housing Trust Fund Financing Completed By
Income Level, 2010 – 2014
Project Total
Units
Extremely
Low-
Income
Very Low-
Income 60% AMI
Low-
Income
Moderate
- Income
Unrestricted
(Manager
Unit)
New Construction
Harmon Gardens 16 2 13 1
Acquisition & Rehabilitation
Amistad House 60 23 36 1
Erna P. Harris Apartments 35 24 10 1
Regent House 6
Savo Island Cooperative
Homes 57 12 23 1
U.A. Homes 74 51 22 1
Total 248 91 68 23 36 5
Source: City of Berkeley Health Housing and Community Services Department
Note: 60% of Area Median Income is an income category created in the City’s Housing Trust Fund guidelines. It is
treated as a distinct category in this chart.
The table below lists projects with current Housing Trust Fund commitments that are not yet
complete.
Table 6-20: HTF Allocations as of November 2014
Project # of Units City Funds Committed
Berkeley 75 (acquisition and
rehab) 75
$300,000 to Berkeley Housing Authority for
predevelopment
$400,000 to Related California for development
Strawberry Creek Lodge
(rehab) 150 $652,200
University Avenue Cooperative
Homes Apartments (rehab) 47 $1,213,016
William Byron Rumford Sr.
Plaza (rehab) 43 $2,140,000 (loan will also refinance existing City loans)
Source: City of Berkeley Health Housing and Community Services Department

2015-2023 Berkeley Housing Element 6 - Housing Programs and Quantified Objectives
161
The following table is a complete list of developments that were financed through the Housing
Trust Fund since guidelines were initially established in 1990.
Table 6-21: All City of Berkeley Housing Trust Fund
Developments 1990 to 2014
Development Name Total Units
1133-1139 Hearst Street 32
1314 Haskell 3
1317 Ashby Avenue 6
1320 Haskell Street 5
1340 Blake Street 5
1534 Prince Street 6
1612 Harmon 6
1849 Shattuck 24
1900 Alcatraz Avenue 9
2203-2207 Sixth Street - AHA Scattered Sites 10
2207 Haste Street 7
2425 California Street 6
2500 Hillegass Street 19
834-836 Allston Way - AHA Scattered Sites 2
950 Hearst - AHA Scattered Sites 8
Addison Court Housing Cooperative 10
Adeline Street Apartments 19
Allston House 48
Amistad House 60
Ashby Commons 6
Ashby Courtyard 20
Ashby Lofts 54
Bonita House - 1410 Bonita Street 15
Bonita House - 1843 Channing Way 15
BuiLD, Inc 6
Casa Buenos Amigos Hsg Cooperative 4
Crossroads Village Mutual Housing Assoc. 26
Dwight Way Apartments 16
Emergency Womens Apartments 13
Erna P. Harris Court 35
Fairview House Cooperative 9
Fred Finch Youth House 15
Harmon Gardens 16
Helios Corner 80
Hope Home 4
Idaho Street 1
Lorin Station 14
Mable Howard Apartments 40
Margaret Breland Senior Homes 28
McKinley House 7
MLK House 12
Oxford Plaza & David Brower Center 97

2015-2023 Berkeley Housing Element 6 - Housing Programs and Quantified Objectives
162
Regent House 6
Rosevine 10
Sacramento Senior Homes 40
Sankofa House 10
Savo Island Cooperative Homes 57
Shattuck Senior Homes 27
U A Housing Cooperative Homes 47
U A Housing/U.C. Hotel/U.A. Homes 74
University Lofts 29
University Neighborhood Apartments 27
William Byron Rumford Plaza 43
TOTAL 1,188
Source: City of Berkeley Health, Housing & Community Services Department
The Housing Trust Fund guidelines, which were revised in early 2009, require that at least 60%
of all units in an eligible housing project must have rents as follows:
Not less than 40% of all units must be affordable to households whose income does not
exceed 60% of Area Median Income (AMI); and
Not less than 20% of all units must be affordable to households whose income does not
exceed 30% of AMI.
Rents on the remaining 40% of the units may be set at market rate.
The City of Berkeley will give preference to projects that address chronic homelessness
and/or housing for extremely low-income households, or households whose income
does not exceed 30% AMI as described above.
Monitoring
When a property receives a Housing Trust Fund loan, a regulatory agreement requiring 55
years of affordability is recorded on the property. The City must monitor the developments to
ensure they are meeting the regulatory requirements and loan terms. Currently, the City’s
monitoring portfolio includes 1,188 units.
Accomplishments
The accomplishments of the HTF program are discussed in detail under “Funding History”
above.
Looking Ahead
The City anticipates continued use of the Housing Trust Fund and the use of Notices of Funding
Available (NOFAs) in subsequent years. The types of projects funded (rehabilitation and
preservation versus new construction), are based on funding that is available to affordable
housing developers and the feasibility of potential projects. State and federal funding for
affordable housing construction has been substantially less available since 2009, compared to
the preceding period, which explains why HTF monies have been used to support rehabilitation
programs recently. The types of projects funded in the future will be based on the type of
funding that is available to affordable housing developers.

2015-2023 Berkeley Housing Element 6 - Housing Programs and Quantified Objectives
163
Implementation Steps
Pool monies from different sources to help develop and preserve long-term below-
market-rate housing for low, very low, and extremely low-income.
Provide loans and grants to qualified developers, public entities, groups, and individuals
to undertake activities which create, maintain, or expand the City's affordable housing
stock.
Timeframe
Ongoing
Responsible Agency
City of Berkeley Health, Housing & Community Services Department
Funding Sources
HUD Home
General Fund/Berkeley Capital Improvement Fund
HUD Community Development Block Group (CDBG)
California HELP
Housing Mitigation Fees
California Housing Trust Fund
Inclusionary & Condominium Conversion Fees
Inclusionary Housing Ordinance and State Density Bonus Law Implementation
Inclusionary housing was originally adopted as City policy as part of the Neighborhood
Preservation Ordinance in 1973. The inclusionary housing requirements (“Inclusionary
Ordinance”) are codified in Chapter 23C.12 of the zoning ordinance, which took effect in
February 1987. In 2009, the Palmer/Sixth Street Properties vs. City of Los Angeles court ruling
found that inclusionary housing requirements on rental developments violate the Costa-Hawkins
Rental Act of 1995, thereby invalidating the City’s inclusionary requirements for rental housing.
To meet the City’s RHNA obligation, Council adopted an Affordable Housing Mitigation Fee on
new market-rate rental units (Ordinance 7,192-N.S.) on June 28, 2011. The fee was established
by an impact fee nexus study, which quantified the need for affordable housing created by the
development of new market rate rental housing.
In response to current market conditions and the 2013 the Sterling Park, L.P. v. City of Palo Alto
ruling, the City is currently updating the nexus study to include potential Hs for ownership
housing.

2015-2023 Berkeley Housing Element 6 - Housing Programs and Quantified Objectives
164
Provisions of the Affordable Housing Mitigation Fee for Rental Housing
The affordable housing impact fee (Fee) is deposited in the City’s Housing Trust Fund. The fee
applies to new rental housing projects of 5 or more dwelling units.4,5 An applicant for a
development project that is subject to the Fee may elect to avoid the Fee by providing, for the
life of the project, a number of units equal to 10% of the market rate units in the project at rental
rates affordable to Very Low- Income Households. An applicant may provide less than 10% of
market rate units as Very Low-Income Units and pay a proportionately reduced Fee at a rate of
[(A-B) x Fee] – [(B/((A-B) x 10%)) x ((A-B) x Fee)] where A = Total number of units in the project
and B= Number of Very-Low Income Units provided in the project.
Provisions of the Inclusionary Ordinance
Currently, the Inclusionary Ordinance is applicable to ownership housing projects of 5 or more
dwelling units and when a lot is zoned to allow five or more units, even if only 1 to 4 units are
proposed.6 The main requirements for inclusionary units are summarized below:
Twenty percent of the units are required to be Inclusionary Units.
Inclusionary Ownership Units are required to be affordable to a household whose
income is no more than 80% of the area median income and are subject to resale
restrictions indefinitely.
o In-lieu fees are permitted in place of the Inclusionary Units in ownership
(condominium) projects. The fees go into the Housing Trust Fund (HTF), which
funds affordable housing projects.
Limited Equity Cooperatives are required to include at least 51% of their units as
Inclusionary Units.
o Units in Limited Equity Cooperatives shall be sold or rented to Households
whose gross incomes do not exceed 120% of median income.
Inclusionary Units must be “reasonably dispersed throughout the project, be of the
same size and contain, on average, the same number of bedrooms as the non-
Inclusionary Units in the project; and be comparable with the design or use of non-
inclusionary units in terms of appearance, materials and finish quality.”
Determining and Implementing Affordable Rates.
To determine affordable rental rates and sale prices, the appropriate household size standards
used for the federal Section 8 Program are used. Rental rates and sales prices are also
adjusted based on the size of the unit. A unit is considered affordable if the cost does not
4 For group living accommodations the equivalency rate is one new rental unit per two bedrooms, such
that one-half the adopted fee shall be imposed on each bedroom.
5 The following projects are exempt from the fee: cooperative student housing developed by the Berkeley
Student Cooperative; units built to replace units destroyed through no fault of the applicant, provided the
applicant files a complete permit application within two years; and rehabilitated rental units unless they
have been vacant more than two years before the applicant files a complete permit application;
6 It does not apply to Dormitories, Fraternity and Sorority Houses, Boarding Houses, Residential Hotels, or live/work
units.

2015-2023 Berkeley Housing Element 6 - Housing Programs and Quantified Objectives
165
exceed 30% of a household’s gross income. The process for determining affordable rent and
sales prices is addressed by City Council Resolution No. 61,497-N.S., adopted in 2002.
Below-market-rate (BMR) rental property owners and buyers of BMR condominiums are
required to execute contracts committing them to abide by the requirements of the Inclusionary
Ordinance. These contracts, called Regulatory Agreements, are negotiated and executed with
property owners prior to the close of escrow on sale units, and prior to occupancy in the case of
rentals, and placed in the Alameda County property records as deed restrictions.
Income verification by the BMR unit occupant must be provided prior to occupancy of the unit.
Buyers of sale units must qualify prior to seeking a loan to purchase the property, with
documentation required by the City prior to the close of escrow, the same time at which the
buyer executes the regulatory agreement with the City. The regulatory agreement is then
recorded on the title deed, where future title searches (e.g., for new buyers of the property in the
future) will disclose the BMR requirements attached to the property.
Implementation State Density Bonus Law and the Inclusionary Ordinance
The State Density Bonus Law (Government Code Section 65915) requires local governments to
grant “density bonuses” to projects that provide specified percentage of below-market-rate units.
The greater the affordability level and the larger the percentage of affordable units in a project,
the higher the density bonus awarded, up to a maximum of 35%. Affordable units that make a
project eligible for density bonus units are required to remain affordable for 30 years under state
law.
The law defines a “density bonus” as “a density increase over the otherwise maximum allowable
residential density as of the date of application…” (§ 65915(f)). “Maximum allowable residential
density” in turn, means “the density allowed under the zoning ordinance and land use element
of the general plan, or if a range of density is permitted, means the maximum allowable density
for the specific zoning range and land use element of the general plan applicable to the project”
(§ 65915(o)(2)).
Thus, in order to calculate the density bonus in any given case, it is necessary to start with the
“maximum allowable residential density”.
In Berkeley, most new multi-family housing projects are located in zoning districts that do not
have density standards that are applied on a parcel by parcel basis.7 Therefore, over the years,
the Planning Department has developed and refined procedures for deriving the “maximum
allowable density” for any density bonus projects. The basic approach is as follows:
7 Although the City’s General Plan includes land use classifications with density ranges, the Plan states
that these classifications “are not intended to be used as standards to determine the maximum allowable
density on a specific parcel.” (2002 General Plan, page LU-23)

2015-2023 Berkeley Housing Element 6 - Housing Programs and Quantified Objectives
166
Step 1: Calculate the “base project,” i.e., the largest project allowed on the project site
that is fully consistent8 with the lot development, parking and open space standards in
the Zoning Ordinance, using the average unit size and other basic characteristics of the
proposed project.
Step 2: Calculate the density bonus based on the number of below market rate (BMR)
units in the proposed project and the size of the base project (i.e., the percentage of
below market rate units in the base project).
Step 3: If concessions/incentives are requested, determine whether these are
necessary to provide for the project’s affordable housing costs.
Step 4: Waive or reduce development standards as needed to accommodate the
project, with the density bonus and concessions.
Projects that incorporate BMR units at the Very Low Income level may qualify for a density
bonus, as well as a reduction of the Affordable Housing Mitigation Fee.9
Accomplishments
Between 2009 and July 31, 2014, the City issued building permits for 9 projects that included
dedicated BMR units. These nine projects represent a total of 533 units, including 37 Low
Income (>50% - 80% AMI) and 48 Very Low Income (<50% AMI) units. Five of these projects
included a density bonus.
During this time frame, the City entitled nine additional projects (building permit issuance
pending), that represent a total of 828 units, 87 of which are dedicated as Very Low Income.
Five of these projects include density bonus units.
The City of Berkeley reduced administrative complexities associated with State Density Bonus
Law by developing procedures for determining the density bonus award. Over a roughly 20
month period, the City met with the Joint Subcommittee on Density Bonus and the Planning
Commission. The City developed procedures for implementation of density bonus and
considered but did not adopt amendments to the zoning ordinance related to implementation of
density bonus law. The procedures have provided consistency in the application of density
bonus law providing applicants, decision makers and the public a better understanding of the
provisions of both state and local law. The time required to review density bonus projects has
been reduced.
Looking Ahead
In the upcoming year (2015), the City will complete the updated nexus study for an affordable
housing fee for construction of both rental and ownership units. The City will consider revisions
to the Inclusionary Ordinance in light of issues resulting from recent legal cases.
8 Many such standards can be modified with an AUP or Use Permit. The “base project” assumes no such
modifications.
9 The Fee applies to all market rate units inclusive of the density bonus.

2015-2023 Berkeley Housing Element 6 - Housing Programs and Quantified Objectives
167
In particular, the City will revise the Density Bonus Ordinance (BMC §23C.12.050) to reflect
current State law and codify the administrative procedures the City has used to implement the
Law.
Implementation Steps
Amend the Inclusionary Ordinance as necessary to meet the current requirements of
State law and to address legal limitations on inclusionary rental units and to maintain
permanently affordable housing units.
As discussed under the program Preserving Units at-risk of Conversion to Market Rate,
staff shall compile and maintain a list of all below-market-rate units as a resource of
potential tenants seeking affordable housing. This list should include units funded
through the HTF, the addition of new income-restricted units created in-lieu of the
affordable housing mitigation fee or through the State density bonus program, and other
state programs.
Timeframe
Spring 2015
Responsible Agency
City of Berkeley Planning Department
City of Berkeley Health, Housing & Community Services Department
Funding Sources
General Fund
Lead Poisoning Prevention Program
Lead in household products can pose serious health hazards to humans, and is more toxic to
babies and children. While lead-based paint was banned in 1978 by the U.S. Consumer
Product Safety Commission (CPSC), it is still a significant problem in cities where the housing
stock is relatively old and built before the ban. In Berkeley, almost 92 percent of the housing
stock was built before 1979.
In 1991, the Alameda Board of Supervisors passed a resolution officially establishing the
Alameda County Lead Poisoning Prevention Program (ACLPPP) aimed at preventing childhood
lead poisoning and other health-related environmental problems. The resolution allowed cities
in the County to participate in and support the Program by assessing an annual $10 fee on all
residential dwellings constructed before 1978. The Cities of Berkeley, Oakland, and Alameda
were the first to participate in the program and the City of Emeryville joined in 1992. The
program is governed by the Joint Powers Authority (JPA) which is composed of elected officials
from each participating city and a community representative.
The City of Berkeley Public Health Division and the Alameda County Healthy Homes
Department will work together to increase awareness and knowledge about lead poisoning
prevention in Berkeley including providing lead-safe painting classes, in-home consultations, ,

2015-2023 Berkeley Housing Element 6 - Housing Programs and Quantified Objectives
168
presentations, educational materials, and other services. Rebuilding Together will work with the
City of Berkeley and Alameda County Healthy Homes Department to increase awareness of
lead issues among their clients and volunteers and to incorporate lead safe work practices into
their activities.
The City of Berkeley Childhood Lead Poisoning Prevention Program collaborates with the
Berkeley Health, Housing & Community Services Department’s State lead-certified Risk
Assessor/Inspector, Project Designer, and Project Monitor. The Alameda County Healthy
Homes Department also has a HUD Lead Hazard Control grant to remediate lead hazards in
approximately 6 qualifying Berkeley housing units that are vacant, or occupied by a low-income
household with either a child under 6, a pregnant woman, or a child under 6 years who regularly
visits during the 2014-15 year. Berkeley’s program also provides case management services to
families with children who have elevated blood lead levels. Services range from Public Health
Nursing case management for children with blood lead levels above 15 µg/dL to health
education for children with levels between 5-14 µg/dL.
Accomplishments
From 2010 - 2011, a total of 9 cases of children with BLL above 10 μg/dL have been
managed.
From 2010 - 2011, heath education for children with BLL below 10 μg/dL has been
provided for a total of 1,903 cases.
From 2008 – 2014, a total of 58 lead poisoning prevention presentations have been
made to 785 parents, childcare providers, and teachers
From July 2008 through June 2014, 230 units in Berkeley have received In-Home
Consultations from the Alameda County Healthy Home Department
From 2009 – 2014, 16 units have been remediated via the Alameda County Healthy
Homes Department HUD Lead Hazard Control grant
From 2008 – 2014, The City of Berkeley Childhood Lead Poisoning Prevention Program
has provided health education and outreach at 85 community events, reaching 7,047
individuals
Looking Ahead
The City plans to continue participation in ACLPPP towards preventing childhood lead poisoning
and other health-related environmental problems.
Implementation Steps
Continue to fund services for prevention of childhood lead poisoning and other health-
related environmental problems.
Timeframe
Ongoing
Responsible Agency
City of Berkeley Health, Housing & Community Services Department
City of Berkeley Public Health Division
2015-2023 Berkeley Housing Element 6 - Housing Programs and Quantified Objectives
169
Funding Sources
General Fund
Mitigating Governmental Constraints
As discussed in Chapter 4, governmental constraints can come from different sources. Two
main sources of potential constraints in Berkeley are land use controls and the discretionary
permit review process. The City has granted land use entitlements for close to 3,500 housing
units since 1999. The City believes this track record demonstrates that land use controls and
the review process do not pose a significant constraint on the development of new housing. This
success is based in part on procedures the City has developed to improve the permit review
process. These procedures are described below under “Accomplishments,” and are intended to
provide clear direction to project applicants and speed up the application process. By
implementing these procedures the City can mitigate some of the uncertainty created by the
discretionary approval process.
Policy H-34 commits the City to “ensure that potential governmental constraints are identified
and mitigated.” In addition to improving the permit review process, the City is committed to
identifying obstacles in City regulations that may impede development of new housing in
residential districts.
Accomplishments
To provide early feedback to applicants, the City implemented the following changes.
o Applicants are required to meet with neighbors prior to submittal of a use permit
application for projects in residential districts and large-scale development
projects located in commercial districts. This early consultation helps the
applicant by providing an opportunity to air issues and minimize future conflict.
o Applicants are required to post a yellow informational sign in front of the project
location prior to submitting their application. The sign must be maintained
throughout the project review process and must include basic project facts, public
meeting dates, major decisions, and contact information.
o Pre-application meetings with staff are available.
o The City offers applicants “pre-application review”, an opportunity to present their
project to the ZAB informally prior to submittal of an application. This preview
process provides valuable feedback to applicants directly from the ZAB and
allows them to adjust projects prior to submittal.
o City staff hold a “roundtable” meeting with various departments that make
recommendations on applications. Various City departments identify issues and
address code compliance early in the design process. This also provides
improved coordination and communication between the departments. The
Planning Department recently began inviting applicants to the meetings, which
has also improved identification of issues and communication.
To provide faster processing of Administrative Use Permits and Use Permits, an
applicant can pay for a consultant or staff overtime and receive expedited processing.

2015-2023 Berkeley Housing Element 6 - Housing Programs and Quantified Objectives
170
This allows staff resources to be allocated fairly while also providing an opportunity for
faster review.
To improve communication and provide clear, consistent information to applicants, the
City took the following steps.
o Planning Department staff undertook extensive public outreach between 2005
and 2008. In particular, presentations were made to three working groups:
remodeling contractors, developers, and commercial leasing agents and realtors.
Detailed information and flow charts of the zoning and building permit process
were provided in binders for attendees.
o The Planning Department’s website was improved and now includes more
detailed information about the permit process, forms, and pending applications.
o Applicants are encouraged to request zoning research letters to get definitive
answers to complex questions; this provides better information than can be
received over-the-counter.
The Planning Department developed density bonus guidelines to assist with the
determination of the “base project” for the purpose of computing a project’s density
bonus award. This allows more transparency in the process, which helps both the
public and the applicants better understand the City’s analysis and outcomes. The
density bonus procedures are described in more detail under Inclusionary Housing
Ordinance and State Density Bonus Law Implementation.
As discussed under the Second Units (Accessory Dwelling Units) program, the City
recently developed and considered a range of zoning modifications to facilitate
Accessory Dwelling Units.
The Planning Department has experienced an increase in the number of applications
for small infill projects in the past few years relative to the past decade. This is likely a
result of increased housing prices making such projects economically viable. Planning
staff are tracking issues that may present obstacles to small infill projects that arise at
the zoning counter. The City Council referred to the Planning Commission
reconsideration of the R-1A zoning standards, in part due to concern of too much
density. Planning staff will evaluate this referral and other issues related to infill with the
Planning Commission and advise an approach that balances neighborhood character
with the goal of new housing.
Looking Ahead
The Planning Department will continue to improve public outreach and project expediting
programs. In addition, the City will identify and mitigate regulatory constraints to residential infill
development. The Second Units (Accessory Dwelling Units) program, described in this chapter,
commits the City to researching obstacles to by-right second units. The Planning Department
will also research what obstacles may prevent other types of residential infill, such as building
separation requirements, setback requirements, lot coverage, and parking standards. Finally,
as discussed in the Chapter 4 of this Element, the Planning Department will continue to provide
pre-application review in order to facilitate more streamlined public review, conduct “roundtable”
meetings with all relevant departments to vet issues with the project early in the process, and
will add project planning staff in order to enable faster permit processing.

2015-2023 Berkeley Housing Element 6 - Housing Programs and Quantified Objectives
171
Implementation Steps
Processing and Permit Procedures:
Continue to require applicants to conduct neighbor consultation and install a “pre-
application” poster to ensure communication between neighbors and applicants.
Continue to provide pre-application consultation to applicants to give advice on design
and the review process and offer project “preview” at the ZAB.
Continue to conduct inter-departmental “roundtable” meetings to identify issues with
building design early in the review process.
Continue to offer expedited project services.
Continue education efforts with the development community about Berkeley’s standards
and review processes, such as green building standards, building permits, and use
permits.
Continue to improve access to building and zoning permit information on the web.
Continue to administer design review concurrently with the land use and building permit
entitlement processes.
Continue to notify the LPC of all pending projects and applications to demolish a
structure located in a non-residential district that is more than 40 years old in order to
identify potential historical resources early in the review process for new residential
development.
Continue periodic training of the LPC in historical resource designation, preservation and
permit processing.
Continue to prioritize the hiring of staff to the LPC with significant background in historic
resources.
Regulatory Changes:
Identify potential constraints to existing infill opportunities in residential districts,
consistent with existing residential densities, by reviewing existing development
standards and tracking zoning inquiries related to residential infill. Work with the
Planning Commission to develop possible modifications to standards in order to remove
obstacles to residential infill development. (Ongoing)
Consider developing area-specific design guidelines to provide better direction to
applicants, including the Adeline Corridor and South Shattuck areas. (Timeframe –
January 2015 to December 2017)
Identify barriers to the development of new condominium units and consider ways to
increase the construction of for-sale units as a source of housing affordable to moderate-
income households.
Timeframe
Processing and Permit Procedures - Ongoing
Zoning Changes - Five years
Responsible agency
City of Berkeley Planning Department

2015-2023 Berkeley Housing Element 6 - Housing Programs and Quantified Objectives
172
Funding sources
General Fund
Mortgage Credit Certificate Program
The City of Berkeley participates in the Mortgage Credit Certificate Program (MCC),
administered by Alameda County, to support homeownership in Berkeley. The City of Berkeley
pays the County an administrative fee annually for the County’s operation of the program. MCC
is a federal income tax credit that provides qualified low-income homebuyers a tax credit worth
up to 15 percent of their annual mortgage interest paid on their home loan. MCC recipients
adjust their federal income tax withholding, which increases their take-home pay, making
monthly mortgage payments more affordable.
To qualify, homebuyers cannot have owned a principal residence within the last three years.
Use of the MCC can enable a first-time homebuyer to qualify for a mortgage more easily, since
mortgage interest is rebated to the MCC holder through filing of a federal income tax return.
The MCC can be used for up to 15 years. An MCC may be used to purchase new or existing
single-family detached homes, mobile homes, condominiums, townhouses, or duplexes.
Properties of 3 or more units are not eligible for MCC-assisted mortgages. The assisted owner
must live in the house being purchased with help from MCC.
Accomplishments
The City continued to participate in the Alameda County Mortgage Credit Certificate program in
PY 2013. In PY 2013, however, no Berkeley residents purchased a home using the MCC
Program. One past Berkeley MCC homebuyer refinanced a home, which required reissuance of
their certificates (RMCC).
Looking Ahead
The MCC provides a valuable resource for the first time homebuyers who do participate,
particularly relative to the public cost of providing the program. The City plans to continue
participation.
Implementation Steps
Continue participation in the MCC program to assist lower income first time
homebuyers.
Timeframe
Ongoing
Responsible agency:
City of Berkeley Health, Housing & Community Services Department
Alameda Housing and Community Development
Funding Sources
General Fund

2015-2023 Berkeley Housing Element 6 - Housing Programs and Quantified Objectives
173
Permit Fee Deferrals for Affordable Housing
Ordinance 5892-N.S. (Chapter 19.62 of the Berkeley Municipal Code) was adopted in 1988
authorizing the City Manager to waive or defer payment of permit fees, and to expedite or
prioritize the processing for any permit for any housing project in which at least 25 percent of its
units are affordable to low- or moderate-income households provided that affordability is
guaranteed by a regulatory or loan agreement. Permit fees that may be deferred or waived
include, but are not limited to, zoning, building, plumbing, and electrical permits.
Low-income households are defined in the ordinance as households with incomes at or below
80 percent of the area median income (AMI.10 Moderate-income households are defined as
households with incomes at or below 120 percent of AMI.
Although the City ordinance states that fees can either be waived or deferred, the City Council
adopted a policy in 2000 providing that fee waivers would only be granted when substitute
funding was authorized by the Council. This policy recognizes that building permit fee revenue
to the Permit Service Fund is needed to continue to provide the services that the Fund supports
and that such costs should not be shifted to other projects. Fees can be deferred until building
permit issuance or certificate of occupancy, depending on the needs of the applicant.
Accomplishments
Since 2009, the City has deferred $288,000 in permit fees for 3 residential projects).
Harmon Garden – 3240 Sacramento: Deferral of $143,000 in 2010 for construction of
transitional youth housing;
UA Homes – 1040 University Avenue: Deferral of $100,000 in 2012 for construction of a
74-unit single-resident occupancy building;
Strawberry Creek Lodge – 1320 Addison Street: Deferral of $45,000 for renovation of an
existing 150-7unit affordable senior housing complex
Looking Ahead
The City will continue to provide fee deferrals for affordable housing projects in accordance with
the Berkeley Municipal Code and Council policy.
Implementation Steps
Promote affordable housing by allowing fee deferrals for affordable housing projects.
Timeframe
Ongoing
Responsible Agency
City of Berkeley Planning Department
10 The 2014 AMI for a family of four in Alameda County is $93,500. California Department of Housing and
Community Development: http://www.hcd.ca.gov/hpd/hrc/rep/state/incNote.html

2015-2023 Berkeley Housing Element 6 - Housing Programs and Quantified Objectives
174
Funding Sources
General Fund
Preserving Restricted Units at Risk of Conversion to Market Rate
California Government Code requires that localities identify and develop a program in their
housing elements for the preservation of assisted, affordable multifamily units. In the
preservation analysis, localities are required to provide an inventory of assisted, affordable units
that are eligible to convert within the next 10 years. As part of the analysis, an estimation of the
cost of preserving versus replacing units is to be included.
Over the past several decades, thousands of privately owned affordable rental housing have
units been constructed across the state with financing (both loans and grants) from federal,
state, and local sources, accompanied by rent affordability and occupancy restrictions that last
generally from 30 to 55 years from the time the project is built. In general, once the period of
restricted rent/occupancy expires, a property owner may charge market rents for the previously
restricted units. There is a risk that low-income occupants may have to find alternative housing if
rents rise to market levels.
State legislation requires an analysis of and programs for preserving assisted housing
developments eligible to change from low-income housing uses over the next ten-year period
due to the termination of subsidy contracts, mortgage prepayments, or the expiration of
restrictions on use. Government Code Section 65583 (a)(9)identifies “assisted housing” required
in this analysis as multifamily rental housing developments that receive governmental
assistance under certain federal programs, state and local revenue bond programs, local
redevelopment agency funding, federal CDBG funding, local in-lieu fees or housing trust fund
money, and also units built pursuant to a local inclusionary ordinance or to qualify for a density
bonus. Some local projects combine multiple sources of funding in addition to qualifying for a
density bonus.
Inventory of Restricted Units Potentially at Risk of Conversion to Market Rate, 2014-2024
The following table includes affordable housing developments in Berkeley that have subsidies or
restrictions expiring in the next ten years and may be at risk for converting to market rate. All of
the developments listed have project-based subsidies from the US Department of Housing and
Urban Development that are currently renewable on an annual basis and do not have other
known restrictions recorded on the property which would prevent conversion to market rate.
These vouchers allow the owner to collect HUD’s Fair Market Rent, and restrict occupancy to
lower income residents and assure that the resident will only be responsible for that portion of
the rent equal to 30 percent of their income.
Because these vouchers are contingent on annual appropriations from the federal government,
the vouchers must be annually renewed. Much of the affordability of these older properties is
linked directly to the voucher subsidy, and so technically, the units are constantly “at risk.” Over

2015-2023 Berkeley Housing Element 6 - Housing Programs and Quantified Objectives
175
time, data and experience have shown that many owners continue to renew their contracts
beyond the original expiration date, providing evidence that the link between affordability
expiration date and conversion is not inevitable.
In particular, five of the properties on the table below, with 318 restricted units, are owned by
organizations with a primary mission of providing affordable housing, and are therefore
considered to be at lower risk. One property without other known restrictions is considered to
be at higher risk. However, all properties would be at risk in the event of federal policy changes
that reduced or eliminated Section 8 subsidies for these properties.
Table 6-22: Units in Projects at Risk of Conversion to Market Rate
Housing, 2014-2024
Development Name
and Address
Total
Units
Restricted
Units Owner Subsidy sources
Units at Lower Risk of Conversion
Bonita House
1910-1912 Hearst St. 2 2 Bonita House Inc 202
Lawrence Moore Manor
1909 Cedar St. 46 46
Satellite Affordable
Housing Associates 236(J)(1) and 202
Redwood Gardens
2951 Derby Street 169 169
Cooperative Services
Inc. 202
Savo Island Cooperative Homes
2017 Stuart Street 57 57 Savo Island Corp. 213
Stuart Pratt Manor
2020 Durant Ave. 44 44
Satellite Affordable
Housing Associates 202
Subtotal, Lower Risk 318 318
Units at Higher Risk of Conversion
Rosewood Manor
1615 Russell Street 36 36
South Berkeley
Neighborhood
Development Corp.
221(D)(3) with
Section 8
Subtotal, Higher Risk 36 36
Total, All Units at Risk 354 354
Source: City of Berkeley Health, Housing & Community Services Department
Note: All projects listed above have a HUD Section 8 Housing Assistance Payment (HAP) operating subsidy. Through contracts that start on a longer term (10 to 20 years) then go to annual renewals, HUD pays the different between a qualified tenant’s affordable rent and a contract rent level. Section 202 is a HUD program that pays for capital costs and provides for the HAP in developments for seniors (62+). Section 213 and 221(d)(3) are HUD mortgage insurance programs for cooperatives and multifamily housing, respectively. Section 236 subsidizes mortgage interest.

2015-2023 Berkeley Housing Element 6 - Housing Programs and Quantified Objectives
176
Below is more information about the properties listed on the table above:
Table 6-23: Properties at Risk of Converting to Market Rate by Total
Units and Restricted Units, 2014-2024
Property Total Units
Restricted/
Subsidized
Units
Elderly Disabled
Bonita House 2 2 0 2
Lawrence Moore Manor 46 46 46 0
Savo Island Homes 57 57 10 0
Stuart Pratt Manor 44 44 44 0
Redwood Gardens 169 169 169 18
Rosewood Manor 36 36 0 0
Total 354 354 269 20
Source: City of Berkeley Health, Housing & Community Services Department
Table 6-24: Properties at Risk of Converting to Market Rate by Size of
Units, 2014-2024 Property Studio 1-BR 2-BR 3-BR 4-BR
Bonita House 0 0 0 2 0
Lawrence Moore Manor 37 9 0 0 0
Savo Island Homes 0 0 8 22 27
Stuart Pratt Manor 28 16 0 0 0
Redwood Gardens 42 109 0 0 0
Rosewood Manor 0 6 22 8 0
Total 107 140 30 32 27
Source: City of Berkeley Health, Housing, & Community Services Department
Restricted Units Considered at Higher Risk of Converting to Market Rate
The property considered to be at higher risk of converting to market rate is Rosewood Manor,
located at 1615 Russell Street in Berkeley. According to the City’s records, it is owned by the
South Berkeley Neighborhood Development Corporation and has 36 units. It was formerly
known as the Melrose Apartments and built in 1972. When the former owner defaulted on his
Section 221(d)(3) loan, the South Berkeley Neighborhood Development Corporation worked
with tenants in cooperation with the City to acquire and rehabilitate the property, taking
ownership in 1993. The South Berkeley Neighborhood Development Corporation is a nonprofit
organization founded in 1987 as the result of a community planning process. The organization
owns and manages two residential properties: this one and Lorin Station. Rosewood Manor was
developed using HUD’s Section 221(d)(3) mortgage insurance program and has an annual
operating subsidy, a Section 8 Housing Assistance Payment. There are no other known sources
of financing in the development which restrict its affordability. Therefore the development relies
on the Section 8 Housing Assistance Payment to make it affordable. The Housing Assistance
Payment is renewable from year to year, and therefore the owner could choose to end the
contract at any time. Due to the annual renewals, this property is considered to be at higher risk

2015-2023 Berkeley Housing Element 6 - Housing Programs and Quantified Objectives
177
of conversion to market rate, although at this point the City has no indication the owner intends
to convert the property to market rate.
In the event that South Berkeley Neighborhood Development Corporation indicated an interest
in selling the property or converting it to market rate, the City would seek to identify a qualified
nonprofit that could acquire the property and keep it as an affordable development. Potential
organizations and sources of funding for the acquisition appear later in this section. The City
would work with a nonprofit developer in assembling financing for the preservation of this
development.
Restricted Units Not Considered at Risk of Converting to Market Rate
There are other properties in Berkeley with subsidies currently renewing on an annual basis and
with Low Income Housing Tax Credit use restrictions that have expired or are expiring.
However, all have other regulatory restrictions that maintain affordability for at least the next 10
years if not longer. Since the Berkeley Housing Trust Fund (HTF) was created in 1990,
development projects receiving a commitment of local funds have been required to record a
regulatory agreement with a 55-year affordability period. Similarly, some properties have
recorded restrictions associated with Berkeley Redevelopment Agency (BRA) funding.
The first property considered to be at lower risk of conversion is Bonita House’s Bonita Grove
development, located at 1910-1912 Hearst Street. The property has 2 units, but houses more
individuals since it is operated as congregate housing. This property was developed early in the
history of the Section 202 program, and includes an annual operating Housing Assistance
Payment. The owner and operator is Bonita House, Inc., (BHI), a private non-profit mental
health agency offering a range of services for adults diagnosed with co-occurring serious
psychiatric disabilities and substance use disorders, including intensive residential treatment,
supported independent living programs, housing and supported employment, outpatient case
management and clinic services. Bonita House has received state and federal recognition for its
exemplary work with people with co-occurring disorders and has demonstrated a strong
commitment to housing for this population. Although the property has relied on annual renewals
of the Housing Assistance Payment since 2003 and does not have other known recorded
restrictions on the property, Bonita House’s ownership puts this property at lower risk of
conversion.
The second property considered to be at lower risk of conversion is the Lawrence Moore
Manor, located at 1909 Cedar Street. It has 46 units of affordable housing for seniors. It was
developed by Satellite Housing Associates in 1972 using HUD’s Section 236(J)(1) program, a
mortgage insurance program, as well as the Section 202 program, which provides capital
funding and an operating subsidy, the Housing Assistance Payment. In 2013, Satellite Housing
and Affordable Housing Associates (AHA) combined to become SAHA. Satellite Housing was
established in 1966 and AHA was established in 1993 and together they have at least 51
properties in its portfolio. The property is still owned by SAHA, one of the most active nonprofit
housing development and management organizations in Berkeley. The organization’s mission is
to provide affordable, service-enriched housing that promotes healthy and dignified living for
people with limited options. Although the property has relied on annual renewals of the Housing

2015-2023 Berkeley Housing Element 6 - Housing Programs and Quantified Objectives
178
Assistance Payment since 1991 and does not have other known recorded use restrictions,
SAHA’s ownership puts this property at lower risk of conversion.
The third property considered to be at lower risk of converting to market rate is Redwood
Gardens, located at 2951 Derby Street in Berkeley. The owner, Cooperative Services Inc.-
Derby St. Non Profit Housing (CSI), built the property in 1986. CSI is a nationwide
resident/member controlled organization that utilizes a cooperative management system. The
property has 169 units for seniors, including 18 units for seniors with disabilities. It was
developed using Section 202 financing, a HUD program for senior housing, and related to that
has an annual operating subsidy, a Section 8 Housing Assistance Payment. There are no other
known sources of financing in the development which restrict its affordability. Therefore the
development relies on the Section 8 Housing Assistance Payment to make it affordable. The
Housing Assistance Payment has been renewable from year to year since 2006, and therefore
the owner could choose to end the contract at any time. Due to the property’s ownership
structure, conversion to market rate would need to be initiated by the residents. Because
conversion would increase each resident’s housing costs, it is unlikely that they will seek
conversion to market rate; therefore, this property is considered to be at lower risk.
The fourth property considered to be at lower risk of conversion is Savo Island Cooperative
Homes located at 2017 Stuart Street. Savo Island Cooperative Homes is a limited equity
cooperative and consists of 57 units spread over Ward, Stuart, Milvia, and Adeline Streets. The
project provides 2-, 3-, and 4-bedroom units of family housing. Ten of these are reserved for
seniors. The Cooperative dates to 1980 and was developed using HUD’s Section 213 mortgage
insurance program and a Section 8 Housing Assistance Payment (HAP) operating contract.
The HAP contract has been in annual renewals since 1994. The property does not have other
known use restrictions recorded on the property. Since the property is a limited equity
cooperative, conversion to market rate would need to be initiated by the residents. Because
conversion would increase each resident’s housing costs, it is unlikely that they will seek
conversion to market rate; therefore, this property is considered to be at lower risk.
The fifth property considered to be at lower risk is the Stuart Pratt Manor, located at 2020
Durant Street. Stuart Pratt Manor includes 44 studio and one-bedroom apartment units of
affordable housing for seniors. It was built in 1969 using the Section 202 program, which
provided capital funding as well as an annual operating Housing Assistance Payment. The
property is owned by SAHA, a nonprofit housing development and management organizations
in Berkeley. Although the property currently relies on annual renewals of the Housing
Assistance Payment, SAHA’s participation puts this property at lower risk of conversion.
Other Units That Were Previously at Risk but Are Not Considered At Risk, 2014-2024
In the 2001 Housing Element, the City included all developments with project-based Section 8
contracts and tax credit restrictions that were expiring soon or had expired as at-risk projects. In
the 2009 Housing Element, developments that have other documented use restrictions which
limit the affordability or occupancy based on income that last past 2019 were excluded. Below is
an updated list of properties where owners may choose to end their operating subsidy contracts
before 2024 but the use of the property will still be restricted and cannot convert to market rate:

2015-2023 Berkeley Housing Element 6 - Housing Programs and Quantified Objectives
179
Allston House is located at 2121 Seventh Street. Since the 2001 Housing Element, this
property was acquired by Satellite Affordable Housing Associates (SAHA) using the City’s
Housing Trust Fund, and preserved as affordable housing. The former owner of this property,
Ronald Hulme, filed a notice to prepay with HUD September 26, 1996, and then prepaid his
HUD mortgage on February 12, 1997. In 2002, the owner elected to opt out of the program in
order to bring rents up to market and maximize the resale value of the property. Recognizing
that an important supply of affordable housing was at-risk of conversion, SAHA took measures
to preserve the affordability of the units and entered into a five-year master lease agreement
with purchase option to prevent the property from being sold to a for profit property
manager/owner. In 2004, the City provided SAHA a HELP loan to acquire the property and in
2006, the City provided a Housing Trust Fund loan to help fund improvements that were
completed in February 2007. With the Housing Trust Fund, a 55-year regulatory agreement
restricting the use to affordable housing was recorded on the property. Use restrictions will
continue until 2064.
Amistad House, 2050 Delaware Street, was built in 1981 and provides 60 below market rate
studio units for seniors. It is subsidized by both Section 202 assistance for senior housing and
Section 8 rental assistance, which went to annual renewals starting in 2001. The current owner,
the Berkeley Pilgrimage Foundation (BPF), decided it wanted to dispose of the property but was
committed to keeping it affordable. In 2007, Satellite Affordable Housing Associates (SAHA), a
nonprofit affordable housing developer and manager based in Berkeley, was selected by BPF in
a Request for Qualifications process to purchase and manage the building. The City has made
a commitment of Community Development Block Grant funds for rehabilitating the property
which will carry a 55-year regulatory agreement that is expected to be executed this year and
would expire in 2064, therefore the property is not at risk of converting to market rate from 2014
through 2024.
Delaware Street Historic District is a mixed use project built in 1988 at 1800 Sixth Street. The
property includes eight rental units for people with disabilities and their families that are
subsidized by a Section 8 Housing Assistance Payment that originally expired in 2003 and has
been in annual renewals since then. These eight units were included on the at-risk list in the
2001 Housing Element. The development also includes 19 market-rate condominiums and 12
commercial condominiums. In addition to the Housing Assistance Payment, the development
includes a ground lease from the Berkeley Redevelopment Agency. This lease includes
affordability restrictions and runs until 2042. Therefore the units are not at risk from 2014 to
2024.
Durkee Lofts is located at 800 Heinz Street. It was developed using low income housing tax
credits between 1987 and 1989, which meant the affordability restrictions lasted just 15 years.
Its tax credit affordability period ended in 2006, which is why the development appeared in the
2001 Housing Element with projects at risk of conversion to market rate. However, in addition to
the low income housing tax credits, Durkee Lofts is also subject to an inclusionary agreement
through the City’s inclusionary zoning ordinance. The inclusionary agreement requires the units
remain affordable in perpetuity. Therefore, this development is not at risk of converting to
market rate by 2024.

2015-2023 Berkeley Housing Element 6 - Housing Programs and Quantified Objectives
180
Dwight Way Apartments was constructed in 1998 and is located at 2501 Sacramento Street.
The project contains 16 rental units for persons with physical disabilities. It is owned by Dwight
Way Housing, Inc. and managed by Resources for Community Development (RCD). The
project was developed using Section 811 financing, a HUD program for persons with disabilities,
and has, a Project Rental Assistance Contract (PRAC), an annual operating subsidy. The
contract has expired but RCD continues to renewal annually. The development was also
funded with HOPWA and City of Berkeley funds. The loan from the City restricts its use to
affordable housing until 2055. Therefore this property is not at risk during 2014 through 2024.
Erna P. Harris Court, at 1330 University Avenue, was called the Belair Motel and was close to
demolition until Resources for Community Development, one of Berkeley’s most active
affordable housing developers and operators, acquired and rehabilitated using HUD’s Section 8
Moderate Rehabilitation SRO program in the early 1990s. The development now includes 25
SRO units and 10 one-bedroom units for formerly homeless adults. Berkeley Housing Authority
has a contract with Resources for Community Development for the Section 8 Housing
Assistance Payment operating subsidy which renews annually, which is why Erna P. Harris
Court appeared on the list of units at risk in the 2001 Housing Element. In order to rehabilitate
the building, RCD obtained commitments of funding from the City’s Housing Trust Fund and the
California Multifamily Housing Program which recorded a 55-year affordability restrictions in a
regulatory agreement at permanent closing. These new restrictions will run until 2065, so the
property is not at risk during 2014 through 2024.
Harriet Tubman Terrace, located at 2870 Adeline Street, provides 90 units of affordable
housing for seniors. It was originally developed in 1975 using HUD’s Section 236 mortgage
interest subsidy program and has Section 8 Housing Assistance Payment operating subsidies.
The Housing Assistance Payment has been renewed annually since 1991, which is why it
appeared in the list of at-risk properties in the 2001 Housing Element. However, in 2004, the
Michaels Development Company, which has one of the largest affordable housing portfolios in
the nation, acquired the property from the American Shelter Corporation. To assist with the
acquisition, the City of Berkeley held the public hearing for Michaels Development Company’s
tax-exempt bond financing, and agreed to monitor the development related to the bond
financing. As part of the tax exempt bond financing, a regulatory agreement was recorded on
the property, which restricts its use to affordable housing until 2059. Therefore this property is
not at risk during 2014 through 2024.
Lorin Station, located at 3253-61 Adeline Street, includes 14 units of affordable housing. It is
owned by the South Berkeley Neighborhood Housing Development Corporation. The South
Berkeley Neighborhood Development Corporation is a nonprofit organization founded in 1987
as the result of a community planning process. The organization owns and manages two
residential properties: this one and Rosewood Manor. It was an early low income housing tax
credit project; the tax credit use restrictions will expire in 2022, which is why it appeared on a list
of projects at risk of conversion in the 2001 Housing Element. In addition to the tax credits, there
are loans on the property of City General Funds through the Economic Development
department, and a loan from the Redevelopment Agency, which placed affordability restrictions

2015-2023 Berkeley Housing Element 6 - Housing Programs and Quantified Objectives
181
on the property until 2029. Because of these restrictions, the property is not at risk of conversion
to market rate by 2024.
Mable Howard (formerly known as Maggie Kuhn) is located at 1499 Alcatraz Avenue/3250
Sacramento Street. It was constructed in 1997 and provides 40 affordable rental units to
seniors. The property is owned by 3250 Sacramento Housing, Inc. and managed by Resources
for Community Development (RCD). The project was developed using Section 202 financing, a
HUD program for senior housing, and City of Berkeley’s Housing Trust Fund. The project also
receives an annual operating subsidy through a Project Rental Assistance Contract (PRAC)
which will expire by 2022. However, the loan from the City restricts its use to affordable housing
until 2052. Therefore, this property is not at risk during 2014 through 2024.
Margaret Breland (formerly known as Jubilee) was constructed in 2006 and is located at 2577
San Pablo Avenue. It provides 27 affordable rental units to seniors plus one manager’s unit.
The project was developed by RCD and Jubilee Restoration Inc. using Section 202 financing, a
HUD program for senior housing, and City of Berkeley’s Housing Trust Fund. A California
Housing Enabled Local Partnership’s Program loan was made by the City of Berkeley to assist
with the initial acquisition of the property site. The development relies on a Project Rental
Assistance Contract (PRAC) which has expired but is operating on annual renewal. However,
the loan from the City restricts its use to affordable housing for 40 years from the date the
project was constructed, or 2046. Therefore this property is not at risk during 2014 through
2024.
Oceanview Gardens was built in 1983 and is located at 813 Delaware Street. It provides 62
units of affordable housing for individuals and families, including one-, two-, and three-bedroom
units. It was developed using Berkeley Redevelopment Agency financing in addition to a
Section 8 Housing Assistance Payment (HAP) operating subsidy. The HAP contract has been in
annual renewals since 2003, which is why it was listed as an at-risk property in the 2001
Housing Element. It is owned and operated by AF Evans, a large affordable housing developer
and property manager. In 2004, AF Evans rehabilitated the property with low income housing
tax credits, tax exempt bonds, and Berkeley Redevelopment Agency participation, which
extended regulatory agreements on the property through 2059. With the dissolution of the
California redevelopment agencies in 2012, the City of Berkeley as Successor Agency to the
Redevelopment Agency transferred all housing assets to the Housing Successor Agency and
assumed regulatory agreements and compliance monitoring responsibilities for the projects
funded by the former Redevelopment Agency, including Oceanview Gardens. Therefore,
Oceanview Gardens is not at risk of converting to market rate during 2014 through 2024.
Rosevine Apartments, located at 1431-33 Oxford Street, is owned and operated by Resources
for Community Development (RCD). The property is a shared-housing project for persons with
disabilities and contains 10 single-room occupancy (SRO) units in five dwelling units. The
owner developed the project in 1997 with a loan from the City and financing from HUD’s Section
811 program, which provides capital advances for non-profit developers to finance the
construction and rehabilitation of supportive housing for persons with disabilities. The project
also receives an annual operating subsidy through a Project Rental Assistance Contract

2015-2023 Berkeley Housing Element 6 - Housing Programs and Quantified Objectives
182
(PRAC) which will expire by 2021. However, the loan from the City restricts its use to affordable
housing until 2052. Therefore this property is not at risk during 2014 through 2024.
Accomplishments
Berkeley has a number of active nonprofit housing developers that both own many of the
properties with annual subsidy renewals and participate actively in preserving subsidized
properties. Since 2009, 271 units in three properties have been preserved.
The City committed HOME and CDBG funds for renovations to the site which were completed in
November 2011.
Strawberry Creek Lodge, located at 1320 Addison Street, was built in 1963 using HUD’s
Section 202 program which provided capital financing as well as an annual operating subsidy
through the Housing Assistance Payment contract. The Strawberry Creek Foundation owns the
building which includes 150 studio and one-bedroom units for seniors. A total of 54 units have
the Housing Assistance Payment contract subsidy, which has been renewed annually since
1996. The Berkeley Housing Authority recently awarded the property project-based vouchers
for 23 units. Satellite Affordable Housing Associates (SAHA) is working with the owner to utilize
City of Berkeley Housing Trust Funds, 4% Low Income Housing Tax Credits, and tax exempt
bonds for rehabilitation and seismic safety upgrades. New regulatory agreements now run
through 2069.
U.A. Homes, located at 1040 University Avenue, was built in 1927 and contains 74 single-room
occupancy (SRO) units for formerly homeless adults. RCD rehabilitated the building using
HUD’s Section 8 Moderate Rehabilitation SRO program in the early 1990s. This program
provided both capital funding and a Section 8 Housing Assistance Payment operating subsidy.
The Berkeley Housing Authority has the contract with RCD for the Housing Assistance
Payment. In 2014, extensive renovation was completed with a Housing Trust Fund loan from
the City and Low Income Housing Tax Credit equity. New regulatory agreements now run
through 2069.
University Avenue Cooperative Homes Apartments was built in 1982 as a limited equity
cooperative. It provides 47 units of affordable housing located on eight parcels on University
Avenue, Sacramento Street, and Addison Street. The land is owned by the City of Berkeley and
the buildings and property improvements are leased to University Avenue Partnership and have
operated as affordable housing since 1982. RCD worked with the Partnership to acquire the
property improvements, rehabilitate the structures, and continue the property as a multi-family
affordable rental housing project. RCD secured a Housing Trust Fund loan from the City and a
9% tax credit allocation to complete the rehabilitation by the end of 2014. New regulatory
agreements now run through 2080.
Looking Ahead
Berkeley’s Resources for Preservation
California Government Code Section 65863.10 requires owners of specified federally-assisted
projects to provide Notices of Intent to prepay a federally-assisted mortgage, terminate
mortgage insurance, or terminate rent subsidies or restrictions at twelve and six months, unless

2015-2023 Berkeley Housing Element 6 - Housing Programs and Quantified Objectives
183
the projects are exempted. These Notices of Intent must be sent to all affected tenant
households and to affected public agencies. Affected public agencies include the city or county
where the project is located, the local Public Housing Authority, and the Department of Housing
and Community Development (HCD).
Pursuant to California Government Code Section 65863.11, owners of government-assisted
projects cannot terminate subsidy contracts, prepay a federally-assisted mortgage, or
discontinue use restrictions without first providing an exclusive Notice of Opportunity to Submit
an Offer to Purchase. This Notice is required to be sent to Qualified Entities (nonprofit or for
profit organizations or individuals that agree to maintain the long-term affordability of projects) at
least twelve months prior to sale or termination of use restrictions.
In the event the City received a Notice of Intent, or was contacted by an owner prior to their
sending the Notice of Intent, the City would contact the many qualified nonprofit and for profit
organizations that develop and/or manage affordable housing in Alameda County which have
expressed interest in acquiring assisted rental housing. The organizations listed in the following
table are those that have been the most active in Berkeley historically, and which are frequently
in communication with Health, Housing & Community Services Department staff.
Table 6-25: Affordable Housing Organizations Interested in Acquiring and
Managing At-Risk Rental Housing in the City of Berkeley Company City
Resources for Community Development Berkeley
Satellite Affordable Housing Associates Berkeley
The John Stewart Company (property management only) San Francisco
The City would also refer to the California Department of Housing and Community
Development’s list of Qualified Entities. At present, the list includes numerous organizations
which have expressed interest in acquisitions in Alameda County. The list is maintained by
HCD, and is located online: www.hcd.ca.gov/hpd/hrc/tech/presrv/
In the event that funding was needed to acquire and/or rehabilitate these developments in order
to preserve their use as affordable housing, multiple sources of federal, state, and local funds
could potentially be used depending on the details of the project. Major sources appear on the
table below.
Table 6-26: Sources of Funding for Acquiring and Rehabilitating
At-Risk Housing in the City of Berkeley
Source Administered locally by
Federal
Community Development
Block Grant (CDBG)
City of Berkeley, community agency capital funding RFP
HOME City of Berkeley, Housing Trust Fund
Housing Opportunities for
Persons with AIDS (HOPWA)
Alameda County Housing and Community Development

2015-2023 Berkeley Housing Element 6 - Housing Programs and Quantified Objectives
184
Low Income Housing Tax
Credits
California Tax Credit Allocation Committee (TCAC)
Project-based Section 8 Berkeley Housing Authority
Sections 202 and 811 HUD
Tax exempt bonds California Debt Limit Allocation Committee (CDLAC)
State
Mental Health Services Act
Housing Program
California Housing Finance Agency
Multifamily Housing Program California Housing and Community Development
Local
General Funds City of Berkeley, Housing Trust Fund
Private
Affordable Housing Program
(AHP)
Federal Home Loan Bank
Nonprofit community
development lenders
Local Initiatives Support Corporation (LISC); Corporation
for Supportive Housing (CSH); Low Income Investment
Fund (LIIF); Northern California Community Loan Fund
(NCCLF)
Private bank loans Multiple banks
Preservation Versus the Cost of Replacement
In addition to identifying units at risk of converting to market rate housing, Government Code
Section 85583(a)(9)(B) requires a comparison of costs to replace lost housing units through
construction or rehabilitation to the cost of preserving units.
Long-term affordability of low-income units can be secured by transferring ownership of these
projects to non-profit affordable housing organizations. In the property transfer, units are
eligible for refinancing using a range of affordable housing financing programs, including low-
income housing tax credits and tax-exempt mortgage revenue bond that ensure affordability for
at least 55 years from the time of funding. Most of these transactions also include rehabilitation
of the project to modernize the property and to extend the useful life of the major systems. This
is the primary preservation strategy that Berkeley has used in the past.
Upon review of the average costs of recently financed preservation projects that have been
acquired and refinanced, adjusting for past cost increases and anticipating some increase
during the next five years, the cost of acquiring and rehabilitating units in Berkeley in the next
five years is estimated at $250,000 to $275,000 per unit depending on the complexity of the
project. This does not account for any major relocation costs associated with rehabilitating
occupied units, in the event that relocation is required.
The cost of replacing units through new construction, should affordable units be lost to market
rate conversion, is higher. Based on the cost of recently financed developments and
anticipating future cost increases, the cost of developing replacement units via new construction
in Berkeley during the next five years is estimated to be in the range of $429,400 per unit.

2015-2023 Berkeley Housing Element 6 - Housing Programs and Quantified Objectives
185
Program for preserving at-risk subsidized units
The City of Berkeley has already implemented a number of recommended practices for
preserving at-risk subsidized units:
Analyze inventory of at-risk units in the City. Included in this Housing Element.
Identify potential buyers and potential acquisition funds. Included in this Housing
Element.
Maintain communications with local HUD office. City staff actively works with the
HUD San Francisco Office’s Community Planning and Development staff, and will work
with the HUD office on an as-needed basis to preserve units.
In FY2010, the City of Berkeley has increased staffing for the Housing Trust Fund. Increased
staff capacity will focus on monitoring activities, which will include some monitoring of at-risk
developments without Housing Trust Fund financing.
Implementation Steps
City activities to preserve the inventory of assisted units will include the following:
City staff will contact owners of at-risk developments regularly to help identify increased
risk of conversion to market rate.
Staff will maintain a record of all below-market-rate properties potentially at-risk, and
update the list with any new information that becomes available, such as the presence
of additional regulatory agreements that affect the risk of conversion and the addition of
new income-restricted units created in-lieu of the affordable housing mitigation fee or
through the State density bonus program.
Staff will work with owners to develop preservation strategies.
In the event an owner indicates interest in selling a property, the City will work to match
the owner with a qualified non-profit affordable housing organization.
As available and appropriate, the City will provide funding through the Housing Trust
Fund for preservation activities in a way that is consistent with the Housing Trust Fund
guidelines and any applicable federal regulations. Whenever City Housing Trust Funds
are provided for acquisition and rehabilitation, the loan agreement will require another
55 years of affordability to be recorded on the property with a regulatory agreement.
Timeframe
Ongoing
Responsible Agency
City of Berkeley Health, Housing & Community Services Department
Funding Sources
General Fund

2015-2023 Berkeley Housing Element 6 - Housing Programs and Quantified Objectives
186
Table 6-27: Assisted Developments in Berkeley with HUD Project-
Based Subsidies or Low Income Housing Tax Credits from 1987-
1989 Without Housing Trust Fund Loans Name Units Subsidy sources Expiration
Bonita House
1910-1912 Hearst St. 2 202 Annual renewal
Delaware Street Historic District
1800 Sixth St. 8
Berkeley Redevelopment
Agency and Section 8 2042
Harriet Tubman Terrace
2870 Adeline St. 91
Tax exempt bonds and
Section 8 2059
Lawrence Moore Manor
1909 Cedar St. 46 236(J)(1), 202 Annual renewal
Lorin Station
3253-61 Adeline St. 14
Berkeley Redevelopment
Agency and Low Income
Housing Tax Credits
2029
Oceanview Gardens
1715-35 5th St.; 1726-32 6th St.;
1816-32 6th St.; 813-15 Hearst St. 62
Berkeley Redevelopment
Agency and Section 8
2059
Redwood Gardens
2951 Derby Street 169 202 Annual renewal
Rosewood Manor
1615 Russell Street 36 221(D)(3), HAP Annual renewal
Strawberry Creek Lodge
1320 Addison St. 150 202 Annual renewal
Stuart Pratt Manor
2020 Durant Ave. 44 202 Annual renewal
William Byron Rumford Plaza
3017 Stanton St. 43
Berkeley Redevelopment
Agency 2020
Total 722
Source: City of Berkeley Health, Housing & Community Services Department

2015-2023 Berkeley Housing Element 6 - Housing Programs and Quantified Objectives
187
Table 6-28: Inventory of Developments in Berkeley with a
Federally-Funded Project-Based Operating Subsidy
Name Total Units Section 8
HAP Units
HAP units
for seniors
Projects Reported in the Last Housing Element
Allston House 48 48
Amistad House 60 60 60
Bonita House 2 2
Delaware Street Historic District 8 8
Erna P Harris Court 35 35
Harriet Tubman Terrace 91 90
Lawrence Moore Manor 46 46 46
Oceanview Gardens 62 60
Redwood Gardens 169 169 169
Rosewood Manor 36 36 36
Savo Island Cooperative Homes 57 57
Shattuck Senior Homes 27 27 27
Strawberry Creek Lodge 150 54 54
Stuart Pratt Manor 44 44 44
UA Homes 74 74
University Avenue Cooperative Homes 47 47
Subtotal 956 857 436
Projects Developed Since 2001
Adeline Street Apartments 18 17
Ashby Lofts 54 20
Harmon Gardens 16 5
Helios Corner 80 40 40
Oxford Plaza 97 24
Sacramento Senior Homes 40 39 39
University Neighborhood Apartments 47 17
Subtotal 336 157 79
Total 1,292 1,014 515
Source: City of Berkeley Housing Department
Priority Development Area Program
In 2007 the Association of Bay Area Governments (ABAG) and the Metropolitan Transportation
Commission (MTC) established a process whereby local jurisdictions can apply to have areas
designated “Priority Development Areas” (PDA’s) based on regional smart-growth criteria.
Priority Development Areas and Priority Conservation Areas are a part of the “Focusing Our
Vision” (aka FOV or FOCUS) program. FOCUS is a regional development and conservation
strategy that promotes a more compact land use pattern for the Bay Area. PDAs are locally
identified, infill development opportunity areas near transit. More information about the FOCUS
and PDA programs is available online: http://www.bayareavision.org/pda/alameda-county/

2015-2023 Berkeley Housing Element 6 - Housing Programs and Quantified Objectives
188
Because infill development tends to be more expensive and more difficult than development in
outlying suburbs, and often causes significant community concern, one of ABAG’s goals is to
encourage the state to provide incentives to jurisdictions who wish to build infill in these PDA’s,
thereby providing some significant “carrots” to jurisdictions who are willing to implement local
policies consistent with regional priorities.
The City’s General Plan policies encourage relatively higher residential density along the major
transportation corridors, in the downtown, and near the Ashby BART Station, consistent with the
PDA criteria. In June 2007 the City successfully applied for PDA status for six areas. They are:
Downtown
San Pablo Avenue
University Avenue (3rd to Martin Luther King)
Telegraph Avenue (Parker to the City border)
Adeline Street
South Shattuck Avenue (Dwight to Ward Street)
Accomplishments
In May 2014 ABAG and MTC awarded the City of Berkeley a grant for $750,000 for a Specific
Plan process in the South Shattuck and Adeline PDAs. The community-led process will identify
ways to improve these PDAs and the surrounding neighborhoods as well as accommodate new
housing units near the existing BART station and commercial shopping district.
The City has also received grant funding for the Downtown PDA to complete planning
processes for intermodal connectivity, the BART station, and bike infrastructure.
Looking Ahead
Looking forward, to the degree that planning and improvement grants continue to be targeted to
PDAs in the Bay Area, the City will continue to apply for such grants, ultimately leading to an
enhanced environment for potential housing development along some of the City’s major mixed-
use boulevards and in Downtown, consistent with the City’s Land Use and Housing Elements.
Implementation Steps
Consistent with Berkeley’s General Plan policies and regional housing goals, effectively
utilize available state funding to promote infill development and improve physical
amenities in Berkeley.
Timeframe
Ongoing.
Downtown Area projects are expected to continue through 2017.
Adeline Corridor Specific Plan (January 2015 to December 2017)
Responsible Agency
City of Berkeley Planning Department

2015-2023 Berkeley Housing Element 6 - Housing Programs and Quantified Objectives
189
Funding Sources
General Fund
Priority Properties Team
During the 1990s, the City of Berkeley adopted the Anti-Blight Ordinance (Ordinance No. 6157
N.S.) and created a taskforce to implement the ordinance. The purpose was to promote, “the
health and safety and general welfare of the citizens by requiring a level of maintenance on
residential and commercial property which will promote healthy neighborhoods and protect and
preserve the livability and appearance of the City.” At that time, blighted residential buildings
were usually also vacant or substantially underused. Of 26 properties initially identified in the
early 1990s, 21 were rehabbed and returned to the rental market.
The City of Berkeley no longer operates the Problem Properties Taskforce, but the City
continues to operate an interdepartmental team with participation from the Police, Fire,
Environmental Health, Building and Safety, Code Enforcement, Mental Health, Housing Code,
and legal departments with coordination from the City Manager’s office. Properties are referred
to Code Enforcement by neighbors, residents, and City staff, when they have conditions having
an adverse impact on the neighborhood, such as broken windows, overgrown vegetation,
suspected drug activities, illegal and unsafe units inoperable vehicles, or visible structural
problems. City staff work with the owner to correct the problems. Often the buildings are
vacant and identifying the owner can be a complex task. Using a combination of land use
controls, housing and fire code provisions, environmental and public health regulations, and
housing rehabilitation loan funds, the City attempts to encourage owners to return their
properties to the market as quickly as possible. As necessary, they are cited for violations.
Accomplishments
In 2014, the team developed a coordinated inspection process led by the Code Enforcement
Division that combines the inspection efforts of Code Enforcement, Housing Code and Building
& Safety divisions. This coordinated effort has addressed roughly 10 properties so far in 2014.
Looking Ahead
The Problem Properties Taskforce is an active and ongoing program that will continue to
address safety concerns.
Implementation Steps
Continue to address vacant or blighted properties using a multi-departmental approach.
Timeframe
Ongoing
Responsible Agency
City of Berkeley City Manager’s Office
Funding Sources
Rental Housing Safety Program fees

2015-2023 Berkeley Housing Element 6 - Housing Programs and Quantified Objectives
190
General Fund
Project Review Outreach Efforts
The Berkeley community takes an active interest in housing issues, and there is a high level of
public participation concerning housing decisions and projects The City actively solicits input
from Berkeley citizens regarding housing projects and policies. The City is guided by the
policies of the General Plan Citizen Participation Element.
To assure public input on City-funded housing programs, HTF funding allocations are awarded
by the HAC after public review and outreach. Additionally, the HTF guidelines were revised with
thorough public review along with the HAC. The community agency funding allocation process,
the Annual Action Plan, the Consolidated Plan, and the CAPER also includes public notice,
mailing and public hearings. The Housing Department regularly prepares a Public Participation
Plan for approval by HUD to guide the public outreach process for these federal program
planning and funding activities. The most recent Public Participation Plan was adopted in May
2012.
The Planning Department posts application materials and information for all projects on the
department website. For controversial projects, project planners meet with neighbors and
groups to identify project concerns during the review process. Applicants are required to contact
neighbors and introduce their projects prior to submitting an application. For larger projects, the
City requires prospective applicants to notice and hold a public meeting to describe the project
and to solicit input. The City’s project submittal requirements include obtaining signatures from
all immediate neighbors in order to assure they are made aware of the proposal. In addition to
legal notices required under state law, the City mails notification of discretionary project
decisions to all owner and occupants within 300 feet of a project location and to any
neighborhood organization that has expressed an interest in a particular area.
Applicants for discretionary review projects are required to post a large proposed development
sign at the project site to notify the public prior to application submittal and maintain and update
it for the full length of the project review process. The sign includes the project description,
contact information, and all public notices. The proposed development sign program has
provided neighbors and residents with advanced notice (most times before the City is aware of
an application) of proposed development, and has provided an easily-recognizable way for the
public to stay informed about proposed changes in their neighborhood.
Accomplishments
In 2011 the Planning Department commenced listing all projects submitted for land use
entitlements on the website. The website includes all projects currently under review, projects
within the appeal period, and all projects entitled by year.
In 2012, the Planning Department implemented a postcard notice system, which allows faster
notification and expanded the capacity to send notices, while saving paper.

2015-2023 Berkeley Housing Element 6 - Housing Programs and Quantified Objectives
191
Looking Ahead
The City will continue to actively solicit input from residents in the planning process through
public notification procedures.
Implementation Steps
Continue to improve public notification procedures to increase public input in the
planning process.
Timeframe
Ongoing
Responsible Agency
City of Berkeley Planning Department
City of Berkeley Health, Housing & Community Services Department
Funding Sources
General Fund
Reasonable Accommodation Ordinance
The City of Berkeley adopted a Reasonable Accommodation Ordinance in December 2001.
Under the ordinance, applicants for reasonable accommodation may request modifications of
the requirements of Title 21 (Subdivision Ordinance) or Title 23 (Zoning Ordinance) through the
City’s normal permitting process, however their applications are subject to different findings.
Reasonable accommodations findings are used in place of the City’s general non-detriment
and/or variance findings.
The normal findings for an administrative use permit or use permit are specific to the zoning
standard under review. If an applicant cannot meet those findings, there is no process or relief
from those requirements other than a variance. The findings for a variance are often difficult to
meet because they are limited to situations where there are “exceptional or extraordinary
circumstances or conditions” applying to the land or building and granting of the variance is
needed to allow “enjoyment of substantial property rights.” If the findings for an administrative
use permit, use permit or variance cannot be met, the request will be denied.
With a reasonable accommodation application, an applicant can obtain relief from ordinance
standards and requirements based on the following factors:
1. Need for the requested modification, including alternatives that may provide an
equivalent level of benefit;
2. Physical attributes of and any proposed changes to the subject property and
structures;
3. Whether the requested modification would impose an undue financial or
administrative burden on the City;

2015-2023 Berkeley Housing Element 6 - Housing Programs and Quantified Objectives
192
4. Whether the requested modification would constitute a fundamental alteration of the
City’s zoning or subdivision program;
5. Whether the requested accommodation would result in a concentration of uses
otherwise not allowed in a residential neighborhood to the substantial detriment of the
residential character of that neighborhood;
6. Any other factor that may have a bearing on the request.
The process for a reasonable accommodation request is the same as would otherwise be required for application under the applicable ordinance and the fees are the same. Findings for the reasonable accommodation procedure are applied in a manner to promote housing opportunities for persons with disabilities and do not act as a constraint. For example, the findings “any other factor that may have bearing on the request” is potentially ambiguous and could convey uncertainty in the application process for an exception. This factor would be utilized to allow flexibility and grant requests, not deny requests. This is particularly important given the City’s priority to further fair housing opportunities, including for persons with disabilities. As a result, this factor has not and will not present a constraint to development, maintenance and improvements of housing for persons with disabilities. However, the City will monitor application of findings and make adjustments if any findings are found to constrain housing opportunities for persons with disabilities.
Accomplishments
The City adopted the Reasonable Accommodation Ordinance in 2001.
Looking Ahead
The Planning Department will improve implementation of the Reasonable Accommodation
Ordinance with the following actions:
Implementation Steps
Prepare materials explaining the reasonable accommodation application process and a
clearer application form.
Develop administrative guidelines to assist with implementation of the ordinance.
Train planning staff on use and implementation of the ordinance.
Monitor findings of approval for reasonable accommodation and make adjustments as
appropriate.
Timeframe
Ongoing
Responsible Agency
City of Berkeley Planning Department
Funding Sources
General Fund

2015-2023 Berkeley Housing Element 6 - Housing Programs and Quantified Objectives
193
The Successor Agency to the Former Redevelopment Agency
As part of the 2011 Budget Act, and in order to protect funding for core public services at the
local level, the Legislature approved the dissolution of the state’s 400 plus Redevelopment
Agencies. After a period of litigation, RDAs were officially dissolved as of February 1, 2012. As
a result of the elimination of the RDAs, property tax revenues are now being used to pay
required payments on existing bonds, other obligations, and pass-through payments to local
governments. The remaining property tax revenues that exceed the enforceable obligations are
now being allocated to cities, counties, special districts, and school and community college
districts, thereby providing critical resources to preserve core public services.
On January 17, 2012, the City Council adopted Resolution No. 65,574-N.S., electing to serve as
the Successor Agency to the Berkeley Redevelopment Agency to take over redevelopment
responsibilities in accordance with the Dissolution Act. To help facilitate the winding down
process at the local level, Successor Agencies have been established to manage
redevelopment projects currently underway, make payments on enforceable obligations, and
dispose of redevelopment assets and properties. Each Successor Agency has an oversight
board that supervises its work. The oversight board is comprised of representatives of the local
agencies that serve the redevelopment project area: the city, county, special districts, and K-14
educational agencies. Oversight Board members have a fiduciary responsibility to holders of
enforceable obligations, as well as to the local agencies that would benefit from property tax
distributions from the former redevelopment project area.
Low and Moderate Income Housing Fund
HSC Section 34179.5 required each Successor Agency to employ a licensed accountant,
approved by the county auditor-controller and with experience and expertise in local
government accounting, to conduct a due diligence review to determine the amount of cash and
cash equivalents available for distribution to the affected taxing entities.
Pursuant to Health and Safety Code (HSC) section 34179.6 (f), the City of Berkeley Successor
Agency (Agency) was ordered by the California Department of Finance (Finance) in January
2013 to remit to the county auditor-controller $127,978 of unencumbered Low-and-Moderate
Income Housing Funds (LMIHF) for distribution to local taxing entities.
Rent Stabilization and Tenant Protections
The Berkeley voters passed the Rent Stabilization and Good Cause for Eviction Ordinance in
1980 (Berkeley Municipal Code, Chapter 13.76). In 1982, the voters passed a Charter
Amendment establishing an elected Rent Stabilization Board (Berkeley Charter, Article XVII,
section 121). From 1980 to 1998 rents in units built prior to 1980 were controlled permanently,
so that the rent did not change when a tenant moved out and new tenants moved in. Since the
Costa-Hawkins Rental Housing Act went into full effect in California 1999, landlords have been
able to establish initial rents for new tenancies at whatever price the market will bear (Civil Code

2015-2023 Berkeley Housing Element 6 - Housing Programs and Quantified Objectives
194
sections 1954.50 through 1954.535). Under the law, the initial rent for new tenancies is not
controlled but subsequent rent increases are controlled. This system is usually called “vacancy
decontrol” although it is really “vacancy decontrol, recontrol.” The law also removed single-unit
properties first re-rented after 1996 from rent control, including single-family houses and most
condominiums.
The Rent Stabilization and Good Cause for Eviction Ordinance provides a stable housing
environment for tenants while assuring that landlords are able to receive a fair return on their
investment. It assures tenants in rent stabilized units that once they move in their rents will not
drastically increase, a situation similar to that of homeowners who are protected from rapid cost
increases by the state property tax limitation and fixed-rate mortgages. Annual rent increases
(the Annual General Adjustment or AGA) are set at 65% of the increase in the Consumer Price
Index and landlords can apply for individual rent adjustments if the increases they receive
through tenant turnover and the AGA are not sufficient to provide them with the legally required
rate of return. The ordinance also protects tenants from arbitrary evictions through a system of
eviction controls and twelve defined just causes for eviction. Good cause for eviction
requirements apply to virtually all rental units, including those built after 1980, condominiums
and single-family houses.
Census data from 2010 indicate that Berkeley had approximately 28,600 rental units, all but a
handful of which were both renter-occupied and subject to good cause for eviction. About 6,700
of these rental units were exempt from rent stabilization, with 2,700 constructed after 1980 and
another 4,000 exempt because they are single-family homes. All units that are subject to rent
stabilization and are rented or available for rent are required to register with the Rent
Stabilization Program. As of the first quarter of 2014, 19078 units were registered and another
1,500 were temporarily exempt because their residents received monthly rental assistance
through the Section 8 Housing Choice Voucher Program or the Shelter Plus Care Program.
There are also approximately 1,400 units in multi-family properties built prior to 1980 that are
temporarily not available for rent or owner-occupied. These units would be subject to rent
stabilization if their use changes and they were rented out. In total, the rent stabilization portion
of the ordinance applies to a maximum of between 20,000 and 21,000 units in Berkeley.
Vacancy decontrol took effect during the “dot.com” boom, which rapidly increased rents and
home prices throughout the Bay Area and peaked in 2001. From 2001 to 2004 market rents in
Berkeley declined somewhat and then began to rise again. By 2008 the market rents for
registered units in Berkeley had increased beyond the 2001 peak levels. After the 2008 financial
crisis, market rents decreased slightly and then remained stable through 2011. Recently, rents
in Berkeley have increased significantly and market rents in units subject to rent control reached
consecutive all time highs in both the 2012 and 2013 calendar years. This trend has continued
in 2014, and the Rent Board reports that 2014 market rents have increased by 9.35% from the
previous 2013 record levels.
Approximately 85% of registered rental units have had a new tenancy since 1999 while 15%
have long-term tenants. The approximately 3,000 tenant households that have remained in
place since the beginning of vacancy decontrol are usually paying a rent that is significantly

2015-2023 Berkeley Housing Element 6 - Housing Programs and Quantified Objectives
195
below current market rates. The table below shows the median rent for both long term tenants
and medium term tenants renting since 1998, 2003, and 2009, and compares them with 2013
market rents. While the units are not directly comparable – a large portion of each year’s
vacancies are in the areas near the UC Berkeley campus that have a high student population
and also have the highest rents – this gives a sense of the discount provided to long-term
tenants and the loss of affordability that results from vacancy decontrol.
Table 6-29: 2014 “Market” rent compared to rent for 2006, 2009 and pre-1999 “Controlled” tenancies*
Unit size
Median 2014 Rent for 1998
Tenants
Median 2014 Rent for 2003
Tenants
Median 2014 Rent for 2009
Tenants
Median 2014 Market Rent*
Studio $671 $985 $1,005 $1,240
1 BR $790 $1,275 $1,323 $1,595
2 BR $978 $1,739 $1,799 $2,250
3 BR $1,355 $2,317 $2,540 $3,000
All Units $814 $1,333 $1,386 $1,695
*The above rental data only includes units that are fully subject to rent control. Rental rates for newly constructed units that are exempt from rent control are significantly higher. The average 2014 market rent for new multi-family developments are: $2,239 for a studio; $2,537 for units with one bedroom; $3,434 for units with two Bedrooms; and $4,200 for units with three bedrooms. See table 2-23 for more information. Source: City of Berkeley Rent Board
While the common perception is that long-term, pre-Costa-Hawkins tenants are the sole
beneficiary of savings due to rent stabilization, the dramatic increase to rents over the past few
years has created a rental market where even tenants that entered rent controlled units
between 2000 and 2013 are experiencing significant savings in the form of more affordable
housing. New tenants receive the benefit of a stable rent despite a volatile housing market.
The Rent Board engages in public education about the importance of the rent stabilization and
good cause for eviction ordinance and works to educate both tenants and landlords about their
respective rights and responsibilities under the law. Rent Board counselors also provide
information to landlords and tenants at between 40 to 50 different events each year. These
include seminars and workshops on different rental housing issues, monthly drop-in counseling
at both the Berkeley Central Library and the Berkeley Senior Centers, weekly counseling for
students at the UC Berkeley campus, and local events such as the Solano Stroll and the
Berkeley Juneteenth Festival. Over the course of the year Rent Board counselors have more
client contacts with property owners than with tenants.
The Rent Board monitors foreclosures to ensure tenants are notified that they do not have to
move simply because a financial institution has taken over ownership of the property and works
with owners to help them stave off foreclosure by informing the lending institution that they will
not be able to simply evict all the tenants and vacate the property but rather will need to take on
2015-2023 Berkeley Housing Element 6 - Housing Programs and Quantified Objectives
196
the responsibility of property management. The Rent Board monitors all filings by owners
evicting tenants on the grounds that they are going out of the rental business to ensure that the
owners make the required relocation payments and follow all the notice requirements of state
and local laws.
The Rent Board works closely with other City departments to ensure that tenants are protected
from retaliation when they complain about code violations and to assist landlords in following the
requirements of the law when they need to temporarily relocate tenants in order to make
repairs.
The Berkeley Rent Stabilization Board also assists with the enforcement of the Fair Housing
Ordinance (BMC Section 13.30.050) by providing funding for the East Bay Community Law
Center and the Eviction Defense Center, which provide legal services to the low-income
community.
Accomplishments
The Board is committed to a transparent and fully accessible administration of the Rent
Stabilization and Eviction for Good Cause Ordinance adopted by the voters. Board meetings
are televised, close captioned, broadcast on radio and webcast. Translation services are
provided in several languages and, upon request, the newsletters have been translated into
Braille. Throughout the year, the Rent Board’s homepage is one of the most frequently visited
websites in the City.
The Rent Board responds to between 10,000 -12,000 inquiries annually from tenants, owners,
realtors and other members of our community. Most contacts are for counseling – several
hundred clients contact us each year to resolve disputes through a formal administrative hearing
process. Each year, an increasing number of clients have taken advantage of the Rent Board’s
mediation services as a way to resolve disputes and avoid additional conflicts. Recently
mediations have exceeded the number of formal hearings.
The Rent Stabilization Ordinance increases the affordability of Berkeley’s rental units. This
affordability allows many low-income, elderly, and disabled tenants to continue to live in
Berkeley even though they cannot afford the current market rent for their units. Table 6-30
shows the annual number of dollars saved by existing tenants in units subject to rent control.
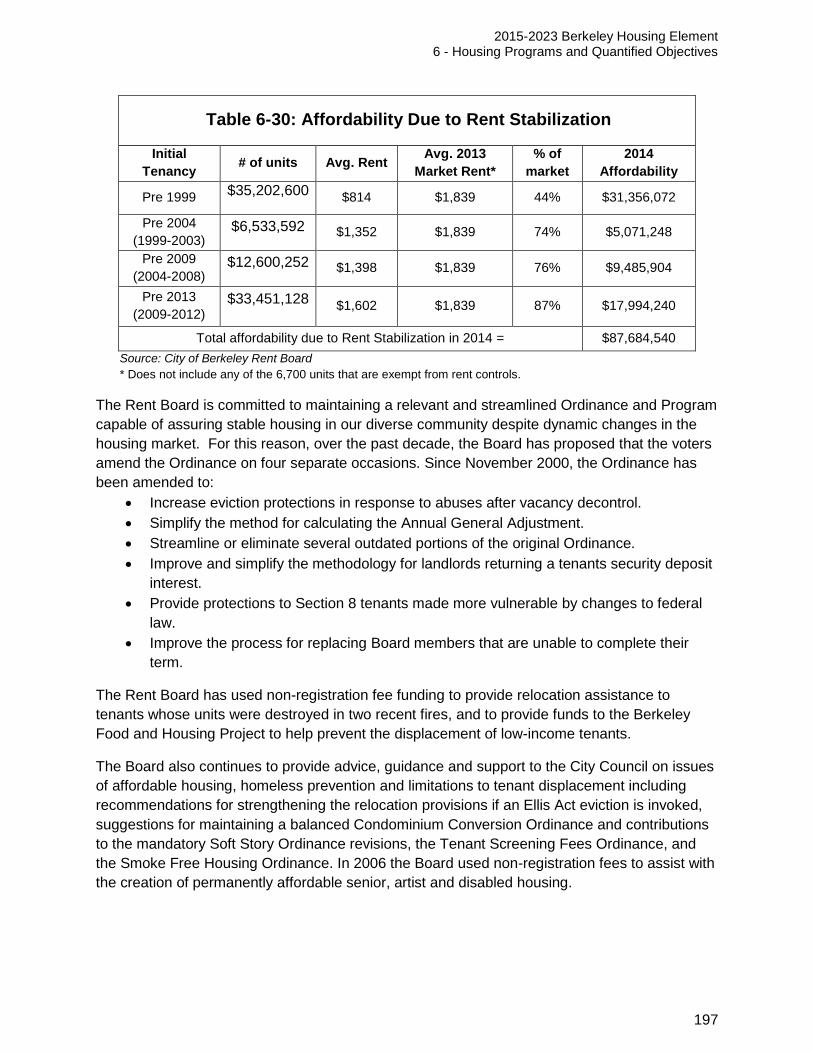
2015-2023 Berkeley Housing Element 6 - Housing Programs and Quantified Objectives
197
Table 6-30: Affordability Due to Rent Stabilization
Initial
Tenancy # of units Avg. Rent
Avg. 2013
Market Rent*
% of
market
2014
Affordability
Pre 1999 $35,202,600
$814 $1,839 44% $31,356,072
Pre 2004
(1999-2003) $6,533,592 $1,352 $1,839 74% $5,071,248
Pre 2009
(2004-2008) $12,600,252 $1,398 $1,839 76% $9,485,904
Pre 2013
(2009-2012) $33,451,128
$1,602 $1,839 87% $17,994,240
Total affordability due to Rent Stabilization in 2014 = $87,684,540
Source: City of Berkeley Rent Board * Does not include any of the 6,700 units that are exempt from rent controls.
The Rent Board is committed to maintaining a relevant and streamlined Ordinance and Program
capable of assuring stable housing in our diverse community despite dynamic changes in the
housing market. For this reason, over the past decade, the Board has proposed that the voters
amend the Ordinance on four separate occasions. Since November 2000, the Ordinance has
been amended to:
Increase eviction protections in response to abuses after vacancy decontrol.
Simplify the method for calculating the Annual General Adjustment.
Streamline or eliminate several outdated portions of the original Ordinance.
Improve and simplify the methodology for landlords returning a tenants security deposit
interest.
Provide protections to Section 8 tenants made more vulnerable by changes to federal
law.
Improve the process for replacing Board members that are unable to complete their
term.
The Rent Board has used non-registration fee funding to provide relocation assistance to
tenants whose units were destroyed in two recent fires, and to provide funds to the Berkeley
Food and Housing Project to help prevent the displacement of low-income tenants.
The Board also continues to provide advice, guidance and support to the City Council on issues
of affordable housing, homeless prevention and limitations to tenant displacement including
recommendations for strengthening the relocation provisions if an Ellis Act eviction is invoked,
suggestions for maintaining a balanced Condominium Conversion Ordinance and contributions
to the mandatory Soft Story Ordinance revisions, the Tenant Screening Fees Ordinance, and
the Smoke Free Housing Ordinance. In 2006 the Board used non-registration fees to assist with
the creation of permanently affordable senior, artist and disabled housing.

2015-2023 Berkeley Housing Element 6 - Housing Programs and Quantified Objectives
198
Looking Ahead
The Rent Board is working with other City departments to ensure that both tenants and owners
are fully informed of their rights early on in any process involving code enforcement or land use
and building permits. The Rent Board is providing review and assistance with the proposed
revisions to the Demolition Ordinance in order to ensure that they are consistent with the
requirements of other City ordinances designed to protect tenants and Berkeley’s older, more
affordable housing stock. The Rent Board continues to advocate for changes in state law that
will strengthen the ability of local governments to protect tenants from rent increases beyond
those necessary to operate and maintain rental housing and provide a fair return on investment
to the owner.
Implementation Steps
Rent stabilization and good cause for eviction for Berkeley tenants.
Timeframe
Ongoing
Responsible Agency
City of Berkeley Rent Stabilization Board
Funding sources
Fees
Second Units (Accessory Dwelling Units)
In July 2003 the City of Berkeley adopted a second unit ordinance allowing ministerial approval
of Accessory Dwelling Units (ADU) subject to certain development standards. New units
meeting the specific standards are allowed in all residential zoning districts as of right.
On April 30, 2013 the City Council referred to the Planning Commission a set of 10
recommendations intended to reduce barriers to the development of residential Accessory
Dwelling Units. Planning Department staff analyzed the referral and presented options for
zoning amendment to the Planning Commission at two meetings in 2014. The Planning
Commission recommended a package of zoning changes to the City Council on June 4, 2014.
The changes included:
Lowering the minimum lot size.
Allowing larger ADUs.
Reducing required setbacks.
Waiving parking when the new ADU is close to transit.
The City Council considered the changes on September 16, 2014 and continued the item to a
workshop to discuss the changes in more detail on February 26, 2015.
The existing ADU standards are summarized below:

2015-2023 Berkeley Housing Element 6 - Housing Programs and Quantified Objectives
199
There is only one unit currently on the lot.
The ADU is limited to between 300 and 640 square feet, and no larger than 25% of the
floor area of the main dwelling on the lot.
The ADU cannot be converted into a condominium.
The property owner must occupy either the primary dwelling unit or the accessory unit.
When the unit is created from a portion of the main building or an addition to the main
building, it must have a separate entrance that does not face the street; any addition
must be lower than 14 feet in height.
When the unit is created in a new or existing detached accessory building, the lot must
be at least 4,500 square feet, the building may not exceed 12 feet in height, and the
building is subject the setback requirements applicable to the main building, which
range from 15-20 feet for the front and rear setback and are four feet for side-yard
setbacks.
One off-street parking space is required.
An ADU that does not meet all of the requirements listed above may be permitted based on
approval of an administrative use permit (AUP), a discretionary permit decided by the Zoning
Officer in the following situations:
If the required parking space would reduce open space on the lot, an AUP may be
obtained to allow tandem parking.
If provision of the parking space would be detrimental and there is adequate parking in
the neighborhood, the required parking space for the ADU may be waived with an AUP.
If the setbacks applicable to the accessory building cannot be met, an AUP may be
obtained to reduce to setbacks to a minimum four-foot side yard setback and 20-foot
front yard setback.
Accomplishments
Since 2003, planning staff estimate there have been 30-35 by-right ADUs permitted in the City,
about ten of which required an AUP. Planning staff believe that more than 50 by-right ADUs
have been built, but the units were not identified during the building permit phase and thus not
tracked.
It is not uncommon for property owners considering an ADU to be unable to do so because they
cannot meet the by-right standards. In some cases, site characteristic that prevent an ADU
cannot be waived through an AUP. In other cases the property owner does not want to purse a
project requiring discretionary review. Staff does not track how often this occurs, however,
planning staff believe allowing more permissive standards would increase the number of ADUs
in the City.
Looking Ahead
Planning Department plans to research what obstacles may prevent property owners from
building ADUs by-right. For example, the following may be potential obstacles:
Minimum lot size of 4,500 square feet for stand-alone ADUs
Maximum of 12 feet in average height for stand-alone ADUs

2015-2023 Berkeley Housing Element 6 - Housing Programs and Quantified Objectives
200
Maximum size of 640 square feet
Rear setback requirements of 15-20 feet for stand-alone ADUs
Parking space requirements
Implementation Steps
Return to the City Council to consider zoning changes to facilitate the construction of
new ADUs.
Timeframe
2015
Responsible Agency
City of Berkeley Planning Department
Funding Sources
General Fund
Seismic Preparedness Programs
Berkeley has initiated a variety of programs to prepare for the effects of a major earthquake on
the Hayward fault on the City’s housing stock. Berkeley programs include the Seismic Retrofit
Permit Fee waiver, Real Property Transfer Tax Seismic Retrofit Rebate, the unreinforced
masonry ordinance, and the soft-story building ordinance. Additional disaster mitigation
activities and programs in Berkeley are described in the Disaster Preparation and Safety
Element of the General Plan.
Real Property Transfer Tax Seismic Retrofit Rebate
Berkeley Municipal Code Section 7.52.060, which imposes a 1.5% Real Property Transfer Tax,
states that “up to one-third of the tax imposed by the City on the sale of real property, shall be
reduced, on a dollar for dollar basis, for all expenses incurred on or after October 17, 1989, to
`seismically retrofit’ either any structure which is used exclusively for residential purposes, or
any mixed use structure which contains two or more dwelling units.” Allowable work can include
foundation and subfloor seismic corrections, installation of shear walls, anchoring of water
heaters, and/or securing of chimneys, stacks, water heaters, as well as improving seismic safety
of all soft story and URM buildings. To be eligible for the reduction, the seismic retrofit work
must be completed either prior to the transfer of property or within a maximum of one year after
the date of transfer.
Accomplishments
The City of Berkeley gave a total of 712 rebates from January 2009 through November 2014.
The average rebate over this time period was worth $4,146.56.

2015-2023 Berkeley Housing Element 6 - Housing Programs and Quantified Objectives
201
Table 6-31: Seismic Tax Rebate 2009-2014
Year # of Rebates Amount
2009-2010 150 $ 592,539.19
2010-2011 157 $ 593,974.47
2011-2012 166 $ 623,502.87
2012-2013 152 $ 739,881.22
2013-2014 87 $ 402,453.19
Total 712 $ 2,952,350.94
Unreinforced Masonry Building Ordinance
Unreinforced Masonry buildings (URMs) are buildings constructed of brick, block or tile prior to
1956 that have no or inadequate reinforcement. URMs present a serious danger of collapse in a
moderate to severe earthquake, which is a threat to occupants and neighboring properties and
could also block roads and emergency access.
In 1991 the City adopted the URM Ordinance, which mandated that all URM properties on the
designated list of 587 URM properties be seismically retrofitted to certain ‘performance
standards’ on a schedule determined by the risk category of each building.
In 1995, the City amended the ordinance to extend the deadline for some categories, to require
the immediate retrofit of any URM buildings undergoing resale or more than $50,000 of work,
and to provide for a process for hardship extensions.
Accomplishments
The City of Berkeley has achieved 97% compliance with the URM ordinance. As of September
2014, 14 URM properties remain on the URM list.
2 are under construction
1 needs a final inspection
1 is in plan check
2 are trying to prove they are not URMs
2 are slated for demolition
6 are non-responders
Citations have been issued and will continue to be issued to property owners who do not comply
with the URM ordinance.
Soft-Story Program
The City of Berkeley requires owners of owners of soft, weak or open front (SWOF) buildings
with five or more dwelling units to retrofit their buildings. Per Berkeley Municipal Code Chapter
19.39, owners have until December 31, 2016 to apply for a building permit and two years to
complete the work after submitting their permit application. The law took effect January 4, 2014
and applies to wood frame buildings constructed prior to 1978.

2015-2023 Berkeley Housing Element 6 - Housing Programs and Quantified Objectives
202
SWOF building owners must also post an earthquake warning sign and notify their tenants of
the building's potentially hazardous condition. Under the first phase of the soft story program,
starting in 2005, SWOF building owners were required to submit an engineering evaluation
report identifying their building's weaknesses and ways to remedy those weaknesses.
Accomplishments
Of the 323 buildings identified as SWOF buildings, 129 have been retrofitted and 56 were
removed from the inventory for other reasons, because they could prove they did not have five
dwelling units or a SWOF condition or because the building was demolished. As of September
2014, 138 SWOF buildings remain on the inventory to be retrofitted.
Looking Ahead
The City will continue the Seismic Retrofit Fee Waiver for URM non-profits. The City also will
continue the Real Property Transfer Tax Seismic Retrofit Rebate.
Property owners that are non-compliant with the URM Ordinance have been and will be issued
citations or fines.
Additional actions for noncompliance that the City can take include:
Issue a citation for each violation;
Perform nuisance abatement, and bill the owner and lien the property for the cost of the
work;
File a lawsuit, and obtain a court order for the owner to act;
Obtain a court order placing the property into receivership giving a private party
authority to receive all income, borrow money and perform the required work.
Implementation Steps
Continue enforcement of the URM and soft story ordinances.
Continue to offer the Seismic Retrofit Fee Waiver and Real Property Transfer Tax
Seismic Retrofit Rebate.
Timeframe
Ongoing
Responsible Agency
City of Berkeley Planning Department
Funding Sources
General Fund
Senior and Disabled Home Improvement Loan Program
The Health, Housing & Community Services Department administers a Senior and Disabled
Home Rehabilitation Loan Program (SDRLP) to preserve the City’s housing stock owned by
low- and moderate-income senior and disabled homeowners. This program is primarily funded
through Community Development Block Grant (CDBG) and CalHOME grants. The program

2015-2023 Berkeley Housing Element 6 - Housing Programs and Quantified Objectives
203
provides a zero interest deferred loan, secured by a deed of trust on the participant’s home.
The loan becomes due upon sale or transfer of the property; when the eligible homeowner
ceases to occupy the property or at 30 years, whichever comes first. Under CalHOME and
CDBG regulations, eligibility must be limited to households whose incomes do not exceed 80%
of Area Median Income. The maximum loan amount under the CalHOME program is $60,000.
CDBG funds have no set maximum amount under federal regulations and may be coupled with
CalHOME funding. The maximum program loan amount is $80,000.
Homeowners may leverage additional City funded Home Repair Programs provided by
Community Energy Services Corporation, the Center for Independent Living, and Rebuilding
Together (formerly Christmas in April). These partnerships allow resources to go farther and
complete more repairs.
Accomplishments
Since 2001, the City has received $2,350,000 in CalHome funds As of September 2014, the
City had assisted 56 low-income homeowners and had $515,384 remaining in CalHome funds.
Between FY2007-2014, the City’s SDRLP served 35 low-income home owners utilizing
$1,037,509 in CalHome funds, $645,062 in CDBG funds and $101,183 in City of Berkeley
General Funds.
Table 6-32: Senior and Disabled Home
Rehabilitation Loan Program, FY 2007 – FY 2014
Fiscal Year # of Properties Annual Loan Volume
2007 1 $20,000
2008 4 $166,108
2009 4 $250,715
2010 6 $277,600
2011 7 $383,931
2012 1 $10,000
2013 4 $205,000
2014 8 $470,400
Source: City of Berkeley Health, Housing & Community Services Department
Looking Ahead
More outreach on this program will help ensure that low-income senior and disabled
homeowners are aware of this affordable option for housing maintenance and improvements.
Disseminating information to seniors and to the disabled community about the program’s
availability is an important aspect to improve. Implementation Steps:
Continue program operations. Allocate the remainder of CalHOME funds and available
CDBG funds.
Timeframe:
Ongoing
CalHOME funds through FY 2015

2015-2023 Berkeley Housing Element 6 - Housing Programs and Quantified Objectives
204
Responsible Agency:
City of Berkeley Health, Housing & Community Services Department
Funding Sources:
Federal Community Development Block Grant (CDBG)
CalHOME
Tool Lending
Tool Lending Library
Established in 1979 with a federal Community Development Block Grant (CDBG), Berkeley’s
Tool Lending Library (TLL) has been lending tools for 30 years. The project began with around
500 tools and one full time employee housed in a portable trailer. In 1988, Berkeley voters
passed a property-based library tax, which allowed for the inclusion of the TLL in the City of
Berkeley Library’s operating budget.
Now housed in a permanent structure, the TLL is available to all Berkeley residents and people
who own property in Berkeley, and has grown to 2,500+ tools with four part time employees.
The TLL is currently at capacity with tools and cannot grow their inventory due to lack of space.
The TLL has tools ranging from weed whackers and hedge trimmers to circular saws and
sanders. The TLL provides access of specialized tools to those who may not be able to afford
them. By allowing low-income residents access to these tools, people can maintain their
homes.
Accomplishments
Since 1988, the TLL has been funded by property taxes and will remain part of the Library
budget. In addition, the passage of Measure FF in 2008 funded the renovation and expansion
the four neighborhood branch libraries, including the TLL.
Looking Ahead
The new South Branch tool library opened in May 2013 with more space for an increased tool
inventory.
Implementation Steps
Provide tools to all Berkeley residents and land owners
Timeframe
Ongoing
Responsible Agency
City of Berkeley Library
Funding Sources
Relief Act of 1988
Measure FF

2015-2023 Berkeley Housing Element
Appendix A – Site Inventory and Capacity Analysis Background by Area
205
Appendix A
Site Inventory and Capacity Analysis Background by Area
Table of Contents
Summary .......................................................................................................................................... 206
Table A-1: Summary of Residential Capacity ............................................................................... 206
Downtown Area Opportunity Sites and Residential Analysis .......................................................... 207
Table A-2: Downtown Area Housing Opportunity Site Inventory and Residential Capacity
Analysis - 2012 C-DMU Regulations ....................................................................................... 210
Southside Plan Opportunity Sites and Residential Capacity Analysis ............................................ 216
Table A-3: Southside Area Housing Opportunity Site Inventory and Residential Capacity Analysis
............................................................................................................................................... 218
Commercial Corridor Opportunity Sites and Residential Capacity Analysis ................................... 220
Table A-4: Capacity Estimates by Zoning District Commercial Corridors (2014-2022) ............... 223
Table A-5: Summary of Projects 1999-2009 Basis for Density Assumptions .............................. 223
Table A-6: Commercial Corridors Housing Opportunity Site Inventory and Residential Capacity
Analysis ................................................................................................................................. 224
Residential Neighborhood Opportunity Sites and Residential Capacity Analysis ........................... 229
Table A-7: Density Assumptions for Residential Zoning Districts* ............................................... 230
Table A-8: Vacant Residential Lots and Estimated Residential Capacity .................................... 230
Table A-9: Estimate of new units in Residential Districts by Unit Type (2015-2023) ................... 231
Table A-10: Residential Area Housing Opportunity Site Inventory and Residential Capacity
Analysis ................................................................................................................................. 231
Progress Towards 2014-2022 RHNA .............................................................................................. 245
Table A-11: Progress towards 2014-2022 RHNA: Units approved 2014 ..................................... 245
Map A-1: Overall map of Opportunity Site Areas………………………………………………………247
Map A-2: Downtown Area Opportunity, Sites North of Allston ........................................................ 248
Map A-3: Downtown Area Opportunity, Sites South of Allston ....................................................... 249
Map A-4: Southside Plan Opportunity Sites .................................................................................... 250
Map A-5: Commercial Corridors Opportunity Sites, University and San Pablo .............................. 251
Map A-6: Commercial Corridors Opportunity Sites, University: Bonar to Martin Luther King Jr. .... 252
Map A-7: Commercial Corridors Opportunity Sites, San Pablo: Bancroft to Ashby ........................ 253
Map A-8: Commercial Corridors Opportunity Sites, San Pablo: Harrison to Cedar ........................ 254
Map A-9: Commercial Corridors Opportunity Sites, Adeline and Telegraph: Dwight to Woolsey .. 255
Map A-10: Commercial Corridors Opportunity Sites, Shattuck: Rose to Francisco ........................ 256

2015-2023 Berkeley Housing Element
Appendix A – Site Inventory and Capacity Analysis Background by Area
206
Summary
This appendix provides an overview of the methodology used to identify housing opportunity
sites and estimate residential capacity on those sites as described in Chapter 3. It includes
maps of the opportunity sites and tables showing residential capacity assumptions for each site.
The Berkeley Housing Element identified opportunities for new housing in four main areas:
Downtown Area Plan area
Southside Plan area
Commercial corridors throughout the City
Residentially-zoned lots
The City identified opportunity sites based on lot sizes, existing development, and existing land
uses on the sites. The criteria used to select these opportunity sites are discussed by area in
this appendix and summarized below:
In the Downtown Area Plan and Southside Plan areas: vacant lots, parking lots, one-
story buildings, seismically hazardous (Southside) or fire damaged buildings
(Downtown), two- and three- story buildings within 100 feet of the downtown BART
station.
In the commercial corridors, lots meeting the following criteria:
o For 10,000 to 20,000 square foot parcels, a maximum existing building floor area
ratio (FAR) of 0.2
o For 20,001+ square foot parcels, a maximum existing FAR of 0.7
The table below summarizes the number of potential housing units estimated in each area.
Table A-1: Summary of Residential Capacity
Inventory Area Total Estimated Capacity
(number of units)
Estimated Capacity
towards current RHNA
cycle
Commercial Corridors 2,461 1,794
Downtown Plan Area 2,121 997
Southside Plan Area 430 430
Residential Districts 316* 237
Total Unit Capacity Estimate 5,328* 3,458
Remaining RHNA Capacity Requirement (From table A-11) 2,822
Estimated Excess Capacity 636
* Does not include sites that are underdeveloped. See discussion under Residential Neighborhood
Opportunity Sites and Residential Capacity Analysis below.

2015-2023 Berkeley Housing Element
Appendix A – Site Inventory and Capacity Analysis Background by Area
207
Downtown Area Opportunity Sites and Residential Analysis
The downtown area has a broad range of uses including retail, office space, restaurants, and
housing. The area serves as a regional transportation hub with numerous Alameda/Contra
Costa Transit (AC Transit) busses and a Bay Area Rapid Transit (BART) station. Also within the
downtown area is a segment between BART and the University of California with the highest
density of foot trips in the East Bay.
In March 2012, Berkeley adopted a Downtown Area Plan (DAP) and associated Downtown
Mixed-Use (C-DMU) zoning district for the 110-acre area located at the intersection of two major
arterials (Shattuck and University Avenues) and immediately west of the University of California
Berkeley campus. The section below describes the capacity analysis for the downtown area.
1. Identifying Opportunity Sites in the Downtown Area
Opportunity sites for residential development identified during the DAP planning process were
used to estimate potential development for the DAP environmental impact report (EIR). These
sites are the most likely to develop during the DAP’s 2012-2030 planning period because they
are considered underutilized. The Housing Element makes use of the opportunity sites identified
for the DAP planning process to estimate the number of housing units that could be built in the
downtown area during the eight year element planning period/RHNA cycle.
Sites were identified through field surveys based on the following indicators of underutilized land
and opportunities for transit oriented development:
Vacant sites;
Surface parking lots (except where used by existing residential uses);
One-story non-residential buildings (except where theaters, cinemas and recent
construction);
Two- and three-story buildings within 100 feet of a BART entrance; and
Two-story buildings that are severely fire damaged.
Opportunity sites that are identified for hotel uses or owned by the University of California were
not included for consideration in the Housing Element, and previously identified sites that are or
have been designated as City Landmarks have been removed from the list.
2. Downtown Area Housing Capacity
The Downtown Commercial Mixed Use (C-DMU) Zoning District includes various new standards
for mixed-use development that have the potential of resulting in higher density than
permissible under the previous Central Commercial (C-2) zoning. In order to identify potential
impacts for the environmental impact report (EIR) for the Downtown Area Plan (DAP), staff
applied the C-DMU standards to prototypical sites to estimate the development potential for the
Downtown. Staff applied the estimated yields under the C-DMU zoning regulations to the list of
opportunity sites to estimate the potential unit yield within the Downtown.

2015-2023 Berkeley Housing Element
Appendix A – Site Inventory and Capacity Analysis Background by Area
208
The results of the capacity analysis on the downtown opportunity sites are described below. The
Downtown Area Plan opportunity sites are illustrated in Map A-2 and Map A-3. The estimated
unit capacity for each site is shown in Table A-2.Potential Capacity Under DAP and C-DMU
Regulations. The 2012 Downtown Area Plan has four mixed-use sub-areas: “Core Area,”
“Corridor,” “Outer Core,” and “Buffer. Staff applied the new standards of these designations to
prototypical sites to estimate the potential building size and number of stories. Staff assumed
upper floors of these prototypical buildings would be residential, and calculated a floor area ratio
(FAR)1 for the residential area for each of the three land use designations.
The Core Area, Outer Core, and Corridor Sub Areas have a maximum allowable building height
of 60 feet without application of the state density bonus or a use permit for increased heights.
This is equivalent to four to five residential stories over first floor commercial uses. The Buffer
area has a maximum allowable height of 50 feet, which is equivalent to three to four stories of
residential over street-level commercial uses. The 2012 DAP contains no maximum density or
FAR requirements.
In the Core Area, Outer Core and Corridor Sub-Areas, four stories of residential construction
translates into an FAR of 2.6 for residential uses (exclusive of street-level uses), when
assuming typical apartment building depths (typically about 65-75 percent of lot depth) and
average downtown area development sites (about 100x130 feet, 13,000 square feet).2 With
regard to the Buffer area, three stories of residential construction translate into an FAR of 2.0 for
residential uses.3
Staff used the residential FAR estimates to calculate total residential floor area on a prototypical
site. In recent years, the gross floor area per residential unit (inclusive of shared circulation and
service areas) has been around 850 square feet. Based on this unit size, staff determined the
number of units in the prototypical building and used this figure to assign a density value to each
DAP land use designation. The assumed residential density for projects in the Core Area, Outer
Core, and Corridor sub-areas is approximately 135 dwellings per net acre, and the residential
density for projects in the Buffer sub-area is approximately 100 dwellings per net acre.4
Staff applied the density assumptions for the four Downtown sub-areas of the C-DMU zoning to
each remaining opportunity site resulting in an estimated capacity for each site. Staff adjusted
the unit yield for opportunity sites that have approved development projects (i.e. Use Permits),
but which have not yet been issued building permits to reflect the approved development. Using
1 Floor area ratio is measured as the ratio of usable floor space in a building to the size of the parcel.
2 The 2.6 FAR estimate is based on the following calculations: 65% of 130 foot lot depth is 84.5 feet, 100
feet x 84.5 feet = 8,450 s.f. of built area per floor, 8,450 s.f. x 4 stories of residential = 33,800 s.f. of
residential floor area, 33,800 of floor area / 13,000 of lot area = 2.6 FAR. 3 The 2.0 FAR estimate is based on the following calculations: 8,450 s.f. per floor x 3 stories = 25,350 s.f.
of residential floor area, 25,350 of floor area / 13,000 of lot area = 1.95 FAR. 4 These estimates are conservative and do not take into account the five allowable buildings of
exceptional height: within the Core, up to three building over 120 feet but not more than 180 feet; within
the Core and Outer Core, up to two buildings over 75 feet but not more than 120 feet (BMC
§23E.68.070.A).

2015-2023 Berkeley Housing Element
Appendix A – Site Inventory and Capacity Analysis Background by Area
209
this methodology, the total number of units estimated for the downtown area based on the C-
DMU zoning is 2,121 units, as shown in Table A-2. Estimating units in the downtown area at a
rate of 124.7 units per year (2,121 units/17.5 remaining years of the 20-year DAP = 124.7 units
per year) results in a total of 997 units on 75 opportunity sites for the remaining eight years of
the RHNA cycle.
Conclusion. There is sufficient capacity to accommodate 997 units during the Housing Element
planning period within the Downtown Mixed Use District.

2015-2023 Berkeley Housing Element - Appendix A – Site Inventory and Capacity Analysis Background by Area
210
1
Table A-2: Downtown Area Housing Opportunity Site Inventory and Residential Capacity Analysis - 2012 C-DMU
Regulations
Building Size Lot Size Estimated
Capacity
#
on
Map
Assessor’s
Parcel
Number
Street Address Sub-
Area
Gen.
Plan
Desig-
nation
Existing Use Sq.
Feet FAR
1 Acres
Sq.
Feet
Units/
Acre
Unit
Yield
1 057
205100300 1908 SHATTUCK Core AC Empty Lot 3,114 0.88 0.08 3,520 135 10
2 057
205100500 1926 SHATTUCK Core AC Optometrist and The Bake Shop 2,842 0.88 0.07 3,241 135 10
3 057
205901200 1933 M L KING JR Buffer DT Flamingo's Cleaners 2,760 0.58 0.11 4,729 100 10
4 057
205901000 1909 UNIVERSITY Buffer DT Utrect Art Supplies 4,725 0.96 0.11 4,937 100 11
5 057
205900900 1915 UNIVERSITY Buffer DT Hot Tubs 4,673 0.94 0.11 4,950 100 11
6 057
205900800 1921 UNIVERSITY Buffer DT Mittaphab Restaurant 3,015 0.61 0.11 4,950 100 11
7 057
205900700 1929 UNIVERSITY Buffer DT Fred’s Market 4,120 0.83 0.11 4,937 100 11
8 057
205900600 1941 UNIVERSITY Buffer DT Wings and Strings Restaurant 7,011 1.42 0.11 4,950 100 11
9 057
205301402 2011 UNIVERSITY Core DT Shrimati's 4,868 1.18 0.09 4,125 135 12
10 057
205301100 2017 UNIVERSITY Core DT Round Table Pizza 4,320 0.45 0.22 9,505 135 29
11 057
205300801 2035 UNIVERSITY Core DT Lhasa Hair Salon 11,816 0.95 0.28 12,388 135 38
12 057
205302201 0 BERKELEY Core MDR City Owned Parking Lot 0 0.00 0.94 40,945 135 126
13 057
205300500 2067 UNIVERSITY Core DT TGI's Sushi 6,914 1.25 0.13 5,520 135 17
14 057
205300402 2071 UNIVERSITY Core DT
The Cutting Room, Taiwan
Restaurant 4,284 0.68 0.15 6,318 135 19
15 057
205300301 1998 SHATTUCK Core DT McDonald's 12,476 1.55 0.18 8,058 135 24

2015-2023 Berkeley Housing Element - Appendix A – Site Inventory and Capacity Analysis Background by Area
211
Table A-2: Downtown Area Housing Opportunity Site Inventory and Residential Capacity Analysis - 2012 C-DMU
Regulations
Building Size Lot Size Estimated
Capacity
#
on
Map
Assessor’s
Parcel
Number
Street Address Sub-
Area
Gen.
Plan
Desig-
nation
Existing Use Sq.
Feet FAR
1 Acres
Sq.
Feet
Units/
Acre
Unit
Yield
16 057
205300302 1984 SHATTUCK Core DT The Mediterranean Café 2,869 1.82 0.04 1,575 135 4
17 057
205300200 1974 SHATTUCK Core DT
Shattuck Avenue Spats
Restaurant 3,850 0.74 0.12 5,200 135 16
18 057
205300100 1950 SHATTUCK Core DT Radstons Office Supply 5,476 0.82 0.15 6,644 135 20
19 057
204600100 2108 BERKELEY Core DT
Missing Link Bicycle Coop,
Vacuum store 17,247 0.98 0.40 17,580 135 54
20 057
204601100 1987 SHATTUCK Core DT
El Sombrero Taqueria, Cutaway,
Brazil Café 7,540 0.99 0.17 7,579 135 23
21 057
204601000 2111 UNIVERSITY Core DT Krishna Copy Center 4,820 0.75 0.15 6,467 135 20
22 057
204600300 0 BERKELEY Buffer DT Parking Lot 0 0.00 0.12 5,428 100 12
23 057
204600600 1900 WALNUT Core DT Parking Lot 0 0.00 0.13 5,632 135 17
24 057
202401300 2099 M L KING JR Buffer DT Goodyear Berkeley 4,250 0.34 0.28 12,330 100 28
25 057
202401200 1911 ADDISON Buffer DT
English Language Institute of the
Bay Area 6,000 0.87 0.16 6,895 100 15
26 057
202401100 1915 ADDISON C-2 Buffer DT Law Offices 6,199 0.89 0.16 7,000 100
69 b
27 057
202400700 1931 ADDISON Buffer DT Ed's Best Auto Service 3,600 1.00 0.08 3,600 100
28 057
202400501 1933 ADDISON Buffer DT Downtown Berkeley SMOG 7,790 0.72 0.25 10,830 100 24
29 057
202400102 1974 UNIVERSITY Buffer DT Firestone Car Service 7,352 0.32 0.52 22,838 135 98
b
30 057
202501300 2000 UNIVERSITY
Down-
town DT Au Coquelet Café 6,590 1.45 0.10 4,539 135 14
31 057
202502300 2009 ADDISON Core DT Berkeley Repertory Theatre 4,200 0.41 0.24 10,352 135 32

2015-2023 Berkeley Housing Element - Appendix A – Site Inventory and Capacity Analysis Background by Area
212
Table A-2: Downtown Area Housing Opportunity Site Inventory and Residential Capacity Analysis - 2012 C-DMU
Regulations
Building Size Lot Size Estimated
Capacity
#
on
Map
Assessor’s
Parcel
Number
Street Address Sub-
Area
Gen.
Plan
Desig-
nation
Existing Use Sq.
Feet FAR
1 Acres
Sq.
Feet
Units/
Acre
Unit
Yield
32 057
202501900 2058 UNIVERSITY
Down-
town DT The Goodwill Store 8,375 0.99 0.20 8,502 135 26
33 057
202500100 2000 SHATTUCK
Down-
town DT Citibank 13,844 1.04 0.31 13,375 135 41
34 057
202500400 2018 SHATTUCK Core DT The Other Change of Hobbit 5,776 0.94 0.14 6,173 135 19
35 057
203401100 2138 UNIVERSITY C-2 Core DT
Instant Copying and Laser
Printing 5,700 1.08 0.12 5,298 135 16
36 057
202201800 2109 M L KING JR C-2 Buffer DT PGE Center 5,133 0.42 0.28 12,282 100 28
37 057
202201500 1916 ADDISON Buffer DT Parking Lot 0 0.00 0.15 6,750 100 15
38 057
202200301 2108 MILVIA
Down-
town DT Firestone Car Service 0 0.00 0.16 6,950 135 21
39 057
202301601 0 MILVIA Core DT Parking Lot 80 0.01 0.16 7,181 135 22
40 057
202302500 2072 ADDISON Core DT 24 Hour Fitness 10,125 0.99 0.23 10,230 135 31
41 057
202300200 2116 SHATTUCK Core DT Café Firenze 2,600 0.91 0.07 2,860 135 8
42 057
203201700 130 BERKELEY Core DT Little Hunan, Newberry's Gifts 2,675 1.03 0.06 2,597 135 8
43 057
203201800 134 BERKELEY Core DT
Little Mandarin, East Bay Photo
Lab 2,208 1.02 0.05 2,174 135 6
44 057
203200503 2119 CENTER Core DT Parking Lot 14,765 0.39 0.87 37,739 135 116
45 057
202600412 2068 CENTER Core DT Peking Express Chinese Food 4,001 0.85 0.11 4,681 135 14
46 057
202600405 2190 SHATTUCK Core DT Ross Old Building 54,385 2.72 0.46 19,966 135 61
47 057
203100600 2187 SHATTUCK Core DT Walgreens 11,970 1.13 0.24 10,570 135 32

2015-2023 Berkeley Housing Element - Appendix A – Site Inventory and Capacity Analysis Background by Area
213
Table A-2: Downtown Area Housing Opportunity Site Inventory and Residential Capacity Analysis - 2012 C-DMU
Regulations
Building Size Lot Size Estimated
Capacity
#
on
Map
Assessor’s
Parcel
Number
Street Address Sub-
Area
Gen.
Plan
Desig-
nation
Existing Use Sq.
Feet FAR
1 Acres
Sq.
Feet
Units/
Acre
Unit
Yield
48 057
203100400 2121 ALLSTON C-2 Core DT Berkeley Central Library 24,632 1.23 0.46 20,070 135 62
49 057
203100101 2128 OXFORD Core DT Starbucks 1,856 0.15 0.29 12,500 135 38
50 057
202700202 2210 HAROLD Core DT
Dharma Books & Art, Mangalam
Centers 6,490 1.08 0.14 6,000 135 18
51 057
203000100 2108 ALLSTON Core DT
Berkeley Wireless Research
Center 26,140 1.47 0.41 17,822 135 55
52 057
203001200 2219 SHATTUCK Core DT The Luggage Center 6,854 2.17 0.07 3,154 135 9
53 057
202801300 2000 KITTREDGE Buffer DT Avis Rental Cars 2,968 0.26 0.26 11,263 100 25
54 057
202801200 2235 MILVIA
Down-
town DT Doggie High Restaurant 1,621 0.63 0.06 2,588 135 8
55 057
202900204 2176 KITTREDGE Core DT Touchless Car Wash 4,676 0.17 0.62 26,842 135 83
56 055
189301600 2301 SHATTUCK
Down-
town DT The Mechanics Bank 5,766 0.61 0.22 9,430 135 29
57 055
189302000 0 BANCROFT
Down-
town DT Parking Lot 0 0.00 0.15 6,500 135 20
58 055
189300100 2190 BANCROFT
Down-
town DT
Looney's Smokehouse Bar-B-
Que 4,243 0.54 0.18 7,840 135 24
59 055
189301300 2327 SHATTUCK
Down-
town DT Venus Restaurant 1,000 0.96 0.02 1,041 135 3
60 055
189301200 2333 SHATTUCK
Down-
town DT Union Bank of California 17,928 1.89 0.22 9,464 135 29
61 055
189301100 2107 DURANT
Down-
town DT
Parking Lot behind Union Bank
of California 0 0.00 0.15 6,500 135 20
62 055
189500800 2023 CHANNING R-4 Buffer A. HDR Residential Structure (Unused) 3,160 0.71 0.10 4,420 100 10
63 055
189501900
2025 CHANNING
/2024 Durant Buffer DT Empty Parking Lot/Church 0 0.00
0.215
2
9,23022
,704 100 2179
b,c

2015-2023 Berkeley Housing Element - Appendix A – Site Inventory and Capacity Analysis Background by Area
214
Table A-2: Downtown Area Housing Opportunity Site Inventory and Residential Capacity Analysis - 2012 C-DMU
Regulations
Building Size Lot Size Estimated
Capacity
#
on
Map
Assessor’s
Parcel
Number
Street Address Sub-
Area
Gen.
Plan
Desig-
nation
Existing Use Sq.
Feet FAR
1 Acres
Sq.
Feet
Units/
Acre
Unit
Yield
64 055
189501805 2352 SHATTUCK
Down-
town DT Blockbuster Video 26,246 0.56 1.08 47,045 135 132
65 055
189201600 2349 SHATTUCK
Down-
town DT Pegasus Books 9,360 1.00 0.21 9,360 135 29
66 055
189201500 2367 SHATTUCK
Down-
town DT Thalassa 4,975 0.81 0.14 6,115 135 18
67 055
189201801 2110 DURANT
Down-
town DT
Toyota of Berkeley Parking
Garage 5,200 0.36 0.33 14,300 135 44
68 055
189201102 2113 CHANNING
Down-
town DT Parking Lot 0 0.00 0.15 6,500 135 20
69 055
189602700 2036 CHANNING Buffer DT Toyota Service Center 10,320 0.96 0.25 10,800 100 24
70 055
189602800 2038 CHANNING Buffer DT Toyota Parking Lot 0 0.00 0.14 6,075 100 13
71 055
189600100 2410 SHATTUCK
Down-
town DT Toyota of Berkeley 10,025 0.82 0.28 12,200 135 37
72 055
189600200 2414 SHATTUCK
Down-
town DT Optometry 1,188 1.05 0.03 1,135 135 3
73 055
189600300 2420 SHATTUCK
Down-
town DT Caffe Giovanni 4,609 0.98 0.11 4,717 135 14
74 055
189600400 2428 SHATTUCK
Down-
town DT Vacant Retail 3,560 0.79 0.10 4,497 135 13
75 055
189600500 2440 SHATTUCK
Down-
town DT Dollar Tree 8,400 0.98 0.20 8,592 135 26
76 055
189600600 2041 HASTE Buffer DT Parking Lot behind Dollar Tree 700 0.08 0.19 8,437 100 19
77 055
189101101 2115 HASTE
Down-
town DT Apartment Building 0 0.00 0.10 4,500 135 13
78 055
189700600 2450 SHATTUCK
Down-
town DT
Laundromat , Tuk Tuk Thai,
Starving Musician 12,300 0.78 0.36 15,750 135 48
79 055
189700103 2480 SHATTUCK
Down-
town DT Tuesday Morning 10,441 1.42 0.17 7,370 135 22

2015-2023 Berkeley Housing Element - Appendix A – Site Inventory and Capacity Analysis Background by Area
215
Table A-2: Downtown Area Housing Opportunity Site Inventory and Residential Capacity Analysis - 2012 C-DMU
Regulations
Building Size Lot Size Estimated
Capacity
#
on
Map
Assessor’s
Parcel
Number
Street Address Sub-
Area
Gen.
Plan
Desig-
nation
Existing Use Sq.
Feet FAR
1 Acres
Sq.
Feet
Units/
Acre
Unit
Yield
80 055
189802900 2489 MLK N/A DT Empty Lot 0 0.00 0.20 8,590 75
b 14
a - C-DMU zoning (BMC 23E.68) Total Acres 16.30 Total Units 2,121
b - Unit yield updated to reflect number of units approved by the City with a Use Permit
c – This project spans 2025 Channing and 2024 Durant, for a combined parcel total of 22,074 square feet. 1 - Floor Area Ratio

2015-2023 Berkeley Housing Element Update
Appendix A – Site Inventory and Capacity Analysis Background by Area
216 February 2015 DRAFT
Southside Plan Opportunity Sites and Residential Capacity
Analysis
In September 2011, the City adopted the Southside Plan (SSP), which was jointly prepared by
the City of Berkeley and the University of California Berkeley. The southside area is composed
of over 170 acres of land located immediately south of the University of California Berkeley
campus and serves as a major source of housing for those connected to the University. The
area also serves the population with student-oriented retail and restaurants. The southside area
is served by several major bus routes.
The University owns and uses approximately one-third of the land area in the southside for
dormitories and office space; as a state institution, land owned by the University is not subject to
local land use regulations. The University agreed to work with the City to create the SSP, and in
turn, use it as a guide for future development by the University in the area.
1. Identifying Opportunity Sites in the Southside Area
The following guidelines were used to identify opportunity sites for the SSP environmental
impact analysis:
Sites with surface parking lots.
Sites with one-story buildings without architectural or historical significance.
Vacant sites.
Sites with seismically hazardous buildings that would be expensive to retrofit.
With these guidelines, the SSP identified over 80 different opportunity sites. The EIR
recognized that not all of these sites would be developed within the timeframe of the Plan and
created a three-tier system based upon the likelihood of development. Only the remaining 23
“Tier 1” sites are included in the Housing Element analysis, as they are the most likely to be
developed. These sites are listed in Table A-3 and illustrated in Map A-4 in Appendix A.
2. Southside Area Housing Capacity
The Southside Plan resulted in the rezoning of the majority on the planning area, including the
inclusion of two new residential zoning districts (Residential South Side (R-S) and the
Residential Southside Mixed Use (R-SMU) Districts). To analyze the residential development
capacity of these new standards, the Southside EIR made residential floor area ratio (FAR)
assumptions for each zoning district based upon these new standards.5 The residential FAR
was then multiplied by the lot size of each Tier 1 opportunity site to calculate “total proposed
potential residential square feet” for all of the Tier 1 sites. The EIR assumed that only 75% of
the total residential square feet would be developed during the planning period of the Southside
5 See Attachment 2 of Southside EIR Appendix E.

2015-2023 Berkeley Housing Element
Appendix A – Site Inventory and Capacity Analysis Background by Area
217
Plan. A 35% increase in residential floor area was added for state density bonus. The average
unit size was assumed to be 800 square feet, so the residential floor area was divided by 800 to
estimate the total number of housing units. With these calculations, the Southside Plan EIR
estimated 430 potential units on the remaining Tier 1 opportunity sites.
The Southside Plan EIR estimated all these new housing units will be built by the year 2020
Thus for the purpose of the Housing Element, the City estimates the capacity of remaining 23
Tier 1 opportunity sites, or 430 new dwelling units, could be built in the SSP area during the
Element planning period.

2009 Berkeley Housing Element - Appendix A – Site Inventory and Capacity Analysis Background by Area
218
Table A-3: Southside Area Housing Opportunity Site Inventory and Residential Capacity Analysis
Building Size Lot Size Estimated Capacity
#
on Map
Assessor’s
Parcel
Number
Street Address Zoning
District
General
Plan
Designati
on
Existing Usea Square
Feet FAR
1 Acres
Square
Feet
Units /
Acre
Unit
Yield
1 055
183800102
2500
Telegraph
C-T AC ONE-STORY STORE 12,230 0.94 0.30 12,992 55 16.28
2 055
187500400
2503 Haste C-T AC VACANT
COMMERCIAL LAND 0 0.00 0.20 8,800 74 14.92
3 055
183102500
2316 Dwight R-3R-4 HDR MEDICAL-DENTAL 2,331 0.33 0.16 7,129 48 7.85
4 055
189001702
2126 Haste R-SR-4 HDR MEDICAL-DENTAL 11,770 0.58 0.46 20,250 83 38.44
5 055
183902000
2539
Telegraph
C-T AC 1 TO 5 STORY
OFFICES 8,368 0.50 0.38 16,678 48 18.36
6 055
183700200
2566
Telegraph
C-T AC ONE-STORY STORE 8,610 1.15 0.17 7,500 48 8.26
7 055
183700100
2556
Telegraph
C-T AC ONE-STORY STORE 10,141 0.99 0.23 10,200 48 11.23
8 055
183002200
2228 Dwight R-3R-4 HDR MULTIPLE
RESIDENTIAL PROP 5,912 0.44 0.31 13,500 48 14.86
9 055
185000303
2750 Dwight R-3HR-4 HDR MULTIPLE
RESIDENTIAL PROP 13,614 1.23 0.25 11,050 48 12.17
10 055
187502400
2511 Dwight C-T AC STORE ON FIRST
FLOOR 11,380 1.08 0.24 10,500 62 15.02
11 055
187602100
2542 Durant C-T AC MULTIPLE
RESIDENTIAL PROP 0 0.00 0.14 6,292 50 7.17
12 055
187602300
2510 Durant C-T AC ONE-STORY STORE 6,080 0.80 0.17 7,600 50 8.66
13 055
188400204
2337 Channing R-SR-4 HDR CHURCHES 0 0.00 0.18 7,800 94 16.78
14 055
186800201
2412 Piedmont R-3HR-4 HDR FRATERNITIES/SOR
ORITIES 10,703 0.68 0.36 15,751 22 8.09
15 055
187601100
2375
Telegraph
C-T AC STORE ON FIRST
FLOOR 13,823 1.06 0.30 13,000 74 22.05
16 055
187201100
2613 Channing R-SMUR-4 HDR HOTEL 0 0.00 0.16 6,970 94 15.00

2015-2023 Berkeley Housing Element - Appendix A – Site Inventory and Capacity Analysis Background by Area
219
17 055
188500201
2315 Durant R-SMUR-4 HDR PARKING LOTS 0 0.00 0.30 13,000 184 54.79
18 055
187800501
2433 Durant C-T AC STORE ON FIRST
FLOOR 23,907 1.84 0.30 13,000 55 16.29
19 055
187701100
2347
Telegraph
C-T AC BANKS 10,295 1.03 0.23 10,000 74 16.96
20 055
188500102
2362 Bancroft R-SMUR-4 HDR CHURCHES 0 0.00 0.27 11,700 184 49.31
21 055
188500103
2398 Bancroft R-4 HDR CHURCHES 3,172 0.32 0.23 10,000 184 42.15
22 055
187700800
2519 Durant C-T AC ONE-STORY STORE 8,916 0.83 0.25 10,790 74 18.30
23 055
187800100
2300
Telegraph
C-T AC ONE-STORY STORE 10,395 1.04 0.23 10,000 74 16.96
24 055
187700100
2590 Bancroft C-T AC STORE ON FIRST
FLOOR 13,424 1.02 0.30 13,130 74 22.27
Total Acres 5.91
Total
Units 430.0
a Alameda County Assessor land use records.
2015-2023 Berkeley Housing Element
Appendix A – Site Inventory and Capacity Analysis Background by Area
220
Commercial Corridor Opportunity Sites and Residential
Capacity Analysis
The City of Berkeley identified the commercial zoning districts as areas with the greatest
potential for new units and a track record of units being built. The majority of the commercial
districts are located along the four main corridors of University Avenue, San Pablo Avenue,
Telegraph Avenue, and Shattuck Avenue/Adeline Street. Each corridor is served by at least
three AC Transit lines.
Corridors with identified opportunity sites are located in the following zoning districts: C-1, C-N,
C-NS, C-SA, and C-W. The commercial districts within the downtown and southside areas are
excluded from the commercial corridor analysis.
1. Identifying Opportunity Sites along the Commercial Corridors
Opportunity sites along the commercial corridors were identified using Alameda County parcel
data and a field survey. Parcels with a minimum lot size of 10,000 square feet were included as
an opportunity site if they met the following criteria:
For 10,000 to 20,000 square foot parcels, a maximum existing FAR of 0.2
For 20,001+ square foot parcels, a maximum existing FAR of 0.7.
No City-designated Landmarks or Structures of Merit.
No use considered unlikely to change.6
This analysis did not identify all underutilized sites with redevelopment potential; it identified the
sites considered most likely to redevelop based on low levels of existing development. Most of
the City of Berkeley commercial corridors are developed with one- or two-story commercial
structures, while the majority of commercial zoning districts allow from three to five stories.
Additionally, the commercial districts allow mixed-use buildings, which generally provide more
development potential and revenue than commercial-only buildings. Therefore, many
commercial sites are underutilized compared to allowable building sizes and uses. Berkeley
staff identified a subset of the underutilized sites most likely to be redeveloped using recent
development trends.
The City reviewed a sample of 24 projects with recent land use entitlements for mixed-used
multi-family housing projects. These examples were used to develop the criteria for opportunity
sites on the commercial corridors. The existing FAR on the 24 sample sites that have been
approved for redevelopment had the following characteristics:
Sites sized 10,000-20,000 sq.ft. - previous FAR ranged from 0.0 to 0.45, averaged 0.17
6 Uses considered unlikely to change despite being located on an underutilized site include non-profit
organizations, religious institutions, grocery stores, and buildings with obvious recent tenant
improvements.

2015-2023 Berkeley Housing Element
Appendix A – Site Inventory and Capacity Analysis Background by Area
221
Sites sized 20,001+ sq.ft. - previous FAR ranged from 0.0 to 1.8, averaged 0.457
Staff then conducted a field survey to verify the parcel size, existing FAR, and existing land use
on the sites. Some parcels that do not meet all the qualifications above are included as
opportunity sites based on adjacency to sites that do meet the qualifications and are under the
same ownership.
The criteria also took into consideration numerous factors, including:
The age of the properties: the City identified the age of the existing structures on the
sites. Most sites were developed before 1970 making the structures roughly 40 years old
or older. In general, older buildings are more likely to redevelop than newer structures,
however, sites with recent tenant improvements that suggest a disincentive to redevelop
were excluded.
Redevelopment trends: the commercial corridor criteria described above (parcel size
and existing FAR) is based on review of existing conditions on a sample of sites with
land use entitlements for new mixed-used projects.
Market conditions: the inner Bay Area is characterized by high land and construction
costs combined with a limited supply of vacant, available and developable land, which
results in the vast majority of new construction being redevelopment of non-vacant sites.
Existing land uses: types of uses deemed unlikely to change, such as non-profit
organizations, religious uses, and grocery stores, were excluded from the list.
Historic structures: buildings with a City of Berkeley Landmark or Structure of Merit were
excluded from the list.
The FAR assumptions used in the Housing Element are considered conservative because, in
general and depending on the type of use, the value of the land will be greater than the value of
the buildings on land with low existing FAR. When land values are greater than the value of
existing development there is an incentive to redevelop the land with more valuable buildings
and uses. A higher maximum FAR for larger sites reflects the assumption that larger sites are
more attractive for development; therefore the value of the existing development on the site is
less of a constraint on the likelihood of future development than with smaller lots.
7 The City selected 0.7 as the FAR threshold for sites over 20,000 sq. ft., rather than the past
development average of 0.45, based on the experience of the planning department staff and because the
existing FAR range on non-vacant sites in the sample survey includes some sites with and existing FAR
much higher than 0.45. The City does not have complete records of the previous built area on
redeveloped sites, but based on the experience of project planners, an estimate of 0.7 is considered a
reasonable cutoff for identifying sites likely to redevelop in the near future.
However, for a more conservative estimate, the sites with an FAR over 0.4 could be considered “Tier 2”
development site. If the City were to use this sorting mechanism, the resulting total unit capacity would be
1,794 units for the Commercial Corridor area, a reduction of 667 “Tier 2” units in the Housing Element
planning period..

2015-2023 Berkeley Housing Element
Appendix A – Site Inventory and Capacity Analysis Background by Area
222
As a result of this process, staff originally identified 69 opportunity sites along the commercial
corridors, 68 of which are still available. The 68 sites have a combined total of 31.88 acres and
range from 0.11 acres to 3.21 acres in size. The total estimated capacity of these sites is 2,461
units, as discussed below. These sites are illustrated in Map A-5, Map A-6, Map A-7, Map A-8,
Map A-9 and Map A-10 and are listed in Table A-6.
2. Commercial Corridor Housing Capacity
The Berkeley zoning ordinance does not include a density standard (units-per-acre) for mixed
use or residential development in the commercial zoning districts. Density is limited by
development standards, parking and useable open space requirements. Therefore, staff used
the following steps to develop density assumptions for each zoning district:
Averaged units-per-acre for each zoning district based on construction in those districts
over the past 10 years.
Reduced the average units-per-acre for opportunity sites within the University Area
Specific Plan by 24% to account for UASP zoning changes.8
Estimated units-per-acre for the C-N and C-NS districts using a combination of past
development and a prototypical site analysis.
Reduced units-per-acre for all zoning districts by 20% to remove density bonus units.9
The resulting density assumptions were applied to the opportunity sites within each zoning
district providing a housing capacity assumption for each site. With these calculations, the
remaining 68 opportunity sites provide capacity for 2,461 total dwelling units, ranging from 55 to
97 units per acre.
Table A-4 illustrates the estimated capacity for each zoning district. Table A-5 illustrates the
actual average densities of projects that received land use entitlements by zoning district from
1999-2009, which were used to calculate the assumed densities.
The City of Berkeley considers it very likely the opportunity sites in the commercial districts will
redevelop with a mixed-use building, rather than a commercial-only building, because the
majority of recent redevelopment of sites zoned for commercial uses has been construction of
new buildings with residential uses above ground floor commercial. This is due to both market
conditions and regulations that favor mixed-use over commercial-only buildings in commercial
districts. Residential and retail uses command a higher rent then office uses, therefore there is a
8 This reduction is based on analysis of the capacity reduction resulting from the UASP zoning changes in
the April 28, 2004 Planning Commission staff report. 9 There is a strong record of projects using state density bonus law in Berkeley, however, to develop a
conservative estimate of residential capacity, the City removed from the actual average densities an
allowable percentage of density bonus units. Therefore, future projects could have greater densities than
those assumed for this analysis. Not all past projects had density bonus units and in recent years some
may have had a density bonus greater than 20 percent. By reducing the overall average density for the
district, this provides and approximation of units per acre without density bonus units.

2015-2023 Berkeley Housing Element
Appendix A – Site Inventory and Capacity Analysis Background by Area
223
strong economic incentive to build a mixed-use building with residential units over a retail space.
Additionally, the Berkeley zoning ordinance favors mixed-use buildings over exclusively
residential or commercial buildings in most commercial zoning districts by allowing mixed-use
buildings to be slightly larger.
Table A-4: Capacity Estimates by Zoning District
Commercial Corridors (2014-2022)
Zoning
District Number of Sites
Total
Acres
Estimated
Units/Acre Total Units3
C-W 36 15.21 82 1,229
C-1 1 0.31 97 30
C-1 (UASP)1 10 3.17 71 221
C-SA 13 9.61 79 751
C-NS2 4 2.36 55 128
C-N2 4 1.21 87 102
Total 68 31.88 2,461
1 - The UASP amendments reduce housing unit yield in the C-1 district by an estimated 24%.
2 - Based on staff estimates.
3 - Total based on the sum of estimated units on each site from Table A-6.
Table A-5: Summary of Projects 1999-2009
Basis for Density Assumptions
Zoning
District
No. of
Past
Projects Acres Units
Average
Units/Acr
e
-20%,
Without
Density
Bonus
C-W 17 6.87 680 99 82
C-1 13 5.12 598 117 97
C-2 7 4.54 615 136 113
C-SA 8 2.54 244 95 79
C-N 1 0.20 21 105 87
1 - Staff also analyzed the hypothetical density of an opportunity site in the C-N to confirm
this density estimate is accurate.

2015-2023 Berkeley Housing Element - Appendix A – Site Inventory and Capacity Analysis Background by Area
224
Table A-6: Commercial Corridors Housing Opportunity Site Inventory and Residential Capacity Analysis
Building Size Lot Size Estimated
Capacity
# on
Map
Assessor’s
Parcel
Number
Street Address Zoning
District
Gen.
Plan
Desig-
nation
Existing Use Bldg.
Age
Sq.
Feet FAR
1 Acres
Sq.
Feet
Units/
Acre
Unit
Yield
1 057
210000702 1914 Fifth C-W AC Zentrum Furniture
b 1980s 13,200 0.36 0.84 36,621 82 68
2 057
210000104 750 Hearst C-W AC Anthropologie, Paper Source
b 1980s 16,700 0.42 0.92 40,003 82 75
3 057
209601001 833 University C-W AC University Gasoline 1957 1,334 0.12 0.25 10,750 82 20
4 057
208502600 1111 University C-1 (UASP) AC Halmar's Work clothes Center 1950 4,000 0.19 0.39 16,900
a 71 27
5 056
197900100 1198 University C-1 (UASP) AC Solar Car Wash 1965 2,000 0.16 0.28 12,330 71 20
6 056
198100101 1248 University C-1 (UASP) AC Shell Gas Station 1964 1,876 0.08 0.52 22,800 71 37
7 057
207200600 1461 University C-1 (UASP) MDR Rodeway Inn 1947 15,378 0.44 0.40 17,400
a 71 28
8 057
207200200 1499 University C-1 (UASP) AC 76 Gas Station 1963 1,189 0.11 0.25 10,704 71 17
9 056
200301601 1500 University C-1 (UASP) AC Chevron Gas Station 1978 732 0.05 0.31 13,700 71 22
10 056
200302401 1548 University C-1 (UASP) AC Five Star Video
b 1958 3,600 0.44 0.19 8,260 71 13
11 056
200302500 1556 University C-1 (UASP) AC Five Star Video parking
b n/a 0 0.00 0.14 6,210 71 10
12 057
207000300 1699 University C-1 (UASP) AC Mike's Auto 1948 1,287 0.11 0.26 11,500 71 18
13 057
201602702 1840 University C-1 (UASP) AC Valero Gas Station 1983 3,052 0.17 0.42 18,304 71 29
14 053
162901901 2959 San Pablo C-W AC Ace Smog Check Center 1948 1,287 0.11 0.26 11,364 82 21
15 053
166101801 2840 San Pablo C-W AC Parking and vacant building 1925 828 0.07 0.27 11,850 82 22
16 054
176300400 2618 San Pablo C-W AC
Roundtree’s Night Clubc
(abandoned) 1970 6,398 0.88 0.17 7,290 82 13

2015-2023 Berkeley Housing Element - Appendix A – Site Inventory and Capacity Analysis Background by Area
225
Table A-6: Commercial Corridors Housing Opportunity Site Inventory and Residential Capacity Analysis
Building Size Lot Size Estimated
Capacity
# on
Map
Assessor’s
Parcel
Number
Street Address Zoning
District
Gen.
Plan
Desig-
nation
Existing Use Bldg.
Age
Sq.
Feet FAR
1 Acres
Sq.
Feet
Units/
Acre
Unit
Yield
17 054
176300300 2612 San Pablo C-W AC Vacant Lot n/a 0 0.00 0.25 10,900
a 82 20
18 054
176300100 1050 Parker C-W M Vacant Lot n/a 0 0.00 0.29 12,600
a 82 23
19 054
178000801 2546 San Pablo C-W M Bank of America and parking 1983 16,030 0.25 0.60 26,000
a 82 48
20 054
178101501 2527 San Pablo C-W AC Babbitt's Brake Service 1963 1,117 0.08 0.31 13,720 82 25
21 056
193200803 2424 San Pablo C-W AC
A La Car Automobile, Solar Car
Wash 1962 3,576 0.11 0.74 32,212 82 60
22 056
192802701 2407 San Pablo C-W AC Ohmega Salvage 1953 374 0.02 0.35 15,152 82 28
23 056
193200401 2400 San Pablo C-W AC Ohmega Salvage 1925 3,466 0.18 0.45 19,575 82 36
24 056
193302403 2366 San Pablo C-W AC Used Car Lot 1964 1,364 0.09 0.33 14,445 82 27
25 056
193300602 2332 San Pablo C-W AC East Bay Nursery 1951 4,878 0.11 0.74 32,200
a 82 60
26 056
198304001 2197 San Pablo C-W AC Jack in the Box 1980s 2,722 0.16 0.37 16,300
a 82 30
27 056
197701101 2136 San Pablo C-W AC ACDelco Car Care 1923 9,373 0.40 0.54 23,625 82 44
28 056
197700605 2100 San Pablo C-W AC U-Haul 1951 1,440 0.07 0.50 21,666 82 40
29 056
197800802 2040 San Pablo C-W AC India Fashion, Laundry, Market 1950s 10,584 0.52 0.31 13,500
a 82 25
30 057
208502500 1931 San Pablo C-W AC 99 Cent Store 1920 21,208 0.44 0.53 23,000
a 82 43
31 057
208800400 1900 San Pablo C-W AC Vacant Lot n/a 0 0.00 0.27 11,800 82 22
32 057
208602903 1819 San Pablo C-W AC Purrfect Auto Service, Karate 1968 2,940 0.17 0.41 17,798 82 33

2015-2023 Berkeley Housing Element - Appendix A – Site Inventory and Capacity Analysis Background by Area
226
Table A-6: Commercial Corridors Housing Opportunity Site Inventory and Residential Capacity Analysis
Building Size Lot Size Estimated
Capacity
# on
Map
Assessor’s
Parcel
Number
Street Address Zoning
District
Gen.
Plan
Desig-
nation
Existing Use Bldg.
Age
Sq.
Feet FAR
1 Acres
Sq.
Feet
Units/
Acre
Unit
Yield
33 058
212800301 1620 San Pablo C-W AC Golden Bear Inn, Genki Sushi 1920s 17,684 0.48 0.85 37,000 82 69
34 059
231000205 1500 San Pablo C-W AC Green Motors 1960s 24,021 0.33 1.15 50,000
a 82 93
35 060
235300203 1300 San Pablo C-W AC Chevron Gas Station 1978 1,500 0.11 0.31 13,440 82 25
36 060
240502000 1299 San Pablo C-W AC Yen's Auto 1950s 1,485 0.11 0.30 13,000 82 24
37 060
235401200 1031 Gilman C-W AC Parking Lot
b n/a 1,032 0.17 0.14 6,169 82 11
38 060
235401100 1041 Gilman C-W AC Happy Doughnuts
b 1950s 0 0.00 0.20 8,700 82 16
39 060
235401001 1049 Gilman C-W AC Gilman Street Bingo 1940s 18,968 0.64 0.68 29,813 82 56
40 060
235401302 1233 Tenth C-W AC Parking Lot n/a 0 0.00 0.32 13,750 82 25
41 060
235400200 1200 San Pablo C-W AC Church's Chicken 1980s 1,335 0.10 0.29 12,800 82 24
42 060
239000701 1198 San Pablo C-W AC McDonald's 1980s 3,913 0.15 0.59 25,500 82 47
43 060
241000500 1197 San Pablo C-W AC Gilman Auto
b 1950s 2,165 0.29 0.17 7,500 82 14
44 060
241000600 1193 San Pablo C-W AC Parking Lot
b n/a 0 0.00 0.11 5,000 82 9
45 060
241000700 1187 San Pablo C-W AC General Transmissions
b 1970s 2,784 0.37 0.17 7,500 82 14
46 052
157800602 2996 Telegraph C-1 AC Chevron Gas Station 1986 4,438 0.12 0.85 36,812 97 81
47 055
183600603 2600 Telegraph C-1 AC Berkeley Auto Care 1956 1,176 0.09 0.31 13,711 97 30
48 053
159703904 0 Adeline C-SA AC Parking Lot n/a 0 0.00 3.21 140,000 79 253

2015-2023 Berkeley Housing Element - Appendix A – Site Inventory and Capacity Analysis Background by Area
227
Table A-6: Commercial Corridors Housing Opportunity Site Inventory and Residential Capacity Analysis
Building Size Lot Size Estimated
Capacity
# on
Map
Assessor’s
Parcel
Number
Street Address Zoning
District
Gen.
Plan
Desig-
nation
Existing Use Bldg.
Age
Sq.
Feet FAR
1 Acres
Sq.
Feet
Units/
Acre
Unit
Yield
49 053
159500903 3031 Adeline C-SA AC Marmot Mountain Works 1948 18,368 0.68 0.62 26,968 79 48
50 053
159200100 3000 Shattuck C-SA NC US Smog & Gas 1958 2,430 0.22 0.25 10,900 79 19
51 053
158702003 3001 Shattuck C-SA NC Enterprise Car Rental 1948 857 0.08 0.23 10,134 79 18
52 053
159101803 2001 Ashby C-SA AC Cooperative Credit Union 1969 7,080 0.27 0.60 26,067 79 47
53 053
168502001 2821 Shattuck C-SA AC Buggy Bank Car Display 1980s 832 0.04 0.43 18,634 79 33
54 054
172001802 2747 Shattuck C-SA AC Any Mountain 1940 20,974 0.58 0.83 36,057 79 65
55 054
172300100 2700 Shattuck C-SA AC Mc Kevitt Volvo 1926 22,273 0.48 1.07 46,683 79 84
56 055
182601802 2655 Shattuck C-SA AC Reel Video Store 1923 10,330 0.45 0.53 23,100 79 41
57 055
182602000 2627 Shattuck C-SA AC Best Auto Buyers Center 1941 744 0.05 0.36 15,800 79 28
58 055
182502000 2110 Parker C-SA AC Berkeley Honda Car Lot n/a 0 0.00 0.23 10,125 79 18
59 055
182301101 2104 Dwight C-SA AC Alta Bates Hospital Parking 1955 841 0.02 0.95 41,293 79 74
60 055
182200301 2032 Dwight C-SA AC Alta Bates Hospital Parking 1928 0 0.00 0.29 12,755 79 23
61 058
217801800 1685 Shattuck C-NS NC Commercial Building 1980s 9,480 0.42 0.51 22,425 55 28
62 058
217802401 1607 Shattuck C-NS NC Elephant Pharmacy Building 1930s 17,530 0.59 0.68 29,657 55 37
63 059
226302401 1536 Shattuck C-NS MDR Bank of America Parking n/a 0 0.00 0.39 16,959 55 21
64 059
226100102 1451 Shattuck C-NS NC Longs Drugs 1980s 17,932 0.53 0.77 33,750 55 42

2015-2023 Berkeley Housing Element - Appendix A – Site Inventory and Capacity Analysis Background by Area
228
Table A-6: Commercial Corridors Housing Opportunity Site Inventory and Residential Capacity Analysis
Building Size Lot Size Estimated
Capacity
# on
Map
Assessor’s
Parcel
Number
Street Address Zoning
District
Gen.
Plan
Desig-
nation
Existing Use Bldg.
Age
Sq.
Feet FAR
1 Acres
Sq.
Feet
Units/
Acre
Unit
Yield
65 053
164100905 901 Ashby C-W AC 76 Gas Station 1983 1,872 0.18 0.23 10,200 82 19
66 064
423500804 3009 Ashby C-N NC Coast Gasoline 1950s 1,225 0.08 0.35 15,400 87 30
67 064
423600400 3048 Ashby C-N NC Chevron Gas Station 1978 1,107 0.08 0.31 13,400 87 26
68 060
243503101 1575 Hopkins C-N NC Berkeley Home Real Estate 1930s 1,272 0.12 0.24 10,387 87 20
69 060
243502801 1601 Hopkins C-N NC Revive Salon 1930s 1,722 0.13 0.31 13,498 87 26
Total Acres 31.88 Total Units 2,46
1
“Tier 1” Subtotal 1,79
4
“Tier 2” Subtotal2 667
a - Reduced lot size because of split zoning
b - Included because adjacent to parcel with same owner 1 – Floor Area Ratio
c - Included because vacant building located adjacent to vacant lot 2 – FAR over 0.4

2015 -2023 Berkeley Housing Element
Appendix A – Site Inventory and Capacity Analysis Background by Area
229
Residential Neighborhood Opportunity Sites and Residential
Capacity Analysis
Most parcels in Berkeley’s residentially zoned districts are currently developed with housing.
There are an estimated 239 remaining vacant parcels that are zoned for residential
development. Ninety percent are in the City’s hillside district, which generally has reduced
development potential due to environmental and physical constraints.
Some residentially-zoned lots that are already developed with housing have capacity for
additional units. Berkeley allows “accessory dwelling units” (ADUs) in all residential districts on
parcels developed with a single-family dwelling. Some lots may have room for additional “main”
dwelling units. Therefore, potential for new housing units in the residential zoning districts
comes from three sources: (1) the few remaining vacant lots, (2) adding additional “main” units
to already developed lots, and (3) adding accessory dwelling units to already developed lots.
Table A-9 summarizes the number of units anticipated from each of these sources.
1. Vacant Lots
A list of vacant parcels over 5,000 square feet in size that are zoned for residential use was
compiled using Alameda County land use records.10 Staff confirmed that these parcels are not
currently developed and that they have access to a street. Staff identified a total of 239 lots
meeting these criteria’ 215 of these sites are located in the single-family district in the hillside
overlay (R-1H). This area is characterized by steep slopes, unstable soils, narrow roadways,
and unconventional lot shapes. These physical attributes limit the ability to develop the lots.
Planning records show that 72 new housing units have been built in the R-1H district over the
past 10 years. Therefore, the City assumes construction of new units in the R-1H district will
continue at this rate of roughly seven units per year. Over the eight years remaining in the
planning period, this would result in an estimated development of 56 units in the R-1H district.
For vacant lots in other residential districts, staff estimated the number of potential units based
on either (a) the zoning ordinance density standards (for the R-1, R-1A, R-2, R-2A, and R-2H
lots), or (b) average densities of past development for the zoning districts without density
standards (the R-3 and R-4). Table A-7 summarizes the density assumptions for these districts.
Table A-8 indicates the number of vacant parcels by zoning district and the estimated residential
unit capacity of those parcels, total and those projected to be constructed during this planning
period. Table A-10 includes a list of all the vacant residential sites in the City by address and
Assessor’s Parcel Number and the estimated residential capacity of each lot. Map A-1 shows
the location of all vacant residential lots.
10 5,000 square feet is the minimum allowable lot size in Berkeley.

2015-2023 Berkeley Housing Element
Appendix A – Site Inventory and Capacity Analysis Background by Area
230
Table A-7: Density Assumptions for Residential Zoning
Districts*
Zoning
District
Zoning
Ordinance
Section Allowable/Estimated Density
R-1 (R-
1H)
23D.16.070 1 unit per lot with 5,000 square foot minimum lot
size
R-1A 23D.20.070 2 units maximum with 4,500 square foot min. lot
size
R-2 (R-
2H)
23D.28.070 1 unit / 2,500 square feet of lot space, plus one unit
for remaining 2,000-2,499 square feet of lot space
R-2A 23D.32.070 1 unit / 1,650 square feet of lot space, plus one unit
for remaining 1,300-1,649 square feet of lot space
R-3 23D.36.070 28 units / acre based on a sample of past
development densities
R-4 23D.40.070 48 units / acre based on a sample of past
development densities
* Does not include Residential Districts fully encompassed by the Southside Plan (i.e. R-S and R-SMU).
Table A-8: Vacant Residential Lots and Estimated
Residential Capacity
Zoning District No. of Lots Total Est. No.
Units
Est. No. Units
during
current
RHNA cycle
R-1 3 3 3
R-1H 215 215 56
R-1A 2 4 4
R-2 4 9 9
R-2A 7 24 24
R-2H 1 4 4
R-3 2 9 9
R-4 5 48 48
Total 239 lots 316 units 157 units
1. Adding Units to Already-Developed Parcels
Other than accessory dwelling units, described below, the Planning Department has only
recently begun to track how many housing units have been generated by adding new main
dwelling units (non-ADU) to already-developed properties. As shown in Appendix B and table
A-7, the City has numerous multi-family zoning districts that allow more than one unit per lot
depending on the lot size. The Planning Department does not know how many residential
parcels have capacity for additional dwelling units, however, staff estimates that roughly 3-4

2015 -2023 Berkeley Housing Element
Appendix A – Site Inventory and Capacity Analysis Background by Area
231
such units are built per year. Therefore, as a conservative estimate for purposes of this Housing
Element, the City assumes 24 new units will result from adding new main dwelling units to
developed lots (three units per year over eight years).
2. Accessory Dwelling Units
An Accessory Dwelling Unit (ADU) is a particular type of housing unit that is limited in size and
subject to other specific development standards. If a new ADU meets all required development
standards, it is allowed “by-right” (i.e. no discretionary permit is required), otherwise
administrative use permit (AUP) approval is required. Since 2003, planning staff estimates there
have been roughly 65 ADUs permitted in the City, about one half of which required an AUP.
Planning staff believes that more than 35 by-right ADUs have been built, but the units were not
identified during the building permit phase and thus not tracked. Therefore, for purposes of
estimating the number of ADUs that could be built in the future, staff assumes that 65 ADUs
have been built since adoption of the ADU ordinance in 2003, or roughly five ADUs per year. In
the beginning of 2015, City Council will consider revisions to the Zoning Ordinance that are
intended to ameliorate some of the development standards (e.g. parking and setback
requirements) that prove to be barriers to the construction of ADUs. If approved, these changes
would take affect by mid-year. Staff estimates that adoption of the new ADU Ordinance will
result in construction of an additional two ADUs per year. This rate would result in 56 additional
ADUs during the eight year housing element planning period.
Table A-9: Estimate of new units in Residential Districts by
Unit Type (2015-2023) Residential Unit Type Estimated Number of New Units
Vacant R-district Lots 157
Additional Main Dwelling Units 24
Accessory Dwelling Units 56
Total 237 Units
Table A-10: Residential Area Housing Opportunity Site Inventory and Residential
Capacity Analysis
#
Assessor’s
Parcel Number Street Address
Zoning
District
Gen.
Plan
Desig-
nation
Existing
Use
Lot Size
Estimated
Unit Yield Acres
Sq.
Feet
1 060
243503300
0 MONTEREY AVE R-1 LDR VACANT 0.13 5,528
1
2 058
218400700
1624 ARCH ST R-1 LDR VACANT 0.15 6,501
1
3 058
218301300
0 VIRGINIA ST R-1 LDR VACANT 0.12 5,310
1
4 056
197701800
2125 10TH ST R-1A MDR VACANT 0.12 5,400
2

2015-2023 Berkeley Housing Element
Appendix A – Site Inventory and Capacity Analysis Background by Area
232
Table A-10: Residential Area Housing Opportunity Site Inventory and Residential
Capacity Analysis
#
Assessor’s
Parcel Number Street Address
Zoning
District
Gen.
Plan
Desig-
nation
Existing
Use
Lot Size
Estimated
Unit Yield Acres
Sq.
Feet
5 057
209300300
0 HEARST AVE R-1A MDR VACANT 0.14 6,000
2
6 062
292300300
400 ARLINGTON AVE R-1H LDR VACANT 0.11 5,000
1
7 062
293602600
0 SAN LUIS RD R-1H LDR VACANT 0.11 5,000
1
8 061
257805200
827 ARLINGTON AVE R-1H LDR VACANT 0.11 5,009
1
9 063
296501200
0 CRESTON RD R-1H LDR VACANT 0.12 5,025
1
10 059
225102400
0 SCENIC AVE R-1H LDR VACANT 0.12 5,034
1
11 063
296701701
0 GRIZZLY PEAK
BLVD
R-1H LDR VACANT 0.12 5,038
1
12 060
249300600
0 SUMMIT RD R-1H LDR VACANT 0.12 5,070
1
13 060
248400303
0 AVENIDA DR R-1H LDR VACANT 0.12 5,090
1
14 063
298405400
1133 KEELER AVE R-1H LDR VACANT 0.12 5,112
1
15 063
298602200
0 CRAGMONT AVE R-1H LDR VACANT 0.12 5,130
1
16 060
248902100
0 SENIOR AVE R-1H LDR VACANT 0.12 5,132
1
17 063
296903902
0 MILLER AVE R-1H LDR VACANT 0.12 5,160
1
18 059
225002800
0 HAWTHORNE TER R-1H LDR VACANT 0.12 5,200
1
19 061
258001800
0 SAN LUIS RD R-1H LDR VACANT 0.12 5,200
1
20 063
295506200
661 EUCLID AVE R-1H LDR VACANT 0.12 5,200
1
21 063
298805206
0 KEITH AVE R-1H LDR VACANT 0.12 5,200
1
22 063
296903904
1015 MILLER AVE R-1H LDR VACANT 0.12 5,240
1
23 060
248205100
0 CAMPUS DR R-1H LDR VACANT 0.12 5,305
1
24 063
298001900
0 STERLING AVE R-1H LDR VACANT 0.12 5,315
1

2015-2023 Berkeley Housing Element
Appendix A – Site Inventory and Capacity Analysis Background by Area
233
Table A-10: Residential Area Housing Opportunity Site Inventory and Residential
Capacity Analysis
#
Assessor’s
Parcel Number Street Address
Zoning
District
Gen.
Plan
Desig-
nation
Existing
Use
Lot Size
Estimated
Unit Yield Acres
Sq.
Feet
25 063
296305200
0 HILLDALE AVE R-1H LDR VACANT 0.12 5,328
1
26 060
249300500
0 SUMMIT RD R-1H LDR VACANT 0.12 5,370
1
27 063
296103900
0 REGAL RD R-1H LDR VACANT 0.12 5,372
1
28 063
298405200
0 KEELER AVE R-1H LDR VACANT 0.12 5,376
1
29 063
298504900
0 CRAGMONT AVE R-1H LDR VACANT 0.12 5,417
1
30 060
248505600
1375 QUEENS RD R-1H LDR VACANT 0.12 5,423
1
31 063
298803001
0 KEITH AVE R-1H LDR VACANT 0.12 5,424
1
32 063
298405300
1139 KEELER AVE R-1H LDR VACANT 0.12 5,430
1
33 060
249306800
0 HILL RD R-1H LDR VACANT 0.13 5,452
1
34 063
297204100
0 EUCLID AVE R-1H LDR VACANT 0.13 5,466
1
35 058
224200800
0 BUENA VISTA WAY R-1H LDR VACANT 0.13 5,471
1
36 060
248206700
0 CAMPUS DR R-1H LDR VACANT 0.13 5,480
1
37 063
295602000
0 EUCLID AVE R-1H LDR VACANT 0.13 5,490
1
38 063
295505802
0 EUCLID AVE R-1H LDR VACANT 0.13 5,500
1
39 063
297603400
1100 CRAGMONT AVE R-1H LDR VACANT 0.13 5,500
1
40 063
298505000
0 CRAGMONT AVE R-1H LDR VACANT 0.13 5,500
1
41 063
295203400
0 CRAGMONT AVE R-1H LDR VACANT 0.13 5,516
1
42 063
311011100
0 WOODMONT AVE R-1H LDR VACANT 0.13 5,517
1
43 060
247902700
0 GLENDALE AVE R-1H LDR VACANT 0.13 5,518
1
44 063
298804400
1150 KEITH AVE R-1H LDR VACANT 0.13 5,520
1

2015-2023 Berkeley Housing Element
Appendix A – Site Inventory and Capacity Analysis Background by Area
234
Table A-10: Residential Area Housing Opportunity Site Inventory and Residential
Capacity Analysis
#
Assessor’s
Parcel Number Street Address
Zoning
District
Gen.
Plan
Desig-
nation
Existing
Use
Lot Size
Estimated
Unit Yield Acres
Sq.
Feet
45 062
290704900
400 VINCENTE AVE R-1H LDR VACANT 0.13 5,525
1
46 063
297000400
0 FOREST LN R-1H LDR VACANT 0.13 5,543
1
47 060
249304700
0 GRIZZLY PEAK
BLVD
R-1H LDR VACANT 0.13 5,564
1
48 060
249306700
0 HILL RD R-1H LDR VACANT 0.13 5,580
1
49 063
296404500
0 MARIN AVE R-1H LDR VACANT 0.13 5,584
1
50 060
248506500
0 FAIRLAWN DR R-1H LDR VACANT 0.13 5,600
1
51 058
224200501
0 LA LOMA AVE R-1H LDR VACANT 0.13 5,604
1
52 063
298601200
0 CRAGMONT AVE R-1H LDR VACANT 0.13 5,623
1
53 062
290202100
0 COLUSA AVE R-1H LDR VACANT 0.13 5,700
1
54 060
247802701
0 CAMPUS DR R-1H LDR VACANT 0.13 5,750
1
55 062
294001400
0 BOYNTON AVE R-1H LDR VACANT 0.13 5,788
1
56 060
249001400
0 OLYMPUS AVE R-1H LDR VACANT 0.13 5,792
1
57 063
296905100
0 FOREST LN R-1H LDR VACANT 0.13 5,804
1
58 063
313006600
0 OVERLOOK RD R-1H LDR VACANT 0.13 5,819
1
59 060
248901402
0 GRIZZLY PEAK
BLVD
R-1H LDR VACANT 0.13 5,825
1
60 063
298601300
0 CRAGMONT AVE R-1H LDR VACANT 0.13 5,859
1
61 062
293903201
0 NORTHAMPTON
AVE
R-1H LDR VACANT 0.13 5,869
1
62 063
298506002
1133 CRAGMONT AVE R-1H LDR VACANT 0.13 5,874
1
63 060
249301902
0 SUMMIT RD R-1H LDR VACANT 0.13 5,876
1
64 063
298800500
0 EUCLID AVE R-1H LDR VACANT 0.14 5,888
1

2015-2023 Berkeley Housing Element
Appendix A – Site Inventory and Capacity Analysis Background by Area
235
Table A-10: Residential Area Housing Opportunity Site Inventory and Residential
Capacity Analysis
#
Assessor’s
Parcel Number Street Address
Zoning
District
Gen.
Plan
Desig-
nation
Existing
Use
Lot Size
Estimated
Unit Yield Acres
Sq.
Feet
65 063
295207401
0 SPRUCE ST R-1H LDR VACANT 0.14 5,907
1
66 063
311011300
0 WOODMONT AVE R-1H LDR VACANT 0.14 5,908
1
67 062
290301900
0 VINCENTE AVE R-1H LDR VACANT 0.14 5,975
1
68 060
247801500
1436 CAMPUS DR R-1H LDR VACANT 0.14 5,976
1
69 063
314008700
0 OVERLOOK RD R-1H LDR VACANT 0.14 5,981
1
70 063
298000102
0 STERLING AVE R-1H LDR VACANT 0.14 5,985
1
71 058
224402501
0 LEROY AVE R-1H LDR VACANT 0.14 6,000
1
72 060
249002602
0 SENIOR AVE R-1H LDR VACANT 0.14 6,000
1
73 063
297602500
0 KEELER AVE R-1H LDR VACANT 0.14 6,000
1
74 063
298606900
0 KEITH AVE R-1H LDR VACANT 0.14 6,000
1
75 063
298804900
0 KEITH AVE R-1H LDR VACANT 0.14 6,000
1
76 060
249200300
0 SUMMIT RD R-1H LDR VACANT 0.14 6,006
1
77 061
258102500
0 INDIAN ROCK AVE R-1H LDR VACANT 0.14 6,006
1
78 063
297002700
0 HILLDALE AVE R-1H LDR VACANT 0.14 6,039
1
79 063
310006802
25 ROSEMONT AVE R-1H LDR VACANT 0.14 6,047
1
80 063
297603800
0 CRAGMONT AVE R-1H LDR VACANT 0.14 6,088
1
81 063
298504700
0 CRAGMONT AVE R-1H LDR VACANT 0.14 6,134
1
82 063
297603900
0 CRAGMONT AVE R-1H LDR VACANT 0.14 6,151
1
83 060
248400200
50 AVENIDA DR R-1H LDR VACANT 0.14 6,183
1
84 062
294200500
0 VERMONT AVE R-1H LDR VACANT 0.14 6,188
1

2015-2023 Berkeley Housing Element
Appendix A – Site Inventory and Capacity Analysis Background by Area
236
Table A-10: Residential Area Housing Opportunity Site Inventory and Residential
Capacity Analysis
#
Assessor’s
Parcel Number Street Address
Zoning
District
Gen.
Plan
Desig-
nation
Existing
Use
Lot Size
Estimated
Unit Yield Acres
Sq.
Feet
85 060
248301600
0 CAMPUS DR R-1H LDR VACANT 0.14 6,250
1
86 063
296701704
0 GRIZZLY PEAK
BLVD
R-1H LDR VACANT 0.14 6,284
1
87 063
298504500
0 CRAGMONT AVE R-1H LDR VACANT 0.14 6,288
1
88 063
297403900
1043 KEITH AVE R-1H LDR VACANT 0.14 6,292
1
89 063
297504402
975 EUCLID AVE R-1H LDR VACANT 0.14 6,302
1
90 063
298503300
0 KEELER AVE R-1H LDR VACANT 0.14 6,307
1
91 063
297603300
0 BRET HARTE RD R-1H LDR VACANT 0.15 6,327
1
92 063
298404100
0 KEELER AVE R-1H LDR VACANT 0.15 6,345
1
93 063
295603700
0 CRAGMONT AVE R-1H LDR VACANT 0.15 6,348
1
94 063
314004103
0 WOODSIDE RD R-1H LDR VACANT 0.15 6,366
1
95 063
298501900
0 KEELER AVE R-1H LDR VACANT 0.15 6,403
1
96 063
297205800
969 CRAGMONT AVE R-1H LDR VACANT 0.15 6,406
1
97 063
295503600
725 EUCLID AVE R-1H LDR VACANT 0.15 6,427
1
98 060
246906800
0 SHASTA RD R-1H LDR VACANT 0.15 6,500
1
99 063
298802000
1103 EUCLID AVE R-1H LDR VACANT 0.15 6,541
1
100 063
313008600
0 CRESTON RD R-1H LDR VACANT 0.15 6,563
1
101 063
295504000
0 EUCLID AVE R-1H LDR VACANT 0.15 6,568
1
102 061
255902300
0 MARIPOSA AVE R-1H LDR VACANT 0.15 6,625
1
103 063
314002902
0 THE CRESCENT R-1H LDR VACANT 0.15 6,661
1
104 063
297804200
0 STERLING AVE R-1H LDR VACANT 0.15 6,695
1
-
-

2015-2023 Berkeley Housing Element
Appendix A – Site Inventory and Capacity Analysis Background by Area
237
Table A-10: Residential Area Housing Opportunity Site Inventory and Residential
Capacity Analysis
#
Assessor’s
Parcel Number Street Address
Zoning
District
Gen.
Plan
Desig-
nation
Existing
Use
Lot Size
Estimated
Unit Yield Acres
Sq.
Feet
105 060
247801100
0 DEL MAR AVE R-1H LDR VACANT 0.15 6,707
1
106 060
248304300
0 CAMPUS DR R-1H LDR VACANT 0.15 6,724
1
107 059
224903002
0 SCENIC AVE R-1H LDR VACANT 0.15 6,750
1
108 059
225000602
0 EUCLID AVE R-1H LDR VACANT 0.15 6,750
1
109 060
246302100
0 EUNICE ST R-1H LDR VACANT 0.15 6,750
1
110 062
293901500
0 MICHIGAN AVE R-1H LDR VACANT 0.15 6,750
1
111 060
248200200
0 QUAIL AVE R-1H LDR VACANT 0.16 6,770
1
112 063
298601400
0 CRAGMONT AVE R-1H LDR VACANT 0.16 6,778
1
113 063
298803401
0 KEITH AVE R-1H LDR VACANT 0.16 6,818
1
114 063
295506100
661 EUCLID AVE R-1H LDR VACANT 0.16 6,823
1
115 058
224204823
0 LA LOMA AVE R-1H LDR VACANT 0.16 6,834
1
116 063
299300802
0 GRIZZLY PEAK
BLVD
R-1H LDR VACANT 0.16 7,035
1
117 063
297603700
0 CRAGMONT AVE R-1H LDR VACANT 0.16 7,081
1
118 063
298002400
0 STERLING AVE R-1H LDR VACANT 0.16 7,087
1
119 060
248303900
1590 OLYMPUS AVE R-1H LDR VACANT 0.16 7,101
1
120 063
296901102
0 GRIZZLY PEAK
BLVD
R-1H LDR VACANT 0.17 7,193
1
121 062
290700100
0 VINCENTE AVE R-1H LDR VACANT 0.17 7,200
1
122 063
298601501
0 CRAGMONT AVE R-1H LDR VACANT 0.17 7,200
1
123 063
297804300
0 STERLING AVE R-1H LDR VACANT 0.17 7,210
1
124 061
255102602
0 OAK ST R-1H LDR VACANT 0.17 7,250
1
-

2015-2023 Berkeley Housing Element
Appendix A – Site Inventory and Capacity Analysis Background by Area
238
Table A-10: Residential Area Housing Opportunity Site Inventory and Residential
Capacity Analysis
#
Assessor’s
Parcel Number Street Address
Zoning
District
Gen.
Plan
Desig-
nation
Existing
Use
Lot Size
Estimated
Unit Yield Acres
Sq.
Feet
125 061
258004700
0 SAN LUIS RD R-1H LDR VACANT 0.17 7,290
1
126 061
258205800
0 SANTA BARBARA
RD
R-1H LDR VACANT 0.17 7,310
1
127 063
298800400
0 EUCLID AVE R-1H LDR VACANT 0.17 7,310
1
128 063
298505600
0 CRAGMONT AVE R-1H LDR VACANT 0.17 7,337
1
129 063
297404000
1039 KEITH AVE R-1H LDR VACANT 0.17 7,348
1
130 063
314000900
0 WILDCAT CANYON
RD
R-1H LDR VACANT 0.17 7,376
1
131 063
298603002
0 CRAGMONT AVE R-1H LDR VACANT 0.17 7,500
1
132 060
248201800
0 QUEENS RD R-1H LDR VACANT 0.17 7,622
1
133 063
297501100
0 REGAL RD R-1H LDR VACANT 0.18 7,650
1
134 063
298800800
0 EUCLID AVE R-1H LDR VACANT 0.18 7,657
1
135 063
295207600
0 SPRUCE ST R-1H LDR VACANT 0.18 7,702
1
136 063
298505700
0 CRAGMONT AVE R-1H LDR VACANT 0.18 7,854
1
137 063
298504400
0 CRAGMONT AVE R-1H LDR VACANT 0.18 7,918
1
138 063
295904600
0 SPRUCE ST R-1H LDR VACANT 0.18 7,924
1
139 060
248201000
0 QUEENS RD R-1H LDR VACANT 0.18 7,986
1
140 061
258004600
0 SOUTHAMPTON
AVE
R-1H LDR VACANT 0.18 7,992
1
141 063
312006100
0 CRESTON RD R-1H LDR VACANT 0.18 8,015
1
142 060
247502800
25 DEL MAR AVE R-1H LDR VACANT 0.18 8,032
1
143 063
313003404
0 MIDDLEFIELD RD R-1H LDR VACANT 0.19 8,079
1
144 058
223202100
0 PARNASSUS CT R-1H LDR VACANT 0.19 8,105
1

2015-2023 Berkeley Housing Element
Appendix A – Site Inventory and Capacity Analysis Background by Area
239
Table A-10: Residential Area Housing Opportunity Site Inventory and Residential
Capacity Analysis
#
Assessor’s
Parcel Number Street Address
Zoning
District
Gen.
Plan
Desig-
nation
Existing
Use
Lot Size
Estimated
Unit Yield Acres
Sq.
Feet
145 063
298606200
0 KEITH AVE R-1H LDR VACANT 0.19 8,273
1
146 063
297604100
0 CRAGMONT AVE R-1H LDR VACANT 0.19 8,300
1
147 063
297604200
0 CRAGMONT AVE R-1H LDR VACANT 0.19 8,300
1
148 063
297604300
0 CRAGMONT AVE R-1H LDR VACANT 0.19 8,300
1
149 063
298604000
0 SHASTA RD R-1H LDR VACANT 0.19 8,468
1
150 063
295602400
0 EUCLID AVE R-1H LDR VACANT 0.20 8,635
1
151 062
291607600
0 ARLINGTON AVE R-1H LDR VACANT 0.20 8,644
1
152 063
298603900
0 SHASTA RD R-1H LDR VACANT 0.20 8,668
1
153 063
297601700
0 KEELER AVE R-1H LDR VACANT 0.20 8,672
1
154 061
258000500
0 SAN LUIS RD R-1H LDR VACANT 0.20 8,740
1
155 060
247800800
0 DEL MAR AVE R-1H LDR VACANT 0.20 8,744
1
156 063
297601600
0 KEELER AVE R-1H LDR VACANT 0.20 8,761
1
157 063
312002702
0 WOODMONT AVE R-1H LDR VACANT 0.20 8,839
1
158 060
248505400
0 QUEENS RD R-1H LDR VACANT 0.20 8,890
1
159 063
298503203
0 KEELER AVE R-1H LDR VACANT 0.21 8,969
1
160 058
224201622
0 MAYBECK TWIN DR R-1H LDR VACANT 0.21 8,978
1
161 060
246907802
0 NORTHGATE AVE R-1H LDR VACANT 0.21 9,000
1
162 062
291501101
0 SANTA BARBARA
RD
R-1H LDR VACANT 0.21 9,012
1
163 063
295202300
0 CRAGMONT AVE R-1H LDR VACANT 0.21 9,048
1
164 063
297806900
0 KEELER AVE R-1H LDR VACANT 0.21 9,126
1

2015-2023 Berkeley Housing Element
Appendix A – Site Inventory and Capacity Analysis Background by Area
240
Table A-10: Residential Area Housing Opportunity Site Inventory and Residential
Capacity Analysis
#
Assessor’s
Parcel Number Street Address
Zoning
District
Gen.
Plan
Desig-
nation
Existing
Use
Lot Size
Estimated
Unit Yield Acres
Sq.
Feet
165 062
291401700
0 NORTHAMPTON
AVE
R-1H LDR VACANT 0.21 9,206
1
166 063
297806800
0 KEELER AVE R-1H LDR VACANT 0.21 9,306
1
167 063
315008700
0 WOODSIDE RD R-1H LDR VACANT 0.21 9,359
1
168 060
246300300
0 GLEN AVE R-1H LDR VACANT 0.21 9,360
1
169 063
297604000
0 CRAGMONT AVE R-1H LDR VACANT 0.22 9,390
1
170 063
312006400
64 SUNSET LN R-1H LDR VACANT 0.22 9,394
1
171 063
314001400
0 WOODSIDE RD R-1H LDR VACANT 0.22 9,403
1
172 063
298305000
0 STERLING AVE R-1H LDR VACANT 0.22 9,420
1
173 063
298504300
0 CRAGMONT AVE R-1H LDR VACANT 0.22 9,495
1
174 063
297601503
0 KEELER AVE R-1H LDR VACANT 0.22 9,625
1
175 059
225001600
1550 EUCLID AVE R-1H LDR VACANT 0.22 9,628
1
176 060
248201700
0 QUEENS RD R-1H LDR VACANT 0.22 9,721
1
177 063
298305100
0 STERLING AVE R-1H LDR VACANT 0.22 9,757
1
178 063
295205000
0 ALAMO AVE R-1H LDR VACANT 0.23 9,854
1
179 063
316002202
0 HILL RD R-1H LDR VACANT 0.23 10,062
1
180 063
295903902
0 REGAL RD R-1H LDR VACANT 0.23 10,065
1
181 058
223202000
0 PARNASSUS CT R-1H LDR VACANT 0.24 10,250
1
182 060
248206200
0 CAMPUS DR R-1H LDR VACANT 0.24 10,368
1
183 063
316002000
0 HILL RD R-1H LDR VACANT 0.25 10,673
1
184 060
246604300
0 OXFORD ST R-1H LDR VACANT 0.25 10,720
1
-

2015-2023 Berkeley Housing Element
Appendix A – Site Inventory and Capacity Analysis Background by Area
241
Table A-10: Residential Area Housing Opportunity Site Inventory and Residential
Capacity Analysis
#
Assessor’s
Parcel Number Street Address
Zoning
District
Gen.
Plan
Desig-
nation
Existing
Use
Lot Size
Estimated
Unit Yield Acres
Sq.
Feet
185 060
248202500
0 QUEENS RD R-1H LDR VACANT 0.25 10,750
1
186 063
312003100
0 WOODMONT AVE R-1H LDR VACANT 0.26 11,221
1
187 063
297806500
0 KEELER AVE R-1H LDR VACANT 0.26 11,529
1
188 060
248301402
0 CAMPUS DR R-1H LDR VACANT 0.27 11,625
1
189 063
298000403
0 TWAIN AVE R-1H LDR VACANT 0.27 11,728
1
190 062
291402004
0 SPRUCE ST R-1H LDR VACANT 0.27 11,760
1
191 058
224206800
0 BUENA VISTA WAY R-1H LDR VACANT 0.27 11,856
1
192 058
224207506
0 BUENA VISTA WAY R-1H LDR VACANT 0.28 12,002
1
193 059
224904601
0 BAY VIEW PL R-1H LDR VACANT 0.28 12,194
1
194 060
246900600
0 SHASTA RD R-1H LDR VACANT 0.28 12,255
1
195 063
297806400
0 KEELER AVE R-1H LDR VACANT 0.28 12,270
1
196 063
314000800
0 WILDCAT CANYON
RD
R-1H LDR VACANT 0.30 12,889
1
197 063
297806300
0 KEELER AVE R-1H LDR VACANT 0.30 13,011
1
198 063
313008800
0 CRESTON RD R-1H LDR VACANT 0.30 13,194
1
199 063
298000500
0 KEELER AVE R-1H LDR VACANT 0.31 13,309
1
200 060
248001600
0 NORTHGATE AVE R-1H LDR VACANT 0.31 13,480
1
201 063
316000100
0 PARK HILLS RD R-1H LDR VACANT 0.31 13,600
1
202 062
289400300
0 SANTA ROSA AVE R-1H LDR VACANT 0.32 13,831
1
203 062
291403800
0 SANTA BARBARA
RD
R-1H LDR VACANT 0.32 13,875
1
204 061
259804001
0 SOUTHAMPTON
AVE
R-1H LDR VACANT 0.32 13,992
1

2015-2023 Berkeley Housing Element
Appendix A – Site Inventory and Capacity Analysis Background by Area
242
Table A-10: Residential Area Housing Opportunity Site Inventory and Residential
Capacity Analysis
#
Assessor’s
Parcel Number Street Address
Zoning
District
Gen.
Plan
Desig-
nation
Existing
Use
Lot Size
Estimated
Unit Yield Acres
Sq.
Feet
205 062
290100200
0 YOSEMITE RD R-1H LDR VACANT 0.33 14,197
1
206 061
257804600
0 ARLINGTON AVE R-1H LDR VACANT 0.33 14,198
1
207 061
257800601
0 SAN MATEO RD R-1H LDR VACANT 0.33 14,231
1
208 063
311010900
0 VISTAMONT AVE R-1H LDR VACANT 0.33 14,500
1
209 063
314000700
0 WILDCAT CANYON
RD
R-1H LDR VACANT 0.33 14,555
1
210 063
316001403
30 BAY TREE LN R-1H LDR VACANT 0.34 14,874
1
211 060
247301602
0 SHASTA RD R-1H LDR VACANT 0.36 15,708
1
212 063
312002603
0 WOODMONT AVE R-1H LDR VACANT 0.37 16,074
1
213 062
291605900
1960 SAN ANTONIO
AVE
R-1H LDR VACANT 0.37 16,216
1
214 063
310000501
0 WOODMONT AVE R-1H LDR VACANT 0.38 16,767
1
215 060
247602200
0 BUENA VISTA WAY R-1H LDR VACANT 0.39 16,830
1
216 060
247301501
0 SHASTA RD R-1H LDR VACANT 0.39 16,929
1
217 060
247901300
1354 CAMPUS DR R-1H LDR VACANT 0.42 18,246
1
218 060
247801300
0 CAMPUS DR R-1H LDR VACANT 0.45 19,438
1
219 060
249301000
0 SUMMIT RD R-1H LDR VACANT 0.50 21,850
1
220 060
249500100
6 AJAX PL R-1H LDR VACANT 0.54 23,349
1
221 060
246900305
0 SHASTA RD R-1H LDR VACANT 0.58 25,180
1
222 063
312003300
0 WOODMONT AVE R-1H LDR VACANT 0.64 27,970
1
223 063
316001402
20 BAY TREE LN R-1H LDR VACANT 0.96 41,671
1
224 063
313009103
0 WOODMONT AVE R-1H LDR VACANT 1.10 47,833
1

2015-2023 Berkeley Housing Element
Appendix A – Site Inventory and Capacity Analysis Background by Area
243
Table A-10: Residential Area Housing Opportunity Site Inventory and Residential
Capacity Analysis
#
Assessor’s
Parcel Number Street Address
Zoning
District
Gen.
Plan
Desig-
nation
Existing
Use
Lot Size
Estimated
Unit Yield Acres
Sq.
Feet
225 063
313009300
0 WOODMONT AVE R-1H LDR VACANT 1.43 62,200
1
226 058
220801301
0 LA VEREDA RD R-1H LDR VACANT 0.11 5,000
1
227 058
221200104
0 HILGARD AVE R-1H LDR VACANT 0.27 11,826
1
228 060
240200200
1300 CORNELL AVE R-2 MDR VACANT 0.11 5,000
2
229 059
227700902
0 EDITH ST R-2 MDR VACANT 0.12 5,212
2
230 057
201502401
2127 GRANT ST R-2 MDR VACANT 0.15 6,500
3
231 055
184100500
0 HILLEGASS AVE R-2 MDR VACANT 0.15 6,380
2
232 055
182901100
0 PARKER ST R-2A MDR VACANT 0.15 6,750
4
233 053
167902000
0 OREGON ST R-2A MDR VACANT 0.12 5,186
3
234 053
159200900
2033 EMERSON ST R-2A MDR VACANT 0.12 5,250
3
235 053
168001800
0 M L KING JR WAY R-2A MDR VACANT 0.12 5,350
3
236 052
152701100
1811 63RD ST R-2A MDR VACANT 0.12 5,400
3
237 053
167901702
0 M L KING JR WAY R-2A MDR VACANT 0.13 5,567
4
238 055
182300500
2135 BLAKE ST R-2A MDR VACANT 0.15 6,750
4
239 058
221101305
0 LA LOMA AVE R-2H MDR VACANT 0.22 9,463
4
240 057
209601201
1925 6TH ST R-3 HDR VACANT 0.15 6,720
4
241 057
208801500
1917 10TH ST R-3 HDR VACANT 0.20 8,712
5
242 053
161901300
1419 ASHBY AVE R-3 HDR VACANT 0.13 5,618
3
243 055
182202200
2016 DWIGHT WAY R-4 HDR VACANT 0.22 9,484
10
244 055
188700800
2223 CHANNING WAY R-4 HDR VACANT 0.15 6,500
7
-

2015-2023 Berkeley Housing Element
Appendix A – Site Inventory and Capacity Analysis Background by Area
244
Table A-10: Residential Area Housing Opportunity Site Inventory and Residential
Capacity Analysis
#
Assessor’s
Parcel Number Street Address
Zoning
District
Gen.
Plan
Desig-
nation
Existing
Use
Lot Size
Estimated
Unit Yield Acres
Sq.
Feet
245 055
189802900
1940 HASTE ST R-4 HDR VACANT 0.15 6,750
7
246 058
218101905
1899 OXFORD ST R-4 HDR VACANT 0.39 17,167
18
247 055
181601900
0 M L KING JR WAY R-4 HDR VACANT 0.13 5,513
6
Total Acres 47.94 Total
Units
316

2015-2023 Berkeley Housing Element
Appendix A – Site Inventory and Capacity Analysis Background by Area
245
Progress Towards 2014-2022 RHNA
The table below lists the development projects for which building permits have been issued
since January 1, 2014. These units count as credit towards Berkeley’s 2014-2022 RHNA.
Table A-11: Progress towards 2014-2022 RHNA: Units approved 2014
Building Permit Action
Year
Ext. Low /
Very Low
Low
Income Moderate
Above
Moderate Total
2411 FIFTH 2014 2 2
2750 SHASTA 2014 1b 1
596 SPRUCE 2014 1 1
2125 A TENTH 2014 1 1
800 UNIVERSITY 2014 4a 54 58
462 VINCENTE 2014 1 b 1
2517 VIRGINIA 2014 1 1
2155 WARD 2014 1 b 1
Total Units Approved with Building Permits 4 0 3 59 137
RHNA requirements 532 442 584 1401 2,959
Percent of Goal Achieved 0.8% 0% 0.5% 4.2% 4.6%
Remaining RHNA Requirement 528 442 581 1,342 2,822
Notes:
Below market rate (BMR) units shown above are rental units subject to affordability restrictions under the
following programs. The sale of these units would result in different BMR unit outcomes.
a. State Density Bonus qualifying units affordable for 30 years per CGC Sec. 65915.
b. ADUs assumed to be affordable to moderate income households.

246
<Page Intentionally Left Blank>

2015 -2023 Berkeley Housing Element - Appendix A – Site Inventory and Capacity Analysis Background by Area
247
Map A-1: Overall map of Opportunity Site Areas
Map A-1: Opportunity Site
Areas
D Commercial Corridors
- Residential Parcels
~ South Side Plan
- Downtown Area Plan
N
j 0 650 1,300 2,600 Feet I 1 1 1 I 1 1 1 I
[I CITY OF BERKELEY Planning Department 2120 Milvia Street , Berkeley CA 94704

2015 -2023 Berkeley Housing Element - Appendix A – Site Inventory and Capacity Analysis Background by Area
248
Map A-2: Downtown Area Opportunity, Sites North of Allston
I
m. -~--... E:t:: I I _j
....
_Jl it z UJ I
IT]
IT]
, .
r--,--------1---------LBERKEl:E¥------'------------~,,- ---
I 12 ~ 18 I 19
i ~-~~~~1~1~~16 7· 0 9 1 O 11 13 14 15 20 21
r t-..... ..,,J,,,..-------....r.---------L,,.1 -----WNIVERSlf.Y:------...Jw!~~---~-------..l.,..-----J-l--"'1'--------:~~==..,,,.,_.'7'7 8 .... 3_0 ________ 1_3
_
3
_1.....,~ T.....__ __ ___/.... .
29 82 ~ ~ tt 9
81 1 34 1 :l .1
rr ~ ~ c:: UJ
I
Hr-----------------+-------ADDIS0NI--------I-----J---_i:.r.-.:_ _______ _.
7
,~o J 8EN=!'ER-------__;'"-____,l--------------0'7-\ j ~
I [:]
11~ 1Zl B
46 J Al:l:STGN---,
Map A-2: Downtown
Area Opportunity Sites
North of Allston
N
j 0
1 1908 SHATTUCK 2 1926 SHATTUCK 3 1933 ML KING JR 4 1909 UNIVERSITY 5 1915 UNIVERSITY 6 1921 UNIVERSITY 7 1929 UNIVERSITY 8 1941 UNIVERSITY 9 2011 UNIVERSITY
10 2017 UNIVERSITY 11 2035 UNIVERSITY 12 0 BERKELEY 13 2067 UNIVERSITY 14 2071 UNIVERSITY 15 1998 SHATTUCK 16 1984 SHATTUCK 17 1974 SHATTUCK 18 1950 SHATTUCK 19 2108 BERKELEY 20 1987 SHATTUCK 21 21 11 UNIVERSITY 22 0 BERKELEY 23 1900 WALNUT 24 2099 M L KING JR 25 1911 ADDISON 20 19 15 ADDISOIQ 27 1931 ADDISON 28 1933 ADDISON 29 1974 UNIVERSITY 30 2000 UNIVERSITY 31 2009 ADDISON 32 2058 UNIVERSITY 33 2000 SHATTUCK 34 2018 SHATTUCK 352136 UICI0Li tOI I I llO 1! 108 r I L llllliil JR 37 1916 ADDISON 38 2108 MILVIA 39 0 MILVIA 40 2072 ADDISON 41 2116 SHATTUCK 42 130 BERKELEY 43 134 BERKELEY 44 21 19 CENTER 45 2068 CENTER 46 2190 SHATTUCK 47 2187 SHATTUCK 10 i! 1i! 1 :9,LLB"Fiilr l 49 2128 OXFORD
80 160 320 Feet I I I I I I I I I
[I CITY OF BERKELEY Planning Department 2120 Milvia Street, Berkeley CA 94704

2015 -2023 Berkeley Housing Element - Appendix A – Site Inventory and Capacity Analysis Background by Area
249
Map A-3: Downtown Area Opportunity, Sites South of Allston
63
----'
--~ ., r:72
~ i ~ 1------Kll'FRElE-------:;~-------.--_-_-_-_-..... ~/
:J -n C: ~ 0
~ z ~ I
~'---------------BANGR0,.F~------------"T'-,
I I 56 57 B z
0 ~
~ 61 ~
1--------------0~RANill~'---
0
---------TI--, ~ J
~ - 64 ,-
63
:s:: (!) ::::, f;-
t
65 67
66
68 _ f l---,J-----------------+---------------GHAN~NG-------------r-7
69 70 71 7')
73 74
76 75 E]
.~ -------HASfE'--------l--------------------;llf.1~-------------r-7
(!) ::::,
9 ~ z 0 ~ ~ u..
Map A-3: Downtown
Area Opportunity Sites
South of Allston
N
j 0
50 2210 HAROLD 51 2108 ALLSTON 52 2219 SHATTUCK 53 2000 KITTREDGE 54 2235 MILVIA 55 2176 KITTREDGE 56 2301 SHATTUCK 57 0 BANCROFT 58 2190 BANCROFT 59 2327 SHATTUCK 60 2333 SHATTUCK 61 2107 DURANT 62 2023 CHANNING 63 2025 CHANNING 64 2352 SHATTUCK 65 2349 SHATTUCK 66 2367 SHATTUCK 67 2110 DURANT 68 2113 CHANNING 69 2036 CHANNING 70 2038 CHANNING 71 2410 SHATTUCK 72 2414 SHATTUCK 73 2420 SHATTUCK 74 2428 SHATTUCK 75 2440 SHATTUCK 76 2041 HASTE 77 2115 HASTE 78 2450 SHATTUCK 79 2480 SHATTUCK 80 2489 M L KING JR
80 160 320 Feet I I I I I I I I I
[I CITY OF BERKELEY Planning Department 2120 Milvia Street, Berkeley CA 94704 J 1--1-----------------f--------0WIGHf--------,~t--,--------------r--, '--------------

2015 -2023 Berkeley Housing Element - Appendix A – Site Inventory and Capacity Analysis Background by Area
250
Map A-4: Southside Plan Opportunity Sites
z ------~
0
~ IX] § §] 0
~ ~ § ~,_ ___ ..
::::i LL
0l:IR:AN:r
0 UJ @]
B Cl ----1--------+------+------0l:IRAN1-
I
CD z O'. et:
~ i+LATG ~ 0 I'? --'-------it--8 HANNING GHANNING
I c:..
~m ::;:: 0 ~--~ HAS:rE
(9
0 UJ
(/) ~
..!J UJ
..!J r.-UJ
6 ~ 0 m
1..z nD~ LI 0
HAS:rE--UJ c£
0 ,-----+---0~8~-+--~~3---+---~~--,----~T""'"'--"""'T"--t---..,..__0fiJ/GH:r ~ g (/);--------1,----Bl:AKE+----------,1----.-"""T'"--f w
..!J ..!J r w
~ I ~ <( 1--i- (9 ~-----+----------,------+--" ,_..._ ___ w w ---2 ~ ~ <9- PARKER- :::e UJ ~ - 0-cr------UJ 2 - 0 UJ ~ £r___,I er w w 0 -::i::
z m if !:!! :;
0 0 IQ ~~--6ARSE<rN ~
~-o::..-----+----0ERB~'------T-7r---..1.11--i-;------½--~r--_Jr---..1.--0ERsv---.... __ .J ~ 2 ..!J ~ ~ ~ F0RES:r
Map A-4: Southside Plan
0 ortunit Sites
N
1
1 2500 Telegraph 2 2503 Haste 3 2316 Dwight 4 2126 Haste 5 2539 Telegraph 6 2566 Telegraph 7 2556 Telegraph 8 2228 Dwight 9 2750 Dwight
10 2511 Dwight 11 2542 Durant 12 2510 Durant 13 2337 Channing 14 2412 Piedmont 15 2375 Telegraph 16 2613 Channing 17 2315 Durant 18 2433 Durant 19 2347 Telegraph 20 2362 Bancroft 21 2398 Bel'lereft 22 2519 Durant 23 2300 Telegraph 24 2590 Bancroft
0 205 410 820 Feet I I I I I I ' I
[I CITY OF BERKELEY Planning Department 2120 Milvia Street, Berkeley CA 94704

2015 -2023 Berkeley Housing Element - Appendix A – Site Inventory and Capacity Analysis Background by Area
251
Map A-5: Commercial Corridors Opportunity Sites, University and San Pablo
I I I 7
Map A-5:
I I x.:-----FRANC::ISCQ-----,
Commercial Corridors
Opportunity Sites University and
San Pablo __ l------r.---;:::::---DEl:AWARE'-------1 L~--_ -_ -_ -_ -=_ =-_ =_ :..:._ .:.._ ....::_ -_ .:::;_ :..:._ ;;..._ '--_ -_ -_ -~,
\~
-..--HEARST-
L -----==+--r---
I - A001S0N----+--,
I
1
I I
l A~~s10N---- \ ---r--._ ___ , __ l
I I I I I I
! r. G)
I
c:=3 1 ~rr----A001S0N-----i
,
l
\ I I
1 1914 Fifth 2 750 Hearst 3 833 University 4 111 1 Univers ity 5 1198 Univers ity
26 2197 San Pablo 27 2136 San Pablo 28 2100 San Pablo 29 2040 San Pablo 30 1931 San Pa blo 31 1900San Pablo 3 2 1819 San Pa blo 33 1620 San Pablo
N
1 o 130 260 520 Feet I I I I I I I I I
[I CITY OF BERKELEY Planning Department 2120 Milvia Street, Berkeley CA 94704

2015 -2023 Berkeley Housing Element - Appendix A – Site Inventory and Capacity Analysis Background by Area
252
Map A-6: Commercial Corridors Opportunity Sites, University: Bonar to Martin Luther King Jr.
' I I I / -r,~rw~:\\~,\Y.Wi,,rr, 1ti-, 1.J:J~~:rt~-~---+---L-----1-.....1.--~--0E0AR l Map A-6: ~~~ ~u1 ... -,,,1.,_,_J __ ~·~-~~ J I Z Commercial
L-- Ii,,, -- t- L ::. I \- ~d"\_l,~i~ :!I :I ::.=I_~r..:l=.itE]l--r--1--____ _J<( __ l:IN80l:N--+w---/;---i m Corridors
l-~ ;:= - -r c::::- ~ ' f *m /sg / Opportunity Sites [f3 ,,.__n L-t:J' rT I r e: ? ::il.L.·------+~----L---f---...J..._--~ university:
-mu, ~1 1 - 4 ~ Bonar to Martin
~ J-\ t, -- '.=_: 0 ,,: .. ~---c: ~ f Luther King Jr ~ l ~ t=-~~ E ~----'-------if-------FRANGISG0---F.'-. --------1~-I L.----------"'"------'
I ~ -r ~ H\' t: ~ z c2 c2 6 1248U niversity 0 0 ~ 7 1461 University
1-1-------'---DEl:AWARE-l-----,-,----'I 0/El:AWARE 8 14 9 9 Un ive rs ity
i ~ 9 1500 University 0 10 1548 University f t-------~-----HEARS:r:...._----~-------t---1 11 1556 University
1-----~ HEARS:r;___..._ __ ---1 / 12 1699 University ~ tH 13 1840 University
0 1------'-----BERKEl:E¥'-l---------1t------BERKEl=EY·------'~;<--· ------+--------+----!
D l!JNIVERSFJ"¥
fi- ~ ff3 .,; __ ....j
~ >- Lh ~
~H___l. __ -1------+----=-l- l~---1----+---s---};__--~,~----1---m g r6R0H- ~ r I I ~ J j
1----1----1----~,---r----+----+BAN0R0Fp----~'-------;J-----+----+----+----f
fi- I ,,. (/) (:)
f i
N
j 0 195 390 780 Feet I I I I I I I I I
[I CITY OF BERKELEY Planning Department 2120 Milvia Street, Berkeley CA 94704

2015 -2023 Berkeley Housing Element - Appendix A – Site Inventory and Capacity Analysis Background by Area
253
Map A-7: Commercial Corridors Opportunity Sites, San Pablo: Bancroft to Ashby
l I
\ \ l"e::m;
I ~ r0E
lc8 25 ~ CHAl:JCER-
@J
\
z 0:: r.: __ [t 0 ----i~-8HANNING--z--<t;~--~ ±J-----1r--,
-"' lB i~ 1 ! I i ~ ~ 8 )> 0 i.;-! g: ~
i I i .!.J UJ
z 0 f-;-
r -......---0WIGH·"
co <( §] ~
- el:JHER--'-~--
-
~ ·
1 __1.1:U=::::::!~------t----1 -----z-
~- ~ V-----t-- ~ . ~c--- CARtEST
I ..----- ~------ir----0ERB¥+----------r---, eA!?-l:Ef0N-
-------- I
L-----PARKER-
v.==------+--B~AKE-1-------r------i
\ --~ p ,c.. R 0 EE - ¥----.----'-T,--WAR0
,.--1 I l I
----------GR} Y.s0N-,...--
(!)
1i ..!J
~ ..!J
I ~ ~ UJ <( I ~
@ ~0REG:N I l I L L---~ 1i HEIN~ -b ~ ,1
\
Eo ~ Rl:JSSE~~- 7JL----'',-17
i I j -8 - Bl:JRNEH -~ -
-4 I ~ \ ,c..Nr-H0N¥- ~ S: 0
~ X - EP-------~-\ _ ___._---ASHB¥'---~1--------P,J\ p0HER'___
1@) ..........--r- 1
1
---------
.-0REG0N-
Map A-7: Commercial
Corridors Opportunity Sites
San Pablo: Bancroft to Ashby
14 2959 San Pab lo 15 2840 San Pab lo 16 26 18 San Pab lo 17 26 12 San Pab lo 18 1050 Parker 19 2546 San Pab lo 20 2527 San Pab lo 21 2424 San Pab lo 22 2407 San Pab lo 23 2400 San Pab lo 24 2366 San Pab lo 25 2332 San Pab lo
N
j o 200 400 800 Feet I I I I I I I I I
[I CITY OF BERKELEY Planning Department 2120 Milvia Street, Berkeley CA 94704

2015 -2023 Berkeley Housing Element - Appendix A – Site Inventory and Capacity Analysis Background by Area
254
Map A-8: Commercial Corridors Opportunity Sites, San Pablo: Harrison to Cedar
GAMEL:IA ---.
l-+--, C z z
HARRISON
PAE'--- i
B
C z z
en :-7i '> z z l> Gl rn
{7)
0 ;p z rn r. r.
1-~~----t---r-- r J> r. r. ~
I 00NES-L--1r1===34:h==i-1tt--7-- • _ jF.~· +-1- I
-cl(
BA'fAAN
t r. CD 0 -:-i
rn < rn ~ z
N
I
Map A-8:
Commercial
Corridors
Opportunity Sites
San Pablo:
Harrison to Cedar
33 1620 San Pablo
34 1500 San Pablo
35 1300 San Pablo
36 1299 San Pablo
37 1031 Gilman
38 1041Gilman
39 1049 Gilman
40 1233 Tenth
41 1200 San Pablo
42 1198 San Pablo
43 1197 San Pablo
44 1193 San Pablo
45 1187 San Pablo
0 130 260
Le 1, I 1 520 Feet
I...J
•
CITY OF BERKELEY
Planning Department
2120 Mi/via Street, Berkeley CA 94704

2015 -2023 Berkeley Housing Element - Appendix A – Site Inventory and Capacity Analysis Background by Area
255
Map A-9: Commercial Corridors Opportunity Sites, Adeline and Telegraph: Dwight to Woolsey
I I l---rm;mi-~4,:al-::J:ci:::pf-::;1fl:r:;:::::p::r.-~:rrrrr(Ja:;B.--,,...=r:t~~-----=[J=--if~B 0w1GH;r,
:F: +rr -=-'==-== ~n .,. r3\,:V.o~ ~ u 59- ----1-------+------+---..--,-_,I .., :::i-- ~l! ...... t~ 0 _ - r- - ... -t:C;: 7_)'~
I- Cf\ 1 I 1 ~ P-lt:1..~-.~._"'C;:::::..+:: .... -H------jf--Bl:AKE I //
- '""t:r-\:::t: ,... ..... 72 (!)5:,·l_,":, 1 ... ~ Fr _,.... -- ~= ::: 1,.. t, \1 ::::..-- 7311\L. \ - - r-:t:..- 1--------=~==-Ji(------:-=:-----+------+--------j:--"---;:==;-,--j ll- --:::. :::. t::~,,~:::~~ tq-_ ___,-=E 1 00 ~ El3/ ~~ -- '"=~ :: - r:i A:±: 1 t ~ ~ ~ ~ \1 B:::; rr! l' \ n ~
-c..i .;:;_ 1 ,, ~ / ~l::::t ~ r-11 I }::::f\ ~:~
i /j 6 1-----~-------+-------M'----,-----t--0ERB¥'-----~-------;r-----,/,___-----,
~ ~ fl ffi ~ ~ u(/) =fi 0
t-----t'---'WAR0--f----;;-r_, 1,...
1
_54
_ ( _ ~..__ ___ ----1----WAR0--!------.....__-_,_/~~-----l
<-S:r-l:JAR:r-'----t---------1-------:l~--+---------+------1 ----S:r-l:JAR'f-,
I/ if
II ~ ~ l------t-------+--~~----;--------r--0REG0N--+-------f!}'-----~
I/ I L-----J---"""T'"---'-~~~----.---+----,r-----rRl:JSSEl:~---~--+------+---.---1-------1
ll ~ ~ ! -H1X/-/ I a::
(I) ~ 0
UJ a.. a:: <t:
..... J:'--+~~~-q7/
48 ~
~a~ I .... ...!.11 · 1 O/ 1 C!)i _ __.______.,._-+----,iJ--------i.---1---........,_-----t
§]~§] I ! $ ..!.I ..... 0
EMERS0N--cn't'------- 0 a:: UJ z ..!.I UJ 0 J UJ t I :;:) z
PRIN8E- !/~ ESSEX
t,;.. z 0 ::i: ~------+-----1-i-
~
I LL
PRIN8E
1---.....--WEBS'nER'--i-: __ ....,ll
00Wl:ING- g:j 0 (!) t PRINCE-- PRl! CE-
0 52 >!-<;( (LJ UJ .!J 0 <t:
I I
Map A-9: Commercial
Corridors Opportunity Sites
Adeline and Telegraph:
N
j
Dwight to Woolsey
48 2998 Teleg ,apl, 47 2600 Telegraph 48 0 Adeline 49 3031 Adeline 50 3000 Shattuck 51 3001 Shattuck 52 2001 As hby 53 2821 Shattuck 54 2747 Sh attuck 55 2700 Shattuck 56 2655 Shattuck 57 2627 Shattuck 58 211 0 Parker 59 2104 Dwight 60 2032 Dwig ht TO ~eoo ~11attc c: k 'i' I ~ ti'f'.l ~ 11 a ttru:: k 'i'~ 259B Sl1atlt1 ~k ?S 26S7 Pa, ke,
0 195 390 780 Feet I 1 1 1 I 1 1 1 I
[I CITY OF BERKELEY Planning Department 2120 Milvia Street, Berkeley CA 94704

2015 -2023 Berkeley Housing Element - Appendix A – Site Inventory and Capacity Analysis Background by Area
256
Map A-10: Commercial Corridors Opportunity Sites, Shattuck: Rose to Francisco
::,;. 0:: 2 w :c
r
64
0
j ~ w VINE-----4'--------+------,.--------+-----x,;;...· ----5
0 0:: a. (/)
I :c (!) 0:: <(
~ I -------?z-----+-----"'-----......;a,...------4----€E0AR---..,_ ___ _....,..... 0 a)
1-----1l:IN80l:N------B
I I EJ l---.f------L------+----------4-----'---------4----'C/l -p
1-----1--------FRANGliE:0--------~
~
i I
-
Map A-10: Commercial
Corridors Opportunity Sites
Shattuck: Rose to Francisco
61 1685Shattuck 62 1607 Shattuck 63 1536 Shattuck 64 1451 Shattuck
N
j 0 125 250 500 Feet I I I I I I I I I
[I CITY OF BERKELEY Planning Department 2120 Milvia Street, Berkeley CA 94704

2015-2023 Berkeley Housing Element Appendix B – Summary of Development Standards (Residential and Commercial Districts)
257
Appendix B
Summary of Development Standards (Residential and
Commercial Districts)

2015-2023 Berkeley Housing Element Appendix B – Summary of Development Standards (Residential and Commercial Districts)
258
Table B-1: Residential District Development Standards
Zoning District
Min Lot Area
(sq. ft.)
Density (sq. ft.) Min Lot Area Per
Unit
Height Limit Yard Maximum Lot Coverage Usable
Open Space
Per Unit (sq ft.)
Story Front Rear Side Street Side
Building Separation
Main Building Height
(stories)
Interior and Through Lots
(%)
Corner Lots (%) Avg.
Height Max Ht (H dist)
Stories (#)
R-1 Single Family
5,000 5,000 28' 1 35' 2 3 1 to 3 20' 20' 11 4' 12
4 9 -- 1 to 3 40 40 400
R-1A Limited Two
Family 5,000 __
14 28' 1 __ 3 1 to 3 20' 20' 10 11 4'
12 4
9 -- 1 to 3 40 45 400
ES-R Environmental
Safety 9,000 9,000 24' 2 35' 2 2 1 to 2 20' 3 20' 3 15' 3 -- 30 '
3 1 to 2 30 30 400
R-2 Restricted Two
Family 5,000 2,500
5 28' 1 35' 2 3
1 20' 20' 13 4' 12
10' 9 8' 7 1 45 50
400 2 20' 20' 13
4' 12
10' 9 12' 7 2 40 45
3 20' 20' 13
6' 15 10'
9 16' 7 3 35 40
R-2A Restricted
Multiple Family 5,000 1,650 6 28' 1 35'
2 3
1 15' 15' 13
4' 12
6' 9 8' 7 1 45 50
300 8 2 15' 15'
13 4'
12 8'
9 12' 7 2 40 45
3 15' 15' 13
6' 15 10' 9 16' 7 3 35 40
R-3 Multiple Family
5,000 __ 4 35' 35'
2 3
1 15' 15' 13
4' 6' 8' 7 1 45 50
200 16
2 15' 15' 13
4' 8' 12' 7 2 45 50
3 15' 15' 13
6' 10' 16' 7 3 40 45
R-4 Multiple Family
5,000 __ 4 35' 17 35'
2 3
17
1 15' 15' 13
4' 6' 8' 7 1 45 50
200 16
2 15' 15' 13
4' 8' 12' 7 2 45 50
3 15' 15' 13
6' 10' 16' 7 3 40 45
4 15' 17' 13
8' 12' 20' 7 4 35 40
5 15' 19' 13
10' 14' 24' 7 5 35 40
6 15' 21' 13
12' 15' 28' 7 6 35 40
R-S Residential Southside
5,000 __ 35’ 35’20
3’20
1 10’13
10’ 4’ 6’ 8’13
1 65 70
5019
2 10’
13 10’ 4’ 8’ 12’
13 2 65 70
3 10’13
10’ 6’ 10’ 16’13
3 60 65
4 10’13
17’ 8’ 10’ 20’13
4 55 60
R-SMU Residential Mixed-Use
5,000 __ 60’17
60’17
417
1 10’13
10’13
4’13
6’13
8’13
1 5521
6021
4019
2 10’13
10’13
4’13
8’13
12’13
2 5521
6021
3 10’13
10’13
6’13
10’13
16’13
3 5021
5521
4 10’13
17’13
8’13
10’13
20’13
4 4521
5021
5 12’13
19’13
10’13
10’13
24’13
5 4021
4521

2015-2023 Berkeley Housing Element Appendix B – Summary of Development Standards (Residential and Commercial Districts)
259
1. Up to 35' allowed with an AUP 7. For two or more main buildings with dwelling units, separation can be reduced with an AUP. 14. No more than two dwelling units allowed; lot area
must be at least 4,500 sq. ft. to establish two dwelling units.
19. For each dwelling unit, 20 sq. ft. for each person in a Group Accommodation Room.
2. May exceed with an AUP (UP in ES-R) 8. 300 sq. ft. for each dwelling unit, 125 sq. ft. for each person in a Group Accommodation room.
3. May reduce with a Use Permit and Fire Department review
9. If the lot to the rear is not a corner lot, the street side yard shall be 1/2 of the existing or required front yard of the lot to the rear, whichever is smaller. However, if subject lot has a rear yard of 50' or greater, the side yard can be reduced to 4'.
15. No more than two dwelling units allowed; lot area must be at least 4,500sq. Ft. to establish two dwelling units.
20. Main Buildings may exceed 35 ft. and three stories in height, to a height of, but not exceeding, 45 ft. and four stories subject to obtaining a Use Permit, and at least 50% of the total building floor area residential use.
4. One Group Accommodation room for every 350 sq. ft; additional room allowed for any remaining lot area of more than 200 sq. ft.
16. 200 sq. ft. for each dwelling unit, 90 sq. ft. for each person in a Group Accommodation Room.
5. Additional dwelling unit allowed for any remaining lot area more than 2,000 sq. ft.
10. Rear and/or side yards on lots west of San Pablo can be reduced to construct a dwelling unit. 17. Main Buildings may exceed 35 ft. and three stories
in height, to a height of, but not exceeding, 65 ft. and six stories subject to obtaining a Use Permit
21. Main Buildings may be increased to up to 100% with an Administrative Use Permit with the finding that the increase is appropriate given the setbacks and architectural design of the surrounding buildings.
11. May reduce to 20% of lot depth when lot depth is less than 100'.
6. Additional dwelling unit allowed for any remaining lot area more than 1,300 sq. ft. One Group Accommodation room for every 800 sq. ft; additional room allowed for any remaining lot area of more than 500 sq. ft.
12. May reduce to 10% of lot width, but not less than 3', when width of lot is less than 40'. 18. Front setbacks may be reduced to 0 feet through
an Administrative Use Permit. 13. May reduce with an AUP for two or more main buildings which contain dwelling units.
Table B-2: Commercial District Development Standards for Mixed-Use Buildings*
Zoning District FAR Max.
Height (ft) Max.
Stories
Parking-Commer. (sq. ft.)
Parking-Resid. (sq.
ft.) 1
Open Space (sq. ft. per unit)
Max. Coverage
(%)
Yard Requirements
Main Building
Separation
Min. Lot Area
(sq. ft.) density
C-1 (non-UASP) 3 40 32 3 2/1000 per R-3
4 200 0 none none none none
C-N 3 35 32 2/1000 per R-3
4 200 0 per 23E.04.050 none none none
C-E 0.8
interior/1 corner
28 2 2/1000 per R-34 200' 0
per 23E.04.050
5
none none none
C-NS 1 35 3 2/1000 per R-34 40 0
per 23E.04.050
6
per R-3 4000 none
C-SA (Durant to
Parker) 4 60 5
2 2/1000
7 per R-4
4 40
35-50 % per R-4
per R-48 none none none
C-SA (Parker to
Ward) 4 50 4
2 2/1000
7 per R-4
4 40
35-50 % per R-4
per R-48 none none none
C-SA (all other) 4 36 32 2/1000
7 per R-4
4 40
35-50 % per R-4
per R-48 none none none
C-T 3 50 4 0 0 40 0 per
23E.04.0509
none none none
C-SO 2 28 2 2/1000 per R-34 40 0
per 23E.04.050
5
per R-3 none none
C-W 3 50 410
2/1000 1/unit 40 0 per 23E.04.050 none none none

2015-2023 Berkeley Housing Element Appendix B – Summary of Development Standards (Residential and Commercial Districts)
260
C-DMU (Core Area, Outer Core, and Corridor)
N/A
6011
N/A 1.5/1000 1per 3 units 8012
0 per 23E.04.050
and 23E.68.070.C
none none none 75 (with
UP)
C-DMU (Buffer) N/A 50 N/A 1.5/1000 1per 3 units 8012
0 per 23E.04.050
and 23E.68.070.C
none none none
MU-R 1 13
35 14
3 14
depends on use
1/unit 150 per
d.u. 40 per l/w
0 5' front yard, 10' adj to R
District none none 1/1,250
15
* All maximum standards are for the base project, some may be increased with a Use Permit.
23E.04.050 Yards Adjacent to Residential District: side 5 ft; rear 10 ft or 10% of lot depth.
1. Over 10 units 1/1000 sf per R-3 and R-4 10. 4th floor must be residential or live/work. 2. 3rd floor and above residential only 11. Within the Core, up to three buildings over 120 feet but not more than 180 feet. 3. 4 stories and 50 feet allowed with a UP Within the Core and Outer Core, up to two buildings over 75 feet but not more than 120 feet. 4. 1 per unit when less than 10 units 12. Each square foot of such open space that is provided as Privately-Owned Public Open 5. Bay windows excepted Space shall be counted as two square feet of required on-site open space for residential uses. 6. Min. 10 foot setback from a room with habitable space 13. FAR 1.5 when 50% of building residential and/or live work
7. First 1,000 sq. ft. waived; may be modified with UP in mixed 14. When 50% residential or live/work use buildings 15. There may be one additional unit for any remaining lot area which may be less than 1,250
9. 4th Floor 10 feet from Telegraph Avenue square feet but greater than 750 square feet.

2015-2023 Berkeley Housing Element Appendix C – Zoning and General Plan Background
261
Appendix C Zoning District and General Plan Designation Background
This appendix provides the zoning district purposes from the Berkeley Municipal Code and
General Plan Land Use Designations from the 2002 Berkeley General Plan.

2015-2023 Berkeley Housing Element Appendix C – Zoning and General Plan Background
262
General Plan Land Use Designations
Low Density Residential (LDR)
These areas are generally characterized by single-family homes. Appropriate uses for these
areas include: residential, community services, schools, home occupations, recreational uses,
and open space and institutional facilities. Building intensity will range from one to 10 dwelling
units per net acre, not including secondary units, and the population density will generally not
exceed 22 persons per acre.
For information purposes, the compatible zoning districts for this classification are: Single
Family Residential (R-1), which allows approximately 9 principal dwelling units/acre and
Environmental Safety- Residential (ES-R), which allows approximately 5 dwelling units per acre.
Height limits in these zoning districts are typically 28 feet with provisions to allow up to 35 feet.
Low Medium Density Residential (LMDR)
These areas are generally characterized by single-family homes and small multi-family
structures with two or three units. The same uses appropriate in Low Density Residential are
appropriate in Low Medium Density Residential areas. Building intensity will range from 10 to 20
dwelling units per net acre, not including secondary units, and the population density will
generally range from 22 to 44 persons per acre.
For information purposes, the compatible zoning districts for this classification are: Limited Two-
family Residential (R-1A) and Restricted Two-family Residential (R-2), which allow
approximately 17 units per acre. Height limits in these zoning districts are typically 28 feet with
provisions to allow up to 35 feet.
Medium Density Residential (MDR)
These areas of Berkeley are generally characterized by a mix of single-family homes and small
to medium sized multi-family structures. The same uses appropriate in Low Density Residential
are appropriate in Medium Density Residential areas. Building intensity will range from 20 to 40
dwelling units per net acre, and the population density will generally range from 44 to 88
persons per acre.
For information purposes, the compatible zoning districts for this classification are: Restricted
Multi-family Residential (R-2A), which allows approximately 17 units per acre, and Multiple-
family Residential (R-3), which allows approximately 26 units per acre. Height limits in the R-2A
zoning district are typically 28 feet with provisions to allow up to 35 feet, and are 35 feet in the
R-3 zoning district.
High Density Residential (HDR)
In Berkeley, these areas are generally characterized by large, multi-family structures
conveniently located near transit, the Downtown, the University campus, or BART. Appropriate
uses for these areas include: residential, community service, schools, institutional, recreational
uses, open space, and in some cases where allowed by zoning, ground-floor commercial and

2015-2023 Berkeley Housing Element Appendix C – Zoning and General Plan Background
263
office. Building intensity will range from 40 to 100 dwelling units per net acre, and the population
density will generally range from 88 to 220 persons per net acre.
For information purposes, the compatible zoning districts for this classification are: Multi-Family
Residential (R-4), which allows building heights of 35 feet with provisions to allow buildings up
to 65 feet, and High Density Residential (R-5), which allows building heights of 40 feet with
provisions to allow buildings up to 65 feet.
Neighborhood Commercial (NC)
These areas of the city are generally characterized by pedestrian-oriented, neighborhood-
serving commercial development, and multi-family residential structures. These areas are
typically located on two-lane streets with on-street parking and transit. Appropriate uses for
these areas include: local-serving commercial, residential, office, community service, and
institutional. Building intensity will generally range from a Floor Area Ratio (FAR) of less than 1
to an FAR of 3. Population density will generally range from 44 to 88 persons per acre.
For information purposes, the compatible zoning districts for this classification are shown below
with accompanying development standards.
Zoning District Maximum FAR Maximum Height Neighborhood Commercial (C-N): 3 35 ft Elmwood Commercial (C-E): 0.8 to 1 28 ft North Shattuck Commercial (C-NS): 1 (non-res.) 35 ft Solano Avenue Commercial (C-SO): 2 28 ft
South Area Commercial (C-SA): 4 24-36 ft
Avenue Commercial (AC)
These areas of Berkeley are characterized by pedestrian-oriented commercial development and
multi-family residential structures. These areas are typically located on wide, multi-lane avenues
served by transit or BART. Appropriate uses for these areas include: local-serving and regional-
serving commercial, residential, office, community service, and institutional. Building intensity
will generally range from a Floor Area Ratio (FAR) of less than 1 to an FAR of 4. Population
density will generally range from 44 to 88 persons per acre.
For information purposes, the compatible zoning districts for this classification are shown below
with accompanying development standards.
Zoning District Maximum FAR Maximum Height South Area Commercial (C-SA): 4 24 - 36 ft General Commercial (C-1): 3 35 - 50 ft Telegraph Avenue Commercial (C-T): 3 - 3.5 50 ft
West Berkeley Commercial (C-W): 3 40 - 50 ft

2015-2023 Berkeley Housing Element Appendix C – Zoning and General Plan Background
264
Downtown (DT)
This area of Berkeley is identified as the Downtown in the Downtown Plan and is characterized
by high density commercial, office, arts, culture, entertainment and residential development. The
Downtown classification is intended to encourage, promote, and enhance development that will
increase the residential population in the Downtown, provide new high density, transit-oriented
housing opportunities, and support a vital city center. Uses appropriate for this area include:
medium- and high-density housing, regional- and local-serving arts, entertainment, retail, office,
cultural, open space, civic uses, and institutional uses and facilities. It is General Plan policy to
increase the residential population in the Downtown. Building intensity will generally range from
a Floor Area Ratio (FAR) of less than 1 to an FAR of 6. Population density will generally range
from 88 to 220 persons per net acre.
For information purposes, the compatible Zoning Districts for this classification are: Central
Commercial (C-2) and General Commercial (C-1). See pages LU-5 and LU-6 of the Land Use
Element above for a description of development standards in the Downtown area.
Institutional (I)
These are areas of Berkeley for institutional, government, educational, recreational, open
space, natural habitat, woodlands, and public service uses and facilities, such as the University
of California, BART, Berkeley Unified School District, and East Bay Municipal Utility District
facilities. It is General Plan policy that public agencies comply with General Plan policies and
local zoning standards. Within these areas, building intensity will generally range from a Floor
Area Ratio (FAR) of less than 1 to an FAR of 4.
Manufacturing (M)
These areas are intended to maintain and preserve areas of Berkeley for manufacturing and
industrial uses necessary for a multi-faceted economy and job growth. Appropriate uses for
these areas are identified in the West Berkeley Plan. Within these areas, building intensity will
generally range from a Floor Area Ratio (FAR) of less than 1 to an FAR of 2.
For information purposes, the compatible zoning districts for this classification are:
Manufacturing (M), Mixed Manufacturing (MM), and Mixed Use-Light Industrial (MU-LI), which
all allow a maximum FAR of 2 and a maximum building height of 45 feet.
Mixed Use-Residential (MU-R)
These areas are intended to maintain and preserve areas of the city for lighter manufacturing
and industrial uses and allow for additional uses, including residential, where determined
appropriate by zoning, and only if the use will not weaken Berkeley’s manufacturing and
industrial economy. Appropriate uses for these areas are identified in the West Berkeley Plan.
Within these areas, building intensity will generally range from a Floor Area Ratio (FAR) of less
than 1 to an FAR of 1.5. Population density will generally range from 22 to 44 persons per acre,
where housing is allowed.

2015-2023 Berkeley Housing Element Appendix C – Zoning and General Plan Background
265
For information purposes, the compatible zoning district for this classification is Mixed Use-
Residential (MU-R), which allows a maximum FAR of 1 to 1.5 and a maximum building height of
28 to 35 feet.
Waterfront/Marina (W)
These areas are intended to maintain and preserve areas of Berkeley adjacent to the Bay for
open space, recreational uses, waterfront-related commercial and visitor services, boating, and
water transit facilities. Appropriate uses for these areas are identified in the Waterfront Plan.
Building intensity will generally range from a Floor Area Ratio (FAR) of 0 to 0.5, as established
by the Waterfront Plan and Measure Q.
Open Space and Recreation (OSR)
These areas of the city are appropriate for parks, open space, pathways, recreational facilities,
natural habitat, and woodlands. Appropriate uses for these areas include parks, recreational
facilities, schoolyards, community services, and facilities necessary for the maintenance of the
areas.
Zoning District Purposes
C-1
The purposes of the General Commercial (C-1) Districts are to:
A. Implement the General Plan’s designations for Avenue Commercial areas;
B. Provide locations for a wide variety of activities along thoroughfares;
C. Encourage development in underutilized neighborhood and community shopping areas;
and
D. Promote development compatible with adjacent commercial and residential areas.
E. Implement permitted use regulations and building development standards for the University
Avenue Strategic Plan Overlay area, as stated in the University Avenue Strategic Plan Goals,
to:
1. Increase public safety for residents, merchants, and customers.
2. Revitalize the University Avenue corridor through appropriate economic development
and housing.
3. Protect and improve neighborhood quality of life.
4. Encourage more pedestrian-oriented development and an appropriate mix of uses to
improve neighborhood identity.

2015-2023 Berkeley Housing Element Appendix C – Zoning and General Plan Background
266
5. Enhance University Avenue as a gateway to the City, a series of neighborhoods, and
the downtown.
6. Coordinate and enhance public transit systems, pedestrian access, and bicycle
circulation.
7. Encourage a concentration of commercial activity at the designated nodes. (Ord. 6830-
NS § 2 (part), 2004: Ord. 6478-NS § 4 (part), 1999)
C-N
The purposes of the Neighborhood Commercial (C-N) Districts are to:
A. Implement the Master Plan’s designations for Neighborhood Commercial areas;
B. Provide locations for uses supplying convenience goods and services for residents of the
immediate area;
C. Provide locations for other activities compatible with these Commercial Uses;
D. Minimize traffic and parking problems for the adjacent residential areas; and
E. Promote compatibility between such commercial areas and nearby residential areas. (Ord.
6478-NS § 4 (part), 1999)
C-E
The purposes of the Elmwood Commercial (C-E) Districts are to:
A. Implement the Master Plan’s designation for a community commercial district in this area.
B. To maintain a scale and balance of retail goods and services in the district to compatibly
serve the everyday needs of surrounding neighborhoods by:
1. Providing locations for retail goods and service establishments to serve surrounding
neighborhoods;
2. Preventing development which exceeds the amount and intensity of use that is compatible
with adjacent residential neighborhoods;
3. Limiting the space occupied by businesses that generate high traffic and/or parking demands;
4. Controlling the proliferation of establishments which, if not limited, might expand to displace
establishments needed to serve surrounding neighborhoods; and
5. Permitting other uses which serve this objective.
C. To ensure that new buildings, alterations and additions to existing buildings harmonize with
their surroundings. (Ord. 6478-NS § 4 (part), 1999)

2015-2023 Berkeley Housing Element Appendix C – Zoning and General Plan Background
267
C-NS
The purposes of the North Shattuck Commercial (C-NS) Districts are to:
A. Implement the Master Plan’s designations for Community Commercial and
Commercial/Residential in this area.
B. To encourage the maintenance and establishment of retail and service activities that
provide goods and services to serve the residents of the adjacent and outlying neighborhoods;
but do not generate high traffic volume.
C. To provide locations for other activities compatible with these commercial activities.
D. To promote compatibility between such commercial areas and adjacent residential
neighborhoods.
E. To limit the space occupied by businesses that generate high traffic volumes.
F. To support the retention of types of businesses serving adjacent neighborhoods.
G. To limit space occupied by Commercial Uses, especially offices, that are more
appropriately located in the downtown business District.
H. To prevent development of commercial spaces exceeding the amount and intensity of use
that can be served by available traffic capacity and potential parking supply.
I. To encourage an adequate commercial and residential mix along Shattuck Avenue.
J. To ensure that new buildings and additions to existing buildings harmonize with their
surroundings. (Ord. 6478-NS § 4 (part), 1999)
C-SA
The purposes of the South Area Commercial (C-SA) Districts are to:
A. Implement the Master Plan’s designations for Community Commercial, and the
Commercial/Residential areas, as well as the policies of the South Berkeley Area Plan.
B. Provide locations for both community-serving and regional-serving businesses, particularly
those which reflect the culture of the surrounding area.
C. Provide an area of neighborhood and lower intensity community Commercial Uses, serving
as a transition between the Downtown area and the neighborhood-serving area south of Ashby
Avenue.
D. Encourage the location of a wide variety of community-oriented retail goods and services in
South Berkeley.
E. Encourage residential development for persons who desire both the convenience of
location and more open space than is available in the Downtown.

2015-2023 Berkeley Housing Element Appendix C – Zoning and General Plan Background
268
F. Provide limited locations for other activities such as offices which may be compatible with
both retail and Residential Uses.
G. Encourage development and amenities that support pedestrian-oriented uses.
H. Encourage appropriate mixed-use development (retail/office/residential) on appropriate
sites in the District.
I. Increase the opportunities for the establishment of businesses which are owned and
operated by local residents. (Ord. 6478-NS § 4 (part), 1999)
C-T
The purposes of the Telegraph Avenue Commercial (C-T) Districts are to:
A. Implement the General Plan’s designation of Avenue Commercial for this area.
B. Implement the Southside Plan’s designation for the Telegraph Avenue Commercial Subarea.
C. Regulate development in the Telegraph Area Commercial District in order to satisfy the
needs of the population groups using the District, especially the University population and the
surrounding resident population.
D. Encourage the availability of a variety of goods and services which serve residents in the
District and the University population but do not generate a high volume of vehicular traffic.
E. Allow for uses which maintain the cultural quality of the District giving it its regional appeal
without generating substantial vehicular traffic.
F. Discourage uses which, because of size, the type of the products sold, vehicular traffic
generated or other considerations, are more appropriately located elsewhere in the City.
G. Encourage a mix of goods and services which will preclude the dominance of any one type of
use and which will produce variations within the same category of uses.
H. To encourage the establishment and maintenance of uses which will satisfy the needs of all
age groups and attract a range of users and interests.
I. Encourage the creation of additional housing in the District which is affordable, including
housing for those who work or study nearby.
J. Encourage those uses and structural architecture that reinforce, and discourage those uses
and architecture that interrupt, the pedestrian orientation of the District.
K. Encourage mixed Commercial and Residential Uses.
L. Encourage the construction of new housing in mixed use development on vacant properties
and surface parking lots.

2015-2023 Berkeley Housing Element Appendix C – Zoning and General Plan Background
269
M. Encourage the redevelopment of single-story structures that are not historically significant
resources with housing and mixed use development.
N. Protect and enhance historically and architecturally significant buildings by ensuring that new
development and alterations complement their existing architectural character.
O. Encourage the establishment and survival of small, locally-owned businesses, thereby
contributing to the vitality and diversity of the District.
P. Discourage the type of Commercial Use whose establishment will contribute to the
displacement of businesses that supply neighboring residents with essential goods and
services.
Q. Ensure that new buildings, additions and renovations harmonize with and enhance the
unique character of the District.
R. Provide environmental protection for the residents of mixed residential commercial structures
and surrounding residents from such detriments as noise, fumes and litter.
S. Preserve the ethnic diversity of the resident population and users of the District and of the
types of businesses providing ethnically diverse goods and services in the District.
T. Protect and encourage the development of properties accessible to the disabled for both
residential and Commercial Use.
U. Discourage uses which are widely available in other shopping Districts throughout the Bay
Area and detract from the unique type and mix of goods and services available in the District. (Ord.
7210-NS § 19, 2011: Ord. 6478-NS § 4 (part), 1999)
C-SO
The purposes of the Solano Avenue Commercial (C-SO) Districts are to:
A. Implement the Master Plan’s designations for Community Commercial and Commercial
Service areas.
B. Maintain a scale and balance of commercial activity on Solano Avenue that will enhance the
surrounding neighborhood and serve its residents, and will operate:
1. To encourage the location of businesses on Solano Avenue that serve the everyday needs of
local residents;
2. To discourage the location of businesses on Solano Avenue that serve a larger regional
clientele, and should more appropriately be located in the Central Business District;
3. To limit the number of businesses on Solano Avenue that generate traffic or parking demand
in excess of commercial parking availability, causing the overflow of traffic circulation and
parking onto adjacent residential streets;

2015-2023 Berkeley Housing Element Appendix C – Zoning and General Plan Background
270
4. To encourage location of late night commerce in appropriate areas in Berkeley, such as the
downtown area, and allow businesses to address demand for late night service on Solano
Avenue by establishing a 11:00 p.m. closing time for businesses on Solano Avenue;
5. To ensure that all construction, alterations, or additions to buildings will be in functional and
aesthetic harmony with adjacent buildings and areas.
C. To protect local residents from commercial noise, offensive odors and parking and traffic
problems. (Ord. 7191-NS § 15, 2011: Ord. 6478-NS § 4 (part), 1999)
C-W
The purposes of the West Berkeley Commercial (C-W) Districts are to:
A. Implement the West Berkeley Plan’s designation of a Commercial District;
B. Provide locations for commercial services which primarily serve area residents and/or
businesses;
C. Support the retention and attraction of a balance of both smaller and larger stores and
restaurants;
D. Provide appropriate locations, consistent with West Berkeley Plan policies, for commercial
services which serve a citywide or broader clientele;
E. To provide a relatively compact, clearly bounded set of commercial areas in West Berkeley,
so as to both improve the quality of West Berkeley shopping environments and to prevent
commercial overspill into industrial areas;
F. Encourage the intensification of commercial activity at designated nodes to help develop
more pedestrian-oriented environments at those locations;
G. Increase the opportunities for development of housing in commercial areas to support local
retailing and use of transit lines and opportunities for mixed use projects combining pedestrian-
oriented neighborhood-serving uses with mixed income housing in locations abutting residential
districts;
H. Encourage appropriately intense development in underutilized portions of commercial
streets;
I. Promote development compatible with adjacent commercial, residential and industrial areas;
J. Provide a location for cultural and performing arts activities;
K. To promote environmental protection for the residents and workers both within and
adjacent to the District from such detriments as noise, fumes, and other detrimental
environmental effects. (Ord. 6478-NS § 4 (part), 1999)
C-DMU
2015-2023 Berkeley Housing Element Appendix C – Zoning and General Plan Background
271
The purpose of this Chapter is to implement the vision and goals of the Downtown Area Plan
(adopted 2012), which include: Environmental Sustainability, Land Use, Access, Historic
Preservation and Urban Design, Streets and Open Space, Housing and Community Health and
Services, and Economic Development. (Ord. 7229-NS § 1 (part), 2012)
R-1
The purposes of the Single Family Residential (R-1) Districts are to:
A. Recognize and protect the existing pattern of development in the low density, single family
residential areas of the City in accordance with the Master Plan;
B. Make available housing for persons who desire detached housing accommodations and a
relatively large amount of Usable Open Space;
C. Protect adjacent properties from unreasonable obstruction of light and air; and
D. Permit the construction of community facilities such as places for religious assembly,
Schools, parks and libraries which are designed to serve the local population when such will not
be detrimental to the immediate neighborhood. (Ord. 6478-NS § 4 (part), 1999)
R-1A
The purposes of the Limited Two-family Residential Districts (R-1A) are to:
A. Recognize and protect the existing pattern of low medium density residential areas
characterized by reasonable open and spacious type of development in accordance with Master
Plan Policy;
B. Protect adjacent properties from unreasonable obstruction of light and air;
C. Allow flexibility in the use of property for residential purposes by permitting two Dwelling
Units on one lot under limited conditions.
D. In those portions of the District west of San Pablo Avenue, appropriately regulate the rear
and side yards for the construction of a Dwelling Unit. (Ord. 6478-NS § 4 (part), 1999)
R-2
The purposes of the Restricted Two-family Residential (R-2) Districts are to:
A. Implement Master Plan policy by encouraging the development of low medium density
residential areas characterized by a reasonably open and spacious type of development with a
pattern of housing types ranging from single-family to duplexes and small apartment structures;
B. Make available housing for persons who desire a range of housing choice with a relatively
large amount of open space;

2015-2023 Berkeley Housing Element Appendix C – Zoning and General Plan Background
272
C. Protect adjacent properties from unreasonable obstruction of light and air. (Ord. 6478-NS §
4 (part), 1999)
R-2A
The purposes of the Restricted Multiple-family Residential (R-2A) Districts are to:
A. Implement Master Plan policy by encouraging the development of medium density
residential areas characterized by small multiple-family and garden-type apartment structures
with a maximum of open space consistent with this type of development;
B. Make available housing for persons who desire apartment-type accommodations with a
maximum of open space;
C. Protect adjacent properties from unreasonable obstruction of light and air;
D. Permit only that intensity of use which will be compatible with existing low density
residential structures and will not be detrimental to the immediate neighborhood. (Ord. 6478-NS
§ 4 (part), 1999)
R-3
The purposes of the Multiple Family Residential (R-3) Districts are to:
A. Implement Master Plan policy by encouraging development of relatively high density
residential areas;
B. Make available housing for persons who desire both convenience of location and a
reasonable amount of Usable Open Space;
C. Protect adjacent properties from unreasonable obstruction of light and air;
D. Permit the construction of residential structures, such as dormitories, fraternity and sorority
houses, boarding and rooming houses, which will meet the City requirements for this type of
housing;
E. Permit the construction of specialized care and treatment facilities such as Senior
Congregate Housing, Nursing Homes and Hospitals when such will not be detrimental to the
immediate neighborhood. (Ord. 6478-NS § 4 (part), 1999)
R-4
The purposes of the Multi-family Residential (R-4) Districts are to:
A. Implement Master Plan policy by encouraging development of relatively high density
residential areas;
B. Make available housing for persons who desire both convenience of location and a
reasonable amount of Usable Open Space;

2015-2023 Berkeley Housing Element Appendix C – Zoning and General Plan Background
273
C. Protect adjacent properties from unreasonable obstruction of light and air;
D. Permit the construction of residential structures, such as residential hotels, and hotels,
which will provide housing opportunities for transient or seasonal residents;
E. Permit the construction of institutional and office uses when such will not be detrimental to
the immediate neighborhood. (Ord. 6478-NS § 4 (part), 1999)
R-5
The purposes of the High Density Residential (R-5) Districts are to:
A. Foster development of high density, multi-story residential areas close to major shopping,
transportation and employment centers, in accordance with the Master Plan;
B. Make available housing for persons who desire both convenience of location, but who require
relatively small amounts of Usable Open Space; yet assure adequate light, air, privacy and
Usable Open Space to promote and protect their physical and mental health;
C. Protect adjacent properties from unreasonable obstruction of light and air;
D. Permit the construction of residential structures, such as apartments and hotels, which will
provide housing opportunities for transient or seasonal residents;
E. Permit the construction of institutional and office uses when such will not be detrimental to
the immediate neighborhood. (Ord. 6478-NS § 4 (part), 1999)
R-S
The purposes of the Residential Southside (R-S) Districts are to:
A. Implement General Plan and Southside Plan policy by encouraging relatively high and
moderate density, multi-story residential development close to major shopping, transportation
and employment centers;
B. Make housing available for persons who desire a convenient location with relatively small
amounts of Usable Open Space, yet assure adequate light, air, privacy and Usable Open Space
to promote and protect their physical and mental health;
C. Protect adjacent properties from unreasonable obstruction of light and air;
D. Permit the construction of residential structures, such as apartments, and hotels, which will
provide housing opportunities for transient or seasonal residents;
E. Encourage the construction of new housing on vacant properties and surface parking lots;
F. Encourage the redevelopment of single-story structures that are not historically significant
resources with more dense housing development; and

2015-2023 Berkeley Housing Element Appendix C – Zoning and General Plan Background
274
G. Protect and enhance historically and architecturally significant buildings by ensuring that new
development and alterations complement their existing architectural character. (Ord. 7208-NS §
1 (part), 2011)
R-SMU
A. Implement General Plan and Southside Plan policy by encouraging high density, multi-story
residential development close to major shopping, transportation and employment centers;
B. Make housing available for persons who desire a convenient location, but who require
relatively small amounts of Usable Open Space; yet assure adequate light, air, privacy and
Usable Open Space to promote and protect their physical and mental health;
C. Protect adjacent properties from unreasonable obstruction of light and air;
D. Permit the construction of residential structures, such as apartments and hotels, which will
provide housing opportunities for transient or seasonal residents;
E. Permit the construction of institutional, neighborhood serving retail, and office uses when
such will not be detrimental to the immediate neighborhood;
F. Provide locations for relocation of office space from other locations in the Southside Plan
area;
G. Encourage the construction of new housing and mixed-use development on vacant
properties and surface parking lots;
H. Encourage the redevelopment of single-story structures that are not historically significant
resources with housing and mixed-use development; and
I. Protect and enhance historically and architecturally significant buildings by ensuring that new
development and alterations complement their existing architectural character. (Ord. 7209-NS §
1 (part), 2011)

2015-2023 Berkeley Housing Element Appendix D – Community Participation Background
275
Appendix D
Community Participation Background
This appendix provides background materials related to the community participation process,
including:
1. List of public meetings
2. Compilation of public comments
3. Distribution list of groups and organizations invited to participate in the update process.
Note: this list does not include individuals included on the distribution list, only groups,
and does not include contact information.
4. Letters from the public
5. December 3, 2014 memorandum compiling and responding to November comments
from the Planning Commission, Housing Advisory Commission, and Homeless
Commission
6. February 18, 2015 memorandum responding to February 4 public and Planning
Commission comments

2015-2023 Berkeley Housing Element Appendix D – Community Participation Background
276
1. List of Public Meetings
1. June 4, 2014 : Planning Commission Meeting
2. September 17, 2014 : Planning Commission Meeting
3. October 15, 2014 : Planning Commission Meeting
4. November 5, 2015 : Planning Commission Meeting
5. November 6, 2014 : Housing Advisory Commission Meeting
6. November 12, 2014 : Homeless Commission Meeting
7. December 3, 2014 : Planning Commission Meeting
8. February 4, 2015 : Planning Commission Meeting
9. February 18, 2015 : Planning Commission Meeting
10. April 28, 2015 (tent.) : City Council Meeting
The Housing Element website provides staff reports and presentations from these
meetings:
http://www.ci.berkeley.ca.us/housingelement/

2015-2023 Berkeley Housing Element Appendix D – Community Participation Background
277
2. Compilation of Public Comments
June 4, 2014, Housing Element Update Kickoff Meeting
There were no public comments on the Housing Element at this meeting.
September 17, 2014: Planning Commission (Chapter 3, Housing Needs)
There were no public comments on the Housing Element at this meeting.
Commissioners discussed the updated site inventory and the need for updates to the city’s
density bonus ordinance
October 15, 2014: Planning Commission (Chapter 2, Community Profile)
Speaker 1: Edward Moore stated that the information is valuable but more inferences and
conclusions are needed in the Community Profile chapter. He referred the Commission to a
news article explaining why the market will not address the affordable housing problem in
the Bay Area.
Speaker 2: Merrilie Mitchell discussed the Plan Bay Area project.
Speaker 3: Ted (last name inaudible) discussed the disposition of 76 BHA scattered sites
and indicated that a for-profit entity should not manage affordable housing.
November 5, 2014: Planning Commission (Chapters 5 & 6, Policies & Programs)
There were no public comments on the Housing Element at this meeting.
Commissioner comments and staff responses are provided in the attached December 3, 2014
memorandum.
November 6, 2014: Housing Advisory Commission (Chapters 5 & 6, Policies & Programs)
There were no public comments on the Housing Element at this meeting.
Commissioner comments and staff responses are provided in the attached December 3, 2014
memorandum.
November 12, 2014: Homeless Commission (Chapters 5 & 6, Policies & Programs)
There were no public comments at the Homeless Commission meeting. The Commissioners
discussed the program addressing units at-risk of converting to market rate and expressed
concern about the loss of restricted-income units.
December 3, 2014: Planning Commission (Chapter 4, Constraints)
Speaker 1: Dorothy Walker stated that the Housing Element does not go far enough in terms of addressing the need for affordable housing. She stated the City would need to make more effort to reduce the barriers to new housing, and provided suggestions as outlined the attached letter dated December 3, 2014.
Speaker 2: Merrilie Mitchell expressed concern about the impact of new housing on quality of life in Berkeley and the role of ABAG and the One Bay Area plan play in dictating development.
Speaker 3: David Shamza stated that Rent Stabilization Board policies are stifling diversity and affordability in housing by allowing tenants to “hold” a unit after moving out, thus reducing the supply of older, more affordable units.

2015-2023 Berkeley Housing Element Appendix D – Community Participation Background
278
Speaker 4: Edward Moore stated that the Element addresses many issues constraining new development, but does not address the building permit requirements for accessory buildings.
Speaker 5: (Name not stated) asked to what extent ADUs were playing a role in housing production in Berkeley.
Speaker 6: Darryl DeTienne stated that the City should consider more housing opportunities in West Berkeley.
February 4, 2015: Planning Commission (Public Hearing) Speaker 1: Michael Diehl stated that the Housing Element should address the issue of
homelessness. He stated that there has been a significant increase in homelessness across the country and that not housing people will end up costing the community more.
Speaker 2: Ian Monroe stated that Berkeley could do more to increase the supply of housing as the demand for housing has gotten worse.
Speaker 3: Katherine Harr stated that even with vacancy decontrol, over time rent controlled units provide affordable housing for tenants who could not afford market rents. She stated that the City should monitor existing inclusionary units, provide a wait list and prioritize special needs populations such as seniors, for whom a lot of housing programs have been cut. She also stated that the at-risk section of the Housing Elements does not address the concerns residents at some of the buildings mentioned who do not feel stable in their housing. She stated that many organizations are concerned about the demolition ordinance and that there must be a one-to-one replacement of rent-controlled housing. Finally, she stated that the Rent Board should decide what is rent-controlled, rather than the Zoning Adjustments Board or staff, and that this conflict should be resolved.
Speaker 4: Moni Law stated that social media should be used for outreach and spoke about tenants who have been displaced from Berkeley to outer cities. She stated that more and more owner-move-in evictions are occurring, displaced tenants (including Section 8 voucher holders) cannot afford market rents in non-rent controlled buildings, and Cal students are living two or more to a room in order to afford housing. She stated that the city should maintain a list of BMR units and noted that BMR units have long wait lists while rents have gone up by $300-1,000 more per month this year.
Speaker 5: Merrilie Mitchell state that the ABAG housing allocation process is unfair because it does not let the city count dorm rooms as housing, and needs of students and low-income residents are in conflict.
February 18, 2015: Planning Commission (Public Hearing) Speaker 1: Mary Rose Sebastian spoke about the lack of affordable units and long wait lists
for Below Market Rate (BMR) housing in Berkeley. Speaker 2: James Chang spoke on behalf of Berkeley Tenant’s Union regarding the
demolition of Rent Controlled Units. He asked the Commission to explicitly state that it supports demolition only in extreme cases and only if demolish units are replaced with permanent affordable housing with for current tenants.
Speaker 3: Julia Cato spoke on behalf of the Berkeley Tenant’s Union regarding habitability issues in Berkeley such as, mold, mildew, shoddy aging, hazardous wiring, and lack of heat—all issues impacting both safety and health of tenants. She stated that 75% of Berkeley Tenants have indicated their units are in need of repair, but many tenants often do not report these issues due to fear of retaliation from landlords. She stated that tenants should be able to make anonymous complaints and that proactive inspections must be dramatically increased.

2015-2023 Berkeley Housing Element Appendix D – Community Participation Background
279
Speaker 4: Kathy Harr spoke on behalf of the Berkeley Tenant’s Union regarding the Affordable Housing Mitigation Fee (AHMF). She stated the Commission should recommend to the Council that the AHMF should be set at $34,000 per unit rather than the current $20,000. She stated that the goal of maintaining 17 percent of Berkeley’s units as affordable for extremely low or very low-income households should be higher, given that 68 percent of renters are extremely low or very low-income.
Speaker 5: Igor Tregub, Chair of the Housing Advisory Commission, stated that the a majority of Housing Advisory Commissioners believe that the AHMF should be at least $28,0000. He also stated that several HAC members believe that the City of Berkeley should increase the minimum amount of affordable housing that developers must provide onsite to 15 percent of units at 50 percent AMI instead of 10 percent.
Speaker 6: Maryanne Sluis stated that the City must examine its density bonus standards in order to keep pace with the demand for affordable housing. She stated that entitled projects that were originally density bonus projects should not be allowed to later take an in-lieu fee instead of meeting density bonus requirements.
Speaker 7: Jude Shelton stated that Berkeley should not allow developers to pay an AHMF and rather require that developers build inclusionary housing. She also stated that building owners should not be allowed to allow their properties to fall into disrepair and later demolish them.
Speaker 8: Kelly Hammergrin stated that she found it difficult to find and track information on the Housing Element public review process, which presented a challenge to commenting within the designated comment period. She stated her support for inclusionary housing in order to maintain diversity and stop displacement.
Speaker 9: Peter Eakland stated that Priority Development Area (PDA) boundaries should be revised to include the MUR and R-2A zoning districts. He also submitted his comments in written form.
Speaker 10: (Name not stated) said that the use of formerly rent-controlled units as short term rentals through AirBnB has created unpredictable and intolerable living conditions, which is a growing problem in Berkeley.
Speaker 11: (Name not stated) shared that as market rate rents have increased, as a landlord, he has been forced to charge more for rent. He also stated that members of the public should not have to pay for hard copies of City documents like the Housing Element.
Speaker 12: Tim Frank stated that the city needs far more housing units than specified by the RHNA allocation in order to fully address the housing shortage and meet social, environmental and regional needs.
Speaker 13: Merrilie Mitchell stated that UC Berkeley dorms should be counted toward Berkeley’s efforts to meet its RHNA allocation. She stated that Berkeley needs more open space, parking, and affordable housing for Berkeley taxpayers.
Speaker 14: Jay Kelekian, executive director of the Berkeley Rent Stabilization Board stated that the Rent Board has provided its input to staff on the Housing Element, which calls for very few changes from the last draft presented to the Commission.
Speaker 15: Charlene Woodcock stated that the university is relying on private developers to house students, and only one or two development companies are buying up the majority of properties in Berkeley. She stated that as a result, the city is changing rapidly and it will be difficult for children of Berkeley’s residents and a diverse population to afford to live in the city.
Speaker 16: (Name not stated) expressed support for the Berkeley Tenant’s Union recommendations to the Commission.

2015-2023 Berkeley Housing Element Appendix D – Community Participation Background
280
3. Distribution Lists
E mailing List: Groups and Organizations*
1 A Better Way, Inc 46 Fred Finch Youth center
2 Adeline Apartments 47 Goldin Design
3 ALA Costa Center 48 Gordon Commercial Real Estate Services
4 Alameda County Homeless Action Center 49 Homeless Action Center
5 Alzheimer's Services of the East Bay 50 Hotel Durant
6 Asians for Job Opportunities in the Bay Area 51 Housing Consortium of the East Bay
7 Bananas Child Care Resource 52 Housing Rights
8 Bay Area Community Resources 53 Inter-City Services
9 Bay Area Hispanic Institute for Advancement 54 Japanese American Services of the East Bay
10 Bay Area Outreach and Recreation Program 55 Lifelong Medical Care
11 Berkeley Albany Licensed Daycare Operators 56 Livable Berkeley
12 Berkeley Albany YMCA 57 Lutheran Church of the Cross
13 Berkeley Chamber of Commerce 58 Miller Star Regalia Legal
14 Berkeley Daily Planet 59 Moe's Books
15 Berkeley Ecumenical Ministries 60 Multi-Cultural Institute
16 Berkeley Food & Housing Project 61 Nai House
17 Berkeley Place 62 New Light Senior Center
18 Berkeley Property Owners Association 63 North Shattuck Association
19 Berkeley Student Cooperative 64 Northern California Land Trust
20 Berkeley Unified School District 65 Options Recovery Services
21 Berkeley Youth Alternatives 66 Pacific Center for Human Growth
22 Bicycle Civil Liberties Union 67 Pacific Gas and Electric Company
23 Bonita House 68 Panoramic Interests
24 Building Opportunities for Self Sufficiency 69 Rasputin
25 CDA Strategies 70 Rebuilding Together
* Individuals are omitted for privacy.

2015-2023 Berkeley Housing Element Appendix D – Community Participation Background
281
26 Center for Accessible Technology 71 Resources for Community Development
27 Center for Education of the Infant Deaf 72 Sick Child Care Program
28 Center for Independent Living 73 SNK Development
29 Coalition for Alternatives In Mental Health 74 Sobriety Through Education and Peer Support
30 Cody's Books 75 Solano Avenue Association
31 Commercial Lessors Inc 76 South Berkeley Community Church
32 De Tienne Associates 77 SRM Associates
33 Diablo Holdings Ltd 78 St. John's Child Care Program
34 DMM and Associates 79 Stiles Hall
35 Dorothy Day House 80 Telegraph Area Association
36 Downtown Berkeley Association 81 Through the Looking Glass
37 East Bay Asian Youth Center 82 Toolworks
38 East Bay Community Law Center 83 United for Health
39 Easy Does It 84 University Press Books
40 Ecology Center 85 Urban Housing Group
41 Eden Council for Hope & Opportunity 86 Wareham Development
42 El Granada Building 87 West Berkeley Artisans and Industrial Companies
43 Elmwood Merchants Association 88 Woman's Employment Resources Corporation
44 Ephesian Children's Center 89 Women's Daytime Drop-In Center
45 Family Violence Law Center

2015-2023 Berkeley Housing Element Appendix D – Community Participation Background
282
4. Letters from the Public
1. January 30, 2014: Letter from Housing Consortium of the East Bay (HCEB)
2. September 17, 2014: Letter from John English
3. September 21, 2014: Letter from John English
4. October 15, 2014: Letter from Peter Eakland
5. November 5, 2015: Letter from Peter Eakland
6. November 6, 2014: Email from Peter Eakland
7. December 3, 2014: Email from Tia Ingram, Berkeley Housing Authority
8. December 3, 2014: Letter from Dorothy Walker
9. February 10, 2015: Letter from Berkeley Tenants’ Union
10. February 10, 2015: Email from John Selawsky
11. February 10, 2015: Email from Jesse Townley
12. February 13, 2015: Email from Leah Hess
13. February 13, 2015: Email from Katherine Harr
14. February 14, 2015: Email from Phoebe Sorgen
15. February 14, 2015: Email from Eleanor Walden
16. February 14, 2015: Email from Peni Hall
17. February 16, 2015: Email from Pei Wu
18. February 16, 2015: Email from Arlene Merryman
19. February 16, 2015: Email from Charlene Woodcock
20. February 17, 2015: Email from William E. Woodcock
21. February 17, 2015: Email from Josh Pfeffer
22. February 17, 2015: Email from Rob Wrenn
23. February 17, 2015: Email from William Bogert
24. February 18, 2015: Email from Judy Ann Alberti
25. February 18, 2015: Email from Donald Goldmacher
26. February 18, 2015: Email from Kate Harrison
27. February 18, 2015: Email from Margot Smith
28. February 18, 2015: Email from Ben Mahrer
29. February 18, 2015: Letter from Peter Eakland
30. February 18, 2015: Document from Charlene Woodcock
31. February 19, 2015: Email from Karen Chapple, Planning Commissioner
32. February 17, 2015: Letter from Paul McDougall, California Department of Housing and
Community Development
1440 BROADWAY SUITE 700 OAKLAND, CA 94612 Telephone (510) 832-1315 Facsimile (510) 832-1743 www.hceb.org
Creating Inclusive Communities
January 30, 2014
MEMORANDUM Re: Housing Element 2015‐2023 Updates, Requirements of SB 812 (Chapter 507; Statutes of 2010) To All Housing Element 2015‐2023 Staff/ Consultants, Council Members, and Commissioners: We are writing in regards to the requirements of the California Senate Bill 812, Chapter 507, Statues of 2010 (SB 812‐Ashburn). Special needs groups spend an exorbitant proportion of their income to find housing and many end up being discriminated due to their circumstances and needs. To address this issue, SB 812 requires that housing elements include an analysis of the disabled with an evaluation of the special housing needs of persons with developmental disabilities. This analysis includes an estimation of the number of people with developmental disabilities in a jurisdiction, an assessment of the housing need and a discussion of potential resources. Attached to this letter are the following documents:
A Memorandum from the State of California Department of Housing and Community Development regarding the requirements of SB 812, dated June 21, 2012.
Housing Need Data For People with Developmental Disabilities 2014‐2023
Letter from Area Board 5 regarding local housing need and methodology
On behalf of the State Council on Developmental Disabilities, Area Board 5, Housing Consortium of the East Bay (HCEB) will be advocating for all jurisdictions in Alameda and Contra Costa Counties to include the requirements of SB 812 in their Housing Element. HCEB creates inclusive communities for individuals with developmental disabilities or other special needs through quality affordable housing in Alameda and Contra Costa Counties. We ask that you please forward this communication to the appropriate staff and your Housing Element consultant. Also, please inform us of your progress in preparing this update, and provide us with working copies of at least the portion that includes the analysis of housing needs for individuals with developmental disabilities. Please include our Deputy Director, [email protected], on all e‐mail and mailing lists as our contact person for your Housing Element update. We thank your jurisdiction for including people with developmental disabilities in your future Housing Element. Please contact us if you have any questions. Sincerely,
Darin Lounds Executive Director

STATE OF CALIFORNIA -BUSINESS, TRANSPORTATION AND HOUSING AGENCY EDMUND G. BROWN JR., Governor
DEPARTMENT OF HOUSING AND COMMUNITY DEVELOPMENT DIVISION OF HOUSING POLICY DEVELOPMENT 1800 Third Street, Suite 430 P. O. Box 952053 Sacramento, CA 94252-2053 (916) 323-3177 FAX (916) 327-2643
MEMORANDUM
DATE: June 21, 2012 TO: Planning Directors Interested Parties
FROM: Glen Campora, Acting Deputy Director Division of Housing Policy Development SUBJECT: Persons with Developmental Disabilities
SB 812 (Ashburn), Chapter 507, Statutes of 2010 Housing elements must include an analysis of the special housing needs of the disabled including persons with developmental disabilities. Special needs groups often spend a disproportionate amount of their income to secure safe and decent housing and are sometimes subject to discrimination based on their specific needs or circumstances. Chapter 507, Statutes of 2010 (SB 812), which took effect January 2011, amended State housing element law to require the analysis of the disabled to include an evaluation of the special housing needs of persons with developmental disabilities. This analysis should include an estimate of the number of persons with developmental disabilities, an assessment of the housing need, and a discussion of potential resources. A "developmental disability" is defined as a disability that originates before an individual becomes 18 years old, continues, or can be expected to continue, indefinitely, and constitutes a substantial disability for that individual. This includes Mental Retardation, Cerebral Palsy, Epilepsy, and Autism. The US Census does not have specific information regarding persons with developmental disabilities. However, each nonprofit regional center contracted with the California Department of Developmental Services (DDS) maintains an accounting of the number of persons served by zip code or city. This information can be used to estimate the number of persons residing in the jurisdiction which have developmental disabilities.
The development of affordable and accessible homes is critical to expand opportunities for persons with developmental disabilities to live in integrated community settings. One of the biggest obstacles to living independently in the community is a lack of financial resources. Income is often limited and affordable housing where people can rent homes, apartments, duplexes, or mobile homes is crucial to the long term stability of a person with developmental disabilities. In addition, access to various types of supported living services is critical for persons with developmental disabilities to live as independently as possible.

California State Department of Housing and Community Development Housing Policy Divison
SB 812, Chapter 507, Statutes of 2010 P a g e | 2
Timing In accordance with Government Code Section 65583(e), any draft housing element submitted to the Department after March 31, 2011 will be required to comply with SB 812. Further Resources Attachment 1 is the amended statutory language, Attachment 2 includes the definition of developmental disabilities, a list of organizational resources, and a bibliography of relevant publications, and Attachment 3 includes a sample analysis and programs. For more information on the Special Housing Needs requirements including sample analyses, see the Department’s Building Blocks’ website at http://www.hcd.ca.gov/hpd/housing_element2/HN_SHN_home.php. A copy of the legislation can be found on the Department’s website at www.hcd.ca.gov. Copies of published bills from the 2010 session can be obtained from the Senate’s website: www.assembly.ca.gov or the Legislative Bill Room at (916) 445-2323. If you have any questions or would like additional information or technical assistance, please contact Melinda Coy, of our staff, at (916) 445-5307.

California State Department of Housing and Community Development Housing Policy Divison
SB 812, Chapter 507, Statutes of 2010 P a g e | 3
ATTACHMENT 1 Changes to State Housing Element Law SB 812 (Chapter 507, Statutes of 2010)

California State Department of Housing and Community Development Housing Policy Divison
SB 812, Chapter 507, Statutes of 2010 P a g e | 4
Changes to State Housing Element Law SB 812 (Chapter 507, Statutes of 2010)
(Excerpts, changes indicated in bold and underlines.)
65583. The housing element shall consist of an identification and analysis of existing and projected housing needs and a statement of goals, policies, quantified objectives, financial resources, and scheduled programs for the preservation, improvement, and development of housing. The housing element shall identify adequate sites for housing, including rental housing, factory-built housing, mobilehomes, and emergency shelters, and shall make adequate provision for the existing and projected needs of all economic segments of the community. The element shall contain all of the following: (a) An assessment of housing needs and an inventory of resources and constraints
relevant to the meeting of these needs. The assessment and inventory shall include all of the following:
(1-6) Omitted – Chapter 507 did not have major changes to these subsections
(7) An analysis of any special housing needs, such as those of the elderly; persons
with disabilities, including a developmental disability, as defined in Section 4512 of the Welfare and Institutions Code; large families; farmworkers; families with female heads of households; and families and persons in need of emergency shelter. The need for emergency shelter shall be assessed based on annual and seasonal need. The need for emergency shelter may be reduced by the number of supportive housing units that are identified in an adopted 10-year plan to end chronic homelessness and that are either vacant or for which funding has been identified to allow construction during the planning period.
(8-9) Omitted – Chapter 507 did not have major changes to this subsection. (b-h) Omitted – Chapter 507 did not have major changes to these subsections

California State Department of Housing and Community Development Housing Policy Divison
SB 812, Chapter 507, Statutes of 2010 P a g e | 5
ATTACHMENT 2 Resources

California State Department of Housing and Community Development Housing Policy Divison
SB 812, Chapter 507, Statutes of 2010 P a g e | 6
Definition of "Developmental Disability" from the Section 4512 of the Welfare and Institutions Code 4512. As used in this division: (a) "Developmental disability" means a disability that originates before an individual attains
age 18 years, continues, or can be expected to continue, indefinitely, and constitutes a substantial disability for that individual. As defined by the Director of Developmental Services, in consultation with the Superintendent of Public Instruction, this term shall include mental retardation, cerebral palsy, epilepsy, and autism. This term shall also include disabling conditions found to be closely related to mental retardation or to require treatment similar to that required for individuals with mental retardation, but shall not include other handicapping conditions that are solely physical in nature.
List of Organizational Resources California Department of Developmental Services DDS is the agency through which the State of California provides services and supports to individuals with developmental disabilities. P. O. Box 944202 Sacramento, CA 94244-2020 (916) 654-1690 http://www.dds.ca.gov/ (Web page includes a list of developmental and regional centers) Community Placement Plan (CPP) funds In collaboration with the regional center, DDS uses CPP funds to develop homes as an alternative for individuals with developmental disabilities to reside in the community instead of institutional settings. http://www.dds.ca.gov/AH/CPP.cfm California Department of Rehabilitation CDR works in partnership with consumers and stakeholders to provide services and advocacy resulting in employment, independent living and equality for individuals with disabilities. P.O. Box 944222 2000 Evergreen Street Sacramento, CA 95815 Phone: (916) 263-8981 (VOICE) (916) 263-7477 (TTY) www.dor.ca.gov (Web page includes list of Independent Living Centers)

California State Department of Housing and Community Development Housing Policy Divison
SB 812, Chapter 507, Statutes of 2010 P a g e | 7
Disability Rights California Disability Rights California provides advocacy help for Californians with disabilities. Ms. Dara Schur 1330 Broadway, Suite 500 Oakland, CA 94612 Phone: (510) 267-1200 http://www.disabilityrightsca.org Mental Health Association in California (MHAC)
Provides advocacy, education, information and other assistance necessary to ensure that all people who require mental health services are able to receive the mental health and other services that they need 1127 11
th Street, Suite 830
Sacramento, CA 95814 Phone: (916) 557-1167 http://www.mhac.org California Mental Health Directors Association (CMHDA) Represents the mental health directors from each of California's counties 2030 ‘J’ Street Sacramento, CA 95814 Phone: (916) 556-3477 http://www.cmhda.org Association of Regional Centers
Represents the autonomous regional centers
915 L Street, Suite 1440 Sacramento, CA 95814 phone: (916) 446-7961 http://www.arcanet.org/
Bibliography of Publications and Reports The following is a bibliography of publications relating to housing for persons with developmental disabilities. California State Council on Developmental Disabilities STATE STRATEGIC PLAN 2011-2016 http://69.93.208.24/documents/DraftSCDDStatePlan2011-2016.pdf California Kern County Regional Center for Developmental Disabilities Hand in Hand Kern Regional Center Online Homepage: http://www.kernrc.org/ Welcome page for Consumers & Families http://www.kernrc.org/#/welcome/4509341943

California State Department of Housing and Community Development Housing Policy Divison
SB 812, Chapter 507, Statutes of 2010 P a g e | 8
California Ventura County, Santa Barbara, and San Luis Obispo Tri-Counties Regional Center (TCRC): Housing Plan TRI-COUNTIES REGIONAL CENTER 5-YEAR HOUSING BUSINESS PLAN (2008) The TCRC Housing Plan is a comprehensive roadmap that focuses on: (1) Supporting people with developmental disabilities in their housing requirements, and (2) Increasing the housing stock of affordable housing units within the jurisdiction. http://www.tri-counties.org/attachments/article/138/TCRC5YrPlan-final1.pdf Adult Residential Care: Regional Centers of California, Residents and Regional Center for the Developmentally Disabled EDUCATION & UNDERSTANDING Online http://www.arf35.com/arf_residents_regional_center.html
WEBSITE DATABASES:
Cornell University, Employment and Disability Institute DISABILITY STATISTICS: ONLINE RESOURCE FOR U.S. DISABILITY STATISTICS (Select a statistic below to access the disability statistics interactive search tool) http://www.ilr.cornell.edu/edi/disabilitystatistics/index.cfm
OTHER STATES REPORTS:
Alaska State Health and Social Services Department 2010 Disability Policy Seminar – Fact Sheet HOUSING FOR PEOPLE WITH DISABILITIES: THE CRISIS & THE OPPORTUNITY http://www.hss.state.ak.us/gcdse/committees/legislative/pdf/2010_factsheet_housing.pdf Maryland State Department of Housing and Community Development CONSOLIDATED PLAN 2010-2015: Persons with Special Needs http://www.mdhousing.org/Website/About/PublicInfo/Publications/Documents/2010-2015specialneeds2.pdf Oregon State Department of Human Services, Seniors and People with Disabilities Division. Oregon Administrative Rules: Chapter 411, Division 315 DEVELOPMENTAL DISABILITIES HOUSING TRUST ACCOUNT http://www.dhs.state.or.us/policy/spd/rules/411_315.pdf Washington State Dept. of Social and Health Services, Aging & Disabilities Services Admin Strategic Plan for Housing Needs Assessment & Trust Fund Utilization for People with Developmental Disabilities STRATEGIC ELEMENTS FOR FISCAL YEAR 2010-2011 (Economic Considerations, p.6) http://www.dshs.wa.gov/pdf/adsa/ddd/2010-11%20Housing%20Strategic%20Plan.pdf
LIBRARY REPORTS:
Judge David L. Bazelon Center for Mental Health Law WHAT “FAIR HOUSING” MEANS FOR PEOPLE WITH DISABILITIES (Revised edition 2011) http://www.bazelon.org/News-publications/Publications/List/1/CategoryID/17/Level/a/ProductID/19.aspx?SortField=ProductNumber%2cProductNumber Call #: H58 4 W53 2011

California State Department of Housing and Community Development Housing Policy Divison
SB 812, Chapter 507, Statutes of 2010 P a g e | 9
Souza, Maria Teresa WORST CASE HOUSING NEEDS OF PEOPLE WITH DISABILITIES (2011) U.S. Dept. of Housing and Urban Development (HUD) Available for viewing full text via the World Wide Web: http://www.huduser.org/Publications/pdf/WorstCaseDisabilities03_2011.pdf Call #: L74 4 R46d 2011
Turner, Margery A., [et al.] DISCRIMINATION AGAINST PERSONS WITH DISABILITIES (2005) Prepared for: Office of Policy Development and Research, U.S. Department of Housing and Urban Development Available for viewing full text via the World Wide Web: http://www.huduser.org/Publications/pdf/DDS_Barriers.pdf Call #: H58 2 D57 2005 California. Senate Select Committee on Developmental Disabilities & Mental Health IMPROVING THE QUALITY OF COMMUNITY-BASED SERVICES AND SUPPORTS IN CALIFORNIA FOR PERSONS WITH DEVELOPMENTAL DISABILITIES (1998) Collins, Peggy, Editor Call #: H59 1 I47 1998
FEDERAL DOCUMENTS:
United States House of Representatives; Report 111-678 (H.R. 476) VETERANS, WOMEN, FAMILIES WITH CHILDREN, AND PERSONS WITH DISABILITIES HOUSING FAIRNESS ACT OF 2010 http://democrats.financialservices.house.gov/FinancialSvcsDemMedia/file/house%20reports/111-678.pdf United States, 111th Congress, 2
nd Session – Senate (S. 1481)
FRANK MELVILLE SUPPORTIVE HOUSING INVESTMENT ACT OF 2010 (The law makes improvements to the Section 811 program and promotes integrated housing opportunities for people with disabilities) http://www.gpo.gov/fdsys/pkg/BILLS-111s1481enr/pdf/BILLS-111s1481enr.pdf

California State Department of Housing and Community Development Housing Policy Divison
SB 812, Chapter 507, Statutes of 2010 P a g e | 10
ATTACHMENT 3 Sample Analysis
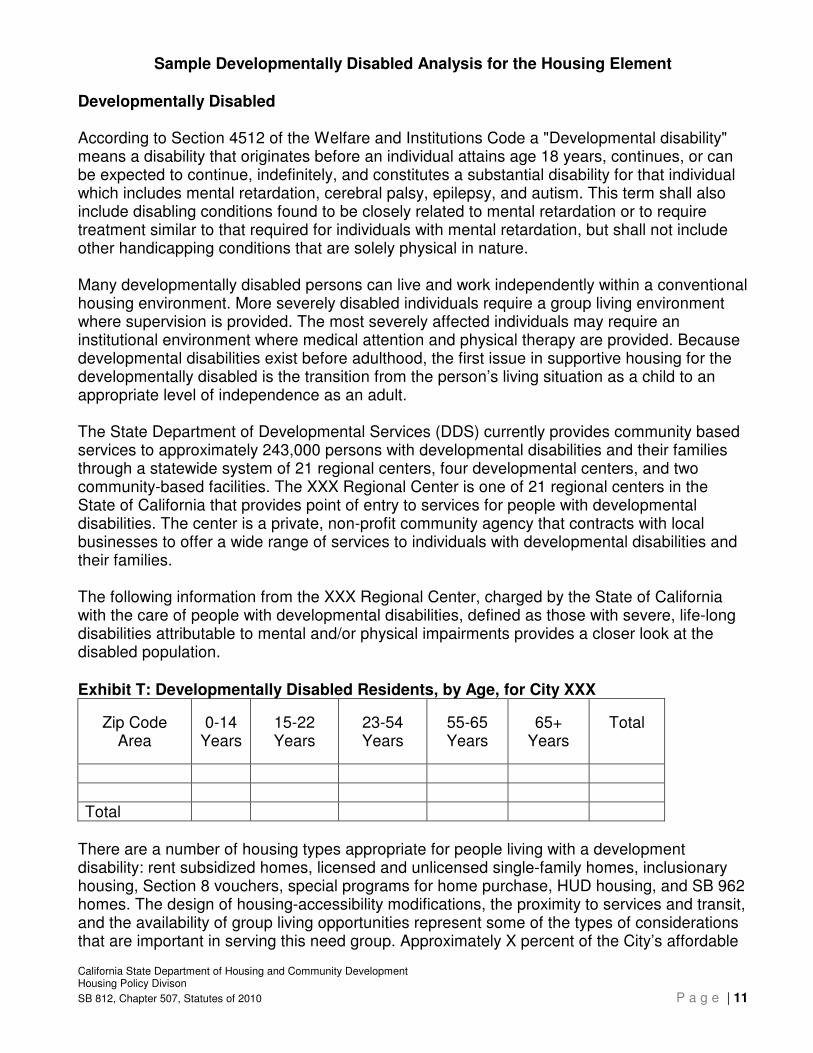
California State Department of Housing and Community Development Housing Policy Divison
SB 812, Chapter 507, Statutes of 2010 P a g e | 11
Sample Developmentally Disabled Analysis for the Housing Element Developmentally Disabled According to Section 4512 of the Welfare and Institutions Code a "Developmental disability" means a disability that originates before an individual attains age 18 years, continues, or can be expected to continue, indefinitely, and constitutes a substantial disability for that individual which includes mental retardation, cerebral palsy, epilepsy, and autism. This term shall also include disabling conditions found to be closely related to mental retardation or to require treatment similar to that required for individuals with mental retardation, but shall not include other handicapping conditions that are solely physical in nature. Many developmentally disabled persons can live and work independently within a conventional housing environment. More severely disabled individuals require a group living environment where supervision is provided. The most severely affected individuals may require an institutional environment where medical attention and physical therapy are provided. Because developmental disabilities exist before adulthood, the first issue in supportive housing for the developmentally disabled is the transition from the person’s living situation as a child to an appropriate level of independence as an adult. The State Department of Developmental Services (DDS) currently provides community based services to approximately 243,000 persons with developmental disabilities and their families through a statewide system of 21 regional centers, four developmental centers, and two community-based facilities. The XXX Regional Center is one of 21 regional centers in the State of California that provides point of entry to services for people with developmental disabilities. The center is a private, non-profit community agency that contracts with local businesses to offer a wide range of services to individuals with developmental disabilities and their families. The following information from the XXX Regional Center, charged by the State of California with the care of people with developmental disabilities, defined as those with severe, life-long disabilities attributable to mental and/or physical impairments provides a closer look at the disabled population. Exhibit T: Developmentally Disabled Residents, by Age, for City XXX
Zip Code Area
0-14 Years
15-22 Years
23-54 Years
55-65 Years
65+ Years
Total
Total
There are a number of housing types appropriate for people living with a development disability: rent subsidized homes, licensed and unlicensed single-family homes, inclusionary housing, Section 8 vouchers, special programs for home purchase, HUD housing, and SB 962 homes. The design of housing-accessibility modifications, the proximity to services and transit, and the availability of group living opportunities represent some of the types of considerations that are important in serving this need group. Approximately X percent of the City’s affordable

California State Department of Housing and Community Development Housing Policy Divison
SB 812, Chapter 507, Statutes of 2010 P a g e | 12
housing units and X percent of the County’s public housing units are reserved for seniors and disabled persons. Incorporating ‘barrier-free’ design in all, new multifamily housing (as required by California and Federal Fair Housing laws) is especially important to provide the widest range of choices for disabled residents. Special consideration should also be given to the affordability of housing, as people with disabilities may be living on a fixed income. In order to assist in the housing needs for persons with Developmental Disabilities, the City will implement programs to coordinate housing activities and outreach with the Regional Center and , encourage housing providers to designate a portion of new affordable housing developments for persons with disabilities, especially persons with developmental disabilities, and pursue funding sources designated for persons with special needs and disabilities. _________________________________________________________________________ Sample Programs:
Program Sample 1: Work with the XXX regional center to implement an outreach program that
informs families within the City on housing and services available for persons with developmental
disabilities. The program could include the development of an informational brochure, including
information on services on the City’s website, and providing housing-related training for
individuals/families through workshops.
Responsibility: Community Development Department
Timing: Development of Outreach Program by June, 2014
Program Sample 2: Develop a program to provide rental assistance to fill the gap between income
levels and the cost of housing for persons with Developmental Disabilities. The program will
include the following steps:
Step One: Work with the regional center to identify the housing needs of the clients and assist in
identifying available housing that meets those criteria.
Step Two: Identify the gaps that limit access to housing for persons with developmental
disabilities (i.e. financial, accessibility).
Step Three: Develop Guidelines and market program
Responsibility: Community Development Department
Timing: Begin Program Development January, 2013.
Objective: Assist 10 persons with developmental disabilities.
Program Sample 3: Explore models to encourage the creation of housing for persons with
developmental disabilities and implement a program by 2015. Such models could include
assisting in housing development through the use of set-asides, scattered site acquisition, new
construction, and pooled trusts; providing housing services that educate, advocate, inform, and
assist people to locate and maintain housing; and models to assist in the maintenance and repair
of housing for persons with developmental disabilities. The City shall also seek State and Federal monies for direct support of housing construction and rehabilitation specifically targeted for housing for persons with disabilities.
Responsibility: Community Development Department

HOUSING NEED (INDEPENDENT LIVING) FOR PEOPLE WITH DEVELOPMENTAL DISABILITIES 2014-2022
0-14 15-22 23-54 55-65 65- Total RoundedAlameda 260 168 302 36 10 776 775 266Albany 64 32 44 2 4 146 150 49Berkeley 180 134 288 48 38 688 700 232Dublin 188 128 174 28 2 520 525 179Emeryville 14 16 48 14 2 94 100 32Fremont 860 460 880 200 118 2518 2525 827Hayward 708 438 1178 342 198 2864 2850 933Livermore 364 172 316 26 10 888 900 296Newark 160 78 152 20 12 422 425 140Oakland 1402 868 1988 260 94 4612 4600 1564Piedmont 24 26 8 0 0 58 50 22Pleasanton 328 162 178 20 12 700 700 233San Leandro 424 268 576 124 28 1420 1425 478Union City 302 184 576 104 34 1200 1200 402
Sub-Total 5278 3134 6708 1224 562 16906 16925 5653
Ashland 0 0 0 0 0 0 0Castro Valley 204 174 174 0 14 566 550 202Cherryland 0 0 0 0 0 0 0 0Sunol 0 0 0 0 0 0 0 0
Sub-Total 204 174 174 0 14 566 550 202
Total, County 5482 3308 6882 1224 576 17472 17475 5854
0-14 15-22 23-54 55-65 65- Total RoundedAntioch 480 474 762 68 54 1838 1825 652
Age
ALAMEDA COUNTYAge
Est. # of Housing Units Needed By
2022
CONTRA COSTA COUNTY
Est. # of Housing Units Needed by
2022
Estimated total number of individuals with developmental disabilities, including RCEB consumers and those unaffiliated with RCEB
Estimated total number of individuals with developmental disabilities, including RCEB consumers and those unaffiliated with RCEB
Brentwood 276 154 212 18 8 668 650 226Clayton 16 26 30 4 0 76 75 29Danville 134 80 104 12 6 336 350 114Concord 470 286 810 154 66 1786 1800 596El Cerrito 52 24 70 2 2 150 150 50Hercules 104 62 126 14 4 310 300 105Knightsen 4 2 2 0 0 8 10 3Lafayette 98 52 88 24 10 272 275 89Martinez 122 82 172 30 6 412 400 140Moraga 26 34 32 4 0 96 100 36Oakley 174 198 276 24 8 680 675 247Orinda 42 30 24 0 0 96 100 34Pinole 50 68 110 6 6 240 250 88
Pittsburg 336 170 426 32 22 986 1000 331Pleasant Hill 84 68 142 38 6 338 350 115Richmond 392 272 500 76 18 1258 1250 432San Pablo 166 108 252 42 22 590 600 199
San Ramon 352 170 128 6 16 672 675 223Walnut Creek 166 92 294 58 16 626 625 208
Total, County 3544 2452 4560 612 270 11438 11460 3915
Total 9026 5760 11442 1836 846 28910 28935 9769
Brianne
Rectangle

Protecting and advocating for the rights of persons with developmental disabilities in Alameda, Contra Costa, Marin, San Francisco and San Mateo counties
1515 Clay St. Suite 300S, Oakland, CA 94612 areabd5@ concentric.net ph 510-286-0439; fax 510-286-4397 www.areabd5.org
THE HOUSING NEEDS OF PEOPLE LIVING WITH A DEVELOPMENTAL DISABILITY
BACKGROUND
DEFINITION: A Developmental Disability is defined by the State of California as a lifelong disability caused by a mental and/or physical impairment manifested prior to the age of 18 and are expected to be lifelong. The conditions included under this definition include:
Mental Retardation, Epilepsy Autism, and/or Cerebral Palsy, and “Other Conditions needing services similar to a person with mental retardation.”
The term is used most commonly to describe substantial limitations in three or more of these major life areas: self-care; expressive or receptive language; learning; mobility; capacity for independent living; economic self-sufficiency; and self-direction.
Many individuals with developmental disabilities are independent and can live in their own apartments or homes with very little support. Other individuals will have more severe disabilities, and may require 24-hour care and assistance in residences that are modified specifically to accommodate their individual needs. For many years people with developmental disabilities were kept in institutions away from the community. We have learned that they can be full participants in their community if given the opportunity. The bottom line is that people with developmental disabilities are finding it increasingly difficult to find affordable, accessible, and appropriate housing that is inclusive in the local community. Note: “Aggregating” people with developmental disabilities into an overall “Special Needs” demographic category with mentally ill or mobility-impaired individuals is inaccurate and misrepresents the unique needs of this population. CURRENT SITUATION:
The State of California has assumed responsibilities for the care of people with developmental disabilities who qualify under the above definition. This duty is implemented through services provided and/or paid for by a local Regional Center, through local approved vendors of services.
Brianne
Text Box
2008-2014 HE Update, the 2015-2023 HE Letter will be available by 2/1/2014.

In the past, many people with developmental disabilities were institutionalized in large
hospital-like settings, often for life. Current practice, as articulated by the Lanterman Act and the Olmstead Decision, now calls
for the” maximum possible integration into the general community.” This is realized through the creation of housing, with affordable rents and appropriate supportive services, dedicated to the long-term needs and empowerment of this population.
7 out of 10 people with developmental disabilities are unable to earn substantial gainful income and must rely on Supplemental Security Income (SSI) to support themselves. The SSI monthly payment is under $ 900, and is simply not enough to cover all of life’s expenses such as rent, food, transportation, and clothing.
HUD defines affordable housing to be a rent level that costs no more than 30% of a person’s monthly income. 30% of a $900/month income would equate to a rent of $270/month. Rents so low are virtually impossible to find without rent subsidies and vouchers, and certainly not without aid from local governments.
Lanterman Developmental Disabilities Act – Sections 4400-4906, California Welfare and Institutions Code –“.…making available….patterns and conditions of everyday life which are as close as possible to the norms and patterns of the mainstream of society”. Olmstead v. L.C. and E.W., United States Supreme Court, 1999 – “Integration Mandate” – “States are required to place persons with mental disabilities in community settings rather than institutions …..when determined to be appropriate.”
NATIONAL OVERVIEW In a message from Commissioner Patricia A. Morrissey, Commissioner of the U.S. Administration on Developmental Disabilities (ADD), she states, “There are approximately 4.5 million individuals with developmental disabilities in the United States.” Developmental disabilities, according to the federal definition, are severe, life-long disabilities attributable to mental and/or physical impairments, manifested before age 22. Developmental disabilities result in substantial limitations in three or more areas of major life activities, including: self care, receptive and expressive language; learning; mobility; self-direction; independent living; and economic self-sufficiency. Based on the ADD estimate of the prevalence of developmental disabilities nationwide (.015 of the total population), and using U.S. Census estimates of the current population of California, there are approximately 450,000 Californians with developmental disabilities, fewer than half of whom meet the narrower state definition for regional center eligibility. Using this method, these are the numbers of individuals with developmental disabilities within the five central Bay Area Counties: Alameda 21,963 Contra Costa 15,295 Marin 3,721 San Francisco 11,472 San Mateo 10,605 TOTAL 63,056 Commissioner Morrissey goes on to say, “The American dream belongs to everyone.” This belief provides a foundation for the work that the Administration on Developmental Disabilities (ADD) and the State Councils on Developmental Disabilities (SCDD) do on behalf of individuals with

developmental disabilities and their families. The ADD carries out its mandate through the direction given to us in the Developmental Disabilities Assistance and Bill of Rights Act of 2000 (P.L. 106-402). The law states: “The purpose of this title is to assure that individuals with developmental disabilities and their families participate in the design of and have access to needed community services, individualized supports, and other forms of assistance that promote self-determination, independence, productivity, and integration and inclusion in all facets of community life, through culturally competent programs authorized under this title.” One of the largest barriers to community integration for people with developmental disabilities, many of whom live on extremely low fixed income, is the lack of safe, affordable, accessible, and decent housing. On February 1, 2001, the New Freedom Initiative was announced. This initiative is aimed at eliminating barriers that restrict Americans with disabilities seeking to participate in their communities through its four key components: 1. Increasing access to assistive and universally designed technologies; 2. Expanding educational opportunities for Americans with disabilities; 3. Integrating Americans with disabilities into the workforce; and 4. Promoting full access to community life. With the signing of Executive Order 13217, on June 18, 2001, there was a mandate for implementation of the U.S. Supreme Court Olmstead Decision in a manner that respects the proper roles of the Federal government and States. The Olmstead Decision affirmed that unnecessary institutional placement for people with disabilities is a form of discrimination. The Executive Order articulated goals to address barriers to full integration, in order to:
a) Integrate Americans with disabilities into the workforce; b) Promote a comprehensive array of community-based services and supports; c) Promote safe, decent housing and homeownership; d) Promote integration into and sustained participation in the workforce; e) Increase access to assistive and universally designed technology; f) Expand transportation options; and g) Promote full access to community life.
PROJECTED HOUSING NEEDS OF
DEVELOPMENTALLY DISABLED POPULATIONS (see attached spreadsheet)
The attached spreadsheet lists only those developmentally disabled individuals who are formally registered as consumers of the Regional Center of the East Bay (RCEB), and are tabulated by zip codes. RCEB is the Regional Center for Alameda and Contra Costa Counties. Developmental Disabilities Area Board 5 is the Bay Area Office of the State Council on Developmental Disabilities with specified oversight responsibilities in reviewing the needs of those with developmental disabilities.

Demographic Trends – see “FACT BOOK”, Tenth Edition – Department of Developmental Services, April 2008
In the period 1996-2006, the developmentally disabled consumer population registered for services at the State Regional Centers increased 60.5%, while the general population in California rose by 18.3%.
Consumers are systematically being outplaced from developmental centers – Under the Lanterman Act and Court Decisions (Olmstead), large institutional settings are being closed or downsized.
Consumers move to a higher level of community integration. Social workers collaborate with clients on devising more independent living strategies.
Consumers reaching adulthood (18-25) seek integrated living in the community. Consumers who are middle aged or elderly are also seeking more integrated, independent
lifestyles as their caregivers retire or are unable to continue to support them in more traditional settings.
Increased need for entire low-to-moderate income family to obtain affordable housing to assist in caring for a disabled family member
Increases in Autism – Practitioners have documented a 460 % increase in diagnosed autism in children since 1994. (DDS Fact Book)
Real Estate and financial factors -- Heightened impediments in acquiring affordable housing and operating group homes
RCEB/ Area Board 5 METHODOLOGY Our methodology seeks to provide each jurisdiction with an estimate of the quantity of housing units which will be required to provide adequate housing to their developmentally disabled population in the 2009-2014 Housing Element cycle. This estimate is based on demographic data, as well as the professional experience and opinions of family members, social workers, service provider agencies, and senior staff at the Golden Gate Regional Center, Regional Center of the East Bay, and Area Board 5. Back-up data is provided by the Department of Developmental Services, State of California. The attached spreadsheet demonstrates the number of developmentally disabled residents by zip code, broken out by age group. We will assign a simple percentage to each component in this list, representing a “Need Factor”, which takes into account consumer wishes, level of ability and self-sufficiency, support services, and financial ability. We have estimated that for every one consumer affiliated with the regional center, there is one person that is not. AGES 0-14 / We shall assign a need factor of 25% for this cohort. Many children in this age group will
remain living at home or, to a lesser extent, in an institutional setting. However, low-income consumer families need affordable housing to maintain and stabilize their entire household. (Planners should note the large number of future community-based housing consumers entering adulthood in the next decade.)
15-22/ Approximately 50% of this category shall seek housing within the community within the
2009-2014 time period 23-54/ Approximately 35% of this category shall seek housing within 2009-2014 55-65/ Approximately 25% of this category shall seek independent housing 2009-2014

65+ / Approximately 20% of this age group shall seek placement into the community Multiplying each category count by the applicable Need Factor percentage shall produce the Estimate of Housing Need. Also, where possible, special circumstances will be reviewed in order to modify this number (like imminent closure of a regional institutional facility).
MULTIPLE DISABILITIES Mental Illness: Upon consultation with caseworkers and senior staff, we provide a conservative estimate of 10% as the portion of people with a developmental disability who are also living with a mental disability. Mobility Impairment: Staff and service providers report that approximately 10 % of all people with a developmental disability also have a physical disability; their mobility impairment will call for housing that is ADA accessible, or certainly readily adaptable to their needs. Visual/Hearing Impairment: It is estimated from prior experience that 2-3% of the developmentally disabled population are living with a visual and/or hearing impairment, and require reasonable accommodation to their disability. Medically Fragile: 2 % of the developmentally disabled population require 24/7 medical care, in housing specifically rehabilitated or constructed to include features like those in hospital settings, with space for care-givers and specialized equipment.
TYPES OF HOUSING OPPORTUNITIES APPROPRIATE FOR PEOPLE LIVING WITH A DEVELOPMENTAL DISABILITY
Rent-subsidized affordable housing, with services, accessible, close to transit and
community Licensed and unlicensed Single Family homes, modified, of 3-4 bedrooms Inclusionary within larger housing developments serving the general population SECTION 8 Apartment/ Housing Choice Voucher Home purchase through special programs (first time home buyers, Fannie Mae) HUD Section 811/ MHP-SHP developments for disabled populations Housing specially modified for the Medically Fragile (SB 962 Homes)
Area Board 5 – office of the State Council on Developmental Disabilities wishes to act as a resource on the housing needs of our consumer population, and is available to all jurisdictions to educate planners and community members as to this topic. Sincerely,
___________________________________________ Rocio de Mateo Smith Executive Director, Area Board 5
- Prepared by Barry Benda, Chief, Community Services, Golden Gate Regional Center Denis Craig, Community Program Specialist, Developmental Disabilities Area Board 5 David Brigode, Senior Project Manager, West Bay Housing Corporation Darin Lounds, Executive Director, Housing Consortium of the East Bay (HCEB), Brianne Steinhauser (HCEB)

1
Mendez, Leslie
From: [email protected]: Wednesday, September 17, 2014 12:54 AMTo: Amoroso, AlexanderCc: Mendez, LeslieSubject: Housing Element Review
September 17, 2014
Planning Commission
Attn.: Planning Commission Secretary Land Use Planning Division
2120 Milvia Street Berkeley, CA 94704
Re: HOUSING ELEMENT REVIEW
Dear Commissioners:
This is to provide various comments of my own (as an individual citizen) on your September 17
agenda packet's materials about the Housing Element review. I hope these remarks will be useful.
GENERAL COMMENTS
Although the staff report's page 3 mentions an "RHNA 2014-2022," its page
4 speaks of an "eight-year RHNA cycle of January 1, 2014-December 31, 2021." Which version is correct? Although footnote 1 on the staff report's page 4 mentions a "planning period from January 31, 2015 to January 31, 2023," Attachment 1's page 1 speaks of an "RHNA planning
period (since January 1, 2014" and Attachment 1's page 5 mentions "the Housing Element's planning period of 2014 to 2022." Another sentence of that page even says, "the Housing
Element's planning period of 2015 to 2020." Again, which version is right? And in general if there's a conceptual difference between the "RHNA" period and the "planning" period, this
should be clarified.
The staff report's page 3 refers to "[t]he recession of 2007-2009," but I believe the Great Recession's duration was quite different.
The staff report's page 4 speaks of Use Permit applications currently under review for high-density mixed-use projects that represent another
"590 dwelling units." I suspect this figure either is already outdated or soon will be. It should be carefully checked during finalization of this Housing Element update.
COMMENTS REGARDING THE DOWNTOWN PLAN AREA
In comparing figures on the Downtown plan area's total housing capacity, I've found a very
big discrepancy. The staff report's Table 3, Attachment 1's Table 3-3, and Attachment 2's Table A-1 each show the Downtown plan area's relevant total housing capacity as just 860 units. But Attachment 2's detailed Table A-2 actually shows pertinent capacity as totaling
2,007 units. And if the latter total is indeed correct, various of the Housing Element review documents' other figures or statements will or may need revising.

2
Table A-2 and Map A-2 show deletion of sites 27 (1931 Addison), 28 (1933 Addison), and 29
(1974 University Avenue). But why? Use Permits were approved very recently for a big project on site 29 and fairly recently for a large development spanning sites 27 and 28, though I
don't know whether building permits for these projects' construction have yet been issued. In any case I question the deleting of these three sites.
On the other hand, I question counting site 48 (2121 Allston) as a development opportunity
site. The building is at least arguably a historic resource, it's presently occupied by the acclaimed Judah L. Magnes Museum, and the site seems quite unlikely to be redeveloped during
the planning period. Site 62 (2023 Channing) probably also should be deleted. Though Table A-2's "Existing Use"
column says "Residential Structure (Unused)," that description seems to be quite obsolete. The sizable house there appears to have been fixed up and reoccupied.
Incidentally, site 62 is in the R-3 District rather than C-DMU. So especially if this site
continues to be listed as a development opportunity site--but even if it isn't so listed--"C-DMU" should be deleted from Table A-2's title. The Downtown Area Plan extends considerably
beyond the C-DMU zone.
Site 26 (1915 Addison) shouldn't be treated as a development opportunity site. In 2012 the LPC designated this property's historic John Boyd House as a Structure of Merit.
Counting site 36 (2109 MLK) as a development opportunity site is very questionable. Here the former PG&E building has been remodeled and is now used as a YMCA teen center. This site's
redevelopment within the Housing Element's planning period is quite unlikely.
COMMENTS REGARDING THE SOUTHSIDE PLAN AREA
Site 21 (2398 Bancroft) should no longer be shown as a development opportunity site. Within the last few years, four-story Wesley House has been built there.
Site 2 (2503 Haste) shouldn't be deleted. This is the long-vacant plot (where the Berkeley Inn once stood) at the northeast corner of Telegraph and Haste. Although a Use Permit
application for development there has been filed, it's still (slowly) undergoing review.
Though Table A-4's specific rows for sites 2 (2503 Haste) and 5 (2539 Telegraph) show their being deleted, neither of those deletions is reflected in the same
table's own "Total Units" cell.
Should an opportunity site be listed at the northeast corner of Fulton and Dwight? I believe that fairly recently a Use Permit was approved for a large housing development on that lot,
though I don't know whether or not building permits for it have yet been issued. Should an opportunity site be listed at the southeast corner of Fulton and Durant? This
strategically located parcel now has just a gas station and convenience store.
Attachment 1's page 5 claims that the City adopted the Southside Plan in "September 2012," but I believe that date is wrong. In the same paragraph, the apparent claim that "2020" will
be "the termination of the SSP [Southside Plan] planning period" is either very confusing or quite wrong.
COMMENTS REGARDING COMMERCIAL CORRIDORS
Although Attachment 1's page 6 implies that this category includes the "C-T" District, that's quite untrue. The entire C-T zone is instead located within the Southside plan area.
3
On Attachment 2's page 16, the statement that "[e]ach corridor is served by at least three AC
Transit lines" could be read as including even the so-called corridors (a) along Hopkins near Sacramento Street and (b) at and near the Claremont/Ashby intersection. This should be
checked, because at least one of those areas seems to be served by just two bus lines.
In that same paragraph, "Adeline Avenue" should instead be "Adeline Street."
Looking now at Attachment 2's Map A-1, the so-called "commercial corridor" along Hopkins is inappropriately shown as extending much farther than does the commercial
zone itself there. Looking at this map also makes me wonder why no analysis has been done of the much lengthier corridor of actual commercial zoning along the southern part of Sacramento Street.
Attachment 2 lacks any detailed maps showing the location of Table A-7's sites 66 and 67 (on
Ashby at or near Claremont) and sites 68 and 69 (on Hopkins).
There's a serious discrepancy between Map A-9 and Table A-7. The map identifies sites 70 (2600 Shattuck), 71 (2598 Shattuck), 72 (apparently also 2598 Shattuck), and 73 (2037
Parker). But Table A-7 doesn't include any of them (and I presume that relevant tables elsewhere don't reflect them either). All four sites probably are involved in what's called
the "Parker Place" development, the current status of which should be checked during this Housing Element update.
The update should also include checking the status of other development proposals--such as the one at 1812 University Avenue, which neither Map
A-9 nor Table A-7 shows.
COMMENTS REGARDING RESIDENTIAL AREAS
There's notable inconsistency about capacity within residential areas. The staff report's Table 3, Attachment 1's Table 3-3, and Attachment 2's Table
A-1 each show a total of 237 units. But according to Attachment 2's Table A-ll, total capacity instead is 316.
Sincerely,
John S. English 2500 Hillegass Avenue, Apt. 3
Berkeley, CA 94704-2937

4

5

1
Mendez, Leslie
From: [email protected]: Sunday, September 21, 2014 2:22 AMTo: Amoroso, AlexanderCc: Mendez, LeslieSubject: Another comment for Housing Element review
Alex,
I've just now noticed a problem with what draft Chapter 3 and its appendix call site 35, at
"2138 University Avenue." The building there (the Ernest Alvah Heron Building) is a designated Landmark. Although the City website's list of designated Landmarks happens to say
that the Heron Building is at "2136," it's at the very same location as the site 35 shown by the draft appendix's Map A-2. So the site shouldn't be treated as a development opportunity
site.
John

October 15, 2014
To: Berkeley Planning Commission
From: Peter Eakland, Transportation Consultant for Peerless R&D Community
Subject: Comments on Chapters 1 and2 and Appendix A of Draft Housing Element Update
This memo contains comments that for the most part we have already been made in written or verbal
comments related to documents related to land use policies in West Berkeley, including the most
recent Housing Element. We are disappointed that the comments have not been addressed. If not
addressed, the document for the next eight years will clearly remain inconsistent with the West
Berkeley Plan and both State and Regional policies for Sustainable Communities Strategies.
1. In June, 2007, as part of a proposal for State bond affordable housing funds, the Berkeley City
Council designated Project Development Areas, as shown in Figure 1, that remain to this day. The
Planning Director at that time admitted that the staff recommendations were not based on any
analysis or outreach to the general public or stakeholders, and there was no public hearing. The
designations have never been mentioned in any City planning document, including the Climate
Action Plan adopted one year later. Nevertheless, they form the framework of the City's Sustainable
Communities Strategy in Plan Bay Area and are strongly reflected in the most recent and proposed
update to the Housing Element. Outside of Downtown, the City for planning purposes has assumed
that virtually all new housing will be located on narrow major arterial corridors . Residential units on
major arterials outside of Downtown and Southside represent 41% of all opportunity sites in the
inventory and 91% of all sites outside of Downtown and Southside.
2. Without any changes, the Housing Element will continue to ignore the adopted West Berkeley
Plan that is a part of the City's General Plan for another eight years. That document in several places
emphasizes the strong role that the mixed-use residential land use category is intended to play in
meeting West Berkeley's share of city-wide residential growth. Here is one example: ""Create a
Mixed Residential district as a special mixed use district which will recognize and support the
continued evolution of a unique mix of residential, light industrial, and arts and crafts uses, with a
particular effort to strengthen residential concentrations existing there". Without justification, MU-
R is the only zoning category in the City allowing residential units by right that was not included in
the inventory of opportunity sites. This category not only allows residential units but multi-family
projects with a density of up to 35 units/acre.
3. Policy H-12, Transit-Oriented New Construction, is different from the General Plan Policy for
Transit Oriented Development and equally important differs from State and Regional policies and
guidelines and the consensus of the land use planning profession. One perhaps can argue that a
broad interpretation of this policy is consistent with these sources, but the City has chosen a very
narrow interpretation that clearly is in opposition to them.
4. Is the emphasis on residential growth being located on major arterials with high frequency transit
service justified? Certainly not. It does not reflect reality or statements by MTC economic

consultants. Over the past five years, there have been no new applications for residential units on
any commercial sites on arterials outside of Downtown and Southside areas. This fact is not
surprising. The most striking example is San Pablo Avenue, where 1,047 estimated units on 32
opportunity sites are included in the inventory for which only 85 units, or 8%, represent the three
vacant parcels and two parking lots. An MTC report in 2013 concluded for this arterial "While the
market for housing exists and infrastructure deficiencies are manageable, the chief constraints are
the small and shallow parcels with diverse ownership, which challenge the ability to construct larger
and efficient housing developments." Additionally, with 25,000 daily vehicles it is the most
congested arterial in the City and is unsuitable for bicycle traffic and presents considerable walking
safety issues. The medians and left-turn prohibitions would create a major increase in U-turns at
major intersections that would further increase congestion. It is unrealistic to assume that all or even
a major percentage of the opportunity sites will be developed by 2040.
5. Plan Bay Area contains residential targets for 2040 that were developed with input from the City.
The problem is that these targets and the proposed update to the Housing Element are irreconcilable,
as shown in Figure 2. The targets for the commercial corridor PDAs are relatively consistent with
the current opportunity sites. The problem is that the 2040 target can only be met with major
increases in growth in Downtown and in non-PDA areas. The Downtown target is almost 1,000 units
above the estimate in the Downtown Area Plan of 3,333. For the non-PDA area, it appears eight
years will be lost in the need for the City to identify more opportunity sites in non-PDA areas,
especially in zoning categories that allow for multi-family projects, including MU-R, R-2A, and R-3.
The non-PDA area will have to absorb even more of the housing burden if the targets for commercial
arterials are not met, which is likely.
6. The Housing Element is only a planning document. Do its shortcomings have any practical effect
on housing development?. Yes. Within the next seven years, there will be considerable State
funding made available to support housing in the context of regional Sustainable Communities
Strategies. With its current PDA designations and its inventory of opportunity sites, Berkeley will
not have the necessary planning in place to successfully compete for funding outside of Downtown.
Even now, 70% of Plan Bay Area capital grants must be spent within PDAs.
7. Where is housing actually being developed? In West Berkeley, within 1/4-mile of University
Avenue and between Sixth and Second streets, recent projects either completed, under construction,
or under review by the City include 733 units. Of the five projects, three have never been listed as
opportunity sites, although they represent 508 units and the City certainly is aware of them. It is
reasonable to assume that this area is perceived by developers and residents as preferable to sites on
San Pablo Avenue. The Housing Element clearly does not reflect reality.
8. State guidelines for the Housing Element require only that the inventory of opportunity sites is
adequate to meet RHN A figures for the planning period. No requirement exists that a given number
of residential units actually be developed. What this means is that the large number of opportunity
sites on major commercial corridors likely will remain largely undeveloped, which will allow them to
be carried forward from one planning period to the next without the City updating its inventory.
Based on Appendix A in the draft update, the inventory in the 2007-2014 Housing Element

accounted for only 158 units, or 9%, of the 1,678 remaining units that remained for the 2009-2014
planning period. Along the way, the City will have created second class neighborhoods that are
unable to compete for needed infrastructure and affordable housing. The City will end up with
approved Housing Elements but ultimately fall short of meeting its Plan Bay Area targets for
residential development in both PDA and non-PDA categories. Of course, housing will continue to
be developed on sites not in the inventory, but this fact will occur in spite of City's land use planning
and not because of it.
10. Although not required by State guidelines, the Housing Element needs to include a discussion of
the extent to which the City met its RHNA requirements for housing growth during the 2007-2014
planning period. Separate data should be provided for entitlements, building permits, and occupancy
permits. Such data ultimately will be required by the County and ABAG so that they can monitor
progress toward 2040 housing targets in Plan Bay Area.
9. The staff effort required to address the Housing Element's deficiencies does not require a lot of
field work. What it does require is for Planning staff to revisit its out-dated assumptions and policies
related to the development of both housing and transportation infrastructure. It appears that the City
for whatever reason is unwilling to undertake the effort at this opportune time.

Figure 1. Designated Project Development Areas in Berkeley (since 2007)
Figure 2. Comparison of Opportunity Sites with Plan Bay Area 2040 Targets
0
500
1,000
1,500
2,000
2,500
3,000
3,500
4,000
4,500
Ho
usi
ng
Op
po
rtu
nit
y U
nit
s
Project Development Area (PDA)
Current and Proposed Project
Development Area (PDA) Growth
Opportunity Sites 2014 Allocations 2014-2022 Plan Bay Area 2010-2040
-·
~{;:- ~ ..._.;:, '!<..o ~{;:-
~~ ~ <:)o iS'
o..;:;. C,
~ e; c.,..S
e, ~<:'
i ••
' ___ I' .....
~e, e,<:' ~ ~
BE ELE
~e, ~e, fv'i{--e,<:' e,<:' ~ ~ ~ o<:'
-;::-4- ~o ~ <l,~ :§> -oe f...<, ~ ':;,..e,~ .,:1f f::-q_
.;::,~ ,,.,_e c.,'li
• •

1
STATEMENT ON 2014-2022 HOUSING ELEMENT UPDATE
NOVEMBER 5, 2014 PLANNING COMMISSION
Good evening, Commissioners. My name is Peter Eakland and I am serving as the
transportation consultant for the proposed mixed-use Peerless R&D Community
project. It is located on the two blocks between 3rd and Fifth Streets and
between Allston Way and Bancroft Way. The City is asking that the most recent
update be re-adopted without any significant changes. I believe that this is a
mistake for the following reasons:
1. The Housing Element's inventory of opportunity sites is inconsistent with
current zoning, the West Berkeley Plan, and recent mixed-use development in
West Berkeley.
Within the past five years, there are four projects within one-quarter mile of the
AMTRAK rail station either completed, under construction, or under review by the
City representing 602 residential units that were never considered as opportunity
sites. They include 651 Addison with 94 units, 800 University with 58 units,
Grocery Outlet site with 152 units, and Peerless R&D Community with 298 units.
800 University and the Peerless R&D Community site include MU-R meet the City
criteria as an opportunity site and contain MU-R parcels.
2. The narrow interpretation of the Housing Element's definition of transit-
oriented development, "on major transit corridors", differs significantly from both
State and Regional infill development guidelines related to such development.
Berkeley's assumption that transit-oriented development can only occur on
commercial zoning parcels facing a major arterial is in conflict with SB375 and
ABAG guidelines that define transit-oriented boundaries as being up to 1/2 mile
of a major transit facility or service, and
3. The Housing Element as written does not consider the Plan Bay Area process
that takes into account, and I quote, "overlapping objectives of SB 375 and the
California Housing Element law". Plan Bay Area with its 2040 housing and
employment targets and forthcoming transportation infrastructure funding is a
game changer that deserves attention.

2
These shortcomings we believe seriously undermine key equity considerations in
the Housing Element, such as housing diversity and affordability particularly in
West Berkeley.
The practical effect of the proposed Housing Element update is that for the next
eight years the City will continue to ignore zoning and the West Berkeley Plan and
instead focus on an unrealistic and inequitable scenario for likely residential
development. At stake is the ability of the major transit arterials during that time
period to successful compete for literally millions of Federal, State, and Regional
funding that will be available to support infrastructure and housing needs within a
city's Sustainable Communities Strategy. Even more important is the document's
inability to equally serve all Berkeley residents.
I am available to discuss in detail any of the issues that I have raised.

1PCIP Housing Element 2009 - Updated 092514
Harrison, Jordan
From: Peter Eakland [[email protected]]Sent: Thursday, November 06, 2014 10:44 AMTo: Harrison, JordanSubject: MTC economic report on PDA feasibility and readinessAttachments: Draft_PBA_PDA_Development_Feasibility_and_Readiness.pdf
Jordan: I enjoyed talking to you briefly last night. Except for a few lapses based on policies for which you have
little or no control, the Housing Element is a quality document, as I would expect from you. I have attached an
MTC report that you will find interesting regarding economic feasibility of residential development in selected
PDAs, one of which is on San Pablo Avenue. A longer version of what I presented last night includes the
following paragraph related to San Pablo Avenue.
The statement in the Housing Element that "the greatest capacity for new units will be on the
remaining underutilized sites in the commercial districts" is untrue and will likely continue to
be so. In the last five years, no submittals for mixed-use housing projects on these sites
outside of Downtown and Southside have occurred. None. This result actually has been
anticipated by a statement for potential development on San Pablo Avenue in an economic
report funded by MTC. "While the market for housing exists and infrastructure deficiencies are
manageable, the chief constraints are the small and shallow parcels with diverse ownership,
which challenge the ability to construct larger and efficient housing developments." This
arterial by itself with an estimated capacity of 1,047 new residential accounts for 41% of the
total for commercial corridors outside of Downtown and Southside. Of the 32 opportunity
sites on San Pablo Avenue, only three are vacant, and two are parking lots. The 25,000 daily
vehicle count on the arterial makes the street unsuitable for bicycle travel and presents
serious safety issues for walking. The renowned land use planner Donald Appleyard makes
the argument against placing undue emphasis on residential development on streets with
even lower traffic volumes. "Above the level of about 10,000 a.d.t. (average daily traffic),
many problems were experienced as equally severe regardless of volume. The percentages of
residents concerned about danger, noise, and air pollution reached 70 or 80 percent; the rest
appeared to be a core of people who did not complain or who perhaps preferred the busy
street."
The City needs to anticipate at some point that the capacity for housing units on San Pablo Avenue especially
but also on other major transit arterials is overstated. The location of recent development in West Berkeley
indicates that developers and residents of multi-family housing are choosing to locate closer to services and
away from congestion. The Appleyard quote is from his book "Livable Streets", p. 60. Unfortunately, It is out
of print and hard to find.
Peter B. Eakland

Late Communications Planning Commission December 3, 2014
Chapter 5 Comments 229 Policy H-15 Homeless Housing 230 Seek solutions to the problems of individuals and families who are homeless, with the goal of 231 first providing them with permanently affordable housing. 232 Actions: 233 A. Increase availability of supportive housing units in Berkeley that are affordable to 234 households whose incomes do not exceed 30 percent of the Area Median Income 235 and serve people who are formerly homeless or have severe disabilities by creating 236 20 to 30 units per year (with an overall goal of 350 units over 15 years). 237 B. Continue existing rent subsidy programs such as the Public Commons for Everyone 238 Initiative Square One program and Shelter Plus Care, and seek out new sources of 239 funding to expand or create new programs to maximize permanent housing 240 opportunities for the homeless. Programs may provide deep or shallow subsidies, 241 and may be linked to affordable housing developments, as in project-based Section 242 8 vouchers and the Mental Health Services Act Housing Program, or be available for 243 private market rentals like tenant-based Section 8 vouchers.
BHA Comments:
BHA, subject to funding and HUD approval, plans to engage in a new homeless housing continuum program whereby stabilized households in the Moderate Rehabilitation Program and Shelter + Care be provided a voucher, vacate a unit with supportive services, and move to a unit in Berkeley with permanent Section 8 assistance.
5. Relationship with Other Institutions 22 The City should continue working with the Berkeley Housing Authority and the University of 23 California to address affordable housing needs.
BHA Comments:
Evidence shows that the only way the affordable housing goals will be achieved is via a
partnership between the City and BHA that includes collaboration around current and new
programs; leveraging of resources; and financial assistance to BHA – critical given HUD’s
historically low proration of Administrative Fee (as low as 69% in FY 2013, currently 79%). A
permanent, Section 8 Voucher is the surest way to ensure housing is affordable to extremely
low-income households, those at or below 30% AMI.
Even with a S8 voucher, and a Payment Standard at 110% of HUD published Fair Market Rent,
low- and even moderate income households are being priced out of the rental market by
professional households commuting to San Francisco. BHA is looking to utilize the ability to
project base vouchers to increase the number of permanently affordable rental units. BHA is
also exploring opportunities to more effectively link BMR units with households that are
extremely low-income, by providing a deeper subsidy that makes the units affordable.
A comprehensive housing strategy must investigate incentives for landlords that would increase
the interest in partnering with BHA; for example, the creation or expansion of a low income
-

2
tenant rehabilitation loan for private landlords renting to extremely low income families or
working with BHA through the Section 8 program
293 5. Relationship with Other Institutions and Regional Cooperation 294 Policy H-20 Berkeley Housing Authority 295 Continue working with the Housing Authority to make quality affordable housing opportunities 296 available to Berkeley residents. 297 Actions: 298 A. Encourage the BHA to consider posting information regarding availability of 299 affordable housing on the City’s website and to coordinate with countywide housing300 information services, such as “2-1-1”. BHA Comments:
We suggest striking this language, as the only units we have listed on our website and office doors are for those with S8 Vouchers. BHA would be happy to list BMR units accepting voucher holders on it’s “available unit listing” (updated weekly on Thursdays and posted on our website, in our lobby, and on our front door). We would also be happy to do this under contract with owners/developers as a way to market and increase knowledge about the units. It is important to note the “available unit listing” report, previously included 20-30 units (of varying bedroom sizes) for households to select from. For the past year or more, the list has averaged 6-8 units. Increased incentives in the affordable housing mitigation programs for long-term participation in the Section 8 program, would increase the supply of housing for extremely-low income households, and strengthen the stability of BHA. 301 B. Assist the BHA with distribution of information. 302 C. Support BHA in their efforts to improve and upgrade the conditions of 71 large family 303 units located on scattered sites throughout the City. BHA Comments:
We suggest striking this language, as the 75 former units of Public Housing (including 14 state funded units) were transferred to private ownership February 2014, have undergone comprehensive modernization, and have Section 8 Project-based assistance to guarantee affordability at 30%-50% AMI. 304 D. Collaborate with the BHA and affordable housing developers in applying for an 305 additional allocation of Project-based Section 8 funding for use in connection with the 306 development of new affordable housing units throughout the City. BHA Comments:
HUD does not award funding for project based assistance. BHA has the option of allocating up to 20% of the total allocation of tenant based vouchers to project basing; each voucher project based, reduces the number of tenant based voucher available. With 300 vouchers currently

3
designated for the project based voucher program (176 expiring in the next five years), BHA has capacity to project base up to an additional 87 vouchers before reaching the maximum program size. There are additional activities/costs incurred in managing project based assistance that are not funded by HUD. Thus, BHA is creating a non-profit affiliate and exploring opportunities to take on a co-developer role in future awards, and other options to cover the cost of administration. Through the Project-based program, and to the extent possible, BHA will prioritize development or rehabilitation of 1 and 2 bedroom; mixed use developments; and fully accessible units. BHA will pursue other Federal funding for housing subsidies. BHA will also investigate the feasibility of starting a Tenant Based Rental Assistance (TBRA) in partnership with the City of Berkeley to provide short-term rental assistance. 307 E. Encourage the Berkeley Housing Authority and other owners of publicly subsidized 308 rental housing work with tenants to maintain a high quality living environment. BHA Comments:
All units with Section 8 rental assistance are safe, decent and sanitary. It is also true that many of the units have deferred maintenance. Many landlords in the Section 8 Program do not have resources to make repairs and provide for preventative maintenance of their properties. Eventually, without such repairs/maintenance/upgrades, the units will become uninhabitable. A grant or low-interest rental property loan program could effectively improve the quality of the units, enhance the neighborhoods, and be an incentive to owners to make scare rental units available to extremely low-income households. BHA will be exploring grants and other funding sources as part of a program of enhanced case management services, including workshops, briefings and other interventions to address behavior that detracts from the peaceful enjoyment of the neighborhood. A city funded/administered program providing 0% loans or grants for modernization of units, with priority consideration for owners participating in BHA’s S8 Voucher program, would preserve the quality of the rental housing stock and revitalize distressed neighborhoods. 309 F. Analyze potential impacts that could occur if BHA were unable to continue to operate 310 and the programs were to be transferred to the County or other housing agency, if 311 such a transfer is proposed.
BHA Comments:
The concept of consolidating the BHA into the jurisdiction of Alameda County Housing Authority
has been discussed conceptually for many years, and was explored and rejected in 2006. BHA
has operated as a “Standard performer” since 2009, and a “High Performer” each year since
2010, under HUD’s required Annual Section 8 Management Assessment Program (SEMAP).
Berkeley is now without any low income public housing units in the jurisdiction, and eliminating
the single jurisdiction housing authority would further detract from the goal of income and racial
diversity in the City. The high rate of BHA issued Voucher holders porting out of the jurisdiction
to find affordable housing is an indicator of this growing trend. BHA’s operations were

4
objectively evaluated by Quadel Associates in 2012, with a conclusion that the operations were
fully complaint, and the level of service provided exceeded industry standards. A 2014 HUD
audit further affirmed that BHA’s operational costs were in the mid-range of industry standards.
Rather than discussing BHA becoming obsolete, BHA proposes a more comprehensive
partnership between the City and the Housing Authority that would ensure the long-term
presence of a single jurisdiction Housing Authority in the City of Berkeley.
Language could read: “Partner with BHA to plan and provide financial support, through general
funds, and other mechanisms, an annual grant for programs such as:
A Housing continuum program whereby those in the moderate rehabilitation program or
Shelter + Care are provided special-admittance to the Housing Choice Voucher
Program.
Housing safety program grants or 0% interest loans for repairs/upgrades of low income
units.
Expansion of language in the BMR ordinance to include the benefits to landlords of BMR
units to renting them to households with a S8 voucher.”
Chapter 6 Comments
178 2. Maintenance of Existing Housing 179 Existing housing should be maintained and improved. Improvements that will prepare 180 buildings for a major seismic event should be encouraged. 181 a. Demolition Controls and Unit Replacement Requirement 182 b. Energy Conservation Opportunities and Programs 183 c. Home Modifications for Accessibility (Center for Independent Living and 184 Rebuilding Together)
185 d. Housing Code Enforcement and the Rental Housing Safety Program 186 e. Lead Poisoning Prevention Program 187 f. Priority Properties Team 188 g. Residential Seismic Preparedness Programs 189 h. Senior and Disabled Home Improvement Load Programs 190 i. Tool Lending Library
BHA Comments:
All units with Section 8 rental assistance are safe, decent and sanitary. It is also true that many of the units have deferred maintenance. Many landlords in the Section 8 Program do not have resources to make repairs and provide for preventative maintenance of their properties. Eventually, without such repairs/maintenance/upgrades, the units will become uninhabitable. A grant or low-interest rental property loan program could effectively improve the quality of the units, enhance the neighborhoods, and be an incentive to owners to make scarce rental units available to extremely low-income households. The annual unit inspection performed by BHA would help ensure the investment is maintained through routine and preventative maintenance
210 5. Relationship with Other Institutions 211 The City should continue working with the Berkeley Housing Authority and the University 212 of California to address affordable housing needs.

5
213 a. Berkeley Housing Authority (Section 8 Housing Assistance Program)
BHA Comments:
Please see BHA’s comment on Pg. 1 above “Relationship with Other Institutions” (Ch. 5).
459 Berkeley Housing Authority (Section 8 Housing 460 Assistance Program) 461 The Berkeley Housing Authority (BHA), established in 1966, operates the Section 8 462 Housing Choice Voucher program, the Section 8 Project-based voucher program, and 463 the Single Room Occupancy, Moderate Rehabilitation Program (Mod Rehab). The 464 programs are administered by the U.S. Department of Housing and Urban Development 465 (HUD). They provide rental assistance for low-income families, the elderly, people with 466 disabilities, and others. 467 Until July 1, 2007, BHA was a division of the City of Berkeley, but has since become an 468 independent entity with its own Board, appointed by the Mayor. While structurally a 469 separate entity, the City of Berkeley provides IT support.
470 Housing Choice Voucher Program. 471 Berkeley Housing Authority currently provides rental assistance to approximately 1,935 472 households through HUD’s Section 8 Housing Choice Voucher program. During the past 473 year BHA awarded new assistance (vouchers) to more than 65 households that had 474 been on both the Section 8 Housing Choice Voucher Wait List and the Section 8 Project475 based Wait List. The vast majority of vouchers provide a tenant-based subsidy, meaning 476 Program Participants can use the voucher to rent privately owned housing and take the 477 vouchers with them when they move to a different property. 478 Households generally pay between 30 - 40% of adjusted monthly income for rent unless 479 they are over-housed. BHA pays the difference directly to the landlord. The Housing 480 Authority establishes a Payment Standard, which is the maximum subsidy amount the 481 Housing Authority will pay, based on the unit and/or Voucher size. HUD allows housing 482 authorities to set the Payment Standard at from 90% to 110% of the region’s “fair market 483 rent” (FMR) by bedroom size. The BHA sets the payment standard at 110% of the FMR. 484 The FMR is adjusted annually to keep pace with the increasing cost of rent and utilities. 485 The Contract Rents for individual units in the Section 8 program are generally capped at 486 the Payment Standard for the particular bedroom size. To avoid artificially inflating rental 487 costs, the approved rent for any contract must first be determined “reasonable” in 488 comparison to similar, unassisted units. After the first year there is no HUD imposed cap, 489 but there are triggers of the local Rent Control Ordinance if the rent exceeds the 490 Payment Standard for the unit size. 491 The current Payment Standards for units of different sizes are shown below.
Table 6-2: BHA Payment Standards, December 1, 2013 November 1, 2014
Number of Bedrooms 0 Bedrooms $1,139 $1,142 1 Bedroom $1,380 $1,386 2 Bedrooms $1,736 $1,743 3 Bedrooms $2,424 $2,434 4 Bedrooms $2,974 $2,987 Source: Berkeley Housing Authority
492 To be eligible, an applicant’s income must be at or below 50 percent of AMI (area

6
493 median income). A minimum of 75% of BHAs admissions must have income below 30% 494 AMI; the remaining 25% of admissions can have income up to 50% AMI. Other assets 495 (savings, investments, retirement funds, etc.) are also evaluated. A family or individual 496 issued a voucher is responsible for finding a suitable rental unit that meets minimum 497 Housing Quality Standards (HUD’s inspections standards for units being rented with 498 Section 8 subsidy). When the participant locates a unit to rent with a landlord that is 499 willing to participate, the owner executes a Request for Tenancy Approval which is 500 submitted to BHA. BHA inspects the dwelling, and when the inspection passes, and the 501 owner and family execute a lease, BHA and the owner enter into a Housing Assistance 502 Payment (HAP) agreement. BHA then pays a rental subsidy directly to the landlord and
503 subsidy amount, 504 typically 30 percent of adjusted household income (less the applicable utility allowance). 505 Waiting List. 506 BHA successfully completed a Wait List intake process for the Section 8 Housing Choice Voucher Tenant Based, and Project Based Wait Lists March 1-5th
507 , 2010. During this 5- 508 day period, over 37,000 applications were received. This speaks to the tremendous 509 demand for rental assistance for low-income families in the Bay Area. 1,500 510 applicants were randomly selected on March 22, 2010 and placed on the Section 8 511 Tenant Based Voucher Wait List. An additional 1,500 names were randomly selected 512 and placed on the Section 8 Project Based Voucher Wait List. In accordance with HUD 513 regulations, preferences are identified in BHA’s administrative plan, which are used to 514 weigh all applicants for their eligibility and ranking on the waiting list. The BHA plans to 515 allow on-line applications when the wait list is opened. 516 Additionally, BHA opened the Project-based Wait List in 2012 for the following 517 categories: seniors 62 or older (637 applications received); youth emancipated from the 518 foster care system (627 applications received); those with HIV or AIDS (282 applications 519 received); families qualifying for 3 bedroom units (1,100 applications received); and 520 families qualifying for 4 bedroom units (224 applications received). 521 Lease-up Rate. 522 In August 2002, the lease-up rate was 1,410 out of 1,841 allocated units (77%). As of 523 May 2009, the lease-up rate was 92% and climbing, 1,683 out of 1,841 allocated units. 524 The current lease up rate, October 2014 is 1791 (93%). BHA remains concerned and 525 alarmed by the current rental market condition in Berkeley, making it difficult to compete 526 for units in the open market. The success rate of new voucher holders is 43%; this is 527 due in large part to the high rent demands, and the increased competition for rental units 528 from CAL students, and commuters to San Francisco, who can meet the owner rent 529 demands without S8 assistance. The success of the S8 Voucher program is critical to 530 the City’s ability to retain a diversified population. BHA remains committed to strategies 531 designed to retain and expand owner participation. 532 Project-Based Section 8 Units. 533 Under HUD rules, BHA can project base up to 20% of the allocated vouchers. In 1999, 534 BHA began “project-basing” a portion of the vouchers by allocating vouchers to selected 535 development projects to ensure that units in rehabilitated or new construction buildings 536 are affordable to people at extremely low incomes. Project Based voucher have 537 effectively assisted in the creation of 187 new, and 114 rehabilitated rental units in 538 senior, disabled, family and mixed use developments. These awards remain a critical 539 element in financial feasibility of the creation and substantial rehabilitation of affordable 540 housing activity. With Project Based Section 8 units, the Housing Authority enters a 541 master HAP contract with a landlord that guarantees Section 8 rents for a period of 15 542 years. Families are selected from the Project Based waitlist (managed by BHA), and 543 those that choose to reside at the property may request transfer to the Tenant Based

7
544 Voucher and move off site with rental assistance after the first year. At the end of the 15 545 year period the landlord may choose to continue renting to families with tenant based 546 vouchers or convert the units to market rate, or BHA may offer to have the master 547 contract extended for some or all of the Project Based units for an additional 1 to 15 548 years. 549 BHA currently has 201 units of Section 8 Project-Based assistance under contract and 550 100 units committed including at the former Low Income Public Housing scattered sites, 551 once owned by BHA but now transitioned to the Project-based program, and Strawberry 552 Creek Lodge, both of which are currently undergoing rehabilitation. 553 Moderate Rehabilitation Program. 554 Berkeley Housing Authority provides subsidy for 98 units of Single Room Occupancy 555 (“SRO”) housing in Berkeley, via HUD’s Moderate Rehabilitation Housing Program. The 556 units offer safe, decent, housing plus on site services for the formerly homeless 557 population, including disabled individuals. 558 Accomplishments
559 The Housing Authority has been a “High” performer under SEMAP (Section 8 560 Management Assessment Program) since 2010.
561 The disposition deal for the 75 former units of Low Income Public Housing was 562 realized, and the units are currently undergoing a major rehabilitation under the 563 Project-based Program.
564 In an effort to streamline payment of landlords, we have moved to a direct 565 deposit program for HAP funds. 566 Looking Ahead 567 The Housing Authority will be working to attract new properties to the Tenant-based 568 Section 8 Program, by reaching out to existing owners and potential new owners, 569 including those with Below Market Rent (BMR) commitments. We are contemplating the 570 possibility of going to a higher Payment Standard of 115% or 120% of the FMR. 571 Additionally, BHA is considering a program to help the formerly homeless individuals 572 living in the Mod. Rehab. units transition to permanent mainstreamed housing. Lastly, 573 we are beginning to conceptualize implementation of the Family Self-sufficiency (FSS) 574 Program, as our waiver (from operating the FSS program) from HUD expires in early 575 2016. 576 Implementation Steps
577 Continue to provide rental assistance to households with incomes lower than 578 50% of AMI during the planning period. 579 Timeframe: 580 Ongoing 581 Responsible Agency: 582 Berkeley Housing Authority
1023 Shortage of affordable housing. 1024 Impediment: The Bay Area is one of the most expensive housing markets in the country. 1025 Berkeley’s housing costs rose steadily for more than a decade, and despite the 1026 recession, remain high. As a result, the most significant barrier to fair housing is the lack 1027 of affordable housing. Because national data shows that minorities are more likely than 1028 non-minorities to have a low income, and people with disabilities are more likely than 1029 people without disabilities to have a low income, the housing problems of low-income 1030 people are most acutely experienced by minority and disabled households. While the 1031 City of Berkeley has historically placed a priority on funding affordable housing, the 1032 needs continue to outstrip available resources.

8
BHA Comments:
Historically BHA has enjoyed strong support from landlords with units in South and West
Berkeley. However, the market has changed as competition from professional households
wishing to live in Berkeley (many commuters to San Francisco) has increased.
Historically BHA has maintained a Payment Standard at 110% of the HUD published Fair
Market Rent, notwithstanding the fact that there is no corresponding increase in annual funding
from HUD or any other source. BHA could appeal to HUD for an exception Payment Standard
of 120% but that would further reduce the number of households we could serve. Each 10%
increase results in approximately 500 fewer households assisted.
BHA would like to see stronger language/enhanced incentives in the Housing Mitigation
program and BMR density bonuses for (a) owners that build 1 and 2 bedroom units; 1 and 2
bedroom wheelchair accessible units; and 1 and 2 bedroom units in mixed family developments,
and, (b) language conditioning the enhanced benefit on owner commitments to lease the units
to households with Section 8 tenant based rental assistance for a minimum of 15 years.
Given the inability to compete on the basis of contract rent, BHA must explore other incentives
for landlords to rent to extremely low-income households. A grant or 0% interest rental unit
rehabilitation loan program could be one such incentive.
1054 Shortage of physically accessible units. 1055 Impediment: New construction in Berkeley complies with the Americans with Disabilities 1056 Act. However, older units may not be accessible, and renters and homeowners with 1057 disabilities may benefit from a variety of adaptations. 1058 City’s Actions: The City has operated the Senior and Disabled Home Rehabilitation 1059 program continuously since the previous Housing Element was submitted in 2001. The 1060 City has continued to fund the Center for Independent Living’s Residential Access 1061 Project and Rebuilding Together to provide accessibility modifications for people with 1062 disabilities. Universal design was added to the HTF guidelines in a 2009 update. These 1063 guidelines encourage developers to exceed the minimum accessibility requirements.
BHA Comments:
BHA will be exploring expanded scoring criteria for evaluating proposals for project based
voucher in the Administrative Plan which may include preferences for rehabilitation and new
construction of fully accessible units.
1098 Affirmative Marketing of Vacant Subsidized Units. 1099 The City’s Housing Trust Fund program and Inclusionary Zoning Ordinance require 1100 property owners to commit to affirmative marketing. 1101 When affordable housing developers receive loans through the City’s Housing Trust 1102 Fund, the loan terms required the developers to market vacant subsidized units in a way 1103 that will make the units equally available to the community’s diverse population. 1104 Developers must submit an affirmative marketing plan that addresses the venue and 1105 media through which units will be marketed and the steps they will take in selecting 1106 tenants to ensure equal access. 1107 Developers of inclusionary housing units under the City’s Inclusionary Zoning Ordinance

9
1108 must sign a regulatory agreement that contains ordinance language requiring the 1109 developer to affirmatively market units to low-income households on an equal 1110 opportunity basis.
BHA Comments:
BHA welcomes the opportunity to conduct affirmative marketing on behalf of and for any and all
landlords/ownership entities that have BMR and inclusionary units in Berkeley, and in the spirit
of deeper affordability, suggest a requirement to affirmatively market the units to extremely low
(30% AMI) households; a task that is income neutral, if not beneficial for the owner.
Furthermore BHA would like to explore the possibility of providing City of Berkeley fair housing
services that include outreach, education, intake, housing discrimination, counseling, hotline
services and other pertinent services.

Late Communications Planning Commission
DEC 03 2014
Dorothy Walker Comments to Planning Commission December 3, ~\9M';J,}!gED
Re: Constraints on Development of Housing in Berkeley
While we are celebrating the huge voter affirmation of our Downtown plan for lots of new housing in taller buildings, we need to be working on a big plan for lots of new housing throughout the rest of Berkeley.
The new draft Housing Element under consideration is a workmanlike response to state and regional requirements but it is not a proactive statement about what the City needs to do. Berkeley has suppressed the development of housing in various way! for about 40 years and this has resulted in low expectations about what the City can do. The biggest constraint on development of housing is the lack of political will to develop a big overall vision and corresponding plan for new housing. If we are serious about new housing we cannot continue the pattern of fighting for housing one building at a time.
Most people In Berkeley value living in a diverse community- diverse in race and ethnicity, diverse in income, diverse in educational attainment, diverse in age, diverse in lifestyle. Because of the lack of an aggressive program for lots of new housing for all kinds of people, Berkeley is losing much of its diversity. To reverse this, the City must have a big, City-wide plan for all kinds of housing and must adopt the means to achieve the plan. This will go far beyond our regional fair share. Such a plan must include all areas of the City and affect all the people in Betkeley. We need the commitment and involvement of the entire community to recapture our diversity. If we are to have a real plan for lots of housing we must have:
• Leadership from the Planning Commission and City Council to spearhead a plan and educate the community about the need for lots of new housing to serve all incomes, to house the homeless, to permit those who work here to live here.
• A shared community understanding and commitment that lots of new housing is the key to keeping Berkeley diverse and this is a communitywide responsibility.

• Zoning throughout the City that promotes and supports new housing. Housing policies and land use controls should be based on a fundamental principle that all parts of the City are potential locations for new housing.
If Berkeley is to have a real city-wide housing plan, for starters I suggest it include:
• Increase General Plan densities and corresponding zoning standards
• Rezone all existing commercial districts to permit a minimum of 5 stories
• Prohibit new one story buildings in all areas zoned for commercial; require any new buildings in commercial districts to have a minimum of 4 stories of housing above the ground floor
• Permit at least one building with residential above the ground floor of up to 120 ft at major intersections/ nodes on arterial streets
• Require Accessory Dwelling Units be included in any new single family dwelling
• Require an Accessory Dwelling Unit on the site if an addition of more than 400 sq ft is proposed to an existing residential building
• Develop PUD plans for intensive development of major sites for housing, including:
City Corp yard BART parking lots Any underdeveloped site of at least ½ acre
• Identify all major undeveloped and underdeveloped parcels and surface parking lots throughout the City that have the potential for a significant amount of housing; work with owners on possible development for housing
• Work with the University for more student housing on University-owned lands, including hill areas
• Eliminate all parking requirements for residential uses
• Work with A/C Transit to increase bus frequencies; assess fees on new buildings to support targeted transit improvements

• Work with the University to develop an on demand shared ride/jitney system for lower density areas
There are lots more ideas to consider, but the first step is a commitment to greatly enlarge our vision beyond what is currently contemplated in the draft Housing Element. I urge the Planning Commission to undertake developing that vision.

Item 9 December 3, 2014
Planning and Development Department Land Use Planning Division
2120 Milvia Street, Berkeley, CA 94704 Tel: 510.981.7410 TDD: 510.981.6903 Fax: 510.981.7420 E-mail: [email protected]
MEMORANDUM DATE: December 3, 2014 TO: Members of the Planning Commission FROM: Jordan Harrison, Associate Planner
Leslie Mendez, Associate Planner SUBJECT: Response to Comments on Chapters 5 and 6, Policies and Programs;
Review Housing Element Chapter 4, Constraints
Recommendation
1. Consider Housing Advisory and Homeless Commissions (HAC and HC) comments for possible inclusion in the Housing Element (HE).
2. Review and comment on the Constraints, Chapter 4. Introduction This report addresses: (1) comments received from the Planning Commission, Housing Advisory Commission (HAC), and Homeless Commission (HC) on Chapter 5, Objectives, Policies and Actions and Chapter 6, Housing Programs and Quantified Objectives of the HE; and (2) the revised HE Chapter 4, Potential Constraints to Housing Production. After tonight’s meeting, the Commission will have reviewed all chapters of the Housing Element except the Introduction (Chapter 1). The Commission will review the complete updated HE at the Public Hearing, tentatively scheduled for early spring 2015. Commission input and recommendations will be taken into account as staff completes the final draft of the HE. The draft HE will be sent to the State Department of Housing and Community Development (HCD) in December. This allows HCD to provide comments and identify issues prior to the public hearing. Chapters 5 and 6 (Policies and Programs) were reviewed by the HAC and HC because of their expertise in the subject matter. Their comments included both non-substantive and typographical corrections, as well as some policy suggestions. A summary of the PC, HAC and HC comments and staff recommendations regarding the policy statements are provided below. Attachment 1 is an e-mail received from HAC Commissioners regarding the Chapters.

Housing Element – Constraints Chapter; Item 9 PC/HAC/HC comments on Policies and Programs December 3, 2014
Page 2 of 6
The Chapter 4, Potential Constraints to Housing Production, identifies possible governmental and non-governmental impediments to housing development in Berkeley. Staff updated and edited the chapter; there are no significant changes as the constraint landscape has not altered significantly in the last four years. This is the final substantive HE chapter to be reviewed by the Commission. Discussion
I. Chapter 5 (Policies) and 6 (Programs): Commissions Comments and Staff Responses
The PC, HAC and HC provided input on these chapters at their November meetings. Many of the comments relate to individual points of view about housing affordability and availability. Certain comments will generate new policies and actions, as discussed below, to be included in the draft HE presented for consideration at the public hearing. PC Comments/Questions 11/5/2014
1. The City is not achieving the RHNA affordability goals, what more can be done?
The HE process in and of itself is not intended to result in the construction of new units. Through the HE process, the city addresses housing need by ensuring availability of adequate sites for new construction and programs to facilitate construction of affordable units. It is rare for any city to meet its RHNA goals, especially for the lower income levels, because there is not sufficient money available through state, Federal, and/or private resources to “buy down” the cost to make the units affordable. Berkeley’s Inclusionary Housing and Affordable Housing Mitigation Fee programs, inclusionary units provided under state density bonus law, and the Housing Trust Fund work together to provide as many below-market rate units as possible.
2. New housing, especially downtown, is being absorbed by student demand. Can this be addressed?
The type of new housing units produced is largely market-driven. Student demand is one driver of housing production in Berkeley, along with empty nesters and people priced out of San Francisco. The City could develop incentives for the construction of housing targeted towards other segments of the population, such as families or seniors, but the City cannot legally control who rents the housing units.
3. How are affordable housing units tracked and administered?
The Health, Housing and Community Services Department (HHCSD) contracts and monitors dedicated affordable units in the City. New tenancies in below-market-rate (BMR) units are reviewed for income eligibility of the tenant and rent level of the unit by HHCSD staff. Units are funded by the Housing Trust Fund, and then managed by non-profit affordable housing providers that fill the vacancies with eligible tenants. All properties with BMR units submit an annual compliance report to HHCSD.

Housing Element – Constraints Chapter; Item 9 PC/HAC/HC comments on Policies and Programs December 3, 2014
Page 3 of 6
4. How are the pending downtown projects going to contribute towards our affordable housing goals?
Since adoption of the 2012 Downtown Area Plan (DAP), five housing/mixed use projects have been approved that are subject to the Affordable Housing Mitigation Fee (AHMF) Program. Three of the projects have committed to providing Very Low Income units on site, one will be paying the full AHMF into the City’s Housing Trust Fund, and one is undecided. Table 1 below summarizes the projects compliance with the AHMF Program.
Table 1: Approved Downtown Projects Affordable Housing Provisions
Project Total Units
VLI BMR Units
AHMF
1931 Addison 69 7 $0
2024 Durant 79 0 $1,580,000
2107 Dwight 99 9 $0
1974 University 98 8 and $200,000
2133 University 205 19 or1 $4,100,000
1. The project has up to the Certificate of Occupancy to decide how it will comply with the AHMF Program.
5. How do we want to prioritize HTF funding in the future, rehabilitation or
construction?
The Housing Trust Fund (HTF) guidelines give equal priority to rehabilitation-preservation and new construction. HTF dollars are typically used in combination with outside funding sources, often governmental or foundation grants, which have specific program objectives. Grant recipients abide by funding program objectives, which, thereby guide decisions about use of HTF money. State and federal funding for affordable housing construction have been substantially less available since 2009, compared with the preceding period, which explains why HTF monies have been used to support rehabilitation programs recently. The types of projects funded in the future will be based on the type of funding that is available to affordable housing developers. HAC Comments/Questions 11/6/2014 Attachment 2 provides comments received from HAC members as of 11/18/14. The substantive comments are included below. Additional comments received focused on typographical errors and were not included with this report.
6. The City should construct and maintain a database of vacant and deteriorated housing units, and vacant properties.
Code Enforcement and the Rental Housing Safety Program combine efforts to address deteriorated properties. As discussed in the HE, there are very few deteriorated housing units in the city and there are few vacant units, likely due to the high cost of land and housing. Information on vacant parcels is collected by the Alameda County Assessor’s Office and is available to the public on the county’s website; maintaining a

Housing Element – Constraints Chapter; Item 9 PC/HAC/HC comments on Policies and Programs December 3, 2014
Page 4 of 6
concurrent tracking program of vacant parcels would be repetitive and very labor intensive.
7. Partnerships with non-profits should be included in the Housing Element.
Staff concurs that this should be added to the HE. Staff will expand the Relationship with Other Institutions policies to include relationships with non-profit housing agencies. The City’s Housing Department does this as a matter of course in their work, and the HE should explicitly state it.
8. Advocate for transportation policies that encourage accommodations for persons with disabilities.
This comment is focused to transportation policy, rather than housing policy. Recent housing development in the Downtown, as well as proposed ADU regulations, would help focus housing development in transit rich areas, thus making the housing more transit accessible. In addition, the majority of the City’s sites available for development are located in transit rich corridors. Staff will provide this comment to the Transportation Department for their consideration.
9. Encourage ADUs near transit.
The current HE addresses the issue of updating Accessory Dwelling Units (ADUs) regulations. The Council is considering draft zoning ordinance changes that would reduce parking requirements for ADUs in proximity to transit. Staff will augment Policy H-13, consistent with Council direction.
10. Support moderate income housing opportunities, particularly ownership.
There are very few programs (state or Federal) that specifically address moderate income ownership housing, although this is a subject of interest for the last 20 years. The majority of moderate income housing in Berkeley is provided by condominium conversions, construction of new condominiums, and rent control. Staff will review and consider the need to add an action or program to address this topic. The forthcoming affordable housing mitigation fee nexus study will also provide information and guidance on housing for this income segment.
11. Include a policy encouraging tenant relocation protections.
Staff will consider the need to add a policy to the HE regarding tenant relocation protections referencing the programs the City already has in place:
The City Relocation Ordinance prevents tenants from being permanently displaced if they must vacate their unit temporarily while repairs are completed to bring the unit into code compliance. The Ordinance requires the owner to allow the tenants to move back into the unit once repairs are completed, and to provide financial compensation to tenants to mitigate the costs associated with being temporarily displaced. City staff monitors City-assisted housing developments to ensure that whenever people or businesses must be relocated either permanently or temporarily, the relocation is carried out according to federal, state, and local regulations. When residents have to

Housing Element – Constraints Chapter; Item 9 PC/HAC/HC comments on Policies and Programs December 3, 2014
Page 5 of 6
move as a result of a City-assisted rehabilitation or housing development project that includes federal funding (such as the City’s Housing Trust Fund), the federal Uniform Relocation Act would apply. The Uniform Relocation Act proscribes the steps that must be undertaken to notify residents in advance of any requirement to relocate, along with specific relocation assistance that must be provided to residents or businesses who may need to relocate.
12. Provide a comprehensive list of BMR units and advocate for use of waiting lists.
Staff will add a program task to create a current and consolidated list of income restricted units, and post to the HHCSD website. Planning and HHCSD staffs are currently working on creating a consolidated list. Additionally, the City contracts with Eden Housing to provide information to potential tenants about BMR unit availability through the 211 program.
13. Provide a table of projects with HTF funds that are allocated, but the work is not yet completed.
Staff will add the following table to the HTF program:
Projects with Current Housing Trust Fund Commitments That Are Not Yet Complete
Project Number of Units Amount of City Funds Committed
Berkeley 75 (acquisition and rehab)
75 $300,000 to Berkeley Housing Authority for predevelopment
$400,000 to Related California for development
Strawberry Creek Lodge (rehab) 150 $652,200
University Avenue Cooperative Homes Apartments (rehab)
47 $1,213,016
William Byron Rumford Sr. Plaza (rehab)
43 $2,140,000 (loan will also refinance existing City loans)
HC Comments/Questions 11/12/2014 The Homeless Commission had no comments on the content of the HE chapters, but asked Housing staff to provide more information on below-market units at risk of conversion to market rate. Conclusion In addition to the responses above, staff will provide the complete draft HE to the HAC and HC. Both Commissions will have the opportunity to provide comments to the Planning Commission prior to the Public Hearing. Either commission may choose to write a separate report to the Council on the subject of the HE. II. Chapter 4, Potential Constraints to Housing Production
Chapter 4 of the Housing Element (Attachment 2) analyzes potential governmental and non-governmental constraints to housing production. Staff updated the chapter, originally written in 2009, to reflect current conditions.

Housing Element – Constraints Chapter; Item 9 PC/HAC/HC comments on Policies and Programs December 3, 2014
Page 6 of 6
As discussed in the chapter, Berkeley has done a good job of balancing land use controls and public process in order to minimize constraints while allowing adequate public input as the city grows. The chapter discusses potential governmental constraints, such as land use controls, fees, and permits, and concludes they are not a significant impairment to new residential construction. This is evident from the strong housing market, particularly on the heels of the recent recession. The biggest change to occur since the 2009 HE with regard to governmental constraints is the addition of the Affordable Housing Mitigation Fee. The amount of the fee takes into consideration housing development costs, as discussed the mitigation fee nexus study. The fee applies to rental housing only, and since its adoption proposals for new rental housing have remained strong. Therefore, staff concludes that the fee has not been a deterrent to new housing. The Chapter also discusses non-governmental constraints, such as physical barriers or development costs. Although certain areas of the City are constrained due to environmental factors (i.e. Panoramic Hill) or development standards (i.e. Manufacturing Districts), the Housing Element analyzes the City as a whole and does not find significant obstacles to new residential development. Berkeley is a City that encourages housing development and does not have the constraints experienced in some communities, such as a housing unit cap, urban growth boundary, or insufficient infrastructure (e.g. water and sewage). At this meeting, Staff is seeking Commission feedback and questions pertaining to the Constraints chapter content. The document is provided in “strike-out/underline” format to clearly show what changes were made. Next Steps Based on direction tonight, staff will take the following steps:
1. Make appropriate modifications to the Constraints, Policies, and Programs chapters (Chapter 4, 5 and 6)
2. Publish the final draft HE by mid-December 3. Notify interested parties, including the commissions 4. Send the draft HE to HCD for review 5. Set a Public Hearing for early spring to consider the complete draft HE, as
modified by Commission direction, as well as any comments from HCD. Attachments:
1. Attachment 1: E-mail from HAC members Maher and Tregub 2. Attachment 2: Chapter 4, Constraints

1PCIP Housing Element 2009 - Updated 092514
Harrison, Jordan
From: Ben Mahrer [[email protected]]Sent: Friday, November 07, 2014 4:08 PMTo: Davidson, Amy; Harrison, JordanCc: Igor TregubSubject: Fwd: HAC housing element comments
Follow Up Flag: Follow upFlag Status: Flagged
Hi Jordan and Amy,
Below you will find Igor's comments on the Housing Element. Mine are as follows:
1. pg. 78, Ln. 102 - Policy H-5 Rent Stabilization
Possibility here is adding a fourth action, "Ensure that ordinances pertaining to damaged and demolished
buildings contain tenant relocation protections"
2. pg. 79 Ln. 148 - Poicy H-10 Deterioration, Blight and Deferred Maintenance
Possibly add a sixth action, "Construct and maintain a database of deteriorated or vacant property."
3. pg. 80 ln. 178 - Expansion of the Housing Supply
Maybe add a third policy to this section: "Vacant Property" w/ the goal of reducing the amount of vacant
residential and commercial property in the city
4. pg. 82 ln. 279 - Policy H-18 Housing for People with Disabilities
add an action to this policy - "support transportation policy that includes provisions and accomodations for the
disabilities described"
5. pg. 83 ln. 293 - Relationship with Other Institutions and Regional Cooperation
This section mentions the BHA, UC Berkeley, and Inter-Jurisdictional coordination but leaves out non-profits.
Seems like activity in the non-profit sector should be included here.
6. pg. 84 ln. 349 - Policy H-23 Fair Housing
Might be appropriate to add a third action to this policy - "advocate for the use of waiting lists to fill affordable
housing units."
That's it - thanks so much for your work!
---------- Forwarded message ----------
From: Igor Tregub <[email protected]>
Date: Thu, Nov 6, 2014 at 5:51 PM
Subject: HAC housing element comments
To: Ben Mahrer <[email protected]>
Item 9 - Attachment 1 Planning Commission
December 3, 2014

2PCIP Housing Element 2009 - Updated 092514
Cc: Katie McCoy <[email protected]>, Luis Amezcua <[email protected]>, "Arreguin, Jesse L."
Here's my feedback after a quick glance.
P. 80, Line 170
"B. Reduce the seismic threat to Berkeley’s housing stock without necessitating
171 substantial rent increases by identifying ways to minimize the financial impact of
172 retrofits, such as offering fee deferrals, waiver of certain zoning regulations, and
173 special funding programs "
It may be premature to mention specific programs in the Housing Element , but you may wish to point out that
we are undertaking efforts to explore seismic retrofit financing through the PACE program (similar to San
Francisco's model) or other avenues to provide retrofitting assistance for low-income property owners of
multifamily buildings. Kelsey and I are meeting with Seismic Retrofitting Project Manager Jenny McNulty to
get an update.
P. 82, Line 274
B. Develop incentives for a range of senior housing types including but not limited to
275 second units or ADUs to help seniors age in their homes, in a universally-accessible
276 ADU on their property, or to provide on-site housing for caregivers.
What does "universally accessible" mean? This policy is still being hashed out by the City Council and planning
staff.
P. 86, Line 426 (minor)
Develop, then phase in - should have a comma after "develop"
Develop then phase in local minimum energy standards for existing residential
427 buildings. Encourage programs to encourage owners of existing single- and multi-
428 family residential buildings to meet those standardsreduce energy use by providing
429 incentives and developing energy services, such as the Smart Solar Program,
430 Berkeley FIRST financing, comprehensive energy audits, energy efficiency
431 upgrades, and education.
P. 96, Line 269 (minor)
"Change" and "s" should be combined to form "Changes"
income production goals. Part of the reason for this is recent change s to state law
270 severely limit the tools available to produce income-restricted units.
income production goals. Part of the reason for this is recent change s to state law
270 severely limit the tools available to produce income-restricted units.
P. 110 Line 782 - May want to wait for BESO to be possibly approved at the Nov 11 Council meeting (it's on
the agenda) and update this section.

3PCIP Housing Element 2009 - Updated 092514
"Residential Energy Conservation Ordinance (RECO): RECO, adopted in
783 1980, requires that every home or apartment building sold or transferred in
784 Berkeley or undergoing renovations with a total value of $50,000 or more must
785 meet a prescriptive list of energy and water efficiency requirements for a range of
786 building systems and features, including: toilets, showerheads, water heaters,
787 attic insulation, exterior door weather stripping and common area lighting (for
788 multi-unit buildings). This ordinance is in the process of being updated. "
P. 111, Line 818 - may want to clarify that Berkeley FIRST is no longer in operation.
"• Berkeley FIRST (Financing Initiative for Renewable and Solar Technology):
819 In 2008, the City of Berkeley launched the Berkeley FIRST program to promote
820 solar photovoltaic (PV) installations using a pioneering financing mechanism. The
821 now concluded pilot program served as a model for Property Assessed Clean
822 Energy (PACE) programs across the country. Berkeley FIRST enabled property
823 owners to pay for sola"
P. 113, Line 876 - May want to update with the fact that the Board of Supervisors recently (I can't remember the
month, but it was earlier this year) approved a study of CCA with the intent of going forward with a county-
wide program.
Community Choice Aggregation (CCA): The success of the Marin Clean Energy
875 program has generated more interest in acquiring cleaner electrical energy through
876 CCA. The Alameda County Board of Supervisors will be considering a resolution to
877 explore CCA and it may be possible for Berkeley and other communities to
878 participate in the process. Staff continues to look for opportunities for a CCA that
879 would minimize the City’s financial exposure and provide the community with access
880 to cleaner electricity sources
P. 133 Line 1411
• "The Public Commons for Everyone Square One program, and "
Ask staff to remind you if Public Commons for Everyone was the precursor of Measure S in 2012, which failed
on the November ballot. If so, probably not relevant here. Or was this Jesse Arreguin's later proposal that came
about after the defeat of Measure S, in which case it's worth mentioning.
P. 136 Line 1606 and below
May wish to change tense from present to past tense as program has been discontinued.
Page 145, Line 1826-1835 - minor
Some grammatical issues - should be FY 2008-2014 (with a dash); check grammar when dealing with numbers
throughout this paragraph.
During FY 20082014, the Shelter Plus Care Program provided housing for a total of
1827 249255 households (213 single adults and 42 families). Housing outcomes are available
1828 for the 31 28 households who exited the program during this period.
1829 • Of those households who exited the program, 100% retained their housing for at

4PCIP Housing Element 2009 - Updated 092514
1830 least six months; 2627/31 or 9683% retained their housing for at least one year;
1831 19/3114 or 5061% retained their housing for at least two 5 years.
1832 • Of the 31 28 households exiting the program: 12 15 left for other permanent
1833 housing, one entered shelter; eight four died; twofour were in jail; four one
1834 entered transitional housing or residential treatment; and two were staying with
1835 family or friends temporarily. three returned to homelessness.
P. 100, last line - seems incomplete - will do what?
"Finally, as discussed in the Chapter
4 of this Element, the Planning Department will. "
--
Igor A. Tregub Commissioner, City of Berkeley Zoning Adjustments Board | http://cityofberkeley.info/zoningadjustmentboard/ Vice Chair, City of Berkeley Housing Advisory Commission | http://tinyurl.com/HousingComm Vice Chair, Sierra Club San Francisco Bay Chapter | http://sfbay.sierraclub.org/ Bay Area Regional Council, Bend the Arc, a Jewish Partnership for Justice | http://bendthearc.us/region/bay-area/ Mobile | 510-295-8798 "The arc of history is long, but it bends towards justice." - Martin Luther King, Jr.

Recjcl.x!Paper
~ D EASTBAY <../..> MUNICIPAL UTILITY DISTRICT
February 18, 2015
Leslie Mendez, Associate Planner Planning and Development Department 2120 Milvia Street Berkeley, CA 94704
Re: Notice oflntent to Adopt a Negative Declaration for 2015-2023 Berkeley Housing Element
Dear Ms. Mendez:
East Bay Municipal Utility District (EBMUD) appreciates the opportunity to comment on the Negative Declaration for the 2015-2023 Berkeley Housing Element. EBMUD has the following comments.
WATER SERVICE
The City of Berkeley is served by 14 pressure zones with service: elevations between O and . 1,250 feet. Main extensions that may be required to serve any specific development to provide adequate domestic water supply, fire flows, and system redundancy will be at the project sponsors' expense. Pipeline and fire hydrant relocations and replacements due to modifications of existing streets, and off-site pipeline improvements, also at the project sponsors' expense, may be required depending on EBMUD metering requirements and fire flow requirements set by the local fire department. When the development plans are finalized, project sponsors for individual projects should contact EBMUD's New Business Office and request a water service estimate to determine costs and conditions of providing water s-ervice to the development. Engineering and installation of new and relocated pipelines and services require substantial lead time, which should be provided for in the project sponsors' development schedule.
Project sponsors should be aware that EBMUD will not inspect, install or maintain pipeline in contaminated soil or groundwater (if groundwater is present at any time during the year at the depth piping is to be installed) that must be handled as a hazardous waste or that may pose a health and safety risk to construction or maintenance personnel wearing Level D personal protective equipment. Nor will EBMUD install piping in areas where groundwater contaminant concentrations exceed specified limits for discharge to sanitary sewer systems or sewage treatment plants. Project sponsors for EBMUD services requiring excavation in contaminated areas must submit copies of existing information regarding soil and groundwater quality within or adjacent to the project boundary.
In addition, project sponsors must provide a legally sufficient, complete and specific written remedial plan establishing the methodology, planning and design of all necessary systems for the
375 ELEVENTH STREET . OAKLAND • CA 94607-4240 • TOLL FREE 1-866-40-EBMUD
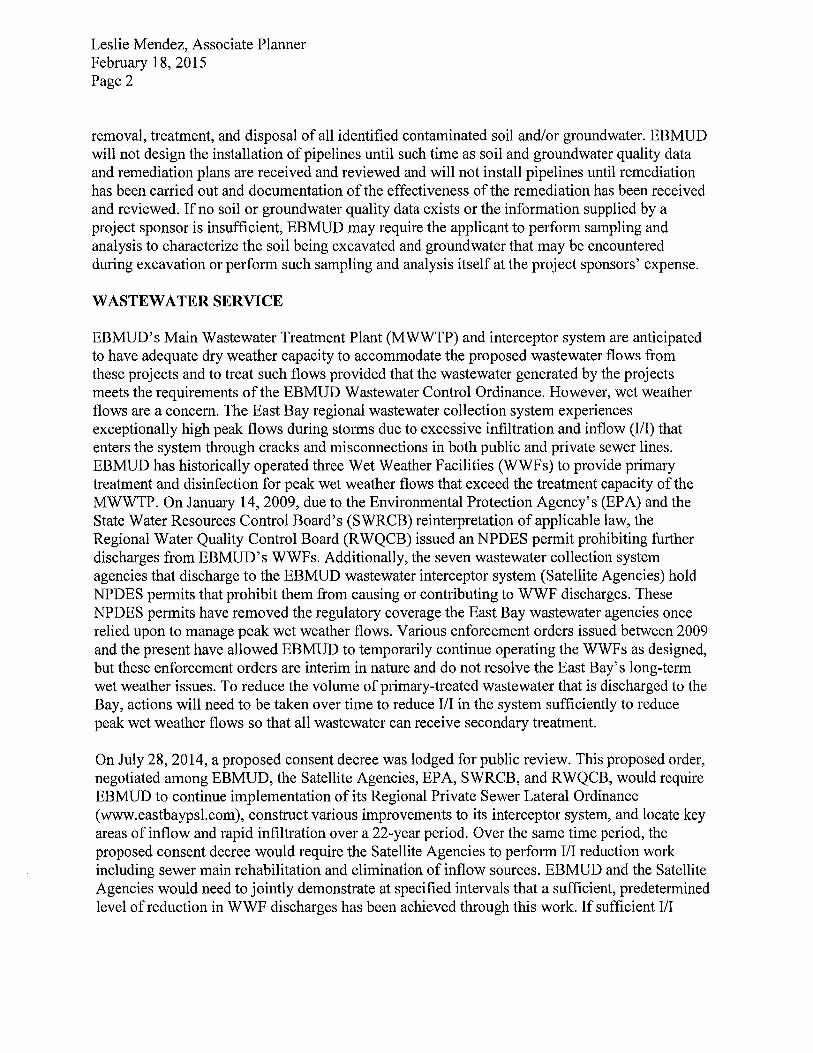
Leslie Mendez, Associate Planner February 18, 2015 Page2
removal, treatment, and disposal of all identified contaminated soil and/or groundwater. EBMUD will not design the installation of pipelines until such time as soil and groundwater quality data and remediation plans are received and reviewed and will not install pipelines until remediation has been carried out and documentation of the effectiveness of the remediation has been received and reviewed. If no soil or groundwater quality data exists or the information supplied by a project sponsor is insufficient, EBMUD may require the applicant to perform sampling and analysis to characterize the soil being excavated and groundwater that may be encountered during excavation or perform such sampling and analysis itself at the project sponsors' expense.
WASTEWATER SERVICE
EBMUD's Main Wastewater Treatment Plant (MWWTP) and interceptor system are anticipated to have adequate dry weather capacity to accommodate the proposed wastewater flows from these projects and to treat such flows provided that the wastewater generated by the projects meets the requirements of the EBMUD Wastewater Control Ordinance. However, wet weather flows are a concern. The East Bay regional wastewater collection system experiences exceptionally high peak flows during storms due to excessive infiltration and inflow (1/1) that enters the system through cracks and misconnections in both public and private sewer lines. EBMUD has historically operated three Wet Weather Facilities (WWFs) to provide primary treatment and disinfection for peak wet weather flows that exceed the treatment capacity of the MWWTP. On January 14, 2009, due to the Environmental Protection Agency's (EPA) and the State Water Resources Control Board's (SWRCB) reinterpretation of applicable law, the Regional Water Quality Control Board (RWQCB) issued an NPDES permit prohibiting further discharges from EBMUD's WWFs. Additionally, the seven wastewater collection system agencies that discharge to the EBMUD wastewater interceptor system (Satellite Agencies) hold NPDES permits that prohibit them from causing or contributing to WWF discharges. These NPDES permits have removed the regulatory coverage the East Bay wastewater agencies once relied upon to manage peak wet weather flows. Various enforcement orders issued between 2009 and the present have allowed EBMUD to temporarily continue operating the WWFs as designed, but these enforcement orders are interim in nature and do not resolve the East Bay's long-term wet weather issues. To reduce the volume of primary-treated wastewater that is discharged to the Bay, actions will need to be taken over time to reduce 1/1 in the system sufficiently to reduce peak wet weather flows so that all wastewater can receive secondary treatment.
On July 28, 2014, a proposed consent decree was lodged for public review. This proposed order, negotiated among EBMUD, the Satellite Agencies, EPA, SWRCB, and RWQCB, would require EBMUD to continue implementation of its Regional Private Sewer Lateral Ordinance (www.eastbaypsl.com), construct various improvements to its interceptor system, and locate key areas of inflow and rapid infiltration over a 22-year period. Over the same time period, the proposed consent decree would require the Satellite Agencies to perform I/I reduction work including sewer main rehabilitation and elimination of inflow sources. EBMUD and the Satellite Agencies would need to jointly demonstrate at specified intervals that a sufficient, predetermined level of reduction in WWF discharges has been achieved through this work. If sufficient 1/1

Leslie Mendez, Associate Planner February 18, 2015 Page 3
reductions are not achieved, additional investment into the region's wastewater infrastructure would be required, which may result in significant financial implications for East Bay residents.
As stated, EBMUD's NPDES permit for the WWFs prohibits discharges. If the consent decree is adopted as anticipated, it will require a demonstration of continuous improvement in reducing the volume of discharges over time. Meeting these legal requirements will require 1/1 reduction, which in turn requires sewer main and sewer lateral repair. To ensure that the proposed projects contribute to these legally required 1/1 reductions, the lead agency should require the project sponsors to comply with EBMUD's Regional Private Sewer Lateral Ordinance. Additionally, it would be prudent for the lead agency to require the following mitigation measures for the proposed projects: (1) replace or rehabilitate any existing sanitary sewer collection systems, including sewer lateral lines, to ensure that such systems and lines are free from defects or, alternatively, disconnected from the sanitary sewer system, and (2) ensure any new wastewater collection systems, including sewer lateral lines, for the projects are constructed to prevent 1/1 to the maximum extent feasible while meeting all requirements contained in the Regional Private Sewer Lateral Ordinance and applicable municipal codes or Satellite Agency ordinances.
WATER CONSERVATION
Individual developments within the Housing Element present opportunities to incorporate water conservation measures. EBMUD requests that the City of Berkeley include in its conditions of approval a requirement that the project sponsors comply with the California Model Water Efficient Landscape Ordinance (Division 2, Title 23, California Code of Regulations, Chapter 2.7, Sections 490 through 495). Project sponsors should be aware that Section 31 of EBMUD's Water Service Regulations requires that water service shall not be furnished for new or expanded service unless all the applicable water-efficiency measures described in the regulation are installed at the project sponsors' expense.
If you have any questions concerning this response, please contact Timothy McGowan, Associate Civil Engineer, Water Service Planning at (510) 287-1981.
Sincerely,
David J. Rehnstrom Manager of Water Distribution Planning
DJR:TRM:dks sbl5 031

STA TE OF CALIFORNIA-CALIFORNIA ST ATE TRANSPORTATION AGENCY EDMUND G . BROWN Jr. Governor
DEPARTMENT OF TRANSPORTATION DISTRICT4 P.O. BOX 23660 OAKLAND, CA 94623-0660
REC~IVED PHONE (510) 286-5528 Serious Drought. Help save water! FAX (510) 286-5559
TTY 711 www.dot.ca.gov MAR ~ 2 2fii5
March 5, 2015
Ms. Leslie Mendez Planning Division City of Berkeley 2120 Milvia Street
· Berkeley, CA 94 704
Dear Ms. Mendez:
2015 - 2023 Housing Element Update - Negative Declaration
ALAGEN264 ALA-GEN-PM VAR SCH# 2015022021
Thank you for including the California Department of Transportation (Cal~rans) in the environmental review process for the project referenced above. We have reviewed the Negative' Declaration and have the following comments to offer.
Lead Agency As the lead agency, the City of Berkeley (City) is responsible for all project mitigation, including any needed improvements to State highways. The project's fair share contribution, financing, scheduling, implementation responsibilities and lead agency monitoring should be fully discussed for all proposed mitigation measures. Required roadway improvements should be completed prior to issuance of the Certificate of Occupancy.
Mitigation to State Facilities Although the Housing Element Update will not result in any specific development projects, to ensure project and cumulative traffic impacts are mitigated, the Negative Declaration should identify transportation related impact fees used for mitigation to State facilities that are impacted by future development.
At such time of individual project review, the City should work with Caltrans to develop cooperative agreements where the City agrees to rnake a fair-share payment towards improvements of nearby State facilities that the applicable agencies agree to implement in a timely manner. The scheduling and costs associated with planned improvements on Caltrans right-of-way (ROW) should be listed, in addition to identifying viable funding sources correlated to the pace of improvements for roadway improvements, if any. Consider the regionally funded traffic improvements identified in the Alameda County ·Transportation Commission's 2014 Transportation Expenditure Plan including the Gilman Street and State Route 13 (Ashby
"Provide a safe, sustainable, integrated and efficient transportation system to enhance California 's economy and livability "

Ms. Leslie Mendez, City of Berkeley March 5, 2015 Page2
Avenue) Interstate 80 Interchange Improvements and Improvements on major commute corridors such as State Route 13, and State Route 123 (San Pablo Avenue), among others.
Vehicle Trip Reduction Caltrans encourages locating any needed housing, jobs and neighborhood services near major mass transit centers, with connecting streets configured to facilitate walking and biking, as a means of promoting mass transit use and reducing regional vehicle miles traveled and traffic impacts on the State highways.
Consider Transportation Demand Management policies to encourage usage of nearby public transit lines and reduce vehicle trips on the State Highway System (SHS). These policies could include lower parking ratios, car-sharing programs, bicycle parking, and providing transit passes to residents, among others. For information about parking ratios, see the Metropolitan Transportation Commission (MTC) report Reforming Parking Policies to Support Smart Growth or visit the MTC parking webpage: http://www.mtc.ca:gov/planning/smart_growth/parking.
CEQA Streamlining We encourage the City to coordinate early with Caltrans on any infill project proposals near State transportation facilities to enable consideration of the potential site specific traffic impacts and ensure appropriate mitigation. Even if cumulative impacts were addressed in a prior environmental clearance document there may be direct impacts of concern with a proposal. A CEQA exemption is still an adequate environmental clearance as long as mitigation of direct project impacts is included as part of the project. If a project does not qualify for streamlining provisions under SB 375 regarding traffic impact analysis, Caltrans requests a Traffic Impact Study to assess the impact of this project on the SHS and the adjacent road network. We recommend using Caltrans' Guide for the Preparation of Traffic Impact Studies for determining which scenarios and methodologies to use in the analysis available at the following website: http://www.dot.ca.gov/hq/tpp/offices/ocp/igr_ceqa_files/tisguide.pdf.
Encroachment Permit Please be advised that any work or traffic control that encroaches onto the State ROW requires an encroachment permit that is issued by Caltrans. Traffic-related mitigation measures should be incorporated into the construction plans prior to the encroachment permit process. To apply, a completed encroachment permit application, environmental documentation, and five (5) sets of plans clearly indicating State ROW must be submitted to the following address: David Salladay, District Office Chief, Office of Permits, California Department of Transportation, District 4, P.O. Box 23660, Oakland, CA 94623-0660. See the following website for more information: http://www.dot.ca.gov/hq/traffops/ developserv/permits.
"Provide a safe, sustainable, integrated and efficient transportation system to enhance California's economy and livability"

Ms. Leslie Mendez, City of Berkeley March 5, 2015 Page 3
Should you have any questions regarding this letter, please call Sherie George at 510-286-5535 or [email protected].
Sincerely,
PATRICIA MAURICE Acting District Branch Chief Local Development - Intergovernmental Review
c: State Clearinghouse
"Provide a safe, sustainable, integrated and efficient transportation system to enhance California 's economy and livability "