
UC Berkeley - CORE
84
UC Berkeley UC Berkeley Electronic Theses and Dissertations Title Working in Dangerous Times: The Effect of Shift Work on Worker Health in the American Manufacturing Cohort Permalink https://escholarship.org/uc/item/5c21x4w8 Author Ferguson, Jacqueline Marie Publication Date 2019 Peer reviewed|Thesis/dissertation eScholarship.org Powered by the California Digital Library University of California
-
Upload
khangminh22 -
Category
Documents
-
view
1 -
download
0
Transcript of UC Berkeley - CORE
UC BerkeleyUC Berkeley Electronic Theses and Dissertations
TitleWorking in Dangerous Times: The Effect of Shift Work on Worker Health in the American Manufacturing Cohort
Permalinkhttps://escholarship.org/uc/item/5c21x4w8
AuthorFerguson, Jacqueline Marie
Publication Date2019 Peer reviewed|Thesis/dissertation
eScholarship.org Powered by the California Digital LibraryUniversity of California

Working in Dangerous Times: The Effect of Shift Work on Worker Health in the American Manufacturing Cohort
By
Jacqueline M Ferguson
A dissertation submitted in partial satisfaction of the
requirements for the degree of
Doctor of Philosophy
in
Environmental Health Sciences
in the
Graduate Division
of the
University of California, Berkeley
Committee in charge:
Professor Ellen A. Eisen, Chair Professor John R. Balmes
Professor Patrick T. Bradshaw Dr. Sadie Costello
Fall 2019
Working in Dangerous Times: The Effect of Shift Work on Worker Health in the American Manufacturing Cohort
Copyright 2019
by
Jacqueline M Ferguson

1
Abstract
Working in Dangerous Times: The Effect of Shift Work on Worker Health in the American Manufacturing Cohort
by
Jacqueline Marie Ferguson
Doctor of Philosophy in Environmental Health Sciences
University of California, Berkeley
Professor Ellen A. Eisen, Chair
This dissertation focuses on assessing the effect of shift work on worker health, specifically identifying and evaluating selected working time characteristics as risk factors for incident hypertension and Type II diabetes mellitus. Shift work is a common occupational exposure across many sectors of the economy with a prevalence of near 20% of the US workforce. Shift work has also been consistently associated with many adverse health outcomes, including cancer. While most research has focused on the associations of night shift work and female breast cancer, recent evidence suggests that shift work may also cause an increased risk of reproductive disorders, gastrointestinal ulcers and cancers, prostate cancer, hypertension and Type II diabetes. In order to protect worker’s health while maintaining the efficiency of 24-hour work, it is important to identify the potentially harmful characteristics of shift work. In chapter 1 we discuss definitions for shift work and present current hypotheses for how shift work impacts human health. We also discuss the challenges facing environmental health scientists and epidemiologists as they define and characterize a complex exposure, such as shift work. An effective assessment of the impact of shift work on human health is dependent on development of metrics of shift work that are designed to capture the biological impact of shift work, rather than workplace schedule variation. In chapter 2 we develop and characterize the prevalence of selected working hour characteristics that may impact circadian rhythms in the American Manufacturing Cohort. In this first description of shift work in a US manufacturing workforce, we demonstrate that working hour characteristics such as shift type, duration, intensity, rotational direction, and social aspects of work need to be considered concurrently. Furthermore, these working hour characteristics vary by annual shift schedule. We identify, as expected, that permanent day workers have the lowest percentage of quick returns and rotations (as a permanent schedule would imply). However, working the day shift does not provide absolute protection from potentially disruptive characteristics of working hours since long work hours, as well as quick returns and rotations occurred when workers switched from morning to afternoon shifts (both considered day work). Notably, we also demonstrate that older workers are more likely to work permanent day schedules, while racial minorities such as African American workers are more likely to perform work with rotations. In chapter 3 we present an analysis examining the impact of recent night and rotation work exposure and risk of hypertension. We apply the same definitions of night and rotational work described in chapter 2, and present evidence that combinations of recent night and rotational work increase the risk of hypertension. In particular, we identify higher risk of

2
hypertension among all levels of recent night work compared with non-night workers. The highest risk of hypertension were among those with 95-100% night work, workers who would normally be considered ‘permanent night workers’. This suggests that permanent night workers are experiencing circadian rhythm disruption even though their work schedules are not rotating. Furthermore, we observe elevated hazard ratios for all combinations of night and rotational work compared to non-night workers. In particular, the hazard ratio was almost 4-fold for workers with mostly night work and frequent rotations compared with non-night workers. Even those workers with mostly non-night work and infrequent rotations had a 2-fold risk of hypertension, indicating the potential importance of recent shift work and hypertension risk. In chapter 4 we analyzed the association between cumulative months of night work and average percentage of night shifts over follow-up using Cox proportional hazard models. The results from the Cox proportional hazard models provide some modest evidence that night work exposure may be associated with an increased risk of diabetes. This association was seen when night work exposure is classified as either the cumulative number of months of night work or the average percentage of night shifts over follow-up. Chapter 5 concludes the dissertation with a summary of the results from each chapter, the strengths and limitations of the current work, and a discussion of the next steps in shift work research.
i
I have a feeling that in the end, probably, training is the answer to a great many things. You can do a lot if you’re properly trained.
– Queen Elizabeth II, 1992
This dissertation is dedicated to the friends, colleagues, family, and loved ones who have helped, encouraged, and supported me along the way.
ii
Contents
List of Figures…………………………………………………………………………………….v
List of Tables…………………………………………………………………………………….vi
Abbreviations……………………………………………………………………………….…..vii
Acknowledgements…………………………………………………………………………….viii
Chapter 1 Introduction.………...………………………………………………………………..1
1.1 Overview…………………………………………………………………………………..1
1.2 What is Shift Work?……………………………………………………………………….1
1.3 Hypotheses on Shift Work and Health………………………………..……………...……2
1.4 Shift Work, Hypertension and Diabetes………………………………..…………....…….3
1.5 The American Manufacturing Cohort………………………...…..……………………….3
1.6 Data Available in the American Manufacturing Cohort………………………...…..…….4
1.7 Shift Work Data Curation…………………………………………………………………4
1.8 Summary…………………………………………………………………………………..5
Chapter 2 Distribution of Working Hour Characteristics by Race, Age, Gender, and Shift Schedule in the American Manufacturing Cohort.…………...…....………… .18
2.1 Abstract…………………………………………………………………………………..18
2.2 Introduction……………………………………………………………………………....19
2.3 Methods…………………………………………………………………………………..20
2.3.1 Study Population………………………………………………….………………..20
2.3.2 Sources of Working Time & Data Quality…………………………….…………..20
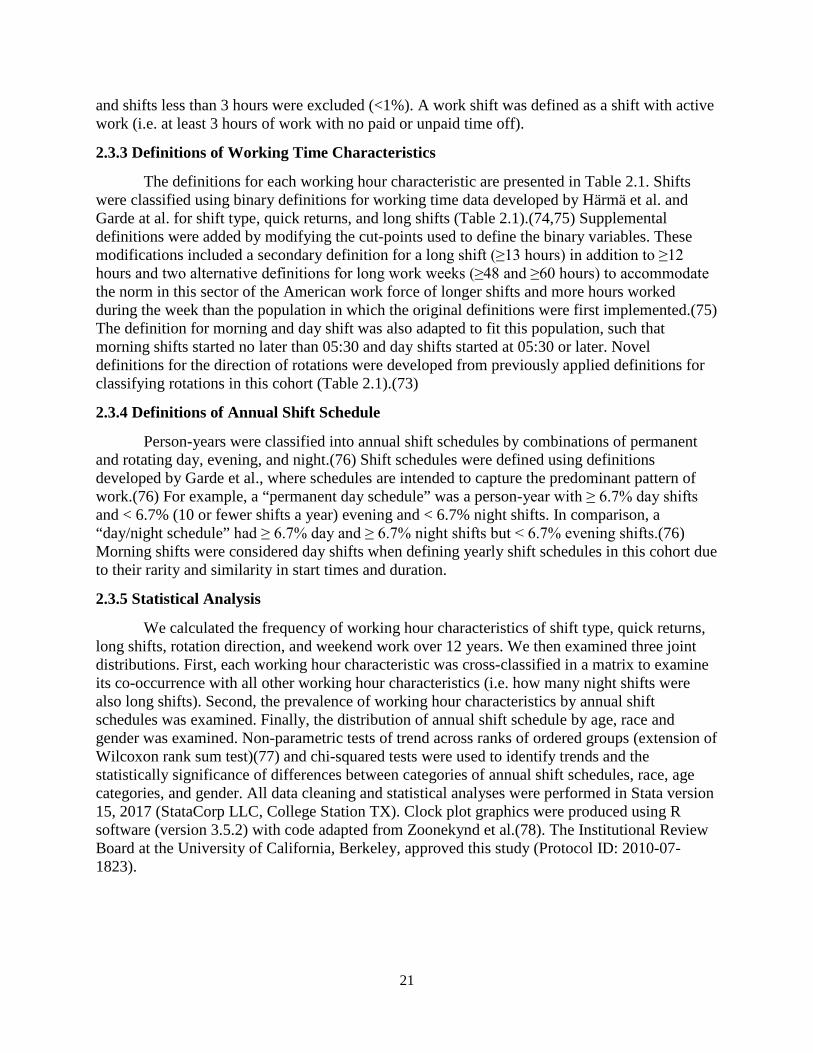
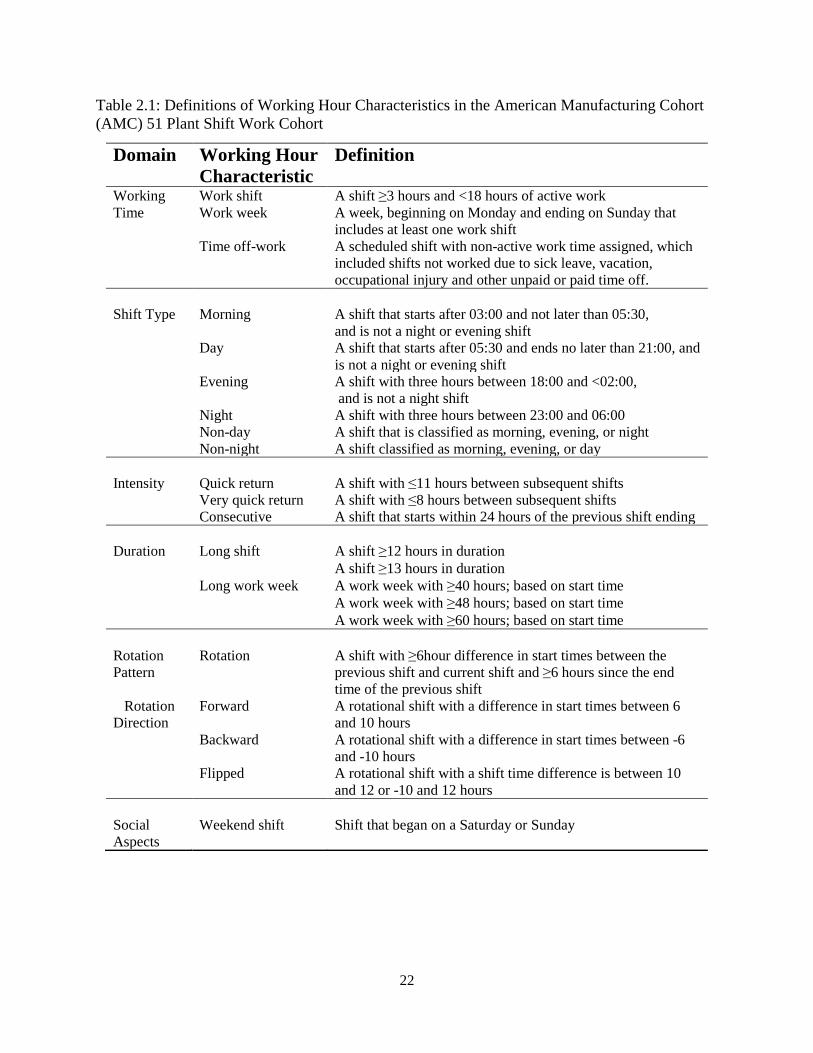
2.3.3 Definitions of Working Time Characteristics………………………….…………..21
2.3.4 Definitions of Annual Shift Schedule………………………………………….…..21
2.3.5 Statistical Analysis…………………………………………………………...…….21
2.4 Results…………………………………………………………………………………....23
2.4.1 Descriptive Statistics of Working Hour Characteristics in a Year………………....24
2.4.2 Co-occurrence of Working Hour Characteristics…………………………….….…26
2.4.3 Distribution of Working Hour Characteristics by Annual Shift Schedule………....26
iii
2.4.4 Distribution of Demographics by Annual Shift Schedule……………………....….29
2.5 Discussion…………………………………………………………………………….…..31
2.6 Conclusion…………………………………………………………………………....…..32
Chapter 3 Night and Rotational Work Exposure within the last 12 months and Risk of Incident Hypertension…………………………………….…………………..33
3.1 Preface……………………………………………………………………………………33
3.2 Abstract……………………………....…………………………………………………...33
3.3 Introduction………………………………………………………………………………33
3.4 Methods…………………………………………………………………………………..34
3.4.1 Study Population…………………………………………………………………...34
3.4.2 Night Work and Rotational Work Exposure…………………………………...…..35
3.4.3 Hypertension Outcome….………………………………………………………….36
3.4.4 Covariates………………………………………………………….…….………….36
3.4.5 Statistical Analysis…………………………………………………………………36
3.5 Results……………………………………………………………………………………37
3.6 Discussion………………………………………………………………………………..46
3.7 Postface…………………………………………………………………………………..47
Chapter 4 Duration or Intensity: Cumulative Number and Average Percentage of Night Work Exposure Over Time and Risk of Diabetes………………………….…..48
4.1 Preface……………………………………………………………………………………48
4.2 Abstract…………………………………………………………………………………..49
4.3 Introduction………………………………………………………………………………49
4.4 Methods…………………………………………………………………………………..50
4.4.1 Study Population…………………………………………………………………...50
4.4.2 Cumulative Night Work Exposures………………………………………………..50
4.4.3 Diabetes Outcome………………………………………………………………….51
4.4.4 Covariates……………………………………………………………………….….51
4.4.5 Statistical Analysis…………………………………………………………………52
4.6 Results……………………………………………………………………………………53
4.7 Discussion………………………………………………………………………………..56

iv
4.8 Conclusion………………………………………………………………………….…….58
Chapter 5 Conclusions………………………………………………………………………….59
5.1 Summary…………………………………………………………………………………59
5.2 Strengths and Significance……………………………………………………………….59
5.3 Limitations………………………………………………………………………………..60
5.4 Next Steps in Shift Work Research……………………………………………………....60
Bibliography……………………………………………………………………………………..61
v
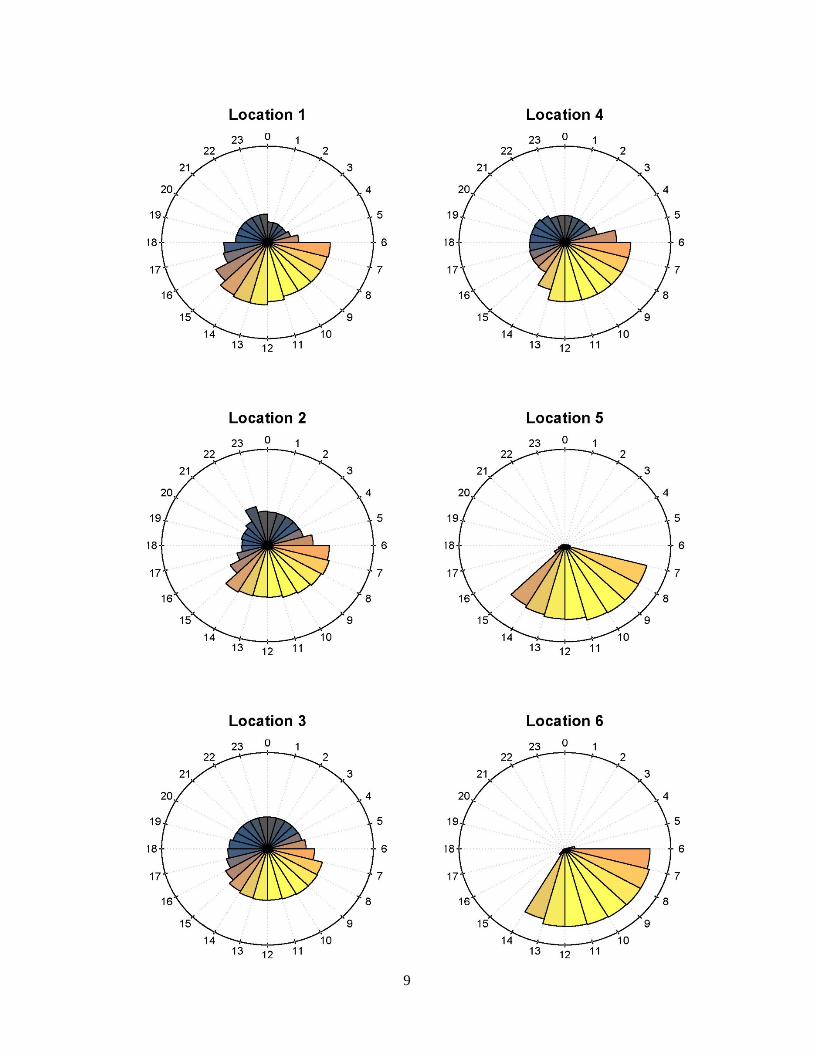
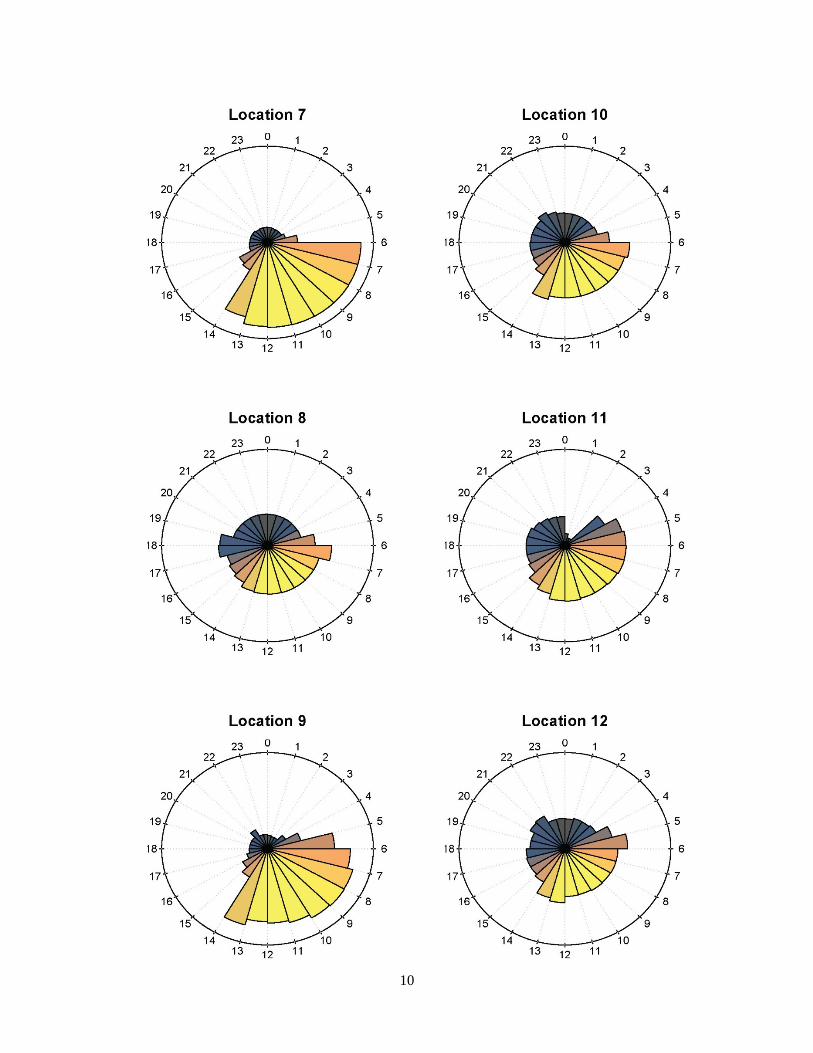
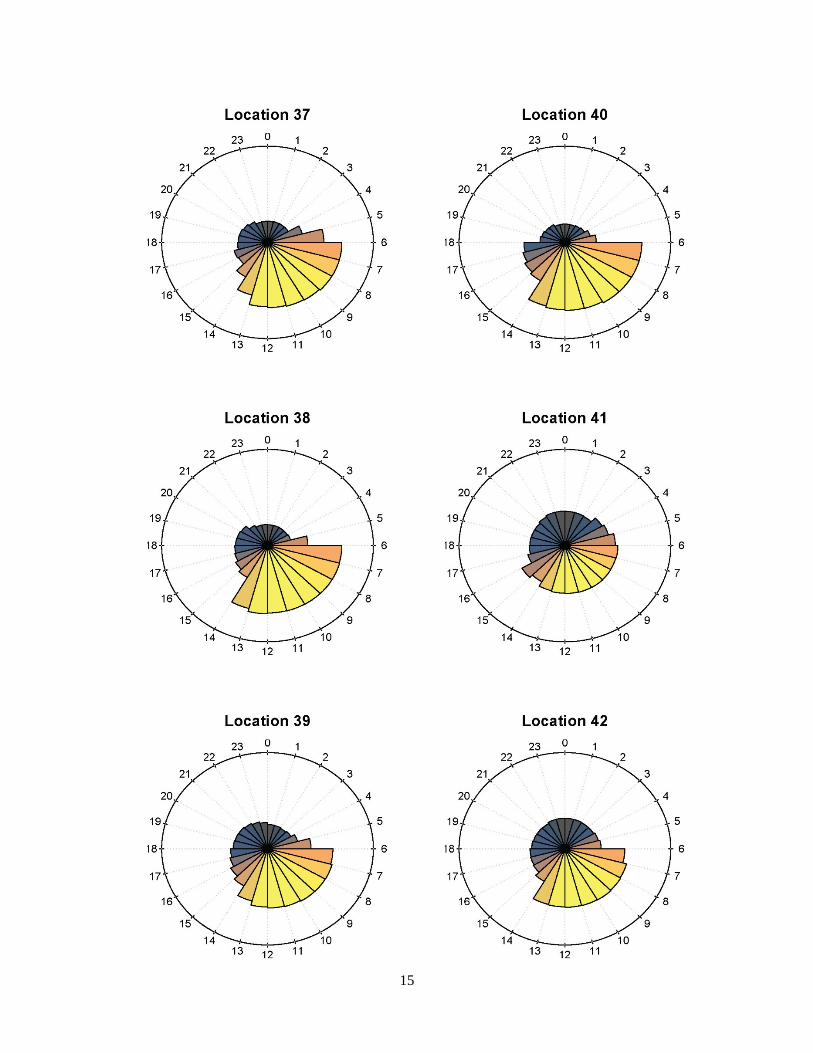
List of Figures 1.1 Proportion of Worker-hours by Hour in a 24-hour Clock: Stratified by Location in
the American Manufacturing Cohort (AMC) 54 plant cohort 2003-2014, USA (N=28, 331 persons)……………..………………………………………………………… .…8
2.1 Proportion of Worker-hours by Hour in a 24-hour Clock: Stratified by Shift Type in the American Manufacturing Cohort (AMC) 51 plant cohort 2003-2014, USA (N= 98,771 person-years)……………………………………………………………......... ....24
2.2 Distribution of Annual Shift Schedule by Age in the American Manufacturing Cohort; 51 Plant Sub-Cohort 2003-2014, USA (N= 98,771 person-years)……………….…29
3.1 Distribution of Shift Start Times by Plant Location American Manufacturing Cohort (AMC) 8 plant sub-cohort 2003-2013, USA .……………………………………………… ..39
3.2 Distribution of person-months with night work in the previous year; restricted to
months with at least one night shift in the previous year, American Manufacturing Cohort, 8 plant sub-cohort 2003-2013, USA……………………………………..………….40
3.3 Distribution of person-months with rotational work in the previous year; restricted to months with at least one rotation in the previous year, American Manufacturing Cohort (AMC) 8 plant sub-cohort 2003-2013, USA…………………………...……..……..40
3.4 Scatter plot of average monthly percentage of night and rotational work in the first
year of follow-up (N=2,151), American Manufacturing Cohort (AMC) 8 plant sub- cohort 2003-2013, USA………………………………………………………………...……41
.
vi
List of Tables
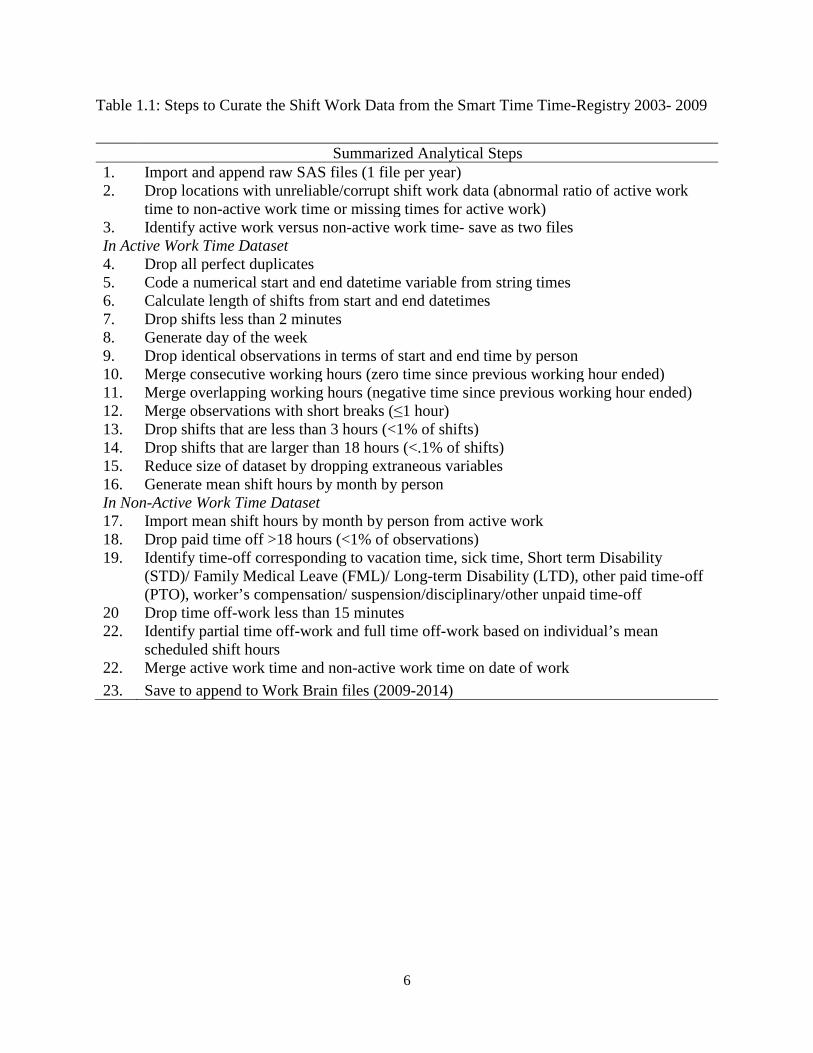
1.1 Steps to Curate the Shift Work Data from the Smart Time Time-Registry 2003- 2009..….… .6
1.2 Steps to Curate the Shift Work Data from the Work Brain Time-Registry 2009-2014….…... .7
2.1 Definitions of Working Hour Characteristics in the American Manufacturing Cohort (AMC) 51 Plant Shift Work Cohort………………………………………………………….22
2.2 Demographic Characteristics in the American Manufacturing Cohort (AMC) 51 Plant Shift Work Cohort 2003-2014 USA……………………………………………………..…...23
2.3 Descriptive Statistics of Yearly Counts of Working Hour Characteristics Across all Person-Years ≥150 shifts/year in the American Manufacturing Cohort (AMC) 51 Plant Shift Work Cohort 2003-2014, USA (N= 98,771 person-years)………………………25
2.4 Joint Distributions (%) of Working Hour Characteristics in American Manufacturing Cohort (AMC) 51 Plant Shift Work Cohort 2003-2014, USA (N shifts=22,443,533)…………………………………………………………………….….27
2.5 Percentage of Shifts in a Year by each Working Hour Characteristic Stratified by Person-year Shift Schedules in the American Manufacturing Cohort (AMC) 51 plant cohort 2003-2014, USA (N= 98,771 person-years)………………………………………….28
2.6 Demographic Characteristics by Annual Shift Schedule in the American Manufacturing Cohort (AMC) 51 Plant Shift Work Cohort 2003-2014, (N= 98,771 person-years)………………………………………………………………...…..30
3.1 Baseline characteristics of the American Manufacturing Cohort Eight plant sub-cohort 2003-2013, USA at Cohort Entry (N=2,151)………………………………….....38
3.2 Hazard Ratios for Incident Hypertension and Recent Exposure to Night Work and Rotational Work.………………………………………………………………………...43
3.3 Hazard Ratios for Incident Hypertension and Combinations of Recent Exposure to Night Work and Rotational Work…………………………………………………………....44
3.4 Hazard Ratios for Incident Hypertension and Exposure to Recent Night Work Defined using Two Alternative Definitions………………………………………………….45
4.1 Demographic Characteristics in a subset of the American Manufacturing Cohort (AMC) Shift Work Cohort 2003-2014 USA (N=3,947)…………………………………..…53
4.2 Distribution of Night Work Exposure Metrics and Demographic Characteristics in a subset of the American Manufacturing Cohort (AMC) Shift Work Cohort 2003-2014 USA,(N=3,947)………………………………………………………………………….…...54
4.3 Hazard Ratios for Incident Diabetes and Accumulated Night Work Exposure in a subset of the American Manufacturing Cohort (AMC) Shift Work Cohort 2003-2014 USA, N=3,947………………………………………………………………………….…….55

vii
Abbreviations
AMC American Manufacturing Cohort CDC Centers for Disease Control BMI Body Mass Index FML Family Medical Leave HR Hazard Ratio HDL High Density Lipoprotein HWSE Healthy Worker Survivor Effect IARC International Agency for Research on Cancer IPTW Inverse Probability Treatment Weighting JEM Job Exposure Matrix LTD Long-term Disability mmHg Millimeters of Mercury OR Odds ratio OSHA Occupational Safety and Health Administration PTO Paid time-off PM2.5 Particulate matter smaller than 2.5μm in aero-diameter SCN Suprachiasmatic nuclei STD Short-term Disability
viii
Acknowledgements Research is rarely conducted in a vacuum and this dissertation is certainly no exception. I am fortunate to be surrounded by incredibly smart and supportive people.
Thank you to Ellen Eisen and Sadie Costello for your guidance, encouragement, honesty, and humor. Thank you for the many opportunities you have given me, especially those that served as a catalyst for my career in occupational health research. I will always be grateful for Ellen’s candid encouragement to attend an international conference on epidemiology in occupational health when I was a first year PhD student with no research to present. Ellen, thank you for your leap of faith, and for introducing me to my newfound scientific family. A special thank you to Sadie for including me in the exploratory data analysis project that became my dissertation research. I am grateful to you both for the insightful questions which encouraged me to think deeper as well as your reminders not to go too deep down the rabbit hole.
Thank you to my dissertation committee members, Patrick Bradshaw and John Balmes, for your advice, patience, and kindness in framing this research. I also want to thank the members of the American Manufacturing Cohort (AMC) research teams, including Sally Picciotto, Andreas Neophytou, Liza Lutzker, Erika Tribett, Kathy Hammond, Betsey Noth, and many more. Sally and Andreas, it has been a delight to travel the world with you. Thank you to Mark Cullen for your mentorship and wisdom, and always reminding us that each data-point we work with represents a person’s life and should be treated with respect.
I also want to acknowledge the Centers for Occupational and Environmental Health (COEH) as well as the National Institute for Health (NIH) and the National Institute for Occupational Health and Safety (NIOSH) for providing the financial support for my education. Without this support, this research would have remained a task too formidable to complete.
On a more personal note, thank you to my fiancé Pritesh, with his endless encouragements to breathe and to take on each problem one step at a time. Thank you for reminding me of the world beyond my dissertation and ensuring that I got to see it.
Thank you to my friends, those old and new, for your encouragements, shared frustrations, and your sympathies whenever the data misbehaved. Tomás, Graham, and Suzanne, thank you for your friendship and for sharing your knowledge with me. A special shout out to Keelin Martinek for her tireless enthusiasm and ever-present willingness to go to war for me.
I owe a great debt to my mother Lois and my father Riccardo, who have always been there for me and always encouraged each and every passion of mine, no matter how frivolous. Mom, thank you so much for never failing to ensure I had what I needed to succeed, even at great personal sacrifice. Dad, thank you for finding that magical place of father and friend where the best advice is given. Thank you both for your support and love in achieving this great goal.
Thank you to all for being a part of this adventure to the brink of genius and back again.

1
Chapter 1 Introduction 1.1 Overview
This dissertation focuses on assessing the association of shift work on human health and comprises five chapters. In this overview (chapter 1), we define shift work and present hypotheses for how shift work impacts human health. We also present a brief introduction to the study population, a subset of the American Manufacturing Cohort, and the data curation process. In chapter 2, we present the first description in a manufacturing cohort of the prevalence and co-occurrence of working time characteristics that may lead to circadian rhythm disruption: shift type, intensity, duration, rotational pattern, and weekend work. We also highlight differences in the distribution of these working hour characteristics by race, age, gender, and by annual shift schedule (e.g. permanent day vs. rotating day/night). In chapter 3, we explore the associations between recent night work, rotational work, combinations of the two, and the risk of incident hypertension. Sensitivity analyses included alternative definitions for night work as well as analyses with multiple imputation to account for missing data on important confounders such as body mass index (BMI) and smoking status. In chapter 4, we examine the relationship between long-term exposure to night work and incident diabetes risk. Chapter 5 concludes the dissertation with a summary of the results from each chapter, the strengths and limitations of the current work, and a discussion of the next steps in shift work research.
1.2 What is Shift Work? Shift work is essential to our modern 24-hour society and has been utilized for over a century. Scheduling work in shift systems was originally implemented for factory and assembly workplaces to operate longer than the hours feasible for individual workers; allowing for the highest return to investment.(1,2) Today, shift work has expanded beyond manufacturing to service industries such as healthcare and food service.(1) In order to meet the needs and demands of a 24-hour society, between 6 and 30% of laborers in European countries and 20% in the US work alternate shifts.(1,3) While nearly a fifth of the working population is thought to be exposed to shift work, there is no clear or uniform definition for what comprises ‘shift work’.(4) The term ‘shift work’ is commonly used to refer to any arrangement of daily work that occurs outside of standard work hours of (7/8am to 5/6pm).(1,4) Generally, shift work in the manufacturing sector is organized in 2-3 shifts, corresponding to either two 12-hour shifts (day vs. night) or three eight-hour shifts (morning vs. afternoon/swing vs. night shifts). However, to suit each workplace’s staffing needs, each industry designs personalized shift work schedules. These individualized and often complex schedules complicate shift work exposure assessment across industries.
2
1.3 Hypotheses on Shift work and Health Shift work is hypothesized to adversely affect human health through circadian rhythm disruption, where the body’s natural clock is advanced or delayed. Circadian rhythm disruption is characterized by a desynchronization of the suprachiasmatic nuclei (SCN), the master circadian clock located in the hypothalamus of the brain, with the 24-hour solar clock.(5–7) The SCN is calibrated to the external environment via light from the retinohypothalamaic tract and adjusts peripheral oscillators found in most human cells to the right phase through glucocorticoids, cytokines, neuropeptides and other clock proteins such as melatonin.(5,8–12) Cell proliferation and apoptosis, immune cell trafficking, and cycles of inflammation are controlled by the circadian rhythm. Under normal conditions, the SCN can adjust the peripheral oscillators to the right phase within several days following circadian rhythm phase shift.(10) Repeated circadian rhythm disruptions alter normal cellular processes which subsequently influences other physiological conditions through numerous direct and indirect pathways such as neuroendocrine stress and increased cortisol secretion.(4,11–14) Circadian rhythm disruption also may cause extended sleep deprivation as the body tries to adjust to the new schedule which may compound the effects of the circadian phase shift. Night and early morning shift workers self-report an average reduction in sleep length of 1-2 hours which increases the risk of sleep deprivation.(15,16) Sleep deprivation is additionally associated with adverse health outcomes such as subsequent obesity, type II diabetes mellitus, hypertension, metabolic syndrome, and cardiac mortality.(15,17,26,18–25) Due to the lack of circadian rhythm biomarkers, the direct relationships between circadian disruption and sleep deprivation and health cannot be measured. In lab studies, melatonin, cortisol, and body-temperature are used as proxies for circadian rhythm disruption, often in murine models.(27) Unfortunately, they must be measured 24/7 and have high-levels of individual variability which makes them poor candidates for cohort studies.(27) Instead, for epidemiological studies, the aspects of shift work that may cause circadian rhythm disruption must be classified by their potential circadian impacts.(19) However, to date, the exposure classification for shift work in epidemiological studies is limited due to simplistic exposure metrics and retrospective self-reported data to classify shift work. As a result, it is unclear which components of working time are associated with excess risk. Despite limited exposure metrics, shift work has been consistently linked to adverse health outcomes, in particular female breast cancer. In 2007, the International Agency for Research on Cancer (IARC) classified ‘shift work that involves circadian disruption’ as a Group 2A probable human carcinogen. In 2019, IARC reconvened and confirmed the Group 2A classification while redefining the exposure of shift work to ‘night shift work’ following a large influx of epidemiological studies examining night work and breast cancer.(28) While most research has focused on the associations of night shift work and breast cancer, recent evidence suggests that night shift work may also cause an increase in the risk of cardiovascular disease, reproductive disorders, gastrointestinal ulcers and cancers, prostate cancer, hypertension and Type II diabetes.(10,29–37)

3
1.4 Shift Work, Hypertension and Diabetes
This dissertation primarily focuses on the health outcomes of hypertension and Type II diabetes mellitus due to their rising global burden, largely modifiable risk factors, and frequency as a reported chronic health issues in shift workers.(38,39) Hypertension and diabetes are also two separate diagnostic components of metabolic syndrome, a cluster of atherosclerotic risk factors including abdominal obesity, high blood pressure, high triglycerides, low high-density lipoprotein cholesterol (HDL-C), and elevated fasting glucose.(40) Individuals with metabolic syndrome are in a constant pro-thrombotic state and pro-inflammatory state and may have a higher risk of cancer, cardiovascular morbidity and mortality.(40–43) Hypertension, commonly referred to as high blood pressure, is classified by the Centers for Disease Control (CDC) as a systolic blood pressure of 140mmHg or higher or a diastolic blood pressure of 90mmHg or higher.(44) A more conservative definition by the American Heart Association defines high blood pressure as a systolic blood pressure of 130mmHg or higher or a diastolic blood pressure of 80mmHG or higher.(45) In a recent meta-analysis of nine cohort studies examining hypertension, shift workers had a pooled odds ratio of hypertension of 1.31 (95% CI, 1.07-1.60) compared to day workers.(39) The association among 18 cross-sectional studies in the meta-analysis was slightly weaker (Odds Ratio (OR) =1.10 (95% CI, 1.00- 1.20)).(39) Three additional cross-sectional studies detected a similar elevated risk of hypertension among shift or night workers.(46–48) Type II diabetes mellitus is characterized by chronically high blood glucose levels resulting from defects in insulin secretion, insulin action, or both.(49,50) In the context of metabolic syndrome, the primary driver for diabetes is developed insulin resistance. Another recent meta-analysis identified an adjusted OR for the association between ever-exposed to shift work and diabetes mellitus of 1.09 (95% CI 1.05- 1.12) as well as a higher risk among rotating workers compared to day workers (1.42, 95% CI 1.19-1.69) and men compared with women (1.37, 95% CI 1.20-1.56).(51) A major limitation of the existing literature is the lack of detail regarding shift work exposure. Most studies classify shift work into dichotomous metrics of night work vs. day work or rotational work vs. non-rotational work due to self-reported and low definition data sources such as questionnaires. These general classifications limit our understanding of which components of shift work are responsible for increased risk of hypertension and diabetes. In order to understand the etiological effect of shift work on human health, future studies need to examine the impact of specific quantitative components of shift work such as night and rotational work and their associations on hypertension and diabetes.
1.5 The American Manufacturing Cohort
To understand the distribution of working time characteristics of shift work and to examine the association between shift work, hypertension and diabetes, this research employed daily working-hour data from a cohort of light metal manufacturing workers, the American Manufacturing Cohort (AMC).(52) The entire AMC cohort includes over 250,000 hourly and salaried workers with follow-up from 1992 to 2014 at more than 100 plants, representing geographically diverse regions of the country.(52) A total of 28,331 active hourly workers in 54 plants were included in the shift work sub-cohort of AMC as they had their daily working time recorded in daily time-registries used to calculate payroll.(52) Shift workers were employed between 2003 and 2014 and performed blue-collar work (i.e. jobs requiring manual labor) in smelters, refineries and fabrication and included
4
tasks such as anode assembly operator, sheet finishing, pack/ship operator, casting, autoclaving, and electrical or mechanical maintenance.(53) All the plants operated with either two 12-hour shifts or three 8-hour shifts. The majority of the plants operated 24-hours 7 days a week; however, three plants had a day shift of either 8 or 12 hours but no night shift. As seen in the location specific clock plots of Figure 1.1 where each sector of the clock represents the number of worker hours present by hour, the 24-hour plants staffed fewer workers at night compared to day. However, the presence of night workers varied by location from a skeleton staff to a modest 10% reduction in workforce at night. Of note, two locations actually had a higher number of worker hours during night hours than day (Location 22 and 43).
1.6 Data Available in the American Manufacturing Cohort
The AMC cohort benefits from a wealth of data which includes administrative data documenting work experience and exposure, health claims, daily time-registries, and extensive socio-demographic data. Detailed information on work environment and demographics was ascertained from employment records and company personnel files. This included information regarding hire date, length of employment, insurance enrollment date, plant location, and job grade. Baseline covariates such as sex, age, marital status, and education as well as time-varying covariates including BMI, and smoking status were obtained from periodic clinic visits and Occupational Health and Safety Administration (OSHA) mandated examinations such as respirator fit tests. These clinic records were maintained only for active workers resulting in missing data for BMI and smoking among the workers who were not active (already terminated or yet to be hired) on the date that the records were pulled. Incident diagnoses of hypertension and Type II diabetes mellitus were defined using medical insurance claims for inpatient and outpatient procedure codes as well as prescription claims over the 12-year follow-up period as defined previously.(54–56) Insurance records also provide an annual risk-score that is designed to predict future health expenditures. We use it as a proxy metric for health status.(54–56) Risk score is an annual time-varying continuous variable derived from insurance company’s algorithms and standardized such that a score of 1 indicates the individual’s predicted health expenditures are expected to fall at the mean. Each one unit increase in annual risk score predicts a one-fold increase in expenditures above the mean.(57) Although annual estimates of fine particulate matter (PM2.5) exposure derived from a job-exposure matrix (JEM) were available for a subset of shift workers, we did not adjust for PM2.5.(53,58) The JEM contains variation in PM2.5 measurement by job type and does not vary by shifts (e.g. day vs. night).(53) While particulate matter may be an important confounder of shift work and health, the time-of-day time-invariant nature of the existing PM2.5 JEM did not allow for effective confounding control. Therefore, our analyses of the association of shift work and health may be impacted by residual confounding from PM2.5.
1.7 Shift Work Data Curation Exposure assessment of shift work was based on two real-time human resource databases that include shift time and attendance tracking modules from 2003 to 2014. The SmartTime dataset contained data from 2003 to 2009 and the WorkBrain dataset contained data from 2009 to 2014. Although there were plants in both datasets, some plants existed only in one or the other, which curtailed the available follow-up time for workers at those plants. The data included details on start/end times of every billable hour (including time at work and time off-work such
5
as time off-work due to injuries covered by worker’s compensation insurance, sick leave, and vacation) and their associated pay codes (surcharges due to night work, overtime, call-in, etc.). A rigorous process of data cleaning, auditing, and post-processing was implemented as detailed in Tables 1.1 and 1.2. Data were assessed for missing values, exact duplicates, inconsistent duplicates, and implausible values.(59) For example, in the raw data, a worker could have 5-25 data rows representing one shift due to meal breaks, hourly billing surcharges (e.g. surcharge for night work or overtime), and cross-departmental positions, as every change in billing (pay or department to bill) produced another row with its own start and end time. Data for each shift were compressed into one row, keeping the earliest starting time and/or the latest ending time, similar to the procedure detailed by Härmä et al.(59,60) Data cleaning involved removing duplicate records due to overtime pay and surcharges. Data cleaning also involved identifying non-work hours (e.g. sick leave, vacation pay). Any shifts over 18 hours (<1%) were removed from the dataset, as they likely represented on-call shifts where employees were allowed to sleep, which could result in a potential circadian disruption outside the purview of this research. Shifts with less than 1 hour between them were considered one continuous shift because short gaps between billable hours were overwhelmingly associated with meal breaks. Shifts with total time less than 3 hours were excluded from the analysis (<1%). These shifts were identified as being mostly administrative billing artifacts that did not represent actual time at work. A small percentage of the shifts less than 3 hours were union or training meetings which did require time at work. Future analyses can consider the potential impact of excluding these short shifts from analysis.
1.8 Summary In this chapter, we described what type of work constitutes shift work, as well as presented hypotheses for the biological mechanisms by which shift work impacts human health. We also presented a brief introduction to the subset of the AMC with shift work data, and the shift work data curation process. In chapter 2, we further define shift work by defining selected ‘working hour characteristics’ to classify specific components of work, such as night work or long hours, which may be relevant for worker health.
6
Table 1.1: Steps to Curate the Shift Work Data from the Smart Time Time-Registry 2003- 2009
Summarized Analytical Steps 1. Import and append raw SAS files (1 file per year) 2. Drop locations with unreliable/corrupt shift work data (abnormal ratio of active work
time to non-active work time or missing times for active work) 3. Identify active work versus non-active work time- save as two files In Active Work Time Dataset 4. Drop all perfect duplicates 5. Code a numerical start and end datetime variable from string times 6. Calculate length of shifts from start and end datetimes 7. Drop shifts less than 2 minutes 8. Generate day of the week 9. Drop identical observations in terms of start and end time by person 10. Merge consecutive working hours (zero time since previous working hour ended) 11. Merge overlapping working hours (negative time since previous working hour ended) 12. Merge observations with short breaks (≤1 hour) 13. Drop shifts that are less than 3 hours (<1% of shifts) 14. Drop shifts that are larger than 18 hours (<.1% of shifts) 15. Reduce size of dataset by dropping extraneous variables 16. Generate mean shift hours by month by person In Non-Active Work Time Dataset 17. Import mean shift hours by month by person from active work 18. Drop paid time off >18 hours (<1% of observations) 19. Identify time-off corresponding to vacation time, sick time, Short term Disability
(STD)/ Family Medical Leave (FML)/ Long-term Disability (LTD), other paid time-off (PTO), worker’s compensation/ suspension/disciplinary/other unpaid time-off
20 Drop time off-work less than 15 minutes 22. Identify partial time off-work and full time off-work based on individual’s mean
scheduled shift hours 22. Merge active work time and non-active work time on date of work 23. Save to append to Work Brain files (2009-2014)

7
Table 1.2: Steps to Curate the Shift Work Data from the Work Brain Time-Registry 2009-2014
Summarized Analytical Steps 1. Import and append raw SAS files (1 file per year) 2. Drop locations with unreliable/corrupt shift work data (abnormal ratio of active work
time to non-active work time or missing times for active work) 3. Drop observations with no start or end time 4. identify premium times (overtime, premium surcharge, call-in) 5. Create a numerical start and end datetime variable from time and date components 6. Drop active shifts with less working hours than 2 minutes 7. Generate day of week 8. Save two files- active work versus non-active work time In Active Work Time Dataset 9. Drop identical observations in terms of start and end time by person 10. Merge consecutive working hours (zero time since previous working hour ended) 11. Merge overlapping working hours (negative time since previous working hour ended) 12. Merge observations with short breaks (≤1 hour) 13. Drop shifts that are less than 3 hours (<1% of shifts) 14. Drop shifts that are larger than 18 hours (<.1% of shifts) 15. Reduce size of dataset by dropping extraneous variables 16. Generate mean shift hours in by month by person In Non-Active Work Time Dataset 17. Import mean shift hours by month by person from active work 18. Identify time-off corresponding to vacation time, sick time, Short term Disability
(STD)/ Family Medical Leave (FML)/ Long-term Disability (LTD), other paid time-off (PTO), worker’s compensation/ suspension/disciplinary/other unpaid time-off
19. Drop paid time off >18 hours (<1% of observations) 20. Identify partial time off-work and full time off-work based on individual’s mean
scheduled shift hours 21. Merge active work time and non-active work time on date of work 22. Save to append to Smart Time Files (2003-2009) 23. Append Smart Time and Work Brain datasets together (Smart Brain) 24. Drop redundant variables 25. Reconcile dates with disability leave data
Assume end dates in disability leave > end dates in SmartTime years Assume end dates in Smart Time years> missing end dates in disability Assume Work Brain > disability leave with missing end dates No disability leaves with reported end dates past 2009
26. Save as Smart Brain All Years Dataset

8
Figure 1.1: Proportion of Worker-hours by Hour in a 24-hour Clock: Stratified by Location in the American Manufacturing Cohort (AMC) 54 Plant Cohort 2003-2014, USA (N=28, 331 persons). Radius of clock plot represents 10% of all shifts in plot for all locations except Location 5, 6, and
16 where the radius represents 15% of all shifts in the plot. Shading reflects proximity to solar noon (yellow) and midnight (black).
9
10

11

12

13

14
15

16

17

18
Chapter 2 Distribution of Working Hour Characteristics by Race, Age, Gender, and Shift Schedule in the American Manufacturing Cohort 2.1 Abstract
Shift work is a common occupational exposure across many sectors of the economy with a prevalence of near 20% of the US workforce. However, there is little information on the prevalence of specific working hour characteristics beyond the generic classification of ‘shift work’. Using daily time-registry data we present the first description in a manufacturing cohort of the prevalence and co-occurrence of working time characteristics that may lead to circadian rhythm disruption: shift type, intensity, duration, rotational pattern, and weekend work. We also describe the distribution of these working hour characteristics by race, age, gender, and by annual shift schedule (e.g. permanent day vs. rotating day/night). In a subset of the American Manufacturing cohort of 23,044 workers at 51 plants, we estimated the prevalence of selected working hour characteristics defined as shift type (e.g. morning, day, night), duration (e.g. shift ≥13 hours), intensity (e.g. quick return (<11 hours between shifts) and consecutive work), rotational direction (e.g. forward, backward, flipped), and social aspects of work (e.g. weekend work). Distributions of working hour characteristics were cross-classified in a matrix to estimate the probabilities of co-occurrence. We then classified the annual shift schedule for each subject by combinations of permanent and rotating day, evening, and night. Finally, the distribution of annual shift schedules were examined by race, age, and gender. Shifts were classified into morning (5.5%), day (50.2%), evening (16.2%), and night (28.1%). Approximately 60% of shifts were potentially disruptive to circadian rhythms, including non-day shifts or day shifts with a quick return, shifts with a rotation, or shifts 13 hours or longer. Approximately 48% of person-years were spent in a non-rotating schedule: day (32%), night (11%), evening (4%), day/evening (11%), day/night (25%), evening/night (4%) and day/evening/night (13%). Men were more likely to work rotational schedules (54.9% vs. 41.4%) while women were more likely to work permanent nights (15% vs 11%). White workers worked a permanent day schedule most often, and racial minorities worked more day/night rotating schedules. Older workers worked more permanent day and fewer day/evening/night schedules. Permanent day schedules had the fewest number of adverse working hour characteristics, such as quick returns, long shifts, and rotations, while rotational schedules such as day/evening/night and day/night had the highest. In this first description of working hour characteristics in a US manufacturing workforce,

19
we found that younger workers, male workers, and racial minorities were working more rotating shifts. We also identified disparities in working hour characteristics by annual shift schedule that may be important if combinations of working hour characteristics have more than an additive impact on circadian rhythm disruption.
2.2 Introduction
Shift work continues to be an important occupational exposure with a prevalence of near 20% of the US workforce(1,3,61) Shift work has been associated with increased risk of cardiovascular disease, hypertension, breast cancer, and psychological and mental health disorders.(39,62–64) However, the term ‘shift work’ is often vaguely defined and generically used to describe any non-standard work schedule that have one or more of characteristics such as occurring at night, changing start times (rotational work), or long hours.(1) Long working hours and night work appear to be risk factors for cardiovascular disease, accidents at work,(65,66) cancer,(63) diabetes,(38,51,67–69) and metabolic syndrome.(70–72) Yet, definitions of these characteristics of shift work are not standardized or well described across working populations. Moreover, few studies have examined aspects of shift work beyond night work and long hours, such as rotational pattern or weekend work, which may also contribute to increased risks of adverse health outcomes. To clarify adverse aspects of shift work and improve exposure classification, more specific definitions of shift work have recently been proposed - referred to as ‘working hour characteristics’.(4) These ‘working hour characteristics’ classify specific components of work, such as night work or long hours, which may be relevant for worker health. Working hour characteristics were categorized into large ‘domains’ of interest defined by the International Agency for Research on Cancer Working Group in 2009 following their 2007 classification of ‘shift work that involves circadian rhythm disruption as a probable human carcinogen’.(1,4) While many domains were identified in the IARC report, five key domains of interest are 1) Shift type, 2) Duration, 3) Intensity, 4) Rotational Pattern, and 5) Social aspects of working time; with each containing several working hour characteristics.(1,4) These five domains are described as follows: The shift type domain contains working hour characteristics of morning, day, evening, and night shifts. These working hour characteristics are defined by starting time and duration, to estimate displacement from solar day and the resulting circadian phase shift. While the impact of night shifts on human health have been studied extensively,(39,63) shifts with start times in early morning or evening may be equally disruptive to circadian rhythms, while day shifts are presumed to have a no impact.(60) The duration domain characterizes the length of shift, workday, or work weeks in order to capture the displacement of normal sleeping times. Longer shifts may reduce recovery time between working periods which impacts the speed at which a worker entrains their circadian rhythm to solar day.(4) The intensity domain contains working hour characteristics such as quick returns, which are designed to capture reduced recovery time between working periods, while the rotational direction domain contains working hour characteristics like the frequency and direction of rotation. By capturing rotation frequency, we hope to estimate the effect of repeat circadian rhythm phase shifts.(1,4) The rotational direction domain distinguishes clockwise/forward rotating (morning to afternoon to night shift) from counter clockwise/backward rotating (night to afternoon to
20
morning shift). The last domain, social aspects of working time, includes working hour characteristics such as weekend work which are critical for maintaining regularity of household and family tasks.(1) Previous studies suggest working hours which combine multiple characteristics, such as night work and rotating shifts, may confer multiplicative or more than additive increases in risk of adverse health outcomes.(1,73) However, evidence is limited as the co-occurrence of the different characteristics among a worker population have not been examined; as cohort studies to date are not well suited to classify more than one domain due to lower resolution data sources such as surveys.(60) The goal of this study was to operationalize these domains for the first time in a US occupational cohort using daily administrative time clock data. In this report we identify the co-occurrence of different working hour characteristics classified by domains of shift type, duration, intensity, rotation pattern, and social aspects of working time in a large cohort of light metal manufacturing workers. We also identify potential social disparities in exposures potentially related to circadian rhythm disruption by describing the distribution of working hour characteristics by demographics and annual shift schedules.
2.3 Methods 2.3.1 Study Population
The subset of the American Manufacturing Cohort (AMC) population eligible for this analysis includes 28,331 active hourly workers with time-registry data.(52) Workers were employed between 2003 and 2014 and performed blue-collar work (i.e. jobs requiring manual labor) in smelters, refineries and fabrication and included tasks such as anode assembly operator, sheet finishing, pack/ship operator, casting, autoclaving, and electrical or mechanical maintenance.(53) Information on employee demographics and employment histories were obtained from company personnel files, employment records, and insurance claims. Workers were employed in 54 plants; 51 of which operated 24 hours a day, 7 days a week. To evaluate the distribution of work time patterns among full time employees, the study population was limited to employees working more than 150 work days a year (N=23,095) and excluded 5,236 part-time workers. Plants with fewer than 50 employees were excluded (N=3 plants, 51 workers). The final study population was 23,044 workers with over 22.4 million shifts at 51 plants.
2.3.2 Sources of Working Time & Data Quality
Daily working hour data retrieved from two time-registry systems (SmartTime 2003-2009 and WorkBrain 2009-2014) were used to calculate hours worked from January 1st 2003 through the end of 2014. The data include details on start and end times of every billable hour and their associated pay codes (surcharges due to night shifts, overtime hours, call-in work, etc.) and whether each shift was worked or not due to sick time/paid time off, vacation, or unexcused absence. Data were assessed for missing values, exact duplicates, inconsistent duplicates, and implausible values following previously described time-oriented data cleaning taxonomies.(59) Consecutive working hours with less than one hour between them were considered one continuous shift as short gaps between billable hours were overwhelmingly associated with meal breaks. Data were compressed into one row keeping the earliest starting time and/or the latest ending time, similar to the procedure detailed by Härmä et al.(59,60) Shifts over 18 hours (<1%)
21
and shifts less than 3 hours were excluded (<1%). A work shift was defined as a shift with active work (i.e. at least 3 hours of work with no paid or unpaid time off).
2.3.3 Definitions of Working Time Characteristics
The definitions for each working hour characteristic are presented in Table 2.1. Shifts were classified using binary definitions for working time data developed by Härmä et al. and Garde at al. for shift type, quick returns, and long shifts (Table 2.1).(74,75) Supplemental definitions were added by modifying the cut-points used to define the binary variables. These modifications included a secondary definition for a long shift (≥13 hours) in addition to ≥12 hours and two alternative definitions for long work weeks (≥48 and ≥60 hours) to accommodate the norm in this sector of the American work force of longer shifts and more hours worked during the week than the population in which the original definitions were first implemented.(75) The definition for morning and day shift was also adapted to fit this population, such that morning shifts started no later than 05:30 and day shifts started at 05:30 or later. Novel definitions for the direction of rotations were developed from previously applied definitions for classifying rotations in this cohort (Table 2.1).(73)
2.3.4 Definitions of Annual Shift Schedule
Person-years were classified into annual shift schedules by combinations of permanent and rotating day, evening, and night.(76) Shift schedules were defined using definitions developed by Garde et al., where schedules are intended to capture the predominant pattern of work.(76) For example, a “permanent day schedule” was a person-year with ≥ 6.7% day shifts and < 6.7% (10 or fewer shifts a year) evening and < 6.7% night shifts. In comparison, a “day/night schedule” had ≥ 6.7% day and ≥ 6.7% night shifts but < 6.7% evening shifts.(76) Morning shifts were considered day shifts when defining yearly shift schedules in this cohort due to their rarity and similarity in start times and duration.
2.3.5 Statistical Analysis
We calculated the frequency of working hour characteristics of shift type, quick returns, long shifts, rotation direction, and weekend work over 12 years. We then examined three joint distributions. First, each working hour characteristic was cross-classified in a matrix to examine its co-occurrence with all other working hour characteristics (i.e. how many night shifts were also long shifts). Second, the prevalence of working hour characteristics by annual shift schedules was examined. Finally, the distribution of annual shift schedule by age, race and gender was examined. Non-parametric tests of trend across ranks of ordered groups (extension of Wilcoxon rank sum test)(77) and chi-squared tests were used to identify trends and the statistically significance of differences between categories of annual shift schedules, race, age categories, and gender. All data cleaning and statistical analyses were performed in Stata version 15, 2017 (StataCorp LLC, College Station TX). Clock plot graphics were produced using R software (version 3.5.2) with code adapted from Zoonekynd et al.(78). The Institutional Review Board at the University of California, Berkeley, approved this study (Protocol ID: 2010-07-1823).
22
Table 2.1: Definitions of Working Hour Characteristics in the American Manufacturing Cohort (AMC) 51 Plant Shift Work Cohort
Domain Working Hour Characteristic
Definition
Working Time
Work shift A shift ≥3 hours and <18 hours of active work Work week A week, beginning on Monday and ending on Sunday that
includes at least one work shift Time off-work A scheduled shift with non-active work time assigned, which
included shifts not worked due to sick leave, vacation, occupational injury and other unpaid or paid time off.
Shift Type Morning A shift that starts after 03:00 and not later than 05:30,
and is not a night or evening shift Day A shift that starts after 05:30 and ends no later than 21:00, and
is not a night or evening shift Evening A shift with three hours between 18:00 and <02:00,
and is not a night shift Night A shift with three hours between 23:00 and 06:00 Non-day A shift that is classified as morning, evening, or night Non-night A shift classified as morning, evening, or day
Intensity Quick return A shift with ≤11 hours between subsequent shifts Very quick return A shift with ≤8 hours between subsequent shifts Consecutive A shift that starts within 24 hours of the previous shift ending Duration Long shift A shift ≥12 hours in duration
A shift ≥13 hours in duration Long work week A work week with ≥40 hours; based on start time
A work week with ≥48 hours; based on start time A work week with ≥60 hours; based on start time
Rotation Pattern
Rotation A shift with ≥6hour difference in start times between the previous shift and current shift and ≥6 hours since the end time of the previous shift
Rotation Direction
Forward A rotational shift with a difference in start times between 6 and 10 hours
Backward A rotational shift with a difference in start times between -6 and -10 hours
Flipped A rotational shift with a shift time difference is between 10 and 12 or -10 and 12 hours
Social Aspects
Weekend shift Shift that began on a Saturday or Sunday

23
2.4 Results
This study population from the AMC includes 23,044 eligible workers (Table 2.2) with over 22.4 million shifts worked and over 2.5 million records of shifts not worked (time off). While the cohort comprised mostly white men between ages 30-60 years old, 25% of the cohort was non-white and the most common minority was Black/African American (14% of persons). Of the 51 plants in the cohort, only seven were followed for the full 12 years. The mean length of follow-up across locations was four years. Due to the change in time-registry systems in 2009 and the acquisition of new plants, the distribution of plants and employees changed over the course of the study period. On average, for each year between 2003-2008, roughly 7,000 workers were employed in 30 plants. In 2009, the year of transition between the two time-registry systems, only 4,183 were employed in 17 plants, but between 2010 and 2014, on average 10,500 workers were employed across 31 plants, representing new plant acquisitions.
Table 2.2: Demographic Characteristics in the American Manufacturing Cohort (AMC) 51 Plant Shift Work Cohort 2003-2014 USA
At Cohort Entry Person-years N %
All persons 23,044 100 98,771 Sex Male 18,888 81.6 82,830 Female 4.244 18.4 15,941 Race White (Not Hispanic or Latino) 17,383 75.4 77,203 Hispanic or Latino 1,759 7.6 6,085 Black or African American (Not Hispanic or Latino) 3,212 13.9 13,091 American Indian or Alaska Native 162 0.7 625 Asian/Native Hawaiian/Other Pacific Islander 418 1.81 1,417 Multi-racial (Not Hispanic or Latino)/ Unknown 110 0.48 350 Age 18-20 145 0.63 166 20-<30 3,339 14.5 8,298 30-<40 4,887 21.2 18,001 40-<50 6,669 28.9 27,865 50-<60 6,831 29.6 36,549 60-<70 1,147 5.0 7,691 70+ 26 0.11 201
24
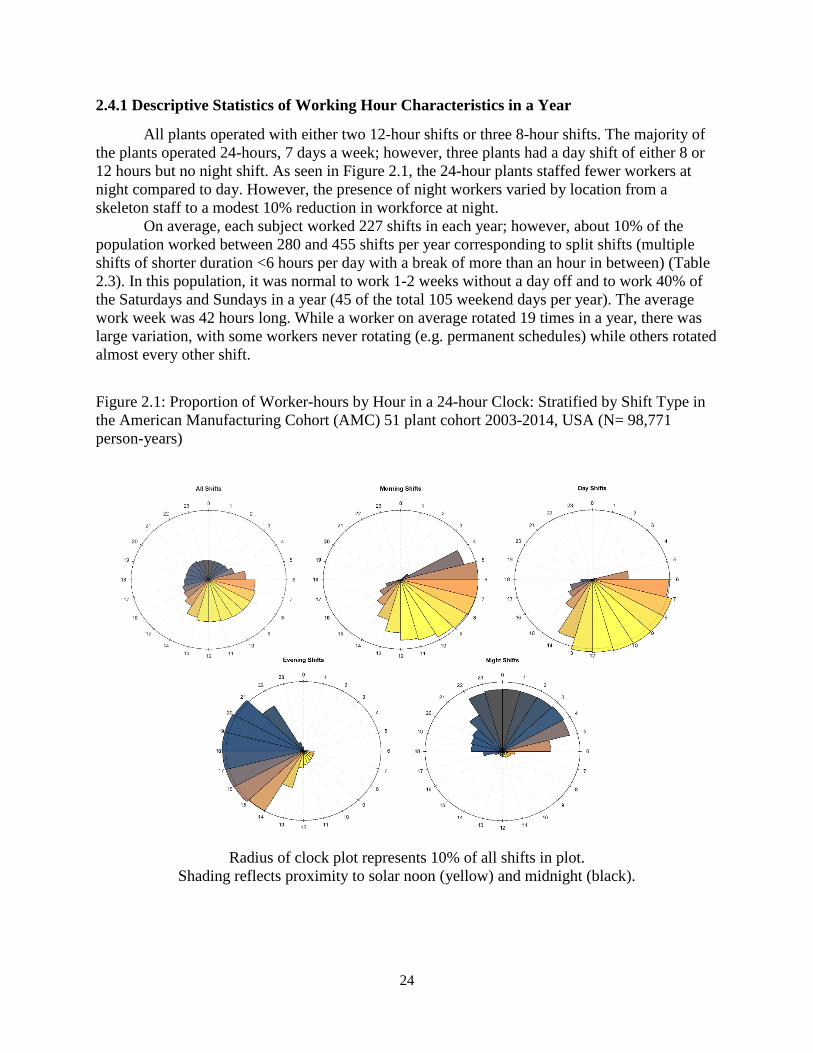
2.4.1 Descriptive Statistics of Working Hour Characteristics in a Year
All plants operated with either two 12-hour shifts or three 8-hour shifts. The majority of the plants operated 24-hours, 7 days a week; however, three plants had a day shift of either 8 or 12 hours but no night shift. As seen in Figure 2.1, the 24-hour plants staffed fewer workers at night compared to day. However, the presence of night workers varied by location from a skeleton staff to a modest 10% reduction in workforce at night. On average, each subject worked 227 shifts in each year; however, about 10% of the population worked between 280 and 455 shifts per year corresponding to split shifts (multiple shifts of shorter duration <6 hours per day with a break of more than an hour in between) (Table 2.3). In this population, it was normal to work 1-2 weeks without a day off and to work 40% of the Saturdays and Sundays in a year (45 of the total 105 weekend days per year). The average work week was 42 hours long. While a worker on average rotated 19 times in a year, there was large variation, with some workers never rotating (e.g. permanent schedules) while others rotated almost every other shift.
Figure 2.1: Proportion of Worker-hours by Hour in a 24-hour Clock: Stratified by Shift Type in the American Manufacturing Cohort (AMC) 51 plant cohort 2003-2014, USA (N= 98,771 person-years)
Radius of clock plot represents 10% of all shifts in plot.
Shading reflects proximity to solar noon (yellow) and midnight (black).

25
Table 2.3: Descriptive Statistics of Yearly Counts of Working Hour Characteristics Across all Person-Years ≥150 shifts/year in the American Manufacturing Cohort (AMC) 51 Plant Shift Work Cohort 2003-2014, USA (N= 98,771 person-years)
Abbreviations: P25 25th Percentile, P75 75th Percentile, P90 90th Percentile. Refer to Table 2.1 for specific definitions for each working hour characteristic. *Max exceeds 365 days/year and 105 weekends per year due to split shifts (multiple shifts a day).
Domain Working hour characteristics
Counts per Person-Year Mean P25 Median P75 P90 Max*
Working Time
Work shift 227 192 230 256 280 455 Work week 51 51 52 52 53 53
Shift Type Morning 12 0 0 2 28 327
Day 114 24 97 195 235 442 Evening 37 0 3 36 156 345 Night 64 0 26 95 194 362 Non-day 113 21 97 191 243 393 Non-night 163 95 182 234 260 443
Shift Intensity
Quick return 12 0 2 13 38 368 Very quick return 4 0 0 2 10 214 Maximum number of consecutive shifts in a row
13 5 9 16 26 360
Shift Duration
Long shift ≥12 hours 68 4 38 145 174 285 ≥13 hours 13 0 1 14 43 239 Long work week ≥40 hour 31 24 32 40 44 52 ≥48 hours 19 8 18 28 36 52 ≥60 hours 6 0 2 9 18 51
Rotational Pattern
Any Rotation 19 0 6 39 53 201
Direction Forward 6 0 1 6 21 118 Backward 5 0 1 5 16 126 Flipped 8 0 0 2 43 82
Social Aspects
Weekend shift 41 21 45 56 70 125

26
2.4.2 Co-occurrence of Working Hour Characteristics
Shifts were classified into morning (5.5%), day (50.2%), evening (16.2%), and night (28.1%) (Table 2.4). Approximately 60% of shifts fall into categories that are hypothesized to cause circadian rhythm disruption, as they were non-day shifts or day shifts with quick returns, long shifts (≥13 hours) or shifts that include a rotation. Overall, the probability of co-occurrence between pairs of working hour characteristics varied substantially (Table 2.4). Among day shifts, 23.9% of shifts were 12 hours or longer, 6.2% included a rotation, and 3.6% were quick returns. Compared with day shifts, night shifts were more likely to be 12 hours or longer (48.2%), however, evening shifts were most often 13 hours or longer (13.6%). Night and evening shifts had the highest joint probability with any type of rotation, but nights were twice as likely to include a flipped rotation when compared with day (6.1% vs. 3.2%). Forward and flipped rotations rarely occurred with a quick return (<1%), while 62.1% of backward rotations coincided with a quick return (<11 hours between shifts), and 25.1% with a very quick return (<8 hours between shifts). Nearly all instances of quick returns co-occurred with the following conditions: a backwards rotation (11.6%), a shift longer than 12 hours (0.76%), the previous shift was longer than 12 hours (31.8%), or a combination of all three (50.2%). The remaining 6% of quick returns were attributable to a worker coming in earlier or staying later than normal but not with a large enough difference to cause a rotation or qualify as a long shift (i.e. a shift <12 hours long and starting <6 hours earlier). Working shifts longer than 12 hours was fairly common in this cohort (30%) and working shifts longer than 13 hours was relatively rare (5.6%). Compared with shifts shorter than 12 hours, shifts longer than 13 hours were 10 times more likely to also be shifts that rotate backwards (16.3% vs. 1.7%) and have a very quick return (12.2% vs. 1.4%). Weekend and weekday shifts had roughly the same joint probability with all working hour characteristics with the exception of shift length; weekend shifts were more often 12 hours or longer (40.5% vs. 27.7%). However, there was a negligible difference in the frequency of shifts 13 hours or longer (5.8% vs. 5.5%) among weekend and weekday shifts.
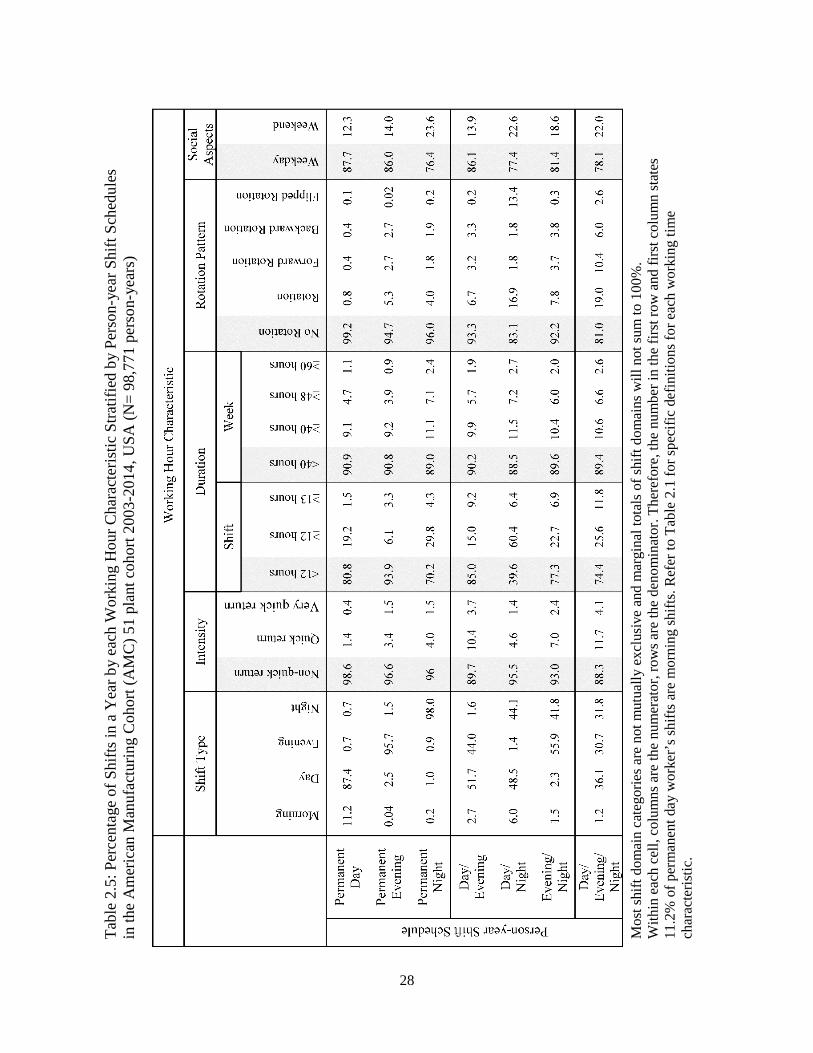
2.4.3 Distribution of Working Hour Characteristics by Annual Shift Schedule
Distributions of quick returns, shift length, rotations, and amount of time off-work varied by annual shift schedule as well (Table 2.5). Permanent day workers had the lowest percentage of quick returns, rotations and weekend work, as well as long shifts (≥13 hours) and long work (≥40 hours/week). Notably, day/evening and day/evening/night schedules had higher percentages of quick and very quick returns to work, as well as shifts 13 hours or longer. Additionally, day/evening/night shifts had the highest percentages of rotations (19%) followed by day/night schedules (16.9%). Shift duration, measured by length of hours per shift or week, fluctuated only slightly across annual shift schedules, with the exception of day/night schedules that had more 12 hour shifts than any other schedule.

27
Mos
t shi
ft do
mai
n ca
tego
ries a
re n
ot m
utua
lly e
xclu
sive
and
mar
gina
l tot
als o
f shi
ft do
mai
ns w
ill n
ot su
m to
100
%.
With
in e
ach
dom
ain,
col
umns
are
the
num
erat
or, r
ows a
re th
e de
nom
inat
or. T
here
fore
, the
num
ber i
n th
e fir
st ro
w a
nd fi
rst c
olum
n st
ates
5.
5% o
f all
shift
s are
mor
ning
shift
s. D
ashe
s (-)
are
used
whe
n th
e sh
ift d
omai
n de
finiti
ons a
re m
utua
lly e
xclu
sive
; to
refle
ct a
stru
ctur
al
zero
. Ref
er to
Tab
le 2
.1 fo
r spe
cific
def
initi
ons f
or e
ach
wor
king
tim
e ch
arac
teris
tic.
Tabl
e 2.
4: Jo
int D
istri
butio
ns (%
) of W
orki
ng H
our C
hara
cter
istic
s in
Am
eric
an M
anuf
actu
ring
Coh
ort (
AM
C)
51 P
lant
Shi
ft W
ork
Coh
ort 2
003-
2014
, USA
(N sh
ifts=
22,4
43,5
33)
28
Ta
ble
2.5:
Per
cent
age
of S
hifts
in a
Yea
r by
each
Wor
king
Hou
r Cha
ract
eris
tic S
tratif
ied
by P
erso
n-ye
ar S
hift
Sche
dule
s in
the
Am
eric
an M
anuf
actu
ring
Coh
ort (
AM
C) 5
1 pl
ant c
ohor
t 200
3-20
14, U
SA (N
= 98
,771
per
son-
year
s)
Mos
t shi
ft do
mai
n ca
tego
ries a
re n
ot m
utua
lly e
xclu
sive
and
mar
gina
l tot
als o
f shi
ft do
mai
ns w
ill n
ot su
m to
100
%.
With
in e
ach
cell,
col
umns
are
the
num
erat
or, r
ows a
re th
e de
nom
inat
or. T
here
fore
, the
num
ber i
n th
e fir
st ro
w a
nd fi
rst c
olum
n st
ates
11
.2%
of p
erm
anen
t day
wor
ker’
s shi
fts a
re m
orni
ng sh
ifts.
Ref
er to
Tab
le 2
.1 fo
r spe
cific
def
initi
ons f
or e
ach
wor
king
tim
e ch
arac
teris
tic.

29
2.4.4 Distribution of Demographics by Annual Shift Schedule
Approximately half of the workers in the AMC worked a rotational schedule, while the other half worked a permanent schedule each year (Table 2.6). The most common annual schedules were permanent day and rotating day/night. Differences in the distribution of annual schedules were identified by gender, race and age. Men were more likely to work rotational schedules than women (54.7% vs. 42.7% of person-years, chi squared p<0.1). Yet, more women worked permanent night schedules than men (15% vs. 11%). White workers worked permanent day shifts most often, while minorities including Black, Hispanic, or American Indian workers were more likely to work day/night schedules. A strong age trend was detected, as older workers were more likely to work permanent day shifts and less likely to work day/evening/night and day/night schedules compared with younger workers (Figure 2.2, Test for trend: p<0.1). The largest proportion of permanent night workers were 60 years of age or older.
Figure 2.2: Distribution of Annual Shift Schedule by Age in the American Manufacturing Cohort; 51 Plant Sub-Cohort 2003-2014, USA (N= 98,771 person-years)

30
Ta
ble
2.6:
Dem
ogra
phic
Cha
ract
eris
tics b
y A
nnua
l Shi
ft Sc
hedu
le in
the
Am
eric
an M
anuf
actu
ring
Coh
ort (
AM
C) 5
1 Pl
ant S
hift
Wor
k C
ohor
t 200
3-20
14, (
N=
98,7
71 p
erso
n-ye
ars)
31
2.5 Discussion
Our results provide evidence that working hour characteristics hypothesized to cause circadian rhythm disruption have a varying distribution across shift schedules and demographic characteristics. The day shift had the lowest co-occurrence with quick returns, long work hours or weeks, and rotations. However, working the day shift did not provide absolute protection from potentially disruptive characteristics of working hours since long work hours, as well as quick returns and rotations occurred when workers switched from morning to afternoon shifts (both considered day work). While the literature has primarily focused on the health impacts of night work, rotations, or long work, little attention has been paid to the co-occurrence of working time characteristics. In this cohort, night and evening shifts were more commonly associated with longer work hours, rotations, and quick returns. Thus, a cautious interpretation of the association between night work exposure and human health may be warranted, as the etiological circadian rhythm disruption, fatigue, or sleep deprivation may be caused in part by long work hours, rotations, or quick returns which may accompany night work. Additionally, we identified differences in the occurrence of specific patterns of rotation direction (forward, backward, or flipped) and shift type. Flipped rotations more often co-occurred with the 12-hour schedule of night/days whereas backward rotations were seen primarily with night shifts on an 8-hour schedule. Forward rotations occurred equally among day, night, and evening shifts. The direction of a rotation is important to consider because forward rotations may be less disruptive to the circadian system than backwards or flipped rotations.(4,14,79) Anecdotal evidence indicates that workers prefer forward rotation schedules over backwards rotation schedules, likely because forward rotation schedules allow a worker to ‘sleep-in’ rather than wake earlier.(4,14,79) Yet, little is known about the impact of forward versus backward rotations on health outcomes. The majority of quick returns and very quick returns are due to long shifts and rotations. However, a small fraction of quick returns is due to working a double shift. While working a double shift or long shift may be due to an unanticipated workforce shortage, some quick returns may be built into the shift system and represent a possible area of intervention. An unexpected finding was that the percentage of shift type, quick returns, and rotations varied minimally between weekday or weekend shifts in this population. This suggests that assessing the impact of weekend shifts may not be influenced by shift type, quick returns, or rotations in this population. As expected, working hour characteristics varied by annual shift schedule as well. Most notably, day/night and day/evening/night schedules had more rotations on average than the day/evening or evening/night schedules which might indicate a slower pattern of rotation among the later. While we assessed the average yearly percentage of rotations (i.e. number of rotations per year) and therefore did not directly assess speed of rotation (i.e. number of shifts between rotations), fast shift rotations which occur every 1- 3 days would correspond to an annual average of >33% rotations in a year, intermediate shift rotations would occur every week (~20% annual average), and slow would occur every 15-30 days or longer (~5-10% annual average).(4) Our results show that, on average, workers rotate about every 2 weeks, and workers on the day/night or day/evening/night schedules are rotating about every week. Slower patterns of rotations are hypothesized to have a smaller impact on the circadian system since slower speed corresponds with fewer rotations, allowing a worker to acclimatize their circadian system to the new schedule before the next rotation. However, recent literature suggests there might be some
32
benefit to a faster rotating system in which the worker switches start times too frequently for the circadian system to entrain itself to the new schedule.(14) Currently, it is still unclear if a constant state of circadian misalignment associated with fast rotations is better than disrupting it periodically with a slower rotation schedule.(80) Future work should more directly examine the frequency of rotations (e.g. times of high frequency of rotations followed by low frequency) and their co-occurrence with the characteristics of working hours. When assessing the differences in yearly shift schedules by race, age, and gender, our results indicated a strong age trend. Older workers are more likely to work a permanent day schedule, possibly due to seniority. Workers with seniority may be able to express shift schedule preferences. However, we have no information on the proportion of preferred shifts granted in this population. We also identified differences in the proportion of workers in permanent or rotational schedules by race and gender. Black/African American workers were the most likely to perform work with rotations, similar to the survey done by the Bureau of Labor Statistics in 2004.(3) The difference by race likely reflects differences in racial composition by job type, due to underlying social factors such as institutionalized racism and higher rates of poverty among racial minorities in America. Similar to other studies, we found that more women worked permanent shifts, including permanent day shifts compared to men.(1,3,81) This pattern might be because women tend to select the day shift more often due to child rearing and meal preparation duties during the evening and night.(65,81) Alternatively, a permanent schedule, even permanent nights, affords a predictability that makes arranging child-care easier.(65,81) Our study has a few limitations. First, while this study benefits from data captured in an administrative time-registry used to document worker’s hours for payroll calculation, the systems do not collect information on individual confounders outside of human-resource demographics. For example, we have no information regarding an individual’s chronotype or preference for working days or nights. Individual chronotype is just one of the many unmeasured confounders or effect measure modifiers that may affect both working hours and worker health.(1,82) Second, the results from this study may have limited generalizability as they describe employees at a single American firm in a single industry.(52) However there remains considerable diversity in this population despite being from one firm. Of the 51 plants in this subset of the AMC only 6 were unionized under the same union contract, 27 were unionized under local union contracts, and 18 were not unionized and were therefore governed under location-specific shift schedules. Despite these limitations, this study is the first to assess the joint probabilities of combinations of working hour characteristics. Furthermore, it the only description of working hour characteristics derived from objective time-registry data in the US and thus represents actual work time in an American manufacturing cohort.(52) This study also updates our understanding of disparities in annual shift schedules by race, gender, and age among American workers, that was last assessed by the Bureau of Labor Statistics in 2004 and briefly in a study of registered nurses in a correctional setting.(3,81)
2.6 Conclusion This research identified disparities in the joint distributions of working hour characteristics that may impact circadian rhythms by shift schedules, race, gender, and age. Younger, male, Hispanic or Black workers were disproportionately working rotational schedules, suggesting potential health disparities in the American Manufacturing Cohort. These patterns highlight the need to account for multiple working hour characteristics when assessing health outcomes in relation to working hour exposures.
33
Chapter 3 Night and Rotational Work Exposure within the last 12 months and Risk of Incident Hypertension
3.1 Preface
In this chapter, we present an analysis examining the impact of recent night and rotational work exposure and risk of incident hypertension. This work was published in the Scandinavian Journal of Work Environment and Health and is reproduced below.(73) Additional co-authors for this chapter beyond the dissertation committee include Andreas Neophytou and Mark Cullen.
3.2 Abstract
Shift work, such as alternating day and nights, causes chronobiologic disruptions which may cause an increase in hypertension risk. However, the relative contributions of the components of shift work, such as shift type (e.g. night work) and the rotations (i.e. switching of shift times; day to night), on this association are not clear. To address this question, we constructed novel definitions of night work and rotational work and assessed their associations with risk of incident hypertension. A cohort of 2,151 workers at eight aluminum manufacturing plants previously studied for cardiovascular disease was followed from 2003 through 2013 for incident hypertension, as defined by ICD-9 insurance claims codes. Detailed time-registry data was used to classify each worker’s history of rotational and night work. The associations between recent rotational work and night work in the last 12 months and incident hypertension were estimated using adjusted Cox proportional hazards models. Elevated hazard ratios were observed for all levels of recent night work (>0-5%, 5-50%, 50-95%, 95-100%) compared with non-night workers, and among all levels of rotational work (>1%, 1-10%, 10-20%, 20-30%, and >30%) compared with those working <1% rotational work. In models for considering the combination of night and rotational work, workers with mostly night work and frequent rotations (≥50% night and ≥10% rotation) had the highest risk of hypertension compared to non-night workers (HR=4.00, 95%CI: 1.69-9.52). Our results suggest recent night and rotational work may both be associated with higher rates of incident hypertension.
3.3 Introduction Shift work is often attractive to workers due to flexible schedules and increased wages; however, these benefits may come at a cost to workers’ health. Shift work has been associated with hypertension, a risk factor for cardiovascular disease.(39,46–48) Yet, prior research has been unable to disentangle the relative importance of particular shift patterns as the drivers for increased risk.

34
Workplaces have utilized shift work for decades to arrange successive work shifts such that they may operate longer hours.(1,2) As a result, there are many different and highly customized work schedules that are considered shift work. Definitions in the literature include rotating shifts, weekend work, and various shift schedules that may or may not include night work.(4,39) Although there are no uniform definitions for all of the specific variants of shift work, estimates of the prevalence of shift work range up to nearly 20% in the US workforce.(1,3) Prior research indicates that two primary components of shift work may be relevant to the risk of hypertension, type of shift defined by the time of work (e.g. day vs. night work) and the rotation of shifts (i.e. switching scheduled shift times), both of which have the potential to disrupt circadian rhythms.(4,39) Imbalance in circadian rhythms may compromise the ability of organ systems, including the cardiovascular system, to adapt to external stimuli.(4,11–14) However, few studies have been able to assess the effects of shift type and rotations on hypertension risk separately and simultaneously in the same cohort.(39) Furthermore, there is ambiguity regarding the biologically relevant time period in which hypertension develops following exposure to shift work.(48) While human-based laboratory studies have identified that circadian misalignment causes alteration in the diurnal variation of blood pressure within 24 hours of shift work,(83) epidemiological studies examining recent exposure to shift work are conflicting and examine exposure periods that vary in length from 1-20 years.(47,84) We hypothesize that shift work in the previous year may be an important time window of exposure for the development of hypertension given the acute impacts shift work can have on blood pressure. To explore the impact of recent night and rotational work on hypertension, we examined novel exposure metrics of rotations and night work in a study of incident hypertension using objective time-registry data in a cohort study of US aluminum manufacturing workers. Additionally, we examined the associations between hypertension and the combinations of night work and rotational work. 3.4 Methods 3.4.1 Study Population The study population is part of the American Manufacturing Cohort (AMC) comprising hourly employees at light-metal smelter, refinery, and fabricating plants operating 24 hours a day in the United States. Workers performed blue-collar work (i.e. jobs requiring manual labor; not including secretarial or office work) and included tasks such as anode assembly operator, sheet finishing, pack/ship operator, casting, autoclaving, and electrical or mechanical maintenance.(53) Detailed information on employee demographics, work environments, and health were obtained from employment records, company personnel files, industrial hygiene records, and insurance claims. In total, 3,790 hourly workers in eight plants employed in shift work were potentially eligible for study inclusion. These workers had shift work exposure data recorded within 10 days of hire and were hired after 2003 when shift work data became available. Workers were excluded if they were employed for less than one year (1,251 workers), or non-concurrently enrolled in the insurance plan (125 workers). In addition, 263 workers with prevalent hypertension, as determined from claims in the first year of employment, were excluded. Our final analytic dataset comprised 2,151 hourly workers without diagnosed prevalent hypertension. Follow-up times were censored on the date workers switched insurance plans, left employment with the

35
company, or were otherwise lost to follow-up. Follow-up times were also censored at the first instance of missing shift work data if it was missing for more than two weeks. 3.4.2 Night Work and Rotational Work Exposure
Exposure assessment for night work and rotational work was based on daily working hour data retrieved from two time-registry systems used to calculate payroll from December 27th, 2002 through the end of 2013. Each exposure metric was calculated from an individual’s first active working date until either the date of hypertension diagnosis, administrative censoring, or the end of the follow-up period, December 31st, 2013, whichever came first. Non-work hours (e.g. sick leave, vacation) and shifts shorter than 3 hours (<0.5%) were defined as non-exposed person-time. Additionally, any shifts over 18 hours (<0.1% of all shifts) were excluded as potential exposures as they likely represented paid time during which employees were allowed to sleep. Shifts with 30 minutes or less unpaid time (e.g. meal breaks) between them were considered one continuous shift. Night shifts were classified using starting time and duration according to the most commonly employed definition of night work in time register studies work by Härmä et al. and Garde et al.: a night shift is a shift with at least three hours between 23:00 and 6:00.(60,76) Shifts not defined as night shifts were considered non-night shifts. Recent night work exposure was defined as the mean monthly percentage of shifts that were night shifts over the previous 12 months (i.e. the number of night shifts per month/total number of shifts per month; in a moving window average of 12 months). Among this population of shift workers, there was exceptional variety in the shift systems used with multiple rotation schedules and shift lengths (e.g. 12-hour night shifts for 4 days, 2/3/4 weeks alternating 8-hour shifts at different start times, permanent 8-hour shifts, etc.). Therefore, rotational shifts were defined to objectively identify a switch to a different shift based on start time rather than by classification of the shift plans. The plants generally operated with either three 8-hour shifts per day or two 12-hour shifts per day, or a combination of both operating independently to ensure 24-hour operation. A minimum six-hour absolute value displacement in start time was chosen to identify a shift with schedule rotation as most plants had at least eight hours between each shift start. Six-hours was chosen to avoid capturing when a worker arrives early or late for their scheduled shift and to capture a true shift change (i.e. morning to night rotation). For example, a shift at 11:00 followed by a shift the next day at 7:00 would not be categorized as a shift rotation because the absolute value of the shift start time displacement was 4 hours (i.e. 11-7= 4). In comparison, a shift at 16:00 followed by a shift the next day at 23:00 would be categorized as a rotation because the absolute value of the shift start time displacement was 7 hours. Shifts on the same day were not classified as rotations to avoid identifying a rotation for a shift with breaks longer than 30 minutes (i.e. long lunch break). Shifts that both began on the same calendar day were rare (<1%). Recent rotational work exposure was defined similarly to night work; the mean monthly percent of shifts that had rotations over the past 12 months. Night and rotational work occurring more than 12 months prior to the index date were considered “historical exposures” and defined in the same manner; the mean monthly percentage of night and rotational shifts, respectively, from the beginning of follow-up until the beginning of the previous year.

36
3.4.3 Hypertension Outcome Incident hypertension was defined as a face-to-face (outpatient or hospitalization) diagnosis (ICD9: 401.x-405.x) identified from medical insurance claims, similar to previous analyses.(56,85–88) Anti-hypertension medications were not part of the case definition since they are prescribed for multiple indications beyond treatment of hypertension.(89) If a face-to-face claim for hypertension occurred within the first year of follow up, the worker was considered to have prevalent hypertension and was excluded from analysis (i.e. a one-year washout period for prevalent hypertension). 3.4.4 Covariates Baseline sex, age, and race, as well as time-varying job grade, and plant location were obtained through human resource records. Race was categorized as White/Asian, Hispanic, Black, and Other (Multi-racial and Native American/Alaska Native). Job grade, a classification matrix for jobs based on experience, skill level, seniority and prestige, ranged from 2 to 49.(55) Job grade was dichotomized into low and high job grade based on the plant-specific median job grade. Job grade was considered an a priori confounder because jobs with higher seniority may result in more realized preference in schedule selection and job grade is correlated with wages which are strong predictors of health.(55) Time-varying body mass index (BMI) and smoking status were obtained through Occupation Health and Safety Administration (OSHA) mandated examinations such as respirator fit tests. These clinic records were maintained only for active workers resulting in missing data for BMI and smoking. BMI was classified into underweight, normal weight, overweight, and obese according to the Centers for Disease Control (CDC) standard definitions; Underweight <18.5 kg/m2, Normal 18.5-<25 kg/m2, Overweight 25.0-<30 kg/m2, and Obese >30.0 kg/m2.(90) Smoking status was categorized into never, current, and ever (ex-smoker). Insurance records also provide a “risk score”, an insurance predictive health expenditures metric, used in this analysis as a surrogate for time-varying health status.(56,57,91) These annual scores were originally developed to predict an individual’s health expenditures in the coming year and are standardized such that a score of 1 indicates the individual’s health expenditures are likely to fall at the mean. Each one unit increase predicts a one-fold increase in expenditures above the mean.(57) 3.4.5 Statistical Analysis
We fit three separate Cox proportional hazard models with age as the time scale to estimate hazard ratios for developing hypertension as a function of: 1) a night work, 2) rotational work, and 3) combinations of both night and rotational work. Baseline hazards for all models contained a strata statement for sex and location to meet the proportional hazards assumptions (92). We verified that the proportional hazard assumption was met using Schoenfeld residuals for each model. Models were additionally adjusted for race, plant location, job grade, risk score, and calendar year. History of night work was adjusted for when examining associations with recent night work and history of rotational work was adjusted for when examining recent rotational work.
Categories of recent and historical night work exposure were defined a priori to identify those workers with no night work exposure (i.e. non-night workers only), those with very little night work exposure, and workers with near permanent night work. The midrange exposures were divided equally. The categories of recent night work exposure were 0% (i.e. non-night work only), >0-5% (i.e. those with very little night work exposure), 5-<50%, 50-95%, and 95-

37
100% night shifts (i.e. near permanent night workers). Historical night work exposure was modeled as a continuous variable, using restricted cubic splines.(93)
Rotational work exposure categories were designated a priori to identify unexposed workers. However, due to the small number of workers who were unexposed to rotations over an entire year, the reference category was modified to include those with less than 1% rotational shifts. The remaining exposures were then classified by decile (e.g. 0-<1%, 1-10%, >10-20%, >30%). Historical rotational work exposure was modeled using restricted cubic splines.(93) Tests for trend were performed for exposure based on the mean percentage of each night/rotational work category.
To examine the association between combinations of night work and rotational work on the risk of hypertension, the exposure categories were combined using the quadrant method a-priori into: non-night workers with infrequent rotations (0% night work and <10% rotations), non-night workers with frequent-rotations (0% night work and ≥10% rotations), mostly non-night workers with infrequent rotations (<50% night work and <10% rotations), mostly non-night workers with frequent rotations (<50% and ≥10% rotations) mostly night workers with infrequent rotations (≥50% night work and <10% rotations), and mostly night workers with frequent rotations (≥50% night work and ≥10% rotations). However, due to small numbers of non-night workers, the two categories of non-night workers were combined to non-night workers (0% night work) regardless of rotations. We did not control for BMI or smoking in the primary analyses since these variables may be on the causal pathway from night work to hypertension.(94–97) In a sensitivity analysis, we assumed a different causal structure and treated smoking and BMI as confounders. Missing values for smoking status (60% missing) and BMI (30% missing) were imputed using multivariable imputation by chained equations (MICE) in 60 simulated datasets, equal to the percentage of missing smoking data.(92,98–100)
Several sensitivity analyses were performed to assess the robustness of the main results. First, we implemented two alternate classifications of night work: 1) Any night shifts versus none, and 2) Number of months working any night shifts. Second, we explored an alternate definition of night shifts using the International Agency for Research on Cancer (IARC) 2007 report: a night shift is a shift with at least three hours between 0:00 – 5:00.(1) Third, we restricted analysis to workers with at least 150 shifts per year. All statistical analyses were performed in Stata version 15, 2017 (StataCorp LLC, College Station TX). This study was approved by the Institutional Review Board at the University of California, Berkeley (Protocol ID: 2010-07-1823). 3.5 Results Among the 2,151 shift workers, 215 incident cases of hypertension were observed over 5,231 person-years. Follow-up time ranged from 1 month to almost 10 years, with a mean of 2.5 years. Table 2.1 presents baseline characteristics of the cohort and the average percent of recent night and rotational work for each covariate category. The cohort was mostly white male with an average age of 37 at baseline. The average risk score of 0.49 indicated that, on average, workers were predicted to have health expenditures below the mean of a nationally representative population in the coming year.(57) The percentage of recent night work at baseline was higher among hypertensive cases, women, multi-racial workers and those with a lower job grade. Percentage of recent rotational work at baseline was higher among non-cases, men, and lower job grades.
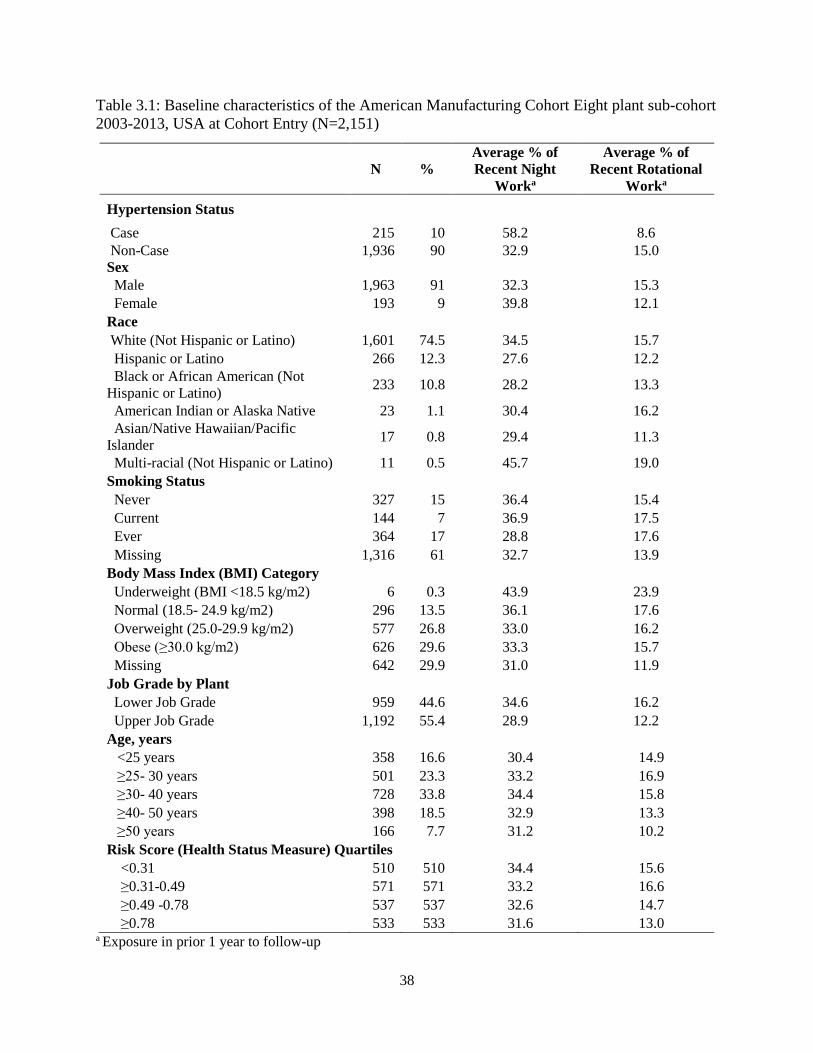
38
Table 3.1: Baseline characteristics of the American Manufacturing Cohort Eight plant sub-cohort 2003-2013, USA at Cohort Entry (N=2,151)
N % Average % of Recent Night
Worka
Average % of Recent Rotational
Worka
Hypertension Status Case 215 10 58.2 8.6 Non-Case 1,936 90 32.9 15.0 Sex Male 1,963 91 32.3 15.3 Female 193 9 39.8 12.1 Race White (Not Hispanic or Latino) 1,601 74.5 34.5 15.7 Hispanic or Latino 266 12.3 27.6 12.2 Black or African American (Not Hispanic or Latino) 233 10.8 28.2 13.3
American Indian or Alaska Native 23 1.1 30.4 16.2 Asian/Native Hawaiian/Pacific Islander 17 0.8 29.4 11.3
Multi-racial (Not Hispanic or Latino) 11 0.5 45.7 19.0 Smoking Status Never 327 15 36.4 15.4 Current 144 7 36.9 17.5 Ever 364 17 28.8 17.6 Missing 1,316 61 32.7 13.9 Body Mass Index (BMI) Category Underweight (BMI <18.5 kg/m2) 6 0.3 43.9 23.9 Normal (18.5- 24.9 kg/m2) 296 13.5 36.1 17.6 Overweight (25.0-29.9 kg/m2) 577 26.8 33.0 16.2 Obese (≥30.0 kg/m2) 626 29.6 33.3 15.7 Missing 642 29.9 31.0 11.9 Job Grade by Plant Lower Job Grade 959 44.6 34.6 16.2 Upper Job Grade 1,192 55.4 28.9 12.2 Age, years
<25 years 358 16.6 30.4 14.9 ≥25- 30 years 501 23.3 33.2 16.9 ≥30- 40 years 728 33.8 34.4 15.8 ≥40- 50 years 398 18.5 32.9 13.3 ≥50 years 166 7.7 31.2 10.2
Risk Score (Health Status Measure) Quartiles <0.31 510 510 34.4 15.6 ≥0.31-0.49 571 571 33.2 16.6 ≥0.49 -0.78 537 537 32.6 14.7 ≥0.78 533 533 31.6 13.0
a Exposure in prior 1 year to follow-up

39
As seen in Figure 3.1, the eight plants operated on either a two-shift, three-shift, or a combination of two- and three-shift system. Plants 1, 2, and 3 all had a two-shift system, consisting of a morning shift starting around 6:00 and a night shift starting around 18:00. Plants 4, 5, and 6 operated on a three-shift system; a morning, afternoon, and night shift. While Plants 7 and 8 operated on a combination of two- and three-shift systems that consisted of a morning, early afternoon, evening, and night shift. There was also some variability in the shift start times which correspond to a worker arriving early or late for a regularly scheduled shift. Figure 3.1: Distribution of Shift Start Times by Plant Location American Manufacturing Cohort (AMC) 8 plant sub-cohort 2003-2013, USA
There was high variability in night work and rotation exposure. Figure 3.2 presents the distribution of recent night work among those person-months with at least one night shift. Only 13% of person-months included no recent night work (i.e. non-night work reference group) and the average percentage of recent night work was 35%. Over their entire recorded work history, 86% of workers worked at least one night shift.

40
Figure 3.2: Distribution of person-months with night work in the previous year; restricted to months with at least one night shift in the previous year, American Manufacturing Cohort, 8 plant sub-cohort 2003-2013, USA
Figure 3.3: Distribution of person-months with rotational work in the previous year; restricted to months with at least one rotation in the previous year, American Manufacturing Cohort (AMC) 8 plant sub-cohort 2003-2013, USA

41
Figure 3.3 presents the distribution of recent rotational work. 94.5% of person-months included at least one rotation in the previous year. The majority of workers (98.7%) experienced at least one rotation in their recorded work history and the average percentage of recent rotational work was 16%. As seen in Figure 3.4, night work and rotational work were not correlated (R=0.06). While there were a number of person-months that had both rotation and night work, there were also person-months that were uncorrelated such as the permanent night workers who had no rotations, and the workers who switched frequently from early morning to afternoon day shifts, but never to night shifts.
Figure 3.4: Scatter plot of average monthly percentage of night and rotational work in the first year of follow-up (N=2,151), American Manufacturing Cohort (AMC) 8 plant sub-cohort 2003-2013, USA
Table 3.2 presents results for hazard ratios for hypertension and each of the two exposures in three different models: a base model, a more fully adjusted model, and a model that also adjusts for imputed BMI and smoking as a sensitivity analysis. In the base model, the hazard ratios were elevated for recent night work, though the exposure-response was non-monotonic, (test for linear trend p=0.32). In comparison, the exposure-response relationship for recent rotational work was monotonic (linear trend test p=0.05). In the adjusted models, workers with relatively little exposure to night work (those with >0-5% night work) experienced a doubling in the risk for hypertension (HR=2.30 (1.06- 4.99)) and the risk continued to rise with increasing night work. Those with more than 95% night shifts had the highest risk of incident hypertension (HR=3.50 (1.21-10.1)). Recent rotational work was also associated with a linear trend of increasing incident hypertension risk in the adjusted models (p=0.01); those with more than 30% rotational shifts per month had 3.44 times the risk (95% CI: 1.54-7.69). Confidence intervals
42
became wider but hazard ratios were similar when imputed BMI and smoking status were adjusted for. Table 3.3 presents hazard ratios for of recent night and rotational shifts and hypertension. Compared to non-night workers, hazards were increased among workers with any recent night work. Among workers who were mostly non-night work with infrequent rotations, the hazard ratio for hypertension was 2.18 (0.97-4.87) compared with non-night workers. Workers with mostly night work and frequent rotational exposure were at the highest risk (HR: 4.00 (1.69-9.52)). When BMI and smoking status were treated as confounders, hazard ratios were slightly elevated with wider confidence intervals after adjusting for imputed BMI and smoking. In the second sensitivity analysis, we implemented two alternate classifications of recent night work: 1) any night shifts versus none and 2) number of months working any night shifts. An increased risk of hypertension was seen when night work was defined in either of these alternate classifications (Table 3.4). In our third sensitivity analysis, workers with less than 150 shifts per year were excluded; 2,813 person-months were dropped leaving 2,216 subjects and 201 hypertension cases. The results were approximately the same but the confidence intervals were larger (results not shown). Finally in the fourth sensitivity analysis, results based on the IARC definition of night work (a night shift is a shift with at least three hours between 0:00 – 5:00)(1) and the Scandinavian definition (three hours between 23:00-6:00)(60,76) were 98% concordant and almost identical (results not shown).
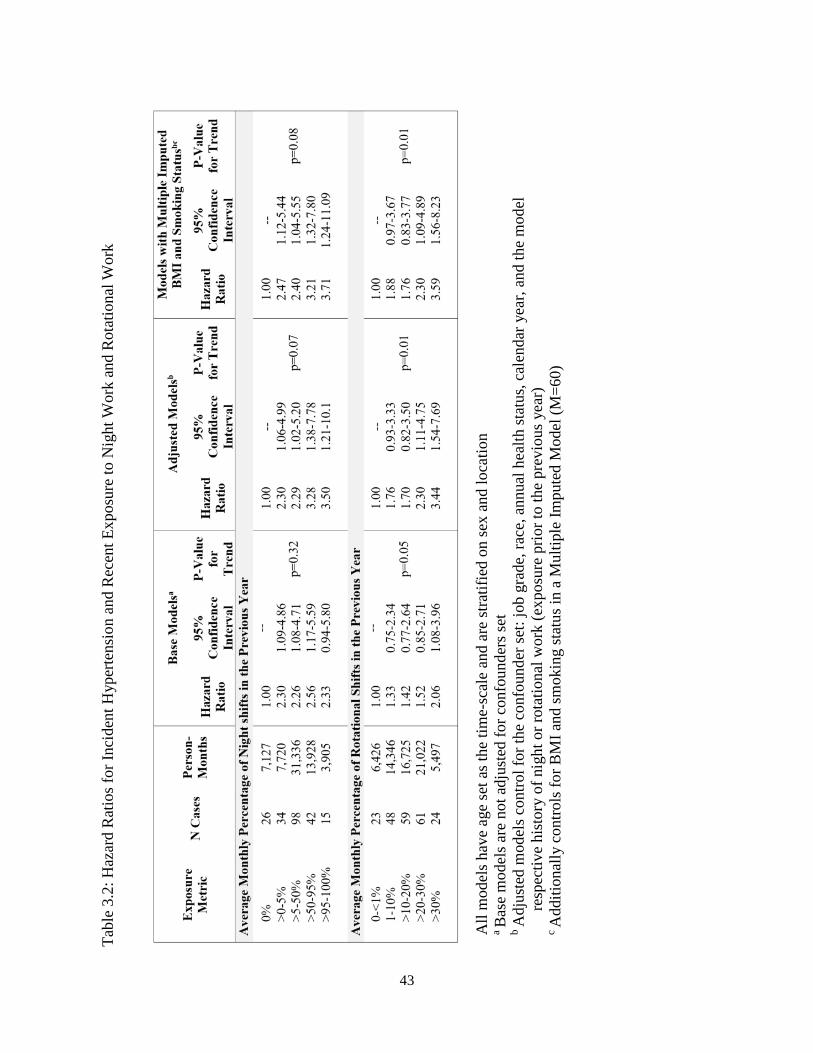
43
Ta
ble
3.2:
Haz
ard
Rat
ios f
or In
cide
nt H
yper
tens
ion
and
Rec
ent E
xpos
ure
to N
ight
Wor
k an
d R
otat
iona
l Wor
k
All
mod
els h
ave
age
set a
s the
tim
e-sc
ale
and
are
stra
tifie
d on
sex
and
loca
tion
a Ba
se m
odel
s are
not
adj
uste
d fo
r con
foun
ders
set
b A
djus
ted
mod
els c
ontro
l for
the
conf
ound
er se
t: jo
b gr
ade,
race
, ann
ual h
ealth
stat
us, c
alen
dar y
ear,
and
the
mod
el
resp
ectiv
e hi
stor
y of
nig
ht o
r rot
atio
nal w
ork
(exp
osur
e pr
ior t
o th
e pr
evio
us y
ear)
c A
dditi
onal
ly c
ontro
ls fo
r BM
I and
smok
ing
stat
us in
a M
ultip
le Im
pute
d M
odel
(M=6
0)

44
Tabl
e 3.
3: H
azar
d R
atio
s for
Inci
dent
Hyp
erte
nsio
n an
d C
ombi
natio
ns o
f Rec
ent E
xpos
ure
to N
ight
Wor
k an
d R
otat
iona
l Wor
k
All
mod
els h
ave
age
set a
s the
tim
e-sc
ale
and
are
stra
tifie
d on
sex
and
loca
tion.
a Ba
se m
odel
s are
not
adj
uste
d fo
r con
foun
ders
set.
b Adj
uste
d m
odel
s con
trol f
or th
e co
nfou
nder
set:
job
grad
e, ra
ce, a
nnua
l hea
lth st
atus
, cal
enda
r yea
r, an
d th
e m
odel
re
spec
tive
hist
ory
of n
ight
or r
otat
iona
l wor
k (e
xpos
ure
prio
r to
the
prev
ious
yea
r)
c Add
ition
ally
con
trols
for B
MI a
nd sm
okin
g st
atus
in a
Mul
tiple
Impu
ted
Mod
el (M
=60)
d
Mos
tly N
on-n
ight
wor
k is
def
ined
as m
ore
than
0%
but
less
than
50%
of s
hifts
in th
e pr
evio
us y
ear w
ere
nigh
t shi
fts.
Mos
tly n
ight
wor
k is
def
ined
as 5
0% o
r mor
e sh
ifts i
n th
e pr
evio
us y
ear w
ere
nigh
t shi
fts. I
nfre
quen
t rot
atio
ns a
re
defin
ed a
s les
s tha
n 10
% o
f shi
fts in
the
prev
ious
yea
r wer
e ro
tatio
nal s
hifts
. Fre
quen
t rot
atio
ns a
re d
efin
ed a
s 10%
or
mor
e sh
ifts i
n th
e pr
evio
us y
ear w
ere
rota
tiona
l shi
fts
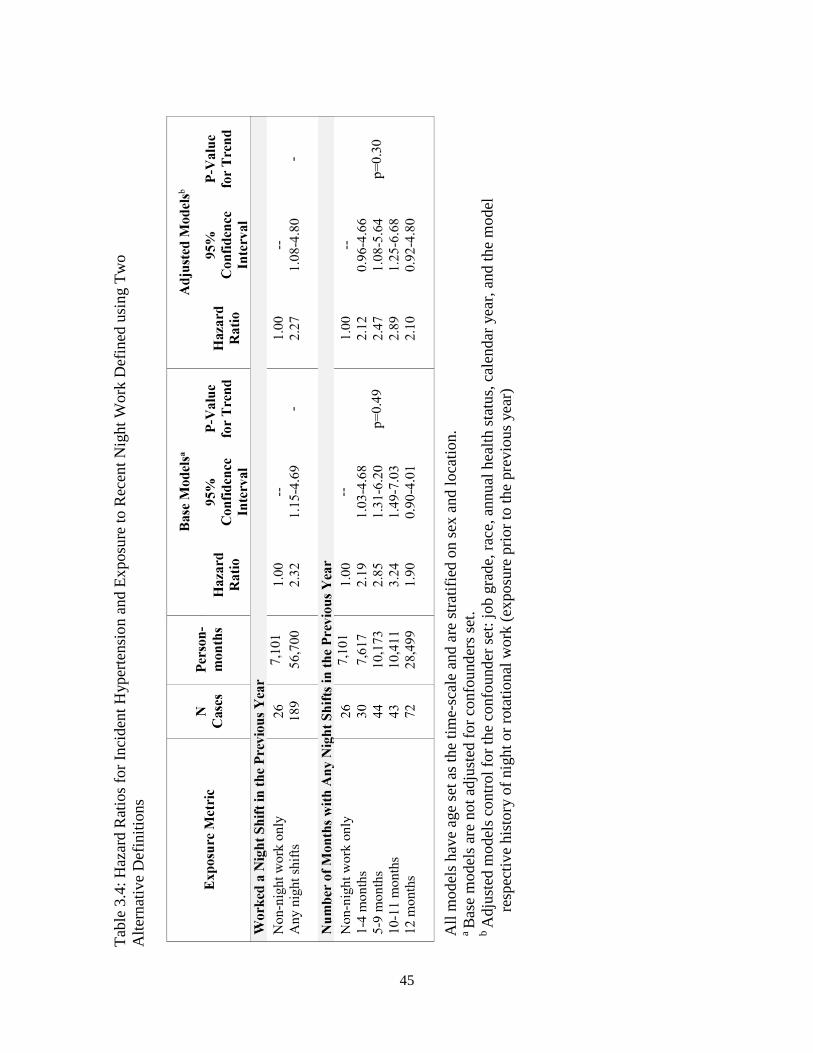
45
Ta
ble
3.4:
Haz
ard
Rat
ios f
or In
cide
nt H
yper
tens
ion
and
Expo
sure
to R
ecen
t Nig
ht W
ork
Def
ined
usi
ng T
wo
A
ltern
ativ
e D
efin
ition
s
All
mod
els h
ave
age
set a
s the
tim
e-sc
ale
and
are
stra
tifie
d on
sex
and
loca
tion.
a Ba
se m
odel
s are
not
adj
uste
d fo
r con
foun
ders
set.
b A
djus
ted
mod
els c
ontro
l for
the
conf
ound
er se
t: jo
b gr
ade,
race
, ann
ual h
ealth
stat
us, c
alen
dar y
ear,
and
the
mod
el
resp
ectiv
e hi
stor
y of
nig
ht o
r rot
atio
nal w
ork
(exp
osur
e pr
ior t
o th
e pr
evio
us y
ear)
46
3.6 Discussion
Our findings support the hypothesis that recent night work and rotational work are associated with an elevated risk of hypertension. The highest rates of hypertension were identified for those with 95-100% night work, workers who would normally be considered ‘permanent night workers’. This suggests that permanent night workers are experiencing circadian rhythm disruption even though their work schedules are not rotating. This may be due to the social ‘jet-lag’ that night workers experience, as they may ‘rotate’ back to a day schedule on their days off. Furthermore, we observed elevated hazard ratios for all combinations of night and rotational work compared to non-night workers. In particular, the hazard ratio was almost 4-fold for workers with mostly night work and frequent rotations compared with non-night workers. Even those workers with mostly non-night work and infrequent rotations had a 2-fold risk of hypertension. These estimated risks of hypertension are higher than in previous research. However, we focused on a shorter and more proximate window of exposure (previous 12 months). Most other studies examined shift work in windows 2-5, 5-10, 10-20, and more than 20 years prior.(48,101–104) Other studies do not specify the exposure period at all.(46,105,106) If the most biologically relevant window of exposure for development of hypertension is a year, then we would expect our study to report higher risks than others. Additionally, these studies may have estimated lower risk due to binary definitions of shift work such as ever/current versus never night work.(104,107–111) Our study has several limitations. First, our reference category in the models examining the combinations of night and rotational work, combined permanent non-night workers with workers who may rotate between non-night shifts (i.e. morning and afternoon shifts). If there is increased risk of hypertension associated with rotating between non-night shifts, we would have underestimated the impact of rotation on hypertension in the combination model due to the heterogenous reference group. Second, the rotational work metric identifies a switch to a different shift schedule but is indifferent to the severity of a rotation. For example, our metric captures switches from a shift that starts at 15:00 to one that starts at 9:00; however, both shifts are generally considered day work and switching between them may have little effect on a worker’s circadian rhythms. Furthermore, our metric does not distinguish between forward rotations and backward rotations or the speed/frequency of rotations which may have differential adverse effects on the circadian system.(4,112,113) Third, hypertension was identified using ICD-9 codes from insurance claims records which reduces, but does not eliminate, outcome misclassification. Although we surely missed some cases, Tessier-Sherman et al. examined the validity of claims data in identifying hypertension cases among the insured employees from which this study population was derived.(88) They found the medical service claims to be highly specific (86%) while the sensitivity was 43% indicating this study population may have under-ascertainment of cases.(88) Poor sensitivity of an outcome will result in statistical power issues, but will not bias the point estimate.(114) Finally, this study may have residual confounding, as we lacked information on personal lifestyle factors such as exercise habits, eating patterns, and chronobiologic preference (i.e. diurnal preference).(64) Additionally, we were unable to adjust for occupational exposures such as fine particulate matter or noise, which may bias the reported hazard ratios.(85,115,116) There may also be residual confounding by underlying health status, whereby healthier workers may
47
select into or acquire more shift work exposure than more susceptible workers who may avoid night or rotational shifts.(117) In a different cohort of workers, between 20% and 30% of shift workers switch to day work schedules within 2-3 years and cite health reasons for switching which suggests that the healthy worker survivor effect may cause downward bias in estimated associations with night work.(118,119) While we restricted to workers hired after the start of follow-up which avoids a form of selection bias, the mean age at baseline was 37 years old and we have no information regarding night work at prior employment. Moreover, this population of light-metal manufacturers may not be generalizable to other populations as they were part of a highly unionized workforce with excellent access to healthcare. Despite these limitations, this study is the first longitudinal study using time-registry data to assess the impact of both night and rotational work on incident hypertension risk. This study benefits from longitudinal follow-up and the objective assessment of working hours which does not rely on subject recall and represents actual work time, as opposed to assigned work time. Additionally, this population of aluminum workers are often employed in standardized manufacturing work teams that operate 24 hours a day. Therefore, the reference group of non-night workers are generally performing the same tasks as the night workers and our reference groups are more directly comparable than other shift worker populations. The elevated hazard ratios were robust to multiple sensitivity analyses.
This research supports the hypothesis that recent night and rotational work is associated with an elevated risk of hypertension. Furthermore, this research suggests hypertension risk rises and remains elevated with increasing exposure to night work compared to non-night work.
3.7 Postface
In this chapter, we explored the relationship between recent night and rotational work and hypertension and found that combinations of recent night and rotational work increase the risk of hypertension. In chapter 3, we examine the cumulative impacts of night work on risk of incident diabetes.
48
Chapter 4 Duration or Intensity: Cumulative Number and Average Percentage of Night Work Exposure Over Time and Risk of Diabetes
4.1 Preface
In this chapter, we present an analysis examining the association of cumulative number and average percentage of night work exposure and risk of incident type II diabetes mellitus. At the time this chapter was being written, access to the AMC data was temporarily suspended. While most of the analysis for this chapter was completed, some final numbers and analyses were not able to be reported for publication in this dissertation. This affected the description of the cohort as I was not able to describe the number of people who met each inclusion and exclusion criteria in the final analytical population for this chapter’s analysis. These missing numbers have been filled in with N1, N2, N3… and so forth. Additionally, sensitivity analyses for the Cox proportional hazard models were completed, but not complied into reportable tables. Therefore, while the results section contains a brief summary of the sensitivity analyses, data were not presented. Additionally, the pathway analysis and subsequent marginal structural models for this study was in progress at the time data access was suspended, and the incomplete results were not included in this chapter. Future inquiries regarding these missing numbers and sensitivity analyses can be sent to the dissertation author, Jacqueline Ferguson, or Mark Cullen at Stanford University. It is my hope that these numbers may also be directly referenced in a forthcoming peer-reviewed journal article version of this chapter.
49
4.2 Abstract
Night shift work has been associated with increased rates of type II diabetes mellitus. While previous observational studies suggest that shift workers who have ever engaged in night work are at higher risk for type II diabetes, few studies examined the exposure-response relationship between accumulated night work exposure and incident diabetes. In the present study, we took advantage of quantitative metrics of night work exposure to examine the exposure-response relationship of night work and incident type II diabetes in a cohort of 3,947 American manufacturing shift workers using Cox proportional hazards models. Our results provide some evidence that night work exposure may be associated with an increased risk of diabetes. This association was seen when night work exposure was classified as either the cumulative number of months of night work or the average percentage of night shifts over follow-up. Hazard ratios were particularly elevated for those who accumulated 13-23 months of night work exposure [HR 1.77 (95% CI: 0.95,3.31)] compared with workers who never worked a month of night work. We also observed a positive association between the average percentage of night shifts over follow-up and risk of incident diabetes. In conclusion, our results support the hypothesis that night work duration and intensity are associated with an increased risk of type II diabetes; however, extended follow-up would help increase the precision of our estimates.
4.3 Introduction
The rising prevalence of type II diabetes mellitus worldwide is considered to be a major public health challenge as an estimated 300 million individuals will be affected by type II diabetes by 2025.(120) Type II diabetes is characterized by high blood glucose levels resulting from defects in insulin secretion, insulin action, or both.(49,50) Type II diabetes has been increasing worldwide largely driven by insulin resistance due to changes in human behavior and increases in sedentary lifestyles which have increased rates of obesity.(49,50) Yet, over 50% of the individual variability in insulin resistance remains unexplained after accounting for key risk factors such as gender, race, age, and adiposity, suggesting a role for genetics and environmental risk factors.(121) Environmental risk factors are important predictors of type II diabetes risk, especially considering the link between diabetes and healthy lifestyles.(121,122) However, there is little knowledge regarding the risk factors from an occupational environment beyond air pollution and chemical exposure. Night work is one potential occupational factor that may influence insulin resistance and subsequent type II diabetes.(51) Night work is a common occupational exposure across many sectors of the economy and results in working and eating at hours when the body is anticipating sleep. This conflict between the body’s internal rhythms of sleep/wake and fasting/feeding cycles is known as circadian rhythm disruption and may accelerate the development of diabetes through the impairment of the body’s glucose metabolism processes.(51,123,124) Night work may also indirectly increase insulin resistance through sleep deprivation, stress, poor sleep quality, and additional behaviors associated with night work such as physical inactivity, smoking, and unhealthy eating.(23,121,125) While previous observational studies suggest that shift workers who have ever engaged in night work are at higher risk for diabetes, few studies examined the exposure-response relationship between night work and incident diabetes.(51,67) Among those few, the majority have focused on cohorts of female nurses or Scandinavian populations.(67,126–129) In the present study, we took advantage of quantitative metrics of night work exposure to

50
examine the exposure-response relationship of night work and incident type II diabetes in a cohort of American manufacturing workers. Our study’s primary objective was to examine the association of cumulative number of night shifts and average intensity of night shifts on risk of incident diabetes.
4.4 Methods
4.4.1 Study Population
The study population is a subset of the larger American Manufacturing Cohort (AMC), a cohort study designed to allow characterization of the determinates of disease, with an emphasis on the social, economic, and physical exposures related to work in light-metal smelters, refineries, and fabricating workplaces in the United States.(52) This unique cohort benefits from detailed administrative data including employee demographics, employment histories, medical claims, and working hours obtained from company personnel files, employment records, insurance claims, and payroll time-registry systems.(52,73) For this analysis, the AMC population was restricted to twelve plants operating 24 hours a day that reported daily working hours in the payroll time-registry systems. To partially account for left truncation bias, where more susceptible workers do not remain observable for a later start of follow-up,(56,117) only workers hired after 2003 (when daily working hours began to be recorded for a subset of plants) were considered. In total, N1 hourly workers in twelve plants employed in shift work between 2003 and 2014 were potentially eligible for study inclusion. Workers were excluded if they were employed for less than 1 year (N2 workers) or were non-concurrently enrolled in the insurance plan (N3 workers) after the start of follow-up. In addition, N4 workers with prevalent diabetes, as determined from claims in the first year of employment, were excluded. To control for the confounding effects of race on night work exposure and diabetes in the presence of two cases among Asian and Multiracial workers, this population was further restricted to workers of white, black, or Hispanic race or ethnicity (N=115). The final study population for this analysis comprised 3,947 workers without prevalent diabetes. Follow-up for each worker began on their date of hire, or the date they first appeared in the time-registry system and were enrolled in the insurance plan, which ever came later, and continued to the administrative end of follow-up on December 31st, 2014. Follow-up times were administratively censored at the first instance of any of the following four conditions: 1) the worker was not enrolled in the insurance plan for two continuous months (i.e. worker switched insurance plans), 2) the worker left employment with the company (e.g. retirement, firing, layoff), 3) the worker was missing shift work data for more than two months (e.g. switched to a salaried job) 4) the worker worked less than 150 work shifts in the last 365 days (i.e. switched to part-time employment or took an extended leave of absence).
4.4.2 Cumulative Night Work Exposures
Exposure assessment for night work was based on daily working hour data retrieved from two time-registry systems used to calculate payroll from December 27th 2002 through December 31st 2014. Each exposure metric was calculated from the start of follow-up until either the date of diabetes diagnosis, administrative censoring, or the end of the follow-up period, whichever came first. Shifts longer than 18 hours and shorter than 3 hours were excluded from exposure classification as previously described.(73) Shifts with an hour or less unpaid time (e.g. meal breaks) were considered to be one continuous shift. Night shifts were classified using the starting
51
time and duration: a night shift is a shift with ≥3 hours between 23:00 and 06:00 which is consistent with previous definitions.(60,73,75) Otherwise, shifts were considered non-night shifts. Two measures of long-term exposure to night work were developed: 1) Cumulative number of months with night work and 2) Average percentage of night shifts over follow-up. A month with night work was defined as a calendar month in which more than 3 night shifts were worked, regardless of the number of non-night shifts worked. The average percentage of night shifts was calculated as the cumulative number of night shifts/cumulative number of shifts over follow-up. Both measures of long-term exposure to night work were lagged by one year as shifts immediately preceding a diabetes diagnosis are unlikely to be those of etiological interest and to avoid reverse causation.
4.4.3 Diabetes Outcome
Type II diabetes mellitus was defined as one face-to-face (outpatient or hospitalization) diagnosis (ICD9: 250.x) or hyperglycemia medication from insurance claims, similar to previous analyses.(56,73,85–88) If a face-to-face diagnosis or insurance claim for hyperglycemia medication occurred within the first year of follow-up, the worker was considered to have prevalent diabetes and was excluded from analysis (i.e., a one-year washout period for prevalent diabetes).
4.4.4 Covariates Gender, age, and race, time-varying job grade and plant location were obtained from human resource records. Race was categorized into white, Hispanic, and black. Job grade, a classification matrix for jobs based on experience, skill level, and seniority and prestige, ranged in value from 2-49,(55) and was treated as a continuous variable. For some workers, there was a gap between hire date and start of follow-up due to a delay in enrollment in both the insurance plan and the time-registry system. For some, shift work data was not available until sometime after hire due to delays in the adoption of the time-registry systems at each location. Alternatively, some employees were enrolled in the time-registry system but delayed enrollment in the insurance plan of interest (i.e. they were enrolled in another insurance plan first). To control for potential differences between those with a gap between hire date and start of follow-up and those with no gap, we calculated the number of days between hire date and start of follow-up which was categorized as follows: 1) 30 days or less, 2) more than 30 days but less than 1 year, or 3) more than 1 year between hire and start of follow-up. Insurance records provide a “risk score”, an insurance metric predictive of health expenditures, which we used in this analysis as a surrogate for time-varying health status similar to previous studies of the AMC.(56,57,91) These annual scores are standardized such that a score of 1 indicates the individual’s health expenditures are likely to fall at the mean.(57) The number of full shifts off-work was controlled for as another surrogate measure for health status because workers struggling with a health issue may elect to take time off-work to recover. The number of full shifts off-work offered the ability to control for monthly variations in health status, unlike risk score, the other metric for health status, which was calculated annually. Full shifts off-work were defined using the non-worked hours in the time-registry data which included reason codes for the recorded absence. Full shifts off-work were defined to exclude non-worked hours explicitly coded as unrelated to health (e.g. military, bereavement, suspension, union duties, or weather-related absences) and included sick leave, unpaid or paid
52
time off, vacation, unexcused absence, short-term/long-term disability, family medical leave, or other health related absences. Non-worked hours were on average between 4 and 12 hours; corresponding to missing half of an 8-hour shift or all of a 12-hour shift. However, non-worked hours ranged from 15 minutes (i.e. leaving a shift early) to over 100 hours off-work in one day (i.e. ‘cashing in’ paid time off hours). Therefore, to classify when a worker missed a full shift off-work and to exclude the ‘cashing in’ of time off, a full shift off-work was defined as recorded non-working hours that were 50% or longer than the worker’s average working hours (i.e. ≥6 hours for a worker with a mean shift of 12 hours or ≥4 hours for a worker with a mean shift of 8 hours). For the pathway analysis, the percentage of full shifts off-work was defined as the number of full shifts off-work/ (number of full shifts off-work+ number of active shifts).
4.4.5 Statistical Analysis We estimated hazard ratios for incident diabetes and long-term night work exposure using Cox proportional hazards models with attained age as the time scale. We treated cumulative months of night work exposure as a categorical variable and exposure category cut-offs were categorized into years and corresponded nearly to the quantiles of the exposure distribution of the cases. Categories of average percentage of night shifts were defined a priori to define 0% night shifts as the reference group. The categories for any night shift exposure were defined by quantiles of the cases’ exposure distribution and rounded slightly for ease of interpretation. A sensitivity analyses where the categories of average percentage of night work are completely defined by the equal distribution of cases in each quantile was performed. All analyses were stratified by sex within the Cox models (baseline hazard stratified by sex). All Cox models were adjusted for location, job grade, race, annual health status (risk score), calendar year, time between hire and start of follow-up, and cumulative number of full shifts off-work. Tests for trend in each Cox model were performed for each exposure based on the median of each exposure category.(130) All statistical analyses were performed in Stata version 15, 2017 (StataCorp LLC, College Station, TX, USA). The Institutional Review Boards at the University of California, Berkeley, approved this study (Protocol ID: 2010-07-1823).
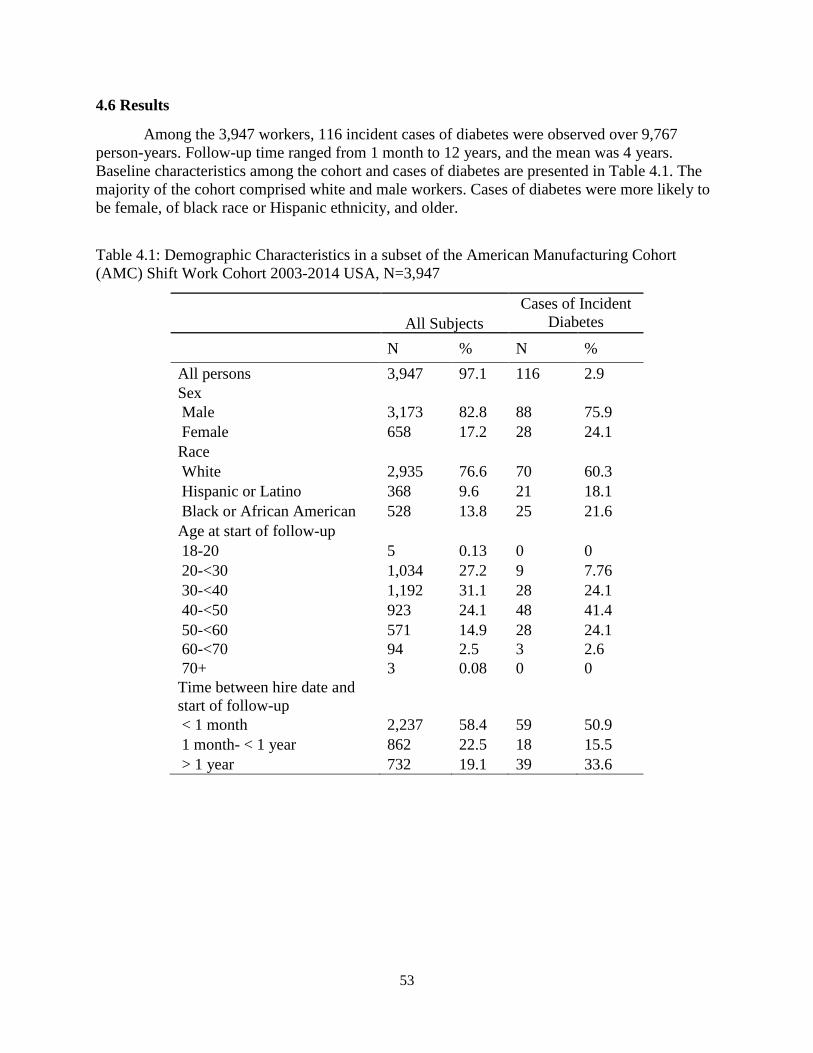
53
4.6 Results
Among the 3,947 workers, 116 incident cases of diabetes were observed over 9,767 person-years. Follow-up time ranged from 1 month to 12 years, and the mean was 4 years. Baseline characteristics among the cohort and cases of diabetes are presented in Table 4.1. The majority of the cohort comprised white and male workers. Cases of diabetes were more likely to be female, of black race or Hispanic ethnicity, and older.
Table 4.1: Demographic Characteristics in a subset of the American Manufacturing Cohort (AMC) Shift Work Cohort 2003-2014 USA, N=3,947
All Subjects Cases of Incident
Diabetes N % N % All persons 3,947 97.1 116 2.9 Sex Male 3,173 82.8 88 75.9 Female 658 17.2 28 24.1 Race White 2,935 76.6 70 60.3 Hispanic or Latino 368 9.6 21 18.1 Black or African American 528 13.8 25 21.6 Age at start of follow-up 18-20 5 0.13 0 0 20-<30 1,034 27.2 9 7.76 30-<40 1,192 31.1 28 24.1 40-<50 923 24.1 48 41.4 50-<60 571 14.9 28 24.1 60-<70 94 2.5 3 2.6 70+ 3 0.08 0 0 Time between hire date and start of follow-up
< 1 month 2,237 58.4 59 50.9 1 month- < 1 year 862 22.5 18 15.5 > 1 year 732 19.1 39 33.6

54
Table 4.2 presents the distribution of the night work exposure metrics by demographic characteristics. The median accumulated months of night work in this cohort was just over a year, and the median annual average percentage of night shifts was 35%. Overall men accumulated more months of night work than women. Women had a lower median annual average percentage of night work than men, but with a larger interquartile range. Cases of diabetes accumulated approximately the same amount of night work during follow-up, but had a higher median annual average intensity than that of the entire cohort. Black workers accumulated the most months of night work and worked the most night shifts, compared with white or Hispanic workers. Older workers accumulated fewer months of night work and worked fewer night shifts in each year over follow-up.
Table 4.2: Distribution of Night Work Exposure Metrics and Demographic Characteristics in a subset of the American Manufacturing Cohort (AMC) Shift Work Cohort 2003-2014 USA, N=3,947
Person-Months
N
Cumulative Months of Night
Work during follow-upa
Median (p25, p75)
Annual Average Percentage of Night
Shifts during follow-upb
Median (p25, p75)
All persons 117,204 14 (1, 29) 35 (2.4 54.4) Cases of Incident Diabetes 2,692 14 (3,24) 38 (3.1, 76.1) Sex Male 100,208 16 (3, 31) 35.8 (3.3, 53.0) Female 16,996 9 (0, 21) 26.1 (0, 84.2) Race White 92,881 14 (2, 29) 33.9 (2.0, 53.3) Hispanic or Latino 10,310 12 (1, 24) 37.4 (1.3, 80.0) Black or African American 14.013 17 (5, 32) 42.1 (10.5, 55.8) Age 18-20 26 0.5 (0, 6) 42.7 (1.9, 88.2) 20-<30 20,981 14 (3, 26) 41.5 (6.7, 52.2) 30-<40 39,449 19 (7, 36) 41.8 (10.3, 54.1) 40-<50 32,097 14 (2, 29) 31.4 (2.0, 59.3) 50-<60 20,610 8 (0, 23) 10.3 (0, 59.7) 60-<70 3,970 3 (0, 19) 0.8 (0, 49.1) 70+ 71 0 (0, 12) 0 (0, 86.1) Time between hire date and start of follow-up
1 month or less 67,397 18 (7, 34) 15 (5, 30) >1 month- < 1 year 23,761 8 (0, 23) 6 (0, 19) ≥ 1 year 26,046 10 (0, 24) 6 (0, 20)
a Units are months. A month of night work is a month with more than three night shifts. b Units are percentages. A night shift is a shift with at least three hours between 23:00 and 6:00.
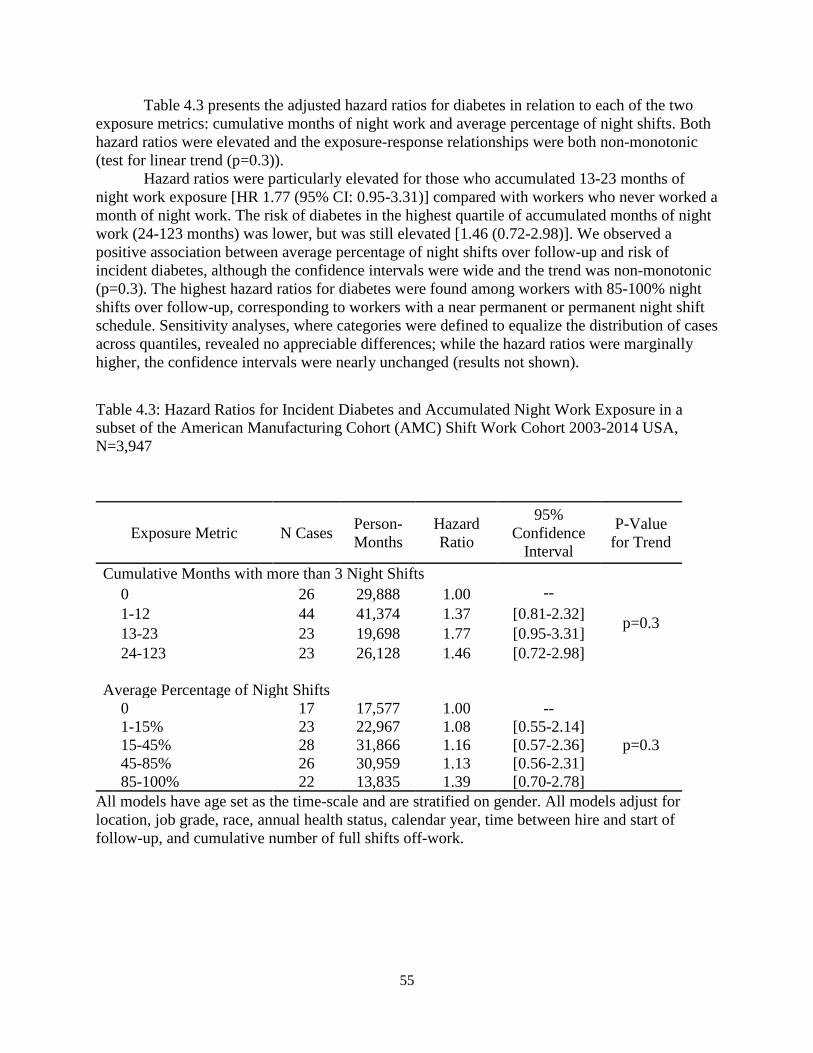
55
Table 4.3 presents the adjusted hazard ratios for diabetes in relation to each of the two exposure metrics: cumulative months of night work and average percentage of night shifts. Both hazard ratios were elevated and the exposure-response relationships were both non-monotonic (test for linear trend (p=0.3)). Hazard ratios were particularly elevated for those who accumulated 13-23 months of night work exposure [HR 1.77 (95% CI: 0.95-3.31)] compared with workers who never worked a month of night work. The risk of diabetes in the highest quartile of accumulated months of night work (24-123 months) was lower, but was still elevated [1.46 (0.72-2.98)]. We observed a positive association between average percentage of night shifts over follow-up and risk of incident diabetes, although the confidence intervals were wide and the trend was non-monotonic (p=0.3). The highest hazard ratios for diabetes were found among workers with 85-100% night shifts over follow-up, corresponding to workers with a near permanent or permanent night shift schedule. Sensitivity analyses, where categories were defined to equalize the distribution of cases across quantiles, revealed no appreciable differences; while the hazard ratios were marginally higher, the confidence intervals were nearly unchanged (results not shown).
Table 4.3: Hazard Ratios for Incident Diabetes and Accumulated Night Work Exposure in a subset of the American Manufacturing Cohort (AMC) Shift Work Cohort 2003-2014 USA, N=3,947
All models have age set as the time-scale and are stratified on gender. All models adjust for location, job grade, race, annual health status, calendar year, time between hire and start of follow-up, and cumulative number of full shifts off-work.
Exposure Metric N Cases Person-Months
Hazard Ratio
95% Confidence
Interval
P-Value for Trend
Cumulative Months with more than 3 Night Shifts
0 26 29,888 1.00 --
p=0.3 1-12 44 41,374 1.37 [0.81-2.32] 13-23 23 19,698 1.77 [0.95-3.31] 24-123 23 26,128 1.46 [0.72-2.98]
Average Percentage of Night Shifts 0 17 17,577 1.00 --
p=0.3
1-15% 23 22,967 1.08 [0.55-2.14] 15-45% 28 31,866 1.16 [0.57-2.36] 45-85% 26 30,959 1.13 [0.56-2.31] 85-100% 22 13,835 1.39 [0.70-2.78]

56
4.7 Discussion
In this cohort study of aluminum manufacturing workers, our results provide some evidence that night work exposure may be associated with an increased risk of diabetes, however, more evidence is needed given the imprecision of the reported estimates. This modest association was seen when night work exposure was classified as either the cumulative number of months of night work or the average percentage of night shifts over follow-up. The cumulative measure captures information about the duration of night work, and the average percentage of night shifts captures the intensity of night work. While the confidence intervals are wide for the hazard ratios comparing average percentage of night shifts to 0% night shift, our findings suggest that both duration and intensity of night work matter for risk of diabetes. Our results are consistent with previous findings for the association of night work and diabetes. A recent meta-analysis reported an adjusted OR of 1.09 (95% CI 1.05-1.12) for any exposure to shift work and risk of diabetes mellitus.(51) Gan et al. also reported a higher risk for rotating workers compared to day workers (1.42, 95% CI 1.19-1.69) and for men compared with women (1.37, 95% CI 1.20-1.56).(51) Additionally, several cohort studies have found increasing risk of diabetes with increasing exposure to night work although the definition of night work exposure varied across studies.(51,67,126–129,131) Recent literature also reports that men are at higher risk for diabetes than women.(49,50,120,132,133) In our study, bivariate analyses indicated that women were more likely to be cases than men. Due to limited sample size, however, we were not able to examine potential effect measure modification by gender in this analysis. Future studies of night workers should examine potential gender differences as an effect modifier of incident diabetes risk. The exposure metrics for night shift work utilized in this study were slightly different than those used in the Nurses’ Health Study, a large longitudinal cohort study of female nurses in the USA that has contributed significantly to the knowledge of the health effects of night work on risk of diabetes.(67,129,134,135) Analyses of the Nurses’ Health Study have considered night work as rotating night work, defined as a month when the nurse worked more than three night shifts while also working day shifts.(67,129) We disagree with the criteria requiring day shifts to be part of the definition as this places permanent night workers in the same reference group as permanent day workers, and therefore assumes the risk for permanent day and permanent night workers is the same. This assumption is based on the theory that permanent night workers are able to maintain a nocturnal schedule on their days off-work. By defining permanent night workers as their own category (those with 85-100% night work) in our analysis we were able to observe that the risk of diabetes is higher for permanent night workers than for non-night workers [HR 1.39 (0.70-2.78)]. Our study has some limitations. Most notably, our study had a relatively short follow-up time and a small number of cases. While some persons were followed for up to 12 years, the mean follow-up time for this cohort was four years. As diabetes is a slow-developing disease, our hazard ratios may be imprecise because our night work exposure metric is only capturing a portion of the etiological relevant exposure. However, there is some evidence that suggests that night work exposure may hasten the progression of diabetes among persons already at risk for diabetes, and our hazard ratios may be capturing that association rather than the association of cumulative long-term impact of night work on diabetes risk.(123,136) We also did not control for the potential impact of smoking, excess adiposity, diet, physical activity, and sleep duration; which are reported risk factors for diabetes as they are likely potential mediators of night work exposure and diabetes.(23,129,134,137–142) For
57
example, night work may increase the likelihood of smoking.(97) Therefore, to assess the total association of night work exposure and diabetes risk, they should not be adjusted for. Additionally, we did not adjust for potential co-exposures of night work such as long working hours or rotations, which have previously been associated with an increased risk of diabetes.(69) Due to the potential for night work shifts to more commonly be long shifts, it is possible that our measurement of night work is picking up some of the association of long working hours on diabetic risk which is a suspected risk factor for diabetes.(69) Our study may also have residual confounding from socioeconomic status and income. Workers with higher socioeconomic status may be working the night shift for personal preference rather than being required due to financial reasons as someone in a lower income group might. While we were unable to control directly for socioeconomic status, we were able to control for job grade. In this cohort, job grade confers different levels of experience, skill level, seniority and prestige. While job grade may control for a portion of the confounding effect of socioeconomic status and income, it is only a proxy for these two more putative measures. Future analysis on this cohort will further explore the role of potential co-exposures of night work, income and socioeconomic status, using available, but not yet synthesized data. Although we restricted our population to those hired after 2003 and adjusted for time between hire and start of follow-up (defined by enrollment in insurance and time-registry system), we may have residual selection bias from left truncation bias. By restricting our population to those hired after 2003, we removed the ‘super-survivors’; those employed for many years and hired potentially decades before the start of follow-up. However, this does not completely eliminate left truncation bias in this cohort as some workers hired after 2003 still had a gap between hire date and start of follow-up due to delays in entering the time-registry system or the insurance plan.(56) This means even those hired after 2003 had to remain employed until they were enrolled in both the insurance and the time-registry system. To completely eliminate left truncation bias, an inception cohort would be required where every worker was observed since hire (no gap between hire date and start of follow-up). Given statistical power concerns, we were not able to restrict to an inception cohort where all employees were hired after the start of follow-up, as this would reduce our cohort by 40% (Table 4.1). A previous study indicates that restriction by hire date, when an inception cohort cannot be achieved, reduces the magnitude, but does not eliminate, bias due to left truncation bias.(56) Therefore, our study is likely to have residual selection bias. Finally, an often overlooked methodological consideration is the potential downward bias from the healthy worker survivor effect (HSWE), a type of selection bias characterized by time-varying confounding affected by prior exposure, where healthier workers acquire more exposure than sick or susceptible workers who modify their exposures by selecting out of work or into less exposed jobs.(117) Health status is likely to be a time-varying confounder affected by prior exposure in studies of night workers as one study reports between 20% and 30% of shift workers switch to day work from night work schedules within 2-3 years and cite health reasons for the switch.(118,119) While the methods developed to control for bias from the HWSE may be analytically complex, a simple pathway analysis can assess the evidence to evaluate if the HWSE is present in a particular study.(143–148) The HWSE is conditional on three associations being present:(146) 1) poor past health predicts less future night work exposure, 2) poor health predicts future diabetes risk, and 3) More night work exposure predicts poorer health status. A pathway analysis for this study was in progress at the time data access was suspended (See section 4.1), and the incomplete results were not included in this chapter. Future work will include completing
58
the pathway analysis and reanalyzing the data using the appropriate statistical analysis (e.g. g-methods) to account for bias from the HSWE.
4.8 Conclusion In conclusion, the results from the Cox models support the hypothesis that night work duration and intensity are associated with an increased risk of diabetes, however, more evidence is needed given the imprecision of the reported estimates. Future work is needed to elucidate this relationship with longer follow-up while examining the potential impacts of co-exposures such as long working hours and effect measure modification by gender and socioeconomic status.
59
Chapter 5 Conclusions 5.1 Summary
In chapter 2, we presented the first description in a manufacturing cohort of the prevalence and co-occurrence of working time characteristics that may lead to circadian rhythm disruption: shift type, intensity, duration, rotational pattern, and weekend work. We highlighted differences in the distribution of these working hour characteristics by race, age, gender, and by annual shift schedule (e.g. permanent day vs. rotating day/night). In particular, we demonstrated that older workers tend to work fewer rotational shifts than their younger counterparts. In chapter 3, we explored the associations between recent night work, rotational work, as well as combinations of the two, and the risk of incident hypertension. We found elevated risk of hypertension among all combinations of night and rotation work compared with non-night workers. We also found the highest risk of hypertension among permanent night workers, suggesting that they are experiencing circadian rhythm disruption even though their work schedules are not rotating. In chapter 4, we examined the relationship between cumulative exposure to night work and incident diabetes risk. Our results provided modest evidence that night work exposure may be associated with an increased risk of diabetes. This association was seen when night work exposure was classified as either the cumulative number of months of night work or the average percentage of night shifts over follow-up.
5.2 Strengths and Significance This work has provided a better understanding of how various shifts and shift schedules may impact worker health. The exposure data were not limited by recall bias and represent actual work time as opposed to assigned work time which may have been modified due to last minute changes such as sickness absence. Additionally, this population of light metal manufacturers is different than other existing datasets with similar time-registry data. For example, our cohort is based in the United States, the majority of our workers are men, and the industry is not healthcare-related. Most existing cohort studies of shift work exposures involve a general population of Scandinavians or American female healthcare workers. While the Scandinavians benefit from a wealth of data registries and the American nurses from a higher propensity to participate in research, their results are not generalizable to other non-healthcare industries. While the AMC workers are from one company, the majority of the geographically diverse plants operate independently with local supervision and individual union contracts. Therefore, the results from the AMC may be generalizable to all manufacturing across America. Furthermore, this research has demonstrated similar elevated risks of night work and rotational work on hypertension and diabetes in a very different worker population. These data also objectively identified hypertension and diabetes based on ICD-9 codes from insurance claims records which confers the advantage of reducing recall bias and loss to follow-up compared with outcome ascertainment surveys. A major strength of this research is its granular classification of shift work and its ability
60
to address exposure misclassification. The data provided the ability to split out different time periods of exposure such as recent work and past work, which may provide insight into the relevant biological exposure windows for increased hypertension and diabetes risk. The large numbers of plants and shift schedules included in the data offer tremendous variability which enabled the characterization of different shift work schedules. Most existing datasets rely on healthcare industries which have uniform shift schedules with only a few variations across hospitals and clinics. The unprecedented amount of detail regarding shift work exposure in this dataset is truly unique and has the potential to shape future research in this area. 5.3 Limitations However, this study had some significant limitations. Although this study reduced exposure misclassification, it did not totally address issues of selection bias and confounding. Given the data available, we were unable to adjust for known confounders of shift work such as income or social economic status which affect a worker’s propensity of working higher paying night shifts and health outcomes. This study also did not account for self-selection into the AMC or shift work jobs within the AMC. In addition to the healthy hire effect, where healthier workers work more strenuous jobs than their unhealthier counterparts, workers may also select into the shift workforce due to financial necessity since shift work pays a premium. Examining the selection mechanisms such as financial motivation for shift work is a topic I am looking forward to examining in the future. This research did not examine potential mediators of shift work and hypertension and diabetes, such as chronotype, smoking, weight gain, eating habits, and exercise habits. Shift work could cause an increase in risk of diabetes and hypertension directly through circadian rhythm disruption or it could indirectly elevate risk through an increase in unhealthy behaviors such as lack of physical activity. Unfortunately, given the nature of the data collected from administrative databases, it is likely that we will never be able to assess these individual mediators in this population. Rather, the results from this population will be focused on the total association of shift work; the direct portion and the indirect portion which proceeds through the hypothesized mediators of lifestyle. Finally, this research is limited by short follow-up and limited number of incident events which restricts analyses to evaluating the associations of more recent exposures or more acute outcomes. While the two time-registry systems collectively cover 12 years, less than 20% of the plants are followed for the full 12 years as most of the plants are followed in one system but not the other. The short follow-up times primarily impacted the analysis in chapter 4 as the confidence intervals for history of night work and diabetes lacked precision.
5.4 Next Steps in Shift Work Research
While shift work cannot realistically be eliminated from work culture, we may be able to reduce the impact of shift work on health by identifying the worst features of working hour schedules. If more specific modifiable components of shift work are identified as pathogenic, such as backward rotating shift schedules, then schedules could be revised to eliminate these components and protect workers’ health. It is my hope that this research is only the beginning of a larger investigation into the role of specific characteristics of working time on people’s health.

61
Bibliography 1. Straif K, Baan R, Grosse Y, Secretan B, Ghissassi F, Bouvard V. IARC Monographs on
the Evaulation of Carcinogenic Risks to Humans. Vol. 98. 2007.
2. Agervold M. Shiftwork-a critical review. Scand J Psychol. 1976;17:181–8.
3. United States Bureau of Labor. Occupational Outlook Handbook: 2004-2005. Jist Publishing; 2004.
4. Stevens RG, Hansen J, Costa G, Rüdiger HW. Considerations of circadian impact for defining “shift work” in cancer studies: IARC Working Group Report. Occup Env Med. 2011;68(6):154–62.
5. Haus E, Smolensky M. Biological clocks and shift work : Orcadian and potential long-term effects. Cancer Causes Control. 2006;17(4):489–500.
6. Arjona A, Silver AC, Walker WE, Fikrig E. Immunity’s fourth dimension: Approaching the circadian-immune connection. Trends Immunol. 2012;33(12):607–12.
7. Haus E, Reinberg A, Mauvieux B, Le Floc’h N, Sackett-Lundeen L, Touitou Y. Risk of obesity in male shift workers: A chronophysiological approach. Chronobiol Int. 2016;0528(July):1–19.
8. Lucey DR, Clerici M, Shearer GM. Type 1 and Type 2 Cytokine Dysregulation in Human Infectious , Neoplastic , and Inflammatory Diseases. Clin Microbiol Rev. 1996;9(4):532–62.
9. Eismann EA, Lush E, Sephton SE. Circadian effects in cancer-relevant psychoneuroendocrine and immune pathways. Psychoneuroendocrinology. 2010;35(7):963–76.
10. Herichova I. Changes of physiological functions induced by shift work. Endocr Regul. 2013;47:159–70.
11. Scheiermann C, Kunisaki Y, Frenette PS. Circadian control of the immune system. Nat Rev Immunol. 2013;13(3):190–8.
12. Curtis AM, Bellet MM, Sassone-Corsi P, O’Neill LAJ. Circadian Clock Proteins and Immunity. Immunity. 2014;40(2):178–86.
13. Castanon-Cervantes O, Wu M, Ehlen JC, Paul K, Gamble KL, Johnson RL, et al. Dysregulation of inflammatory responses by chronic circadian disruption. J Immunol. 2010;185(10):5796–805.
14. Bambra CL, Whitehead MM, Sowden AJ, Akers J, Petticrew MP. Shifting Schedules. The Health Effects of Reorganizing Shift Work. Am J Prev Med. 2008;34(5).

62
15. Mahan R, Carvalhais AB, Queen SE. Sleep reduction in night-shift workers: Is it sleep deprivation or a sleep disturbance disorder? Percept Mot Skills. 1990;70:723–30.
16. Wyse CA, Celis Morales CA, Graham N, Fan Y, Ward J, Curtis AM, et al. Adverse Metabolic and Mental Health Outcomes Associated With Shiftwork in a Population-Based Study of 277 168 Workers in Uk Biobank. Ann Med. 2017;0(0):1–23.
17. Costa G. The impact of shift and night work on health. Appl Ergon. 1996;27(1):9–16.
18. Blask DE. Melatonin, sleep disturbance and cancer risk. Sleep Med Rev. 2009;13(4):257–64.
19. Smith MR, Eastman CI. Shift work: Health, performance and safety problems, traditional countermeasures, and innovative management strategies to reduce circadian misalignment. Nat Sci Sleep. 2012;4:111–32.
20. Mullington JM, Haack M, Toth M, Serrador JM, Meier-ewert HK. Cardivascular, Inflammatory, and Metabolic Consequences of Sleep Deprivation. Prog Cardiovasc Dis. 2009;51(4):294–302.
21. Monk TH, Buysse DJ. Exposure to shift work as a risk factor for diabetes. J Biol Rhythms. 2013;28(5):356–9.
22. Wang X-SS, Armstrong ME. EG, Cairns BJJ, Key T. J, Travis R. C. Shift work and chronic disease: The epidemiological evidence. Occup Med (Chic Ill). 2011;61(2):78–89.
23. Chao C-Y, Wu J-S, Yang Y-C, Shih C-C, Wang R-H, Lu F, et al. Sleep duration is a potential risk factor for newly diagnosed type 2 diabetes mellitus. Metabolism. 2011;60(6):799–804.
24. Haus EL, Smolensky MH. Shift work and cancer risk: Potential mechanistic roles of circadian disruption, light at night, and sleep deprivation. Sleep Med Rev. 2013;17(4):273–84.
25. Arble DM, Bass J, Laposky AD, Vitaterna MH, Turek FW. Circadian Timing of Food Intake Contributes to Weight Gain. Obesity. 2009;17(11):2100–2.
26. Kobayashi D, Takahashi O, Deshpande GA, Shimbo T, Fukui T. Association between weight gain, obesity, and sleep duration: a large-scale 3-year cohort study. Sleep Breath. 2012;16:829–33.
27. Dycke KCG Van, Pennings JLA, Oostrom CTM Van, Linda W. Biomarkers for Circadian Rhythm Disruption Independent of Time of Day. 2015;1–14.
28. Ward EM, Germolec D, Kogevinas M, McCormick D, Vermeulen R, Anisimov VN, et al. Carcinogenicity of night shift work. Lancet Oncol. 2019 Aug 1;20(8):1058–9.
29. Who. Shiftwork. IARC Monogr Eval Carcinog Risks to Humans. 2010;98:562–764.
30. Sephton S, Spiegel D. Circadian disruption in cancer: A neuroendocrine-immune pathway from stress to disease? Brain Behav Immun. 2003;17(5):321–8.
63
31. Rajaratnam SMW, Arendt J. Health in a 24-h society. Lancet. 2001;358(9286):999–1005.
32. Willett WC, Schernhammer ES, Hunter DJ, Laden F, Kawachi I, Colditz GA, et al. Rotating Night Shifts and Risk of Breast Cancer in Women Participating in the Nurses’ Health Study. J Natl Cancer Inst. 2001;93(20):1563–8.
33. Schernhammer ES, Speizer FE, Walter C, Hunter DJ, Fuchs CS, Colditz G a, et al. Night-shift work and risk of colorectal cancer in the nurses’ health study. J NatlCancer Inst. 2003;95(11):825–8.
34. Sookoian S, Gemma C, Fernández Gianotti T, Burgueño A, Alvarez A, González CD, et al. Effects of rotating shift work on biomarkers of metabolic syndrome and inflammation. J Intern Med. 2007;261(3):285–92.
35. Nagaya T, Yoshida H, Takahashi H, Kawai M. Markers of insulin resistance in day and shift workers. Int Arch Occup Env Heal. 2002;75:562–8.
36. Karlsson BH, Knutsson AK, Lindahl B. Is there an association between shift work and having a metabolic syndrome? Results from a population based study of 27,485 people. Occup Environ Med. 2001;58(11):747–52.
37. Karlsson BH, Knutsson AK, Lindahl BO, Alfredsson LS. Metabolic distrubances in male workers with rotating three-shift work. Results of the WOLF study. Int Arch Occup Environ Health. 2003;76(6):424–30.
38. Knutsson A, Kempe A. Shift work and diabetes - A systematic review. Chronobiol Int. 2014;31(10):1–6.
39. Manohar S, Thongrayoon C, Cheungpasitporn W, Mao MA, Hermann SM. Associations of rotational shift work and night shift status with hypertension: a systematic review and meta-analysis. J Hypertens. 2017;35(1):1–9.
40. Alshehri AM. Metabolic syndrome and cardiovascular risk. J Fam Community Med. 2010;17(2):73–8.
41. Tikin T, Forouhi NG, McKeigue PM, Chaturvedi N. The Role of Diabetes and Components of the Metabolic Syndrome in Stroke and Coronary Heart Disease Mortality in U.K. Diabetes Care. 2006;29(9):2127–9.
42. Kadota A, Hozawa A, Okamura T, Kadowak T, Nakmaura K, Murakami Y, et al. Relationship Between Metabolic Risk Factor Clustering and Cardiovascular Mortality Stratified by High Blood Glucose. Diabetes Care. 2007;30:1533–8.
43. Esposito K, Chiodini P, Colao A, Lenzi A, Giugliana D. Metabolic Syndrome and Risk of Cancer: A systematic review and meta-analysis. Diabetes Care. 2012;35:2402–11.
44. CDC. High Blood Pressure Fact Sheet [Internet]. Division for Heart Disease and Stroke Prevention. 2016. p. 1–3. Available from: http://www.cdc.gov/dhdsp/data_statistics/fact_sheets/docs/fs_bloodpressure.pdf

64
45. American Heart Association. What is High Blood Pressure [Internet]. The Facts About High Blood Pressure. 2019 [cited 2019 Aug 30]. Available from: https://www.heart.org/en/health-topics/high-blood-pressure/the-facts-about-high-blood-pressure/what-is-high-blood-pressure
46. Rotenberg L, Silva-costa A, Vasconcellos-silva PR, Griep RH. Work schedule and self-reported hypertension – the potential beneficial role of on-shift naps for night workers. Chronobiol Int. 2016;33(6):697–705.
47. Lu K, Chen J, Wang L, Wang C, Ding R, Wu S, et al. Association of sleep duration, sleep quality and shift-work schedule in relation to hypertension prevalence in chinese adult males: A cross-sectional survey. Int J Environ Res Public Health. 2017;14(210):1–12.
48. Yeom JH, Sim CS, Lee J, Yun SH, Park SJ, Yoo C-I, et al. Effect of shift work on hypertension: cross sectional study. Ann Occup Environ Med. 2017;29(11):1–7.
49. Classification and diagnosis of diabetes mellitus and other categories of glucose intolerance. Diabetes. 1979;28(12):1039–57.
50. Diagnosis and classification of diabetes mellitus. Diabetes Care. 2014;37(SUPPL.1):81–90.
51. Gan Y, Yang C, Tong X, Sun H, Cong Y, Yin X, et al. Shift work and diabetes mellitus: a meta-analysis of observational studies. Occup Environ Med. 2014;1(1):1–8.
52. Elser H, Neophytou AM, Tribett E, Galusha D, Modrek S, Noth EM, et al. Cohort Profile: The American Manufacturing Cohort (AMC) study. Int J Epidemiol. 2019;
53. Noth EM, Dixon-Ernst C, Liu S, Cantley L, Tessier-Sherman B, Eisen EA, et al. Development of a job-exposure matrix for exposure to total and fine particulate matter in the aluminum industry. J Expo Sci Environ Epidemiol. 2013;24(1):89–99.
54. Neophytou AM, Picciotto S, Costello S, Eisen EA. Occupational Diesel Exposure, Duration of Employment, and Lung Cancer. Epidemiology. 2016;27(1):1.
55. Clougherty JE, Slade MD, Cullen MR, Eisen EA, Kawachi I. Workplace status and risk of hypertension among hourly and salaried aluminum manufacturing employees. Soc Sci Med. 2009;68(2):304–13.
56. Costello S, Neophytou AM, Brown DM, Noth EM, Hammond SK, Cullen MR, et al. Incident Ischemic Heart Disease After Long-Term Occupational Exposure to Fine Particulate Matter : Accounting for 2 Forms of Survivor Bias. Am J Epidemiol. 2016;183(9):861–8.
57. Hamad R, Modrek S, Kubo J, Goldstein BA, Cullen MR. Using “big data” to capture overall health status: Properties and predictive value of a claims-based health risk score. PLoS One. 2015;10(5):1–14.
58. Liu S, Noth EM, Dixon-Ernst C, Eisen EA, Cullen MR, Hammond SK. Particle Size Distribution in Aluminum Manufacturing Facilities. Env Pollut. 2014;3(4):79–88.

65
59. Gschwandtner T, Gartner J, Aigner W, Miksch S. A Taxonomy of Dirty Time-Oriented Data. Int Fed Inf Process. 2012;58–72.
60. Harma M, Ropponen A, Hakola T, Koskinen A, Vanttola P, Puttonen S, et al. Developing register-based measures for assessment of working time patterns for epidemiologic studies. Scand J Work Env Heal. 2015;41(3):268–79.
61. Demetriades S, Pedersini R. Working time in the EU and other global economies. European Foundation for the Improvement of Living and Working Conditions; 2008.
62. Straif K, Baan R, Grosse Y, Secretan B, Ghissassi F El, Bouvard V, et al. Carcinogenicity of shift-work, painting, and fire-fighting. Lancet Oncol. 2007;8:1065–6.
63. Hansen J. Night Shift Work and Risk of Breast Cancer. Curr Environ Heal reports. 2017;4(3):325–39.
64. Costa G. Shift Work and Health: Current Problems and Preventive Actions. Saf Health Work. 2010;1(2):112–23.
65. Mustard CA, Chambers A, McLeod C, Bielecky A, Smith PM. Work injury risk by time of day in two population-based data sources. Occup Environ Med. 2013;70(1):49–56.
66. Nielsen H, Larsen AD, Dyreborg J, Hansen AM, Pompeii LA, Conway SH, et al. Risk of injury after evening and night work-findings from the Danish Working Hour Database. 2011;(c):631–9.
67. Pan A, Schernhammer ES, Sun Q, Hu FB. Rotating Night Shift Work and Risk of Type 2 Diabetes : Two Prospective Cohort Studies in Women. PLoS Med. 2011;8(12):1–8.
68. Morikawa Y, Nakagawa H, Miura K, Ishizaki M, Soyama Y, Kido T, et al. Shift work and the risk of diabetes mellitus among Japanese male factory workers. Scand J Work Env Heal. 2005;31(3):179–83.
69. Kivimäki M, Virtanen M, Kawachi I, Nyberg ST, Alfredsson L, Batty GD, et al. Long working hours, socioeconomic status , and the risk of incident type 2 diabetes : a meta-analysis of published and unpublished data from 222 120 individuals. Lancet. 2015;3:27–34.
70. Lu YC, Wang CP, Yu TH, Tsai IT, Hung WC, Lu IC, et al. Shift work is associated with metabolic syndrome in male steel workers ‑ the role of resistin and WBC count ‑ related metabolic derangements. Diabetol Metab Syndr. 2017;1–7.
71. Lin Y, Hsiao T, Chen P. Persistent Rotating Shift-Work Exposure Accelerates Development of Metabolic Syndrome among Middle-Aged Female Employees : A Five- Year Follow-Up. 2009;0528(November 2016).
72. Wang F, Zhang L, Zhang Y, Zhang B, He Y, Xie S, et al. Meta-analysis on night shift work and risk of metabolic syndrome. Obes Rev. 2014;15(9):709–20.
73. Ferguson JM, Costello S, Neophytou A, Balmes J, Bradshaw P, Cullen M, et al. Night and rotational work exposure within the last 12 months and risk of incident hypertension. Scand J Work Env Heal Online-first. 2018;0–11.

66
74. Härmä M, Karhula K, ina Ropponen A, mpsa Puttonen S, Koskinen A, Ojajärvi A, et al. Association of changes in work shifts and shift intensity with change in fatigue and disturbed sleep: a within-subject study. Scand J Work Environ Health. 2018;(c):0–9.
75. Garde AH, Harris A, Vedaa Ø, Bjorvatn B, Hansen J, Hansen ÅM, et al. Working hour characteristics and schedules among nurses in three Nordic countries – a comparative study using payroll data. BMC Nurs. 2019;18(1):12.
76. Garde AH, Hansen J, Kolstad HA, Larsen AD, Pedersen J, Petersen JD, et al. Payroll data based description of working hours in the Danish regions. Chronobiol Int. 2018;00(00):1–6.
77. Cuzick J. A wilcoxon‐type test for trend. Stat Med. 1985;4(4):543–7.
78. Zoonekynd V, Gama J. Statistics with R [Internet]. Vincent Zoonekynd and Abo Akademi University; 2012. Available from: http://zoonek2.free.fr/UNIX/48_R/03.html
79. Knauth P. Designing better shift systems. Appl Ergon. 1996;27(1):39–44.
80. Moreno CR, Marqueze EC, Sargent C, WRIGHT Jr KP, Ferguson SA, Tucker P, et al. Working Time Society consensus statements: Evidence-based effects of shift work on physical and mental health. Ind Health. 2019;1–51.
81. Ghaziri M El, Dugan AG, Zhang Y, Gore R, Castro ME. Sex and Gender Role Differences in Occupational Exposures and Work Outcomes Among Registered Nurses in Correctional Settings. Ann Work Expo Heal. 2019;1–15.
82. Costa G. Factors influencing health of workers and tolerance to shift work. Theor Issues Ergon Sci. 2003;4(3):4–263.
83. Morris CJ, Purvis TE, Mistretta J, Hu K, Scheer FAJ. Circadian Misalignment Increases C-Reactive Protein and Blood Pressure in Chronic Shift Workers. J Biol Rhythms. 2017;32(2):154–64.
84. Ohlander J, Keskin M, Stork J, Radon K. Shift Work and Hypertension : Prevalence and Analysis of Disease Pathways in a German Car Manufacturing Company. Am J Ind Med. 2015;58:549–60.
85. Brown DM, Petersen M, Costello S, Noth EM, Hammond SK, Cullen MR, et al. Occupational Exposure to PM2.5 and Incidence of Ischemic Heart Disease. Epidemiology. 2015;26(6):806–14.
86. Tessier-Sherman B, Galusha D, Cantley LF, Cullen MR, Rabinowitz PM, Neitzel RL. Occupational noise exposure and risk of hypertension in an industrial workforce. Am J Ind Med. 2017;(August):1–8.
87. Cullen MR, Vegso S, Cantley L, Galusha D, Rabinowitz P, Taiwo O, et al. Use of medical insurance claims data for occupational health research. J Occup Environ Med. 2006;48(10):1054–61.
88. Tessier-Sherman B, Galusha D, Taiwo OA, Cantley L, Slade MD, Kirsche SR, et al. Further validation that claims data are a useful tool for epidemiologic research on
67
hypertension. BMC Public Health. 2013;13(1):51.
89. LLC P. Prescribers’ Digital Reference [Internet]. 2018 [cited 2018 Sep 16]. Available from: http://www.pdr.net/
90. Centers for Disease Control. Defining Adult Overweight and Obesity [Internet]. Overweight & Obesity. [cited 2018 Jul 3]. Available from: https://www.cdc.gov/obesity/adult/defining.html
91. Neophytou AM, Costello S, Brown DM, Picciotto S, Noth EM, Hammond SK, et al. Marginal Structural Models in Occupational Epidemiology: Application in a Study of Ischemic Heart Disease Incidence and PM2.5 in the US Aluminum Industry. Am J Epidemiol. 2014;180(6):608–15.
92. Cleves M, Gould WW, Marchenko Y V. An Introduction to Survival Analysis Using Stata. 3rd ed. College Station, TX: StataCorp LP; 2016.
93. Harrel FEJ. Regression Modeling Strategies: With Applications to Linear Model, Logistic Regression, and Survival Analysis. Springer. New York; 2001.
94. Peplonska B, Burdelak W, Krysicka J, Burkowski A, Marcinkiewicz A, Sobala W, et al. Night Shift Work and Modifiable Lifestyle Factors. Int J Occup Med Environ Health. 2014;27(5):693–706.
95. Kim M-J, Son K-H, Park H-Y, Choi D-J, Yoon C-H, Lee H-Y, et al. Association between shift work and obesity among female nurses: Korean Nurses’ Survey. BMC Public Health. 2013;13(1):1204.
96. Nea FM, Kearney J, Livingstone MBE, Pourshahidi LK, Corish CA. Dietary and lifestyle habits and the associated health risks in shift workers. Nutr Res Rev. 2015;28:143–66.
97. van Amelsvoort LG, Jansen NW, Kant IjJ. Smoking among shift workers: More than a confounding factor. Chronobiol Int. 2006;23(6):1105–13.
98. Azur MJ, Stuart EA, Frangakis C, Leaf PJ. Multiple Imputation by Chained Equations: What is it and how does it work? Int J Methods Psychiatr Res. 2011;20(1):40–9.
99. Royston P, White I. Multiple Imputation by Chained Equations (MICE): Implementation in Stata. J Stat Softw. 2011;45(4).
100. Rubin DB. Multiple Imputation for Nonresponse in Surveys. New York: John Wiley & Sons; 1987.
101. Chen J, Lin Y, Hsiao S. Obesity and High Blood Pressure of 12-Hour Night Shift Female Clean-Room Workers. Chronobiol Int. 2010;27(2):334–44.
102. Burdelak W, Bukowska A, Krysicka J, Peplonska B. Night Work and Health Status of Nurses and Midwives. Cross-Sectional Study. Med Pr. 2012;63(5):517–29.
103. Violanti JM, Owens SL, Fekedulegn D, Ma CC, Charles LE, Andrew ME. An Exploration of Shift Work, Fatigue, and Gender Among Police Officers: The BCOPS Study. Workplace Health Saf. 2018;10(November):216507991875458.
68
104. Morikawa Y, Nakagawa H, Miura K, Ishizaki M, Nishijo M, Higashiguchi K, et al. Relationship between shift work and onset of hypertension in a cohort of manual workers. Scand J Work Env Heal. 1999;25(2):100–4.
105. Ceide ME, Pandey A, Olafiranye O, Pandey AK, Donat M, Brown CD, et al. Linking sleep duration to night shift-work and hypertension. In: Sleep. Amer Acad Sleep Medicine; 2012. p. A203–A203.
106. Sfreddo C, Fuchs SC, Merlo R, Fuchs DF. Shift Work Is Not Associated with High Blood Pressure or Prevalence of Hypertension. PLoS One. 2010;5(12):1–5.
107. Sakata K, Suwazono Y, Harada H, Okubo Y, Kobayashi E, Nogawa K. The Relationship Between Shift Work and the Onset of Hypertension in Male Japanese Workers. J Occup Environ Med. 2003;45(9):1002–6.
108. Oishi M, Suwazono Y, Sakata K, Okubo Y, Harada H, Kobayashi E, et al. A longitudinal study on the relationship between shift work and the progression of hypertension in male Japanese workers. J Hypertens. 2005;23(12):2173–8.
109. Ellingsen T, Bener A, Gehani A. Study of shift work and risk of coronary events. J R Soc Promot Health. 2007;127(6):265–7.
110. Suwazono Y, Dochi M, Sakata K, Okubo Y, Oishi M, Tanaka K, et al. Shift Work Is a Risk Factor for Increased Blood Pressure in Japanese Men A 14-Year Historical Cohort Study. Hypertension. 2008;
111. Hublin C, Partinen M, Koskenvuo K, Silventoinen K, Koskenvuo M, Kaprio J. Shift-work and cardiovascular disease : a population-based 22-year follow-up study. Eur J Epidemiol. 2010;25(5):315–23.
112. Kantermann T, Duboutay F, Haubruge D, Darling AL, Berry JL, Kerkhofs M, et al. The direction of shift-work rotation impacts metabolic risk independent of chronotype and social jetlag – An exploratory pilot study. Chronobiol Int. 2014;31(10):1139–45.
113. van Amelsvoort LG, Jansen NW, Swaen GM, van den Brandt PAPA, Kant IjJ, VanAmelsvoort LG, et al. Direction of shift rotation among three-shift workers in relation to psychological health and work-family conflict. Scand J Work Environ Health. 2004;30(2):149–56.
114. Rothman KJ, Greenland S, Lash TL. Modern epidemiology. Lippincott Williams & Wilkins; 2008.
115. Stokholm ZA, Bonde P, Christensen KL, Hansen ÅM, Kolstad HA. Occupational Noise Exposure and the Risk of Hypertension. Epidemiology. 2013;24(1):135–42.
116. Costello S, Brown DM, Noth EM, Cantley L, Slade MD, Tessier-Sherman B, et al. Incident ischemic heart disease and recent occupational exposure to particulate matter in an aluminum cohort. J Expo Sci Environ Epidemiol. 2014;24(1):82–8.
117. Brown DM, Picciotto S, Costello S, Neophytou AM, Izano MA, Ferguson JM, et al. The Healthy Worker Survivor Effect: Target Parameters and Target Populations. Curr Environ Heal Reports. 2017;1–9.

69
118. Harrington J. Shift work and health--a critical review of the literature on working hour. Ann Acad Med Singapore. 1994;23(5):699–705.
119. Kuhn G. Circadian rhythm, shift work, and emergency medicine. Ann Emerg Med. 2001;37(1):88–98.
120. Zimmet P, Alberti KGMM, Shaw J. Global and Societal Implications of the diabetes epidemic. Nature. 2001;414:782–7.
121. Van Cauter E. Sleep disturbances and insulin resistance. Diabet Med. 2011;28(12):1455–62.
122. Dendup T, Feng X, Clingan S, Astell-burt T. Environmental Risk Factors for Developing Type 2 Diabetes Mellitus : A Systematic Review. 2018;
123. Gale JE, Cox HI, Qian J, Block GD, Colwell CS, Matveyenko A V. Disruption of circadian rhythms accelerates development of diabetes through pancreatic beta-cell loss and dysfunction. J Biol Rhythms. 2011;26(5):423–33.
124. Szosland D. Shift work and metabolic syndrome, diabetes mellitus and ischaemic heart disease. Int J Occup Med Environ Health. 2010;23(3):287–91.
125. Najafian J, Mohamadifard N, ZD S, Sadri G, Rahmati M. Association between sleep duration and diabetes mellitus: Isfahan Healthy Heart Program. Niger J Clin Pract. 2013;16(1):59–62.
126. Hansen AB, Stayner L, Hansen J, Andersen ZJ. Night shift work and incidence of diabetes in the Danish Nurse Cohort. Occup Env Med. 2016;73(4):262–8.
127. Ika K, Suzuki E, Mitsuhashi T, Takao S, Doi H. Shift Work and Diabetes Mellitus among Male Workers in Japan:Does the Intensity of Shift Work Matter? Acta Med Okayama. 2013;67(1):25–33.
128. Vetter C, Dashti HS, Lane JM, Anderson SG, Schernhammer ES, Rutter MK, et al. Night shift work, genetic risk, and type 2 diabetes in the UK biobank. Diabetes Care. 2018;41(4):762–9.
129. Shan Z, Li Y, Zong G, Guo Y, Li J, Manson JE, et al. Rotating night shift work and adherence to unhealthy lifestyle in predicting risk of type 2 diabetes : results from two large US cohorts of female nurses. Br Med J. 2018;17–9.
130. Vittinghoff E, Glidden D V, Shiboski SC, McCulloch CE. Regression methods in biostatistics: linear, logistic, survival, and repeated measures models. Springer Science & Business Media; 2011.
131. Vimalananda VG, Palmer JR, Gerlovin H, Wise LA, Rosenzweig JL, Rosenberg L, et al. Night-shift work and incident diabetes among African-American women. Diabetologia. 2015;58(4):699–706.
132. Silva-costa A, Rotenberg L, Nobre AA, Schmidt MI, Chor D, Griep RH. Gender-specific association between night-work exposure and type-2 diabetes : results from longitudinal study of adult health, ELSA-Brasil. Scand J Work Env Heal. 2018;41(6):569–78.
70
133. Kautzky-Willer A, Harreiter J, Pacini G. Sex and gender differences in risk, pathophysiology and complications of type 2 diabetes mellitus. Endocr Rev. 2016;37(3):278–316.
134. Hu FB, Manson JE, Stampfer MJ, Colditz GA, Liu S, Solomon CG, et al. Diet, Lifestyle, and the Risk of Type 2 Diabetes Mellitus in Women. N Engl J Med. 2001;345(11):790–7.
135. Kroenke CH, Spiegelman D, Manson J, Schernhammer ES, Colditz A, Kawachi I, et al. Work Characteristics and Incidence of Type 2 Diabetes in Women. Am J Epidemiol. 2007;165(2):175–83.
136. Florez JC. Newly identified loci highlight beta cell dysfunction as a key cause of type 2 diabetes: Where are the insulin resistance genes? Diabetologia. 2008;51:1100–10.
137. van Drongelen BA, Boot CRL, Merkus SL, Smid T, van der Beek AJ. The effects of shift work on body weight change - A systematic review of longitudinal studies. Scand J Work Environ Heal. 2011;37(4):263–75.
138. Hulsegge G, Boer JMA, van der Beek AJ, Verschuren WMM, Sluijs I, Vermeulen R, et al. Shift workers have a similar diet quality but higher energy intake than day workers. Scand J Work Environ Heal. 2016;42(6):1–10.
139. Ding Ding, Kenny D Lawson, Tracy L Kolbe-Alexander, Eric A Finkelstein, Peter T Katzmarzyk, Willen van Mechelen, et al. The economic burden of physical inactivity: a global analysis of major non-communicable diseases. Lancet. 2016;388(10051):1311–24.
140. Pan A, Wang Y, Talaei M, Hu FB, Wu T. Relation of active, passive, and quitting smokine with incident diabetes: a meta-analysis and systematic review. Lancet Diabetes Endocrinol2. 2015;3(12):958–67.
141. Guo Y, Liu Y, Huang X, Rong Y, He M, Wang Y, et al. The Effects of Shift Work on Sleeping Quality, Hypertension and Diabetes in Retired Workers. PLoS One. 2013;8(8):1–6.
142. Vetter C, Devore EE, Ramin CA, Speizer FE, Willett WC, Schernhammer ES. Mismatch of sleep and work timing and risk of type 2 diabetes. Diabetes Care. 2015;38(9):1707–13.
143. Chevrier J, Picciotto S, Eisen E a. A Comparison of Standard Methods With G-estimation of Accelerated Failure-time Models to Address The Healthy-worker Survivor Effect. Epidemiology. 2012;23(2):212–9.
144. Robins J. A New Approach to Causal Inference in Mortality Studies with a Sustained Exposure Period -Application to Control of the Healthy Worker Survivor Effect. Math Model. 1986;7:1393–512.
145. Robins JM, Hernán MA, Brumback B. Marginal Structural Models and Causal Inference in Epidemiology. Epidemiology. 2000;11(5):550–60.
146. Garcia E, Picciotto S, Costello S, Bradshaw PT, Eisen EA. Assessment of the healthy worker survivor effect in cancer studies of the United Autoworkers-General Motors cohort. Occup Environ Med. 2017;74(4):294–300.

71
147. Naimi AI, Cole SR, Kennedy EH. An introduction to G Methods. Int J Epidemiol. 2016;0(0):1–7.
148. Naimi AI, Cole SR, Hudgens MG, Brookhart MA, Richardson DB. Assessing the component associations of the healthy worker survivor bias: Occupational asbestos exposure and lung cancer mortality. Ann Epidemiol. 2013;23(6):334–41.