City Council Agenda - Meeting 18-2019 - Report COU-19-150
229
City of Kingston Information Report to Council Report Number 19-150 To: Mayor and Members of Council From: Lanie Hurdle, Acting Chief Administrative Officer Resource Staff: Julie Salter-Keane, Community Project Manager Date of Meeting: July 9, 2019 Subject: Deep Water Dock & Cruise Ships Options Update Executive Summary: In 2018, by way of Report Number 18-210, City Council approved $500,000 to support the investigation and dredging work for a deep water dock. Council also directed staff to continue discussions to explore short-term and long-term partnership options with the private property owner at 1 Queen Street. Report Number 17-282, endorsed by Council in November 2017, had identified 55 Ontario and 1 Queen Street as two (2) potential locations in the downtown area that could support a future deep water dock. 1 Queen Street was identified as a more central location in the downtown area with anticipated lower costs to renovate and stabilize the dock. Since that time, staff have worked with Riggs Engineering to continue the investigation related to the assessment of the structure, navigation lines and dredging requirements. This report is intended to provide Council with an update on the current status of the engineering assessment of the private structure, updated cost estimates and the next steps staff will be undertaking to complete additional assessments and review all options in order to support Council’s strategic priorities. The result of the engineering assessment has determined that there are improvements needed with respect to the structural stabilization of the private wharf at 1 Queen Street. These improvements are required prior to any dredging work in order for it to be utilized as a deep water dock for smaller to medium size cruise ships. A mooring dolphin with gangway to the wharf would also be required to extend the length of the berthing face in order to accommodate the Pearl Mist and M/V Victory I and II, which are considered to be medium size cruise ships. Riggs has estimated the wharf rehabilitation works, including the addition of a mooring dolphin and contingency, at $2,280,000. In addition, the consultant has indicated that the permitting requirement for the dredging work will be onerous. The overall estimate for the dredging costs, including contingencies, is a
-
Upload
khangminh22 -
Category
Documents
-
view
1 -
download
0
Transcript of City Council Agenda - Meeting 18-2019 - Report COU-19-150
City of Kingston Information Report to Council
Report Number 19-150
To: Mayor and Members of Council From: Lanie Hurdle, Acting Chief Administrative Officer Resource Staff: Julie Salter-Keane, Community Project Manager Date of Meeting: July 9, 2019 Subject: Deep Water Dock & Cruise Ships Options Update
Executive Summary:
In 2018, by way of Report Number 18-210, City Council approved $500,000 to support the investigation and dredging work for a deep water dock. Council also directed staff to continue discussions to explore short-term and long-term partnership options with the private property owner at 1 Queen Street. Report Number 17-282, endorsed by Council in November 2017, had identified 55 Ontario and 1 Queen Street as two (2) potential locations in the downtown area that could support a future deep water dock. 1 Queen Street was identified as a more central location in the downtown area with anticipated lower costs to renovate and stabilize the dock. Since that time, staff have worked with Riggs Engineering to continue the investigation related to the assessment of the structure, navigation lines and dredging requirements.
This report is intended to provide Council with an update on the current status of the engineering assessment of the private structure, updated cost estimates and the next steps staff will be undertaking to complete additional assessments and review all options in order to support Council’s strategic priorities.
The result of the engineering assessment has determined that there are improvements needed with respect to the structural stabilization of the private wharf at 1 Queen Street. These improvements are required prior to any dredging work in order for it to be utilized as a deep water dock for smaller to medium size cruise ships. A mooring dolphin with gangway to the wharf would also be required to extend the length of the berthing face in order to accommodate the Pearl Mist and M/V Victory I and II, which are considered to be medium size cruise ships. Riggs has estimated the wharf rehabilitation works, including the addition of a mooring dolphin and contingency, at $2,280,000.
In addition, the consultant has indicated that the permitting requirement for the dredging work will be onerous. The overall estimate for the dredging costs, including contingencies, is a
Information Report to Council Report Number 19-150
July 9, 2019
Page 2 of 7
minimum of $820,000. This estimate assumes that the City will be able to partner with the Ministry of Transportation on its dredging contract for the ferry dock expansion. Structural and in water works, especially with anticipated contaminated soil, usually have the highest risks as it relates to unforeseen costs; therefore, a higher contingency (30%) is being recommended for these cost estimates.
An estimate has also been received from a landscape architect for the redevelopment and beautification of the wharf for a cruise ship dock facility. This cost estimate is $1,400,000 and includes landscaping, sidewalks, lighting and a small cruise terminal to provide safe and pleasant arrival and departures of passengers. It is important to note that the dredging and improvements to the structure would not enable the docking of larger cruise ships, such as the Hamburg, which has close to 420 passengers.
Staff have been advised by the property owner of its interest in the future redevelopment of the property located at 1 Queen Street for another use. This property currently has land use approvals for the development of a hotel. Considering the limited footprint of the property, it is anticipated that most of the property, if not all, would be required during the redevelopment for staging and construction. The timing of redevelopment would most likely create some disruption to the operation of the cruise ship terminal and the continuous service to the cruise ship passengers. Staff would need to review alternative options during that period of time to continue to support cruise ship operations. There could be additional costs during that redevelopment period to continue to support the cruise ship industry.
On April 16, 2019, Council endorsed the Integrated Destination Strategy (IDS) (Report Number 19-119) and directed staff to work through the implementation of City of Kingston led initiatives included in the Kingston IDS. One of these initiatives and one of Council’s strategic priorities is to position Kingston as a key cruise tourism hub.
In 2018, the City of Kingston, working with seven other municipalities, completed an assessment of the cruise ship market in the Great Lakes. The Great Lakes Cruise Strategy and the Cruise Industry Strategic Action Plan (Exhibit A) will assist staff and Tourism Kingston (TK) in the development of the operational and marketing plan for the cruise ship terminal.
Based on revised and updated numbers, the investment required at 1 Queen Street would be a minimum of $4,500,000. Staff recognize that the City would have to manage all risks and liability related to the development of the deep water dock at 1 Queen Street; therefore, staff will continue to assess all options for the deep water dock, including refining estimates.
The findings from the Great Lakes Cruise Strategy have estimated that in 2021, forty mid-size cruise ships will stop in Kingston should there be a deep water dock. This number increases to approximately fifty-one by 2028. Staff will work with TK to develop an operational and marketing plan for a deep water dock for cruise ships. In accordance with the Council Strategic Priorities Implementation Plan, staff will report back to Council with a plan no later than 2020.

Information Report to Council Report Number 19-150
July 9, 2019
Page 3 of 7
Recommendation:
This report is for information purposes only.
Information Report to Council Report Number 19-150
July 9, 2019
Page 4 of 7
Authorizing Signatures:
Lanie Hurdle, Acting Chief Administrative Officer
Consultation with the following Members of the Corporate Management Team:
Deanne Roberge, Acting Commissioner, Corporate Enterprise Services
Not required
Peter Huigenbos, Acting Commissioner, Community Services
Jim Keech, President & CEO, Utilities Kingston Not required
Desirée Kennedy, Chief Financial Officer & City Treasurer Not required
Sheila Kidd, Commissioner, Transportation & Public Works Not required

Information Report to Council Report Number 19-150
July 9, 2019
Page 5 of 7
Options/Discussion:
Since 2017, staff have been working with Tourism Kingston (TK) on short term cruise ship options to market Crawford Wharf. Efforts over the last couple of years to market Kingston as a cruise ship port have already shown an increase in the number of cruise ships visiting Kingston and the trend continues through the end of 2020. The number of cruise ship passengers has almost doubled from 2017 to 2019. The passengers of these medium size cruise ships have to be tendered to shore as the City currently does not have the appropriate deep water dock facility with the necessary water depth. Staff recognize that this approach has to be temporary (over the next couple of years) in order to ensure that Kingston can continue to maintain and grow this market.
Staff will continue to work with TK to implement the Great Lakes Cruise Strategy and the Cruise Industry Action Plan that was completed in 2018 for the eight municipalities along the Great Lakes, including Kingston. One of the key recommendations from the strategy is that each port organizes an effective “Cruise Network” including port operations, tourism and local businesses that would take on the role of Business to Business (B2B) with the cruise industry. Staff are currently working on the structure of the network in collaboration with TK.
Over the last year, working with staff from TK and Cruise Ontario, City staff have been marketing Kingston as a cruise destination in order to attract more cruise lines. Staff have identified some potential for additional cruise lines at the existing Crawford dock over the next couple of years.
In addition to marketing Crawford Wharf, staff have been reviewing options for a long term solution related to a deep water dock for cruise ships. A report was presented to Council in November 2017 which reviewed four (4) locations (Crawford Wharf, 1 Queen Street, 55 Ontario Street and the Coal Dock) for a future deep water dock (Report Number 17-282). There were three (3) potential downtown locations (Crawford Wharf, 1 Queen Street and 55 Ontario Street). Crawford Wharf is under municipal ownership but it is anticipated that the development of a deep water dock at that location would have higher costs related to both the amount of dredging and structural extension required to accommodate the depth and the length of medium cruise ships. The 55 Ontario Street location was identified as a location that could accommodate larger cruise ships, such as the Hamburg, with some dredging, but the issue was the costs to renovate and stabilize the actual dock structure. The 55 Ontario Street location has an estimated 7 minute walk to City Hall. The property located at 1 Queen Street was identified as a preferred option due to the anticipated lower costs of renovation and its more central location (estimated 4 minute walk to City Hall), even if the location would not be able to accommodate the larger cruise ships such as the Hamburg. Staff retained the services of Riggs Engineering to proceed with the assessment of the existing wharf to determine the feasibility of establishing a cruise ship terminal in this location.
The results of the engineering assessment have determined that there are improvements needed with respect to the structural stabilization of the private wharf, which are required prior to any dredging work, in order to operate it as a deep water dock. In addition to the wharf wall stabilization, mooring structures including concrete parapet with bollard bases, pipe curb,
Information Report to Council Report Number 19-150
July 9, 2019
Page 6 of 7
ladders, fenders and bollards would be required along the south wharf face in the area of the proposed cruise ship berthing. A mooring dolphin with gangway to the wharf would also be required to extend the length of the berthing face in order to accommodate the Pearl Mist and M/V Victory I and II, which are mid-size cruise ships. The cost estimate for the wharf rehabilitation, including the dolphin, is $2,280,000, including a contingency. An estimate has also been received from a landscape architect for the wharf improvements and beautification needed for the operation of a cruise ship terminal. This estimate is $1,400,000 which includes landscaping, sidewalks, light fixtures and a terminal building.
The dredging along the Queen Street Wharf is estimated to generate up to 1,800 cubic metres of material. This material is likely contaminated from historical industrial use and, once dewatered, would need to be trucked to an appropriately licensed disposal facility. The overall estimate for the dredging costs, including the demobilization and contingencies, is approximately $820,000. This amount is based on the assumption that the City will partner with MTO on its dredging contract.
In addition, the consultant has indicated that the permitting requirement for the dredging work will be onerous due to timing. The assumption from Riggs is that the structural work would be completed under the same approvals as the dredging contract given scheduling considerations and the fact that the structural works are required to be in place prior to the dredging. If this is not the case, timing of both the dredging and structural work become a constraint in the approval process.
Staff have also been advised by the property owner of its interest in redeveloping the property located at 1 Queen Street. It is anticipated that continuous service to the cruise ship passengers would be impacted while the private development occurs. At a minimum, the City would have to provide a tendering service for medium size cruise ships. Based on the potential market in the Great Lakes Cruise Strategy, it is anticipated that the City could possibly have to offer tendering to forty (40) cruise ships in 2021 and up to fifty-one (51) cruise ships in 2028. Based on recent tendering costs, it is anticipated that this could add a cost of $60,000 to $150,000. It is important to note that the investments to improve and beautify the wharf in order to provide a positive passenger experience would be removed should the redevelopment of the property take place. The future type of use has not yet been determined but the property does have land use approvals for the construction of a hotel. The integration of a more permanent deep water dock facility on that property would have to be discussed and agreed to with the property owner.
It is anticipated that the neighbouring MTO Wolfe Island Ferry Terminal and its ferry schedule will somewhat constrain the entry and exit of cruise ships into the dock at 1 Queen Street. Typically, cruise ships give way to ferries due to their scheduling commitments. Therefore, cruise ships will need to enter and exit at times that will keep the channel clear for the ferries.
Based on discussions with TK, the development of a cruise ship terminal is a project that has been identified for potential funding from the Municipal Accommodation Tax (MAT) in order to reduce the impact on local taxpayers and invest those funds in attracting and welcoming cruise ship tourism. Decisions on the allocation of MAT funds are made jointly by TK, Kingston Accommodation Partners (KAP) and the City.

Information Report to Council Report Number 19-150
July 9, 2019
Page 7 of 7
Existing Policy/By-Law:
Not applicable
Notice Provisions:
Not applicable
Accessibility Considerations:
Not applicable
Financial Considerations:
Council approved a capital budget amendment in the amount of $500,000, funded from the Environment Reserve Fund, for staff to complete the dredging work for the waterlot located next to 1 Queen Street. An updated cost estimate for the dredging is $820,000 which now includes a 30% contingency. $2,280,000 is required for the wharf rehabilitation works, including the mooring dolphin, staff project management and $1,400,000 for the landscaping improvements to the wharf for the operation as a cruise ship terminal.
Contacts:
Lanie Hurdle, Acting Chief Administrative Officer 613-546-4291 extension 1231
Julie Salter-Keane, Community Projects Manager 613-546-4291 extension 1163
Other City of Kingston Staff Consulted:
Not applicable
Exhibits Attached:
Exhibit A Great Lakes Cruise Strategy for Ontario Ports and Cruise Industry Strategic Plan
GREAT LAKES CRUISE STRATEGY
FOR ONTARIO’S PORTS
TASK 2: BUSINESS CASE AND CRUISE INDUSTRY STRATEGIC ACTION PLAN
Prepared for:
TOWN OF MIDLAND
August, 2018
Exhibit A Report Number 19-150

GREAT LAKES CRUISE STRATEGY FOR ONTARIO’S PORTS – TASK 2: BUSINESS CASE AND CRUISE INDUSTRY STRATEGIC ACTION PLAN
2
DISCLAIMER Bermello Ajamil & Partners, Inc. (“B&A”) has produced this document consistent with: (i) the level of diligence ordinarily exercised by competent professionals practicing in the area under the same or similar circumstances; and (ii) the time and budget available for its work, to ensure that the data contained in this document are accurate as of the date of its preparation. This document is based on estimates, assumptions and other information developed by B&A and/or provided by other third parties and from its independent research effort, general knowledge of the industry, and information provided via consultations with the Client and the Client's representatives. B&A has served solely in the capacity of consultant and has not rendered any expert opinions in connection with the subject matter hereof. Any changes made to the document, or any use of the document not specifically identified in the agreement between the Client and B&A or otherwise expressly approved in writing by B&A, shall be at the sole risk of the party making such changes or adopting such use. No responsibility is assumed for inaccuracies in reporting by the Client, the Client's agents and representatives, or any third‐party data source used in preparing or presenting this document. B&A assumes no duty to update the information contained herein unless it is separately retained to do so pursuant to a written agreement signed by B&A and the Client. B&A’s findings represent its professional judgment. Neither B&A nor its respective affiliates, makes any warranty, expressed or implied, with respect to any information or methods disclosed in this document. Any recipient of this document other than the Client, by their acceptance or use of this document, releases B&A and its affiliates from any liability for direct, indirect, consequential or special loss or damage whether arising in contract, warranty (express or implied), tort or otherwise, and irrespective of fault, negligence and strict liability. This document was prepared solely for use by the Client. No party may rely on this document except the Client or a party so authorized by B&A in writing (including, without limitation, in the form of a reliance letter). Any party who is entitled to rely on this document may do so only on the document in its entirety and not on any excerpt or summary. Entitlement to rely upon this document is conditioned upon the entitled party accepting full responsibility and not holding B&A liable in any way for any impacts on the forecasts or the earnings resulting from changes in "external" factors such as changes in government policy, in the pricing of commodities and materials, price levels generally, competitive alternatives to the project, the behavior of consumers or competitors and changes in the owners’ policies affecting the operation of their projects, acts of war, terrorism, general economic factors, issues associated with safety of cruise ships and operations, or other issues that may affect the tourism and leisure business. This document may include “forward‐looking statements”. These statements relate to B&A’s expectations, beliefs, intentions or strategies regarding the future. These statements may be identified by the use of words like “anticipate,” “believe,” “estimate,” “expect,” “intend,” “may,” “plan,” “project,” “will,” “should,” “seek,” and similar expressions. The forward‐looking statements reflect B&A’s views and assumptions with respect to future events as of the date this document was produced and are subject to future economic conditions, and other risks and uncertainties. Actual and future results and trends could differ materially from those set forth in such statements due to various factors, including, without limitation, those discussed in this document. These factors are beyond B&A’s ability to control or predict. Accordingly, B&A makes no warranty or representation that any of the
Exhibit A Report Number 19-150
GREAT LAKES CRUISE STRATEGY FOR ONTARIO’S PORTS – TASK 2: BUSINESS CASE AND CRUISE INDUSTRY STRATEGIC ACTION PLAN
3
projected values or results contained in this document will actually be achieved. This document is qualified in its entirety by, and should be considered in light of, these limitations, conditions and considerations. Specifically:
This document includes forecasts, projections and other predictive statements that represent our assumptions and expectations considering currently available information.
Forward looking statements apply only as of the date of this document and are expressly qualified in their entirety by the cautionary statements included in this document.
These forecasts are based on industry trends, and subject to circumstances involving current users, the economy, political issues, and other factors, and they involve risks, variables and uncertainties. Large variations may occur from year to year as certain vessels join or are withdrawn from the market.
The actual performance results may differ from those projected, consequently, no guarantee is presented or implied as to the accuracy of specific forecasts, projections or predictive statements contained herein.
Inevitably, some assumptions will not materialize, and unanticipated events and circumstances may affect the ultimate results. Issues such as accidents, taxes, terrorism and financial markets may have significant impacts on the actual results.
Exhibit A Report Number 19-150
GREAT LAKES CRUISE STRATEGY FOR ONTARIO’S PORTS – TASK 2: BUSINESS CASE AND CRUISE INDUSTRY STRATEGIC ACTION PLAN
4
TABLE OF CONTENTS
DISCLAIMER __________________________________________________________________2
TABLE OF CONTENTS ___________________________________________________________ 4
FIGURES _____________________________________________________________________ 7
TABLES ____________________________________________________________________ 8
GLOSSARY OF TERMS ___________________________________________________________ 9
EXECUTIVE SUMMARY __________________________________________________________ 14 Key Cruise Action Items _____________________________________________________________________________________ 15 Great Lakes and Ontario Ports Growth Opportunities _____________________________________________________________ 15 Infrastructure Needs and Use ________________________________________________________________________________ 17 Economic Impacts _________________________________________________________________________________________ 18 Primary Organization and Structure ___________________________________________________________________________ 19 Strategic Action Plan _______________________________________________________________________________________ 20 Action Plan Budget Items ___________________________________________________________________________________ 21 Summary _________________________________________________________________________________________________ 21
1. INTRODUCTION ____________________________________________________________ 22
2. CRUISE MARKET ASSESSMENT: ENVIRONMENTAL SCAN _______________________________ 23 The Global Cruise Industry ___________________________________________________________________________________ 23 Global Forecast ____________________________________________________________________________________________ 24 Key Trends _______________________________________________________________________________________________ 25 Consumer Demand ________________________________________________________________________________________ 26 Current Status of Great Lakes Cruising _________________________________________________________________________ 30 Regional Regulatory Environment ____________________________________________________________________________ 32 Competitive Analysis _______________________________________________________________________________________ 41 Strengths, Weaknesses, Opportunities & Threats (SWOT) _________________________________________________________ 50 Summary of Conclusions ____________________________________________________________________________________ 52 Ontario Port Overview ______________________________________________________________________________________ 54
3. CRUISE MARKET OPPORTUNITIES: CRUISE PASSENGER FORECASTS _______________________ 60 Overview _________________________________________________________________________________________________ 60 Great Lakes Cruise Projections _______________________________________________________________________________ 61 Growth in Great Lakes Historic Cruises _________________________________________________________________________ 63 Projection Approach 1 – Market Capture _______________________________________________________________________ 65 Projection Approach 2 – Vessel Deployment Scenarios ____________________________________________________________ 65 Range of Growth Opportunity _______________________________________________________________________________ 70 Conclusions about Great Lakes Projections _____________________________________________________________________ 72 Ontario Ports’ Passenger Traffic ______________________________________________________________________________ 73 Passenger and Cruise Calls ___________________________________________________________________________________ 74
Exhibit A Report Number 19-150
GREAT LAKES CRUISE STRATEGY FOR ONTARIO’S PORTS – TASK 2: BUSINESS CASE AND CRUISE INDUSTRY STRATEGIC ACTION PLAN
5
Berth Demand ____________________________________________________________________________________________ 77 Berth Demand Conclusions __________________________________________________________________________________ 78
4. CRUISE ECONOMIC IMPACTS _________________________________________________ 80 Overview _________________________________________________________________________________________________ 80 Summary of Conclusions ____________________________________________________________________________________ 91
5. CRUISE DESIGN VESSEL AND FACILITY REQUIREMENTS _______________________________ 93 Vessel Characteristics (Small Ships) ____________________________________________________________________________ 93 Cruise Facilities and Upland Requirements ______________________________________________________________________ 98 Homeport Facility Components _____________________________________________________________________________ 100 Port‐of‐Call Options _______________________________________________________________________________________ 102 Best Practices ____________________________________________________________________________________________ 104 Alaska – (Skagway) Case Study ______________________________________________________________________________ 105 Alaskan Small‐Ship Adventure Market, 2017 ____________________________________________________________________ 106
6. BUSINESS CASE & CRUISE STRATEGIC ACTION PLAN __________________________________111 Overview ________________________________________________________________________________________________ 111 Port and Soft Tourism Infrastructure Assessment (Key Ontario Ports and Great Lakes Overview) ________________________ 111 Key Action Plan Elements __________________________________________________________________________________ 143 Planning Needs – B2C, B2B _________________________________________________________________________________ 146 Ontario Cruise Brand Development Option ____________________________________________________________________ 147 Positioning the Great Lakes on the Global Cruise Map ___________________________________________________________ 148 Cruise Tourism Marketing & Promotions ______________________________________________________________________ 149 Strategic Marketing Targets ________________________________________________________________________________ 150 Marketing Communication Strategy Drivers ___________________________________________________________________ 151 Cruise Line Strategy and Approach ___________________________________________________________________________ 152 Local Cruise Network and Product Development _______________________________________________________________ 156 Local Ontario and other Port based Cruise Network Activities _____________________________________________________ 158 Recommendations ________________________________________________________________________________________ 160 Regional Brand Leader / Local Cruise Network Coordinators ______________________________________________________ 162 Consumer Motivators _____________________________________________________________________________________ 163 Cruise Brand Messaging ____________________________________________________________________________________ 163 One Message ____________________________________________________________________________________________ 164
7. DETAILED ROADMAP AND STRATEGIC ACTION PLAN _________________________________ 166 Overview ________________________________________________________________________________________________ 166 Action Plan ______________________________________________________________________________________________ 167 Regulatory (Capital and Finance) ____________________________________________________________________________ 168 Operations ______________________________________________________________________________________________ 168 Tourism Product Development ______________________________________________________________________________ 169 Marketing & Capacity Building ______________________________________________________________________________ 170 Operations and Marketing Synergy __________________________________________________________________________ 171 Assembling the Issues and Meeting the Challenges _____________________________________________________________ 171 Strategic Plan Outline ______________________________________________________________________________________ 172 Summary ________________________________________________________________________________________________ 173
Exhibit A Report Number 19-150
GREAT LAKES CRUISE STRATEGY FOR ONTARIO’S PORTS – TASK 2: BUSINESS CASE AND CRUISE INDUSTRY STRATEGIC ACTION PLAN
6
ANNEX A: LARGE CRUISE VESSEL FLEET INFORMATION ___________________________________ 174 Cruise Industry Consolidation and Deployment Strategies ________________________________________________________ 174 Industry Capacity, Market Segmentation, and Passenger Demographics ____________________________________________ 175
ANNEX B: SMALL CRUISE SHIP COMPANIES ___________________________________________ 178 Top small ship cruise brands ________________________________________________________________________________ 178
ANNEX C: CRUISE SHIPS ABLE TO TRANSIT GREAT LAKES LOCKS (2020) _______________________ 189
ANNEX D: 2018/2019 GREAT LAKES ITINERARIES ______________________________________ 195
ANNEX E: ONTARIO PORTS – 2018 CRUISE LINE SURVEY _________________________________202
ANNEX F: ONTARIO PORTS – 2018 PORT AND DESTINATION SURVEY _______________________ 206
ANNEX G: ONTARIO PORTS PROFILE (SUMMARY TABLE) ________________________________ 209
ANNEX H: CRUISE CANADA NEW ENGLAND (CCNE) ALLIANCE (PLAN EXAMPLE) ________________ 211
ANNEX I: STRATEGIC ACTION PLAN (SPREADSHEET) ____________________________________ 219
Exhibit A Report Number 19-150

GREAT LAKES CRUISE STRATEGY FOR ONTARIO’S PORTS – TASK 2: BUSINESS CASE AND CRUISE INDUSTRY STRATEGIC ACTION PLAN
7
FIGURES
Figure 1: Global Cruise Passengers, 1995 ‐ 2017 ....................................................................................................................................................................... 23 Figure 2: Global Cruise Growth Projections, 2018 ‐ 2037 ...................................................................................................................................................... 24 Figure 3: Cruise Consumer Market Penetration, 2016 .......................................................................................................................................................... 26 Figure 4: Great Lakes Compulsory Pilotage Areas ................................................................................................................................................................ 38 Figure 5: Primary Cruise Regions, Ranked By Deployment, 2017 ..................................................................................................................................... 41 Figure 6: Expected CNE Region Cruise Passenger Growth Range, 2018 ‐ 2035 .............................................................................................................. 48 Figure 7: Great Lakes Cruise Zones ............................................................................................................................................................................................ 62 Figure 8: Great Lakes Historic Cruise Passenger Throughput, 2009 – 2018 ................................................................................................................... 63 Figure 9: Great Lakes Historic Cruise Sailings, 2009 – 2018 ................................................................................................................................................. 64 Figure 10: Great Lakes Historic Cruise Passengers per Sailing, 2009 – 2018 ................................................................................................................... 64 Figure 11: Market Capture Passenger Projections, 2009 ‐ 2028 ......................................................................................................................................... 65 Figure 12: Passenger Projections of Deployment Scenarios, 2009 ‐ 2028 ....................................................................................................................... 68 Figure 13: Vessel Call Projection, 2009 ‐ 2028 .......................................................................................................................................................................... 68 Figure 14: Passengers per Call Projection, 2009 ‐ 2028 .................................................................................................................................................... 69 Figure 15: Passenger Projection Range of Opportunity, 2009 ‐ 2028 ............................................................................................................................... 70 Figure 16: Sailing‐Projection Range of Opportunity, 2009 ‐ 2028 ................................................................................................................................... 70 Figure 17: Projected Passengers‐per‐Sailing Range of Opportunity, 2009 ‐ 2028 ........................................................................................................ 71 Figure 18: Percentage of Revenue Passengers and Cruise Calls per Port, 2019 ‐ 2028 ................................................................................................ 73 Figure 19: Passengers per Sailing Projection Range of Opportunity, 2009 ‐ 2028 ....................................................................................................... 74 Figure 20: Monthly Cruise Berth Demand, 2009 ‐ 2019 ........................................................................................................................................................ 77 Figure 21: Projected Monthly Cruise Berth Demand, 2019 ‐ 2028 ...................................................................................................................................... 77 Figure 22: Flow of Economic Impacts Generated by Cruise Vessel Activity ................................................................................................................... 80 Figure 23: Primary Cruise Terminal Requirements.............................................................................................................................................................. 101 Figure 24: Homeport Passenger Movements, 600‐Passenger Vessel ........................................................................................................................... 101 Figure 25: Port‐of‐Call Passenger Movements, 200‐Passenger Vessel .......................................................................................................................... 103 Figure 26: Alaska Passenger Throughput, 2002 ‐ 2017 ....................................................................................................................................................... 105 Figure 27: Alaska Seasonality, 2012 ‐ 2017 ............................................................................................................................................................................... 105 Figure 28: Skagway Cruise Passenger Throughput, 1996 ‐ 2016 ...................................................................................................................................... 107 Figure 29: City of Kingston ......................................................................................................................................................................................................... 113 Figure 30: Town of Little Current ............................................................................................................................................................................................. 117 Figure 31: Town of Midland ....................................................................................................................................................................................................... 121 Figure 32: Town of Parry Sound ............................................................................................................................................................................................... 125 Figure 33: City of Sault Sainte Marie ....................................................................................................................................................................................... 129 Figure 34: City of Thunder Bay .................................................................................................................................................................................................. 133 Figure 35: City of Toronto/Toronto Port Authority ............................................................................................................................................................ 136 Figure 36: City of Windsor ........................................................................................................................................................................................................ 140 Figure 37: Sample Cruise Network Organizational Outline .............................................................................................................................................. 158 Figure 38: Delivering One Message ......................................................................................................................................................................................... 165 Figure 39: Assembling the Issues and Meeting the Challenges ....................................................................................................................................... 166 Figure 40: Major Worldwide Cruise Line Passenger Capacity, 2017 ............................................................................................................................... 175
Exhibit A Report Number 19-150

GREAT LAKES CRUISE STRATEGY FOR ONTARIO’S PORTS – TASK 2: BUSINESS CASE AND CRUISE INDUSTRY STRATEGIC ACTION PLAN
8
Tables
Table 1: Top 20 Potential Great Lakes Cruise Operators, Ranked by Number of Vessels in 2020 ............................................................................ 28 Table 2: Top 20 Potential Great Lakes Cruise Operators, Ranked by Passenger Capacity in 2020 .......................................................................... 29 Table 3: Great Lakes Cruise Itineraries, 2018 ‐ 2020 ............................................................................................................................................................... 30 Table 4: Cruise Line Survey Results ............................................................................................................................................................................................ 57 Table 5: Great Lakes Revenue Passengers and Cruise Calls, 2019 ‐ 2028 ......................................................................................................................... 71 Table 6: LOW Revenue Passenger and Cruise Calls, 2019 ‐ 2028 ....................................................................................................................................... 74 Table 7: MEDIUM Revenue Passenger and Cruise Calls, 2019 ‐ 2028 ................................................................................................................................ 75 Table 8: HIGH Revenue Passenger and Cruise Calls, 2019 ‐ 2028 ....................................................................................................................................... 76 Table 9: Potential Economic Impacts of Cruise Vessel Sailings in Ontario, MEDIUM / HIGH ..................................................................................... 86 Table 10: Potential Economic Impacts of Cruise Vessel Sailings in Ontario by Port 2019 (PROJECTED) ................................................................ 88 Table 11: Potential Economic Impacts of Cruise Vessel Sailings in Ontario by Port 2023 (MEDIUM / HIGH) ......................................................... 88 Table 12: Potential Economic Impacts of Cruise Vessel Sailings in Ontario by Port 2028 (MEDIUM / HIGH) ......................................................... 89 Table 13: Potential Impacts of Cruise Tourism Development in Ontario, 2019 – 2028 and Totals, NPV ................................................................ 90 Table 14: Top 20 Potential Great Lakes Cruise Operators, Ranked by Number of Vessels in 2020 ......................................................................... 94 Table 15: Small Ship Newbuilds on Order, 2018 ‐ 2022 .......................................................................................................................................................... 95 Table 16: Current and Future Great Lakes Vessel Range .................................................................................................................................................... 97 Table 17: Design Vessel Template .............................................................................................................................................................................................. 97 Table 18: Ontario Port Cruise Facility and Upland Requirements ................................................................................................................................... 100 Table 19: Alaska Small Ship Fleet, 2017 ................................................................................................................................................................................... 106 Table 20: Kingston Business Case, 2019, 2023, 2028 ............................................................................................................................................................ 112 Table 21: Kingston SWOT Assessment ................................................................................................................................................................................... 115 Table 22: Little Current Business Case, 2019, 2023, 2028 .................................................................................................................................................... 116 Table 23: Little Current SWOT Assessment .......................................................................................................................................................................... 119 Table 24: Midland Business Case, 2019, 2023, 2028 ............................................................................................................................................................. 120 Table 25: Midland SWOT Assessment .................................................................................................................................................................................... 123 Table 26: Parry Sound Business Case, 2019, 2023, 2028 ..................................................................................................................................................... 124 Table 27: Town of Parry Sound SWOT Assessment ........................................................................................................................................................... 127 Table 28: Sault Ste. Marie Business Case, 2019, 2023, 2028 ............................................................................................................................................... 128 Table 29: Sault Ste. Marie SWOT Assessment ...................................................................................................................................................................... 131 Table 30: Thunder Bay Business Case, 2019, 2023, 2028 .................................................................................................................................................... 132 Table 31: Thunder Bay SWOT Assessment ............................................................................................................................................................................ 134 Table 32: Toronto Business Case, 2019, 2023, 2028 ............................................................................................................................................................. 135 Table 33: Toronto SWOT Assessment .................................................................................................................................................................................... 138 Table 34: Windsor Business Case, 2019, 2023, 2028 ............................................................................................................................................................ 139 Table 35: Windsor SWOT Assessment ................................................................................................................................................................................... 142 Table 36: Marketing Approach Definitions ........................................................................................................................................................................... 151 Table 37: Tour Participant Motivators ................................................................................................................................................................................... 170 Table 38: Action Plan Budget Items ........................................................................................................................................................................................ 172 Table 39: Major Worldwide Cruise Line & Brand Passenger Capacity, 2017 ................................................................................................................ 176 Table 40: High Potential Great Lakes Cruise Operators – Market Positions and Demographic Profiles............................................................. 184 Table 41: Cruise Ships Able to Transit Great Lakes Locks, 2020 ....................................................................................................................................... 189
Exhibit A Report Number 19-150

GREAT LAKES CRUISE STRATEGY FOR ONTARIO’S PORTS – TASK 2: BUSINESS CASE AND CRUISE INDUSTRY STRATEGIC ACTION PLAN
9
GLOSSARY OF TERMS Air Draft The maximum height of a vessel above the waterline. Apron Area immediately adjacent to the vessel berth where lines, provisioning, gangway, and other operations occur. Available Passenger Cruise Days (APCD) The formula cruise lines typically use to assess and compare cruise itineraries from a financial perspective. Anchorage Location where a vessel may anchor. In destinations where docks are not present to accommodate vessel operations, anchorages are used, and passengers are shuttled to/from the cruise vessel to a landside location using a small boat (tender). Anchorages are generally only used in ports‐of‐call. B2B A marketing term meaning Business to Business. B2C A marketing term meaning Business to Consumer. Beam The width of the cruise vessel at its widest point. Bed (Berth) Nights A typical cruise industry form of capacity measurement representing the number of lower berths (a bed on a cruise vessel, with the aggregate total generally determining the vessel’s nominal passenger capacity), multiplied by nights of operation in a region. Berth (1) A bed, generally attached to the deck and/or bulkhead onboard a vessel. (2) An anchorage or dock space for a vessel in port. Bunkers Marine fuel used for propulsion. Cabotage Laws Legislation and/or regulation relating to the ability of foreign‐flagged vessels to transport goods and passengers between domestic ports. Cabotage Laws are often put into place to protect domestic cruise vessel industries.
Exhibit A Report Number 19-150

GREAT LAKES CRUISE STRATEGY FOR ONTARIO’S PORTS – TASK 2: BUSINESS CASE AND CRUISE INDUSTRY STRATEGIC ACTION PLAN
10
Capacity (Lower Berth) The number of beds of standard height on a cruise vessel. The number of lower berths determines the vessel’s nominal passenger capacity. Maximum Passenger Capacity refers to the total number of passengers that can be accommodated on the cruise vessel, in lower berths and other flexible berths (also referred to as upper berths). Concessionaire This term is used interchangeably with Terminal Operator throughout this report. Conventional Cruises (i.e., Cruises) Leisure‐oriented voyages on deep‐water, oceangoing cruise vessels of two or more nights, often to a variety of destinations (i.e., port of calls). Conventional cruises are offered either by regional or international operators marketing to a variety of consumer sectors and nationalities. Cruise Brand Term referring to individual cruise vessel operating companies (e.g., Royal Caribbean International, Celebrity Cruises, Azamara Club Cruises) to distinguish them from their corporate holding companies (e.g., Royal Caribbean Cruises, Ltd). The terms cruise brand and cruise line are sometimes used interchangeably. However, for purposes of this report, cruise brand refers specifically to each individual company that operates a fleet of same‐brand cruise vessels (e.g., Celebrity), while cruise line refers more generally to the corporate holding company (e.g., RCCL). Cruise Line For the purposes of this report, cruise line is used to describe a corporate holding company with one or more cruise brand(s) operating under its corporate umbrella. Carnival Corporation and Plc, for example, is a cruise line parent company that owns and operates 10 distinct global cruise brands, namely Carnival Cruise Line, Princess Cruises, Costa Crociere, AIDA Cruises, Holland America Line, P&O Cruises, P&O Cruises Australia, Cunard Line, Seabourn Cruise Line, and Carnival Asia. Cruises to Nowhere (i.e., Homeport Cruises without Destination) Generally geared toward a local consumer market (within a one‐hour drive) with the mainstay of the cruise experience being focused around onboard gaming, food and entertainment. Deadweight Tonnage Refers to the actual weight of cargo, fuel, and stores required to bring the vessel down to her load‐line marks. Displacement Tonnage The amount of water displaced by the vessel, or the actual weight of the vessel. This measure is not often used to describe cruise vessels, but it is meaningful in describing military vessels and the structural capacity of port and terminal facilities. It is typically applied to a vessel in normal operating state (i.e., with fuel and stores onboard). Dockage Fees levied by a port or destination for the right to dock a vessel.
Exhibit A Report Number 19-150

GREAT LAKES CRUISE STRATEGY FOR ONTARIO’S PORTS – TASK 2: BUSINESS CASE AND CRUISE INDUSTRY STRATEGIC ACTION PLAN
11
Draft The depth of water required by a vessel to float; the measurement in meters (or feet) of the extent to which the vessel projects below the surface of the water. Emission Control Area (ECA) Geographic boundaries established through treaties to provide for decreased NOx and SOx emissions in select zones, such as North America and Europe. Ferry Term usually applied to a vessel transporting passengers and/or vehicles from point to point. The key difference between these operations and conventional cruises is that the primary purpose of ferry operations is to focus offering transportation services, not a travel and leisure experience. Gross Tonnage (GT) A measure of a vessel’s enclosed volume. This term has emerged as the standard measure of communicating a vessel’s size. A mega‐vessel generally refers to a vessel of 70,000 GT or larger. Ground Transportation Area (GTA) Zone in which vehicles, including buses, taxis, and private cars, are organized and accessed as part of cruise terminal/destination embarkation and disembarkation activities. Homeport A marine facility and destination that serves as base of operations, from which the cruise begins and/or terminates. Itinerary Sailing routes and ports visited on a given cruise. Two itinerary types are generally observed. Open‐jaw (OJ) itineraries refer involves the cruise beginning at one homeport and ending at another. Roundtrip (RT) or Closed‐jaw itineraries—the more common type observed—begin and end at the same homeport. In Bond Secured baggage transits directly to / from the port / airport, has customs approval allowing for a single inspection. Interporting The practice of allowing cruise passengers to embark and debark in multiple ports throughout an itinerary pattern, which is similar (to some degree similar) to a ferry on a longer routing. Length Overall (LOA) Total length of a cruise vessel in meters (or feet), including any incidental structure that may extend this dimension. Liquefied Natural Gas (LNG) Liquefied Natural Gas is a fuel that is seeing use in the marine industry. Ferry operators and small cruise vessels have built vessels with this fuel source. There are currently 19 newbuilds with LNG fuel as a source of propulsion on order.
Exhibit A Report Number 19-150
GREAT LAKES CRUISE STRATEGY FOR ONTARIO’S PORTS – TASK 2: BUSINESS CASE AND CRUISE INDUSTRY STRATEGIC ACTION PLAN
12
Mixed‐Use Facility Refers to a facility or complex with more than one type of real estate or operational use. Mixed‐use facilities are generally (1) are contiguous in nature; (2) developed within a broader master plan, constructed at one time or in phases; and (3) provide for a symbiotic relationship to occur among all uses, such that the sum of mixed‐use facility from a real estate or operational perspective is greater than its parts. Neo‐Panamax Vessels with this classification are of the maximum dimensions that will fit through the newest set of locks in operation by the Panama Canal (427 m/1,401 ft long by 55 m/180 ft wide by 18.3 m/60 ft in depth). Net Present Value (NPV) Difference between the present value of cash inflows and the present value of cash outflows over a period of time. Panamax Vessels with this classification are of the maximum dimensions that will fit through the original locks of the Panama Canal (304 m long by 33.5 m wide by 25.9 m deep). Thus, a Panamax vessel will usually have dimensions of close to 294 m/965 ft long by 32.3 m/106 ft wide by 12.04 m/39.5 ft in depth. See Beam. Passenger Tax (Head Tax) Port charge assessed against each passenger aboard a standard cruise vessel. It is generally the principal income stream to ports and destinations for accommodating cruise activities. Peak (or Peaking) Period of greatest intensity of use or volume. Peak days for port‐of‐call cruise activity, for example, may be mid‐week, since those are the days that, on average, see the greatest number of cruise ship calls and/or passenger debarkations during the course of a given cruise season. Penetration Rate Percentage of the total population of a given region that takes a cruise in a given year. For example, in 2016, North America had a penetration rate per cruise of 2.3% (13.34 million cruisers/579 million total population). Port Authority (PA) Governmental or quasi‐governmental public authority for a special‐purpose district usually formed by a legislative body (or bodies) to oversee and/or operate ports and other maritime, aviation, road, and/or rail transportation infrastructure. Port of Call (POC) One of several destinations visited as part of a cruise itinerary. The focus of the port of call is on tourism activities adjacent to the cruise arrival area and the transportation of passengers to regional points of interest.
Exhibit A Report Number 19-150

GREAT LAKES CRUISE STRATEGY FOR ONTARIO’S PORTS – TASK 2: BUSINESS CASE AND CRUISE INDUSTRY STRATEGIC ACTION PLAN
13
Post‐Panamax Size standard that exceeds the largest vessel dimension capable of transiting the original Panama Canal locks (304 m long by 33.5 m wide by 25.9 m in depth). Generally based on the beam and LOA of the vessel. See Beam. Private Island Island destinations primarily located in the Caribbean and Central America that are owned and/or developed for exclusive or semi‐exclusive use by a single cruise company (cruise line) and its proprietary brands. Revenue Passenger This term generally refers to homeport passengers or, in some very limited cases, port‐of‐call passengers (e.g., Vancouver, where all passengers are charged on/off the vessel), whereby passenger counts reflect the Port’s passenger wharfage or tariff rate charging policy. For homeport calls, the actual number of passengers is doubled to show the cruise operator is charged by the port for the passenger embarking / debarking the vessel at a set fee. Ro‐Ro Maritime term for roll‐on/roll‐off cargo (such as passenger vehicles, semi‐trailer trucks, trailers, buses, railcars, and tanks) that are driven on and off the ship under their own power or using a platform vehicle (such as a truck and trailer or self‐propelled modular transporter). Seaway Max Refers to vessels that are the maximum size and can fit through the canal locks of the St. Lawrence Seaway, linking the inland Great Lakes of North America with the Atlantic Ocean. Super‐Post Panamax Generally refers to the largest cruise vessels in existence today. This term refers to the largest cargo vessels in existence today. These vessels are defined by both their dimensions and their carrying capacity, of more than 3,000+ passengers and GT, approaching and exceeding 150,000. Terminal Building where cruise passengers embark and/or debark in a homeport destination. Terminal Operator (TO) Entity with primary responsibility for managing marine terminal and related operations on a daily basis, usually under contract, to a public port authority or other public or quasi‐public ownership interest. This term is used interchangeably with Concessionaire throughout this report. Use Ratio (Utilization Percentage) The ratio of days that a berth is actually occupied to available berth days (total calls / available berth days). For example, in a year‐round market, a single berth is theoretically available for a total of 365 days. If that berth receives 52 calls (one vessel sailing weekly roundtrip itineraries year‐round), then its use ratio is .142, or 14.2% (52/365).
Exhibit A Report Number 19-150
GREAT LAKES CRUISE STRATEGY FOR ONTARIO’S PORTS – TASK 2: BUSINESS CASE AND CRUISE INDUSTRY STRATEGIC ACTION PLAN
14
EXECUTIVE SUMMARY
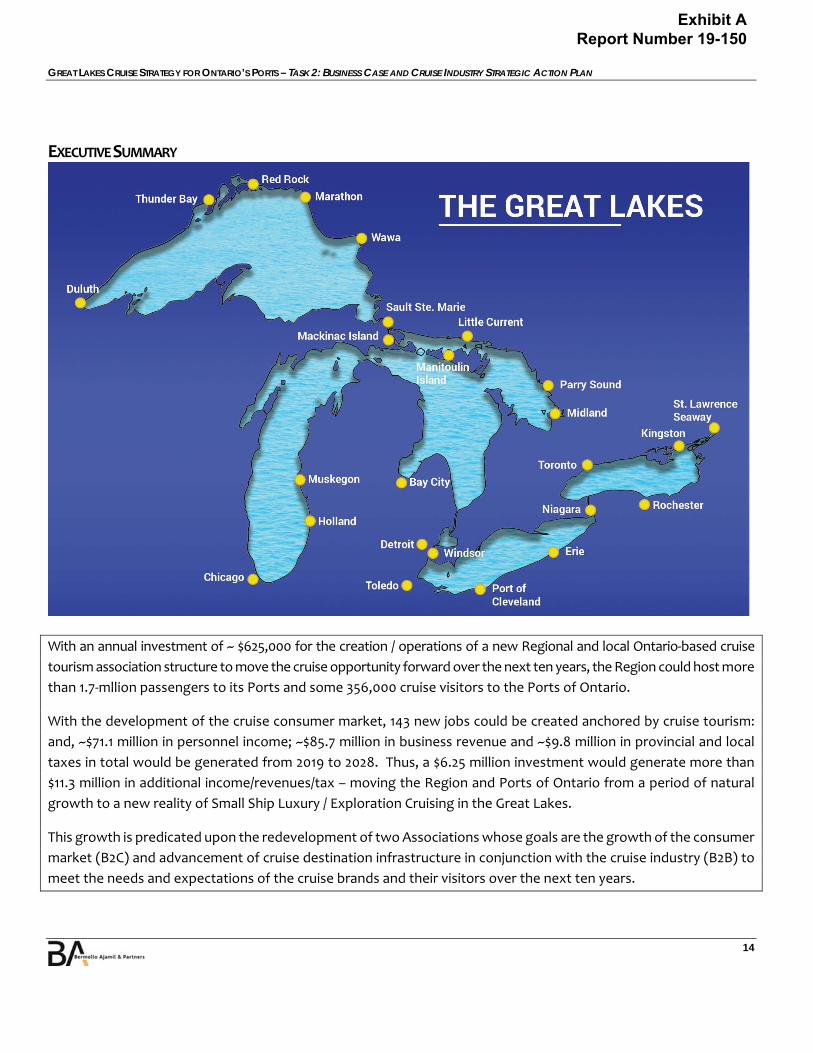
With an annual investment of ~ $625,000 for the creation / operations of a new Regional and local Ontario‐based cruise
tourism association structure to move the cruise opportunity forward over the next ten years, the Region could host more
than 1.7‐mllion passengers to its Ports and some 356,000 cruise visitors to the Ports of Ontario.
With the development of the cruise consumer market, 143 new jobs could be created anchored by cruise tourism:
and, ~$71.1 million in personnel income; ~$85.7 million in business revenue and ~$9.8 million in provincial and local
taxes in total would be generated from 2019 to 2028. Thus, a $6.25 million investment would generate more than
$11.3 million in additional income/revenues/tax – moving the Region and Ports of Ontario from a period of natural
growth to a new reality of Small Ship Luxury / Exploration Cruising in the Great Lakes.
This growth is predicated upon the redevelopment of two Associations whose goals are the growth of the consumer
market (B2C) and advancement of cruise destination infrastructure in conjunction with the cruise industry (B2B) to
meet the needs and expectations of the cruise brands and their visitors over the next ten years.
Exhibit A Report Number 19-150
GREAT LAKES CRUISE STRATEGY FOR ONTARIO’S PORTS – TASK 2: BUSINESS CASE AND CRUISE INDUSTRY STRATEGIC ACTION PLAN
15
Small‐ship and exploration cruising is a long‐established business on the Great Lakes. For literally hundreds of years, ships have carried touring passengers to various ports in the region. In recent years, there has been a resurgence in interest from cruise operators wanting to do business in the Great Lakes. In order to capitalize on this renewed interest in the region—and sustain growth in cruise activity over time—a cruise tourism industry action plan must be developed. Bermello Ajamil & Partners, Inc. (B&A) has been retained by the Town of Midland, Ontario, to assist the Ontario ports to develop a cruise tourism business case and action plan for cruise during the next 10 years.
Key Cruise Action Items The goal for the Great Lakes region could be to become a world‐class cruise destination with a higher volume of
exploration / luxury cruise passengers passing through its ports and establish a close, secondary domestic source market to generate substantial socioeconomic impacts to Ontario.
o One message to be communicated throughout the strategy needs to be strong, credible, encouraging, and shared by all: The Great Lakes is a world‐class small ship luxury / exploration cruise destination!
o Increase cruise consumer demand for the region. Focusing on this aspect for the region overall will provide more sailings into the region. From there, all of the Great Lakes ports, inclusive of the Ontario ports will have an opportunity to capture. The Ontario ports are well positioned to capture additional cruise tourism calls and
passengers in the next ten years.
While it is vital to create an effective Great Lakes Cruise Brand and Identity that is recognized by the consumer source markets, it is equally as important to ensure that the whole of the region delivers on its marketing promises as a tourism destination.
o The long‐term development of the Ontario Ports cruise business is directly tied to the development of the Great Lakes as a successful tourism destination recognized for delivering memorable experiences.
o Provide for a strong business functional and operational foundation for cruise lines. This element touches upon the aspects of vessel deployments to the region, including onboard destination support, port infrastructure / operations / cost structure, upland tourism, venue and shore excursion operations, safety & security, and a strongly supported regulatory environment that encourages deployments to the Great Lakes region and the Ports of Ontario.
Great Lakes and Ontario Ports Growth Opportunities There is a limit to the cruise capacity for the Great Lakes region:
o Accessibility factor of the St. Lawrence Seaway and lock systems (740‐ft. LOA; 78‐ft. beam; 26.3‐ft. sea draft; 116.6‐ft. air draft), allowing for a defined vessel range.
o Seasonality of the Great Lakes (likely limited over the term at 22/26‐weeks or May – October). o Due to other region’s competing for the summer deployments of the small luxury / exploration cruise
vessel market, this passenger volume opportunity is further reduced as the Great Lakes competes against such other summer regional destinations as Alaska, Norwegian Fjords, Iceland/Greenland, Central America, Caribbean, South Pacific, Baltic Sea, Mediterranean / Greek Isles, and others that are traditional consumer draws and known to the market.
o The total potential market size worldwide is ~38,000 cruise passengers.
Exhibit A Report Number 19-150
GREAT LAKES CRUISE STRATEGY FOR ONTARIO’S PORTS – TASK 2: BUSINESS CASE AND CRUISE INDUSTRY STRATEGIC ACTION PLAN
16
From a cruise call and passenger tourism growth perspective a significant sea‐change is required, such as the development of the river cruise phenomenon in Europe, to push cruise growth in the region.
o From 2019 – 2028 the Great Lakes could host 1.59 to 1.78‐million revenue passengers at Ports in the many States and Province of Ontario that make up the rim of the Great Lakes region with more than 10,405 cruise calls. To make a move from the current natural growth scenario in the Great Lakes to the projected
growth that could be achieved, the Ports must intervene in the current cruise tourism process and redevelop, invigorate and define a new strategy to increase cruise consumer demand for the region and meet the needs of the cruise visitor and brands to generate additional positive impacts for the port communities that host these cruise ships.
The growth rates shown are equal to, or somewhat higher than, comparable cruise regions worldwide. However, the overall passenger numbers are smaller, due to the limiting factors of the region. If the regulatory environment related to border access and pilotage were revised, the region could provide a platform on par with European river cruising.
That is a range from 15,176‐passengers / 94 sailings (Low Market Capture) to 18,798‐passengers / 104 sailings (High “River Cruise” type market Scenario) by 2028.
o Based upon the ability of the Great Lakes region to expand over the next ten years, the Ports of
Ontario, which is the largest contingent of ports in a state or province would host from 318,535 (natural growth) to 356,070 (Highly achievable) revenue passengers on 1,663 cruise calls. ~ 19.9% of the overall cruise passenger / 15.9% cruise calls is captured by the Ports of Ontario.
The capture rate per Ontario Port is based upon many factors inclusive of geography, marquee value and revenue production / costs for the cruise brands based on their consumer demographic / vessel type.
If the Ports of Ontario has the ability to capture additional calls / revenue passengers to their ports through the implementation of the action plan items shown in the strategy that provides for higher potential cruise revenues while in port, expands the overall consumer demographic and allows the cruise brands to be rewarded for the Ontario ports exceeding passenger expectations.
The range of passengers per ship for each port moves from Kingston (128‐passengers – due to its geographic position in relation to the St. Lawrence Seaway) to a high of 339‐passengers per call (Toronto – due to its primary homeport role and marquee value). The remaining 6 Ontario ports range from 202 – 233 passengers per call.
Cruise growth requires effort on behalf of the ports, cities, provinces/states, and regions. To compete, there is a need for good cruise infrastructure, operations, and balanced costs, but the main issue moving forward is developing consumer demand, and working with various cruise lines that fit into the region to grow it accordingly. Therefore, to be successful, the region and individual ports must differentiate themselves from other competitors!
Working with key cruise brands and tour operators to generate demand and efficiently use marketing dollars is required, due to the limited overall passenger throughput and impacts to tourism throughout Ontario and the Great Lakes region.
Exhibit A Report Number 19-150
GREAT LAKES CRUISE STRATEGY FOR ONTARIO’S PORTS – TASK 2: BUSINESS CASE AND CRUISE INDUSTRY STRATEGIC ACTION PLAN
17
Unless there is a significant sea‐change, growth of the Great Lakes market will not reach its optimum range of cruise passenger visitors over the next ten year period. Our best assumption is that growth would fall somewhere between the low and mid‐range (basically natural growth) if there is a status quo approach to cruise tourism in the Great Lakes ranging from 15,176 – 16,618‐passengers sailing in the region in 2028. In theory, due to the limiting factors of the Great Lakes that no other competing region has, it is possible that the region may lose new traffic prospects as brands choose to go elsewhere where there are less restrictions and more revenue opportunities – such as those regions shown above.
If there is a change to the Great Lakes Cruise Tourism approach as outlined in the Strategic Action Plan one can be relatively certain that the region would retain its current levels of traffic and have the opportunity to meet and exceed the high projection model of 18,798‐passengers and quite likely could capture the 21,278‐passengers as shown in the scenario 2 approach, whereby building on the North American consumer focus and capturing the European and Adventure/Exploration Markets as well. This is the sea‐change discussed within this action plan. There is a further possibility of modifying the regulatory elements to such an extent and expanding the consumer market to create a new cruise tourism market opportunity on the level of the river cruise phenomenon in Europe. This would surely exceed expectations, but moving toward that goal now could improve the overall opportunity tremendously into the longer‐term.
Infrastructure Needs and Use During the next ten years, there will be a need to manage the existing berths within the peaking periods, which will allow for more control of berth use in ports. Ports should alleviate any foreseeable issues by working in conjunction with cruise brands as they are planning their deployments.
Kingston is in need of a berth that can accommodate the cruise vessels that could take advantage of its geographic positioning, marquee value, and upland offerings.
Toronto’s existing cruise facilities accommodate homeport and port‐of‐call demands during the study term. However, the ability to provide for a more centralized location as part of a downtown waterfront PPP may provide a boost in economic impact.
Midland has a downtown berth that can provide for the future need of the cruise industry. There is an option to develop a new waterfront cruise berth as part of a PPP that could provide for a more robust reception facility for potential homeport operations.
The Little Current berths have the ability to accommodate two cruise vessels simultaneously, based upon dimensional attributes of each. Drafts may challenge larger vessels at the port, and further assessments should be conducted to determine the ROI on a project to alleviate this issue. It is unlikely that the ability to berth a few cruise vessels per year would make the project viable. But due to its location in the Georgian Bay, it is more likely to see some multiple‐call traffic for vessels entering and exiting the area.
Exhibit A Report Number 19-150
GREAT LAKES CRUISE STRATEGY FOR ONTARIO’S PORTS – TASK 2: BUSINESS CASE AND CRUISE INDUSTRY STRATEGIC ACTION PLAN
18
The destinations of Windsor, Parry Sound, and Thunder Bay do not require additional berths during this period. Each has the ability to accommodate a single vessel at good to excellent facilities.
The ability for each port to accommodate the design vessel minimum is a key factor in the Great Lakes’ ability to serve as a primary regional market in the mid‐ to long‐term. Additionally, the ports should also recognize the potential opportunity of both the larger ocean calling (on a one‐ or two‐call seasonal basis) and small coastal and river‐type cruising vessels, which may be locally based or run along the St. Lawrence Seaway.
Based upon the findings of the site visit and Ontario Port projections a Business Case is illustrated for each Port in Chapter 6 as to the required hard and / or soft infrastructure need to obtain the HIGH projection range, which is more of the push and pull scenario for the Great Lakes region and Ontario ports that for comparison is similar to that of the European River Cruise Industry success in Europe, whereby consumer demand; the use of primarily existing port and soft tourism infrastructure; and regulatory came together to rapidly build the small ship river cruise industry of today that continues to move forward.
o Limited resources are required for hard infrastructure development, but there is a need for consumer development, port / tourism operations coordination and providing for a fair share of revenues for the ports on itineraries to provide for the changing needs of the river cruise industry.
Economic Impacts The potential cruise activity at Ontario ports in 2019 is projected to generate $6.4 million in revenue to
businesses supplying services to the cruise vessels, passengers, and crew. o By 2028, the NPV could range from $63.7 to $71.1 million; thus, should the Ports of Ontario and Great
Lakes region invest the time and monies to create a new cruise environment this could be an increase of ~$7.49‐million additional dollars over the period.
By 2028, $9.7 million of business revenue is projected in Ontario under the MEDIUM scenario and more than $10.9 million in 2028 under the HIGH scenario.
o This is a potential NPV of $85.7‐million on the high scenario, an added return of ~$9.0‐million over the period.
The cruise activity in 2019 is estimated to generate about $733,000 of provincial and local tax revenue, growing to $1.1 million for the projected cruise activity at Ontario ports in 2028 under the MEDIUM scenario and $1.26 million under the HIGH scenario.
o This is ~ $9.89‐million (NPV) in additional tax dollars over the period.
Some 143 new jobs could be created in Ontario over the period if monies are invested into cruise tourism as outlined in this plan providing for the impetus of the additional revenues and tax dollars shown.
While the overall cruise passenger throughput and corresponding tax revenues may be small, there is a significant direct benefit for each port and the surrounding communities.
Exhibit A Report Number 19-150
GREAT LAKES CRUISE STRATEGY FOR ONTARIO’S PORTS – TASK 2: BUSINESS CASE AND CRUISE INDUSTRY STRATEGIC ACTION PLAN
19
o These jobs, business revenues and income would not be seen without cruise tourism in the small Ports of Ontario. This is an additional piece of tourism income that would not be there otherwise, as through past surveys it is clear that consumers clearly choose to cruise to specific regions, inclusive of the Great Lakes.
There are additional direct revenues available for ports and cities through the implementation of a more uniform tariff system in the region and per port. We are not recommending a wholesale increase in tariffs, but a more tailored system for cruise vessels tied to passenger counts, LOA/GT charges, utilities, etc. that could produce additional revenues over the timeframe.
Primary Organization and Structure The Great Lakes is a large, relatively protected region separating the U.S. and Canada (mainly the province
of Ontario and multiple states), tourism entities, and local jurisdictions, all with a stake in the cruise tourism opportunity.
o Two specific organizations with a support network is required for the Great Lakes to grow cruise tourism ‐ B2C and B2B Association Models.
o As Ontario has the greatest number of ports used by the cruise industry as compared to the individual states it could be a driving force behind the resurgence of Great Lakes cruising.
To expand cruise tourism to the region, the primary goal of an association should be the development of a consumer market to demand cruise in the Great Lakes.
o To achieve this goal a regional association should be formed with this primary purpose – creating a consumer market for cruise tourism ‐ primarily North American and secondarily World.
o The Great Lakes Cruise Association would focus on B2C market development with cruise brands, tourism boards, tour operators, and travel agents and direct to consumer programs that target key demographic markets to produce new and repeat cruise passengers to the region.
o While these associations can be unwieldly due to the many jurisdictions involved, there are other examples of successful similar entities as outlined in this action plan. Keep it simple in terms of a controlling board, budget contributions and strategic plan. Keep
a specific focus on cruise consumers and work with the individual ports and stakeholders throughout the region.
The secondary goal is to develop / evolve the necessary products and services in the ports visited, to meet the needs and expectations of the cruise industry.
o To achieve this goal, an Ontario Ports Association should be created with a foundation of Local Cruise Networks that are the heart of the B2B directive.
The broader Great Lakes Cruise Association should work with and encourage the development of Local Cruise Networks in all ports throughout the Region (USA and Canada) to take on the role of B2B with the cruise industry.
o The Local Networks would be made up of key stakeholders such as the Port, Tourism, Port Agent, Tour Operator, Venues, Chamber of Commerce, Retailers, etc.
Exhibit A Report Number 19-150
GREAT LAKES CRUISE STRATEGY FOR ONTARIO’S PORTS – TASK 2: BUSINESS CASE AND CRUISE INDUSTRY STRATEGIC ACTION PLAN
20
o Direct funding would be minimal for these organizational structures as not full time staff is required; no offices, etc. The funds would be directed toward FAM trips for cruise line executives, B2B market trips, and local development as required.
The Plan outlines numerous responsibilities for each of the associations illustrated, as well as the key leadership positions in each.
Strategic Action Plan
A detailed roadmap and strategic action plan is focused on achieving cruise development and growth for the Great Lakes region. The plan includes recommendations for the levels of business (operations and business development), port (hard infrastructure), and tourism (soft support infrastructure such as transportation, tour offerings, commercial and venue options and marketing), in order to ensure that all the pertinent elements are aligned for success.
The action plan provides a template that identifies specific items in each category, the level of importance (priority), linkages, timelines, and primary responsibilities for implementation of the action.
o There are action items illustrated in the plan that are specific to the primary stakeholders, inclusive of the Ports, Cities, Tourism and business related stakeholders. These are items within the control of this group.
o Regulatory items shown within the plan are mostly out of the direct control of the primary stakeholders, but they do have influence on the direction and modification of the regulatory items shown.
While the world cruise market has increasingly become a dynamic offering in terms of new cruise vessels, shoreside offerings, service levels, port infrastructures, and other tourism requirements, the Great Lakes region to date has not followed a similar trend.
o The Action Plan is intended to change this trajectory and provide for a plan moving forward to expand cruise tourism through the development of a consumer market and the right type infrastructure to provide for a platform for success of the cruise tourism industry.
The dynamics of the action plan recommendations will change over time, and require a greater or more rapidly adapting emphasis as the industry matures further in the region, cruise‐line brands deploy, vessels increase in size, and the demographic range modifies.
The overarching goals of the plan are the following:
Increase cruise consumer demand for the region. Focusing on this aspect for the region overall will provide more sailings in the region, from which all of the Ontario ports will have an opportunity to capture. The primary focus is on the development of a North American consumer‐source market with a secondary goal of expanding the presence and passenger throughput of the international consumer market, which is a mainly a marketing and education (software) endeavor.
Provide for a strong, functional, and operational business foundation for cruise lines. This element touches on the aspects of vessel deployments to the region, including onboard destination support, port infrastructure / operations / cost structure, upland tourism, venue and shore excursion
Exhibit A Report Number 19-150
GREAT LAKES CRUISE STRATEGY FOR ONTARIO’S PORTS – TASK 2: BUSINESS CASE AND CRUISE INDUSTRY STRATEGIC ACTION PLAN
21
operations, safety & security, and a strongly supported regulatory environment that encourages deployments to the Great Lakes region.
Increase overall cruise visitor satisfaction. If decision‐making focuses on this aspect as a primary goal, then the plan will fall into place much easier, which is primarily an operational and software exercise.
The Action Plan is built to achieve the following:
Build a new market, drive deployments to the region as demand increases, with higher ticket revenues.
Create high levels of cruise visitor satisfaction, and further promote the region for return visits via land‐based or cruise holidays.
Support new activities and shore excursion options that provide increased daily spending to build additional cruise‐line and stakeholder revenues.
Ensure the infrastructure provides for a seamless visitor experience for homeport & port of call operations.
Provide a regional environment that is supportive of cruise‐industry growth and renders the highest possible socioeconomic impacts to the communities visited.
Action Plan Budget Items
The preliminary budget for those key items associated with the creation of the organization structure and annual marketing monies is some $600,000. It is assumed the GLCA and Ontario Ports Association monies are annual. Grants or other funding mechanisms from association partners such as Government agencies ‐ Tourism, economic opportunities agencies and others may provide for part of the contribution. Larger projects related to joint marketing efforts with cruise brands / tour operators, etc., as well as specific consumer marketing campaigns will need to be approached on an individual basis and rated on a Return On Investment (ROI) scale related to their impact on new additional cruise passenger throughput to the Great Lakes and the Ontario Ports specifically and the subsequent socioeconomic impacts.
Summary
To capitalize on growth of global cruise tourism, the Great Lakes Region must focus its energy and resources on delivering a small‐ship luxury / exploration cruise experience that is second to none, and that appeals equally to the demographics of the brands sailing to, and wanting to sail to, the Great Lakes. This cruise experience must be consistent with the brand philosophies of the diverse range of cruise lines that operate within the region, and include equally diverse and high‐quality landside products that complement onboard products. There must be a unified public voice of the Great Lakes cruise region: an Alliance between a Regional Cruise Association and the Local Cruise Networks (in conjunction with an Ontario Cruise Association) charged with spearheading efforts to increase consumer demand, deliver superior hospitality, unique activities, and authentic local experiences to small‐ship cruise brands and their customers. Over time, the Great Lakes region has a genuine opportunity to position itself as a premier small‐ship luxury / exploration cruise destination for visitors from around the world. Realizing this future vision will require not only significant effort by all parties and stakeholders in the region, but also new and innovative approaches to partnerships and unprecedented collaboration amongst stakeholders.
Exhibit A Report Number 19-150
GREAT LAKES CRUISE STRATEGY FOR ONTARIO’S PORTS – TASK 2: BUSINESS CASE AND CRUISE INDUSTRY STRATEGIC ACTION PLAN
22
1. INTRODUCTION Bermello Ajamil & Partners, Inc. (“B&A”) has been retained by the Town of Midland, Ontario, to help the Ontario ports develop a strategy for cruise. The goals of this effort are as follows:
Establish a comprehensive understanding of the current status and future prospects of Ontario’s Great Lakes cruise ship industry.
Create an Ontario‐wide strategy to guide the development of a successful cruise ship industry on the Great Lakes.
Specifically identify and detail the needed improvements in the infrastructure of Ontario’s cruise ship ports and port attractions.
To achieve these goals, this project has been broken down into the following distinct tasks:
Task 1 – Cruise Market Assessment: Environmental Scan
Task 2 – Business Case and Cruise Industry Strategic Action Plan B&A is pleased to submit this report, the contents of which reflect input and feedback from cruise line executives, the Ontario ports themselves, and other stakeholders who are directly or indirectly involved with controlling and/or influencing cruise activity within the Great Lakes region.
Exhibit A Report Number 19-150
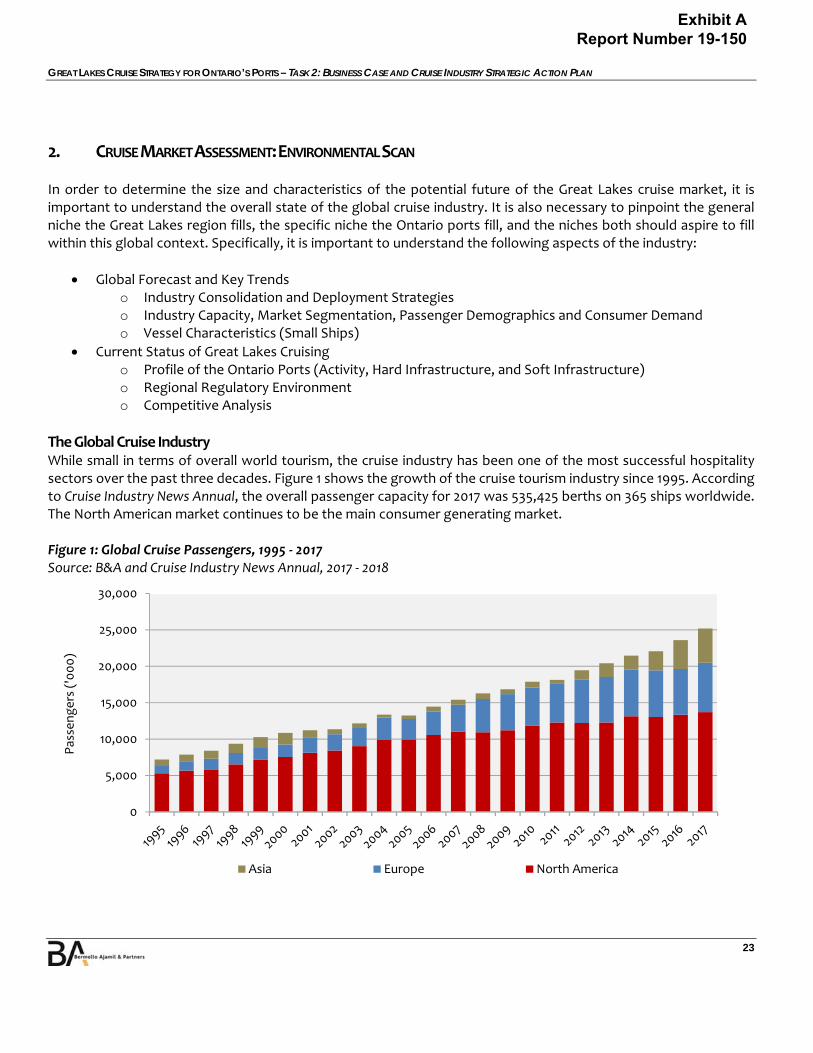
GREAT LAKES CRUISE STRATEGY FOR ONTARIO’S PORTS – TASK 2: BUSINESS CASE AND CRUISE INDUSTRY STRATEGIC ACTION PLAN
23
2. CRUISE MARKET ASSESSMENT: ENVIRONMENTAL SCAN In order to determine the size and characteristics of the potential future of the Great Lakes cruise market, it is important to understand the overall state of the global cruise industry. It is also necessary to pinpoint the general niche the Great Lakes region fills, the specific niche the Ontario ports fill, and the niches both should aspire to fill within this global context. Specifically, it is important to understand the following aspects of the industry:
Global Forecast and Key Trends o Industry Consolidation and Deployment Strategies o Industry Capacity, Market Segmentation, Passenger Demographics and Consumer Demand o Vessel Characteristics (Small Ships)
Current Status of Great Lakes Cruising o Profile of the Ontario Ports (Activity, Hard Infrastructure, and Soft Infrastructure) o Regional Regulatory Environment o Competitive Analysis
The Global Cruise Industry While small in terms of overall world tourism, the cruise industry has been one of the most successful hospitality sectors over the past three decades. Figure 1 shows the growth of the cruise tourism industry since 1995. According to Cruise Industry News Annual, the overall passenger capacity for 2017 was 535,425 berths on 365 ships worldwide. The North American market continues to be the main consumer generating market. Figure 1: Global Cruise Passengers, 1995 ‐ 2017 Source: B&A and Cruise Industry News Annual, 2017 ‐ 2018
0
5,000
10,000
15,000
20,000
25,000
30,000
Passe
ngers ('000)
Asia Europe North America
Exhibit A Report Number 19-150

GREAT LAKES CRUISE STRATEGY FOR ONTARIO’S PORTS – TASK 2: BUSINESS CASE AND CRUISE INDUSTRY STRATEGIC ACTION PLAN
24
The industry overall has seen steady growth, year after year—irrespective of recession, political turmoil, or other factors that have influenced the visitor and travel industry. Each of the major cruise lines is focusing on the development of key consumer markets around the world. In Asia, cruise lines are beginning to develop consumer awareness of the product, and in Europe, the lines are continuing to focus their products on each country and population base by creating individual brands. The North American consumer demographic is turning to new products and experiences in the Caribbean and elsewhere. With the opening of Cuba and new private‐island destinations (islands owned and/or developed for exclusive or semi‐exclusive use by a single cruise line and its proprietary brands), the Caribbean is experiencing a boom in deployment and passenger volumes, and Alaska is growing rapidly. In the Northeast region of Canada & New England (“CNE”), the family summer market continues to expand, building on the region’s core fall season. Multiple factors are contributing simultaneously to this global growth, not the least of is the introduction of a record number of new cruise ships and the launch of several new cruise brands across every segment of the industry—from large ships in the mass market (“contemporary”) space to small luxury and expedition vessels, and everything in between. These new ships and brands have generated a heightened level of excitement in the industry, and have helped boost consumer demand for cruising across multiple market segments.
Global Forecast The global cruise industry is dominated and driven forward by the major cruise lines and their generally large fleets. The Small Ship market is also expanding, with 35 of the current 106 ships in the orderbook classified as small “expedition” vessels. Though its role in the overall industry is small in terms of capacity, small luxury and expedition vessels are increasingly popular, and the growth of this segment will help open new markets in the industry. Based on the total anticipated capacity of the global fleet, including known newbuilds as per the current orderbook, Figure 2 shows the range of potential worldwide passenger growth through 2037. Figure 2: Global Cruise Growth Projections, 2018 ‐ 2037 Source: B&A
37,901,156
41,839,180
47,137,479
10,000,000
15,000,000
20,000,000
25,000,000
30,000,000
35,000,000
40,000,000
45,000,000
50,000,000
Passe
ngers
Low Medium High
2.0% ‐ 3.1% CAGR
Exhibit A Report Number 19-150
GREAT LAKES CRUISE STRATEGY FOR ONTARIO’S PORTS – TASK 2: BUSINESS CASE AND CRUISE INDUSTRY STRATEGIC ACTION PLAN
25
This forecast is based on the additional supply (cruise vessels) placed into the consumer market and a minimal withdrawal factor of 5% for older ships being taken out of the conventional cruise fleet on an annual basis, over the 20‐year period. New ships entering the market over an extended period of time have slowed this down, as have major refurbishments of vessels on a regular basis. There are no regulations in place, or on the horizon, which are forcing vessels out of service at an accelerated rate.
Key Trends Against this backdrop of overall growth, two contrasting but complementary trends can also be observed. While cruise ships with a capacity greater than 1,000 passengers lead the current orderbook, as already mentioned, in the coming decade, nearly a third of newbuilds will be smaller expedition ships, most of which will have fewer than 600 lower berths, and many of them will have fewer than 300. So if the trend for the major global brands is to double‐down on big ships, then the trend for niche operators is to double‐down on small ships. This bifurcation of supply is allowing both industry segments is to grow simultaneously, since the big ship experience is, in most ways, wholly different than the small ship experience. Current trends in vessel supply are related to trends in consumer demand and cruise experience delivery. For cruisers who prefer the big‐ship contemporary brand experience, the major cruise brands continue to innovate and provide new onboard amenities that enhance the menu of entertainment options, while also continuing to expand into new markets where possible. Small ship operators, on the other hand, are focusing increasingly on destination differentiation by exploring new and exotic regions and ports‐of‐call, and by developing itineraries that allow their passengers to spend more time in destinations, in order to have a more intense, nuanced interaction with the local environment, culture, and cuisine. Another consumer trend that is very important and encouraging for the future of the cruise industry is relatively high market penetration among the millennial demographic in the United States, which remains the single largest source market for cruising. According to a 2017 American Society of Travel Agents (ASTA) survey on consumer habits, millennials are not only more likely to enjoy a cruise than older travelers, they also usually spend more on vacations than their baby boomer counterparts. As part of its survey, ASTA interviewed approximately 1,500 people in the U.S. aged 25 to 70 about their travel habits and preferences. The results showed that U.S. travelers averaged 1.94 vacations in 2016, with millennials averaging 2.38 vacations. More importantly for the cruise industry, ASTA’s survey showed that nearly a third (32%) of millennials have cruised within the past five years, making market penetration among millennials higher than any other generation today. If this trend continues in the U.S. and takes hold in other source markets, then the future of cruising seems very bright.1
A final trend worth mentioning is the emerging shift away from traditional bunker fuel and toward liquefied natural gas (LNG) as a primary fuel source for cruise ships.2 There are clear financial and environmental advantages to
consuming LNG, rather than bunker fuel. However, while this transition to LNG is increasingly likely to be widespread across the industry within a few years, will still take many years to implement, since the first newbuilds to use LNG are only now coming into the market. Additional global Cruise Industry information is found in Annex A.
1 Source: American Society of Travel Agents and Boston Globe 2 There are 19 dual‐fuel LNG vessels on the newbuild orderbook, as of July 2018.
Exhibit A Report Number 19-150
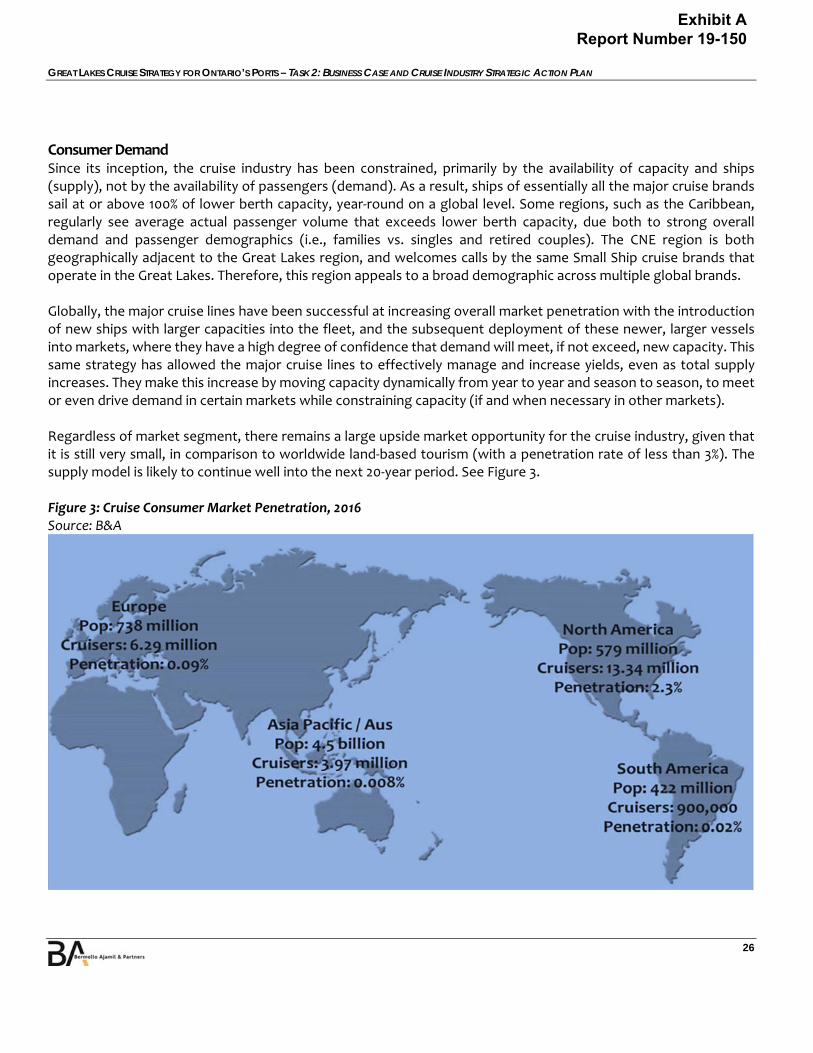
GREAT LAKES CRUISE STRATEGY FOR ONTARIO’S PORTS – TASK 2: BUSINESS CASE AND CRUISE INDUSTRY STRATEGIC ACTION PLAN
26
Consumer Demand Since its inception, the cruise industry has been constrained, primarily by the availability of capacity and ships (supply), not by the availability of passengers (demand). As a result, ships of essentially all the major cruise brands sail at or above 100% of lower berth capacity, year‐round on a global level. Some regions, such as the Caribbean, regularly see average actual passenger volume that exceeds lower berth capacity, due both to strong overall demand and passenger demographics (i.e., families vs. singles and retired couples). The CNE region is both geographically adjacent to the Great Lakes region, and welcomes calls by the same Small Ship cruise brands that operate in the Great Lakes. Therefore, this region appeals to a broad demographic across multiple global brands. Globally, the major cruise lines have been successful at increasing overall market penetration with the introduction of new ships with larger capacities into the fleet, and the subsequent deployment of these newer, larger vessels into markets, where they have a high degree of confidence that demand will meet, if not exceed, new capacity. This same strategy has allowed the major cruise lines to effectively manage and increase yields, even as total supply increases. They make this increase by moving capacity dynamically from year to year and season to season, to meet or even drive demand in certain markets while constraining capacity (if and when necessary in other markets). Regardless of market segment, there remains a large upside market opportunity for the cruise industry, given that it is still very small, in comparison to worldwide land‐based tourism (with a penetration rate of less than 3%). The supply model is likely to continue well into the next 20‐year period. See Figure 3. Figure 3: Cruise Consumer Market Penetration, 2016 Source: B&A
Exhibit A Report Number 19-150
GREAT LAKES CRUISE STRATEGY FOR ONTARIO’S PORTS – TASK 2: BUSINESS CASE AND CRUISE INDUSTRY STRATEGIC ACTION PLAN
27
Small Ship brands have generally utilized this same strategy to maintain strong yields and grow demand. Here is one fundamental difference: Rather than introduce larger and larger vessels, Small Ship cruise brands continuously introduce new destinations and experiences to drive new demand to fill their expanding fleets. The growth in demand for Small Ship cruising can, in some sense, be seen as a response to rapid growth in the contemporary market; Small Ship cruising offers a more intimate and destination‐centric cruise experience for passengers who are already fond of cruising, but are seeking an alternative to a large‐ship contemporary brand experience. Because of its more exclusive nature, Small Ship cruising also often appeals to a more affluent consumer demographic, which is elaborated later in this report. Repeat clientele is a major strength of the cruise industry. According to Cruise Lines International Association (CLIA), 62% of respondents to a 2014 consumer survey (the most recent such survey available) of 1,600 US and Canadian residents self‐reported as having taken multiple cruises, with 38% self‐reporting as first‐time cruisers. This high level of repeat business requires that the industry provide new products and destinations to sustain interest and continue attracting repeat customers, in addition to new customers. Cruise lines are expanding in several cruise regions or providing new destination products, to provide a variety of merchandising to their repeat clientele and establish new market bases. In line with this pattern, there is a saturation of some traditional cruise destinations, which has motivated the industry to branch out into new regions, as well as add new ports, berths, and products in existing marquee regions, such as the Mediterranean, the Caribbean, and Alaska. US consumers have represented the industry’s base from inception, and continue to be a stabilizing factor. Today, non‐US passengers are taking more cruises, with the European market (particularly Germany and the UK) and Asian consumer markets continuing to grow. Because of the vessel size restrictions imposed by the Locks that control access to the Great Lakes region – the “Seaway Max” factor – only five of 268 major branded vessels are capable of calling at Ontario ports.3
Some 168 additional cruise ships have been identified (total of 173) operated by 72 different cruise brands that can/will be able to transit the locks into the Great Lakes by 2020 (or shortly thereafter). Of these 72 brands and 173 cruise ships, the Top 20 brands (ranked by the number of vessels in their fleets that can transit the Great Lakes Locks) account for 118 vessels and 62.6% of passenger capacity (i.e., lower berths). Meanwhile, the Top 10 brands account for 81 ships and 44.8% of passenger capacity. Table 1 lists these Top 20 operators, in order of ranking, based on the total number of ships in their respective global fleets through 2020. Only ships that can physically fit within the Great Lakes Locks are included.
3 Additional information is presented on the Great Lakes Lock and other restrictions in the Design Vessel Chapter.
Exhibit A Report Number 19-150
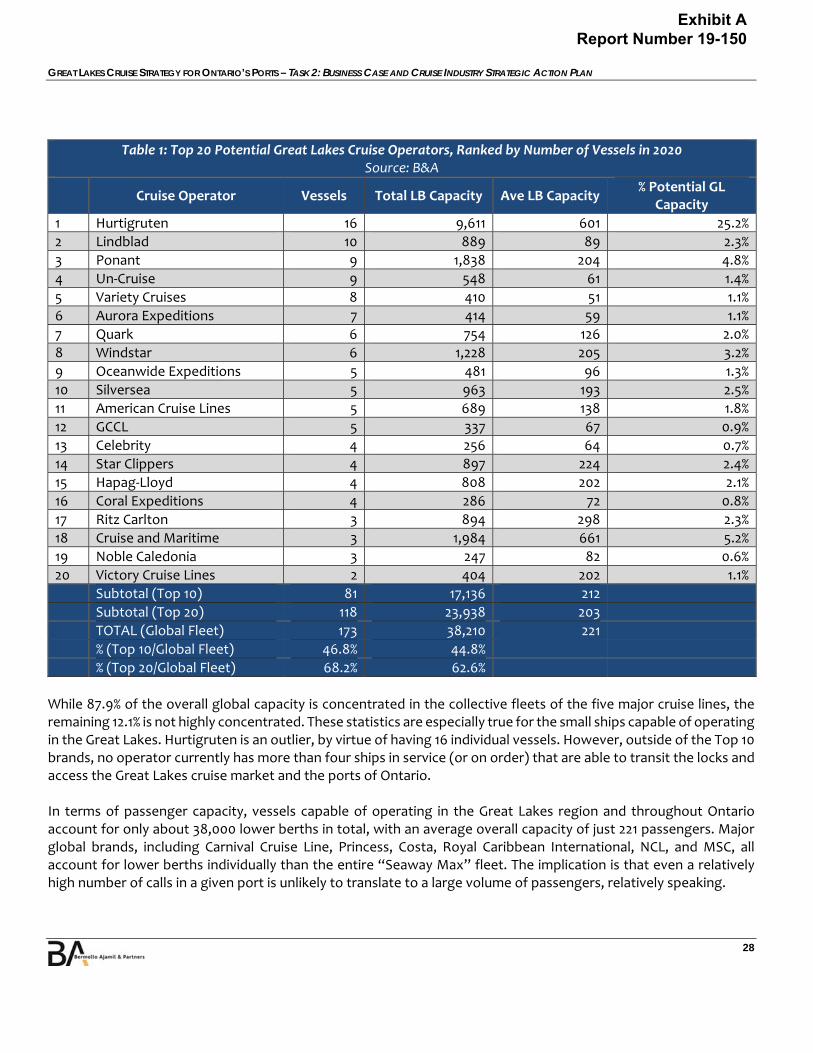
GREAT LAKES CRUISE STRATEGY FOR ONTARIO’S PORTS – TASK 2: BUSINESS CASE AND CRUISE INDUSTRY STRATEGIC ACTION PLAN
28
Table 1: Top 20 Potential Great Lakes Cruise Operators, Ranked by Number of Vessels in 2020 Source: B&A
Cruise Operator Vessels Total LB Capacity Ave LB Capacity % Potential GL
Capacity
1 Hurtigruten 16 9,611 601 25.2%
2 Lindblad 10 889 89 2.3%
3 Ponant 9 1,838 204 4.8%
4 Un‐Cruise 9 548 61 1.4%
5 Variety Cruises 8 410 51 1.1%
6 Aurora Expeditions 7 414 59 1.1%
7 Quark 6 754 126 2.0%
8 Windstar 6 1,228 205 3.2%
9 Oceanwide Expeditions 5 481 96 1.3%
10 Silversea 5 963 193 2.5%
11 American Cruise Lines 5 689 138 1.8%
12 GCCL 5 337 67 0.9%
13 Celebrity 4 256 64 0.7%
14 Star Clippers 4 897 224 2.4%
15 Hapag‐Lloyd 4 808 202 2.1%
16 Coral Expeditions 4 286 72 0.8%
17 Ritz Carlton 3 894 298 2.3%
18 Cruise and Maritime 3 1,984 661 5.2%
19 Noble Caledonia 3 247 82 0.6%
20 Victory Cruise Lines 2 404 202 1.1% Subtotal (Top 10) 81 17,136 212 Subtotal (Top 20) 118 23,938 203 TOTAL (Global Fleet) 173 38,210 221
% (Top 10/Global Fleet) 46.8% 44.8%
% (Top 20/Global Fleet) 68.2% 62.6%
While 87.9% of the overall global capacity is concentrated in the collective fleets of the five major cruise lines, the remaining 12.1% is not highly concentrated. These statistics are especially true for the small ships capable of operating in the Great Lakes. Hurtigruten is an outlier, by virtue of having 16 individual vessels. However, outside of the Top 10 brands, no operator currently has more than four ships in service (or on order) that are able to transit the locks and access the Great Lakes cruise market and the ports of Ontario. In terms of passenger capacity, vessels capable of operating in the Great Lakes region and throughout Ontario account for only about 38,000 lower berths in total, with an average overall capacity of just 221 passengers. Major global brands, including Carnival Cruise Line, Princess, Costa, Royal Caribbean International, NCL, and MSC, all account for lower berths individually than the entire “Seaway Max” fleet. The implication is that even a relatively high number of calls in a given port is unlikely to translate to a large volume of passengers, relatively speaking.
Exhibit A Report Number 19-150
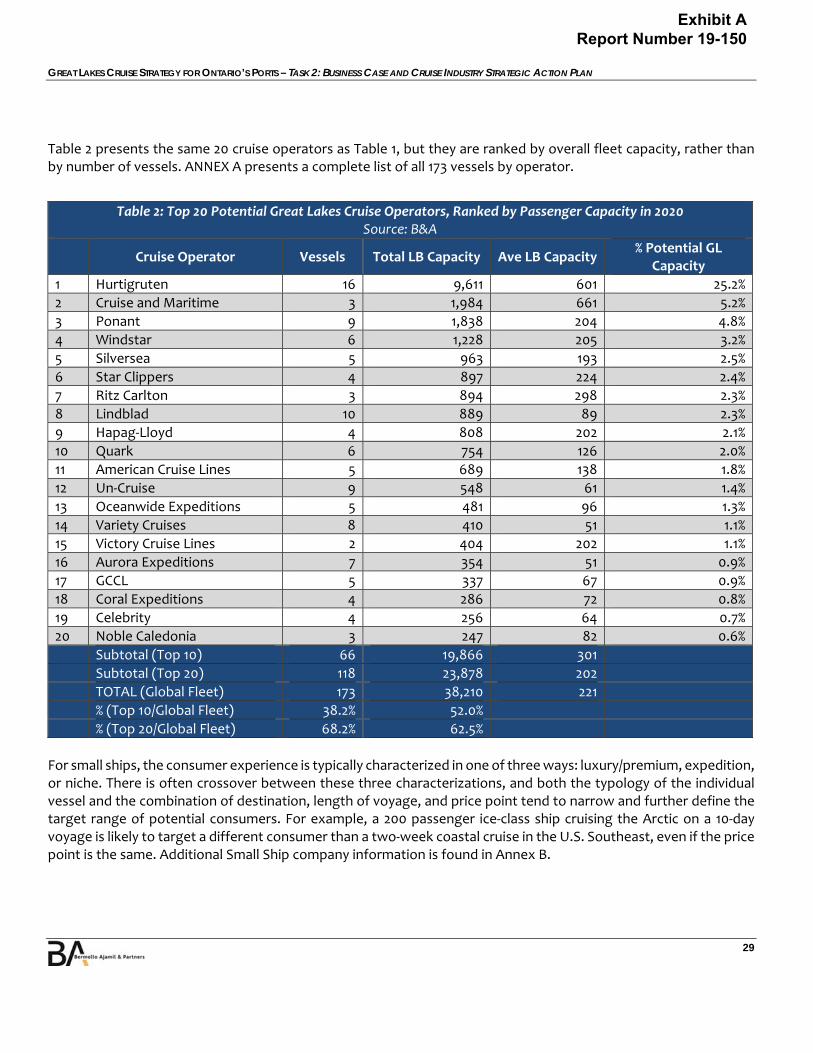
GREAT LAKES CRUISE STRATEGY FOR ONTARIO’S PORTS – TASK 2: BUSINESS CASE AND CRUISE INDUSTRY STRATEGIC ACTION PLAN
29
Table 2 presents the same 20 cruise operators as Table 1, but they are ranked by overall fleet capacity, rather than by number of vessels. ANNEX A presents a complete list of all 173 vessels by operator.
Table 2: Top 20 Potential Great Lakes Cruise Operators, Ranked by Passenger Capacity in 2020 Source: B&A
Cruise Operator Vessels Total LB Capacity Ave LB Capacity % Potential GL
Capacity
1 Hurtigruten 16 9,611 601 25.2%
2 Cruise and Maritime 3 1,984 661 5.2%
3 Ponant 9 1,838 204 4.8%
4 Windstar 6 1,228 205 3.2%
5 Silversea 5 963 193 2.5%
6 Star Clippers 4 897 224 2.4%
7 Ritz Carlton 3 894 298 2.3%
8 Lindblad 10 889 89 2.3%
9 Hapag‐Lloyd 4 808 202 2.1%
10 Quark 6 754 126 2.0%
11 American Cruise Lines 5 689 138 1.8%
12 Un‐Cruise 9 548 61 1.4%
13 Oceanwide Expeditions 5 481 96 1.3%
14 Variety Cruises 8 410 51 1.1%
15 Victory Cruise Lines 2 404 202 1.1%
16 Aurora Expeditions 7 354 51 0.9%
17 GCCL 5 337 67 0.9%
18 Coral Expeditions 4 286 72 0.8%
19 Celebrity 4 256 64 0.7%
20 Noble Caledonia 3 247 82 0.6% Subtotal (Top 10) 66 19,866 301
Subtotal (Top 20) 118 23,878 202 TOTAL (Global Fleet) 173 38,210 221 % (Top 10/Global Fleet) 38.2% 52.0% % (Top 20/Global Fleet) 68.2% 62.5%
For small ships, the consumer experience is typically characterized in one of three ways: luxury/premium, expedition, or niche. There is often crossover between these three characterizations, and both the typology of the individual vessel and the combination of destination, length of voyage, and price point tend to narrow and further define the target range of potential consumers. For example, a 200 passenger ice‐class ship cruising the Arctic on a 10‐day voyage is likely to target a different consumer than a two‐week coastal cruise in the U.S. Southeast, even if the price point is the same. Additional Small Ship company information is found in Annex B.
Exhibit A Report Number 19-150

GREAT LAKES CRUISE STRATEGY FOR ONTARIO’S PORTS – TASK 2: BUSINESS CASE AND CRUISE INDUSTRY STRATEGIC ACTION PLAN
30
Current Status of Great Lakes Cruising Cruising has existed on and off in the Great Lakes region for over 100 years, but the modern industry has only been active in the region for the past 15 years or so. By 2020, there will be a total of five individual oceangoing cruise brands active in the Great Lakes. These five brands will operate seven different cruise ships, and offer a total of 14 different itinerary patterns, nine of which call one or more Ontario port(s). ANNEX D presents a map of each of these core itineraries. Two additional itineraries – both operated by Hapag‐Lloyd beginning in 2020 – will call only Toronto as part of a non‐Great Lakes cruise (CNE, Greenland) itinerary. The Great Lakes region remains very much a niche market for cruise, and is limited by the dimensions of its many locks to a fleet of small vessels. However, as explained in detail in later sections of this report, even these limitations still leave 173 oceangoing vessels with the capability to access the Great Lakes market, 99 of which have genuine potential to do so at some point in the future. What follows is a summary description of the existing Great Lakes cruise market, including a discussion of itineraries by oceangoing vessels that are currently offered and/or planned, and feedback received from cruise lines related to the region as a whole, as well as the Ontario ports. Table 3 summarizes known oceangoing cruise offerings within the Great Lakes through 2020.
Table 3: Great Lakes Cruise Itineraries, 2018 ‐ 2020 Source: B&A
Operator Vessel Itinerary Sailings Days Date Range Ports Called
Victory (2018)
Victory I
Canadian Maritimes & French Canada
2 11 Mid May ‐ early Jun; mid Oct
PORTLAND ‐ Halifax ‐ Charlottetown ‐ Quebec City ‐ Montreal ‐ TORONTO
Great Lakes Grand Discovery
8 10 Early Jun ‐ mid Oct
CHICAGO ‐ Mackinac Island ‐ Sault Ste. Marie (MI) ‐ Little Current ‐ Windsor ‐ Cleveland ‐ Port Colborne ‐ TORONTO
Victory II French Canada & Great Lakes
1 10 Late Jul ‐ early Aug
MONTREAL ‐ Quebec City ‐ Kingston ‐ Toronto ‐ Port Colborne ‐ Cleveland – DETROIT
French Canadian Maritimes & St. Lawrence
3 11 Early Aug ‐ early Sep
HALIFAX ‐ Charlottetown ‐ Quebec City ‐ Montreal ‐ Port Colborne ‐ Cleveland – DETROIT
SUBTOTAL 14 145
Pearl Seas (2018)
Pearl Mist Great Lakes & Georgian Bay
8 12 Early Jun ‐ early Sep
TORONTO ‐ Port Colborne ‐ Windsor ‐ Midland ‐ Parry Sound ‐ Little Current ‐ Sault Ste. Marie (MI) ‐ Mackinac Island ‐ Muskegon/Holland (MI) ‐ CHICAGO
Exhibit A Report Number 19-150
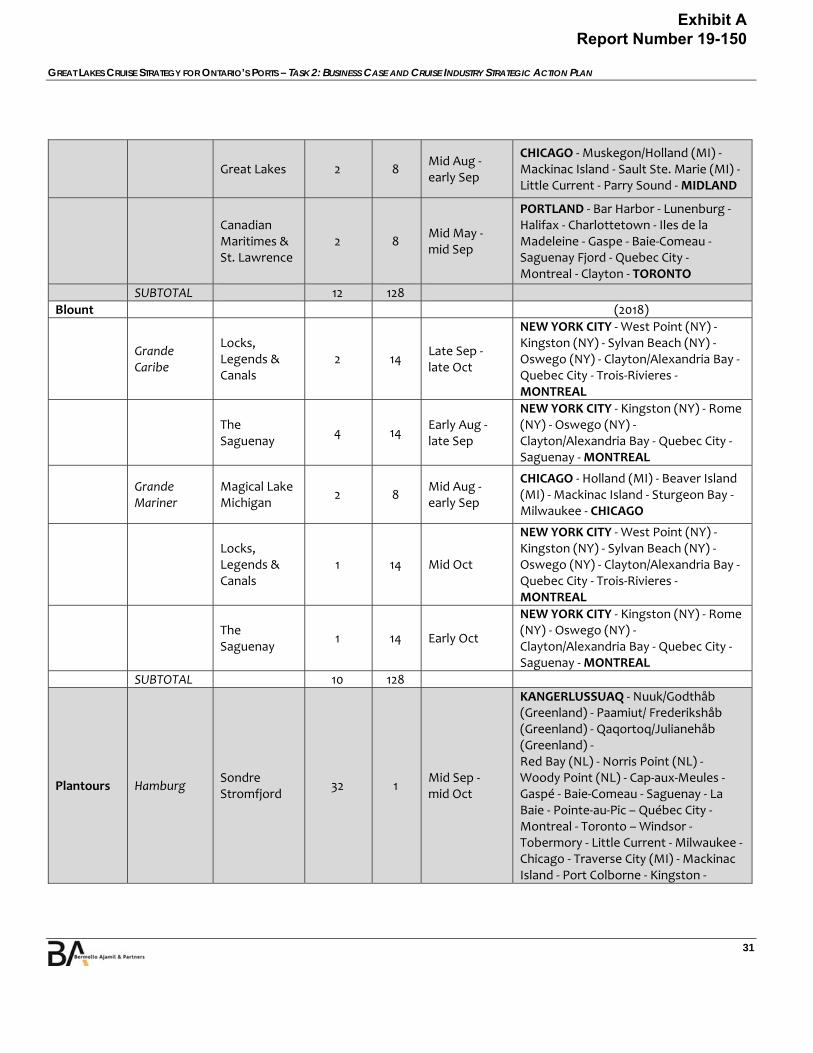
GREAT LAKES CRUISE STRATEGY FOR ONTARIO’S PORTS – TASK 2: BUSINESS CASE AND CRUISE INDUSTRY STRATEGIC ACTION PLAN
31
Great Lakes 2 8 Mid Aug ‐ early Sep
CHICAGO ‐ Muskegon/Holland (MI) ‐ Mackinac Island ‐ Sault Ste. Marie (MI) ‐ Little Current ‐ Parry Sound ‐ MIDLAND
Canadian Maritimes & St. Lawrence
2 8 Mid May ‐ mid Sep
PORTLAND ‐ Bar Harbor ‐ Lunenburg ‐ Halifax ‐ Charlottetown ‐ Iles de la Madeleine ‐ Gaspe ‐ Baie‐Comeau ‐ Saguenay Fjord ‐ Quebec City ‐ Montreal ‐ Clayton ‐ TORONTO
SUBTOTAL 12 128
Blount (2018)
Grande Caribe
Locks, Legends & Canals
2 14 Late Sep ‐ late Oct
NEW YORK CITY ‐ West Point (NY) ‐ Kingston (NY) ‐ Sylvan Beach (NY) ‐ Oswego (NY) ‐ Clayton/Alexandria Bay ‐ Quebec City ‐ Trois‐Rivieres ‐ MONTREAL
The Saguenay
4 14 Early Aug ‐ late Sep
NEW YORK CITY ‐ Kingston (NY) ‐ Rome (NY) ‐ Oswego (NY) ‐ Clayton/Alexandria Bay ‐ Quebec City ‐ Saguenay ‐ MONTREAL
Grande Mariner
Magical Lake Michigan
2 8 Mid Aug ‐ early Sep
CHICAGO ‐ Holland (MI) ‐ Beaver Island (MI) ‐ Mackinac Island ‐ Sturgeon Bay ‐ Milwaukee ‐ CHICAGO
Locks, Legends & Canals
1 14 Mid Oct
NEW YORK CITY ‐ West Point (NY) ‐ Kingston (NY) ‐ Sylvan Beach (NY) ‐ Oswego (NY) ‐ Clayton/Alexandria Bay ‐ Quebec City ‐ Trois‐Rivieres ‐ MONTREAL
The Saguenay
1 14 Early Oct
NEW YORK CITY ‐ Kingston (NY) ‐ Rome (NY) ‐ Oswego (NY) ‐ Clayton/Alexandria Bay ‐ Quebec City ‐ Saguenay ‐ MONTREAL
SUBTOTAL 10 128
Plantours Hamburg Sondre Stromfjord
32 1 Mid Sep ‐ mid Oct
KANGERLUSSUAQ ‐ Nuuk/Godthåb (Greenland) ‐ Paamiut/ Frederikshåb (Greenland) ‐ Qaqortoq/Julianehåb (Greenland) ‐ Red Bay (NL) ‐ Norris Point (NL) ‐ Woody Point (NL) ‐ Cap‐aux‐Meules ‐ Gaspé ‐ Baie‐Comeau ‐ Saguenay ‐ La Baie ‐ Pointe‐au‐Pic – Québec City ‐ Montreal ‐ Toronto – Windsor ‐ Tobermory ‐ Little Current ‐ Milwaukee ‐ Chicago ‐ Traverse City (MI) ‐ Mackinac Island ‐ Port Colborne ‐ Kingston ‐
Exhibit A Report Number 19-150
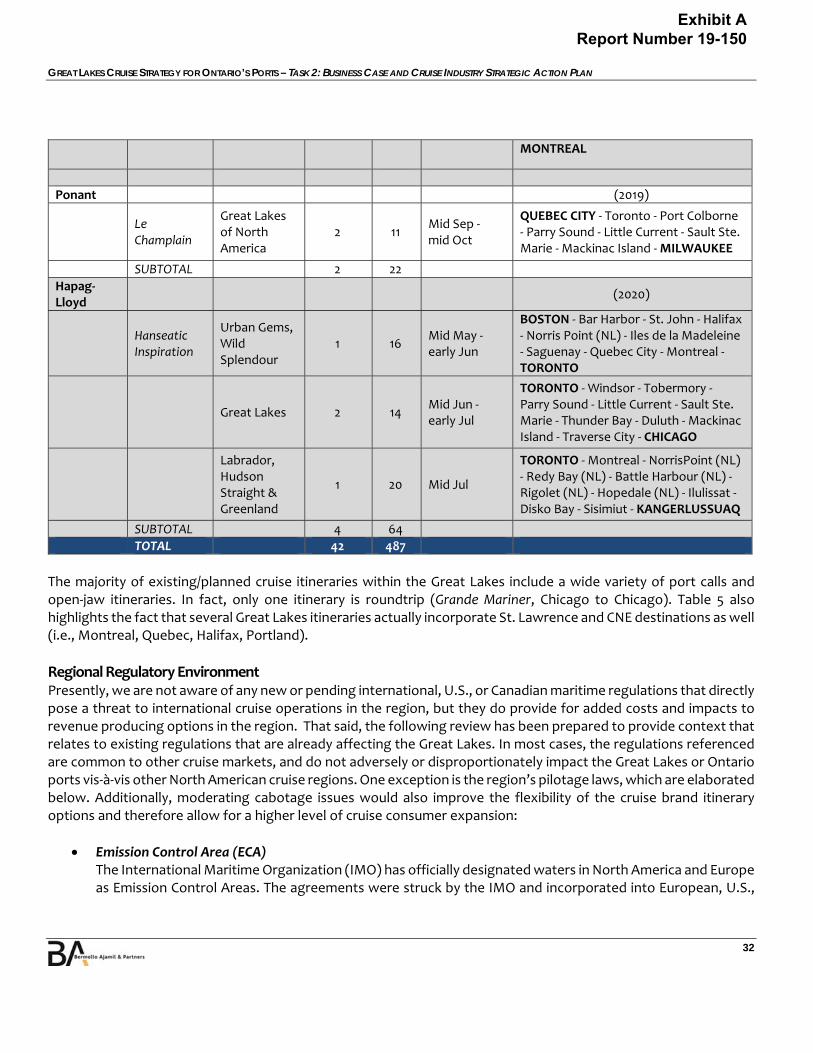
GREAT LAKES CRUISE STRATEGY FOR ONTARIO’S PORTS – TASK 2: BUSINESS CASE AND CRUISE INDUSTRY STRATEGIC ACTION PLAN
32
MONTREAL
Ponant (2019)
Le Champlain
Great Lakes of North America
2 11 Mid Sep ‐ mid Oct
QUEBEC CITY ‐ Toronto ‐ Port Colborne ‐ Parry Sound ‐ Little Current ‐ Sault Ste. Marie ‐ Mackinac Island ‐ MILWAUKEE
SUBTOTAL 2 22
Hapag‐Lloyd
(2020)
Hanseatic Inspiration
Urban Gems, Wild Splendour
1 16 Mid May ‐ early Jun
BOSTON ‐ Bar Harbor ‐ St. John ‐ Halifax ‐ Norris Point (NL) ‐ Iles de la Madeleine ‐ Saguenay ‐ Quebec City ‐ Montreal ‐ TORONTO
Great Lakes 2 14 Mid Jun ‐ early Jul
TORONTO ‐ Windsor ‐ Tobermory ‐ Parry Sound ‐ Little Current ‐ Sault Ste. Marie ‐ Thunder Bay ‐ Duluth ‐ Mackinac Island ‐ Traverse City ‐ CHICAGO
Labrador, Hudson Straight & Greenland
1 20 Mid Jul
TORONTO ‐ Montreal ‐ NorrisPoint (NL) ‐ Redy Bay (NL) ‐ Battle Harbour (NL) ‐ Rigolet (NL) ‐ Hopedale (NL) ‐ Ilulissat ‐ Disko Bay ‐ Sisimiut ‐ KANGERLUSSUAQ
SUBTOTAL 4 64
TOTAL 42 487
The majority of existing/planned cruise itineraries within the Great Lakes include a wide variety of port calls and open‐jaw itineraries. In fact, only one itinerary is roundtrip (Grande Mariner, Chicago to Chicago). Table 5 also highlights the fact that several Great Lakes itineraries actually incorporate St. Lawrence and CNE destinations as well (i.e., Montreal, Quebec, Halifax, Portland).
Regional Regulatory Environment Presently, we are not aware of any new or pending international, U.S., or Canadian maritime regulations that directly pose a threat to international cruise operations in the region, but they do provide for added costs and impacts to revenue producing options in the region. That said, the following review has been prepared to provide context that relates to existing regulations that are already affecting the Great Lakes. In most cases, the regulations referenced are common to other cruise markets, and do not adversely or disproportionately impact the Great Lakes or Ontario ports vis‐à‐vis other North American cruise regions. One exception is the region’s pilotage laws, which are elaborated below. Additionally, moderating cabotage issues would also improve the flexibility of the cruise brand itinerary options and therefore allow for a higher level of cruise consumer expansion:
Emission Control Area (ECA) The International Maritime Organization (IMO) has officially designated waters in North America and Europe as Emission Control Areas. The agreements were struck by the IMO and incorporated into European, U.S.,
Exhibit A Report Number 19-150
GREAT LAKES CRUISE STRATEGY FOR ONTARIO’S PORTS – TASK 2: BUSINESS CASE AND CRUISE INDUSTRY STRATEGIC ACTION PLAN
33
and Canadian law. The Baltic Sea became the first fully implemented SOx Emission Control Area (SECA) in August 2006. One year later, the North Sea and English Channel became the second SECA. In March 2010, IMO’s Marine Environmental Protection Committee adopted a proposal from the U.S. and Canada, for an ECA extending 200 nautical miles from both east and west coasts, and around the islands of Hawaii. The North American ECA also applies to the Great Lakes.
The ECA is not only for SOx emissions, but also particulate matter and NOx. It has been fully implemented since August 2012. In September 2010, another U.S. proposal for an ECA around Puerto Rico and the U.S. Virgin Islands was discussed at the IMO, which was enforced in 2014. Further ECAs have been or will be proposed for Norway, Japan, and the Mediterranean. When the revised MARPOL Annex VI entered into force in July 2010, it included a change to the name and definition of an emission control area from SECA to ECA – an area where special mandatory measures are required to control NOx, SOx, particulate matter (PM), or all three types of emissions from ships. In 2015, a fuel‐sulphur standard of 0.1% (1,000 ppm) was expected to reduce PM and SOx emissions by more than 85%. This fuel standard is expected to be met primarily by fuel switching. In most cases, ships have the capability to store two or more fuels. To meet the 1,000 ppm fuel sulphur requirement, some vessels may need to be modified for additional distillate fuel‐storage capacity. As an alternative to using lower‐sulphur fuel, ship operators may choose to equip their vessels with exhaust‐cleaning devices (i.e., scrubbers). Vessels were required to burn LS 380 (1%) beginning in 2012 and MGO (0.5%) by 2015 within ECAs. Outside ECAs, the current global limit of 4.5% sulphur‐in‐fuel has been reduced to 3.5% in 2012, then 0.5% in 2020 or 2025, depending on a review in 2018 that will determine the availability of fuel to enable implementation of this standard. It is currently estimated that the cost of fuel for cruise ships is between $10 and $20 per passenger per day. There is also a shift to using dual fuel sources, such as LNG, in ports and heavily populated regions. Of the 106 newbuilds in the current orderbook, 18 will be powered by LNG. None of the current or planned fleet of small cruise vessels capable of transiting the Great Lakes Locks are designed to use LNG as a primary fuel.
o Emissions from these smaller vessels, coupled with few calls likely has a low environmental impact. These regulations are not envisioned to be a detractor from potential small ship cruise growth in the region.
Wastewater International requirements for the prevention of pollution from sewage are contained in Annex IV of the International Maritime Organization's Pollution Convention, Regulations for the Prevention of Pollution by Sewage from Ships. Annex IV of the Pollution Convention contains requirements for surveys, International Sewage Pollution Prevention Certificates, sewage treatment plants, discharging sewage, reception facilities, and standard discharge connections. Annex IV came into force in 2003. Canada has not acceded to Annex IV; however, Canada has adopted regulations concerning sewage pollution prevention in Division 4 – Sewage – of the Regulations for the Prevention of Pollution from Ships and for Dangerous Chemicals. These provisions replace the previous Great Lakes Sewage Pollution Prevention Regulations, Pleasure Craft Sewage Pollution Prevention Regulations, and
Exhibit A Report Number 19-150

GREAT LAKES CRUISE STRATEGY FOR ONTARIO’S PORTS – TASK 2: BUSINESS CASE AND CRUISE INDUSTRY STRATEGIC ACTION PLAN
34
Non‐Pleasure Craft Sewage Pollution Prevention Regulations. The regulations for the Prevention of Pollution from Ships and for Dangerous Chemicals are a consolidation of the former regulatory requirements, the recommendations of a stakeholder group established by Transport Canada Marine Safety, and the requirements of Annex IV of the Pollution Convention that have not been fully addressed by regulations in Canada. Annex IV of the Pollution Convention applies only to ships of 400 tons or more, or that are certified to carry over 15 persons. The application has been expanded in the regulations to include all ships in all Canadian waters, and to all Canadian ships everywhere. Previous regulations concerning sewage only applied to ships other than pleasure crafts in the Great Lakes, and to all ships in a few areas designated for zero discharge. In Ontario, application includes pleasure crafts under provincial legislation. Section 119 of the regulations requires a ship that has a toilet onboard to have a holding tank or an approved marine‐sanitation device. With some exceptions, the discharge of untreated sewage into all Canadian inland and coastal waters within 3 nautical miles of land (from ships less than 400 tons) and 12 miles of land (from ships larger than 400 tons) is now banned. Treated sewage will only be allowed to be discharged into Canadian waters subject to specified limits of fecal coliforms per 100 ml of water. Adoption of these requirements will permit Canada to accede to Annex IV of the Pollution Convention.4
o This is not an impactful regulation to small vessel growth in the region, but does provide for strengthening
of the environmental protection for the region. Thus, Great Lakes ports should provide infrastructure to off‐load wastewater as part of meeting the Marpol Annex IV Pollution Convention.
Ballast Water Invasive species have challenged parts of the Great Lakes region for many years. There are a number of entry points for non‐native species, one of which is the ballast water of oceangoing vessels. In response to this environmental concern, a number of international and joint U.S.‐Canadian initiatives have been implemented. In 2004, the IMO, a part of the United Nations, adopted a global agreement for the regulation of ships’ ballast water. This agreement contains a specific, numeric ballast‐water quality standard. The agreement anticipates that ballast‐water management systems will be installed onboard vessels to filter and treat this water prior to discharge. Two years later, in 2006, a U.S.‐Canadian Ballast Water Working Group was formed. The BWWG is comprised of representatives from Transport Canada Marine Safety, the U.S. Coast Guard, the U.S. Saint Lawrence Seaway Development Corporation, and the Canadian St. Lawrence Seaway Management Corporation. The BWWG’s mission is to coordinate regulatory, compliance, and research efforts among the group’s membership for reducing aquatic nuisance‐species invasions via ballast water in the Great Lakes. Another initiative related to ballast water is the Great Ships Initiative. The Northeast‐Midwest Institute, in collaboration with the American Great Lakes Ports Association, the National Fish and Wildlife Foundation, the University of Wisconsin Superior, interested carriers, and relevant federal, state and provincial agencies launched a Great Ships Initiative (GSI) in July 2006 to focus resources and expertise on producing solutions to the problem of ship‐mediated invasive species in the Great Lakes. The primary objectives of the GSI program are:
4 Source: Transport Canada
Exhibit A Report Number 19-150

GREAT LAKES CRUISE STRATEGY FOR ONTARIO’S PORTS – TASK 2: BUSINESS CASE AND CRUISE INDUSTRY STRATEGIC ACTION PLAN
35
1) Solicit and identify promising treatment systems most relevant to Seaway‐sized transoceanic vessels. 2) Provide technical support through operational and biological testing, and expert reviews of findings to
accelerate the effective research and development of promising systems. 3) Facilitate successful evaluation and approval by regulators of any promising treatment alternatives.
o Today, all vessels entering the St. Lawrence Seaway from outside Canada’s exclusive economic zone are inspected in a binational program before they enter the Great Lakes. This enforcement action ensures full compliance with exchange and flushing requirements, as ships must either already meet the regulatory requirements or take corrective action to meet them. Scientific research has shown that this program is effective, and recommended it for other freshwater ecosystems around the world. Since this binational inspection system was implemented in 2006, no new non‐native species attributed to ships’ ballast water has been reported in the Great Lakes.5
Customs & Immigration Issues Most Great Lakes cruises are operated by foreign flag vessels that visit both Canadian and U.S. ports. Therefore, customs and immigration clearance is required for passengers entering each country after visiting the other. In Canada, such services are handled by the Canada Border Services Agency (CBSA). In the U.S., they are handled by U.S. Customs & Border Protection. There are currently no practices within the Great Lakes related to customs and immigration that are unique to the Great Lakes. In other words, cruise lines and passengers alike can expect an experience similar to what they would have in comparable cruise regions, such as CNE and Alaska. The majority of cruise lines have already adopted a related best practice in the Great Lakes, as well as elsewhere in North America: Limit multiple entries to one country or the other to the maximum extent possible, so that passengers can be cleared only once, based on a single foreign arrival.
o Making key itinerary patterns within the Great Lakes “closed loop” (i.e., limiting the immigration inspection requirements) will provide fewer regulations for cruise brands with a majority of U.S. / Canadian citizens and allow for a better overall passenger experience and provide for the ability of vessel to more easily move between US and Canadian ports.
o The “closed loop” pattern discussion is relevant as part of the cabotage issue below and wold provide for an abundance of opportunities for small cruise ship itinerary patterns in the region, thus increasing the potential opportunity for new cruise patterns and calls to the Ports of Ontario.
Cabotage Passenger cabotage exists in both the U.S. under the Passenger Vessel Services Act, (PVSA) and Canadian Coasting Trade Act (1992) waters. Today, most Great Lakes cruises are operated by foreign flag vessels that visit both Canadian and U.S. ports. Therefore, customs and immigration clearance is required The Great Lakes is unique among the United States coastal trade because there is no adjacent international water for a vessel to sail into. A vessel sailing on the Lakes is either in U.S. or Canadian territorial waters. Maritime cabotage, or coasting trade as it is referred to in Canada, may generally be defined as the movement of
5 Source: Transport Canada; St. Lawrence Seaway Management Corporation
Exhibit A Report Number 19-150
GREAT LAKES CRUISE STRATEGY FOR ONTARIO’S PORTS – TASK 2: BUSINESS CASE AND CRUISE INDUSTRY STRATEGIC ACTION PLAN
36
goods or passengers between two ports or places within the same State. While in Canada the definition has been expanded to include certain other related activities.6
A cruise vessel that carries passengers from one Great Lakes U.S. port to another U.S. port without stopping in Canada must fulfil the requirements of the Passenger Vessel Services Act. The Act requires that the vessel be registered in the U.S., that a majority of its stock be owned by U.S. citizens and that it be crewed by U.S. citizens. The United States Coast Guard (USCG) issues certificates of documentation, and this agency determines the eligibility of vessels for a coastwise endorsement to appear on such certificates. U.S. Customs has ruled that generally, a passenger is any person carried on a vessel who is not directly and substantially connected with the operation of such vessel, her navigation, ownership, or business, (Customs Bulletin and Decisions, 2002).
Summary of the “Zodiacs Incident” As reported on July 10, although Seabourn had permits to operate Zodiac in Alaska, these were withdrawn at the last minute, meaning its Alaska Zodiac program had to be dropped. The concern was an interpretation of the US PVSA, which restricts coasting in US waters to US‐built, US‐owned and US‐flag vessels. There being no similar problem in Canada, Seabourn’s Zodiac tours proceeded as planned in British Columbia waters. In 1994, a company called Marine Expeditions had planned a series of five expedition voyages on the Great Lakes, which in the end they decided to restrict to the Canadian side of the border. The cruises never went ahead, but nevertheless a ruling was made by the US Coast Guard by on July 21, 1994, the rulings of which were: 1) The transportation of passengers by a foreign‐flagged cruise vessel between two ports on the Great Lakes, when the port of embarkation is in Canada and the port of disembarkation is in the United States, and with various intervening stops at both United States and Canadian ports, does not constitute a violation of 46 USC12107 or 46 USC App 289. 2) The transportation of passengers by a foreign‐flagged cruise vessel between two ports on the Great Lakes, when the port of embarkation is in the United States and the port of disembarkation is in Canada, and with various intervening stops at both United States and Canadian ports, does not constitute a violation of 46 USC12107 or 46 USC App 289. 3) A foreign‐built & owned inflatable boat carried on board the above‐described cruise vessel used to transport passengers on excursions in United States waters for the purpose of sight‐seeing constitutes a violation of 46 USC App. 289. After Seabourn’s experience in Alaska (summer 2018), both Hapag‐Lloyd and Ponant will want to pay close attention to this ruling before introducing their new ships in 2020. For Canada, by allowing Zodiac excursions, there would be a huge advantage over US destinations.
The geography of the Great Lakes does not preclude the use of a foreign‐flag vessel. Indeed during the past two decades foreign vessels have been the largest cruise ships on the Great Lakes. However, the route structure is artificially constrained because the vessel must call at Canadian ports every voyage. The PSVA states that no foreign vessel shall transport passengers between ports or places in the United States either directly or by way of a near‐by‐foreign port. A “nearby foreign port” as defined includes any port in North America. There are no “far‐foreign” ports in the Great Lakes. For instance, a vessel without coastwise documentation cannot pick up a passenger in Duluth, MN then call at Canadian Ports, enroute to
6 J. R. F. Hodgson & Mary R. Brooks Marine Affairs Program Dalhousie University
Exhibit A Report Number 19-150

GREAT LAKES CRUISE STRATEGY FOR ONTARIO’S PORTS – TASK 2: BUSINESS CASE AND CRUISE INDUSTRY STRATEGIC ACTION PLAN
37
disembarking the passenger in Chicago, IL. Thus, limitations imposed by the PVSA result in constraints on Great Lakes route structures and create additional operating costs for foreign flag operators.7
o In its simplest form revising the PSVA or Coasting Trade Acts to allow for ease of access to and from U.S. /
Canadian Ports for U.S. and Foreign‐flagged vessels with the express purpose of carrying cruise passengers on an extended itinerary pattern would be invaluable to allow for ease of access.
o Modifying Cabotage in conjunction with immigration policies for cruise vessels / passengers would be beneficial to the small ship cruise industry to allow for greater freedom of movement in the Great Lakes on a variety of itinerary patterns.
o To determine the extent of the impacts to the industry would take time in order to determine if additional sailings would be added.
Right Whale Protection/Monitoring In 2017, the Northeast coast of the U.S. and the Gulf of St. Lawrence experienced a shift in North Atlantic Right Whale migration patterns to the North. While anticipated as far back as 2010, this shift occurred more abruptly than expected, resulting in unforeseen impacts to shipping channels across the Gulf of St. Lawrence. This shift resulted in numerous new sightings of Right Whales at the mouth of the St. Lawrence, and led to 12 whale fatalities. The North Atlantic Right Whale has been on the endangered species list since 1970 and numerous measures have been taken during the past 40 years in the whale’s primary habitat areas to reduce injuries and deaths caused by vessel strikes. The occurrence of 12 such strikes in a single year triggered a host of new temporary regulations, most of which relate to vessel positioning, monitoring, and reporting practices and speeds. The most significant resulting impact of this environmental crisis for the cruise industry was a mandatory vessel‐speed reduction program that disrupted numerous sailings in the CNE region causing more than a dozen itineraries to be altered.
o While this impact is primarily an issue for the CNE cruise market to deal with, since all of the oceangoing cruise ships that operate in the Great Lakes transit the St. Lawrence Seaway, any future regulations or mandates related to vessel speeds within the St. Lawrence could cause disruptions to planned Great Lakes itineraries as well. Given the scheduling‐integrity challenges that cruise vessels in the Great Lakes already face due to occasional lack of availability of pilots licensed to operate in the Great Lakes (see below), the Right Whale situation is something to be mindful of, if not necessarily concerned about.
Pilotage Pilotage is probably the single most important and complex regulatory aspect of the Great Lakes region. Pilotage in the Great Lakes region is compulsory for most vessels. Under the treaties between the two nations a pilot must be aboard a foreign flag vessel trading between Canadian and U.S. ports. Ships subject to compulsory pilotage include (among others):
o Ships of more than 1500 GT; Ships not registered in Canada of more than 35 meters in overall length; and, U.S. flagships that sail only within U.S. waters.
7 Regulations & Policies that Limit the Growth of the U.S. Great Lakes Cruising Market, University of Wisconsin-Superior Paper No. 02-21:1 National Center for Freight & Infrastructure Research & Education College of Engineering Department of Civil and Environmental Engineering University of Wisconsin, Madison Authors: Richard Stewart, Ph.D. University of Wisconsin-Superior and Principal Investigator: Richard Stewart, Ph.D. Chair, Department of Business and Economics, University of Wisconsin-Superior
Exhibit A Report Number 19-150
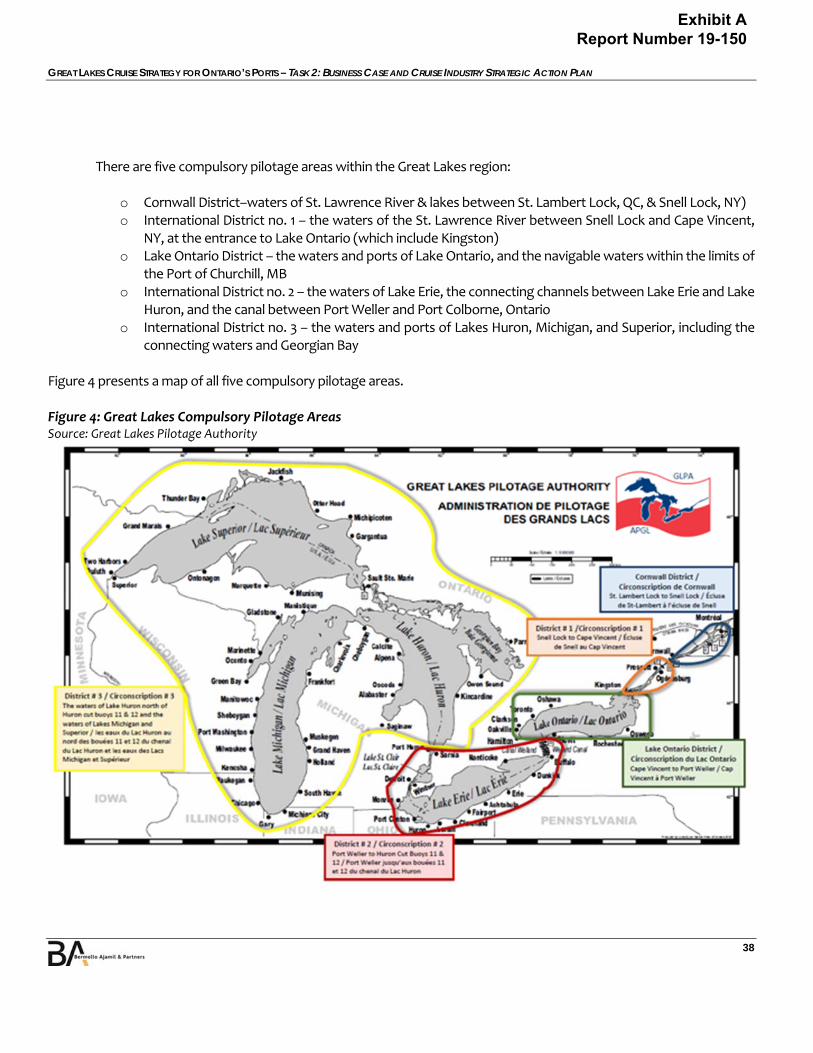
GREAT LAKES CRUISE STRATEGY FOR ONTARIO’S PORTS – TASK 2: BUSINESS CASE AND CRUISE INDUSTRY STRATEGIC ACTION PLAN
38
There are five compulsory pilotage areas within the Great Lakes region:
o Cornwall District–waters of St. Lawrence River & lakes between St. Lambert Lock, QC, & Snell Lock, NY) o International District no. 1 – the waters of the St. Lawrence River between Snell Lock and Cape Vincent,
NY, at the entrance to Lake Ontario (which include Kingston) o Lake Ontario District – the waters and ports of Lake Ontario, and the navigable waters within the limits of
the Port of Churchill, MB o International District no. 2 – the waters of Lake Erie, the connecting channels between Lake Erie and Lake
Huron, and the canal between Port Weller and Port Colborne, Ontario o International District no. 3 – the waters and ports of Lakes Huron, Michigan, and Superior, including the
connecting waters and Georgian Bay Figure 4 presents a map of all five compulsory pilotage areas.
Figure 4: Great Lakes Compulsory Pilotage Areas Source: Great Lakes Pilotage Authority
Exhibit A Report Number 19-150
GREAT LAKES CRUISE STRATEGY FOR ONTARIO’S PORTS – TASK 2: BUSINESS CASE AND CRUISE INDUSTRY STRATEGIC ACTION PLAN
39
Canadian pilotage within the Great Lakes is governed by the Canadian Pilotage Act. Articles 25 and 26 of the Pilotage Act state that licensed pilots have the exclusive legal responsibility for the conduct of the ship, and for ensuring its safe navigation. In Canada, the pilot is not restricted to an advisory role, as is the case in other countries. The pilot is responsible for controlling the ship’s movement at all times, including during berthing and un‐berthing, while remaining responsible to the captain for the safe navigation of the ship. Therefore, pilots are required to remain onboard all vessels for the entire duration of their Great Lakes operations. Canadian pilotage regulations specify that English is to be the language between the pilot and bridge watch‐keeping personnel, unless a language other than English is common to all those involved in the operation. Communication with Marine Communications and Traffic Services (MCTS) is also specified to be conducted in English in International district no. 1, International Lake Ontario District, International Districts no. 2 and 3. Communications are conducted in French in the Cornwall District. Unlike Canada, pilotage of international trade vessels in the U.S. has not been regulated at the federal level, but by individual states, since 1789. All state pilots also hold a Federal license, however, which serves as a national minimum. All vessels engaged in international trade moving in the waters of a state are required to take a pilot licensed by that state. Although each state has its own pilotage statute and regulatory system, there are substantial similarities in their systems. The largest of the Great Lakes compulsory pilotage areas – District 3 – falls within the jurisdiction of the Western Great Lakes Pilots Association (WGLPA). District 3 is comprised of Lakes Superior, Michigan, and Huron, as well as the St. Mary’s River and the Soo Locks. The WGLPA pilots ships into nearly 60 different ports. Pilotage duties are shared between U.S. and Canadian pilots, with the current mix being 15 U.S. and 3 Canadian. Since the Great Lakes are bordered by 8 U.S. states and one Canadian province (Ontario), the U.S. pilots are regulated federally by the U.S. Coast Guard.8
The cost of a registered pilot aboard a Great Lakes cruise vessel is determined by formulas based on vessel size and the route structure. The additional charges that can accrue due to locks, layovers, pilot exchanges and other vessel movements are complex enough so that the pilot authority pricing is based on ship size and route rather than ship type. The vessels are assigned a pilotage class for pricing. The formula used by the Canadian authority is determined in meters. The fees that are charged are roughly the same for U.S. or Canadian pilots. A 2009 case study for a potential cruise vessel with 65 berths and dimensions of length‐over‐all 65.52 meters x beam 10.97 meters x draft 3.80 meters, was undertaken by the Great Lakes Cruising Coalition, (Burnett, 2009). As part of the study a pilotage fee of CA $26,403 was estimated for a Toronto, Canada to Thunder Bay, Canada one‐way seven day voyage that started in the port of Toronto, through the Welland Canal, with stops in Windsor, Midland, Parry Sound, Little Current, and Sault Saint Marie, Ontario, Canada. The pilotage fee for this proposed vessel with 65 berths at a 100% occupancy rate breaks down to $406 per passenger during a one week cruise. The fee would not change if occupancy falls below 100%. This case study shows that the price of pilotage drives operators to capture costs through higher prices and if possible to sail as large a vessel as possible to spread the pilotage fee over a greater number of passengers. There may be options to reduce the cost of pilotage for a Great Lakes Cruise vessel. One potential pilotage‐related risk to future cruise activity in the Great Lakes is lack of pilot availability. Due to the stay‐onboard requirements of all pilots in the region and a limited pool of pilots licensed to work in each district
8 Source: the American Pilots Association
Exhibit A Report Number 19-150
GREAT LAKES CRUISE STRATEGY FOR ONTARIO’S PORTS – TASK 2: BUSINESS CASE AND CRUISE INDUSTRY STRATEGIC ACTION PLAN
40
within the region, the vessels occasionally face delays entering or continuing their voyage, due to pilots not being available.
o It is B&A’s understanding that this situation currently impacts only a small percentage of vessel traffic within the Great Lakes. However, if the number of vessels and sailings continues to grow, this issue could become more significant, especially since vessels in the Great Lakes system have strict advance‐notification requirements for transiting the region’s multiple locks. In other words, a vessel delay in one district could cause that vessel to miss its scheduled transit through the next district, thereby disrupting the entire itinerary. Options may include the following: Allow for small ship vessel Captain’s to obtain licensing in the Great Lakes based upon length of
time sailing in the region and appropriate other qualifications. Reduce the overall fees associated with pilotage, or modify the requirements within the Great
Lakes when in certain areas. o Any changes or modifications that could assist the cruise brands in what is a significant cost of cruising in
the region would be beneficial and may cause more ships to extend their seasonality in the Great Lakes.
Other / Future Regulation For the most part, it is not possible to predict future regulations that might be strongly adopted to the cruise industry. One exception has to do with overall carbon emissions from oceangoing vessels involved in international trade (including cruise vessels). In April 2018, the IMO announced its initial strategy as follows: “The goal is to reduce maritime emissions at least 50% by 2050, from 2008 levels, while pursuing full decarbonisation in line with the Paris Agreement. The strategy also sets a target to reduce CO2 emissions relative to each tonne of cargo shipped by at least 40% by 2030 and pursue efforts towards 70% by 2050, and plans to review the IMO’s energy efficiency design rules with an eye to strengthening them.” Talks on implementing these targets are to be guided by two principles:
o “Common but differentiated responsibility” between rich and poor countries for tackling climate change from the UN climate convention
o The IMO rule against discrimination between ships by the country where their flags are registered This language is still generic, in the sense that mechanisms for achieving the stated goals are as yet undefined. However, this announcement from IMO does indicate clearly that broad carbon‐emission reduction regulations are likely imminent, since previous regulations (i.e., ECA) have taken this same basic path prior to being adopted and ultimately enforced.
With organizations such as the Great Lakes Coalition, Council of the Great Lakes Region, Canada‐U.S. Regulatory Cooperation Council and others working to modify regulatory processes toward the goal of increased cruise passenger services in the Great Lakes, and in cooperation between federal and state governments to address these regulatory issues there is an excellent opportunity to expand Great Lakes cruising over the next 10‐years.
If the regulatory environment related to border access, pilotage, etc. were cleaned up the region may provide a
Exhibit A Report Number 19-150
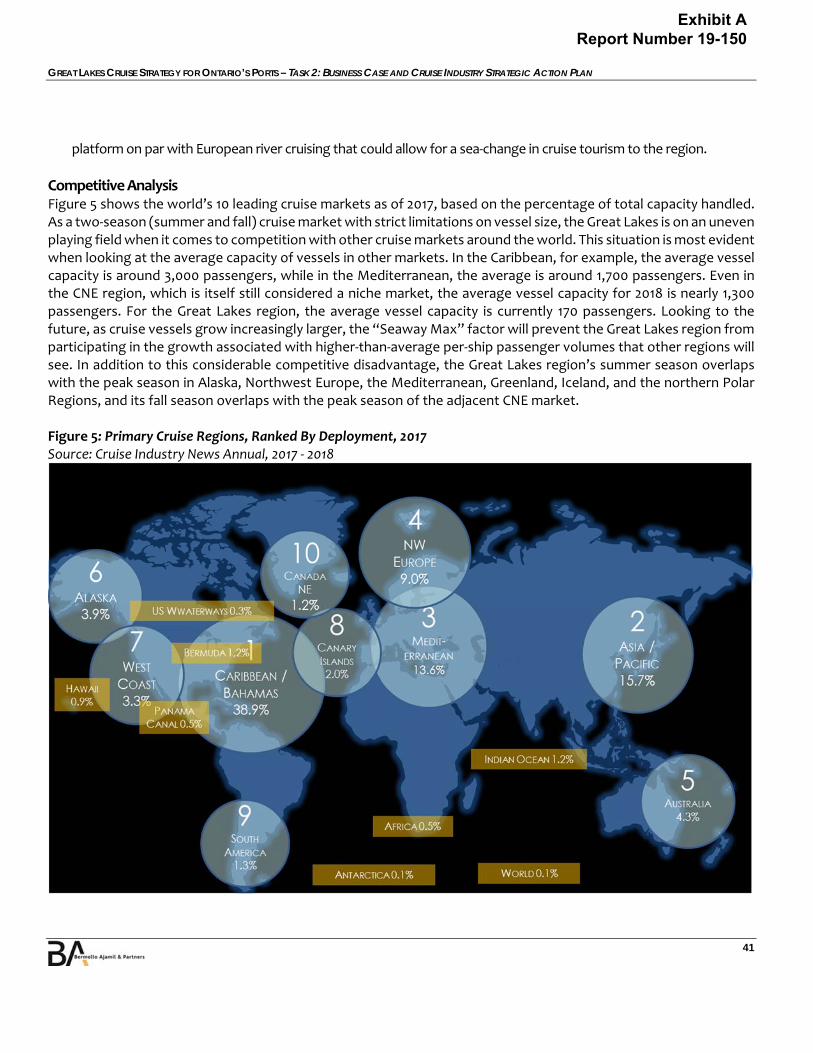
GREAT LAKES CRUISE STRATEGY FOR ONTARIO’S PORTS – TASK 2: BUSINESS CASE AND CRUISE INDUSTRY STRATEGIC ACTION PLAN
41
platform on par with European river cruising that could allow for a sea‐change in cruise tourism to the region.
Competitive Analysis Figure 5 shows the world’s 10 leading cruise markets as of 2017, based on the percentage of total capacity handled. As a two‐season (summer and fall) cruise market with strict limitations on vessel size, the Great Lakes is on an uneven playing field when it comes to competition with other cruise markets around the world. This situation is most evident when looking at the average capacity of vessels in other markets. In the Caribbean, for example, the average vessel capacity is around 3,000 passengers, while in the Mediterranean, the average is around 1,700 passengers. Even in the CNE region, which is itself still considered a niche market, the average vessel capacity for 2018 is nearly 1,300 passengers. For the Great Lakes region, the average vessel capacity is currently 170 passengers. Looking to the future, as cruise vessels grow increasingly larger, the “Seaway Max” factor will prevent the Great Lakes region from participating in the growth associated with higher‐than‐average per‐ship passenger volumes that other regions will see. In addition to this considerable competitive disadvantage, the Great Lakes region’s summer season overlaps with the peak season in Alaska, Northwest Europe, the Mediterranean, Greenland, Iceland, and the northern Polar Regions, and its fall season overlaps with the peak season of the adjacent CNE market. Figure 5: Primary Cruise Regions, Ranked By Deployment, 2017 Source: Cruise Industry News Annual, 2017 ‐ 2018
Exhibit A Report Number 19-150

GREAT LAKES CRUISE STRATEGY FOR ONTARIO’S PORTS – TASK 2: BUSINESS CASE AND CRUISE INDUSTRY STRATEGIC ACTION PLAN
42
Fortunately, vessel deployment is driven by consumer demand, and can and does change over time. Cruise lines place their vessels into regions where they get the best return on investment. Essentially, they are looking for regions that are in high demand, provide low operating costs, and, in the final calculations, provide the highest level of profit. The Great Lakes region, including all 14 itinerary patterns planned for 2018‐2019 (see Annex B), remains very much a niche market for cruise. However, in the recent past and increasingly when looking to the future, consumer demand and cruise‐line interest both appear to be growing as the appetite for access to new and lesser known destinations, including the Great Lakes, continues to grow. Therefore, by 2020, the region will welcome a total of five cruise lines and seven individual ships, with nine of the 14 itineraries calling at least one Ontario port. Still, it is important to understand what is happening in other markets around the world, since most of the same ships that have potential to call the ports of Ontario are by and large choosing to operate elsewhere at present. What follows is an overview of the markets that compete most directly with the Great Lakes for cruise ships, and more importantly, cruise passengers.
Alaska Alaska has grown into the sixth largest cruise market in the world by deployed capacity, and now serves as the summer home to some of the newest and largest cruise ships in the global fleet, including NCL’s Norwegian Bliss and RCI’s Ovation of the Seas. Alaska is also the summer home for a number of small expedition cruise brands who take advantage of their smaller vessels to access ports and areas within the Alaska region that most major cruise brands cannot reach. Alaska attracts a wide range of consumers, and has a very strong adventure travel brand that aligns closely with its exotic wilderness and last frontier iconography. Because the Alaska season overlaps directly with the Great Lakes season, it should be seen as a direct competitor. However, Alaska as a destination experience is significantly different from the Great Lakes. Alaska is dominated by North American brands, especially Princess, HAL, CCL, NCL, RCI, and Celebrity. Alaska is an expensive market in which to operate. However, as one of the more profitable cruise markets in the world, it is expected that Alaska will soon be targeted for expansion by major European brands as well, especially MSC. Alaska is currently enjoying a period of rapid growth, in terms of both consumer demand and deployment. Alaska consistently yields high customer satisfaction ratings, as well as above‐average APCDs for the cruise lines. In addition, just as Northwest Europe has benefitted from capacity being withdrawn from the Mediterranean, Alaska has as well, though to a lesser extent. Perceived as a safe and convenient yet exotic cruise option by its core North American source market, Alaska has become one of the world’s “hot” cruise markets, and is poised to continue to grow. Small ship brands that are currently active in Alaska—and might also have potential to operate in the Great Lakes—include the following:
Hurtigruten Hurtigruten operates one ship and offers two itinerary options in Alaska from August through September. Both itineraries are open‐jaw and range in duration from 18‐24 days.
Lindblad Lindblad operates four ships and offers eight different itinerary options in Alaska from June through August. These itineraries include both roundtrip and open‐jaw cruises between multiple ports, and often include extensive land tours. Lindblad’s Alaska itineraries range in duration from 6‐15 days.
Exhibit A Report Number 19-150

GREAT LAKES CRUISE STRATEGY FOR ONTARIO’S PORTS – TASK 2: BUSINESS CASE AND CRUISE INDUSTRY STRATEGIC ACTION PLAN
43
Ponant Ponant operates three ships and offers seven different itinerary options in Alaska, from June through September. All of Ponant’s itineraries are open‐jaw and range in duration from 13‐23 days.
Un‐Cruise Un‐Cruise operates six ships and offers 10 different itinerary options in Alaska, beginning in April and continuing through September. These itineraries include both roundtrip and open‐jaw cruises between multiple ports, and range in duration from 7‐14 days.
Windstar Windstar operates one ship and offers 10 different itinerary options in or passing through Alaska from May through September. All of Windstar’s itineraries are open‐jaw and range in duration from 12‐27 days.
Silversea Silversea operates three ships, including one expedition ship, in Alaska from May through September. Their single expedition ship offers five itinerary options, all but one of which are open‐jaw. They range in duration from 11‐19 days.
ACL/Pearl Seas ACL operates a single ship and offers three different itinerary options in Alaska from June through August. They include two roundtrip cruises (Juneau to Juneau) and one open‐jaw cruise (Juneau to Seattle). ACL’s three itineraries range from 8‐15 days in duration.
Northwest Europe As the fourth largest cruise market in the world, it is not surprising that Northwest Europe offers a large variety of geographic and cultural experiences for cruise passengers to enjoy. The region’s principal source markets are Europe and North America, and it attracts both European and U.S. cruise brands. In addition to many of the world’s major cruise lines, a number of small ship operators also deploy vessels in Northwest Europe during the summer months. As in other markets, small ships in Northwest Europe have successfully developed a niche market‐within‐a‐market by virtue of their ability to differentiate their product offerings—by calling ports and visiting destinations that larger vessels on more rigid schedules cannot. The major draw of the region for cruise tourism incudes numerous urban cultural and historical experiences in multiple iconic European cities, as well as a wide variety of scenic natural attractions, ranging from the famous fjords of Norway to some of the lesser known archipelagos of the North Atlantic. The peak season in Northwest Europe roughly coincides with the peak season in Alaska, namely June through August. Like Alaska, though, Northwest Europe has seen growth into the shoulder seasons (May and September). Generally speaking, Northwest Europe competes head‐to‐head with both Alaska and the Mediterranean for both cruise‐vessel capacity and cruise passengers, though the source markets for these three regions do not completely overlap. Like Alaska and the Mediterranean, Northwest Europe is also an expensive market in which to operate. Still, as more newbuild capacity comes online in the coming years, Northwest Europe will continue to grow
Exhibit A Report Number 19-150

GREAT LAKES CRUISE STRATEGY FOR ONTARIO’S PORTS – TASK 2: BUSINESS CASE AND CRUISE INDUSTRY STRATEGIC ACTION PLAN
44
proportionately, due to both strong consumer demand and high APCDs for the cruise lines. Specific to small ship operators, crossover brands with the greatest potential to operate in the Great Lakes include the following:
Hurtigruten Hurtigruten operates four ships and offers 12 itinerary options in Northwest Europe & Iceland from March through October. They offer an additional 42 itineraries along the Norwegian Coast & Svalbard, both of which are defining markets for their brand. These itineraries include both roundtrip and open‐jaw cruises between multiple ports, and range in duration from 9‐15 days.
Lindblad Lindblad operates one ship and offers two itinerary options in Northwest Europe from May through August. These itineraries are open‐jaw cruises and range from 9‐15 days in duration.
Ponant Ponant operates six ships and offers 22 different itinerary options in Northwest Europe from April through October. Ponant’s itineraries include both roundtrip and open‐jaw cruises, and range in duration from 7‐12 days.
Windstar Windstar operates two ships and offers 22 different itinerary options in Northwest Europe from May through September. Windstar’s itineraries are a mix of roundtrip and open‐jaw cruises, and range in duration from 7‐29 days.
Silversea Silversea operates four ships, including one expedition ship, in Northwest Europe from April through September. Their single expedition ship offers eight itinerary options, all of which are open‐jaw. They range in duration from 10‐14 days.
Hapag‐Lloyd Hapag‐Lloyd operates six ships and offers 12 different itineraries in Northwest Europe from April through September. Theses itineraries include both roundtrip and open‐jaw cruises, and range in duration from 3‐17 days.
GCCL GCCL operates two ships and charters a third in Northwest Europe during the summer months. They offer four different itineraries, all of which are open‐jaw cruises ranging in duration from 14‐18 days.
Cruise & Maritime Cruise & Maritime operates four ships during the summer months in Northwest Europe, and offers a wide variety of itinerary options, ranging in duration from 3‐21 days.
Exhibit A Report Number 19-150
GREAT LAKES CRUISE STRATEGY FOR ONTARIO’S PORTS – TASK 2: BUSINESS CASE AND CRUISE INDUSTRY STRATEGIC ACTION PLAN
45
Noble Caledonia Noble Caledonia operates two ships during the summer months in Northwest Europe, and offers 12 different itinerary options, ranging in duration from 9‐14 days. Noble Caledonia also charters ships in Northwest Europe.
The Mediterranean For many years, the Mediterranean was the world’s second largest cruise market, behind only the Caribbean. The Mediterranean is a large region full of seemingly infinite cultural, culinary, and geographic variety, with a wealth of history, architecture, and lore to go with it. It has an extremely strong appeal to the traveling public, and draws tourists from every corner of the world. Specific to cruise, while the Mediterranean is primarily a summer season, it also enjoys approximately 4‐6 weeks of additional sailings v. Alaska and Northwest Europe, due to its more favorable weather during the shoulder periods of spring and fall. The Mediterranean is also very popular with small ship operators, because the region is full of islands and other world‐class. However, it is not necessarily full of mainstream, hard‐to‐reach destinations that are more conveniently accessed by sea than air. While still an extremely important cruise market, the fact is that the Mediterranean saw continuing decline in both capacity deployed and market share during each year between 2013 and 2017. This downward trend is the direct result of the withdrawal of capacity from the region, either in response to reduced demand or in pursuit of more profitable markets (Asia/Pacific, Caribbean, Alaska, etc.). Uncertainty related to regional geopolitical events has driven much of this recent decline, and resulted in the reduced capacity deployment in the Eastern Mediterranean and the elimination of port calls in the Black Sea and along the coast of North Africa. The Mediterranean is expected to bounce back and continue to grow moving forward, however, and the small ship market there will undoubtedly also continue to thrive. Specific to small ship operators, crossover brands with the greatest potential to operate in the Great Lakes include the following:
Lindblad Lindblad does not currently operate any of their own vessels in the Mediterranean. However, from May through September, Lindblad does offer four different itineraries in the Mediterranean aboard the Sea Cloud, which they charter. These itineraries range in duration from 9‐16 days, and include both roundtrip and open‐jaw cruises.
Ponant Ponant operates six ships and offers 70 different itinerary options in the Mediterranean from April through November. Ponant’s itineraries include both roundtrip and open‐jaw cruises, and range in duration from 8‐11 days.
Variety Variety operates three ships and offers 8 different itinerary options in the Mediterranean from April through November. Variety’s itineraries include both roundtrip and open‐jaw cruises, and are all 8 days in duration.
Exhibit A Report Number 19-150
GREAT LAKES CRUISE STRATEGY FOR ONTARIO’S PORTS – TASK 2: BUSINESS CASE AND CRUISE INDUSTRY STRATEGIC ACTION PLAN
46
Windstar Windstar operates four ships and offers 37 different itinerary options in the Mediterranean from April through November. Windstar’s itineraries are a mix of roundtrip and open‐jaw cruises, and range in duration from 6‐51 days.
Silversea Silversea operates five ships in the Mediterranean from April through October, only one of which could potentially operate in the Great Lakes. Their Mediterranean itineraries range in duration from 6‐16 days.
Hapag‐Lloyd Hapag‐Lloyd operates two ships and offers 19 different itineraries in the Mediterranean from May through October. Theses itineraries include both roundtrip and open‐jaw cruises, and range in duration from 4‐15 days.
GCCL GCCL operates four ships and offers 11 different itineraries in the Mediterranean during the summer months. These itineraries range in duration from 12‐27 days, and include both roundtrip and open‐jaw cruises.
Star Clippers Star Clippers operates two ships in the Mediterranean from April through October, offering 45 different itineraries that range from 3‐11 days in duration.
Cruise & Maritime Cruise & Maritime operates two ships during the summer months in the Mediterranean, and offers seven different itinerary options that range in duration from 10‐15 days.
Greenland/Iceland/Arctic Along with Antarctica, the northern Polar Regions are ripe for exploration by adventure enthusiasts, and their geography allows small expedition vessels an ideal means of accessing destinations that would otherwise be difficult, if not impossible, for the average traveler to get to. It is also the case that these regions are still relatively well‐protected and free from the masses of tourists that often converge on more mainstream vacation destinations, which makes them all the more attractive to consumers looking to do something different and less touristy. This fact, combined with a shared core cruise season, makes the polar regions collectively a competitor of the Great Lakes, in terms of consumer demand, despite the numerous and notable differences between the two regions. Other than Southeast Alaska, where mass market cruising has been successfully operating for decades, most of the world’s northern polar regions remain untouched by the major global cruise brands. This fact also makes the Polar Regions a competitor of the Great Lakes, in terms of vessel deployments, since both markets are largely dominated by small ships. Small ship brands that are currently active in arctic waters, and have the greatest potential to operate in the Great Lakes include the following:
Exhibit A Report Number 19-150
GREAT LAKES CRUISE STRATEGY FOR ONTARIO’S PORTS – TASK 2: BUSINESS CASE AND CRUISE INDUSTRY STRATEGIC ACTION PLAN
47
Hurtigruten Hurtigruten operates three ships and offers 38 itinerary options in Greenland (18), Iceland (15), and the Arctic (5), not including its 42 itinerary options within Norway. These itineraries run from June through early September, and include mostly open‐jaw cruises between multiple ports, ranging in duration from 11‐24 days.
Lindblad Lindblad operates two ships and offers eight different itinerary options in Greenland, Iceland, and the Arctic between May and September. These itineraries include both roundtrip and open‐jaw cruises, and range from 9‐22 days in duration.
Ponant Ponant operates three ships and offers a variety of itinerary options in Greenland, Iceland, and the Arctic between May and September. Ponant’s itineraries include both roundtrip and open‐jaw cruises, and range in duration from 8‐23 days.
Aurora Aurora operates two ships, and by 2020, will offer 6 different itinerary options in Greenland, Iceland, and the Arctic, primarily in July and August. Aurora’s itineraries range in duration from 11‐26 days.
Silversea Silversea operates a single expedition ship in Greenland, Iceland, and the Arctic, and offers seven different itinerary options between June and August. These cruises range in duration from 9‐16 days.
Cruise & Maritime Cruise & Maritime operates four ships during the summer months in Greenland, Iceland, and the Arctic, and offers nine different itinerary options, ranging in duration from 11‐22 days.
Canada & New England CNE is one of the world’s smaller cruise markets, and represents just 1.2% of global cruise passengers (as of this writing). However, as it pertains specifically to the Great Lakes and ports of Ontario, CNE is without question one of the most important cruise markets in the world; the reason is that any ship wishing to operate in the Great Lakes must first pass through the CNE region and transit the Saint Lawrence Seaway and its locks. Beyond just a point of access, though, CNE is important to the future of Great Lakes cruising, because for all intents and purposes, any cruise line wishing to operate in the Great Lakes will realistically also need to operate within CNE, either as part of one or more combined CNE‐Great Lakes itineraries or as separate inbound and outbound repositioning itineraries. In this sense, CNE is both a competitor of the Great Lakes and Ontario ports and a facilitator of their future growth. In terms of the cruise experience and value proposition offered by the two markets, there are numerous similarities, with both markets appealing to similar consumer demographics and cruise brands. For CNE, most cruise activity remains concentrated in September and October, with fall foliage still being the main attraction. However, during the past few years and continuing through at least 2020, there has been, and will continue to be, a significant increase in CNE Summer deployments, primarily by the major contemporary large‐ship brands.
Exhibit A Report Number 19-150
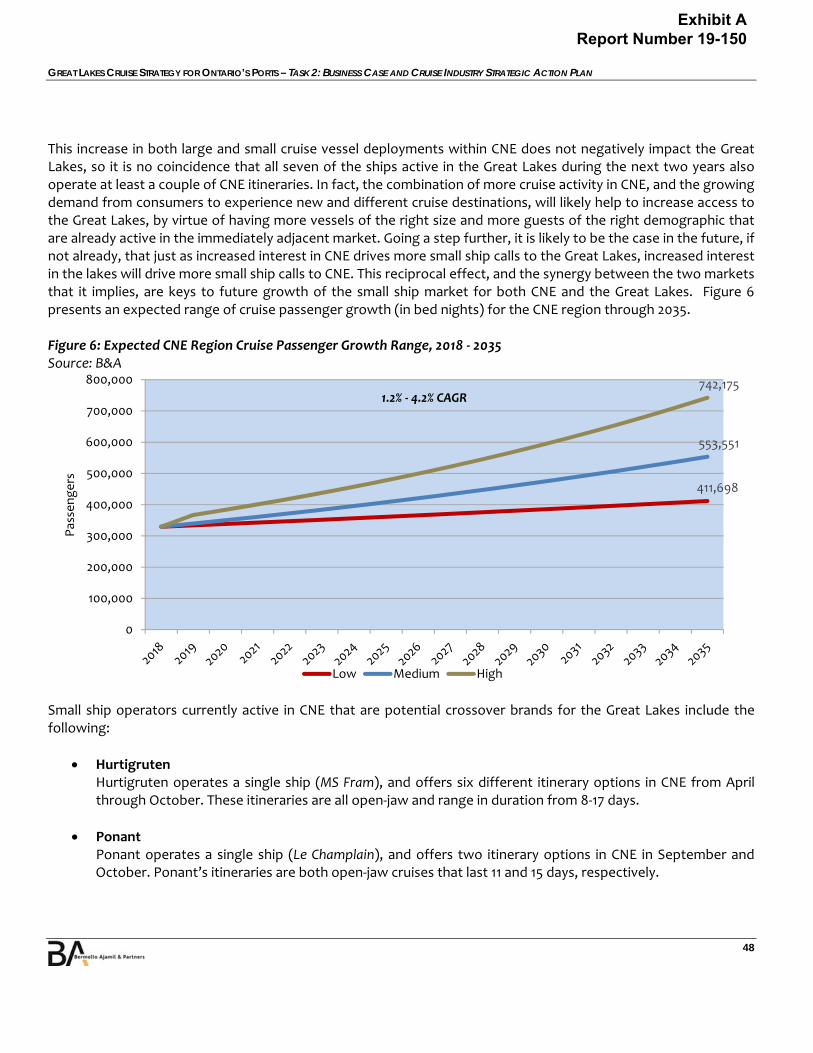
GREAT LAKES CRUISE STRATEGY FOR ONTARIO’S PORTS – TASK 2: BUSINESS CASE AND CRUISE INDUSTRY STRATEGIC ACTION PLAN
48
This increase in both large and small cruise vessel deployments within CNE does not negatively impact the Great Lakes, so it is no coincidence that all seven of the ships active in the Great Lakes during the next two years also operate at least a couple of CNE itineraries. In fact, the combination of more cruise activity in CNE, and the growing demand from consumers to experience new and different cruise destinations, will likely help to increase access to the Great Lakes, by virtue of having more vessels of the right size and more guests of the right demographic that are already active in the immediately adjacent market. Going a step further, it is likely to be the case in the future, if not already, that just as increased interest in CNE drives more small ship calls to the Great Lakes, increased interest in the lakes will drive more small ship calls to CNE. This reciprocal effect, and the synergy between the two markets that it implies, are keys to future growth of the small ship market for both CNE and the Great Lakes. Figure 6 presents an expected range of cruise passenger growth (in bed nights) for the CNE region through 2035. Figure 6: Expected CNE Region Cruise Passenger Growth Range, 2018 ‐ 2035 Source: B&A
Small ship operators currently active in CNE that are potential crossover brands for the Great Lakes include the following:
Hurtigruten Hurtigruten operates a single ship (MS Fram), and offers six different itinerary options in CNE from April through October. These itineraries are all open‐jaw and range in duration from 8‐17 days.
Ponant Ponant operates a single ship (Le Champlain), and offers two itinerary options in CNE in September and October. Ponant’s itineraries are both open‐jaw cruises that last 11 and 15 days, respectively.
411,698
553,551
742,175
0
100,000
200,000
300,000
400,000
500,000
600,000
700,000
800,000
Passe
ngers
Low Medium High
1.2% ‐ 4.2% CAGR
Exhibit A Report Number 19-150
GREAT LAKES CRUISE STRATEGY FOR ONTARIO’S PORTS – TASK 2: BUSINESS CASE AND CRUISE INDUSTRY STRATEGIC ACTION PLAN
49
Windstar Windstar operates a single ship (Star Pride) and offers six different itinerary options in CNE between August and October. Windstar’s itineraries are all open‐jaw cruises, and range in duration from 9‐23 days.
Silversea Silversea operates two ships in CNE during the summer months, only one of which can fit through the Great Lakes Locks (Silver Wind). Silversea’s CNE itineraries include both roundtrip and open‐jaw cruises, and range in duration from 9‐16 days.
ACL/Pearl Seas ACL operates three ships, including the Pearl Mist (as well as American Constellation and Independence) and offers six different itinerary patterns in CNE during the summer and fall seasons. All ACL itineraries are roundtrip cruises, ranging from 8‐11 days in duration. Pearl Seas’ itineraries are a mix of roundtrip and open‐jaw itineraries, and range from 7‐14 days in duration.
Hapag‐Lloyd Beginning in 2020, Hapag‐Lloyd’s Hanseatic Inspiration will offer two itineraries in CNE, both of which are open‐jaw cruises of 5 and 16 days’ duration, respectively.
Cruise & Maritime Cruise & Maritime operates a single ship (Marco Polo) and offers a single 32‐day roundtrip itinerary in CNE in September‐October.
Noble Caledonia Noble Caledonia operates a single ship (Hebridean Sky) and offers two itineraries in CNE during May‐June. These two open‐jaw itineraries are each 13 days in duration.
Victory Victory operates two ships (Victory I and Victory II) in CNE during the summer and fall months, and offers six different itinerary options, most of which are open‐jaw cruises ranging in duration from 7‐11 days.
Blount Blount operates two ships (Grande Caribe and Grand Mariner) in CNE in the summer, and offers seven itineraries ranging from 4‐14 days in duration. These cruises are a mix of roundtrip and open‐jaw.
Plantours Plantours operates a single ship (Hamburg) in CNE from September through October, and offers two
different itinerary options, each of which is 16 days in duration.
Exhibit A Report Number 19-150
GREAT LAKES CRUISE STRATEGY FOR ONTARIO’S PORTS – TASK 2: BUSINESS CASE AND CRUISE INDUSTRY STRATEGIC ACTION PLAN
50
Strengths, Weaknesses, Opportunities & Threats (SWOT) From a global cruise‐industry perspective, the Great Lakes region and the Ontario ports have both advantages and disadvantages. What follows is a point‐by‐point description of both the strengths and weaknesses related to cruise and a summary of what B&A believes to be the primary drivers of, and impediments to, future growth in the form of opportunities and challenges. Strengths
A “new” destination for most cruise brands with substantial upside potential, very limited competition for berths, and no concerns about port congestion or over‐tourism
High guest satisfaction with the Great Lakes among past cruise visitors
Very high consumer demand for future cruises in the region
Average annual income of Great Lakes cruisers estimated at $200,000 (CAD)
Great Lakes/Ontario ports shore excursions rated highly, in terms of both variety and quality by cruise line
Average per passenger spending in each destination visited, estimated to be $200‐$250 (CAD) Weaknesses
Generally limited consumer awareness of, and familiarity with, the Great Lakes region as a cruise destination
Very limited understanding of the Great Lakes region among cruise line itinerary/deployment planners and other decision‐makers (e.g., ports, destinations, access constraints, operating requirements, and sites/tourism products)
Great Lakes/Ontario port infrastructures rated low to average by most brands currently in the market
Lack of coherent product management throughout the Ports of the Great Lakes
Defined by a very specific vessel typology, and therefore limited in terms of potential (~38,000 lower berths total, only a fraction of which are likely ever to be deployed in the region during a given season)
Opportunities
Numerous small‐ship cruise brands are adding capacity and looking to expand into new markets that fit their target consumer demographic profile(s).
Exhibit A Report Number 19-150
GREAT LAKES CRUISE STRATEGY FOR ONTARIO’S PORTS – TASK 2: BUSINESS CASE AND CRUISE INDUSTRY STRATEGIC ACTION PLAN
51
The global cruise industry is adding capacity more aggressively during the next 10 years than ever before.
The current orderbook for new vessels stands at 106; 35 of them are small expedition vessels, and many are capable of sailing in the Great Lakes.
North America is once again leading global growth with the Caribbean, Alaska, Canada, and New England all projecting significant future increases in passenger volume.
By 2020, more than 170 ships operated by 70+ brands and representing ~38,000 lower berths will be physically capable of transiting the Great Lakes’ system of locks.
20 brands controlling nearly 100 ships and over 22,000 lower berths are realistic candidates for the Great Lakes, and potential targets for the Ontario ports.
Small‐ship operators compete by focusing on destination differentiation (i.e., exploring new and unique regions), which favors the Great Lakes and Ontarian ports.
Small‐ship itineraries emphasize time in destinations over time onboard, to allow their guests to have a more intense and nuanced interaction with the local environment, culture, and cuisine.
In 2016, a major travel‐agent survey showed that 32% of millennials have cruised within the past five years— more than any other generational cohort, including baby boomers. In other words, the future of cruising is likely even brighter than in the past.
Authentic, immersive experiences that are unique to a given destination—and the ability to access non‐mainstream “undiscovered” locations—are driving consumer demand for small‐ship cruising.
Restricted access The inability of large or midsized cruise ships to access the Great Lakes puts small‐ship operators in a highly advantageous market position (i.e., a unique and limited product).
Collaboration All cruise line survey respondents identified promotional partnerships with other Great Lakes ports and destinations as a very important step toward growing the region’s cruise activity, and they all agreed that forming an Ontario Ports Association (or something similar) to coordinate and oversee certain operational and marketing responsibilities would be an advantage.
o The opportunity therefore is to leverage better‐known destinations within the Great Lakes, as well as key marquee destinations on the St. Lawrence (i.e., Montreal and Quebec City) to grow the overall market, and also add calls at the ports of Ontario over time.
Exhibit A Report Number 19-150
GREAT LAKES CRUISE STRATEGY FOR ONTARIO’S PORTS – TASK 2: BUSINESS CASE AND CRUISE INDUSTRY STRATEGIC ACTION PLAN
52
Threats
Restricted access in the Great Lakes means the universe of potential customers (i.e., cruise ships) is extremely limited vis‐à‐vis other destinations.
The Great Lakes Locks and pilotage system is complex, and can be intimidating and potentially onerous to vessel operators, possibly serving as a deterrent to growth.
Costs are generally easier for large ships to absorb than for small ships in a region that can only accommodate small ships, is 100% within the North American ECA, and has compulsory pilotage throughout. Even if individual port costs remain low, the overall cost of operating in the region (e.g., compulsory, stay‐onboard pilotage, and 100% ECA operations) may negatively influence future vessel deployments.
Competition from other regions Despite the unprecedented number of cruise ship newbuilds in the orderbook set for delivery within the coming 10 years, other cruise markets around the globe are competing fiercely for capacity and future deployments, most of which are more established and better known.
The overall socioeconomic impacts presented by the cruise lines in the Great Lakes are low compared to land‐based tourism. Thus, it is difficult to provide a substantial return on investment (ROI) for the establishment / operations of a regional / Ontario‐based association to promote and market cruise to the cruise lines and potential consumers. In addition, the individual ports must invest in hard port infrastructure to serve a limited pool of cruise vessels.
Summary of Conclusions While small in terms of overall world tourism, the cruise industry has been one of the most successful
hospitality sectors over the past three decades. Multiple factors are contributing simultaneously to this global growth, the least of which are not the introduction of a record number of new cruise ships and the launches of several new cruise brands across every segment of the industry, from large ships in the mass market (i.e., contemporary) space to small luxury and expedition vessels.
Globally, the major cruise lines have been successful in increasing overall market penetration through the deployment of newer, larger vessels to markets that involve a high degree of confidence that demand will meet, if not exceed, new capacity. This overall growth in global cruise activity has allowed Small Ship cruise brands to “ride the tide” and take advantage of niche market opportunities that the larger brands cannot— by continuously introducing new destinations and experiences that only small ships can access. These niche markets (including lesser traveled and more exotic destinations) are driving new demand for small ship cruising, which is being matched by unprecedented increases in small‐ship capacity.
Repeat clientele is a major strength of the cruise industry, with as many as 62% of cruisers having cruised before. This high level of repeat business pushes the industry (especially small‐ship operators) further
Exhibit A Report Number 19-150

GREAT LAKES CRUISE STRATEGY FOR ONTARIO’S PORTS – TASK 2: BUSINESS CASE AND CRUISE INDUSTRY STRATEGIC ACTION PLAN
53
toward new market and destination exploration as a means of distinguishing themselves from the competition, and attracting a broader base of core‐passenger demographics to fill their expanding fleets.
As a two‐season (summer and fall) cruise market with strict limitations on vessel size, the Great Lakes are on an uneven playing field when it comes to competition with other cruise markets around the world. Fortunately, vessel deployment is driven by consumer demand, and can and does change over time. To remain competitive and grow cruise activity in the future, it is important to understand what is happening in other markets around the world, to adopt best practices when possible, and to continuously improve the cruise experience and value proposition offered by the region and by each individual port called.
Five major cruise corporations control 87.9% of global cruise capacity, and ~78% of global cruise revenue. The remaining fleet encompasses approximately 200 vessels controlled by numerous independent brands that each operate, between one and 16 oceangoing vessels of various sizes and capacities. B&A has identified 173 individual vessels operated by 72 different cruise brands that can/will be able to transit the locks into the Great Lakes by 2020 or shortly thereafter. 20 of these brands control over 100 ships, and more than 22,000 lower berths. In addition, they are realistic mid‐ to long‐term candidates for future deployments within the Great Lakes, including the ports of Ontario.
Destination reputation/marketability and costs are two of the most critical factors impacting Great Lakes deployments now and in the future. Cruise‐line survey results indicate that current cruise vessel operators in the Great Lakes region and their guests are relatively pleased with the overall experience that the Great Lakes offers. Specific to the Ontario ports, all survey respondents identified promotional partnerships with other Great Lakes ports and destinations as a very important step toward growing the region’s cruise activity, and they all also agreed that forming an Ontario Ports Association to coordinate and oversee certain operational and marketing duties would be an advantage. Ultimately, as a niche market for cruise, the Great Lakes and Ontario ports must do everything possible to increase consumer and cruise line awareness of the region’s offerings and value proposition, in order to drive more business to the region while simultaneously minimizing costs that do not add value.
Hard infrastructure (i.e., piers and terminals) is more important to some cruise ship operators than to others; soft infrastructure (i.e., fun/interesting things to do) is universally important and defines the cruiser’s experience. Given the growing appetite among consumers for new and lesser‐travelled destinations and the fact that guest satisfaction and profitability are two of the biggest drivers of cruise ship deployments, the Great Lakes is very well‐positioned to take advantage of a rapidly growing small‐ship market and aggressive future orderbook—as long as it provides and continuously improves the diversity and quality of tour options and destination activities offered, while actively managing costs across the region.
Exhibit A Report Number 19-150
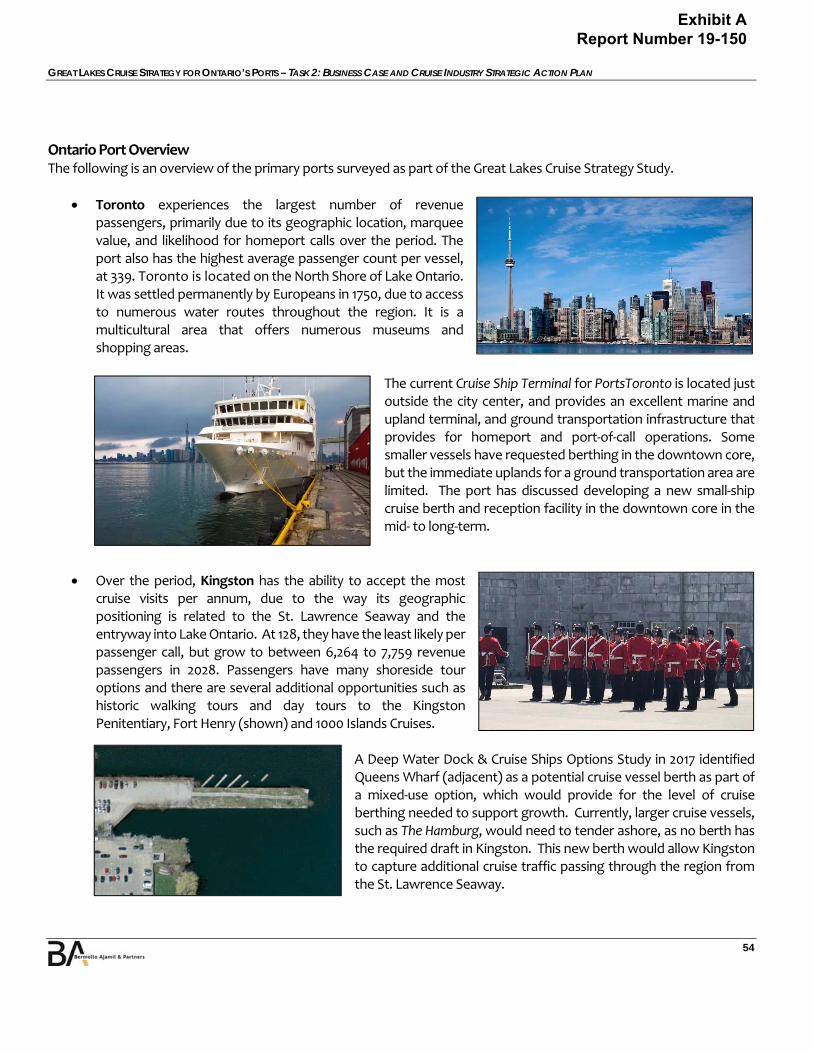
GREAT LAKES CRUISE STRATEGY FOR ONTARIO’S PORTS – TASK 2: BUSINESS CASE AND CRUISE INDUSTRY STRATEGIC ACTION PLAN
54
Ontario Port Overview The following is an overview of the primary ports surveyed as part of the Great Lakes Cruise Strategy Study.
Toronto experiences the largest number of revenue passengers, primarily due to its geographic location, marquee value, and likelihood for homeport calls over the period. The port also has the highest average passenger count per vessel, at 339. Toronto is located on the North Shore of Lake Ontario. It was settled permanently by Europeans in 1750, due to access to numerous water routes throughout the region. It is a multicultural area that offers numerous museums and shopping areas.
The current Cruise Ship Terminal for PortsToronto is located just outside the city center, and provides an excellent marine and upland terminal, and ground transportation infrastructure that provides for homeport and port‐of‐call operations. Some smaller vessels have requested berthing in the downtown core, but the immediate uplands for a ground transportation area are limited. The port has discussed developing a new small‐ship cruise berth and reception facility in the downtown core in the mid‐ to long‐term.
Over the period, Kingston has the ability to accept the most cruise visits per annum, due to the way its geographic positioning is related to the St. Lawrence Seaway and the entryway into Lake Ontario. At 128, they have the least likely per passenger call, but grow to between 6,264 to 7,759 revenue passengers in 2028. Passengers have many shoreside tour options and there are several additional opportunities such as historic walking tours and day tours to the Kingston Penitentiary, Fort Henry (shown) and 1000 Islands Cruises.
A Deep Water Dock & Cruise Ships Options Study in 2017 identified Queens Wharf (adjacent) as a potential cruise vessel berth as part of a mixed‐use option, which would provide for the level of cruise berthing needed to support growth. Currently, larger cruise vessels, such as The Hamburg, would need to tender ashore, as no berth has the required draft in Kingston. This new berth would allow Kingston to capture additional cruise traffic passing through the region from the St. Lawrence Seaway.
Exhibit A Report Number 19-150

GREAT LAKES CRUISE STRATEGY FOR ONTARIO’S PORTS – TASK 2: BUSINESS CASE AND CRUISE INDUSTRY STRATEGIC ACTION PLAN
55
Windsor provides a potential opportunity for both homeport and port‐of‐call options, but there are many substantial regulatory, operational, and consumer‐delivery challenges to overcome, due to competition with Detroit. In fact, some of the existing calls even operate cross‐border excursions from Windsor to Detroit, to visit sites such as the Henry Ford Museum. Presently, it is has approximately 14 cruise calls per annum. However, with regulatory and market adjustments, this port could change its fortunes significantly, as it provides excellent port infrastructure and soft tourism products within close proximity to the downtown core, as well as adjacent historical areas, such as Amherstburg.
In Windsor, cruise ships berth along the waterfront promenade, with in‐berth utilities and a view of downtown Detroit. The waterfront provides a great reception area, with access to downtown, walkways, and ground transportation.
Midland provides excellent marine infrastructure. In the heart of the downtown core, it has desired amenities, a visitor’s center, and a ground transportation area. Midland is also located within 1.5 hours of Toronto International Airport, and 2 hours from downtown hotels. It is used as a homeport option for vessels choosing to forego the extensive travel time from Georgian Bay into Lake Ontario, to conduct a homeport turnaround in downtown Toronto. With the opportunity for homeport options, Midland has the second highest per‐call passenger average, at 233. The revenue passengers are expected to range from 2,934 to 3,634 in 2028.
Midland is located at the southern end of Lake Huron, near Georgian Bay's 30,000 Islands. One of the highlights of the area is the 17th‐century French Jesuit Mission headquarters, where re‐creators offer insight into the first interaction between the native people and the Europeans. The SS Keewatin, a steamship built in 1907 in Scotland, is also available to sail along the entire length of the Great Lakes. The city has also has an opportunity for a mixed‐use development on the water’s edge, which could be combined with a future cruise berth to provide homeporting.
Exhibit A Report Number 19-150

GREAT LAKES CRUISE STRATEGY FOR ONTARIO’S PORTS – TASK 2: BUSINESS CASE AND CRUISE INDUSTRY STRATEGIC ACTION PLAN
56
Parry Sound also has a myriad of upland tourism options, which could be exploited now, then further developed to be offered to a diverse consumer demographic. While the average of cruise passengers per vessel (210) is lower than Midland, they both track similarly, in terms of revenue passenger production over the long‐term, due to their proximity to each other in Georgian Bay.
Parry Sound has the ability to capture some additional small‐exploration vessels, due to its offerings. The port is located on the Eastern shore of Georgian Bay in Lake Huron, and is the world's deepest natural freshwater port. Established in 1857, Parry Sound became an important depot along the rail lines to Western Canada. Cruise ships berth in close proximity to the Bobby Orr Museum and Trestle Brewery, as well as both floatplane and cruise sightseeing adventures.
Little Current is in a good geographic position to capture numerous traffic patterns throughout the Great Lakes, so with an average passenger‐per‐call capacity of 210, it may have the ability to capture from 6,366 to 7,885 revenue passengers in 2028. The marine berthing works well for most vessels, but there is an issue with shallow draft in the channel, which does not allow for some larger ships to dock. Thus, they must anchor and tender.
Little Current is located on Manitoulin Island in Georgian Bay, and is home to the Ojibwe people, part of the First Nation of Anishinaabe. The options for cultural and natural activities offer a variety of excursions. For example, Victory Cruise Lines offers tours to the Ojibwe Cultural Foundation, to see art galleries / exhibits at the heritage museum. Visitors can also participate in a smudging ceremony, an Ojibwe ritual using cedar smoke, sage, sweet grass, and other plants known for their healing powers. A drum and dance performance offers further insight into Ojibwe culture.
Picture Courtesy of Victory Cruise Lines
Exhibit A Report Number 19-150

GREAT LAKES CRUISE STRATEGY FOR ONTARIO’S PORTS – TASK 2: BUSINESS CASE AND CRUISE INDUSTRY STRATEGIC ACTION PLAN
57
Sault Ste. Marie lies at the entryway to Lake Superior, and is in a good position to capture traffic in Zones #2 and #3. Thus, the vessel capacity was set at 206, producing between 4,323 and 5,355 revenue passengers in 2028, on 21 to 26 calls. There is an excellent marine berthing option, adjacent to a covered area for passengers and a ground transportation area within walking distance. Passengers have many shoreside tour options, and there are several additional opportunities, such as fishing and the day‐long Agaway Canyon Tour Train. The Soo Locks allow ships to move from Lake Huron to Lake Superior at Sault Ste. Marie.
Thunder Bay lies at the outermost edge of Ontario, along Lake Superior. An existing berth can be used for cruise vessels just outside the downtown core, and the marina may also be able to accommodate smaller coastal vessels. There is also an opportunity to further develop the existing berth as part of a mixed‐use development. Due to the current distance from the rest of the main Great Lakes port, it currently receives minimal traffic. The projection modelling shows growth from 847 to 1,049 revenue passengers in 2028. This port can provide a substantial tourism product that focuses on active exploration. Additional ports in the area would provide for itinerary options along the North Shore of Minnesota, as well as along the Ontario coastline back to Sault Ste. Marie.
Despite vessel‐size limitations associated with physical access to the region, there is still a sizable small‐ship market in which the Great Lakes and Ontario ports can compete. Feedback received by B&A from cruise line executives indicates that both consumer demand for, and guest satisfaction with, the region is strong and increasing. This feedback is critical to future growth because capacity follows profitability, and profitability follows demand. Other key feedback from cruise lines surveyed are summarized in Table 4.
Table 4: Cruise Line Survey Results Source: B&A
Question/Criterion Aggregated Response
Age range of Great Lakes cruisers 45‐65
Average annual income of Great Lakes cruisers ~$200,000 (CAD)
Profitability of Great Lakes itineraries vs. other regions Average t0 Good
Current guest satisfaction with Great Lakes cruise itineraries Good to Very Good
Future consumer demand for Great Lakes cruise itineraries Very Good to Exceptional
Average condition of Great Lakes port facilities Not Very Good to Average
Exhibit A Report Number 19-150
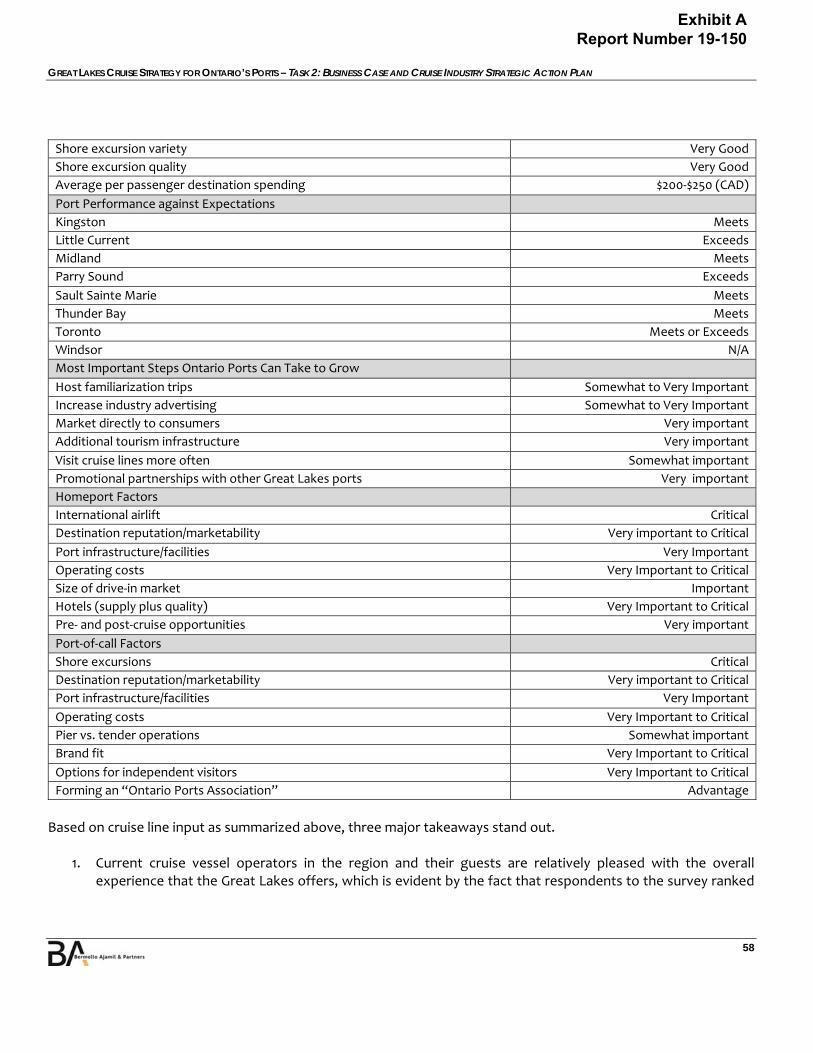
GREAT LAKES CRUISE STRATEGY FOR ONTARIO’S PORTS – TASK 2: BUSINESS CASE AND CRUISE INDUSTRY STRATEGIC ACTION PLAN
58
Based on cruise line input as summarized above, three major takeaways stand out.
1. Current cruise vessel operators in the region and their guests are relatively pleased with the overall experience that the Great Lakes offers, which is evident by the fact that respondents to the survey ranked
Shore excursion variety Very Good
Shore excursion quality Very Good
Average per passenger destination spending $200‐$250 (CAD)
Port Performance against Expectations
Kingston Meets
Little Current Exceeds
Midland Meets
Parry Sound Exceeds
Sault Sainte Marie Meets
Thunder Bay Meets
Toronto Meets or Exceeds
Windsor N/A
Most Important Steps Ontario Ports Can Take to Grow
Host familiarization trips Somewhat to Very Important
Increase industry advertising Somewhat to Very Important
Market directly to consumers Very important
Additional tourism infrastructure Very important
Visit cruise lines more often Somewhat important
Promotional partnerships with other Great Lakes ports Very important
Homeport Factors
International airlift Critical
Destination reputation/marketability Very important to Critical
Port infrastructure/facilities Very Important
Operating costs Very Important to Critical
Size of drive‐in market Important
Hotels (supply plus quality) Very Important to Critical
Pre‐ and post‐cruise opportunities Very important
Port‐of‐call Factors
Shore excursions Critical
Destination reputation/marketability Very important to Critical
Port infrastructure/facilities Very Important
Operating costs Very Important to Critical
Pier vs. tender operations Somewhat important
Brand fit Very Important to Critical
Options for independent visitors Very Important to Critical
Forming an “Ontario Ports Association” Advantage
Exhibit A Report Number 19-150

GREAT LAKES CRUISE STRATEGY FOR ONTARIO’S PORTS – TASK 2: BUSINESS CASE AND CRUISE INDUSTRY STRATEGIC ACTION PLAN
59
both guest satisfaction and consumer demand as Good to Exceptional. Ranking consumer as Exceptional is a very positive indicator for future deployment to the region.
2. Specific to the Ontario ports, all survey respondents identified promotional partnerships with other Great
Lakes ports and destinations as a very important step toward growing the region’s cruise activity, and they all also agreed that forming an Ontario Ports Association to coordinate and oversee certain operational and marketing duties would be an advantage.
3. It is clear that the cruise lines surveyed feel that destination reputation/marketability and costs are two of
the most critical factors impacting Great Lakes deployments. These two factors combined define the relative success of cruise lines in the market. Destination reputation and marketability directly impact consumer demand and sales, including both volume and pricing, which drives the revenue side of the equation. Balancing revenue and costs is fundamental to whether it makes sense for a given cruise line to operate in the Great Lakes region.
Ultimately, as a niche market for cruise, the Great Lakes and Ontario ports must do everything possible to increase consumer and cruise line awareness of the region’s offerings and value proposition, in order to drive more business to the region while simultaneously minimizing costs that do not add value. All cruise markets, including the Caribbean, started by offering a niche product, and building and growing that product over time. CNE is still a niche market, even though it will welcome nearly 350,000 cruise passengers in 2018. The Great Lakes region is unique in the sense that it is highly constrained to a limited vessel size and typology. However, given the growing appetite among consumers for new and lesser‐traveled destinations, the Great Lakes is very well positioned to take advantage of a growing Small Ship market and aggressive future orderbook, and to build on its current level of activity. The key is to spread the word about what the region has to offer, so that the consumer will eventually lead the effort to bring more cruise ships into the region as a result of greater and greater demand.
Exhibit A Report Number 19-150
GREAT LAKES CRUISE STRATEGY FOR ONTARIO’S PORTS – TASK 2: BUSINESS CASE AND CRUISE INDUSTRY STRATEGIC ACTION PLAN
60
3. CRUISE MARKET OPPORTUNITIES: CRUISE PASSENGER FORECASTS
Overview Cruise projections are used to assist with determining the future scenarios associated with cruise passenger throughput for the Great Lakes region and Ontario ports, as well as specific facility berth demand for each. These projections assess the current industry trends, and venture to establish how these trends may impact future cruise passenger and vessel throughput—on world, regional (Great Lakes), and Ontario ports scales—over a 10‐year planning period (2018 ‐ 2028). The projection models are based on an examination of the Great Lakes’ existing position in world and regional cruise deployments, levels and types of cruise operations, overall traffic patterns, and the most probable range of passenger (first) and vessel (second) throughput. From the regional assessment, the model then establishes a potential range of passenger throughput and cruise calls for the individual Ontario ports. It is difficult to project a cruise line’s growth for a region or port over the short term (3 to 5 years), as for the most part, lines themselves rarely know their deployment outside of this time period, due to outside forces and market trends. Projecting over a 10‐year period is difficult and filled with assumptions. However, this exercise does provide a perspective of the potential market over the period, and allows for the testing and establishment of goals and objectives related to marketing and infrastructure. While we venture to look at past trends and future market‐capture options, this exercise can develop potential scenarios. Therefore, the regional, provincial, and individual destinations can focus on the development of strategies to entice and grow cruise line traffic, in partnership with the projection term and beyond. Projections anticipate that the cruise industry will continue to follow fundamentally positive trends. Methods and various assumptions incorporate the best interpretation of supply‐and‐demand conditions in the marketplace. Projections are un‐constrained in nature, and do not take into account the potential berth capacity, utilization, or other limiting factors of the region or ports. However, consideration is given for the limiting factor of vessels that can transit the St. Lawrence Seaway and lock systems of the Great Lakes. Projection models used include:
Regional market capture
Scenarios that are actionable, based on cruise line feedback and analysis, which are likely the key for Great Lake’s growth options.
Key projection factors include the following elements:
Great Lakes market growth (in conjunction with St. Lawrence Seaway / Canada & New England)
Competition
Consumer desire – NA market (primary), European market (secondary)
Cruise season elasticity – moving beyond the typical seasonal deployments for brands / type of cruise lines
Market delineation – creation of a “Unique Selling Point” for the Great Lakes region / Ontario Ports
Exhibit A Report Number 19-150
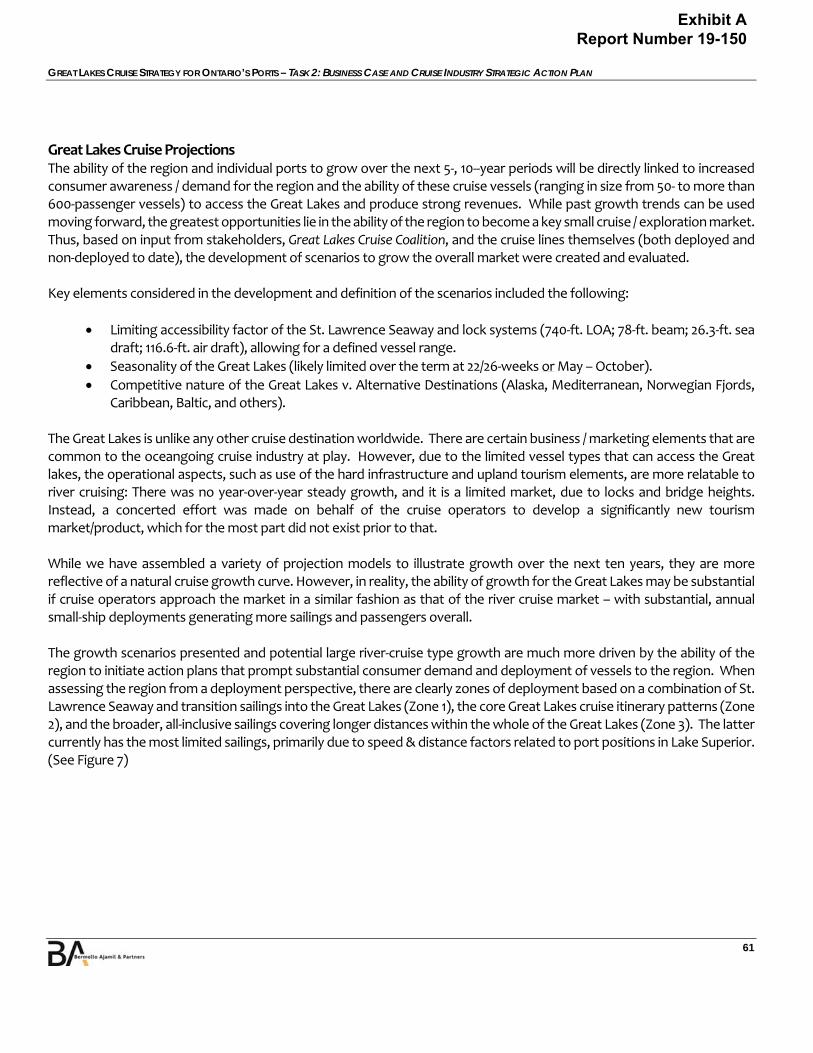
GREAT LAKES CRUISE STRATEGY FOR ONTARIO’S PORTS – TASK 2: BUSINESS CASE AND CRUISE INDUSTRY STRATEGIC ACTION PLAN
61
Great Lakes Cruise Projections The ability of the region and individual ports to grow over the next 5‐, 10‐‐year periods will be directly linked to increased consumer awareness / demand for the region and the ability of these cruise vessels (ranging in size from 50‐ to more than 600‐passenger vessels) to access the Great Lakes and produce strong revenues. While past growth trends can be used moving forward, the greatest opportunities lie in the ability of the region to become a key small cruise / exploration market. Thus, based on input from stakeholders, Great Lakes Cruise Coalition, and the cruise lines themselves (both deployed and non‐deployed to date), the development of scenarios to grow the overall market were created and evaluated. Key elements considered in the development and definition of the scenarios included the following:
Limiting accessibility factor of the St. Lawrence Seaway and lock systems (740‐ft. LOA; 78‐ft. beam; 26.3‐ft. sea draft; 116.6‐ft. air draft), allowing for a defined vessel range.
Seasonality of the Great Lakes (likely limited over the term at 22/26‐weeks or May – October).
Competitive nature of the Great Lakes v. Alternative Destinations (Alaska, Mediterranean, Norwegian Fjords, Caribbean, Baltic, and others).
The Great Lakes is unlike any other cruise destination worldwide. There are certain business / marketing elements that are common to the oceangoing cruise industry at play. However, due to the limited vessel types that can access the Great lakes, the operational aspects, such as use of the hard infrastructure and upland tourism elements, are more relatable to river cruising: There was no year‐over‐year steady growth, and it is a limited market, due to locks and bridge heights. Instead, a concerted effort was made on behalf of the cruise operators to develop a significantly new tourism market/product, which for the most part did not exist prior to that. While we have assembled a variety of projection models to illustrate growth over the next ten years, they are more reflective of a natural cruise growth curve. However, in reality, the ability of growth for the Great Lakes may be substantial if cruise operators approach the market in a similar fashion as that of the river cruise market – with substantial, annual small‐ship deployments generating more sailings and passengers overall. The growth scenarios presented and potential large river‐cruise type growth are much more driven by the ability of the region to initiate action plans that prompt substantial consumer demand and deployment of vessels to the region. When assessing the region from a deployment perspective, there are clearly zones of deployment based on a combination of St. Lawrence Seaway and transition sailings into the Great Lakes (Zone 1), the core Great Lakes cruise itinerary patterns (Zone 2), and the broader, all‐inclusive sailings covering longer distances within the whole of the Great Lakes (Zone 3). The latter currently has the most limited sailings, primarily due to speed & distance factors related to port positions in Lake Superior. (See Figure 7)
Exhibit A Report Number 19-150
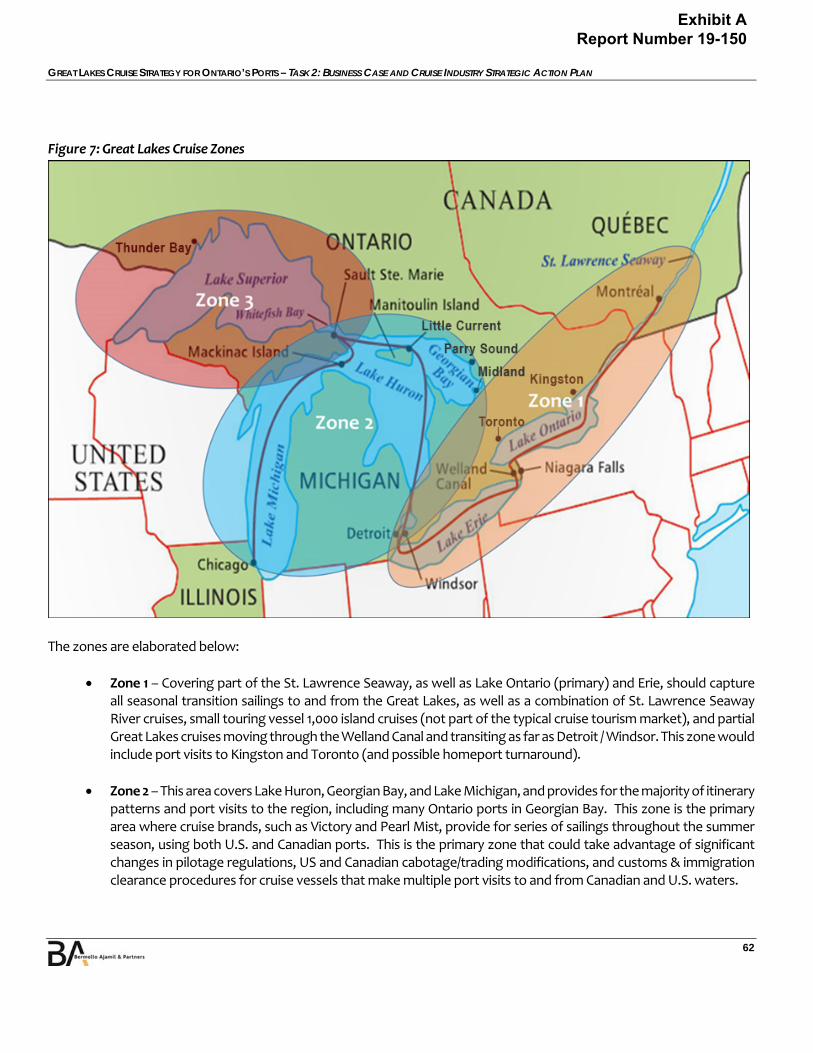
GREAT LAKES CRUISE STRATEGY FOR ONTARIO’S PORTS – TASK 2: BUSINESS CASE AND CRUISE INDUSTRY STRATEGIC ACTION PLAN
62
Figure 7: Great Lakes Cruise Zones
The zones are elaborated below:
Zone 1 – Covering part of the St. Lawrence Seaway, as well as Lake Ontario (primary) and Erie, should capture all seasonal transition sailings to and from the Great Lakes, as well as a combination of St. Lawrence Seaway River cruises, small touring vessel 1,000 island cruises (not part of the typical cruise tourism market), and partial Great Lakes cruises moving through the Welland Canal and transiting as far as Detroit / Windsor. This zone would include port visits to Kingston and Toronto (and possible homeport turnaround).
Zone 2 – This area covers Lake Huron, Georgian Bay, and Lake Michigan, and provides for the majority of itinerary patterns and port visits to the region, including many Ontario ports in Georgian Bay. This zone is the primary area where cruise brands, such as Victory and Pearl Mist, provide for series of sailings throughout the summer season, using both U.S. and Canadian ports. This is the primary zone that could take advantage of significant changes in pilotage regulations, US and Canadian cabotage/trading modifications, and customs & immigration clearance procedures for cruise vessels that make multiple port visits to and from Canadian and U.S. waters.
Exhibit A Report Number 19-150
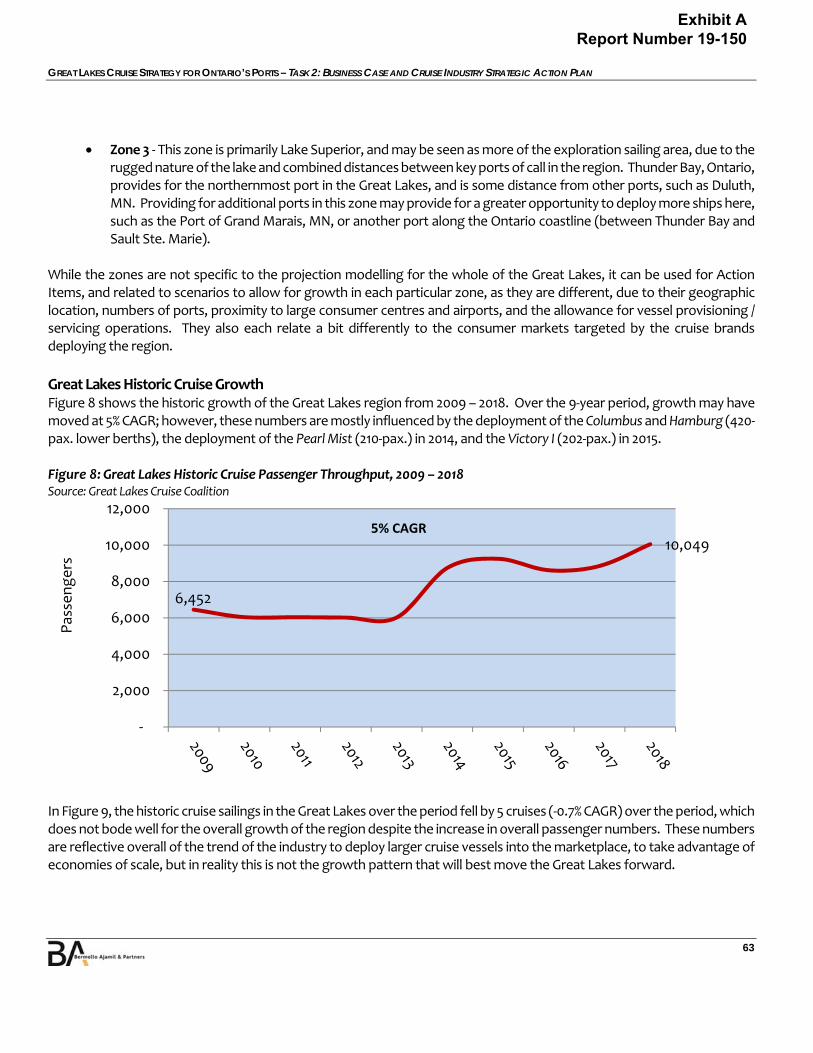
GREAT LAKES CRUISE STRATEGY FOR ONTARIO’S PORTS – TASK 2: BUSINESS CASE AND CRUISE INDUSTRY STRATEGIC ACTION PLAN
63
Zone 3 ‐ This zone is primarily Lake Superior, and may be seen as more of the exploration sailing area, due to the rugged nature of the lake and combined distances between key ports of call in the region. Thunder Bay, Ontario, provides for the northernmost port in the Great Lakes, and is some distance from other ports, such as Duluth, MN. Providing for additional ports in this zone may provide for a greater opportunity to deploy more ships here, such as the Port of Grand Marais, MN, or another port along the Ontario coastline (between Thunder Bay and Sault Ste. Marie).
While the zones are not specific to the projection modelling for the whole of the Great Lakes, it can be used for Action Items, and related to scenarios to allow for growth in each particular zone, as they are different, due to their geographic location, numbers of ports, proximity to large consumer centres and airports, and the allowance for vessel provisioning / servicing operations. They also each relate a bit differently to the consumer markets targeted by the cruise brands deploying the region.
Great Lakes Historic Cruise Growth Figure 8 shows the historic growth of the Great Lakes region from 2009 – 2018. Over the 9‐year period, growth may have moved at 5% CAGR; however, these numbers are mostly influenced by the deployment of the Columbus and Hamburg (420‐pax. lower berths), the deployment of the Pearl Mist (210‐pax.) in 2014, and the Victory I (202‐pax.) in 2015. Figure 8: Great Lakes Historic Cruise Passenger Throughput, 2009 – 2018 Source: Great Lakes Cruise Coalition
In Figure 9, the historic cruise sailings in the Great Lakes over the period fell by 5 cruises (‐0.7% CAGR) over the period, which does not bode well for the overall growth of the region despite the increase in overall passenger numbers. These numbers are reflective overall of the trend of the industry to deploy larger cruise vessels into the marketplace, to take advantage of economies of scale, but in reality this is not the growth pattern that will best move the Great Lakes forward.
6,452
10,049
‐
2,000
4,000
6,000
8,000
10,000
12,000
Pas
sengers
5% CAGR
Exhibit A Report Number 19-150
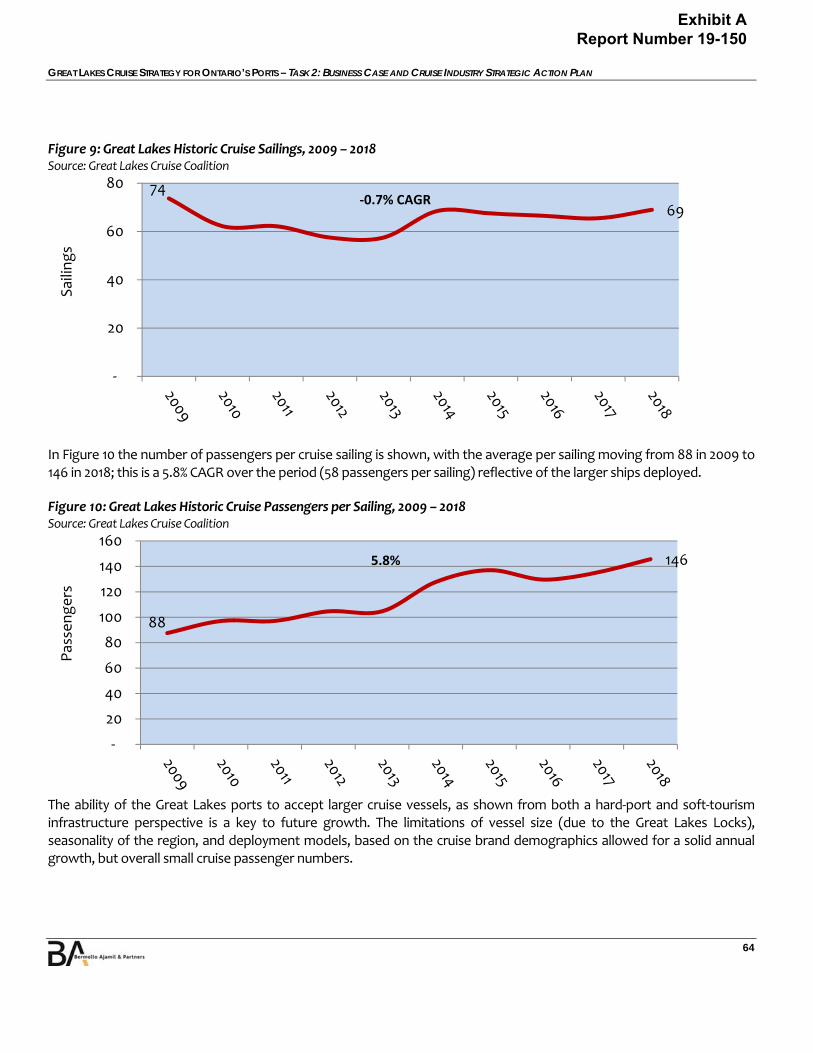
GREAT LAKES CRUISE STRATEGY FOR ONTARIO’S PORTS – TASK 2: BUSINESS CASE AND CRUISE INDUSTRY STRATEGIC ACTION PLAN
64
Figure 9: Great Lakes Historic Cruise Sailings, 2009 – 2018 Source: Great Lakes Cruise Coalition
In Figure 10 the number of passengers per cruise sailing is shown, with the average per sailing moving from 88 in 2009 to 146 in 2018; this is a 5.8% CAGR over the period (58 passengers per sailing) reflective of the larger ships deployed.
Figure 10: Great Lakes Historic Cruise Passengers per Sailing, 2009 – 2018 Source: Great Lakes Cruise Coalition
The ability of the Great Lakes ports to accept larger cruise vessels, as shown from both a hard‐port and soft‐tourism infrastructure perspective is a key to future growth. The limitations of vessel size (due to the Great Lakes Locks), seasonality of the region, and deployment models, based on the cruise brand demographics allowed for a solid annual growth, but overall small cruise passenger numbers.
74
69
‐
20
40
60
80
Sailin
gs
88
146
‐
20
40
60
80
100
120
140
160
Pas
sengers
‐0.7% CAGR
5.8%
Exhibit A Report Number 19-150

GREAT LAKES CRUISE STRATEGY FOR ONTARIO’S PORTS – TASK 2: BUSINESS CASE AND CRUISE INDUSTRY STRATEGIC ACTION PLAN
65
Projection Approach 1 – Market Capture The market capture approach is based on capturing a percentage of all passengers in the region and on a multitude of itinerary patterns. An assumption is then made as to the future ability of the Great Lakes to capture a percentage of the overall world market over the 10‐year period. See Figure 11. Ranges used for capture model are within the growth trend shown above, and range from 3% to 7% per annum growth. Thus, there is a potential range for some 102 ‐ 149 sailings, with an average passenger capacity of 139. The CAGR for the market projections scenarios ranges from 3.5% to 7.1% over the period. Figure 11: Market Capture Passenger Projections, 2009 ‐ 2028
* The lower passenger capacity assumes added smaller vessels sailing within the region during the summer season for a longer period, similar to that of river cruise vessels. The consumer base would be a combination of regional North American passengers, and a greater number of European and Asian guests into the long‐term.
Projection Approach 2 – Vessel Deployment Scenarios In this approach, based on past trends of the cruise industry, marketplace assumptions have been made about the deployment of cruise vessels to the Great Lakes region, addressing the zones and other assumptions provided above. This approach requires strategic planning, marketing, and operations on the part of the Great Lakes stakeholders and regional partners to attract cruise deployments and provide the platform necessary for the brands to be successful.
In the cruise tourism industry, success breeds success—in the mainstream, river, and exploration categories. Thus, as one cruise brand is successful with a product in the region, another will then look to also come into the marketplace and set up its product for their target consumer. Two scenarios were assembled, illustrating levels of deployment to the Great Lakes, and in turn, the distribution of cruise passengers to the Ontario ports (illustrated in the following section). The ship size and range of vessel calls for each scenario were established based on the interpretation of potential regional growth,
6,452
14,172
16,851
10,049
19,969
0
2,500
5,000
7,500
10,000
12,500
15,000
17,500
20,000
22,500
Pas
sengers
Historic Low (3%) Mid (5%) High (7%)
Exhibit A Report Number 19-150
GREAT LAKES CRUISE STRATEGY FOR ONTARIO’S PORTS – TASK 2: BUSINESS CASE AND CRUISE INDUSTRY STRATEGIC ACTION PLAN
66
seasonality, type of vessels that will likely be deployed to the region, and historical context (as it relates to the types of itineraries for future success in the region ).
The target scenarios are based on cruise‐line input, and an assessment of the reasoning for deployments in the region. While specific cruise brands can be illustrated as targets, these objectives may change quickly, based on reactions from regional competitors. However, it is important to note that these scenarios will likely take a minimum of 2 years to begin developing, based on sales & marketing timing, the introduction of infrastructure, and other competitive factors. The Great Lakes region provides excellent geographic positioning from a marine itinerary planning perspective, but suffers from a low consumer‐awareness factor for the regional destinations via cruise. Its primary existing and potential regional homeports in Canada are Toronto and Midland for direct Georgian Bay sailings, Montreal (for St. Lawrence River Lake Ontario cruises), and Windsor (for access to Detroit and the primary Great Lakes Zone 2). These homeports, as well as the primary USA homeports of Chicago, Detroit, and Cleveland, provide excellent access (both direct and airlift) to large consumer‐base groups.
All the primary homeports have some level of marquee value for North American, European, and other consumer markets. It is also assumed, to a degree, that as the adjacent market of small / exploration sailings in Canada and New England (including the St. Lawrence region and Newfoundland & Labrador) continue to trend upwards, they will ultimately provide the Great Lakes with additional opportunities for passenger growth.
Based on the feedback of cruise lines, some brands have been specifically identified in the scenarios presented. They include Ritz Carlton (RCYC), which will likely be in the region by 2021. Their management team is keen to sail in the region, but the limited number of vessels—and the currently planned deployments that produce higher revenues than the Great Lakes—offset any potential opportunity in the immediate future.
A strategic action plan can provide the impetus to grow the cruise market, but the region must be developed as a whole. As this plan develops, the destinations need to grow products and services to meet the needs and expectations of the cruise brands calling as business expands. Besides strong passenger demand to provide higher per‐ticket yields (to be competitive in the world market), cruise brands must obtain the upland revenue options and fair costs of using marine facilities to be successful.
Scenario #1 – NA Focus (North America Cruise Market Development, Non‐Expedition) This scenario builds on the current levels of traffic in the Great Lakes, with the extended seasonal sailings of Victory Cruises and Pearl Seas as the impetuses for expanded growth. The focus is on the expansion of the Great Lakes core seasonal products and itinerary patterns in Zones 1 and 2, and a concentrated effort on expanding the North American core consumer market by reaching out beyond the current, primary charter markets and into the U.S. Midwest, Eastern, and Western markets, as well as regional Ontario consumer markets, to educate and create added consumer demand for the Great Lakes.
This scenario would look to increase demand and allow for competitive companies to deploy to the market (as a transition or in‐season) for as many as 16 sailings in the long term. The primary pattern would be 7 to 10 days, and use the U.S. homeports and Toronto as starting points.
Some of the key target brands for extended deployments would be the following:
Exhibit A Report Number 19-150
GREAT LAKES CRUISE STRATEGY FOR ONTARIO’S PORTS – TASK 2: BUSINESS CASE AND CRUISE INDUSTRY STRATEGIC ACTION PLAN
67
Victory
Pearl
Ritz Carlton
Silversea
Hapag Lloyd
Windstar In the next 5 to 10 years, we anticipate that brands such as Viking Line and Star Clippers might also deploy to the Great Lakes. In the scenario #1 projection model, cruise passenger throughput rises to 15,674 (4.5% CAGR) in 2028 on 100 sailings, and the passenger‐per‐call capacity is 157. See Figure 12 for the overall growth, based on the above scenarios. Scenario #2 – Building on NA Focus in the European and Adventure/Exploration Markets The premise for this scenario is that the Great Lakes could work with multiple brands to create a cruise option that will meet their brand needs in terms of itinerary planning, marketing, operations, and cost savings. The scenario would be extremely compelling in the timeframe, with partnerships being driven between adventure tour operators / consolidators and key cruise brands. Encouraging charters for European and NA groups would be a key to expanding the market on a more direct consumer market, which would be driven more by a wider swathe of direct marketing to the key travel agents and demographics than the one laid out in Scenario #1. This scenario would encourage more sailings in all three Great Lakes zones, with Zones #2 and #3 being targeted for more adventurous brands to use small ports and other destinations within the region that are less explored to date. These sailings primarily involve small to midsize vessels focusing on 7‐ and 10‐day open‐jaw sailings. Using homeports that provide for key access points to the European consumer would be key to long‐term success. Taking advantage of the context of historical European adventurers would create an excellent selling point for cruise brands teaming with the region to deploy vessels. Some of the key added brands for new and extended deployments would include:
Ponant
Hurtigruten
Saga
Noble Caledonia
Viking Ocean
Star Clippers
Exhibit A Report Number 19-150

GREAT LAKES CRUISE STRATEGY FOR ONTARIO’S PORTS – TASK 2: BUSINESS CASE AND CRUISE INDUSTRY STRATEGIC ACTION PLAN
68
Based on the model deployment developed, there would be approximately 21,278 passengers (7.8% CAGR) on 123 sailings in 2028, which is an average of 173 passengers per call. See Figure 12.
Figure 12: Passenger Projections of Deployment Scenarios, 2009 ‐ 2028
Figure 13 provides the number of projected calls, based on the passenger projection and vessel capacity. Figure 13: Vessel Call Projection, 2009 ‐ 2028
6,452
15,674
10,049
21,278
0
5,000
10,000
15,000
20,000
25,000
Pas
sengers
Historical throughput Scenario 1 NA Focus Scenario 2 Added Europe / Adventure Focus
74
100
69
123
0
20
40
60
80
100
120
140
Sailin
gs
Historical throughput Scenario 1 NA Focus Scenario 2 Added Europe / Adventure Focus
Exhibit A Report Number 19-150

GREAT LAKES CRUISE STRATEGY FOR ONTARIO’S PORTS – TASK 2: BUSINESS CASE AND CRUISE INDUSTRY STRATEGIC ACTION PLAN
69
Figure 14 illustrates an overview of the growth of the cruise vessels calling in the Great Lakes in the scenarios shown over the projection period. Figure 14: Passengers per Call Projection, 2009 ‐ 2028
In the projection modelling, the Great Lakes market capture was also tested against the Canada & New England regional passenger deployments as this is the primary pass‐through market for entry into the Great Lakes. There is a shared historical trend.
88
156146 173
0
50
100
150
200
pas
sengers per sa
iling
Historical throughput Scenario 1 NA Focus Scenario 2 Added Europe / Adventure Focus
Exhibit A Report Number 19-150
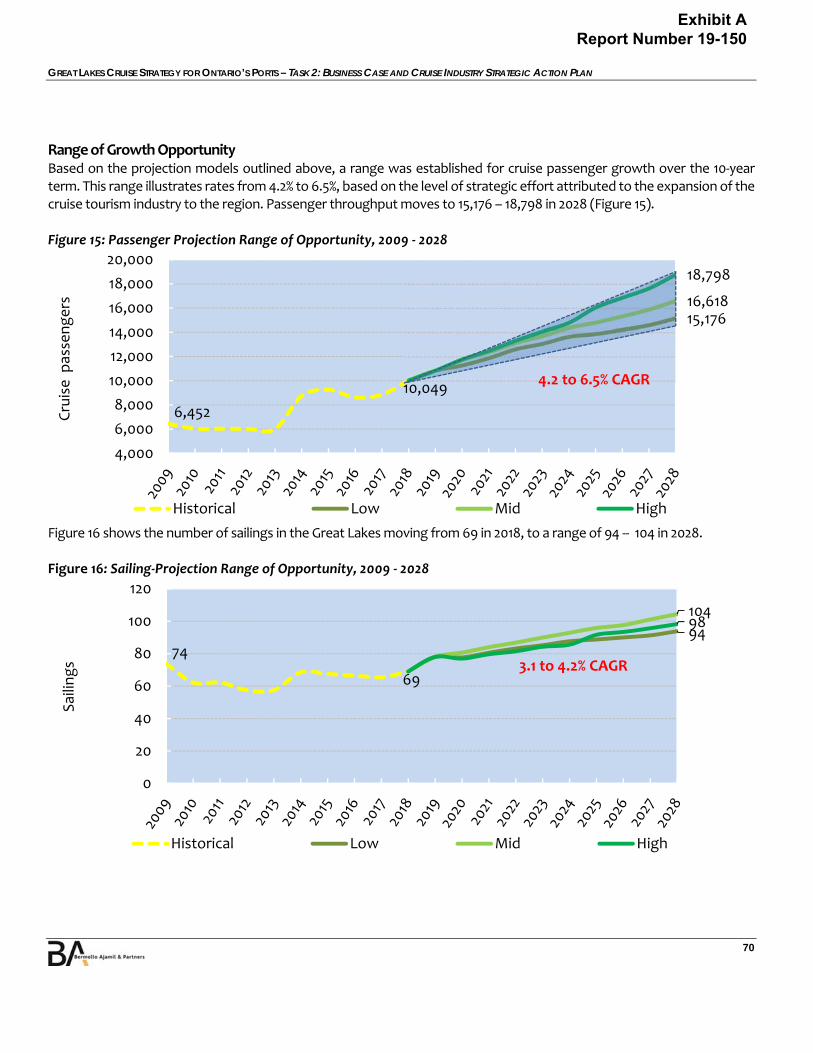
GREAT LAKES CRUISE STRATEGY FOR ONTARIO’S PORTS – TASK 2: BUSINESS CASE AND CRUISE INDUSTRY STRATEGIC ACTION PLAN
70
Range of Growth Opportunity Based on the projection models outlined above, a range was established for cruise passenger growth over the 10‐year term. This range illustrates rates from 4.2% to 6.5%, based on the level of strategic effort attributed to the expansion of the cruise tourism industry to the region. Passenger throughput moves to 15,176 – 18,798 in 2028 (Figure 15). Figure 15: Passenger Projection Range of Opportunity, 2009 ‐ 2028
Figure 16 shows the number of sailings in the Great Lakes moving from 69 in 2018, to a range of 94 ‐‐ 104 in 2028. Figure 16: Sailing‐Projection Range of Opportunity, 2009 ‐ 2028
6,452
15,17616,618
10,049
18,798
4,000
6,000
8,000
10,000
12,000
14,000
16,000
18,000
20,000
Cruise p
asse
ngers
Historical Low Mid High
7494
104
69
98
0
20
40
60
80
100
120
Sailin
gs
Historical Low Mid High
4.2 to 6.5% CAGR
3.1 to 4.2% CAGR
Exhibit A Report Number 19-150
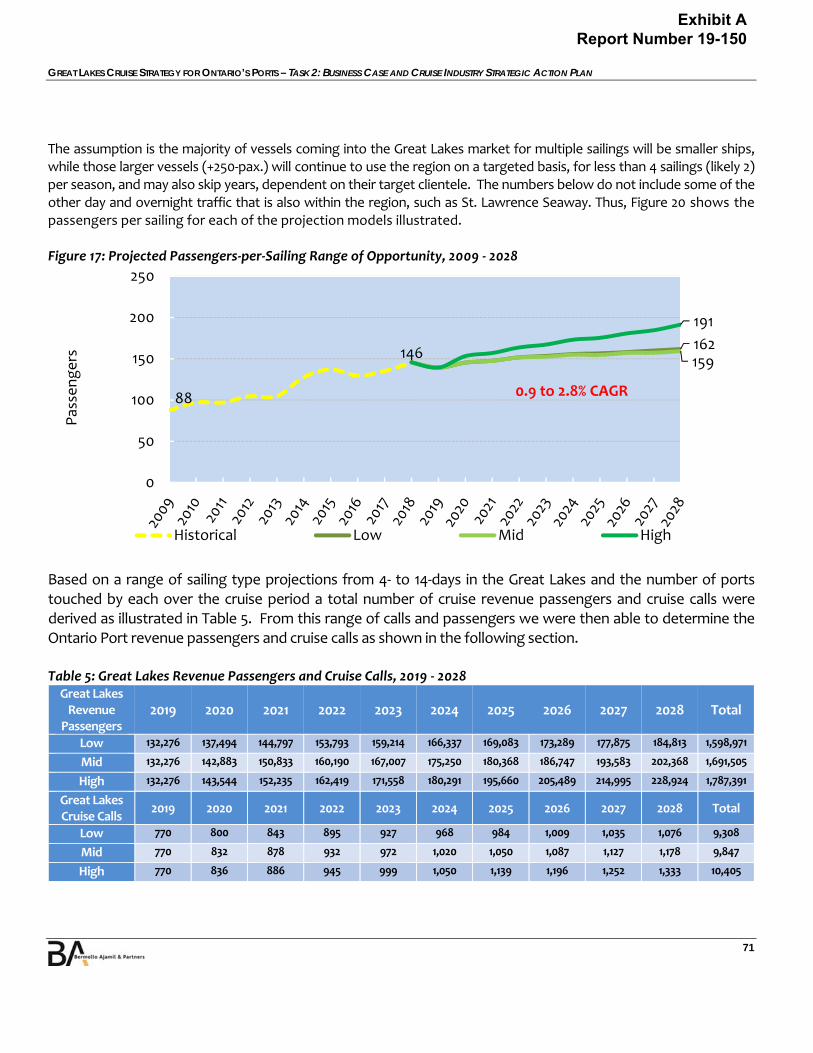
GREAT LAKES CRUISE STRATEGY FOR ONTARIO’S PORTS – TASK 2: BUSINESS CASE AND CRUISE INDUSTRY STRATEGIC ACTION PLAN
71
The assumption is the majority of vessels coming into the Great Lakes market for multiple sailings will be smaller ships, while those larger vessels (+250‐pax.) will continue to use the region on a targeted basis, for less than 4 sailings (likely 2) per season, and may also skip years, dependent on their target clientele. The numbers below do not include some of the other day and overnight traffic that is also within the region, such as St. Lawrence Seaway. Thus, Figure 20 shows the passengers per sailing for each of the projection models illustrated. Figure 17: Projected Passengers‐per‐Sailing Range of Opportunity, 2009 ‐ 2028
Based on a range of sailing type projections from 4‐ to 14‐days in the Great Lakes and the number of ports touched by each over the cruise period a total number of cruise revenue passengers and cruise calls were derived as illustrated in Table 5. From this range of calls and passengers we were then able to determine the Ontario Port revenue passengers and cruise calls as shown in the following section. Table 5: Great Lakes Revenue Passengers and Cruise Calls, 2019 ‐ 2028
Great Lakes Revenue
Passengers 2019 2020 2021 2022 2023 2024 2025 2026 2027 2028 Total
Low 132,276 137,494 144,797 153,793 159,214 166,337 169,083 173,289 177,875 184,813 1,598,971
Mid 132,276 142,883 150,833 160,190 167,007 175,250 180,368 186,747 193,583 202,368 1,691,505
High 132,276 143,544 152,235 162,419 171,558 180,291 195,660 205,489 214,995 228,924 1,787,391
Great Lakes Cruise Calls
2019 2020 2021 2022 2023 2024 2025 2026 2027 2028 Total
Low 770 800 843 895 927 968 984 1,009 1,035 1,076 9,308
Mid 770 832 878 932 972 1,020 1,050 1,087 1,127 1,178 9,847
High 770 836 886 945 999 1,050 1,139 1,196 1,252 1,333 10,405
88
162159
146
191
0
50
100
150
200
250
Pas
sengers
Historical Low Mid High
0.9 to 2.8% CAGR
Exhibit A Report Number 19-150
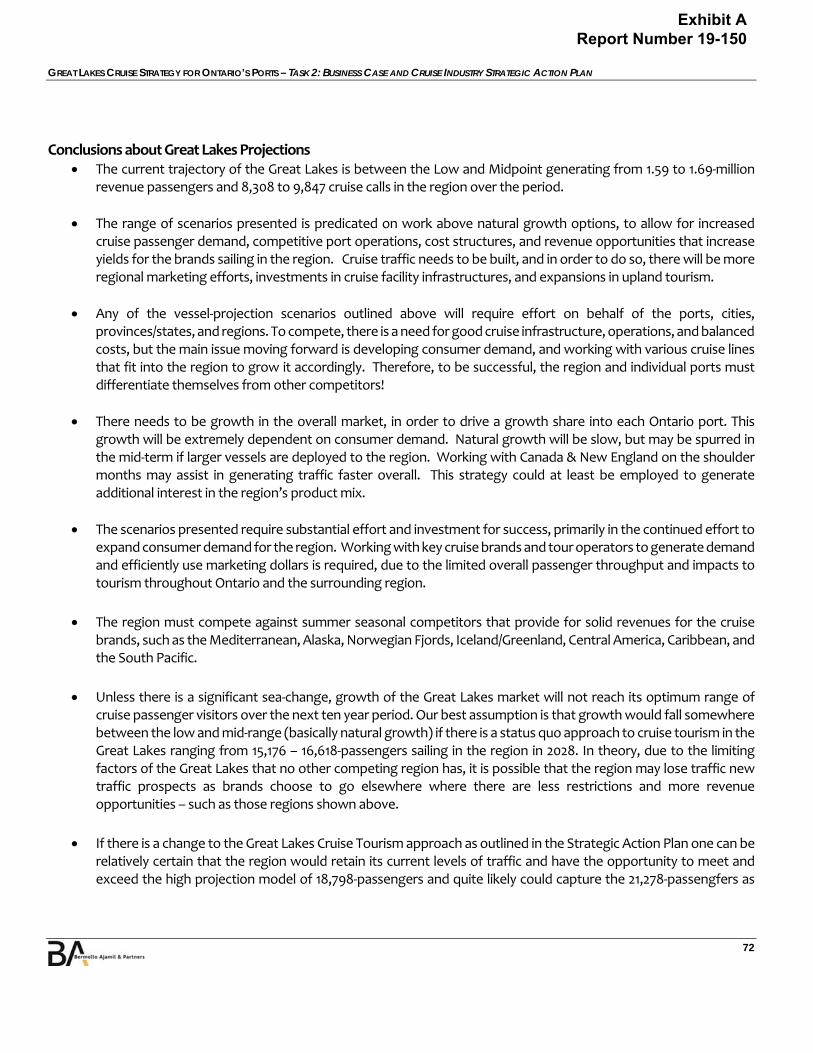
GREAT LAKES CRUISE STRATEGY FOR ONTARIO’S PORTS – TASK 2: BUSINESS CASE AND CRUISE INDUSTRY STRATEGIC ACTION PLAN
72
Conclusions about Great Lakes Projections The current trajectory of the Great Lakes is between the Low and Midpoint generating from 1.59 to 1.69‐million
revenue passengers and 8,308 to 9,847 cruise calls in the region over the period.
The range of scenarios presented is predicated on work above natural growth options, to allow for increased cruise passenger demand, competitive port operations, cost structures, and revenue opportunities that increase yields for the brands sailing in the region. Cruise traffic needs to be built, and in order to do so, there will be more regional marketing efforts, investments in cruise facility infrastructures, and expansions in upland tourism.
Any of the vessel‐projection scenarios outlined above will require effort on behalf of the ports, cities, provinces/states, and regions. To compete, there is a need for good cruise infrastructure, operations, and balanced costs, but the main issue moving forward is developing consumer demand, and working with various cruise lines that fit into the region to grow it accordingly. Therefore, to be successful, the region and individual ports must differentiate themselves from other competitors!
There needs to be growth in the overall market, in order to drive a growth share into each Ontario port. This growth will be extremely dependent on consumer demand. Natural growth will be slow, but may be spurred in the mid‐term if larger vessels are deployed to the region. Working with Canada & New England on the shoulder months may assist in generating traffic faster overall. This strategy could at least be employed to generate additional interest in the region’s product mix.
The scenarios presented require substantial effort and investment for success, primarily in the continued effort to expand consumer demand for the region. Working with key cruise brands and tour operators to generate demand and efficiently use marketing dollars is required, due to the limited overall passenger throughput and impacts to tourism throughout Ontario and the surrounding region.
The region must compete against summer seasonal competitors that provide for solid revenues for the cruise brands, such as the Mediterranean, Alaska, Norwegian Fjords, Iceland/Greenland, Central America, Caribbean, and the South Pacific.
Unless there is a significant sea‐change, growth of the Great Lakes market will not reach its optimum range of cruise passenger visitors over the next ten year period. Our best assumption is that growth would fall somewhere between the low and mid‐range (basically natural growth) if there is a status quo approach to cruise tourism in the Great Lakes ranging from 15,176 – 16,618‐passengers sailing in the region in 2028. In theory, due to the limiting factors of the Great Lakes that no other competing region has, it is possible that the region may lose traffic new traffic prospects as brands choose to go elsewhere where there are less restrictions and more revenue opportunities – such as those regions shown above.
If there is a change to the Great Lakes Cruise Tourism approach as outlined in the Strategic Action Plan one can be relatively certain that the region would retain its current levels of traffic and have the opportunity to meet and exceed the high projection model of 18,798‐passengers and quite likely could capture the 21,278‐passengfers as
Exhibit A Report Number 19-150
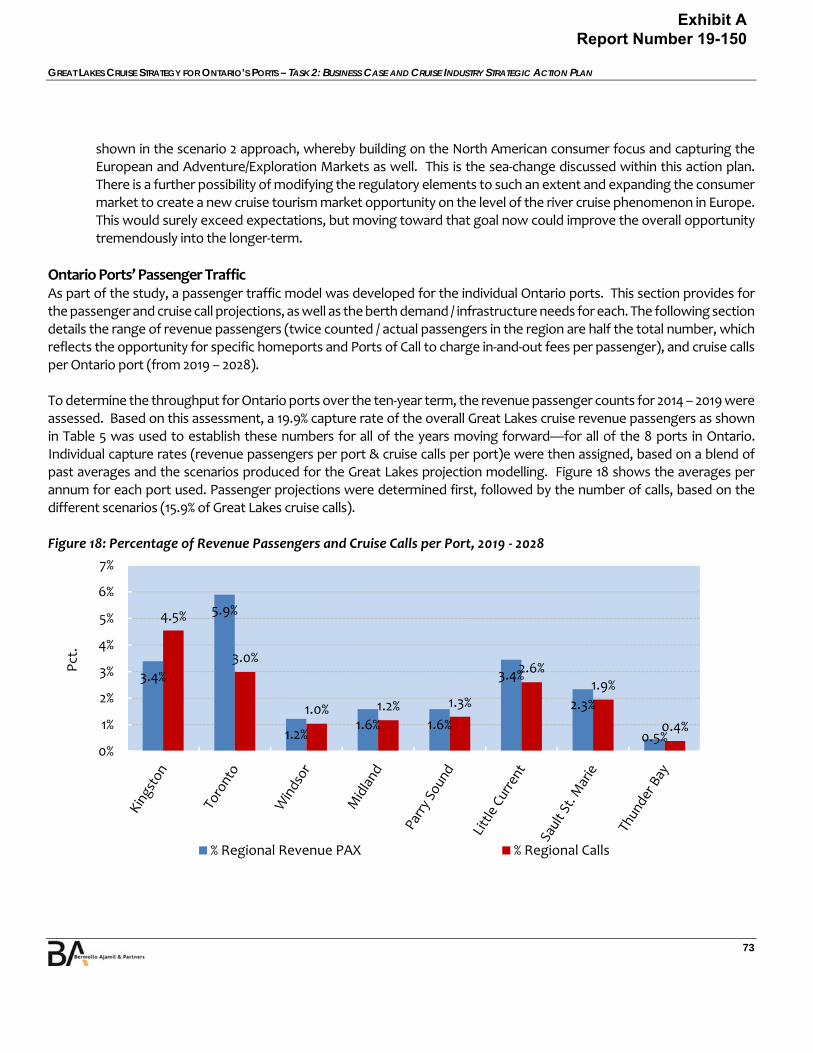
GREAT LAKES CRUISE STRATEGY FOR ONTARIO’S PORTS – TASK 2: BUSINESS CASE AND CRUISE INDUSTRY STRATEGIC ACTION PLAN
73
shown in the scenario 2 approach, whereby building on the North American consumer focus and capturing the European and Adventure/Exploration Markets as well. This is the sea‐change discussed within this action plan. There is a further possibility of modifying the regulatory elements to such an extent and expanding the consumer market to create a new cruise tourism market opportunity on the level of the river cruise phenomenon in Europe. This would surely exceed expectations, but moving toward that goal now could improve the overall opportunity tremendously into the longer‐term.
Ontario Ports’ Passenger Traffic As part of the study, a passenger traffic model was developed for the individual Ontario ports. This section provides for the passenger and cruise call projections, as well as the berth demand / infrastructure needs for each. The following section details the range of revenue passengers (twice counted / actual passengers in the region are half the total number, which reflects the opportunity for specific homeports and Ports of Call to charge in‐and‐out fees per passenger), and cruise calls per Ontario port (from 2019 – 2028). To determine the throughput for Ontario ports over the ten‐year term, the revenue passenger counts for 2014 – 2019 were assessed. Based on this assessment, a 19.9% capture rate of the overall Great Lakes cruise revenue passengers as shown in Table 5 was used to establish these numbers for all of the years moving forward—for all of the 8 ports in Ontario. Individual capture rates (revenue passengers per port & cruise calls per port)e were then assigned, based on a blend of past averages and the scenarios produced for the Great Lakes projection modelling. Figure 18 shows the averages per annum for each port used. Passenger projections were determined first, followed by the number of calls, based on the different scenarios (15.9% of Great Lakes cruise calls). Figure 18: Percentage of Revenue Passengers and Cruise Calls per Port, 2019 ‐ 2028
3.4%
5.9%
1.2%1.6% 1.6%
3.4%
2.3%
0.5%
4.5%
3.0%
1.0% 1.2% 1.3%
2.6%1.9%
0.4%
0%
1%
2%
3%
4%
5%
6%
7%
Pct.
% Regional Revenue PAX % Regional Calls
Exhibit A Report Number 19-150
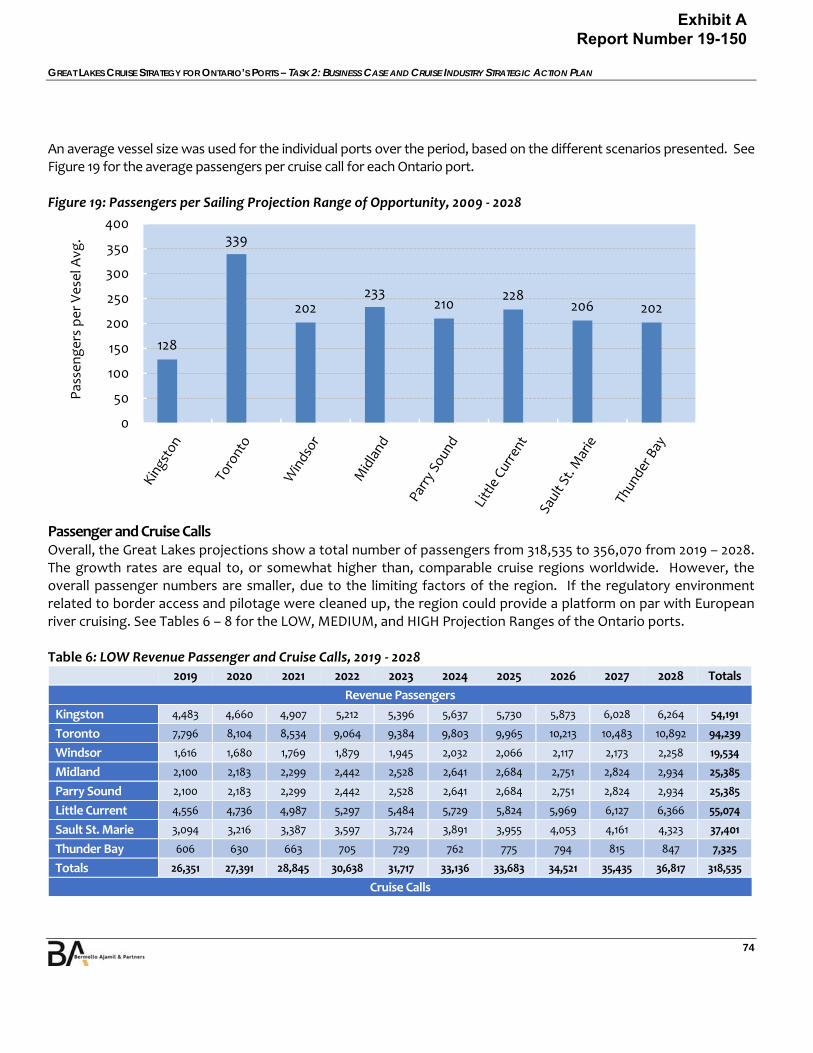
GREAT LAKES CRUISE STRATEGY FOR ONTARIO’S PORTS – TASK 2: BUSINESS CASE AND CRUISE INDUSTRY STRATEGIC ACTION PLAN
74
An average vessel size was used for the individual ports over the period, based on the different scenarios presented. See Figure 19 for the average passengers per cruise call for each Ontario port. Figure 19: Passengers per Sailing Projection Range of Opportunity, 2009 ‐ 2028
Passenger and Cruise Calls Overall, the Great Lakes projections show a total number of passengers from 318,535 to 356,070 from 2019 – 2028. The growth rates are equal to, or somewhat higher than, comparable cruise regions worldwide. However, the overall passenger numbers are smaller, due to the limiting factors of the region. If the regulatory environment related to border access and pilotage were cleaned up, the region could provide a platform on par with European river cruising. See Tables 6 – 8 for the LOW, MEDIUM, and HIGH Projection Ranges of the Ontario ports. Table 6: LOW Revenue Passenger and Cruise Calls, 2019 ‐ 2028
2019 2020 2021 2022 2023 2024 2025 2026 2027 2028 Totals
Revenue Passengers
Kingston 4,483 4,660 4,907 5,212 5,396 5,637 5,730 5,873 6,028 6,264 54,191
Toronto 7,796 8,104 8,534 9,064 9,384 9,803 9,965 10,213 10,483 10,892 94,239
Windsor 1,616 1,680 1,769 1,879 1,945 2,032 2,066 2,117 2,173 2,258 19,534
Midland 2,100 2,183 2,299 2,442 2,528 2,641 2,684 2,751 2,824 2,934 25,385
Parry Sound 2,100 2,183 2,299 2,442 2,528 2,641 2,684 2,751 2,824 2,934 25,385
Little Current 4,556 4,736 4,987 5,297 5,484 5,729 5,824 5,969 6,127 6,366 55,074
Sault St. Marie 3,094 3,216 3,387 3,597 3,724 3,891 3,955 4,053 4,161 4,323 37,401
Thunder Bay 606 630 663 705 729 762 775 794 815 847 7,325
Totals 26,351 27,391 28,845 30,638 31,717 33,136 33,683 34,521 35,435 36,817 318,535
Cruise Calls
128
339
202233
210228
206 202
0
50
100
150
200
250
300
350
400
Pas
sengers per Vese
l Avg
.
Exhibit A Report Number 19-150
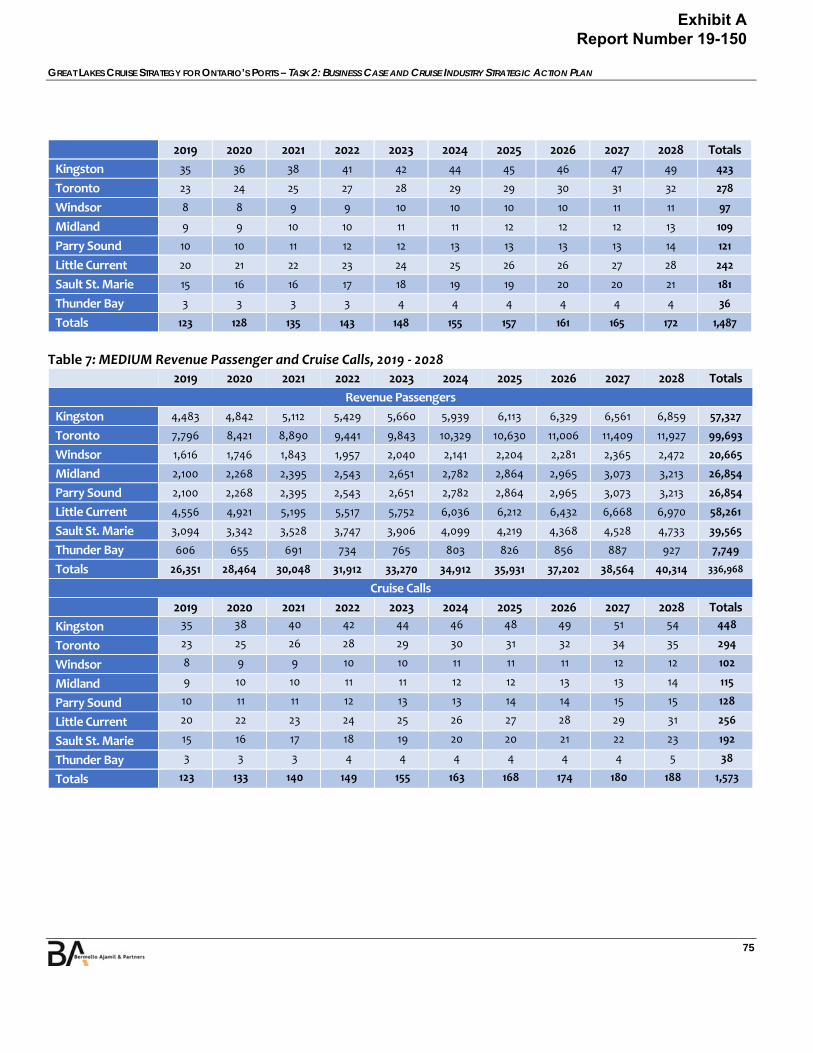
GREAT LAKES CRUISE STRATEGY FOR ONTARIO’S PORTS – TASK 2: BUSINESS CASE AND CRUISE INDUSTRY STRATEGIC ACTION PLAN
75
2019 2020 2021 2022 2023 2024 2025 2026 2027 2028 Totals
Kingston 35 36 38 41 42 44 45 46 47 49 423
Toronto 23 24 25 27 28 29 29 30 31 32 278
Windsor 8 8 9 9 10 10 10 10 11 11 97
Midland 9 9 10 10 11 11 12 12 12 13 109
Parry Sound 10 10 11 12 12 13 13 13 13 14 121
Little Current 20 21 22 23 24 25 26 26 27 28 242
Sault St. Marie 15 16 16 17 18 19 19 20 20 21 181
Thunder Bay 3 3 3 3 4 4 4 4 4 4 36
Totals 123 128 135 143 148 155 157 161 165 172 1,487
Table 7: MEDIUM Revenue Passenger and Cruise Calls, 2019 ‐ 2028
2019 2020 2021 2022 2023 2024 2025 2026 2027 2028 Totals
Revenue Passengers
Kingston 4,483 4,842 5,112 5,429 5,660 5,939 6,113 6,329 6,561 6,859 57,327
Toronto 7,796 8,421 8,890 9,441 9,843 10,329 10,630 11,006 11,409 11,927 99,693
Windsor 1,616 1,746 1,843 1,957 2,040 2,141 2,204 2,281 2,365 2,472 20,665
Midland 2,100 2,268 2,395 2,543 2,651 2,782 2,864 2,965 3,073 3,213 26,854
Parry Sound 2,100 2,268 2,395 2,543 2,651 2,782 2,864 2,965 3,073 3,213 26,854
Little Current 4,556 4,921 5,195 5,517 5,752 6,036 6,212 6,432 6,668 6,970 58,261
Sault St. Marie 3,094 3,342 3,528 3,747 3,906 4,099 4,219 4,368 4,528 4,733 39,565
Thunder Bay 606 655 691 734 765 803 826 856 887 927 7,749
Totals 26,351 28,464 30,048 31,912 33,270 34,912 35,931 37,202 38,564 40,314 336,968
Cruise Calls 2019 2020 2021 2022 2023 2024 2025 2026 2027 2028 Totals
Kingston 35 38 40 42 44 46 48 49 51 54 448
Toronto 23 25 26 28 29 30 31 32 34 35 294
Windsor 8 9 9 10 10 11 11 11 12 12 102
Midland 9 10 10 11 11 12 12 13 13 14 115
Parry Sound 10 11 11 12 13 13 14 14 15 15 128
Little Current 20 22 23 24 25 26 27 28 29 31 256
Sault St. Marie 15 16 17 18 19 20 20 21 22 23 192
Thunder Bay 3 3 3 4 4 4 4 4 4 5 38
Totals 123 133 140 149 155 163 168 174 180 188 1,573
Exhibit A Report Number 19-150

GREAT LAKES CRUISE STRATEGY FOR ONTARIO’S PORTS – TASK 2: BUSINESS CASE AND CRUISE INDUSTRY STRATEGIC ACTION PLAN
76
Table 8: HIGH Revenue Passenger and Cruise Calls, 2019 ‐ 2028 2019 2020 2021 2022 2023 2024 2025 2026 2027 2028 Totals
Revenue Passengers
Kingston 4,483 4,865 5,159 5,505 5,814 6,110 6,631 6,964 7,286 7,759 60,577
Toronto 7,796 8,460 8,972 9,573 10,111 10,626 11,532 12,111 12,671 13,492 105,344
Windsor 1,616 1,754 1,860 1,984 2,096 2,203 2,390 2,510 2,627 2,797 21,836
Midland 2,100 2,279 2,417 2,579 2,724 2,862 3,106 3,262 3,413 3,634 28,376
Parry Sound 2,100 2,279 2,417 2,579 2,724 2,862 3,106 3,262 3,413 3,634 28,376
Little Current 4,556 4,944 5,243 5,594 5,909 6,210 6,739 7,078 7,405 7,885 61,563
Sault St. Marie 3,094 3,358 3,561 3,799 4,013 4,217 4,577 4,806 5,029 5,355 41,808
Thunder Bay 606 658 697 744 786 826 896 941 985 1,049 8,189
Totals 26,351 28,596 30,327 32,356 34,176 35,916 38,978 40,936 42,830 45,605 356,070
Cruise Calls 2019 2020 2021 2022 2023 2024 2025 2026 2027 2028 Totals
Kingston 35 38 40 43 45 48 52 54 57 61 473
Toronto 23 25 26 28 30 31 34 36 37 40 311
Windsor 8 9 9 10 10 11 12 12 13 14 108
Midland 9 10 10 11 12 12 13 14 15 16 122
Parry Sound 10 11 12 12 13 14 15 16 16 17 135
Little Current 20 22 23 25 26 27 30 31 33 35 270
Sault St. Marie 15 16 17 18 19 20 22 23 24 26 203
Thunder Bay 3 3 3 4 4 4 4 5 5 5 41
Totals 123 133 142 151 160 168 182 191 200 213 1,662
Exhibit A Report Number 19-150
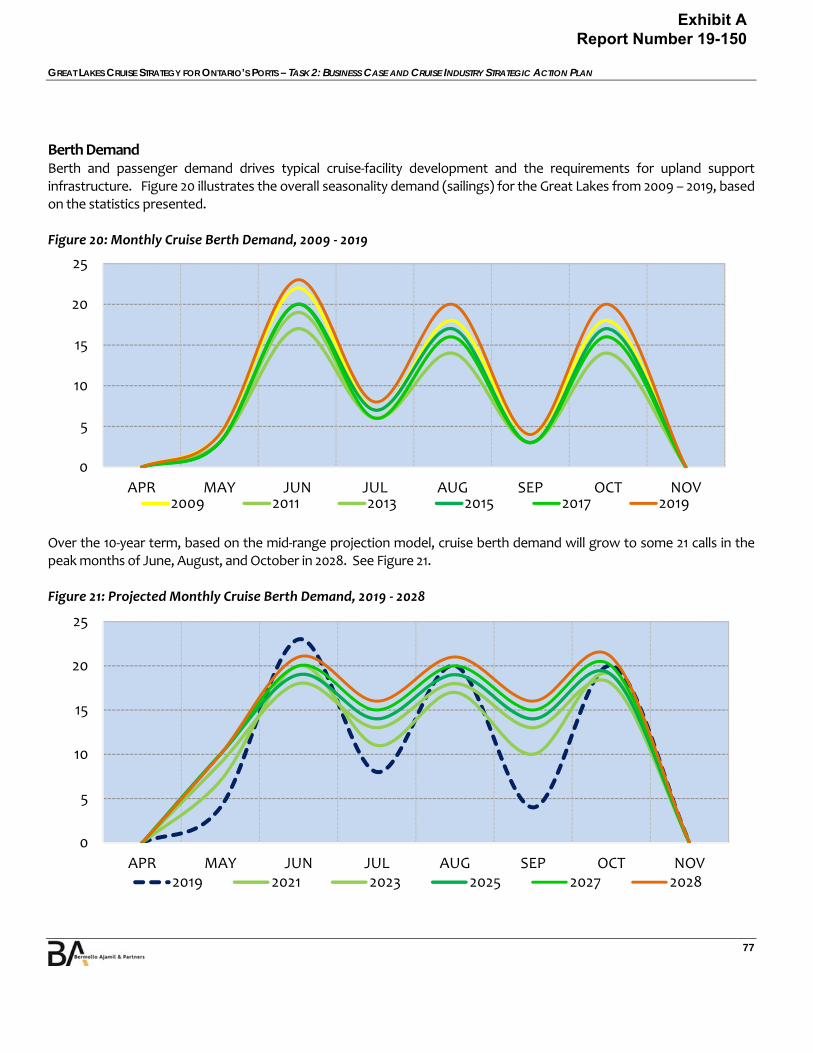
GREAT LAKES CRUISE STRATEGY FOR ONTARIO’S PORTS – TASK 2: BUSINESS CASE AND CRUISE INDUSTRY STRATEGIC ACTION PLAN
77
Berth Demand Berth and passenger demand drives typical cruise‐facility development and the requirements for upland support infrastructure. Figure 20 illustrates the overall seasonality demand (sailings) for the Great Lakes from 2009 – 2019, based on the statistics presented. Figure 20: Monthly Cruise Berth Demand, 2009 ‐ 2019
Over the 10‐year term, based on the mid‐range projection model, cruise berth demand will grow to some 21 calls in the peak months of June, August, and October in 2028. See Figure 21. Figure 21: Projected Monthly Cruise Berth Demand, 2019 ‐ 2028
0
5
10
15
20
25
APR MAY JUN JUL AUG SEP OCT NOV2009 2011 2013 2015 2017 2019
0
5
10
15
20
25
APR MAY JUN JUL AUG SEP OCT NOV2019 2021 2023 2025 2027 2028
Exhibit A Report Number 19-150
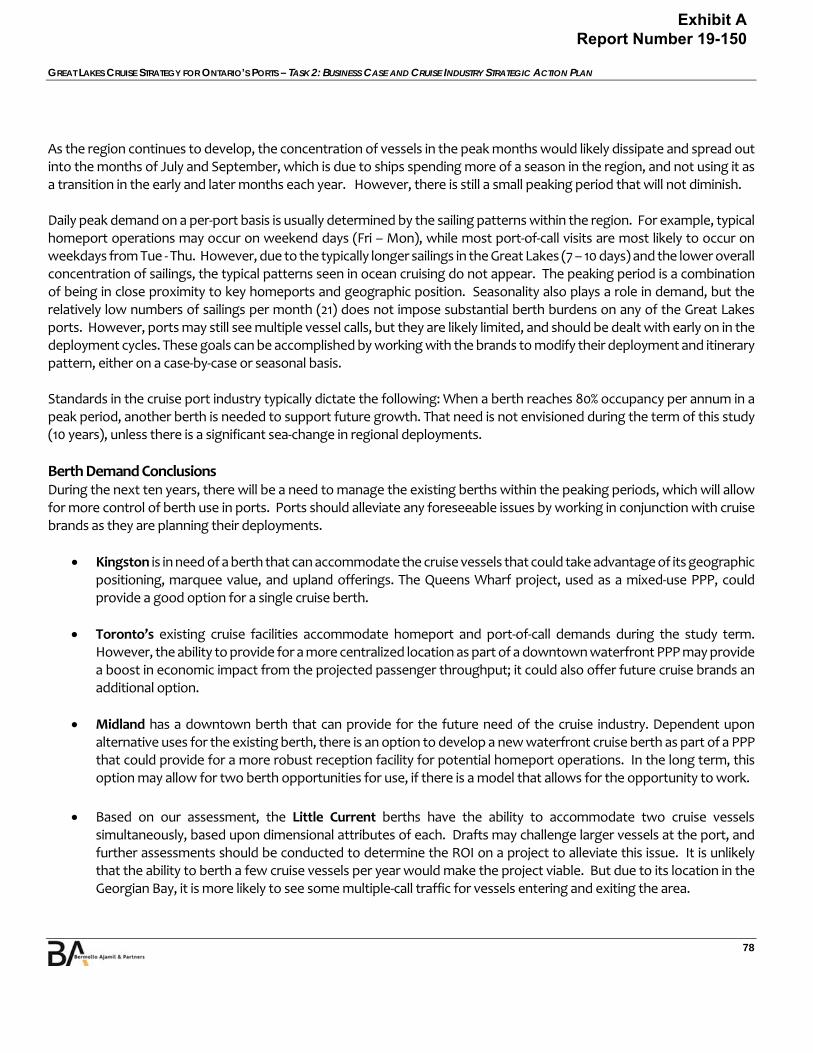
GREAT LAKES CRUISE STRATEGY FOR ONTARIO’S PORTS – TASK 2: BUSINESS CASE AND CRUISE INDUSTRY STRATEGIC ACTION PLAN
78
As the region continues to develop, the concentration of vessels in the peak months would likely dissipate and spread out into the months of July and September, which is due to ships spending more of a season in the region, and not using it as a transition in the early and later months each year. However, there is still a small peaking period that will not diminish. Daily peak demand on a per‐port basis is usually determined by the sailing patterns within the region. For example, typical homeport operations may occur on weekend days (Fri – Mon), while most port‐of‐call visits are most likely to occur on weekdays from Tue ‐ Thu. However, due to the typically longer sailings in the Great Lakes (7 – 10 days) and the lower overall concentration of sailings, the typical patterns seen in ocean cruising do not appear. The peaking period is a combination of being in close proximity to key homeports and geographic position. Seasonality also plays a role in demand, but the relatively low numbers of sailings per month (21) does not impose substantial berth burdens on any of the Great Lakes ports. However, ports may still see multiple vessel calls, but they are likely limited, and should be dealt with early on in the deployment cycles. These goals can be accomplished by working with the brands to modify their deployment and itinerary pattern, either on a case‐by‐case or seasonal basis. Standards in the cruise port industry typically dictate the following: When a berth reaches 80% occupancy per annum in a peak period, another berth is needed to support future growth. That need is not envisioned during the term of this study (10 years), unless there is a significant sea‐change in regional deployments.
Berth Demand Conclusions During the next ten years, there will be a need to manage the existing berths within the peaking periods, which will allow for more control of berth use in ports. Ports should alleviate any foreseeable issues by working in conjunction with cruise brands as they are planning their deployments.
Kingston is in need of a berth that can accommodate the cruise vessels that could take advantage of its geographic positioning, marquee value, and upland offerings. The Queens Wharf project, used as a mixed‐use PPP, could provide a good option for a single cruise berth.
Toronto’s existing cruise facilities accommodate homeport and port‐of‐call demands during the study term. However, the ability to provide for a more centralized location as part of a downtown waterfront PPP may provide a boost in economic impact from the projected passenger throughput; it could also offer future cruise brands an additional option.
Midland has a downtown berth that can provide for the future need of the cruise industry. Dependent upon alternative uses for the existing berth, there is an option to develop a new waterfront cruise berth as part of a PPP that could provide for a more robust reception facility for potential homeport operations. In the long term, this option may allow for two berth opportunities for use, if there is a model that allows for the opportunity to work.
Based on our assessment, the Little Current berths have the ability to accommodate two cruise vessels simultaneously, based upon dimensional attributes of each. Drafts may challenge larger vessels at the port, and further assessments should be conducted to determine the ROI on a project to alleviate this issue. It is unlikely that the ability to berth a few cruise vessels per year would make the project viable. But due to its location in the Georgian Bay, it is more likely to see some multiple‐call traffic for vessels entering and exiting the area.
Exhibit A Report Number 19-150
GREAT LAKES CRUISE STRATEGY FOR ONTARIO’S PORTS – TASK 2: BUSINESS CASE AND CRUISE INDUSTRY STRATEGIC ACTION PLAN
79
The destinations of Windsor, Parry Sound, and Thunder Bay do not require additional berths during this period. Each has the ability to accommodate a single vessel at good to excellent facilities. Specifically:
o Windsor could have the ability to host homeports if some of the regulatory issues could be modified for
Great Lakes cruising, such as border access and storing costs. It is in close proximity to a core consumer market in Detroit, which also has a large international airport.
o Parry Sound has an excellent berth in the downtown core, which includes a visitor’s center, large parking area for tour dispatches (air and cruise), a scenic river walk, and a retail area.
o At present, Thunder Bay has limited cruise calls. However, they do have a good berth and an upland ground transportation area to support tour options. It is also a short walk / drive to the downtown core. Thunder Bay may have the opportunity to host smaller cruise vessels in the inner harbour, along the existing seawall (depending on vessel characteristics).
The goal of the region is to expand the cruise season during the summer months. Peaking activities will occur in the early summer and fall seasons, but unless more significant growth occurs, we do not envision that a catalyst for berth infrastructure and soft tourism development will occur.
Exhibit A Report Number 19-150
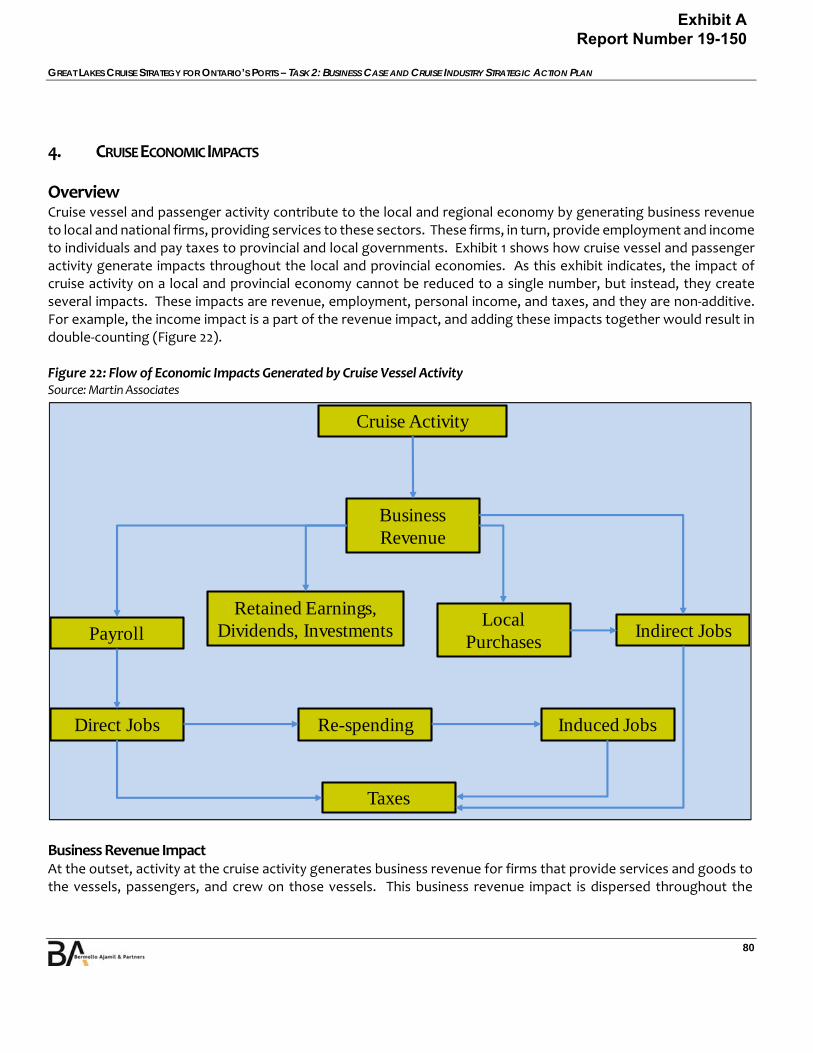
GREAT LAKES CRUISE STRATEGY FOR ONTARIO’S PORTS – TASK 2: BUSINESS CASE AND CRUISE INDUSTRY STRATEGIC ACTION PLAN
80
4. CRUISE ECONOMIC IMPACTS
Overview Cruise vessel and passenger activity contribute to the local and regional economy by generating business revenue to local and national firms, providing services to these sectors. These firms, in turn, provide employment and income to individuals and pay taxes to provincial and local governments. Exhibit 1 shows how cruise vessel and passenger activity generate impacts throughout the local and provincial economies. As this exhibit indicates, the impact of cruise activity on a local and provincial economy cannot be reduced to a single number, but instead, they create several impacts. These impacts are revenue, employment, personal income, and taxes, and they are non‐additive. For example, the income impact is a part of the revenue impact, and adding these impacts together would result in double‐counting (Figure 22). Figure 22: Flow of Economic Impacts Generated by Cruise Vessel Activity Source: Martin Associates
Business Revenue Impact At the outset, activity at the cruise activity generates business revenue for firms that provide services and goods to the vessels, passengers, and crew on those vessels. This business revenue impact is dispersed throughout the
Cruise Activity
Business Revenue
Indirect JobsLocal
Purchases
Retained Earnings, Dividends, InvestmentsPayroll
Induced JobsRe-spendingDirect Jobs
Taxes
Exhibit A Report Number 19-150

GREAT LAKES CRUISE STRATEGY FOR ONTARIO’S PORTS – TASK 2: BUSINESS CASE AND CRUISE INDUSTRY STRATEGIC ACTION PLAN
81
economy in several ways: It is used to hire people to provide the services, to purchase goods and other services, to pay for the use of the port facilities and make provincial and local tax payments. The remainder is used to pay stockholders, retire debt, make investments, and be held as retained earnings. It is to be emphasized that the only portions of the revenue impact that can be definitely identified as remaining in the province of Ontario are those portions paid out in salaries to Ontario employees, for local purchases by individuals and businesses directly dependent on the cruise activity and contributing to provincial and local taxes.
Employment Impact The employment impact of the cruise activity consists of three levels of job impacts:
Direct employment impact ‐ Jobs directly generated by cruise activity. These jobs include firms providing services to the vessel, as well as local hotels, restaurants, transportation firms, and retail stores providing services to the passengers and crew.
Induced employment impact ‐ Jobs created throughout the local and provincial economies because individuals are directly employed, due to the cruise vessel’s activity, and spend their wages locally on goods and services, such as food, housing, and clothing. These jobs are held by residents located throughout the region and province, since they are estimated, based on local and regional purchases by individuals.
Indirect Jobs ‐ Jobs created in Ontario, due to purchases of goods and services by firms, employing the directly generated job holders depending on the cruise vessel and passenger activity. These jobs include jobs with suppliers of goods to local retail shops and restaurants supplying the services to the cruise passengers and crew, fuel to the tour operators, and supplies to the ports that are providing water and bunkers to the vessels. It is to be emphasized that special care was taken to avoid double‐counting, since the current study counts certain jobs as direct, which are often classified as indirect by other approaches.
Personal Earnings Impact The personal earnings impact is the measure of employee wages and salaries (excluding benefits) received by individuals directly employed, due to airport or seaport activity. Re‐spending these earnings is also estimated throughout Ontario for purchases of goods and services, which in turn generates additional jobs and the induced employment impact described previously. In addition, re‐spending is estimated using a provincial income multiplier developed for Ontario from Statistics Canada, Industry Accounts Division, and provided to Martin Associates. Martin Associates developed the distribution of purchases by type of purchase (e.g., food at home, food in restaurants, housing, apparel, home furnishings, transportation, and medical care) for each resident of Ontario, using data provided by Statistics Canada (2015 base data). The associated jobs‐to‐sales ratios, on a provincial level, were also supplied to Martin Associates by Statistics Canada (Provincial Input‐Output Models). These ratios included the retail and wholesale re‐spending impacts. The personal‐consumption expenditures from the cruise activity are then combined with these job multipliers to estimate the induced impacts for Ontario. To estimate the non‐consumption induced impacts with such sectors as state/provincial governments, education, and other social services, a ratio of state/provincial employment in these key service industries (to total provincial employment) was developed. This ratio was then multiplied by the direct and consumption‐induced jobs, to estimate the total direct and induced job impact.
Exhibit A Report Number 19-150

GREAT LAKES CRUISE STRATEGY FOR ONTARIO’S PORTS – TASK 2: BUSINESS CASE AND CRUISE INDUSTRY STRATEGIC ACTION PLAN
82
The re‐spending impact includes both the income received by people employed to provide goods and services to the direct job‐holders, but also the value of the purchases. Therefore, the re‐spending/local consumption impact cannot be divided by the induced jobs to estimate the induced income—as it would overestimate the induced personal wage/salary impact per induced job.
Indirect Impacts Indirect jobs, income tax, and revenue impacts are generated in the provincial economy as the result of purchases by companies that are directly dependent on the cruise vessels and passenger activity at the ports. To estimate these indirect impacts, employment multipliers for each direct job category were developed for Ontario from Statistics Canada, Industry Accounts Division. The indirect job ratios also account for the in‐province spinoff effects from multiple rounds of supply chains, which are required to provide the purchased goods and services. Indirect income, local purchases, and taxes are also estimated.
Tax Impact Provincial and local impacts are tax payments to the provincial and local governments by firms and individuals whose jobs are directly dependent upon and supported (induced and indirect jobs) by the cruise activity at the Ontario ports. These tax impacts were estimated based on data provided by Revenue Canada to Martin Associates.
Methodology Summary Cruise vessel service at a port consists of either a homeport call or a port of call. For the vessels homeporting, passengers embark and disembark to begin and end their cruise, and the vessel often takes on supplies. For those vessels making ports of call, passengers embark and disembark for day visits where the vessel is docked, but the vessels typically do not take on supplies. For such port‐of‐call activity, the vessel may take on water, discharge waste, and hire security, line handlers, tugs, and docking pilots. Each of these types of calls creates economic impacts in the local economy. Cruise activity creates economic activity in two sectors of the local and regional economy in which the port is located. These sectors are the Maritime Service and Visitor Industry Sectors. The maritime‐service sector includes the firms that provide services to the cruise vessels while in port:
Chandlers and other local retailers and wholesalers that provide ship stores and provisions to be used by passengers and crew.
Towing services that assist vessels with docking and undocking. (A majority of the new cruise vessels are equipped with bow and stern thrusters, and the need for tug assistance is minimized.)
Pilots assist the vessels navigating the channels from the open sea to the docks.
Stevedoring services, including handling baggage and ship supplies
Line‐handling services that are required when a vessel enters port
Bunkering firms that provide fuel to the vessels
Parking services for the passengers driving from their places of residence to embark on cruises
Ground transfers from the airport and hotels to the ship, prior to and after the cruise.
Exhibit A Report Number 19-150
GREAT LAKES CRUISE STRATEGY FOR ONTARIO’S PORTS – TASK 2: BUSINESS CASE AND CRUISE INDUSTRY STRATEGIC ACTION PLAN
83
Security‐service firms while the vessel is in port
Waste‐removal services while in port
Potable‐water service to the vessels while in port The visitor sector consists of firms providing services to the passengers and crew, prior to and after the cruise, for a homeport call and land tours, as well as retail goods and food for passengers and crew during a port of call. Included in this category are:
Hotels and motels
Restaurants/bars
Retail goods
Entertainment establishments, such as ground tours, movies, and amusements To estimate these impacts, Martin Associates contacted several cruise lines with current and potential operations on the Great Lakes, in particular those companies that may provide services to the specific Ontario ports. The operators contacted included Blount Small Ship Adventures, Victory Cruise Lines, Ritz Carlton Cruises, and ACL / Pearl Seas Cruises. While these officials were contacted, the data provided regarding expenditures by the cruise lines was limited. Data was requested regarding vessel purchases for:
Ship stores
Bunkers
Water
Liquor
Flowers
Pilots
Tugs
Local advertising
Local travel agents
Line‐handling
Tendering services
Stevedoring
Retail items
Maintenance and repair
Trash disposal
Laundry
Crew allowance
Wharfage and dockage While data provided by the operators was limited, they indicated that the majority of the cruise service at the Ontario ports would be ports of call, not homeport calls. In order to develop likely purchases by a port of call, data
Exhibit A Report Number 19-150
GREAT LAKES CRUISE STRATEGY FOR ONTARIO’S PORTS – TASK 2: BUSINESS CASE AND CRUISE INDUSTRY STRATEGIC ACTION PLAN
84
regarding cruise tariffs in place at the Ontario ports was used to develop a vessel‐expenditure profile for a cruise‐vessel port of call. Martin Associates developed jobs‐to‐sales and income‐per‐employee ratios with the types of firms providing the goods and services to a port‐of‐call vessel. These jobs‐to‐sales ratios and personal‐income levels were developed from the Statistics Canada, for the Province of Ontario. The total annual expenditures, by type of service, is multiplied by the corresponding jobs‐to‐sales ratios to estimate the total direct job impacts in the maritime service sector, by type of service. The indirect multipliers are then applied to these direct job multipliers, to estimate the indirect impacts. The revenue impacts are estimated directly from the expenditure profiles provided by the port tariffs. The jobs generated in the Visitor Industry/Tourism Sector (e.g., land tours, restaurants, hotels, and retail purchases) data regarding passenger and crew spending for cruise operations at the Ontario ports was developed from the Economic Impacts of Canadian Cruising.9 Data for passenger and cruise spending at other Quebec ports was used
as a starting point for this analysis, since the Economic Contribution of the International Cruise Industry in Canada report did not include Ontario ports. The category “other Quebec” ports refers to the non‐home call 3ports in Quebec, excluding Montreal and Quebec City. It is assumed that these port‐of‐call “other Quebec” ports are representative of ports that would occur in Ontario, and are used to estimate the role that Ontario ports will likely play in the Great Lakes cruise market. Based on this analysis, the average expenditure per passenger at each Ontario port of call is:
$12.37 per passenger for food onshore
$24.75 per passenger for retail purchases
$26.12 per passenger for landside tours Similarly, the average expenditure per crew member per port of call is:
$7.29 per crew member for food
$8.03 per crew member for retail purchases
$1.30 per crew member of landside tours and entertainment For homeport calls, the average vessel expenditure per passenger in Quebec was estimated from the Economic Contribution of the International Cruise Industry in Canada, and expanded, based on the number of passengers per vessel assumed for the Ontario operations (214 passengers per vessel). In addition, specific tariff items for Ontario ports were also included in the homeport model.
9 Economic Contribution of the International Cruise Industry in Canada, April 2017, by Cruise Line Industry Association, St. Lawrence Cruise Association, Atlantic Canada Cruise Association, Cruise BC, by BREA
Exhibit A Report Number 19-150

GREAT LAKES CRUISE STRATEGY FOR ONTARIO’S PORTS – TASK 2: BUSINESS CASE AND CRUISE INDUSTRY STRATEGIC ACTION PLAN
85
For homeport vessel calls, the average expenditures for a cruise passenger in Montreal was used, as presented in the Economic Contribution of the International Cruise Industry in Canada. These expenditures are for a homeport call:
$83.55 per passenger for lodging pre‐ or post‐cruise
$43.90 per passenger for food and beverages off‐vessel
$29.73 per passenger for retail purchases
$31.15 per passenger for tours and entertainment The same crew expenditures were assumed for homeports and port‐of‐call visits. The jobs per sales for hotels, restaurants, retail, and entertainment were developed for Ontario from Statistics Canada, Provincial Input‐Output Models. These ratios included the retail and wholesale re‐spending impacts, as well as income and revenue multipliers. In order to assess the economic impacts of potential cruise business at the Ontario ports, Martin Associates developed a spreadsheet framework, which was used to translate the cruise vessels and passenger projections into potential economic impacts. This model can also be used to assess the impacts of changes in such factors as:
Number of cruise vessel calls
Number of passengers
Passenger characteristics o Local expenditures o Local residents v. tourists o Length of time and location of stay after disembarking
Different types of cruise service o Homeport o Port of call
Size of crew
Size of vessel This model was then used to estimate the impacts of potential cruise operations at the Ontario ports. Based on the cruise market analysis conducted by B&A, it is estimated that by 2020, 80 sailings will call the Ontario ports, representing about 12,000 passengers. Presumably, each sailing will then call 6 Ontario ports. By 2028, B&A estimated a total of 132 sailings will call the Ontario ports, with 6 individual port calls per sailing.
Potential Economic Impacts Based on the MEDIUM and HIGH scenarios of projected sailings at Ontario ports in 2019, 2023, and 2038, Martin Associates developed the economic impacts in Ontario that could be potentially generated by this level of cruise activity. In 2019, 123 port calls were used, including 23 homeport calls. In 2023, the number of port calls at Ontario ports increased to 155, with 29 homeport calls in the MEDIUM scenario. By 2028, 188 port calls are projected under
Exhibit A Report Number 19-150
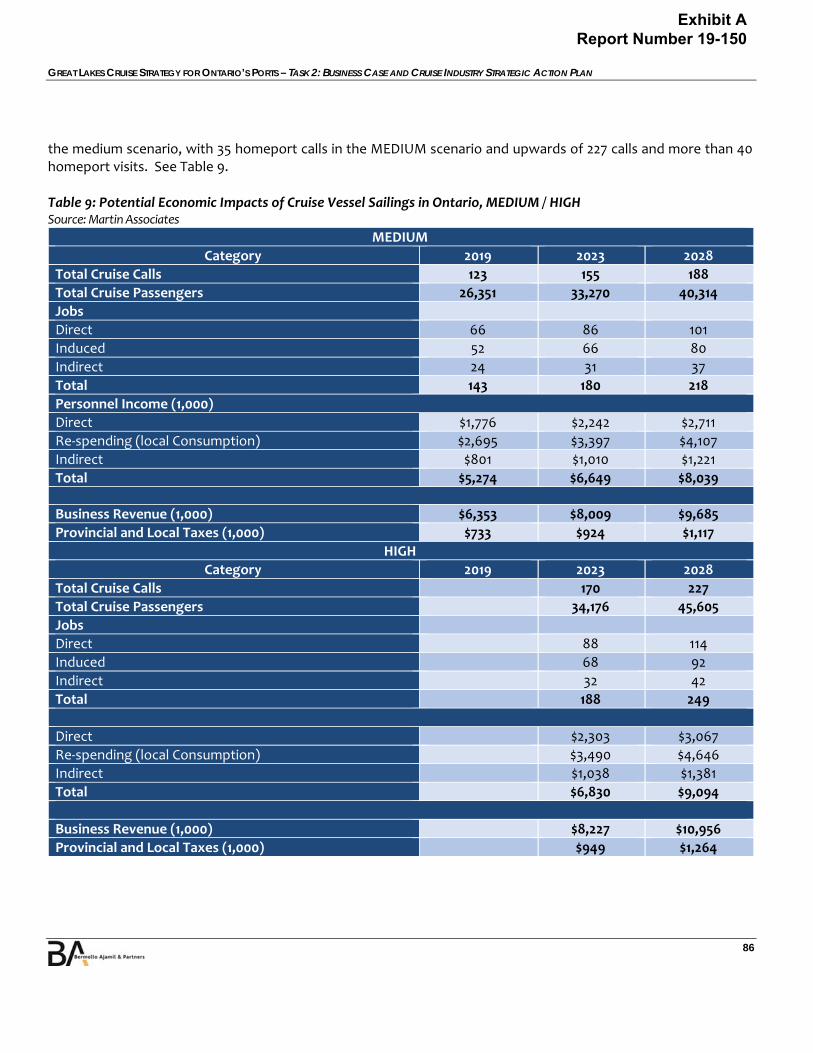
GREAT LAKES CRUISE STRATEGY FOR ONTARIO’S PORTS – TASK 2: BUSINESS CASE AND CRUISE INDUSTRY STRATEGIC ACTION PLAN
86
the medium scenario, with 35 homeport calls in the MEDIUM scenario and upwards of 227 calls and more than 40 homeport visits. See Table 9. Table 9: Potential Economic Impacts of Cruise Vessel Sailings in Ontario, MEDIUM / HIGH Source: Martin Associates
MEDIUM
Category 2019 2023 2028
Total Cruise Calls 123 155 188
Total Cruise Passengers 26,351 33,270 40,314
Jobs
Direct 66 86 101
Induced 52 66 80
Indirect 24 31 37
Total 143 180 218
Personnel Income (1,000)
Direct $1,776 $2,242 $2,711
Re‐spending (local Consumption) $2,695 $3,397 $4,107
Indirect $801 $1,010 $1,221
Total $5,274 $6,649 $8,039
Business Revenue (1,000) $6,353 $8,009 $9,685
Provincial and Local Taxes (1,000) $733 $924 $1,117
HIGH
Category 2019 2023 2028
Total Cruise Calls 170 227
Total Cruise Passengers 34,176 45,605
Jobs
Direct 88 114
Induced 68 92
Indirect 32 42
Total 188 249
Direct $2,303 $3,067
Re‐spending (local Consumption) $3,490 $4,646
Indirect $1,038 $1,381
Total $6,830 $9,094
Business Revenue (1,000) $8,227 $10,956
Provincial and Local Taxes (1,000) $949 $1,264
Exhibit A Report Number 19-150
GREAT LAKES CRUISE STRATEGY FOR ONTARIO’S PORTS – TASK 2: BUSINESS CASE AND CRUISE INDUSTRY STRATEGIC ACTION PLAN
87
Under the MEDIUM scenario the 2019, 2023, and 2028 projected cruise‐vessel activity at Ontario ports has the potential to generate the following economic impacts in the Province: 143 direct, induced, and indirect jobs in Ontario in 2019, increasing to 180 total jobs by 2023, and 218 by 2028. Of the total jobs:
66, 83, and 101 direct jobs are projected for the cruise levels assumed in 2019, 2023, and 2028, respectively.
52, 66, and 80 induced jobs are projected for these three periods, respectively.
24, 31, and 37 indirect jobs are projected for these three periods, respectively. $5.3 million of wages and salaries and consumption expenditures in Ontario are projected in 2019, increasing to $6.6 million in 2023 and $8.0 million in 2028:
$1.8, $2.2 million, and $2.7 million of direct wages and salaries in the three forecast years, respectively.
As the result of re‐spending, another $2.7, $3.4, and $4.1 million of re‐spending and consumption purchases annually are projected in each of the forecast years, and will support the 52 induced jobs in 2019, the 83 direct jobs in 2023, and 101 direct jobs in 2028.
$0.8, $1.0 and $1.2 million of wages and salaries received by indirect job holders in each of the forecast years. Under the HIGH scenario the 2023, and 2028 projected cruise‐vessel activity at Ontario ports has the potential to generate the following economic impacts in the Province: 188 direct, induced, and indirect jobs in Ontario in 2023, and 249 by 2028. Of the total jobs:
88 and 114 direct jobs are projected for the cruise levels assumed in 2023, and 2028, respectively.
68 and 92 induced jobs are projected for these three periods, respectively.
32 and 42 indirect jobs are projected for these three periods, respectively. $6.8 million of wages and salaries and consumption expenditures in Ontario are projected in 2023, increasing to $9.0 million in 2028:
$2.3 and $3.0 million of direct wages and salaries in the forecast years, respectively.
As the result of re‐spending, another $3.5, and $4.6 million of re‐spending and consumption purchases annually are projected in each of the forecast years.
$1.0 and $1.3 million of wages and salaries received by indirect job holders in each of the forecast years. Additionally, the economic impacts above have been broken down into the 8 Ontario ports to illustrate the opportunity for cruise in each of the communities in the same years (2019, 2023, 2028) using the projected numbers for 2019; and the MEDIUM and HIGH projections for 2023 and 2028 to show the return on the investment in the cruise tourism industry for the Ports of Ontario as illustrated in the Action Plan. See Tables 10 ‐ 12.
Exhibit A Report Number 19-150
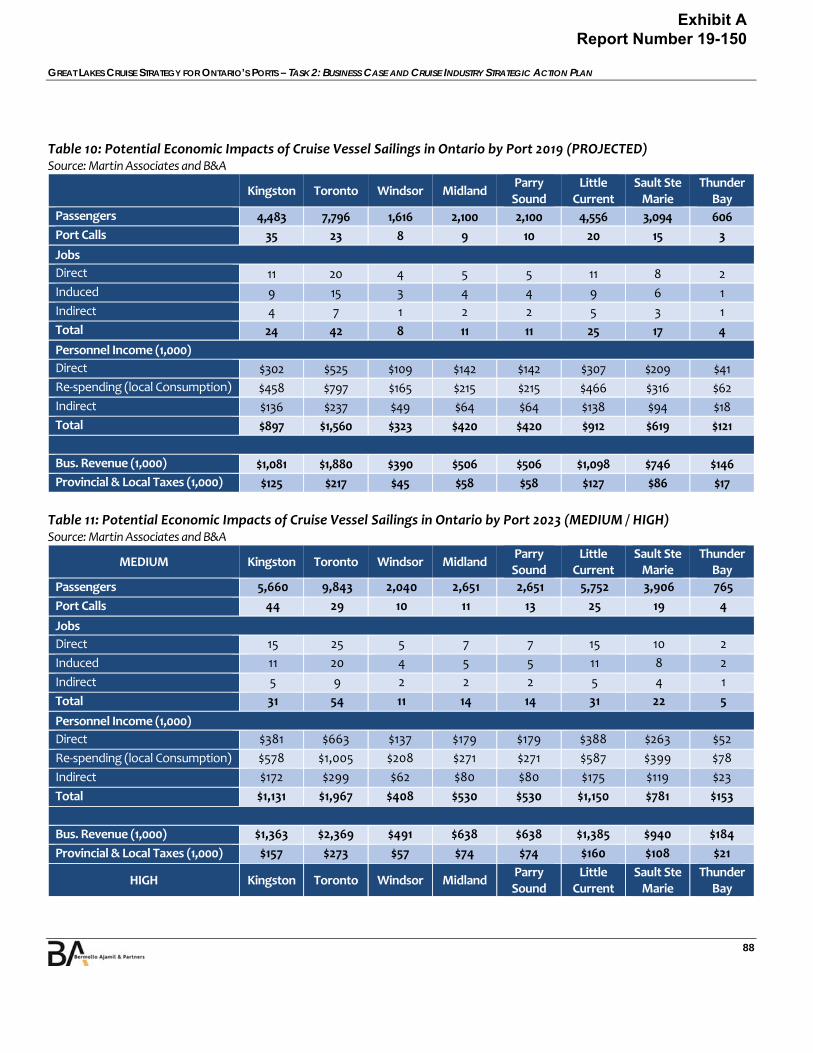
GREAT LAKES CRUISE STRATEGY FOR ONTARIO’S PORTS – TASK 2: BUSINESS CASE AND CRUISE INDUSTRY STRATEGIC ACTION PLAN
88
Table 10: Potential Economic Impacts of Cruise Vessel Sailings in Ontario by Port 2019 (PROJECTED) Source: Martin Associates and B&A
Kingston Toronto Windsor Midland Parry Sound
Little Current
Sault Ste Marie
Thunder Bay
Passengers 4,483 7,796 1,616 2,100 2,100 4,556 3,094 606
Port Calls 35 23 8 9 10 20 15 3
Jobs
Direct 11 20 4 5 5 11 8 2
Induced 9 15 3 4 4 9 6 1
Indirect 4 7 1 2 2 5 3 1
Total 24 42 8 11 11 25 17 4
Personnel Income (1,000)
Direct $302 $525 $109 $142 $142 $307 $209 $41
Re‐spending (local Consumption) $458 $797 $165 $215 $215 $466 $316 $62
Indirect $136 $237 $49 $64 $64 $138 $94 $18
Total $897 $1,560 $323 $420 $420 $912 $619 $121
Bus. Revenue (1,000) $1,081 $1,880 $390 $506 $506 $1,098 $746 $146
Provincial & Local Taxes (1,000) $125 $217 $45 $58 $58 $127 $86 $17
Table 11: Potential Economic Impacts of Cruise Vessel Sailings in Ontario by Port 2023 (MEDIUM / HIGH) Source: Martin Associates and B&A
MEDIUM Kingston Toronto Windsor Midland Parry Sound
Little Current
Sault Ste Marie
Thunder Bay
Passengers 5,660 9,843 2,040 2,651 2,651 5,752 3,906 765
Port Calls 44 29 10 11 13 25 19 4
Jobs
Direct 15 25 5 7 7 15 10 2
Induced 11 20 4 5 5 11 8 2
Indirect 5 9 2 2 2 5 4 1
Total 31 54 11 14 14 31 22 5
Personnel Income (1,000)
Direct $381 $663 $137 $179 $179 $388 $263 $52
Re‐spending (local Consumption) $578 $1,005 $208 $271 $271 $587 $399 $78
Indirect $172 $299 $62 $80 $80 $175 $119 $23
Total $1,131 $1,967 $408 $530 $530 $1,150 $781 $153
Bus. Revenue (1,000) $1,363 $2,369 $491 $638 $638 $1,385 $940 $184
Provincial & Local Taxes (1,000) $157 $273 $57 $74 $74 $160 $108 $21
HIGH Kingston Toronto Windsor Midland Parry Sound
Little Current
Sault Ste Marie
Thunder Bay
Exhibit A Report Number 19-150
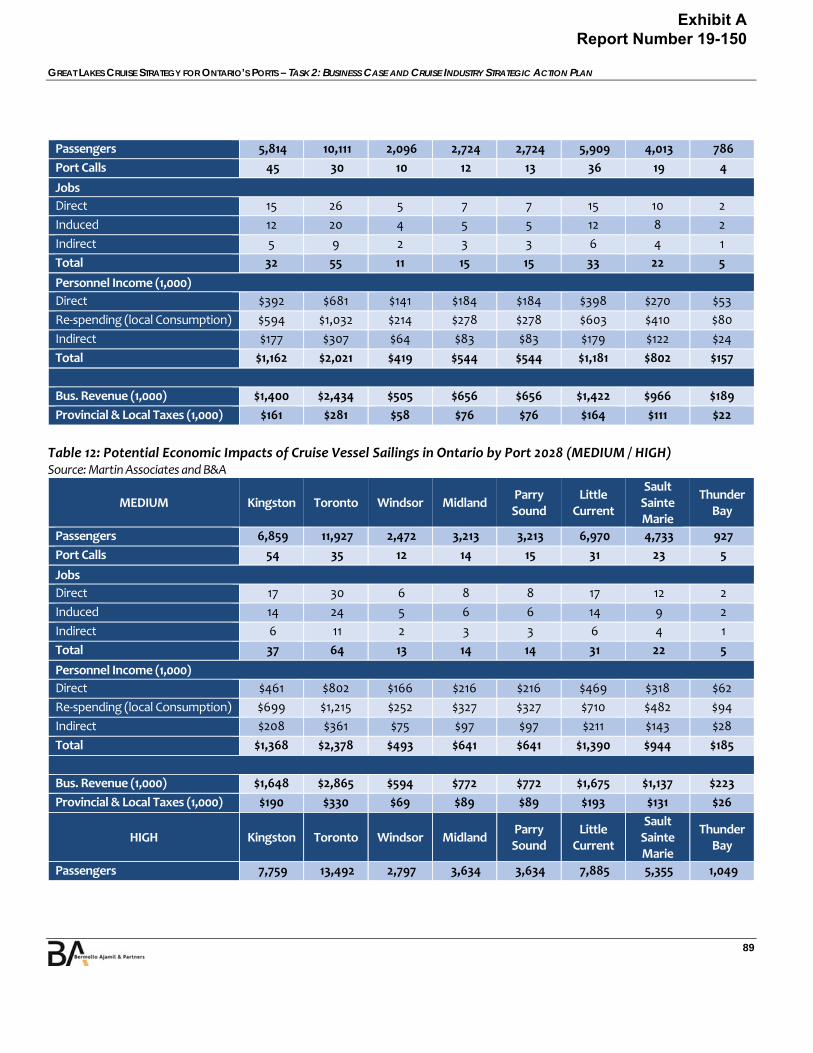
GREAT LAKES CRUISE STRATEGY FOR ONTARIO’S PORTS – TASK 2: BUSINESS CASE AND CRUISE INDUSTRY STRATEGIC ACTION PLAN
89
Passengers 5,814 10,111 2,096 2,724 2,724 5,909 4,013 786
Port Calls 45 30 10 12 13 36 19 4
Jobs
Direct 15 26 5 7 7 15 10 2
Induced 12 20 4 5 5 12 8 2
Indirect 5 9 2 3 3 6 4 1
Total 32 55 11 15 15 33 22 5
Personnel Income (1,000)
Direct $392 $681 $141 $184 $184 $398 $270 $53
Re‐spending (local Consumption) $594 $1,032 $214 $278 $278 $603 $410 $80
Indirect $177 $307 $64 $83 $83 $179 $122 $24
Total $1,162 $2,021 $419 $544 $544 $1,181 $802 $157
Bus. Revenue (1,000) $1,400 $2,434 $505 $656 $656 $1,422 $966 $189
Provincial & Local Taxes (1,000) $161 $281 $58 $76 $76 $164 $111 $22
Table 12: Potential Economic Impacts of Cruise Vessel Sailings in Ontario by Port 2028 (MEDIUM / HIGH) Source: Martin Associates and B&A
MEDIUM Kingston Toronto Windsor Midland Parry Sound
Little Current
Sault Sainte Marie
Thunder Bay
Passengers 6,859 11,927 2,472 3,213 3,213 6,970 4,733 927
Port Calls 54 35 12 14 15 31 23 5
Jobs
Direct 17 30 6 8 8 17 12 2
Induced 14 24 5 6 6 14 9 2
Indirect 6 11 2 3 3 6 4 1
Total 37 64 13 14 14 31 22 5
Personnel Income (1,000)
Direct $461 $802 $166 $216 $216 $469 $318 $62
Re‐spending (local Consumption) $699 $1,215 $252 $327 $327 $710 $482 $94
Indirect $208 $361 $75 $97 $97 $211 $143 $28
Total $1,368 $2,378 $493 $641 $641 $1,390 $944 $185
Bus. Revenue (1,000) $1,648 $2,865 $594 $772 $772 $1,675 $1,137 $223
Provincial & Local Taxes (1,000) $190 $330 $69 $89 $89 $193 $131 $26
HIGH Kingston Toronto Windsor Midland Parry Sound
Little Current
Sault Sainte Marie
Thunder Bay
Passengers 7,759 13,492 2,797 3,634 3,634 7,885 5,355 1,049
Exhibit A Report Number 19-150
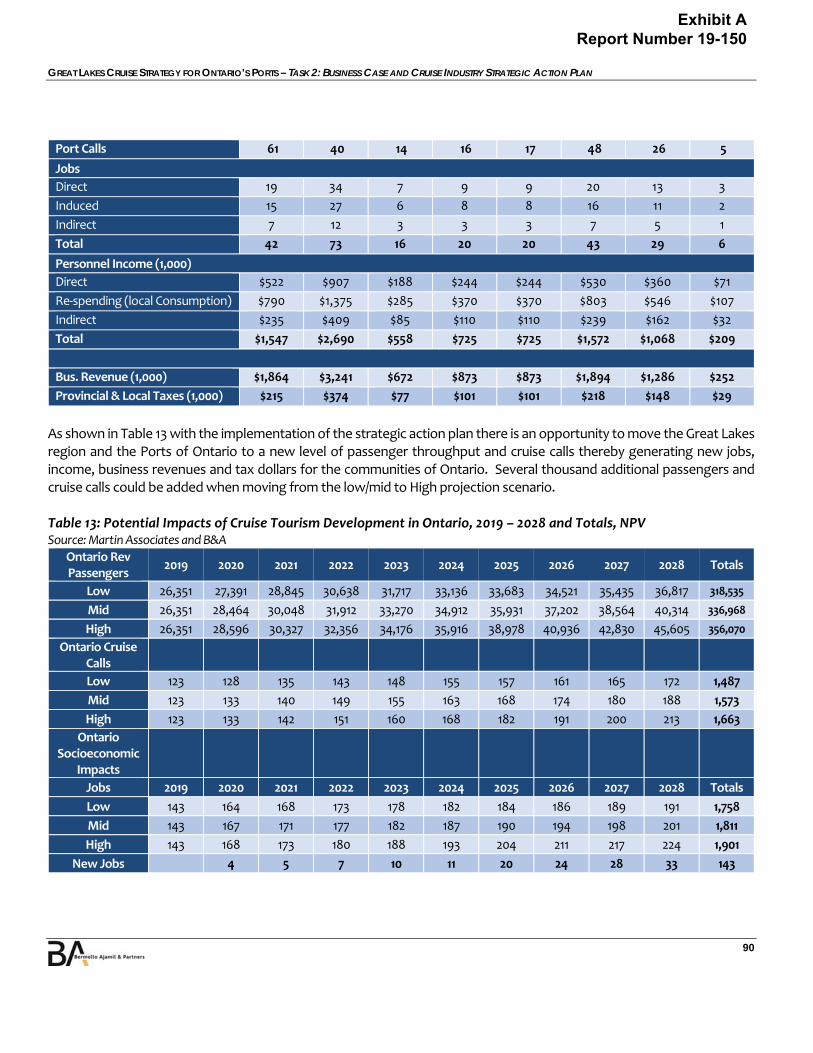
GREAT LAKES CRUISE STRATEGY FOR ONTARIO’S PORTS – TASK 2: BUSINESS CASE AND CRUISE INDUSTRY STRATEGIC ACTION PLAN
90
Port Calls 61 40 14 16 17 48 26 5
Jobs
Direct 19 34 7 9 9 20 13 3
Induced 15 27 6 8 8 16 11 2
Indirect 7 12 3 3 3 7 5 1
Total 42 73 16 20 20 43 29 6
Personnel Income (1,000)
Direct $522 $907 $188 $244 $244 $530 $360 $71
Re‐spending (local Consumption) $790 $1,375 $285 $370 $370 $803 $546 $107
Indirect $235 $409 $85 $110 $110 $239 $162 $32
Total $1,547 $2,690 $558 $725 $725 $1,572 $1,068 $209
Bus. Revenue (1,000) $1,864 $3,241 $672 $873 $873 $1,894 $1,286 $252
Provincial & Local Taxes (1,000) $215 $374 $77 $101 $101 $218 $148 $29
As shown in Table 13 with the implementation of the strategic action plan there is an opportunity to move the Great Lakes region and the Ports of Ontario to a new level of passenger throughput and cruise calls thereby generating new jobs, income, business revenues and tax dollars for the communities of Ontario. Several thousand additional passengers and cruise calls could be added when moving from the low/mid to High projection scenario. Table 13: Potential Impacts of Cruise Tourism Development in Ontario, 2019 – 2028 and Totals, NPV Source: Martin Associates and B&A
Ontario Rev Passengers
2019 2020 2021 2022 2023 2024 2025 2026 2027 2028 Totals
Low 26,351 27,391 28,845 30,638 31,717 33,136 33,683 34,521 35,435 36,817 318,535
Mid 26,351 28,464 30,048 31,912 33,270 34,912 35,931 37,202 38,564 40,314 336,968
High 26,351 28,596 30,327 32,356 34,176 35,916 38,978 40,936 42,830 45,605 356,070
Ontario Cruise Calls
Low 123 128 135 143 148 155 157 161 165 172 1,487
Mid 123 133 140 149 155 163 168 174 180 188 1,573
High 123 133 142 151 160 168 182 191 200 213 1,663
Ontario Socioeconomic
Impacts
Jobs 2019 2020 2021 2022 2023 2024 2025 2026 2027 2028 Totals
Low 143 164 168 173 178 182 184 186 189 191 1,758
Mid 143 167 171 177 182 187 190 194 198 201 1,811
High 143 168 173 180 188 193 204 211 217 224 1,901
New Jobs 4 5 7 10 11 20 24 28 33 143
Exhibit A Report Number 19-150
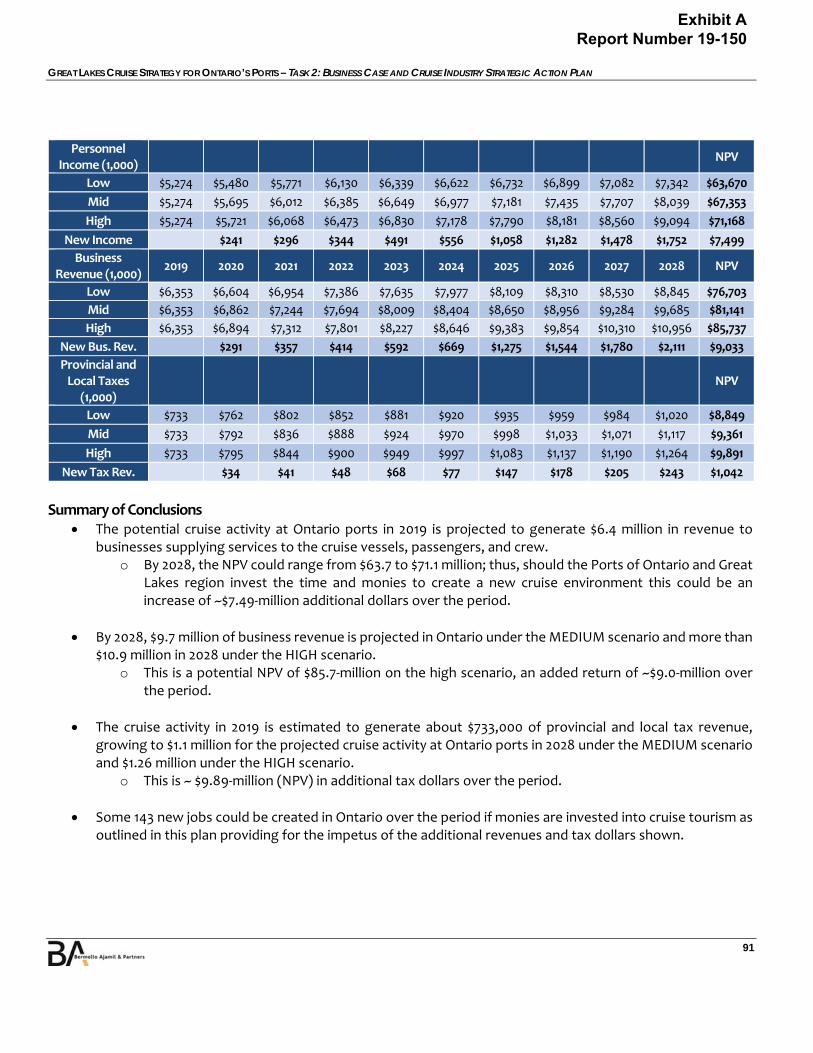
GREAT LAKES CRUISE STRATEGY FOR ONTARIO’S PORTS – TASK 2: BUSINESS CASE AND CRUISE INDUSTRY STRATEGIC ACTION PLAN
91
Personnel Income (1,000)
NPV
Low $5,274 $5,480 $5,771 $6,130 $6,339 $6,622 $6,732 $6,899 $7,082 $7,342 $63,670
Mid $5,274 $5,695 $6,012 $6,385 $6,649 $6,977 $7,181 $7,435 $7,707 $8,039 $67,353
High $5,274 $5,721 $6,068 $6,473 $6,830 $7,178 $7,790 $8,181 $8,560 $9,094 $71,168
New Income $241 $296 $344 $491 $556 $1,058 $1,282 $1,478 $1,752 $7,499
Business Revenue (1,000)
2019 2020 2021 2022 2023 2024 2025 2026 2027 2028 NPV
Low $6,353 $6,604 $6,954 $7,386 $7,635 $7,977 $8,109 $8,310 $8,530 $8,845 $76,703
Mid $6,353 $6,862 $7,244 $7,694 $8,009 $8,404 $8,650 $8,956 $9,284 $9,685 $81,141
High $6,353 $6,894 $7,312 $7,801 $8,227 $8,646 $9,383 $9,854 $10,310 $10,956 $85,737
New Bus. Rev. $291 $357 $414 $592 $669 $1,275 $1,544 $1,780 $2,111 $9,033
Provincial and Local Taxes
(1,000)
NPV
Low $733 $762 $802 $852 $881 $920 $935 $959 $984 $1,020 $8,849
Mid $733 $792 $836 $888 $924 $970 $998 $1,033 $1,071 $1,117 $9,361
High $733 $795 $844 $900 $949 $997 $1,083 $1,137 $1,190 $1,264 $9,891
New Tax Rev. $34 $41 $48 $68 $77 $147 $178 $205 $243 $1,042
Summary of Conclusions The potential cruise activity at Ontario ports in 2019 is projected to generate $6.4 million in revenue to
businesses supplying services to the cruise vessels, passengers, and crew. o By 2028, the NPV could range from $63.7 to $71.1 million; thus, should the Ports of Ontario and Great
Lakes region invest the time and monies to create a new cruise environment this could be an increase of ~$7.49‐million additional dollars over the period.
By 2028, $9.7 million of business revenue is projected in Ontario under the MEDIUM scenario and more than $10.9 million in 2028 under the HIGH scenario.
o This is a potential NPV of $85.7‐million on the high scenario, an added return of ~$9.0‐million over the period.
The cruise activity in 2019 is estimated to generate about $733,000 of provincial and local tax revenue, growing to $1.1 million for the projected cruise activity at Ontario ports in 2028 under the MEDIUM scenario and $1.26 million under the HIGH scenario.
o This is ~ $9.89‐million (NPV) in additional tax dollars over the period.
Some 143 new jobs could be created in Ontario over the period if monies are invested into cruise tourism as outlined in this plan providing for the impetus of the additional revenues and tax dollars shown.
Exhibit A Report Number 19-150
GREAT LAKES CRUISE STRATEGY FOR ONTARIO’S PORTS – TASK 2: BUSINESS CASE AND CRUISE INDUSTRY STRATEGIC ACTION PLAN
92
While the overall cruise passenger throughput and corresponding tax revenues may be small, there is a significant direct benefit for each port and the surrounding communities.
o These jobs, business revenues and income would not be seen without cruise tourism in the small Ports of Ontario. This is an additional piece of tourism income that would not be there otherwise, as through past surveys it is clear that consumers clearly choose to cruise to specific regions, inclusive of the Great Lakes.
There are additional direct revenues available for ports and cities through the implementation of a more uniform tariff system in the region and per port. We are not recommending a wholesale increase in tariffs, but a more tailored system for cruise vessels tied to passenger counts, LOA/GT charges, utilities, etc. that could produce additional revenues over the timeframe.
Exhibit A Report Number 19-150

GREAT LAKES CRUISE STRATEGY FOR ONTARIO’S PORTS – TASK 2: BUSINESS CASE AND CRUISE INDUSTRY STRATEGIC ACTION PLAN
93
5. CRUISE DESIGN VESSEL AND FACILITY REQUIREMENTS
Vessel Characteristics (Small Ships) The controlling maximum dimensions of the Great Lakes Locks are as follows:
222.5m (740‐ft.) Length Overall (LOA)
23.2m (78‐ft.) Beam
8.08m (26.3‐ft.) Sea Draft
35.5m (116.6‐ft.) Air Draft
An additional constraint that currently affects a small but significant number of vessels that are otherwise able to transit the locks is the presence of bridge wings and/or overhanging lifeboats on certain vessels. These features effectively increase the beam of the ship. In so doing, they extend beyond the controlling dimensional envelope of the locks, even if the vessels do not come into contact with any part of the locks during transit. Therefore, vessels with these features are not allowed to transit the locks, due to perceived (if not real) safety concerns and/or risk of damage.10
Apart from the basic maximum dimensional characteristics that necessarily define all vessels, with the potential to operate in the Great Lakes, other characteristics range considerably by brand. Generally speaking, there are four categories of vessels that are capable of offering multiday cruises within the Great Lakes region. These categories are:
Small ships, as the name implies, are essentially more intimate versions of the larger cruise ships that dominate the global industry. They typically include similar amenities as their larger counterparts, but are scaled down as appropriate to meet the needs of each individual operating brand’s target consumer.
Expedition ships are typically more Spartan versions of small ships, and many include features, amenities, and equipment geared specifically to less hospitable environments. For brands operating in the Polar Regions, one or all of their vessels may also be ice‐class. For higher‐end expedition ship brands, more luxurious aspects of cruising (such as spas) are also integrated into the vessel designs.
Yachts tend to be more luxurious, intimate versions of small ships, with more emphasis on exclusive areas and resort‐like activities and amenities.
Sailing ships include high masts and sails, among other more traditional nautical features.
10 At least 5 individual vessels appear to have had these issues with the locks, and there are several additional vessels that could potentially have issues, should they choose to consider future deployments in the Great Lakes.
Exhibit A Report Number 19-150
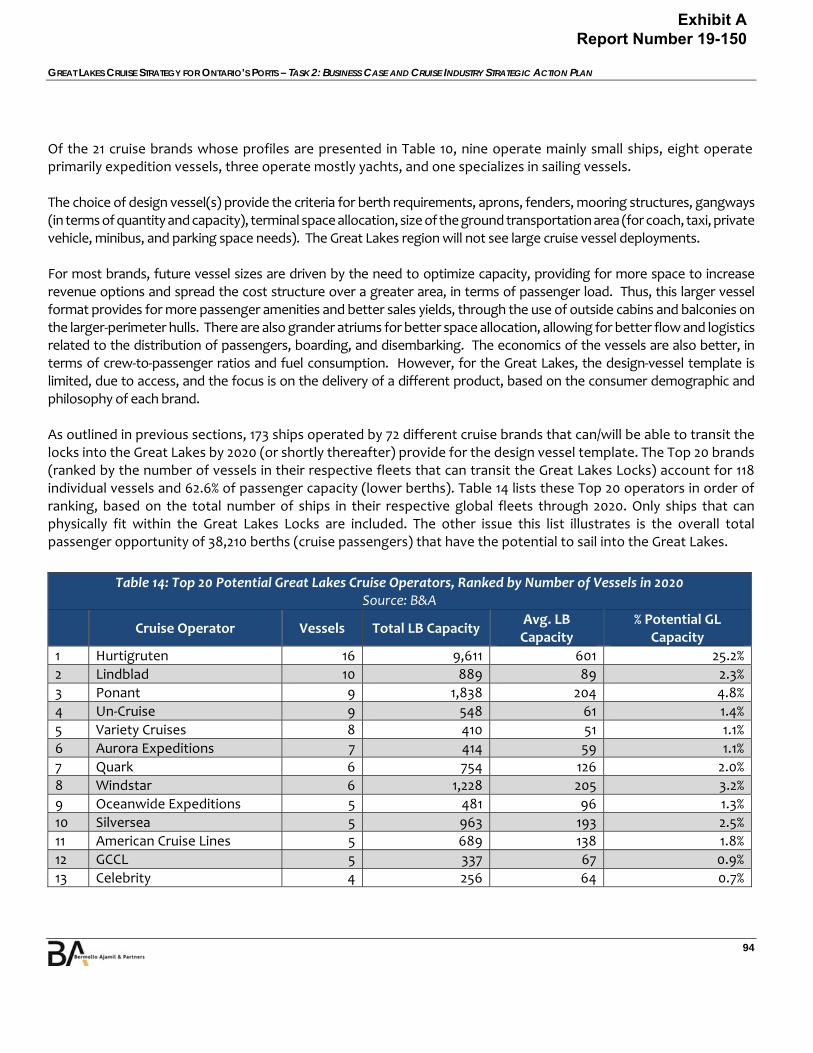
GREAT LAKES CRUISE STRATEGY FOR ONTARIO’S PORTS – TASK 2: BUSINESS CASE AND CRUISE INDUSTRY STRATEGIC ACTION PLAN
94
Of the 21 cruise brands whose profiles are presented in Table 10, nine operate mainly small ships, eight operate primarily expedition vessels, three operate mostly yachts, and one specializes in sailing vessels. The choice of design vessel(s) provide the criteria for berth requirements, aprons, fenders, mooring structures, gangways (in terms of quantity and capacity), terminal space allocation, size of the ground transportation area (for coach, taxi, private vehicle, minibus, and parking space needs). The Great Lakes region will not see large cruise vessel deployments. For most brands, future vessel sizes are driven by the need to optimize capacity, providing for more space to increase revenue options and spread the cost structure over a greater area, in terms of passenger load. Thus, this larger vessel format provides for more passenger amenities and better sales yields, through the use of outside cabins and balconies on the larger‐perimeter hulls. There are also grander atriums for better space allocation, allowing for better flow and logistics related to the distribution of passengers, boarding, and disembarking. The economics of the vessels are also better, in terms of crew‐to‐passenger ratios and fuel consumption. However, for the Great Lakes, the design‐vessel template is limited, due to access, and the focus is on the delivery of a different product, based on the consumer demographic and philosophy of each brand. As outlined in previous sections, 173 ships operated by 72 different cruise brands that can/will be able to transit the locks into the Great Lakes by 2020 (or shortly thereafter) provide for the design vessel template. The Top 20 brands (ranked by the number of vessels in their respective fleets that can transit the Great Lakes Locks) account for 118 individual vessels and 62.6% of passenger capacity (lower berths). Table 14 lists these Top 20 operators in order of ranking, based on the total number of ships in their respective global fleets through 2020. Only ships that can physically fit within the Great Lakes Locks are included. The other issue this list illustrates is the overall total passenger opportunity of 38,210 berths (cruise passengers) that have the potential to sail into the Great Lakes.
Table 14: Top 20 Potential Great Lakes Cruise Operators, Ranked by Number of Vessels in 2020 Source: B&A
Cruise Operator Vessels Total LB Capacity Avg. LB Capacity
% Potential GL Capacity
1 Hurtigruten 16 9,611 601 25.2%
2 Lindblad 10 889 89 2.3%
3 Ponant 9 1,838 204 4.8%
4 Un‐Cruise 9 548 61 1.4%
5 Variety Cruises 8 410 51 1.1%
6 Aurora Expeditions 7 414 59 1.1%
7 Quark 6 754 126 2.0%
8 Windstar 6 1,228 205 3.2%
9 Oceanwide Expeditions 5 481 96 1.3%
10 Silversea 5 963 193 2.5%
11 American Cruise Lines 5 689 138 1.8%
12 GCCL 5 337 67 0.9%
13 Celebrity 4 256 64 0.7%
Exhibit A Report Number 19-150
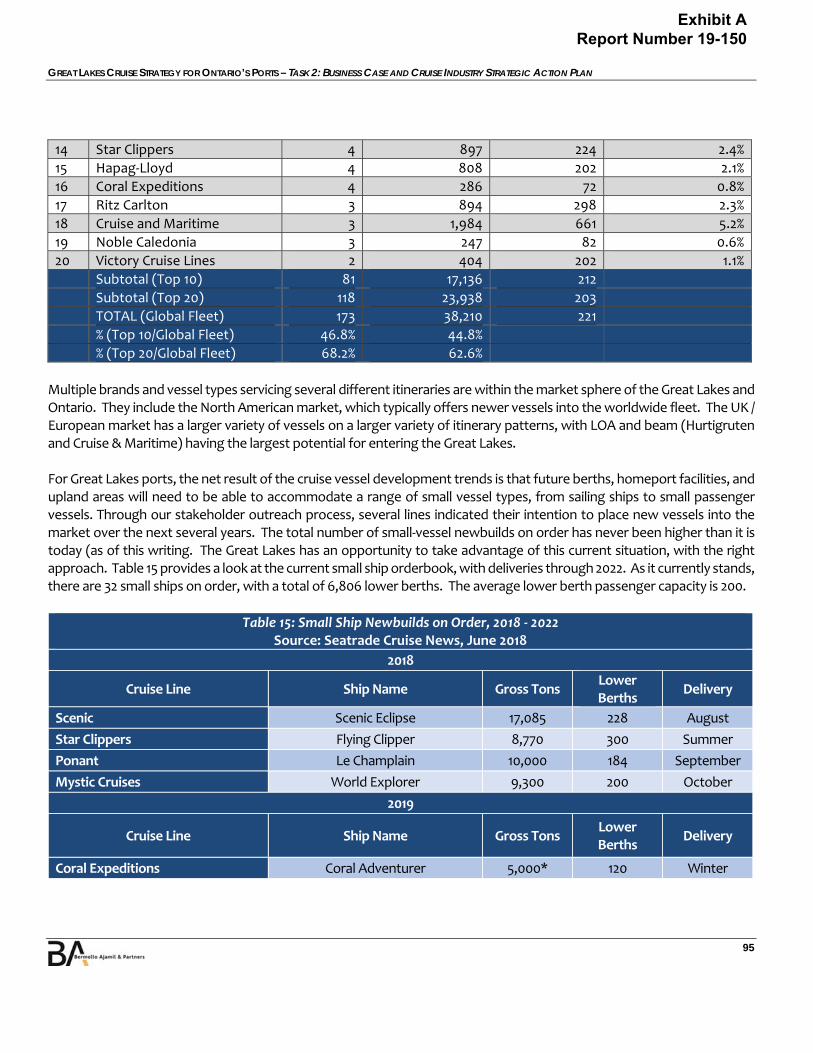
GREAT LAKES CRUISE STRATEGY FOR ONTARIO’S PORTS – TASK 2: BUSINESS CASE AND CRUISE INDUSTRY STRATEGIC ACTION PLAN
95
14 Star Clippers 4 897 224 2.4%
15 Hapag‐Lloyd 4 808 202 2.1%
16 Coral Expeditions 4 286 72 0.8%
17 Ritz Carlton 3 894 298 2.3%
18 Cruise and Maritime 3 1,984 661 5.2%
19 Noble Caledonia 3 247 82 0.6%
20 Victory Cruise Lines 2 404 202 1.1% Subtotal (Top 10) 81 17,136 212
Subtotal (Top 20) 118 23,938 203
TOTAL (Global Fleet) 173 38,210 221
% (Top 10/Global Fleet) 46.8% 44.8%
% (Top 20/Global Fleet) 68.2% 62.6%
Multiple brands and vessel types servicing several different itineraries are within the market sphere of the Great Lakes and Ontario. They include the North American market, which typically offers newer vessels into the worldwide fleet. The UK / European market has a larger variety of vessels on a larger variety of itinerary patterns, with LOA and beam (Hurtigruten and Cruise & Maritime) having the largest potential for entering the Great Lakes. For Great Lakes ports, the net result of the cruise vessel development trends is that future berths, homeport facilities, and upland areas will need to be able to accommodate a range of small vessel types, from sailing ships to small passenger vessels. Through our stakeholder outreach process, several lines indicated their intention to place new vessels into the market over the next several years. The total number of small‐vessel newbuilds on order has never been higher than it is today (as of this writing. The Great Lakes has an opportunity to take advantage of this current situation, with the right approach. Table 15 provides a look at the current small ship orderbook, with deliveries through 2022. As it currently stands, there are 32 small ships on order, with a total of 6,806 lower berths. The average lower berth passenger capacity is 200.
Table 15: Small Ship Newbuilds on Order, 2018 ‐ 2022 Source: Seatrade Cruise News, June 2018
2018
Cruise Line Ship Name Gross Tons Lower Berths
Delivery
Scenic Scenic Eclipse 17,085 228 August
Star Clippers Flying Clipper 8,770 300 Summer
Ponant Le Champlain 10,000 184 September
Mystic Cruises World Explorer 9,300 200 October
2019
Cruise Line Ship Name Gross Tons Lower Berths
Delivery
Coral Expeditions Coral Adventurer 5,000* 120 Winter
Exhibit A Report Number 19-150
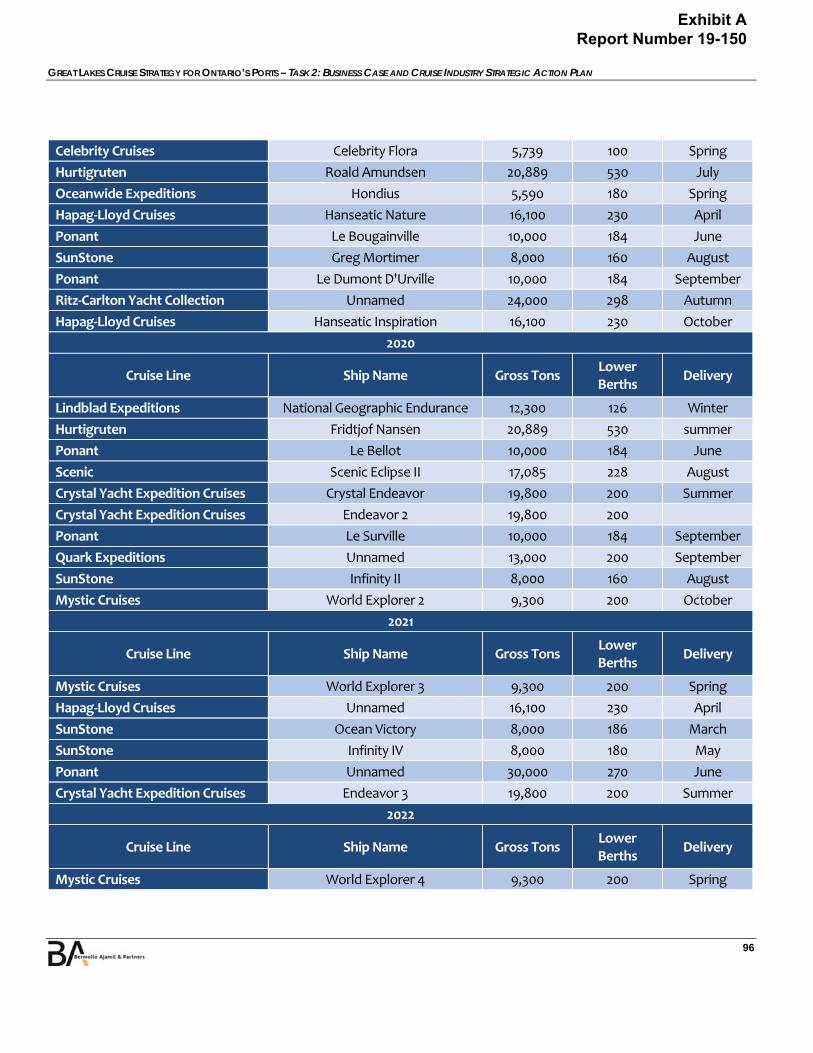
GREAT LAKES CRUISE STRATEGY FOR ONTARIO’S PORTS – TASK 2: BUSINESS CASE AND CRUISE INDUSTRY STRATEGIC ACTION PLAN
96
Celebrity Cruises Celebrity Flora 5,739 100 Spring
Hurtigruten Roald Amundsen 20,889 530 July
Oceanwide Expeditions Hondius 5,590 180 Spring
Hapag‐Lloyd Cruises Hanseatic Nature 16,100 230 April
Ponant Le Bougainville 10,000 184 June
SunStone Greg Mortimer 8,000 160 August
Ponant Le Dumont D'Urville 10,000 184 September
Ritz‐Carlton Yacht Collection Unnamed 24,000 298 Autumn
Hapag‐Lloyd Cruises Hanseatic Inspiration 16,100 230 October
2020
Cruise Line Ship Name Gross Tons Lower Berths
Delivery
Lindblad Expeditions National Geographic Endurance 12,300 126 Winter
Hurtigruten Fridtjof Nansen 20,889 530 summer
Ponant Le Bellot 10,000 184 June
Scenic Scenic Eclipse II 17,085 228 August
Crystal Yacht Expedition Cruises Crystal Endeavor 19,800 200 Summer
Crystal Yacht Expedition Cruises Endeavor 2 19,800 200
Ponant Le Surville 10,000 184 September
Quark Expeditions Unnamed 13,000 200 September
SunStone Infinity II 8,000 160 August
Mystic Cruises World Explorer 2 9,300 200 October
2021
Cruise Line Ship Name Gross Tons Lower Berths
Delivery
Mystic Cruises World Explorer 3 9,300 200 Spring
Hapag‐Lloyd Cruises Unnamed 16,100 230 April
SunStone Ocean Victory 8,000 186 March
SunStone Infinity IV 8,000 180 May
Ponant Unnamed 30,000 270 June
Crystal Yacht Expedition Cruises Endeavor 3 19,800 200 Summer
2022
Cruise Line Ship Name Gross Tons Lower Berths
Delivery
Mystic Cruises World Explorer 4 9,300 200 Spring
Exhibit A Report Number 19-150

GREAT LAKES CRUISE STRATEGY FOR ONTARIO’S PORTS – TASK 2: BUSINESS CASE AND CRUISE INDUSTRY STRATEGIC ACTION PLAN
97
The largest vessels that have the ability to fit into the Great Lakes are Hurtigruten’s 2 vessels, at 530‐lower berths each. They are likely intended for the Norwegian Fjords routes (20,889‐T.), and Celebrity Cruises Celebrity Flora has 100‐passengers, with a likely deployment to the Galapagos Islands. Therefore, the design vessels for the ports in the Great Lakes should be drawn from this field. The most likely design vessel is the actual dimensions for a ship to fit into the Great Lakes. Table 16 illustrates the vessel statistics for current key cruise vessels in the Great Lakes, and those anticipated in the short‐ to mid‐term. Table 16: Current and Future Great Lakes Vessel Range
Vessel Length Overall (m) Beam (m) Sea Draft (m) Tons Pass. Capacity
Victory I and II 87.2 15.2 4.1 4,954 202
Pearl Mist 99.1 16.8 4.2 5,109 210
Hamburg 143.9 21.5 4.9 15,067 420
Le Champlain 131 18 4.5 9,900 184
Ritz Carlton I 190.2 TBD TBD 26,500 298
This chart provides for a mid to high range of design vessel template for the Great Lakes and the Ports of Ontario. See the design vessel template (Table 17) for the Great Lakes ports, including Ontario Study. Table 17: Design Vessel Template
Attribute Minimum Maximum
Length Overall 87.2 m. 222.5 m.
Beam 15.2 m. 23.2 m.
Sea Draft 4.1 m. 8.08 m.
Air Draft 35.5 m.
Tonnage ~ 30,000
Lower Berth Passenger Capacity ~ 184 ~ 500
Crew Capacity ~ 50 ~ 200
There may be slight variations to accommodate smaller vessels with unique features, such as sailing masts and door configurations, but the ports should have the ability to accommodate the vessels that can fit into the region. The ability for each port to accommodate the design vessel minimum is a key factor in the Great Lakes’ ability to serve as a primary regional market in the mid‐ to long‐term. Additionally, the ports should also recognize the potential opportunity of both the larger ocean calling (on a one‐ or two‐call seasonal basis) and small coastal and river‐type cruising vessels, which may be locally based or run along the St. Lawrence Seaway. The latter is an expanding business model, and may provide for substantial new cruise options in the Great Lakes in the long‐term.
Exhibit A Report Number 19-150
GREAT LAKES CRUISE STRATEGY FOR ONTARIO’S PORTS – TASK 2: BUSINESS CASE AND CRUISE INDUSTRY STRATEGIC ACTION PLAN
98
Cruise Facilities and Upland Requirements There are a number of critical programmatic requirements for cruise facilities to meet the needs of the cruise lines, including:
Vessel safety & security and servicing
Passenger reception and comfort
Allowance for the ability of the destination to enhance its ability to secure socioeconomic benefits from the tourism visit (passengers and crew)
Provisions for potential land‐based stay options.
There is a difference in providing for infrastructure for small vessels (50 – 600 passengers), v. large cruise vessels (1,000 – 7,000), and in terms of overall space, operational processes, and access. Today, the Ontario ports are utilizing existing berths and upland spaces to make accommodations for cruise vessel calls. Based on the anticipated call / passenger throughput over the next 10‐year period, there is likely a limited investment required in any of the port facilities, with the exceptions of Kingston (which has a mixed‐use PPP) and Toronto / Midland (PPP developments for homeport / port‐of‐call options). Each of these throughputs can be right‐sized, based on the design vessel, demand, and layout information provided below:
Shoreside facilities: Pedestrian and vehicular access, traffic control, and maintenance
Homeport embarkation: Ground transportation area (GTA), check‐in, waiting area, passenger security, and boarding
Homeport disembarkation: Immigration, baggage areas, customs, and ground transportation area
Marine operations: Gangway & apron operations, service & storing vehicles, shell door operations
Ground transportation: Curbside requirements (including coaches and taxis, POV, vehicle‐marshalling, operations, and parking)
Security: Approved security plans and standards for port operations established in the International Ship and Port Facility Security (ISPS) Code of the International Maritime Organization (IMO).
Based on the design‐vessel templates shown above, the Great Lake’s berths will need to accommodate the largest vessel shown in the long term. Key factors are:
General Marine o Apron: 10 ‐ 15 m. wide (Many of the vessels berth on finger piers with set widths. Security perimeters are set,
and the apron provides adequate space for passenger movement and vessel servicing.) o Pier: 2 ‐ 10 ton bollards (A mooring analysis could be completed for each berth, to ensure proper bollard types
and placement, but based on the existing conditions and design‐vessel template, it is unlikely that a requirement should be addressed by the individual port and cruise line, when a vessel berthing reservation is made.)
o Utilities – Provisions for potable freshwater intake at all ports is a requirement. In addition, ports should consider offloading and acceptance of garbage and greywater. Bunkering is a priority for homeport operations, unless there is a downstream port with better access.
Exhibit A Report Number 19-150

GREAT LAKES CRUISE STRATEGY FOR ONTARIO’S PORTS – TASK 2: BUSINESS CASE AND CRUISE INDUSTRY STRATEGIC ACTION PLAN
99
o Telecommunications – Internet connectivity with any homeport / POC reception facility and outside spaces is a plus for passenger and crew use.
o Adequate maneuvering (includes distance within any entry channel), with a turning basin of 1.2 times length of vessel overall (LOA).
Gangway(s) o A single workable system per vessel is the minimum acceptable requirement. A secondary gangway for crew
/ storing & servicing is preferred in POC locations. For homeport operations, a minimum of 2 gangways is desirable. For small ships, the gangways are on the apron level, and provided by the ship.
Berth Options/Utilization o 1 berth per port (min. 100.0 meters) today, and in some key ports, the ability to accommodate the maximum
design vessel template (222.5‐m.), plus 10 meters fore and aft for lines & bollards o Ports such as Toronto & Midland (homeport / POC mix) and Kingston may occasionally have two vessel calls
on peak days. With the current and projected traffic forecast, it is not seen as an investment requirement for a second berth. It is best if this situation is handled during the berth reservation process (first come‐first served), or if a secondary berth is available in a port that can be used then, which may be an option.
Ontario Port Operations (Market Advantage) o Homeport and Port of Call market – primary small / mid‐size exploration / adventure NA luxury brands;
Secondary – major European small ship exploration / luxury brands; and, tertiary market – expansion of small vessel zodiac exploration vessels and river‐type cruise vessels.
Operational Requirements Basis o Homeport: 200 passenger and peak of 500 passengers o POC Baseline: 200 passengers and peak of 500 passengers
Daily Operational Vehicle Loads o All modes of transportation should be separated on entry to the site(s) – even for small vessel operations to
allow for ease of movement and passenger identification of transport options (such as shore excursions, and independent vehicles).
o Homeport Passenger Parking – highly limited, based on current market (may use limited lot of 10 – 20 spaces). o Coaches/Tour Vehicle Alternatives/Shuttles: range from approx. 2 – 8 coaches. Slots for 2 – 6 total per berth
(which are active loading spaces, and not used for parking) o Taxis / Limousine/ Ride Share: Capacity is very dependent on brand and cruise type. There is a need for an
active curbside area (approximately 10 ‐ 15 meters) o Private Vehicles (POV): Capacity is very dependent on brand and cruise type, included in the overall active
curbside area o Storing trucks: Range from 2 – 4 per vessel call is dependent on vessel capacity / itinerary pattern and brand.
This range can include onsite or an offsite marshalling / inspection facility, based on physical facility layout, o Service, terminal employee, staff vehicles: An offsite parking area of 10 to 20 spaces could be used as an
alternative, due to space limitations at most port areas visited.
Exhibit A Report Number 19-150

GREAT LAKES CRUISE STRATEGY FOR ONTARIO’S PORTS – TASK 2: BUSINESS CASE AND CRUISE INDUSTRY STRATEGIC ACTION PLAN
100
As part of the site visits to the individual Ontario Ports Table 18 illustrates whether or not the port meets the general guidelines for small vessel cruise facility and upland requirements as shown above. Table 18: Ontario Port Cruise Facility and Upland Requirements
Item Toronto Kingston Midland Windsor Parry Sound
Little Current
Thunder Bay
Pier length X Need X X X X X
Apron width X Need X X X X X
Bollards / Fenders X Need X X X X X
Utilities – water, sewer, garbage, bunkering, telecom.
X Need X X X X X
Manuevering area X Need X X X X X
Entry Channel (draft) X Need X X X Need X
Gangways (port)
Secondary berth X Need X X X
GTA X X X X X X X
Access (via road/walk) X X X X X X X
Welcome Center X X X X
ISPS security plan X X X X X X X
Port service personnel X X X X X X X
Tourism options X X X X X X X
Homeport Facility Components Figure 23 provides an illustration of the primary cruise terminal homeport requirements. Today, terminals are integrated facilities, and can be a part of an overall waterfront development. The design should reduce traffic impacts to the roadway systems and surroundings. In the case of Toronto / Midland, design may be a critical factor, due to the small, centralized waterfront areas. Toronto’s current cruise homeport facility provides for all of the necessary elements for operations. The facility can also be a homeport or port‐of‐call. For Midland, this usage may be more difficult, due to the land constraint issues surrounding the downtown cruise Berth, but there is a substantial Greenfield site that could provide for terminal / berth expansion. It a substantial cost to add a cruise terminal for homeporting that may be used on a very limited basis. Thunder Bay also provides for a homeport option for Victory Cruises, and has an air/hotel/transport/berth combination that can deliver the necessary product. In each case, understanding the total development package (including all the elements in a PPP development) will provide for a vision moving forward. For the most part, the small cruise lines do not have a uniform concept of terminal design, and many times, people within the same cruise line have different opinions. In addition, the security design of the facility will be dependent on the port
Exhibit A Report Number 19-150
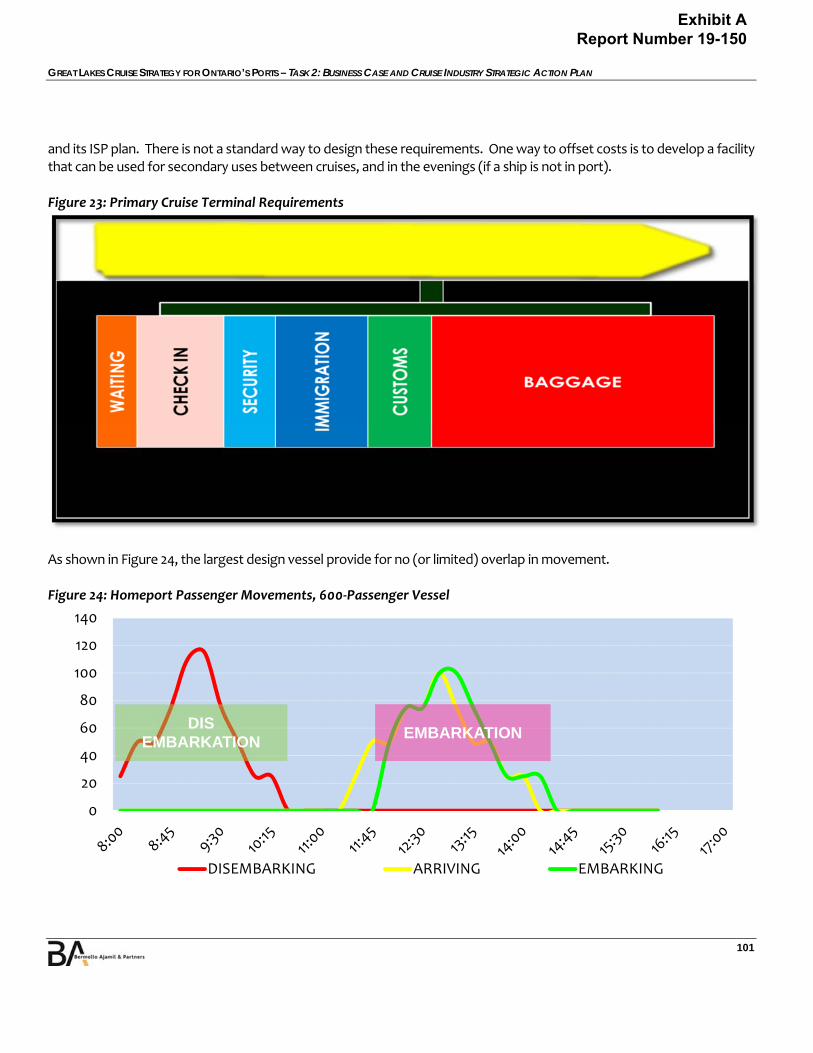
GREAT LAKES CRUISE STRATEGY FOR ONTARIO’S PORTS – TASK 2: BUSINESS CASE AND CRUISE INDUSTRY STRATEGIC ACTION PLAN
101
and its ISP plan. There is not a standard way to design these requirements. One way to offset costs is to develop a facility that can be used for secondary uses between cruises, and in the evenings (if a ship is not in port). Figure 23: Primary Cruise Terminal Requirements
As shown in Figure 24, the largest design vessel provide for no (or limited) overlap in movement. Figure 24: Homeport Passenger Movements, 600‐Passenger Vessel
0
20
40
60
80
100
120
140
DISEMBARKING ARRIVING EMBARKING
EMBARKATION DIS
EMBARKATION
Exhibit A Report Number 19-150

GREAT LAKES CRUISE STRATEGY FOR ONTARIO’S PORTS – TASK 2: BUSINESS CASE AND CRUISE INDUSTRY STRATEGIC ACTION PLAN
102
Meanwhile, design and performance standards should be used to develop a facility that meets the needs and expectations of the cruise passenger, and provides for a low operational cost overall (for the port and cruise line). Critical design issues for the small‐ship cruise facility would be as follows:
Segregate embarkation from disembarkation passenger flows
Segregate modes of transportation o Buses o Private vehicles o For‐hire vehicles (taxis, limousines, and rideshare)
Provide for the latest security requirements, internationally and locally o Total check of passengers, luggage, and provisions o Provide for operational flexibility (based on vessel size) o All‐terminal security cordon o Partial‐terminal security cordon o Boarding‐ramp security cordon o Improved / mixed‐use functionality o Minimal queuing
Linkages for passenger processing o Luggage‐handling o Collect luggage at point or on arrival o Deliver luggage to central screening o Reduce labor costs o Provide express lanes for self‐service passengers
Integrate the terminal into the waterfront o Invite the non‐traveling public to experience the cruise lines / waterfront area o Invite passengers to move outside to the water’s edge o Provide for the support of secondary uses
Port‐of‐Call Options A port‐of‐call cruise facility is not just about a pier or dock. It is about delivering the destination to the cruise visitor. There is a lot of competition in the tourism industry for the consumer. Therefore, ports that can differentiate themselves from others, regionally and worldwide, have a distinct advantage long‐term. Key factors make a port of call successful, including the ambience, the welcome, the comfort level, and the opportunities provided at the destination. Figure 25 illustrates the typical port‐of‐call passenger movement of a small 200‐passenger cruise vessel.
Exhibit A Report Number 19-150
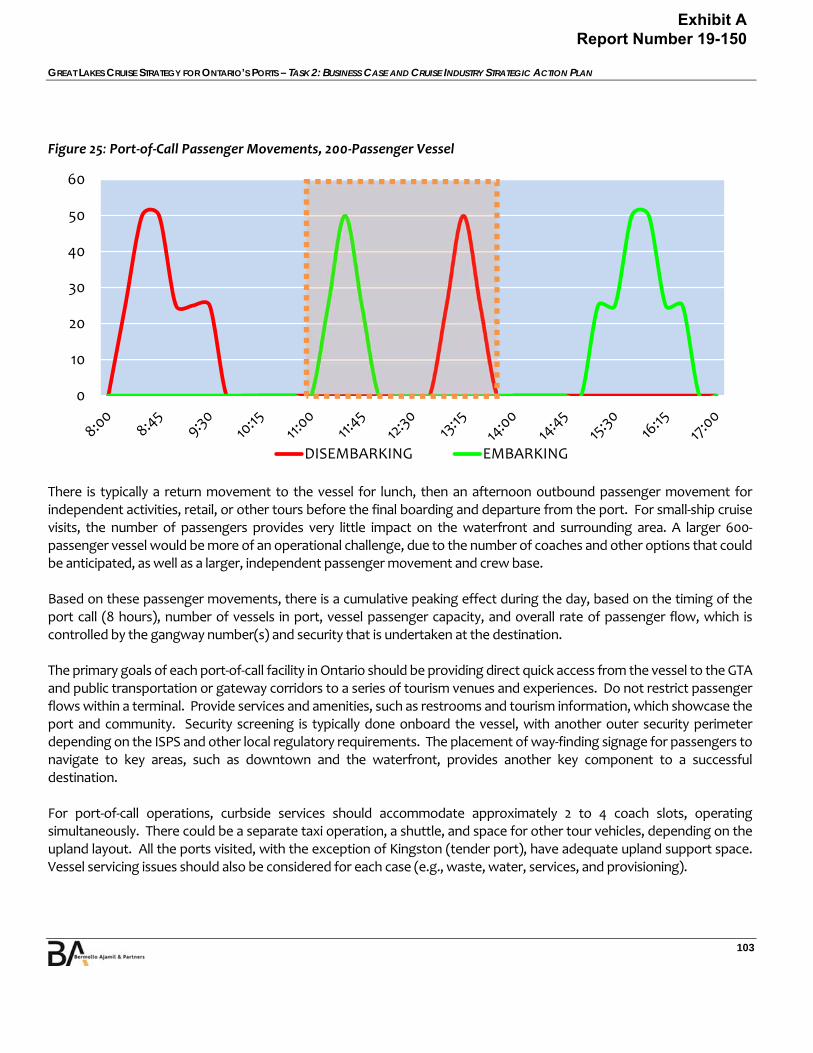
GREAT LAKES CRUISE STRATEGY FOR ONTARIO’S PORTS – TASK 2: BUSINESS CASE AND CRUISE INDUSTRY STRATEGIC ACTION PLAN
103
Figure 25: Port‐of‐Call Passenger Movements, 200‐Passenger Vessel
There is typically a return movement to the vessel for lunch, then an afternoon outbound passenger movement for independent activities, retail, or other tours before the final boarding and departure from the port. For small‐ship cruise visits, the number of passengers provides very little impact on the waterfront and surrounding area. A larger 600‐passenger vessel would be more of an operational challenge, due to the number of coaches and other options that could be anticipated, as well as a larger, independent passenger movement and crew base. Based on these passenger movements, there is a cumulative peaking effect during the day, based on the timing of the port call (8 hours), number of vessels in port, vessel passenger capacity, and overall rate of passenger flow, which is controlled by the gangway number(s) and security that is undertaken at the destination. The primary goals of each port‐of‐call facility in Ontario should be providing direct quick access from the vessel to the GTA and public transportation or gateway corridors to a series of tourism venues and experiences. Do not restrict passenger flows within a terminal. Provide services and amenities, such as restrooms and tourism information, which showcase the port and community. Security screening is typically done onboard the vessel, with another outer security perimeter depending on the ISPS and other local regulatory requirements. The placement of way‐finding signage for passengers to navigate to key areas, such as downtown and the waterfront, provides another key component to a successful destination. For port‐of‐call operations, curbside services should accommodate approximately 2 to 4 coach slots, operating simultaneously. There could be a separate taxi operation, a shuttle, and space for other tour vehicles, depending on the upland layout. All the ports visited, with the exception of Kingston (tender port), have adequate upland support space. Vessel servicing issues should also be considered for each case (e.g., waste, water, services, and provisioning).
0
10
20
30
40
50
60
DISEMBARKING EMBARKING
Exhibit A Report Number 19-150
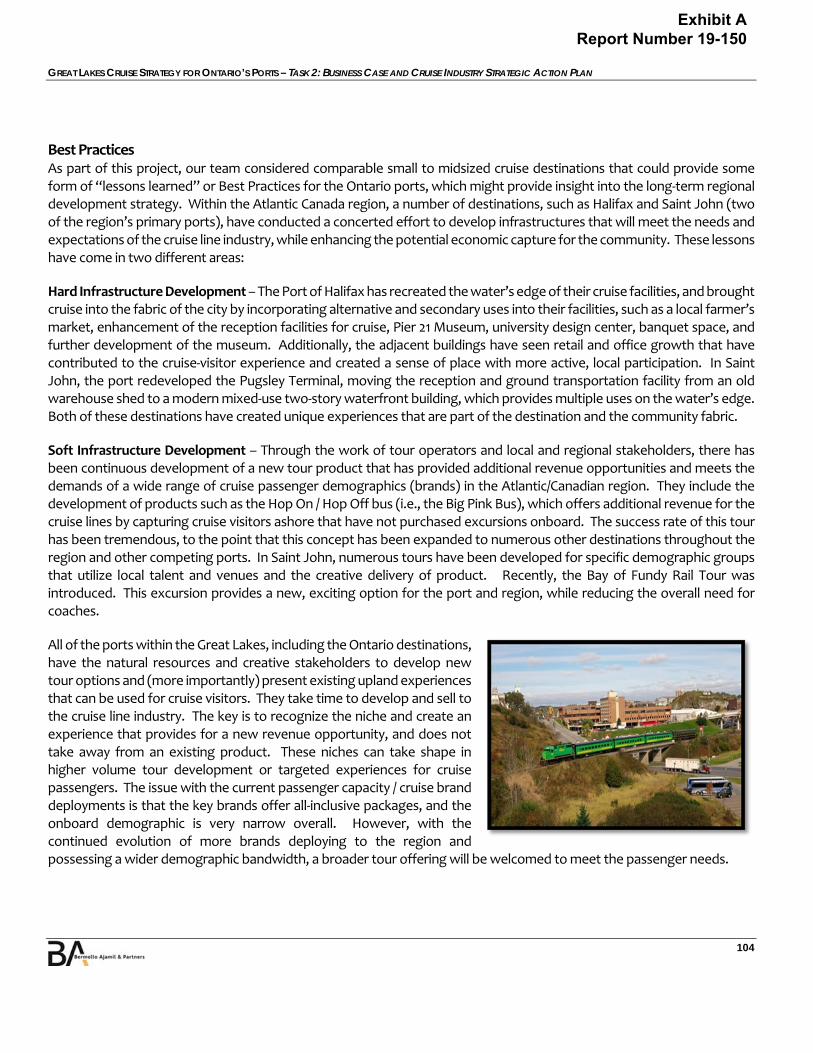
GREAT LAKES CRUISE STRATEGY FOR ONTARIO’S PORTS – TASK 2: BUSINESS CASE AND CRUISE INDUSTRY STRATEGIC ACTION PLAN
104
Best Practices As part of this project, our team considered comparable small to midsized cruise destinations that could provide some form of “lessons learned” or Best Practices for the Ontario ports, which might provide insight into the long‐term regional development strategy. Within the Atlantic Canada region, a number of destinations, such as Halifax and Saint John (two of the region’s primary ports), have conducted a concerted effort to develop infrastructures that will meet the needs and expectations of the cruise line industry, while enhancing the potential economic capture for the community. These lessons have come in two different areas:
Hard Infrastructure Development – The Port of Halifax has recreated the water’s edge of their cruise facilities, and brought cruise into the fabric of the city by incorporating alternative and secondary uses into their facilities, such as a local farmer’s market, enhancement of the reception facilities for cruise, Pier 21 Museum, university design center, banquet space, and further development of the museum. Additionally, the adjacent buildings have seen retail and office growth that have contributed to the cruise‐visitor experience and created a sense of place with more active, local participation. In Saint John, the port redeveloped the Pugsley Terminal, moving the reception and ground transportation facility from an old warehouse shed to a modern mixed‐use two‐story waterfront building, which provides multiple uses on the water’s edge. Both of these destinations have created unique experiences that are part of the destination and the community fabric.
Soft Infrastructure Development – Through the work of tour operators and local and regional stakeholders, there has been continuous development of a new tour product that has provided additional revenue opportunities and meets the demands of a wide range of cruise passenger demographics (brands) in the Atlantic/Canadian region. They include the development of products such as the Hop On / Hop Off bus (i.e., the Big Pink Bus), which offers additional revenue for the cruise lines by capturing cruise visitors ashore that have not purchased excursions onboard. The success rate of this tour has been tremendous, to the point that this concept has been expanded to numerous other destinations throughout the region and other competing ports. In Saint John, numerous tours have been developed for specific demographic groups that utilize local talent and venues and the creative delivery of product. Recently, the Bay of Fundy Rail Tour was introduced. This excursion provides a new, exciting option for the port and region, while reducing the overall need for coaches.
All of the ports within the Great Lakes, including the Ontario destinations, have the natural resources and creative stakeholders to develop new tour options and (more importantly) present existing upland experiences that can be used for cruise visitors. They take time to develop and sell to the cruise line industry. The key is to recognize the niche and create an experience that provides for a new revenue opportunity, and does not take away from an existing product. These niches can take shape in higher volume tour development or targeted experiences for cruise passengers. The issue with the current passenger capacity / cruise brand deployments is that the key brands offer all‐inclusive packages, and the onboard demographic is very narrow overall. However, with the continued evolution of more brands deploying to the region and possessing a wider demographic bandwidth, a broader tour offering will be welcomed to meet the passenger needs.
Exhibit A Report Number 19-150
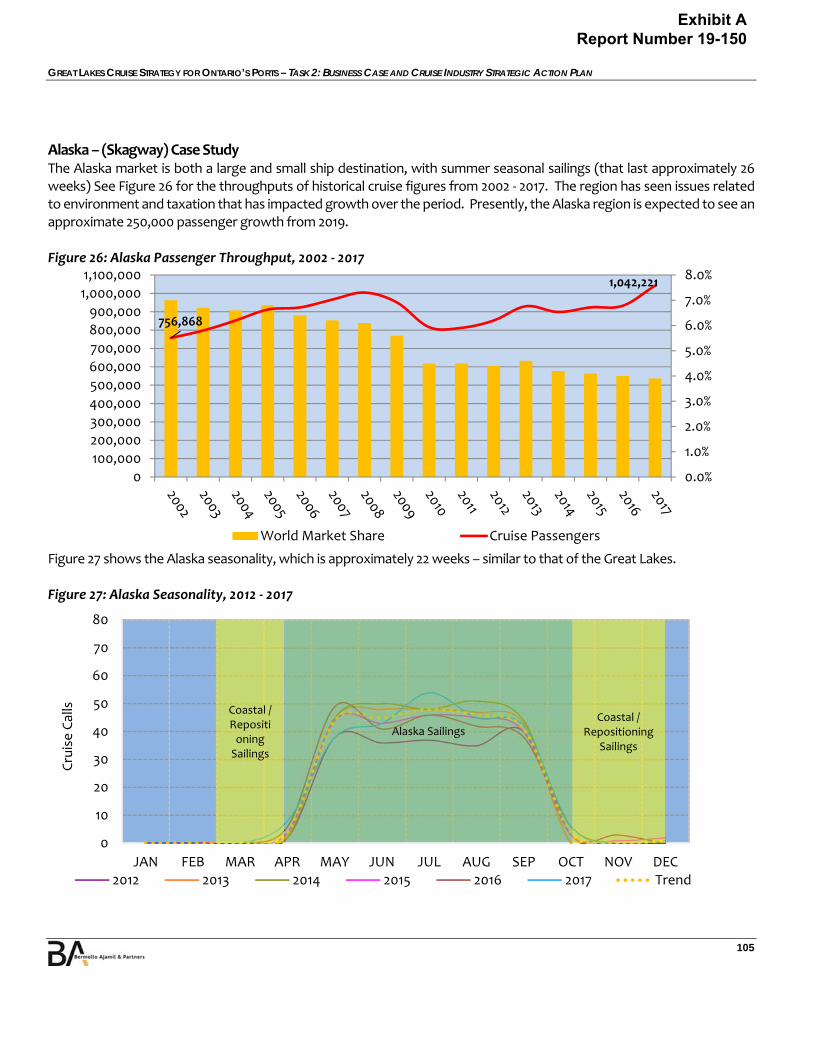
GREAT LAKES CRUISE STRATEGY FOR ONTARIO’S PORTS – TASK 2: BUSINESS CASE AND CRUISE INDUSTRY STRATEGIC ACTION PLAN
105
Alaska – (Skagway) Case Study The Alaska market is both a large and small ship destination, with summer seasonal sailings (that last approximately 26 weeks) See Figure 26 for the throughputs of historical cruise figures from 2002 ‐ 2017. The region has seen issues related to environment and taxation that has impacted growth over the period. Presently, the Alaska region is expected to see an approximate 250,000 passenger growth from 2019. Figure 26: Alaska Passenger Throughput, 2002 ‐ 2017
Figure 27 shows the Alaska seasonality, which is approximately 22 weeks – similar to that of the Great Lakes. Figure 27: Alaska Seasonality, 2012 ‐ 2017
756,868
1,042,221
0.0%
1.0%
2.0%
3.0%
4.0%
5.0%
6.0%
7.0%
8.0%
0
100,000
200,000
300,000
400,000
500,000
600,000
700,000
800,000
900,000
1,000,000
1,100,000
World Market Share Cruise Passengers
0
10
20
30
40
50
60
70
80
JAN FEB MAR APR MAY JUN JUL AUG SEP OCT NOV DEC
Cruise Calls
2012 2013 2014 2015 2016 2017 Trend
Coastal / Repositioning Sailings
Alaska Sailings Coastal /
Repositioning Sailings
Exhibit A Report Number 19-150

GREAT LAKES CRUISE STRATEGY FOR ONTARIO’S PORTS – TASK 2: BUSINESS CASE AND CRUISE INDUSTRY STRATEGIC ACTION PLAN
106
The seasonality of the Alaskan market is similar to that of the Great Lakes, due to the northern climate of both locations. However, while Alaska has a limiting glass ceiling, it also creates large economic impacts and revenues for the communities. Thus, new berths and upland projects supporting tourism can be undertaken with revenues produced. The Great Lakes is not in the same position.
Alaskan Small‐Ship Adventure Market, 2017 In 2017, there were 5 primary brands with 17 small ships sailing in the Alaskan market, with an average of 64 passengers per vessel on 234 cruises. In 2017, the whole of the small‐ship market provided for a lower berth capacity of 14,973 (less than 1.5% of the total Alaskan cruise capacity). Table 19 provides an overview of the small ship fleet in Alaska for 2017.
Table 19: Alaska Small Ship Fleet, 2017
Exhibit A Report Number 19-150

GREAT LAKES CRUISE STRATEGY FOR ONTARIO’S PORTS – TASK 2: BUSINESS CASE AND CRUISE INDUSTRY STRATEGIC ACTION PLAN
107
These statistics are on par with the anticipated Great Lakes market, which is part of the projection modelling. As with Alaska, the small‐ship market is only a small part of the bigger tourism market in Alaska overall, with the main difference being that the Great Lakes cannot accommodate the large cruise vessels that Alaska also gets, due to limited access. However, this market is a portion of the overall land‐based tourism basket. The City of Skagway is one of the smallest cities that caters to the cruise lines in Alaska and perhaps the world, in terms of overall population of less than 1,000 year round residents. However, it has become a primary port‐of‐call that offers numerous shore excursions that are operated by motor‐coach, soft‐adventure, walking, air, boat, horse, bike, and train, amongst other options. Skagway is one of the Big 3 ports in the Alaskan itinerary pattern that also features Juneau and Ketchikan. Over the course of more than 30 years, the region and these communities have continued to develop the cruise industry, which provides a strong economic impact to each community in Southeast Alaska.
The initial development of the White Pass and Scenic Railway excursion is at the core of the tourism growth for Skagway. In 1983, White Pass announced that it would cease operations. At the same time, Skagway landed the Alaska Visitors Association convention and saw an immediate increase in the number of cruise ships docking to more than 100. In 1984, a dock deal was reached between the city, state, and White Pass to improve dock facilities and allow more cruise ships. The total number of visitors to Skagway topped 200,000 in 1985. See Figure 28 for the cruise passenger throughput for the Port of Skagway from 1996 – 2016.
Figure 28: Skagway Cruise Passenger Throughput, 1996 ‐ 2016 Source: B&A
268,443
815,778
0
100,000
200,000
300,000
400,000
500,000
600,000
700,000
800,000
900,000
Pas
sengers
Exhibit A Report Number 19-150

GREAT LAKES CRUISE STRATEGY FOR ONTARIO’S PORTS – TASK 2: BUSINESS CASE AND CRUISE INDUSTRY STRATEGIC ACTION PLAN
108
In 1988, White Pass President Marvin Taylor announced that the company reached an agreement with its unions to reopen the railroad for a summer tourist operation, with three‐hour round‐trips to the summit, which became the impetus for tourism development and growth for Skagway.
The White Pass and Yukon Route Railroad Company own and operate three docks in Skagway. Their lengths are 1,800 feet with a 35‐foot draught, 1,800 feet with a 42.5‐foot draught, and 1,000‐feet with a 35‐foot depth alongside. In addition, a Ferry Terminal Pier in the center of the city’s downtown waterfront can accommodate a small cruise ship of up to 865 feet, when not in use by the Alaska Marine Highway. White Pass and Yukon Route have a long‐term leases on the property for the cruise ship berths. The railroad tracks for the White Pass excursion come directly to the cruise ship piers, and allow for increased efficiency of tour loading. There is very good space on the piers for loading and unloading of tour operations. A pier extension and new berth have also been added to the mix. With the development of mining in the interior of Canada over the past few years, there is also a move to use the docks and rail for the movement of mining materials.
The downtown main street and surrounding areas have continued to grow and develop infrastructures, tourism products, and venues that play on the dramatic history of the Gold Rush and early days of Skagway. In addition, a variety of adventure tourism products have also been developed, using the natural resources that surround the area. Below is a list of 32 typical tour options for a cruise‐vessel calling in Skagway.
A Taste of Skagway at Jewell Gardens 2 ½ hours
Adventure Park: Rock Climb & Rappel 3 ¼ hours
Adventure Park: Rock Climb, Rappel & Zip 3 ½ hours
Adventure Park: Zip Lining 3 ¼ hours
Alpine Snow Shoe & White Pass Rail Experience 8 hours
Best of Broadway 3 ¾ hours
Best of Skagway 6 ½ hours
Chilkoot Hike & Float 4 ½ hours
Dog Sledding & Glacier Helicopter Flightseeing 2 hours
Ghosts & Goodtime Girls Walking Tour 2 hours
Glacier Discovery by Helicopter 2 hours
Glacier Lake Kayak & White Pass Rail Experience 5 hours
Glacier Point Wilderness Safari 6 ½ hours
Golden Glassblowing Experience 3 hours
Guide's Choice Photography Tour to Haines 6 hours
Haines Eagle Preserve Float Adventure & Lynn Fjord Cruise 6 ½ hours
Haines Eagle Preserve Wildlife River Adventure 6 ¼ hours
Heli‐Hike & White Pass Rail Adventure 5 hours
Historical City & Salmon Bake 3 hours
Horseback Riding Adventure 3 ½ hours
Klondike Gold Dredge, White Pass Rail & Scenic Highway Exploration 5 hours
Klondike Summit, Suspension Bridge & Salmon Bake 4 hours
Musher's Camp & Sled Dog Experience 3 ¼ hours
Exhibit A Report Number 19-150

GREAT LAKES CRUISE STRATEGY FOR ONTARIO’S PORTS – TASK 2: BUSINESS CASE AND CRUISE INDUSTRY STRATEGIC ACTION PLAN
109
Rain Forest by Bicycle 3 hours
Skagway's Original Street Car 1 ½ hours
Takshanuk Trail Adventure by 4x4 6 ½ hours
White Pass Rail, Klondike Highway & Gold Camp Adventure 4 ½ hours
White Pass Railway & Klondike Highway 3 ½ hours
White Pass Summit Scenic Railroad 3 ½ hours
White Pass Train & Bike 4 ½ hours
Yukon Expedition & White Pass Railway 8 hours
Yukon Jeep Adventure 5 hours While analyzing the transportation, infrastructure, tour options, and product development for Skagway, the following elements stand out in terms of Best Practices that can be applied to the Ontario Ports:
They included the creation of tours with a variety of price points, activities, participation levels, languages, and nonverbal communication.
Tour products and venues have been developed around a variety of themes that are historical in context, use natural resources, and (in some cases) provide for a new activity level (such as the zip line).
Venues, such as the Gold Camp Adventure and Best of Broadway, have been created, and provide for an authentic character experience, based on the history of Skagway (similar to the many National Historic Sites and Parks).
Transportation has also been created to incorporate historical themes, such as the Skagway Streetcar, which provides for a unique experience not found elsewhere. Other adventure experiences include the use of the train, jeeps, horses, bikes, rafts, planes, and helicopters to provide for a variety of products.
Multiple departures are offered to provide for increased revenue opportunities for the cruise line and tour operator. Additionally, the duration of most tours is less than 4 hours, allowing for multiple departures. This option may be beneficial for the larger ships (400 – 500 pax.) calling in the Great Lakes region.
Developing tour products is not just about inventing a tour option or venue. Tour operators in Skagway and other Alaskan ports work diligently in the aspects of training and development of staff, guides, and support personnel to provide a high‐quality entertaining experience.
Overall, there has been much effort on behalf of the local tourism stakeholders to develop and create a unique destination over an extended period of time, and there has been considerable investment by private entrepreneurs in the infrastructure throughout the community. Investing in active tour options that meets the needs of local, land‐based, and cruise tourists must be considered. In general, a cruise line shore excursion department may deal, with approximately 300 destinations annually. Thus, it is important that the presentation of tour options help them identify the type of tour offered and keep with their demographic.
Exhibit A Report Number 19-150

GREAT LAKES CRUISE STRATEGY FOR ONTARIO’S PORTS – TASK 2: BUSINESS CASE AND CRUISE INDUSTRY STRATEGIC ACTION PLAN
110
Adventure, Nature and Wildlife: Seaweed secrets, wildlife watching, beach tours, feeding the giants, fishing, and exploring local flavours in the wild
Hands‐on experiences: These learning experiences include farmer’s tours, cooking experiences, “help the community” tours (where guests engage and participate in local projects), glass blowing, painting classes, jam making, basket weaving, and moonshine making (and tasting)
History, culture, and local stories: Traditional items, such as historic walks, native themed, maritime heritage, brewery tours, local storytellers, and traditional meals
Active tours: Kayaking, fishing, sailing, hiking, trail rides, biking, and golfing
Shows and festivals: Powwows. There is also a huge selection of festivals and events throughout the season, for visitors to participate in either independently or on an organized tour with VIP status (justifying an extra charge). Each destination has these powwows as a local community or regional experience.
Concierge and special: "Behind the Powwow." Private and exclusive tours that luxury / exploration cruise lines search for. Examples: behind the Powwow, with backstage access to meet the dancers and drummers, and private tastings at a brewery company (with local delicacies by a top chef). It’s something unique to the destination that is not advertised anywhere else.
Give back to the community: Tours that provide impacts to the community, such as Habitat for Humanity and hospital and hospice restoration.
By developing and offering a broad, innovative product selection that could differ from the traditional, competitive, regional product offering, the Great Lakes region and the Ontario ports can proactively lead a change in the consumer mind‐set and brand‐marketing perception of the region.
Exhibit A Report Number 19-150
GREAT LAKES CRUISE STRATEGY FOR ONTARIO’S PORTS – TASK 2: BUSINESS CASE AND CRUISE INDUSTRY STRATEGIC ACTION PLAN
111
6. BUSINESS CASE & CRUISE STRATEGIC ACTION PLAN
Overview By understanding the potential opportunity in the form of projection modelling for the Great Lakes region, specifically the Ontario Ports, evaluating the existing cruise related hard (i.e., port) and soft (i.e., upland support infrastructure) tourism, and determining the scenarios whereby the region can accelerate the cruise business growth. Then a series of strategic action items can be developed, in order to formulate an overall plan. This section lays out that plan moving forward. Port and Soft Tourism Infrastructure Assessment (Key Ontario Ports and Great Lakes Overview) Each of the eight Ontario destinations included in this study offers a variety of cruise products, and its own unique overall visitor experience. The port infrastructure of each destination also varies considerably with some destinations offering newly constructed or improved docking facilities and others doing their best to utilize pre‐existing if less than optimal marine infrastructure to welcome cruise visitors. What follows is a brief overview of both the hard infrastructure (piers, terminals, ground transportation areas (GTAs), etc.) and the soft infrastructure (tours, guides, destination amenities, etc.) of each port based on preliminary findings. Additionally, based upon the findings of the site visit and Ontario Port projections a Business Case is illustrated for each port as to the required hard and / or soft infrastructure need to obtain the HIGH projection range which is more of the push and pull scenario for the Great Lakes region and Ontario ports that for comparison is similar to that of the River Cruise Industry success in Europe, whereby consumer demand; the use of primarily existing port and soft tourism infrastructure; and regulatory came together to rapidly build the small ship river cruise industry of today that continues to move forward. Limited resources are required for hard infrastructure development, but there is a need for consumer development, port / tourism operations coordination and providing for a fair share of revenues for the ports on the itinerary routes to provide for the changing needs of the river cruise industry. As part of the annual investment for each Ontario port an assumption has been set aside for an Ontario based cruise association dealing with the cruise industry directly with local destination based networks providing for the key port and tourism destination knowledge; a Great Lakes regional association whose primary mission is to develop the consumer demand market for the region’s cruise tourism industry, whereby the local ports throughout the region , including Ontario would provide for an annual contribution to assist in this effort; and, any direct investment required to allow for the increased use of the destination, such as a berth to accommodate larger ships, etc. In the following chapter the overall outline of the associations will be provided as part of the action items. As with the current Great Lakes Cruise Coalition, this new association will need to be funded accordingly.
Exhibit A Report Number 19-150
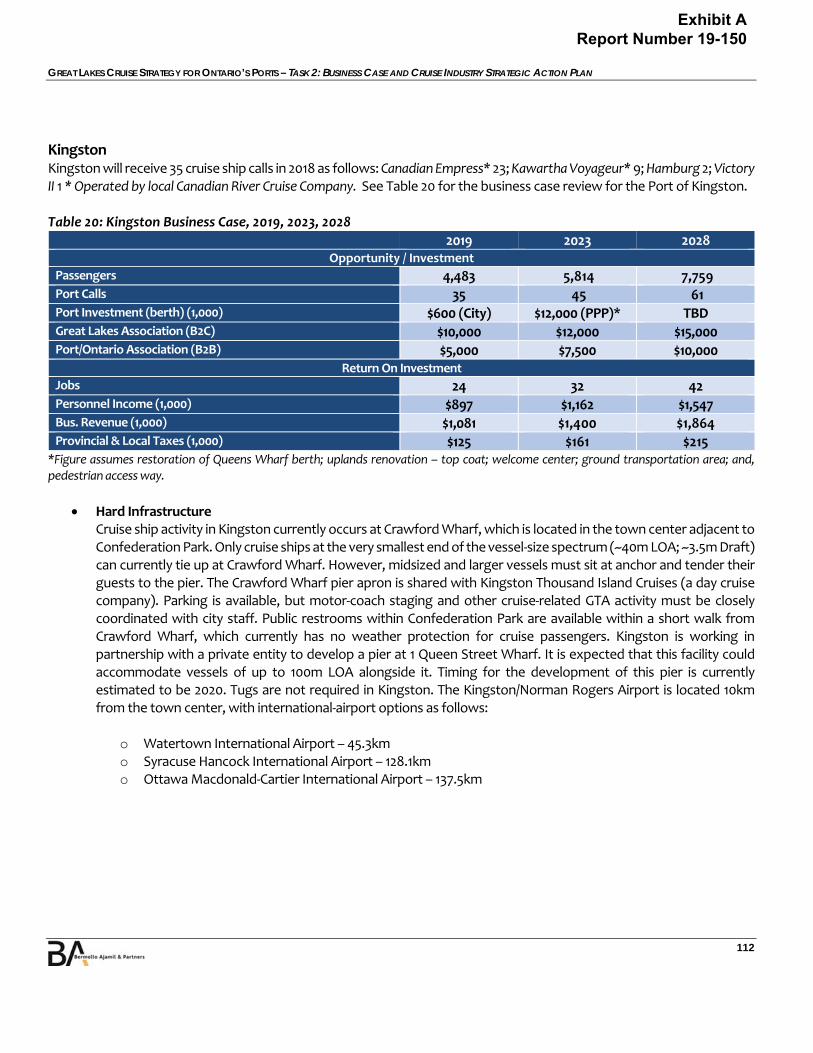
GREAT LAKES CRUISE STRATEGY FOR ONTARIO’S PORTS – TASK 2: BUSINESS CASE AND CRUISE INDUSTRY STRATEGIC ACTION PLAN
112
Kingston Kingston will receive 35 cruise ship calls in 2018 as follows: Canadian Empress* 23; Kawartha Voyageur* 9; Hamburg 2; Victory II 1 * Operated by local Canadian River Cruise Company. See Table 20 for the business case review for the Port of Kingston. Table 20: Kingston Business Case, 2019, 2023, 2028
2019 2023 2028 Opportunity / Investment
Passengers 4,483 5,814 7,759 Port Calls 35 45 61 Port Investment (berth) (1,000) $600 (City) $12,000 (PPP)* TBD Great Lakes Association (B2C) $10,000 $12,000 $15,000 Port/Ontario Association (B2B) $5,000 $7,500 $10,000
Return On Investment Jobs 24 32 42 Personnel Income (1,000) $897 $1,162 $1,547 Bus. Revenue (1,000) $1,081 $1,400 $1,864 Provincial & Local Taxes (1,000) $125 $161 $215
*Figure assumes restoration of Queens Wharf berth; uplands renovation – top coat; welcome center; ground transportation area; and, pedestrian access way.
Hard Infrastructure Cruise ship activity in Kingston currently occurs at Crawford Wharf, which is located in the town center adjacent to Confederation Park. Only cruise ships at the very smallest end of the vessel‐size spectrum (~40m LOA; ~3.5m Draft) can currently tie up at Crawford Wharf. However, midsized and larger vessels must sit at anchor and tender their guests to the pier. The Crawford Wharf pier apron is shared with Kingston Thousand Island Cruises (a day cruise company). Parking is available, but motor‐coach staging and other cruise‐related GTA activity must be closely coordinated with city staff. Public restrooms within Confederation Park are available within a short walk from Crawford Wharf, which currently has no weather protection for cruise passengers. Kingston is working in partnership with a private entity to develop a pier at 1 Queen Street Wharf. It is expected that this facility could accommodate vessels of up to 100m LOA alongside it. Timing for the development of this pier is currently estimated to be 2020. Tugs are not required in Kingston. The Kingston/Norman Rogers Airport is located 10km from the town center, with international‐airport options as follows:
o Watertown International Airport – 45.3km o Syracuse Hancock International Airport – 128.1km o Ottawa Macdonald‐Cartier International Airport – 137.5km
Exhibit A Report Number 19-150

GREAT LAKES CRUISE STRATEGY FOR ONTARIO’S PORTS – TASK 2: BUSINESS CASE AND CRUISE INDUSTRY STRATEGIC ACTION PLAN
113
Figure 29: City of Kingston11
Soft Infrastructure Originally settled in the mid‐1600s by the French with the establishment of Fort Frontenac, the British later took control after the Seven Years War in 1758. During the War of 1812, Kingston served as the base for the Great Lakes British Naval fleet. Historical Fort Henry and a number of Martello Towers were built around 1832, to protect the 202km Rideau Canal. The canal, the oldest continually operating canal system in North America, provided a safe trade route between Montreal and Kingston by using the Ottawa River, thus bypassing the vulnerable St. Lawrence River against possible American attacks. Kingston is sometimes referred to as the Limestone City, since
11 Sources: Google Earth; pictures.dealer.com; lakeshoreexcursions.com
Crawford Wharf
1 Queen Street Wharf
Exhibit A Report Number 19-150
GREAT LAKES CRUISE STRATEGY FOR ONTARIO’S PORTS – TASK 2: BUSINESS CASE AND CRUISE INDUSTRY STRATEGIC ACTION PLAN
114
many of its historic buildings are built from local limestone. Kingston is also known as the gateway to the 1,000 Islands, and was the capital of the united Canadas (Upper & Lower Canada) from 1841‐1844. Last but not least, Kingston was home to Canada's first Prime Minister, Sir John A. MacDonald. Today, Kingston maintains a population of approximately 150,000, has a bustling arts and entertainment scene, and is home to two famous degree‐granting universities: Queens (one of Canada's oldest) and the Royal Military College (Canada's only military university) and St. Lawrence College of Applied Arts and Technology. Kingston’s major attractions include the following:
o Fort Henry – 2.4km o Bellevue House – 2.5km o Kingston Penitentiary – 3.0km o Rideau Canal (UNESCO heritage site) & Kingston Mill Locks – 9.0km o Ottawa – 175km
The following is a brief description of tours currently available to cruise passengers for each of these attractions: City Tour Duration: 7‐8 hours Historical overview of the city and visits to:
o Bellevue House ‐ Traditional Georgian architecture built in the 1840s by a successful grocer, and later home to Canada's first Prime Minister, Sir John A. MacDonald
o Agnes Etherington Art Center on the grounds of the famous Queen's University The permanent collection is one of the most notable in Canada. The "Agnes" features an extensive collection of historical and contemporary Canadian art, as well as one of the finest public collections of African art in Canada.
o St. Mary's Roman Catholic Cathedral or St. George's Anglican Cathedral o Fort Henry National Historic Site ‐ An authentic 19th‐century British military fortress, which is set high above
the Kingston harbour on Lake Ontario, the gateway to the St. Lawrence River and the Rideau Canal. The garrison parade is daily at 3pm.
o Kingston Penitentiary, After 178 years of mystery behind the walls, guided tours began in 2013, offering a rare opportunity to visit a National Historic Site.
Fort Henry Sunset Ceremony (Wednesdays) Duration: 4 hours (5PM ‐ 9PM) Experience the pomp and pageantry of the British Military of 1867 with music by the Drums of Fort Henry and the Drill Squad and Artillery Units.
o Fort Regiment performs split‐second bayonet drills / field maneuvers, recreating battle tactics of over a century ago and includes military music, gun salutes, and a fireworks finale.
o Includes a three‐course dinner by soldier servants in the officers' dining rooms, followed by an escort to prestige seating with VIP Balcony Seats (on the covered balcony, overlooking the fort’s parade square performance area).
Exhibit A Report Number 19-150
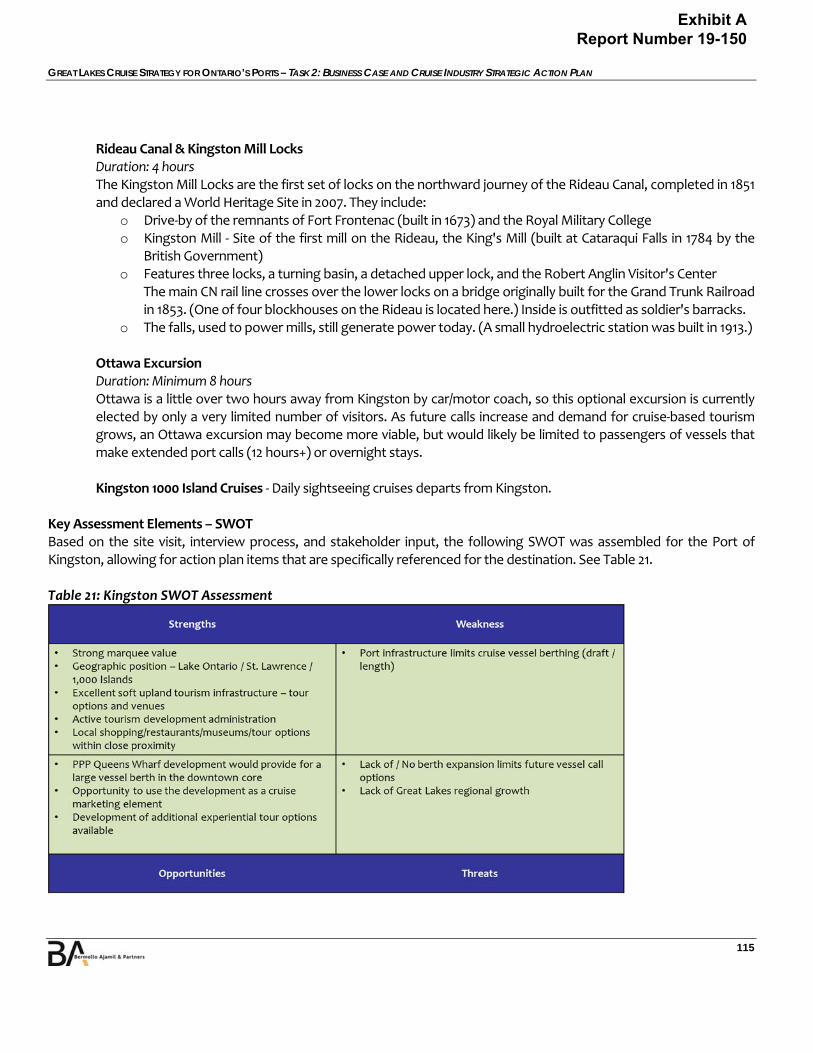
GREAT LAKES CRUISE STRATEGY FOR ONTARIO’S PORTS – TASK 2: BUSINESS CASE AND CRUISE INDUSTRY STRATEGIC ACTION PLAN
115
Rideau Canal & Kingston Mill Locks Duration: 4 hours The Kingston Mill Locks are the first set of locks on the northward journey of the Rideau Canal, completed in 1851 and declared a World Heritage Site in 2007. They include:
o Drive‐by of the remnants of Fort Frontenac (built in 1673) and the Royal Military College o Kingston Mill ‐ Site of the first mill on the Rideau, the King's Mill (built at Cataraqui Falls in 1784 by the
British Government) o Features three locks, a turning basin, a detached upper lock, and the Robert Anglin Visitor's Center
The main CN rail line crosses over the lower locks on a bridge originally built for the Grand Trunk Railroad in 1853. (One of four blockhouses on the Rideau is located here.) Inside is outfitted as soldier's barracks.
o The falls, used to power mills, still generate power today. (A small hydroelectric station was built in 1913.)
Ottawa Excursion Duration: Minimum 8 hours Ottawa is a little over two hours away from Kingston by car/motor coach, so this optional excursion is currently elected by only a very limited number of visitors. As future calls increase and demand for cruise‐based tourism grows, an Ottawa excursion may become more viable, but would likely be limited to passengers of vessels that make extended port calls (12 hours+) or overnight stays.
Kingston 1000 Island Cruises ‐ Daily sightseeing cruises departs from Kingston.
Key Assessment Elements – SWOT Based on the site visit, interview process, and stakeholder input, the following SWOT was assembled for the Port of Kingston, allowing for action plan items that are specifically referenced for the destination. See Table 21. Table 21: Kingston SWOT Assessment
Exhibit A Report Number 19-150

GREAT LAKES CRUISE STRATEGY FOR ONTARIO’S PORTS – TASK 2: BUSINESS CASE AND CRUISE INDUSTRY STRATEGIC ACTION PLAN
116
Little Current Little Current will receive 28 cruise ship calls in 2018, as follows: Victory I 16; Pearl Mist 10; and, Hamburg 2* ‐ these are calls via tender, due to vessel size. Table 22 illustrates the business plan outline for Little Current based upon our assessment. Table 22: Little Current Business Case, 2019, 2023, 2028
2019 2023 2028 Opportunity / Investment
Passengers 4,556 5,909 7,885 Port Calls 20 36 48 Port Investment (Dredge channel expansion) (1,000) $5,000 (EST)* TBD Great Lakes Association (B2C) $10,000 $12,000 $15,000 Port/Ontario Association (B2B) $5,000 $7,500 $10,000
Return On Investment Jobs 25 33 43 Personnel Income (1,000) $912 $1,181 $1,572 Bus. Revenue (1,000) $1,098 $1,422 $1,894 Provincial & Local Taxes (1,000) $127 $164 $218
* To accommodate the larger vessels sailing in the region, to avoid anchoring / tendering process, the port may consider channel deepening to allow for these ships to berth. The $5‐million is an estimate of the dredge cost, but a complete study would need to be undertaken to determine the actual cost (cost / benefit analysis).
Hard Infrastructure Most cruise ship activity in Little Current occurs at the main cruise‐ship dock, which is located approximately 50m from the town center and is part of a recent multimillion‐dollar waterfront renovation. Vessels up to ~107m LOA and 4.6m draft can tie up directly alongside. If two cruise ships are in port on the same day, or if a vessel exceeds the length and/or draft capabilities of the main dock, then those vessels must tender their passengers to one of four alternative docks, located between 100m and 500m from the town center. Motor‐coach staging and other cruise‐related GTA activities can generally be handled adjacent to the main cruise ship dock, which currently has a small office but no weather protection for cruise passengers. Restrooms are located nearby, but outside the secure area. Tugs are not required in Little Current. Manitoulin East Airport is located 20km from the town center. The next nearest airport (Greater Sudbury Airport) is located 155km from Little Current. The nearest international airport is Pearson International Airport in Toronto (~500km).
Exhibit A Report Number 19-150
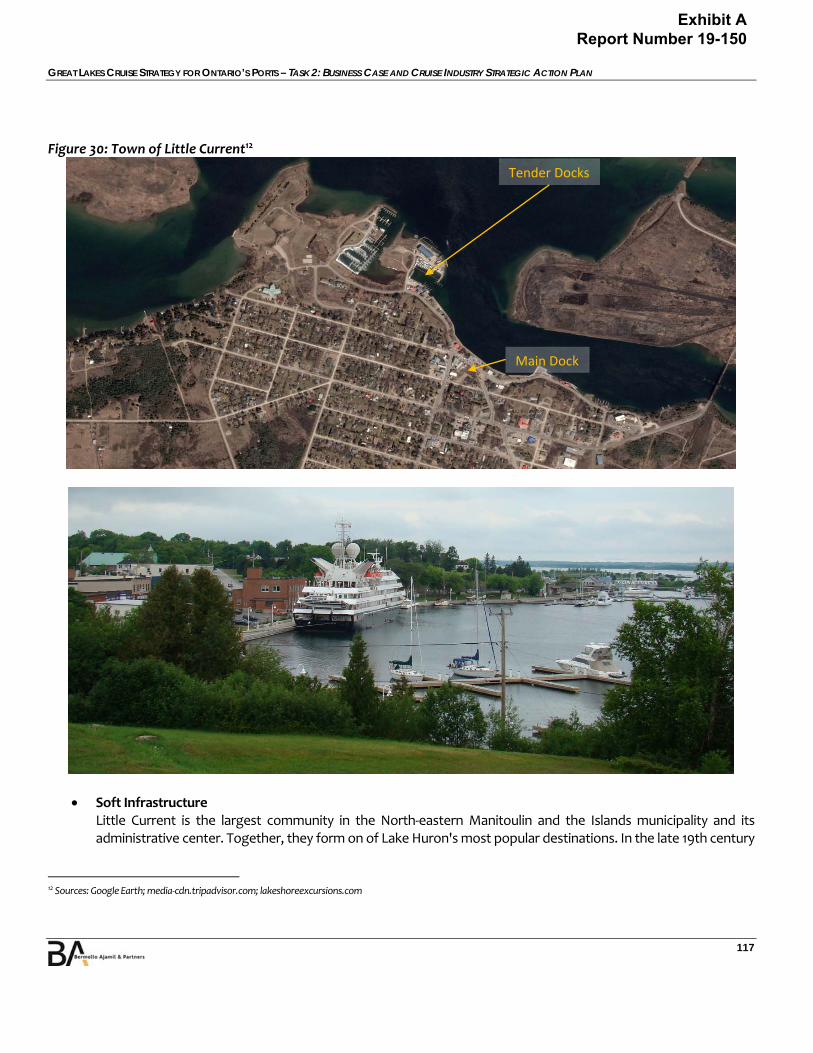
GREAT LAKES CRUISE STRATEGY FOR ONTARIO’S PORTS – TASK 2: BUSINESS CASE AND CRUISE INDUSTRY STRATEGIC ACTION PLAN
117
Figure 30: Town of Little Current12
Soft Infrastructure Little Current is the largest community in the North‐eastern Manitoulin and the Islands municipality and its administrative center. Together, they form on of Lake Huron's most popular destinations. In the late 19th century
12 Sources: Google Earth; media‐cdn.tripadvisor.com; lakeshoreexcursions.com
Main Dock
Tender Docks
Exhibit A Report Number 19-150
GREAT LAKES CRUISE STRATEGY FOR ONTARIO’S PORTS – TASK 2: BUSINESS CASE AND CRUISE INDUSTRY STRATEGIC ACTION PLAN
118
lake vessels stopped in Little Current to take on wood for fuel. The lumbering trade was foremost in the region at the time and saw mills were established at nearby Low Island, now a park in the community. Today the local economy continues to include farming and lumbering, but tourism is also a major component. Little Current has a population of less than 3,000 and its major attractions include the following:
o Ojibway Cultural Foundation – 30km o Cup & Saucer Hiking Trail – 25km o Bridal Veil Falls – 40km
What follows is a brief description of tours currently available to cruise passengers for each of these attractions. Powwow Excursion Duration: 4‐5 hours Passengers board a motor coach at the pier for a 30‐minute narrated transfer providing an overview of Manitoulin Island's rich native and nautical history, as well as other interesting commentary on life on the world's largest freshwater island. Stops include:
o Immaculate Conception Church A spiritual focal point of the First Nations community that brings together the beliefs and customs of both the native Ojibwe culture and the Catholic Church
o Ojibwe Cultural Foundation Welcome ceremony and interpretive tour of this state‐of‐the‐art heritage museum and art gallery including participation in a smudging ceremony and traditional Aboriginal dance & drum presentation
o Excursion concludes with a 30‐minute return transfer back to the Port of Little Current
Hiking the Cup & Saucer Trail Duration: 5 hours The Cup and Saucer Trail is one of Manitoulin Island's premier tourist destinations and offers:
o Unique hiking and panoramic views extending some 50km from an elevation of around 76 meters o Local guides – including experts in geology, photography, and paramedic trained firefighters – are
provided for groups up to 20 o The property is owned in part by the Escarpment Biosphere Conservancy, a non‐profit corporation whose
function is to conserve nature preserves in the Ontario/Niagara Escarpment o Requires reasonable level of fitness and hiking boots are recommended o Includes post‐hike hors d’oeuvres of Canadian wines, cheeses and locally smoked rainbow trout
Bridal Veil Falls Duration: N/A Bridal Veil Falls are fed by the Kagawong River which flows between Lake Kagawong and Lake Huron. The falls are located on Manitoulin Island 40km from Little Current town center. A staircase and walking trail leads to the ~11m cascading falls. There is a small village at the mouth of the river featuring a museum and art galleries. B&A is unaware of any guided tours of Bridal Veil Falls being offered to cruise visitors, meaning it is most likely an
Exhibit A Report Number 19-150
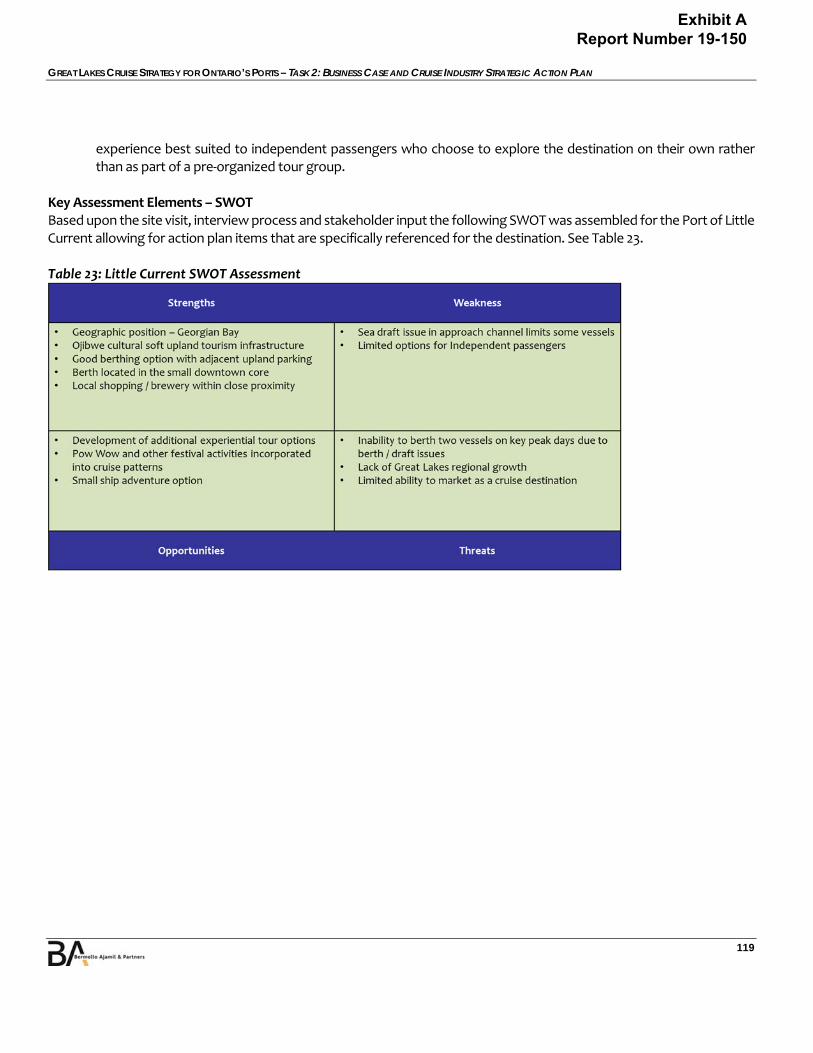
GREAT LAKES CRUISE STRATEGY FOR ONTARIO’S PORTS – TASK 2: BUSINESS CASE AND CRUISE INDUSTRY STRATEGIC ACTION PLAN
119
experience best suited to independent passengers who choose to explore the destination on their own rather than as part of a pre‐organized tour group.
Key Assessment Elements – SWOT Based upon the site visit, interview process and stakeholder input the following SWOT was assembled for the Port of Little Current allowing for action plan items that are specifically referenced for the destination. See Table 23. Table 23: Little Current SWOT Assessment
Exhibit A Report Number 19-150
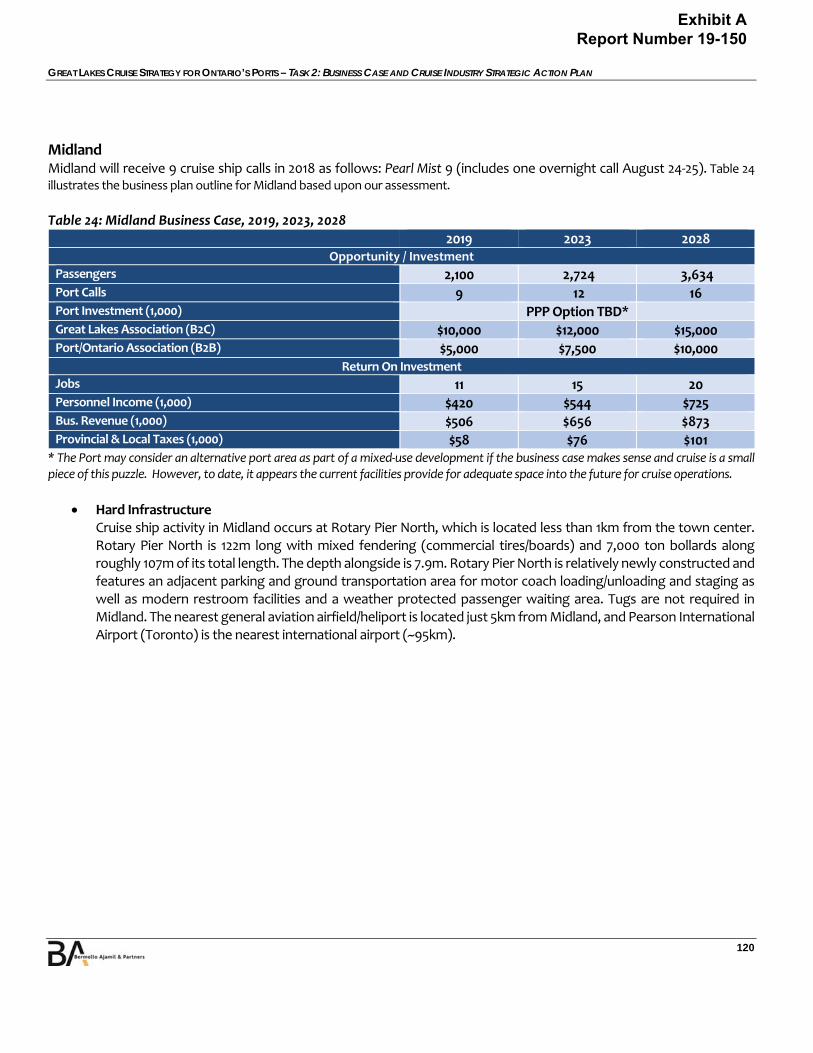
GREAT LAKES CRUISE STRATEGY FOR ONTARIO’S PORTS – TASK 2: BUSINESS CASE AND CRUISE INDUSTRY STRATEGIC ACTION PLAN
120
Midland Midland will receive 9 cruise ship calls in 2018 as follows: Pearl Mist 9 (includes one overnight call August 24‐25). Table 24 illustrates the business plan outline for Midland based upon our assessment.
Table 24: Midland Business Case, 2019, 2023, 2028
2019 2023 2028 Opportunity / Investment
Passengers 2,100 2,724 3,634 Port Calls 9 12 16 Port Investment (1,000) PPP Option TBD* Great Lakes Association (B2C) $10,000 $12,000 $15,000 Port/Ontario Association (B2B) $5,000 $7,500 $10,000
Return On Investment Jobs 11 15 20 Personnel Income (1,000) $420 $544 $725 Bus. Revenue (1,000) $506 $656 $873 Provincial & Local Taxes (1,000) $58 $76 $101
* The Port may consider an alternative port area as part of a mixed‐use development if the business case makes sense and cruise is a small piece of this puzzle. However, to date, it appears the current facilities provide for adequate space into the future for cruise operations.
Hard Infrastructure Cruise ship activity in Midland occurs at Rotary Pier North, which is located less than 1km from the town center. Rotary Pier North is 122m long with mixed fendering (commercial tires/boards) and 7,000 ton bollards along roughly 107m of its total length. The depth alongside is 7.9m. Rotary Pier North is relatively newly constructed and features an adjacent parking and ground transportation area for motor coach loading/unloading and staging as well as modern restroom facilities and a weather protected passenger waiting area. Tugs are not required in Midland. The nearest general aviation airfield/heliport is located just 5km from Midland, and Pearson International Airport (Toronto) is the nearest international airport (~95km).
Exhibit A Report Number 19-150
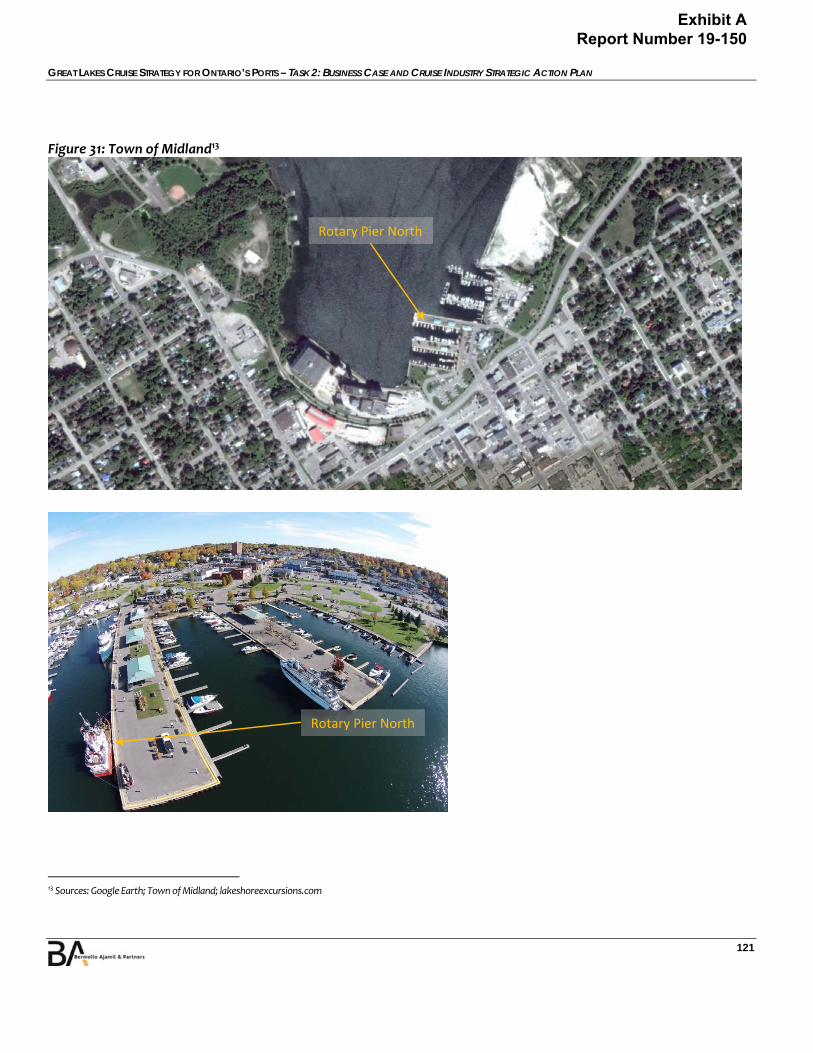
GREAT LAKES CRUISE STRATEGY FOR ONTARIO’S PORTS – TASK 2: BUSINESS CASE AND CRUISE INDUSTRY STRATEGIC ACTION PLAN
121
Figure 31: Town of Midland13
13 Sources: Google Earth; Town of Midland; lakeshoreexcursions.com
Rotary Pier North
Rotary Pier North
Exhibit A Report Number 19-150
GREAT LAKES CRUISE STRATEGY FOR ONTARIO’S PORTS – TASK 2: BUSINESS CASE AND CRUISE INDUSTRY STRATEGIC ACTION PLAN
122
Soft Infrastructure The town of Midland was founded in 1871 (incorporated 1890) when the Midland Railway of Canada selected the area as the new terminus of the Midland railway. Settlers, attracted by the convenience of rail service, soon began to move into the area. The town thrived, based on Georgian Bay shipping and the lumber and grain trade. A number of light industrial companies later established themselves in the area, and tourism in the southern Georgian Bay area has also become a significant part of the local economy. The Town of Midland is situated at the gateway to Georgian Bay's picturesque 30,000 Islands, and is the economic and cultural heart of North Simcoe. Midland proper has a population of over 17,000, with the broader Southern Georgian Bay area being home to a population of approximately 50,000. In the summer months, the population grows considerably. Midland goes above and beyond to customize a destination experience for the passengers of the Pearl Mist by holding a “Cruise Ship Celebration Day” during each of Pearl Seas’ 9 calls. The program for each of these days is as follows:
8:50am – 9:30am Misty Creek “the beginning” 10:00am Cannon (Discovery Harbour) 10:00am – 3:00pm Discovery Harbour satellite programming 10:00am – 4:00pm Artisans and demonstrations 10:30am – 12:00pm Entertainment (under the pavilion) Louis Lefaive 12:00pm Legion Pipes and Drums 1:00pm – 2:30pm Entertainment (under the pavilion) Louis Lefaive 2:30pm Birds of Prey Show 3:30pm – 5:00pm Alyssa Tess (under the pavilion) 5:30pm Misty Creek “the end” 6:30pm Badger (departure cannon)
Apart from this customized cruise day experience, Midland’s major permanent attractions include the following:
o SS Keewatin o Saint Marie, among the Huron’s/Discovery Harbour o The Martyr’s Shrine o Huronia Museum
What follows is a brief description of tours currently available to cruise passengers for each of these attractions.
Midland Highlights Duration: 6 hours This all‐day allows visitors to experience a range of local historical and cultural highlights, including the following sites:
o Ouendat Village and Huronia Museum The museum houses a display consisting of over one million pieces of local Huron Ouendat and Ojibway artifacts, as well as an active art exhibit that includes contemporary Georgian Bay and First Nations art, as well as a collection of photos portraying the history and culture of the unique region known as Huronia.
Exhibit A Report Number 19-150
GREAT LAKES CRUISE STRATEGY FOR ONTARIO’S PORTS – TASK 2: BUSINESS CASE AND CRUISE INDUSTRY STRATEGIC ACTION PLAN
123
o Sainte Marie among the Huron’s A recreated 17th century French Jesuit Mission headquarters that exemplifies the interaction between the French and Wendat (Ouendat) Huron First Nation people
o Lunch o Wye Marsh
Wye Marsh is an important bird area and home to a large diversity of species. Wye Marsh provides nesting habitats to some uncommon species, such as the Least Bittern, Black Tern, and Trumpeter Swan. Wye Marsh is also one of the best places in the region to observe the habits of a number of native mammals, such as beavers, porcupines, minks and river otters. Turtles, frogs, and snakes abound as well.
o Martyr's Shrine The shrine honors the eight Jesuit saints who lived, worked, and died in the area over 350 years ago. The grounds include the famous Shrine Church, as well as 75 adjoining, lushly landscaped acres.
SS Keewatin The SS Keewatin is a passenger liner that once sailed between Port Arthur/Fort William (now Thunder Bay) on Lake Superior and Port McNicoll on Georgian Bay (now Lake Huron) in Ontario. She carried passengers between these ports for the Canadian Pacific Railway’s Great Lakes Steamship Service. The Keewatin also carried packaged freight goods for the railways at these ports. Tours are available every half hour, seven days a week, from May 17 through October 8 from 10am until 3:30 pm. Reservations are NOT required. Upper deck tours last 60 minutes, with engine room tours lasting an additional 30 minutes. B&A is unaware of any cruise tour packages that include the SS Keewatin, but it is no doubt a popular site for independent passengers who choose to explore the destination on their own, rather than as part of a pre‐organized tour group.
Key Assessment Elements – SWOT Based upon the site visit, interview process and stakeholder input the following SWOT was assembled for the Port of Midland allowing for action plan items that are specifically referenced for the destination. See Table 25. Table 25: Midland SWOT Assessment
Exhibit A Report Number 19-150
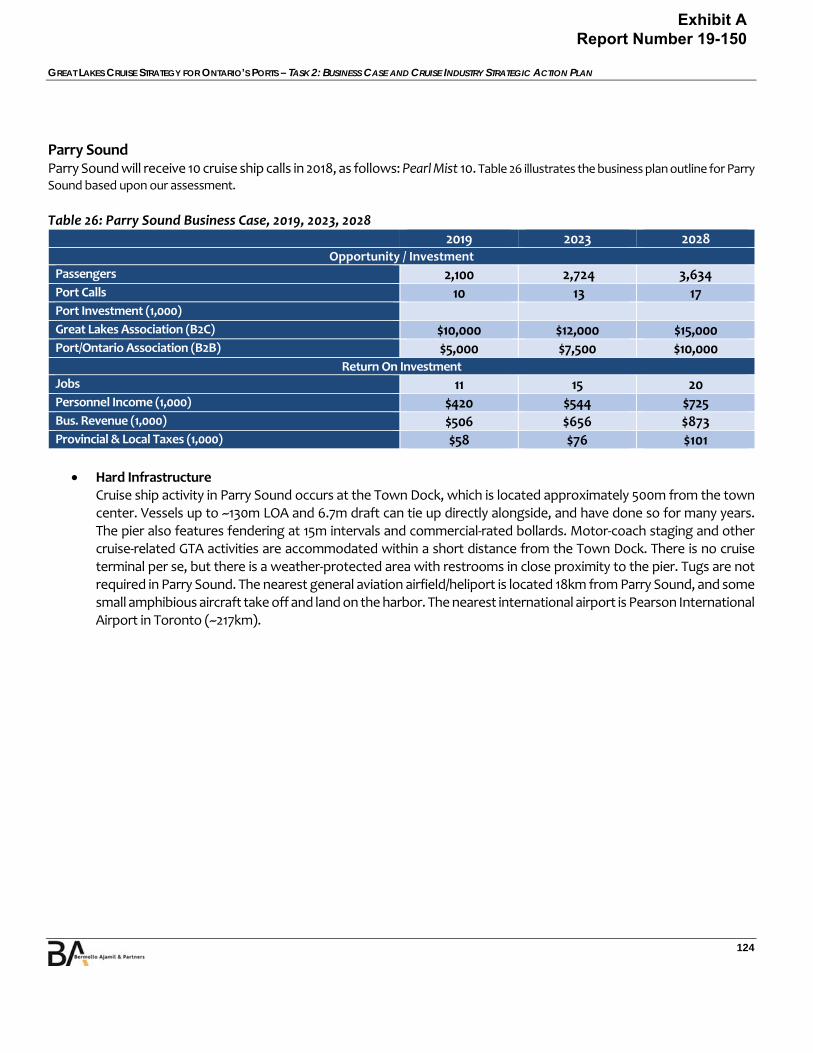
GREAT LAKES CRUISE STRATEGY FOR ONTARIO’S PORTS – TASK 2: BUSINESS CASE AND CRUISE INDUSTRY STRATEGIC ACTION PLAN
124
Parry Sound Parry Sound will receive 10 cruise ship calls in 2018, as follows: Pearl Mist 10. Table 26 illustrates the business plan outline for Parry Sound based upon our assessment.
Table 26: Parry Sound Business Case, 2019, 2023, 2028
2019 2023 2028 Opportunity / Investment
Passengers 2,100 2,724 3,634 Port Calls 10 13 17 Port Investment (1,000) Great Lakes Association (B2C) $10,000 $12,000 $15,000 Port/Ontario Association (B2B) $5,000 $7,500 $10,000
Return On Investment Jobs 11 15 20 Personnel Income (1,000) $420 $544 $725 Bus. Revenue (1,000) $506 $656 $873 Provincial & Local Taxes (1,000) $58 $76 $101
Hard Infrastructure Cruise ship activity in Parry Sound occurs at the Town Dock, which is located approximately 500m from the town center. Vessels up to ~130m LOA and 6.7m draft can tie up directly alongside, and have done so for many years. The pier also features fendering at 15m intervals and commercial‐rated bollards. Motor‐coach staging and other cruise‐related GTA activities are accommodated within a short distance from the Town Dock. There is no cruise terminal per se, but there is a weather‐protected area with restrooms in close proximity to the pier. Tugs are not required in Parry Sound. The nearest general aviation airfield/heliport is located 18km from Parry Sound, and some small amphibious aircraft take off and land on the harbor. The nearest international airport is Pearson International Airport in Toronto (~217km).
Exhibit A Report Number 19-150
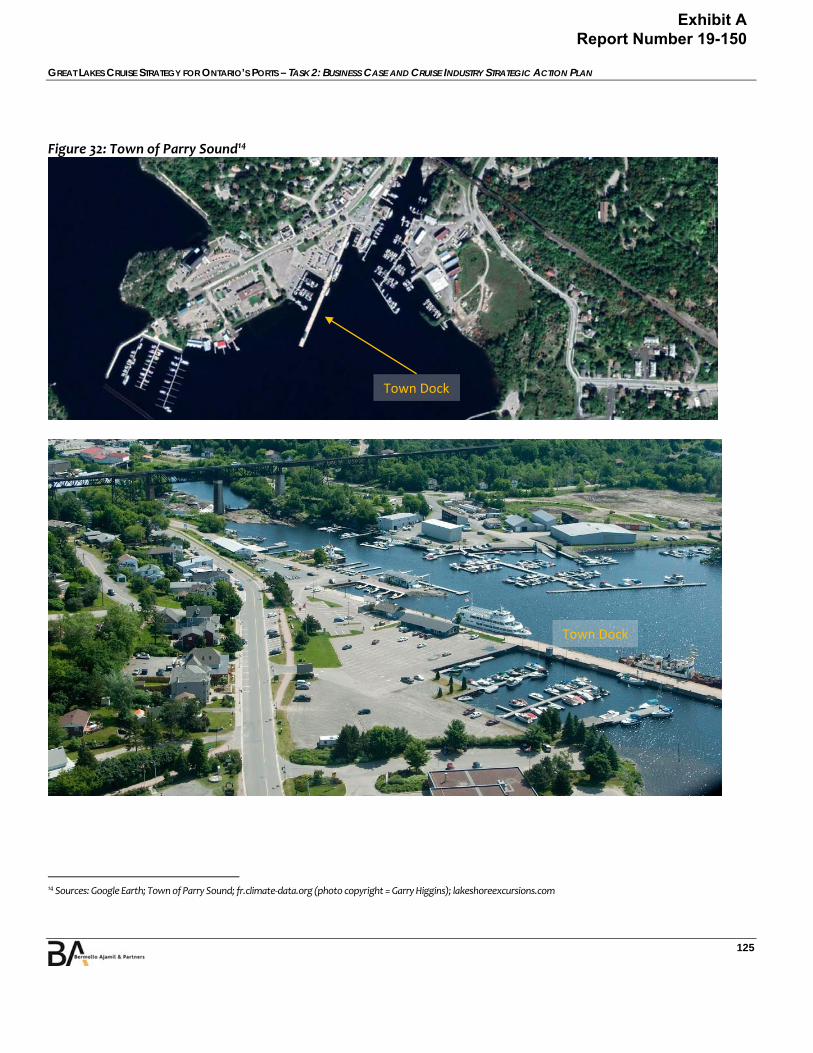
GREAT LAKES CRUISE STRATEGY FOR ONTARIO’S PORTS – TASK 2: BUSINESS CASE AND CRUISE INDUSTRY STRATEGIC ACTION PLAN
125
Figure 32: Town of Parry Sound14
14 Sources: Google Earth; Town of Parry Sound; fr.climate‐data.org (photo copyright = Garry Higgins); lakeshoreexcursions.com
Town Dock
Town Dock
Exhibit A Report Number 19-150
GREAT LAKES CRUISE STRATEGY FOR ONTARIO’S PORTS – TASK 2: BUSINESS CASE AND CRUISE INDUSTRY STRATEGIC ACTION PLAN
126
Soft Infrastructure The Town of Parry Sound is located on Highway 400, approximately two hours north of Toronto, and two hours south of Sudbury. Parry Sound hugs the shores of the world's largest freshwater archipelago, known as the 30,000 Islands. In 2004, UNESCO designated the area as the Georgian Bay Biosphere Reserve. Parry Sound is rich in arts, culture, and heritage. The Charles W. Stockey Center for the Performing Arts and Bobby Orr Hall of Fame are home to the international summer music festival known as the Festival of the Sound, which runs from mid‐July through mid‐August (7.20‐08.11 in 2018). The Hall of Fame pays tribute to hometown hockey hero Bobby Orr. Parry Sound is also home to the 6km Rotary and the Algonquin Regiment Fitness Trail, a waterfront trail linking to the North Shore Rugged Trail. Parry Sound also distinguishes itself as a cruise destination by organizing local musicians to play live music on the dock as passengers make their way back to the ship. Parry Sound also staffs an information kiosk on the dock while cruise ships are in port. Pamphlets, maps, fact sheets, and lists of day‐of things to do are available for independent passengers wishing to explore the town on their own. Complimentary shuttle bus service is available at the Town Dock for passengers who do not want to/aren’t able to walk to the downtown area. Parry Sound’s major attractions include the following:
o Georgian Bay Airways ‐ ~100m o Island Queen – 0m ( located on the Town Dock) o Killbear Provincial Park/Interpretive Center – 40.1km
What follows is a brief description of tours currently available to cruise passengers for each of these attractions:
Bush Plane Excursion Duration: 30 minutes (~15 minutes in the air) Operating out of Parry Sound's downtown waterfront, adjacent to the Town Pier, a modern fleet of aircraft— including the Found Bush Hawk and two Cessna C180s—flies passengers at an altitude of ~300m over the following areas:
o Georgian Bay shoreline, along the South Channel o Parry Sound Harbour via Depot Harbour
Island Cruise Duration: 2‐3 hours This local island cruise departs from the Town Dock for two‐ and three‐hour sightseeing cruises through the wild and rugged 30,000 Islands region of Georgian Bay, recently designated by the United Nations as a Biosphere Reserve. Highlights of this tour include:
o Glacier‐sculpted islands o Forests o Prominent summer residences o The outer islands o Wildlife
Exhibit A Report Number 19-150

GREAT LAKES CRUISE STRATEGY FOR ONTARIO’S PORTS – TASK 2: BUSINESS CASE AND CRUISE INDUSTRY STRATEGIC ACTION PLAN
127
Killbear Provincial Park Duration: 2‐4 hours Accessible via car or motor coach, Killbear is located near the town of Nobel, and combines Great Lakes sandy beaches with the rock ridges and pines of the Canadian Shield. The park is ecologically significant for its large and varied types of shoreline, and is also famous for its numerous species of snakes. As water levels in the Great Lakes fluctuate over time, different wetland, meadow, and shoreline vegetation is created. These habitats support significant populations of spotted turtles, Blanding’s turtles, eastern Massassauga rattlesnakes, hognose snakes, five‐lined skinks, and fox snakes. The southeastern portion of the park protects a typical area of bedrock barrens; these barrens represent a distinctively shallow soil habitat found in eastern Georgian Bay. Other highlights of the park include:
o 6km recreational trail for hiking and biking o Visitor center o Excellent sailing and windsurfing conditions o Talks and tours provided by geologists and naturalists
Key Assessment Elements – SWOT Based on the site visit, interview process, and stakeholder input, the following SWOT was assembled for the Town of Parry Sound, allowing for action plan items that are specifically referenced for the destination. See Table 27. Table 27: Town of Parry Sound SWOT Assessment
Exhibit A Report Number 19-150
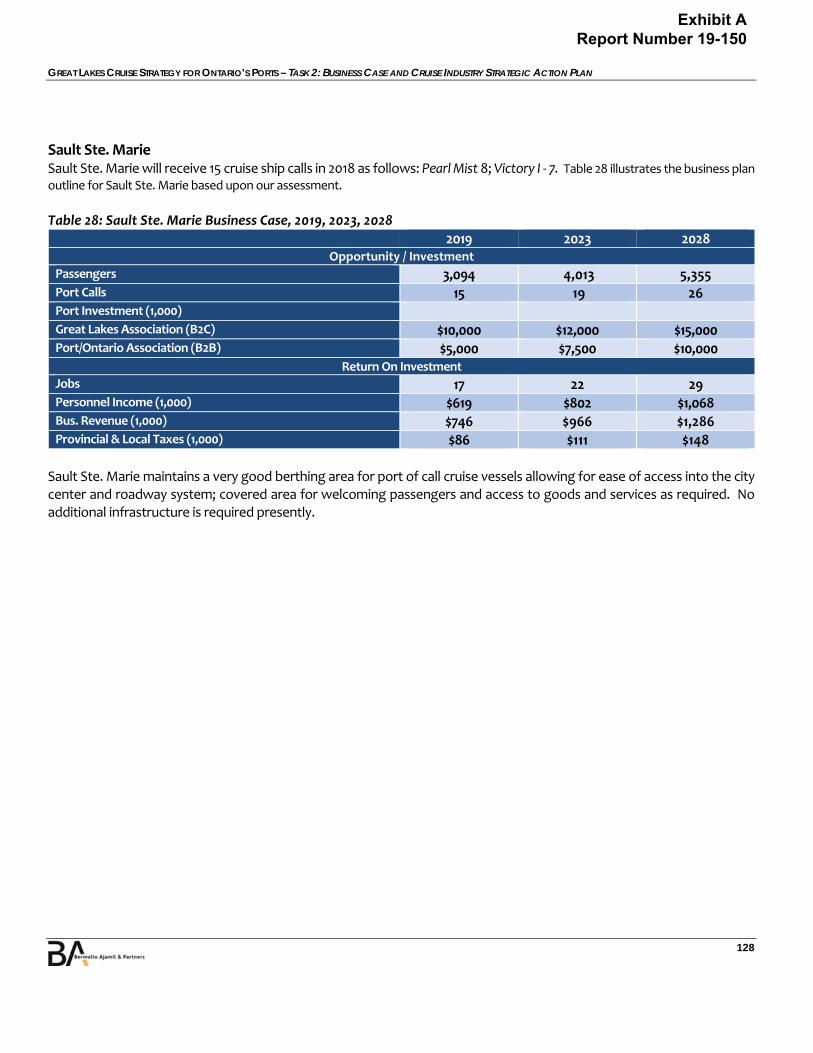
GREAT LAKES CRUISE STRATEGY FOR ONTARIO’S PORTS – TASK 2: BUSINESS CASE AND CRUISE INDUSTRY STRATEGIC ACTION PLAN
128
Sault Ste. Marie Sault Ste. Marie will receive 15 cruise ship calls in 2018 as follows: Pearl Mist 8; Victory I ‐ 7. Table 28 illustrates the business plan outline for Sault Ste. Marie based upon our assessment.
Table 28: Sault Ste. Marie Business Case, 2019, 2023, 2028
2019 2023 2028 Opportunity / Investment
Passengers 3,094 4,013 5,355 Port Calls 15 19 26 Port Investment (1,000) Great Lakes Association (B2C) $10,000 $12,000 $15,000 Port/Ontario Association (B2B) $5,000 $7,500 $10,000
Return On Investment Jobs 17 22 29 Personnel Income (1,000) $619 $802 $1,068 Bus. Revenue (1,000) $746 $966 $1,286 Provincial & Local Taxes (1,000) $86 $111 $148
Sault Ste. Marie maintains a very good berthing area for port of call cruise vessels allowing for ease of access into the city center and roadway system; covered area for welcoming passengers and access to goods and services as required. No additional infrastructure is required presently.
Exhibit A Report Number 19-150

GREAT LAKES CRUISE STRATEGY FOR ONTARIO’S PORTS – TASK 2: BUSINESS CASE AND CRUISE INDUSTRY STRATEGIC ACTION PLAN
129
Figure 33: City of Sault Sainte Marie15
Hard Infrastructure Cruise ship activity in Sault Sainte Marie occurs at Roberta Bonda Park and Marina, which is located on the downtown waterfront. The major shopping mall (Station Mall) in the city is one block from the pier, and the main shopping district (Queen Street) is two blocks away. Roberta Bonda can accommodate vessels with an LOA up to 124m and a draft up to 6.7m. The main berth features timber fenders with 14 bollards of mixed type and rating.
15 Sources: Google Earth; City of Sault Sainte Marie; lakeshoreexcursions.com
Roberta Bonda Park and Marina
Exhibit A Report Number 19-150
GREAT LAKES CRUISE STRATEGY FOR ONTARIO’S PORTS – TASK 2: BUSINESS CASE AND CRUISE INDUSTRY STRATEGIC ACTION PLAN
130
Roberta Bonda includes a tent immediately adjacent to the dock that is used for tour staging and provides weather protection for cruise passengers. There are also bathrooms nearby, as well as a large ground‐transportation area for motor‐coach loading/unloading and staging. Tugs are not required in Sault Sainte Marie. The Sault Sainte Marie International Airport is located 20km from the city center.
Soft Infrastructure Sault Sainte Marie was incorporated as a town in 1887 and a city in 1912, but is one of the oldest settlements in North America. For at least 2,000 years, people have lived beside the rapids of the St. Marys River, which provided an ideal environment for fish gathering for centuries for communities of Ojibwa. Jesuit missionaries, explorers, voyagers, artists, soldiers, and traders have also called Sault Sainte Marie home at different points during the past several centuries. Sault Sainte Marie is the third largest city in Northern Ontario, with a population of approximately 75,000. It is bordered to the east by the Rankin and Garden River First Nation reserves, and to the west by Prince Township. To the north, the city is bordered by Heyden, Goulais River, Searchmont, Batchawana Bay, and Pancake Bay. To the south is the Sault Sainte Marie Canal (Canada) and the famous “Soo” locks (U.S.). The City of Sault Sainte Marie welcomes cruise visitors by way of their “Ambassador Corp,” which is a local welcoming group affiliated with the Chamber of Commerce that greets each ship and provides visitor guides and maps to passengers. Sault Sainte Marie’s major attractions include the following:
o Agawa Canyon Tour Train This all‐day wilderness rail excursion takes approximately 40,000 people on a 70km round trip adventure between mid‐June and mid‐October (2 blocks)
o Canadian Bush plane Heritage Center A ~2,300m2 interactive museum dedicated to the history of float plane flying and aerial water bombing, this center features dozens of vintage planes and a 4D motion theatre with flight simulators all housed in an actual airplane hangar on the downtown waterfront – 3 blocks
o Ermatinger Clergue National Historic Site An interactive museum dedicated to the history of the Fur Trade and area industrialization. The experience includes a summer kitchen with food cooked on an open hearth and all staff in period costume – 1km
o AN additional popular day excursion a motor‐coach tour of the North shore of Lake Superior, including scenic stops along the way, hiking opportunities and a lunch stop at the Voyageur Cookhouse ‐ 200km round trip from Roberta Bonda
In addition to above, the following excursion is available for cruise passengers:
Mackinac Island Excursion Duration: 7 hours To this day, motorized vehicles are prohibited on Mackinac Island. Fort Mackinac was constructed by the British in 1780, and turned over to the Americans following the War of 1812. By the 1880s, the economy of Mackinac changed to focus on tourism. During this era, many of the Victorian homes were built, as well as the aptly named Grand Hotel. Highlights of this tour include:
o The Grand Hotel
Exhibit A Report Number 19-150
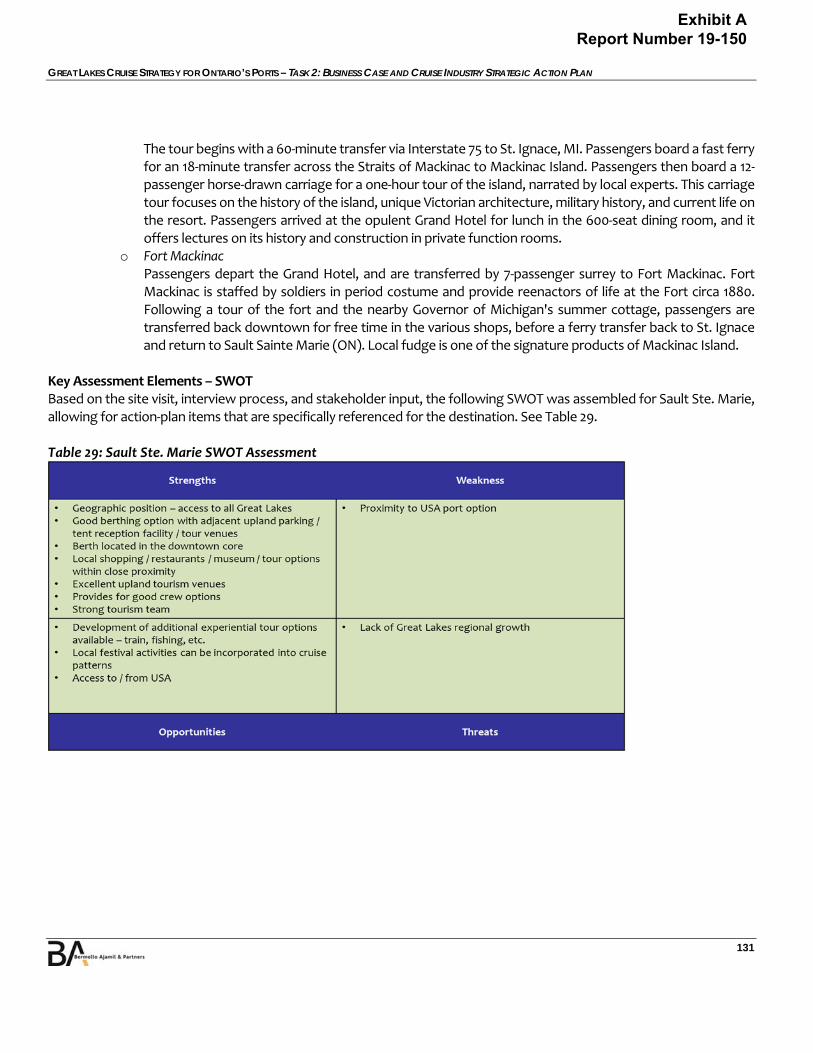
GREAT LAKES CRUISE STRATEGY FOR ONTARIO’S PORTS – TASK 2: BUSINESS CASE AND CRUISE INDUSTRY STRATEGIC ACTION PLAN
131
The tour begins with a 60‐minute transfer via Interstate 75 to St. Ignace, MI. Passengers board a fast ferry for an 18‐minute transfer across the Straits of Mackinac to Mackinac Island. Passengers then board a 12‐passenger horse‐drawn carriage for a one‐hour tour of the island, narrated by local experts. This carriage tour focuses on the history of the island, unique Victorian architecture, military history, and current life on the resort. Passengers arrived at the opulent Grand Hotel for lunch in the 600‐seat dining room, and it offers lectures on its history and construction in private function rooms.
o Fort Mackinac Passengers depart the Grand Hotel, and are transferred by 7‐passenger surrey to Fort Mackinac. Fort Mackinac is staffed by soldiers in period costume and provide reenactors of life at the Fort circa 1880. Following a tour of the fort and the nearby Governor of Michigan's summer cottage, passengers are transferred back downtown for free time in the various shops, before a ferry transfer back to St. Ignace and return to Sault Sainte Marie (ON). Local fudge is one of the signature products of Mackinac Island.
Key Assessment Elements – SWOT Based on the site visit, interview process, and stakeholder input, the following SWOT was assembled for Sault Ste. Marie, allowing for action‐plan items that are specifically referenced for the destination. See Table 29. Table 29: Sault Ste. Marie SWOT Assessment
Exhibit A Report Number 19-150

GREAT LAKES CRUISE STRATEGY FOR ONTARIO’S PORTS – TASK 2: BUSINESS CASE AND CRUISE INDUSTRY STRATEGIC ACTION PLAN
132
Thunder Bay Thunder Bay will not receive any cruise ship calls in 2018. Victory Cruises is expected to call in 2019, using it as the westernmost homeport. Table 30 illustrates the business plan outline for Thunder Bay based upon our assessment. Table 30: Thunder Bay Business Case, 2019, 2023, 2028
2019 2023 2028 Opportunity / Investment
Passengers 606 786 1,049 Port Calls 3 4 5 Port Investment (1,000) Great Lakes Association (B2C) $5,000 $10,000 $10,000 Port/Ontario Association (B2B) $2,500 $5,000 $5,000
Return On Investment Jobs 4 5 6 Personnel Income (1,000) $121 $157 $209 Bus. Revenue (1,000) $146 $189 $252 Provincial & Local Taxes (1,000) $17 $22 $29
Thunder Bay has an area that can be used to berth cruise vessels and with some minor clean‐up efforts provides for a nice area for small ships. There is space for a GTA and welcome center and access to the downtown core. The Port also has a marina in the central part of the downtown area that could also be used for smaller exploration ships should the need arise. There is a potential for a mixed‐use facility that may accommodate the current cruise berth, but that is still being contemplated. An investment in this for cruise only would not make for a good investment model. This is a port that could see much greater expansion, should the Lake Superior region be viewed as more of a small ship exploration market that could be based here for the entirety of the summer months due to the small ports, islands etc.
Hard Infrastructure Cruise ship activity in Thunder Bay occurs at the Pool 6 Cruise Dock, which is located approximately 1km from the city center, and 4km from the main shopping area. Vessels up to the maximum LOA that can fit through the locks can tie up alongside its 244m pier. Motor‐coach staging and other cruise‐related GTA activities occur at the pier, immediately adjacent to the cruise passenger embarkation/disembarkation area. There is no cruise terminal or weather‐protected structure for cruise passenger use at the Pool 6 Cruise Dock. Portable toilets are available within a short walk. Tugs are not required in Thunder Bay, but are regularly used during periods of strong winds. The nearest general aviation airfield/heliport is Thunder Bay International Airport, located 12km from the pier. Seaplanes can take off and land approximately 1.5km away. In addition, Thunder Bay is currently working to permit helicopter arrivals and departures at a site near the pier.
Exhibit A Report Number 19-150
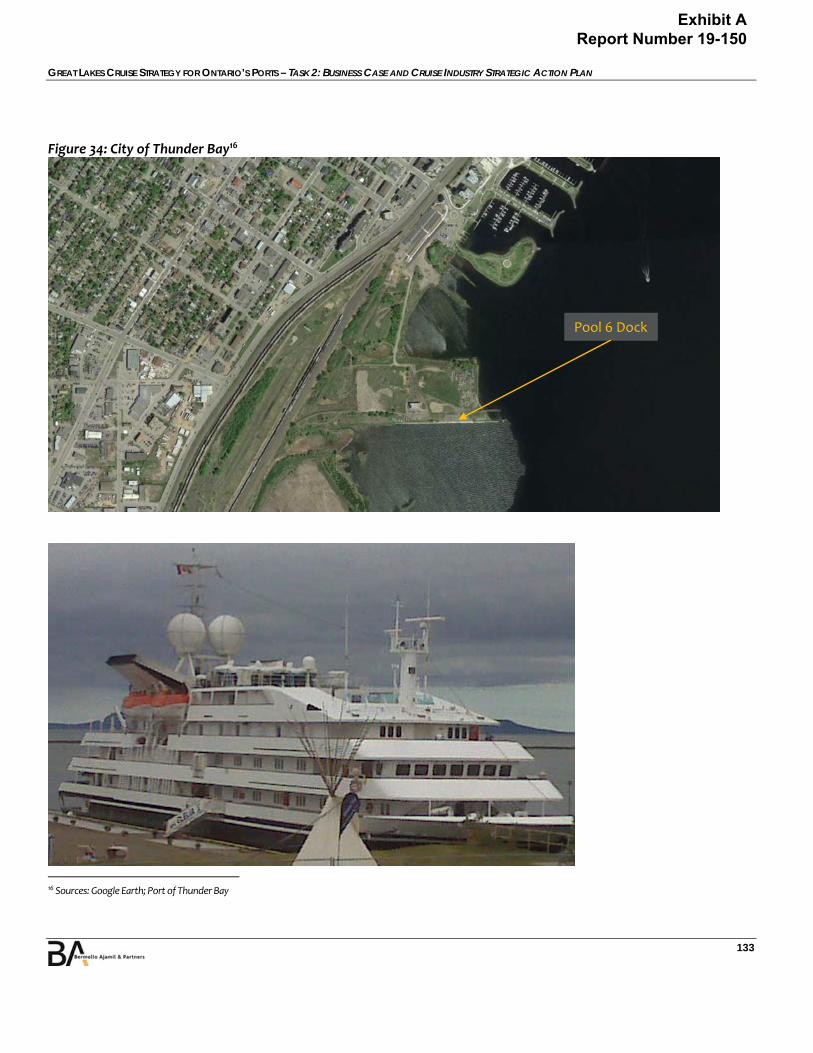
GREAT LAKES CRUISE STRATEGY FOR ONTARIO’S PORTS – TASK 2: BUSINESS CASE AND CRUISE INDUSTRY STRATEGIC ACTION PLAN
133
Figure 34: City of Thunder Bay16
16 Sources: Google Earth; Port of Thunder Bay
Pool 6 Dock
Exhibit A Report Number 19-150
GREAT LAKES CRUISE STRATEGY FOR ONTARIO’S PORTS – TASK 2: BUSINESS CASE AND CRUISE INDUSTRY STRATEGIC ACTION PLAN
134
Soft Infrastructure Thunder Bay is the largest city in Northwest Ontario, with a population over 120,000, which accounts for nearly half of the entire region's population. The city boasts art, music, film, and culinary scenes, and brands itself “Canada's Greatest Outdoor City.” Hiking, sailing, paddling, and mountain biking are among the main activities marketed to visitors. European settlement in the region began in the late 17th century, with a French outpost on the banks of the Kaministiquia River. The area eventually grew into an important transportation hub with the shipping of grain and other products from western Canada via the Great Lakes and the Saint Lawrence Seaway, to the east coast, becoming an important trade. Fur trading, forestry, and manufacturing all once played important roles in the city's economy. Today, Thunder Bay is the regional services center for Northwestern Ontario, and home to Lakehead University and Confederation College. Thunder Bay’s major attractions include the following:
o Fort William Historical Park o Kakabeka Falls o Bay and Algoma Finn Heritage District
Since Thunder Bay does not have any cruise calls in 2018, it is currently unclear which tour products will be available to cruise passengers in 2019 and beyond, though the above listed sites and activities are sure to figure prominently. Key Assessment Elements – SWOT Based upon the site visit, interview process, and stakeholder input, the following SWOT was assembled for Thunder Bay, allowing for action plan items that are specifically referenced for the destination. See Table 31. Table 31: Thunder Bay SWOT Assessment
Exhibit A Report Number 19-150
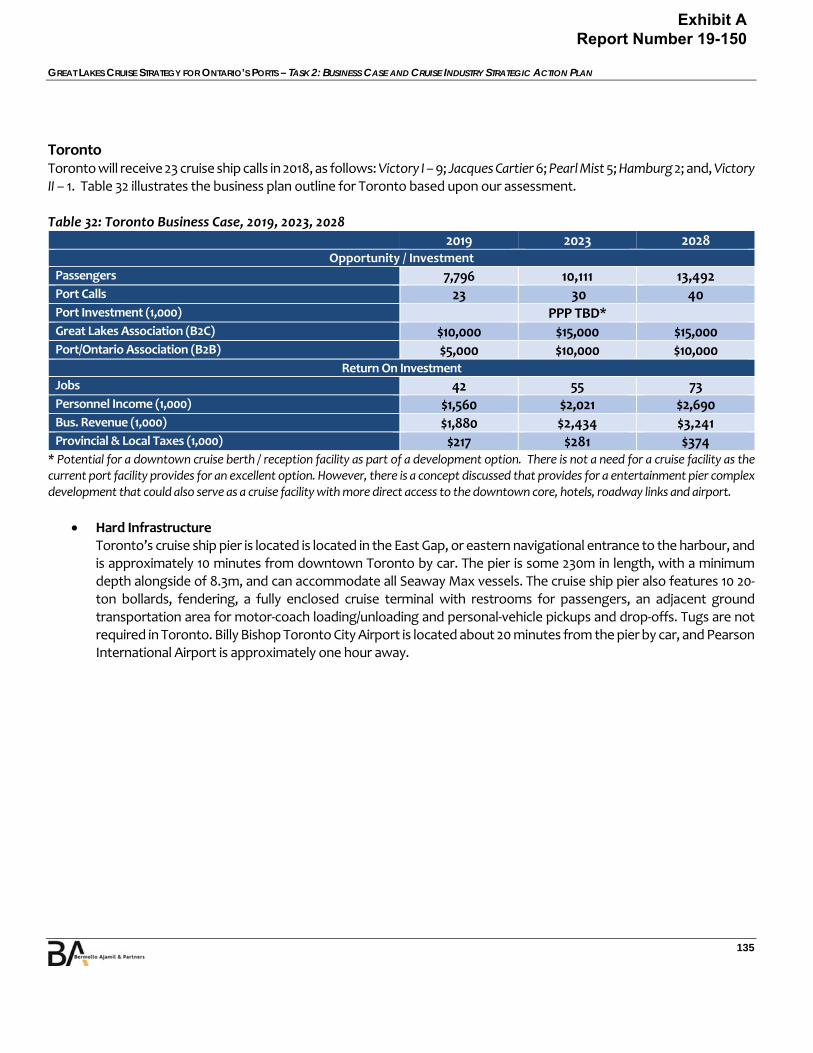
GREAT LAKES CRUISE STRATEGY FOR ONTARIO’S PORTS – TASK 2: BUSINESS CASE AND CRUISE INDUSTRY STRATEGIC ACTION PLAN
135
Toronto Toronto will receive 23 cruise ship calls in 2018, as follows: Victory I – 9; Jacques Cartier 6; Pearl Mist 5; Hamburg 2; and, Victory II – 1. Table 32 illustrates the business plan outline for Toronto based upon our assessment. Table 32: Toronto Business Case, 2019, 2023, 2028
2019 2023 2028 Opportunity / Investment
Passengers 7,796 10,111 13,492 Port Calls 23 30 40 Port Investment (1,000) PPP TBD* Great Lakes Association (B2C) $10,000 $15,000 $15,000 Port/Ontario Association (B2B) $5,000 $10,000 $10,000
Return On Investment Jobs 42 55 73 Personnel Income (1,000) $1,560 $2,021 $2,690 Bus. Revenue (1,000) $1,880 $2,434 $3,241 Provincial & Local Taxes (1,000) $217 $281 $374
* Potential for a downtown cruise berth / reception facility as part of a development option. There is not a need for a cruise facility as the current port facility provides for an excellent option. However, there is a concept discussed that provides for a entertainment pier complex development that could also serve as a cruise facility with more direct access to the downtown core, hotels, roadway links and airport.
Hard Infrastructure Toronto’s cruise ship pier is located is located in the East Gap, or eastern navigational entrance to the harbour, and is approximately 10 minutes from downtown Toronto by car. The pier is some 230m in length, with a minimum depth alongside of 8.3m, and can accommodate all Seaway Max vessels. The cruise ship pier also features 10 20‐ton bollards, fendering, a fully enclosed cruise terminal with restrooms for passengers, an adjacent ground transportation area for motor‐coach loading/unloading and personal‐vehicle pickups and drop‐offs. Tugs are not required in Toronto. Billy Bishop Toronto City Airport is located about 20 minutes from the pier by car, and Pearson International Airport is approximately one hour away.
Exhibit A Report Number 19-150
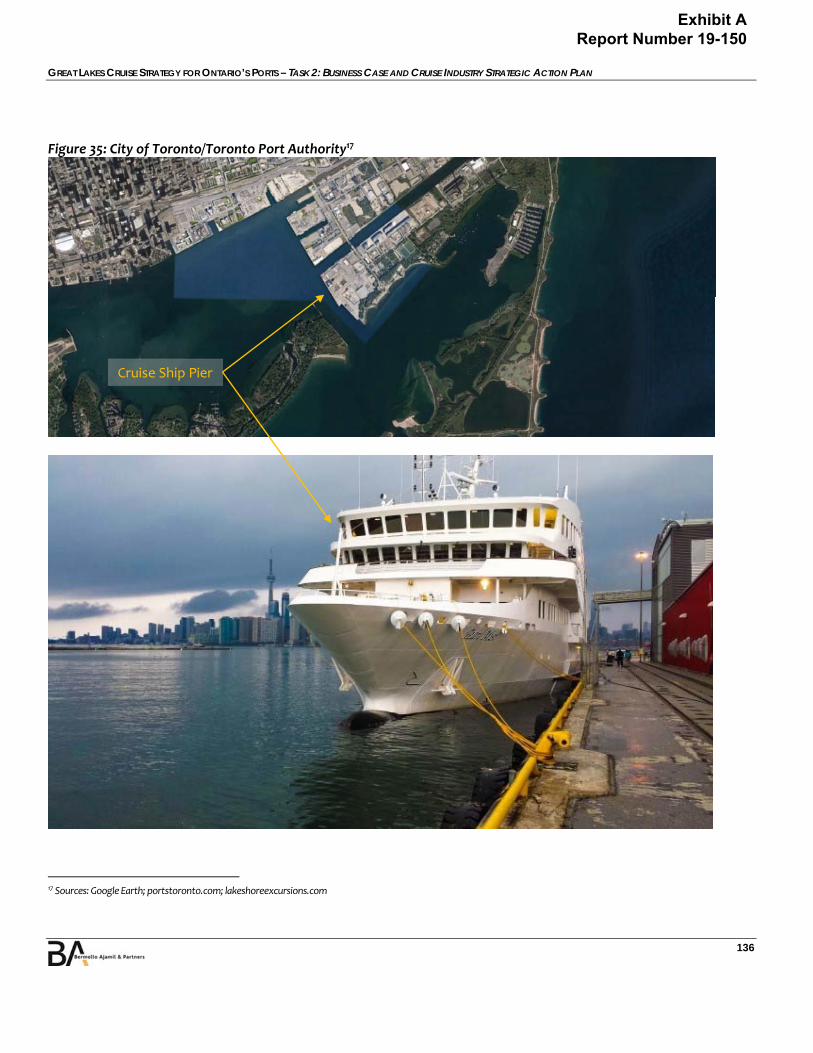
GREAT LAKES CRUISE STRATEGY FOR ONTARIO’S PORTS – TASK 2: BUSINESS CASE AND CRUISE INDUSTRY STRATEGIC ACTION PLAN
136
Figure 35: City of Toronto/Toronto Port Authority17
17 Sources: Google Earth; portstoronto.com; lakeshoreexcursions.com
Cruise Ship Pier
Exhibit A Report Number 19-150

GREAT LAKES CRUISE STRATEGY FOR ONTARIO’S PORTS – TASK 2: BUSINESS CASE AND CRUISE INDUSTRY STRATEGIC ACTION PLAN
137
Soft Infrastructure As Canada’s largest city, Toronto is a well‐known world‐class tourist destination, with all the amenities of a city of its size and complexity. It is dynamic, eclectic, and multicultural, with an outstanding nightlife, and is one of the world's top financial centers. Originally settled by the Iroquois tribe, the French briefly settled here in the 1750s before the British arrived at the end of the 18th century, led by Governor John Graves Simcoe. Today, Toronto is a major center for communications, transportation, business, entertainment, and higher education. Following many waves of immigration over the past century and a half from various countries worldwide (including Europe, Asia, the Caribbean, and Africa), the greater Toronto population exceeds five million, and is extremely diverse. Toronto’s major attractions include the following:
o Canadian National (“CN”) Tower – 12 minutes driving o Ripley's Aquarium – 12 minutes driving o Distillery District – 5 minutes driving
Due to its extensive international flight connections, large metropolitan population, and cruise passenger facilities and services, Toronto serves as the principal cruise homeport in Ontario for oceangoing vessels. For ports of call, given its size and scale, it is B&A’s understanding that the most popular shore excursion is a half‐day “Toronto highlights” sightseeing tour, which is summarized below. Toronto Highlights Tour Duration: 4 hours Cruise passengers tour the city via motor coach, visiting areas that include:
o Chinatown o Greek town o Little Italy o Kensington Market o Rosedale o Yorkville o Distillery District o Theater District o Central Business District (including a stop at the famous St. Lawrence Market)
This tour also visits the Art Gallery of Ontario (AGO), one of the largest fine arts museums in North America, designed by American architect Frank Gehry. In addition to the highlights tour described above, independent passengers have numerous opportunities to explore the city, including other places of interest, such as:
o Fort York Houses Canada's largest collection of original buildings from the War of 1812 period
o The Royal Ontario Museum Canada's largest museum of world culture and natural history
Exhibit A Report Number 19-150
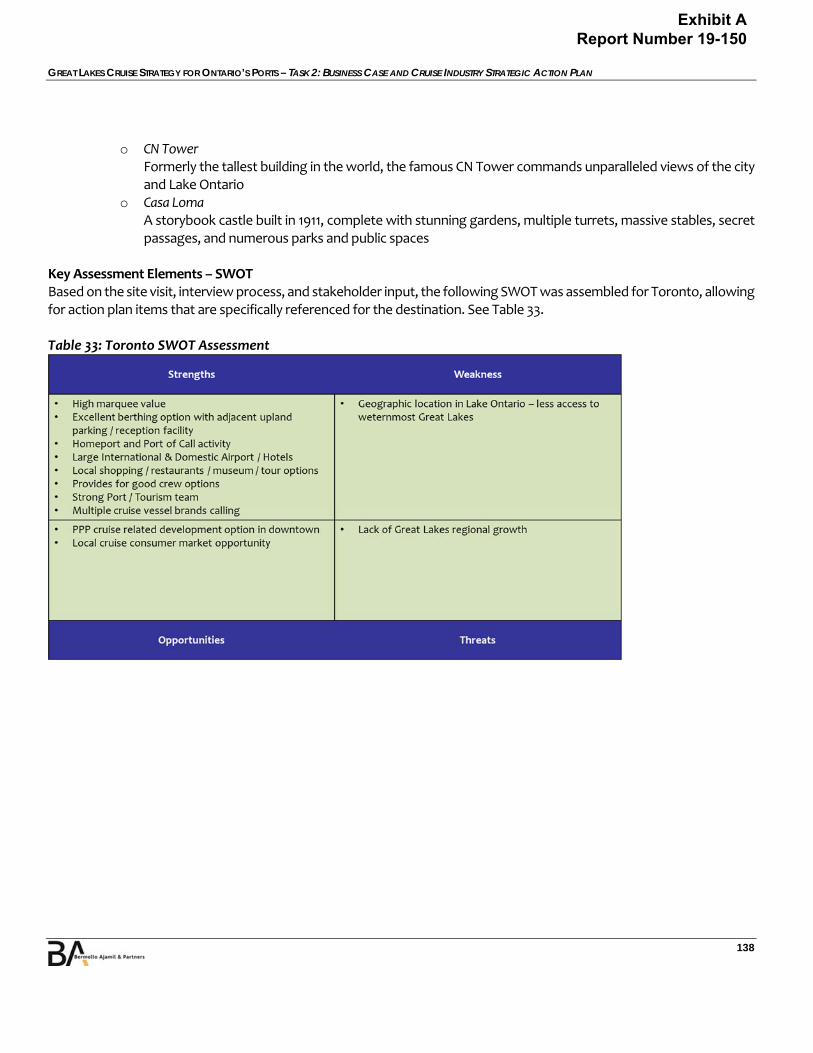
GREAT LAKES CRUISE STRATEGY FOR ONTARIO’S PORTS – TASK 2: BUSINESS CASE AND CRUISE INDUSTRY STRATEGIC ACTION PLAN
138
o CN Tower Formerly the tallest building in the world, the famous CN Tower commands unparalleled views of the city and Lake Ontario
o Casa Loma A storybook castle built in 1911, complete with stunning gardens, multiple turrets, massive stables, secret passages, and numerous parks and public spaces
Key Assessment Elements – SWOT Based on the site visit, interview process, and stakeholder input, the following SWOT was assembled for Toronto, allowing for action plan items that are specifically referenced for the destination. See Table 33. Table 33: Toronto SWOT Assessment
Exhibit A Report Number 19-150

GREAT LAKES CRUISE STRATEGY FOR ONTARIO’S PORTS – TASK 2: BUSINESS CASE AND CRUISE INDUSTRY STRATEGIC ACTION PLAN
139
Windsor Windsor will receive 8 cruise ship calls in 2018 as follows: Victory I – 8. Table 34 illustrates the business plan outline for Windsor based upon our assessment. Table 34: Windsor Business Case, 2019, 2023, 2028
2019 2023 2028 Opportunity / Investment
Passengers 1,616 2,096 2,797 Port Calls 8 10 14 Port Investment (1,000) Great Lakes Association (B2C) $10,000 $15,000 $15,000 Port/Ontario Association (B2B) $5,000 $10,000 $10,000
Return On Investment Jobs 8 11 16 Personnel Income (1,000) $323 $419 $558 Bus. Revenue (1,000) $390 $505 $672 Provincial & Local Taxes (1,000) $45 $58 $77
Hard Infrastructure The Port of Windsor provides excellent berthing facilities. Cruise ship activity in Windsor occurs at Dieppe Gardens Docking Facility, which is located on the downtown Windsor waterfront. Dieppe Gardens can accommodate vessels with an LOA up to nearly 300m and a draft up to 6m. The main berth features rubber tire fendering with 19 bollards of mixed type and rating. Dieppe Gardens does not feature a terminal or other weather protected space and there are no bathrooms at the dock. There is a parking and motor‐coach loading/unloading and staging area immediately adjacent to the berth, as well as a nearby park/green space. Tugs are not required in Windsor. The nearest airfield/heliport/international airport is located within 12km.
Exhibit A Report Number 19-150
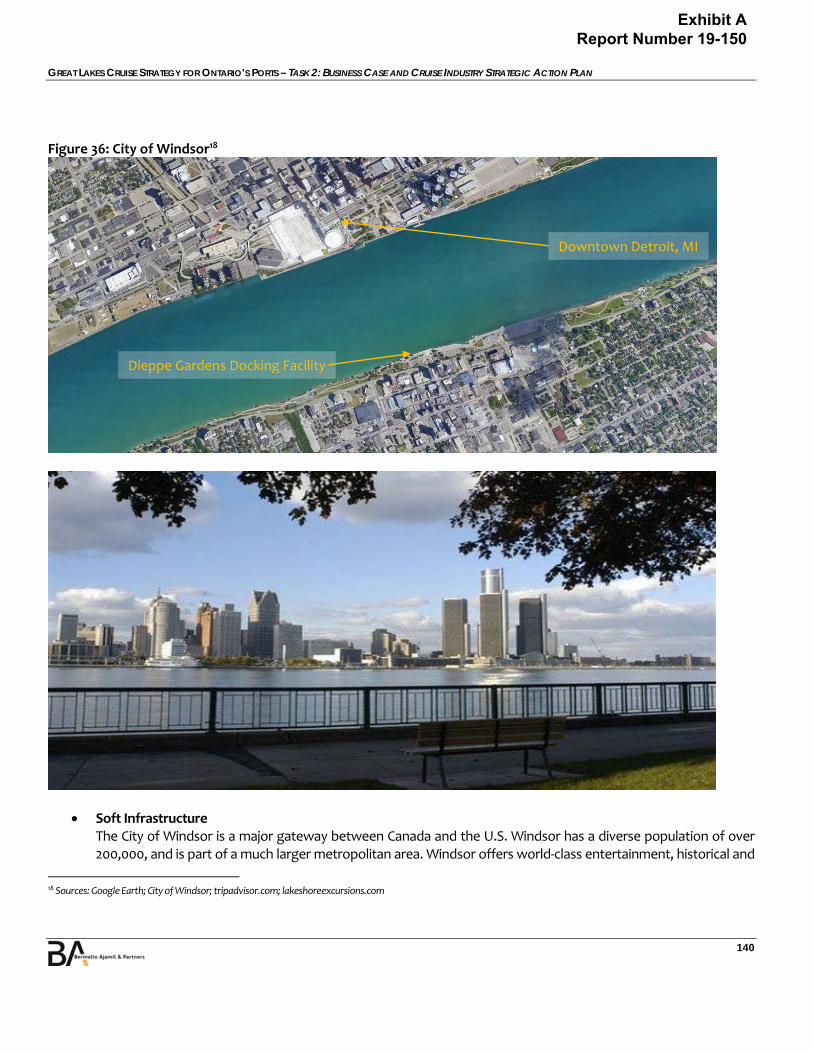
GREAT LAKES CRUISE STRATEGY FOR ONTARIO’S PORTS – TASK 2: BUSINESS CASE AND CRUISE INDUSTRY STRATEGIC ACTION PLAN
140
Figure 36: City of Windsor18
Soft Infrastructure The City of Windsor is a major gateway between Canada and the U.S. Windsor has a diverse population of over 200,000, and is part of a much larger metropolitan area. Windsor offers world‐class entertainment, historical and
18 Sources: Google Earth; City of Windsor; tripadvisor.com; lakeshoreexcursions.com
Dieppe Gardens Docking Facility
Downtown Detroit, MI
Exhibit A Report Number 19-150
GREAT LAKES CRUISE STRATEGY FOR ONTARIO’S PORTS – TASK 2: BUSINESS CASE AND CRUISE INDUSTRY STRATEGIC ACTION PLAN
141
cultural landmarks, and numerous waterfront parks and gardens. Windsor remains a major contributor to Canada's automotive industry, even though economic activity in this sector is down significantly from its historical peak. Located across the Detroit River from the Motor City, Windsor is also known as the Automotive Capital of Canada. In recent years, the city has revitalized itself, and according to the city’s website, it’s home to a vibrant art scene and many young creatives. Windsor also offers recreational and outdoor activities, including 215 parks encompassing 2,800 acres of green space. Windsor’s major attractions include:
o Detroit, MI o Art Gallery of Windsor/Chimczuk Museum o Hiram Walker Distillery o Essex County Wine Tours o Caesars Windsor Casino and Resort
Historic Willistead Manor and Mackenzie Hall are also available to tour. What follows is a brief description of these attractions, including tours currently available to cruise passengers.
Detroit Excursion Duration: 5 hours Across the border in Detroit, MI, the Port of Windsor provides access to some of the most popular U.S.‐based tourist destinations within the Great Lakes region. The Henry Ford Museum positions itself as 'Americas Greatest History Attraction.' This destination is located at the same site as its partner facility Greenfield Village. Transfer time from the ship docked in Windsor to the Ford Museum in Dearborn, MI is approximately 50 minutes. Guests on this excursion are provided with guided access to both of these locations, as well as horse drawn transport and transfers on a vintage Model T Ford automobile. Numerous exhibits and events are available for the passenger at these two facilities, as well as shopping and dining options.
Art Gallery of Windsor/Chimczuk Museum Duration: 3‐4 hours Established in 1943, the Art Gallery of Windsor has a mandate as a public art space to show significant works of art by local, regional, and national artists. The Art Gallery of Windsor has created, collected, presented, and conserved one of Ontario's most significant collections of Canadian art, and is one of Windsor's most notable cultural reserves, with a permanent collection of approximately 4,000 paintings, sculptures, and works on paper. Co‐located with the Art Gallery of Windsor, the Chimczuk Museum is a premier museum destination that houses permanent exhibits on the history of the Windsor area, the Original People’s Culture and Legacy, and the development of The City of Windsor. The site also features a state‐of‐the‐art Children’s Gallery and Learning Space, with opportunities for hands‐on exploration for the young and young‐at‐heart, two galleries for travelling and temporary exhibitions, and a gift shop.
Hiram Walker Distillery Duration: 1hour The Hiram Walker distillery is a massive spirits‐making complex, said to produce a good majority of Canadian whisky. The facility has long been closed to most public access, but now offers limited public tours through WindsorEats, a local culinary tour operator, and Corby Spirits (Pernod Ricard’s Canadian arm). Tour groups are
Exhibit A Report Number 19-150

GREAT LAKES CRUISE STRATEGY FOR ONTARIO’S PORTS – TASK 2: BUSINESS CASE AND CRUISE INDUSTRY STRATEGIC ACTION PLAN
142
limited to 16 people at a time. The tour includes a hosted tasting of four Canadian whiskeys. A fifth tasting is offered directly from a whiskey barrel.
Essex County Wine Tours Duration: 4 hours+
The Essex County wine route includes a number of cozy bed and breakfasts, as well as many standalone restaurants. Uniquely, in addition to guided tours and independent driving tours, visitors can access many wineries in Essex County by a bicycle trail that hugs the Lake Erie North Shore. Numerous tours are offered by numerous operators. Below is a sample itinerary: North Shore Wine Adventure
o Wine tasting at 4 wineries, with tasting fees included o A tour of the winery’s production facilities o A delicious, relaxing lunch at a restaurant featuring local specialities and a glass of wine o Shop at winery boutiques (Many wines are only available at the winery.) o Personalized Tours (Choose the wineries you would like to visit.)
Caesars Windsor Casino and Resort (“Caesar’s Windsor”) Caesars Windsor is one of four casinos in the Detroit–Windsor metropolitan area. Owned by the government of the province of Ontario, it is operated by Caesars Entertainment. The casino is located on Windsor's riverfront overlooking the Detroit skyline near the Canadian end of the Detroit‐Windsor Tunnel. Like other major casinos, Caesar’s Windsor offers a diverse range of gambling and entertainment options.
Key Assessment Elements – SWOT Based on the site visit, interview process, and stakeholder input, the following SWOT was assembled for Windsor, allowing for action plan items that are specifically referenced for the destination. See Table 35. Table 35: Windsor SWOT Assessment
Exhibit A Report Number 19-150
GREAT LAKES CRUISE STRATEGY FOR ONTARIO’S PORTS – TASK 2: BUSINESS CASE AND CRUISE INDUSTRY STRATEGIC ACTION PLAN
143
Key Action Plan Elements The port visits, stakeholder and cruise line outreach, and projection development in the prior sections provides for an assessment of the opportunities and challenges associated with the potential development of the Great Lakes as a cruising region moving forward. Assembling a business case for the development of cruise tourism to the region and the Ports of Ontario is difficult when measured against the competitive regions, such as Alaska, Mediterranean, Caribbean, Baltic, Norwegian Fjords, and Canada & New England. The reasons are the scale of the opportunities in the present and future, as well as its impact on regional and land‐based tourism activities. However, cruise tourism does provide for a niche tourism product in the region, and added socioeconomic impacts to several cruise tourism related communities, using existing hard‐port infrastructures, tourism products, and services that exist as part of the overall tourism element in the region. Therefore, the scale to which ports, tourism entities, provinces, states, and cruise‐line stakeholders contribute to its growth must be addressed about the ROI for those parties. Key elements to consider in the business case are as follows: Cruise capacity impacts
There is a limit to the cruise capacity that can enter the Great Lakes region, due to the physical barriers of the St. Lawrence Seaway and Great Lakes Locks (~38,000 cruise passengers per annum based on the total worldwide small exploration ship fleet lower berth capacity that has access to the Great Lakes).
o Due to the competitive nature of the cruise industry, this passenger‐volume opportunity is further reduced, as illustrated in our projection modelling for the Great Lakes, to between 15,176‐passengers (Low – market capture) to 18,798‐regional passengers (High Scenario composite) by 2028. This number is relatively consistent with the current small‐ship passenger market of a
regional competitor (such as Alaska’s), but these other regions have the benefit of utilizing the strong volumes of the large oceangoing fleets to market the region to the consumer and cruise lines on a broad level.
o The economic impact to the Ontario ports is estimated to be ~ $9.7 million, with about 100 induced jobs per annum, and provincial and local taxes of $1.1 million in 2028. See the entire Economic impact section for specific data on the regional and Ontario specific impacts. Based on our observations, there is presently little direct economic benefits for the ports,
cities, and service providers, due to the current methodology of charging, small overall volumes, and use of marina docks and parking lots, as well as assistance with tour assembly.
Tariffs should be based upon a combination of actual per passenger throughout per vessel (homeport – in and out & Port of Call – one way); dockage based upon the LOA or Tonnage of the vessel; line handling charge for docking and undocking; fees for water hookup and water per ton or other method of measure; garbage collection; grey water collection; bunkering; provisioning and services; Security; and, other operations.
o Each port should have a consistent methodology for charging. o The tariff should have the ability to be flexible to allow for pass through to
the passenger.
Exhibit A Report Number 19-150
GREAT LAKES CRUISE STRATEGY FOR ONTARIO’S PORTS – TASK 2: BUSINESS CASE AND CRUISE INDUSTRY STRATEGIC ACTION PLAN
144
Infrastructure needs
When beginning this process and undertaking the interviews and site visits, it seemed the development of port infrastructure may be a primary issue. However, our recommendation is to utilize the existing infrastructure in the key ports to its greatest extent, while developing relationships with the cruise line industry and promoting and building the region for new cruise tourism growth.
Port and tourism infrastructures that meet the needs of the cruise line and visitors, both today and tomorrow are req1uired, which include:
o Berths and upland cruise reception and service facilities that meet the vessel design capacity and demand for future deployments
o Upland tourism infrastructures (e.g., transportation, information, venues, sites, roadways, and city services) that provide an atmosphere conducive to tourism prosperity
Kingston requires added cruise infrastructure to capture new traffic due to its lack of a pier to accept larger cruise vessels. All of the other ports visited have existing infrastructure that can be used / modified / enhanced to support growth over the 10‐year period, based on the projection model.
Midland, Toronto, and Thunder Bay may be presented with PPP development options, including cruise infrastructure that will benefit the communities with new cruise growth, but none of them will specifically be required to support or sustain cruise tourism unless the opportunity to use existing port berths is no longer available.
o Dual and mixed uses provide a great opportunity to enhance the waterfront for local uses, and land‐based and cruise tourism. Each opportunity illustrated above provides for a different set of development criteria and an overall business case, based on the needs and expectations of the community.
Organizational Needs and Structure
The Great Lakes is a large, relatively protected region separating the U.S. and Canada (mainly the province of Ontario and multiple states), tourism entities, and local jurisdictions, all with a stake in the cruise tourism opportunity. To date, assembling a workable union of all parties has been a struggle.
o This situation is similar to the Canada & New England region in this regard, and they have worked to overcome many of the financial, regulatory, and leadership challenges associated with the geography of the region, and have worked to form organizations that have been successful in moving cruise tourism forward. Other examples of regional organizations include Cruise Baltic (plus 50 members) and MedCruise (plus 100 members). The benefit that all of the above regional organizations have is cruise‐tourism volume and
anticipated solid growth with no limits, except ones that are self‐imposed. o What does developing the “right” organizational structure for the entirety of the Great Lakes region
and corresponding local cruise networks (to provide for the support and development of products, services, etc.) look like? The GLCC has been the primary driver of cruise development in the Great Lakes since 1997,
with ~30 members and relationships with the Cruise the St. Lawrence and the Atlantic Canada Cruise Association.
Exhibit A Report Number 19-150

GREAT LAKES CRUISE STRATEGY FOR ONTARIO’S PORTS – TASK 2: BUSINESS CASE AND CRUISE INDUSTRY STRATEGIC ACTION PLAN
145
The Ontario‐based Cruise Ship Industry Group (CSIG) and Cruise Ontario (CO) are organized by the member ports in the region, and are looking to expand cruise tourism as an economic development tool.
The GLCC goals are “designed to pave the way for cruise ship owners and operators to bring their vessels into our magnificent lakes.” A requirement is providing a platform for success for the region. The GLCC is also focused on regulatory issues impeding growth, such as pilotage and cross‐border immigration.
Clearly, the leadership of the organization has strong regional and cruise‐industry knowledge, but if there is to be progress made in the short‐ to mid‐term, a new model must be implemented.
B2C and B2B Association Models
To expand cruise tourism to the region, the primary goal of an association should be the development of a consumer market to demand cruise in the Great Lakes.
o To achieve this goal a regional association should be formed with this primary purpose – creating a consumer market for cruise tourism ‐ primarily North American and secondarily World.
o The Great Lakes Cruise Association would focus on B2C market development with cruise brands, tourism boards, tour operators, and travel agents and direct to consumer programs that target key demographic markets to produce new and repeat cruise passengers to the region. A funding mechanism is critical for this association to be successful.
Requirement min. 1 full time staff with a Cruise Marketing focus. This person may be contractual in nature with additional staffing to support as required.
Need for shared / program monies for business development opportunities, marketing programs, content / materials development, trade shows, etc.
A membership board would steer the organization made up of State and Ontario provincial Tourism entities, Great Lakes Coalition and Ports and other identified key stakeholders that would represent the Local Cruise Networks.
o Being creative and using existing lines of communication already developed by the State and Provincial tourism entities to promote and educate consumers about cruise opportunities in the Great Lakes and target specific consumer market segments will be critical, in order to maximize a budget. Key tour operators and cruise line brands will provide excellent partners for marketing. The development of an overall marketing strategy for the Great Lakes that is driven by a
“brand” regional image must be developed, to drive demand development. This goal includes messaging, promotes development, and is driven by clear goals and objectives defined by set Key Performance Indicators (KPIs). They should include meeting the projection model outlined and achieving socioeconomic impacts amongst others. The KPIs for individual ports may also vary.
o Critical to the success of the strategic plan and subsequent marketing effort are the focus and consistency of both the message and the messenger(s). In the case of the Great Lakes, the message has not been “loud and broad enough” to impact consumer demand and influence cruise brand
Exhibit A Report Number 19-150
GREAT LAKES CRUISE STRATEGY FOR ONTARIO’S PORTS – TASK 2: BUSINESS CASE AND CRUISE INDUSTRY STRATEGIC ACTION PLAN
146
deployments. The secondary goal is developing the necessary products and services in the ports to be visited, to meet the needs and expectations of the cruise industry, specifically the visitor.
The secondary goal is to develop / evolve the necessary products and services in the ports visited, to meet the needs and expectations of the cruise industry.
o To achieve this goal, a loose Ontario Ports Association should be created with a foundation of Local Cruise Networks that are the heart of the B2B directive. The broader Great Lakes Cruise Association should work with and encourage the
development of Local Cruise Networks in all ports throughout the Region (USA and Canada) to take on the role of B2B with the cruise industry.
The Local Networks would be made up of key stakeholders such as the Port, Tourism, Port Agent, Tour Operator, Venues, Chamber of Commerce, Retailers, etc.
Direct funding would be minimal for these organizational structures as not full time staff is required; no offices, etc. The funds would be directed toward FAM trips for cruise line executives, B2B market trips, and local development as required.
Membership monies would be reserved for the primary Great Lakes Cruise Association to drive the consumer market demand.
Planning Needs – B2C, B2B Cruise‐line deployment decisions begin with their marketing groups; it is essential that these decision‐makers have the correct information and a clear understanding of the potential available in their itinerary formulation, both from a point of view of servicing their onboard guests, and their long‐term marketing efforts to capture new passenger bases within a specific region. The creation of cruise itineraries that fit within that targeted consumer’s vacation patterns is essential in defining the product, and offering it to the many consumer markets worldwide. The deployment of cruise vessels closer to base cruise consumer groups allowing the passenger to forego air travel may also be beneficial to the growth of the Great Lakes. This model has strengthened the Atlantic Canada market, as brands have deployed their ships to the northeast region year‐round to bring the vessels close to the brand’s key demographic consumer target. New York is used as a year‐round homeport for sailings to the Bahamas and Caribbean, and seasonally to Canada & New England, the Transatlantic, Bermuda and The World Islands. Placing the right cruise vessel in the right itinerary is a key to the overall success of a cruise line. Not all cruise homeports or ports of call fit every cruise line’s brand philosophy; they cannot be everything to all lines. In the mid‐term itinerary, planning will continue to be driven by profitability and net yields. Lines will limit time in ports, and yet expect to create value experiences. The latter, value experiences, is where the ports in the Great Lakes, specifically Ontario, should focus much of their attention in the enhancement and the development of new cruise products that may also provide a strong market for land‐based and local consumer markets within and outside of the summer cruise seasonality, and meet the needs of new cruise brands looking to enter the market with a broader consumer demographic than exists today. Passenger demand is key. Moving forward, there will be more pressure on regions and ports to keep expenses low and regulatory issues in check, while providing for increased cruise‐line revenue opportunities. The main reasons why cruise lines visit a destination are as follows:
Consumer demand
Revenue opportunities
Exhibit A Report Number 19-150
GREAT LAKES CRUISE STRATEGY FOR ONTARIO’S PORTS – TASK 2: BUSINESS CASE AND CRUISE INDUSTRY STRATEGIC ACTION PLAN
147
Return on investment ‐ costs v. revenue
Passenger satisfaction
Safety and security
Fit of the itinerary The order of these items may vary, depending on each cruise line and its operating policies, but the most important of these factors remains “consumer demand” (i.e., “where passengers want to travel”). This concept applies to all cruise lines, and understanding it is relevant to building a strong message for the consumer (B2C) and cruise line (B2B). Considering the itinerary preparations and requirements, in terms of how ports and destinations are selected by cruise lines, is essential to then knowing how a “message” must be composed to approach each cruise brand. As a business, cruise lines are driven by profitability / net yields (ticket price, onboard spend, and shore‐side revenues). They place their vessels in the destinations that allow for the best ROI and highest passenger satisfaction to ensure repeat business. Cruise lines and travel agents survey the passengers before and after their cruises, in order to find out what their preferences are regarding ports and regions, as well as to obtain feedback regarding their onboard and shore‐side experiences (i.e., delivery vs. expectations). The most well‐known and popular cruise destinations are also the destinations, which have been able to establish well‐recognized brand awareness in the consumer’s minds. In most cases, they also allow for excellent shore excursion options and high passenger‐satisfaction ratings. Passengers take notice of any new destinations visited in which they had positive, unforgettable experiences. The higher the satisfaction levels of the visitors, the higher the demand will be. A priority for the Great Lakes region is to educate the consumer, while creating the proper conditions to deliver an outstanding experience to the visitor. Cruise lines need to create a strong message directed to the cruise community and corporations that communicates:
Change and improvement.
Commitment to work together, and with the industry, to develop mutual opportunities.
Positioning the Great Lakes as a premium / exploration cruise destination.
Ontario Cruise Brand Development Option In projection modeling, there were scenarios developed for the entirety of the Great Lakes. However, there may be a more direct option for growth for Ontario, based on the division of the zones or smaller sections, such as the Georgian Bay. This option would be the direct development of a cruise brand product (PPP) for the Ontario region to support more direct growth and economic impacts to the ports. With the SS Keewatin, there is a historical context from which to draw that could be the platform for a new cruise brand business (which may already exist)—and may be seasonal in nature, chartered, or deployed to another key market, depending on the consumer profile. It may be the most direct way to increase cruise tourism to the region, and thereby socioeconomic impacts to the Ontario ports. It may also have the highest monetary risk. However, there would likely be greater control of the product, pricing, and operational costs.
Exhibit A Report Number 19-150
GREAT LAKES CRUISE STRATEGY FOR ONTARIO’S PORTS – TASK 2: BUSINESS CASE AND CRUISE INDUSTRY STRATEGIC ACTION PLAN
148
Positioning the Great Lakes on the Global Cruise Map The Great Lakes’ success as a cruise tourism region moving forward will depend on creating / rebranding a successful cruise tourism ecosystem that provides a platform for success. Within this system, the primary focus should be on the development of a primary North American domestic market and secondary European market in the short‐ to mid‐term, which would take advantage of the existing cruise brands and distribution channels for educating and promoting the region to consumers. However, the current system limits the consumer demographic, as the primary target is typically related to the group / charter. To be successful long‐term, the larger individual consumer market must be activated. Thus, working with Provincial and State tourism bodies, cruise brands, and CLIA to address media and travel‐agent groups will be critical to expanding demand. At the same time, a regional organization can focus on the region’s regulatory issues to provide for lower operating costs to the cruise brands. For Ontario ports, providing for the right‐sized cruise berth and hard upland support infrastructure to support the design vessel template; ensuring continuity in operations (e.g., berthing process, fee structure, security, welcome, and ground transportation processes); and developing product and venue innovations for an expanded consumer demographic are critical for success. With those items resolved, the primary focus is the development of consumer demand for cruise as an experience, using Ontario ports as the primary base of operations. To accomplish this task, a number of fundamental items must be addressed immediately to allow for success to occur. They include the following:
Creating and developing the right market atmosphere. From a demand perspective, there will be opportunities for the cruise industry to market and sell cruises in the Great Lakes that meet the needs and expectations of the target demographic(s). In the mid‐ to long‐term, a number of brands will be participating in the market, but as of now, this number is targeted toward a specific demographic. Thus, both the onboard and shoreside products and services, as well as a marketing system, must be developed for the needs and demands of the industry. These items include the following:
o Marketing and educational campaigns targeting key North American consumer groups, and
illustrating the positive aspects of a Great Lakes cruise product (and Europe / Asia, as the industry expands)
o Shoreside programming, shore excursions, and independent activity information crafted for the consumer markets activity levels and desires (exploration / luxury).
Additional items of importance required to lay the foundation for success include: o Redefining a more applicable pilotage charging system to small cruise ships o Providing for a cross‐border immigration process for Great Lakes cruise tourism to allow for ease of
access and itinerary development (not a high priority, but could be a solid message) o Installing / continuing adequate security procedures that do not impede movement of guests to and
from the cruise vessel o Taxation regime that does not overburden the cruise line with direct taxes or tax implementations
to the passenger (which may be more of a concern with provisioning of vessels – USA v. Canada for homeport operations)
Exhibit A Report Number 19-150
GREAT LAKES CRUISE STRATEGY FOR ONTARIO’S PORTS – TASK 2: BUSINESS CASE AND CRUISE INDUSTRY STRATEGIC ACTION PLAN
149
o Tariff regime for cruise vessels that is internationally comparable, which is consistent throughout the region, and seen as viable for a new market start‐up, as well as being easily implemented and passed through to the consumer as needed (potential bundling of fees). Single‐unit charge per passenger (homeport and port of call) – may include security, line
handling, and dockage charge Standard fees:
Water charges, including hook‐up and per‐liter rate (may be a pass‐through from the city)
Waste disposal per container / ton / unit
Oily waste, bilge, and grey water disposal to meet all national and IMO criteria
Cruise Tourism Marketing & Promotions In the Great Lakes and Ontario, Cruise Tourism must be seen as a subsector of Tourism, which is a rapidly growing industry worldwide. However, there are obvious limitations to the growth of Tourism, as currently seen in the Great Lakes. However, it is still a contriubtor for economic development and employment generation, and there is certainly potential for growth. Nevertheless, the small overall capacity in the region, shortage of capital, and lack of effective destination are obstacles for Cruise Tourism development.
Most of the Great Lakes destinations are focused on land‐based tourism development. Cruise tourism needs to be developed in coordination with this effort, via promotion. Cruise is seldom promoted in most areas, due to low demand and lack of visibility.
The Great Lakes region (including Ontario) has not provided a leader (for the development of consumer demand, coordiantion of bodies, promotions, investments, and oversight) that can provide cohesion to the entire region. However, cohesion is no small task, and requires a full‐time effort.
The goal for the Great Lakes Region could be to become a world‐class cruise destination with a higher volume of exploration. Therefore, luxury cruise passengers passing through its ports need to establish a close secondary domestic source market to generate substantial socioeconomic impacts in Ontario. In other words, Ontario needs to promote itself to the surrounding Great Lakes population. The Great Lakes region needs to establish itself as a unique cruise opportunity, in order to develop and grow as a true cruise destination. Today, the cruise product in this region lacks demand, and needs to strengthen its weak passenger deployment pattern, which features predominantly seasonal charter cruises. A strong Marketing / Communication Strategy is one of the most important vehicles to accomplish this goal and drive success to the Great Lakes. Current cruise industry feedback about the potential of the region is strong, but tempered by the fact that there are limited cruise vessels and a strong competition for traffic elsewhere in the world that provides easier access and a higher ROI. Cruise lines criticize regulations and procedures. They applaud the existing port and tourism support infrastructure, logistics and operations, service levels, and the general attitude of regional stakeholders towards cruise. It is important that solutions for pilotage and other operational issues be addressed, that infrastructure issues are addressed, and that a standardized system is put in place for tariffs,
Exhibit A Report Number 19-150

GREAT LAKES CRUISE STRATEGY FOR ONTARIO’S PORTS – TASK 2: BUSINESS CASE AND CRUISE INDUSTRY STRATEGIC ACTION PLAN
150
berthing, and other operations that are consistent throughout the region. These issues need to be addressed before embarking on a promotional and marketing initiative. Maximum effort should be made to create conditions that deliver memorable experiences to the cruise visitor. This philosophy should be at the core of the strategy. When passenger satisfaction is achieved, growth will follow. Most importantly, the region needs to focus on developing a consumer base through a pragmatic approach to increasing the appetite of the target demographic for cruising in the Great Lakes. The Great Lakes is a candidate for a word‐of‐mouth campaign that reaches out to consumers (B2C) and encourages them to cruise in this region. Supproting this demand campaign is targeting cruise line decision‐makers (B2B) as part of an overall strategy of invovlement and destination buy‐in to actively promote and initiate new cruise‐tourism opportunities. The destinations then must deliver their promises to the brands. Undertstanding the consumer demographics of each brand and overall desires is key for the local stakeholders (such as tour operators, venues, tourism entitites, and communities).
Strategic Marketing Targets
North American consumer The U.S. and Canada are the cores and primary market drivers, which must be a targeted approach, based on the key consumer demographics of the most likely cruise brands to sail in the region. These potential partnerships with each will further develop new cruise deployments. There may also be an opportunity to use the populations concentrated in the large cities surrounding the Great Lakes (e.g., Toronto, Chicago, Detroit, and Cleveland) as potential source markets as well. The goal is for cruise lines to expand deployments, due to consumer demand. Market development must be performed in coordination with cruise line partners, to maximize the effectiveness of the strategy.
International consumer There are already international vessels that sail seasonally into the Great Lakes. Ontario can use their historical associations / consumer desires for culture, heritage, and wildlife as a tool for increasing consumer demand. In general, visitors may not be educated about many of the Great Lakes ports as a cruise destination. The current cruise market demand for the Great Lakes is weak, compared to key competitors. It is critical to make a full assessment and coordinate with cruise brands to enhance the experience.
The objective of this strategy is to create demand for the Great Lakes as a cruise destination. When visiting the individual destinations, there must be a consumer education component to the strategy, illustrating “what can be seen and experienced in the Great Lakes.” In other words, the cruise industry needs to show tourists why visiting via cruise ships (of varying types) provides an excellent value. In part, this education is a Public Relations and Image campaign that needs to be fulfilled, in conjunction with the cruise brands as partners.
Industry Goals The objective of the strategy targeting the cruise industry is to increase the number of cruise passengers sailing to and from the Great Lakes, specifically Ontario ports—by creating a domestic market and increasing demand for foreign arrivals. The region needs to build a high level of trust and confidence amongst the cruise‐line decision‐
Exhibit A Report Number 19-150
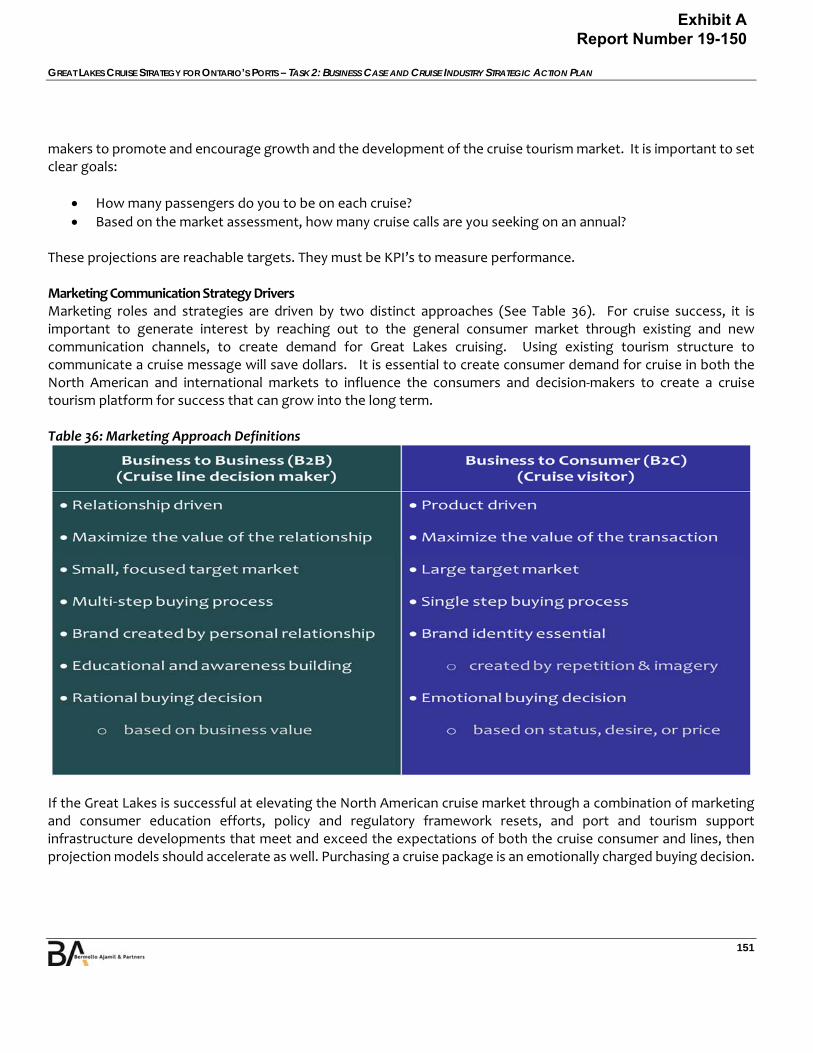
GREAT LAKES CRUISE STRATEGY FOR ONTARIO’S PORTS – TASK 2: BUSINESS CASE AND CRUISE INDUSTRY STRATEGIC ACTION PLAN
151
makers to promote and encourage growth and the development of the cruise tourism market. It is important to set clear goals:
How many passengers do you to be on each cruise?
Based on the market assessment, how many cruise calls are you seeking on an annual? These projections are reachable targets. They must be KPI’s to measure performance. Marketing Communication Strategy Drivers Marketing roles and strategies are driven by two distinct approaches (See Table 36). For cruise success, it is important to generate interest by reaching out to the general consumer market through existing and new communication channels, to create demand for Great Lakes cruising. Using existing tourism structure to communicate a cruise message will save dollars. It is essential to create consumer demand for cruise in both the North American and international markets to influence the consumers and decision‐makers to create a cruise tourism platform for success that can grow into the long term. Table 36: Marketing Approach Definitions
If the Great Lakes is successful at elevating the North American cruise market through a combination of marketing and consumer education efforts, policy and regulatory framework resets, and port and tourism support infrastructure developments that meet and exceed the expectations of both the cruise consumer and lines, then projection models should accelerate as well. Purchasing a cruise package is an emotionally charged buying decision.
Exhibit A Report Number 19-150

GREAT LAKES CRUISE STRATEGY FOR ONTARIO’S PORTS – TASK 2: BUSINESS CASE AND CRUISE INDUSTRY STRATEGIC ACTION PLAN
152
Cruise becomes a much easier sell when marketing and educating consumer groups offer many options, products, and services, and steer consumers to travel agents and websites that offer well‐apportioned details. The core of the B2B tactic cruise industry can install a refined marketing approach to reach out directly to cruise line deployment decision‐makers, in order to develop relationships based on trust, and provide them with essential information that allows them to make educated deployment decisions. The deployment of a cruise vessel is a rationally based decision‐making process that depends on the underlying consumer demand (B2C) to be successful. The type of cruise product deployed in the Great Lakes is a niche market that is seldom given the proper attention or development of a strategy by the government to develop this tourism area. It is important that marketing cruise tourism and enhancing promotion to the North American and international segment will be performed in conjunction with the development of the processes, and marketing and infrastructure projects will support the industry growth and provide the shoreside tourism component. One of the biggest challenges will be funding cruise‐related marketing and infrastructure, due to small cruise‐related direct economic impacts and the total number of stakeholders. The approximately ~$150,000 annual funding of the GLCC (plus additional monies for specific events, etc.) will not adequately support a startup and ongoing association / program to promote cruise tourism’s goals for growth over the next ten‐year term. Thus, it is critical to create some type of mechanism for funding as the main driver of all cruise‐related strategic, promotional and marketing initiatives including the Cruise Marketing Communication Strategy for a direct B2C approach. Without financial support the overall strategy will not be able to be implemented. Cruise Line Strategy and Approach Goal: Increase cruise deployments to the Great Lakes region, specifically Ontario, including passengers, cruise calls, and spending increases. Target: Small ship luxury / exploration cruise lines Sub‐targets and communication channels:
CLIA, cruise lines, and local GSA’s
Tour operators and port agents
International cruise events and exhibitions
Specialized cruise media (magazines, blogs, news sites, etc.)
Canada, USDA tourism campaigns, websites, and publications
Dedicated cruise website (new or rework of current GLCC site) Strategies: We believe that unless there is adequate financial support, it may be best to divide the efforts of B2C efforts:
Consumer marketing / promotions
Targeting cruise lines led by the individual port / local destination cruise network, via very close cooperation with the Key Marketing / Promotions Association on all initiatives.
Exhibit A Report Number 19-150
GREAT LAKES CRUISE STRATEGY FOR ONTARIO’S PORTS – TASK 2: BUSINESS CASE AND CRUISE INDUSTRY STRATEGIC ACTION PLAN
153
Both of these efforts need to be well‐coordinated to ensure best results, which involves developing a communication procedure between a primary Cruise Marketing Body and the local Cruise Networks. Positive steps forward would involve presenting a familiarization campaign and introducing local cruise networks to cruise‐industry professionals. In other words, we want to get cruise lines familiar with port and tourism representatives. This positive step can be achieved by participation in international cruise events and exhibitions, such as:
Attending CLIA Meetings, Summits, and Conferences CLIA is an international cruise industry trade association, with representation in Europe, North and South America, Asia, and Australasia. These events take place globally several times a year, and they include:
o Seatrade Cruise Global Premier global event that brings together industry's most knowledgeable speakers from every facet of the business including cruise lines, suppliers, travel agents and partners through world’s largest international exhibition and conference for past 30 years. It is supported by CLIA and FCCA, and takes place once a year in Miami or Fort Lauderdale.
o International Cruise Summit Established in 2011, this is the only forum of global knowledge about the worldwide cruise industry to be held in Europe annually. It attracts more than 400 delegates, and is attended by numerous port authorities and leading cruise brands. This summit takes place each fall in Madrid.
o Florida‐Caribbean Cruise Association (FCCA) This Cruise Conference & Trade Show is the premier industry event of the year for many cruise executives, destinations, suppliers, and tour operators. It’s an opportunity to meet in a roundtable format with key players, to analyze industry trends and discuss current issues. These events take place several times during the year in the Caribbean / Central America region.
o Seatrade Europe Biennial event that brings together senior buyers, planners, and key decision‐makers from Europe's ocean and river cruise lines, with suppliers from all sectors of these industries. It takes place once every 2 years in Hamburg, Germany.
o Seatrade Cruise Med Seatrade Cruise Med is the major biennial cruise event focused on the world's second largest cruise destination: the Mediterranean and its adjoining seas. The event takes place once a year in the Mediterranean region, and features a showcase exhibition, a conference, and networking opportunities.
o Seatrade Cruise Asia Pacific (not recommended at this point, due to format) This event focuses on the growing momentum for cruise tourism in Asia, the expansion of the cruise fleet now operating in Asian waters, and the opportunities and challenges they represent for the region. It takes place in Shanghai once a year.
Establishing Relationships and Reliable Contacts The cruise industry is relatively small, compared to other tourism industries For the Great Lakes, this circle is even smaller, due to the type of vessels and limits in the region. The GLCC has already done several recent
Exhibit A Report Number 19-150
GREAT LAKES CRUISE STRATEGY FOR ONTARIO’S PORTS – TASK 2: BUSINESS CASE AND CRUISE INDUSTRY STRATEGIC ACTION PLAN
154
cruise line office visits, which can be used as templates for information / growth moving forward. Specifically:
o Introduce a newly revised Cruise Network and local cruise coordinators to the industry is important. Coordinating with the existing and potential cruise brands that the organization is handling key issues related to regulatory, infrastructure, and service issues are being studied to benefit cruise brands in the region. This is a vital confidence builder.
o Visit cruise‐line offices in other countries, including Europe (UK, Germany, Italy, and Spain), and Asia (Singapore, China)
o Send Emails, newsletters, mailings, phone calls, media articles, and interviews. o The Great Lakes, specifically Ontario in conjunction with the Cruise the St. Lawrence and Atlantic
Canada Cruise Association should organize its own international cruise conferences, and promote Cruising Magazine.
Understanding the Reality of Each Port and Destination Most cruise‐line decision‐makers (especially itinerary planning, shore excursions, and marine operations) may have never visited the Great Lakes ports, so they base their plans on information provided by providers, GLCC staff, or the internet. Therefore, processes need to be in place to make sure that cruise lines understand all the challenges and opportunities that each port / destination presents, which can be achieved by doing the following:
o Go on FAM (familiarization) trips, in which cruise lines and specialized cruise media are invited to visit specific ports and destinations.
o Conduct cruise workshops / mini‐conferences in a key Great Lakes city (such as Toronto), where cruise line executives meet and interact with the local cruise‐network stakeholders. This tactic will also allow the locals to understand cruise lines challenges, wants and expectations.
o Communicate challenges and solutions. In other words, do not promise something that cannot be delivered.
Helping Cruise Lines Increase Revenue and Passenger Satisfaction Ashore This step can be achieved by doing the following:
o Incentivize cruise & stay programs, especially cruise lines that are conducting embarkation / debarkation and might have an interest in diversifying their offer and increasing revenue opportunities.
o Use the network to brainstorm new products, attractions, and programs suitable for cruise passengers, taking into consideration the distances and timings in between venues, etc., and the demographics of the brands involved.
o Focus on unique, up‐close and personal experiences delivered by local, passionate people. Simultaneously, try to invigorate the existing tour offer to add more value. Ontario has a substantial local culture that can be tapped into, including its First Nations heritage and National Park system.
o Share videos and images of the destination’s attractions and highlights with the cruise lines to boost consumer demand and knowledge, as well as shore excursion participation levels onboard the ships and promotional initiatives.
Exhibit A Report Number 19-150

GREAT LAKES CRUISE STRATEGY FOR ONTARIO’S PORTS – TASK 2: BUSINESS CASE AND CRUISE INDUSTRY STRATEGIC ACTION PLAN
155
o Develop a dedicated cruise website to provide the consumer with firsthand information about the Great Lakes (and each port) as a destination when visited aboard a cruise vessel. The GLCC site provides links, but a new site needs to be created that offers the more relevant, specific needs of the industry. This new site should include practical information about visas, entry formalities, ports, cities, attractions, programs, distances, languages, money exchanges, and restrictions.
o Provide maps marked with locations of ports, city centers, main attractions, and shopping. Also provide sheets with specifics about ground transportation, especially to independent passengers and crewmembers who decide to go ashore on their own.
o Educate cruise lines on how to better plan programs to sell the Great Lakes. There are already many adamant supports of the region in executive leadership positions of major cruise brands and tour operators that sell the Great Lakes. Taking advantage of their promotional abilities may assist the region in its efforts to increase consumer demand.
o Educate passengers on where to go and where to spend money to build a better experience.
Anticipating Issues with Guides and Transportation In our experience, all regions need some form of assistance with Tour Guide Training & Development. This assistance would institute formal training and licensing for guides to be used for land and cruise tourism, and provide a mid‐ to long‐term focus on language development for the international market.
Initiating Surveys These surveys should target passengers and crewmembers at the pier to measure their spending and levels of satisfaction. They can be conducted for all ports every two years, and the results should be shared with all the stakeholders, government officials, and industry executives to assist with support in new developments, investments, and initiatives. The specialized cruise travel / industry media plays an important role in educating cruise lines and the industry in general, and sharing news and developments related to ports and destinations. Amongst the most important are:
o Small Ship
Porthole Travel & Leisure Travel Pulse Travel Agent Central LuxeGetaways
o General Cruise
Seatrade Insider http://www.seatrade‐insider.com
Cruise Industry News
http://www.cruiseindustrynews.com
Exhibit A Report Number 19-150
GREAT LAKES CRUISE STRATEGY FOR ONTARIO’S PORTS – TASK 2: BUSINESS CASE AND CRUISE INDUSTRY STRATEGIC ACTION PLAN
156
Cruise Business Review http://www.cruisebusiness.com
Cruise and Ferry International
http://www.cruiseandferry.net Cruise Insight
http://www.ashcroftandassociates.com Cruise Media News
http://www.cruisesnews.es Cruise Times
http://www.cruisetimes.net Coordinated marketing campaigns should be well‐coordinated with regional partners to ensure that all efforts are synchronized between the two primary approaches (B2B and B2C), and costs are minimized.
Joining Cruise Associations like CLIA The organizations charge an annual membership that will allow introductions to all the relevant cruise line executives. Joining a cruise association does not guarantee immediate success. Rather, these associations are communication platforms that allow for education and networking. Each port / destination will need a promotion and marketing strategy.
In the case of the Great Lakes, in the short‐term, a more viable and less costly solution may involve working directly with the cruise brands and key tour operators / travel agents in and out of the region. The tour operators may include Adventure Smith, Vaya Adventures, International Expeditions, Tauck, Blount, Vantage Adventures, Road Scholar, WLC Vacations, Explor Cruises, Lindblad Expeditions, UnCruise Adventures, Natural Habitat Adventures, Zeagrahm, Smithsonian Travel, Grand Circle, and Small Ship Adventure Cruises amongst others.
Strategies should be based on attainable goals (KPIs) for each port.
Local Cruise Network and Product Development Given the Cruise Industry Approach (B2B), the size of the Great Lakes, and the diversity and distances between the destination ports, it is recommended that each destination creates its own cruise network and assigns its own local cruise coordinator. This preparation will ensure that all local matters are discussed and addressed via promotional and marketing initiatives, which are aligned with the realities and plans for each of the destinations.
This process will involve the creation of a local cruise network, allowing a platform for cruise development. Through local tourism, each port could be involved in the cruise sector, and take a leading role with the larger marketing organization in this initiative. In some of the ports visited, there is already a loose organization of this type. Together, they could build the
Exhibit A Report Number 19-150
GREAT LAKES CRUISE STRATEGY FOR ONTARIO’S PORTS – TASK 2: BUSINESS CASE AND CRUISE INDUSTRY STRATEGIC ACTION PLAN
157
foundation for this network, by working on any challenges identified. Other local stakeholders, organizations, legislators, and tourism providers should also be included.
What brings these stakeholders together are common interests and an overall strategy for the development of cruise in the Great Lakes and the specific port. Product development should be a priority. The involvement, investment, responsibility, and level of commitment are directly proportional to the success of a cruise destination and the economic benefits resulting therefrom. The alliance needs to be consolidated and applied at all levels of the organization, including planning and execution that will provide assistance to reach a long‐term cruise goal.
This process should not involve a bureaucratic organization. Rather, it should be a working group, in which goals, strategies, and actions are agreed upon. In general, the objective is for cruise stakeholders to be educated about the cruise business, its players, and their needs and expectations. A destinations management of its opportunities and challenges will determine how best to engage in the necessary activities to generate an economic impact and social rewards for the community.
This local cruise network may have several functions that could be categorized as educational, promotional, and operational. The most relevant tasks related to creating a product‐development strategy include building the product locally and promoting it to the cruise lines that are most important at present. These tasks are as follows:
Initiate a long‐term product‐development strategy to improve the quality and quantity of tours, given the existing cruise line business, potential new cruise lines, and the features of the destination.
Provide a platform for local operators to receive training to package, price, time, and market the tours to match cruise lines expectations.
Provide a platform to better market and introduce new products and local operators to the cruise lines.
Use a destination inventory list to identify and select which products could fit each individual demographic. While the demographics offer some initial guidelines, they should not limit selecting options to match specific brands.
Conduct workshops with the local operators and providers to discuss the best approach for each cruise line, including which products and tours could work. Make them part of the process.
Make sure tours differ from the other neighbouring destinations. It is important to try to be as different and original as possible, and work on products that no other destination is offering. This tactic will also help cruise lines increase their sales in each port.
Develop a good selection of high‐end products and more intimate programs that can entice luxury / exploration cruise lines to choose the port.
The example of the work philosophy and the success of Experience could be used as a motivational tool for other local operators.
Exhibit A Report Number 19-150
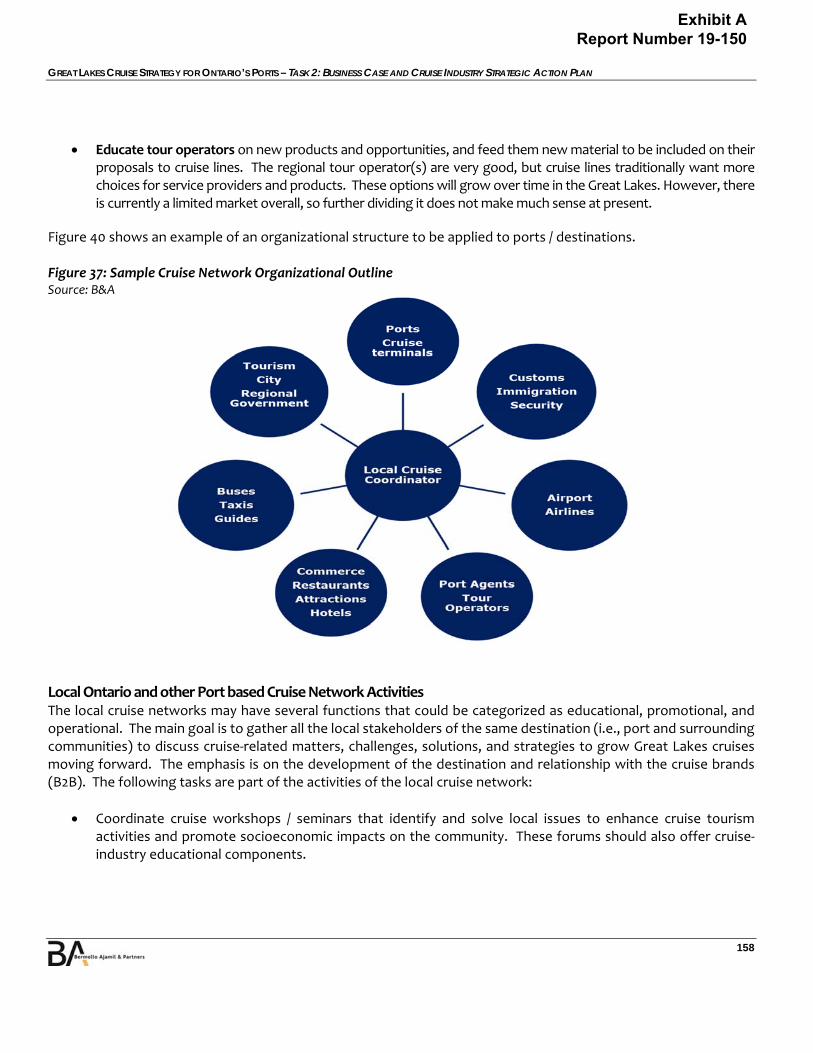
GREAT LAKES CRUISE STRATEGY FOR ONTARIO’S PORTS – TASK 2: BUSINESS CASE AND CRUISE INDUSTRY STRATEGIC ACTION PLAN
158
Educate tour operators on new products and opportunities, and feed them new material to be included on their proposals to cruise lines. The regional tour operator(s) are very good, but cruise lines traditionally want more choices for service providers and products. These options will grow over time in the Great Lakes. However, there is currently a limited market overall, so further dividing it does not make much sense at present.
Figure 40 shows an example of an organizational structure to be applied to ports / destinations. Figure 37: Sample Cruise Network Organizational Outline Source: B&A
Local Ontario and other Port based Cruise Network Activities The local cruise networks may have several functions that could be categorized as educational, promotional, and operational. The main goal is to gather all the local stakeholders of the same destination (i.e., port and surrounding communities) to discuss cruise‐related matters, challenges, solutions, and strategies to grow Great Lakes cruises moving forward. The emphasis is on the development of the destination and relationship with the cruise brands (B2B). The following tasks are part of the activities of the local cruise network:
Coordinate cruise workshops / seminars that identify and solve local issues to enhance cruise tourism activities and promote socioeconomic impacts on the community. These forums should also offer cruise‐industry educational components.
Exhibit A Report Number 19-150
GREAT LAKES CRUISE STRATEGY FOR ONTARIO’S PORTS – TASK 2: BUSINESS CASE AND CRUISE INDUSTRY STRATEGIC ACTION PLAN
159
This tactic can apply to the retail and hotel sectors. For example, locals need to be educated about which products cruise passengers like to buy. Hotel associations and owners should learn about the industry, and identify cooperation and revenue opportunities to enhance business.
Conduct local operational workshops for the cruise tourism industry service providers (ports, tourism, transportation, venues, sites, guides, port agents, operators, commerce, airport, and other stakeholders) to enhance the delivery and quality of the products and services to meet the needs and expectations of the passengers and cruise lines. It is very important that the private sector be well‐represented.
Coordinate local training programs for stakeholders, such as taxi drivers, guides, shop owners, and other personnel involved in the cruises business, and focus on specific topics and challenges that need to be overcome. The focus should also be on how they could participate more actively in the cruise business and improve their revenues.
Coordinate promotional activities, initiatives, and participation in international events, such as Cruise Global Miami, and Seatrade.
Coordinate FAM trips for cruise lines executives, international operators, and cruise media.
Plan welcome initiatives for passengers when cruise vessels arrive at the port.
Coordinate preparation & delivery of city maps to passengers before ships arrive during cruise calls.
Coordinate the creation of a contact list, including the main cruise stakeholders (one contact in each company) to facilitate communication between relevant stakeholders.
Conduct studies and surveys targeting passengers and cruise lines regarding their satisfaction levels while visiting each port / destination.
o These studies help gather the necessary support and financial data that justifies promotional initiatives, and the betterment of tourism and port infrastructures.
Create an intelligence center where the following information can be gathered and distributed amongst all the interested stakeholders:
o Statistics of cruise‐passenger visits per port and estimated calls for the remaining years. o Information selected by calls (turnaround and transit), passengers, crew, cruise line brands, and
nationalities. o Information on new ship‐building, trends in the industry, and annual reports to provide an
understanding of the industry. o Share the result of passenger & cruise line surveys, economic impact studies, and other relevant
information related to guest satisfaction (such as effects on the region with the local communities, networks, and the leading marketing efforts of the Regional Cruise Tourism Organization).
Exhibit A Report Number 19-150
GREAT LAKES CRUISE STRATEGY FOR ONTARIO’S PORTS – TASK 2: BUSINESS CASE AND CRUISE INDUSTRY STRATEGIC ACTION PLAN
160
Assist cruise lines to improve their existing information (on board and office) regarding each port / destination, such as videos, images, latest information, and new attractions.
Coordinate the preparation of Welcome Cards to be given out to crewmembers, with discounts on shopping, restaurants, and other promotional and revenue opportunities throughout the local community.
Initiate a long‐term product‐development strategy to improve the quality and quantity of tours in each destination, given the existing cruise‐line business and the features each individual destination has to offer.
Communicate port / destination challenges to the cruise industry, and allow them to provide input about the long‐term solutions.
Share relevant information about each port / destination to assist in educational, promotional, and marketing initiatives related to the B2C strategy.
Establish a budget for all activities / initiatives. o Annual membership fees, paid by all members, may be considered one form of annual fundraising.
Recommendations
Make sure the network is built to deliver practical results.
Make it simple and easy to participate.
Define the organization’s objectives.
Form a network of stakeholders with similar desires and expectations.
Assign a cruise coordinator, who is trusted and respected by everyone and knows how to sell the destination.
o It is important to define responsibilities for everyone that is part of the network.
Identify the key stakeholders that are willing to commit long‐term.
Cooperate with all Great Lakes ports / destination networks. o Coordination amongst all will assure better and more sustainable results for the region as a whole.
Create a long‐term vision. o Focus on the visitor experience!
Exhibit A Report Number 19-150
GREAT LAKES CRUISE STRATEGY FOR ONTARIO’S PORTS – TASK 2: BUSINESS CASE AND CRUISE INDUSTRY STRATEGIC ACTION PLAN
161
Each local cruise networks would be responsible for matters that relate to the visitation of cruise tourists to the port / destination, such as their experience visiting the sites, products, and services and identifying where they spend their money, in order to bring economic benefits to the community. While the ports are the cruise gateways, it is ultimately the destination that passengers explore. Therefore, it is important to gather all the key stakeholders for each port / region (such as service providers, airports, restaurants, hotels, tourism, commerce, transportation, and guides) around the table to meet regularly and agree on cruise tourism goals and strategy. Each port should have a dedicated coordinator to handle cruise‐related matters, and be responsible for cruise‐line and community‐stakeholder communication. Each port / region presents its own “identity.” Thus, each port can be involved in their promotional and marketing efforts to cruise lines. The overall region must cooperate and communicate with each other. Each cruise line is different in the way they operate and the luxury level, profile, and nationality of its passengers. These factors need to be taken into account when preparing offers, designing promotional materials, and conducting meetings, site inspections, office visits, and phone / email communications.
Find out which cruise lines are currently sailing in the region, and which lines could be potential clients in the future.
Directly establish a personal contact with each cruise line that is targeted to discuss their needs and challenges.
Plan visits to each cruise line office, to meet with the appropriate cruise‐line executive that handles land programs, marketing, and itinerary planning.
Find out how to best help each cruise lines, and how the individual port can help the cruise lines make more revenue.
Raise the awareness of the new products and tours available in the region and port. Each cruise line requires a different approach, so know what it is in advance!
Invigorate the traditional tour program of cruise lines currently visiting the port on an annual basis.
Education is a key to active participation, which can be achieved by organizing local cruise seminars, workshops, and training sessions or by creating networking, cruise publications, online information, international events, and other activities.
When conducting cruise seminars and workshops, invite cruise industry representatives and tourism industry providers (in/out of region) to provide their knowledge. These cruise seminars and workshops could be done annually with different agenda topics.
As identified previously, gather information and materials to use in promotional and marketing initiatives targeting the following in con junction with the Great Lakes Cruise Association:
Exhibit A Report Number 19-150
GREAT LAKES CRUISE STRATEGY FOR ONTARIO’S PORTS – TASK 2: BUSINESS CASE AND CRUISE INDUSTRY STRATEGIC ACTION PLAN
162
Travel Agents are very important tools for every cruise. In many cases, they are too busy to travel and get personally acquainted with the destinations. The solution is to channel the information to them via existing lines of communication, and get them excited about the possibilities of cruising to the Great Lakes, specifically Ontario Ports.
Media includes publications, newspapers, cruise blogs, and travel sites. The secret is to “keep renewing your message while strengthening your image.”
Cruise Visitors ultimately decide where the ships will be deployed! Use the existing tourism platforms to reach out to the cruise consumer in potential source market regions and countries (US and EU) to raise exposure and drive demand. These existing channels may not provide any additional cost factor.
Regional Brand Leader / Local Cruise Network Coordinators Every cruise destination needs a “champion.” Normally, this person is the regional or local cruise network coordinator and designated contact for all cruise‐related issues in the organization. Each local cruise network should select a representative that has the passion to drive cruise forward, and is able to gather everyone around the table for constructive dialogue. There is also a need for a Regional Brand Leader (B2C). This professional could already be working for one of the existing organizations involved in the business, or be a separate hire. These two institutions and personnel from the regional and local level work together on promoting the Great Lakes. This regional brand leader is the driving force behind the cruise tourism marketing focus (B2C), and takes the lead on all strategic, promotional, and marketing matters for the region. Cruise lines may reach out to this person when they have questions or issues related to destinations in the region and in this case they would then pass them along to the local cruise network coordinator for port related information / discussions. The local cruise network coordinator would also be responsible for ensuring that the destination remains focused on service, product development, and other regional cruise initiatives, and that every stakeholder remains active and responsible within their areas. Based on our experience and observations about several destinations / regions, the following guidelines illustrate the tasks and characteristics of an effective Cruise Lead:
Coordinator of all activities.
Prepare cruise promotional and marketing materials.
Keep contacts with cruise lines on a regular basis, and build trust and cruise intelligence.
Liaise and maintain contact with ports, tourism boards, operators, agents, stakeholders, city hall, service providers, and others in the region / abroad.
Work with tour operators to generate new products and attractions in the region, promote cruise tourism, and increase economic impacts.
Compile a statistical cruise database.
Conduct cruise surveys to measure passenger satisfaction and spending.
Coordinate the attendance of international cruise events and meetings (including meetings with cruise lines and other relevant parties).
Exhibit A Report Number 19-150

GREAT LAKES CRUISE STRATEGY FOR ONTARIO’S PORTS – TASK 2: BUSINESS CASE AND CRUISE INDUSTRY STRATEGIC ACTION PLAN
163
Coordinate cruise‐association memberships and connected activities.
Coordinate events, conferences, workshops, FAM trips, site inspections, and other initiatives.
Oversee budgets and allocations of funds.
Be able to sell the destination to the cruise lines / consumers. The profile of a successful Cruise Destination Champion (local) matches the profile of a successful Regional Brand Leader. Many times, these persons are the main reasons why cruise lines visit a port or region. It may take time to find the right candidate that meets all of the prerequisites outlined. Thus, initial efforts should be made to ensure that all stakeholders understand the responsibilities and tasks associated with building a cruise network(s) into an efficient tool. The existing cruise facilitation meetings (in an expanded form) are good platforms to expand from, and allow more stakeholders to participate in discussions about cruise‐related matters for the ports / destinations in the Great Lakes.
Consumer Motivators The cruise passenger is the most important element in the cruise industry chain. Without these individuals, there would be no cruise business. Therefore, they will always be the ultimate targets (direct or indirect) for every promotion and marketing and PR initiative executed by cruise lines, cruise and travel associations, ports, tourism boards, travel agents, and the dedicated media. For Great Lakes ports, the potential cruise consumer plays a major role, as they are the ones who will fill the cruise ships. They will be the ones that will purchase the shore excursions, visit cities, and spend money. They are the ones that will rate the level of satisfaction after visiting Ontario regional destinations, and decide if they are coming back or not. They are also one of the best marketing tools via word‐of‐mouth. Ultimately, the consumer will be the key driver of success for the Great Lakes and Ontario as a cruise destination. Cruise consumers look for a number of factors related to a destination offering. This marketing option is costly, but allows for the long‐term expansion of cruise products by generating consumer demand. Using the existing tourism, travel agents and media channels for traditional land‐based tourism can assist with adding cruise to the list of options available for consumers.
Cruise Brand Messaging Prior to contacting and meeting, each cruise brand has a defined message that must be created, based on the following key elements:
Cruise brand consumer demographic Who is their target consumer? How do you as a destination and / or port fit into their core brand values? The message must speak to their values, in terms of how they promote their product to the target audience about what is expected onboard and shoreside products and services.
Physical size and capacity of the cruise vessel Creating a product‐delivery message must be geared around the physical specifications of the hardware (i.e., type of ships) used by the brand. It makes no sense to promote large reception facilities for a small cruise
Exhibit A Report Number 19-150
GREAT LAKES CRUISE STRATEGY FOR ONTARIO’S PORTS – TASK 2: BUSINESS CASE AND CRUISE INDUSTRY STRATEGIC ACTION PLAN
164
vessel. However, at the same time, a port with no facilities and little in the way of upland tourism support and venues could not accommodate a large‐sized vessel. Thus, creating a message that fits the sensibilities of the brand is essential. A destination must assess its own capabilities first, and determine how they best fit into each brand. Some may fit into many brands, while others may not.
Cruise line decision‐maker Many times, the hardest issue for a destination is meeting with the right person and communicating a message that meets their particular needs. Getting a meeting with just anyone at a cruise line does not work. Rather, it is about defining the message you want to deliver, then determining who is the right decision‐maker to speak with about the destination. There are operations, marine, shore excursions, purchasing, destination development, marketing, deployment planners, government relations executives and other cruise line decision‐makers that interact with destinations on a regular basis. However, meeting with all of them to promote the destination as a port or encourage an increased profile within certain itineraries is generally a non‐starter. Contacts should be planned according to a specific goal: getting more cruise passengers / calls, providing improved service, and promoting new products. Consideration should be given to the history between each cruise line, port, and local providers.
Efforts should support the development of key relationships with marketing, deployment planners and operations. These are the core groups that affect change. Thus, the message should be crafted and targeted accordingly. In addition, the contacts and efforts orchestrated need to be consistent and regularly checked on.
One Message A common message shared by all stakeholders in the Great Lakes, specifically Ontario, is beneficial to the long‐term growth of the cruise business. The Great Lakes needs to be rediscovered by the small‐ship luxury and exploration cruise industry, but most importantly, it has to be discovered by the consumer to build a cruise sector. The long‐term development of the Ontario cruise business is directly tied to the development of the Great Lakes as a successful tourism destination that is well‐recognized internationally for delivering memorable experiences. While it is vital to create an effective Great Lakes Cruise Brand and Identity that is recognized by the key NA and international consumer source markets, it is equally important to ensure that the whole region actually delivers on its marketing promises as a tourism destination. Achieving this goal will involve a process of cultivating the markets and cruise lines, while at the same time educating and training local providers and communities about the potential of cruise tourism and the business opportunities it represents. In the case of the Great Lakes, the overall impact is low, based on the constraints of the cruise types that can transit into the region. However, direct community impacts can be established. Therefore, ONE message to be communicated throughout the strategy needs to be strong, credible, encouraging and shared by all: The Great Lakes is a world‐class small‐ship luxury / exploration cruise destination!
Exhibit A Report Number 19-150
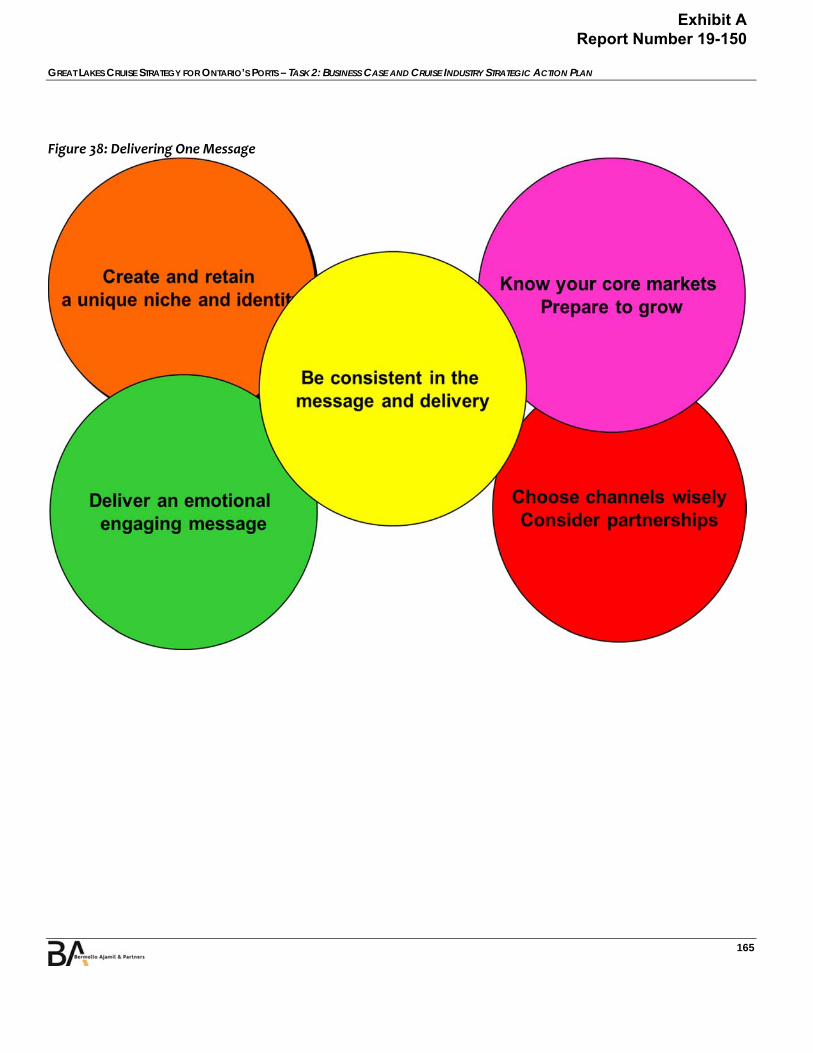
GREAT LAKES CRUISE STRATEGY FOR ONTARIO’S PORTS – TASK 2: BUSINESS CASE AND CRUISE INDUSTRY STRATEGIC ACTION PLAN
165
Figure 38: Delivering One Message
Exhibit A Report Number 19-150
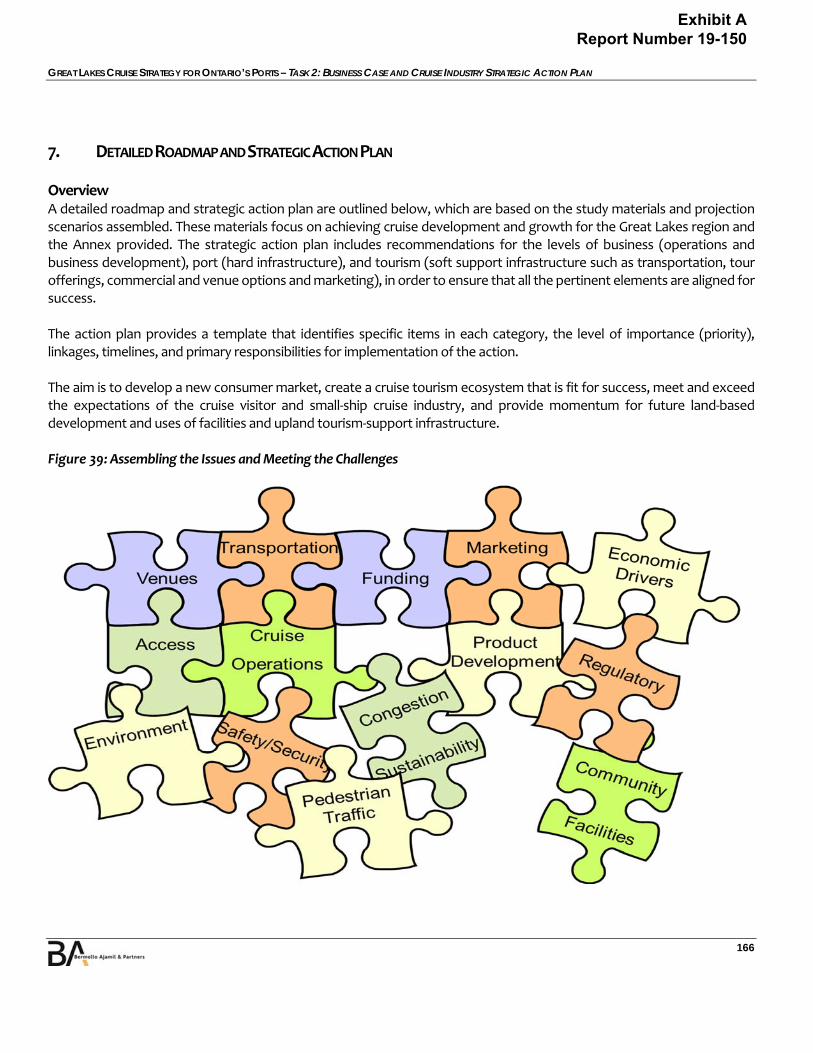
GREAT LAKES CRUISE STRATEGY FOR ONTARIO’S PORTS – TASK 2: BUSINESS CASE AND CRUISE INDUSTRY STRATEGIC ACTION PLAN
166
7. DETAILED ROADMAP AND STRATEGIC ACTION PLAN
Overview A detailed roadmap and strategic action plan are outlined below, which are based on the study materials and projection scenarios assembled. These materials focus on achieving cruise development and growth for the Great Lakes region and the Annex provided. The strategic action plan includes recommendations for the levels of business (operations and business development), port (hard infrastructure), and tourism (soft support infrastructure such as transportation, tour offerings, commercial and venue options and marketing), in order to ensure that all the pertinent elements are aligned for success. The action plan provides a template that identifies specific items in each category, the level of importance (priority), linkages, timelines, and primary responsibilities for implementation of the action. The aim is to develop a new consumer market, create a cruise tourism ecosystem that is fit for success, meet and exceed the expectations of the cruise visitor and small‐ship cruise industry, and provide momentum for future land‐based development and uses of facilities and upland tourism‐support infrastructure. Figure 39: Assembling the Issues and Meeting the Challenges
Exhibit A Report Number 19-150
GREAT LAKES CRUISE STRATEGY FOR ONTARIO’S PORTS – TASK 2: BUSINESS CASE AND CRUISE INDUSTRY STRATEGIC ACTION PLAN
167
Action Plan While the world cruise market has increasingly become a dynamic offering in terms of new cruise vessels, shoreside offerings, service levels, port infrastructures, and other tourism requirements, the Great Lakes region to date has not followed a similar trend. Thus, this action plan provides a series of basic and more specific recommendations, to achieve growth and success for the region. The dynamics of the action plan recommendations will change over time, and require a greater or more rapidly adapting emphasis as the industry matures further in the region, cruise‐line brands deploy, vessels increase in size, and the demographic range modifies. The elements important to the growth of the cruise business are outlined in several specific areas, which include:
Regulatory
Capital
Finance
Marketing & Communications
Operations
Capacity‐Building Within these areas, the overarching goals of the plan are the following:
Increase cruise consumer demand for the region. Focusing on this aspect for the region overall will provide more sailings in the region, from which all of the Ontario ports will have an opportunity to capture. The primary focus is on the development of a North American consumer‐source market with a secondary goal of expanding the presence and passenger throughput of the international consumer market, which is a mainly a marketing and education (software) endeavor.
Provide for a strong, functional, and operational business foundation for cruise lines. This element touches on the aspects of vessel deployments to the region, including onboard destination support, port infrastructure / operations / cost structure, upland tourism, venue and shore excursion operations, safety & security, and a strongly supported regulatory environment that encourages deployments to the Great Lakes region.
Increase overall cruise visitor satisfaction. If decision‐making focuses on this aspect as a primary goal, then the plan will fall into place much easier, which is primarily an operational and software exercise.
By focusing on these elements, the end result should be as follows:
Build a new market, and drive deployments to the region as demand increases, providing for higher ticket revenues.
Exhibit A Report Number 19-150
GREAT LAKES CRUISE STRATEGY FOR ONTARIO’S PORTS – TASK 2: BUSINESS CASE AND CRUISE INDUSTRY STRATEGIC ACTION PLAN
168
Create high levels of cruise visitor satisfaction, and further promote the region for return visits via land‐based or cruise holidays.
Support new activities and shore excursion options that provide increased daily spending to build additional cruise‐line and stakeholder revenues.
Ensure the port infrastructure provides for a seamless cruise visitor experience for homeport and port of call operations.
Provide a regional environment that is supportive of cruise‐industry growth and renders the highest possible socioeconomic impacts to the communities visited.
This focus should provide cruise brands with the ability to generate the yields necessary to establish and increase regional deployments.
Regulatory (Capital and Finance) Undertaking capital enhancements of the ports and their public spaces will be a critical element in the near term for some key ports, such as Kingston, to be able to provide seamless cruise facilities for cruise operations. This program should be conducted with attention to both aesthetics and operational efficiency. We believe that the cruise elements of the development, in terms of passenger processing, ground transportation, security, and other enhancements to the delivery of the destination, must not be overlooked, as the process is undertaken. The overall development should be inclusive of a mix of cruise‐ and land‐based elements, to provide long‐term project success. Further focus on the primary cruise homeport facilities and mixed‐use aspects should also be undertaken for the Ports of Toronto and Midland. Due to the ongoing advancements in this area already seen worldwide, these Ontario ports may be able to consolidate a new waterfront cruise development that meet the needs of the individual communities, based on the specifics of the ports and waterfronts and the existing / potential tourism outlook. Capital improvements will likely need to be led by Public Private Partnerships (PPPs) while implementing mixed‐use cruise facilities / berths accommodate the design vessels and demands needed for future projections. These results are due to the higher levels of initial capital requirements and the lower returns based on the current and anticipated passenger throughput. However, the public and cruise line investors should be able to visualize the future of cruise tourism, and may provide for earlier investments if the deals are right, and there are options for additional revenue sources.
Operations The government departments (Tourism, Finance, Immigration, and Customs) and ports / destinations must embrace the need to create tourism areas and provide a secure and safe oasis for cruise vessels and passengers, while balancing public access to the areas and additional revenue options and public uses. Likewise, operational, regulatory, and physical improvements affecting standard operating procedures must be included in the whole of the Great Lakes regional action plan. Areas identified as part of the study worthy of operational improvements include pilotage, wastewater / garbage management, security, immigration, and customs. For Ontario, they also include the ability to compete for provisioning, fueling, and other high‐dollar services included primarily in homeport operations.
Exhibit A Report Number 19-150

GREAT LAKES CRUISE STRATEGY FOR ONTARIO’S PORTS – TASK 2: BUSINESS CASE AND CRUISE INDUSTRY STRATEGIC ACTION PLAN
169
There must also be an established homeport / port of call culture capable of catering to vessels that provide opportunities for cruise lines to berth and enhance onboard revenue options related to land activities. Port and city infrastructure linkages are also of importance to move visitors to and from these areas without unnecessary impedance. Cruise lines place significant emphasis on total passenger revenue. Approximately 50 ‐ 85% of a ship’s onboard revenue is attributed to the sale and operation of landside activities. It is recommended that the whole of the stakeholders actively cooperate and encourage local businesses experienced in this trade, to creatively improve the programs available to cruise line visitors. A port’s most significant contributions to this effort will come from the continued support of its land‐program efforts, which may include parking areas, traffic patterns, administrative controls, and support of the cruise ships’ control of the sale of tour products. The contributions may occur by preventing a divisive, competitive land‐program sales environment. Cost control is also an important element for the Great Lakes region. Tariff assessments and recommendations should be completed. The region should modify its port‐charging policies and range of fees to allow for a stable competitive environment, which may include port charges and other mandatory requirements, such as stevedoring, tugs, and pilotage.
Tourism Product Development Product development may involve the modification of an existing product or its presentation, or the formulation of an entirely new product that satisfies a newly defined customer want or market niche. In the case of Great Lakes cruises, product development entails shore excursions, overland programs, attractions, and services to be offered and provided to North American and international cruise passengers in a variety of demographics. When considering the product development process for cruise tourism in general, there needs to be a clear understanding of WHY and for WHOM things are being done. The main goal of the Great Lakes Cruise Industry Strategic Action Plan is to become a world‐class small luxury / exploration cruise destination with a higher volume of cruise passengers passing through its ports, to generate substantial socioeconomic impacts to the region, specifically Ontario. Product development, and all other initiatives related to cruise, need to be aligned with this goal. Cruise ships (especially the new small class of vessels being built) offer an array of world‐class features, but destinations included on an itinerary are the primary reasons for cruise passengers to book a small cruise vessel adventure. Cruise passengers look forward to experiencing what each destination has to offer. Therefore, it is the responsibility of each destination to engage in product‐development initiatives that will ensure that cruise lines have a meaningful reason to bring their ships and passengers to the destination / port. Tour products and services must be developed to meet the needs and expectations of the visitor, not focus on what a local operator or tourism entity believes they want to deliver or espouse. Local tour operators should take responsibility for developing tours and options to meet the requirements of cruise lines and their passengers. The final tourism product should be a joint collaboration between tourism boards, tour operators, providers, and attractions. The primary motivational factors for each cruise brand related to the development of new tours, programs, and options for cruises are shown in Table 37.
Exhibit A Report Number 19-150
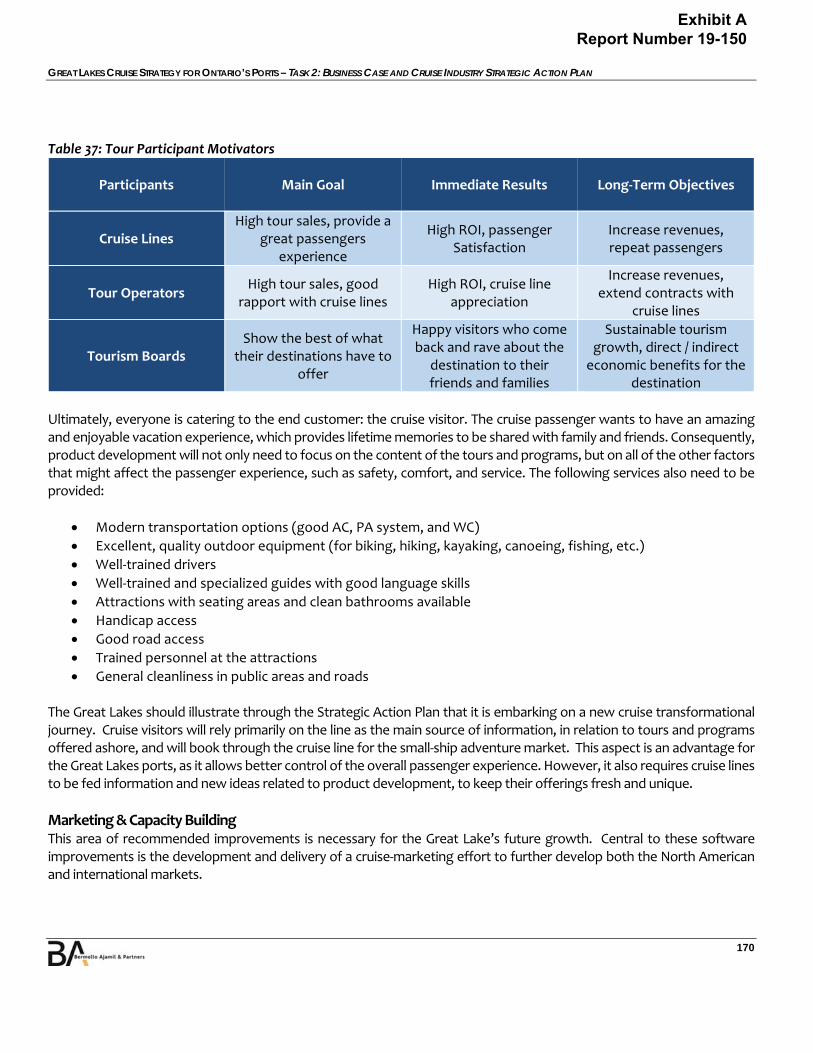
GREAT LAKES CRUISE STRATEGY FOR ONTARIO’S PORTS – TASK 2: BUSINESS CASE AND CRUISE INDUSTRY STRATEGIC ACTION PLAN
170
Table 37: Tour Participant Motivators
Participants Main Goal Immediate Results Long‐Term Objectives
Cruise Lines High tour sales, provide a
great passengers experience
High ROI, passenger Satisfaction
Increase revenues, repeat passengers
Tour Operators High tour sales, good
rapport with cruise lines High ROI, cruise line
appreciation
Increase revenues, extend contracts with
cruise lines
Tourism Boards Show the best of what
their destinations have to offer
Happy visitors who come back and rave about the
destination to their friends and families
Sustainable tourism growth, direct / indirect
economic benefits for the destination
Ultimately, everyone is catering to the end customer: the cruise visitor. The cruise passenger wants to have an amazing and enjoyable vacation experience, which provides lifetime memories to be shared with family and friends. Consequently, product development will not only need to focus on the content of the tours and programs, but on all of the other factors that might affect the passenger experience, such as safety, comfort, and service. The following services also need to be provided:
Modern transportation options (good AC, PA system, and WC)
Excellent, quality outdoor equipment (for biking, hiking, kayaking, canoeing, fishing, etc.)
Well‐trained drivers
Well‐trained and specialized guides with good language skills
Attractions with seating areas and clean bathrooms available
Handicap access
Good road access
Trained personnel at the attractions
General cleanliness in public areas and roads The Great Lakes should illustrate through the Strategic Action Plan that it is embarking on a new cruise transformational journey. Cruise visitors will rely primarily on the line as the main source of information, in relation to tours and programs offered ashore, and will book through the cruise line for the small‐ship adventure market. This aspect is an advantage for the Great Lakes ports, as it allows better control of the overall passenger experience. However, it also requires cruise lines to be fed information and new ideas related to product development, to keep their offerings fresh and unique.
Marketing & Capacity Building This area of recommended improvements is necessary for the Great Lake’s future growth. Central to these software improvements is the development and delivery of a cruise‐marketing effort to further develop both the North American and international markets.
Exhibit A Report Number 19-150

GREAT LAKES CRUISE STRATEGY FOR ONTARIO’S PORTS – TASK 2: BUSINESS CASE AND CRUISE INDUSTRY STRATEGIC ACTION PLAN
171
Central to any marketing effort must be the highlighting of the key regional ports as marquee destinations, which may be different, depending on the cruise brand and their delivery of the Great Lakes product. Thus, understanding and support in this area is critical. Local and regional tourism organizations, ports, and other private stakeholders need to focus on creating a concerted marketing campaign (through a centralized Great Lakes promotional body), which will not only benefit a single port, but also the whole region overall, by generating awareness and demand in the consumer markets. There is an obvious interest in having the National Government, Regional tourism entities, Cities, and Ports as part of a cooperative marketing team. In this regard, we envision that the development/retrofit of a Great Lakes Cruise Association and Local/Regional Cruise Networks would lead in the development of the consumer market, while also coordinating the upland software development through support and education. Continuing to include stakeholders with active roles in these organizations will provide for leverage in the development of new products and services, to support cruise tourism. Members such as port authorities, tourism boards, cities, airports, tour operators, port agents, venue managers, transportation providers, and public entities should be included. In the case of the Great Lakes, it may be beneficial to have cruise line membership in the organization as a consultative body, which also provides the cruise brands with a sense of ownership in the development of the Great Lakes region, and can act as a direct conduit for marketing partnerships between the region / cruise brands / tour operators / travel agents / tourism associations.
Operations and Marketing Synergy The Great Lakes stakeholders must ensure that the marketing message and operational delivery match, which is inclusive of port operations and upland tourism offerings. The structure of the ports moving forward should be provided to the cruise brands, in terms of uses of berths, defined operational patterns, and potential partnerships with the regional association (B2C) and local network (B2B). The stakeholder message must inform the cruise market of the intentions of the ports moving forward. A key stakeholder group should meet with the individual cruise brands to provide this outline of opportunity in the future. A public announcement outlining this new or improved cruise venture change and opportunity for port‐of‐call and homeport operations should be conducted as part of the action‐plan efforts.
Assembling the Issues and Meeting the Challenges Part of the marketing‐message creation is the assessment of the opportunities and challenges that the ports, cities, and region has that must be crafted and communicated to the industry, individual brands, and decision‐makers. Each destination has a different set of these issues, so unfortunately, when looking at crafting a message on a regional level, it must typically be bigger‐picture (influencing the education of the consumer to choose a small‐ship cruise), and not always as specific as a cruise operator may like. It is important to understand that as a destination, each port may not be all things to all cruise line brands. However, for the Ontario ports included in this study, it is apparent that the destinations cover many brands and consumer types, which is a positive attribute as the region grows the cruise business. It cannot be overstated that the focus should be on the guest experience, which is central to the success of any cruise line. Always improving and creating new fresh and innovative products and services is essential to the success of a cruise line and destination. The Great Lakes regional tourism bodies have done an excellent job at marketing and developing land‐based tourism that meet a wide swathe of consumer demographics and provide revenue opportunities. The focus will be
Exhibit A Report Number 19-150

GREAT LAKES CRUISE STRATEGY FOR ONTARIO’S PORTS – TASK 2: BUSINESS CASE AND CRUISE INDUSTRY STRATEGIC ACTION PLAN
172
on further expanding these efforts to drive a new cruise‐market demand, providing for socioeconomic impacts to the communities, allowing for greater cruise line revenues and lower operating costs, and creating higher guest satisfaction.
Strategic Plan Outline The attached spreadsheet outlines the strategic‐plan elements. See Annex I for the Strategic Action Plan. The plan consists of three sections. The first of which is a summary of the key action items and the timeline for each. The second tab provides for the overall action plan listings with all key components of the plan inclusive of a strategy outline for each item to provide a directive for each item. Table 38 (and as an action item tab) illustrate the preliminary budget for those key items associated with the creation of the organization structure and annual marketing monies. It is assumed the GLCA and Ontario Ports Association monies are annual. Table 38: Action Plan Budget Items
No. Priority Strategy Estimated Cost
M‐ST 1 High Great Lakes Cruise Association (B2C Marketing) ‐ Grant Preferred $250,000
M‐ST 2 High Regional Cruise Leader (Search / Hire / Contract) $100,000
M‐ST 3 High Great Lakes Cruise Brand Development $25,000
M‐ST 4 High Cruise Website(s) Redevelopment $50,000
M‐ST 5 High Local Cruise Networks / Ontario Cruise Association $100,000
M‐ST 7 High B2C North American Cruise Consumer Market Development Partnership funding
M‐ST 8 High B2C International Cruise Consumer Market Development Partnership funding
M‐ST 9 High B2B Cruise Line Development $5,000 (Direct Travel)
M‐ST 11 Medium Cruise Tourism Provider Education $10,000
Cap‐ST 3 High NA / CLIA Small Ship Travel Agent Education $15,000
Cap‐ST 4 Medium NA Regional Consumer Education $50,000
Cap‐ST 5 High European / NA Cruise Operator Visitation (GLCA) $25,000
GLCA Related (Immediate Need) ~$525,000
Local/Ontario Association Related (Combined) Per Annum (Direct) ~$100,000
Annual / Longer‐term Items (Per Port Member Per Annum) ~$2,500 ‐ $10,000
Grants or other funding mechanisms from association partners such as Government agencies ‐ Tourism, economic opportunities agencies and others may provide for part of the contribution. Larger projects related to joint marketing
Exhibit A Report Number 19-150
GREAT LAKES CRUISE STRATEGY FOR ONTARIO’S PORTS – TASK 2: BUSINESS CASE AND CRUISE INDUSTRY STRATEGIC ACTION PLAN
173
efforts with cruise brands / tour operators, etc., as well as specific consumer marketing campaigns will need to be approached on an individual basis and rated on a Return On Investment (ROI) scale related to their impact on new additional cruise passenger throughput to the Great Lakes and the Ontario Ports specifically and the subsequent socioeconomic impacts.
Summary Cruise tourism continues to grow and expand globally. However, competition for cruise deployments and visitors has never been fiercer, with new and potentially game‐changing markets (such as Cuba and China) coming into play, even as mature cruise regions (such as the Baltic and Alaska) continue to grow. In order to capitalize on current and projected growth of global cruise tourism, the Great Lakes region must focus its energy and resources on delivering a small‐ship luxury / exploration cruise experience that is second to none, and that appeals equally to the demographics of the brands sailing to, and wanting to sail to, the Great Lakes. This cruise experience must be consistent with the brand philosophies of the diverse range of cruise lines that operate within the region, and must include equally diverse and high‐quality landside products that complement onboard products. There must be a unified public voice / face of the Great Lakes cruise region: an Alliance between a Great Lakes Regional Cruise Association and the Local Cruise Networks (in conjunction with an Ontario Cruise Association) charged with spearheading efforts to increase consumer demand, deliver superior hospitality, unique activities, diverse destinations, and authentic local experiences to small‐ship cruise brands and their customers. As outlined throughout the action plan, the purpose should be increasing cruise‐ship calls, cruise visitations, visitor satisfaction rates, and economic impacts within the region during the next 5 – 10 years and beyond. The Great Lakes region has a genuine opportunity to position itself right now as a premier small‐ship luxury / exploration cruise destination for visitors from around the world. Realizing this future vision will require not only significant effort by all parties and stakeholders in the region, but also new and innovative approaches to partnerships and unprecedented collaboration amongst stakeholders.
Exhibit A Report Number 19-150
GREAT LAKES CRUISE STRATEGY FOR ONTARIO’S PORTS – TASK 2: BUSINESS CASE AND CRUISE INDUSTRY STRATEGIC ACTION PLAN
174
ANNEX A: LARGE CRUISE VESSEL FLEET INFORMATION Cruise Industry Consolidation and Deployment Strategies The cruise industry has largely consolidated into a handful of profitable operators that necessitate most ports, in order to market to a limited number of companies/decision‐makers. See Figure 40. However, individual brands still make their own itinerary/deployment decisions based on their target consumer demographics and demand cycles. In addition, since the locks that define the Great Lakes and ports of Ontario limit the size of vessels capable of operating in the region, the broader consolidation of the industry is largely irrelevant, because the vast majority of Small Ship cruise brands that have the potential to deploy their ships within the waters of the Great Lakes are so small that they have not been part of the consolidation activity to date. Therefore, the Ontario ports must still deal directly with multiple Small Ship lines and individual decision‐makers at each line.
Cruise lines large and small try to limit their commitments to regions or ports to preserve their ability to move ships and modify their operations quickly (within 6‐12 months) to reflect changes in demand and global economic/ geopolitical issues, to absorb costs, and/or to increase profitability. Two major factors that weigh heavily in the determination of ship deployment are:
Passenger satisfaction/demand – Cruise lines use survey tools, travel agents, and passenger feedback as key indicators for future deployments.
Yields – Lines place vessels into itinerary patterns with high demand, high revenues, and lower operating costs, to maximize passenger net margins and spending per day (meaning onboard and shore‐side spending, such as shopping, bar, casino, spa and shore excursion revenues).
Exhibit A Report Number 19-150
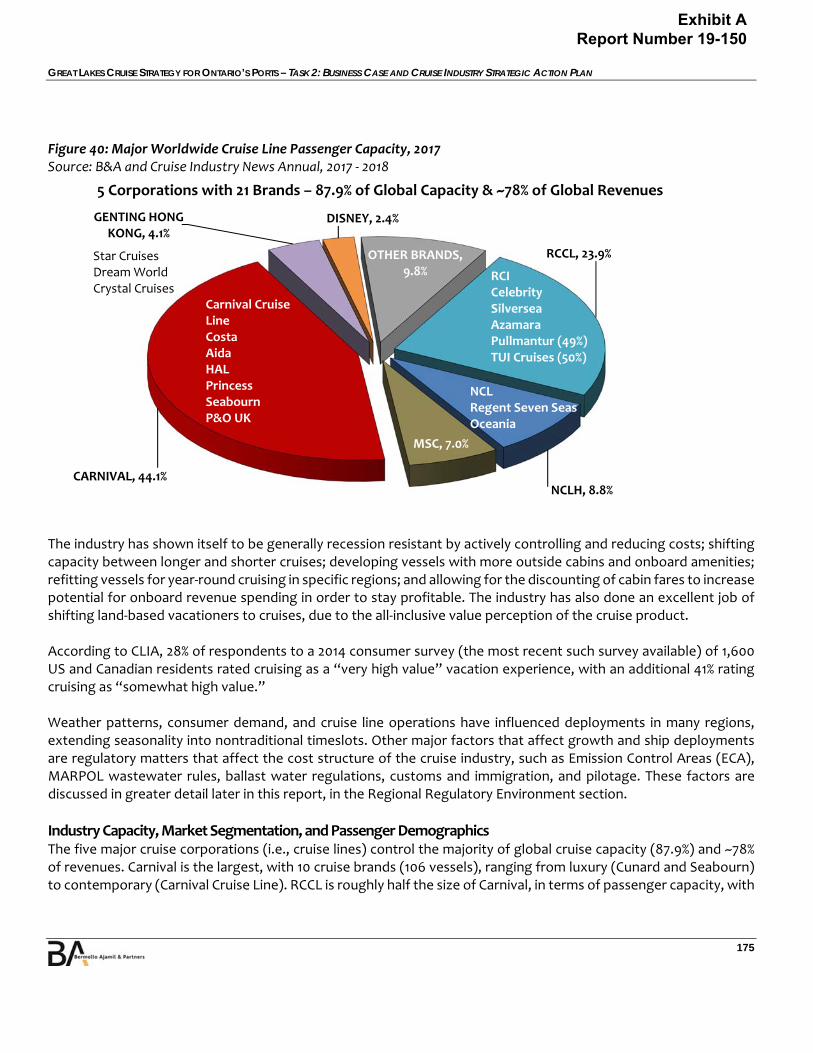
GREAT LAKES CRUISE STRATEGY FOR ONTARIO’S PORTS – TASK 2: BUSINESS CASE AND CRUISE INDUSTRY STRATEGIC ACTION PLAN
175
Figure 40: Major Worldwide Cruise Line Passenger Capacity, 2017 Source: B&A and Cruise Industry News Annual, 2017 ‐ 2018
The industry has shown itself to be generally recession resistant by actively controlling and reducing costs; shifting capacity between longer and shorter cruises; developing vessels with more outside cabins and onboard amenities; refitting vessels for year‐round cruising in specific regions; and allowing for the discounting of cabin fares to increase potential for onboard revenue spending in order to stay profitable. The industry has also done an excellent job of shifting land‐based vacationers to cruises, due to the all‐inclusive value perception of the cruise product. According to CLIA, 28% of respondents to a 2014 consumer survey (the most recent such survey available) of 1,600 US and Canadian residents rated cruising as a “very high value” vacation experience, with an additional 41% rating cruising as “somewhat high value.” Weather patterns, consumer demand, and cruise line operations have influenced deployments in many regions, extending seasonality into nontraditional timeslots. Other major factors that affect growth and ship deployments are regulatory matters that affect the cost structure of the cruise industry, such as Emission Control Areas (ECA), MARPOL wastewater rules, ballast water regulations, customs and immigration, and pilotage. These factors are discussed in greater detail later in this report, in the Regional Regulatory Environment section.
Industry Capacity, Market Segmentation, and Passenger Demographics The five major cruise corporations (i.e., cruise lines) control the majority of global cruise capacity (87.9%) and ~78% of revenues. Carnival is the largest, with 10 cruise brands (106 vessels), ranging from luxury (Cunard and Seabourn) to contemporary (Carnival Cruise Line). RCCL is roughly half the size of Carnival, in terms of passenger capacity, with
RCCL, 23.9%
NCLH, 8.8%
MSC, 7.0%
CARNIVAL, 44.1%
GENTING HONG KONG, 4.1%
DISNEY, 2.4%
OTHER BRANDS, 9.8%
Carnival Cruise Line CostaAidaHALPrincessSeabournP&O UK
NCLRegent Seven SeasOceania
5 Corporations with 21 Brands – 87.9% of Global Capacity & ~78% of Global Revenues
RCI Celebrity Silversea Azamara Pullmantur (49%) TUI Cruises (50%)
Star Cruises Dream World Crystal Cruises
Exhibit A Report Number 19-150

GREAT LAKES CRUISE STRATEGY FOR ONTARIO’S PORTS – TASK 2: BUSINESS CASE AND CRUISE INDUSTRY STRATEGIC ACTION PLAN
176
six brands and 54 ships; RCCL is followed by the fleets of NCLH (three brands/25 ships), MSC (single brand/14 ships), and Genting Hong Kong (three brands/nine ships). (See Table 39).
Table 39: Major Worldwide Cruise Line & Brand Passenger Capacity, 2017 Source: B&A and Cruise Industry News Annual, 2017 ‐ 2018
Cruise Operator Vessels Newbuilds Consumer
Market Number
of Berths Bed Day Capacity
Market Share
CARNIVAL CORPORATION & PLC 106 19 234,208 10,469,332 44.1%
Carnival Cruise Line (NA) 25 3 Contemporary 65,890 4,292,296 17.1%
Princess Cruises (NA) 18 4 Contemporary 47,130 1,816,870 7.2%
Costa Crociere (IT) 15 4 Contemporary 36,147 1,971,012 7.8%
AIDA Cruises (G) 12 2 Contemporary 25,012 946,582 3.8%
Holland America Line (NA) 14 2 Premium 23,362 834,468 3.3%
P&O Cruises (UK) 8 1 Contemporary 17,991 558,383 2.2%
P&O Cruises Australia (AUS) 6 0 Contemporary 9,330 402,792 1.6%
Cunard Line (UK) 3 0 Luxury 6,712 212,044 0.8%
Seabourn Cruise Line 4 1 Luxury 1,954 61,510 0.2%
ROYAL CARIBBEAN CRUISES, LTD 54 10 123,792 6,021,020 23.9%
Royal Caribbean Intl. (NA) 25 5 Contemporary 77,042 4,181,972 16.6%
Celebrity Cruises (NA) 16* 2 Premium 22,430 803,404 3.2%
Pullmantur (SP) 4 0 Budget 7,358 404,276 1.6%
TUI Cruises (G) 6 3 Contemporary 13,734 454,296 1.8%
Azamara Club Cruises (NA) 2 0 Premium 1,428 45,672 0.2%
NORWEGIAN CRUISE LINE HOLDINGS
25 8 50,646 2,213,796 8.8%
NCL (NA) 15 7 Contemporary 42,730 1,987,800 7.9%
Oceania Cruises (NA) 6 0 Premium 5,256 150,336 0.6%
RSSC (NA) 4 1 Luxury 2,660 75,660 0.3%
MSC CRUISES 14 10 CONTEMPORARY 40,500 1,759,140 7.0%
GENTING HONG KONG 9 6 15,409 1,022,419 4.1%
Star Cruises (Asia) 4 2 Contemporary 6,505 702,691 2.8%
Dream Cruises (Asia) 2 Premium 6,800 258,400 1.0%
Crystal Cruises (NA) 3 4 Luxury 2,104 61,328 0.3%
DISNEY CRUISE LINE 4 3 CONTEMPORARY 8,500 591,500 2.4%
Note: RCCL recently purchased a stake in Silversea Cruises (67%).
The remaining fleet encompasses approximately 200 vessels (including existing ships and approximately 40 newbuilds, scheduled for delivery after 2018) that are controlled by numerous independent brands, each of which operate between one and 16 oceangoing vessels of various sizes and capacities.
Exhibit A Report Number 19-150
GREAT LAKES CRUISE STRATEGY FOR ONTARIO’S PORTS – TASK 2: BUSINESS CASE AND CRUISE INDUSTRY STRATEGIC ACTION PLAN
177
The major cruise lines simultaneously compete for consumers in many different market segments. To be successful, they must differentiate themselves and provide a value proposition to the consumer, which ranges from budget to super luxury, with a plethora of different experiences offered. In general, different cruise brands target different demographics. However, individual vessels, particularly large contemporary vessels, typically carry varying demographics based on cabin type (i.e., suite vs. inside cabin), destination (i.e., Caribbean vs. Mediterranean) and other factors. Even individual sailings may consist of highly mixed and very different demographic profiles, particularly within the mass market space.
Exhibit A Report Number 19-150

GREAT LAKES CRUISE STRATEGY FOR ONTARIO’S PORTS – TASK 2: BUSINESS CASE AND CRUISE INDUSTRY STRATEGIC ACTION PLAN
178
ANNEX B: SMALL CRUISE SHIP COMPANIES Top small ship cruise brands The following section presents a brief overview of each of the Top 20 brands, including generalizations related to their target consumer demographics. Specific demographic information is included where known. Blount Small Ship Adventures (currently active in the Great Lakes) has also been added, since it is a strong candidate for future deployments to one or more port(s) of Ontario.
Hurtigruten Hurtigruten was founded and remains headquartered in Tromsø, Norway, and has been sailing small ships in polar waters since 1893. Hurtigruten brands itself as a destination‐focused exploration company that “values learning and personal growth over luxury” and maintains a strong commitment to sustainability. Hurtigruten promotes its expedition cruise offerings by focusing on themes that include nature, adventure, and memorable experiences—in the most remote corners of the world. Hurtigruten’s fleet currently consists of 14 vessels, only two of which currently operate in or around North America. They will add two new ships by 2020, growing their total fleet to 16 ships, all of which will be able to transit the Great Lakes Locks. Hurtigruten’s ships range in capacity from 268 passengers to 1,000. Hurtigruten characterizes the markets in which it operates as 12 distinct destinations, including Norway, Antarctica, Greenland, Svalbard (Arctic Norway), South America, Iceland, Northwest Passage, Alaska, North America, Europe, Russia, and the Caribbean and Central America. Many of their itineraries continue to focus on Polar Regions or other extreme cold‐weather environments. Consistent with their branding, they target active adventure enthusiasts, who are more interested in rugged, off‐the‐beaten‐path destination exploration than luxury accommodations.
Lindblad Expeditions Headquartered in New York, NY, since 2004, Lindblad has operated its expedition cruises in partnership with National Geographic as a joint venture. The two companies cobrand, and the entire Lindblad fleet of vessels includes “National Geographic” as part of the naming convention (i.e., National Geographic Explorer, National Geographic Orion, etc.). Lindblad focuses heavily on hard‐to‐reach destination experiences with a special emphasis on impact travel and educational opportunities, including onboard lectures, photography lessons, and access to scientific equipment that can be used to both study a destination and explore it. Lindblad proudly touts its connections via National Geographic to research, education, conservation, and community development initiatives in the markets in which they operate vessels. These initiatives include studies on humpback whale behaviour, clean water, invasive species eradication, and other wildlife conservation projects in the Galápagos, as well as artisan development in the Peruvian Amazon. Lindblad currently operates a fleet of nine expedition vessels, which will expand to 10 by 2020. All Lindblad vessels can traverse the Great Lakes Locks. Their ships range in capacity from 48 to 148 passengers. Lindblad offers cruises in all of the following markets, either aboard their own vessels or aboard one of five charter vessels that they use: North America (Alaska, Baja California, Caribbean, Pacific Northwest, and Canada); Central America (Costa Rica, Panama, Belize, Guatemala); South America (Amazon, Galápagos, Peru, South American West Coast); Europe (Scotland, Mediterranean, British & Irish Isles); Southeast Asia & Pacific (Vietnam, Cambodia, South Pacific, French Polynesia); Polar Regions (Antarctica, Arctic, Russian Far
Exhibit A Report Number 19-150

GREAT LAKES CRUISE STRATEGY FOR ONTARIO’S PORTS – TASK 2: BUSINESS CASE AND CRUISE INDUSTRY STRATEGIC ACTION PLAN
179
East); and Africa/the Middle East (Egypt). Consistent with their branding, Lindblad targets travel enthusiasts who are acutely interested in the social, cultural, anthropological, and natural aspects of the destinations they visit.
Ponant Ponant is headquartered in Marseille, France, and its vessels are also registered in France. The company uses its French identity as a marketing tool, claiming “refined cuisine, fine wines, and discreet service” as well as a “truly relaxed and elegant experience,” accompanied by the “French touch.” This celebration of French heritage and culture defines the Ponant brand, which operates more as a luxury yacht cruise line than an expedition cruise line. Ponant currently operates a fleet of seven ships, which will grow to nine by 2020; all of them will be able to transit the Great Lakes Locks. Ponant’s ships range in capacity from 64 passengers to 164, and they operate in all of the following markets: Africa, Alaska, Antarctica, Asia, the Caribbean, Latin America, North America, Northern Europe, the Pacific, Oceania, Russia, the Adriatic, the Arctic, and the Mediterranean. In 2019, Ponant’s 180 passenger Le Champlain will sail a limited number of itineraries within the Great Lakes region, calling four Ontario ports (Sault Sainte Marie, Little Current, Parry Sound, and Toronto). Ponant’s primary target demographic is affluent francophone or Anglophone travel enthusiasts who wish to explore less common destinations, while still enjoying certain onboard amenities that come with a “French touch.” See ANNEX B for a map of each itinerary that Ponant operates in the Great Lakes.
Un‐Cruise Adventures Headquartered in Seattle, Washington, Un‐Cruise’s stated mission is “to provide our guests an enriching adventure travel experience and inspire an appreciation of local cultures and the natural world”. Un‐Cruise operates nine expedition ships, ranging in capacity from 22 passengers to 86, and they sail in several different markets, including Alaska, Costa Rica, Panama, the Galápagos, Hawaii, the Sea of Cortés (Mexico), and the Pacific Northwest. Alaska is the principal market for Un‐Cruise. This line encourages social interaction among its guests as part of its core brand identity, stating on its website that “it doesn’t take long for guests and crew alike to get to know one another and call each other by name … Adventure activities, meals, and comfortable community spaces mean spending time with your fellow adventurers.” The Un‐cruise demographic is primarily North American and includes an eclectic mix of ages, with couples, singles, and multigenerational families all among their target passengers. Un‐Cruise also describes its typical guest as educated and savvy when it comes to traveling.
Variety Cruises Founded and headquartered in Athens, Greece, Variety Cruises is one of the leading yacht cruise lines in the world, operating a fleet of eight cruise ships that range in capacity from 49 to 72 passengers. All Variety ships can transit the Great Lakes Locks. Variety markets itself as an exclusive product that offers travellers the “ultimate yacht cruise experience.” Variety also emphasises the experiential nature of its cruise itineraries, which include destinations that are “much‐loved and unfrequented,” and can be visited in a private, intimate, relaxed environment. Other qualities associated with the Variety brand include: the ability to dock in the heart of a destination, where larger ships cannot go; time in the destination, including overnights; immersion in the destination via unique shore excursions; Mediterranean cuisine with strong local influence; personalized service; and swimming platforms (for swimming, snorkelling, kayak‐launching, etc.). Variety operates in all of the following markets: the Greek Islands; Turkey; the Adriatic Sea (Croatia, Montenegro, Albania, Greece); Costa Rica & Panama; Cuba (year‐round); Iceland; the Seychelles (year‐round); Madagascar & Mozambique; the Canary Islands; and the
Exhibit A Report Number 19-150

GREAT LAKES CRUISE STRATEGY FOR ONTARIO’S PORTS – TASK 2: BUSINESS CASE AND CRUISE INDUSTRY STRATEGIC ACTION PLAN
180
Cape Verde Archipelago. Variety’s target demographic is affluent travellers seeking a Small Ship luxury onboard experience, combined with high‐end, exclusive in‐destination experiences.
Aurora Expeditions The Aurora brand is headquartered in Sydney, Australia, and is defined by the company’s stated “passion” for adventure, exploration of wild places, and social interaction in Small Ship, small‐group, and personalized expedition settings. Aurora touts its expedition teams, which lead the brand’s guided explorations of remote areas, in addition to providing onboard lectures to “entertain and expand” guest knowledge. Among the brand’s desired objectives is to provide adventures that “stir the soul, offer personal attention on unforgettable expeditions and welcome new friends into the Aurora family.” Aurora also emphasizes flexibility over schedule, in order to accommodate unplanned situations – both positive (i.e., rare wildlife sightings) and negative (i.e., unforeseen weather) – and they promote environmental sensitivity and enrichment. Aurora operates seven expedition vessels, ranging in capacity from 28 to 72 passengers. All Aurora ships can transit the Great Lakes Locks. As of 2018, these ships operate in all of the following markets: Alaska, Antarctica, the Arctic, Ecuador, Galápagos, the Kimberley Coast, Papua New Guinea, Patagonia, Russia, and Scotland. Aurora’s primary target demographic is adventure travellers who are looking to connect with likeminded people to explore rugged and remote destinations.
Quark Expeditions Quark was founded in 1991, and is headquartered in Seattle, Washington. Quark specializes in Arctic and Antarctic expedition travel, and offers polar region expeditions on purpose‐built small‐expedition ships and icebreakers. For the most part, their itineraries are limited to the Polar Regions. Quark currently operates a fleet of five vessels, ranging in capacity from 62 to 207 passengers. All of their ships can transit the Great Lakes Locks. In its marketing, Quark emphasizes unique land‐based adventures in extreme environments. Each of their ships features ice‐strengthened hulls and increased inflatable landing crafts for “safe, comfortable transfers between ship and shore.” These features allow their passengers to access some of the world’s most remote places, which is core to their marketing and brand identity. Their land programs include aspects of various academic and scientific disciplines, including polar history, biology, geology, photography, ornithology, and glaciology. Quark’s target demographic includes younger and adventure travellers looking to explore remote, challenging places that are not widely known or visited.
Windstar Cruises Windstar is headquartered in Seattle, WA. It operates a fleet of six small luxury cruise ships/yachts with capacities ranging from 148 passengers to 308. All Windstar vessels can transit the Great Lakes Locks. Windstar calls 150 ports in 50 different countries, in markets including: Europe, the Mediterranean, Alaska, Asia, Canada & New England, the Caribbean, the South Pacific, Central America, Iceland, and Tahiti. In 2014, Windstar was named “Best Small Ship Cruise Line” by Condé Nast Traveller. Windstar markets itself as an upscale yet casual alternative to mainstream cruising, which emphasizes cultural experiences that are “personal and authentic, with the power to change your perspective.” In the same vein, they promote their ships as “large enough to pamper, yet small enough to explore secluded coves and docks in the heart of charming villages, sparkling cities and remote islands.” Windstar’s primary target demographic is affluent luxury travellers between 55 and 65 years of age with average
Exhibit A Report Number 19-150
GREAT LAKES CRUISE STRATEGY FOR ONTARIO’S PORTS – TASK 2: BUSINESS CASE AND CRUISE INDUSTRY STRATEGIC ACTION PLAN
181
annual incomes between $150,000 and $200,000 (CAD), who are looking for an exclusive yet informal vacation experience. On average, in‐destination spending by Windstar passengers ranges from $150‐$200 (CAD) per person.
Oceanwide Expeditions Oceanwide is a Dutch company headquartered in the Netherlands. They specialize in the Arctic and Antarctic regions. Oceanwide currently operates a fleet of four ice‐strengthened vessels, with a fifth new vessel scheduled for delivery in 2019. All of Oceanwide’s ships range in capacity from 20 to 196 passengers, and will be able to transit the Great Lakes Locks by 2020. As a niche polar region expedition line, Oceanwide focuses on wildlife observation, unique and remote historical site visits, and generally hard‐to‐get to places with little or no tourism infrastructure. Oceanwide’s brand is built around its identity as a “pioneer of ship‐based expeditions, inventor of Basecamp Antarctica, and the first company to take travellers to the remote Arctic island of Spitsbergen.” Their marketing emphasizes authentic experiences that involve long periods of time ashore, and close personal contact with “Earth’s most surreal environments.” Oceanwide’s target demographic includes younger and includes adventure travellers looking to explore remote and challenging places that are not otherwise widely known or visited.
Silversea Cruises – recently RCCL purchased a 67% stake in the company Silversea is a Small Ship luxury cruise line with headquarters in Monaco. Founded in 1994, Silversea pioneered all‐inclusive cruising. The Silversea fleet consists of two classes of vessel: Silversea cruise ships, of which there will be six by 2020, ranging in capacity from 296 to 576 passengers; and Silversea expedition ships, of which there are four, ranging in capacity from 100 to 252 passengers. Of these 10 ships, five can theoretically transit the Great Lakes Locks, though two of them – Silver Cloud and Silver Wind – have overhang issues that have prevented them from accessing the Great Lakes market in the past. Therefore, Silversea is convinced that no vessel in their existing fleet can fit through the locks. This line brands itself as an ultra‐luxury cruise line that provides a high‐end, all‐inclusive travel experience for those looking to be spoiled. They emphasize intimacy, personal attention, and luxury features on their vessels, including butler service for some cabin classes. Silversea stresses their Europeanism as a distinguishing feature, but also highlights their appreciation of the destinations they visit, which include Africa & the Indian Ocean, Alaska, the U.S. West Coast, Antarctica, the Arctic & Greenland, Asia, Australia & New Zealand, Canada & New England, the Caribbean & Central America, Galápagos Islands, the Mediterranean, Northern Europe & the British Isles, the Russian Far East, South America, and South Pacific Islands.
American Cruise Lines (ACL) / Pearl Seas Cruises ACL is a Small Ship cruise line headquartered in Guilford, CT. ACL currently operates five oceangoing vessels, ranging in capacity from 100 passengers to 175, all of which can transit the Great Lakes Locks. ACL has an additional five newbuilds on order, all of which have a capacity of 195 passengers and are expected to be put into service by 2022. While operated under a different brand, Pearl Seas’ Pearl Mist falls under the same ownership and management as ACL. Pearl Mist has a capacity of 210 passengers, and already operates in the Great Lakes region, calling five Ontario ports (Sault Sainte Marie, Little Current, Parry Sound, Midland, and Toronto). Pearl Seas plans to build two additional ships, each with a capacity of approximately 300 passengers, within the next few years. However, orders for these ships have not yet been placed yet. While ACL is known mainly for its US Coastal itineraries, Pearl Seas visits international destinations, including Canada and Cuba. Both brands fall into the “soft adventure” category, and market themselves as affordable alternatives to luxury brands and comfortable Small Ship alternatives to larger brands. The core demographic for ACL/Pearl Seas is older, middle‐income North
Exhibit A Report Number 19-150
GREAT LAKES CRUISE STRATEGY FOR ONTARIO’S PORTS – TASK 2: BUSINESS CASE AND CRUISE INDUSTRY STRATEGIC ACTION PLAN
182
American travellers who want to explore their own backyard, or more exotic destinations, in a casual environment. See ANNEX B for a map of each itinerary that ACL/Pearl Seas operates in the Great Lakes.
Grand Circle Cruise Line (GCCL) GCCL operates five small ocean cruise ships, ranging in capacity from 50 to 98 passengers. GCCL also operates several river cruise ships as part of the Grand Circle Corporation (based in Boston, MA), which includes Grand Circle Travel. GCCL caters primarily to an older, affluent soft‐adventurer consumer demographic, and sources almost exclusively from North America. GCCL also frequently charters vessels owned and operated by other brands.
Celebrity Cruises – Xpedition Class (Celebrity X) Celebrity, which is part of RCCL and headquartered in Miami, FL, operates three Xpedition class vessels, with a fourth under construction. These ships range in capacity from 16 to 100 passengers, and can all transit the Great Lakes Locks. Celebrity is a premium brand, and its Xpedition ships are no exception. Billed as luxury exploration vessels, Celebrity X currently operates its entire fleet in the Galapagos Islands. Celebrity’s target demographic is affluent North Americans who appreciate exotic destination exploration, with a touch of luxury.
Star Clippers Star Clippers is a premium ocean‐sailing brand headquartered in Miami, FL. It operates four sail/cruise ships in markets including the Caribbean, Mediterranean, Southeast Asia, Central America, and other regions, as part of its grand voyage itineraries. Star Clippers’ fleet ranges in capacity from 82 to 320 passengers. From a brand identity and marketing perspective, Star Clippers differentiates itself rather easily from most other cruise brands by virtue of the unique lifestyle elements associated with tall ships and the culture of sailing, which are described in its promotional materials as “informal elegance.” Star Clippers’ target demographic is travellers who are interested in a more traditional maritime experience.
Hapag‐Lloyd Hapag‐Lloyd, headquartered in Hamburg, Germany, currently operates two small luxury cruise ships and two expedition ships, with two additional expedition ships set for delivery prior to 2020. All four Hapag‐Lloyd expedition ships will be able to transit the Great Lakes Locks. These four vessels range in capacity from 164 to 230 passengers. Hapag‐Lloyd operates in several global regions, including the Middle East, the Mediterranean, the Caribbean, the Pacific & South Seas, Asia, the North Sea/Baltic Sea, Africa, Antarctica, and the Arctic. Beginning in 2020, the newest expedition vessel in the Hapag‐Lloyd fleet will operate a handful of different itineraries in the Great Lakes region, including two 14‐day sailings that travel across all five lakes, calling the Ontario ports of Thunder Bay, Sault Sainte Marie, Little Current, Parry Sound, Windsor, and Toronto along the way. Hapag‐Lloyd is a luxury cruise line, and its target demographic is affluent European travellers who enjoy visiting destinations that fall somewhat outside the normal travel circuit. See ANNEX B for a map of each itinerary that Hapag‐Lloyd operates in the Great Lakes.
Ritz‐Carlton Yacht Collection (RCYC) RCYC is a cruise start‐up set to begin operations in 2019‐2020, building up to three identical ultra‐luxury “mega‐yachts” shortly thereafter. Its parent company is headquartered in Chevy Chase, MD, but RCYC will be based in
Exhibit A Report Number 19-150
GREAT LAKES CRUISE STRATEGY FOR ONTARIO’S PORTS – TASK 2: BUSINESS CASE AND CRUISE INDUSTRY STRATEGIC ACTION PLAN
183
Miami, FL. Each of RCYC’s custom‐built ships will offer a very high standard of service, and will have a capacity of 298 passengers. Accommodations will include 149 suites, each with its own terrace, plus two penthouse suites. Itineraries will range from 7 to 12 nights, and include intimate and signature destinations, with many overnight calls to maximize in‐destination experiences. While many details related to RCYC’s deployment plans are still unknown, they do plan to include the Great Lakes among their early North American markets, and they expect to call Toronto as early as 2021, with calls in other Ontario ports to be determined. At least one of RCYC’s three vessels is being designed specifically to fit within the dimensions of the Great Lakes Locks, and all three will likely fit once constructed. Their target demographic is affluent travellers between 45 and 55 years of age with average annual incomes exceeding $250,000 (CAD). RCYC operates in the luxury market, and their cruise ship guests’ profiles will generally be similar to those of their hotel and resort guests. RCYC expects average in‐destination spending by their guests to exceed $250 (CAD) per person.
Coral Expeditions Based in Cairns, Australia, Coral operates three Australia‐flagged expedition vessels, ranging in capacity from 44 to 72 passengers, with a 120‐passenger newbuild set for delivery in 2019. Coral pioneered small‐ship expedition‐style cruising in the Kimberley Islands of the South Pacific, Indonesia, and Papua New Guinea. Coral Expeditions remains the only major operator of extended small ship cruises on the Great Barrier Reef. Coral’s target demographic is adventure travellers seeking access to hard‐to‐reach tropical destinations.
Cruise & Maritime Voyages Cruise & Maritime is headquartered in Essex, England. They position themselves in the market as a provider of cruise holidays aboard smaller and midsized classic, traditional ships. They currently operate a fleet of five vessels, three of which can transit the Great Lakes Locks. These ships have capacities ranging from 550 to 844 passengers, putting them on the large side for the Great Lakes market. Cruise & Maritime targets an adult, English‐speaking demographic, and offers “soft adventure” and traditional entertainment, dining, and accommodations. Cruise & Maritime operates in a wide variety of cruise markets, including the Amazon & West Indies, Australasia, the Baltic, the British Isles, Atlantic Canada & Greenland, the Canary Islands & Madeira, Central America & Mexico, the Far East, Iceland, Atlantic Europe, Norwegian Fjords, Scottish Isles & Faroes, and Spitzbergen & North Cape.
Noble Caledonia Noble Caledonia offers a variety of cruise itineraries on its three vessels, which range in capacity from 49 to 118 passengers. All of Noble Caledonia’s vessels can transit the Great Lakes Locks. According to the Noble Caledonia website, their small ships allow them to “create itineraries and an onboard ambience that is conducive to exploring the world and learning of its wonders in the company of like‐minded travellers”. Their philosophy is that limiting the number of passengers involved in a given travel experience allows the camaraderie to grow between passengers, thereby creating a warm and friendly atmosphere onboard. They also distinguish themselves from larger brands by emphasizing their high crew‐to‐passenger ratio, and the personalization of service it allows. Noble Caledonia’s branding speaks to an “informative yet relaxed onboard atmosphere combined with a true spirit of adventure,” and they emphasize heavily their adventurous curiosity and efforts to continuously seek out new, unique, and interesting destinations. Noble Caledonia currently operates in the following markets: Africa, Antarctica, Australasia, Central America & the Caribbean, Central Asia, Europe, East Asia, India & the Indian Ocean,
Exhibit A Report Number 19-150
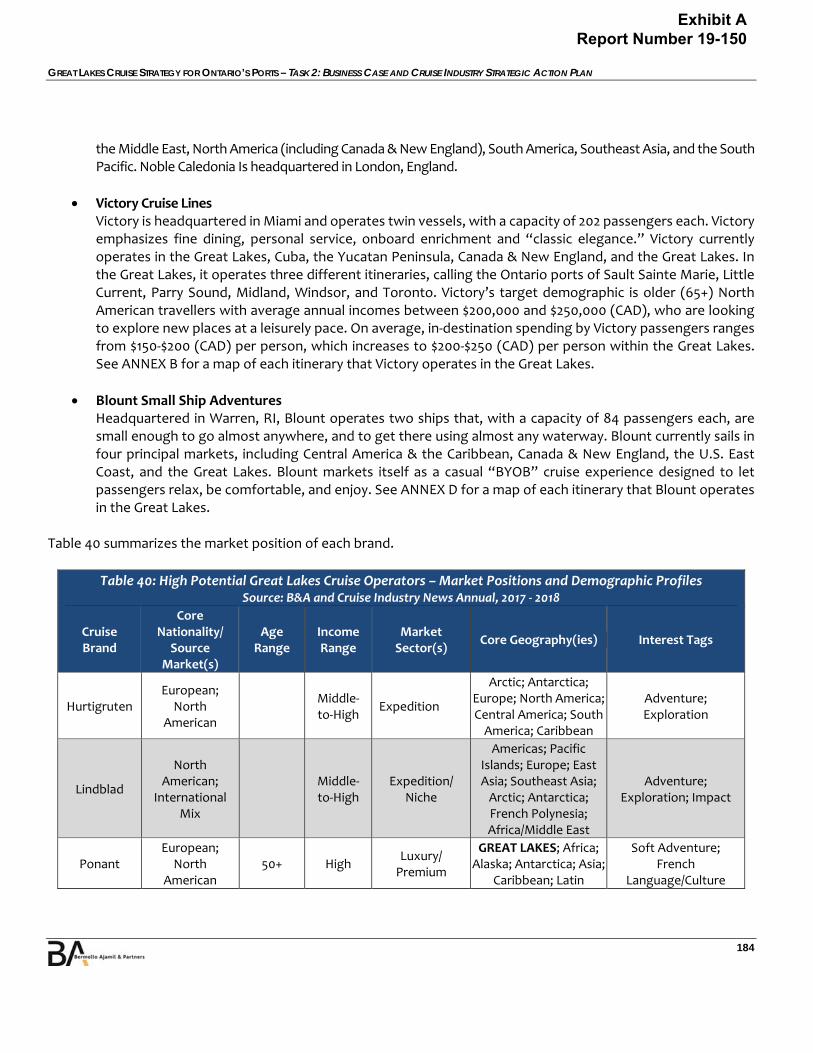
GREAT LAKES CRUISE STRATEGY FOR ONTARIO’S PORTS – TASK 2: BUSINESS CASE AND CRUISE INDUSTRY STRATEGIC ACTION PLAN
184
the Middle East, North America (including Canada & New England), South America, Southeast Asia, and the South Pacific. Noble Caledonia Is headquartered in London, England.
Victory Cruise Lines Victory is headquartered in Miami and operates twin vessels, with a capacity of 202 passengers each. Victory emphasizes fine dining, personal service, onboard enrichment and “classic elegance.” Victory currently operates in the Great Lakes, Cuba, the Yucatan Peninsula, Canada & New England, and the Great Lakes. In the Great Lakes, it operates three different itineraries, calling the Ontario ports of Sault Sainte Marie, Little Current, Parry Sound, Midland, Windsor, and Toronto. Victory’s target demographic is older (65+) North American travellers with average annual incomes between $200,000 and $250,000 (CAD), who are looking to explore new places at a leisurely pace. On average, in‐destination spending by Victory passengers ranges from $150‐$200 (CAD) per person, which increases to $200‐$250 (CAD) per person within the Great Lakes. See ANNEX B for a map of each itinerary that Victory operates in the Great Lakes.
Blount Small Ship Adventures Headquartered in Warren, RI, Blount operates two ships that, with a capacity of 84 passengers each, are small enough to go almost anywhere, and to get there using almost any waterway. Blount currently sails in four principal markets, including Central America & the Caribbean, Canada & New England, the U.S. East Coast, and the Great Lakes. Blount markets itself as a casual “BYOB” cruise experience designed to let passengers relax, be comfortable, and enjoy. See ANNEX D for a map of each itinerary that Blount operates in the Great Lakes.
Table 40 summarizes the market position of each brand.
Table 40: High Potential Great Lakes Cruise Operators – Market Positions and Demographic Profiles Source: B&A and Cruise Industry News Annual, 2017 ‐ 2018
Cruise Brand
Core Nationality/
Source Market(s)
Age Range
Income Range
Market Sector(s)
Core Geography(ies) Interest Tags
Hurtigruten European;
North American
Middle‐to‐High
Expedition
Arctic; Antarctica; Europe; North America; Central America; South America; Caribbean
Adventure; Exploration
Lindblad
North American;
International Mix
Middle‐to‐High
Expedition/ Niche
Americas; Pacific Islands; Europe; East Asia; Southeast Asia; Arctic; Antarctica; French Polynesia; Africa/Middle East
Adventure; Exploration; Impact
Ponant European;
North American
50+ High Luxury/ Premium
GREAT LAKES; Africa; Alaska; Antarctica; Asia;
Caribbean; Latin
Soft Adventure; French
Language/Culture
Exhibit A Report Number 19-150
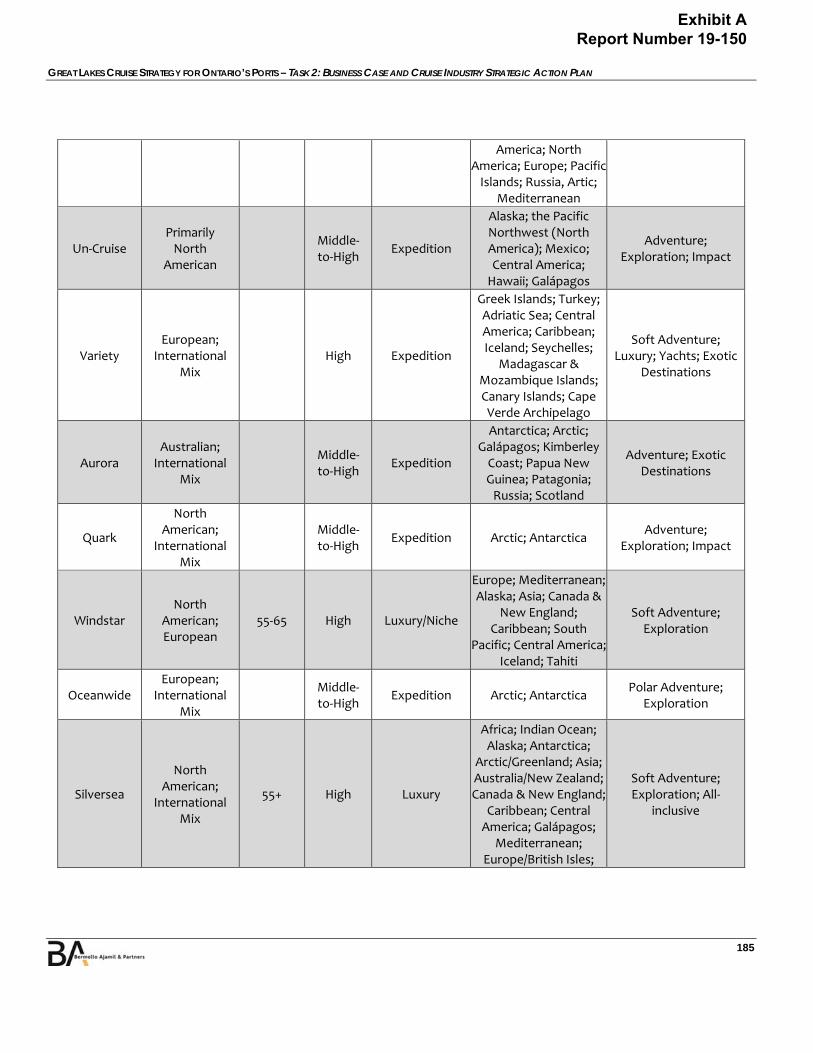
GREAT LAKES CRUISE STRATEGY FOR ONTARIO’S PORTS – TASK 2: BUSINESS CASE AND CRUISE INDUSTRY STRATEGIC ACTION PLAN
185
America; North America; Europe; Pacific Islands; Russia, Artic;
Mediterranean
Un‐Cruise Primarily North
American
Middle‐to‐High
Expedition
Alaska; the Pacific Northwest (North America); Mexico; Central America; Hawaii; Galápagos
Adventure; Exploration; Impact
Variety European;
International Mix
High Expedition
Greek Islands; Turkey; Adriatic Sea; Central America; Caribbean; Iceland; Seychelles;
Madagascar & Mozambique Islands; Canary Islands; Cape Verde Archipelago
Soft Adventure; Luxury; Yachts; Exotic
Destinations
Aurora Australian;
International Mix
Middle‐to‐High
Expedition
Antarctica; Arctic; Galápagos; Kimberley Coast; Papua New Guinea; Patagonia; Russia; Scotland
Adventure; Exotic Destinations
Quark
North American;
International Mix
Middle‐to‐High
Expedition Arctic; Antarctica Adventure;
Exploration; Impact
Windstar North
American; European
55‐65 High Luxury/Niche
Europe; Mediterranean; Alaska; Asia; Canada &
New England; Caribbean; South
Pacific; Central America; Iceland; Tahiti
Soft Adventure; Exploration
Oceanwide European;
International Mix
Middle‐to‐High
Expedition Arctic; Antarctica Polar Adventure;
Exploration
Silversea
North American;
International Mix
55+ High Luxury
Africa; Indian Ocean; Alaska; Antarctica;
Arctic/Greenland; Asia; Australia/New Zealand; Canada & New England;
Caribbean; Central America; Galápagos;
Mediterranean; Europe/British Isles;
Soft Adventure; Exploration; All‐
inclusive
Exhibit A Report Number 19-150
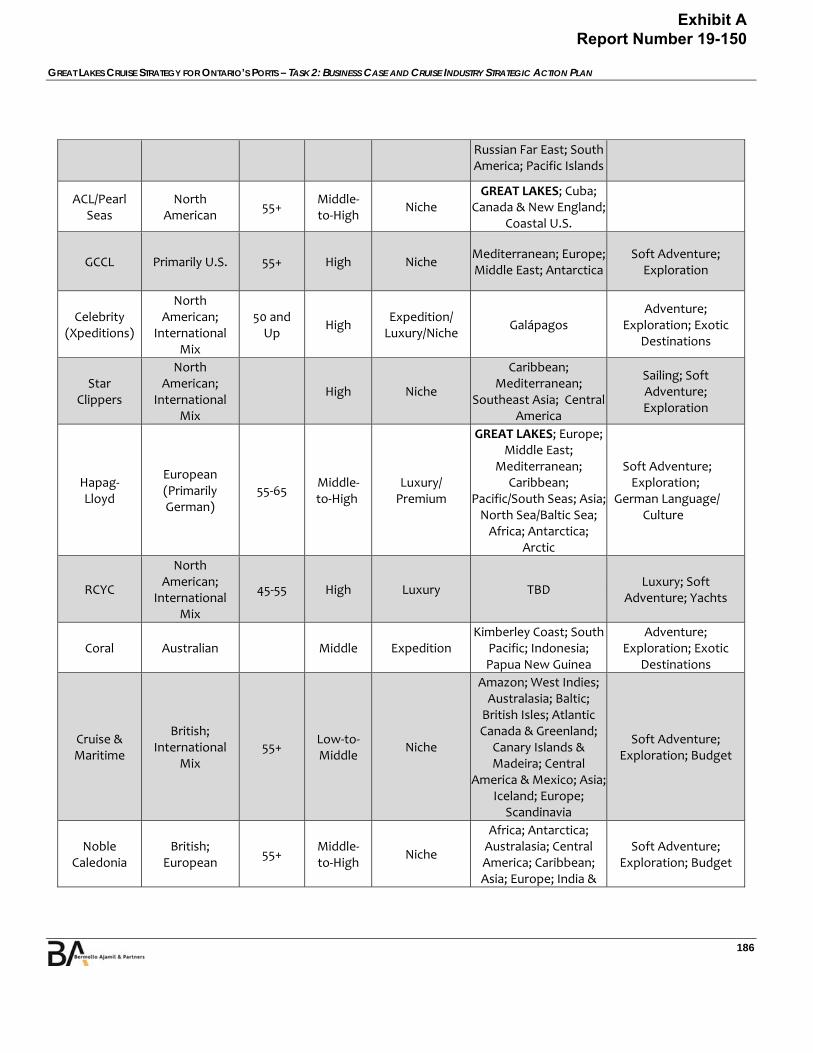
GREAT LAKES CRUISE STRATEGY FOR ONTARIO’S PORTS – TASK 2: BUSINESS CASE AND CRUISE INDUSTRY STRATEGIC ACTION PLAN
186
Russian Far East; South America; Pacific Islands
ACL/Pearl Seas
North American
55+ Middle‐to‐High
Niche GREAT LAKES; Cuba;
Canada & New England; Coastal U.S.
GCCL Primarily U.S. 55+ High Niche Mediterranean; Europe; Middle East; Antarctica
Soft Adventure; Exploration
Celebrity (Xpeditions)
North American;
International Mix
50 and Up
High Expedition/ Luxury/Niche
Galápagos Adventure;
Exploration; Exotic Destinations
Star Clippers
North American;
International Mix
High Niche
Caribbean; Mediterranean;
Southeast Asia; Central America
Sailing; Soft Adventure; Exploration
Hapag‐Lloyd
European (Primarily German)
55‐65 Middle‐to‐High
Luxury/ Premium
GREAT LAKES; Europe; Middle East;
Mediterranean; Caribbean;
Pacific/South Seas; Asia; North Sea/Baltic Sea; Africa; Antarctica;
Arctic
Soft Adventure; Exploration; German Language/ Culture
RCYC
North American;
International Mix
45‐55 High Luxury TBD Luxury; Soft
Adventure; Yachts
Coral Australian Middle Expedition Kimberley Coast; South
Pacific; Indonesia; Papua New Guinea
Adventure; Exploration; Exotic
Destinations
Cruise & Maritime
British; International
Mix 55+
Low‐to‐Middle
Niche
Amazon; West Indies; Australasia; Baltic; British Isles; Atlantic Canada & Greenland;
Canary Islands & Madeira; Central
America & Mexico; Asia; Iceland; Europe;
Scandinavia
Soft Adventure; Exploration; Budget
Noble Caledonia
British; European
55+ Middle‐to‐High
Niche
Africa; Antarctica; Australasia; Central America; Caribbean; Asia; Europe; India &
Soft Adventure; Exploration; Budget
Exhibit A Report Number 19-150
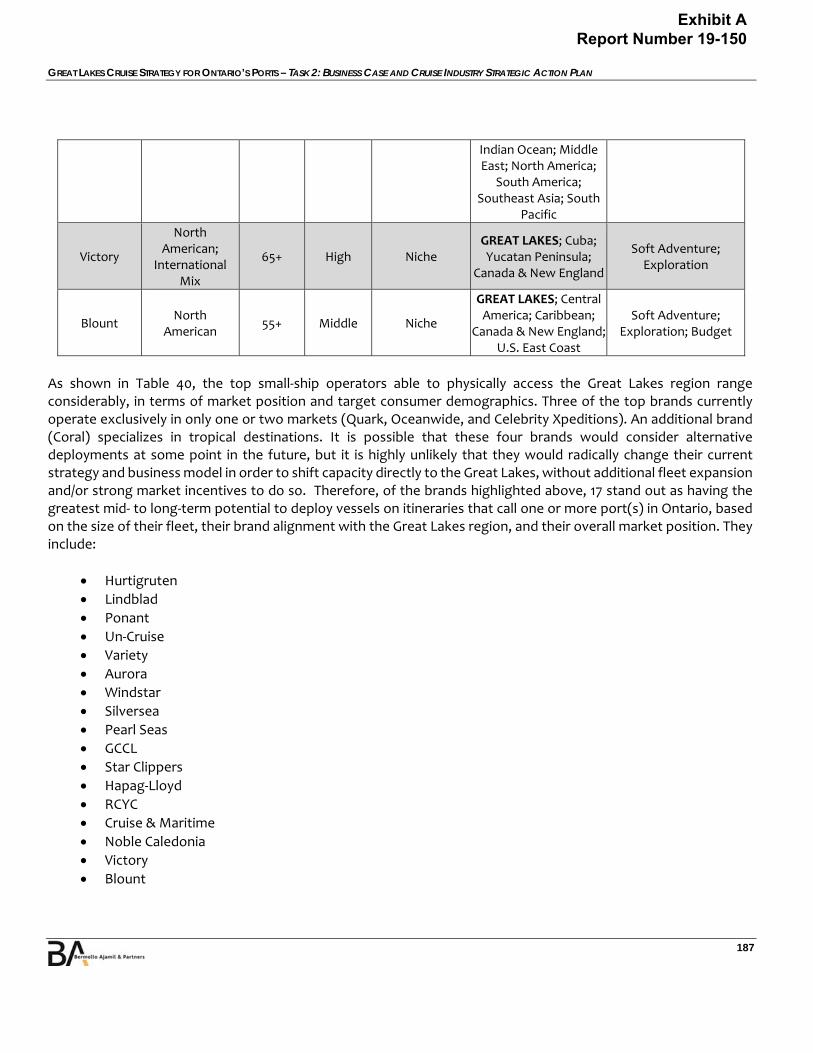
GREAT LAKES CRUISE STRATEGY FOR ONTARIO’S PORTS – TASK 2: BUSINESS CASE AND CRUISE INDUSTRY STRATEGIC ACTION PLAN
187
Indian Ocean; Middle East; North America;
South America; Southeast Asia; South
Pacific
Victory
North American;
International Mix
65+ High Niche GREAT LAKES; Cuba; Yucatan Peninsula;
Canada & New England
Soft Adventure; Exploration
Blount North
American 55+ Middle Niche
GREAT LAKES; Central America; Caribbean;
Canada & New England; U.S. East Coast
Soft Adventure; Exploration; Budget
As shown in Table 40, the top small‐ship operators able to physically access the Great Lakes region range considerably, in terms of market position and target consumer demographics. Three of the top brands currently operate exclusively in only one or two markets (Quark, Oceanwide, and Celebrity Xpeditions). An additional brand (Coral) specializes in tropical destinations. It is possible that these four brands would consider alternative deployments at some point in the future, but it is highly unlikely that they would radically change their current strategy and business model in order to shift capacity directly to the Great Lakes, without additional fleet expansion and/or strong market incentives to do so. Therefore, of the brands highlighted above, 17 stand out as having the greatest mid‐ to long‐term potential to deploy vessels on itineraries that call one or more port(s) in Ontario, based on the size of their fleet, their brand alignment with the Great Lakes region, and their overall market position. They include:
Hurtigruten
Lindblad
Ponant
Un‐Cruise
Variety
Aurora
Windstar
Silversea
Pearl Seas
GCCL
Star Clippers
Hapag‐Lloyd
RCYC
Cruise & Maritime
Noble Caledonia
Victory
Blount
Exhibit A Report Number 19-150

GREAT LAKES CRUISE STRATEGY FOR ONTARIO’S PORTS – TASK 2: BUSINESS CASE AND CRUISE INDUSTRY STRATEGIC ACTION PLAN
188
Together, these Top 17 brands represent varying degrees of potential, as candidates for the ports of Ontario partner with organizations to target new and/or increased business in the coming years. Some will no doubt be uninterested in operating in the Great Lakes, at least in the foreseeable future. However, five of them (Ponant, Pearl Seas, Hapag‐Lloyd, Victory, and Blount) already operate in the Great Lakes, or will by 2020. In addition, it seems likely that RCYC will operate in the Great Lakes by 2021, at least on a limited basis. Two other brands listed above (Windstar and Silversea) have also expressed interest in operating in the Great Lakes region, though both have had issues with transiting the locks, despite being technically capable of doing so. Collectively, these 17 brands will operate 99 ships and control 22,101 lower berths by the beginning of the coming decade. In addition to the 17 potential candidate brands identified above, the following brands all have at least one ship capable of accessing the Great Lakes market, and are either already active in the Great Lakes, or would be strong candidates to do so in the future:
Adventure Canada – Ocean Endeavor
Plantours – MS Hamburg (two Great Lakes sailings in 2018)
Saga – Saga Pearl II
Croisieres M/S Jacques Cartier* – M/S Jacques Croisiere (six Great Lakes sailings in 2018)
Ontario Waterway Cruises* – Kawartha Voyageur (nine Great Lakes sailings in 2018)
St. Lawrence Cruise Lines* – Canadian Empress (23 Great Lakes sailings in 2018) * Local and Canadian river cruise company (included due to current presence in the Great Lakes market) Viking Ocean Cruises also just recently announced their intent to construct at least two new LNG‐powered expedition ships, both of which may also be able to fit through the Great Lakes Locks (vessel dimensions TBD). All of these brands are potential candidates for future deployments in the region, and to the ports of Ontario. See ANNEX C for a complete list of all 173 vessels capable of transiting the Great Lakes Locks by operator. It is also important to note that, in the small ship market, chartering is far more common for large vessels, meaning a number of travel companies and tour operators that do not have their own fleet of vessels are also good candidates for cruising the Great Lakes. Examples of companies with this type of potential to charter Great Lakes cruises include Grand Circle Travel, Lindblad, Road Scholar, and Tauck.
Exhibit A Report Number 19-150
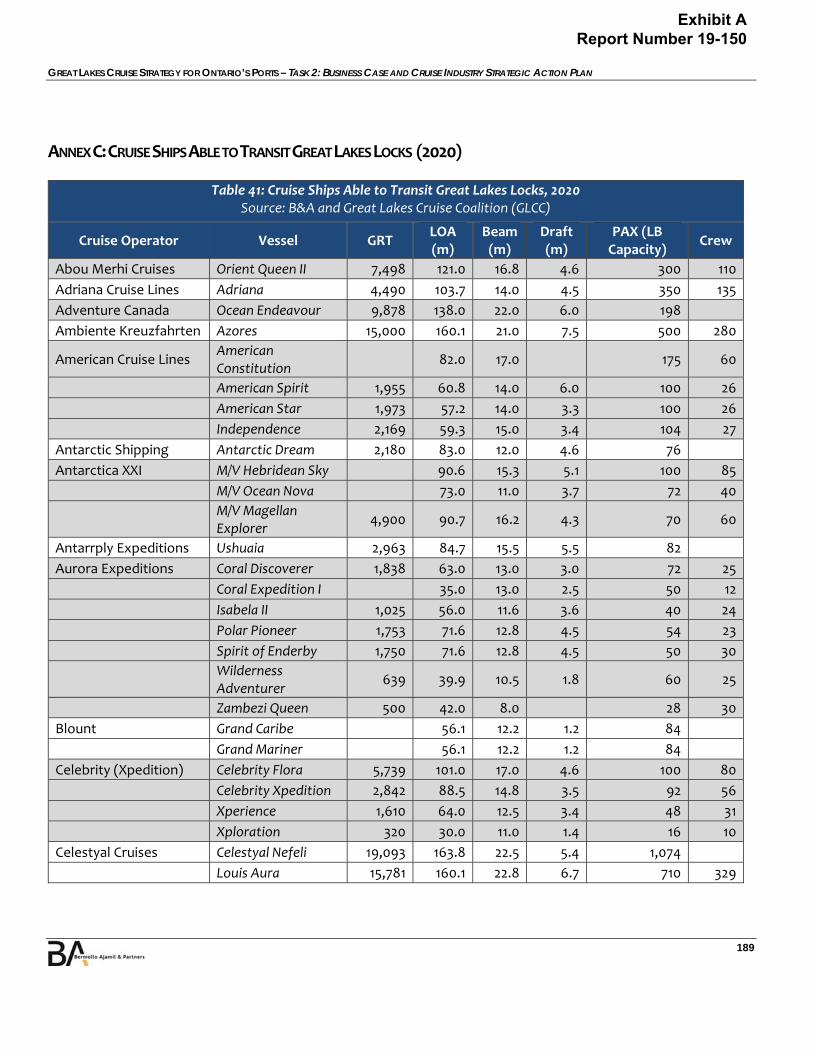
GREAT LAKES CRUISE STRATEGY FOR ONTARIO’S PORTS – TASK 2: BUSINESS CASE AND CRUISE INDUSTRY STRATEGIC ACTION PLAN
189
ANNEX C: CRUISE SHIPS ABLE TO TRANSIT GREAT LAKES LOCKS (2020)
Table 41: Cruise Ships Able to Transit Great Lakes Locks, 2020 Source: B&A and Great Lakes Cruise Coalition (GLCC)
Cruise Operator Vessel GRT LOA (m)
Beam (m)
Draft (m)
PAX (LB Capacity)
Crew
Abou Merhi Cruises Orient Queen II 7,498 121.0 16.8 4.6 300 110
Adriana Cruise Lines Adriana 4,490 103.7 14.0 4.5 350 135
Adventure Canada Ocean Endeavour 9,878 138.0 22.0 6.0 198
Ambiente Kreuzfahrten Azores 15,000 160.1 21.0 7.5 500 280
American Cruise Lines American Constitution
82.0 17.0 175 60
American Spirit 1,955 60.8 14.0 6.0 100 26
American Star 1,973 57.2 14.0 3.3 100 26
Independence 2,169 59.3 15.0 3.4 104 27
Antarctic Shipping Antarctic Dream 2,180 83.0 12.0 4.6 76
Antarctica XXI M/V Hebridean Sky 90.6 15.3 5.1 100 85
M/V Ocean Nova 73.0 11.0 3.7 72 40
M/V Magellan Explorer
4,900 90.7 16.2 4.3 70 60
Antarrply Expeditions Ushuaia 2,963 84.7 15.5 5.5 82
Aurora Expeditions Coral Discoverer 1,838 63.0 13.0 3.0 72 25
Coral Expedition I 35.0 13.0 2.5 50 12
Isabela II 1,025 56.0 11.6 3.6 40 24
Polar Pioneer 1,753 71.6 12.8 4.5 54 23
Spirit of Enderby 1,750 71.6 12.8 4.5 50 30
Wilderness Adventurer
639 39.9 10.5 1.8 60 25
Zambezi Queen 500 42.0 8.0 28 30
Blount Grand Caribe 56.1 12.2 1.2 84
Grand Mariner 56.1 12.2 1.2 84
Celebrity (Xpedition) Celebrity Flora 5,739 101.0 17.0 4.6 100 80
Celebrity Xpedition 2,842 88.5 14.8 3.5 92 56
Xperience 1,610 64.0 12.5 3.4 48 31
Xploration 320 30.0 11.0 1.4 16 10
Celestyal Cruises Celestyal Nefeli 19,093 163.8 22.5 5.4 1,074
Louis Aura 15,781 160.1 22.8 6.7 710 329
Exhibit A Report Number 19-150

GREAT LAKES CRUISE STRATEGY FOR ONTARIO’S PORTS – TASK 2: BUSINESS CASE AND CRUISE INDUSTRY STRATEGIC ACTION PLAN
190
Charter Akademik Loffe 6,450 117.1 18.2 5.9 92
Clipper Stad Amsterdam
Stad Amsterdam 723 76.2 10.5 4.8 28 30
Club Med Club Med II 14,745 187.2 20.0 5.1 392 181
Coco Explorer Inc 7107 Islands Cruise 5,200 109.6 16.3 5.3 274 99
Coral Expeditions Coral Discoverer 1,838 63.0 13.0 3.0 72 25
Coral Expeditions I 730 35.0 12.0 2.4 50 14
Coral Expeditions II 730 35.0 12.0 2.5 44 12
Coral Adventurer 5,536 94.0 17.0 5.0 120 30
Coral Princess Cruises Oceanic Discoverer 2,000 63.0 13.0 3.0 76
Cruise & Maritime Astor 20,158 176.5 22.6 5.8 590 300
Astoria 16,144 160.0 21.0 7.9 550 200
Marco Polo 22,080 176.2 23.5 8.2 844 356
Crystal Cruises Crystal Esprit 3,300 82.2 14.0 3.4 62 91
Fred. Olsen Cruises Braemar 24,344 195.9 22.5 5.4 929 371
FTI Cruises FTI Berlin 9,570 139.3 17.5 4.9 352 170
G Adventures Expedition 6,172 105.2 18.9 4.4 116
Grand Circle Cruise Line M/V Corinthian 4,077 88.4 15.2 3.7 98 55
M/V Clio 3,504 100.26 13.9 3.5 89 60
M/V Athena 58.8 10.7 3.0 50
M/V Arethusa 58.8 10.7 3.0 50
M/V Artemis 58.8 10.7 3.0 50
Hansa Touristik MS Ocean Majesty 10,417 135.3 19.2 6.0 535 235
Hapag‐Lloyd Hanseatic Inspiration
16,100 138.0 22.0 5.4 230 170
Hanseatic 8,378 122.8 18.0 4.7 184 122
Hanseatic Nature 16,100 138.0 22.0 5.4 230 170
Bremen 6,752 111.5 17.0 4.8 164 80
Hebridean Island Cruises
Hebridean Princess 2,112 71.6 14.0 3.0 48 35
Heritage Expeditions Akademik Shokalskiy 1,764 72.0 12.6 4.5 37
Hurtigruten Finnmarken 15,690 138.5 21.5 5.0 1,000 150
Fram 12,000 110.0 20.0 5.0 268 150
Kong Harald 11,204 121.8 19.2 5.0 691 70
Lofoten 2,621 87.4 15.0 5.0 410 40
Midnatsol 16,151 135.8 21.5 5.2 1,000 150
Nordkapp 11,386 123.3 19.5 5.0 350 70
Exhibit A Report Number 19-150
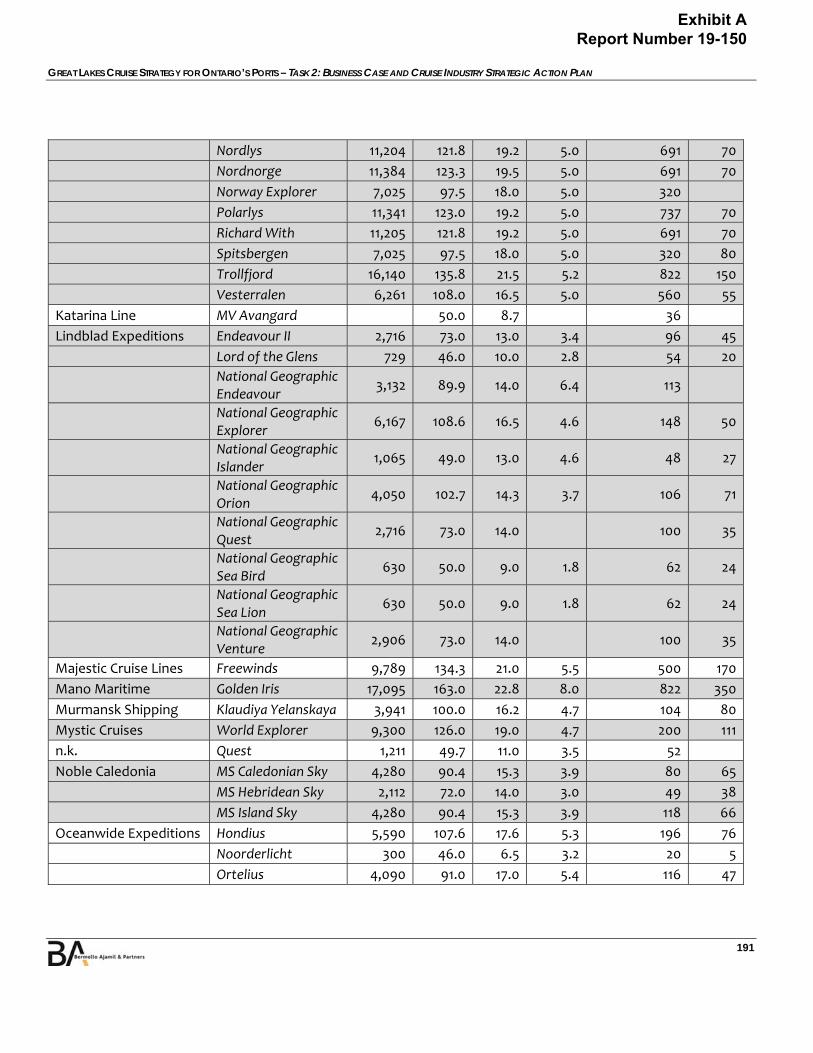
GREAT LAKES CRUISE STRATEGY FOR ONTARIO’S PORTS – TASK 2: BUSINESS CASE AND CRUISE INDUSTRY STRATEGIC ACTION PLAN
191
Nordlys 11,204 121.8 19.2 5.0 691 70
Nordnorge 11,384 123.3 19.5 5.0 691 70
Norway Explorer 7,025 97.5 18.0 5.0 320
Polarlys 11,341 123.0 19.2 5.0 737 70
Richard With 11,205 121.8 19.2 5.0 691 70
Spitsbergen 7,025 97.5 18.0 5.0 320 80
Trollfjord 16,140 135.8 21.5 5.2 822 150
Vesterralen 6,261 108.0 16.5 5.0 560 55
Katarina Line MV Avangard 50.0 8.7 36
Lindblad Expeditions Endeavour II 2,716 73.0 13.0 3.4 96 45
Lord of the Glens 729 46.0 10.0 2.8 54 20
National Geographic Endeavour
3,132 89.9 14.0 6.4 113
National Geographic Explorer
6,167 108.6 16.5 4.6 148 50
National Geographic Islander
1,065 49.0 13.0 4.6 48 27
National Geographic Orion
4,050 102.7 14.3 3.7 106 71
National Geographic Quest
2,716 73.0 14.0 100 35
National Geographic Sea Bird
630 50.0 9.0 1.8 62 24
National Geographic Sea Lion
630 50.0 9.0 1.8 62 24
National Geographic Venture
2,906 73.0 14.0 100 35
Majestic Cruise Lines Freewinds 9,789 134.3 21.0 5.5 500 170
Mano Maritime Golden Iris 17,095 163.0 22.8 8.0 822 350
Murmansk Shipping Klaudiya Yelanskaya 3,941 100.0 16.2 4.7 104 80
Mystic Cruises World Explorer 9,300 126.0 19.0 4.7 200 111
n.k. Quest 1,211 49.7 11.0 3.5 52
Noble Caledonia MS Caledonian Sky 4,280 90.4 15.3 3.9 80 65
MS Hebridean Sky 2,112 72.0 14.0 3.0 49 38
MS Island Sky 4,280 90.4 15.3 3.9 118 66
Oceanwide Expeditions Hondius 5,590 107.6 17.6 5.3 196 76
Noorderlicht 300 46.0 6.5 3.2 20 5
Ortelius 4,090 91.0 17.0 5.4 116 47
Exhibit A Report Number 19-150

GREAT LAKES CRUISE STRATEGY FOR ONTARIO’S PORTS – TASK 2: BUSINESS CASE AND CRUISE INDUSTRY STRATEGIC ACTION PLAN
192
Plancius 3,211 89.0 14.0 5.0 116 47
Rembrandt van Rijn 435 56.0 7.0 2.8 33 12
Ontario Waterway Cruises*
Kawartha Voyageur 36.6 1.8 45
Paul Gaugin Cruises Tere Moana 3,504 100.3 13.9 3.5 90
Paul Gauguin 19,170 156.6 22.0 5.1 320 206
Pearl Seas Cruises Pearl Mist 4,985 102.1 17.1 3.7 210
Phoenix Reisen GmbH MS Deutschland 22,496 175.4 23.0 5.8 520 280
Plantours Hamburg 14,903 144.0 21.5 5.1 420 170
Ponant Le Champlain 10,000 128.0 18.0 4.4 180 110
Le Boreal 10,700 142.1 18.0 4.9 264 138
Le Bougainville 10,000 128.0 18.0 4.4 180 110
Le Kerguelen 10,000 128.0 18.0 4.4 180 110
Le Laperouse 10,000 128.0 18.0 4.4 180 110
Le Lyrial 10,700 142.0 18.0 4.8 262 139
Le Ponant 1,489 88.0 12.0 4.0 64 32
Le Soleal 10,600 142.0 18.0 4.9 264 139
L'Austral 10,700 142.0 18.0 4.7 264 138
Poseidon Expeditions M/V Sea Spirit 4,200 90.6 15.3 4.2 144 72
Quark Expeditions World Explorer 10,000 126.0 19.0 4.7 176
Akademik Sergey Vavilov
6,231 117.1 18.2 5.9 76
Ocean Diamond 8,282 124.7 16.0 4.6 207
Sarfak Ittuk 1,127 49.7 11.0 3.4 62
Sea Adventurer 5,750 101.0 16.3 4.7 122
Sea Explorer 4,280 90.4 15.3 3.9 111
Ritz‐Carlton TBD TBD 190.0 TBD TBD 298
TBD TBD 190.0 TBD TBD 298
TBD TBD 190.0 TBD TBD 298
Saga Saga Pearl II 18,591 164.4 22.6 6.1 446 252
Salamis Lines Salamis Filoxenia 15,402 157.0 21.8 6.0 500 240
Scenic Ocean Cruises Scenic Eclipse 16,500 168.0 21.5 228 172
Sea Cloud Cruises Sea Cloud 2,532 96.3 14.9 5.1 68 60
Sea Cloud II 3,849 117.1 16.0 5.4 96 58
SeaDream Yacht SeaDream I 4,253 104.8 14.6 4.0 118 89
SeaDream II 4,253 104.8 14.6 4.0 118 89
Serenissima M/V Porto 5,888 117.0 16.0 6.2 300
Exhibit A Report Number 19-150
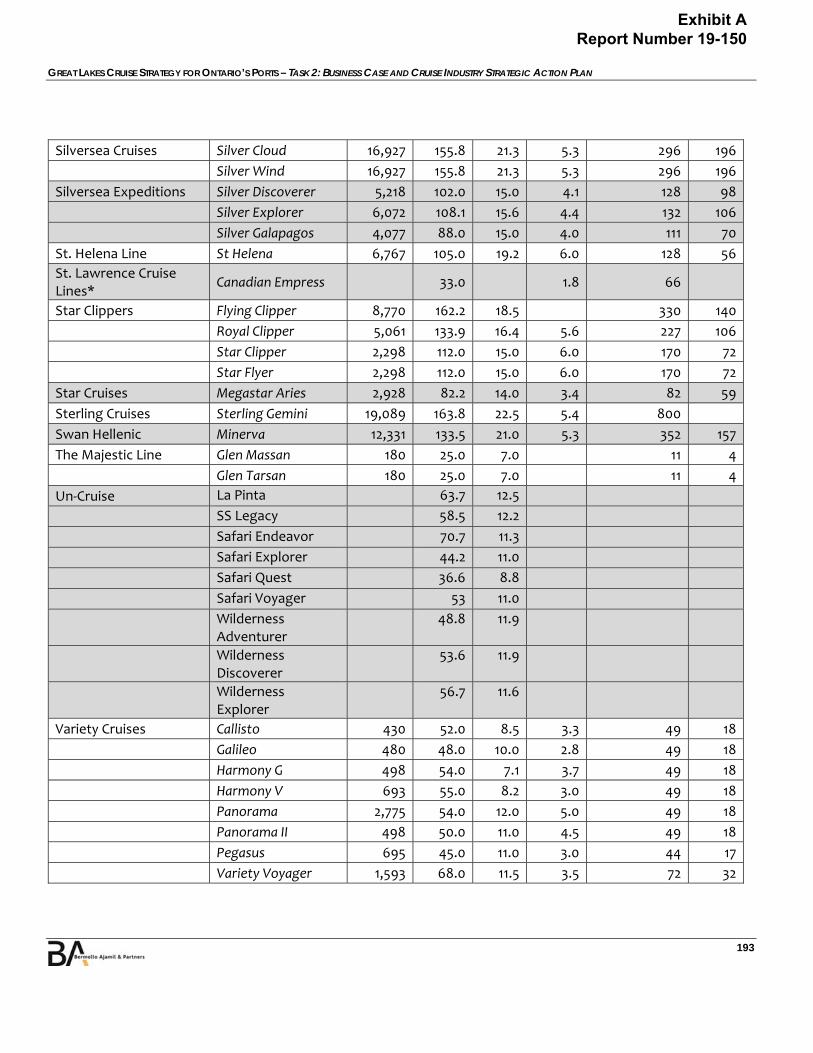
GREAT LAKES CRUISE STRATEGY FOR ONTARIO’S PORTS – TASK 2: BUSINESS CASE AND CRUISE INDUSTRY STRATEGIC ACTION PLAN
193
Silversea Cruises Silver Cloud 16,927 155.8 21.3 5.3 296 196
Silver Wind 16,927 155.8 21.3 5.3 296 196
Silversea Expeditions Silver Discoverer 5,218 102.0 15.0 4.1 128 98
Silver Explorer 6,072 108.1 15.6 4.4 132 106
Silver Galapagos 4,077 88.0 15.0 4.0 111 70
St. Helena Line St Helena 6,767 105.0 19.2 6.0 128 56
St. Lawrence Cruise Lines*
Canadian Empress 33.0 1.8 66
Star Clippers Flying Clipper 8,770 162.2 18.5 330 140
Royal Clipper 5,061 133.9 16.4 5.6 227 106
Star Clipper 2,298 112.0 15.0 6.0 170 72
Star Flyer 2,298 112.0 15.0 6.0 170 72
Star Cruises Megastar Aries 2,928 82.2 14.0 3.4 82 59
Sterling Cruises Sterling Gemini 19,089 163.8 22.5 5.4 800
Swan Hellenic Minerva 12,331 133.5 21.0 5.3 352 157
The Majestic Line Glen Massan 180 25.0 7.0 11 4
Glen Tarsan 180 25.0 7.0 11 4
Un‐Cruise La Pinta 63.7 12.5
SS Legacy 58.5 12.2
Safari Endeavor 70.7 11.3
Safari Explorer 44.2 11.0
Safari Quest 36.6 8.8
Safari Voyager 53 11.0
Wilderness Adventurer
48.8 11.9
Wilderness Discoverer
53.6 11.9
Wilderness Explorer
56.7 11.6
Variety Cruises Callisto 430 52.0 8.5 3.3 49 18
Galileo 480 48.0 10.0 2.8 49 18
Harmony G 498 54.0 7.1 3.7 49 18
Harmony V 693 55.0 8.2 3.0 49 18
Panorama 2,775 54.0 12.0 5.0 49 18
Panorama II 498 50.0 11.0 4.5 49 18
Pegasus 695 45.0 11.0 3.0 44 17
Variety Voyager 1,593 68.0 11.5 3.5 72 32
Exhibit A Report Number 19-150
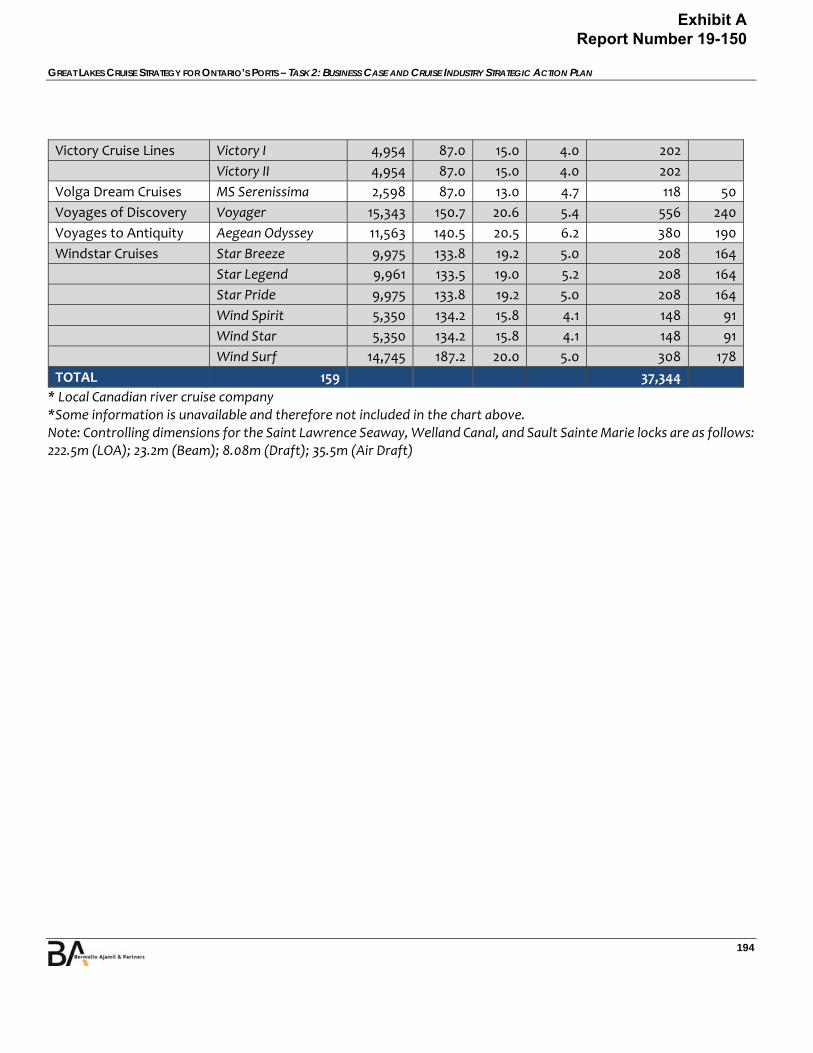
GREAT LAKES CRUISE STRATEGY FOR ONTARIO’S PORTS – TASK 2: BUSINESS CASE AND CRUISE INDUSTRY STRATEGIC ACTION PLAN
194
Victory Cruise Lines Victory I 4,954 87.0 15.0 4.0 202
Victory II 4,954 87.0 15.0 4.0 202
Volga Dream Cruises MS Serenissima 2,598 87.0 13.0 4.7 118 50
Voyages of Discovery Voyager 15,343 150.7 20.6 5.4 556 240
Voyages to Antiquity Aegean Odyssey 11,563 140.5 20.5 6.2 380 190
Windstar Cruises Star Breeze 9,975 133.8 19.2 5.0 208 164
Star Legend 9,961 133.5 19.0 5.2 208 164
Star Pride 9,975 133.8 19.2 5.0 208 164
Wind Spirit 5,350 134.2 15.8 4.1 148 91
Wind Star 5,350 134.2 15.8 4.1 148 91
Wind Surf 14,745 187.2 20.0 5.0 308 178
TOTAL 159 37,344
* Local Canadian river cruise company *Some information is unavailable and therefore not included in the chart above. Note: Controlling dimensions for the Saint Lawrence Seaway, Welland Canal, and Sault Sainte Marie locks are as follows: 222.5m (LOA); 23.2m (Beam); 8.08m (Draft); 35.5m (Air Draft)
Exhibit A Report Number 19-150
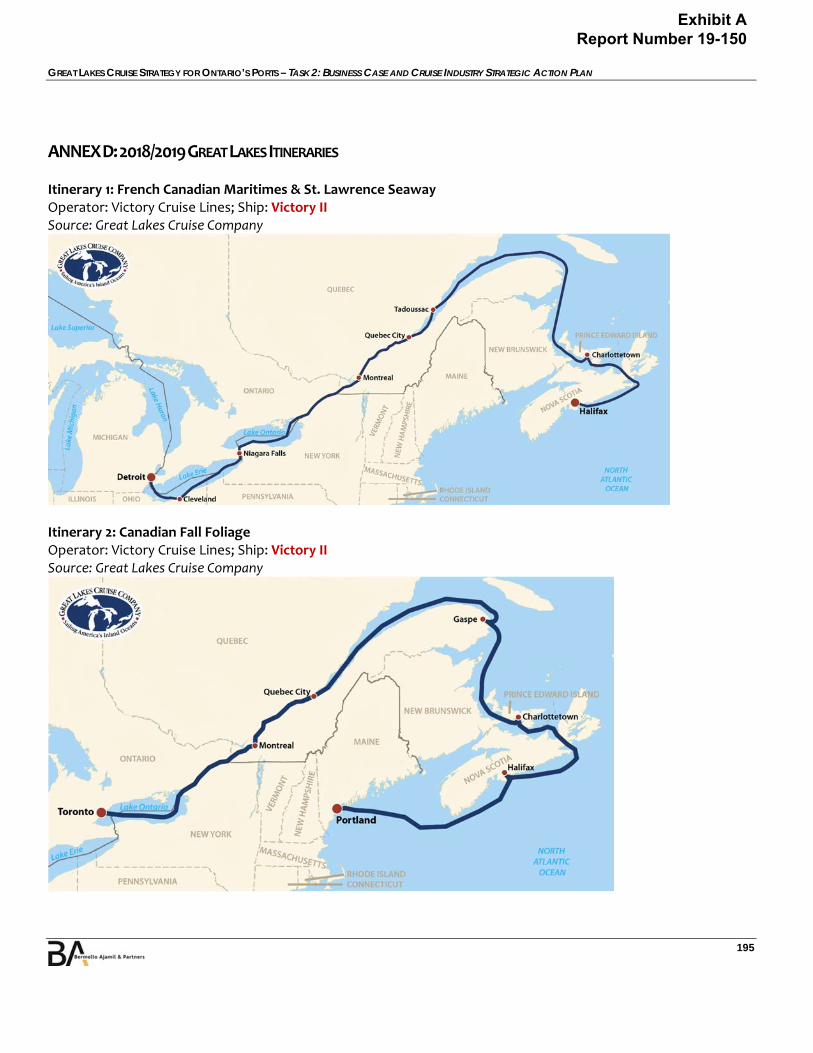
GREAT LAKES CRUISE STRATEGY FOR ONTARIO’S PORTS – TASK 2: BUSINESS CASE AND CRUISE INDUSTRY STRATEGIC ACTION PLAN
195
ANNEX D: 2018/2019 GREAT LAKES ITINERARIES Itinerary 1: French Canadian Maritimes & St. Lawrence Seaway Operator: Victory Cruise Lines; Ship: Victory II Source: Great Lakes Cruise Company
Itinerary 2: Canadian Fall Foliage Operator: Victory Cruise Lines; Ship: Victory II Source: Great Lakes Cruise Company
Exhibit A Report Number 19-150
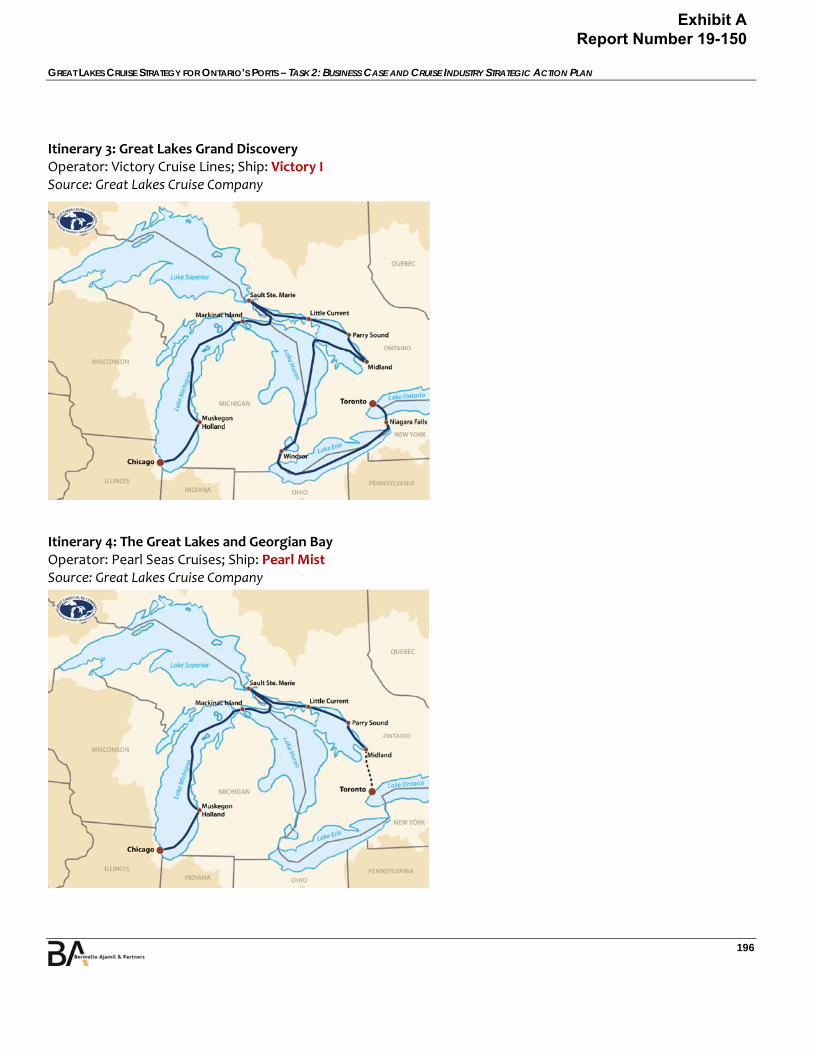
GREAT LAKES CRUISE STRATEGY FOR ONTARIO’S PORTS – TASK 2: BUSINESS CASE AND CRUISE INDUSTRY STRATEGIC ACTION PLAN
196
Itinerary 3: Great Lakes Grand Discovery Operator: Victory Cruise Lines; Ship: Victory I Source: Great Lakes Cruise Company
Itinerary 4: The Great Lakes and Georgian Bay Operator: Pearl Seas Cruises; Ship: Pearl Mist Source: Great Lakes Cruise Company
Exhibit A Report Number 19-150
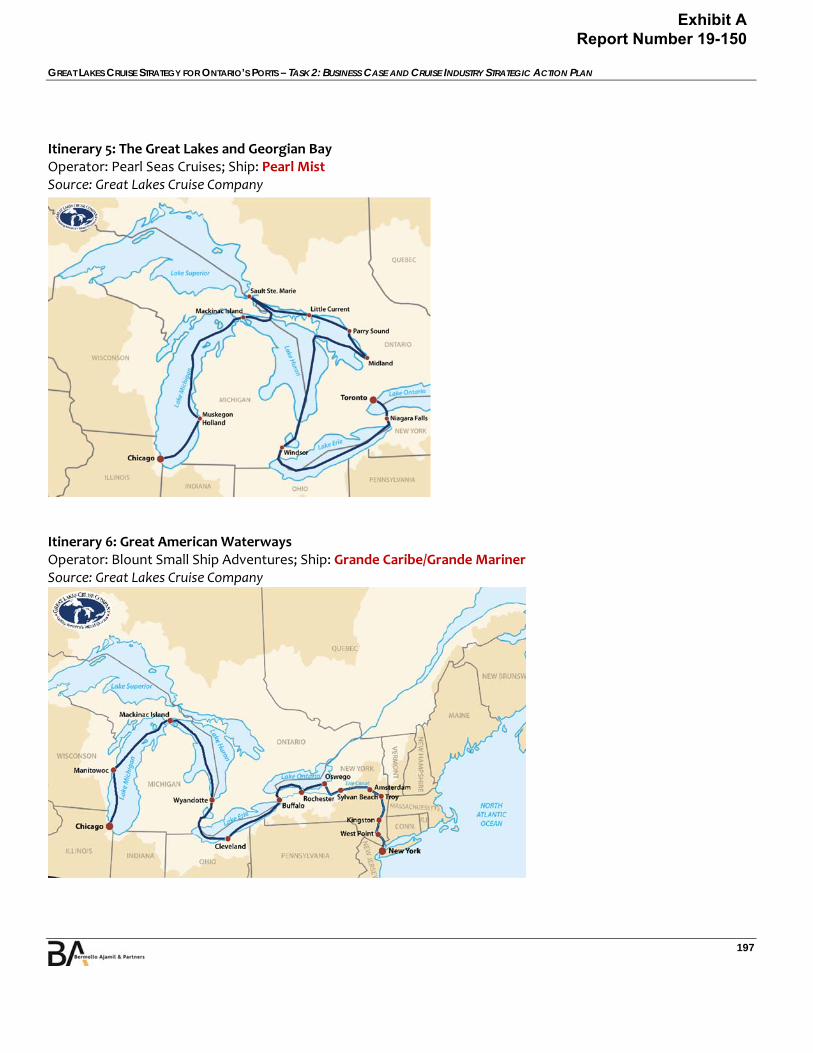
GREAT LAKES CRUISE STRATEGY FOR ONTARIO’S PORTS – TASK 2: BUSINESS CASE AND CRUISE INDUSTRY STRATEGIC ACTION PLAN
197
Itinerary 5: The Great Lakes and Georgian Bay Operator: Pearl Seas Cruises; Ship: Pearl Mist Source: Great Lakes Cruise Company
Itinerary 6: Great American Waterways Operator: Blount Small Ship Adventures; Ship: Grande Caribe/Grande Mariner Source: Great Lakes Cruise Company
Exhibit A Report Number 19-150

GREAT LAKES CRUISE STRATEGY FOR ONTARIO’S PORTS – TASK 2: BUSINESS CASE AND CRUISE INDUSTRY STRATEGIC ACTION PLAN
198
Itinerary 7: The Saguenay Operator: Blount Small Ship Adventures; Ship: Grande Caribe/Grande Mariner Source: https://www.blountsmallshipadventures.com
Itinerary 8: Locks, Legends & Canals of the Northeast Operator: Blount Small Ship Adventures; Ship: Grande Caribe Source: Great Lakes Cruise Company
Exhibit A Report Number 19-150

GREAT LAKES CRUISE STRATEGY FOR ONTARIO’S PORTS – TASK 2: BUSINESS CASE AND CRUISE INDUSTRY STRATEGIC ACTION PLAN
199
Itinerary 9: Magical Lake Michigan Operator: Blount Small Ship Adventures; Ship: Grande Mariner Source: Great Lakes Cruise Company
Itinerary 10: Great Lakes of North America Operator: Ponant; Ship: Le Champlain Source: https://us.ponant.com/cruises/north‐america‐great‐lakes‐of‐north‐america‐c120919‐4
Exhibit A Report Number 19-150
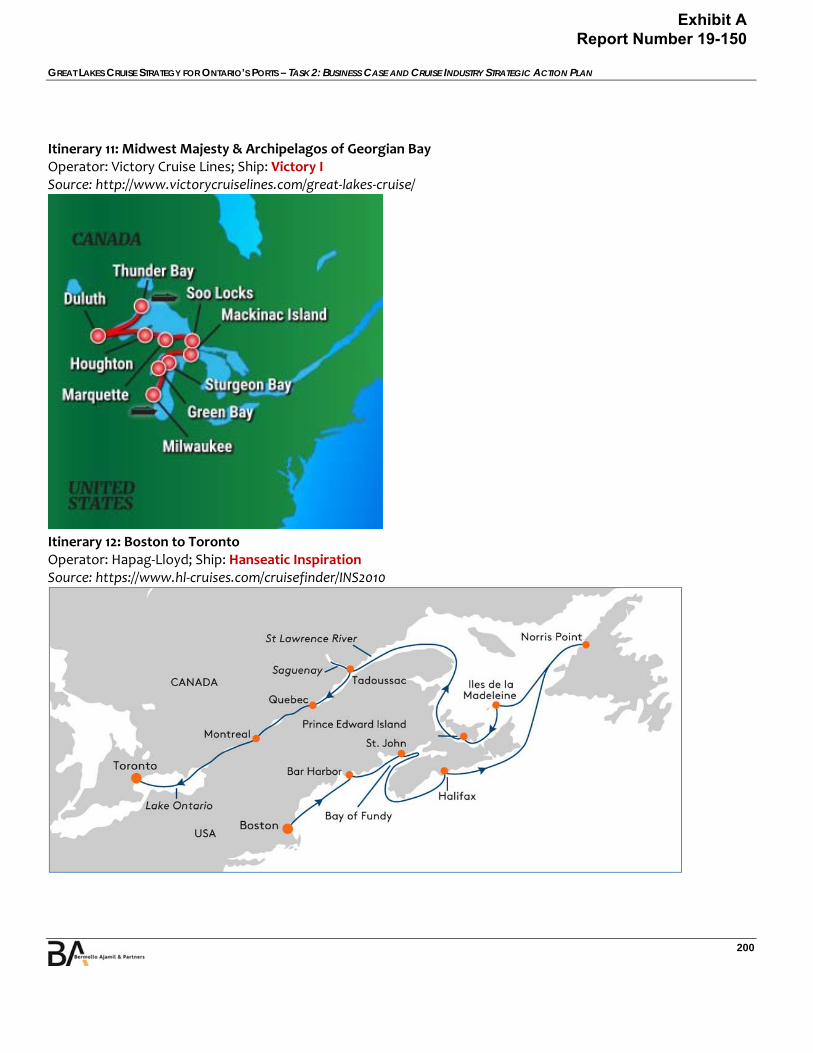
GREAT LAKES CRUISE STRATEGY FOR ONTARIO’S PORTS – TASK 2: BUSINESS CASE AND CRUISE INDUSTRY STRATEGIC ACTION PLAN
200
Itinerary 11: Midwest Majesty & Archipelagos of Georgian Bay Operator: Victory Cruise Lines; Ship: Victory I Source: http://www.victorycruiselines.com/great‐lakes‐cruise/
Itinerary 12: Boston to Toronto Operator: Hapag‐Lloyd; Ship: Hanseatic Inspiration Source: https://www.hl‐cruises.com/cruisefinder/INS2010
Exhibit A Report Number 19-150
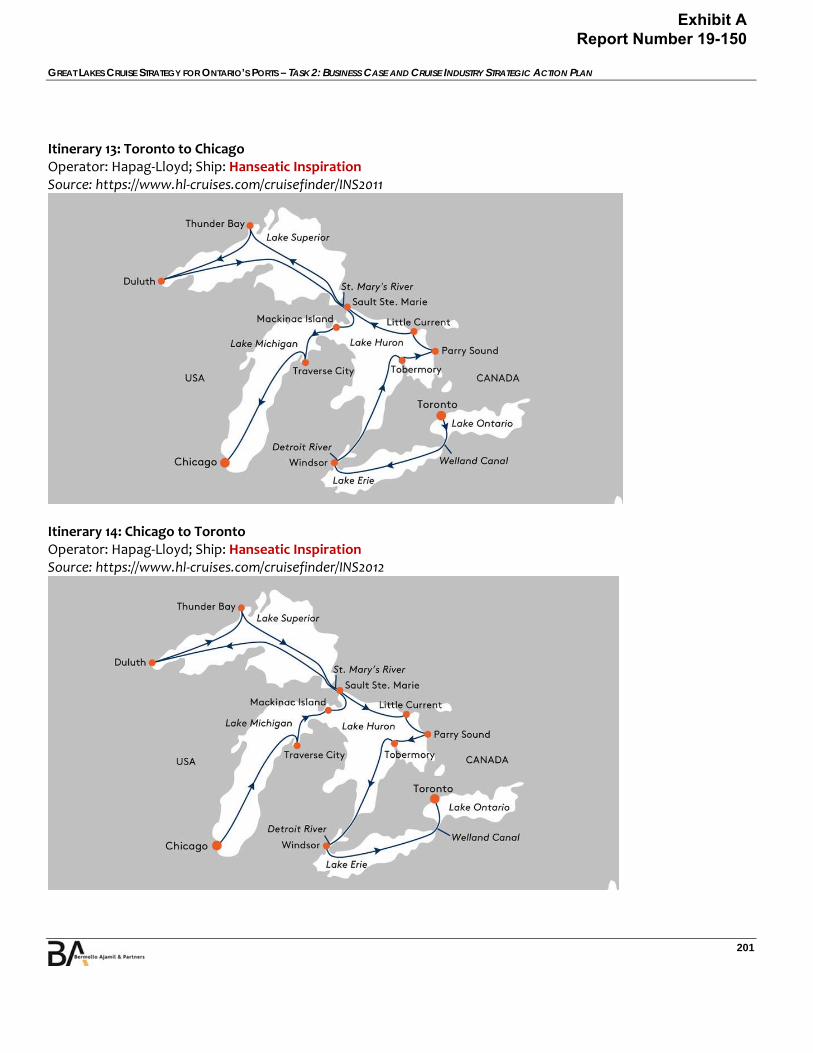
GREAT LAKES CRUISE STRATEGY FOR ONTARIO’S PORTS – TASK 2: BUSINESS CASE AND CRUISE INDUSTRY STRATEGIC ACTION PLAN
201
Itinerary 13: Toronto to Chicago Operator: Hapag‐Lloyd; Ship: Hanseatic Inspiration Source: https://www.hl‐cruises.com/cruisefinder/INS2011
Itinerary 14: Chicago to Toronto Operator: Hapag‐Lloyd; Ship: Hanseatic Inspiration Source: https://www.hl‐cruises.com/cruisefinder/INS2012
Exhibit A Report Number 19-150

GREAT LAKES CRUISE STRATEGY FOR ONTARIO’S PORTS – TASK 2: BUSINESS CASE AND CRUISE INDUSTRY STRATEGIC ACTION PLAN
202
ANNEX E: ONTARIO PORTS – 2018 CRUISE LINE SURVEY
Exhibit A Report Number 19-150
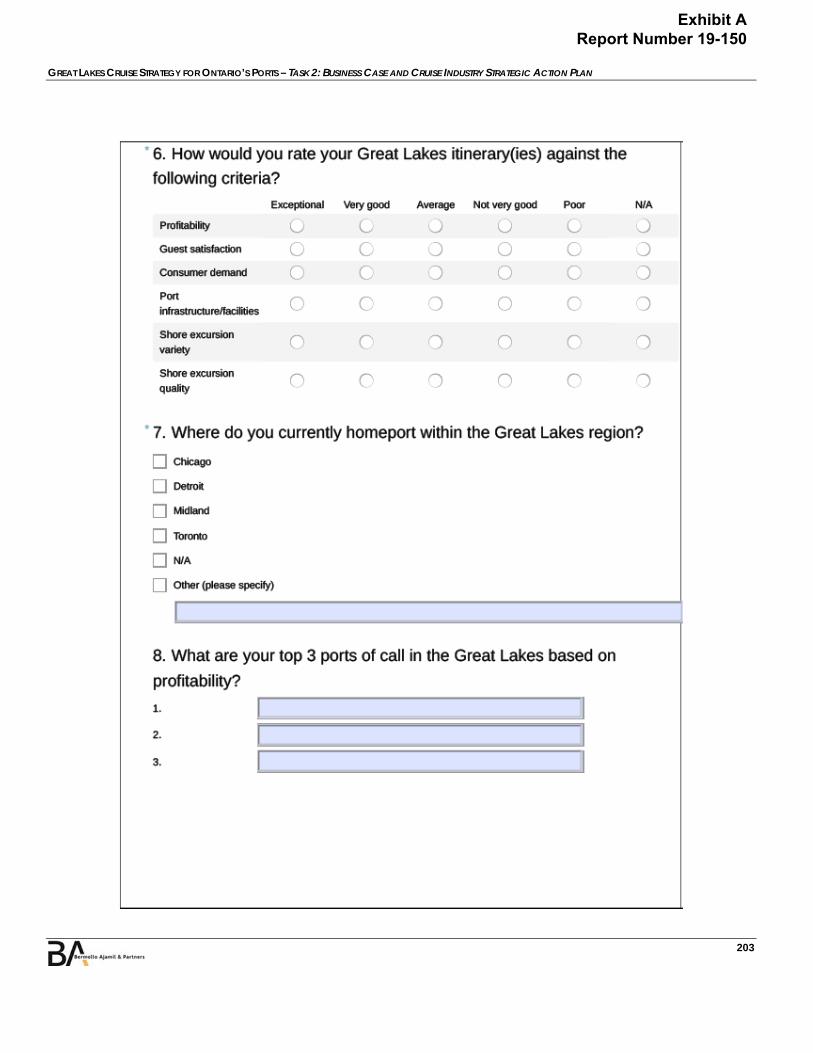
GREAT LAKES CRUISE STRATEGY FOR ONTARIO’S PORTS – TASK 2: BUSINESS CASE AND CRUISE INDUSTRY STRATEGIC ACTION PLAN
203
Exhibit A Report Number 19-150

GREAT LAKES CRUISE STRATEGY FOR ONTARIO’S PORTS – TASK 2: BUSINESS CASE AND CRUISE INDUSTRY STRATEGIC ACTION PLAN
204
Exhibit A Report Number 19-150
GREAT LAKES CRUISE STRATEGY FOR ONTARIO’S PORTS – TASK 2: BUSINESS CASE AND CRUISE INDUSTRY STRATEGIC ACTION PLAN
205
Exhibit A Report Number 19-150

GREAT LAKES CRUISE STRATEGY FOR ONTARIO’S PORTS – TASK 2: BUSINESS CASE AND CRUISE INDUSTRY STRATEGIC ACTION PLAN
206
ANNEX F: ONTARIO PORTS – 2018 PORT AND DESTINATION SURVEY
Ontario Ports (Town of Midland)
Cruise Ship Industry Business Case and Strategy
Port & Destination Questionnaire
1) WHAT IS YOUR NAME?
2) WHAT IS YOUR TITLE?
3) WHAT CITY/TOWN/PORT (DESTINATION) DO YOU REPRESENT?
4) DOES YOUR DESTINATION CURRENTLY HAVE A PIER CAPABLE OF BERTHING CRUISE SHIPS, OR MUST CRUISE SHIPS TENDER AT YOUR DESTINATION IN ORDER FOR PASSENGERS TO COME ASHORE? a) If you have a pier, please provide the following information:
i) Length of pier and maximum vessel LOA that can be berthed alongside ii) Number of and distance between fenders (if any) iii) Number and capacity rating of bollards iv) Maximum draft alongside pier v) Does your cruise ship pier have a terminal or other weather-protected space adjacent to the
berth? vi) Are restrooms available at your cruise ship pier? vii) Can motor coaches/vans/cars be staged in an area adjacent to, or less than a 5-minute walk
from, your cruise ship berth? (1) If no, approximately how long does it take to walk from the cruise ship pier to ground
transportation options? viii) How far is your cruise ship pier from the city/town center? ix) Please provide an aerial photograph of your cruise ship pier and surrounding area.
b) If cruise ships must tender at your destination, please provide the following information: i) Does your cruise tender area have a terminal or other weather-protected space adjacent to the
berth? ii) Are restrooms available at your cruise tender area? iii) Can motor coaches/vans/cars be staged in an area adjacent to, or less than a 5-minute walk
from, your cruise tender area? (1) If no, approximately how long does it take to walk from the cruise tender area to ground
transportation options? iv) How far is your cruise tender area from the city/town center? v) Please provide an aerial photograph of your cruise tender area and surrounding area.
5) HOW LONG IS THE NAVIGATIONAL CHANNEL APPROACHING YOUR DESTINATION, AND WHAT IS THE CONTROLLING
DEPTH OF THE CHANNEL AT MEAN LOW WATER (MLW)?
Exhibit A Report Number 19-150

GREAT LAKES CRUISE STRATEGY FOR ONTARIO’S PORTS – TASK 2: BUSINESS CASE AND CRUISE INDUSTRY STRATEGIC ACTION PLAN
207
6) ARE LOCAL PILOTS REQUIRED TO NAVIGATE CRUISE SHIPS CALLING YOUR DESTINATION?
7) ARE TUGS REQUIRED TO ASSIST CRUISE SHIPS CALLING YOUR DESTINATION? 8) WHICH, IF ANY, OF THE FOLLOWING FEES DO YOU COLLECT?
a) Dockage i) Amount: $__________per __________
b) Water (potable, provided to ship) i) Amount: $__________per __________
c) Waste (removal from ship) i) Amount: $__________per __________
d) Bunkering (fuel provided to ship) i) Amount: $__________per __________
e) Inspections i) Amount: $__________per __________
f) Pilotage i) Amount: $__________per __________
g) Documentation i) Amount: $__________per __________
h) Port/Harbor Dues i) Amount: $__________per __________
i) Wharfage (head tax per passenger) i) Amount: $__________per __________
j) Other Taxes (customs fee, tourism fee, terminal-access fee, etc.) i) Amount: $__________per __________
k) Anchorage i) Amount: $__________per __________
l) Agent Commissions (excursions, hotel, transfers, entertainment, etc.) i) Amount: $__________per __________
m) Tolls (bridge, canals, and/or other transportation fees between destinations) i) Amount: $__________per __________
n) Security Fee i) Amount: $__________per __________
9) DO YOU HAVE ANY SPECIAL WELCOME ACTIVITIES FOR CRUISE SHIP PASSENGERS? IF SO, PLEASE DESCRIBE THEM.
10) PLEASE PROVIDE THE FOLLOWING INFORMATION SPECIFIC TO YOUR DESTINATION:
a) 2018 and 2019 cruise schedules b) 2018 cruise tariff (as well as any other schedule of fees that are not included in your tariff) c) 2018 local pilotage rates (if applicable) d) 2018 tug rates (if applicable) e) List of cruise tour operators (name and contact information) in your destination, and list of
cruise tours offered
Exhibit A Report Number 19-150

GREAT LAKES CRUISE STRATEGY FOR ONTARIO’S PORTS – TASK 2: BUSINESS CASE AND CRUISE INDUSTRY STRATEGIC ACTION PLAN
208
11) WHAT ARE THE TOP THREE (3) MAJOR ATTRACTIONS/TOURISM POINTS OF INTEREST FOR YOUR DESTINATION, AND HOW
FAR ARE THEY FROM YOUR CRUISE SHIP PIER/CRUISE TENDER AREA?
12) HOW FAR IS THE NEAREST GENERAL AVIATION AIRFIELD/HELIPORT FROM YOUR CRUISE SHIP PIER/ TENDER AREA?
13) HOW FAR IS THE NEAREST INTERNATIONAL AIRPORT FROM YOUR CRUISE SHIP PIER/ TENDER AREA?
14) HAVE YOU COMPLETED A PASSENGER SURVEY IN THE LAST 12 MONTHS? IF SO, PLEASE SHARE THE RESULTS OF YOUR SURVEY.
Exhibit A Report Number 19-150
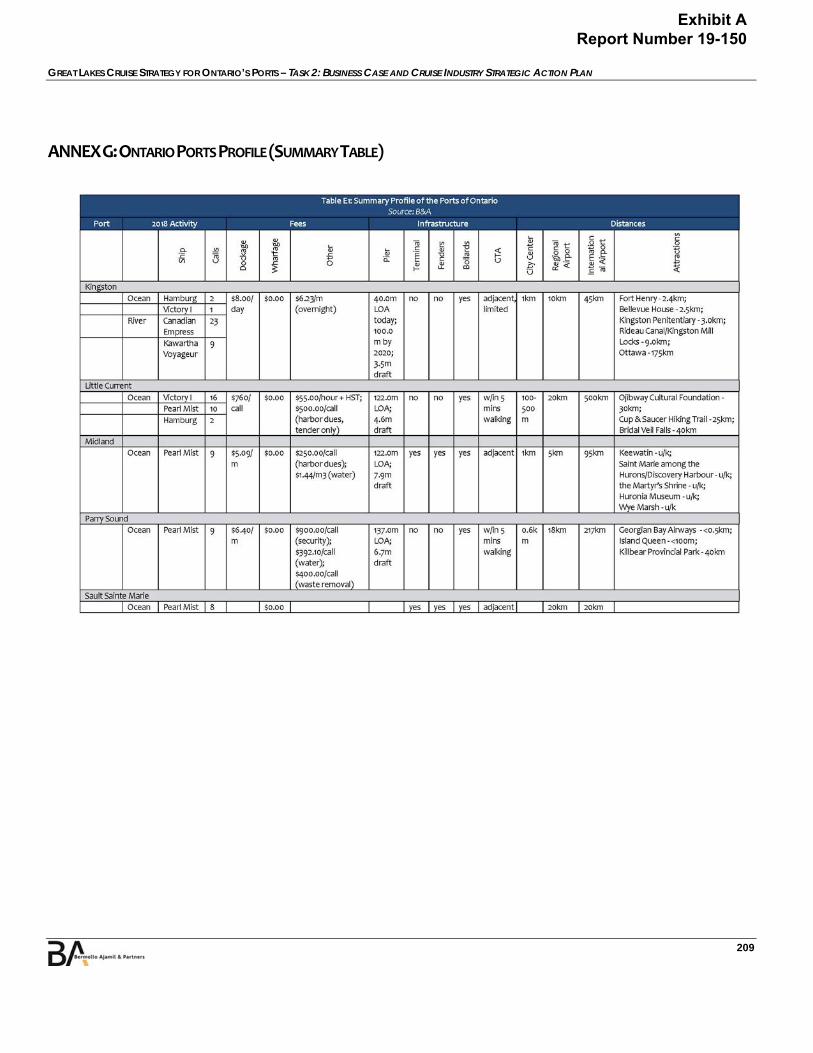
GREAT LAKES CRUISE STRATEGY FOR ONTARIO’S PORTS – TASK 2: BUSINESS CASE AND CRUISE INDUSTRY STRATEGIC ACTION PLAN
209
ANNEX G: ONTARIO PORTS PROFILE (SUMMARY TABLE)
Exhibit A Report Number 19-150
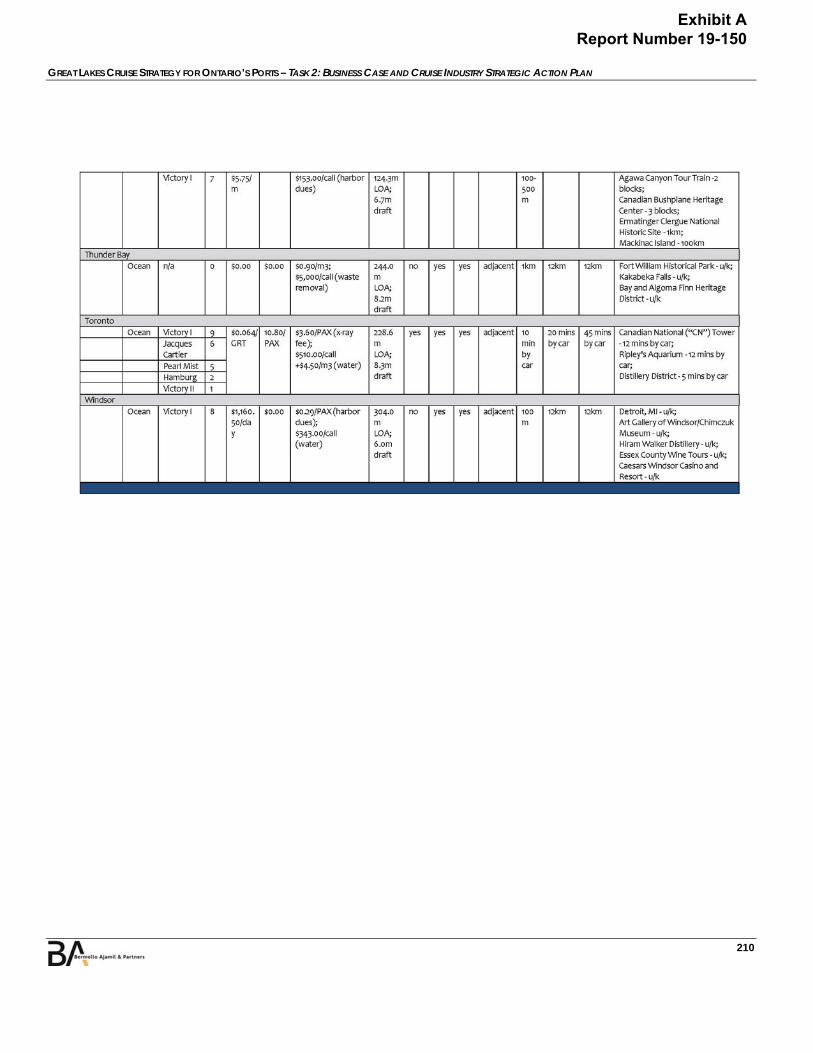
GREAT LAKES CRUISE STRATEGY FOR ONTARIO’S PORTS – TASK 2: BUSINESS CASE AND CRUISE INDUSTRY STRATEGIC ACTION PLAN
210
Exhibit A Report Number 19-150

GREAT LAKES CRUISE STRATEGY FOR ONTARIO’S PORTS – TASK 2: BUSINESS CASE AND CRUISE INDUSTRY STRATEGIC ACTION PLAN
211
ANNEX H: Cruise Canada New England (CCNE) Alliance (Plan Example)
The Cruise Canada New England (CCNE) Alliance represents more than 100 large, medium, and small ports of call, as well as the region’s primary homeports, located in three U.S. states, five Canadian provinces, and one French colony. The CCNE Alliance is led by an Executive Committee that encompasses five unique and diverse cruise partners, including NYCruise, Flynn Cruiseport Boston, Cruise Maine USA, Atlantic Canada Cruise Association (Cruise Atlantic Canada), and Cruise the Saint Lawrence. In June 2016, approximately 150 Canada New England cruise-region stakeholders gathered in New York City for the 18th annual CCNE Symposium. During this symposium, a commitment was made by the CCNE Alliance Executive Committee to develop a strategic plan for the region, prior to the 2017 Symposium in Montreal. The plan presented here follows through on that commitment, and outlines a path forward for the CCNE Alliance and the Canada New England cruise region as a whole. The sole purpose of the CCNE Alliance is to develop and market the Canada New England region as a premier cruise destination, in order to increase cruise ship calls, visitations, visitor satisfaction rates, and economic impacts within the region during the next 10 years and beyond. CCNE Alliance partners will continue to pool their resources and enhance and market the region, both domestically and internationally, in order to offer cruise visitors from around the world superior hospitality, unique activities, diverse destinations, and authentic local experiences that appeal equally to families, adventure enthusiasts, and everyone in between. CCNE’s primary target demographics include:
Cruise lines Travel agents Travel media Cruise visitors (i.e., passengers) and potential cruise visitors
CCNE’s primary target markets include:
United States Canada Europe
CCNE’s secondary target markets include:
China Australia
Years of mutual cooperation have spawned strong results for the Canada New England cruise region. In 2016, 21 cruise lines made a total of 1,186 ship calls to CCNE member ports, bringing approximately 593,000 crew visits and 1.5 million cruise visits to this unique, historic, and picturesque region. The result was a combined passenger and crew spend of approximately $207 million, and a total economic impact of approximately $620
Exhibit A Report Number 19-150

GREAT LAKES CRUISE STRATEGY FOR ONTARIO’S PORTS – TASK 2: BUSINESS CASE AND CRUISE INDUSTRY STRATEGIC ACTION PLAN
212
million. These numbers reflect steady growth in cruise tourism within the region, and point to additional opportunities in the future. By focusing on a common mission, a shared vision for the future, and strategies, tactics, and partnerships that will help us achieve this vision over the next 10 years, the CCNE Alliance will position the Canada New England cruise region for continued and unprecedented future success.
CCNE Mission The CCNE Alliance is the unified voice and public face of the Canada New England cruise region, and is charged with developing and marketing the region as a premier cruise destination, in order to increase cruise ship calls, visitations, visitor satisfaction rates, and economic impacts within the region.
CCNE Vision By 2026, the Canada New England region will be a premier, year-round cruise destination that welcomes dozens of international cruise lines, hundreds of cruise ship calls, and more than one million cruise visitors (bed nights) each year. Known for its superior hospitality, unique activities, diverse destinations, and authentic local experiences, Canada New England will be a four-season holiday destination for both first-time and repeat cruise visitors from around the world, and will consistently rank among the world’s top cruise destinations for visitor satisfaction.
Examples of Key Action Items:
Cruise Visitor Satisfaction Benchmarking Study and Survey In partnership with cruise lines, travel agents, and other strategic partners, establish a baseline for visitor satisfaction against key criteria related to cruising within the Canada New England region, and develop a joint CCNE Alliance visitor satisfaction survey to be distributed through cruise line and travel agent partners to individuals who have recently cruised within the Canada New England region.
Cost: TBD Timeframe: Recurring (every year), beginning in 2018 KPI(s): Successful determination of baseline satisfaction rating(s) Successful development and distribution of a joint CCNE
Alliance cruise visitor satisfaction survey, as measured by the number of responses received and the average rating earned
Lead: Cruise Maine USA
Best Practices Mission Plan and conduct a cruise-based best practices mission for regional partners to a cruise region that is substantially similar to the Canada New England region (i.e., Norwegian Fjords). This mission will focus on observing, documenting, and debriefing port infrastructure, tourism product offerings, and overall
Exhibit A Report Number 19-150
GREAT LAKES CRUISE STRATEGY FOR ONTARIO’S PORTS – TASK 2: BUSINESS CASE AND CRUISE INDUSTRY STRATEGIC ACTION PLAN
213
cruise visitor experience, vis-à-vis Canada New England, as a means of developing recommendations for how to more effectively carry out the CCNE mission and achieve the CCNE vision for the future.
Cost: $0 (The cost of this mission will be 100% borne by individual CCNE partner organizations/members, who choose to participate.)
Timeframe: Recurring (every 2-3 years), beginning in 2018 KPI(s): Effective documentation of cruise-related best practices that are directly applicable to the Canada New England region. Lead: Cruise the Saint Lawrence
Brand Identity The Canada New England region has much to offer cruise passengers, but the region remains fragmented in terms of its identity and lacks a cohesive brand that can be easily marketed to cruise lines and their consumer bases. The CCNE Alliance will focus on developing a brand identity that resonates with the cruising public, as well as potential first-time cruise visitors to the region; captures the diversity of culture and experiences that define our region; and propels the Canada New England region to premier, year-round cruise destination status by 2026.
Logo and Tagline
Formalize a CCNE Alliance logo and tagline that reflect the Canada New England region’s strengths and our shared vision for the future.
Cost: $2,500 USD/$3,350 CAD (one-time) Timeframe: 2017 KPI(s): Successful creation (or continuation) of a CCNE Alliance logo and tagline Lead: Cruise the Saint Lawrence
Website
Develop and maintain an effective website for the CCNE Alliance that enhances the Canada New England region’s online profile, and supports the CCNE Alliance’s mission and vision for the future.
Cost: TBD Timeframe: Ongoing, beginning in 2017 KPI(s): Successful creation (or continuation) of a functional CCNE website Lead: TBD
Social Media
Develop and maintain an effective social media presence for the CCNE Alliance that enhances the Canada New England region’s online profile, and supports the CCNE Alliance’s mission and vision for the future.
Cost: $0 Timeframe: Ongoing, beginning in 2017
Exhibit A Report Number 19-150
GREAT LAKES CRUISE STRATEGY FOR ONTARIO’S PORTS – TASK 2: BUSINESS CASE AND CRUISE INDUSTRY STRATEGIC ACTION PLAN
214
KPI(s): Successful creation and ongoing management of effective CCNE Facebook, Twitter, LinkedIn, and YouTube accounts, as measured by number of friends/followers/ likes/views/comments.
Lead: Flynn Cruiseport Boston
Collateral Create joint Canada New England marketing collateral (including maps, brochures, booths/backdrops, PowerPoint templates, and videos) that feature the CCNE Alliance logo and tagline, in order to reinforce our brand identity and showcase a unified region to cruise lines, cruise visitors, travel media, and other stakeholders.
Cost: $300,000 USD/$402,000 CAD (over 10 years) $2000 for the production and printing of the map
Timeframe: INITIAL DEVELOPMENT 2017 Portfolio/Brochure ($20,000)
2018/2019 Updated Seatrade Booth ($25,000) 2018 PowerPoint Template ($0) 2019/2020 Video(s) ($30,000)
--- FIVE-YEAR UPDATE
2022 Portfolio/Brochure ($20,000) 2023/2024 Updated Seatrade Booth ($25,000)
2023 PowerPoint Template ($0) 2024/2025 Video(s) ($30,000)
KPI(s): Successful production and use of collateral Lead: Cruise the Saint Lawrence
Marketing and Communication In order to achieve its vision for the future, the CCNE Alliance and the Canada New England cruise region as a whole must continue to have high visibility among cruise lines, but also among other key stakeholders in the cruise industry, including travel agents, travel media, and cruise visitors. The CCNE Alliance will leverage its brand identity and existing strengths to raise its profile and move beyond existing perceptions (e.g., limited to fall foliage), in order to become a premier year-round cruise destination for visitors from around the world.
Annual CCNE Symposium
Continue to host annual in-destination CCNE Symposium to promote the region among target audiences and key stakeholders.
Cost: $75,000 USD/$100,500 CAD/year Timeframe: Recurring (every year) KPI(s): Successful event, as measured by the number of target
customers (i.e., cruise line executives and staff) engaged Events (Outbound)
Exhibit A Report Number 19-150

GREAT LAKES CRUISE STRATEGY FOR ONTARIO’S PORTS – TASK 2: BUSINESS CASE AND CRUISE INDUSTRY STRATEGIC ACTION PLAN
215
Plan and execute numerous joint marketing and customer-focused events each year in order to increase visibility of the Canada New England cruise region and reinforce the CCNE Alliance brand identity.
Cost: $90,000-100,000 USD/$120,600-$134,000 CAD/year Timeframe: Ongoing, beginning in 2017 KPI(s): Successful events as measured by the number of target
customers (i.e., cruise line executives and staff) engaged Lead: Cruise Atlantic Canada
Familiarization Tours (Inbound)
Organize and execute at least one inbound familiarization (FAM) tour per year for cruise line itinerary planning, product development, and/or shore excursion executives and staff.
Cost: $10,000 USD/$13,400 CAD/year Timeframe: Recurring (every year), beginning in 2018 KPI(s): Successful execution of one or more annual cruise line FAM tour within the
region, as measured by the number of cruise line executives and staff members participating
Lead: Cruise Atlantic Canada
Travel Agent Training In partnership with Cruise Lines International Association (CLIA) and/or other travel industry partners, develop and deliver at least one inbound or outbound training program per year for travel agents that is specific to the Canada New England cruise region.
Cost: $25,000 USD/$33,500 CAD/year Timeframe: Recurring (every year), beginning in 2017 KPI(s): Successful execution of an annual training program for travel agents, as measured
by the number of new agents each year Lead: Flynn Cruiseport Boston
Annual Report
Produce and distribute an Annual Report no later than January 31 each year to CCNE Alliance stakeholders. This Annual Report will summarize the most recent Canada New England cruise season, as well as the activities (including inbound and outbound events) of the CCNE Alliance during the prior 12 months. This Annual Report will also include a prospective summary of the upcoming cruise season.
Cost: TBD Timeframe: Annual, beginning in 2018 KPI(s): Successful production and distribution of Annual Report Lead: CruiseMaineUSA
CCNE eNewsletter
Create and distribute a concise quarterly eNewsletter to CCNE stakeholders, to update them on activities of interest and trends of note within the Canada New England region.
Exhibit A Report Number 19-150
GREAT LAKES CRUISE STRATEGY FOR ONTARIO’S PORTS – TASK 2: BUSINESS CASE AND CRUISE INDUSTRY STRATEGIC ACTION PLAN
216
Cost: TBD Timeframe: Ongoing, beginning in 2019 KPI(s): Successful creation and distribution of a CCNE eNewsletter
Feedback from stakeholders on the quality and value of eNewsletter Lead: TBD
Industry Promotion
Where feasible, convert individual CCNE Alliance partner-organization sponsorships and advertising to joint CCNE sponsorships, in order to have a broader reach, more meaningful impact, and increased buying power.
Cost: $150,000 USD/$201,000 CAD/year Timeframe: Ongoing, beginning in 2019 KPI(s): Cruise ship occupancy and line profitability, before and after
Number of cruise ship calls and volume of cruise visitors (bed nights) in the region, before and after
Lead: Cruise Maine USA
Consumer Advertising Partner with cruise lines to evaluate and pursue strategic opportunities for joint direct-to-consumer (i.e., cruise visitors) marketing, in order to drive demand for Canada New England cruising, thereby increasing occupancy and profitability of existing cruise ships and itineraries within the region and attract new ships and itineraries to the region.
Cost: TBD Timeframe: Ongoing, beginning in 2019 or 2020 KPI(s): Cruise ship occupancy and line profitability, before and after
Number of ship calls and volume of cruise visitors (bed nights) visiting the region Lead: TBD
CCNE Media Engagement
Coordinate and distribute a joint annual CCNE Alliance press release no later than the end of January each year (between 2018 and 2026), which focuses on industry publications; conduct other media interviews to promote the Canada New England cruise region as often as possible during trade shows, during the annual CCNE Symposium, and at other times (as appropriate); and pursue editorial opportunities.
Cost: $0 Timeframe: Ongoing, beginning in 2018 KPI(s): Successful distribution of a joint press release each year to multiple cruise
industry media outlets Lead: Cruise Maine USA
Exhibit A Report Number 19-150
GREAT LAKES CRUISE STRATEGY FOR ONTARIO’S PORTS – TASK 2: BUSINESS CASE AND CRUISE INDUSTRY STRATEGIC ACTION PLAN
217
Destination Development Successful in-destination experiences are critical drivers of current and future cruise business within the Canada New England region. The CCNE Alliance will work closely with cruise lines, ports, tour operators, and other destination partners across Canada New England to evaluate and improve the quantity, diversity, and quality of tour products offered, focusing initially on summer and fall, and eventually on a year-round portfolio.
New Tourism Product Development Work with cruise lines, ports, tour operators, and other destination partners to identify opportunities for improvement, and create a plan for developing new and dynamic tour products across the region that focus on authentic local experiences that appeal equally to families, adventure enthusiasts, and everyone in between, and that increase average shore-excursion revenue within the region.
Cost: TBD Timeframe: Ongoing, beginning in 2019 KPI(s): Quantity and diversity of tour products offered v. baseline established by 2017 Inventory of Tour Products
Quality of tour products offered, as measured by cruise visitor satisfaction survey Shore excursion revenue, as reported (most likely
anecdotally) by cruise lines Lead: TBD
Best Bienvenue Plan
Partner with port and destination partners across the Canada New England region, to develop and implement cruise visitor welcome practices and traditions that reinforce the CCNE Alliance brand identity and distinguish the region as a whole, as well as individual ports and destinations within the region, as “best in class” for cruise visitor satisfaction.
Cost: TBD Timeframe: Ongoing, beginning in 2018 KPI(s): Average cruise-visitor satisfaction rating earned Lead: Cruise the Saint Lawrence
Language Diversity and Cultural Engagement
Work with tour operators, state/provincial, and local tourism agencies and German and Chinese Consular Corps offices within the region, and strengthen regional capabilities and accommodate German and Mandarin speakers as a means of increasing the appeal of the Canada New England cruise region to visitors from these two countries.
Cost: TBD Timeframe: Ongoing, beginning in 2019 KPI(s): Quantity and quality of German and Mandarin tour products offered as measured by cruise visitor satisfaction survey
Exhibit A Report Number 19-150
GREAT LAKES CRUISE STRATEGY FOR ONTARIO’S PORTS – TASK 2: BUSINESS CASE AND CRUISE INDUSTRY STRATEGIC ACTION PLAN
218
Port Evaluation/Readiness Kit Using the Inventory of Tour Products, Infrastructure Needs Analysis and Cruise Visitor Satisfaction Benchmarking Study for context, conduct a voluntary evaluation or audit of at least three ports within the Canada New England region each year to a) assess each port/destination’s readiness to accommodate cruise ship visits and b) make recommendations for how to improve cruise visitor satisfaction.
Cost: TBD Timeframe: Ongoing, beginning in 2018 KPI(s): Number of ports evaluated/audited each year Average cruise visitor satisfaction rating earned Lead: Cruise the Saint Lawrence
Partnerships The CCNE Alliance cannot carry out its mission or achieve its vision for the future without the help and engagement of key stakeholders. The following strategic partners, among others, have a role to play in the Canada New England cruise region’s success, and will be integrated to one degree or another, formally or informally, into the CCNE Alliance during the next 10 years.
Cruise lines Cruise Lines International Association (CLIA) Discover New England Saint Pierre and Miquelon German Consular Corps (New York, Boston, Portland, Halifax, Montreal) Chinese Consular Corps (New York, Montreal) State-/Province-level tourism agencies City-level convention and visitors bureaus U.S. Customs and Border Protection/Canada Border Services Agency Tour operator and ground transportation partners Travel agency partners Airline partners
Funding The CCNE Alliance is an unincorporated not-for-profit organization that relies entirely on partner contributions (both cash and in-kind) and sponsorships for its funding. During the next 10 years, the CCNE Alliance will explore alternative funding strategies with the goal of achieving annual funding levels that are consistent and adequate to allow the CCNE Alliance to carry out its mission and achieve its vision for the future.
Exhibit A Report Number 19-150

GREAT LAKES CRUISE STRATEGY FOR ONTARIO’S PORTS – TASK 2: BUSINESS CASE AND CRUISE INDUSTRY STRATEGIC ACTION PLAN
219
ANNEX I: Strategic Action Plan (Spreadsheet)
Exhibit A Report Number 19-150
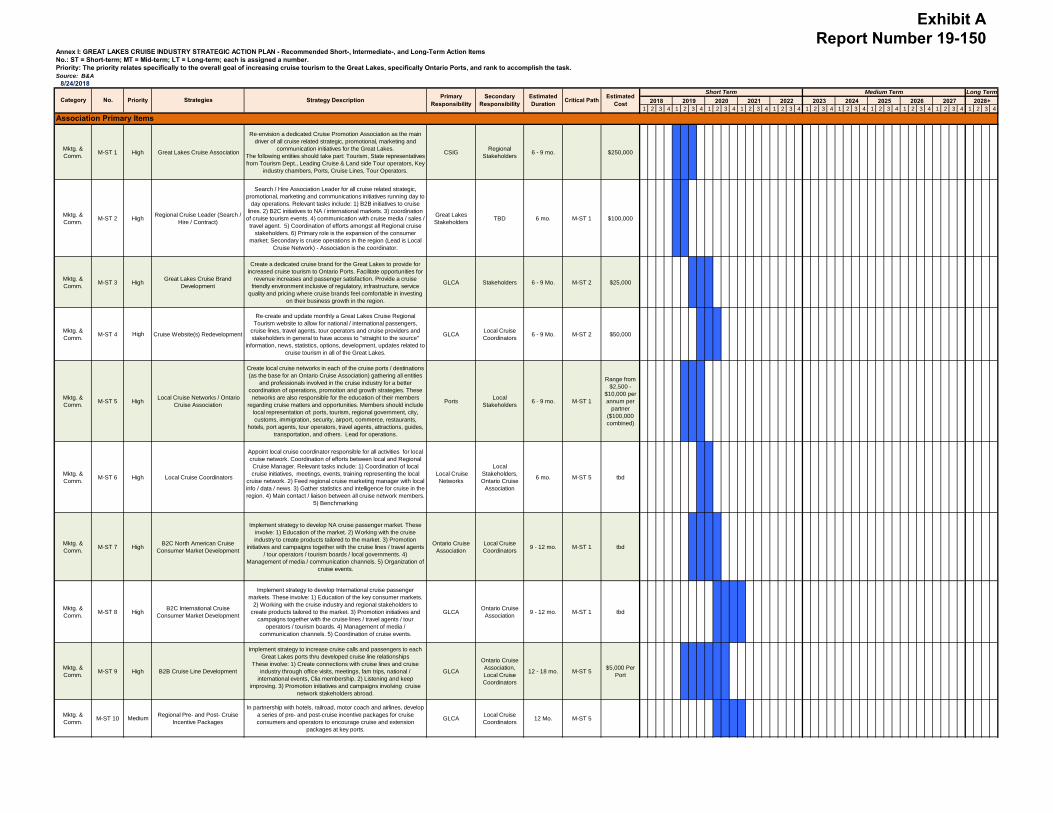
Annex I: GREAT LAKES CRUISE INDUSTRY STRATEGIC ACTION PLAN - Recommended Short-, Intermediate-, and Long-Term Action ItemsNo.: ST = Short-term; MT = Mid-term; LT = Long-term; each is assigned a number. Priority: The priority relates specifically to the overall goal of increasing cruise tourism to the Great Lakes, specifically Ontario Ports, and rank to accomplish the task. Source: B&A
8/24/2018
1 2 3 4 1 2 3 4 1 2 3 4 1 2 3 4 1 2 3 4 1 2 3 4 1 2 3 4 1 2 3 4 1 2 3 4 1 2 3 4 1 2 3 4
Mktg. &
Comm.M-ST 1 High Great Lakes Cruise Association
Re-envision a dedicated Cruise Promotion Association as the main
driver of all cruise related strategic, promotional, marketing and
communication initiatives for the Great Lakes.
The following entities should take part: Tourism, State representatives
from Tourism Dept., Leading Cruise & Land side Tour operators, Key
industry chambers, Ports, Cruise Lines, Tour Operators.
CSIGRegional
Stakeholders6 - 9 mo. $250,000
Mktg. &
Comm.M-ST 2 High
Regional Cruise Leader (Search /
Hire / Contract)
Search / Hire Association Leader for all cruise related strategic,
promotional, marketing and communications initiatives running day to
day operations. Relevant tasks include: 1) B2B initiatives to cruise
lines. 2) B2C initiatives to NA / international markets. 3) coordination
of cruise tourism events. 4) communication with cruise media / sales /
travel agent. 5) Coordination of efforts amongst all Regional cruise
stakeholders. 6) Primary role is the expansion of the consumer
market; Secondary is cruise operations in the region (Lead is Local
Cruise Network) - Association is the coordinator.
Great Lakes
StakeholdersTBD 6 mo. M-ST 1 $100,000
Mktg. &
Comm.M-ST 3 High
Great Lakes Cruise Brand
Development
Create a dedicated cruise brand for the Great Lakes to provide for
increased cruise tourism to Ontario Ports. Facilitate opportunities for
revenue increases and passenger satisfaction. Provide a cruise
friendly environment inclusive of regulatory, infrastructure, service
quality and pricing where cruise brands feel comfortable in investing
on their business growth in the region.
GLCA Stakeholders 6 - 9 Mo. M-ST 2 $25,000
Mktg. &
Comm.M-ST 4 High Cruise Website(s) Redevelopment
Re-create and update monthly a Great Lakes Cruise Regional
Tourism website to allow for national / international passengers,
cruise lines, travel agents, tour operators and cruise providers and
stakeholders in general to have access to "straight to the source"
information, news, statistics, options, development, updates related to
cruise tourism in all of the Great Lakes.
GLCALocal Cruise
Coordinators6 - 9 Mo. M-ST 2 $50,000
Mktg. &
Comm.M-ST 5 High
Local Cruise Networks / Ontario
Cruise Association
Create local cruise networks in each of the cruise ports / destinations
(as the base for an Ontario Cruise Association) gathering all entities
and professionals involved in the cruise industry for a better
coordination of operations, promotion and growth strategies. These
networks are also responsible for the education of their members
regarding cruise matters and opportunities. Members should include
local representation of: ports, tourism, regional government, city,
customs, immigration, security, airport, commerce, restaurants,
hotels, port agents, tour operators, travel agents, attractions, guides,
transportation, and others. Lead for operations.
PortsLocal
Stakeholders6 - 9 mo. M-ST 1
Range from
$2,500 -
$10,000 per
annum per
partner
($100,000
combined)
Mktg. &
Comm.M-ST 6 High Local Cruise Coordinators
Appoint local cruise coordinator responsible for all activities for local
cruise network. Coordination of efforts between local and Regional
Cruise Manager. Relevant tasks include: 1) Coordination of local
cruise initiatives, meetings, events, training representing the local
cruise network. 2) Feed regional cruise marketing manager with local
info / data / news. 3) Gather statistics and intelligence for cruise in the
region. 4) Main contact / liaison between all cruise network members.
5) Benchmarking
Local Cruise
Networks
Local
Stakeholders,
Ontario Cruise
Association
6 mo. M-ST 5 tbd
Mktg. &
Comm.M-ST 7 High
B2C North American Cruise
Consumer Market Development
Implement strategy to develop NA cruise passenger market. These
involve: 1) Education of the market. 2) Working with the cruise
industry to create products tailored to the market. 3) Promotion
initiatives and campaigns together with the cruise lines / travel agents
/ tour operators / tourism boards / local governments. 4)
Management of media / communication channels. 5) Organization of
cruise events.
Ontario Cruise
Association
Local Cruise
Coordinators9 - 12 mo. M-ST 1 tbd
Mktg. &
Comm.M-ST 8 High
B2C International Cruise
Consumer Market Development
Implement strategy to develop International cruise passenger
markets. These involve: 1) Education of the key consumer markets.
2) Working with the cruise industry and regional stakeholders to
create products tailored to the market. 3) Promotion initiatives and
campaigns together with the cruise lines / travel agents / tour
operators / tourism boards. 4) Management of media /
communication channels. 5) Coordination of cruise events.
GLCAOntario Cruise
Association9 - 12 mo. M-ST 1 tbd
Mktg. &
Comm.M-ST 9 High B2B Cruise Line Development
Implement strategy to increase cruise calls and passengers to each
Great Lakes ports thru developed cruise line relationships
These involve: 1) Create connections with cruise lines and cruise
industry through office visits, meetings, fam trips, national /
international events, Clia membership. 2) Listening and keep
improving. 3) Promotion initiatives and campaigns involving cruise
network stakeholders abroad.
GLCA
Ontario Cruise
Association,
Local Cruise
Coordinators
12 - 18 mo. M-ST 5$5,000 Per
Port
Mktg. &
Comm.M-ST 10 Medium
Regional Pre- and Post- Cruise
Incentive Packages
In partnership with hotels, railroad, motor coach and airlines, develop
a series of pre- and post-cruise incentive packages for cruise
consumers and operators to encourage cruise and extension
packages at key ports.
GLCALocal Cruise
Coordinators12 Mo. M-ST 5
Long Term
2018 2019 2020 2021 2028+
Association Primary Items
2024 2025 2026Secondary
ResponsibilityEstimated Duration Critical Path Estimated
Cost
Short Term Medium Term
20272022 2023Category No. Priority Strategies Strategy Description Primary Responsibility
Exhibit A Report Number 19-150

Annex I: GREAT LAKES CRUISE INDUSTRY STRATEGIC ACTION PLAN - Recommended Short-, Intermediate-, and Long-Term Action ItemsNo.: ST = Short-term; MT = Mid-term; LT = Long-term; each is assigned a number. Priority: The priority relates specifically to the overall goal of increasing cruise tourism to the Great Lakes, specifically Ontario Ports, and rank to accomplish the task. Source: B&A
8/24/2018
1 2 3 4 1 2 3 4 1 2 3 4 1 2 3 4 1 2 3 4 1 2 3 4 1 2 3 4 1 2 3 4 1 2 3 4 1 2 3 4 1 2 3 4
Long Term
2018 2019 2020 2021 2028+
Association Primary Items
2024 2025 2026Secondary
ResponsibilityEstimated Duration Critical Path Estimated
Cost
Short Term Medium Term
20272022 2023Category No. Priority Strategies Strategy Description Primary Responsibility
Mktg. &
Comm.M-ST 11 Medium
Cruise Tourism Provider
Education
Conduct bi-annual workshops for cruise tourism service providers
(ports, tourism, regional government, city, customs, immigration,
security, airport, commerce, restaurants, hotels, port agents, tour
operators, travel agents, attractions, guides, transportation, and
others) to enhance delivery and quality of cruise products in order to
meet the needs and expectations of cruise lines and passengers
Ontario Cruise
Association
Local Cruise
CoordinatorsEvery 24 Mo. M-ST 5 $10,000
Mktg. &
Comm.M-ST 12 High
Focus on the Success of Key
Brands
Collaborate on win-win scenarios which can be created between key
cruise brands and the Great Lakes to ensure mutual gains on
revenue, passenger satisfaction and repeat business such as: 1)
Promotional, marketing & sales efforts to the NA / international
consumer. 2) Development of incentive packages. 3) Itinerary
development initiatives & product development tailored to each brand
/ type of passenger, etc.
GLCALocal Cruise
Coordinators
Now / On-
goingM-ST 1, 5
Mktg. &
Comm.M-ST 13 High
Form Marketing Partnerships with
select cruise brands / Tour
Operators
Form a targeted marketing partnership with regionally expanding
cruise brands to promote the Great Lakes and the key ports as a
cruise destination. Include shared media related spending to target
consumer prospects.
GLCALocal Cruise
Coordinators12 - 24 Mo. tbd
Mktg. &
Comm.M-ST 14 Medium
Develop Messaging for a Broader
Demographic
Develop different marketing content that is customized for specific
consumer profiles and develop a customized delivery approach for
each.
GLCALocal Cruise
Coordinators3 - 6 Mo. M-ST 13
Mktg. &
Comm.M-ST 15 High
Align with Other Regional Cruise
Marketing Organizations
Align GLCA marketing efforts and messaging with in-market tourism
boards and like-minded regional cruise organizations such as Cruise
the St. Lawrence and CCNE. .
GLCA, Other
OrganizationsStakeholders 6 - 9 Mo. M-ST 14
Regulatory R-ST 1 High Tariff Strategy and Pricing
Evaluate existing port charges and procedures; Provide, where
possible, a consistent tariff package for all Ontario and Great Lakes
ports.
GLCA, Ports NA 6 - 12 mo. M-ST 5
Regulatory R-ST 2 Medium Cruise Berthing PolicyPrepare a comprehensive berth policy on a first come - first served
basis for all Great Lakes, Ontario Ports.GLCA, Ports NA 6 mo. M-ST 5
Operations O-ST 1 HighCruise Operations and Scheduling
Plan
A cruise operations and scheduling plan and process should be
prepared and implemented to streamline the delivery of information
and identify potential conflicts arising from berth or other tourism
infrastructure availability for all key ports. 1) Port wide initiative with a
single site for all ports to address deployments. 2) Continuous
updates to allow cruise line decision-makers to deploy in a timely
manner. 3) Provide for confidentiality as required.
GLCA, Ports Cruise Lines6 - 9 Mo. /
On-going
Operations O-ST 2 Medium Port Experience Standards
Develop a quality standard and specific routines/traditions for
homeports and ports of call across the Great Lakes region that
enhance guest satisfaction and reinforce the GREAT LAKES brand
from one port to another.
GLCA, Ports Tourism6 - 12 Mo. /
On-going
Operations O-ST 3 High Tourism Product Redevelopment
Work with Tour Operators and Cruise Brands to enhance the variety,
quality and unique experiences of tours in the region. Create bucket
list experiences as well as new products for repeat cruisers. Create
new experiences in each port to differentiate from one call to the next.
Aspire to make destinations competitive on a global scale through
new and unique product and service offerings that have strong guest
appeal.
Tour Operators,
Venues, TourismGLCA
12 - 24 Mo. /
On-going
Operations O-ST 4 Medium ECO Sustainability ProductsCreate a series of ECO adventure products that are sustainable and
support the Branding of the Great Lakes.
Tour Operators,
Venues, TourismGLCA
6 - 12 Mo. /
On-goingO-ST 3
Operations O-ST 5 Low Complementary Port Support
Provide operations and facilities development support for regional
ports. Focus on facilities that have had difficulty emerging given
favorable market trends and those of long-term interest for Great
Lakes expansion, specifically in Ontario.
GLCA, Ports Tourism3 - 6 Mo. /
On-going$5,000
Capital C-ST 1 HighIdentification of Early Bird Projects
(fast-track) - Kingston
Inventory of early bird projects required for Great Lakes design
vessel(s) at key cruise ports. Redevelopment of cruise port
infrastructure (e.g. navigable entry & docking channels).
Kingston TBD 12 - 18 mo. tbd
Capital C-MT 2 High Private Stakeholder Workshops
Conduct workshops with international and domestic private players
involved in development of waterfronts to gauge their interest and
expertise in the development of mixed-use facilities.
Midland, Toronto,
Thunder BayTBD 12 mo. $15,000
Capital C-ST 3 Medium Port Master Plan(s)
1. Develop masterplans for ports based on demand assessment. 2.
Consider mixed / multifunctional urban waterfront development
inclusive of the land side and marine facilities as the engine for PPP
development.
Port, City TBD18 - 24 mo. /
On-goingC-ST 2 $150,000
Capital C-ST 4 HighTechno-Economic Feasibility
Studies
Detailed Feasibility Studies for development of PPP Mixed Use Cruise
Facilities should be undertaken in Toronto, Midland and Thunder
Bay. These are related to the master planning process as a way to
evaluate the overall feasibility and positive impacts on the Port and
surrounding areas.
Port Transport
Canada9 - 18 mo. C-ST 3 $50,000
Capital C-MT 3 High Model Bid DocumentsModel RFP and Draft Concession Agreement for development of
PPPs in Key Ports.
Midland, Toronto,
Thunder BayTBD 6 - 9 mo. C-MT 2 tbd
Exhibit A Report Number 19-150
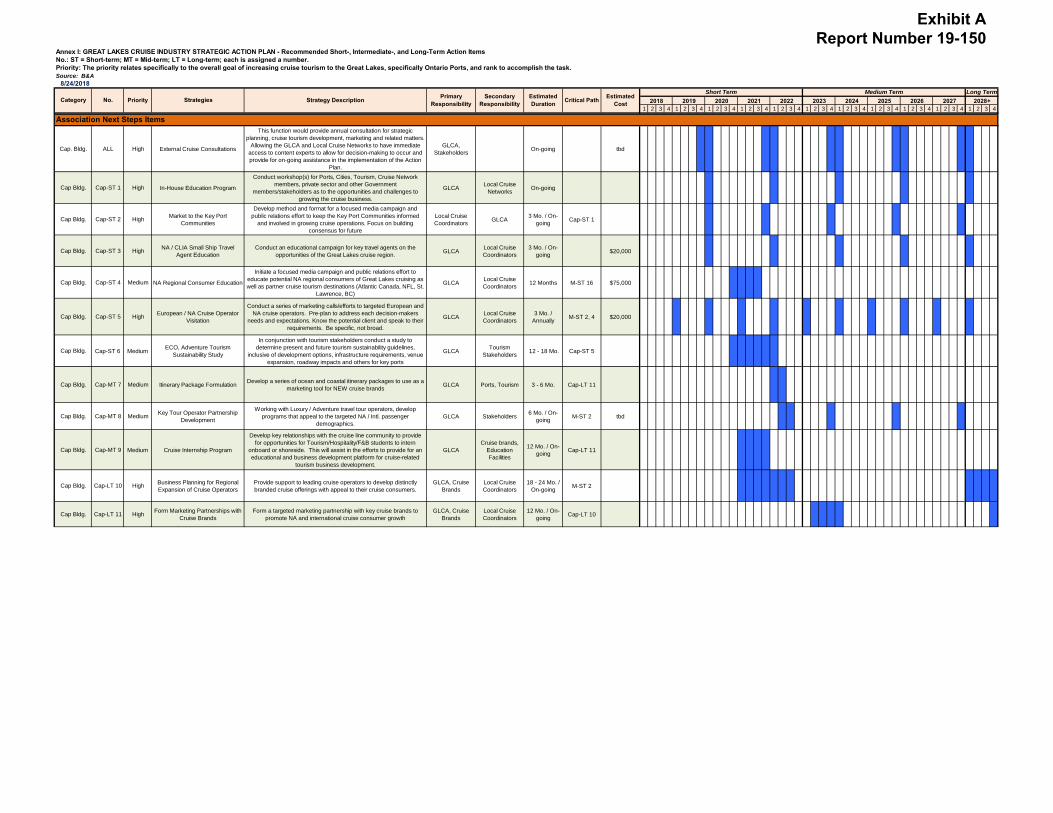
Annex I: GREAT LAKES CRUISE INDUSTRY STRATEGIC ACTION PLAN - Recommended Short-, Intermediate-, and Long-Term Action ItemsNo.: ST = Short-term; MT = Mid-term; LT = Long-term; each is assigned a number. Priority: The priority relates specifically to the overall goal of increasing cruise tourism to the Great Lakes, specifically Ontario Ports, and rank to accomplish the task. Source: B&A
8/24/2018
1 2 3 4 1 2 3 4 1 2 3 4 1 2 3 4 1 2 3 4 1 2 3 4 1 2 3 4 1 2 3 4 1 2 3 4 1 2 3 4 1 2 3 4
Long Term
2018 2019 2020 2021 2028+
Association Primary Items
2024 2025 2026Secondary
ResponsibilityEstimated Duration Critical Path Estimated
Cost
Short Term Medium Term
20272022 2023Category No. Priority Strategies Strategy Description Primary Responsibility
Cap. Bldg. ALL High External Cruise Consultations
This function would provide annual consultation for strategic
planning, cruise tourism development, marketing and related matters.
Allowing the GLCA and Local Cruise Networks to have immediate
access to content experts to allow for decision-making to occur and
provide for on-going assistance in the implementation of the Action
Plan.
GLCA,
StakeholdersOn-going tbd
Cap Bldg. Cap-ST 1 High In-House Education Program
Conduct workshop(s) for Ports, Cities, Tourism, Cruise Network
members, private sector and other Government
members/stakeholders as to the opportunities and challenges to
growing the cruise business.
GLCALocal Cruise
NetworksOn-going
Cap Bldg. Cap-ST 2 HighMarket to the Key Port
Communities
Develop method and format for a focused media campaign and
public relations effort to keep the Key Port Communities informed
and involved in growing cruise operations. Focus on building
consensus for future
Local Cruise
CoordinatorsGLCA
3 Mo. / On-
goingCap-ST 1
Cap Bldg. Cap-ST 3 HighNA / CLIA Small Ship Travel
Agent Education
Conduct an educational campaign for key travel agents on the
opportunities of the Great Lakes cruise region. GLCA
Local Cruise
Coordinators
3 Mo. / On-
going$20,000
Cap Bldg. Cap-ST 4 Medium NA Regional Consumer Education
Initiate a focused media campaign and public relations effort to
educate potential NA regional consumers of Great Lakes cruising as
well as partner cruise tourism destinations (Atlantic Canada, NFL, St.
Lawrence, BC)
GLCALocal Cruise
Coordinators12 Months M-ST 16 $75,000
Cap Bldg. Cap-ST 5 HighEuropean / NA Cruise Operator
Visitation
Conduct a series of marketing calls/efforts to targeted European and
NA cruise operators. Pre-plan to address each decision-makers
needs and expectations. Know the potential client and speak to their
requirements. Be specific, not broad.
GLCALocal Cruise
Coordinators
3 Mo. /
AnnuallyM-ST 2, 4 $20,000
Cap Bldg. Cap-ST 6 MediumECO, Adventure Tourism
Sustainability Study
In conjunction with tourism stakeholders conduct a study to
determine present and future tourism sustainability guidelines,
inclusive of development options, infrastructure requirements, venue
expansion, roadway impacts and others for key ports
GLCATourism
Stakeholders 12 - 18 Mo. Cap-ST 5
Cap Bldg. Cap-MT 7 Medium Itinerary Package FormulationDevelop a series of ocean and coastal itinerary packages to use as a
marketing tool for NEW cruise brandsGLCA Ports, Tourism 3 - 6 Mo. Cap-LT 11
Cap Bldg. Cap-MT 8 MediumKey Tour Operator Partnership
Development
Working with Luxury / Adventure travel tour operators, develop
programs that appeal to the targeted NA / Intl. passenger
demographics.
GLCA Stakeholders6 Mo. / On-
goingM-ST 2 tbd
Cap Bldg. Cap-MT 9 Medium Cruise Internship Program
Develop key relationships with the cruise line community to provide
for opportunities for Tourism/Hospitality/F&B students to intern
onboard or shoreside. This will assist in the efforts to provide for an
educational and business development platform for cruise-related
tourism business development.
GLCA
Cruise brands,
Education
Facilities
12 Mo. / On-
goingCap-LT 11
Cap Bldg. Cap-LT 10 HighBusiness Planning for Regional
Expansion of Cruise Operators
Provide support to leading cruise operators to develop distinctly
branded cruise offerings with appeal to their cruise consumers.
GLCA, Cruise
Brands
Local Cruise
Coordinators
18 - 24 Mo. /
On-goingM-ST 2
Cap Bldg. Cap-LT 11 HighForm Marketing Partnerships with
Cruise Brands
Form a targeted marketing partnership with key cruise brands to
promote NA and international cruise consumer growth
GLCA, Cruise
Brands
Local Cruise
Coordinators
12 Mo. / On-
goingCap-LT 10
Association Next Steps Items
Exhibit A Report Number 19-150