CITN March 2019 Edition
155
i
-
Upload
khangminh22 -
Category
Documents
-
view
0 -
download
0
Transcript of CITN March 2019 Edition

i
Published by
The Chartered Institute Of Taxation Of Nigeria
Tax Professionals’ House, Plot 16, Otunba Jobi Fele Way, Central Business District, Alausa - Ikeja.
P. O. Box 1087, Ebute-Metta, Lagos State, Nigeria. Tel: +(234)01-7741273 Website: www.citn.org, Email- [email protected]
Abuja Liaison Office: Block 26(27), Abidjan Street, Wuse Zone 3, Abuja, FCT
Tel: 09-2918349, 08060656493
© Chartered Institute of Taxation of NigeriaAll right reserved. Reproduction of the Journal of Taxation and Economic
Development in any form without prior permission of the Institute is prohibited. Views expressed by the authors do not necessarily represent the opinion of the
Institute.
ii
EDITORIAL BOARD
Editor-in-ChiefProfessor Oyesola Rafiu Salawu, FCTI
Faculty of Administration, Obafemi Awolowo University, Ile-Ife
MembersProfessor Chinedum Nathaniel NwezeakuFederal University of Technology, Owerri
Professor John AdeotiNigerian Institute of Social and Economic Research (NISER), Ibadan
Dr Stephen Chukwuemeka Mark AbaniMSCA Worldwide Projects Limited, Abuja
Dr Oyebode Samson OyetundeStanbic IBTC Bank Plc, Lagos
EDITORIAL ADVISORY COMMITTEE
ChairmanProf. Mikailu Aminu, FCTI
Usmanu Danfodiyo University Sokoto, Sokoto State
MembersProfessor Mohammed Taofeeq Abdulrazaq, FCTI
Faculty of Law, Lagos State University, Ojo
Professor Wole AdewumiDepartment of Economics, Banking and Finance, Babcock University,
Ilishan Remo
Professor Amari Omaka, FCTIFaculty of Law, Ebonyi State University, Ebonyi
Professor Prince Famous Izedonmi, FCTIDepartment of Accounting, University of Benin, Benin City
Jude Jirinwayo Odinkonigbo, FCTIFaculty of Law, University of Nigeria, Enugu
iii

NOTES ON CONTRIBUTORS
Harrison Vincent is a Lecturer in the Department of Banking & Finance, Faculty of Administration, Nasarawa State University, Keffi.
Prof. S.A.S Aruwa is a Professor in the Department of Accounting, Faculty of Administration, Nasarawa State University, Keffi.
Gimba John Toro is of the Department of Banking &Finance, Faculty of Administration, Nasarawa State University, Keffi.
Peter Okoeguale Ibadin, PhD is of the Department of Accounting, Faculty of Management Sciences, University of Benin, Edo State Nigeria.
Ofiafoh Eiya, PhD is an Associate Professor of Accounting in the Department of Accounting, Faculty of Management Sciences, University of Benin, Edo State Nigeria.
Ifeoluwapo Adebimpe Salami is of the Department of Accounting, Bowen University, Iwo, Osun State.
Prof. Rafiu Oyesola Salawu is a Professor of Accounting in the Department of Management and Accounting, Obafemi Awolowo University, Ile-Ife, Osun State.
Edosa Joshua Aronmwan and Izilin Mavis Okaiwele, PhD are both of the Department of Accounting, Faculty of Management Sciences University of Benin, Benin City.
Sani Muhammad is a Lecturer in the Department of Economics, Usmanu Danfodiyo University Sokoto State Nigeria.
Ahmed Aminu Mikailu is a Lecturer in the Department of Economics, Kaduna State University.
Alexander Olawumi Dabor, PhD is a Lecturer in the Department of Accounting, Edo University, Iyahmo.
Iyahmo, Eguase Beauty Ekiomado, PhD is a Lecturer in the Department of Accounting, Benson Idahosa University, Benin.
Meshack Aggreh, PhD is Lecturer Accounting Department, Edo University, Iyahmo.
Sadiq Oshoke Akhor is the staff of Bursary Department, College of Education, Igueben Edo State- Nigeria.
Dennis Onutomaha Akrawah is of The Department of Accounting, Faculty of Management Sciences, Chukwuemeka Odumegwu Ojokwu University, Anambra State, Nigeria.
Leslie Eyesan Dabor, PhD, is of the Department of Accounting, Faculty of Management Sciences, University of Benin, Nigeria.
Chinwuba Ambrose Okafor, PhD, is of the Department of Accounting, Faculty of Management Sciences, University of Benin, Nigeria.
iv

Ozele, Edojor Clement is a Lecturer in the Department of Accounting, Igbinedion University, Okada, Atu Favour Osaro is a Lecturer in the Department of Accounting, Wesley University, Ondo
Adeghe,Raphael Igbinosa Atu is the Dean, College of Business and Management Studies, Igbinedion University, Okada.
Oghogho Gina is Lecturer in the Department of Accounting, Igbinedion University, Okada.
Iduh Peter Ogwuche, Ph.D is a Lecturer at the Department of Business Administration, Kwararafa University Wukari, Taraba State Nigeria.
Abdullahi Musa Abdullahi, Ph.D is a Lecturer at the Department of Taxation, Nasarawa University Keffi, Nasarawa State, Nigeria.
Godwin Emmanuel Oyedokun, Ph.D is a Senior Lecturer at the Department of Accounting, Faculty of Administration, Nasarawa State University, Keffi .
v

JOURNAL OF TAXATION AND ECONOMIC DEVELOPMENT (JTED)A publication of the Chartered Institute of Taxation of Nigeria
(Academic and Professional Researchers)
CALL FOR PAPERSThe Institute The Institute is charged with the duty, amongst others, to encourage, promote and coordinate research for the advancement of taxation in Nigeria and to regulate the taxation profession in all its ramifications. The Chartered Institute of Taxation of Nigeria Act LFN 2004 is recognized as part of the tax laws in the country by the Federal Government Tax Policy.
The PublicationThe Journal of Taxation and Economic Development (JTED) is the official Journal of the Chartered Institute of Taxation of Nigeria (CITN). JTED is devoted to the study of taxation and its role in economic development. The journal's specific areas of interest include the theoretical and empirical analysis of taxation and its implication for fiscal performance; tax laws and policies; accounting and tax administration; and social factors determining the effectiveness of tax regimes especially in developing economies. Articles in these areas should keep in view the nexus between tax-related factors and economic development as a major deciding criterion of their contribution to the mission of JTED.
Articles submitted to JTED are peer-reviewed, and are expected to promote scholarly interactions among taxation professionals, academics, policy makers, development partners, and other development stakeholders in Nigeria and abroad.
Guidelines for the submission of articles1. Submission of an article for publication in JTED presupposes that it is original research; has
never been previously published and is not being concurrently submitted for publication elsewhere.
2. All articles must be well researched on contemporary issues in keeping with the JTED's mission outlined above. These can be under any of the following categories:
a. Original research - These must report studies and explain the purpose, methodology, sample, results and implications of the findings. A variety of research designs are welcomed but manuscripts should not exceed 7,500 words typed in Times New Romans 12 font and double-spaced.
b. Best practice – analytical reports of specific, successful documented efforts that improved, or provide evidence-based guidelines that can be used to improve, taxation administration, policy, etc. Whether entirely innovative or a variation of a tried and true approach, the best practice described must offer evidence as to how the subject matter was or could be enhanced and should have wide application. Such best practice papers should not exceed 4,000 words typed in Times New Romans 12 font and double-spaced.
c. Insights - well-reasoned and effectively articulated perspectives on issues within the JTED mission. Such contributions could take the form of counterpoint columns on a controversial topic. Insight papers are intended to stimulate thought and prompt open dialogue about taxation administration and social effect as well contribute to new lines of study. Such insight papers should not exceed 2,500 words typed in Times New Romans 12 font and double-spaced.
d. Reviews – these are a synopsis of worthwhile reading, viewing, and direct experience in taxation related research and practice. Such review papers should not exceed 1,000 words typed in Times New Romans 12 font and double-spaced.
vi

3. Articles submitted should have a covering letter that contains the following information:a. Category submitted as outlined in 2 aboveb. Title of Articlec. Name of Author(s) d. Brief bio-data of the Author(s) at the bottom of the first page e.g. XXX is a Professor at
…University; or xxx, Tax Manager, Training Manager, Managing Partner, Partner XYZ Associates & Co. (not exceeding 100 words)
e. Email address(es) f. Text references should be cited in the body of the paper as follows: Author's last name
and publication year (E.g., Oyeleke, 2010)4. Full references using the Current edition of the American Psychological Association (APA)
styled should be listed at the end of the paper as follows: Last, F. M. (Year Published) Book. City, State: Publisher.
5. Footnotes should be avoided apart from the Author's bio-data on page one.6. Manuscripts: The manuscript must be submitted in soft copy as a Microsoft Word document.
Other file formats, including PDF documents, are not accepted for the main (text) document. The manuscript should contain no clues as to author identity, such as acknowledgements, institutional information, and mention of a specific city – these should all be in the covering letter. Thus, information that might identify the author(s) should be omitted or highlighted in black. The first page of the manuscript should include only the title of the manuscript and date of submission. All manuscripts must include an abstract of 150- 200 words and three to six keywords. Line numbers should be embedded in the left margin to facilitate the review process.
7. Where tables and figures are necessary, they should not duplicate the text. Tables must be formatted using Microsoft Word's table building functions (using spaces or tabs in your tables may create problems when typesetting and may result in an error). Check tables and figures (rows, columns and totals) properly. Tables should be single-spaced and include a brief title. Explanatory paragraphs should be as near as possible to the relevant tables and figures, which should be appropriately numbered. The size and complexity of a table should be determined with consideration for its legibility and ability to fit the printed page.
8. Plagiarism is a serious offence. Authors should ensure appropriate citation of documents used in their articles and avoid copying from already published materials.
9. Final Revisions: Authors of accepted manuscripts must obtain and provide the managing editor all necessary permissions for reproduced figures, pictures, or other copyrighted work prior to publication. The authors also will need to complete and sign the copyright agreement.
10. Desk Rejection Policy: Before the full review, submissions are examined at the editorial level. If the editor and an editorial board member believe the submission has extensive flaws or is inconsistent with the mission and focus of the journal, the manuscript may receive a desk reject decision.
Submission and Correspondence:Manuscripts should be submitted electronically to [email protected]
For further enquiries, please contact:The Editor-in-Chief
Journal of Taxation and Economic Development (JTED)Chartered Institute of Taxation of Nigeria
Tax Professionals’ HousePlot 16, Otunba Jobi Fele Way
Central Business District Alausa- IkejaP.O.Box 1087, Ebute Metta
Lagos [email protected]; [email protected]
www.citn.org
vii

Contents VISION, MISSION, MOTTO ....................................................................... i
PUBLISHER’S AND COPYRIGHT INFORMATION................................. ii
EDITORIAL ADVISERS.............................................................................. iii
NOTES ON CONTRIBUTORS.................................................................... iv
CALL FOR PAPERS..................................................................................... vi
CONTENTS PAGE ....................................................................................... viii
Measuring Tax Avoidance using Effective Tax Rate: Concepts and ImplicationsEdosa Joshua Aronmwan and Izilin Mavis Okaiwele ...................................... 1-13
Impact of Economic Growth, Energy and Public Health Expenditure on Life Expectancy in Nigeria: Bound Test ApproachSani Muhammad and Ahmed Aminu Mikailu................................................... 14-22
Tax Aggressiveness and Corporate Social Responsibility in the Nigerian Manufacturing SectorAlexander Olawumi Dabor,Eguase Beauty Ekiomado and Meshack Aggreh... 23-33
Financial Reporting and Tax Issues in NigeriaSadiq Oshoke Akhor and Dennis Onutomaha Akrawah.................................... 34-44
Issues in Financial Reporting LagSadiq Oshoke Akhor, Leslie Eyesan Dabor and Chinwuba Ambrose Okafor... 45-58
Value Added Tax and Revenue Generation in Nigeria: An Empirical AnalysisEdojor Clement Ozele, Favour Osaro Atu, Raphael Igbinosa Atu Adeghe and Gina Oghogho ................................................................................................. 59-71
Company Income Tax and Nigerian Economic GrowthIduh Peter Ogwuche, Abdullahi Musa Abdullahi, Godwin Emmanuel Oyedokun... 72-83
Nexus between Financial Sector Development and Economic Growth in NigeriaHarrison Vincent, S.A.S Aruwa and Gimba John Toro..................................... 84-96
Measurements of Economic Development: Does Human Development Index Matter in the Context of Nigeria? Peter Okoeguale Ibadin and Ofiafoh Eiya....................................................... 97-109
The Determinants of the Adoption of International Public Sector Accounting Standards in Lagos StateIfeoluwapo Adebimpe Salami and Rafiu Oyesola Salawu............................... 110-121
Effect of Structural Capital on Performance of Listed Consumer Goods Companies in NigeriaHalimatu S. Abubakar, Musa I. Fodio, and Hassan Ibrahim.......................... 122-147
viii

MEASURING TAX AVOIDANCE USING EFFECTIVE TAX RATE: CONCEPTS AND IMPLICATIONS
Edosa Joshua AronmwanDepartment of Accounting
Faculty of Management SciencesUniversity of Benin, Benin [email protected]
Izilin Mavis OkaiweleDepartment of Accounting
Faculty of Management SciencesUniversity of Benin, Benin City
AbstractLack of consensus on the multifaceted concept of tax avoidance has caused us to witness a plethora of proxies that have been developed to measure and capture tax avoidance for the sake of empirical analysis. Therefore, this study contributes to the literature on tax avoidance as it seeks to find out the similarity or differences between tax avoidance measures with specific emphasis on effective tax rate based measures. Conducting the ANOVA and the Games Howell multiple comparison tests on a sample of 673 unbalanced firm-year observations of Nigerian companies, the study found that there is a significant difference between the examined measures while the Games Howell test further showed that the H & S measure differs significantly from the ETR based measures. Researchers are hereby advised to consider their research objectives before deciding on the measure of tax avoidance to use in their study.
Keywords: Corporate Tax Avoidance, Effective Tax Rate, Henry and Sansing Measure, Annual ETR, Long-run ETRJEL Classification: H25, M41
INTRODUCTIONTax avoidance has been at the forefront of academic research in recent times especially as a result of the increasing awareness amongst stakeholders and government to the threat associated with tax avoidance such as loss of revenue and public benefits to the society. It's a known fact that government rely on the revenue generated from the taxpayers to fund their activities such as providing the necessary infrastructural facilities for the citizenry, therefore activities that reduce the tax burdens of the taxpayers make it difficult for the government to get sufficient fund to provide their mandate to the citizens.
Tax avoidance is practiced globally with events such as the Luxembourg leaks in 2014, the Panama papers in 2016, and recently the Paradise leak in 2017 (Fitzgibbon & Starkman, 2017) further reiterating enormous tax avoidance by individual and corporate taxpayers. In the developed countries, the issue of tax avoidance has taken centre stage especially with the loss of tax revenue needed by the government to execute their
1Measuring Tax Avoidance Using Effective Tax Rate: Concepts And Implications
Journal of Taxation and Economic Development ISSN 1118-6017 Vol. 18, (1), March 2019

mandates. In the United States of America for instance, the loss of tax revenue is reported to be close to 70 billion dollars annually, which is close to 20% of the corporate tax revenue collected annually (Zucman, 2017). Also, in developing economies, tax avoidance is not a new trend with an estimated amount of up to 9.6 billion dollars a year being lost by the West African region in general and Nigeria losing an estimated 2.9 billion dollars in particular (Action Aid and Tax Justice Network, 2015).
Despite the attention in the media, academia, and research environ, there seems to be no generally agreed definition for tax avoidance (Dunbar, Higgins, Phillips, & Plesko, 2010; Gebhart, 2017; Hanlon & Heitzman, 2010) and this may account for the numerous proxies and measurements for tax avoidance (Salihu, Obid, & Annuar, 2013). Put differently, conceptualizing tax avoidance is riddled with bottlenecks and disagreements. This may be as a result of the multidimensional nature of tax avoidance. Dunbar et al. (2010) opined that the challenge of a lack of generally accepted definition for tax avoidance makes its measurement challenging for empirical researchers. In addition, Blouin (2014:875) asserts that this lack of consensus also creates confusion and inconsistency in tax avoidance measurements by researchers such that “ad-hoc approaches to developing and testing any hypotheses” bothering on tax avoidance has to be employed.
The commonly cited definition in literature for tax avoidance is that it is an act aimed at reducing explicit tax liability (Hanlon & Heitzman, 2010). Such an act may broadly include investment in bonds, use of tax reliefs and exemptions, lobbying activities, and other uncertain tax positions (Hanlon & Heitzman, 2010). Slemrod and Yitzhaki (2002) assert that when tax avoidance is aggressively done, it can be described as employing a wide range of reporting practices whose real intent is to reduce a tax liability without any real business activity. In addition, Chen, Chen, Cheng, and Shevlin (2010) portray tax avoidance as any arrangement to reduce tax liability and these arrangements when scrutinized, form a continuum of legitimate, grey, or unlawful activities. They also opine that those arrangements that are grouped as grey arrangements better portray the aggressive practice of tax avoidance. Therefore, tax avoidance however legitimate, could end up being unlawful when it is done aggressively, which in the words of Hanlon and Heitzman (2010:137) is "pushing the envelope of tax law”.
The opinion of Chen et al. (2010) may account for why various concepts have been introduced in the literature to explain the act of reducing tax liability. These terms as used interchangeably include tax avoidance; tax minimization; tax planning; tax aggressiveness; tax management; and tax sheltering (Boussaidi & Hamed, 2015; Graham, Hanlon, Shevlin, & Shroff, 2014; Richardson, Taylor, & Lanis, 2013). Also, Hanlon and Heitzman (2010) observed that aggressiveness is a very relative term and the real research interest is usually on excessive exploitation of loopholes in the tax system (aggressive tax avoidance, evasion, sheltering, and haven).
Based on the foregoing, there is obviously a debate on the concept of tax avoidance as deduced from the various related terms used in literature. This debate also confirms the position of Dunbar et al. (2010) and Blouin (2014) on the lack of consensus on the definition of tax avoidance and inconsistency in tax avoidance measurements.
2Measuring Tax Avoidance Using Effective Tax Rate: Concepts And Implications
Journal of Taxation and Economic Development ISSN 1118-6017 Vol. 18, (1), March 2019

Furthermore, there are numerous measures developed and used by researchers in exploring tax avoidance practices and according to Hanlon and Heitzman (2010), these measures are largely similar in that they capture non-conform tax avoidance through their assertion was not backed by empirical analysis. Conversely, Salihu et al. (2013) using Malaysian data found that effective tax rate based measures are significantly not the same based on the outcome of the ANOVA. In addition, Gebhart (2017) investigate tax avoidance measures in terms of their similarities using data available on Compustat and found that “although the different measures of corporate tax avoidance do exhibit differences and those differences persist over time; measures based on the same rationale (such as Effective Tax Rate measures) are subject to large correlation among one another”. In other words, his findings reveal differences between the broad categories of tax avoidance measures but similarities within each category. These further buttresses the measurement issue associated with researches on tax avoidance and the findings on the similarities and differences of tax avoidance measures are inconclusive and largely under-researched especially in developing countries.
Also, in conducting empirical researches, it is important that the variables of interest are properly measured because failure to ensure this may lead to poor inferences, which are most likely to be biased. Nachmias and Nachmias (2009) explained that to properly measure a concept, both the operational and conceptual definitions must be correctly spelt out. While the conceptual definition involves defining a concept based on what is generally agreed, the operational definition involves defining a concept with reference to the procedures or processes that are conducted in order to relate an abstract concept to reality. We believe that the link between these two definitions is that if a concept can be conceptualized properly, providing an operational definition should not be difficult.
Therefore, it is against the above backdrop that this study seeks to find out the similarity or differences between tax avoidance measures with specific emphasis on effective tax rate based measures. In actualizing the objective of the study, three ETR based measures and the Henry & Sansing measure [argued to be superior to ETR based measure as it avoids data truncation bias and is proposed by Henry & Sansing (2014) to capture conforming tax avoidance] were compared using the ANOVA and the Games Howell multiple comparison test. The result of the ANOVA revealed a significant difference between the examined measures while the Games Howell test further showed that the H & S measure differs significantly from the ETR based measures. Thus, this study contributes to knowledge on the issue of measuring tax avoidance in this regards. It is also relevant as it provides empirical evidence to show that ETR based measures are largely similar except for ETR derived by dividing cash tax by cash flow from operations. Therefore, it may just likely capture a different aspect of tax avoidance not captured by the other ETR based measures.
The structure of this study is as follows: section 2 captures the review of literature and hypotheses formulation; section 3 provides information on the methodology; section 4 bothers on the discussion of findings; section 5 harps on the conclusion, recommendations and limitation of the study.
3Measuring Tax Avoidance Using Effective Tax Rate: Concepts And Implications
Journal of Taxation and Economic Development ISSN 1118-6017 Vol. 18, (1), March 2019

LITERATURE REVIEW AND HYPOTHESES FORMULATIONOperationalizing Tax Avoidance Most studies on tax avoidance have focused more on the non-conforming aspect than the conforming due to the relative ease of measurement and source of information (Badertscher et al., 2016). Non-conforming tax avoidance involves reducing taxable income without reducing accounting income while conforming involves a reduction in both incomes. In addition, studies that have investigated the practice of tax avoidance can be grouped into three (Annuar, Salihu, & Obid, 2014). These three groups are (1) those that measure tax avoidance using the ratio of tax to income (effective tax rate), (2) those that measure tax avoidance using the gap between book and taxable income (book-tax gap), and (3) those that used other measures asides these first two measures. However, this study focuses on just the first group (effective tax rate) due to the availability of data, and the high frequency of its usage in literature.
Effective Tax Rate (ETR) Measure of Tax Avoidance This measure is used to capture tax avoidance practices by dividing the tax expense in the financial statement by pre-tax accounting income or cash (Hanlon & Heitzman, 2010). This gives a figure which ordinarily should lie between 0 and 1. In performing this calculation, the intention of the researcher is paramount. When the researcher is interested in the distribution of tax burden across companies and industries, or the fairness of the tax system, the average ETR should be calculated; while if the interest is on the evaluation of new investment, the marginal ETR should be calculated (Gupta & Newberry, 1997). In addition, from a time perspective, if the researcher is interested in a yearly rate of tax avoidance which is usually susceptible to time variations, the annual ETR should be calculated. However, if the interest is on several years, the long-run ETR is the more appropriate rate (Gebhart, 2017). The long-run measure of ETR was propounded by Dyreng, Hanlon, and Maydew (2008) to address the issue of volatility. It is more or less the same with the annual measure except that it is measured as the cumulative tax expense/current expense/cash tax over a period of years divided by pre-tax accounting income over the same number of years (Zeng, 2010).
Aside from the above-mentioned broad categorises of the ETR, specific variants of the ETR include accounting ETR, current ETR, cash ETR, and cash flow ETR. They are subsequently discussed below.
Accounting ETR Accounting ETR is the ratio of tax expense to pre-tax income as reported in the income statement (Hanlon & Heitzman, 2010). As a result of the accrual concept, tax expense is usually a combination of both current and deferred tax liability. Current tax is the portion of tax payable by applying the current tax rate on the profit for the year while deferred tax is the portion of tax expenses resulting from temporal timing difference (the difference between the carrying amount and tax base of an asset/liability).
One of the limitations of this measure is that it fails to capture deferral tax strategies [strategies by a company to minimise tax liability using management discretion and choice of accounting policies] (Hanlon & Heitzman, 2010). The reason for this is not farfetched since deferred tax is a portion of total tax expense and increases [decreases] in the current tax expense are offset by corresponding decreases [increases] in the deferred
4Measuring Tax Avoidance Using Effective Tax Rate: Concepts And Implications
Journal of Taxation and Economic Development ISSN 1118-6017 Vol. 18, (1), March 2019

tax expense. Another limitation is that it does not capture conforming tax avoidance and it suffers from truncation bias in a situation where the pre-tax accounting income is negative [loss] (Henry & Sansing, 2014).
Current ETR This is a variant of the accounting ETR developed to capture deferral tax strategy which is the reason for its superiority over the accounting ETR (Oyeleke, Erin, & Emeni, 2016). It is derived from the ratio of current tax expense to pre-tax accounting income. Despite being able to capture the deferral tax strategy, it suffers other limitations. For example, if computed as an annual measure, it is subject to yearly volatility (Salihu, Obid, & Annuar, 2014). Also, it is likely to understate the level of aggressive tax avoidance if uncertain tax benefits are included in the pre-tax accounting income (Dunbar, Higgins, Phillips, & Plesko, 2010). Uncertain tax benefits are tax positions upheld by a company that is likely to be disallowed by the relevant tax authority upon conducting a tax audit.
Cash ETR Financial reporting is done in line with Generally Accepted Accounting Principles (GAAP). One such principle is the accrual principle that allows for the recognition of expenses (incomes) when they are incurred (earned) and not when payment is made (received). This principle, therefore, makes any ETR derived from the tax expense recorded in the income statement prone to accrual management such as valuation allowance and management discretions (Lee et al., 2015).
To remedy the aforementioned issue of accrual management, the cash ETR was introduced. The cash ETR is gotten by dividing the actual amount of tax paid (tax expense recorded in the cash flow statement) by pre-tax income. Thus, it measures the actual tax avoided per unit of income. Nonetheless, it suffers from a mismatch between the numerator and the denominator. The numerator (cash tax expense) is devoid of accruals and is the actual tax paid while the denominator (pre-tax accounting income) is sourced from the income statement prepared in line with the accrual principle. Therefore, the ratio derived is reflective of both accrual management and tax avoidance schemes. In addition, since cash basis deals with movement of cash when it is received or spent notwithstanding the originating period (Hanlon & Heitzman, 2010), the cash tax paid may be payment relating to current tax liabilities and liabilities deferred from previous years, thus, making the resulting ETR not necessarily an annual or long-run measure of tax avoidance. Be that as it may, to address the mismatch issue, the use of net cash flow from operating activities has been suggested (Hanlon & Heitzman, 2010; Salihu et al., 2013).
Cash flow ETR As pointed out above, the use of cash ETR creates a mismatch issue that may affect the interpretation of findings. This issue can be easily be solved by comparing a numerator and a denominator that are both cash based. Hence the use of cash flow ETR. The cash flow ETR is derived by dividing tax expense by net cash flow from operating activities (Zimmerman, 1983) or by dividing cash tax paid by net cash flow from operating activities. According to Gebhart (2017), the cash flow variants of ETR is a recent
5Measuring Tax Avoidance Using Effective Tax Rate: Concepts And Implications
Journal of Taxation and Economic Development ISSN 1118-6017 Vol. 18, (1), March 2019

measure while Hanlon and Heitzman (2010) suggest that it differs from all other ETRs because of its capability to measure conforming tax avoidance. The suggestion by Hanlon and Heitzman (2010) is however opposed by Badertscher et al. (2016:10) who argue that cash flow ETR would not suffices in capturing conforming tax avoidance as it “excludes book-tax conforming tax strategies involving the acceleration of expenses or deferral of revenue that affect cash flow from operations”. In our opinion, Hanlon and Heitzman (2010) may be right as inferences based on the analysis carried out in this study to compare cash flow ETR with other variants of ETRs revealed a significant difference.
Furthermore, aside from the issue of the capability of the cash flow ETR in capturing conforming tax avoidance, it is equally possible for the cash flow ETR to lead to data truncation bias in a situation where the net operating cash flow is negative. According to the Henry and Sansing (2014), data truncation bias occurs when a denominator is negative and consequently, yields a negative quotient that has to be assumed as zero for the purpose of analysis. This bias may create ambiguity in interpretation though; it may be avoided if the focus is on just companies with positive cash flow.
Henry and Sansing's MeasureTo address the issue of truncation bias especially when the focus goes beyond profitable companies, Henry and Sansing's Measure (H & S) has been developed. According to Henry and Sansing (2014), discarding loss years during analysis, when the focus goes beyond profitable companies, is usually not random and this can lead to spurious findings. Also, they noted that comparison is to be made across companies and industries when making inferences and that the use of pre-tax accounting income as the denominator does not effectively achieve this objective. According to them, using pre-tax accounting income as the denominator especially when the companies have different sizes creates an exaggerated effect on companies with low but positive pre-tax accounting income. To remedy this, they suggest the use of a cash tax non-conformity measure (hereafter referred to as H & S measure).
The H & S measure is derived by performing two basic operations. First is to get the difference between the cash tax paid and the product of pre-tax income and the statutory rate. Second, the answer from the first operation is then divided by the market value of assets (Henry & Sansing, 2014). The final answer is what is referred to as the H & S measure. Its value is either positive, zero or negative. Companies that pay exactly what is expected by the tax authority will have a value of zero (no tax avoidance); those that paid higher will have a positive H & S value; while companies that pay lower will have a negative H & S value (Henry & Sansing, 2014; Gebhart, 2017). In addition, Badertscher et al. (2016) document that the H & S measure captures more than just non-conforming tax avoidance practices. This study aligns with this summation as it was observed based on the analysis done that the H & S measure significantly differs from the other ETR measures that are generally agreed to capture non-conforming tax avoidance.
Hypotheses FormulationSo far, we have seen that various measures for tax avoidance have been used by various researchers. However, the extent to which these measures converge or disperse may account for differences in findings. Hanlon and Heitzman (2010), Gebhart (2017),
6Measuring Tax Avoidance Using Effective Tax Rate: Concepts And Implications
Journal of Taxation and Economic Development ISSN 1118-6017 Vol. 18, (1), March 2019

N Minimum Maximum Mean Std. D
Cash ETR 673 0 1 0.1436 0.20817
Cash flow ETR 673 0 1 0.1189 0.20912
Pre Tax Cash flow ETR 673 0 1 0.1009 0.17438
H&S 673 -0.19 0.19 -0.0107 0.02736
Long-run Cash ETR 517 0 1 0.154 0.19124
Long-run Cash flow ETR 517 0 1 0.1447 0.21825
Long-run Pre Tax Cash flow ETR 517 0 1 0.1169 0.16795
Lisowsky et al. (2013) and Salihu et al. (2013) all opine that the various measures of tax avoidance have similarities and differences with respect to the nature of tax avoidance they capture. This leads us to hypothesize that:
1. There is a significant difference between the ETR based measures2. There is a significant difference between the ETR based measures and the H & S
measure.
METHODOLOGYUsing a descriptive research design to test the hypotheses raised, a total of 673 unbalanced firm-year observations of 88 companies quoted on the Nigerian Stock Exchange between 2008 and 2015 was used. Both annual and 3 years long-run variants of cash ETR, cash flow ETR, pre-tax cash flow ETR and H & S measures were computed.
Table 1: Descriptive Statistics
Source: Researcher’s computation (2018)
Table 1 depicts the descriptive statistics of the measures of tax avoidance. Based on the annual measures, cash ETR has the highest mean of 14.36%. This is followed by cash flow ETR, pre-tax cash flow ETR, and H & S having means of 11.89%, 10.09%, and -1.07% respectively. As expected, cash flow based ETRs have lower means than cash ETR because of the absence of accrual management in both the numerator and denominator and its possible ability to capture conforming tax avoidance. Pre-tax cash flow ETR (another variant of cash flow ETR) is also lower than cash flow ETR as expected since cash tax paid is added back to the denominator to account for its presence in the numerator. The H & S measure has a negative mean revealing that companies have a negative tax preference. The standard deviation which measures variability is a bit high and lies between 17% and 21% for the annual measures. This supports the argument that annual measures are subject to yearly volatility.
Looking at the long run measures, it is observed that the means for all the long-run measures increased, thus, giving a better picture of tax avoidance. The increase as time progresses show that companies tend to be less tax avoidant as time passes. However, since the means of the ETRs are well below the statutory rate of 30%, it suggests a low tax burden by companies.
7Measuring Tax Avoidance Using Effective Tax Rate: Concepts And Implications
Journal of Taxation and Economic Development ISSN 1118-6017 Vol. 18, (1), March 2019
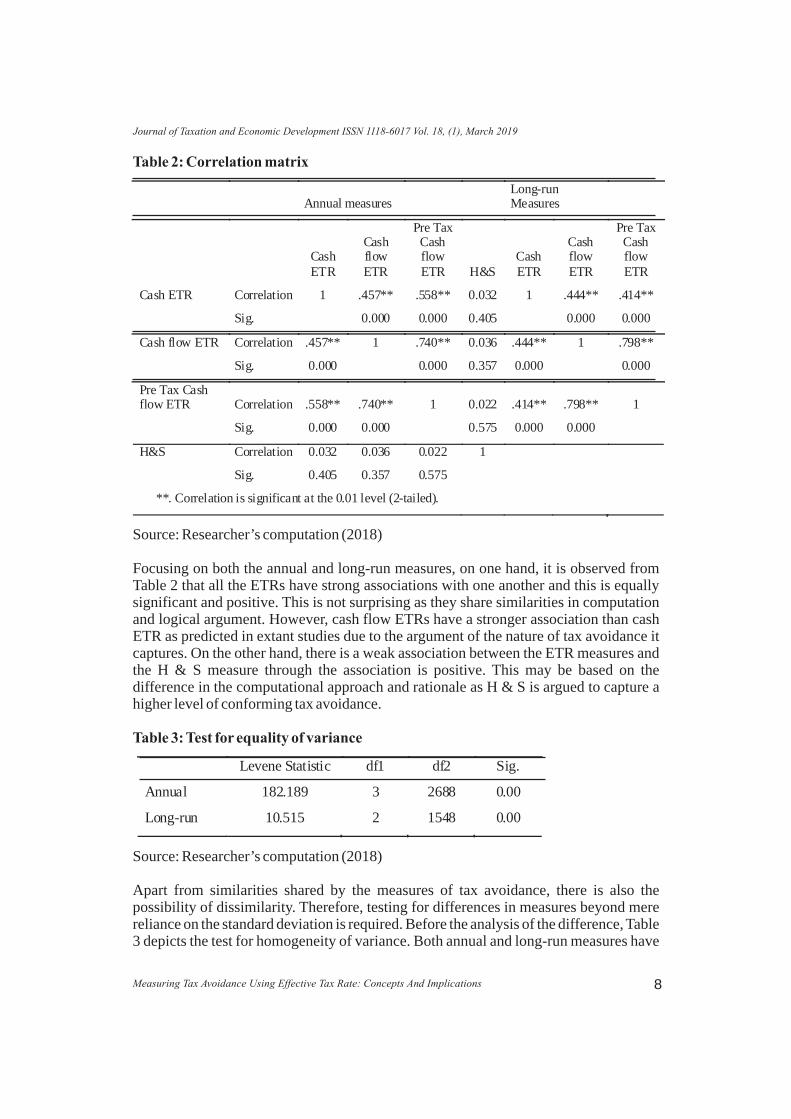
Table 2: Correlation matrix
Source: Researcher’s computation (2018)
Focusing on both the annual and long-run measures, on one hand, it is observed from Table 2 that all the ETRs have strong associations with one another and this is equally significant and positive. This is not surprising as they share similarities in computation and logical argument. However, cash flow ETRs have a stronger association than cash ETR as predicted in extant studies due to the argument of the nature of tax avoidance it captures. On the other hand, there is a weak association between the ETR measures and the H & S measure through the association is positive. This may be based on the difference in the computational approach and rationale as H & S is argued to capture a higher level of conforming tax avoidance.
Table 3: Test for equality of variance
Source: Researcher’s computation (2018)
Apart from similarities shared by the measures of tax avoidance, there is also the possibility of dissimilarity. Therefore, testing for differences in measures beyond mere reliance on the standard deviation is required. Before the analysis of the difference, Table 3 depicts the test for homogeneity of variance. Both annual and long-run measures have
8Measuring Tax Avoidance Using Effective Tax Rate: Concepts And Implications
Journal of Taxation and Economic Development ISSN 1118-6017 Vol. 18, (1), March 2019
Annual measures Long-run Measures
Cash ETR
Cash flow ETR
Pre Tax Cash flow ETR H&S
Cash ETR
Cash flow ETR
Pre Tax Cash flow ETR
Cash ETR Correlation 1 .457** .558** 0.032 1 .444** .414**
Sig.
0.000 0.000 0.405
0.000 0.000
Cash flow ETR Correlation .457** 1 .740** 0.036 .444** 1 .798**
Sig. 0.000
0.000 0.357 0.000
0.000
Pre Tax Cash flow ETR Correlation .558** .740** 1 0.022 .414** .798** 1
Sig. 0.000 0.000
0.575 0.000 0.000
H&S Correlation 0.032 0.036 0.022 1
Sig. 0.405 0.357 0.575
**. Correlation is significant at the 0.01 level (2-tailed).
Levene Statistic df1 df2 Sig.
Annual 182.189 3 2688 0.00
Long-run 10.515 2 1548 0.00

significant probability values F(3, 2688) = 0.00 and F(2, 1548) = 0.00 respectively suggesting that the condition for equality of variance is violated.
Table 4: Robust tests for equality of means
Source: Researcher’s computation (2018)
The robust test for means is normally carried out when there is a violation of equality of variance. For the use of ANOVA, it is expected that the variances are equal or at least, one of the means of the groups is different. Based on Table 4, due to the significant p-values obtained from the Welch test F(3, 1162) = 0.00 and Brown-Forsythe test F(3, 1992) = 0.00 for the annual measures, and the Welch test F(2, 1021) = 0.002 and Brown-Forsythe test F(2, 1481) = 0.006 for the long run measures, we can conclude that for both measures, at least one (two) of the group means is (are) different. The post hoc test (Games Howell) in Table 6 substantiates this conclusion.
Table 5: Analysis of Variance (ANOVA)
Source: Researcher’s computation (2018)
ANOVA is used to investigate the possibility of a significant difference between three or more groups. The annual measures statistics F(3, 2688) = 0.00 and the long run measures statistics F(2, 1548) = 0.006 show that there is a significant difference between the various measures as seen in Table 5. Consequently, as expected and documented in the
9Measuring Tax Avoidance Using Effective Tax Rate: Concepts And Implications
Journal of Taxation and Economic Development ISSN 1118-6017 Vol. 18, (1), March 2019
Statistic df1 df2 Sig.
Annual Welch 284.652 3 1162 0.000
Brown-Forsythe 105.959 3 1992 0.000
Long-run Welch 6.049 2 1021 0.002
Brown-Forsythe 5.149 2 1481 0.006
Sum of Squares Df
Mean Square F Sig.
Annual Between Groups 9.395 3 3.132 105.959 0.000
Within Groups 79.445 2688 0.03
Total 88.84 2691
Long run
Between Groups 0.386 2 0.193 5.149 0.006
Within Groups 58.004 1548 0.037
Total 58.39 1550

literature, we accept the first alternate hypothesis that there is a significant difference between the ETR measures. We can also infer from the Nigerian context that these measures capture various aspects of tax avoidance. However, to determine which of the measures differs, a multiple comparisons is done in Table 6.
Table 6: Multiple comparisons (Games Howell Test)
*. The mean difference is significant at the 0.05 level.
Source: Researcher’s computation (2018)
Beginning with the annual measures, it is observed from Table 6 that cash ETR is significantly different from pre-tax cash flow ETR and H & S measure; cash flow ETR is significantly different from H & S measure; pre-tax cash flow is significantly different from cash ETR and H & S measure; while H & S measure is significantly different from all the measures. This makes us accept the second alternative hypothesis that H & S is significantly different from the ETR measures. This finding is not surprising as it confirms casual empirics that H & S distinctively measures conforming tax avoidance. For the long run measures, long run pre-tax cash flow ETR significantly differs from long-run cash ETR as expected since the latter has elements of accrual management in its denominator.
DISCUSSION OF FINDINGSAs expected and documented in the literature, we found based on the analysis in Table 5, that there is a significant difference between the ETR measures. This finding agrees with studies like Gebhart (2017); Salihu et al. (2013); and Dunbar et al. (2010) who have investigated the similarities or differences associated with measures of tax avoidance
10Measuring Tax Avoidance Using Effective Tax Rate: Concepts And Implications
Journal of Taxation and Economic Development ISSN 1118-6017 Vol. 18, (1), March 2019
Annual (I) Group (J) Group
Mean Difference
(I-J) Std.
Error Sig. 95% Confidence
Interval
Lower Bound
Upper Bound
Cash flow ETR Pre Tax Cash flow ETR 0.018 0.010 0.316 -0.009 0.045
Cash ETR -0.025 0.011 0.133 -0.054 0.005
H&S .129* 0.008 0.000 0.109 0.151
Pre Tax Cash flow ETR Cash flow ETR -0.018 0.010 0.316 -0.045 0.009
Cash ETR -0.004* 0.010 0.000 -0.070 -0.016
H&S .111* 0.007 0.000 0.094 0.129
Cash ETR Cash flow ETR 0.025 0.011 0.133 -0.005 0.054
Pre Tax Cash flow ETR .0426* 0.010 0.000 0.016 0.070
H&S .1543* 0.008 0.000 0.133 0.175
H&S Cash flow ETR -0.129* 0.008 0.000 -0.151 -0.109
Pre Tax Cash flow ETR -0.111* 0.007 0.000 -0.129 -0.094
Cash ETR -0.154* 0.008 0.000 -0.175 -0.133
Long run Long run Cash flow ETR Long run Pre Tax Cash flow ETR 0.028 0.012 0.057 -0.001 0.056
Long run Cash ETR -0.009 0.013 0.745 -0.039 0.021
Long run Pre Tax Cash flow ETR Long run Cash flow ETR -0.028 0.012 0.057 -0.056 0.001
Long run Cash ETR -0.003* 0.011 0.003 -0.063 -0.011
Long run Cash ETR Long run Cash flow ETR 0.009 0.013 0.745 -0.021 0.039
Long run Pre Tax Cash flow ETR -0.003* 0.011 0.003 0.011 0.063

within the broad classifications. Salihu et al. (2013) focused on Malaysian firms and conducted an Analysis of Variance amongst the individual members of the ETR based measures and discovered that the various measures are different and thus, capture various aspects of tax avoidance. They also found that the ratio of the cash tax paid to cash flow from operations as a measure of tax avoidance differs significantly from the other ETR based measures. We can also infer from the Nigerian context that these measures capture various aspects of tax avoidance.
Based on the second hypothesis, we found that H & S measure is significantly different from all the ETR measures (see Table 6). This finding is not surprising as it confirms casual empirics that H & S distinctively measures conforming tax avoidance. It also supports the findings of Gebhart (2017) who extended his investigation to include book-tax-difference and Henry and Sansing’s measure. He found that the effective tax rate based measures that are calculated with either cash tax paid and/or operating cash flow have higher variability than the other ETR based measures. He also found that cash tax paid to cash flow from operations has the lowest mean of the ETR based measures and most likely is the only ETR based measure that captures conforming tax avoidance. The analyses done in this study further confirms the observations of these researchers on the similarities and differences associated with the broad classifications.
CONCLUSION AND RECOMMENDATIONThe study examined various effective tax rate measures of corporate tax avoidance in order to see if there is a significant difference between the measures and provide a guide on the selection of measures for future studies to prevent wrong inferences. In achieving this, secondary data were sourced from companies listed on the Nigerian Stock Exchange (NSE) for the period 2008 – 2015 for 673 unbalanced firm-years observation of 88 companies. The estimates from the ANOVA tests suggests that there is a significant difference between the various variants of the effective tax rate measures which implies that each measure captures different aspects of tax avoidance and also, the estimates found that there is a significant difference between the H & S measure and the effective tax rate based measures of tax avoidance implying that the H & S distinctly measures conforming tax avoidance.
Based on these findings, we recommend that researchers consider their research objectives before deciding on the measure of tax avoidance to use in their study. For instance, the effective tax rate variant measures might be most appropriate when considering tax avoidance of only profitable firms since company tax cannot be computed on losses, while the H & S measure would be appropriate when the study considers tax avoidance of profitable and non-profitable companies and when interested in conforming tax avoidance. The study also recommends that further study be carried out using other measures of tax avoidance different from the ETR based measures.
This study excludes firms in the financial sector as well as the oil and gas sector. Therefore, this finding may not be applicable to them due to differences in the regulatory environment for both financial and tax purposes.
11Measuring Tax Avoidance Using Effective Tax Rate: Concepts And Implications
Journal of Taxation and Economic Development ISSN 1118-6017 Vol. 18, (1), March 2019

REFERENCES
ActionAid and Tax Justice Network (2015, July). The West African giveaway: Use & abuse of corporate tax incentives in Ecowas. Retrieved from www.actionaid.org/publications/west-africa-giveaway-use-abuse-corporate-tax-incentives-ecowas.
Annuar, H. A., Salihu, I. B., & Obid, S. N. S. (2014). Corporate ownership, governance and tax avoidance: An interactive effects. Procedia Social and Behavioral Sciences, 164, 150-160.
Badertscher, B. A., Katz, S. P., Rego, S. O., & Wilson, R. J. (2016). Conforming tax avoidance and capital market pressure. Available at http://papers.ssrn.com.
Blouin, J. (2014). Defining and measuring tax planning aggressiveness. National Tax Journal, 67(4), 875-900.
Boussaidi, A., & Hamed, M. S. (2015). The impact of governance mechanism on tax aggressiveness: Empirical evidence from the Tunisian context. Journal of Asian Business Strategy, 5(1), 1-12.
Chen, S., Chen, X., Cheng, Q., & Shevlin, T. (2010). Are family firms more tax aggressive than non-family firms? Journal of Financial Economics, 95, 41–61.
Dunbar, A., Higgins, D. M., Phillips, J. D., & Plesko, G. A. (2010). What do measures of rd
tax aggressiveness measure? 103 Annual Conference on Taxation, 2010.
Dyreng, S., Hanlon, M., & Maydew, E. (2008). Long-run corporate tax avoidance. The Accounting Review, 83(1), 61–82.
Fitzgibbon, W., & Starkman, D. (December 27, 2017). The 'paradise papers' and the long twilight struggle against offshore secrecy. Retrieved from https://www.icij.org/investigations/paradise-papers/paradise-papers-long-twilight-struggle-offshore-secrecy/.
Gebhart, M. S. (2017). Measuring corporate tax avoidance: An analysis of different measures. Junior Management Sciences, 3, 43-60.
Graham, J. R., Hanlon, M., Shevlin, T., & Shroff, N. (2014). Incentives for tax planning and avoidance: Evidence from the field. The Accounting Review, 89(3), 991-1023.
Gupta, S., & Newberry, K. (1997). Determinants of the variability in corporate effective tax rates: Evidence from longitudinal study. Journal of Accounting and Public Policy, 16, 1–34.
Hanlon, M., & Heitzman, S. (2010). A review of tax research. Journal of Accounting and Economics, 50, 127-178.
Henry, E., & Sansing, R. C. (2014). Data truncation bias and the mismeasurement of corporate tax avoidance. Available at http://papers.ssrn.com.
Lee, B. B., Dobiyanski, A., & Minton, S. (2015). Theories and empirical proxies for corporate tax avoidance. Journal of Applied Business and Economics, 17(3), 21–34.
12Measuring Tax Avoidance Using Effective Tax Rate: Concepts And Implications
Journal of Taxation and Economic Development ISSN 1118-6017 Vol. 18, (1), March 2019

Lisowsky, P., Robinson, L., & Schmidt, A. (2013). Do publicly disclosed tax reserves tell us about privately disclosed tax shelter activity? Journal of AccountingResearch, 51(3), 583-629.
Nachmias, C. F., & Nachmias, D. (2009). Research methods in the social sciences. Britain: UK, Hodder Education.
Oyeleke, O., Erin, O., & Emeni, F. (2016). Female directors and tax aggressiveness of rd
listed banks in Nigeria. 3 International Conference on African Development Issues (CU-ICADI, 2016).
Richardson, G., Taylor, G., & Lanis, R. (2013). The impact of board of director oversight characteristics on corporate tax aggressiveness: An empirical analysis. Journal of Accounting and Public Policy, 32, 68–88.
Salihu, I. B., Obid, S. N. S., & Annuar, H. A. (2013). Measures of corporate tax avoidance: Empirical evidence from an emerging economy. International Journal of Business and Society, 14(3), 412-427.
Salihu, I. B., Obid, S. N. S., & Annuar, H. A. (2014). Government ownership and corporate tax avoidance: Empirical evidence from Malaysia. Book proceedings of ICETSR, Malaysia. Retrieved from www.pakinsight.com/ebooks/ICETSR.
Slemrod, J., & Yitzhaki, S. (2002). Tax avoidance, evasion and administration. Handbook on Public Economics, 3, 1425-1470.
Zeng, T. (2010). Income tax liability for large corporations in China: 1998-2007. Asian Review of Accounting, 18(3), 180-196.
Zimmerman, J. (1983). Taxes and firm size. Journal of Accounting and Economics, 5, 119–149.
Zucman, G. (2017, November 10). How corporations and the wealthy avoid taxes (and how to s top them) . The New York Times . Re t r i eved f rom https://www.nytimes.com/interactive/2017/11/10/opinion/gabriel-zucman-paradise-papers-tax-evasion.html.
13Measuring Tax Avoidance Using Effective Tax Rate: Concepts And Implications
Journal of Taxation and Economic Development ISSN 1118-6017 Vol. 18, (1), March 2019

IMPACT OF ECONOMIC GROWTH, ENERGY AND PUBLIC HEALTH EXPENDITURE ON LIFE EXPECTANCY IN NIGERIA: BOUND TEST
APPROACH
Sani MuhammadDepartment of Economics
Usmanu Danfodiyo University Sokoto, Nigeria+2348065911704 ; [email protected] & [email protected]
and
Ahmed Aminu MikailuDepartment of Economics
Kaduna State University, Kaduna +2348032523596; [email protected]
AbstractThis paper examines the impact of economic growth, energy and public health expenditure on life expectancy in Nigeria applying Autoregressive Distributive Lag (ARDL) model over the period of 1980 to 2018. The result shows that economic growth and public health expenditure positively affect life expectancy over the period of the study. On the other hand, energy negatively affect life expectancy. Consequently, It is however, recommended that, to improve the health status in Nigeria, health policymakers should focus on the factors which lie outside the healthcare system. These factors are mainly associated with economic growth and development level. Thus, the economic stabilisation policies with the aim of increasing the productivity, economic growth, and energy efficiency will certainly play significant roles in the improvement of health status and therefore, increasing the life span of Nigerians.
Keywords: life expectancy, economic growth, public health expenditure, energy, Bound test, NigeriaJEL Classification: F43, K33, O13, P36
INTRODUCTIONLife expectancy is an important synthetic indicator for assessing the economic and social development of a country or a region. During the last 170 years, life expectancy has been constantly rising (Bilas et al., 2014).Yet enormous discrepancies still exist between developed and developing countries. This disparity in life expectancy is believed to have its roots in differential socio-economic backgrounds of different social groups. The underlying rationale is that the socio-economic and environmental factors do exert independent, as well as, interactive influence on the life expectancy level. Considering population ageing trends it is to be expected that in the future there will be a decline in the active workforce, an increase in public expenditures for pensions and in health care expenses. Such changes significantly affect health care systems in developed countries, which are also faced with challenges caused by technological changes.
Furthermore, life expectancy is one of the pivotal outcomes of health care facilities as well as important component of human development index (HDI). This however
14Impact of Economic Growth, Energy and Public Health Expenditure on Life Expectancy in Nigeria....
Journal of Taxation and Economic Development ISSN 1118-6017 Vol. 18, (1), March 2019

encapsulates several variables and is itself determined by various factors, hence its comprehensiveness. Therefore, adequate health care facilities are presumed to see its reflections in stably high life expectancy. Thus, life expectancy can be only achieved if mortality rate, both infant and maternal, are dealt with from the root-cause rather than hitting its causes. Therefore, these root-causes of mortality are poor health care facilities, illiteracy, inadequate access to safe drinking water, erratic power supply, malnutrition and poor energy intake. However, low life expectancy in any country is attributed to so many factors including the aforementioned ones. Until recently, empirical evidence revealed that Nigeria records the following stylized facts as average year of life expectancy at birth: 49.8 in 2008; 50.4 in 2009; 50.9 in 2010; 51.3 in 2011; 51.7 in 2012; 52.1 in 2013; 52.4 in 2014; 52.8 in 2015 and income per capita growth of 3.5 in 2008; 4.1 in 2009; 5.0 in 2010; 2.1 in 2011; 1.5 in 2012; 2.6 in 2013; 3.5 in 2014; -0.01 in 2015. The trend of life expectancy is not in tandem with the income per capita growth which is puzzling. Meanwhile it is generally believed that, ceteris paribus, high income per capita seems to be translated in rapid sustainable increase in life expectancy at birth. This is because the more people have high income at their disposal on consumption the more life expectancy tends to increase. But it is different in Nigeria where the various trending in income per capita growth that do not reflect the increase in life expectancy at birth.
Moreover, it is clearly evident that income per capita growth is a times increasing at decreasing rate (e.g. from 2010 to 2012) or even decreasing (e.g. 2014 to 2015) with negative value (-0.01). Meanwhile life expectancy is increasing at increasing rate which is remarkable. Therefore, it is for this reason that necessitates research in this area in order to explore the reason behind this mishap. Therefore, it is against this background that this paper intends to answer the following research question:
i. To what extent does economic growth influence life expectancy in Nigeria?ii. To what extent does energy influence life expectancy in Nigeria? and iii. To what extent does public health expenditure affect life expectancy in Nigeria?
The paper is organized as follows: following this introduction is section 2 that contains conceptual as well as empirical literature reviews. Section 3 discusses the method of data collection and methodology. The major findings are presented in Section 4 and section 5 reports the conclusion and recommendations.
Literature ReviewLife expectancy at birth is the average number of years a newborn infant would be expected to live if health and living conditions at the time of birth remained the same throughout life. It reflects the health of a people, the quality of care they receive when ill as well as social, economic and environmental conditions which mitigates or predisposes to morbidity and mortality. Furthermore, life expectancy at birth is the number of years a new born infant of either gender may be expected to live if prevailing patterns of mortality at the time of its birth stays the same throughout its life time (Muhammad and Sabo, 2018). Empirical studies investigating the determinants of life expectancy or the relationship between life expectancy and other relevant variables are abound such as Muhammad and Sabo (2018); Ngwen and Kouty (2015); Monsef and Mehrjardi (2015); Sufyan, (2013); Sanda and Oyerinola (2014); Kunot et al. (1994); Lokpriy (2013); Christensen and Vanpel (1996); Lin et al. (2012); Bilas et al. (2014); and
15Impact of Economic Growth, Energy and Public Health Expenditure on Life Expectancy in Nigeria....
Journal of Taxation and Economic Development ISSN 1118-6017 Vol. 18, (1), March 2019

Balan and Jaba (2011); but specifically there is no research on the determinants of life expectancy in Nigeria. They are as follows:
Using Autoregressive Distributed Lag (ARDL) Model, Muhammad and Sabo (2018) examined the impact of economic growth and access to safe drinking water on life expectancy in Nigeria from 1980 to 2014. The paper found the existence of cointegration among the variables under study. Hence, the result revealed that economic growth and access to safe drinking water exert positive and statistically significant impact on life expectancy at birth over the period of the study. Similarly, Monsef and Mehrjardi (2015) surveyed the determinants of life expectancy in 136 countries for the period 2002–2010 using panel data analysis, fixed effects and random effect models. The results indicated that gross capital formation and gross national income have positive impact on life expectancy. For instance, Christensen and Vanpel (1996) analyze the determinants of longevity in the industrialized countries. The variables of choice are genetic, environmental and medical factors. It finds that high lifespan as well as mean lifespan increase substantially; there is remarkable improvement in survival amongst people of eighty and above; genetic factor contributes one-quarter of the variation in lifespan; the impact of both genetic and environmental factors on longevity can potentially be modified by medical treatment, behavioral changes and environmental improvements. Also, Lokpriy (2013) applied multiple regression technique to examine the socio-economic determinants of life expectancy in ninety lower income countries with a per capita GNI below $4035 in 2011. The variables of interest are improved sanitation facilities, improved water sources, secondary school enrolment, GDP per capita, and health expenditure per capita. The study finds that a higher GDP per capita combined with access to sanitation and safe water source as well as secondary school education have a positive impact on life expectancy; while relationship between life expectancy and health expenditure per capita is found to be contradictory. It is recommended that non-medical interventions are more positively robust determining factors of life expectancy in comparison with medical intervention.
Kunot et al. (1994) empirically assessed whether life expectancy is to the detriment of happiness. The dataset on 5 countries cover 6 years period from 1984 to 1989, using Sullivan Method. They addressed that life expectancies are not related to life satisfaction; because in Netherland, there is high life expectancy as well as high level of life satisfaction; while Ireland has high level of life satisfaction with low life expectancies; therefore, life satisfaction can be set up, in a country, irrespective of longevity; and in Greece and France, there is high life expectancies with lowest number of years in happiness. They that life at old age is not as gloomy as indicators of physical health.
In a similar study, Sufyan, (2013) examines the impacts of socio-economic determinants of life expectancy across one-hundred and six countries. These countries are categorized into three categories namely, countries with low life expectancy as group, countries with medium life expectancy as group, and countries with high life expectancy as group. Canonical discriminating analysis technique is used to discriminate the groups. The discriminating variables are population, living in Urban areas (%), currently married or in-union women of reproductive age (%), GNI purchasing power parity,
16Impact of Economic Growth, Energy and Public Health Expenditure on Life Expectancy in Nigeria....
Journal of Taxation and Economic Development ISSN 1118-6017 Vol. 18, (1), March 2019

population density, rural population with access to improved water supply, infant mortality rate, total fertility rate, dependent population (%), and poverty. The study shows that the infant mortality is the most influential variable in discriminating among the three groups, seconded by poverty. The other important discriminating factors are total fertility rate, percentage of currently married or in-union women of reproductive age, percentage of rural population with access to improved water supply, population density, and percentage of urban population. More so, infant mortality rate, poverty and total fertility rate positively discriminate countries to belong to the group of low life expectancy at birth countries. While percentage of population living in urban areas, currently married or in-union women of reproductive age, and rural population with access to improved water supply negatively discriminate a country to the group of high life expectancy at birth countries.
In Nigerian studies, Sanda and Oyerinola (2014) examine the impact of life expectancy on economic growth in Nigeria over the period of 1980 – 2012. OLS and ARDL estimation techniques were used in the analysis. The finds revealed that life expectancy has a positive impact on economic growth in Nigeria. Similarly, Ogungbenle, Olawumi, and Obasuyi, (2013) analyzed the relationship among life expectancy, public health spending and economic growth in Nigeria using VAR model. The findings revealed that there is no bidirectional causality between life expectancy and public health spending as well as life expectancy and economic growth but there is bidirectional causality between public health spending and economic growth. The method used is not in harmony with the findings of the study.
Using linear regression model Balan and Jaba (2011) examine the determinants of life expectancy in Romania by its region for the year 2008. The variables of interest under investigation are net nominal monthly salary(wages), number of readers subscribed to libraries, illiterate population aged ten and over (% from the total population), ratio of the Roma population (%), number of beds in hospitals, and number of doctors. The study shows that wages, the number of beds in hospitals, the number of doctors and the number of readers subscribed to libraries are positively related to life expectancy. On the other hand, the ratio of the Roma population and the ratio of illiterate population are negatively related to life expectancy. Therefore, it is clearly observed that Romanian regions are homogeneous in terms of level of life expectancy and its determinants. Ngwen and Kouty (2015) determined the impact of life expectancy on economic growth in developing countries using a dynamic panel of 141 countries over the period 2000- 2013. The results showed that life expectancy has positive effect on economic growth.
Leading support to the work of Lin et al. (2012) applied linear mixed models in examining the influence of four political and socio-economic factors on life expectancy at birth in one-hundred and nineteen less developed countries from 1970 to 2004. The four political and socio-economic determinants are economy, educational environment, over nutritional status and political regime measured by GDP per capita at purchasing power parity, literacy rate of the adult population aged fifteen and over, proportion of undernourished people in the population, and regime score, respectively. It finds that these determinants generally explain fifty five percent to ninety eight percent increases in life expectancy given a lag period of ten years. Specifically, political regime has the
17Impact of Economic Growth, Energy and Public Health Expenditure on Life Expectancy in Nigeria....
Journal of Taxation and Economic Development ISSN 1118-6017 Vol. 18, (1), March 2019

least contribution to life expectancy in LDCs but it contributes at increasing rate; while other three determinants have the highest contribution but they contribute at decreasing rate.
Similarly, Bilas et al. (2014) investigate the determinants of life expectancy at birth in twenty eight European countries from 2001 to 2011 using panel data analysis approach. The variables used in the study are GDP growth rate, level of education attained, education enrollment, GDP per capita, and life expectancy. The finds reveal that GDP per capita and level of education have positive and negative influence on life expectancy, respectively; these are the leading variables explaining between seventy three and eighty three percent of differences in life expectancy. Therefore, the negativity of educational level might be due to lifestyle factor of people with higher education that incorporate more stress as a result of more complex responsibility at work, bad nutrition habits, long working hours, less physical activities, etc.
MethodologyData and Description of VariablesThis paper employs Autoregressive Distributed Lag (ARDL) Model to examine the impact of economic growth, energy and public health expenditure on life expectancy. The data covers thirty five years i.e. 1980 to 2018. The data is sourced from a publication of World Bank, World Bank Indicators. The period was justifiably selected based on the availability of data in Nigeria. The paper used GDP growth as proxy for economic growth.
Model specification and Estimation ProcedureFollowing the work of Pesaran et al. (2001), the ARDL model is given as:
Although, ARDL model consists of two parts, the first part of the equations with ß1 to ß9 stands r the short-run dynamics of the models, while the coefficients a1 to a3 represents the long-run relationship. The null hypothesis of the above model is defined as H0: ß1 = ß2 = ß3 = ß4 = ß5 = 0 which tell us that there is no evidence of long run relationship (Pesaran et al.2001).
We begin the estimation by conducting cointegration test. The calculated F-statistics is compared with the Critical Value as tabulated by Pesaran et al. (2001). If F-statistics exceeds or supersedes the upper critical value, then the decision rule will be to reject the null hypothesis of no long-run relationship (no cointegration) irrespective of whether the underlying order of integration of the variables is zero or one i.e. I(0) or I(1), whereas if F-statistics falls below a lower critical value, then the null hypothesis cannot be rejected and if F-statistics falls within these two critical bounds, then the result is inconclusive (Pesaran et al, 2001). Accordingly, the Error Correction Model of the ARDL approach is specified as:
18Impact of Economic Growth, Energy and Public Health Expenditure on Life Expectancy in Nigeria....
Journal of Taxation and Economic Development ISSN 1118-6017 Vol. 18, (1), March 2019

Where ECM is the error correction representation of equation (1); however, before estimating equation (1), the study conducted a unit root test through the use of Augmented Dickey-Fuller and Dickey-Fuller Generalized Least Square.
Results and DiscussionEven though ARDL does not require stationarity test, but this study decide to determine the stationarity level of the variables under investigation before running ARDL bound test. This is because ARDL bound test is not capable of handling any series that go beyond first difference i.e. I(1) order of integration. Table 4.1, Show the results of the ADF and KPSS unit root tests and none of the series goes beyond I(1) order of integration. Based on the ADF stationarity test, the results show that life expectancy is stationary at level while health expenditure, GDP per capita, energy consumption, and electricity consumption are stationary at first difference.
Table 4.1: Unit Root test (ADF and DF-GLS)
Note: ***, **, and * indicating significant at 1%, 5% and 10% respectively.Source: Authors computation using Eviews Version 9.
However, after unit root test, there is also need to know the value of F-statistics in order to determine the presence or existence of cointegration or otherwise among the variables under estimation. This has been carried out using ARDL bounds test and the result reveals the evidence of cointegration among the variables. From Table 4.2, F-statistics is 17.19505. This shows that the null hypothesis of no cointegration can be rejected at one percent significance level. This is because the value of F-statistics is greater than the upper bound critical value of 3.93 and 2.79 for lower critical bound value.
Table 2: ARDL Bounds Test for Cointegration
Source: Authors Computation Using Eviews Version 9.0
19Impact of Economic Growth, Energy and Public Health Expenditure on Life Expectancy in Nigeria....
Journal of Taxation and Economic Development ISSN 1118-6017 Vol. 18, (1), March 2019
Variables ADF
Level First Difference
Life Expectancy -4.0265***
Health Expenditure -6.0196***
GDP Per Capita -3.9060***
Energy Consumption -4.8882***
Electricity Consumption -6.0142***
F-statistics value = 17.19505
Critical Value of Bounds
Significance I(0) Bound I(1) Bound
1% 2.79 3.93
5% 2.3 3.33
10% 2.05 3.02

However, the ARDL long-run coefficients are presented in Table 4.3. The results indicate that there is negative and statistically significant relationship between energy consumption and life expectancy. On the other hand it also reveals that there is positive relationship among public health expenditure, GDP per capita, and life expectancy in Nigeria throughout the study period. This implies that a unit increase in health expenditure and economic growth lead to 3%, and 0.4% increase in life expectancy, respectively. Contrariwise, a unit increase (decrease) in energy consumption is associated with 2.11% decrease (increase) in life expectancy.
Table 4.3: Result of the Estimated Long-Run Coefficients of the ARDL
Significance at 1% (***), 5% (**) & 10% (*)Source: Author’s Computation using E-view 9.0
Moreover, once the variables under study are cointegrated, and then there is need to go further to test error correction model (ECM) that expresses the short-run nexus among the variables. The reason behind this ECM is that, it expresses the speed of adjustment from the short-run to the long-run equilibrium in case of any distortion in the economy. The results as depicted in Table 4.4 show that ECM coefficient is -0.999931 and statistically significant at 1% level. This shows high speed of adjustment to equilibrium level after a shock. For the other explanatory variables, the short-run analysis reveals the existence of positive and statistically significant relationship with dependent variable.
Table 4.4: Error Correction Estimate of the ARDL Model (Short-Dynamics)
Significance at 1% (***), 5% (**) & 10% (*)Source: Author’s Computation using E-view 9.0
20Impact of Economic Growth, Energy and Public Health Expenditure on Life Expectancy in Nigeria....
Journal of Taxation and Economic Development ISSN 1118-6017 Vol. 18, (1), March 2019
Dependent Variable: LLIXP
Variables Coefficients t-Statistics
Health Expenditure 0.0334 2.0139*
GDP Per Capita 0.0004 3.7683***
Energy Consumption -0.0211 -3.0096**
Electricity Consumption -0.0019 -1.1266
R2 = 0.99, Adj. R2 = 0.99, AIC = -3.9601, SIC = -3.0338, HQC = -3.7032, DW = 2.3297
Dependent Variable: LLIXP
Variables Coefficients t-Statistics
Health Expenditure 0.025465 5.7119***
GDP Per Capita -0.000007 -0.2249
Energy Consumption -0.021653 -7.3104***
Electricity Consumption -0.000405 -0.8644
Constant 42.318240 28.4767***
ECM(-1) -0.999931 -28.5294***

Conclusion and RecommendationThe paper examines the impact of economic growth, energy and public health expenditure on life expectancy in Nigeria. Thus, Augmented Dickey-Fuller (ADF) was employed in testing the unit root properties of the variables under investigation. The paper further used Autoregressive Distributed Lag (ARDL) Model in examining the relationship between the variables.
Our results show that health expenditure has positive significant impact on life expectancy at birth in Nigeria. This implies that the more government spends on health facilities the higher the life expectancy at birth. Therefore, provision of health care facilities reduces both infant and maternal mortalities rates, which automatically increase life expectancy of the people. It is against this finding that the paper suggests that government should provide more health care facilities in the hospitals and medical dispensaries so that people will have more access to health care facilities in order to improve the health status in Nigeria, health policymakers should also focus on the other factors which lie outside the healthcare system.
The findings also revealed that economic growth has positive significant impact on life expectancy in Nigeria over the period of the study. Implying that increase in aggregate output produced in Nigeria will significantly enhance life expectancy of Nigerians. To achieve this there is need to increase energy efficiency as well as level of investment as they are among the pivotal drivers of economic growth. Thus, the aforementioned catalysts are mainly associated with economic growth and development level. Thus, the economic stabilisation policies with the aim of increasing the productivity, energy efficiency, and economic growth will certainly play significant roles in the improvement of health status and therefore, increasing life span of Nigerians.
21Impact of Economic Growth, Energy and Public Health Expenditure on Life Expectancy in Nigeria....
Journal of Taxation and Economic Development ISSN 1118-6017 Vol. 18, (1), March 2019

REFERENCES
Balan, C. and E. Jaba (2011) “Statistical analysis of the determinants of life expectancy in Romania”. Romanian Journal of Regional Science, volume 5, No. 2.
Lin, R., Y. Chen, L. Chien and C. Chan (2012). “Political and socio-economic determinants of life expectancy in less developed countries: a longitudinal study” BMC Public Health
Lokpriy (2013). “Socio-economic determinants of life expectancy: an analysis of lower income countries”.
Monsef, A. and A. S. Mehrjardi (2015). “Determinants of Life Expectancy: A Panel Data Approach” Asian Economic and Financial Review, 5(11): 1251-1257, DOI:10.18488/journal.aefr/2015.5.11/102.11.1251.1257
Muhammad, S. and A. Sabo (2018). “Impact of Economic Growth and Access to Safe Drinking Water on Life Expectancy in Nigeria: Bound Test Approach” Saudi Journal of Business and Management Studies (SJBMS), 3(4): 428-433 (Apr, 2018). DOI:10.21276/sjbms.2018.3.4.8
Ngwen N. and M. Kouty (2015). “The Impact of Life Expectancy on Economic Growth in Developing Countries” Asian Economic and Financial Review, 5(4): 653-660
Ogungbenle, S., O.R. Olawumi, and F.O.T. Obasuyi, (2013) “Life Expectancy, Public Health Spending and Economic Growth in Nigeria: A Vector Autoregressive (VAR) Model” European Scientific Journal 9(19): 1857- 7431, July
Shaw, J. W., C. H. William and J.V. Ronald (2005) “The Determinants of Life Expectancy: An Analysis of the OECD Health Data” Southern Economic Journal 71(4), 768-783
Sanda, U. A. And S. D. Oyerinola (2014). “Impact of Life Expectancy on Economy G r o w t h i n N i g e r i a : 1 9 8 0 - 2 0 1 2 ” A v a i l a b l e a t https://www.unilorin.edu.ng/ejournals/index.php/ijms/article/view/1957
UNDP (2016) “United Nations Human Development Report For Nigeria”
Venhoven, R. (1996) “Happy Life Expectancy: A Comprehensive Measure of Qualityof Life in Nations” Social Indicators Research, 39(01), 1 – 58.
Weisbrot, M. and R. Ray (2011) “The Scorecard on Development, 1960 – 2010: Closing the Gap?”. Economic and Social Affairs, UN/DESA Working paper 106.
World Bank, World Development Indicators; World Bank database (2015).
22Impact of Economic Growth, Energy and Public Health Expenditure on Life Expectancy in Nigeria....
Journal of Taxation and Economic Development ISSN 1118-6017 Vol. 18, (1), March 2019

TAX AGGRESSIVENESS AND CORPORATE SOCIAL RESPONSIBILITY IN THE NIGERIAN MANUFACTURING SECTOR
Alexander Olawumi DaborDepartment of Accounting,
Edo University, [email protected]
Eguase Beauty EkiomadoDepartment of Accounting
Benson Idahosa University, Benin City
and
Meshack AggrehAccounting Department Edo University, Iyahmo
Abstract The objective of this study is to ascertain the relationship between corporate social responsibility and aggressive tax behaviour of Nigerian firms. The study was restricted to the manufacturing sub-sector with the time scope of eleven years (2007-2017). A sample of thirty firms was selected using random sampling technique. The study employed the Least Square statistical technique to ascertain the relationship between the dependent and independent variables. The result shows that there is a positive relationship between corporate social responsibility and aggressive tax behaviour of the Nigerian manufacturing firms. This study recommended that researchers that intend to veer in this area of study should examine the impact of CSR on tax aggressiveness in the presence of earnings manipulation.
Keywords: Tax Aggressiveness, Risk Management Strategy theory, Corporate Social Responsibility
INTRODUCTION The primary motive for carrying out any business organization is to make a profit and to achieve this motive managers strategically lookout for ways to minimize cost in order to maximize profit. One area that managers strategically reduce cost is an area of taxation. Klassen, Lisowsky and Mescall (2016) document that managers in recent times have marshalled out legal means to whittle down cost via reduction of tax expenses. One among many mechanisms that managers can use to reduce tax expenses is aggressive tax mechanism. França, Moraes and Martinez (2015) report that tax aggressiveness is an integral part of the overall business plan which is geared toward the reduction of tax expenses.
An aggressive firm will always go for an option that permits minimal tax burden when transactions are made. Lanis, Richardson and Taylor (2017) opined that when structuring transactions, managers always look for the forms and alternatives that
23Tax Aggressiveness and Corporate Social Responsibility in the Nigerian Manufacturing Sector
Journal of Taxation and Economic Development ISSN 1118-6017 Vol. 18, (1), March 2019
guarantee the greatest tax savings. In certain clans, this conduct is assumed to be legally dubious. However prior studies have shown that tax aggressiveness can be used as a tax-saving vehicle for cutting costs in order increase shareholders' wealth (Graham & Tucker, 2006; Hanlon & Heitzman, 2010; Hanlon & Slemrod, 2009).
The determinants of aggressive tax behaviour are not certain. Various factors have been suggested by different researchers in extant literature to be responsible for aggressive tax behaviour. Some scholars (Desai & Dharmapala, 2006, 2009; Dyreng, Hanlon & Maydew, 2008) suggest that firm characteristics are the major determinants of tax aggressive behavior of managers while on the contrary other scholars (Kubick, Lynch, Mayberry & Omer, 2015; Huang,Lobo, Wang, & Xie, 2016; McGuire, Omer & Wilde, 2014) argue that the attributes of firms' operating environment (environmental factors like product market competition, customer concentration and the set of investment opportunities) are key determinants of managers' aggressive tax behaviour. The modality school of thought (Brown & Drake, 2013; Cheng, Huang, Yinghua Li & Stanfield, 2012; McGuire, Omer & Wang, 2012; Klassen et al., 2016; Khan,Srinivasan ,2017) argues that some gatekeepers, such as corporate networks industry expert accounts activities hedge funds and institutional investors facilitate or inhibit aggressive tax behaviour in certain settings.
Logical reasoning suggests that there is a link between aggressive tax behaviours and Corporate Social Responsibility (CSR). However, prior studies have not been able to establish the relationship between tax aggressiveness and CSR. Some authors suggest that CSR impacts tax aggressiveness while others argued that aggressive tax aggressiveness impacts CSR. Some studies suggest that firms use CSR as tax shelters while other scholars argue that firms that take advantage of tax shelter are socially irresponsible (Erle, 2008; Schön, 2008; Lanis & Richardson, 2012). The argument that is brought to the fore is that tax shelter reduces tax revenue which in turn result to lower the provision for public goods by government. Very few works have done on the relationship between Corporate Social and tax aggressiveness in the Nigerian content. Against this backdrop, this study is aimed at ascertaining the relationship between CSR and tax aggressiveness in the Nigerian Manufacturing sector.
LITERATURE REVIEWConceptual Framework Corporate Social Responsibility The EU (2016) sees corporate social responsibility a situation whereby companies voluntarily go beyond what is required by the law to achieve the social and environmental objective in the course of carrying out their daily business activities. Knuutinen (2016) document that the concept CSR refers to the operations or actions of companies that are above or independent of the limit or minimum requirement set by legislation Society expects companies to act in socially responsible ways. In other words, society sets the expectation for business to reflect its ethical norms. McWilliams and Siegel (2001) define CSR as actions that appear to further some social good beyond the interests of the firm and that which is required by law. The World Business Council for Sustainable Development (2000) defines CSR as the continuing commitment by business to behave ethically and contribute to economic development while improving
24Tax Aggressiveness and Corporate Social Responsibility in the Nigerian Manufacturing Sector
Journal of Taxation and Economic Development ISSN 1118-6017 Vol. 18, (1), March 2019

the quality of life of the workforce and their families as well as of the local community and the society at large.
Tax AggressivenessChen et al (2010) define tax aggressiveness as the effort of the company tominimize tax payments using aggressive tax planning activities and tax avoidance. Fran et al (2009) describe aggressive tax as the manipulation to lower tax income using tax planning that can be considered as tax management. Bruce at al (2007) report that the tax aggressiveness is a fervent action taken by companies to reduce their public debts from shaping and affecting their financial strategy scheme. Aggressive tax represents different handling activities to lower taxable income that can be legal or illegal. Desai and Dharmapal (2006) indicate that tax aggressive activities are characterized by complexity and obfuscation, which are practically difficult to detect. In fact, the most significant goal is to increase the net income of the company which creates a positive signal to foreign investors. Blouin (2014) explains that the lack of a definitive measure of tax aggressiveness is because there is little consensus as to how to define tax aggressiveness. She further explains how various types of tax planning have differing levels of risk, and argues that only tax planning .beyond acceptable, legislated or “known” tax deductions should constitute aggressive tax planning. This perspective stems from the observation that, in general, any innovative tax planning that capitalizes on uncertainty in the tax code could be deemed risky until it survives challenges by the tax authorities and/or the courts.
THEORETICAL FRAMEWORK Risk Management Strategy TheoryRisk management strategy theory believes that CSR activities can enhance a firm'sreputation for social responsibility to avoid risks of anti-political, regulatory andsocial sanctions. Godfrey (2005) argues that a positive social reputation isimportant when there is a negative event in business. This reputation helps toimprove sanctions on the company's business, thus providing a degree of insurance coverage. Some schools of thought argue that tax aggressive behaviour can lead to negative sanctions such as loss of corporate reputation, increased political pressure, penalty imposed by tax bureaus and even consumer boycotts. They further report that smart manager use provision of CSR to hedge the negative effects of these sanctions.
Review of Empirical Studies Lanis and Richardson (2012) carried out a study in Austral to determine the relationship between CSR and tax aggressiveness employing a cross-industry sample of 408 listedAustralian. Their result reveals that higher levels of CSR activities are associated with lower tax aggressiveness; while for the disaggregate CSR components, corporate strategy and social investment items have negative and significant relationship with tax aggressiveness.
Hoi et al. (2013) carry out a study to find out the correlation between corporate social responsibility (CSR) and tax aggressiveness using quoted companies on the Australian stock market. Their result shows that showed CSR activities have a negative impact on tax aggressiveness. Landry, Deslandes and Fortin (2013) investigate the relationship
25Tax Aggressiveness and Corporate Social Responsibility in the Nigerian Manufacturing Sector
Journal of Taxation and Economic Development ISSN 1118-6017 Vol. 18, (1), March 2019

between CSR and tax aggressiveness using archival data for 2004–2008 on panel data of Canadian firms. Their results reveal that family firms are less tax aggressive than non-family firms. Their findings suggest that tax behaviours are not necessarily aligned with corporate social responsibility. The findings underscore the importance of considering corporate social responsibility dimensions separately when investigating the relationship between tax aggressiveness and corporate social responsibility. Laguir et al. (2015) researched how different activities of social responsibility of a company influence the tax aggressiveness of the company. The results showed that tax aggressiveness of a company depends on the nature of socially responsible activities of the company. More extensive are the activities of the social dimension of a socially responsible company, lower is the level of tax aggressiveness.
Mgbame, Mgbame and Yekini, (2017) investigated the effect of corporate social responsibility (CSR) performance on tax aggressiveness of quoted Nigerian firms using cross-sectional research design. They used a sample of 50 companies for the period of 2007 to 2013. Their findings reveal that there is a negative relationship between CSR performance and tax aggressiveness in Nigeria. Agundu and Siyanbola (2017) perform a study in Nigeria to ascertain the relationship between CSR and tax aggressiveness employing Ordinary Least Square technique. Their results establish that tax aggressiveness has a positive relationship with CSR focal components (environmental enhancement and community involvement).
METHODOLOGYThis study applied a simple random sampling technique to select 30 manufacturing firms quoted on the floor of the Nigerian stock exchange market as at 31st December 2017. The researcher extracted information from the financial report of selected companies. This study adopted the modified version of Hanlonand and Heitzman (2010) to express the relationship between the dependent variable and the independent variable and it is written below:
TAGit = â + â FSZ + â LEV +â CSR + ? ... ... ... (1)0 1 2 3 it it
where:
TAG = Tax Aggressiveness CSR = Corporate Social Responsibility.FSIZE = Firm size (proxy by natural logarithm of total assets),LEV = Leverage? = Error Term,it
ß , ß , ß , ß = coefficients. A Prior expectation = ß , ß , ß , and ß >0.0 1 2 3 0 1 2 3
it it
26Tax Aggressiveness and Corporate Social Responsibility in the Nigerian Manufacturing Sector
Journal of Taxation and Economic Development ISSN 1118-6017 Vol. 18, (1), March 2019

Operation and Measurement of Variables
Source: Researcher’s Computation (2018)
PRESENTATION OF RESULT
Table 4.1: Descriptive Statistics
Source: Researcher’s Computation (2018)
Table 4.1 presents the descriptive statistics of the explanatory and dependent variables in the sample firms. The mean and standard deviation of TAG is 0.22 (22.20%) and the standard deviation of 0.37 showing that the tax aggressiveness as depicted by the effective tax rate of the sample is under the statutory tax rate of 30%. The low average effective tax rate by firms in the manufacturing sector implies they are have high aggressive tax behaviour the nature of payment of taxes in this sector fail to signify the statutory tax rates displayed by the government. The average amount expended on CSR
is ?215000 by firms within the period understudied. This implies that most manufacturing firms are committed to CSR activities. . However, the mean of firm size and leverage are 7558.6 and 1.27.
27Tax Aggressiveness and Corporate Social Responsibility in the Nigerian Manufacturing Sector
Journal of Taxation and Economic Development ISSN 1118-6017 Vol. 18, (1), March 2019
Variable Variable Label
Measurement Source Expected sign
Dependent
Tax Aggressiveness
TAG Effective Tax Rate
Chen et al., (2010); Hanlon & Heitzman, (2010); Lanis & Richardson (2012).
Independent
Corporate Social Responsibility
CSR Donations made by the firm.
Dabor and Dabor (2016)
-
Control variables
Leverage LEV is measured as long-term debt scaled by asset
Ferguson, Pinnuck, & Skinner, (2013)
+
Firm Size FISIZE Log of total asset Ferguson, Pinnuck, & Skinner, (2013)
+
Mean Max Min Stv.dev JB Prob Kurtosis Obs
TAG 0.2229 1.97 -1.99 0.37 920.2 0.000 16.45 120
CSR 21471990 1.03E 215000 25062098 73.95 0.000 5.104 120
FSZ 7558.6 24528 160.0 6708.3 16.56 0.000 2.611 120
LEV 1.27 16.57 -4.1500 3.06 1092.2 0.000 15.90 120

Table 4.2 Pearson Correlation Results
Source: Researcher’s Computation (2018)
Table 4.2 reveals a correlation matrix of variables. The result shows that there is a positive relationship between CSR and effective tax rate as depicted by a correlation coefficient of 0.08. In the same vein firm size exhibit a positive correlation with an effective tax rate as depicted by a correlation coefficient of 0.02. However, leverage exhibits a negative correlation with aggressiveness tax as depicted by -0.10. Furthermore, CSR exhibits a positive correlation with firm size with CSR as depicted by a correlation coefficient of 0.237. This implies that corporate responsibility is a function of the firm size. Finally, the result shows that leverage has negative correlation with firm size and CSR as depicted by a correlation coefficient of -0.015 and -0.183 respectively.
Normality Histogram
Source: Researcher’s Computation (2018) using e-views 9
The further strengthened the Jarque–Bera statistics reported in table 1. The result reported in figure 1 signifies a bell–shape histogram with mean of -5.10e and Jarque-Bera value of 12064.0 and associated probability value of 0.000000 which signifies normal distribution of the regression variables.
28Tax Aggressiveness and Corporate Social Responsibility in the Nigerian Manufacturing Sector
Journal of Taxation and Economic Development ISSN 1118-6017 Vol. 18, (1), March 2019
TAG CSR FSZ LEV
TAG 1.0000
CSR 0.0799 1.000
FSZ 0.0208 0.2365 1.000
LEV -0.1024 -0.0159 -0.1834 1.000

Table 4.3 Regression Result
Source: Researcher’s Computation (2018)
From the regression table 4.3, the R-square of 0.65 indicates that the independent variables explain 65%of the changes in the tax aggressive behaviour. The result shows that CSR has a positive relationship with tax aggressiveness at 5% level of significance. The positive sign of the coefficient of the CSR implies that more firms spend on CSR activities the lower their tax aggressive behaviour. The significant coefficient of the control variable, leverage relates to the opinion that the high debt ratio lowers the aggressive tax behaviour of firms. Furthermore, the result shows that firm size is also not significant, this indicates that tax aggressive behaviour is not a function of firm size.
CONCLUSION AND RECOMMENDATIONTax is one of the furthermost corporate expenses expended by corporate entities. Thus, managers have financial inducements to exhibit aggressive tax behaviour. Suffices to say that aggressive tax behaviour can undesirably tarnish the corporate image of a firm. The argument over the years is that paying taxes is an integral part of corporate social responsibility. Socially responsible firms go the extra mile to preserve their good reputation by been less tax aggressive. This study examines if socially responsible firms are less tax aggressive. The result shows that socially responsible firms are less tax aggressive. This study recommends that researchers that intend to veer in this area of study should examine the impact of CSR of tax aggressiveness in the presence of earning manipulation.
29Tax Aggressiveness and Corporate Social Responsibility in the Nigerian Manufacturing Sector
Journal of Taxation and Economic Development ISSN 1118-6017 Vol. 18, (1), March 2019
Dependent Variable: TAG
Variable Coefficient t-Stat Prob
C 0.2656 22.851 0.000 CSR 1.68E 6.169 0.000
FSZ -7.98E -1.790 0.074 LEV -0.083 -12.135 0.000 R-squared 0.65 F-Stat 81.00 Adjusted R-squared 0.64 Prob 1.94

REFERENCES
Agundu, P.U & Siyanbola, A.A (2017) Tax aggressiveness and Corporate Social Responsibility Fluidity in Nigerian firms,Jorind,15(1)12-27
Blouin, J. (2014). Defining and Measuring Tax Planning Aggressiveness. National Tax Journal, 67(4), 875–900.
Brown, J., Drake, K. & Wellman, L. (2014). The Benefits of a Relational Approach to Corporate Political Activity: Evidence from Political Contributions to Tax Policymakers. Working paper, Arizona State University.
Bruce, D., Deskins, J., & Fox, W. F. (2007). The extent of growth and efficiency consequences of state business tax planning, in taxing corporate income in the 21 century. Cambridge university press.
Chen, S., Chen, X., Cheng, Q., & Shevlin, T. (2010). Are family firms more tax aggressive then non-family firms? Journal of Financial Economics, 95(5), 41-61.
Cheng, C. S. A., Huang, H. H., Yinghua Li, & Stanfield, J. (2012). The Effect of Hedge Fund Activism on Corporate Tax Avoidance. The Accounting Review, 87(5), pp. 1493–1526.
Desai, M.A & D. Dharmapala, D (2006). Corporate tax avoidance and highpowered incentives. Journal of Financial Economics,79 (4),145-179.
Dyreng, S., Hanlon.M & E. Maydew. E. (2010) .The effects of executives on corporate tax avoidance. The Accounting Review, 85 (4), 1163-1189
Dyreng, S. D., Hanlon, M., & Maydew, E. L. (2008). Long-run corporate tax avoidance. The Accounting Review, 83(1), 61-82.
European Commission (2014) Taxation papers – working paper no 41 “BehavioralEconomics and Taxation.
França, C. J. de, Moraes, A. M. L. de M. de, & Martinez, A. L. (2015). Tributação Implícita e Clientelas, Arbitragem, Restrições e Fricções. Revista de Administração e Contabilidade da FAT, 7(1), 5–18.
Frank, M. M., Lynch, J. L., & Rego, S. O. (2009). Are financial and tax reporting aggressiveness reflective of broader corporate policies? The Accounting Review, 84(2), 467–496.
Godfrey, P.C. (2005) The Relationship between Corporate Philanthropy and Shareholder Wealth: A Risk Management Perspective. Academy of Management Review, 30 (3),777-798.
Graham, J.R., Hanlon, M., Shevlin,T .J. & Shroff, N.(2014). Incentives for tax planning and avoidance: Evidence from the field,” The Accounting Review, 89(3) 991-1023,
Hanlon, M. & J. Slemrod (2009). What does tax aggressiveness signal? Evidence from stock price reactions to news about tax shelter involvement. Journal of Public Economics, 93, (3)126-141.
30Tax Aggressiveness and Corporate Social Responsibility in the Nigerian Manufacturing Sector
Journal of Taxation and Economic Development ISSN 1118-6017 Vol. 18, (1), March 2019

Hanlon, M., & Heitzman, S. (2010). A review of tax research. Journal of Accounting and Economics, 50(2),127–178.
Hoi, C.K, Wu, Q & H. Zhang,H (2013). Is Corporate Social Responsibility (CSR) associated with tax avoidance? Evidence from irresponsible CSR activities. The Accounting Review, 88(6), 2025-2059.
Huang, H. H., Lobo, G. J., Wang, C., & Xie, H. (2016). Customer concentration and corporate tax avoidance. Journal of Banking and Finance, 72(5),184–200.
Khan, M., Srinivasan, S., & Tan, L. (2017). Institutional Ownership and Corporate Tax Avoidance: New Evidence. The Accounting Review, 92(2), 101–122.
Klassen, K. J., Lisowsky, P., & Mescall, D. (2016). The Role of Auditors, Non-Auditors, and Internal Tax Departments in Corporate Tax Aggressiveness. The Accounting Review, 91(1), 179–205.
Kubick, T. R., Lynch, D. P., Mayberry, M. A., & Omer, T. C. (2015). Product Market Power and Tax Avoidance: Market Leaders, Mimicking Strategies, and Stock Returns. Accounting Review, 90(2), 675–702
Laguir, I., Staglianò, R., & Elbaz, J. (2015). Does corporate social responsibility affect corporate tax aggressiveness? Journal of Cleaner Production, 107(4), 662–675.
Landry, S., Deslandes, M., & Fortin, A. (2013). Tax aggressiveness, corporate social responsibility and ownership structure. Journal of Accounting, Ethics & Public Policy, 14(3), 99–132
Lanis, R., & Richardson, G. (2012). Corporate social responsibility and tax aggressiveness: An empirical analysis. J. Account. Public Policy, 319(2) 86-108.
Lanis, R., Richardson, G., & Taylor, G. (2017). Board of Director Gender and Corporate Tax Aggressiveness: An Empirical Analysis. Journal of Business Ethics, 144(3),. 577–596.
McGuire, S. T., Omer, T. C., & Wang, D. (2012). Tax Avoidance: Does Tax-Specific Industry Expertise Make a Difference? The Accounting Review, 87(3), 975–1003.
Mgbame, C. O., Mgbame M. A. Yekini, S, (2017). Corporate social responsibility performance and tax aggressiveness. Journal of Accounting and Taxation. 9(8), 101-108,
Taylor, G., & Richardson, G. (2014). Incentives for corporate tax planning and reporting: Empirical evidence from Australia. Journal of Contemporary Accounting and Economics,10(6),1-45.
31Tax Aggressiveness and Corporate Social Responsibility in the Nigerian Manufacturing Sector
Journal of Taxation and Economic Development ISSN 1118-6017 Vol. 18, (1), March 2019

APPENDICES
Appendix 1: Descriptive Statistics
Appendix 2: Correlation Results
Appendix 3: Normality Test
32Tax Aggressiveness and Corporate Social Responsibility in the Nigerian Manufacturing Sector
Journal of Taxation and Economic Development ISSN 1118-6017 Vol. 18, (1), March 2019
TAG CSR FSIZE LEV Mean 0.188037 13659092 10548.38 0.601503 Median 0.150000 7190124. 6000.000 0.590000 Maximum 2.160000 1.03E+08 132000.0 4.930000 Minimum 0.000000 215000.0 308.0000 -0.870000 Std. Dev. 0.204458 18397511 14203.74 0.488561 Skewness 3.846769 2.505298 4.850317 2.752477 Kurtosis 31.31323 9.611115 37.12972 24.26042 Jarque-Bera 11692.93 934.7087 17100.60 6551.378 Probability 0.000000 0.000000 0.000000 0.000000 Sum 61.30000 4.45E+09 3438773. 196.0900 Sum Sq. Dev. 13.58594 1.10E+17 6.56E+10 77.57476 Observations 326 326 326 326
TAG CSR FSIZE LEV TAG 1.000000 0.078914 0.020841 -0.102460 CSR 0.078914 1.000000 0.236524 -0.015901 FSIZE 0.020841 0.236524 1.000000 -0.183453 LEV -0.102460 -0.015901 -0.183453 1.000000

Appendix 4: Regression Results
Dependent Variable: TAGMethod: Panel EGLS (Cross-section SUR)Date: 07/20/18 Time: 10:54Sample: 2007 2017Periods included: 12Cross-sections included: 11Total panel (balanced) observations: 132Linear estimation after one-step weighting matrix
33Tax Aggressiveness and Corporate Social Responsibility in the Nigerian Manufacturing Sector
Journal of Taxation and Economic Development ISSN 1118-6017 Vol. 18, (1), March 2019
Variable Coefficient Std. Error t-Statistic Prob. C 0.265697 0.011627 22.85176 0.0000 CSR 1.68E-09 2.72E-10 6.169100 0.0000 FSIZE -7.98E-07 4.43E-07 -1.799698 0.0743 LEV -0.083452 0.006877 -12.13545 0.0000 Weighted Statistics R-squared 0.655013 Mean dependent var 5.564418 Adjusted R-squared 0.646928 S.D. dependent var 7.048333 S.E. of regression 1.005155 Sum squared resid 129.3231 F-statistic 81.00955 Durbin-Watson stat 1.948026 Prob(F-statistic) 0.000000 Unweighted Statistics R-squared 0.073451 Mean dependent var 0.225000 Sum squared resid 3.355869 Durbin-Watson stat 1.517995

FINANCIAL REPORTING AND TAX ISSUES IN NIGERIA
Sadiq Oshoke AkhorBursary Department,
College of Education, Igueben, Benin City, Nigeria07030891548; [email protected]
Dennis Onutomaha Akrawah The Department of Accounting,
Faculty of Management Sciences,Chukwuemeka Odumegwu Ojokwu University, Anambra State, Nigeria
AbstractThe purpose of this study is to examine the relationship between financial reporting and tax issues in Nigeria. The objective of the study is to examine the relationship between deferred taxation, tax planning and financial reporting in Nigeria. The study adopts a longitudinal research design for the collection of secondary data for the period of 2012 to 2016 where thirty-two (32) quoted non-service company are randomly selected and employs Logistic regression for the empirical analysis. The empirical evidence shows that deferred taxation has a positive and a significant relationship with financial reporting at 1% level of significant across the models (Probit, Logit and Extreme value regressions), tax planning measured by cash effective tax rate has a positive and insignificant relationship with financial reporting even at 10% level of significant across the models (Probit, Logit and Extreme value regressions). And tax planning measured by income effective tax rate has a negative and insignificant relationship with financial reporting even at 10% level of significant across the models (Probit, Logit and Extreme value regressions). The study therefore recommends that financial managers and accountants should consolidate deferred tax liabilities for the intended purpose because it help to generate more cash flow to the organization for meeting operation activities. The study also suggests that management of quoted firms in Nigeria should employ stringent tax measures to cushion the incidence of cash effective tax rate and income effective tax rate.
Keywords: Financial Reporting, Deferred Taxation, Tax Planning, Logit Regressions.
INTRODUCTIONThe Nigerian tax system has undergone series of reforms and amendments geared towards enhancing tax collection and administration with minimal enforcement cost and high level of tax compliance from tax payers in Nigeria (Adedeji & Oboh, 2012). Ezeoha and Ogamba (2010:5), “argue that the Nigerian tax system has an inherent delinquent that has been a major impediment to economic growth, where tax evasion and avoidance are the means employed by tax payers not to comply with the payment of tax”. Torgler (2007) argues that taxpayers are willing to cooperate with the tax authority will increase, if they sees itself as a service institution and provides a quality service and meets the taxpayers expectation. This shows that taxpayers are willing to cooperate with the tax
34Financial Reporting and Tax Issues in Nigeria
Journal of Taxation and Economic Development ISSN 1118-6017 Vol. 18, (1), March 2019

authority leads to credible financial reporting. The quality of financial reporting has to be maintained in order to ensure good measure of credibility on the information disclosed to the general public of the financial health of the companies at the end of the financial period (Adeyemi, Okpala &Dabor, 2012). Financial reporting credibility is reflected in the confidence of users in audited financial reports (Watkins, Hillison & Morecroft, 2004).
Tax administration is a very crucial and bases for any economic development of many nations and society over a long period of time (Gurama & Mansor, 2015). However, this fundamental and basic source of capacity and economic building is related with various problems which need urgent attention by the stakeholders and policy makers in maintaining quality financial reporting. Muhrtala and Ogundeji (2013:35), “are of the view that factors that influence sharp practices in the tax system include the presence of high tax burden, non-availability of comprehensive tax payers database, lack of accountability for tax revenue, lack of clarity and fairness on taxation powers of government, lack of skilled manpower and inadequate funding, aggressive and unorthodox tax collection methods, non-refund of excess taxes paid by economic agents, non-review of tax legislations guiding the operation of taxes in Nigeria”. In addition, the corruption is paramount among tax officials in a society where there is poor tax policy and weak tax administration. This issue has led to poor financial reporting quality in public and private sector of the Nigerian economy. In order to fill the gap in knowledge, this study tried to find out the tax issues that influence credible financial reporting. The study contributed to the body of knowledge the possible effect of deferred taxation and tax planning on financial reporting in Nigeria.
Objective of the StudyThe broad objective of this study is to examine the relationship between financial reporting quality and tax issues in Nigeria. The specific objective is:(i) to examine the relationship between deferred taxation and financial reporting
quality in Nigeria.(ii) to examine the relationship between tax planning and financial reporting quality in
Nigeria.
LITERATURE REVIEW AND HYPOTHESIS DEVELOPMENTFinancial Reporting QualityThe financial reporting is an important element necessary for corporate governance system to function effectively, that is, it provide quality information about a business entity that is useful to a wide range of users (i.e., Creditors, Shareholders, Financial Institutions, e.t.c) to make economic decisions about their resources (Osisioma & Enahoro, 2006; Appah & Emeh, 2013). According to Ogbaisi, Izedonmi, and Dabor (2016:75), “financial statements is aimed to provide information about the financial position, performance and changes in financial position of an enterprise that is useful to a wide range of users in making economic decisions”. Financial statements should be understandable, relevant, reliable and comparable. The need for credible financial reporting has become imperative due to the increasing exposure of Nigerian business organizations to international capital markets and the adoption of International Financial Reporting Standards (IFRS). Adeyemi (2016) states that IFRS concept is bases on
35Financial Reporting and Tax Issues in Nigeria
Journal of Taxation and Economic Development ISSN 1118-6017 Vol. 18, (1), March 2019

establishing a set of accounting standards issued by the International Accounting Standards Board (IASB) which was established to achieve the objective of developing a single set of high quality globally accepted accounting standards based upon clearly articulated principles. Adzis, Tripe and Dunmore (2012) add that the general overview of International Financial Reporting Standards (IFRS) is to establish a common set of accounting standards to promote the comparability of financial statements around the globe. In addition, the adoption of IFRS was expected to improve the quality of financial reporting, increase the transparency of financial information due to increased disclosure requirements, and increase access to international capital markets.
Tax Issues in NigeriaTaxation has been a concern of global significance as it affects every economy irrespective of national differences. Therefore, an efficient and robust tax system is the cornerstone to attaining the Nigeria's ambition of becoming one of the most rapidly developing economies of the world (Adedeji & Oboh, 2012). Total tax expense reflects the tax expenses over the tax benefits that are attributable to pre-tax book income but that are not reflected in current tax expense of the period (Astrid, 2011). “The purpose of deferred tax accounting is to inform about future tax benefits and future tax liabilities, an analysis of the relation of currently disclosed deferred taxes to actual future tax cash flow is crucial for assessing whether deferred tax accounting actually meets its intended purpose,” (Beechy, 2007:221). Deferred tax accounting is the recognition of the tax consequences of an item reported within the financial statements in the same accounting period as the item itself.
Tax PlanningTax planning is an arrangement of the financial affairs in such a way that without violating in any way the legal provisions, full advantage is taken of all tax exemptions, rebates, allowances and other reliefs or benefits permitted under the Act for improved financial reporting (Taylor, & Richardson, 2014). Hence, “tax planning is seen as the methods employed by a tax payer to reduce the burden of taxes in a legal manner. Avoidance is normally employed to minimize tax liability” (Cowell, 1990b:231). However, avoidance is encouraged by legislation granting favourable tax treatment to specific activities in contrast to general taxation principles. As far as economic function is concerned, however, evasion and avoidance obviously have very strong similarities; sometimes, indeed, they can hardly be distinguished (Cowell, 1990b). “Tax avoidance is a cost benefit to the company becauseplanning of tax costs implies higher cash flows and net income for the firm and residually for its shareholders”(Blouin, 2014:875).
Effective tax rate is used as a measure of tax planning because both effective tax rate and tax savings figures yield the same result since statutory tax rate is constant over the years of the study, Taylor and Richardson (2014:1), “carried out an empirical study on incentives for corporate tax planning and reporting”. The study made use of 200 publicly listed Australian firms for the period of 2006 to 2010 period for the empirical analysis. “The study revealed that reported uncertainty of a firm's tax position, the tax expertise of its directors, and the performance-based remuneration incentives of key management personnel had significantly positively associated with tax avoidance while tax-related affiliation was significantly negatively associated with tax avoidance”.
36Financial Reporting and Tax Issues in Nigeria
Journal of Taxation and Economic Development ISSN 1118-6017 Vol. 18, (1), March 2019

Deferred Tax AssetTax on extraordinary item and prior year adjustment should be deducted or added to the related item and disclosed by way of notes. Deferred tax should be shown separately from the items and disclosed by way of note. Tax should be recognized as expense or income, and included in the profit and loss account of the period, as a separate line item (SAS 19). In addition, the changes in deferred tax assets are based on income tax expense which directly affecting net income; deferred tax assets may be an attractive account to manageearnings. Therefore, “research on recognition of deferred tax assets has primarily focused onwhether discretion in recognition is used for earnings management purposes,” (Christensen, Paik & Stice, 2008: 601). According to Zee, Stotsky and Ley (2002:1497), “investment tax credit as a recognized measured of deferred tax asset in a new manufacturing plant and equipment purchased for first-time use in manufacturing or processing”. Therefore, “the companies earn 10% non-refundable tax credit which can be applied against company income tax in the year earned, with unused credits usually available for either 10-year carry forward or 3-year carry backward”. Gugl and Zodrow (2006:167), “add that investment tax credit as a recognized measured of deferred tax asset is only earned in the year that the property was actually acquired, and only applies to new properties in a company”.
Deferred Tax LiabilityTax consequences of business transactions are recognized in that period when they are recognized by tax authorities, which may be before or after the period when the event itself is recognized in the financial statements. It violates the relationship between accounting income and income tax expense in the income statement and leads to distortions in net profit after tax. Therefore, deferred tax liability is not recognized for the initial recognition of the assets in a transaction that is not a business combination and that affects neither accounting or taxable profit or loss and differences relating to investment in subsidiaries, jointly controlled entities and goodwill to the extent that it is probable that they will not reverse in the foreseeable future (Haskins & Simko, 2011). Meanwhile, deferred tax liability is measured at the tax rates that are expected to be applied to temporary differences when they reverse based on the laws that have been enacted or substantively enacted by the reporting date. A deferred tax liability is the estimated future tax increase related to book income. It is created when an expense is deductible for tax purposes in the current period but is not deductible for book income until some future period, or when revenue is includible for book purposes but not for taxable income until a future period. Therefore, deferred tax liabilities include book-tax depreciation differences (accelerated for tax purposes), installment sales, and undistributed or reinvested foreign earnings (Poterba, Rao & Seidman, 2007). Astrid (2011) argued that the informative value of deferred taxes is only low due to highly uncertain cash flow implications. Meanwhile, the major part of deferred taxes is not expected to be realized in the near future as a consequence of arising from operating and, therefore, periodically recurring activities, which results in an effectively permanent deferral of the associated tax cash flow. In other words, the lack of relevance of deferred tax information is seen as a consequence of lacking cash flow implications would challenge the usefulness of deferred tax accounting in a given reporting entity. Chludek (2011:1), “conducted a study on the impact of deferred tax on firm value”. The study showed that deferred taxes are not significantly related to actual tax cash flow of 67.25 percent of the sample firms. Also, “firms with significant deferred tax information tend to perform poorly based on the average value, less growth (of sales, operating cash flow, and total assets), lower
37Financial Reporting and Tax Issues in Nigeria
Journal of Taxation and Economic Development ISSN 1118-6017 Vol. 18, (1), March 2019

ROA, and significantly less multinational activity (as measured by percent of foreign to total pre-tax income) as compared to the total sample”.
METHODOLOGYThe study employed longitudinal research design in the collection of data. The population of this study consists of all non-financial quoted and non-service firms in Nigeria Stock Exchange for the period of 2012 to 2016. The population is made up of companies whose shares are quoted on the floor of the Nigerian Stock Exchange and must have finished its obligation in delivery annual reports for the year ended 2016. The sampled firms were simple randomly from the following sectors, Agriculture, Breweries, Building/ Materials, Health Care, Industrial and Domestic products, Food/Breverages and Tobacco, Petroleum marketing companies etc. In considering sample size, Saunders, Lewis and Thornhill (2003) suggested that a minimum number of thirty (30) for statistical analyses provide a useful rule of thumb. However, the study used thirty-two (32) sampled non-service firms in the Nigerian Stock Exchange. The estimations were carried out with the aid of E-views version 8.0.
Model Specification and MeasurementIn the light of the above methodology and theoretical framework deduced to adequately capture and empirically analyze the financial reporting and tax issues in Nigeria. A logistic regression econometric model specified in equation (ll) will be employed for model. This assumption is that, the dependent variable is a dummy variable. The model below is adapted from McFadden Logistic Regression Model (1974) as measured in recent prior study (Adeniye & Mieseigha, 2013). It is express as:
FRP = F (DTL, TPL) ……………………………………………………(1)
The binary regressions with error term (et) is express in equation (2)FRP = á + á DTL + á TPL + å ………………………………………….. (2)0 1 2
Where;FRP = Financial reportingTPL = Tax planningDTA = Deferred tax assetå = error term
Dependent VariableFinancial reporting is measured by a dummy variable: “1” Big 4 or otherwise “0”
Independent VariableTax planning is proxy by cash effective tax rate (CTR) and income effective tax rate (ITR) which is measured by corporate income tax expense (excluding deferred tax expense)/ profit before tax) (Kawor & Kportorgbi, 2014).
DATA PRESENTATION AND DISCUSSION OF RESULTSTo study examined the relationship between financial reporting and tax issues in Nigeria. The study employed Correlation Matrix, Logistic Regression; Table 1 shows the correlation matrix result which measures the degree of linear relationship between the given variables for the study. The result of the correlation coefficient revealed that
38Financial Reporting and Tax Issues in Nigeria
Journal of Taxation and Economic Development ISSN 1118-6017 Vol. 18, (1), March 2019

deferred tax liability (DTL) was positive and moderately correlated with financial reporting (FRP =0.2191). Tax planning (TPL) measured by cash effective tax rate (CTR) was negative and weakly correlated with financial reporting (FRP =-0.1063). Also, tax planning (TPL) measured by income effective tax rate (ITR) was negative and weakly correlated with financial reporting (FRP =-0.0035). This means that there is the absence of multicolinearity problem in our model. Multicollinearity between explanatory variables may result to wrong signs or implausible magnitudes, in the estimated model coefficients, and the bias of the standard errors of the coefficients. The correlation result is presented in table 1 below;
Table 1: Correlations Result
Source: Author’s Computation (2018)
The study employed Logistic regression techniques to examine the relationship between the financial reporting and tax issues and to test the formulated hypotheses. The regression results obtained were presented in table 2 below.
Table 2: Logistic Regression Results PROBIT LOGIT EXTREME VALUE
C 0.19 0.24 0.53 (0.10) (0.77) (2.25) [0.30] [0.44] [0.02]**
DTL 9.48 1.88 1.76 (2.55) (2.37) (2.33) [0.01]* [0.01]* [0.01]*
CTR 0.007 0.01 0.009 (1.61) (1.55) (0.60) [0.11] [0.11] [0.11]
ITR -0.0008 -0.001 -0.001 (-0.62) (-0.75) (-0.82) [0.52] [0.44] [0.41] ____________________________________________________________________McFaden R2 0.096648 0.099873 0.101768LR statistic 14.81 15.31 15.60 Prob (LR-Stat) 0.001981 0.001569 0.001369 Note: (1) Parentheses ( ) are z-statistic while bracket [ ] are p-values (2) *, and ** were, 1% and 5% level of significance respectively.
39Financial Reporting and Tax Issues in Nigeria
Journal of Taxation and Economic Development ISSN 1118-6017 Vol. 18, (1), March 2019
Variable FRP DTL CTR ITR
FRP 1 DTL 0.2191 1 CRR -0.1063 -0.0013 1 ITR -0.0035 -0.0027 0.1220 1

It would be revealed from the above that the study employed a dummy measure for the dependent variables to proxy financial reporting. The Logistic regression showed that the McFadden R2 value Probit regression (0.096648), Logit regression (0.099873) and Extreme value regression (0.101768) and its associated probability values of 0.001 across the models showed about 10% of the chances in variation of financial reporting (FRP) was jointly explained by the independent variables (deferred taxation, and tax planning). Therefore, that the model on overall is statistically significant. The LR-statistic value of 14.81, 15.31 and 15.60 showed that the model on overall was statistically significant. This means that there exists a significant linear relationship between the dependent variable and the independent variables.
Following the results in the table above, deferred taxation (DTL) had a positive and a significant relationship with financial reporting (FRP) at 1% level of significant across the models (Probit, Logit and Extreme value regressions). This means that presence of quality financial reporting has the tendency of increasing deferred taxation in the Balance Sheet of the companies. Tax planning measured by cash effective tax rate (CTR) has a positive and insignificant relationship with financial reporting (FRP) even at 10% level of significant across the models (Probit, Logit and Extreme value regressions). This means that presence of quality financial reporting has the tendency of increasing tax planning issues but was statistically insignificant. More so, Tax planning measured by income effective tax rate (ITR) has a negative and insignificant relationship with financial reporting (FRP) even at 10% level of significant across the models (Probit, Logit and Extreme value regressions). This means that presence of quality financial reporting has the tendency of decreasing tax planning issues but was statistically insignificant.
CONCLUSION AND RECOMMENDATIONS Tax system is one of the most effective means of mobilizing resources for any given country and creating an environment conducive to the promotion of business organizations that would enhance economic growth. Taxation might change the ranking of different alternatives, i.e. it is relevant for decision-making. Business managers might increase post-tax performance by considering different levels of taxation on different decision alternatives for improve financial reporting quality. The study therefore recommends that:
(i) Financial managers and accountants should consolidate deferred tax liabilities for the intended purpose because it helps to generate more cash flow to the organization for meeting operation activities.
(ii) The study also suggests that management of quoted firms in Nigeria should employ stringent tax measures to cushion the incidence of cash effective tax rate and income effective tax rate.
40Financial Reporting and Tax Issues in Nigeria
Journal of Taxation and Economic Development ISSN 1118-6017 Vol. 18, (1), March 2019

REFERENCES
Adedeji, T. O & Oboh, C.S. (2012). An empirical analysis of tax leakages and economic
41Financial Reporting and Tax Issues in Nigeria
Journal of Taxation and Economic Development ISSN 1118-6017 Vol. 18, (1), March 2019

42Financial Reporting and Tax Issues in Nigeria
Journal of Taxation and Economic Development ISSN 1118-6017 Vol. 18, (1), March 2019

APPENDIX: RESULTS
CORRELATION MATRIX
Dependent Variable: FRPMethod: ML - Binary Probit (Quadratic hill climbing)Date: 06/19/18 Time: 10:18Sample: 1 134Included observations: 133Convergence achieved after 10 iterationsCovariance matrix computed using second derivatives
43Financial Reporting and Tax Issues in Nigeria
Journal of Taxation and Economic Development ISSN 1118-6017 Vol. 18, (1), March 2019
FRP DTL CTR ITR FRP 1.000000 0.219183 0.106380 -0.003595 DTL 0.219183 1.000000 -0.001356 -0.002794 CTR 0.106380 -0.001356 1.000000 0.122068 ITR -0.003595 -0.002794 0.122068 1.000000
Variable Coefficient Std. Error z-Statistic Prob. C 0.190355 0.185418 1.026625 0.3046
DTL 9.48E-08 3.71E-08 2.557221 0.0106 CTR 0.007461 0.004632 1.610862 0.1072 ITR -0.000834 0.001324 -0.629836 0.5288
McFadden R-squared 0.096646 Mean dependent var 0.736842
S.D. dependent var 0.442012 S.E. of regression 0.423670 Akaike info criterion 1.101418 Sum squared resid 23.15501 Schwarz criterion 1.188346 Log likelihood -69.24431 Hannan-Quinn criter. 1.136742 Deviance 138.4886 Restr. deviance 153.3049 Restr. log likelihood -76.65244 LR statistic 14.81625 Avg. log likelihood -0.520634 Prob(LR statistic) 0.001981
Obs with Dep=0 35 Total obs 133
Obs with Dep=1 98

Dependent Variable: FRPMethod: ML - Binary Logit (Quadratic hill climbing)Date: 06/19/18 Time: 10:19Sample: 1 134Included observations: 133Convergence achieved after 10 iterationsCovariance matrix computed using second derivatives
Dependent Variable: FRPMethod: ML - Binary Extreme Value (Quadratic hill climbing)Date: 06/19/18 Time: 10:19Sample: 1 134Included observations: 133Convergence achieved after 9 iterationsCovariance matrix computed using second derivatives
44Financial Reporting and Tax Issues in Nigeria
Journal of Taxation and Economic Development ISSN 1118-6017 Vol. 18, (1), March 2019
Variable Coefficient Std. Error z-Statistic Prob. C 0.243071 0.315310 0.770896 0.4408
DTL 1.88E-07 7.93E-08 2.375709 0.0175 CTR 0.013110 0.008421 1.556755 0.1195 ITR -0.001660 0.002194 -0.756658 0.4493
McFadden R-squared 0.099877 Mean dependent var 0.736842
S.D. dependent var 0.442012 S.E. of regression 0.421999 Akaike info criterion 1.097694 Sum squared resid 22.97276 Schwarz criterion 1.184622 Log likelihood -68.99666 Hannan-Quinn criter. 1.133018 Deviance 137.9933 Restr. deviance 153.3049 Restr. log likelihood -76.65244 LR statistic 15.31156 Avg. log likelihood -0.518772 Prob(LR statistic) 0.001569
Obs with Dep=0 35 Total obs 133
Obs with Dep=1 98
Variable Coefficient Std. Error z-Statistic Prob. C 0.531832 0.235393 2.259333 0.0239
DTL 1.76E-07 7.54E-08 2.334940 0.0195 CTR 0.009941 0.006188 1.606500 0.1082 ITR -0.001437 0.001745 -0.823514 0.4102
McFadden R-squared 0.101768 Mean dependent var 0.736842
S.D. dependent var 0.442012 S.E. of regression 0.421207 Akaike info criterion 1.095514 Sum squared resid 22.88655 Schwarz criterion 1.182442 Log likelihood -68.85168 Hannan-Quinn criter. 1.130838 Deviance 137.7034 Restr. deviance 153.3049 Restr. log likelihood -76.65244 LR statistic 15.60151 Avg. log likelihood -0.517682 Prob(LR statistic) 0.001369
Obs with Dep=0 35 Total obs 133
Obs with Dep=1 98

ISSUES IN FINANCIAL REPORTING LAG
Sadiq Oshoke AkhorBursary Department,
College of Education, Igueben, Benin City, Nigeria08025912721; [email protected]
Leslie Eyesan DaborDepartment of Accounting,
Faculty of Management Sciences,University of Benin, Benin City, Nigeria
and
Chinwuba Ambrose OkaforDepartment of Accounting,
Faculty of Management Sciences,University of Benin, Benin City, Nigeria
AbstractThis paper examines the issues in financial reporting lag. It specifically attempts a critique on some important conceptual and practical issues that are worth pondering about when assessing the concept of financial reporting lag. Particularly, the paper identified and discussed four (4) of such issues which include: regulatory issues, external auditor-related issues, issues regarding early/late disclosure of 'good' or 'bad' news; and issues relating to the conceptualisation and measurement of financial reporting lag. As part of its critical evaluation, the paper disputes the existing pattern of definition and measurement of financial reporting lag and equally proposed a similar, but strikingly different approach to its conceptualisation and measurement. After the discussions of all other issues, the paper took its position by conjecturing that financial reporting lag is entirely inevitable, but can be avoided. By way of policy implication, the paper supports the idea of accelerated financial reporting proposals by some advanced countries in order to reduce financial reporting lag, in as much as the reliability of the reports are not traded-off as a result. The paper opens up two possible avenues for further studies; firstly by testing the new proposed measurement of financial reporting lags; and secondly by examining the implication of implementing an accelerated financial reporting framework in a developing market like Nigeria.
Keywords: Financial reporting lag, Regulatory, External auditor, Good/bad news, Measurement issues.
INTRODUCTIONStudies on financial reporting lag have received quite a handful of attention from researchers in the field of accounting and auditing. So also is the regulatory and stakeholders concern on the need for timely disclosure of financial information among listed companies. However, the issues and arguments surrounding the delays in corporate financial reporting have continued to resurface and taking newer dimensions
45Issues in Financial Reporting Lag
Journal of Taxation and Economic Development ISSN 1118-6017 Vol. 18, (1), March 2019

in academic research. Several school of thoughts (Fodio, Oba, Olukoju, & Zik-rullahi, 2015; Iyoha, 2012; Luypaert, Caneghem & Uytbergen, 2016) argue that, other things being equal, prompt financial reporting presentation by listed companies is possible if stringent deterrent measures are strictly enforced, while others (e.g. Oladipupo & Izedonmi, 2009) argue that financial reporting delay is all-in-all inevitable. Also, some researchers such as Abernathy, Kubick and Masli (2018) argue that financial reporting lag is a function of management discretion, others attribute it to delays caused by the external auditors (Hoang, Dang & Nguyen, 2018). There are also some recent group of studies (Ahmad, Yunos & Yunos, 2018; Ghafran & Yasmin, 2018; Hoang et al, 2018; Lestari & Nuryatno, 2018) that showed evidence that financial reporting lags are largely determined by company-related attributes and corporate governance structure. The differing contending views continues.
A careful examination of the extant literature has raised some thought-provoking issues that require careful evaluations in order to understand whether delays in companies' financial reporting can be classified as completely unavoidable or not. First among the issues is the differing regulatory requirement by different nations and the perceived lack of effective penalties for defaulting companies. As a result, most companies may leverage on the slack regulatory enforcements and systematically delay the release of financial information for unspecified reasons. Another issue is that relating to the external auditors - because a company may not publish its financial statement without it being certified by an independent auditor (Ohaka & Akani, 2017). The third is the issue relating to the management strategic disclosure policies, where (as posited by Al-Daoud, Ismail, & Lode, 2015; Lehtinen, 2013) the uncertainty of markets' reaction to companies 'good' or 'bad news' may push the management into engaging in smoothening of the accounting numbers prior to presentation, thereby causing a systematic delay. Research-wise, there is also the fourth issue concerning the conceptualisation and measurement of financial reporting lag which, if reconciled, may provide a new dimension to financial reporting lag evaluation.
In all, the paper attempts to critique the above four (4) identified issues in a bid to broadening their existing understanding in respect to financial reporting lag. At the end of the study, the researcher took a position on the two contending ideas as to whether or not financial reporting lag can be tagged as “avoidable” or “inevitable”. Aside this introductory part, the remaining part of the paper is divided into five (5) more sections. Section two looks at the regulatory issues and how it relates to financial reporting lag, the third section dissects the issues relating to the external auditors' in respect to financial reporting lag. In section four, the paper looks at the issues surrounding firms' disclosure of “good news” or “bad news” in relation to financial reporting lag. The fifth section presents a critique of the conceptualisation and measurement of financial reporting lag. The paper finally took its position and concludes in the sixth section.
Regulatory IssuesRegulatory bodies can be described as constituted public agencies that are mandated to supervise, guide and exercise autonomous control over the activities of various industry sectors (be they financial or non-financial) in the interests of all stakeholders. The essence of regulation in the context of financial information disclosure is to promote
46Issues in Financial Reporting Lag
Journal of Taxation and Economic Development ISSN 1118-6017 Vol. 18, (1), March 2019

timely accessibility of the annual financial statements of companies by the public. When and if the financial information is not made available on time, its value to the intended users (especially potential investors and creditors) would have been grossly plummeted (Okaka & Akani, 2017). Taking cognisance of the importance of timely release of financial information, regulatory bodies of different nations usually stipulate maximum time limits by which companies are expected to issue-out audited financial reports to the stakeholders. In Nigeria for instance, there are multiplicity of regulatory agencies such as the Financial Reporting Council of Nigeria (FRCN), Securities and Exchange Commission (SEC), Corporate Affairs Commission (CAC), Nigerian Stock Exchange (NSE), Central Bank of Nigeria (CBN) via Banks and Other Financial Institutions Act (BOFIA) 2003, Companies and Allied Matters Act (CAMA) 2004, among others. Both financial and non-financial companies have differing regulations and requirements as regards the timeliness of financial reporting in Nigeria (see Table 1).
However, while the financial information needs of stakeholders and their demand for its prompt availability remain same in virtually all climes, the allowable disclosure time limit largely depends on the country in question. Investors in developed countries appear more advantaged due to the availability of other non-financial statement sources such as media releases, news conferences and financial analysts' forecasts which usually gives investors a glimpse of what to expect. Emerging economies, on the other hand, are often characterised by ineffective regulations and capital markets, as well as lack of alternative non-financial statement sources such as financial analysts' forecasts (Karim, Ahmed & Islam, 2006). Thus, the provision of timely financial information assumes greater importance particularly in emerging and developing economies (Iyoha, 2012).
Other things being equal, companies are required to strictly comply with the statutory requirements set by the relevant regulatory authorities with regards to timeliness of annual financial reporting; however, not every company complies with the disclosure regulations and this has being a cause of concern. Luypaert et al (2016) argue that timeliness of financial reporting may not be achieved if penalties and sanctions are not meted on defaulters, irrespective of the severity of such provision. To act as deterrents, several countries impose some sort of sanctions and penalties on public listed companies that violate the rules concerning the timing of financial information disclosures. However, not all the sanctions are strictly implemented especially in most developing countries as (Luypaert et al, 2016).
Table 1 below shows: i) some countries' permissible time limits within which public companies are required to issue their audited financial statements, ii) the prescribed sanctions/penalties for would-be defaulters; and iii) the effectiveness of the sanctions based on the corresponding referenced studies.
47Issues in Financial Reporting Lag
Journal of Taxation and Economic Development ISSN 1118-6017 Vol. 18, (1), March 2019

Table 1: Financial Reporting disclosure time limits of some countries with corresponding defaulters’ penalties:
Source: Researcher’s compilation (2018) *Ns: not stated in our source
As observed from Table 1, the least allowable time limit for financial statement presentation among the countries in the log is two (2) months. Another observable issue is that countries like United States and Malaysia streamlined their previously allowable reporting time limit in order to reflect the current two (2) months filing deadlines. This action supports the position of Azubike and Aggreh (2014) which observed that the time lag prescribed by most regulatory bodies are usually too long, thereby encouraging companies to engage in the act of delaying their financial statements. However, if the argument of Ettredge, Li and Sun (2006) and Fodio et al (2015) that the adoption of new regulations (such as the Sarbanes-Oxley Act and IFRS) has further extended the inevitability of reporting delays due to greater audit works required – can be considered a valid argument, then there is tendency that enforcing an accelerated financial reporting filing deadline may raise another concern about the quality and accuracy of the reports since auditors will have less time to audit financial statements.
48Issues in Financial Reporting Lag
Journal of Taxation and Economic Development ISSN 1118-6017 Vol. 18, (1), March 2019
Country Allowable time limit after
company’s year-end (for
yearly reports).
Administrative
sanction(s)/Penalties
Effectiveness of
Sanction(s)
Source(s)
Malaysia Four (4) months (120 days).
Recently proposed its
reduction to two (2) months
(i.e. 60 days)
A reprimand or a fine
of up to RM 1 million
($4,000) or both.
Effective Ahmad, Yunos &
Yunos (2018);
Hashim & Rahman
(2011)
United
States
Initially 90 days (3 months),
changed to 75 in 2003, then
to 60 days (2 months) as
from 2007.
Loss of SEC
registration, exchange
delisting, and other
legal consequences.
Highly Effective Amy (2015); Hashim
& Rahman (2011);
Sherrill & Yerkes
(2018)
Bangladeshi 120 days (4 months) as from
year 2000.
Defaulters are fined
Tk 5,000 (NZ$110)
Karim, Ahmed &
Islam (2006)
Nigeria SEC and CAC =90days;
CAMA,2004 = 120 days &
180 days; BOFIA,2003 =
120days (for
banks);Insurance Act,2003 =
180 days (for Insurance
companies)
Late submission
attract a fine of N100,
000($300) per week
from due date to the
date of eventual
submission.
Effective (but not
strictly enforced)
Adebayo & Adebiyi
(2016); Iyoha (2012)
Belgium Seven (7) months (210 days) Ranges from 400 EUR
up to 1,200 EUR
Highly effective
after eight (8)
months of delay
Luypaert, Caneghem
& Uytbergen (2016)
Jordan Within three (3) months of
the end of the fiscal year.
Not less than 100,000
Dinars as penalty.
Highly effective AL-Tahat (2015)
Turkey Within 10 weeks of year end
(where there is no obligation
to prepare consolidated
financial statements) and 14
weeks (where there is)
*Ns
*Ns
Vuran and Adiloglu
(2013)

Some group of researchers (such as Abernathy, Barnes, Stefaniak & Weisbarth, 2017; Blankley, Hurtt & MacGregor, 2014; Bryant-Kutcher, Peng & Weber, 2013) have already raised such concerns claiming that hastening the financial reporting preparation process may impair the precision of such report due to the shortened deadline. Asides that, it may also harbour some severe costs implications on the firm as audit fees may increase due to short period required to whine-up the entire auditing process, as firms may also require additional staff or an upgraded accounting system in order to produce reports in the shortest possible time. In the same vein, the different internal and external bodies that are required to review and scrutinize the reports prior to filling with relevant authorities (such as the audit committee, board of directors, external auditors, etc) would have less time to perfect the review; this may either increase the chances of errors or reduce the extent of disclosure. Whatever be the case, the managers of companies (to a large extent) have the opportunity (uses discretion) to decide the timing of their earnings releases irrespective of the date of completion of the audit (Lee & Son, 2009). There are also some legal provisions for time extensions of reporting deadlines in different countries which most companies usually exploit when delay becomes inevitable, either for company’s strategic intents or when it is regulatory-imposed. For example, two prominent listed Nigerian companies (Oando Plc and First Bank Holdings) recently made a publication (as reported in The Nation, March, 6th 2018) indicating their resolve to delay their 2017 financial reports owing to regulatory impediments (Salako, 2018). Thus, the assumption that regulatory issues are paramount when discussing financial reporting lag cannot be debated.
From the foregoing, it looks probable that one of the ways by which the accelerated reporting can be feasible is by commencing the audit exercise even before the financial year-end approaches, especially if the company prepares periodic reports within the course of the business year (e.g monthly, quarterly or half-year reports). However, such possibility can be neutralized when and if the parent company has numerous subsidiaries in diverse sectors, which may require that each subsidiary satisfies certain regulatory requirements before the group can collate and present a consolidated report.
External Auditors’- Related IssuesAs statutorily required by the regulatory bodies of different countries, the financial statement of a company must be independently verified by a certified external auditor before it can be released to the public (Abernathy et al, 2018). This is done through the issuance of an audit report which is expected to lend credence to the financial figures claimed by the management. There are several audit firms in Nigeria. However, four (4) among them (i.e. KPMG Professional Services, Akintola Williams Deloitte, Price Water house Coopers and Ernst & Young) are classified as the Big four (Big4) audit firms. At the end of any financial year, companies are required to either engage the services of a particular audit firm of their choice or retain the services of the existing one via the recommendations of the audit committee and approval of the board. In order for the auditor to give an opinion that represents the true picture of the company’s operation, they require time to perfect the audit processes and that contributes to how timely a company presents its reports.
In that regards, most previous studies (e.g. Abernathy, Barnes, Stefaniak & Weisbarth, 2017) have shown evidence that audit delay is a major determinant of financial reporting
49Issues in Financial Reporting Lag
Journal of Taxation and Economic Development ISSN 1118-6017 Vol. 18, (1), March 2019

lag. Thus, issues relating to external auditors cannot be overlooked when financial reporting lag is being discussed. This is because, whether or not the company timely presents its annual financial report to stakeholders is largely dependent on the completion of the auditing process by the external auditor. Several issues emanate from the above submissions; this paper focuses on the issue pertaining to the “busy season effect”.
Most previous researchers, such as Hashim and Rahman (2011), claim that audit delay will most likely be greater during the busy season. Practically, this appears most probable especially in countries where companies adopt same financial year-end. For example, the most common year-end for all companies listed on the Nigerian Stock Exchange is 31st December (peak season), thus there is possibility that most audit firms will be busily engaged during such periods. Therefore, the tendency that the audit process might take longer time becomes highly imminent especially for companies with contentious tax issues and those audited by audit firms with less experienced audit staffs. Also, findings in most previous studies (e.g. Ilaboya & Iyafekhe, 2014) have shown that over seventy percent (70%) of Nigerian listed companies engage the services of the Big4 audit firms. This is an indication that the audit firms may experience heightened workload, job saturation, scheduling problems and shortage of work force in ‘busy seasons’ - especially if the auditee has multiple complexities (Lopez & Peters, 2011).
However, there are also other contesting views to the busy season effect. For example Lopez and Peters (2011) argues that more local audit resources are usually available during the busy season which tends to neutralize the effect of the increased workload. Thus, bigger audit firms can handle such peak periods by increased overtime or more audit staffs, and consequently, a smaller audit report lag becomes feasible. In both divides, the argument of Hashim and Rahman (2011) appears to be the Nigerian situation - where, for example, all the listed deposit money banks in the aftermath of the adoption of IFRS in 2012 (till date) have engaged the services of the Big4 audit firms, and majority could still not meet the submission deadline. Evidence from most previous studies (e.g Adebayo & Adebiyi, 2016; Akhor & Oseghale, 2017; Efobi & Okougbo, 2014; Fodio, Oba, Olukoju, & Zik-rullahi, 2015; Iyoha, 2012) showed that the financial sector in Nigeria (between 2010 to 2015) have the following average reporting lag: 94 days, 94 days, 124 days, 96 days and 161 days respectively. Even though those that reported within a week after the deadline may not be adjudged to have delayed much - considering that there are provisions for short extensions after the elapse of the disclosure date especially due to unavoidable logistical issues such as Annual General Meeting (AGM) scheduling.
Issues regarding early or late disclosure of either “good news” or “bad news”The issues of concern here entail the level of company performance (whether ‘good’ or ‘bad’ news) as well as the uncertainty of market reactions to early or late disclosure of such information. The management (as agents) has the mandate of running the day-to-day affairs of the company on behalf of the owners, while the owners (as principals) are more concerned about profit maximization. However, a firm will either make a profit (good news) or a loss (bad news) at any given financial year, and management are required to report how well they have fared to the shareholders as part of their stewardship function. The managements’ sincerity and incentives to produce annual
50Issues in Financial Reporting Lag
Journal of Taxation and Economic Development ISSN 1118-6017 Vol. 18, (1), March 2019

reports on time plays a key role in this regards. And since investors and creditors (both potential and existing) are more likely to be attracted to highly profitable firms than the underperforming ones, firms bearing ‘good news’ are considered more positioned to promptly disclose their earnings to stakeholders in anticipation of the underlying signaling effect. On the other hand, companies that made losses (bearing bad news) may be more reluctant to quickly make disclose their earnings due to the perceived implicational discomfort on stakeholders (Askari & Moradpour, 2016). For example, Karim et al (2006) reported that Bangladesh companies are hesitant in scheduling the Annual General Meetings (AGM) of shareholders in years they performed poorly and/or in years where there are low or no prospects of dividend announcement. These assumptions begot the ‘good news early, bad news late’ hypothesis as used in most previous studies (see Kieruj, 2013).
From the foregoing, it looks clear that theoretically, timely financial reporting disclosure is concomitant with profitable (good news) firms, while the reverse becomes the case when the performance indices appear unfavorable. The basic assumption here, based on the submissions of Dao and Pham (2014), is that investors perceive firms releasing financial reports later than expected to be a signal of poor performance and as such, receive negative abnormal returns. Further, companies with ‘bad news’ are usually more cautious and uncertain of markets reactions; hence tend to delay the auditing process especially when the loss could lead to a default situation. Thus, the timing of earnings releases is of high significance since markets’ reactions are created by the announcements of financial releases. In practice however, these positions can only continue to hold when the accounting numbers are not tailored because managers and executives routinely encounter strong incentives to strategically alter the financial figures using permissible accounting techniques in order to achieve a pre-defined goal (Sherman & Young, 2016). In 2014 for example, an online internet giant, Twitter, reported a profit per share of $0.34 using one accounting measure, but a loss of $0.96 using another technique. This goes to show that it may even be more calamitous to make long-term business decisions relying solely on the firms’ quick declaration of profitable accounting numbers, than to receive a late and more reliable financial report. This sounds arguable though!
In essence, not all financial reporting delays can be a signal of poor performance or bad news. This is because, some management of highly profitable companies may strategically choose to save for the rainy days, and thereby can take some time to smoothen the accounting numbers which may end up delaying the entire auditing process. Lehtinen (2013) argue that the managers might manipulate the timing of earnings releases since they know that influencing the less informed stakeholders can probably be beneficial to the company. If that should be the case, then the delay in the timing of financial reports may no longer be adjudged to be as a result of poor performance or bad news announcement, rather as a strategic intent. Whatever be the case, the financial statement ought to unveil the underlying economic truth of a business – in order for it to fulfill its intended social and economic functions. In an event that they deviate from the true position of the company, the scarce resources will continue to be misallocated and wealth will be misplace or wrongly invested.
51Issues in Financial Reporting Lag
Journal of Taxation and Economic Development ISSN 1118-6017 Vol. 18, (1), March 2019

Issues with the conceptualisation and measurement of financial reporting lagIn literature, financial reporting lag is generally defined as “as the number of days between a firm’s fiscal year-end and the earnings announcement date” (Abernathy et al, 2018, p.5) or as Hoang et al (2018, p.295) put it “the number of days from the date of the statement of financial position in accordance with the law to the date of publication of the audited financial reports”. Several other researchers have equally given similar definitions. For example, Al-Daoud et al (2014, p.191) described reporting lag as “the period between the end of the financial reporting period and the date the financial reports are issued, or the date of the submission of the reports to the regulatory bodies” while Arif, Marshall, Schroeder and Yohn (2016) referred to it as the interval of days between the company’s fiscal year-end and the release date of annual financial statement. In all these definitions, the observable conjoining ideology is that the financial reporting lag starts to count beginning from the last day of the financial year-end to whenever the company holds its Annual General Meeting (AGM) – because the AGM marks the day the report is officially released/presented to the shareholders and the public at large.
On the other hand, there are equally other concepts (such as audit report lag and timeliness of financial reporting) that are closely intertwined with financial reporting lag, and which are oftentimes conceptualised interchangeably in literature. For example, while audit report lag has been defined as the duration of completing the audit of annual financial statements, measured as the number of days between a firm’s fiscal year-end and the audit report date (Ghafran & Yasmin, 2018; Lestari & Nuryatno, 2018); ‘timeliness’ on the other hand represents the allowable number of days between the end of the accounting year and the day that listed companies must publish financial reports in accordance with the law (Hoang et al, 2018). Even as the above two definitions appears to capture that which they represent, that of the former has received some criticisms in recent studies. For example, Imeny (2017) argues that the use of the number of calendar days from fiscal year end to the auditor reports date, as measure of audit report lag, is out of order because the audit process usually commence even before fiscal year-end by audit planning and it continues after the issuance of audit report. Quite arguable as Imeny’s argument may appear, this paper focuses on the conceptualisation and measurement of the more encompassing ‘financial (total) reporting lag’ which this researcher argues is wrongly conceptualised or can be viewed differently.
To buttress our view on the conceptualization and measurement of ‘financial reporting lag’, a look at the Merriam-Webster Dictionary interprets the definition of “Lag” as the ‘failure to keep-up with a specified pace (time)’. Thus, considering that each individual nation or regulatory body have distinctive allowable time limits (usually in days, weeks or months) by which a listed company is expected to present its audited annual reports, the “lag” therein ought to commence after the legally “specified” allowable time has elapsed. In other words, the counting and measurement of financial reporting lag should commence after the company has exhausted the legally specified deadline (see mathematical example below).
FRL = DOP – ARSWhere:FRL = Financial reporting lagDOP = Date of publication of the audited financial reportsARS = Allowable regulatory specified time (i.e. Financial year-end date to allowable deadline date)
52Issues in Financial Reporting Lag
Journal of Taxation and Economic Development ISSN 1118-6017 Vol. 18, (1), March 2019

The reasoning behind this argument is that if we choose to measure financial reporting lag by counting from the last day of the financial year-end to the day a company issues its audited reports, it implies that we expect the company to have completed both the drafting and auditing of the financial reports as at the last day of the accounting year-end – which in practice will be an uphill task. Thus, a company may not be adjudged to have delayed in presenting its audited reports if it is issued within the allowable time-frame (timeliness) specified by the regulatory body. In that situation, there can no longer be a ‘lag’. Vuran and Adiloglu (2013, p.61) gave a definition of financial reporting lag that closely captures the tenets of our above mathematical expression. They described it “as the number of days between publication date of financial statements and the last date for publication of financial statements which is determined by the regulatory body”. For the purpose of this paper therefore, financial reporting lag can be defined as the number of days (either in surplus or in deficit) it takes a company to presents its financial report before or after the legally ‘specified’ allowable time limit under a particular regulation. In order words, it can be seen as the difference in the period (usually in days) from the deadline date allowed by the law to the date of publication of the audited financial statements.
Flowing from the dimension of the above definition, there may be a solvable problem with measurement. For instance, if peradventure a company publishes its financial reports earlier than (before) the legally required time, what will be the implication in terms of the quantitative measurement? This question arises because, based on the existing measurement that this paper critiques, there must be a surplus (in days or months) from the financial year-end by which any company can be able to complete the financial reporting process and file with the relevant bodies. Thus, the calculation of the lag in that regards must be in surplus – i.e. after a particular accounting year has ended. However, considering the concept behind this our proposed definition, the quantitative measures must go either in the direction of a surplus or in deficit. The former (surplus i.e. positive sign) will represent a situation when a company presents its reports even before the required deadline date, while the latter (deficit i.e. negative sign) represents those that exceeded the allowable date.
In practicalising the above scenario, take for instance a country like Nigeria where the accounting year-end of listed countries is 31st December, and BOFIA requires that listed Deposit Money Banks (DMBs) issue their yearly audited financial report within 90 days (3 months) after the end of the accounting period of a particular year (for example 2017). The implication is that by March 31st 2018, all the listed DMBs are expected to have issued their audited financial reports. Going by our conceptualization, if a particular DMB issue its audited yearly financial report on March 15th 2018, it is assumed that the “lag” has not commenced because the allowable time-limit has not elapsed. Hence, we can assume that the bank issued her reports at a surplus of 15days (meaning the quantitative data measure will bear a positive value of 15). On the other hand, let’s assume another DMB issued theirs on April 21st 2018, then it has exceeded the permissible time limit, therefore the ‘lag’ has set in. In this situation, going by our definition, we can assume that the bank has issued her report at a deficit of 21 days (meaning the calculation of the quantitative data measure will bear a negative value of -21), and so on using same metrics in other years.
53Issues in Financial Reporting Lag
Journal of Taxation and Economic Development ISSN 1118-6017 Vol. 18, (1), March 2019

There is also another angle to the conceptualization and measurement of financial reporting lag, as observed from Vuran and Adiloglu (2013), where numeric values are
54Issues in Financial Reporting Lag
Journal of Taxation and Economic Development ISSN 1118-6017 Vol. 18, (1), March 2019
Categories Timeliness of issuing audited reports
Classification(s) Suggested Lag Coding based on
severity
Category 1 0 – 3 days earlier Just-in-time reporting group 1
Category 2 Two weeks earlier than the
deadline
Early reporting group 2
Category 3 = One month before the
stipulated time limit
Earliest reporting group 3
Category 4 Less than a week after the
deadline
Conditionally-late reporting
group
-3
Category 5 = One month after the deadline Late reporting group -2
Category 6 Up to or more than three months
after the deadline
Arbitrary late reporters -1
£
³

55Issues in Financial Reporting Lag
Journal of Taxation and Economic Development ISSN 1118-6017 Vol. 18, (1), March 2019

REFERENCES
Abernathy, J.L., Barnes, M., Stefaniak, C., & Weisbarth, A. (2017). An international perspective on audit report lag: a synthesis of the literature and opportunities for future research. International Journal of Auditing, 2(1), 100-127.
Abernathy, J.L., Kubick, T.R., Masli, A. (2018). Evidence on the relation between managerial ability and financial reporting timeliness. International Journal of Auditing, 3(2), 1–12.
Adebayo, P.A., & Adebiyi, W.K. (2016). Effect of firm characteristics on the timeliness of corporate financial reporting: evidence from Nigerian deposit money banks. International Journal of Economics, Commerce and Management, 4(3), 369-381.
Adeyemo, K.A., Isiavwe, D., Adetiloye, K.A., & Eriabie, S. (2011). Financial reports and shareholders decision making in Nigeria: any connectedness? The Journal of Internet Banking and Commerce, 1(3), 14-28.
Ahmad, S.A., Yunos, S.M., & Yunos, R.M. (2018). Timeliness of financial reporting in the Shariah-compliant companies: effects of audit committee's and firms' characteristics. Insight Journal, 1(1), 49-59.
Ahmed, M.I., & Che-Ahmad, A. (2016). Effects of corporate governance characteristics on audit report lags. International Journal of Economics and Financial Issues, 6(S7), 159-164.
Akhor, S.O., & Oseghale, E.O. (2017). An empirical investigation of audit committee attributes and financial reporting lag in Nigeria Banking Sector. Journal of Accounting and Financial Management, 3(2), 25-38.
Al-Ajmi, J. (2008). Audit and reporting delays: Evidence from an emerging market. Advances in Accounting, 24(1), 217–226.
Al-Daoud, K. A., Ismail, K., & Lode, N. A. (2014). The timeliness of financial reporting among Jordanian companies: Do company and board characteristics, and audit opinion matter? Asian Social Science, 10(13), 191-201.
Al-Daoud, K. A., Ismail, K., & Lode, N. A. (2015). The impact of internal corporate governance on the timeliness of financial reports of Jordanian Firms: Evidence using audit and management report lags. Mediterranean Journal of Social Sciences, 6(1), 430-442.
Al-Tahat, S.S.Y. (2015). Company attributes and the timeliness of interim financial reporting in Jordan. International Journal of Application or Innovation in Engineering and Management, 4(3), 6-16.
Arif, S., Marshall, N.T., Schroeder, J.H., & Yohn, T.L. (2016). The influence of mandatory disclosure regulation on voluntary disclosure: Financial reporting timeliness and the rise of concurrent earnings announcements. Paper presented at 27th Annual Conference on Financial Economics and Accounting (CFEA).
Ashton, R.H., Graul, P.R. & Newton, J.D. (1989). Audit delay and the timeliness of corporate reporting. Contemporary Accounting Research, 5(2), 657-673.
56Issues in Financial Reporting Lag
Journal of Taxation and Economic Development ISSN 1118-6017 Vol. 18, (1), March 2019

Askari, R., & Moradpour, S. (2016). The relationship between auditor characteristics and its impact on the audit report on companies listed in the Tehran Stock Exchange. International journal of humanities and cultural studies, 3(1), 177-190.
Azubike, J.U.B., & Aggreh, M. (2014). Corporate governance and audit delay in Nigerian quoted companies. European Journal of Accounting Auditing and Finance Research, 2(10), 22-33.
Dao, M., & Pham, T. (2014). Audit tenure, auditor specialization and audit report lag. Managerial Auditing Journal, 29(6), 419-512.
Efobi, P., & Okougbo, P. (2014). Timeliness of financial reporting in Nigeria. South African Journal of Accounting Research, 28(1), 65-77.
FBN Holdings highlights reason for delay in filing audited statements. (2018, April 04). Retrieved from https://www.pmnewsnigeria.com/2018/04/04/fbn-holdings-highlights-reason-for-delay-in-filing-audited-statements/
Fodio, M.I., Oba, V.C., Olukoju, A.B., & Zik-rullahi, A.A. (2015). IFRS adoption, firm traits and audit timeliness: Evidence from Nigeria. ACTA Universitatis danubius, 11(3), 106-119.
Ghafran, C., & Yasmin, S. (2018). Audit committee chair and financial reporting timeliness: a focus on financial, experiential and monitoring expertise. International Journal of Auditing, 22(1), 13-24. https://papers.ssrn.com/sol3/ papers.cfm?abstract_id=3121455
Hashim, U.J.B., & Rahman, R.B.A. (2011). Reviewing the literature on audit report lag and corporate governance. Retrieved from: http://ssrn.com/abstract=2207811
Hoang, T.V.H., & Dang, N.H., & Nguyen, T.P. (2018). The study of factors affecting the timeliness of financial reports: The experiments on listed companies in Vietnam. Asian Economic and Financial Review,8(2), 294-307.
Ilaboya, O.J., & Iyafekhe, C. (2014). Corporate governance and audit report lag in Nigeria. International Journal of Humanities and Social Science, 4(13), 172 – 180.
Imeny, V.M. (2017). The impact of Ethnic characteristics of CEOs on audit report lag and audit fees. Journal of Economics & Administrative Sciences, Iran, 4, 1-12. Retrieved from: https://ssrn.com/abstract=2873056
Iyoha, F.O. (2012). Company attributes and the timeliness of financial reporting in Nigeria. Business Intelligence Journal, 5(1), 41-49.
Karim, W., Ahmed, K., & Islam, A. (2006). The effect of regulation on timeliness of corporate financial reporting: Evidence from Bangladesh. JOAAG, 1(1), 15-35.
Kieruj, D. (2013). The effect of timeliness of financial disclosure on post-announcement abnormal returns. Master thesis of Accountancy Department, School of Economics and Management, Tilburg University.
57Issues in Financial Reporting Lag
Journal of Taxation and Economic Development ISSN 1118-6017 Vol. 18, (1), March 2019

Lehtinen, T. (2013). Understanding timeliness and quality of financial reporting in a Finnish public company. Master's thesis of School of Business, Aalto University, Finland.
Lestari, S.Y., & Nuryatno, M. (2018). Factors affecting the audit delay and its impact on abnormal return in Indonesia Stock Exchange. International Journal of Economics and Finance, 10(2), 48-56.
Lopez, D.M., & Peters, G.F. (2011). Auditor workload compression and busy season auditor switching. Accounting Horizons American, 25(2), 357–380.
Luypaert, M., Caneghem, T., & Uytbergen, S. (2016). Financial statement filing lags: An empirical analysis among small firms. International Small Business Journal, 34(4), 506-531.
Ohaka, J. & Akani, F.N. (2017). Timeliness and relevance of financial reporting in Nigerian quoted firms. Management and Organizational Studies, 4(2), 55-62.
Oladipupo, A.O., & Izedonmi, F.I.O. (2009). The inevitability of financial reporting delay and conceptual definitional problems. Journal of the Management Science, 9(1), 119-133.
Salako, T. (2018, March 02). Oando explains delay in earnings report. Retrieved from http://thenationonlineng.net/oando-explains-delay-earnings-report/
Sherman, H.D., & Young, S.D. (2016). Where financial reporting still falls short. Havard Business Review, 6(7), 1-21.
Sherrill, D.E., & Yerkes, R.T. (2018). Municipal disclosure timeliness and the cost of debt. The Financial Review, 53(8), 51–86.
Vuran, B. & Adiloglu, B. (2013). Is timeliness of corporate financial reporting related to accounting variables? Evidence from Istanbul Stock Exchange, International Journal of Business and Social Science, 4(6), 58-70.
58Issues in Financial Reporting Lag
Journal of Taxation and Economic Development ISSN 1118-6017 Vol. 18, (1), March 2019

VALUE ADDED TAX AND REVENUE GENERATION IN NIGERIA: AN EMPIRICAL ANALYSIS
Edojor Clement OzeleDepartment of Accounting,
Igbinedion University, Okada+2348145721570, [email protected]
Favour Osaro AtuDepartment of Accounting, Wesley University, Ondo
+234810375311, [email protected]
Raphael Igbinosa Atu AdegheDEAN- College of Business and Management Studies,
Igbinedion University, Okada+2348037112764, [email protected]
and
Gina OghoghoDepartment of Accounting,
Igbinedion University, Okada+2348065796019, [email protected]
AbstractThis study is a discourse on the contributions of Value-added tax to total revenue. The study adopts an ex-post research design with extensive use of secondary data to show the contributions of VAT to total revenue in Nigeria between the period, 1994-2017. Descriptive statistics using charts was used for the analysis. The study shows that the contributions of VAT for the period under review has been quite unimpressive. The study found that VAT is generally not characterized with threatening oscillations year-on-year over the period. This is a good sign for policy makers as it implies that over the business cycle, VAT revenue will still maintain some considerable stability and hence it can be dependent upon in the forecasting, budget planning and fiscal coordination. The study concludes that the low performance of VAT in Nigeria is rather unfortunate as most developed and emerging markets have long begun re-directing tax policy towards more consumption-based model rather than income-based model and at best having an efficient combination of both models. The reason is not far-fetched as consumption taxes have been credited with having less distortionary effects on investment and less volatile because consumption expenditure appears more stable. The tax is also quite equitable as the burden is the same irrespective of income. The tax collection is highly cost effective as it is charged at point of consumption and importantly, the loop-holes for evasion or avoidance is less when compared to direct taxes. The study recommends that the government and tax authorities look critically at the VAT- consumption based model in ensuring revenue stability.
Key words: VAT, revenue generation, government, administration, income tax.
59Value Added Tax and Revenue Generation in Nigeria: An Empirical Analysis
Journal of Taxation and Economic Development ISSN 1118-6017 Vol. 18, (1), March 2019

INTRODUCTIONTax earning is one of the most important sources of revenue for any government. In Nigeria, tax is basically of two types - direct taxes and indirect taxes. The individuals directly pay the direct tax to the government, income tax is a good example of this type of taxation. Whereas indirect tax (such as sales tax, value added tax (VAT) or goods and services tax) is a tax collected by an intermediary (such as retail store) from the person who bears the ultimate economic burden of the tax.
Generally, countries find ways of increasing their revenue generation. As a result many countries have introduced value added tax on goods and services (Onwucheka & Aruwa, 2014). According to them, African countries such as Benin Republic, Cote d’Ivoire, Guineas, Kenya, Madagascar, Mauritius, Senegal, Togo including Nigeria have introduced VAT and which has become important contributor to total their total revenue generated. It goes to show that importance of VAT to revenue generation cannot be overemphasized. According to Okpe (2001), the introduction of VAT in Nigeria became necessary because government expenditure was steadily over-shooting revenue, resulting in the wide deficit financing. In addition records show that between 1960 and 1971, income from indirect taxes in Nigeria constituted the single most important of government revenue but declined to 12% and 13% in 1980 and 1990respectively. This is as of oil boom which rose the share of direct taxes from23% in 1970 to 60% in 1980 but came down to 45% in 1990.
Statement of the Problem The introduction and full recognition of the potential value of VAT in revenue generation after planning its adoption into the Nigerian tax system has become a controversial issue that forms debate among several authors. For instance, Anyanwu (1993) viewed VAT as a consumption tax on economic operations including imports except those exempted as par the provision of the decree. Irrespective of the enormous revenue accruing to the government treasury, Umerora (2013) argues that the incidence of VAT like other indirect tax is regressive as the poor spend a large portion of their income on purchases. However, Brown and Gale (2012) are of the opinion that a VAT with a constant tax rate over time would not distort household saving choices, nor would it distort business's choices regarding new investments, financing instruments, or organizational form. Bilal (2015) further supports the statement of Brown & Gale, (2012) stating that if VAT is levied uniformly on all goods and services with a constant tax rate, it becomes a simple tax levy. Since it is a self-assessment tax levy, it facilitates VAT administration with relatively less cost of collection as compared to income taxes. There are numerous other studies on VAT and revenue generation in Nigeria such as Okoye & Gbegi, (2013); Muhibat, Abdul, Azeez & Tope, (2013); Adereti, Sanni & Adesina, (2011); and Okoyeuzu (2013). This study lean to investigate upon existing research on the impact of value added tax on revenue generation in Nigeria, expanding the scope of the study as it relates to the period from 1994 to 2017.
The objective of the study therefore is to find out whether VAT contributes significantly to the total revenue generated in Nigeria for the period 1994 to 2017.
60Value Added Tax and Revenue Generation in Nigeria: An Empirical Analysis
Journal of Taxation and Economic Development ISSN 1118-6017 Vol. 18, (1), March 2019

CONCEPTUAL FRAMEWORKThis section consists of analysis of similar or previous study on the topic undertaken by researchers, with the objective of gaining a holistic view of previous research on similar themes.
Taxation in NigeriaTax is a compulsory payment made by all concerned to the government of a country from which essential services are rendered, without necessarily offering an explanation on how the money generated was spent or equating the services with the money collected (Onwuchekwa & Aruwa, 2014). Taxation is an instrument employed by the government for generating public funds (Anyaduba, 2004). According to Brautigam (2008) a well-designed tax system can help governments in developing countries prioritize their spending, build stable institutions, and improve democratic accountability. The main purpose of a tax is to enable public sector finance its activities so as to achieve some economic and social goals. It can also be for the purpose of redistribution of wealth to ensure social justice (Ola, 2001).
Therefore, taxes can be used as an instrument for achieving both micro and macroeconomic objectives especially in developing countries such as Nigeria. However, Musgrave and Musgrave (2004) comment that the dwindling level of tax revenue generation in the developing countries makes it difficult to use tax as an instrument of fiscal policy for the achievement of economic development. Some governments like Canada, United States, Netherland, and The United Kingdom have substantially influenced their economic development through tax revenue generated from Company Income Tax, Value Added Tax, and Personal Income Tax, and have prospered through tax revenue (Oluba, 2008). In Africa, natural resources such as income from production sharing, royalties, and corporate income tax on oil and mining companies yield the significant portion of tax revenue (Pfister, 2009). The tax sources are the basic and most reliable sources of government revenue because of their certainty and flexibility characteristics. Certainty characteristic implies that collection of taxes from taxpayers is assured, all other things being equal. Tax collection is not affected by the state of the economy; whether the economy is declining, stagnant or growing. Its flexibility makes it possible for the government to adjust the tax system to suit her desired purpose.
Value Added Tax in NigeriaThe concept of value added tax is a consumption tax that is levied at a particular stage in the sale of a product or service. In other words, it is an indirect tax imposed on consumers at every stage of the consumption process from the raw stage to the finished stage. VAT, from the perspective of the buyer, is a tax on the purchase price, whereas, from the seller‘s point of view, it is a tax only on the "value added" to a product, material or service, at the stage of its manufacture or distribution (Rehana, 2017). Adesola (2000) described value added tax as a consumer tax and is charge before selling the good. He said, value added tax is often defined as the sum of wages and profit.
When it became apparent that Nigeria couldn’t survive favourably by sole dependence on the oil-derived income/revenue, the need to diversify the source of revenue by the
61Value Added Tax and Revenue Generation in Nigeria: An Empirical Analysis
Journal of Taxation and Economic Development ISSN 1118-6017 Vol. 18, (1), March 2019
government forced it to think of restructuring the economy. Olatunji (2009) explains that the walk towards VAT system in Nigeria started with acceptance of the recommendation of Dr. Sylvester Ugoh-led study group on indirect taxation in November, 1991 which was made public in the 1992 budget speech of the then Head of State, General Ibrahim Babangida. The introduction of VAT in Nigeria through Decree 102 of 1993 which became operational in January 1994, marked the phasing out of the Sales Tax Decree No. 7 of 1986.
The VAT in Nigeria is basically a consumption tax levied at a flat rate of 5%. It is collected on behalf of the government by businesses and organizations. Its implementation is such that a tax of 5% is added when all goods and services pass from one hand to the other except those exempted as contained in the Schedule, (Olatunji, 2009). In the Schedule exempted goods and services are divided into two parts. Part 1 listed goods exempted to include: all medical and pharmaceutical products; basic food items; books and educational materials; baby products; locally produced fertilizer, agricultural and veterinary medicine, farming machinery and farming transportation equipment; all exported goods; plant and machinery imported for use in the Export Processing Zone; plant, machinery and equipment purchased for utilization of gas in downstream petroleum operations; and tractors, ploughs, agricultural equipment and implements purchased for agricultural purpose. Part II contains services exempted. These include: medical services, services rendered by community banks people’s bank and mortgage institutions; plays and performances conducted by educational institutions as part of learning and all exported services.
According to Tax Act 1993 as amended, Where the VAT collected on behalf of the government (output VAT) in a particular month is more than the VAT paid to other persons (input VAT) in the same month, the difference is required to be remitted to the government, on a monthly basis, by the taxable person (Oserogho and Associates, 2008). Where the reverse is the case, the taxpayer is entitled to a refund of the excess VAT paid or more practically, to receive a tax credit of the excess VAT from the government. All exports are zero rated for VAT. VAT is payable in the currency of the transaction under which goods or services are exchanged.
Value Added Tax (VAT) is administered in Nigeria by the Federal Inland Revenue Service (FIRS) through the VAT directorate Abuja. The jurisdiction of VAT lies with the federal government of Nigeria and the proceeds from VAT are distributed among the three tiers of government in Nigeria in an approved ratio, currently, the federal government receives fifteen percent (15%), state government gets fifty percent (50%) while the local government gets thirty-five percent (35%), (Oyedokun, 2016).
VAT and Revenue Generation in Nigeria VAT as a tax policy, made its debut in 1994. Since then, it has contributed significantly to revenue generation. From a modest beginning of N7,206.8 million in 1994, the percentage change in the amount generated from VAT from 1995 to 1996 was about 185.9%, and increasing from N20.76 billion in 1995 to N31 billion in 1996. In 1999, the change from military rule to democratic government also witnessed a positive increase in the compliance by the tax payers as the amount generated rose from N36.9 billion in
62Value Added Tax and Revenue Generation in Nigeria: An Empirical Analysis
Journal of Taxation and Economic Development ISSN 1118-6017 Vol. 18, (1), March 2019

1998 to N47.11 billion in 1999 accounting for about 27.6% increase (Madugba & Azubike, 2016). Details of further proceeds are as follows N91.7 billion (2001), N108.6 billion (2002), N136.4 billion (2003), N159.5 billion (2004) N178.1 billion (2005). It is however important to note that with the positive attributes of effectiveness and equity of VAT, its contribution to the total tax revenue in Nigeria has been low. The highest contribution to the total tax revenue is 18.8% in 1998. Since 2000, during this democratic dispensation the highest was 14.13% in 2008, with the lowest ever recorded being in 2005 when it was 7.18%. VAT generated N275.57bn, N318.00bn, N347.69bn, N389.53bn and N388.85bn in 2010, 2011, 2012, 2013 and 2014 respectively (CBN Statistical bulletin, 2015). Tax also constitutes a substantial part of the revenue accruing to the state in Nigeria. This is especially the case when VAT is added to the internally generated revenue, which is substantially made up of other taxes.
In fact more states are strengthening their tax admiration in a bid to increase their revenue base to finance critical infrastructural projects. For instance Edo State revenue increase from N275 million per month to over N1.6 billion per month, Olotu (2012). Abiola and Asiweh (2012) also highlighted the contribution of Lagos State to government revenue generation in Nigeria. They stated that Lagos State is among a few states in Nigeria that have left a land mark in terms of independence and use of internally generated revenue. Syndelle (2009) observed that in 2007, Lagos state achieved a gross domestic product of N3.68 trillion an equivalent of $29.028 billion making it the biggest contributor to the federal government.
Theoretical Framework The major theories backing this study are the optimal tax reform theory, Benefit received theory and Ibn Khaldun’s theory of Taxation.
The optimal tax reform theory states that the best way to raise revenue is through taxing goods or factors with inelastic demand or supply, and that taxation relating to distribution and externalists or market failures should concentrate on identifying the source or origin of the problem. Thus, for distribution, we should look for the sources of inequality (for example, land endowments or earned incomes) and taxation should be concentrated there (Oriakhi & Ahuru, 2014).
The benefit received theory is based on the assumption that there is basically an exchange relationship between tax-payers and the state. The state provides certain goods and services to the members of the society and they contributes to the cost of these supplies in proportion to the benefits received (Bhartia, 2009).
Ibn Khaldun's theory of taxation is seen as one of his most important contributions to economic thought. He relates the theory of taxation with the government expenditure and argued for low tax rate so that incentive to work is not killed and taxes are paid happily. According to him, at the beginning of a dynasty, taxation yields a large revenue from small assessment, but at the end of a dynasty, taxation yields a small revenue from large assessment. The effect of taxation on incentives and productivity is so clearly visualized by Ibn Khaldun that he seems to have grasped the concept of optimum taxation (Abdul, n.d).
63Value Added Tax and Revenue Generation in Nigeria: An Empirical Analysis
Journal of Taxation and Economic Development ISSN 1118-6017 Vol. 18, (1), March 2019

Ishlahi, (2006) sees this theory from two-folds; viz: the arithmetic and economic effects. The arithmetic effect states that if VAT rates are lowered the VAT revenue will be lowered by the amount of the decrease in the rate. The reverse is the case for an increase in VAT rates. Conversely, the economic effect recognized the positive impact that lower VAT rate have on work, output and employment and thereby providing incentives to increase these activities whereas raising VAT rate has the opposite economic effect by penalizing participation in the taxed activities.
Empirical ReviewAdereti, Sanni and Adesina (2011) empirically investigated the contribution of Value Added Tax (VAT) to GDP in Nigeria for the period 1994-2008.Their findings show a positive and significant correlation between VAT revenue and GDP. Also Keen and Lockwood (2007) estimated, on a panel of 143 countries for 25 years, of a system of equations describing both the probability of VAT adoption and the revenue impact of the VAT and found that the effect of the VAT proves to be significantly positive but fairly modest: adoption of the VAT is associated with a long run increase in the overall revenue-to-GDP ratio of about 4.5%. In a similar study done by Basila (2010), he investigated the relationship between VAT and GNP in Nigeria from 1994 to 2008, and revealed that there is a strong positive correlation between VAT revenue and GNP in Nigeria. Also Adereti, Sanni and Adesina (2011), in their study found out that the ratio of VAT Revenue to GNP averaged 1.3% compared to 45% in Indonesia, though VAT Revenue accounts for as much as 75% significant variations in GNP in Nigeria. However, they concluded that there is a positive and significant correlation that exists between VAT Revenue and GNP in Nigeria from 1994-2008. While Ebeke and Ehrhart (2011), in their study on whether or not the adoption of value-added tax (VAT) in developing countries is an effective way of stabilizing tax revenues using a large panel of 103 developing countries, observed over 1980-2008, revealed that the presence of VAT leads to significantly lower tax revenue instability. They concluded that on average, countries with VAT experience 40-50% less tax revenue instability than countries which do not have a VAT system. These effects decrease with the level of economic development and the openness of trade.
Okoyeuzu (2013) in his study on Value Added Tax Remittance: Observation from developing country covering a period of 7 years from 2005-2011 revealed that VAT revenue has been on the decrease for the period of study and recommends that the Nigerian government should make adequate provision for retrieving the proceeds of VAT from companies and other agents of collection. Also the study of Okoye and Gbegi (2013), revealed that revenue generated through VAT has a significant influence on wealth creation in Nigeria and that revenue generated through VAT has a significant effect on total tax revenue in Nigeria. Therefore, from their findings they discovered that valued added tax (VAT) is the bedrock of wealth creation in Nigeria as well as economic development as it contributes significantly to the nation's Gross Domestic Products (GDP).
Muhibat, Abdul, Azeez and Tope (2013) carried out an investigation on empirical Evaluation of the Contributions of Value Added Tax to total Revenue Generation and gross Domestic Product in Nigeria from1994-2010. The result showed that VAT significantly impact on GDP. Lastly Omolapo, Aworemi, and Ajala (2013), from the results of their analysis, it was revealed that value added tax (VAT) is beneficial to the
64Value Added Tax and Revenue Generation in Nigeria: An Empirical Analysis
Journal of Taxation and Economic Development ISSN 1118-6017 Vol. 18, (1), March 2019

Nigeria economy. From the findings it also shows that for Nigeria to attain its economic growth and development, she must be able to generate enough revenue in order to meet up with the challenge of her expenditure in term of provision of social amenities and the running costs of the government.
METHODOLOGYThe research design used here is the time-series design. The study examines Value added tax and total revenue with data covering the years 1994-2017. The sources of data include Central Bank of Nigeria statistical bulletin of various year and various issues and Federal Inland Revenue Service (IFRS). The statistical techniques used in the study was largely descriptive using charts to show the needed information useful for the study.
PRESENTATION AND ANALYSIS OF RESULTFigure 1 shows total revenue performance and also VAT revenue profile from 1994 to 2017. As observed, statistics shows that total revenue has been on a steady rise from the beginning of the study period driven largely by rising oil prices which has also been complemented with improvement in non-oil revenue performance. In 2009 a down turn in total revenue was observed which was quite short-lived as revenue bounced back increasing in 2010 in a sustained manner until 2015 when the global fall in crude oil prices set in hurting oil revenue. Nigeria’s economy has been growing except at an average of 6% than the 5 per cent continental average except for 2015 when crash in oil prices hampered revenue from oil related sectors and mainly the petroleum profit tax and thus affecting total tax revenue for 2015 (Guardian, 2015). A revenue rebound was observed in 2016 coming on the heels of Non-OPEC production and relentless demand growth moving up more than a million barrels per day each year and which have remained largely so amidst benign oscillations into 2017.
Figure 1: Total Revenue and VAT Distribution.
Source: CBN, FIRS (2018)
65Value Added Tax and Revenue Generation in Nigeria: An Empirical Analysis
Journal of Taxation and Economic Development ISSN 1118-6017 Vol. 18, (1), March 2019

Figure 2 shows the total revenue profile and the percentage contributions of VAT to total revenue over the study period. As observed, the percentage contributions of VAT have been quite unimpressive. In 1995, VAT contributed 10.15% to total revenue, declining to 8.9% in 1996 and improved slightly to 12.61% in 1997 and then again to 14.11% in 1998. In 1999, VAT contributed just 11.32% to revenue and then 14.054% in 2000. The period following from 2000-2013, the contribution of VAT was abysmally low at less than 10% with the highest being 9.14% in 2013. Some slight improvement followed in 2015 when VAT contributed 13.3% and then 24.519% in 2016 but declining to 19.799% in 2017. The dismal performance of VAT is indeed an unfortunate situation for Nigeria as the potentials of VAT-type revenue has been identified globally as countries are now moving away from income based taxes to consumption based taxes.
Figure 2: Total Revenue and VAT percentage Contribution
Source: CBN, FIRS (2018)
Figure 3 examines the volatility of VAT revenue in Nigeria. The considerations of volatility is important for tax planning and fiscal policy. A very volatile tax revenue may pose challenge for budgeting and fiscal coordination. As shown in the figure 3, VAT exhibits no threatening volatility as the trend shows very stable behaviour with less unprecedented shocks. Though there are sharp spikes in 2010 and 2015 deviations, the trend of VAT is generally not characterized with threatening oscillations year-on-year over the period. This is a good sign for policy makers as it implies that over the business cycle, VAT revenue will still maintain some considerable stability and hence it can be depended upon in the forecasting, budget planning and fiscal coordination. It has been empirically shown that VAT are less susceptible to shocks because it is consumption-based.
66Value Added Tax and Revenue Generation in Nigeria: An Empirical Analysis
Journal of Taxation and Economic Development ISSN 1118-6017 Vol. 18, (1), March 2019

Figure 3: Total Revenue and Volatility of VAT Revenue.
Source: CBN, FIRS (2018)
Figure 4 examines the growth rate of VAT revenue over the study period. Though as indicated earlier, VAT contributions to total revenue have not been impressive, the growth rate of VAT have been very unstable. After its introduction, in 1994, VAT grew by 24.45% and by 80.351% in 1996. However, it crashed down to 23.26% growth rate in 1997 and then rose to 46.51% in 1999 and climaxed at a growth rate of 29.0% in 2000. In 2001, it grew by 46.57% and then hit a ground low of -9.095% in 2005 which is the lowest growth threshold for VAT over the period under review. The highest growth rate of VAT was experienced in 2016 at 112.70% and then was followed by a growth decline of -1.66%. The data reveals that VAT growth rates have been very unstable and meshed with a lot of oscillations and this may be expected due to lack of efficiency and low monitoring levels of tax management authorities and the several loop-holes associated with the remittance of VAT revenue. Policy reforms and widening of the tax base may also cause growth spikes but concerns are raised with growth rates declining rather than increasing and hence there is need for a lot more consistency and coordination by tax authorities in VAT revenue mobilization.
67Value Added Tax and Revenue Generation in Nigeria: An Empirical Analysis
Journal of Taxation and Economic Development ISSN 1118-6017 Vol. 18, (1), March 2019

Figure 4: VAT Revenue and Growth rate of VAT Revenue.
Source: CBN, FIRS (2018)
CONCLUSION AND RECOMMENDATIONThis study is a discourse on the contributions of Value-added tax to total revenue. The study adopts an ex-post research design with extensive use of secondary data to show the contributions of VAT to total revenue in Nigeria between the period 1994-2017. The study finds out that the percentage contributions of VAT have been quite unimpressive. In 1995, VAT contributed 10.15% to total revenue, declining to 8.9% in 1996 and improved slightly to 12.61% in 1997 and then again to 14.11% in 1998. In 1999, VAT contributed just 11.32% to revenue and then 14.054% in 2000. The period following from 2000-2013, the contribution of VAT was abysmally low at less than 10%. Some slight improvement followed in 2015 when VAT contributed 13.3% and then 24.519% in 2016 but declining to 19.799% in 2017. The study also found that VAT is generally not characterized with threatening oscillations year-on-year over the period. This is a good sign for policy makers as it implies that over the business cycle, VAT revenue will still maintain some considerable stability and hence it can be depended upon in the forecasting, budget planning and fiscal coordination.
The study also revealed that VAT growth rates have been very unstable and meshed with a lot of oscillations and this may be expected due to the efficiency and monitoring levels of tax management authorities and the several loop-holes associated with the remittance of VAT revenue. Policy reforms and widening of the tax base may also cause growth spikes but concerns are raised with growth rates are declining rather than increasing and hence there is need for a lot more consistency and coordination by tax authorities in VAT revenue mobilization.
The study concludes that the low performance of VAT in Nigeria is rather unfortunate as most developed and emerging markets have long begun re-directing tax policy towards
68Value Added Tax and Revenue Generation in Nigeria: An Empirical Analysis
Journal of Taxation and Economic Development ISSN 1118-6017 Vol. 18, (1), March 2019

more consumption based models rather than income based models and at best having an efficient combination of both models. The reason is not far-fetched as consumption taxes
69Value Added Tax and Revenue Generation in Nigeria: An Empirical Analysis
Journal of Taxation and Economic Development ISSN 1118-6017 Vol. 18, (1), March 2019

Okoyeuzu, C (2013) Value added tax remittance: observation from developing country. Global Journal of Management and Business Research Finance. 13(9).
Okpe, T. J. (2001) Guide to Nigerian Companies Taxation, Enugu. Chiezugo Ventures.
Ola, C.S. (2001). Income tax law and practice in Nigeria. Ibadan: Dalag Prints and Part.
Olatunji, C.O. (2009). A review of value added tax (VAT). International Business Management 3(4) 61-68
Olotu, G.E. (2012) Welcome Address speech by the chairman, chartered institute of taxation of Nigeria, 14th Annual Tax Conference, 10th May.
Omolapo, A. A., Aworemi, R .J. & Ajala, O. A. (2013). Assessment of Value Added Tax and Its Effects on Revenue Generation in Nigeria, International Journal of Business and Social Science. 4(1).
Onwuchekwa J. C. & Aruwa S. A. S. (2014) Value added tax and economic growth in Nigeria. European Journal of Accounting Auditing and Finance Research, 2(8), 62-69.
Oriakhi, D. E. & Ahuru, R. R. (2014). The impact of tax reform on Federal revenue generation in Nigeria. Journal of policy and development studies, 9(1), 92-107.
Oserogho & Associates (2008): Legal Alert March 2008 VAT & Foreign Non Resident Companies in Nigeria assessed from http://www.oseroghoassociates.com/ pdf/200803.pdf on March 2, 2018.
Oyedokun, G. E., (2016). Nigeria value added tax system and the concept of basic food. SSRN Electronic Journal. Retrieved on August 3, 2018 from https://www.researchgate.net/publication/317995386_Nigerian_Value_Added_Tax_System_and_the_Concept_of_Basic_Food.
Rehana, I. (2017). “Value added tax (VAT) – in view of Bangladesh”. IOSR Journal of Business and Management (IOSR-JBM), 19(1), 08-18.
Pfister, M. (2009). Taxation for investment and development: An overview of policy challenges in Africa. Ministerial Meeting and Expert Roundtable of the NEPAD – OECD Africa Investment Initiative on November 11 – 12.
Syndelle, S. (2009) Taxes- accountability and revenue in Nigeria. Nigeria Curiosity: Com Available from: http://www.nigeriancuriosity.com./2009/11/taxes- accountability- revenue- in-Nigeria. html. Accessed 10/4/2010.
Umeora, C.E (2013) The effects of value added tax (VAT) on the Economic Growth of Nigeria, Journal of Economics and Sustainable Development, 4(6).
70Value Added Tax and Revenue Generation in Nigeria: An Empirical Analysis
Journal of Taxation and Economic Development ISSN 1118-6017 Vol. 18, (1), March 2019

71Value Added Tax and Revenue Generation in Nigeria: An Empirical Analysis
Journal of Taxation and Economic Development ISSN 1118-6017 Vol. 18, (1), March 2019

COMPANY INCOME TAX AND NIGERIAN ECONOMIC GROWTH
Iduh Peter OgwucheDepartment of Business Administration,Kwararafa University Wukari, Nigeria.
Abdullahi Musa AbdullahiDepartment of Taxation,
Nasarawa University Keffi, Keffi, [email protected]
&
Godwin Emmanuel OyedokunDepartment of Accounting,
Faculty of Management SciencesNasarawa State University, Keffi, Nigeria
+234-80-3373-7184; [email protected]
AbstractThis study examines the impact of company income tax on economic growth in Nigeria. The analyses were performed using data from CBN bulletin, NSE fact book and FIRS annual report for an eleven-year period (2007-2017). The study employed multiple regression analysis techniques based on the SPSS 20 version for the analysis of data, where gross Domestic product (GDP), the dependent variable and proxy for economic growth, was regressed as a function of company income tax (CIT), and the independent variables and descriptive statistics were used to analyze the data. The findings indicated that company income tax has significant influence over economic growth in Nigeria. It is therefore recommended that the policies of company income tax should be reviewed to block the loopholes that encourage tax avoidance where most companies capitalize on to avoid tax and, full implementation of tax reforms agenda of 2003. The integrated tax office (ITO) introduced in 2004 should be adequately computerized and staffed with quality and experienced staff.
Keywords: Company tax, Economic growth, Policies, Tax avoidance, Tax reform
INTRODUCTIONOne of the major functions of any government especially developing countries such as Nigeria is the provision of infrastructural services such as electricity, pipe-borne water, hospitals, schools, good roads and as well as ensure a rise in per capita income, poverty alleviation to mention a few. For these services to be adequately provided, the government should have enough revenue to finance them. The task of financing these enormous responsibilities is one of the major problems facing the government. Based on the limited resources of government, there is a need to carry the citizens (governed) along hence the imposition of tax on all taxable individuals and companies to augment government financial position. To this end, the government have always enacted various tax laws and reformed existing ones to stand the taste of time. They include
72Company Income Tax And Nigerian Economic Growth
Journal of Taxation and Economic Development ISSN 1118-6017 Vol. 18, (1), March 2019

Income Tax Management Act (ITMA), Companies Income Tax Decree (CIID), Joint Tax Board (JIB) etc.
All these are aimed at ensuring adherence to tax payment and discouraging tax evasion and avoidance. For the purpose of this study, the researcher would be concerned with the impact of company income taxation as an aid to the economic growth of Nigeria. The contribution of company income tax to the growth and development of any economy cannot be overemphasized. Apart from being a major source of revenue to the government, it also serves a means by which governments actualize certain macro-economic goals. It is therefore of no doubt that tax is a major tool used by the most government to promote growth and development (Ahunwan, 2009).
Furthermore, the first need of any modern government is to generate enough revenue which is indeed “the breath of its nostril”. Thus taxation is by far the most significant source of revenue for the government. Nigerians regard payment of tax as a means whereby the government raises revenue on herself at the expense of their sweat. It is good to note that no tax succeeds without the taxpayer’s co-operation. Here, we can ask some thought-provoking questions such as: what makes taxation such a difficult issue? Why do people feel cheated when it comes to tax? Is the government making judicious use of taxpayer’s money? What are the problems affecting the successful operation of tax systems in Nigeria? How does the government determine the Assessable income of companies? In view of these questions above, this study seeks to empirically investigate to what extent has company income tax efficiently impacted on the economic growth of Nigeria?
The main objective of this study is to examine the impact or relevance of the various forms of companies’ income taxation on Nigeria economic growth. The specific objectives are; To examine the impact of company income tax on Nigeria economic growth. This study is of great significance to the government in that it is aimed at bringing to light the impact of company taxes and why company evade and avoid tax and also provide useful suggestions in areas of policy improvement that could aid in curbing these menace; also significance to Lawmakers: According to Garde (2004), many provisions in the Nigerian tax laws encourage tax avoidance. He buttressed his argument further by citing an example of section 19 of the Companies Income Tax Act (CITA) which exempted certain type of profit from tax.
This study is also significant to this group because it is designed to point out the various lapses in the Nigerian tax laws that encourage tax evasion and avoidance by companies.; Tax administrators: This study is also of great significance to the various tax administrators in Nigeria because it is aimed at exposing the various schemes used by companies to avoid and evade tax.; Academic circle: Since no knowledge is waste, this research work is of significance to the academic field in that it represents a humble contribution to the coffers of knowledge and also provides a basis for further study.
The first section of the paper is the introductory part, section two reviews the literature on the impact of company income tax and economic growth. The section also contains the connection between the impact of company income tax and economic growth. Section three discusses the research methodology. Section four presents the Results & Discussion of Findings. Section five conclusion and recommendations of the paper.
73Company Income Tax And Nigerian Economic Growth
Journal of Taxation and Economic Development ISSN 1118-6017 Vol. 18, (1), March 2019

LITERATURE REVIEWThe concepts of tax and taxation in prior researches have been largely discussed in different contexts by tax experts, academic scholars, international organizations as well as different governments. For example, The World Bank (2000) noted that taxes are a compulsory transfer of resources to the government from the rest of the economy, while Adeyeye (2004) described tax as a liability on account on the fact that the taxpayer has an income of a minimum amount and from certain specified source(s). However, in a simple term for the purpose of this study, tax is a compulsory fee individual, as well as corporate bodies, are obliged to comply with as stipulated by the tax laws, while taxation is the process of administering the tax laws in the way that achieves government objectives. And so, tax revenue is a major source of fund for any government and the availability of fund is a very crucial aspect of running a State. Although several options according to Soyode and Kajola (2006) are available to governments for raising fund, company income tax remains the principal source (Kiabel & Nwokah, 2009). This chapter seeks to review the works of scholars who vehave written on the topic and to effectively explain the conceptual and theoretical frameworks of the impact of company income tax on economic growth.
Concept of Company Income TaxCompanies Income Tax Act, 1990 is the current enabling law that governs the collection of taxes on profits made by companies operating in Nigeria excluding companies engaged in Petroleum exploration activities. This Tax is payable for each year of assessment of the profits of any company at a rate of 30% (Adereti 2011). According to Ola (2006), Companies ‘income tax administration in Nigeria does not measure up to appropriate standards. If good old tests of equity, certainty, convenience and administrative efficiency are applied, Nigeria will score low considering the following points: Due to inadequate monitoring, persons in the self-employed and unquoted private companies group evade tax. In a study conducted by Festus and Samuel (2007) on company Income Tax and the Nigerian economy, they conclude that Company income tax is a major source of revenue in Nigeria but non-compliance with tax laws and regulations by taxpayers is deep in the system because of weak control. There is a need for general tax reform in the Nigerian company income tax system.
Concept of Economic Growth A country‘s tax system is a major determinant of other macroeconomic indexes. Specifically, for both developed and developing economies, there exists a relationship between tax structure and the level of economic growth and development. Indeed, it has been argued that the level of economic development has a very strong impact on a country’s tax base and tax policy objectives vary with the stages of development (Kiabel, 2009 &Vincent, 2001). According to Olopade and Olopade (2010) Growth means an increase in economic activities. Kuznets (Cited in Likita, 1999) defined a country‘s economic growth as a long-term rise in capacity to supply increasingly diverse economic goods to its population, this growth capacity is based on advancing technology and the institutional and ideological adjustment that it demands.
Economic growth represents the expansion of a country’s potential GDP or output. Rostow – Musgrave model (1999:46) carried out a research on growth of public expenditure where they focused mainly on the utilization of taxes as the major revenue
74Company Income Tax And Nigerian Economic Growth
Journal of Taxation and Economic Development ISSN 1118-6017 Vol. 18, (1), March 2019

source, concluded that, at the early stages of economic development, the rate of growth of public expenditure will be very high because government provides the basic infrastructural facilities (social overheads) and most of these projects are capital intensive, therefore, the spending of the government will increase steadily. The investment in education, health, roads, electricity, water supply are necessities that can launch the economy from the practitioner stage to the take-off stage of economic development, making the government spend an increasing amount with time in order to develop an egalitarian society.
Development in human society is a one-sided process; this, in turn, remains the goals of every society at all times. The term ‘development’ until recently meant growth measured by GNP or rise in per capital income. Yet development is not growth. Perhaps it could be growth coupled with social justice, (Kayode,1993). Development implies changes that lead to improvement or progress; it is believed that an economy that raises its per capita level of real income over time without transforming its social and economic structure is unlikely to be perceived as developing.
The main purpose of the tax is to raise revenue to meet government expenditure and to redistribute wealth and manage the economy (Ola, 2001; Jhingan, 2004 & Bhartia, 2009). Jarkir (2011) outlined that for the economic growth of a country, tax can be used as an important tool in the following manner: firstly, Optimum allocation of available resources; secondly, Reduction of inequalities in income and wealth; thirdly, Acceleration of Economic Growth and Price Stability; fourthly, Control mechanism.
Review of Empirical LiteratureFurceri and Karras (2009) researched to investigate the effects of changes in taxes on economic growth by using annual data from 1965 to 2007 for a panel of twenty-six economies. The main variable of this study is growth and the growth rate of real GDP per capita. This study also uses other variables such as tax rate and income tax. The findings show that the effect of an increase in tax on real GDP per capita is negative and persistent where an increase in the total tax rate which measures like the total tax ratio to GDP by 2% of GDP has a long-run effect on real GDP per capita of -0.5% to -1%. Besides, their findings also imply that the increase in social security contributions or taxes on goods and services has a large negative effect on per capita output than the increase in the income tax.
Adegbie and Fakile (2011) examined the relationship between company income tax and Nigeria’s economic growth for the period 1981 to 2007. They used the GDP to capture the Nigerian Economy which was measured against total annual revenue from company Income Tax for the same period. They employed the use of chi-square and multiple linear regression analysis methods to analyze data obtained from both primary and secondary sources. Their variables included various taxes regressed against GDP. With an R squared of 98.6% and an adjusted R squared of 98.4%, revealing that company income tax’s impact on GDP is very high and impressive. It further showed that there is a significant relationship between company income tax and Nigerian economic development and that tax evasion and avoidance are the major hindrances to revenue generation. Overall the study examined only Company Income Tax which calls for the need to see the impact of all Tax revenues on the Nigerian economy.
75Company Income Tax And Nigerian Economic Growth
Journal of Taxation and Economic Development ISSN 1118-6017 Vol. 18, (1), March 2019
Festus and Samuel (2007) opined that the relationship between company income tax and Nigerian economic growth, the role of tax revenue in promoting economic activities and growth is not felt primarily because of its poor administration, perception and often an undesirable imposition which bears no relation to the responsibilities of 40 citizenship or to the service provided by the government. Their study further revealed that efficient and effective tax administration results in increased revenue yield, but this is not possible because of the presence of evasion and avoidance due to loopholes in the tax laws. On the other hand, Adedeji and Oboh (2010) stated that people expect that by sacrificing their private resources to the state in the form of taxes, the government is expected to reciprocate by spending public revenue in a way that will enhance their welfare. However, government and tax collectors have been dubiously mismanaging the public treasury. There is a high level of manipulation and diversion of tax revenue by the collectors. The dwindling tax revenue as presently witnessed results from lack of encouragement to the taxpayer, due to the fact that there is very little evidence to show for taxes collected. For these reasons, there are increased cases of tax evasion. Therefore, this gap in the existing literature on tax revenue and economic growth needs to be filled (Appah, 2004)
THEORETICAL FRAMEWORK This study is hinged on the Economy Principle and Revenue Productivity Theory. Adam Smith argues that it makes little sense to institute a tax system for which the cost of collection is higher than the realized tax revenue. Scholars like David Ricardo and J.S Mills emphasized this distinction by putting revenue first in their division of public finance into three namely; “revenue, expenditure and public debt”. Also, Public Finance Expert based their arguments principally on Revenue Productivity as important criteria for judging a good tax system. This theory lay emphases on having a large tax base to cover the minimum cost through efficient tax administration by providing direction towards more productive endeavors through lowering the tax rates, eliminating the tax on tax and widening the base so as to enforce compliance because this are likely to provide this sort of platform. The taxes introduced should be appropriate and sufficient to finance the expenditure needs of the government over time. Well-designed tax systems would encourage competitive growth across various sectors of the economy with a high prospect of tax revenue. An effective CIT tax system will encourage an efficient economy and provide an environment conducive for business, thereby reducing the costs. When taxes fund the essential ‘public goods’ like public security and the ‘rule of law’ on which company income depends. It promotes Revenue Productivity.
METHODOLOGYThe objective of this study is to examine the impact of company income tax on Nigerian economic growth. The study is descriptive in nature and focuses more on time series observational descriptive research design. The population for this study ranges from all the companies registered under corporate affairs commission (CAC) and which their taxes are collected by Federal Inland Revenue Service (FIRS) and the sample size for the study were aggregates of company’s income tax assessed and collected by FIRS under the scope of the study. The study used secondary data extracted from published Central bank of Nigeria statistical bulletin, Nigeria bureau of statistics, Nigerian fact book and from relevant literature (books, journals, previous research papers and electronic sites). The time series data cover the period 2007-2017.
76Company Income Tax And Nigerian Economic Growth
Journal of Taxation and Economic Development ISSN 1118-6017 Vol. 18, (1), March 2019

Model SpecificationThe model for this study is the functional relationship and the resultant models are as specified below.
GDP =f(CIT)GDP = f (CIT)
From the above functional relationship, the stochastic model is specified below:GDP = a0 + a1 (CIT) +Ut
Where a0 and a1are model parameters and Ut is the stochastic error term. The ‘priori’ expectation is that the model parameter is expected to be positively signed. What this means by implication is that some economic growth is expected even when no CIT revenue is collected.
RESULTS & DISCUSSION OF FINDINGSThis section presents results and discussions of major findings of the study. Descriptive statistics are discussed first, and finally, the multiple regressions result.
Table 1: Descriptive Statistics
Source: SPSS Statistics (2019)
Table 1 present the descriptive statistics of the dependent and independent variable. The mean gross domestic product is 170.5 percent with a standard deviation of 12913.6, and company income tax of 314.1 billion with a standard deviation of 241.1 indicating that company income tax contributed an average of 314.2 billions to the Nigerian economy within the period under review (2007-2017).
Table 2: Model Summary
a. Predictors: (Constant), CITb. Dependent Variable: GDPSource: SPSS Statistics 2019a. Dependent Variable: GDP
Source: SPSS Statistics 2019
77Company Income Tax And Nigerian Economic Growth
Journal of Taxation and Economic Development ISSN 1118-6017 Vol. 18, (1), March 2019
Mean Std. Deviation Obs
GDP 1.705E4 12913.6294 11
CIT 314.182 241.1865 11
Model R R Square
Adjusted
R Square
Std. Error of the
Estimate
Change Statistics
Durbin-
Watson R Square Change
F
Change df1 df2
Sig. F
Change
1 .937a .878 .864 4759.0972 .878 64.629 1 9 .000 .970

Consequently, the regression equation can be written as:GDP = a0 + a1 (CIT) + UtEstimated regression result:Y= 1293.869 + 50.163 a1Std. error = (2429.467) (6.240) Student’s test= (0.533) (8,039) Coefficient of multiple determination (R2) = 0.878Table value= 2.228The results obtained from the model shall be analyzed and interpreted on the basis of APRIORI expectation i.e. making statement based on logical reasoning. The apriori expectation in this project is that company income tax has positive impact on economic growth.Source: Researchers’ Result (2019)
The regression result as shown in Table 2 revealed that company income tax is statistical significant at 5% level of significance. From the equation, the coefficient of CIT shows its contribution to the economy which is being represented by the GDP. In this line, using the coefficient, autonomous GDP is a positive 1293.869. This simply means that when CIT is held constant, there will be a positive variation up to the tune of 164.217 units in GDP. Similarly, a unit changes in CIT will lead to an increase in GDP by 50.163 units less the autonomous component. The implication is that the economy responds favourably to the contribution of CIT.
2The R is otherwise known as the measure of the “goodness of fit” or the “coefficient of determination”. It shows the percentage of the total variation of our dependent variable (Y) that can be explained by the independent variables (X1, X2, X3, and X4), and the
2lower of R shows the percentages of the total variation of our independent variable that can be explained by our dependent variables. Therefore, the R2 is expressed as a
2percentage, and that part of the variation of the dependent variable (i.e. 100-R ) which is not explained by the regression line is attributed to the existence of the disturbance term (Ui). The R2 gives 0.878 or 88% meaning that the regression model is approximately 88% significant i.e. the variation in the dependent variable i.e. Gross Domestic Product (GDP) is 88% attributable to the changes in the independent variable i.e. company income tax. This result is also supported by the high value of the adjusted R-Square, which is to the tune of 86% .
2R shows that 88% of the total variation in the dependent variable (GDP) is explained by CIT.
DW (Durbin-Watson) =0.970 shows that there is an element of positive autocorrelation meaning that there is a linear relationship between Gross Domestic Product (GDP) and the independent variable company income tax.
Data Validity TestIn other to ensure that the results are robust, several diagnostic tests were performed. In an attempt to detect multicollinearity, the VIF and TOL statistics were computed as indicated in Table 3.
78Company Income Tax And Nigerian Economic Growth
Journal of Taxation and Economic Development ISSN 1118-6017 Vol. 18, (1), March 2019

The Variance Inflation Factor (VIF) measures the impact of Collinearity among the variables in a regression model. The Variance Inflation Factor (VIF) is 1/Tolerance, it is always greater than or equal to 1. There is no formal VIF value for determining the presence of multicollinearity. Values of VIF that exceed 10 are often regarded as indicating multicollinearity, but in weaker models values above 2.5 may be a cause for concern (Kouisoyiannis, 1977: Gujarati; & Sangeetha, 2007). This study we adopt the “Rule of thumb” of 5, this shows the appropriateness of fitting of the model of the study with the independent variable. In addition, the tolerance value is exactly one, this further substantiates the absence of multicollinearity. The two measures for testing multicollinearity indicate that there is no multicollinearity problem in the model (Table 4.3). Therefore, it is used for our analysis.
Test of Research HypothesisThe Student's t-test is calculated at 5% level of significance; the decision rule is based on the use of hypothesis testing on the calculated values of t-distribution for the data collected. We shall accept or reject H0 if the t-value for the test statistic falls within the acceptance or rejection region of the normal curve of distribution.
To get the degree of freedom we use the formula (n-1) wheren = number of observations.
In this case, the number of observation is 11. Therefore, we look up 10 under 0.05, (5% level of significance in a two-tail test under the t-distribution table and got the figure 2.228 which we can use to analyze our parameter.
The hypothesis formulated in this study was tested, the result of the study (see Table 4.3) provides evidence for the rejection hypothesis one. This clearly shows that economic growth is significantly influenced by company income tax.
Interpretation of Result The analysis and test of the research hypothesis on impact of company income tax on the Nigerian economy indicates that company income tax is positive and statistically significant to gross domestic product this is in agreement with Adebie, (2011) and Abiola (2012) who finds company income tax to be statistically significant to gross domestic product. This result could be interpreted that the high rate of tax imposed on companies are effectively assessed and collected by the relevant tax authorities and the issue of company income tax evasion and avoidance is at its minimal.
CONCLUSION AND RECOMMENDATIONSNigeria is part of the global community and should imitate policies that have benefited other countries. Company income tax is a veritable tool that can be used to enhance the development of Nigeria. The empirical and theoretical studies on the impact of company income tax on economic growth have increased but with mixed results, researches on the role of company income tax on economic growth are limited and leave a research gap.
This study,, therefore, examines the impact of company income tax on economic growth in Nigeria. The analyses are performed using data from CBN bulletin, NSE fact book and FIRS annual report for an eleven-year period (2007-2017). The multiple regression analysis techniques and descriptive statistics were used to analyze the data.
79Company Income Tax And Nigerian Economic Growth
Journal of Taxation and Economic Development ISSN 1118-6017 Vol. 18, (1), March 2019

The findings indicate that company income tax has significant influence over economic growth in Nigeria.
It is, therefore, recommended that to make Nigerian company income tax more effective and increase its impact to the economic growth of the nation, the following recommendations should be adopted: Firstly, full implementation of tax reforms agenda of 2003. The integrated tax office (ITO) introduced in 2004 should be adequately computerized and staffed with quality and experienced staff. When all facilities are in place with good remuneration and motivation for the staff, the issue of corruption will be eradicated. If companies operating are fully captured in the integrated system, the issue of non-disclosure of income and expenditure will be eradicated. Online payment of tax should be introduced. The Economic and Financial Crime Commission (EFCC) should be strengthened so that part of its roles should include the prosecution of tax evaders and tax avoiders. The policies of company income tax should be reviewed to block the loopholes that encourage tax avoidance where most companies capitalize on to avoid tax.
Lastly, the level of corruption in the management of tax revenue should be minimized to achieve the goals of a good tax system. The level of tax evasion in Nigeria should be reduced through an efficient and effective tax administration. The economy of Nigeria should be restructured for taxation to play a major source of non-oil revenue. There should be accountability and transparency from government officials on the management of revenue derived from taxation and also citizens should be able to benefit from the payment of taxes.
80Company Income Tax And Nigerian Economic Growth
Journal of Taxation and Economic Development ISSN 1118-6017 Vol. 18, (1), March 2019

REFERENCES
Abdulfattah, O. (2010). Nigeria: Yar ‘Adua’s nephew makes list. Daily Trust: http://allafrica.com/stories/201003240058.html
Adedeji, T. O.&Oboh, C. S. (2010): An empirical analysis of tax leakages and economic growth in Nigeria. European Journal of Economics, Finance and Administrative Sciences. ISSN 1450-2275 Issue 48 (2012) © Euro Journals, Inc. 2012
Adegbie et al (2011). Company income tax and Nigerian economic development. European journal of social sciences, 22(2).
Adereti, S. A, Sanni, M. R, & Adesina, J. A (2011). Value Added Tax and economic growth of Nigeria, European Journal of Humanities and Social Sciences 10(1) (Special Issue), 2011 © JournalsBank.com (2011). ISSN 2220-9425 457
Adeyeye, O. (2004). Integrated economics: A study of developing economics, Addison-Wesley Publishers Ltd.
Ahunwan, B. (2009). New national tax policy approval in Late December '08 – Nigeria. HG. Org Worldwide Legal Directories.
stAkpa, A and Angahar, P.A (1999). Essentials of research Methodology. 1 ed. Lagos:
Aboki Publishers.
Aluko, B. T. (2005). Building urban local governance fiscal autonomy through property taxation 110 financing option. International Journal of Strategic Property Management 9, no. 4, (December 1): 201-214.
Anyanwu, J.C., (2003). Nigerian public finance. Joanne Educational Publishers, Onitsha.
Ariyo, A. (1997) Productivity of the Nigeria tax system: 1970-1990. Department of Economics, University of Ibadan. Nigeria.
Arnold, J. & Martinez-Vazquez, J. (2011). Societal institutions and tax evasion in developing and transition countries”. A paper prepared for a Public Finance in developing and Transitional Countries Conference; Georgia State University
Asawa, J.U.B., (2012). Challenges of tax authorities, taxpayers in the management of tax reform processes. Niger. Account. 42(2), 36-42
Ayodele, O. (2006). Tax policy reform in Nigeria. World Institute for Developmental Economic Research (WIDER) Research Paper, Vol. 2006/03.
Bhartia, H.L.(2009): Public Finance. 14th Edn., Vikas Publishing House PVT Ltd, New Delhi.
thBlack law Dictionary of the English Language, 12 Edition, lexicon International,
Publishers Guild Group, New York, (1995).
Brautigam, D. (2008). Introduction: Taxation and satate-building in developing countries: Capacity and onsent, Cambridge University Press, Cambridge, pp. 1-33.
Chartered Institute of Taxation of Nigeria (2010). Why Nigeria's tax system is weak. Punch.
81Company Income Tax And Nigerian Economic Growth
Journal of Taxation and Economic Development ISSN 1118-6017 Vol. 18, (1), March 2019

Collins, J & Hussey, R. (2012). Business Research a practical guide for undergraduate ndand post graduate students, 2 Ed. New York. Palgrave Macmillan. International
Journal of Business and Social Science Vol. 3 No. 8 [Special Issue - April 2012]
Ezeoha, A.E. & Ogamba, E. (2010). Corporate tax shield or fraud? Insight from Nigeria. International Journal of Law and Management, 52(1), 5-20.
Fagbemi, T.O., Uadiale, O.M. & Noah, A.O. (2010). The Ethics of tax evasion: perceptual evidence from Nigeria. European Journal of Social Sciences, 17(3), 360-371.
Festus, A, F., & Samuel, F. A. (2007). Company income tax and Nigeria economic development. European Journal of Social Sciences, 22(2).
FIRS (2012) Federal Inland Revenue Services Website, Nigeria.
FIRS (2013). Gauge: A quarterly publication of the Federal Inland Revenue Service, April-June.
Garde, M (2004). A model of tax administration reform, Manila Bulletin.
Institute of Chartered Accountants of Nigeria ICAN (2006). Tax Management and Fiscal Policy in Nigeria VI publishing Ltd. 1st edition, 46-50
James, S. & Nobes, C. (2009) Economics for Taxation. 9th ed. Birmingham, Fiscal publications.
Jakir K. (2011). Role of tax revenue in economic development, James O. Alabede, Zaimah Zainol Ariffin and Kamil Md Idris, ¯Individual taxpayers'attitude and compliance behaviour in Nigeria: The moderating role of financial condition and risk preference. Journal of Accounting and Tax Revenue, 3(5), 91-104
Jhingan, M.L. (2004). Money, banking, international trade and public finance. Vrinda Publications, New Delhi.
Kayode, M.O. (1993). The national question and revenue allocation: An articulation of some of the problems and issues. The National Questions and Economic Development in Nigeria Ibadan: Nigerian Economic Society.
Kiabel, D. B. & Nwokah, G. N. (2009). Boosting revenue generation by state governments in Nigeria: The tax consultant option revisited. European journal of Sciences, 8(4).
Lamb, M. et al. (2005). Taxation: An Interdisciplinary Approach to Research, (ed.). New York, Oxford publication.
Likita; (1999). Elements of public finance. Marcel Business Centre 103 Lower Mission Road, Ilaro. First Edition.
Lopez, A. & Kadar, Z. (2001). Introduction to Taxation. International Tax Review: World Tax 2002, 1st Jan: 6-11. Available from: http://proquest.umi.com/.
thLymer, A. & Oats, L. (2010). Taxation policy and practice. 16 ed. Birmingham. Fiscal Publication
Miller, A & Oats, L (2009). Principles of international taxation, 2nd ed. West Sussex, Tottel publishing.
82Company Income Tax And Nigerian Economic Growth
Journal of Taxation and Economic Development ISSN 1118-6017 Vol. 18, (1), March 2019
Musa, W.E. (2004). Tax planning and Economic Development. International Research Journal on Economics ISSN 1450-2887, 4.
Naiyeju, J.K. (1996). Improving the Nigeria tax system from Canadian experience, Wordsmith Printing and Packaging Ltd, 101, 104
Nigeria (2006). Tax assessment procedure. FIRS Information Circular No: 2006/04, F e b r u a r y 2 0 0 6 . Av a i l a b l e f r o m h t t p : / / w w w. f i r s . g o v. n g / CMSTemplates/FIRS_SITE/downloads/Tax_Assessment_Procedure.ptf.
Nigeria: Country fact sheet (2011) EIU Views Wire July 16, Available from http://www.proquest.com/.
Nigeria (2009). Company income tax. Federal Inland Revenue Services. Available from: http://www.firs.gov.ng/companies-income-tax.aspx.
thNightingale, K. (2002). Taxation theory and practices. 4 ed. England Pearson
Education Ltd.
Ogbonna, A. (2010), “Nigeria Tax System Has not Come of Age – Kunle Quadri, CITN Pres ident . Dai ly Sun, Fr iday, August , 13 . Avai lable f rom: http://www.sunnewsonline.com/webpages/features/ceomagazine/index.htm.
Ola, C.S. (2001). Income Tax law and practice in Nigeria. 5th edition, Ibadan, Dalag Prints and Park.
Olaseyita, C (2012). Taxation in Western Nigeria. London Oxford University Press.
Olopade, C. & D.O. Olopade (2010). The Impact of Government Expenditure On Economic Growth And Development In Developing Countries: Nigeria As A Case Study.
Oloyede, F. (2011).Elements of taxation. Lagos, Libri Services Nig. Ltd.
Onyeukwu, H. (2010). Business tax in Nigeria: The controversy of multiple taxation. Corporate Governance.
Presidential Committee on National tax policy (2008). Draft document on the National Tax Policy.
Sanni, A, U (2007). Tax reform in the capital market: A welcome development. Seminar Paper Ogun State Internal Revenue Service Seminar.
Sekaran, U. & Bougie, R. (2010).Research methods for business: A skill building Approach, 5 ed.West Sussex, UK. John Wiley & Sons Ltd.
Soyode et al (2006). The theory and practice of income tax. Macmillan Press Ltd.
Stelltiz, C. et al (1976). Research methods in social relations. New York: Holt Rinehart rdand Wonstem 3 Edition.169
Syndelle, S. (2009). Taxes accountability & revenue in Nigeria. Nigeria Curiosity.com.
World Bank (1994). Tax policy in developing countries, edited by Javad, K. & Anwar, S. World Bank, Washington D.C.
83Company Income Tax And Nigerian Economic Growth
Journal of Taxation and Economic Development ISSN 1118-6017 Vol. 18, (1), March 2019

NEXUS BETWEEN FINANCIAL SECTOR DEVELOPMENT AND ECONOMIC GROWTH IN NIGERIA
Harrison VincentDepartment of Banking & Finance
Faculty of AdministrationNasarawa State University, Keffi, Nigeria
08169355509; [email protected]
S.A.S AruwaDepartment of AccountingFaculty of Administration
Nasarawa State University, Keffi, Nigeria08034511107; [email protected]
and
Gimba John ToroDepartment of Banking & Finance
Faculty of AdministrationNasarawa State University, Keffi, Nigeria
AbstractThis study evaluates the nexus between financial sector development and economic growth in Nigeria for the period 1986 to 2016. Secondary data were extracted from Central Bank of Nigeria statistical bulletin 2016. The dependent variable is Economic growth which was proxy by GDP and the independent variable is financial sector development which was proxy by credit to private sector and market capitalization while inflation rate as control variable. Expo-facto research design was thus used. The study applied multiple regression model of analysis using Eview statistical package version 8. It was found that financial sector development has positive and significant relationship with economic growth in the period of study. The study recommends that Central Bank of Nigeria (CBN) ensure effective compliance with its credit control policy which direct credit to more productive private sector activities and the Securities and Exchange Commission formulating strategies to deepen the Nigerian Stock market.
Keywords: Financial sector development, Market Capitalization, Bank Credit, Economic Growth, Nigeria
INTRODUCTIONThe Nigerian financial sector like those of many other less developed countries, was highly regulated leading to financial disintermediation which retarded the growth of the economy. The link between the financial sector and the growth of the economy has been weak. The real sector of the economy, most especially the high priority sectors which are also said to be economic growth drivers are not effectively and efficiently serviced by the financial sector. The banks are declaring billions of profit, the Market capitalization is hitting up to 13 trillion but yet the real sector continues to weak thereby reducing the productivity level of the economy. Most of the operators in the productive sector are folding up due to the inability to get loan from the financial institutions or the cost of
84Nexus Between Financial Sector Development and Economic Growth in Nigeria
Journal of Taxation and Economic Development ISSN 1118-6017 Vol. 18, (1), March 2019
borrowing was too outrageous. The Nigerian banks have concentrated on short term lending as against the long term investment which should have formed the bedrock of a virile economic transformation.
The global financial crisis which translated into economic meltdown of most nations led to several bail out of the financial sector (with public funds) by the governments of the affected countries with believe that once the financial sector is revived it will translate into reviving the economy and stimulate growth. This scenario however, will only be possible if there is positive relationship between the financial sector and the economic growth with causality running from the financial sector to economic growth. This provoked the need to investigate the relationship between the financial development and economic growth as public funds should not be used in bailing out the financial sector where such relationship does not exist or where the causal relationship runs from economic growth to financial development.
The gaps that prompted this study was that most studies conducted previously in Nigeria on the financial sector and economic growth used only one component of the financial sector such as Capital market or Banking Sector. Taking one component of the financial sector to represent the whole financial sector will not be an adequate sample of the entire financial sector. This is because for an effective intermediation function which is the key purpose of any financial sector to take place for both short and long term tenors, the collaboration of at least these few components selected for this study will be more appropriate. To fill the gap therefore, this study considered two components of the financial sector comprising banking credits and capital market to the financial sector together in relation to economic growth.
Therefore, this study questions the role financial system development plays in driving economic growth in Nigeria. To further express or investigate the extent to which the financial system has affected the economic growth in Nigeria the null hypothesis were formulated below:
Ho1: There is no significant relationship between bank Credits to private sector and economic growth in Nigeria
Ho2: There is no significant relationship between Market Capitalization and Economic growth in Nigeria
LITERATURE REVIEWConcepts of Financial sector development According to Adeoye (2007) the financial sector development is the hub of productive activity of an economy as it performs the vital role of intermediation, provider of payment services and the fulcrum of monetary policy implementation. Financial systems have long been identified as a sector that has an important role to play in the development of any economy. The financial sector has been described to be a catalyst of economic growth if it is developed and healthy. The reforms in the financial sector has enhanced the capacity of the market to provide windows of opportunities where large scale investors can raise funds to finance long-term projects and it has also lead to increase in employment opportunities as a result of increase in number of branches of banks.
85Nexus Between Financial Sector Development and Economic Growth in Nigeria
Journal of Taxation and Economic Development ISSN 1118-6017 Vol. 18, (1), March 2019

The level of financial development reflects the soundness of the financial sector and the ability with which credits are created with respect to lending and deposit rates. Financial development theory thus defines the positive role of the financial system on economic growth by the size of the sector’s activity. That means that an economy with more intermediary activity is assumed to be doing more to generate efficient allocations. According to Ndebbio (2004) economic growth and development of a country depends greatly on the role of financial deepening. He argued what is important is what constitutes the financial assets that wealth-holders must have as a result of high per capita income. It is only when we can identify those financial assets can we be able to approximate financial deepening adequately. In short, and for our purpose, financial deepening simply means an increase in the supply of financial assets in the economy.
Therefore, the sum of all the measures of financial assets gives us the approximate size of financial deepening. That means that the widest range of such assets as broad money, liabilities of non-bank financial intermediaries, treasury bills, value of shares in the stock market, money market funds, etc., will have to be included in the measure of financial deepening (Ndebbio, 2004). To simply pick the ratio of broad money (M2) to gross domestic product (Y), as done in this study, is because of lack of reliable data on other measures of financial assets likely to adequately approximate financial deepening in most SSA countries including Nigeria.
It is important to note that if the increase in the supply of financial assets is small, it means that financial deepening in the economy is most likely to be shallow; but if the ratio is big, it means that financial deepening is likely to be high. Many other authors have also defined financial deepening. The World Bank (1989) defines it as an increase in the stock of asset. Contributing, Shaw (1973:8) sees it as a process involving specialization in financial functions and institutions through which organized domestic institution and markets relate to foreign markets, profitable operation of other institutions as well via bill dealers to industrial banks and insurance companies. Opinionating, Nnanna and Dogo (1998) said that financial deepening often refers to a state of an atomized financial system, meaning a financial system that is largely free from financial repression. Financial deepening thus is the outcome of accepting appropriate real finance policy such as relating real rate of return to real stock of finance.
Concept of Economic Growth Economic growth means the growth in a nation’s real gross domestic product (an increase in a nation’s output of goods and services) or the physical expansion of the nation’s economy. (Antwi, Mills & Zhao, 2013) Economic growth can be illustrated as an upbeat change on the output of a nation’s manufacturing goods and services, stretching over a certain period of time (Kanu & Ozurumba, 2013)
Banking Sector Credit and Economic GrowthGherbi and Eddine (2016) examined the impact of financial development on economic growth in the context of the MENA countries. The study considers a number of measures of financial development that are: private credit to GDP, M2/GDP, the ratio of commercial bank assets to the total of commercial bank assets and central bank assets. They also take growth rate of real GDP as dependent variable and few core control
86Nexus Between Financial Sector Development and Economic Growth in Nigeria
Journal of Taxation and Economic Development ISSN 1118-6017 Vol. 18, (1), March 2019

variables of economic growth. Their study employed panel time series data over the year of 1980-2012 for each indicator for a split sample of 11 MENA countries. In order to measure the impact, this study analyzes the data by applying panel autoregressive distributed lag (ARDL) framework of pooled mean group (PMG), mean group (MG) and Dynamic fixed effect (DFE) estimators. The result obtained from PMG estimators demonstrates that the financial intermediary has a negative effect on the growth rate in the MENA countries in the short and long run. The paper concludes by pointing out directions to improve financial development in the MENA countries by applying more financial reforms to promote competition in the financial sector and financial structure expansion that reflects in the improvement of the quality and quantity of financial services. On the other hand, taking further steps to create an appropriate legal environment may further help the MENA countries to reap the utmost benefits by maximizing the potential role of the financial system in the real sector. However, there study focused on the money market.
Nwosu and Metu (2015) assessed the impact of financial development on economic growth in Nigeria using time series data from 1970 to 2012. The Autoregressive Distributed Lag bounds testing approach to cointegration was utilized for this study. The result from the ARDL model indicate that the variables for this study are cointegrated while the error correction term appeared significant and confirms that short-run disequilibria are corrected up to about 50 percent annually. The empirical results reveals that financial development exerts positive and significant impact on economic growth in the long-run while trade liberalization variables exert negative impact on economic growth in the long-run indicating non-competitive nature of non-oil domestic products in the international market. In the short-run, domestic credit is insignificant which indicates a dearth of investible funds in the economy. There is evidence that financial development policies influence economic growth in the long-run and not in the short-run. This study among others recommends the urgent need to implement policies that will strengthen the deposit mobilization and intermediation efforts in the banking system in order to deepen the financial system. Nigerian trade performance should be improved through economic diversification and further availability of funds to private sector at competitive interest rate in order to produce internationally competitive products.
Sunde (2012) determine the nature of the nexus between financial sector development and economic growth with specific reference to the Namibian economy. The reason why I carried out this study is that no similar study has yet been carried out in Namibia and the nature of the relationship between financial development and economic growth is still not known. This study, therefore, is the first step in attempting to provide literature that could be useful to policy makers and academics in Namibia. We used the Granger causality tests to establish the relationship among the financial sector indicators and economic growth indicators after having carried out the unit root and co integration tests. The results show that the Granger causality between financial development and economic growth is by and large bidirectional. In other words, this means that when the economy grows the financial sector may respond positively and vice versa. We also found that the financial sector variable, the logarithm of the ratio of private sector credit to gross domestic product (GDP), Granger caused the real variables, logarithm of real GDP, and logarithm of real income per capita. This is in line with the conclusion above
87Nexus Between Financial Sector Development and Economic Growth in Nigeria
Journal of Taxation and Economic Development ISSN 1118-6017 Vol. 18, (1), March 2019

that real variables could respond favorably to financial variables. So causality in this case is running from financial variables to real sector variables. The article ended with a cautionary statement on the size of the sample used and the general availability of statistical data on the Namibian economy, which could have negatively affected the authenticity of the results.
Kiran, et al., (2009) investigated the relationship between financial development and economic growth for ten emerging countries over the period 1968–2007. Three measures of financial development (ratio of liquid liabilities to GDP, bank credit to GDP, and private sector credit to GDP) were used to quantify the impact of financial development on economic growth. The results concluded that financial development has a positive and statistically significant effect on economic growth.
Sanusi and Salleh (2007) examined the relationship between financial development and economic growth in Malaysia covering the period 1960-2002. Three measures of financial development were used, namely, ratio of broad money to GDP, credit provided by the banking system, and deposit money banks to GDP. By employing the autoregressive distributed lag approach, the study found that ratio of broad money to GDP, and credit provided by the banking system have positive and statistically significant impact on economic growth in the long-run. The results further indicated that a rise in investment will enhance economic growth in the long-run. Using panel analysis and Fully Modified OLS (FMOLS) methods.
Market Capitalization and Economic GrowthRezwanul and Barua (2015) examines the relationship between financial development and economic growth using panel data for five emerging South Asian countries - Bangladesh, India, Nepal, Pakistan and Sri Lanka. The heterogeneous panel data is collected from the World Bank for the period of 1974 to 2012. Economic Growth is represented by GDP growth rate, and for Financial Development, five major variables have been used: (i) Domestic Credit Provided by Financial Sector, (ii) Total Debt Services, (iii) Gross Domestic Savings, (iv) Broad Money, and (v) Trade Balance. Fixed Effect Panel regression model has been used and Time Fixed Effect, Cross Sectional Dependence, Heteroskedasticity, Serial Correlation and Cointegration have been tested for model fitness. The results indicate that growth of total debt services and domestic savings have significant impact on economic development of these countries. Interestingly, broad money, trade balance and domestic credit have no considerable influence on fostering economic growth which is generally unexpected. The paper places several arguments to explain these results. The study appears to be a first hand examination on the South Asian countries and adds new insight into the existing literature. The findings and discussions presented would be valuable in designing long term financial and macroeconomic policies by these countries.
Ewetan and Okodua (2013) investigates the long run and causal relationship between financial sector development and economic growth in Nigeria for the period 1981 and 2011 using time series data. Results from a multivariate VAR and vector error correction model support evidence of long run relationship between financial sector development and economic growth in Nigeria. Granger causality test results also confirm the
88Nexus Between Financial Sector Development and Economic Growth in Nigeria
Journal of Taxation and Economic Development ISSN 1118-6017 Vol. 18, (1), March 2019

cointegration results indicating there exist causality between financial sector development and economic growth in Nigeria. The nature of the causality however depends on the variable used to measure financial development. The results demand that government should implement appropriate regulatory and macroeconomic policies to consolidate on the gains of previous financial sector reforms.
Khan, Ahmad and Siraj (2011) has it that financial sector development is an effective instrument that can bring reduction in poverty. Financial sector can be developed by four different ways, by improving efficiency of the financial sector, by increasing range of financial sector, by improving regulation of the financial sector and by increased accesses of more of the population to the financial services. For estimating effect of financial sector development on poverty we divided financial sector into four sectors, Banking sector, Insurance companies, Stock market and Bond market. Gini= f (Banking sector, Insurance companies, Stock market and Bond market) For banking sector, they used variables, central bank assets to GDP, deposits money banks assets to GDP, bank deposits, concentration, overhead costs and net interest rate. For insurance company they used variable non-life insurance, to capture the effect of stock market variable stock market turnover ratio used. For bond market both market capitalization to GDP and public bond market capitalization to GDP are used. This study attempts to make analysis of the relationship between financial sector development and poverty for different countries. Growth depends on financial sector development and poverty depends on growth, here the negative relation of poverty and financial sector development tested.
Adelakun (2010) examines the relationship between financial development and economic growth. In his study, he perceived relationship between financial development and economic growth is estimated econometrically using the Ordinary Least Square Estimation Method (OLSEM). The result showed that there is a substantial positive effect of financial development on economic growth in Nigeria. The Granger causality test showed that financial development promotes economic growth, but there is evidence of causality from economic growth to the development of financial intermediaries. Thus, advancement of the financial sector development, including diversification of financial instruments should be pursued to facilitate economic development in Nigeria.
Nkoro and Uko (2009) examines the financial sector development-economic growth nexus in Nigeria. In doing this, the study employed the cointegration/Error Correction Mechanism (ECM) with annual dataset covering the period, 1980-2009. Five variables, namely; ratios of broad money stock to GDP, private sector credit to GDP, market capitalization-GDP, banks deposit liability to GDP and Prime interest rate were used to proxy financial sector development while real gross domestic product proxy growth. The empirical results show that there is a positive effect of financial sector development on economic growth in Nigeria. However, credits to private sector and financial sector depth are ineffective and fail to accelerate growth. This signifies the effect of government borrowings, the problem of huge non-performing loans, and a deficient legal system on the private sector. These inefficiently and severely limit the contribution of Nigeria’s financial sector development to economic growth. To sustain and enhance the existing relationship between financial sector development and economic growth in Nigeria, there is need to adequately deepen the financial system through innovations,
89Nexus Between Financial Sector Development and Economic Growth in Nigeria
Journal of Taxation and Economic Development ISSN 1118-6017 Vol. 18, (1), March 2019

adequate and effective regulation and supervision, a sound and efficient legal system, efficient mobilization of funds and making such funds available for productive investment and improved services.
Azege (2004) examines the empirical nexus between the level of development by financial intermediaries and growth. The study employed data on aggregate deposit money bank credit over time and gross domestic product to establish that a moderate positive relationship exist between financial deepening and economic growth. He concludes that the development of financial intermediary institutions in Nigeria is fundamental for overall economic growth.
Tokunbo (2001) examined the impact of stock market on economic growth of Nigeria, using time series data from 1980 – 2000. The results showed that there was a positive relationship between growth and all the stock market development variables used.
Goldsmith TheoryGoldsmith (1969) was one of the foremost to recognize the role of financial intermediaries in the institutionalization of savings. Since the growth process is financed either through domestic funds or foreign funds or both, the sources and uses of funds and their method of financing throw light on the factors determining the demand for funds. In this context, the role of financial intermediaries in mobilizing savings and channeling them to various sectors become crucial. Recognizing this, Goldsmith analyzed the volume of assets of various financial intermediaries, trends in their types and distribution, in relation to long-run economic growth. According to Goldsmith, the development of financial intermediaries and the trend of their share in national asset and wealth particularly are important from the economist's point of view. It indicates the extent and character of financial interrelations, which in turn helps to determine how capital expenditures are financed and how existing assets are shifted among owners. These together are important in directing the flow of savings into investment and also their size, which in turn stimulates economic growth. Goldsmith (1958) illustrates that despite the growth of all financial intermediaries in the first half of the twentieth century, the claims of non-bank financial intermediaries increased relative to the claims of demand deposits of commercial banks thereby diminishing their importance among all financial intermediaries. This implied that with the relative decline in the share of commercial banks, the ability of the central banks to control economic activity weakens and it called for a direct control of the non-bank intermediaries.
Goldsmith (1969) found that the nature of financial structure in less developed countries as compared with developed ones is such that a small proportion of primary securities to Gross National Product and aggregate saving is issued by individual economic unit, which is acquired through financial intermediaries. Besides, the central bank accounts for about two-thirds of all claims on financial intermediaries, which are held by the public. This implies that there is greater dependence on self-finance and thereby hardly any direct contact between the primary borrower and the ultimate lender. He demonstrated that as real income and wealth increase both in terms of aggregate and per capita levels, the size and complexity of the financial super structure also grows. Economic growth was associated with expanding size and increasing complexity of financial structure.
90Nexus Between Financial Sector Development and Economic Growth in Nigeria
Journal of Taxation and Economic Development ISSN 1118-6017 Vol. 18, (1), March 2019

METHODOLOGYThe research design for this study was expo-facto research design. This research design was adopted for this study because of its strengths as the most appropriate design to use when it is difficult to select, control and operate all or any of the independent variables or when laboratory control will be impracticable, costly or ethically questionable. The research data to be employed in analyzing financial sector development and economic performance in Nigeria was secondary data from CBN statistical bulletin from 1986 to 2016. For the purpose of this research, the ordinary least square (OLS) multiple regression model was used to estimate the variables.
The estimation shall be conducted using the econometric computer software package, E-Views version 8.0.
The following regression model was estimatedGDPt = ß0 + ß1CPSt + ß2MCAPt + ß2IFLt + et
Where:GDPt = Gross Domestic Product (dependent variable) β0 = Constant term
β1 = Coefficient of the parameter estimates
The explanatory variables are: CPSt = Banking Sector Credit to Private sectors (Independent Variable)MCAPt = Market Capitalization (Independent Variable)IFLt= inflation Rate (control variable)e = Error Term
RESULT AND DISCUSSIONSHo: Financial Sector Development has no significant effects on economic growth in
Nigeria.
Descriptive Statistics
91Nexus Between Financial Sector Development and Economic Growth in Nigeria
Journal of Taxation and Economic Development ISSN 1118-6017 Vol. 18, (1), March 2019
CPS MCAP GDP IFL Mean 4476.244 4801.331 25978.59 20.69917 Median 764.9600 662.5000 8134.140 12.16854 Maximum 21082.72 19077.42 101489.5 76.75887 Minimum 15.25000 6.800000 202.4400 0.223606 Std. Dev. 6594.423 6494.938 32348.39 19.44263 Skewness 1.311135 1.018505 1.119790 1.574500 Kurtosis 3.243367 2.453527 2.853430 4.248097
Jarque-Bera 8.958396 5.745389 6.506387 14.82052 Probability 0.011343 0.056546 0.038651 0.000605
Sum 138763.6 148841.3 805336.4 641.6742 Sum Sq. Dev. 1.30E+09 1.27E+09 3.14E+10 11340.48
Observations 31 31 31 31

This table presents the descriptive statistics for both the dependent and explanatory variables of the study that is Credit to Private Sector, Market Capitalization, Gross Domestic Product and Inflation rate. The number of observations for the study reflects a value of 31 indicating that the number of observation for the study is made up of a period of 31years (1986-2016). The table also shows the mean of Credit to Private Sector, Market Capitalization, Gross Domestic Product and Inflation rate as 4476.244, 4801.331, 25978.59 and 20.69917 respectively. While the maximum values of CPS, MCAP, GDP and IFL are 21082.72, 19077.42, 101489.5 and 76.75887 respectively, with minimum values as 15.25000, 6.800000, 202.4400 and 0.223606 in the same arrangement.
Unit Root TestGroup unit root test: Summary Series: CPS, MCAP, GDP, IFLDate: 06/12/18 Time: 16:04Sample: 1986 2016Exogenous variables: Individual effectsAutomatic selection of maximum lagsAutomatic lag length selection based on SIC: 0 to 3Newey-West automatic bandwidth selection and Bartlett kernel
** Probabilities for Fisher tests are computed using an asymptotic Chi-square distribution. All other tests assume asymptotic normality.
From the group unit root table, the series CPS, MCAP, GDP and IFL were not stationary at conventional level. However, it was stationary at first difference level. The Im, Pesaran and Shin W-stat, ADF – Fisher Chi-square and PP – Fisher Chi-square all has statistic values of -2.78657, 31.9459 and 46.4438 respectively. With their associated p-value (for a test with 109 observations) of 0.0027, 0.0001 and 0.0000 respectively. Therefore, we reject the null at first difference test.
Serial Correlation
The Breusch-Godfrey Serial Correlation LM Test indicates that, there is no autocorrelation. This is given by the F-statistic of 3.598014 and its corresponding P-value of 0.0705.
92Nexus Between Financial Sector Development and Economic Growth in Nigeria
Journal of Taxation and Economic Development ISSN 1118-6017 Vol. 18, (1), March 2019
Cross- Method Statistic Prob.** sections Obs Null: Unit root (assumes individual unit root process) Im, Pesaran and Shin W-stat -2.78657 0.0027 4 109 ADF - Fisher Chi-square 31.9459 0.0001 4 109 PP - Fisher Chi-square 46.4438 0.0000 4 116
Breusch-Godfrey Serial Correlation LM Test: F-statistic 3.598014 Prob. F(1,23) 0.0705
Obs*R-squared 3.922940 Prob. Chi-Square(1) 0.0476

Heteroskedasticity Test
The Breusch Pegan Test of Heteroskedasticity given the F-statistics 1.191614 and its corresponding P-value of 0.3323 indicates that there is no problem of heteroskedasticity and this is corroborated by observed Rsquared of the auxiliary regression P-value of 0.3048.
Regression OutputDependent Variable: GDPMethod: Least SquaresDate: 06/12/18 Time: 16:18Sample (adjusted): 1987 2016Included observations: 30 after adjustments
The Regression table reveals a statistically significant relationship between GDP, CPS, MCAP and IFL. The estimate of this equation reveals a positive intercept which stands at 5277.535. This implies that when CPS, MCAP and IFL are zero, GDP would stand at 5277.535. The slope of the estimated model also shows a positive and statistically significant relationship between CPS and GDP, with its value being 3.609865, and a p-value of 0.0000, any 1 unit change in CPS would cause GDP to change by 3.609865 units in the same direction. While MCAP and GDP exert positive and significant relationship, with its value being 1.246399 and a p-value of 0.0020. But IFL and GDP exert a negative and insignificant relationship, with its value being -71.61898, and a p-value of 0.0818, any 1 unit change in IFL would not cause GDP to change.
93Nexus Between Financial Sector Development and Economic Growth in Nigeria
Journal of Taxation and Economic Development ISSN 1118-6017 Vol. 18, (1), March 2019
Heteroskedasticity Test: Breusch-Pagan-Godfrey F-statistic 1.191614 Prob. F(3,26) 0.3323
Obs*R-squared 3.626233 Prob. Chi-Square(3) 0.3048 Scaled explained SS 3.156797 Prob. Chi-Square(3) 0.3681
Variable Coefficient Std. Error t-Statistic Prob. C 5277.535 1355.416 3.893664 0.0006
CPS 3.609865 0.376410 9.590245 0.0000 MCAP 1.246399 0.363410 3.429731 0.0020
IFL -71.61898 39.56431 -1.810191 0.0818 R-squared 0.984692 Mean dependent var 23461.56
Adjusted R-squared 0.982926 S.D. dependent var 29653.51 S.E. of regression 3874.771 Akaike info criterion 19.48593 Sum squared resid 3.90E+08 Schwarz criterion 19.67275 Log likelihood -288.2889 Hannan-Quinn criter. 19.54569 F-statistic 557.4901 Durbin-Watson stat 1.014611 Prob(F-statistic) 0.000000

Finally, the test of goodness of fit reveals that the estimated relation has a good fit. While 2 2both the R and adjusted R , which stand at 98% and 98% respectively, revealed that
about 98% of total variations in economic growth is explained by variations in financial sector development; the f-statistic, which reveals the joint significance of all estimated parameters in predicting the values of GDP, is statistically significant with a value of 557.4901 and a p-value of 0.0000. Since the p-value is less than 0.05, which is the accepted level of significance for this research, the researcher hereby rejects H0 and 1
H0 .2
CONCLUSION AND RECOMMENDATIONSThis research work investigated the nexus between financial sector development on economic growth in Nigeria over the period of 1986-2016.From the findings, it is clear that financial sector development has a positive and significant relationship with economic growth in Nigeria, this is line with the Goldsmith theory (1969). According to Goldsmith, the development of financial intermediaries and the trend of their share in national asset and wealth particularly are important from the economist's point of view. It indicates the extent and character of financial interrelations, which in turn helps to determine how capital expenditures are financed and how existing assets are shifted among owners.
Considering the importance of the financial sector to economic growth and development, the Securities and Exchange Commission (SEC) and the Nigerian Stock Exchange (NSE) should strive to improve on market capitalization of the stock market by attracting listing and increased trading activities. In other words, deepening the capital market, the present state of the Nigerian stock market is not unconnected with low literacy level and poor corporate governance issues. And also credit control by the CBN should be more effective to channel credits to more productive core private sector.
94Nexus Between Financial Sector Development and Economic Growth in Nigeria
Journal of Taxation and Economic Development ISSN 1118-6017 Vol. 18, (1), March 2019
REFERENCES
Adelakan, O.J. (2010). Financial sector development and economic growth in Nigeria.International Journal of Economic Development Research and Investment. 1(1)
Adeoye B.W (2007). Financial sector development and economic growth: The Nigerian th
experience. Being a paper presented at the 48 annual conference of the Nigerian economic society, Abuja
Azege, M. (2004). The Impact of Financial Intermediation on Economic Growth: The Nigerian Perspective. Lagos State University. Central Bank of Nigeria (2009)
Cooray, A. (2010). Migrant remittances, financial sector development and the Government ownership of Banks. European Economics and Finance Society Conference (pp. 1-27). Athens, Greece: European Economics and Finance Society.
Dicle, B., Dicle, M., (2010). Military spending and GDP growth: is there a gen-eral causal relationship? Journal of Comparative Policy Analysis 12 (3), 311–345.
Filer. H (1999). Do Stock Markets Promote Economic Growth? Working Paper No.267.
Goldsmith, R. W. (1969), Financial Structure and Development, New Haven, Coon, Yale University Press.\
Kasekende, L. (2008). Developing a Sound Banking System. Paper presented at IMF Seminar, Tunisia.
Khan, M.S., & Senhadji, A.S. (2003). Financial Development and Economic Growth; A review and new evidence, Journal of African Economics, 12, AERC Supplement 2: ii89-ii110.
Kiran, B., N.C. Yavuz and B. Guris, (2009). Financial development and economic growth: A panel data analysis of emerging countries. Int. Res. J. Financial Economics, 30(2): 87-94.
King, R. G. and Levine, R. (1993). “Finance, entrepreneurship, and growth– Theory andevidence”. Journal of Monetary Economics 32: 513-542
Levine, R. (2002). “Bank-Based or Market-Based Financial Systems: Which is Better?Journal of Financial Intermediation 11, 398–428
Mishkin, F.S. (2007). The Economics of Money and Financial Markets, Pearson/Addison Wesley.
Ndebbio, J.E. (2004). “Financial deepening, economic growth and development: Evidence from selected Sub-Saharan African countries”. African Economic Research Consortium, Nairobi. Research Paper 142, August.
Ndebbio, J.E. (2010) Financial Deepening, Economic Growth and Development: Evidence from Selected Sub-Sahara African Countries, AERC Research Papers No. 142 African Economic Research Consortium, Naira.
Nnanna, O. J. and Dogo, M. (1998). Structural Reform, Monetary Policy and FinancialDeepening: The Nigerian Experience. Economic and Financial Review, Vol. 36 No. 2, June. Pp 1-29.
95Nexus Between Financial Sector Development and Economic Growth in Nigeria
Journal of Taxation and Economic Development ISSN 1118-6017 Vol. 18, (1), March 2019

Nkoro E. & A. Uko (2013). Financial Sector Development, Economic Growth Nexus: Empirical Evidence from Nigeria. American International Journal of Contemporary Research Vol. 3
Nwosu, C. & Metu, A. (2015). Financial Development and Economic Growth Nexus in Nigeria, Journal of Economics and Finance, Volume 6, Issue 4.
Pal, P. (2006). Foreign Portfolio Investment, Stock Market and Economic Development: A Case Study of India, Annual Conference on Development and Change Mission: Promoting Development in a Globalized World, Sao Paolo, Brasil.
Patrick H. (1966): “Financial Development and Economic Growth in Underdevelopment Countries: Economic Development and Cultural Change”. Vol. 14 No. 2.
Randall (1999). The 1966 Financial Crisis: A case of Minskian instability, Working Paper no. 262, Annandale-on-Hudson, N.Y.: The Jerome Levy Economics Institute, January
Ray, D. (1998). Development Economics. Princeton: Princeton University Press.
Rezwanul Hasan Rana & Suborna Barua (2015) Financial Development and Economic Growth: Evidence from a Panel Study on South Asian Countries. Asian Economic and Financial Review, Vol. 5, No. 10, pp.
Sanusi, N. A & Sallah, N. H. (2007). Financial Development and Economic Growth in Malaysia: An Application of ARDL Approach. Proceedings Papers.
Schumpeter, J.A. (1912).The Theory of Economic Development, Leipzig: Dicker and Humblot, Translated by Redvers Opie, Harvard University Press, Cambridge, MA
Shaw, E.S. (1973). Financial deepening in economic development. Oxford University Press, New York.
Udenwa T.A & Uwaleke J.U. (2015). Understanding Nigerian Financial System, Pearl Publishers, Port harcourt, Nigeria.
96Nexus Between Financial Sector Development and Economic Growth in Nigeria
Journal of Taxation and Economic Development ISSN 1118-6017 Vol. 18, (1), March 2019
MEASUREMENTS OF ECONOMIC DEVELOPMENT: DOES HUMAN DEVELOPMENT INDEX MATTER IN THE CONTEXT OF NIGERIA?
Peter Okoeguale IbadinDepartment of Accounting
Faculty of Management Sciences University of Benin, Benin City, Nigeria
+2348136667575; [email protected]
and
Ofiafoh EiyaDepartment of Accounting
Faculty of Management Sciences University of Benin, Benin City, Nigeria
+2348051488152
AbstractThe economic development literature is replete with measures that capture the operationalisation of economic development, one of which is the Gross Domestic Product (GDP). The GDP is the most widely used metric for assessing an economy’s performance, or economic development, as it measures the market value of all final goods and services produced within a country in a given period. Currently, there is the argument that GDP or its ally, the Gross National Product (GNP), is not an adequate measure of economic development because it does not measure progress in the well-being of people. Measures and measurements of economic development go beyond the mere expressions provided by the GDP, GNP or any other variants used in the ensuing model of GDP or GNP. The relatively current index, the Human Development Index (HDI), has been strongly expressed as a measure of economic development; but there are some limitations when the HDI is applied to all economic situations. It is against this backdrop that this paper proposes a HDI that will accommodate the peculiarities of Nigeria, given the poor level of education and health facilities in the country. To this end, the paper proposes modified variants of HDI, namely the standard of living and the education indexes which should be reviewed to reflect the aforementioned and identified level of development in the country. Beyond this, a comparable level of economic development with global best practices should spur up concerted and sincere efforts among stakeholders in building and developing human capacity through adequate educational funding across all levels, as well as providing good health-care facilities that will ensure human longevity and improved living standards of the people.
Keywords: Economic development, Gross domestic product, Gross national product, Human development index, Nigeria.
INTRODUCTIONAccounting has gone beyond considering only historical financial measures of performance but now includes strategic non-financial measures of performance, in order to determine areas that need improvement in the economic development of nations
97Measurements of Economic Development: Does Human Development Index Matter In the Context of Nigeria?
Journal of Taxation and Economic Development ISSN 1118-6017 Vol. 18, (1), March 2019

because without such improvements, nations and countries will be hunted by poverty and penury. Economic development remains a focal point of all countries – both developed and developing- because it is the means to determine the ‘welloffness’ of peoples of such countries. Economic development has been variously described: The International Economic Development Council (IECD) (2001) described economic development as an attempt to enhance the economic well-being of communities and societies that make up a given country. Besides, and in general terms, governments initiate policy intervention efforts to improve economic and social well-being, which in turn improve the quality of life of people (Ofoegbu, Akwu, & Oliver, 2016).The development of an economy will be made possible by measuring its performance and continuous refinement of its measures (Jacobs & Slaus, 2010).Such refinements and improvements include the changes in the distribution of output and economic structures. These changes involve improvement in the well-being of the poorer half of the population, improvement in the education and skills of the labour force and technological advancement in the country (Nafziger, 2006). Therefore, economic development refers to enhancement in the economic activities in the community.
Globally, governments take action to improve their economies, societies, environments and the way of life by creating a better life for their citizens. Unfortunately, however, very little is done on the evaluation of the measurements of economic development indicators which have appeared in the literature. Economic development indicators in general terms have expressions of innovations instituted, investments, savings, international linkages, intellectual capabilities, infrastructure, employment, sustainability, fiscal and price stability, amongst others. These indicators, when raised, have the potentialities of achieving long-run economic growth and development objectives in ways, that do not only ensure progress in economic goals but also benchmark performance against those of other nations (Smol, Whitehead, & Bascand, 2011)
The measurements of economic development have been expressed in Gross Domestic Product (GDP), Gross National Product (GNP) and Human Development Index (HDI) (Deb, 2015). Of these measures, the GDP is the most widely followed metric for assessing an economy’s performance and captures the market value of all final goods and services produced within a country in a period (Stefan, 2006). Currently, there is the argument that GDP and GNP are not adequate measures of economic development because they do not measure progress in the well-being of people Such as fundamental difference in the perception of GDP as an economic measure, led to the introduction of HDI in 1990 in the Human Development Report (HDR) by the United Nations Development Programme (UNDP) (Jahan, 2014). The UNDP’s establishment of the HDR expanded both the availability of measurement and comparison tools used by governments, Non-Government Organizations(NGOs), professionals and researchers, alike (Stanton, 2007). HDI has been proposed as a better way to measure human well-being and evaluate economic development than the traditional GDP or GNP (Gallardo, 2009). This is because HDI covers achievements in three basic dimensions of education, health and standard of living; this becomes true when viewed against the fact that economic development is beyond just expanding wealth and income (Kovacevic, 2010).But the use of HDI cannot be used hook, line and sincker without constraints, as such acceptance of its use as proposed in the UDR may not reflect the same defined
98Measurements of Economic Development: Does Human Development Index Matter In the Context of Nigeria?
Journal of Taxation and Economic Development ISSN 1118-6017 Vol. 18, (1), March 2019

indices of HDI that are comparable globally without the peculiarities of the individual world economies.
Given the foregoing, this study examines the HDI and proposes a modification of the components of this measure. To this end, section 2 addresses the concepts of Gross Domestic Product (GDP), Gross National Product (GNP) and Human development index (HDI). This is followed by section 3 which addresses the components of Human Development Index (HDI). Section 4 offers some suggestions for improvements. The paper is concluded in section 5.
The Concept of Economic DevelopmentEconomic development(ED) is a process where low income national economies are transformed into modern industrial economies; and it involves both qualitative and quantitative improvements in a nation’s economy (Shodhganga, 2011). ED includes not only the rate of change in economic wellbeing but also to its level (Nafziger, 2006). In a seemingly narrow perspective. Smol et. al. (2011) identify six drivers of higher economic performance in nations to include, among others, better public services; a global competitive regulatory environment; an efficient and fair tax system; productive infrastructure investment; higher skills; support for science; innovation and trade. In a similar but broader perspective, ED is a process that influences growth and restructuring of an economy to enhance the economic well-being of a community. It involves ensuring jobs creation, wealth creation and improving the quality of life (IEDC, 2001). The major aim of ED is to improve the economic well-being in a society through efforts that entail job retention, job creation, quality of life and tax base enhancements.
ED has three core values which include: life sustenance, self-esteem and freedom (Shodhganga, 2011). The United Nations Human Development Report (1990) asserts that economic development creates an environment in which people can expand for both present and future generations. Such expansion takes into account both economic and non-economic aspects, as well as the removal of main sources of poverty, poor economic opportunities and systematic social deprivation, neglect of public facilities including intolerance or over activity of repressive states. Since economic development is concerned with economic, social and institutional mechanisms which are necessary for bringing large scale improvements in the levels of living of the masses, then measures of economic development are crucial and germane.
Measures of Economic DevelopmentEconomic development is a multi-dimensional concept with no sacrosanct single measure of economic development that completely captures the whole process (Shodhganga, 2011).The list of measures is not however restricted to the following:
Gross Domestic Product (GDP)GDP is a broad measure of aggregate economic activity, using the product approach, the expenditure approach, and the income approach (Maroni, 2011). It is a tool that provides the government an estimate of the amount that could be spent and by how much revenues could increase without inflationary pressures in the economy. GDP includes market production and some non-market production and it is valued at market prices. Beyond this, GDP measures current production which is equal to the value of goods and services
99Measurements of Economic Development: Does Human Development Index Matter In the Context of Nigeria?
Journal of Taxation and Economic Development ISSN 1118-6017 Vol. 18, (1), March 2019

for final users. It is a gross measure and captures output produced. On ways of measurement, GDP can be measured in three different ways: first, as the sum of expenditures or purchases by final users, being used to identify the final goods and services purchased by persons, businesses, governments and foreigners. Second, GDP is used to examine the purchasing power of households and the financial status of business income. Third, GDP can also be measured either as total revenue less the value of intermediate inputs or as the addition of the value added at each phase of the production process (Bureau of Economic Analysis of U.S. Department of Commerce, 2015). However, Costanza, Hart, Posner and Talberth (2009) have argued that GDP could measure the monetary transactions related to the production of goods and services. Some have even described GDP as a measure of welfare or wellbeing (Stefan, 2006)..
However, GDP measures only the market value of final goods and services produced in a country but does not really and truly capture economic development. It is argued that GDP does not reflect the basic quality of lives and human needs (Shodhganga, 2011). GDP accounts for production of output but fails to accommodate the roles of human capital, natural resources and the environment in the production base. Besides, there is a dearth of accurate data availability for GDP estimates due to the misleading inadequate and unreliable statistical information. Other major limitations are : i) measurement of income produced in a country as against the income generated and received by the people in that country (ii) Accounting for the monetary transactions, including the estimates for those in the shadow economy, while it ignores many other activities such as caring for children or elderly at home, the value of leisure time spent relaxing or with friends and family.
Miklos and Jeroen (2014) criticize GDP as a measure of estimate of costs rather than a measure of estimate of benefits of all market-related economic activities. GDP does not capture various social costs. This negates the principles of proper accounting. Beyond this, GDP when used for inter- country comparisons of economic development based on official exchange rates, does not reflect local purchasing power. This makes it difficult to compare standards of living of people of various countries. In all sense, GDP, as a measure, ignores transaction costs, social costs, environmental impacts, income inequality, and this measure cannot show whether things seem to be getting better or getting worse (Guarav, 2014).Therefore, many agendas and global frameworks today recognize the need for a broader view of economic development that focus on the comprehensive economic and human well-being rather than only the economic well-being (Deb, 2015).
Gross National Product (GNP)GNP refers to an estimated value of the total worth of production of goods and services, generated by citizens of a country, on its land or on foreign land, calculated over the course of one year (Morgan, 2012). In general terms, GNP is the total market value of all business production and service sector industry in a nation, including its gain on foreign investment. This measure presents a full picture of the economic well-being of the country’s nationals and measures the income of the people in a nation and excludes the economic activity of foreigners.
100Measurements of Economic Development: Does Human Development Index Matter In the Context of Nigeria?
Journal of Taxation and Economic Development ISSN 1118-6017 Vol. 18, (1), March 2019

GNP has some measurement approaches in the literature; one approach is the expenditure approach which determines the aggregate demand by summing up the consumption, investment, government expenditure and net exports. Another measure is the summation of wages, rents, interest, profits, non-income charges, and net foreign factor income earned, which reflect the income and output method. These three methods yield the same outcome because total expenditures on goods and services are equal to the value of goods and services produced which is equal to the total income paid to the factors that produced the goods and services. Expenditure method which is the most common approach for calculating GNP is mathematically shown as:
GNP = GDP + NI (Net income inflow from abroad – NO (Net income outflow to foreigners).
From the onset of modern national income accounting, it has been a contentious issue in deciding which products of human activity belong in GNP. There is the argument for including the goods that are scarce and legally exchanged in the market place (England & Harris, 2005). This accounting criterion is seen as an arbitrary one because lots of sources of human satisfaction remain unmeasured and undetected by national income accountants once the criterion is officially adopted. The GNP fails to account for environmental costs and values(dirt, air pollution with its attendant consequences such as deterioration, and so on (Learner, 2012).Other criticisms listed by Haque (2004) include the existence of perfect market competition which hardly exists, the cross-national comparison of GNP for a common currency (like the US dollar) which is problematic because the official exchange rates do not always reflect income and price differences among countries; inability of GNP to measure non-economic dimension of human welfare. The GNP is also discredited as a measure of economic development because there is no direct relationship between economic development and GNP growth rate. Stiglitz (2009) has argued that GNP imperfectly reflects society’s total output, excuding other dimensions to human welfare.
Human Development Index (HDI)Kovacevic (2010) has argued that technological advancement increases the ability to live healthier and longer lives, leading to extraordinary decline in mortality rates at all ages, including the automatic reduction of fatal diseases and sufficient increase in life expectancy.
The first Human Development Report (HDR) of the United Nations Development Programme, released in 1990 (United Nations Development Programme,1990), 1990;Sagar & Najam,1998), was an important document that first resulted in the in the debate on the measurement of development. Eventually, it distilled various concepts that had been raised in earlier development discussions into a unified theme of ‘human development’. It also provided a handy, if preliminary, framework for measuring performance on the dimensions of human development through the human development index (HDI).
Human Development Index (HDI) is arguably the world’s best-known index of societal well-being (Osberg & Sharpe, 2005); and it measures a country's achievement in healthy and long life, knowledge and decent standard of living. These three (3) components have been captured in life expectancy at birth, school enrollment and
101Measurements of Economic Development: Does Human Development Index Matter In the Context of Nigeria?
Journal of Taxation and Economic Development ISSN 1118-6017 Vol. 18, (1), March 2019

literacy rates as well as GDP per capital ((Byte, 2015). Morgan (2012) has argued that the focus for better measurement of economic development should not be fixed on purchasing power but rather on living power.
The idea on human development index was introduced in the Human Development Report (HDR) of 1990. The HDR (1990) was an attempt to take incorporating the view of human beings as ends in the accounting and assessment of development (Anand & Sen, 2000).The intent is to put people at the center of development and public awareness (Neumayer, 2001).
According to Radovanovic (2011), HDI emphasizes human capabilities as ultimate criteria for assessing the development of a country. The main capabilities for economic development are to live healthy and long lives, to be educated (knowledgeable), to have access to the social services and resources required for a decent living standard, and to be able to participate in life in a society (Sina & Moshtaghi, 2014). A person needs both the resources and the ability to use them in order to pursue their capability.
The Human Development Index is known to measure average achievement in basic human capabilities and has helped to expand the attention in appraising the process of economic development (Jahan, 2014). The index summarises a great deal of social performance in a single composite index, combining the three (3) indicators of longevity, education and living standards (Nafziger, 2006). This position is supported by Marone (2011) who in her later study found the HDI as truly a measure of healthy living and long safe life, being knowledgeable and having a decent standard of living. These dimensions and indices can be shown in the table below:
Table 1: Variables for each of the three dimensions of human development index
Source: Rahjou, Imani, and Sharifi, 2014
The Human Development Index has been used to rank development levels and comparing countries internationally (Sina & Moshtaghi, 2014). According to Ofoegbu, et al. (2016), the HDI is a measuring tool that ranks nations' levels of economic development base on three (3) criteria of Health Index, Education Index and Standard of living Index. The health index reflects and indicates the life expectancy of a particular country. The education index shows the enrolment rate at the level of primary, secondary and tertiary levels of people in a nation as well as the literacy rate with the standard of living index showing the GDP per capita income of a nation. HDI is one of the first indicators that challenges the supremacy of GDP, and has become widely referenced and used (PricewaterhouseCoopers Limited, 2016).
102Measurements of Economic Development: Does Human Development Index Matter In the Context of Nigeria?
Journal of Taxation and Economic Development ISSN 1118-6017 Vol. 18, (1), March 2019
Dimensions of development Human Development Index
Living standards GDP per capita
Education Adult Literacy Combined Gross Enrolment Ratio (primary, secondary and tertiary schooling)
Health Life Expectancy

According to Nefs (2009), a nation's HDI arithmetically averages the three (3) indexes of health, education and standard of living, shown as that :
HDI = 1/3(Standard of Living Index) + 1/3(Health Index) + 1/3(Education Index)
The HDI lies between the range of zero and one, and nations are rated based on how close their HDI is to one (Neumayer, 2001). At an HDI value of 0.51, Nigeria is classified as a low development country, given a rank of 152 amongst 188 countries in the world. Between 2005 and 2014 however, Nigeria's HDI value improved only marginally from 0.467 to 0.514 (PricewaterhouseCoopers Limited, 2016).This is however below the average Human Development Index of the world of 0.706!
Human Development index is not restricted to the real per capita GDP but it considers longevity (life expectancy) and educational attainment also. In summary, Human Development Index (HDI) is adjudged a better measure and indicator of the welfare of the people than simply national income. The HDI clearly shows the distinction between income and human well-being because it can give a more complete picture of the state of a nation's economic development than can GDP or GNP alone (Human Development Report, 2014).
Standard of Living Index (SoL)Income is seen as a means to human development and not an end by itself (Jahan, 2014). With little income, a lot can be achieved in economic development. The income component of the HDI has been used as an indirect indicator of some capabilities not well reflected directly or indirectly, in the measures of longevity and education. Income helps to provide adequate shelter, prevent hunger with respect to longevity and provide good education (Anand & Sen, 2000).
Standard of living Index is measured using the GDP per capita income; where GDP per capita income is derived dividing the GDP by the population of a country, adjusted for purchasing power parity (PPP) in dollars (Gallardo, 2009). The PPP-adjusted GDP per capita provides better approximation of the relative power to gain command over resources and to buy commodities for a decent living standard (Anand & Sen, 2000).
Critiques pointed out that GDP per capita includes all effects of economic activities whether they are negative or positive without questioning; and these often lead to double accounting for an economic activity and under-reports the true cost of economic activities (Kovacevic, 2010).The level of living standard is also criticized to have increased through increased level of leisure which is not accounted for in the GDP per capita figure. GDP per capita above the threshold value is also heavily discounted (Neumayer, 2001).In addition, calculating standard of living (SOL) index is more complex than other indices because the index is calculated using the logarithmic formula (Sina & Moshtaghi, 2014). However, the logarithmic formula is used based on the fact that people do not need excessive financial resources to enjoy a decent standard of living (Anand & Sen, 2000).
Health Index The Health Index shows the degree to which life expectancy (LE) in a region analyzed is above the minimum life expectancy (Min LE) as a proportion of the maximum
103Measurements of Economic Development: Does Human Development Index Matter In the Context of Nigeria?
Journal of Taxation and Economic Development ISSN 1118-6017 Vol. 18, (1), March 2019

difference between possible life expectancies. Globally, Min LE is set as 25 and maximum life expectancy (Max LE) in the world is determined to be 85 (Ofoegbu, et. al., 2016; Kovacevic, 2010). Health Index is mathematically represented as:
Health Index = (LE – Min LE) / Max LE – Min LE) (Nefs, 2009).
Although, life expectancy is commonly used as the indicator for the Health Index, life expectancy does not capture all the aspects of the individual's current health which may limit and affect capabilities (Kovacevic, 2010). The indicators of health quality are difficult to obtain in measuring the multiple dimensions of the healthy state which influences the potential human capabilities. Therefore, the statistical adequacy of life expectancy can be questioned (Anand & Sen, 2000).
Education IndexBasic education advances the participation and the efficiency of each individual. People with little formal education can carry out only simple manual work. Insufficient basic education can become a limitation on economic development, in which a country may find it difficult to move up through the value chain to produce and consume more advanced products and services, and thus makes the entire society lag behind (Kovacevic, 2010).Education helps in the acquisition of knowledge while knowledge is a core factor of production and a principal determinant of productivity. Acquisition of knowledge is an important dimension of human development because it is a critical means of building capability. Knowledge gap rather than the income gap is likely to be the most critical determinants of the fortunes of countries across the world (Arab Human Development Report, 2002).
The Education Index relies on two indicators for the knowledge dimension, which are: the combined gross enrolment ratio for primary, secondary and tertiary schooling and adult literacy rate (Elementary Education in India analytical Report, 2006-7). The enrolment ratio is the percentage of children of school-going age (Primary, Secondary and Tertiary) who go to school. The literacy rate is the percentage of people aged 16 years and above who are able to read, write and understand simple statements regarding their daily lives (Ofoegbu, et. al., 2016).
Nafziger (2006) again showed the literacy rate as the weight of two-thirds and the enrolment rate as the weight of one-third, such that the Education Index is mathematically represented as:
Education Index = 2/3 Literacy Rate + 1/3 Enrolment Rate.
The Education Index is seen to have many crucial divergences with respect to inter-country comparison for calculating educational achievements. The quality of education, length of the school year, effects of repetition, automatic promotion, continuing education and training are not the same in each country in the world (Kovacevic, 2010). This makes the basis for country comparison to be poor.
104Measurements of Economic Development: Does Human Development Index Matter In the Context of Nigeria?
Journal of Taxation and Economic Development ISSN 1118-6017 Vol. 18, (1), March 2019

The HDI has been the subject of several critical reviews and critics have questioned whether HDI provides significant information beyond what is already available from the separate indicator like GDP. However, the suggestion is that the use of multiple indicators is essential to capture cultural, political, ecological and social aspects of development (England & Harris, 2005).Another skepticism with the HDI measures is that there are many crucial divergences, even in the inter-country comparisons for calculating the GDP per capita, life expectancy and educational achievements (Anand & Sen, 2000). Since the HDI index is for a single country, and as such does not distinguish between different rates of development within a country, such as between urban and traditional rural communities. There is the disaggregation of the HDI in terms of gender, region, race and ethnic group.
HDI is seen to focus on long term human development outcomes at the expense of short term human development achievements. Also, HDI is said to focus on the three basic dimensions: health, education and standard of living, and cannot consider other important dimensions of human development like political freedom, human freedom, human rights and others. Economic development also covers areas on freedom, but the HDI does not directly measure this. For example, access to the internet might be regarded by many as a freedom that improves the quality of life of the people (Arab Human Development Report, 2002). In addition, the HDI excludes many aspects of social and economic life which could be regarded as constraining or contributing to economic development, such as corruption, poverty, deprivation, crime, and negative externalities.
One category of critiques of the HDI addresses poor quality of data, particularly in terms of the frequency of measurement errors, the thoroughness of data collection, infrequency of census data collection, a lack of complete coverage within countries and the possibility of inaccurate reporting (Stanton, 2007). Obviously, some vital information is lost in the construction of the index. Income above basic level of need counts for specific, very little health and nutrition data are not reflected except insofar as they affect life expectancy (England & Harris, 2005).
However, the HDI has its strength because it measures broader issues of human well-being, which can be used as a measure for economic development, compared to GDP per capita which can only be used to measure economic growth (Arab Human Development Report, 2002).
Improving Human Development Index in the Context of NigeriaThe measure of Human Development Index (HDI) as an indicator of well-being of the society and economic development globally is recognized. The HDI has a focus for enhancing human lives and helping to influence policy thrust and direction at the regional, national and international levels. The limited scope of HDI in its neglects of sustainable development, notably in poor countries provides an incomplete picture of human development. A new version of HDI will serve as a better measure of economic development. It is expected that a new version of the HDI should better capture the current and potential future capabilities in education of modern societies, health and income that is available to a country. To this end, the following changes are proposed.
105Measurements of Economic Development: Does Human Development Index Matter In the Context of Nigeria?
Journal of Taxation and Economic Development ISSN 1118-6017 Vol. 18, (1), March 2019

i. The education dimension or component of HDI should emphasize quality education in addition to quantity of enrolment. This means that stakeholders, including the government, academic planners and academic institutions, on-governmental Organisations, to mention but a few, should have an academic summit on the quality of education and quantity of enrolment that will not only align with the global best practices but also account for the special peculiarities of Nigeria.Besides, it is expected that the outcomes of such a summit should exist for cross-national assessment among countries.
ii. In the standard of living dimension, the Gross Domestic Product (GDP) per capita should build into the Real Gross Domestic Product (GDP) per capita model a working population rather than the use of population. Real GDP is usually calculated at constant prices. It shows the changes in physical production in real terms. Per capita real GDP is the GDP at constant prices divided by population. To achieve the GDP at constant prices, governments at all levels must deploy the right fiscal and monetary policies to affect the desired constant prices.
iii. Efforts should be deployed to integrate and accommodate inequity/inequality considerations into the evaluation of performance models in each of the three dimensions and incorporated into the HDI index. Such distinct considerations required in the HDI should encompass metrics, as freedom index (human right), crime index (public safety rating), corruption index (degree of openness of their borders to international journalists and visitors, also public report) and poverty index (head-count of people below the standard required level of income).
CONCLUSION AND RECOMMENDATIONThe diversity of cultural richness and peculiarities in a country and among countries around the world call for a good measure beyond GDP and GNP, for economic development and well-being that can suit all and allow comparisons among countries overtime. Economic development encompasses a broad based index such as the Human Development Index, HDI. with the core dimensions of Health, Education and Standard of Living Index. However, these components are not without limitations. The consideration of quality of education, in addition to the quantity of enrolment in the assessment of education index and the use of working population in the assessment of standard of living index are advised. Furthermore, the HDI can have an in-built of other indicators in the areas of inequality, poverty, gender, sustainability, human security and empowerment to make the HDI very robust as an economic development model.
For further studies, an empirical evaluation of Human Development Index as a measure of economic development is suggested to compare the empirical findings with this conceptual and current study.
106Measurements of Economic Development: Does Human Development Index Matter In the Context of Nigeria?
Journal of Taxation and Economic Development ISSN 1118-6017 Vol. 18, (1), March 2019

REFERENCES
Sagar, A, D.., & Najam, A. (1998). The human development index: A critical review. Ecological Economics, 25(3), 249 – 264.
Anand, S. ,& Sen, A. (2000).The income component of the human development index. Journal of Human Development, 1(1), 83-106.
Arab Human Development Report. (2002). Human development: Definition, concept and larger context. Received 12 May, 2016 from http://www.arab-hdr.org/contents/2002/ch1-e.pdf
Bureau of Economic Analysis U.S. Department of Commerce (2015). Measuring the economy: A primer on GDP and the national income and products accounts Received 22 June,2017 from http://www.bea.gov/national/pdf/nipa_primer.pdf
Byte, S. (2015). GDP and indicators of economic wellbeing. Center for the advancement of t h e s t e a d y s t a t e e c o n o m y. R e c e i v e d 1 2 J u n e , 2 0 1 6 f r o m http://www.steadystate.org/wp-content/uploads/
Costanza, R., Hart, M., Posner, S., &Talberth, J. (2009). Beyond GDP: the need for new measures of progress. Boston University Pardee Paper, 4.
Deb, S. (2015). Gap between GDP and HDI: Are the rich country experiences different from the poor? IARIW - OECD better policies for better lives. Paper prepared for the IARIW-OECD special conference: “W (h) ither the SNA?”Paris, France. Received 12 June,2018 from http://www.nyu.edu/econ/user/debraj
Elementary Education in India, Analytical Report, 2006-07. Educational Development I n d e x . R e c e i v e d 2 5 M a y , 2 0 1 6 f r o m http://pib.nic.in/archieve/others/2008/oct/r2008101004.pdf
England, R. W. & Harris, J. M. (2005). Alternatives to gross national product: A critical Survey. Received 12 June, 2016 from http://www.ase.tufts.edu/gdae/publications
Gallardo, G. (2009). The human development index as an effort to measure well-being in Honduras. OECD World Forum, 27 – 30.
Haque, M. S. (2004). The myths of economic growth (GNP): Implications for human development. In Gedeon Mudacumura and M. Shamsul Haque (eds.) Handbook of Development Policy Studies. New York: Marcel Dekker,1-24.
Hassan, A. (2012). HDI as a measure of human development: A better index than the income approach. Journal of Business and Management, 2(5), 24 – 28.
Human Development Report. (2004). Human development indicators. Received 12 November, 2016 from h t tp : / /www.cone i . sp .gov.br / ind /Met_Human Development_Indicators.pdf
International Economic Development Council’s. (2001). the power of knowledge and leadership. Received 15 July,2016 from www.iedconline.org/clientuploads/ Downloads/IEDC_ED_Reference_Guide.pdf
107Measurements of Economic Development: Does Human Development Index Matter In the Context of Nigeria?
Journal of Taxation and Economic Development ISSN 1118-6017 Vol. 18, (1), March 2019

Jacobs, G., & Slaus, I. (2010). Indicators of economics progress: The power of measurement and human welfare. Cadmus, 1(1) 52-115.
Jahan, S. (2014). Measuring living standard and poverty: Human development index as an alternative measure. Received 12 July,2018 from http:// www.peri.umass.edu/ fileadmin
Kovacevic, M. (2010). Review of HDI critiques and potential improvements. UNDP human development research paper, 33.
Learner, A. (2012). GNP /GDP: What Is It All About. Economics U$A. Received 12 September,2015 from https://www.learner.org/resources/transcripts/economics
Marone, H. (2011). Measuring economic progress and well-being: How to move beyond
GDP.Oxfam America Research Backgrounders. Received 17 July,2017 from https://www.oxfamamerica.org/static/media/files/measuring-economic-progress-
and-well-being.pdf
Miklos, A. ,&Jeroen, C. (2014). Evaluating Alternatives to GDP as measures of social welfare / progress. wwwforeuropewelfarewealthwork, 56. Received 15 June, 2015 from http;//www.foreurope.eu
Morgan, M. (2012). The Paradox of GDP / GNP as Determinants of Human Progress: Effects on Welfare and Equality. Received 12 June,2016 from https://www.tcd.ie/Economics/assets/pdf/SER/2011/Marc_Morgan.pdf
thNafziger, E. W. (2006). Economic Development. Cambridge University Press, 4
Edition. Received 19 June,2016 from http://tabesh.edu.af/Books/economic/ Economic%20Development.pdf
Nefs, D. (2009). HDI project report. Received 16 April,2018 from http://www.india.jbs.cam.ac.uk
Neumayer, E. (2001). The human development index and sustainability – a constructive proposal. Ecological Economics 39 (2001), 101 – 114.
Ofoegbu, G. N., Akwu, D.O. ,& Oliver, O. (2016). Empirical analysis of effect of tax revenue on economic development of Nigeria. International Journal of Asian Social Science, 6(10), 604 – 613.
Osberg, L., & Sharpe, A. (2005). How should we measure the economic aspects of Well-being. Review of Income and Wealth, 51 (2). Received 12 June,2016 from http://www.roiw.org/
Pricewaterhouse Coopers Limited. (2016). The future of Nigeria: Three critical levers for improving HDI. Received 12 June,2016 from https://www.pwc.com/ng/en/ assets
Rahjou, S., Imani, M. N., & Sharifi, A. (2014). The review of human development index to determine the contribution of higher education in the education index. Bulletin of Environment, Pharmacology and Life Sciences, 3(2), 244 – 252.
108Measurements of Economic Development: Does Human Development Index Matter In the Context of Nigeria?
Journal of Taxation and Economic Development ISSN 1118-6017 Vol. 18, (1), March 2019

Radovanovic, B. (2011). Human development index as a measure of human development. Received 12 June,2018 from http://www.doiserbia.nb.rs/img/doi
Shodhganga. (2011).Concept of economic development and its measurement. Received 12 June,2016 from shodhganga.inflibnet.ac.
Sina, K., & Moshtaghi, F. (2014). Globalization and human development and instruction: A case study of comparative comparison of 62 countries in the world, including Iran (2008-2010). Kuwait Chapter of Arabian Journal of Business and Management Review, 3(6),116-126.
Smol, D., Whitehead, J. ,& Bascand, G. (2011).The Economic Development Indicators. Received 12 June,2016 from http://www.dbresearch.com/prod/dbr_internet
Stanton, E. A. (2007). The human development index: A History. Political, Economy Research Institute. University of Massachusetts' working paper series no. 127.
Stefan, B. (2006). Measures of well-being: There is more to it than GDP. Deutsche Bank Research. Received 30 August,2017 from on http://www.fortschrittszentrum. de/dokumente/
Stiglitz, J. (2009). GNP is not happiness: Society needs new goals. Received 12 June, 2016 from http://www.stiglitzsen- fitoussi.fr
United Nations Development Programme (1990).Human development report . Oxford University Press, New York.
109Measurements of Economic Development: Does Human Development Index Matter In the Context of Nigeria?
Journal of Taxation and Economic Development ISSN 1118-6017 Vol. 18, (1), March 2019

THE DETERMINANTS OF THE ADOPTION OF INTERNATIONAL PUBLIC SECTOR ACCOUNTING STANDARDS IN LAGOS STATE
Ifeoluwapo Adebimpe SalamiDepartment of Accounting
Bowen University, [email protected]
and
Rafiu Oyesola SalawuDepartment of Management and Accounting
Obafemi Awolowo University, Ile-Ife08033795887; [email protected]
AbstractThe study examined the determinants of the adoption of International Public Sector Accounting Standards (IPSASs) in Lagos State. The study employed primary data. The population consisted of all the public sector accountants and auditors working with Lagos State Government. The sample size selected was 300 using stratified random sampling technique. Data were collected with the aid of structured questionnaire. A total of 291 copies of questionnaire were retrieved from the respondents. Data were analyzed using ordinal logistic regression technique. The study revealed that acceptable in cash accounting based system (CABS), adequate multidimensional reporting requirement (MDRR), awareness on the transition of IPSASs (AOT), commitment of central entities and key officials (CCEK), effective project management structure for IPSASs (EPMS), budget for additional human resources (BAHR), adequate technology capacity and information system (TCIS), regular update of the governing bodies on the progress made in the implementation of IPSASs (UGBP), interim financial statement (IFSR), continuous testing of internal controls (CTIC) and prevention of corrupt practice (PCP) are the major determinants of adoption of IPSASs. An increase in this will raise the likelihood of the occurrence of higher level of adoption of IPSASs. The study recommends that each State should put into consideration the identified determinants in order to enhance the implementation of IPSAS.
Keywords: Determinants, Adoption, Standards, IPSAS, Public Sector
INTRODUCTIONThe global anxiety for better public financial management that guarantees more accountability and transparency is the concern of both developed and developing countries. In view of this, the International Federation of Accountants (IFAC) establishes and promotes the application of International Public Sector Accounting Standards (IPSASs) by public sector entities around the world when preparing their General Purpose Financial Reports (GPFR).
The main aim of IPSAS is to improve the quality of GPFR by public sector entities so as to have a better informed assessment of the decisions governments take to allocate
110The Determinants of the Adoption of International Public Sector Accounting Standards in Lagos State
Journal of Taxation and Economic Development ISSN 1118-6017 Vol. 18, (1), March 2019

resources. Compliance with IPSASs guarantees that financial reporting by public entities conveys a “true and fair view” of the financial situation. The adoption of IPSASs therefore, enhances transparency and accountability by governments in the management of public resources. It raises the quality of financial management, facilitates transactions with financiers and simplifies communication with the general public. IPSASs assure comparability of financial reporting with other countries, motivation of foreign investors to make investment in the country, and very helpful in raising capital from the international markets (South Asian Federation of Accountants, 2006 and International Public Sector Accounting Standards Board, 2015).
Hassan (2013) noted that only six governments across the world had actually issued financial statements on the full accrual basis. He further revealed that some countries such as United States of America, Australia, Albania, Chile, Canada, Cyprus and Germany applied accounting standards that are already consistent with IPSASs. However, some of the countries yet to implement IPSASs include Afghanistan, Armani, Austrian, Estonia, Lebanon, Republic of Macedonia, United Arab Emirates and Ghana (Ijeoma & Oghomeh, 2014).
During the Federal Executive Council (FEC) meeting of 28th July, 2010, the adoption of IPSASs for public sector in Nigeria was approved. IPSASs was adopted into Nigeria public sector with the view that its adoption will, no doubt, enhance Nigeria's image with foreign investors, reduce its risk profile as well as provide a reliable comparable reporting basis such that the country remains one of the best investment destinations on the African continent. Lagos State Government started complying with IPSASs requirements in 2014 and subsequent financial reports have been prepared and presented based on IPSASs requirements till date (Alamu, 2014). According to Malahleha (2013) and Oyewobi (2014), some other state governments in Nigeria including Oyo, Osun, Ogun, Ondo, Ebonyi and Enugu States are fully aware of the practices of IPSASs but are yet to implement IPSASs.
Logically, any official adoption of a public sector accounting reform in general and of IPSASs in particular in Nigeria should be preceded by an identification and assessment of the determining factors influencing the success. According to Kuye (2010), many accounting and financial reforms delay or collapse as a result of poor or no feasibility studies carried out to examine the factors responsible for the success if the reform is adopted.Consequently, this paper aimed at identifying and assessing the factors influencing IPSASs adoption in Lagos State. In order to address the main focus of this paper, the second section looks at literature review and section three explains methodological issues. Section four discusses results while the conclusion and recommendations drawn from this study are presented in section five.
LITERATURE REVIEWAn overview of International Public Sector Accounting Standards (IPSASs)IPSASB develops accounting standards for public sector entities (Heald, 2003). The IPSASB recognizes the significant benefits of achieving consistent and comparable financial information across jurisdictions. Also IPSASB recognizes the right of Governments and national standard-setters to establish accounting standards and
111The Determinants of the Adoption of International Public Sector Accounting Standards in Lagos State
Journal of Taxation and Economic Development ISSN 1118-6017 Vol. 18, (1), March 2019

guidelines for financial reporting in their jurisdictions. The IPSASB comprises a total of 18 members. The countries represented on the IPSASB include: Australia, Canada, China, France, Germany, Japan, Kenya, Morocco, New Zealand, Pakistan, Romania, South Africa, United Kingdom, United States of America and Uruguay. The IPSAS Board (IPSASB) is the responsible body formed to develop and issue IPSAS under its own authority. Current work program of the IPSASB are;
• Phase 1 (1997-2002) through financial support of international institutions development of a first set of accounting standards (Core Set: IPSAS 1 – IPSAS 20)
• Phase 2 (2003-2010) Where relevant for the public sector, convergence with IAS/IFRS as of 31.12.2008 was achieved Issuance of first standards to specific issues of the public sector (IPSAS 21 – IPSAS 24)
• Phase 3 (Since 2010) Development of a Conceptual Framework for the public sector Focus on specific issues of the public sector as well as further development of existing standa
IPSASB is a board under the auspices of the International Federation of Accountants (IFAC). IPSASB develops standards that apply to an accrual-based and to the cash basis of accounting. The IPSASB is among the four independent standard-setting boards of International Federation of Accountants (IFAC).
IFAC is the global organization for the accountancy profession dedicated to serving the public interest by strengthening the profession and contributing to the development of strong international economies. It was founded in 1977. IFAC is comprised of 173 members and associates in 129 countries and jurisdictions which include Nigeria. IFAC is expected to serve the public interest by: contributing to the development, adoption and implementation of high quality international standards and guideline, contributing to the development of competent professional accountants, promoting the value of professional accountants and trashing out accounting public issues.
International Public Sector Accounting Standards (IPSASs) are high-quality global financial reporting standards for application by public sector entities other than government business enterprises (GBEs). Accrual-based IPSASs set out recognition, measurement, presentation and disclosure requirements dealing with transactions and events in general purpose financial statements. IPSASs refer to the recommendations made by the IPSASs Board under the auspices of the International Federation of Accountants. IPSASs therefore are sets of accounting standards issued by the IPSAS Board for use by public sector entities around the world in the preparation of financial statements, and are based on International Financial Reporting Standards (IFRS) issued by the International Accounting Standards Board (IASB). Basically, IPSASs are accepted from international organizations. IPSASs are accepted for accounting for funds provided under World Bank Programs (Chan, 2008). Thus, IPSASs have become de facto international benchmarks for evaluating Government accounting practices worldwide. For these reasons, IPSASs deserves the attention of accounting policy-makers, practitioners and scholars alike. More and more governments and other public sector entities around the world are adopting the accrual-based IPSASs as a basis for their accounting and financial reporting. In total, more than 40 countries have adopted or are adopting IPSASs or comparable standards.
112The Determinants of the Adoption of International Public Sector Accounting Standards in Lagos State
Journal of Taxation and Economic Development ISSN 1118-6017 Vol. 18, (1), March 2019

Determinants of the Adoption of IPSASsAgbo (2014), investigated accountability in the Nigerian public sector, the population of the study is Nigeria public sector and the sample frames was drawn from Ministry of Finance, Presidency, Ministry of Works, and National Assembly. Source of data was primary and were collected through structured questionnaire which was distributed to 100 management staff of the above organizations at random. Data were analyzed using Pearson Product Moment Correlation with the aid of SPSS. The result showed that there is weak accountability in Nigeria due to weak accounting infrastructure, poor regulatory framework and attitude of government officials. According to the study, measures like legislative committees, financial audit, ministerial control, judicial reviews, anticorruption agencies, advisory committees, parliamentary questions and public hearing to ensure accountability in the public sector as in developed countries were adopted yet no tangible result has been achieved.
International Monetary Fund's (IMF) (2016) manual on, implementing accrual accounting in the public sector, this technical note and manual (TNM) explains what accrual accounting means for the public sector and discusses current trends in moving from cash to accrual accounting. It outlines factors governments should consider in preparing for the move and sequencing of the transition. The note recognizes that governments considering accounting reforms will have different starting points across the public sector, different objectives, and varying coverage of the existing financial statements, it therefore recommends that governments consider each of these, and the materiality of stocks, flows and entities outside of government accounts when planning reforms and design the sequencing and stages involved accordingly. Building on international experiences, the note proposes four possible phases for progressively increasing the financial operations reported in the balance sheet and operating statement, with the ultimate aim of including all institutional units under the effective control of government in fiscal reports.
Yosra and Yosra (2017) reviewed institutional and economic factors affecting the adoption of IPSASs. This work investigates the environmental factors associated with countries' decision to adopt International Public Sector Accounting Standards (IPSASs). Based on a sample of 110 countries, the results reveal a positive influence of external public funding (coercive isomorphic pressure), the degree of external openness (mimetic isomorphic pressure), and public sector organizations' importance on IPSASs adoption. They show a negative effect of the availability of local Generally Accepted Accounting Principles (GAAP) on this decision, whereas education level (normative isomorphic pressure) is a non-significant factor. This research contributes to the international accounting literature in the public sector. The results are relevant to standard-setters, regulators, researchers, international financial organizations, and non-adopting countries.
Flynn (2018) reviewed the roadmap for adopting IPSASs. Despite these strong benefits, there is a wide variation in the rate of progress made with IPSASs adoption. Taking the sample of countries as examples, the review suggests progress remains slower than is desirable. Specific, complex and consistent implementation challenges have faced adopting countries, which need to be overcome. Here are further issues to consider in
113The Determinants of the Adoption of International Public Sector Accounting Standards in Lagos State
Journal of Taxation and Economic Development ISSN 1118-6017 Vol. 18, (1), March 2019

the transition towards successful full adoption of IPSASs: stakeholder engagement, structural and legal transformation, transformation and change management, skills capacity, cost, technology and infrastructure, implementation approach and external support. Flynn concluded that if the roadmap for IPSASs adoption is strictly adhere to, implementation of IPSASs will be more effective.
In line with the objective of this research work and in order to evaluate the adoption of IPSASs in Lagos State, a conceptual framework was developed to investigate the determinants of the level of adoption of IPSASs in Lagos State. From the conceptual framework, determinants of the level of adoption of IPSASs were seen as factors that affect the level of adoption of IPSASs in Lagos State. Here, the determinants of the level of adoption were used as independent variables of the study while level of adoption of IPSASs was the dependent variable to test the objective.
Figure 2: Conceptual Framework for the Determinates of the adoption of International Public Sector Accounting Standards (IPSASs) in Lagos State.Source: The Researcher, 2018
METHODOLOGYThe study employed primary data because; the view of the researcher, public sector accountants and public sector auditors who are the primary subjects of the study would be easily captured. The population consisted of all the public sector accountants and auditors working with Lagos State Government Accountant Generals’ Office, Auditor Generals’ Office, Ministry of Finance and Lagos Internal Revenue Service. According to IFAC 2011, public sector accountants and auditors are obliged to seeing to the successful implementation of IPSASs. The sample size selected from the departments and ministry was 300using stratified random sampling technique. The choice of the ministry and department is because they are directly concerned with finances and auditing of finances(Klynveld Peat Marwick Goerdeler, KPMG, 2016).Most often, more of accountants and auditors are found in these ministries, departments and agencies (MDAs) (Udeh & Sopekan, 2015). Data were collected with the aid of structured questionnaire. A total of 291 copies of questionnaire were retrieved from the accountants and auditors working with Lagos State Government. They are well-informed about IPSASs adoption and are taking part in building and developing the system of public accounting. The closed-ended questions were measured in ordinal level in which respondents chose their answers from the provided continuum scale. The Likert scale was used in this research because it is one of the most widely used itemized scales. Model on determinants of the level of the adoption of IPSASs was drawn from the conceptual framework.
114The Determinants of the Adoption of International Public Sector Accounting Standards in Lagos State
Journal of Taxation and Economic Development ISSN 1118-6017 Vol. 18, (1), March 2019
The level of adoption of International Public Sector
Accounting Standards (IPSASs)
(Dependent variable)
Determinants of the level of adoption of International Public Sector Accounting
Standards (IPSASs)
(Independent variables)

LAI = f(DLA ) ... ............... 1i 1
WhereDLA = Determinants of the level of adoption1
LAI = level of the adoption of IPSASsi
LAI = f (CABS, MDRR, AOT, TSU, CCEK, EPMS, BAHR, TCIS, UGBP, IFSR, CTIC, i
PCP).
Note that DLA is a vector of several factors that determine the level of the adoption of IPSASs which include; cash accounting based system (CABS), adequate multidimensional reporting requirement (MDRR), awareness on the transition of IPSAS (AOT), total support and commitment from the political class (TSU), commitment of central entities and key officials (CCEK), effective project management structure for IPSAS (EPMS), budget for additional human resources (BAHR), adequate technology capacity and information system (TCIS), regular update of the governing bodies on the progress made in the implementation of IPSAS (UGBP), interim financial statement (IFSR), continuous testing of internal controls (CTIC) and prevention of corrupt practice (PCP).
Assuming a linear relationship, consequently, equation (3.1) can be explicitly expressed as:
LAI = b + bDLA + e …………………………………………………..2i 1 2 1 i
Where: b and bare the parameters while the a priori expectation is that b> 01 2 2
Where: e = error term. Data were analyzed using ordinal logistic regression technique.
RESULTS AND DISCUSSIONThere were five models estimated in order to establish the determinants of the level of adoption of IPSASs in Lagos State. four (4) of the five models (that is model 1 to model 4) correspond to the sampled public offices such as; Auditor General’s office, Accountant General’s office, Ministry of Finance and Lagos Internal Revenue Service, respectively and the last model (model 5) pooled the whole samples.
Table 1 shows the determinants of the level of adoption of IPSASs in the public sector in Lagos state. From table 1, the diagnostics tests for the models reveal that the variation in the level of the adoption of IPSASs as explained by variation in the determinants (as seen in Pseudo R2) is up to 21.22% in model 1, 6.85% in model 2, 7.11% in model 3, 4.97% in model 4 and 5.86% in model 5. Jointly, at 1% level of significance, the included variables in the models are significant in explaining this variation except for model 1 which remains insignificant.
In model 1, (which corresponds to the level of adoption of IPSASs in the office of the Accountant General) apart from acceptable cash accounting based system (CABS) which is significant at 5%, none of these determinants are significant in explaining the level of adoption of IPSASs in the office of the accountant general. A rise in acceptable in cash accounting based system (CABS) increases the odds of the occurrence of having a higher level of adoption of IPSASs by 4.564 while an increase in the awareness on the
......................................................
115The Determinants of the Adoption of International Public Sector Accounting Standards in Lagos State
Journal of Taxation and Economic Development ISSN 1118-6017 Vol. 18, (1), March 2019
transition of IPSASs (AOT) makes the odd likelihood of the adoption of IPSASs to rise by 2.561.
This trend is seen for total support and commitment from the political class (TSU), effective project management structure for IPSASs (EPMS), adequate technology capacity and information system (TCIS), regular update of the governing bodies on the progress made in the implementation of IPSASs (UGBP), interim financial statement (IFSR) and continuous testing of internal controls (CTIC): such that an increase in this will raise the likelihood of the occurrence of higher level of adoption of IPSASs by 1.735, 1.181, 1.183, 1.628,1.205 and 1.934 respectively. However, evidence has it that when adequate multidimensional reporting requirement (MDRR) raises the odds likelihood of higher adoption of IPSASs falls by 0.513, an increase in commitment of central entities and key officials (CCEK) lowers the likelihood of a higher adoption of IPSASs by 0.579, while an increase in budget for additional human resources (BAHR) make the likely occurrence of a higher IPSASs adoption to fall by 0.812 and increase in prevention of corrupt practice (PCP) leads to the fall in the likelihood of the occurrence of higher adoption of IPSASs to the tune of 0.840.
In model 2, (which corresponds to the level of adoptionof IPSASs in the office of the Auditor General) apart from acceptable cash accounting based system (CABS), adequate multi-dimensional reporting requirements (MDRR), awareness on the transition of IPSASs (AOT), commitment of central entities and key officials (CCEK) and budget for additional human resources (BAHR) which are significant at 1%, 5%,5%,5% and 5% respectively, other determinants are not significant in explaining the level of adoption of IPSASs in the office of the auditor general. A rise in acceptable cash accounting based system (CABS) increases the odds of the occurrence of having a higher level of adoption of IPSASs by 3.646 while an increase in adequate multidimensional reporting requirement (MDRR) raises the odds likelihood of higher adoption of IPSASs by 2.119. Also, when the awareness on the transition (AOT) of IPSASs increases, it makes the odd likelihood of the adoption of IPSASs to rise by 2.615.
This trend is seen for commitment of central entities and key officials (CCEK), effective project management structure for IPSASs (EPMS), budget for additional human resources (BAHR), adequate technology capacity and information system (TCIS), interim financial statement (IFSR), continuous testing of internal controls (CTIC) and prevention of corrupt practice (PCP): such that an increase in this will raise the likelihood of the occurrence of higher level of adoption of IPSASs by 2.173, 1.995, 2.345, 1.693, 2.105, 2.011 and 2.037 respectively. However, evidence has it that when total support and commitment from the political class (TSU) and regular update of the governing bodies on the progress made in the implementation of IPSASs (UGBP) increases, there is the likelihood that the level of the adoption of IPSASs will reduce.In model 3, (which corresponds to the level of adoption of IPSASs in the Ministry of Finance) asides adequate multi-dimensional reporting requirements (MDRR), commitment of central entities and key officials (CCEK) and interim financial statement (IFSR) that are significant at 5% each, none of the other determinants are individually significant in explaining the level of adoption of IPSASs in the office of the Ministry of Finance. Thus, while an increase in adequate multidimensional reporting requirement
116The Determinants of the Adoption of International Public Sector Accounting Standards in Lagos State
Journal of Taxation and Economic Development ISSN 1118-6017 Vol. 18, (1), March 2019

(MDRR) raises the odds likelihood of higher adoption of IPSASs by 2.207, an increase in total support and commitment from the political class (TSU) improves the likely occurrence of a higher adoption of IPSASs by about 1.47. Similarly, when the commitment of central entities and key officials (CCEK) increases, the odds likelihood of the occurrence of the adoption of IPSASs the Ministry of Finance raises by 2.121.
This trend is seen for, effective project management structure for IPSASs (EPMS), budget for additional human resources (BAHR), adequate technology capacity and information system (TCIS), regular update of the governing bodies on the progress made in the implementation of IPSASs (UGBP), interim financial statement (IFSR) and continuous testing of internal controls (CTIC): such that an increase in these will raise the likelihood of the occurrence of a higher level of adoption of IPSASs by 1.42, 1.239, 1.319, 1.348, 2.267 and 1.27 respectively. whereas, evidence has it that when acceptable in cash accounting based system (CABS), awareness on the transition of IPSASs (AOT) and prevention of corrupt practice (PCP) increases, there is the likelihood that the level of the adoption of IPSASs will drops by 0.742, 6.273 and 0.687 respectively.
In model 4, (which corresponds to the level of adoption of IPSASs in the Lagos state Internal Revenue Service) there are no variables that are significant in explaining variations in the level of the adoption of IPSASs. Although a rise in acceptable in cash accounting based system (CABS) increases the odds of the occurrence of having a higher level of adoption of IPSASs by 1.419 while an increase in adequate multidimensional reporting requirement (MDRR) raises the odds likelihood of higher adoption of IPSASs by 1.148. Also, when the awareness on the transition of IPSASs (AOT) increases, it makes the odd likelihood of the adoption of IPSASs to rise by 1.042.
This trend is seen for total support and commitment from the political class (TSU), commitment of central entities and key officials (CCEK), budget for additional human resources (BAHR), , regular update of the governing bodies on the progress made in the implementation of IPSASs (UGBP), interim financial statement (IFSR), continuous testing of internal controls (CTIC) and prevention of corrupt practice (PCP): such that an increase in this will raise the likelihood of the occurrence of higher level of adoption of IPSASs by 1.306, 1.652, 1.510, 1.042, 1.291, 1.751 and 1.561 respectively. Nonetheless, when there is an increase in effective project management structure for IPSASs (EPMS) and adequate technology capacity and information system (TCIS), there is the likelihood that the level of the adoption of IPSASs will reduce by 0.67 and 0.589 respectively.
In model 5, (which corresponds to the level of adoption of IPSASs in the overall sampled public offices) only acceptable cash accounting based system (CABS), interim financial statement (IFSR) and continuous testing of internal controls (CTIC) are significant in explaining the level of adoption of IPSASs in the overall sampled public offices at 5% each. Interestingly, a rise in acceptable in cash accounting based system (CABS) increases the odds of the occurrence of having a higher level of adoption of IPSASs by 1.399 while an increase in adequate multidimensional reporting requirement (MDRR) raises the odds likelihood of higher adoption of IPSASs by 1.304. Also, when the awareness on the transition of IPSASs (AOT) increases, it makes the odd likelihood of the adoption of IPSASs to rise by 1.228.
117The Determinants of the Adoption of International Public Sector Accounting Standards in Lagos State
Journal of Taxation and Economic Development ISSN 1118-6017 Vol. 18, (1), March 2019

In the same vein, commitment of central entities and key officials (CCEK), effective project management structure for IPSASs (EPMS), budget for additional human resources (BAHR), adequate technology capacity and information system (TCIS), regular update of the governing bodies on the progress made in the implementation of IPSASs (UGBP), interim financial statement (IFSR), continuous testing of internal controls (CTIC) and prevention of corrupt practice (PCP): such that an increase in this will raise the likelihood of the occurrence of higher level of adoption of IPSASs by 1.418, 1.261, 1.28, 1.093, 1.128, 1.465, 1.675 and 1.111 respectively. However, total support and commitment from the political class (TSU) decreased the likelihood of the occurrence of higher level of adoption of IPSASs by 0.71. From these indices, it can be said that there is significant association between the level of adoption of IPSASs and the determinants of level of adoption of IPSASs in the sampled public offices. Therefore, the hypothesis which states that there is no significant association between the level of adoption of IPSASs and the determinants of level of adoption of IPSASs by Lagos State government is rejected.
The findings of the study revealed that on the whole, the overall result is significant in explaining the variation between the level of adoption and determinants of adoption of IPSASs for the study. This implies that there is significant association between the level of adoption of IPSAS and the determinants of adoption of IPSASs. The findings corroborate Jones and Browrey (2013) who found that the re-introduction of the cash accounting and budgeting system (CABS) have great influence on changes in cash allocation such that it serves as basis for government entity that desires to adopt IPSASs accrual basis of accounting.
Gruthrie, Humphry, Jones and Olson (2010) also averred that introduction of accrual accounting allows for interim financial reporting which assist management of government in funding and expenditure capital investments. However, the finding of this study negates the thought of Mellet, Macniven and Marriot (2008) when they stated that governments of developing countries may not experience improvement in the rating of internal controls through the adoption and implementation of IPSASs. Consequently, Shakirat (2013) found that there has been positive significant impact of financial control on appropriation processes and budgetary controls in Nigeria public sector.
118The Determinants of the Adoption of International Public Sector Accounting Standards in Lagos State
Journal of Taxation and Economic Development ISSN 1118-6017 Vol. 18, (1), March 2019

Table 1: Ordinal Logistic Regression for the Determinants of the level of Adoption of IPSASs in Lagos State
The figure without bracket is the odds ratio while the figure with bracket is the Z test score for each variable.* represents 1% and ** represents 5% levels of significanceSource: Field Survey, 2018
CONCLUSION AND RECOMMENDATIONSThe study revealed that cash accounting based system (CABS), adequate multidimensional reporting requirement (MDRR), awareness on the transition of IPSASs (AOT), commitment of central entities and key officials (CCEK), effective project management structure for IPSASs (EPMS), budget for additional human resources (BAHR), adequate technology capacity and information system (TCIS), regular update of the governing bodies on the progress made in the implementation of IPSASs (UGBP), interim financial statement (IFSR), continuous testing of internal controls (CTIC) and prevention of corrupt practice (PCP) are the major determinants of adoption of IPSASs. An increase in this will raise the likelihood of the occurrence of higher level of adoption of IPSASs by 1.399, 1.304, 1.228, 1.418, 1.261, 1.28, 1.093, 1.128, 1.465, 1.675 and 1.111 respectively. The study recommends that each state should put into consideration the identified determinants in order to enhance the implementation of IPSAS.
119The Determinants of the Adoption of International Public Sector Accounting Standards in Lagos State
Journal of Taxation and Economic Development ISSN 1118-6017 Vol. 18, (1), March 2019
Variable Model 1 Model 2 Model 3 Model 4 Model 5
CABS 4.564** (2.25)
3.646* (2.97)
0.742 (-0.96)
1.419 (1.23)
1.399** (2.15)
MDRR 0.513 (-1.27)
2.119** (2.21)
2.207** (1.98)
1.148 (0.49)
1.304 (1.73)
AOT 2.561 (1.80)
2.615** (2.32)
0.627 (-1.21)
1.042 (0.15)
1.228 (1.21)
TSU 1.735 (1.08)
0.904 (-0.24)
1.470 (1.16)
1.306 (0.79)
0.971 (-0.17)
CCEK 0.579 (-1.30)
2.173** (1.98)
2.121** (2.10)
1.652 (1.26)
1.418 (1.95)
EPMS 1.181 (0.39)
1.995 (1.27)
1.420 (1.10)
0.670 (-1.04)
1.261 (1.29)
BAHR 0.812 (-0.48)
2.345** (2.42)
1.239 (0.59)
1.510 (1.32)
1.280 (1.56)
TCIS 1.183 (0.36)
1.693 (1.27)
1.319 (0.80)
0.589 (-1.74)
1.093 (0.55)
UGBP 1.628 (1.04)
0.591 (-1.12)
1.348 (1.08)
1.042 (0.14)
1.128 (0.79)
IFSR 1.205 (0.44)
2.105 (1.68)
2.267** (2.33)
1.291 (0.80)
1.465** (2.17)
CTIC 1.934 (1.30)
2.011 (1.49)
1.270 (0.62)
1.751 (1.41)
1.675** (2.56)
PCP 0.840 (-0.30)
2.037 (1.52)
0.687 (-1.04)
1.561 (1.09)
1.111 (0.55)
Number of Observations 42 70 72 90 274
LR Chi-Squared 17.31 81.18 31.18 27.00 104.55
Pseudo R2 0.0685 0.2122 0.0711 0.0497 0.0586
Prob>Chi-Squared 0.1384 0.0000 0.0019 0.0077 0.0000
Log-Likelihood -117.6471 -150.7148 -203.7723 -257.8283 -839.9359

REFERENCES
Agbo, A. (2014). Corruption: Jonathan's lost war. Tell Broad Street Journal, 38(54), 15- 23.
Alamu, I.T. (2014). Adoption of International Public Sector Accounting Standards. Compliance based workshop. Ph.D. thesis writing, Olabisi Onabanjo University.
Chan, J. L. (2008). International Public Sector Accounting Standards: Conceptual and Institutional Issues. New York, Palgrave Macmillan.
Flynn, A. C. (2018). Corporate Governance. Theories and their Application to Boards of Directors, Acritic Literature Review. Prime Journal of Business Administration and Management, 11-12.
Guthrie, P., Humphrey, F., Jones, T. & Olson, L. (2010). Presentation of Budget and Accrual Accounting. Academic Review of International Public Financial Management Reforms, 3(2), 19-398.
Hassan, M. M. (2013). Debates on Accrual Accounting in the Public Sector: A Discrepancy between Practitioners and Academicians. Seventh Asia pacific interdisciplinary research in accounting conference. Retrieve on February, 2015 from http://www.apira2013.org/ proceedings/ pdfs/K102-abstract.pdf.
Heald, D. (2003). The Global Revolution in Government Accounting. Public Money and Management, International Journal of Business Management, 3(2) 92-97.
Ijeoma, N. B. & Oghoghomeh T. S. (2014). Adoption of International Public Sector Accounting Standards in Nigeria: Expectations, Benefits and Challenges. Journal of Investment and Management, 3 (1), 21-29.
International Monetary Fund (IMF), (2016). Adoption of International Public Sector Accounting Standards in Nigeria: Expectations, Benefits and Challenges. Journal of Investment and Management, 3 (1), 21-29.
IPSAS Handbook, (2015). On-line information, retrieved on March, 2015 from www.ifac.org/publicSector.
Jones, R. & Browrey, U. (2013). Managing Legitimacy: Strategic and Institutional Approaches. Academy of Management Review, 11(3), 71-80.
KPMG (2016). Adoption of International Public Sector Accounting Standards in Nigeria. A Seminal Paper Review, 25, 323-345
Kuye, J. M. (2010). The Roadmap to the Adoption of International Financial Reporting Standards-(IFRS) in Nigeria . Retr ieved on May, 2015 from www.georgesadoh.com /NaijaGAAPtoIFRS.
Malahleha, R. (2013). Implications of Adopting and Implementing IPSASs. KPMG Services (Pty) Limited, a South African Company and a member firm of the KPMG network of independent member firms affiliated with KPMG International Cooperative, Swiss entity KPMG International.
120The Determinants of the Adoption of International Public Sector Accounting Standards in Lagos State
Journal of Taxation and Economic Development ISSN 1118-6017 Vol. 18, (1), March 2019

Mellet, N., Macniven, F. & Marriot, M. (2008). Costs and Benefits of Adopting Accrual Accounting. International Public Sector Bulletin Journal, (5)12, 13-45.
Oyewobi, I. A. (2014). Feasibility of Commencing the International Public Sector Accounting Standards in Oyo State. M.Sc. thesis, department of accounting, Bowen University
Shakirat, A. I. (2013). The Effects of Adoption of Accrual-Based Budgeting on Transparency and Accountability in the Nigerian Public Sector. School of post graduate studies, Lagos, University of Lagos School of post graduate studies.
South Asian Federation of Accountants, (2006). Improving Public Finance Management in India: Opportunity to Move Forward. Shanlax International Journal of Management, 1 (3), 32 – 44.
Udeh, F. & Sopekan, S. (2015). Implications of Adopting International Public Sector Accounting Standards (IPSASs) on the Quality of Financial Reporting of Public Sector Organizations in Nigeria. Awka, Anambra, Nnamdi Azikiwe University, state, Nigeria, 1-9.
Yosra, M. S. &Yosra, G. (2017). Institutional and Economic Factors Affecting the Adoption of IPSASs. .International Journal of Public Administration, Taylor Francis online, 2 (1): 1-4.
121The Determinants of the Adoption of International Public Sector Accounting Standards in Lagos State
Journal of Taxation and Economic Development ISSN 1118-6017 Vol. 18, (1), March 2019

EFFECT OF STRUCTURAL CAPITAL ON PERFORMANCE OF LISTED CONSUMER GOODS COMPANIES IN NIGERIA
By
Halimatu S. AbubakarDepartment of Accounting,
Faculty of Management ScienceNasarawa State University, Keffi
08072023231; [email protected]
Musa I. FodioDepartment of Accounting,
Faculty of Management ScienceNasarawa State University, Keffi
Hassan IbrahimDepartment of Accounting,
Faculty of Management ScienceNasarawa State University, Keffi
AbstractThe recognition of the value and influence of intellectual property rights on performance has overtime been overlooked by companies and researchers. This study examined effect of structural capital on the performance of listed consumer goods companies (CGCs) in Nigeria for a period of six (6) years from 2012 to 2017. The dependent variable for this study is performance proxy by value added while the independent variables are structural capital proxy by intellectual property rights. This study carried out descriptive statistics, correlation analysis, panel regression and post diagnostics test to analyze the variables. The regression result revealed that intellectual property rights has positive and significant effect on performance of listed CGCs in Nigeria for the specified period. The study recommends that listed CGCs in Nigeria should increase investment in intangible assets such as computer software, trademarks, and copyrights as this could be used to create revenue for the businesses there by increasing performance. Also, listed CGCs in Nigeriashould ensure separation of the representation of book value for IPR from that of other intangible assets like goodwill in their financial statements.
Key words: Structural Capital, Intellectual Property Rights and Value Added.
INTRODUCTIONStructural capital had developed as a result of earlier assumptions by Stewart (1997) on the difference between company's book value and its stock market value are in the calculated intangible value considered to be company’s premium earnings, that is, the earnings greater than those of an average company within the industry. The method values company’s intangible assets with a view that the proportion of company's profit that exceeds average yield is explained by intellectual property rights. The method apportions a fixed value to intangible assets like brand equity and proprietary technology that does not change according to the company’s market value.
122Effect of Structural Capital on Performance of Listed Consumer Goods Companies in Nigeria
Journal of Taxation and Economic Development ISSN 1118-6017 Vol. 18, (1), March 2019

Subsequently, the discounted projected cash-flows methods developed by Nash (1998), Anderson and McLean (2000) and Sullivan (2000) assumed that the value of intellectual property is based on assessment through creation of intellectual capital value chain to establish a link between innovation and value realization by recognizing the elements of the company that create significant value. The value of a company comprises of the value of its intangible assets, net present value of earnings from its intellectual capital, net present value of earnings from a company's complementary business assets and net present value of earnings from its generic structural capital. During the same period, Brookling (1996), Andriessen and Tiessen (2000) and Bontis (2001) developed the monetary value method of intellectual property and assumed approach for estimating intellectual property value as analyzing replacement cost of intangible assets, the market value of intangible assets and profitability for each intangible asset. The method classified intangibles as assets and endowments, skills and tacit knowledge, collective values and norms, technology and explicit knowledge, primary and management processes. The method developed other indicators for intellectual property such as weighted patents based on the patents developed by companies using a series of indices such as number of patents and cost of patents to sales turnover. Hierarchies of weighted indicators like monetary value added and intangible value added were combined to obtain intellectual property value.
Considering previous methods, structural capital was first viewed as intangible assets and afterwards as intellectual property such as patents, brands and technology. However, current methods like returns on assets method developed by Luthy (1998), Lev and Zarowin(1999) and Public (2000a) focused on relating already developed indicators of structural capital with company performance. The method apportions a fixed value to intangible assets like brand equity and proprietary technology that does not change according to the company's market value. The method determines intangible value using average pretax earnings, average year-end tangible assets, company's return on assets (ROA), industry average ROA, excess ROA and company's cost of capital. The company's book value plus intellectual property value is compared with market value to determine economic value.
Following current trends, there is need to examine the implication of structural capital indicators on performance of companies. A number of literature in their study have indicated structural capital as company's culture; orientation to quality; innovation; continuous improvement in work processes; information systems; teamwork (Kamukama, Ahiauzu & Ntayi, 2010); succession training; recruitment programs; reward system; skills and education support; employees influence over decisions; effect of systems and programs on productivity, profitability and market valuation; research leader; latest scientific and technical development; research and development budget; board trust and support of research and development; effect of research and development on productivity, profitability and market valuation; intellectual property rights (IPRs) strategies and procedures; monitors of IPRs portfolio; multiple strategy of licensing IPRs; IPRs considered for value creation; utilization of IPRs to maximum level; high number of IPRs; effect of IPRs on productivity, profitability and market valuation (Sharabati, Jawad & Bontis, 2010; Al-Hawajreh, 2013); knowledge management and organizational process efficiency (Mohammadi, Sherafati & Ismail, 2014).
123Effect of Structural Capital on Performance of Listed Consumer Goods Companies in Nigeria
Journal of Taxation and Economic Development ISSN 1118-6017 Vol. 18, (1), March 2019

Consistently, the indicators specified in the previous paragraph were developed based on data generated through responses from the opinion of employees and managers about the effect of R&D and IPRs on profitability, productivity and market valuation. Expenditure on R&D and IPRs are costs items that are incurred by companies and included in the financial statements while profitability, productivity and market valuation are performance measures that could be ascertained with profit figures, turnover, market value, book value, cost of production, total assets and value of equity to mention a few. These figures are also obtainable from the financial statements and would yield better results than mere opinion. Moreover, opinion about recruitment programs, reward systems and procedures for monitoring intellectual property rights (IPRs) should not be preferred to other measures like R&D budget (Ghaffar & Khan, 2014), R and D intensity, advertising intensity (Tsai, Yen & Wen, 2013) cost of IPRs, stock of intellectual property rights and average life of IPRs in the study of IC and performance, since most performance measure are presumed to be profit related. The effect of the expenses (viewed as capital) related to R and D and IPRs on performance should be the concern to companies. In that case, expenses on structural capital should not be taken as synonyms for carrying amount or book value of structural capital, because expenses are events that should be settled within reporting period usually twelve (12) months and is not subjected to any form of capitalization nor is it required for determination of net worth of businesses during purchase consideration among companies. Whereas, the book value of structural capital is that which is capitalized (value is subject to adjustments on cost through amortization) overtime usually within useful life of the intellectual property and constitutes part of net assets of companies.
Nonetheless, company performance measures often used by existing literatures are returns on equity, returns on assets, earnings per share (Ghaffar & Khan, 2014), market capitalization, productivity and profitability (Sharabati et al, 2010; Tsai et al, 2013). Returns on asset and returns on equity are proportions of profit out of total assets and shareholders' equity determined to show what is realized from the usage of assets and to ascertain shareholders wealth. Productivity is ascertained for management use and decision making while market valuation is used for purchase consideration during merger and acquisitions. These measures do not capture the characteristics of the value added as a measure of performance. Value added is the actual amount realized after the deduction of input (bought-in-materials) from output (total revenue). The amount realized is then distributed to employees, providers of finance (interest holders), government (tax) and for growth and expansion of businesses. The value added considers both management and shareholders holdings as well as other stakeholders' interest. Value added measures how efficient companies are in creating value and is composed of retained earnings, salaries, depreciation, interest, dividends and taxes. Value added proportions to sales, production cost, employees, total assets, equity capital and earnings are also forms of company performance that can be computed.
Haven considered measurability issues in the indicators for structural capital and company performance, there is need to raise questions: What are possible modification or alternative indicators for structural capital and performance? What is the effect of structural capital on performance of listed (CGCs) consumer goods companies in Nigeria?
124Effect of Structural Capital on Performance of Listed Consumer Goods Companies in Nigeria
Journal of Taxation and Economic Development ISSN 1118-6017 Vol. 18, (1), March 2019

The objective of this study is to determine the effect of structural capital on the performance of listed consumer goods and industrial goods in Nigeria. However, the hypothesis is stated below:H 1: Structural capital has no significant effect on the performance of consumer goods 0
and industrial goods listed in Nigeria.
Structural CapitalStructural Capital is defined as average length of time for product design, research and development invested in product design, number of multi-functional project teams, product life-cycle trend, revenue generated per research and development expense, number of new product introductions, number of software licenses, ratio of research and development expense to administrative expense, ratio of information system expense to total revenue, volume of information systems use, number of times corporate database is accessed, patents or copyrights per employee and computer links to corporate database (Miller, DuPont, Fera, Jeffrey, Mahon, Payer & Starr, 1999). Structural capital refers to corporate culture, organizational learning, operation process and information system (Chen, Zhu & Xie, 2004). Structural capital is the a non-human asset which remains in factory or office when employees leave at the end of the day which includes: organizational ability, processes, procedures, rules, regulations, data bases, patents, trademarks and copyrights which are company's property that can be traded, reproduced and serve as supportive infrastructure that can be shared within the organization so that human capital can function properly (Ahangar, 2011; Rehman, Asghar & Rehman, 2013).Structural capital can be defined as the sum of capitals stemming from internal processes, relations, communication, systems and programs, research and development and intellectual property rights (Pena, Ruiz & Navarro, 2012; Al-Hawajreh, 2013). Structural capital is everything in an organization that supports employees (human capital) in their work.
Nonetheless, structural capital is an organization's ability to meet the company's routine processes and structures that support employee's efforts to produce optimal intellectual performance and overall business performance. Structural capital includes construction of company's culture and operational systems; employee identification with company perspective; clarification of relationship among authority, responsibility and benefit; validity of enterprise controlling system; construction and utilization of inner information net and company repository; business process period; product quality level; corporate operating efficiency; mutual support and cooperation between employees; availability of enterprise information and share of knowledge; corporate mission and vision; manufacturing processes, management philosophy and all forms of intellectual property (hardware, software, trademarks, patents, formulas, management style, company reputation, image) owned by companies and remains with it even when the worker leaves the organization. From the review of prevailing literature there three major indicators of structural capital namely: corporate culture/systems/procedures, intellectual property rights and research and development. For the purpose of this study, intellectual property rights would be discussed in details in the following paragraph.
Intellectual Property Rights Intellectual property rights (IPRs) refers to creations of the intellect for which a monopoly is assigned to designated owners by law. IPRs are proxy by index construction
125Effect of Structural Capital on Performance of Listed Consumer Goods Companies in Nigeria
Journal of Taxation and Economic Development ISSN 1118-6017 Vol. 18, (1), March 2019

which includes stock of different types of IPRs. This involves the use of flows of IP applications in terms of average life of IPRs and number of new applications of each IPR (Griffiths, Jensen & Webster, 2005). Intellectual property rights (IPRs) are the protections granted to the creators of IP, and include trademarks, copyright, patents, industrial design rights, internet domain names and in some jurisdictions trade secrets (Castro, Lopez, Saez & Salazar, 2006). Patents are rights granted by a government to an inventor to manufacture, use and sell an invention for limited period of time. Patents of companies can be measured by number of patents registered and average quantity of patents of employees. Copyrights are legal rights given to an originator to print or publish a book, perform or record a play, film or photograph within specified jurisdiction. Trademarks are legally registered symbols, graphics, logos or words legally registered and used to represent a company or product. Artistic works including music and literature, as well as discoveries, inventions, words, phrases, symbols, and designs can all be protected as intellectual property. Intellectual property rights are licenses granted for use of intellectual property. IP like software packages are renewable and can be upgraded to current versions for speedy and better features. There are cost implications associated to obtaining licenses for the usage, upgrade and sale of intellectual property. For instance, consumer goods companies engage in transaction with their customers and suppliers through protected e-transactions (electronic transactions) platforms specially designed for the companies. This platform is used by the companies to make payments to suppliers and receipts from customers and a remittance and pin code is generated for the transaction. The implication is that the companies need to determine the cost of license granted for usage of package (IP), cost of maintenance of IP (cost of upgrade). Where it is a patent right there is need for the companies to also determine residual values for IP for purpose like disposal of the IP. Finally, companies need to examine how these costs affect the performance.
PerformanceA measure of performance that is usually avoided by researchers in the assessment of company performance is value added. Value added is used as a measure of efficiency that represents the wealth created through the company’s production process or provision of services. Value added measures the difference between sales and the cost of materials and services incurred to generate the sales (Deep & Narwal, 2014; Kamath, 2015). The resulting wealth is generated by the combined efforts of those who work in the organization (employees) and those who provide the capital (employers and investors). Value added is thus distributed as wages to employees, depreciation for reinvestment in machinery and equipment, interest to lenders of money, dividends to investors and profits to the organization. Value added for a firm is the sum of interest expense, depreciation expenses, dividends, corporate taxes, equity of minority shareholders and profit retained for the year. Value added can be calculated using either the Subtraction Method or the Addition Method. The Subtraction Method emphasizes the creation of value added (Value added = Sales – Cost of purchased goods and services). It measures the difference between sales and the cost of goods and services purchased to generate the sales. The Addition method emphasizes the distribution of value added to those who have contributed to the creation of value added (Value added = Labour cost to employees + Interest to lenders of money + Depreciation for reinvestment in machinery and equipment + Profits retained by the organization + other distributed costs e.g. tax).
126Effect of Structural Capital on Performance of Listed Consumer Goods Companies in Nigeria
Journal of Taxation and Economic Development ISSN 1118-6017 Vol. 18, (1), March 2019

However, for quantitative assessment of firm performance, value added common indicators are: the total amount of computed value added, value added to sales ratio, value added to number of employees, operating profit to value added and value added to fixed assets to measure effectiveness and proportions of value added to various components of financial statements.
EMPIRICAL REVIEWKamukama et al (2010) explored the extent to which structural capital explained financial performance of sixty five (65) micro-finance firms in Uganda. Structural capital was represented as company’s culture, orientation to quality, innovation, continuous improvement, information systems and teamwork while financial performance was indicated as portfolio at risk (PAR), net profit ratio, loan loss recovery ratio, repayment rate, yield on portfolio and returns on asset (ROA). Five (5) point Likert scale was used to convert responses generated from questionnaire administered to employees of the micro-finance institutions into quantitative data. Normality test and Pearson’s bi-variate correlation co-efficient was carried out. Cronbach’s alpha test of reliability and validity was carried out to test for the consistency among questions which shows an alpha of 75% signifying reliability of questions in the questionnaire. Hierarchical regression was used to analyze variables because of its capacity to indicate precisely what happens to the model as different predictor variables are introduced. Multicolinearity test which resulted to a mean VIF of less than 10. The study found SC was a strong predictors of financial performance. The problem with hierarchical regression lies with the choice of what variable to add when including a new model with the aim of improving R2 to determine the fitness of the model. The researcher adds variable to a new model at his/her own discretion and as such causing biasness in the selection of variables. There would be biasness in the responses obtained from the use of employee perception to measure the operational items developed for SC because of the different roles they play as employees in the firms.
Likewise, Sharabati et al (2010) examined the association of structural capital with performance of fifteen (15) pharmaceutical companies registered with the Jordanian Association of Pharmaceutical Manufacturers (JAPM) in 2007. Structural capital was specified as systems and programmes, research and development (R and D), intellectual proprietary rights (IPRs) while business performance was expressed as productivity, profitability and market valuation. A survey unit of analysis was composed of two hundred (200) top and middle managers drawn from the 15 JAPM firms. One hundred and forty (140) were returned as response which represents the sample and one hundred and thirty-two (132) were used for analysis because eight (8) of the surveys were incomplete. Kolmogorov-Smirnov (K-S) test, Cronbach’s alpha test and factor analysis (Pearson’s principal component analysis) were used to test for normality, reliability and validity of data and measures respectively. The Pearson’s bi-variate correlation coefficient was used to test the association between the dependent and the independent variables and ANOVA test was used to analyze respondents’ characteristics related to gender, age, education, experience, department and sector. Other analyses carried out are multi-collinearity, multiple regression analysis and partial least squares (PLS-Graph). Results revealed that there is a significant relationship between structural capital variables and business performance variables. Also, structural capital has a strong and positive influence on business performance.
127Effect of Structural Capital on Performance of Listed Consumer Goods Companies in Nigeria
Journal of Taxation and Economic Development ISSN 1118-6017 Vol. 18, (1), March 2019

However, Sharabati et al (2010) regressed questionnaire responses for intellectual capital variables with quantitative data obtained from annual reports for productivity, profitability and market valuation. Questionnaire responses for independent variable should not be regressed with quantitative data for dependent variable because of the difference in the periods from which data is obtained, only if questionnaire responses is generated for equal number of years from which quantitative data is drawn.
Similarly, Al-Hawajreh (2013) measured effect of structural capital and business performance of fifteen (15) Pharmaceutical manufacturing companies in Jordan. The dependent variable is business performance proxy by productivity, profitability and market valuation while the independent variable is structural capital proxy by systems and programmes (S and P), research and development (R and D) and intellectual property rights (IPRs). Questionnaires containing ten (10) business performance (BP) indicators and thirty (30) structural capital indicators were administered to two hundred (200) managers of selected pharmaceutical manufacturing companies out of which one hundred and thirty-two (132) responses were obtained. Five (5) point Likert scales were used to tap all managers’ perception about the variables. S and P indicators were succession training, culture atmosphere, recruitment programs, reward system, skills & education support, employees influence over decisions, not bureaucratic nightmare, S and P affect productivity, S and P affect profitability and S and P affect market valuation. R and D indicators were research leader, work processes development, development and re-organizing, latest scientific and technical development, innovation's systems & programs, R and D budget, board trust and support R and D, R and D affect productivity, R and D affect profitability and R and D affect market valuation. IPRs indicators were IPRs strategies and procedures, monitors IPRs portfolio, multiple strategy of licensing IPRs, encourage and reward creation, IPRs considered for value creation, utilization of IPRs to maximum level, high number of IPRs, IPRs affect productivity, IPRs affect profitability and IPRs affect market valuation. BP indicators were industry leadership, future outlook, overall response to competition, success rate in new launches, Overall BP and success, employee productivity, process (transaction) productivity, sales growth, profit growth and company market valuation. Kolmogorov test, Cronbach’s alpha test of reliability and Pearson’s principal component factor analysis were used to test for normality, reliability and validity of models and measures. Mean, standard deviation, one-sample t-test and multiple regression analysis were used to assess relationship between variables. Results showed positive significant relationship exist between structural capital and business performance which indicated that structural capital can clearly explain productivity and profitability more than market valuation. S and P, R and D positively and directly affect business performance while IPRs negatively affect business performance.
The indicators of whether S and P, R and D and IPRs affects productivity, profitability and market valuation of the pharmaceutical companies require empirical analysis and not an expression of perception in a questionnaire administered to managers. Also, where there are quantifiable figures about a variable existing in the published reports of a company, the use of individual opinion from questionnaire would be a weak measurement for such variable. In essence variables like employee productivity, sales growth, profit growth and market valuation could be sourced from the financial statements of the companies and so, questionnaire facts for these variables would be a weak source compared to evidence from published reports. Employee productivity
128Effect of Structural Capital on Performance of Listed Consumer Goods Companies in Nigeria
Journal of Taxation and Economic Development ISSN 1118-6017 Vol. 18, (1), March 2019

could be expressed as efficiency and effectiveness of employee in the generation of value added (value added to number of employees), marketing strategy or sales per employee (sales to number of employees) and average remuneration per employee (labour cost to number of employees). Sales growth and market valuation could be defined as changes in sales from period to period and market value to book value respectively while profit growth could be defined as profit margin (operating profit to sales).
On the contrary, Tsai, Yu and Wen (2013), examined implication of R and D intensity (R and D expenditure/sales), advertising intensity (advertising expenditure/sales) on company performance measured by Tobin’s Q ratio and quarterly stock returns rate. Control variables used were market to book value ratio and debt ratio. The descriptive statistics, correlation analysis and panel regression were used to analyze data and variables. The study found that R and D intensity and advertising intensity were significantly related to Tobin’s Q and stock return rates companies. The study did not conduct the normality test to be able detect whether there are abnormalities in the data set. However, the study used expenses incurred on structural capital indicators as against responses from questionnaires as used by Al-Hawajreh (2013).
Equally, Ghaffar and Khan (2014) studied research and development (R and D) effect on performance of eight (8) pharmaceutical companies listed on the Karachi Stock Exchange for a period of six years (6) from 2007 to 2012. Research and development expressed as budget on research and development while performance (FP) was proxy by ROA, ROE and EPS. Correlation and regression analysis were used to analyze variables. The study found that research and development budget had weak correlation with ROA and strong correlation with ROE and EPS, R and D budget had significant positive effect on performance of the companies. The study used the aggregate value of ROA, ROE and EPS as FP and regressed with R and D budget in the model specified which is entirely wrong. The study failed to show result of the R-square (R2) for us to detect whether model was of good fit.
Likewise, Mohammadi et al (2014) established the implication of structural capital on financial performance of companies in Iran using seventy-nine (79) questionnaires containing latent variables and administered to managers of knowledge-intensive small and medium enterprises (SMEs). Three latent variables: knowledge management, organizational culture and organizational process efficiency proxy structural capital. On the other hand, financial performance was expressed as variables included in the latent variables for structural capital. The study could have developed separate latent variables for performance instead of including them in that of structural capital. Cronbach’s alpha, the visual partial least square regression and structural modeling was carried out to analyze relationship between variables and results showed structural capital significant influence on organization’s financial performance.
Microeconomic Theory of Intellectual Property RightsThe basic reasoning for intellectual property rights (IPR) is that the public good character of technological knowledge requires artificial incentives for innovators in the form of temporary monopoly rights on innovations (Thumm, 2000). According to economic theory IPR increase expected profits for the innovator and make him/her to
129Effect of Structural Capital on Performance of Listed Consumer Goods Companies in Nigeria
Journal of Taxation and Economic Development ISSN 1118-6017 Vol. 18, (1), March 2019

invest more in research and development (R and D) in order to raise the innovation rate (innovation effect). The classical welfare analysis of intellectual property rights refers to monopoly theory and takes into consideration monopolistic pricing. The intellectual property right holder sells less quantity of the innovative good for a higher price, implementing a dead weight loss compared to the competitive market situation. Nevertheless, there are dynamic benefits of allowing proprietization of ideas via IPR. Consider a new production innovation that result from a company’s R and D expenditures. If the idea behind the innovation leaks out, rival company can adopt the innovation and produce at the same marginal cost as the original company, but without having incurred the costs of R and D that led to the innovation. Since this puts the original innovator at a competitive disadvantage, it follows that if the companies cannot either keep the innovative idea secret, or obtain intellectual property protection for the idea that allows it to recover its investment costs, it won’t undertake the R and D. Clarke (2011) identified the various costs associated with IPR as transfer cost, rent-seeking cost, fixed cost and cost-benefit trade off.
Transfer costs exist with intellectual property such that transactions costs associated with transfer of intellectual property (or the determination of illegal use of intellectual property) can be substantial because of the problem of identifying which particular idea is actually protected. There are rent-seeking costs associated with the granting of IPR conferred by patents called “patent race”. The costs of protecting intellectual property can be quite large and hence are a key consideration in forming intellectual property policy. Consider a production innovation which the innovating company is able to keep secret and hence exploit for its own benefit. However, it would be more beneficial if the innovation were adopted by the whole industry, rather than just by a single innovative company. This cost is the basis for the requirement of disclosure in patent law. The importance of the costs of protecting intellectual property are also magnified significantly if the underlying fixed cost of innovation is large, while the marginal cost of using the innovative idea is small or zero. If companies can absent the ability to exclude non-payers from using an innovative idea, companies would not incur the fixed cost of innovating unless they can simultaneously protect the innovation. If fixed costs are large, firms may end up investing substantial resources in protecting trade secrets or otherwise discouraging imitators.
The costs associated with granting IPR dictate that if the laws governing the granting of these rights are meant to promote economic efficiency, they should contain provisions which minimize the associated costs.
The microeconomic theory of IPR shows quantitative measurement by way of costs related to intellectual property rights which existing literatures such as Sharabati et al, 2010; Kamukama et al, 2010 and Tsai et al, 2013 on IPR have ignored in their review. Instead, the literatures explored individual perceptions about IPR. This study would explore and identify the book value of IPR included in the intangible assets of listed CGCs in Nigeria. The book value of IPR would be considered because it is the capitalized amount of IPR. In other words, the carrying amount for IPR after adjusting for transfer cost, rent-seeking cost, fixed cost and cost-benefit trade off as prescribed by the micro-economic theory. The book value also recognizes the useful life of the IPR in the computation of its value.
130Effect of Structural Capital on Performance of Listed Consumer Goods Companies in Nigeria
Journal of Taxation and Economic Development ISSN 1118-6017 Vol. 18, (1), March 2019

METHODOLOGY This study employs the ex-post facto research design to establish the relationship between structural capital and the performance of consumer goods companies listed in Nigeria. The dependent variable for this study is company performance indicated as efficiency and proxy by value added. The independent variable is structural capital expressed as intellectual property rights (IPRs) while control variable for this study is company size proxy by total assets of the companies. There are twenty-two (22) consumer goods \companies listed on the Nigerian stock exchange and fourteen (14) were selected as sample size based on purposive sampling technique. Data was sourced from the published annual reports of the selected companies and for the period specified. Panel data involving data required for variables for the thirteen (13) consumer goods companies and for a period of six (6) years from 2012 to 2017, put together to make up seventy-eight (78) observations.
This study would carry out descriptive statistics, normality test, correlation analysis, panel regression and post regression diagnostic test on variables with the aid of statistical package STATA version 13. The descriptive statistics would detect whether there are errors in the data set by determining mean, maximum and minimum values for each of the variable measures. The normality test would determine whether there are outliers in the data set, that is, deviations from the average using Jaque-Berra statistics. Pearson correlation analysis would tests association among the variables, while panel regression would examine the relationship between the dependent and independent variables. Panel regression tests for fixed effect model and random effect model. Thereafter, Housman specification test would determine whether the fixed effect or random effect is most appropriate for the study.
Model Specification:
131Effect of Structural Capital on Performance of Listed Consumer Goods Companies in Nigeria
Journal of Taxation and Economic Development ISSN 1118-6017 Vol. 18, (1), March 2019
Indicators for Variables
Measurements
VA it Value added per annum = sum of dividends pa id, interest paid, retained earnings, taxes paid and wages & salaries paid by the firms a t the end of every trading period for each of the thirteen companies selected and for each period of the six years se lected.
IPR it Value of intel lectual property rights per annum = the carrying amount for copyrights, patents, trademarks and designs acquired by the firms every trading period for each of the thirteen companies selected and for each period of the six years se lected.
FSIZE it Company size = total assets a s a t the end of every trading period for each of the thirteen companies selec ted and for each period of the six years se lected.
it = The sub-script for each indicator in models (1), i represents the companies while t represents the period of the study.
b0 = constant
b1, and b2 are coefficients for the independent variables.
eit = error term

DATA PRESENTATION AND ANALYSISData for the variables IPR, FSIZE and VA were presented using nominal scale. All variables are in billion naira but the size of the absolute values were reduced to nine (9) decimal places to avoid taking natural log and other forms of scaling. Moreover, there are negative values in the data set that would not allow for natural log, whereas, absolute values better describes the data and identify the behavioural pattern of variables. The data set for each variable is panel data which is a combination of cross sectional data (number of companies) represented by thirteen (13) companies and time series data (number of periods) represented by six (6) years 2012 to 2017. However, seventy-eight (78) observations was expected for each variables from the data combination but some of the variables have missing values not obtainable from the financial reports where data was pooled. Nonetheless, IPR had fifty-eight (58) observations, VA had seventy-five (75) observations while FSIZE with seventy- eight (78) observations. See appendix for table of data.
Descriptive Statistics and Normality Test
The above table represents the descriptive statistics of the observations in the data set. The minimum values for VA, IPR and FSIZE are respectively -1.111131 (N-1,111,131,000), 0.001508 (N1,508,000) and 10.13941 (N10,139,410,000) recorded by Dangote Flour Mills and Vitafoam, between 2012 and 2015 period of reporting. Principally, Dangote Flour Mills recorded the minimum values for VA in the year 2015 as a result of increased accumulated loss (retained loss) from N10,524,972,000 in 2014 to N23,052,118,000 in 2015. Both retained profit and retained loss form part of value added. Therefore, retained profit would increase VA while retained loss would decrease VA. Nonetheless, Vitafoam recorded the minimum values for IPR and FSIZE due to restatement of the 2012 value of intangible assets (intellectual property rights) in 2014 and decrease in the value of some items that make up total assets (company size) such as investment property (from N12,642,000 in 2012 to N11,992,000 in 2013), available for sale in financial assets (from N18,644,000 in 2012 to N17,151,000 in 2013), inventories (from N5,171,676,000 in 2012 to N4,333,528,000 in 2013) and cash and bank (from N393,407,000 in 2012 to N268,211,000 in 2013).
The maximum values for the variables are VA 127.9538 (N127,953,800,000), IPR 1.962124 (N1,962,124,000) and FSIZE 482.6033 (N482,603,300,000) respectively recorded by Nigerian Breweries, Unilever and Flour Mills between 2012 and 2017.
The joint probability for the combination of skewness and kurtosis test for normality for all the variables is less than 10% which is significant, thus, the null hypothesis is rejected. This indicates that the data for IPR, FSIZE and VA are not normally distributed. This is probably because the number of observations for the variables are not the same (each variable with different number of observations).
132Effect of Structural Capital on Performance of Listed Consumer Goods Companies in Nigeria
Journal of Taxation and Economic Development ISSN 1118-6017 Vol. 18, (1), March 2019
Variables Minimum Maximum Prob>chi2
Skewness/Kurtosis
VA -1.111131 127.9538 0.0000
IPR 0.001508 1.962124 0.0007
FSIZE 10.13941 482.6033 0.0000
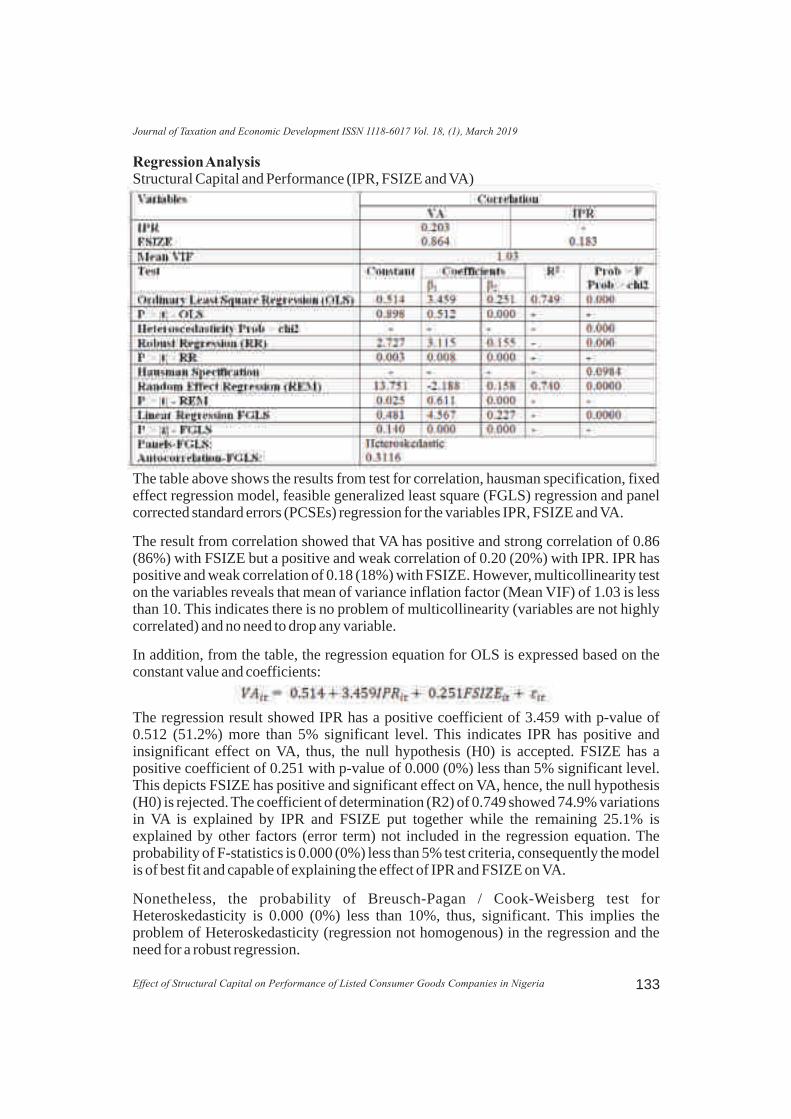
Regression AnalysisStructural Capital and Performance (IPR, FSIZE and VA)
The table above shows the results from test for correlation, hausman specification, fixed effect regression model, feasible generalized least square (FGLS) regression and panel corrected standard errors (PCSEs) regression for the variables IPR, FSIZE and VA.
The result from correlation showed that VA has positive and strong correlation of 0.86 (86%) with FSIZE but a positive and weak correlation of 0.20 (20%) with IPR. IPR has positive and weak correlation of 0.18 (18%) with FSIZE. However, multicollinearity test on the variables reveals that mean of variance inflation factor (Mean VIF) of 1.03 is less than 10. This indicates there is no problem of multicollinearity (variables are not highly correlated) and no need to drop any variable.
In addition, from the table, the regression equation for OLS is expressed based on the constant value and coefficients:
The regression result showed IPR has a positive coefficient of 3.459 with p-value of 0.512 (51.2%) more than 5% significant level. This indicates IPR has positive and insignificant effect on VA, thus, the null hypothesis (H0) is accepted. FSIZE has a positive coefficient of 0.251 with p-value of 0.000 (0%) less than 5% significant level. This depicts FSIZE has positive and significant effect on VA, hence, the null hypothesis (H0) is rejected. The coefficient of determination (R2) of 0.749 showed 74.9% variations in VA is explained by IPR and FSIZE put together while the remaining 25.1% is explained by other factors (error term) not included in the regression equation. The probability of F-statistics is 0.000 (0%) less than 5% test criteria, consequently the model is of best fit and capable of explaining the effect of IPR and FSIZE on VA.
Nonetheless, the probability of Breusch-Pagan / Cook-Weisberg test for Heteroskedasticity is 0.000 (0%) less than 10%, thus, significant. This implies the problem of Heteroskedasticity (regression not homogenous) in the regression and the need for a robust regression.
133Effect of Structural Capital on Performance of Listed Consumer Goods Companies in Nigeria
Journal of Taxation and Economic Development ISSN 1118-6017 Vol. 18, (1), March 2019

Furthermore, the equation for robust regression is stated as follow:
Consequently, there are changes in the coefficients and p-values of predictor variables in robust regression different from ordinary least square regression and with different results. Robust regression showed IPR has a positive coefficient of 3.115 with p-value of 0.008 (0.8%) less than 5% significant level. This indicates IPR has positive and significant effect on VA, thus, the null hypothesis (H0) is rejected. FSIZE has a positive coefficient of 0.155 with p-value of 0.000 (0%) less than 5% significant level. This depicts FSIZE has positive and significant effect on VA, hence, the null hypothesis (H0) is rejected.
However, the equation for fixed effect regression based on constant value and coefficient is stated as follow:
The probability of Hausman specification test is 0.098 (9.8%) less than 5% test criteria. This implies random effect model is more appropriate than fixed effect model and the null hypothesis (H0: p-value > 5%) is accepted. The regression result showed IPR has a negative coefficient of -2.188 with p-value of 0.025 (2.5%) less than 5% significant level. This indicates IPR has negative and significant effect on VA, thus, the null hypothesis (H0) is rejected. FSIZE has a positive coefficient of 0.158 with p-value of 0.000 (0%) less than 5% significant level. This depicts FSIZE has positive and significant effect on VA, hence, the null hypothesis (H0) is rejected. The coefficient of determination (R2) of 0.74 showed 74% variations in VA is explained by IPR and FSIZE put together while the remaining 26% is explained by other factors (error term) not included in the regression equation. The probability of F-statistics is 0.000 (0%) less than 5% test criteria, consequently the model is of best fit and capable of explaining the effect of IPR and FSIZE on VA.
Furthermore, to eliminate heteroskedasticity and autocorrelation, FGLS regression was carried out. Though, time period (T) is less than the number of cross-sections (N) which means PCSEs regression is more appropriate but random effect model (REM) does not support PCSEs (the REM is a generalized least square regression). The equation for FGLS regression is stated as follow:
FGLS regression showed IPR has a positive coefficient of 4.567 with p-value of 0.000 (0%) less than 5% significant level. This indicates IPR has positive and significant effect on VA, thus, the null hypothesis (H0) is rejected. FSIZE has a positive coefficient of 0.227 with p-value of 0.000 (0%) less than 5% significant level. This depicts FSIZE has positive and significant effect on VA, hence, the null hypothesis (H0) is rejected.
Lastly, comparing regression coefficients and p-values obtained from OLS, robust regression, fixed effect model and FGLS established for IPR and FSIZE on VA. OLS showed IPR has positive and insignificant effect on VA while FSIZE has positive and
134Effect of Structural Capital on Performance of Listed Consumer Goods Companies in Nigeria
Journal of Taxation and Economic Development ISSN 1118-6017 Vol. 18, (1), March 2019

significant effect on VA. The random effect model found IPR has negative and insignificant effect on VA while FSIZE have positive and significant effect on VA. Robust regression and FGLS revealed IPR and FSIZE has positive and significant effect on VA.
DISCUSSION OF FINDINGSThis study found that intellectual property rights has positive and significant effect on value added of listed CGCs in Nigeria. This signifies value added would increase as intellectual property rights increase. Also, intellectual property rights have substantial influence on value added. Amount invested on intellectual property rights such as computer software, trademarks and copyrights regarded as intangible assets are capitalized based on amortization and impairment to determine its book value called carrying amount and this forms part of net worth of the business during negotiation for merger and acquisition. Increase in investment in intellectual property rights could create wealth in many ways for businesses. For instance, computer software could be sold at the end of its useful life to generate realizable value and could be rented out to generate rental income. Computer software is used to perform operations and transactions in the business with ease and without error and the output creates wealth for the business. Furthermore, trademarks and copyrights could be serve as source of finance for companies when authorization is granted to third parties for usage and money is realized from such authorization. Consequently, intellectual property rights has major effect on value added such that amount required for growth and expansion of assets is dependent on investment in intellectual property rights.
Finally, company size has positive and significant effect on value added of listed CGCs in Nigeria. This denotes value added would increase as company size increase. It also means company size has substantial influence on value added of listed CGCs in Nigeria for the period specified. Company size as represented by total assets involves increase in all non-current and current assets from acquisition of tangible assets, investment in intangible assets, selling of inventories, accounts receivables, cash and cash equivalence and so on. The larger the size of the business, the likelihood of creating more wealth for CGCs in Nigeria.
CONCLUSION AND RECOMMENDATIONThis study concludes that structural capital represented by intellectual property rights has significant and positive effect on performance of listed CGCs in Nigeria for the period specified. This is similar to the conclusions of Sharabati et al (2010) that intellectual property rights significantly and positively influence performance of selected pharmaceutical companies in Jordan. Therefore, intellectual property rights has material and substantial importance on performance of listed CGCs in Nigeria and so the companies should increase investment in intangible assets such as computer software, trademarks, copyrights as this could be used to create revenue for the businesses there by increasing performance. In addition, CGCs in Nigeria should ensure separation of the representation of book value for IPR from that of other intangible assets like goodwill in their financial statements. This is because intangible assets are non-physical assets and each has different method of valuation. For instance, the method of valuation for intellectual property rights could be different from that of investment in fixed deposits.
135Effect of Structural Capital on Performance of Listed Consumer Goods Companies in Nigeria
Journal of Taxation and Economic Development ISSN 1118-6017 Vol. 18, (1), March 2019

BIBLIOGRAPHY
Adejola, P. A. (2014).Financial Management Theory and Practice, Published by Rainbow Press Limited, Abuja.
Afroze, R. (2011). Intellectual Capital and its Influence on the Financial Performance, ASA University Review, 5(1), 161-173.
Ahangar, R. G. (2011). The Relationship between Intellectual Capital and Financial Performance: An Empirical Investigation in an Iranian Company. African Journal of Business Management, 5(1), 88–95. https://doi.org/10.5897/AJBM10.712
Akinsurulere, O. (2011).Financial Management, Published by Ceemol Nigeria Limited, Lagos.
Al-Hawajreh, K. M. (2013). The Impact of Structural Capital on Business Performance in Jordanian Pharmaceutical Manufacturing Companies. European Journal of Business and Management, 5(10), 177–190.
Al-Matari, E. M., Al-Swidi, A. K., & Fadzil, F. H. B. (2014). The Measurements of Firm Performance's Dimensions. Asian Journal of Finance & Accounting, 6(1), 24-29. https://doi.org/10.5296/ajfa.v6i1.4761
Al-Shubiri, F. N. (2013). The Impact of Value Added Intellectual Coefficient Components on Financial Health. Review of International Comparative Management, 14(962), 459–472.
Andersen R. & McLean R. (2000). Accounting for the Creation of Value. Research Project sponsored by the Canadian Institute of Chartered Accountants.
Andriessen, D. & Tissen, R. (2000). Weightless Wealth: Find Your Real Value in a Future of Intangible Assets. London, United Kingdom: Financial Times Prentice-Hall.
Anuonye, N. B. (2016). Effect of Intellectual Capital on Return on Assets of Insurance Firms in Nigeria, Global Journal of Management and Business Research: C Finance, 16(1), 41-51.
Awan, M. A. S., & Sarfraz, N. (2013). The Impact of Human Capital on Company Performance and the Mediating Effect of Employee Satisfaction. Journal of Business and Management, 8(2), 76–82.
Banker, R., Wattal, S., Liu, F. & Ou, C. (2008).Education, Research & Development and Firm Performance in Information Technology Industries: An Empirical Examination, Working Paper Series.
Baygi, B. M., Zolfani, H. S., Rezaeiniya, N. & Aghdaie, M. H. (2011).Using Fuzzy AHP to Develop Intellectual Capital Evaluation Model in Hotel Industry. European Journal of Scientific Research, 59(2), 170-178.
Bani, M., Mehrpouyan, H., Keshavarziyan, M., & Rohani, M. (2014). Study of the Effect of Intellectual Capital Components and Firm Size. Kuwait Chapter of Arabian Journal of Business and Management Review, 3(11), 212–220.
Bontis, N. (1996). There’s a Price on Your Head: Managing Intellectual Capital Strategically.
136Effect of Structural Capital on Performance of Listed Consumer Goods Companies in Nigeria
Journal of Taxation and Economic Development ISSN 1118-6017 Vol. 18, (1), March 2019

Bontis, N. (1998). Intellectual Capital: An Exploratory Study that Develops Measures a n d M o d e l s . M a n a g e m e n t D e c i s i o n , 3 6 / 2 , p p . 6 3 - 7 6 . http://dx.doi.org/10.1108/00251749810204142
Bontis, N., William, C. C. L., & Richardson, R. (2000). Intellectual Capital and Business Performance in Malaysian industries. Journal of Intellectual Capital, 1(1), 85-100. http://dx.doi.org/10.1108/14691930010324188
Bontis, N. (2001). Assessing Knowledge Assets: A Review of the Models used to Measure Intellectual Capital, International Journal of Management Review, 3(1), 41-60
Bouaziz, Z. (2016). The Impact of R and D Expenses on Firm Performance?: Empirical Witness from the Bist Technology Index, Journal of Business Theory and Practice, 4(1), 51–60.
Brooking, A. (1996). Intellectual Capital: Core Assets for the Third Millennium Enterprise, Thompson Business Press, London.
Brooking, A. (1997). The Management of Intellectual Capital, Long Range Planning, 30(3), 364-365.
Budiandriani, B., & Mahfudnurnajamuddin, M. (2014). The Influence of Intellectual Capital Components to Financial Performance and Value of the Firm Registered in Indonesia Stock Exchange. Research in Applied Economics, 6(1), 216-224. https://doi.org/10.5296/rae.v6i1.5400
Castro, G.M., Lopez, E.N., Saez, P.L., Salazar, E.A., (2006). Organizational Capital as Competitive Advantage of the Firm, Journal of Intellectual Capital 7, 324–337.
Chang, W. S. (2010). The Different Proportion of IC Components and Firms' Market Performance?: Evidence from Taiwan, International Journal of Business and Finance Research, 4(4), 121–134.
Chen, J., Zhu, Z. and Xie, H.Y. (2004). Measuring Intellectual Capital: a New Model and Empirical Study. Journal of Intellectual Capital, 5, 195-212.
Clarke, M., Seng, D., & Whiting, R. H. (2011). Intellectual Capital and Firm Performance in Australia. Journal of Intellectual Capital, 12(4), 505–530. https://doi.org/10.1108/14691931111181706
Deep, R., & Narwal, K. P. (2014). Intellectual Capital and its Association with Financial Performance: A Study of Indian Textile Sector. International Journal of Management and Business Research, 4(1), 43–54.
Deku, G. (2014). Impact of Human Capital Development on the Performance of Ghanian Road Contractors, Kwame Nkrumah University of Science and Technology.
Dogan, M. (2013). Does Firm Size Affect The Firm Profitability?? Evidence from Turkey, Research Journal of Finance and Accounting, 4(4), 53–60.
Emmanuel, O.S. (2012). Business Relational Capital and Firm Performance in South Western Nigerian Small Scale Enterprise Clusters, European Journal of Business Management, 4(17), 207-215.
137Effect of Structural Capital on Performance of Listed Consumer Goods Companies in Nigeria
Journal of Taxation and Economic Development ISSN 1118-6017 Vol. 18, (1), March 2019

Emadzadeh, Afzali, N., Bagheri, A., Rahimpoor, M., Ezadi, F., & Rahmani, M. (2013). Effect of Intellectual Capital on Firm Performance. International Journal of Academic Research in Accounting, Finance and Management Sciences, 3(2), 98–103.
Ghaffar, A., & Khan, W. A. (2014). Impact of Research and Development on Firm Performance. International Journal of Accounting and Financial Reporting, 4(1), 357–367. https://doi.org/10.5296/ijafr.v4i1.6087
Ghanei, H., & Kheibari, A. R. (2015). A Survey of the Relationship between Intellectual Capital and Firm Performance Criteria, Journal of Scientific Research and Development, 2(7), 280–284.
Gigante, G. (2013). Intellectual Capital and Bank Performance in Europe. Accounting and Finance Research, 2(4), 120–129. https://doi.org/10.5430/afr.v2n4p120
Griffiths, W., & Jensen, P. (2005). The Effects on Firm Profits of the Stock of Intellectual Property Rights. Intellectual Property Research Institute, Working Paper Series. R e t r i e v e d f r o m h t t p : / / w w w. i p r i a . c o m / p u b l i c a t i o n s / w p / 2 0 0 5 / IPRIAWP05.2005.pdf
Holienka, M., & Pilková, A. (2014). Impact of Intellectual Capital and its Components on Firm Performance before and after Crisis. Electronic Journal of Knowledge Management, 12(4), 261–272.
Ibrahim, F. A., Shafiei, M. W. M., Ismail, R., & Said, I. (2012). Australian Journal of Business and Management Research. Australian Journal of Business and Management Research, 2(8), 56–62.
International Accounting Standards Board (2004), Intangible Assets, IAS 38, International Accounting Standards Board, London.
Institute of Chartered Accountants of Nigeria-ICAN (2010). Study Park on Financial Reporting and Ethics, VI Publishing Limited, Nigeria.
Isanzua, J. (2015).Impact of Intellectual Capital on Financial Performance of Banks in Tanzania, Journal of International Business Research and Marketing, 1(1).
Iswati, S., & Anshori, M. (2007). The Influence of Intellectual Capital to Financial Performance at Insurance Companies in Jakarta Stock Exchange (JSE). Proceedings of the 13th Asia Pacific Management Conference, 1393–1399.
Jasour, J., Shagagi, F., & Rezazadeh, S. (2013). Impact of Intellectual Capital on Financial Performance in the Pharmaceutical Industry in Iran. International J o u r n a l o f A c c o u n t i n g a n d E c o n o m i c s S t u d i e s , 1 ( 1 ) , 1 – 8 . https://doi.org/10.14419/ijaes.v1i1.771
Kamath, G. B. (2015). Impact of Intellectual Capital on Financial Performance and Market Valuation of Firms in India. International Letters of Social and Humanistic Sciences, 48(1), 107–122. https://doi.org/10.18052/ www.scipress.com/ILSHS.48.107
138Effect of Structural Capital on Performance of Listed Consumer Goods Companies in Nigeria
Journal of Taxation and Economic Development ISSN 1118-6017 Vol. 18, (1), March 2019

Kamukama, N., Ahiauzu, A. & Ntayi, J. M. (2010). Intellectual Capital and Financial Performance in Uganda's Microfinance Institutions. African Journal of Accounting, Economics, Finance and Banking, 6(6), 17–31.
Khanqah, V. T., Khosroshahi, M. A., & Ghanavati, E. (2012). An Empirical Investigation of the Impact of Intellectual Capital on Firms' Market Value and Financial Performance?: Evidence from Iranian Companies. International Journal of Management Business Research, 2(1), 1–12.
Kehelwalatenna, S., Gunaratne, P. S. M., & Lanka, S. (2010). The Impact of Intellectual Capital on the Firm Performance and Investor Response: An Empirical Study of Selected Sectors in Colombo Stock.
Lev, B. & Zarowin, P. (1999). The Capitalization, Amortization and Value-Relevance of R&D. Journal of Accounting and Economics, 21, 107-138
Lev, B. (2001) Intangibles: Management, and Reporting, Bookings Institution Press, Washington, DC.
Low, J & Kallafut, P. C. (2002).Invisible Advantage: How Intangibles are Driving Business Performance, Perseus Publishing, Cambridge.
Luthy, D. H. (1998). Intellectual Capital and its Measurement. Proceedings of the AsianPacific Interdisciplinary Research in Accounting Conference (APIRA), Osaka, Japan.
Mehri, M., Umar, M. S., Saeidi, P., & Hekmat, R. K. (2017). Intellectual Capital and Firm Performance of High Intangible Intensive Industries?: Malaysia Evidence, 9(9), 146–155. https://doi.org/10.5539/ass.v9n9p146
Mohammadi, R., Sherafati, M. & Ismail, B. M. N. (2014). Factors Affecting Intellectual Capital and its Role in Financial Performance of Organization. Indian Journal of Scientific Research,5(1), 314–320.–
Miller, M., DuPont, B., Fera, V., Jeffrey, R., Mahon, B., Payer, B. and Starr, A. (1999). Measuring and Reporting Intellectual Capital from a Diverse Canadian IndustryPerspective, OECD Symposium Amsterdam, Holland.
Mosavi, S. A., Nekoueizadeh, S., & Ghaedi, M. (2012). A Study of Relations between Intellectual Capital Components, Market Value and Finance Performance. African J o u r n a l o f B u s i n e s s M a n a g e m e n t , 6 ( 4 ) , 1 3 9 6 – 1 4 0 3 . https://doi.org/10.5897/AJBM11.1466
Nash, H.H. (1998). Accounting for the Future: Prospective Accounting Initiative. http://home.sprintmail.com/, humphreynash/indexback.htm.
Obiñska-Wajda, E. (2016). The New Institutional Economic Main Theories. “e-F i n a n s e ” F i n a n c i a l I n t e r n e t Q u a r t e r l y , 1 2 ( 1 ) , 7 8 – 8 5 . https://doi.org/10.14636/1734-039X
Ordonez de Pablos, P. (2003). Intellectual Capital Reporting in Spain a Comparative View. Journal of Intellectual capital, 4(1), 61-81.
139Effect of Structural Capital on Performance of Listed Consumer Goods Companies in Nigeria
Journal of Taxation and Economic Development ISSN 1118-6017 Vol. 18, (1), March 2019

Pandey, I. M. (2010). Financial Management, VIKAS Publishing House PVT Limited, New Delhi.
Pena, D.N., Ruiz, V.L. and Navarro J.A. (2012).A case study of control strategy based on intellectual capital management. African Journal of Business Management, 6(16), 5622-5632.
Pulic, A. (2000a). VAIC – an accounting tool for IC management. From http://www.measuringip. at/papers/hamggtxt.html
Pulic, A. (2000b). MVA and VAIC analysis of randomly selected companies from FTSE 250. From http://www.vaic-on.net/downloads/ftse30.pdf.
Rehman, W., Abdul-Rehman, C., Rehman, H. & Zahid, A. (2011). Intellectual Capital Performance and its Impact on Corporate Performance: An Empirical Evidence from Modaraba Sector of Pakistan. Australian Journal of Business and Management Research, 1(5), 8–16.
Rehman, W., Asghar, N. & Rehman, H. (2013). Intellectual Capital Efficiency and Financial Performance of Insurance Sector in Pakistan: A Panel Data Analysis, Middle-East Journal of Scientific Research, 17(9), 1251-1259. https://doi.org/10.5829/idosi.mejsr.2013.17.09.12285
Salman, R. T., Tayib, M., Mansor, M., & Babatunde, A. D. (2012). Impact of Intellectual Capital on Return on Asset in Nigerian Manufacturing Companies. Interdisciplinary Journal of Research in Business, 2(4), 21–30.
Santos, J. B. & Brita, L. A. D. (2012). Toward a Subjective Measurement Model for Firm Performance. Brazilian Administration Review, 9(6), 95–117.
Sharabati, A.A.A., Jawad, S. N. & Bontis, N. (2010). Intellectual Capital and Business Performance in the Pharmaceutical Sector of Jordan. Management Decision, 48(1), 105–131. https://doi.org/10.1108/00251741011014481
SPRING Singapore. (2011). A Guide to Productivity Measurement. A Guide to Productivity Measurement, 3–29. Retrieved from https://www.spring.gov.sg/ Resources/Documents/Guidebook_Productivity_Measurement.pdf
Stewart, T. A. 1997. Intellectual Capital, the New Wealth of Organizations. Nicholas Brealey Publishing: London.
Sullivan, P. H. 2000. Value-Driven Intellectual Capital: How to Convert Intangible Corporate Assets into Market Value. Canada: John Wiley and Sons.
Tharmila, K., & Arulvel, K. K. (2013). The Impact of the Capital Structure and Financial Performance?: A Study of the Listed Companies traded in Colombo Stock Exchange. Merit Research Journal of Accounting, Auditing, Economics and Finance,1(5), 106–117.
Thompson, P. (2001). The Microeconomics of an R&D-Based Model of Endogenous Growth, Journal of Economic Growth, 6,263-283.
Thumm, N. (2000). Intellectual Property Rights: National Systems and Harmonisation in Europe, Springer-Verlag, Berlin Heidelberg GmbH, 31-43.
140Effect of Structural Capital on Performance of Listed Consumer Goods Companies in Nigeria
Journal of Taxation and Economic Development ISSN 1118-6017 Vol. 18, (1), March 2019

Uadiale, O. M., & Uwalomwa, U. (2011). Intellectual Capital and Business Performance: Evidence from Nigeria. Interdisciplinary Journal of Research in Business, 1(10), 49–56.
Umar, G., Emmanuel, O., Emmanuel, T. & Oluseyi, A. (2013). Empirical Study of Training and Development as a Tool for Organizational Performance: Case Study of Selected Banks in Nigeria. Kuwait Chapter of Arabian Journal of Business Management Review, 2(10), 78-87.
Venugopal, D. (2010). Impact of Intellectual Capital on Corporate. Joint International Conference on Technology, Innovation and Industrial Management, Italy, 675–687.
Wang, M. (2011). Measuring Intellectual Capital and its Effect on Financial Performance: Evidence from the Capital Market in Taiwan. Frontiers of Business Research in China, 5(2), 243–265. https://doi.org/10.1007/s11782-011-0130-7
Zadeh, E., Afzali, N., Bagheri, A., Rahimpoor, M., Ezadi, F. & Rahmani, M. (2013).Effect of Intellectual Capital on Firm Performance, International Journal of Academic Research in Accounting, Finance and Management Sciences, 3(2), 98-103.
Zia ul haq, M., Sabir, M. H., Arshad, S. S., A., & Latif, B. (2014). VAIC and Firm Performance: Banking Sector of Pakistan. Information and Knowledge Management, 3(4), 100–107.
Zambon, S. (2002).Accounting, Intangibles and Intellectual Capital: An Overview of the Issues and some Considerations, PRISM Project, University of Ferrara.
Zehri, C., Abdelbaki, A. & Bouabdellah, N. (2012).How Intellectual Capital Affects a Firm's Performance? Australian Journal of Business and Management Research, 2(8), 24-31.
141Effect of Structural Capital on Performance of Listed Consumer Goods Companies in Nigeria
Journal of Taxation and Economic Development ISSN 1118-6017 Vol. 18, (1), March 2019

APPENDIX:DESCRIPTIVE STATISTICS: STRUCTURAL CAPITAL AND PERFORMANCE . tabstat va ipr fsize, statistics( mean min max median sd skewness kurtosis )
stats | va ipr fsize---------+------------------------------ mean | 28.78606 .4538882 102.4348 min | -1.111131 .001598 10.13941 max | 127.9538 1.962124 482.6033 p50 | 14.5893 .301173 70.96574 sd | 32.98029 .471799 105.8857skewness | 1.735271 1.365173 1.677572kurtosis | 5.2675 4.380642 5.103442----------------------------------------
NORMALITY TEST: STRUCTURAL CAPITAL AND PERFORMANCE. sktest va ebenefit estock rec pay equity ipr fsize
Skewness/Kurtosis tests for Normality ----- joint ------ Variable | Obs Pr(Skewness) Pr(Kurtosis) adj chi2(2) Prob>chi2-------------+----------------------------------------------------------- va | 81 0.0000 0.0042 25.41 0.0000 ipr | 58 0.0001 0.0426 14.58 0.0007 fsize | 83 0.0000 0.0056 24.68 0.0000
STRUCTURAL CAPITAL AND PERFORMANCE. correlate va ipr fsize(obs=56)
| va ipr fsize-------------+--------------------------- va | 1.0000 ipr | 0.2027 1.0000 fsize | 0.8641 0.1829 1.0000
. regress va ipr fsize
Source | SS df MS Number of obs = 56-------------+------------------------------ F( 2, 53) = 78.99 Model | 52618.3654 2 26309.1827 Prob > F = 0.0000 Residual | 17652.6033 53 333.067987 R-squared = 0.7488
-------------+------------------------------ Adj R-squared = 0.7393 Total | 70270.9688 55 1277.65398 Root MSE = 18.25
------------------------------------------------------------------------- va | Coef. Std. Err. t P>|t| [95% Conf. Interval]-------------+----------------------------------------------------------- ipr | 3.459055 5.233588 0.66 0.512 -7.038193 13.9563 fsize | .2513682 .0205716 12.22 0.000 .2101067 .2926296 _cons | .5137923 3.977167 0.13 0.898 -7.463395 8.49098-------------------------------------------------------------------------
. estat vif
142Effect of Structural Capital on Performance of Listed Consumer Goods Companies in Nigeria
Journal of Taxation and Economic Development ISSN 1118-6017 Vol. 18, (1), March 2019

Variable | VIF 1/VIF -------------+---------------------- fsize | 1.03 0.966563 ipr | 1.03 0.966563-------------+---------------------- Mean VIF | 1.03
. estat hettest
Breusch-Pagan / Cook-Weisberg test for heteroskedasticity Ho: Constant variance Variables: fitted values of va
chi2(1) = 58.57 Prob > chi2 = 0.0000
. rreg va ipr fsize
Huber iteration 1: maximum difference in weights = .89901506 Huber iteration 2: maximum difference in weights = .28508697 Huber iteration 3: maximum difference in weights = .11778433 Huber iteration 4: maximum difference in weights = .02017464Biweight iteration 5: maximum difference in weights = .29405411Biweight iteration 6: maximum difference in weights = .1494391Biweight iteration 7: maximum difference in weights = .07712247Biweight iteration 8: maximum difference in weights = .0322938Biweight iteration 9: maximum difference in weights = .08850544Biweight iteration 10: maximum difference in weights = .15543771Biweight iteration 11: maximum difference in weights = .1434866Biweight iteration 12: maximum difference in weights = .44280611Biweight iteration 13: maximum difference in weights = .40417407Biweight iteration 14: maximum difference in weights = .40415182Biweight iteration 15: maximum difference in weights = .32318721Biweight iteration 16: maximum difference in weights = .09640538Biweight iteration 17: maximum difference in weights = .02079896Biweight iteration 18: maximum difference in weights = .00501981
Robust regression Number of obs = 56 F( 2, 53) = 644.11 Prob > F = 0.0000
------------------------------------------------------------------------- va | Coef. Std. Err. t P>|t| [95% Conf. Interval]-----------+------------------------------------------------------------- ipr | 3.114561 1.138049 2.74 0.008 .8319248 5.397197 fsize | .1551506 .0044733 34.68 0.000 .1461783 .164123 _cons | 2.727182 .8648387 3.15 0.003 .992535 4.461829-------------------------------------------------------------------------
. xtset id year panel variable: id (strongly balanced) time variable: year, 2012 to 2017 delta: 1 unit
. xtreg va ipr fsize, fe
143Effect of Structural Capital on Performance of Listed Consumer Goods Companies in Nigeria
Journal of Taxation and Economic Development ISSN 1118-6017 Vol. 18, (1), March 2019

Fixed-effects (within) regression Number of obs = 56Group variable: id Number of groups = 13
R-sq: within = 0.4005 Obs per group: min = 1 between = 0.7495 avg = 4.3 overall = 0.7062 max = 6
F(2,41) = 13.70corr(u_i, Xb) = 0.6558 Prob > F = 0.0000
------------------------------------------------------------------------- va | Coef. Std. Err. t P>|t| [95% Conf. Interval]---------+--------------------------------------------------------------- ipr | -5.578031 4.50817 -1.24 0.223 -14.68247 3.526404 fsize | .1171178 .0271617 4.31 0.000 .0622636 .1719719 _cons | 20.98732 4.57564 4.59 0.000 11.74663 30.22801---------+--------------------------------------------------------------- sigma_u | 22.24753 sigma_e | 6.8626806 rho | .91311415 (fraction of variance due to u_i)-------------------------------------------------------------------------F test that all u_i=0: F(12, 41) = 27.82 Prob > F = 0.0000
. estimates store fixed
. xtreg va ipr fsize, re
Random-effects GLS regression Number of obs = 56Group variable: id Number of groups = 13
R-sq: within = 0.3899 Obs per group: min = 1 between = 0.7660 avg = 4.3 overall = 0.7403 max = 6
Wald chi2(2) = 47.57corr(u_i, X) = 0 (assumed) Prob > chi2 = 0.0000
------------------------------------------------------------------------- va | Coef. Std. Err. z P>|z| [95% Conf. Interval]
-------------+----------------------------------------------------------- ipr | -2.187984 4.305065 -0.51 0.611 -10.62576 6.249788 fsize | .1582395 .0241881 6.54 0.000 .1108317 .2056474 _cons | 13.75127 6.116952 2.25 0.025 1.762269 25.74028---------+--------------------------------------------------------------- sigma_u | 16.256774 sigma_e | 6.8626806 rho | .84874905 (fraction of variance due to u_i)-------------------------------------------------------------------------
. estimates store random
. hausman fixed random
---- Coefficients ----
144Effect of Structural Capital on Performance of Listed Consumer Goods Companies in Nigeria
Journal of Taxation and Economic Development ISSN 1118-6017 Vol. 18, (1), March 2019
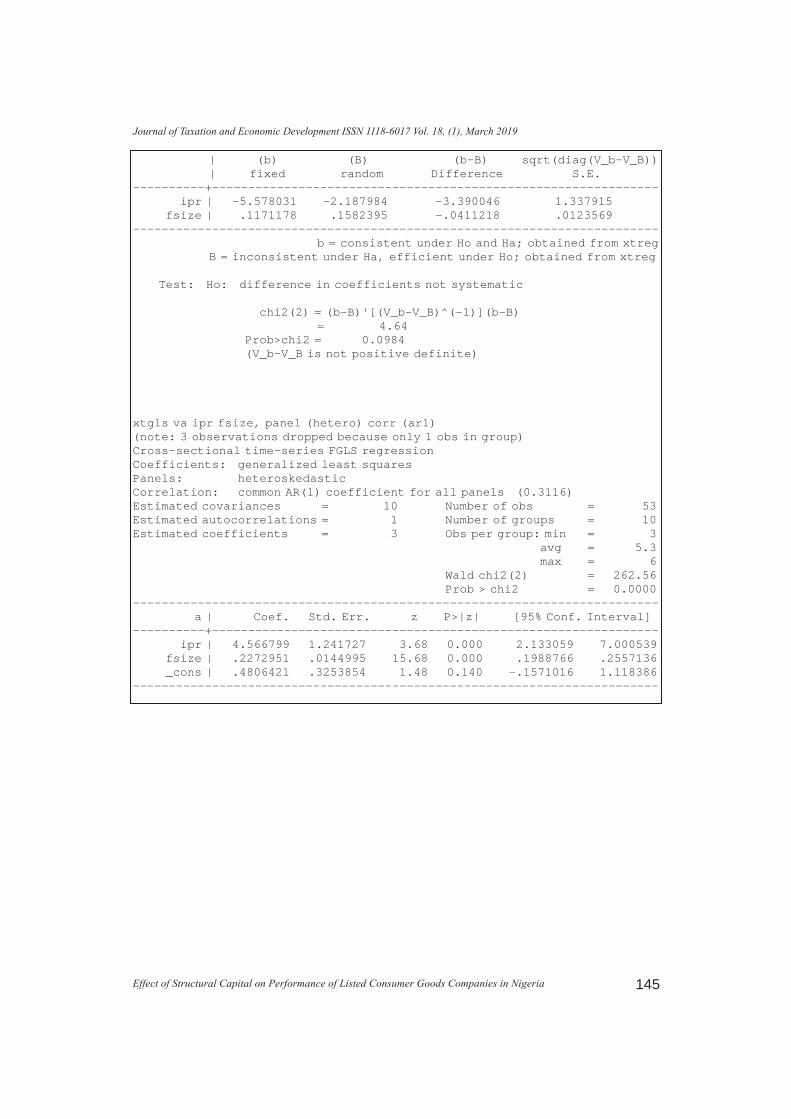
| (b) (B) (b-B) sqrt(diag(V_b-V_B)) | fixed random Difference S.E.----------+-------------------------------------------------------------- ipr | -5.578031 -2.187984 -3.390046 1.337915 fsize | .1171178 .1582395 -.0411218 .0123569------------------------------------------------------------------------- b = consistent under Ho and Ha; obtained from xtreg B = inconsistent under Ha, efficient under Ho; obtained from xtreg
Test: Ho: difference in coefficients not systematic
chi2(2) = (b-B)'[(V_b-V_B)^(-1)](b-B) = 4.64 Prob>chi2 = 0.0984 (V_b-V_B is not positive definite)
xtgls va ipr fsize, panel (hetero) corr (ar1)(note: 3 observations dropped because only 1 obs in group)Cross-sectional time-series FGLS regressionCoefficients: generalized least squaresPanels: heteroskedasticCorrelation: common AR(1) coefficient for all panels (0.3116)Estimated covariances = 10 Number of obs = 53Estimated autocorrelations = 1 Number of groups = 10Estimated coefficients = 3 Obs per group: min = 3 avg = 5.3 max = 6 Wald chi2(2) = 262.56 Prob > chi2 = 0.0000------------------------------------------------------------------------- a | Coef. Std. Err. z P>|z| [95% Conf. Interval]----------+-------------------------------------------------------------- ipr | 4.566799 1.241727 3.68 0.000 2.133059 7.000539 fsize | .2272951 .0144995 15.68 0.000 .1988766 .2557136 _cons | .4806421 .3253854 1.48 0.140 -.1571016 1.118386-------------------------------------------------------------------------
145Effect of Structural Capital on Performance of Listed Consumer Goods Companies in Nigeria
Journal of Taxation and Economic Development ISSN 1118-6017 Vol. 18, (1), March 2019

DATA FOR VARIABLES
146Effect of Structural Capital on Performance of Listed Consumer Goods Companies in Nigeria
Journal of Taxation and Economic Development ISSN 1118-6017 Vol. 18, (1), March 2019
YEAR
2012
2013
2014
2015
2016
2017
2012
2013
2014
2015
2016
2017
2012
2013
2014
2015
2016
2017
2012
2013
2014
2015
2016
2017
2012
2013
2014
2015
2016
2017
2012
2013
2014
2015
2016
2017
2012
2013
2014
2015
2016
2017
2012
2013
2014
2015
Id
1
1
1
1
1
1
2
2
2
2
2
2
3
3
3
3
3
3
4
4
4
4
4
4
5
5
5
5
5
5
6
6
6
6
6
6
7
7
7
7
7
7
8
8
8
8
VA
7.876575000
-0.464926000
-0.742351000
-1.111131000
19.898188000
34.102667000
20.064607000
22.137719000
20.963026000
25.541188000
29.937690000
60.986417000
46.641358000
40.102595000
36.512939000
40.466106000
27.017425000
32.943833000
5.325356000
5.494730000
4.739209000
5.400862000
6.286251000
11.438062000
43.921319000
48.449104000
52.203248000
58.924411000
69.206858000
91.181900000
127.953812000
116.509322000
118.430536000
127.071588000
112.428952000
126.560289000
13.765161000
15.911240000
15.878513000
15.826290000
13.338694000
13.975886000
15.382384000
14.996567000
13.737531000
13.379513000
IPR
0.239218000
0.301711000
0.263885000
0.136571000
0.012753000
0.002564000
0.679792000
0.578771000
0.608138000
0.942887000
1.708807000
1.364420000
0.234993000
0.141184000
0.047374000
0.026347000
0.890878000
0.697975000
0.673757000
0.524251000
0.548129000
0.506247000
1.017337000
1.962124000
1.627836000
1.398037000
1.168581000
FSIZE
77.449018000
75.481540000
54.801489000
49.354982000
79.979982000
129.357118000
83.051450000
83.159877000
92.801302000
102.232144000
178.381640000
195.080449000
102.534172000
121.060621000
132.328273000
122.246632000
136.992444000
146.038216000
10.689542000
11.431167000
12.555885000
16.294826000
24.603267000
30.123247000
88.963218000
108.207480000
106.062067000
119.215053000
169.585932000
146.804128000
253.633629000
252.759633000
349.229163000
358.218676000
367.146468000
382.228093000
64.406797000
72.296420000
70.965735000
67.387914000
74.430174000
90.087525000
36.497624000
43.754114000
45.736255000
50.172484000

147Effect of Structural Capital on Performance of Listed Consumer Goods Companies in Nigeria
Journal of Taxation and Economic Development ISSN 1118-6017 Vol. 18, (1), March 2019
2016
2017
2012
2013
2014
2015
2016
2017
2012
2013
2014
2015
2016
2017
2013
2014
2015
2016
2017
2012
2013
2014
2015
2016
2017
2012
2013
2014
2015
2016
2017
8
8
9
9
9
9
9
9
10
10
10
10
10
10
11
11
11
11
11
12
12
12
12
12
12
13
13
13
13
13
13
16.637122000
25.409792000
12.092405000
14.589302000
8.958360000
8.842980000
6.643311000
6.431980000
31.467708000
46.689129000
51.827365000
57.387200000
63.908073000
73.969895000
6.283443000
6.953109000
7.677724000
10.039958000
10.286277000
10.307634000
7.690837000
34.039910000
14.009229000
2.412961000
2.461210000
2.669062000
3.186567000
2.919870000
3.541344000
0.940124000
0.705890000
0.054636000
0.011693000
0.342076000
0.283218000
0.397439000
0.300635000
0.520868000
0.672908000
0.554905000
0.496248000
0.735330000
0.208370000
0.024765000
0.022444000
0.054383000
0.054923000
0.045738000
0.169024000
0.303296000
0.147933000
0.183581000
0.192566000
0.370234000
0.001508000
0.036326000
0.041293000
0.050575000
0.050763000
0.047166000
72.491309000
121.084365000
40.156508000
43.172624000
28.111286000
28.417005000
28.409000000
28.423122000
232.578054000
280.137992000
296.561247000
343.260830000
345.348326000
482.603257000
23.036762000
24.370540000
30.171590000
33.482106000
44.962735000
28.006505000
32.663299000
49.818490000
55.477999000
83.161837000
98.324096000
10.591638000
10.139408000
11.913500000
12.849555000
13.269399000
13.410672000