CIMA F2 - Financial Management Workbook Q & A - Mapit ...
255
F2 Financial Management Q & A www.mapitaccountancy.com CIMA F2 - Financial Management Workbook Q & A
-
Upload
khangminh22 -
Category
Documents
-
view
1 -
download
0
Transcript of CIMA F2 - Financial Management Workbook Q & A - Mapit ...

F2 Financial Management Q & A www.mapitaccountancy.com
CIMA F2 - Financial Management
Workbook Q & A

F2 Financial Management Q & A www.mapitaccountancy.com
Group Accounts

F2 Financial Management Q & A www.mapitaccountancy.com
Illustration 1
Additional Information
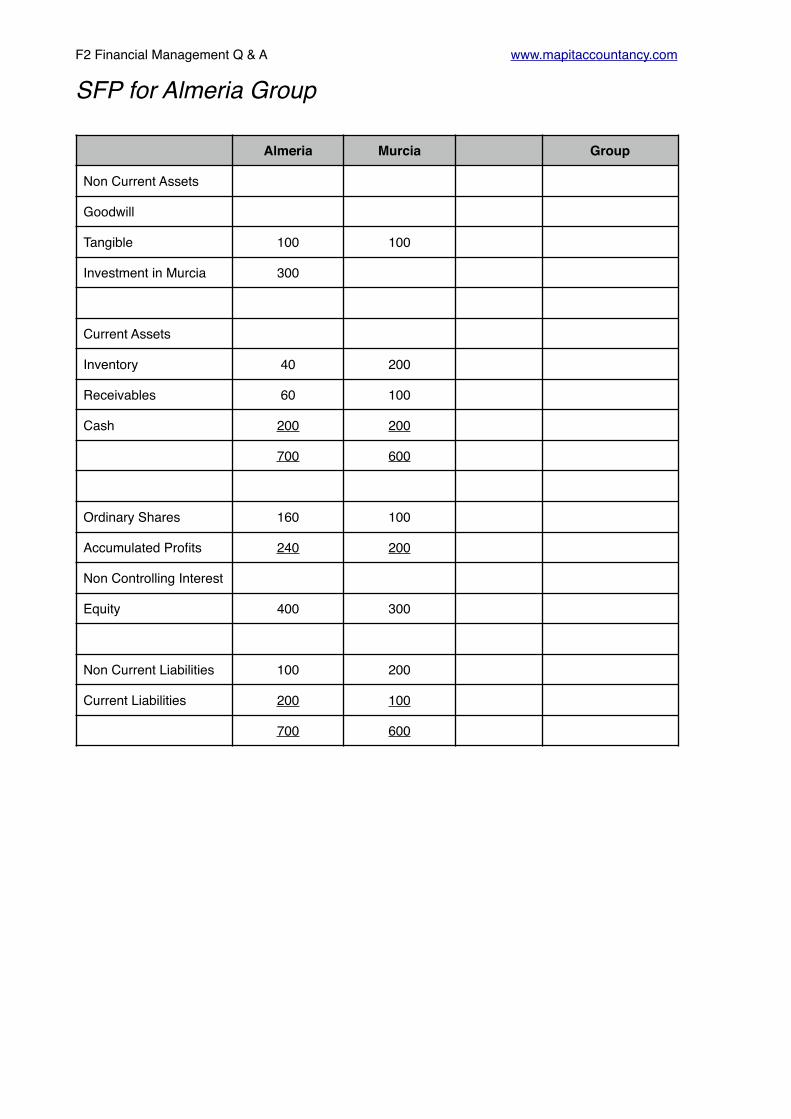
Almeria today acquired all the shares in Murcia for $300m.
The Fair Value of the NCI at acquisition was 0.
Required
Prepare the consolidated statement of financial position for the Almeria group
Almeria Murcia
Non Current Assets
Tangible 100 100
Investment in Murcia 300
Current Assets
Inventory 40 200
Receivables 60 100
Cash 200 200
700 600
Ordinary Shares 160 100
Accumulated Profits 240 200
Equity 400 300
Non Current Liabilities 100 200
Current Liabilities 200 100
700 600
F2 Financial Management Q & A www.mapitaccountancy.com
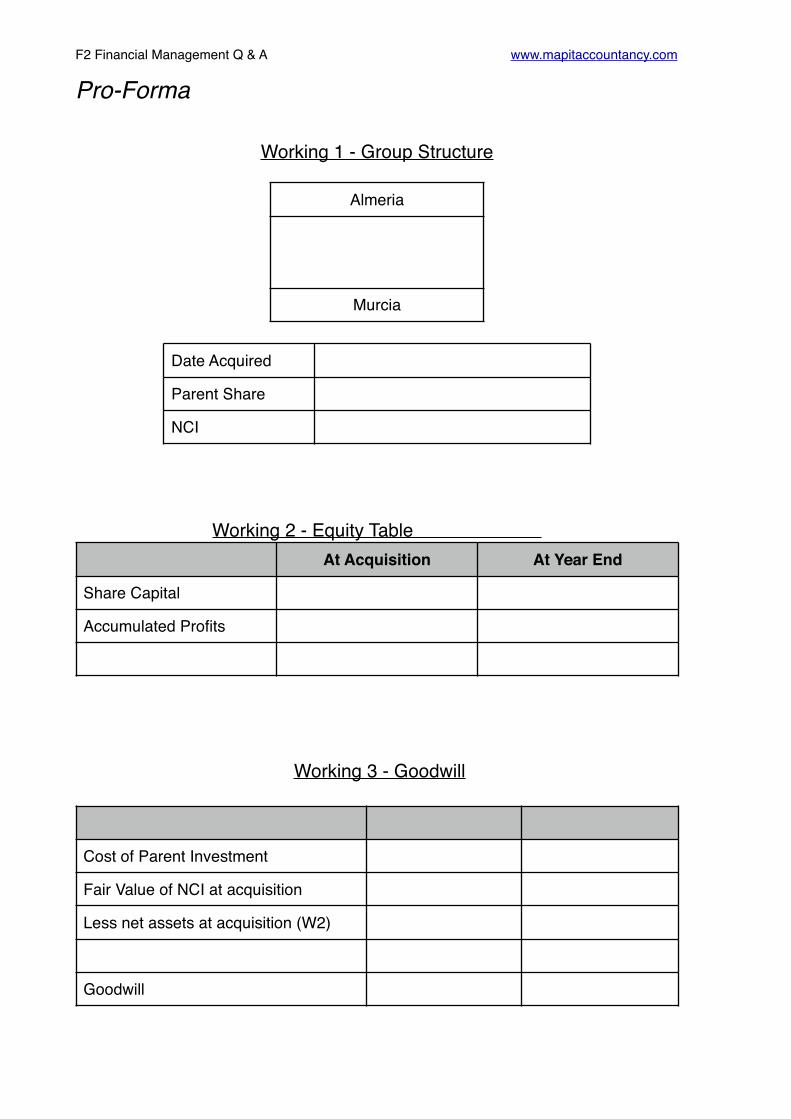
Pro-Forma
Working 1 - Group Structure
Working 2 - Equity Table
Working 3 - Goodwill
Almeria
Murcia
Date Acquired
Parent Share
NCI
At Acquisition At Year End
Share Capital
Accumulated Profits
Cost of Parent Investment
Fair Value of NCI at acquisition
Less net assets at acquisition (W2)
Goodwill

F2 Financial Management Q & A www.mapitaccountancy.com
Working 4 - NCI
Working 5 - Accumulated Profits
$
Fair Value of NCI at acquisition
NCI% of Sub Post-Acq Profits
Value of NCI at Year End
$
Parent’s Accumulated Profits
Add: Parent % of the subsidiary’s post acquisition profits
F2 Financial Management Q & A www.mapitaccountancy.com
SFP for Almeria Group
Almeria Murcia Group
Non Current Assets
Goodwill
Tangible 100 100
Investment in Murcia 300
Current Assets
Inventory 40 200
Receivables 60 100
Cash 200 200
700 600
Ordinary Shares 160 100
Accumulated Profits 240 200
Non Controlling Interest
Equity 400 300
Non Current Liabilities 100 200
Current Liabilities 200 100
700 600

F2 Financial Management Q & A www.mapitaccountancy.com
Solution
Working 1 - Group Structure
Working 2 - Equity Table
Working 3 - Goodwill
Almeria
↓100%
Murcia
Date Acquired TODAY
Parent Share 100%
NCI 0%
At Acquisition At Year End
Share Capital 100 100
Accumulated Profits 200 200
300 300
Cost of Parent Investment 300
Fair Value of NCI 0
Less net assets at acquisition (W2) -300
Goodwill 0

F2 Financial Management Q & A www.mapitaccountancy.com
Working 4 - NCI
Working 5 - Accumulated Profits
$
Fair Value of NCI at acquisition 0
NCI% of Sub Post-Acq Profits 0
Value of NCI at Year End 0
$
Parent’s Accumulated Profits 240
Add: Parent % of the subsidiary’s post acquisition profits Nil
240

F2 Financial Management Q & A www.mapitaccountancy.com
SFP for Almeria Group
Almeria Murcia Group
Non Current Assets
Goodwill None (W3) Nil
Tangible 100 100 100 + 100 200
Investment in Murcia 300 Cancel out Nil
Current Assets
Inventory 40 200 40 + 200 240
Receivables 60 100 60 +100 160
Cash 200 200 200 + 200 400
700 600 1000
Ordinary Shares 160 100 Parent 160
Accumulated Profits 240 200 W5 240
Non Controlling Interest W4 Nil
Equity 400 300 400
Non Current Liabilities 100 200 100 + 200 300
Current Liabilities 200 100 200 + 100 300
700 600 1000

F2 Financial Management Q & A www.mapitaccountancy.com
Illustration 2
Additional Information
Ant today acquired 160m of the 200m shares in Dec.
The Fair Value of the NCI was 50.
Required
Prepare the consolidated statement of financial position for the Ant group
Ant Dec
Assets 500 500
Investment in Dec 350
850 500
Ordinary Shares 100 200
Accumulated Profits 250 100
Equity 350 300
Liabilities 500 200
850 500

F2 Financial Management Q & A www.mapitaccountancy.com
Illustration 2 Pro-Forma
Working 1- Group Structure
Working 2- Equity Table
Working 3 - Goodwill
↓
Date Acquired
Parent Share
NCI
At Acquisition At Year End
Share Capital
Accumulated Profits
Cost of Parent Investment
Fair Value of NCI at acquisition
Less net assets at acquisition (W2)
Goodwill

F2 Financial Management Q & A www.mapitaccountancy.com
Working 4 - NCI
Working 5 - Accumulated Profits
$
Fair Value of NCI at acquisition
NCI% of Sub Post-Acq Profits
Value of NCI at Year End
$
Parent’s Accumulated Profits
Add: Parent % of the subsidiary’s post acquisition profits

F2 Financial Management Q & A www.mapitaccountancy.com
Statement of Financial Position for Ant Group
Ant Dec Group
Goodwill
Assets 500 500
Investment in Dec
350
850 500
Ordinary Shares
100 200
Accumulated Profits
250 100
NCI
Equity 350 300
Liabilities 500 200
850 500
F2 Financial Management Q & A www.mapitaccountancy.com
Illustration 2 Solution
Working 1- Group Structure
Working 2- Equity Table
Working 3 - Goodwill
Ant
↓80%
Dec
Date Acquired TODAY
Parent Share 80%
NCI 20%
100%
At Acquisition At Year End
Share Capital 200 200
Accumulated Profits 100 100
300 300
Cost of Parent Investment 350
Fair Value of NCI at acquisition 50
Less net assets at acquisition (W2) -300
Goodwill 100

F2 Financial Management Q & A www.mapitaccountancy.com
Working 4 - NCI
Working 5 - Accumulated Profits
$
Fair Value of NCI at acquisition 50
NCI% of Sub Post-Acq Profits 0
Value of NCI at Year End 50
$
Parent’s Accumulated Profits 250
Add: Parent % of the subsidiary’s post acquisition profits Nil
250

F2 Financial Management Q & A www.mapitaccountancy.com
Statement of Financial Position for Ant Group
Ant Dec Group
Goodwill W3 100
Assets 500 500 500 + 500 1000
Investment in Dec
350 Cancelled in Goodwill W3
Nil
850 500 1100
Ordinary Shares
100 200 Parent Only 100
Accumulated Profits
250 100 W5 250
NCI W4 50
Liabilities 500 200 500 +200 700
850 500 1100

F2 Financial Management Q & A www.mapitaccountancy.com
Illustration 3
Additional Information
Evan acquired 150m shares in Dando one year ago when the reserves of Dando were $40m. The Fair Value of the NCI on the date of acquisition was $100m.
Required
Prepare the consolidated statement of financial position for the Evan group.
Evan Dando
Assets 200 350
Investment in Dando 500
Current Assets 200 300
900 650
Ordinary Shares ($1) 200 200
Accumulated Profits 250 100
Equity 450 300
Non Current Liabilities 280 200
Liabilities 170 150
900 650
F2 Financial Management Q & A www.mapitaccountancy.com
Solution
Working 1- Group Structure
Working 2 - Equity Table
Working 3 - Goodwill
↓
Date Acquired
Parent Share
NCI
At Acquisition At Year End
Share Capital
Accumulated Profits
Cost of Parent Investment
Fair Value of NCI at acquisition
Less net assets at acquisition (W2)
Goodwill

F2 Financial Management Q & A www.mapitaccountancy.com
Working 4 - NCI
Working 5 - Accumulated Profits
$
Fair Value of NCI at acquisition
NCI% of Sub Post-Acq Profits
Value of NCI at Year End
$
Parent’s Accumulated Profits
Add: Parent % of the subsidiary’s post acquisition profits

F2 Financial Management Q & A www.mapitaccountancy.com
Statement of Financial Position for Evan Group
Evan Dando Group
Goodwill
Assets 200 350
Investment in Dando
500
Current Assets 200 300
900 650
Ordinary Shares ($1)
200 200
Accumulated Profits
250 100
NCI
Equity 450 300
Non Current Liabilities
280 200
Liabilities 170 150
900 650

F2 Financial Management Q & A www.mapitaccountancy.com
Solution
Working 1- Group Structure
Working 2 - Equity Table
Working 3 - Goodwill
Evan
↓75%
Dando
Date Acquired 1 Year Ago
Parent Share 75%
NCI 25%
100%
At Acquisition At Year End
Share Capital 200 200
Accumulated Profits 40 100
240 300
Cost of Parent Investment 500
Fair Value of NCI at acquisition 100
Less net assets at acquisition (W2) -240
Goodwill 360
F2 Financial Management Q & A www.mapitaccountancy.com
Working 4 - NCI
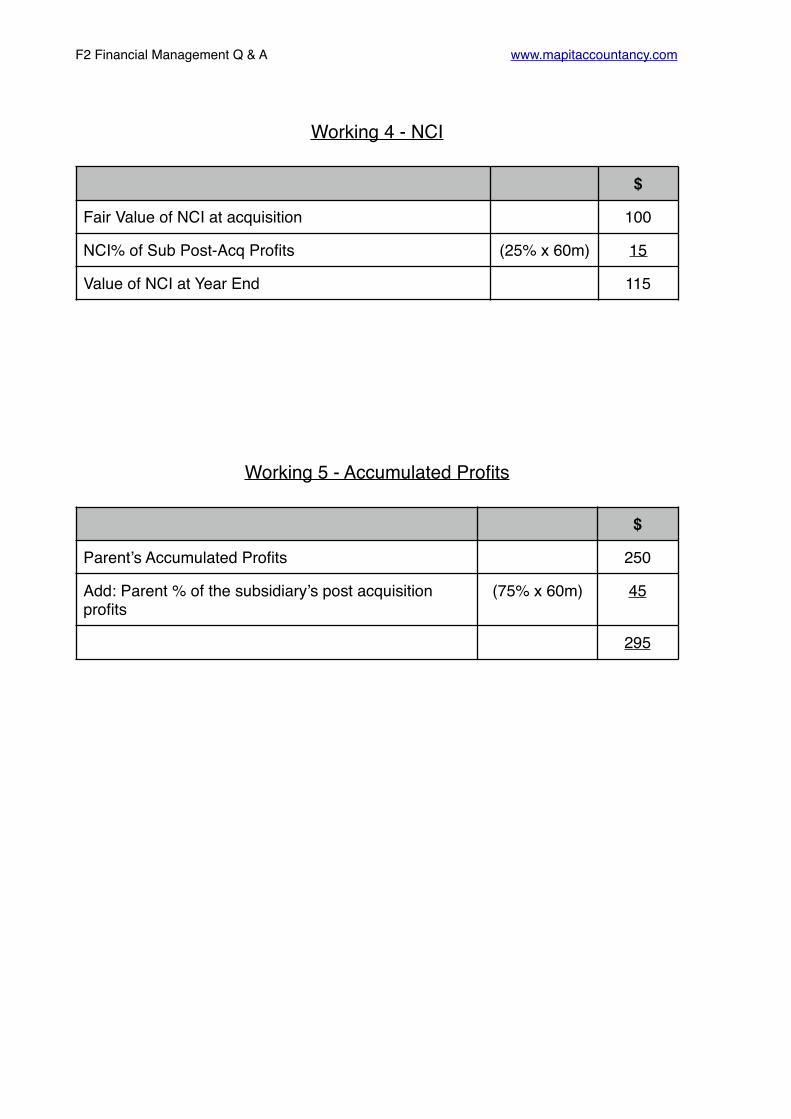
Working 5 - Accumulated Profits
$
Fair Value of NCI at acquisition 100
NCI% of Sub Post-Acq Profits (25% x 60m) 15
Value of NCI at Year End 115
$
Parent’s Accumulated Profits 250
Add: Parent % of the subsidiary’s post acquisition profits
(75% x 60m) 45
295

F2 Financial Management Q & A www.mapitaccountancy.com
Statement of Financial Position for Evan Group
Evan Dando Group
Goodwill W3 360
Assets 200 350 200 + 350 550
Investment in Dando
500 Cancelled out in W3.
Nil
Current Assets 200 300 200 + 300 500
1410
Ordinary Shares ($1)
Parent Only 200
Accumulated Profits
W5 295
NCI W4 115
570
Non Current Liabilities
280 200 280 + 200 480
Liabilities 170 150 170 + 150 320
1410

F2 Financial Management Q & A www.mapitaccountancy.com
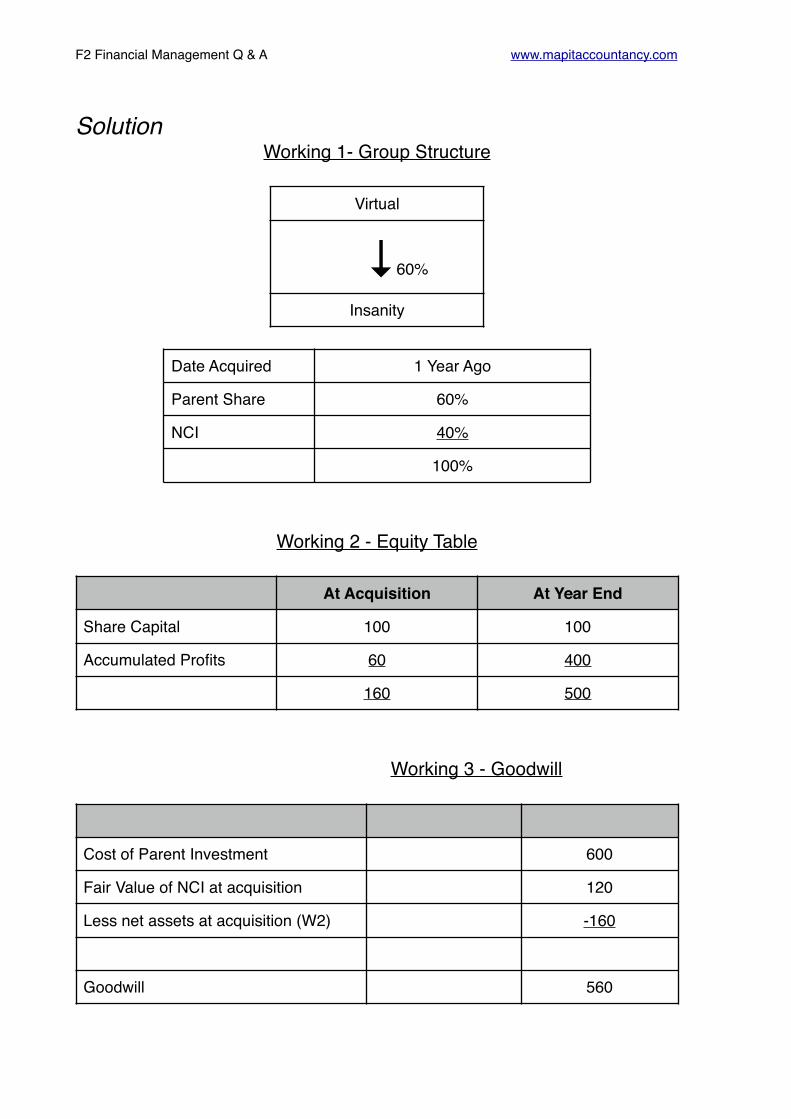
Illustration 4
Additional Information
Virtual acquired 60m shares in Insanity one year ago when the reserves of Insanity were $60m. The Fair Value of the NCI at that date was $120m.
Required
Prepare the consolidated statement of financial position for the Virtual group
Virtual Insanity
Assets 1000 800
Investment in Insanity 600
Current Assets 400 200
2000 1000
Ordinary Shares ($1) 800 100
Accumulated Profits 750 400
Equity 1550 500
Non Current Liabilities 250 300
Liabilities 200 200
2000 1000
F2 Financial Management Q & A www.mapitaccountancy.com
SolutionWorking 1- Group Structure
Working 2 - Equity Table
Working 3 - Goodwill
Virtual
↓60%
Insanity
Date Acquired 1 Year Ago
Parent Share 60%
NCI 40%
100%
At Acquisition At Year End
Share Capital 100 100
Accumulated Profits 60 400
160 500
Cost of Parent Investment 600
Fair Value of NCI at acquisition 120
Less net assets at acquisition (W2) -160
Goodwill 560
F2 Financial Management Q & A www.mapitaccountancy.com
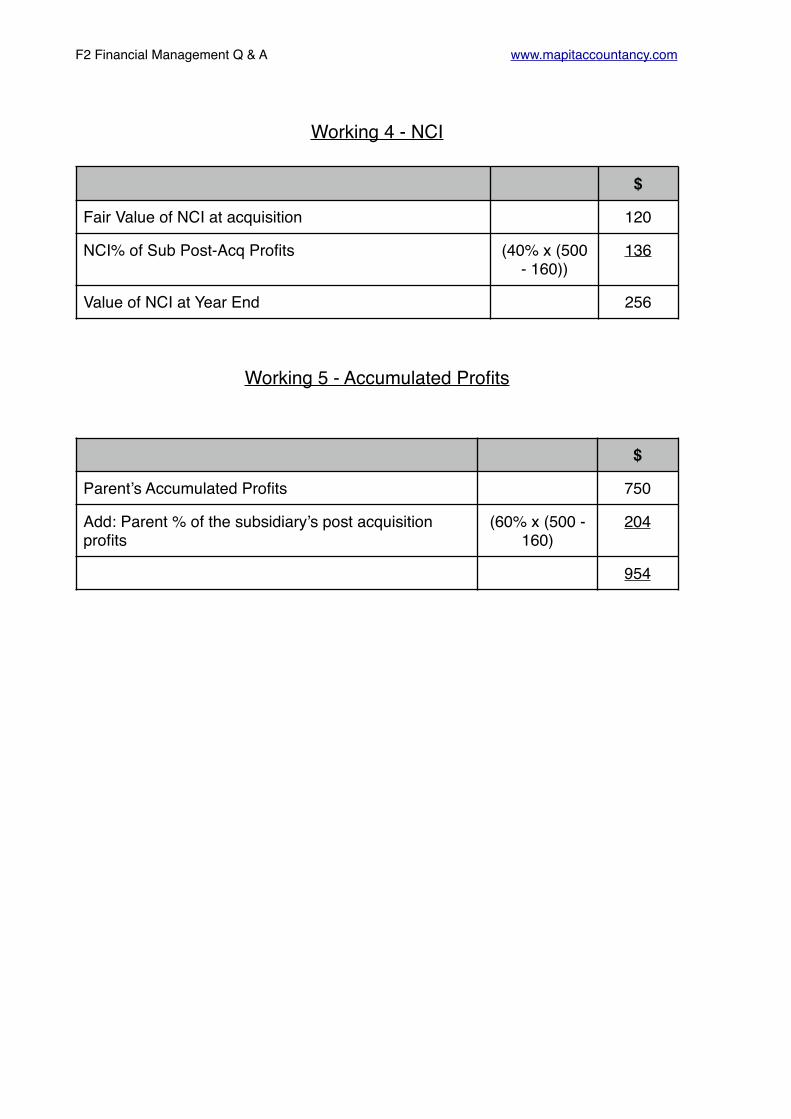
Working 4 - NCI
Working 5 - Accumulated Profits
$
Fair Value of NCI at acquisition 120
NCI% of Sub Post-Acq Profits (40% x (500 - 160))
136
Value of NCI at Year End 256
$
Parent’s Accumulated Profits 750
Add: Parent % of the subsidiary’s post acquisition profits
(60% x (500 - 160)
204
954
F2 Financial Management Q & A www.mapitaccountancy.com
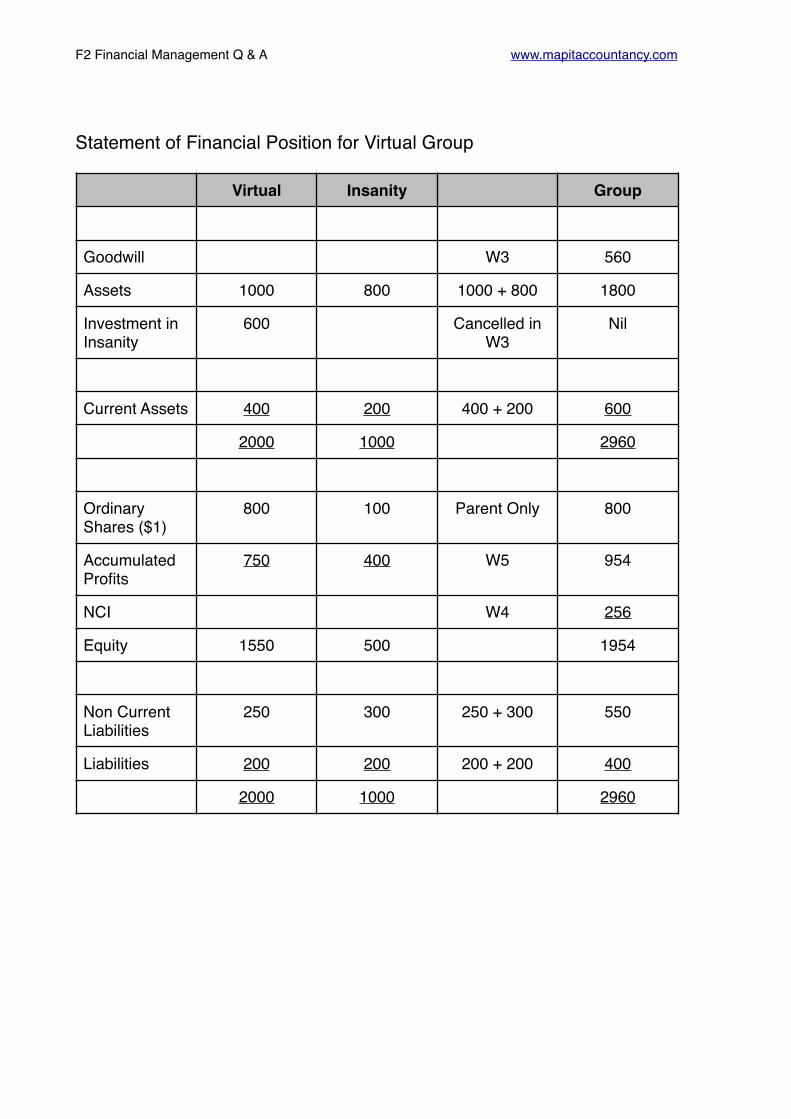
Statement of Financial Position for Virtual Group
Virtual Insanity Group
Goodwill W3 560
Assets 1000 800 1000 + 800 1800
Investment in Insanity
600 Cancelled in W3
Nil
Current Assets 400 200 400 + 200 600
2000 1000 2960
Ordinary Shares ($1)
800 100 Parent Only 800
Accumulated Profits
750 400 W5 954
NCI W4 256
Equity 1550 500 1954
Non Current Liabilities
250 300 250 + 300 550
Liabilities 200 200 200 + 200 400
2000 1000 2960

F2 Financial Management Q & A www.mapitaccountancy.com
Illustration 5
Jabba acquired 100% of the shares in Hutt two years ago.
The consideration was as follows:
1. Cash of $36,000.2. 2000 Shares in Jabba (the share price is currently $3).3. $30,000 to be paid four years after the date of acquisition. The
relevant discount rate is 12%4. If the group meets certain targets there will be a further payment with
fair value of $60,000 at a later date.
Required:
(i) Calculate the fair value of the consideration which Jabba has given in purchasing the investment in Hutt.
(ii)Show the value of the liability in the Statement of Financial Position for the deferred consideration at the end of the current year.
(iii)What is the charge to the Statement of Profit or Loss in the current period related to the deferred consideration?
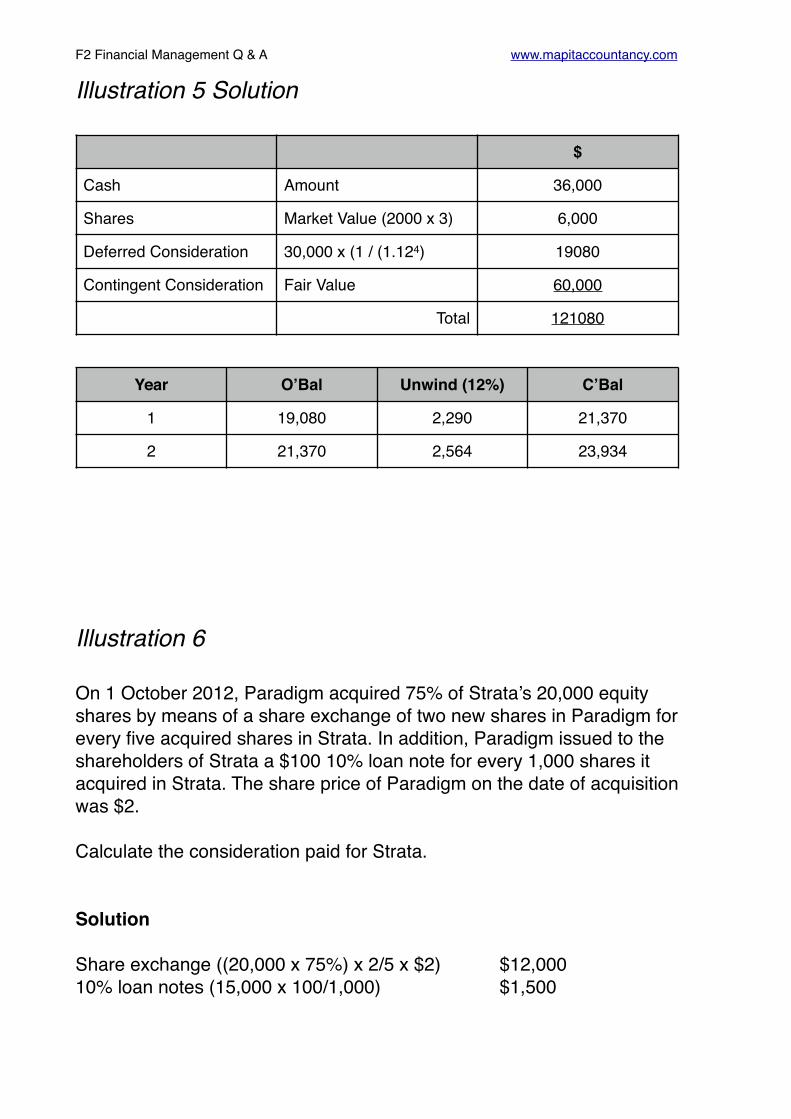
F2 Financial Management Q & A www.mapitaccountancy.com
Illustration 5 Solution
Illustration 6
On 1 October 2012, Paradigm acquired 75% of Strata’s 20,000 equity shares by means of a share exchange of two new shares in Paradigm for every five acquired shares in Strata. In addition, Paradigm issued to the shareholders of Strata a $100 10% loan note for every 1,000 shares it acquired in Strata. The share price of Paradigm on the date of acquisition was $2.
Calculate the consideration paid for Strata.
Solution
Share exchange ((20,000 x 75%) x 2/5 x $2) $12,00010% loan notes (15,000 x 100/1,000) $1,500
$
Cash Amount 36,000
Shares Market Value (2000 x 3) 6,000
Deferred Consideration 30,000 x (1 / (1.124) 19080
Contingent Consideration Fair Value 60,000
Total 121080
Year O’Bal Unwind (12%) C’Bal
1 19,080 2,290 21,370
2 21,370 2,564 23,934
F2 Financial Management Q & A www.mapitaccountancy.com
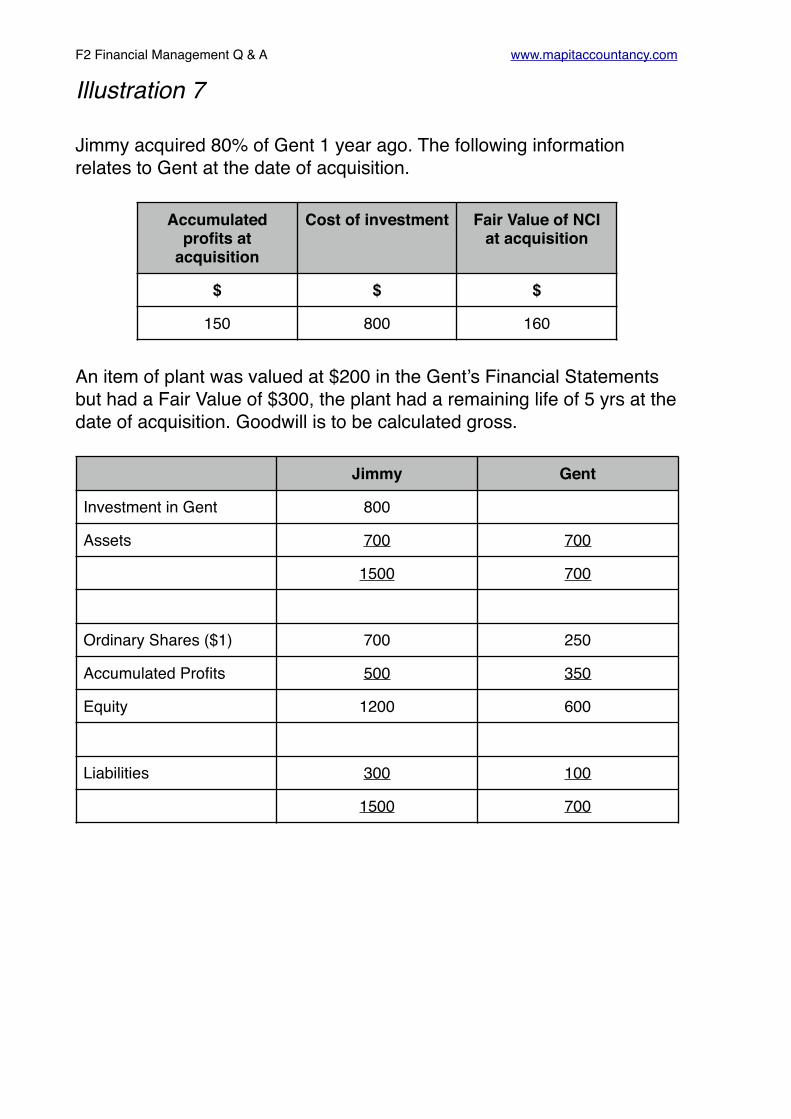
Illustration 7
Jimmy acquired 80% of Gent 1 year ago. The following information relates to Gent at the date of acquisition.
An item of plant was valued at $200 in the Gent’s Financial Statements but had a Fair Value of $300, the plant had a remaining life of 5 yrs at the date of acquisition. Goodwill is to be calculated gross.
Accumulated profits at
acquisition
Cost of investment Fair Value of NCI at acquisition
$ $ $
150 800 160
Jimmy Gent
Investment in Gent 800
Assets 700 700
1500 700
Ordinary Shares ($1) 700 250
Accumulated Profits 500 350
Equity 1200 600
Liabilities 300 100
1500 700

F2 Financial Management Q & A www.mapitaccountancy.com
SolutionWorking 1- Group Structure
Working 2 - Equity Table
Jimmy
↓80%
Gent
Date Acquired 1 Year Ago
Parent Share 80%
NCI 20%
100%
At Acquisition At Year End
Share Capital 250 250
Accumulated Profits 150 350
Fair Value Adjustment 100 100
Additional Depreciation -20
500 680
F2 Financial Management Q & A www.mapitaccountancy.com
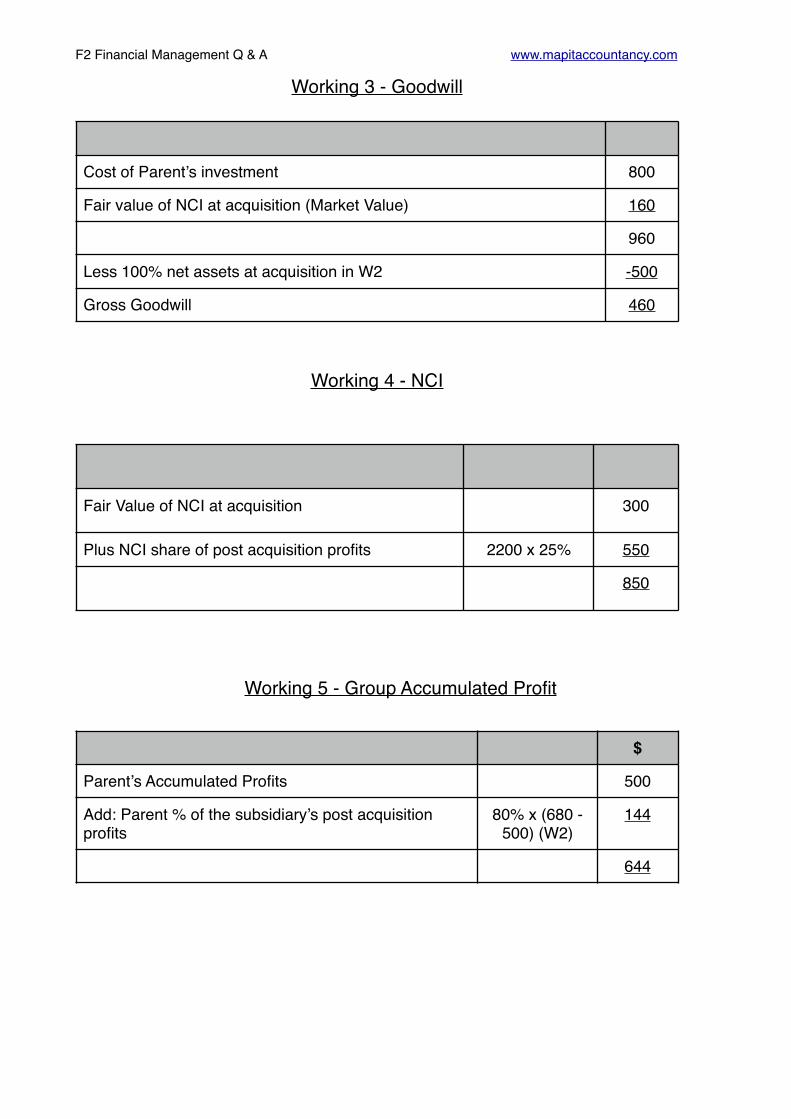
Working 3 - Goodwill
Working 4 - NCI
Working 5 - Group Accumulated Profit
Cost of Parent’s investment 800
Fair value of NCI at acquisition (Market Value) 160
960
Less 100% net assets at acquisition in W2 -500
Gross Goodwill 460
Fair Value of NCI at acquisition 300
Plus NCI share of post acquisition profits 2200 x 25% 550
850
$
Parent’s Accumulated Profits 500
Add: Parent % of the subsidiary’s post acquisition profits
80% x (680 - 500) (W2)
144
644
F2 Financial Management Q & A www.mapitaccountancy.com
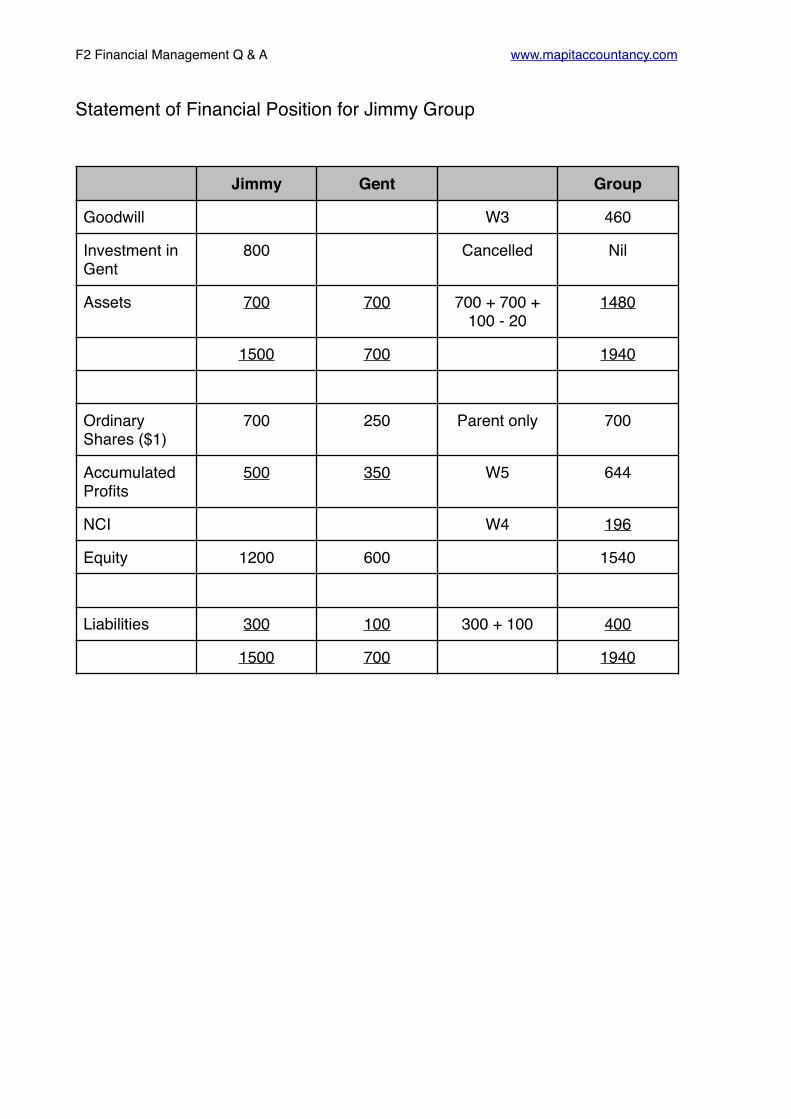
Statement of Financial Position for Jimmy Group
Jimmy Gent Group
Goodwill W3 460
Investment in Gent
800 Cancelled Nil
Assets 700 700 700 + 700 + 100 - 20
1480
1500 700 1940
Ordinary Shares ($1)
700 250 Parent only 700
Accumulated Profits
500 350 W5 644
NCI W4 196
Equity 1200 600 1540
Liabilities 300 100 300 + 100 400
1500 700 1940

F2 Financial Management Q & A www.mapitaccountancy.com
Illustration 8
Devil acquired 90% of Detail 2 years ago. The following information relates to Gent at the date of acquisition.
An item of plant was valued at $300 in the Gent’s Financial Statements but had a Fair Value of $200.
The plant subject to the fair value adjustment had a remaining life of 4 yrs at the date of acquisition. Goodwill is to be calculated Gross.
Accumulated profits at
acquisitionCost of
investmentFair Value of NCI
at acquisition
$ $ $
250 1000 55
Devil Detail
Investment in Detail 1000
Assets 600 800
1600 800
Ordinary Shares ($1) 650 100
Accumulated Profits 250 500
Equity 900 600
Liabilities 700 200
1500 700

F2 Financial Management Q & A www.mapitaccountancy.com
SolutionWorking 1- Group Structure
Working 2 - Net Assets Subsidiary
Devil
↓90%
Detail
Date Acquired 2 Years Ago
Parent Share 90%
NCI 10%
100%
At Acquisition At Year End
Share Capital 100 100
Accumulated Profits 250 500
Fair Value Adjustment -100 -100
Additional Depreciation (2yrs) 50
250 550
300

F2 Financial Management Q & A www.mapitaccountancy.com
Working 3 - Goodwill
Working 4 - NCI
Working 5 - Group Accumulated Profit
Cost of Parent’s investment 1000
Fair value of NCI at acquisition (Market Value) 55
1055
Less 100% net assets at acquisition in W2 -250
Gross Goodwill 805
Fair Value of NCI at acquisition 55
Plus NCI share of post acquisition profits 10% x 300 (W2) 30
85
$
Parent’s Accumulated Profits 250
Add: Parent % of the subsidiary’s post acquisition profits
90% x 300 (W2)
270
520

F2 Financial Management Q & A www.mapitaccountancy.com
Statement of Financial Position for Devil Group
Devil Detail
Goodwill 1000 W3 805
Assets 600 800 600 + 800 - 100 + 50
1350
1600 800 2155
Ordinary Shares ($1)
650 100 Parent 650
Accumulated Profits
250 500 W5 520
NCI W4 85
Equity 900 600
Liabilities 700 200 700 + 200 900
1500 700 2155

F2 Financial Management Q & A www.mapitaccountancy.com
Illustration 9
Evaro Co. Acquired 80% of Stando Co. one year ago and the following detail is relevant:
At the date of acquisition the following was relevant:
i) An item of plant was valued at $100m in the Gent’s Financial Statements but had a Fair Value of $50m, the plant had a remaining life of 10 yrs at the date of acquisition.
ii)Stando Co. owns an internally generated brand worth $20m on the date of acquisition that has a useful economic life of 20 years.
iii)At the date of acquisition a court case against Stando Co. is in process which has resulted in a contingent liability of $25m being disclosed in their financial statements. By the year end Stando Co. had won the court case resulting with no payment as a result.
Required
Compete the Equity Table (W2) based on the above information for Stando. Co.
At Acquisition$m
At Year End$m
Share Capital 100 100
Accumulated Profits 250 500

F2 Financial Management Q & A www.mapitaccountancy.com
Solution
At Acquisition$m
At Year End$m
Share Capital 100 100
Accumulated Profits 250 500
Fair Value of Plant -50 -50
Remove Depreciation (50/10) 5
Brand 20 20
Amortization on Brand -1
Contingent Liability -25 0
295 574
F2 Financial Management Q & A www.mapitaccountancy.com
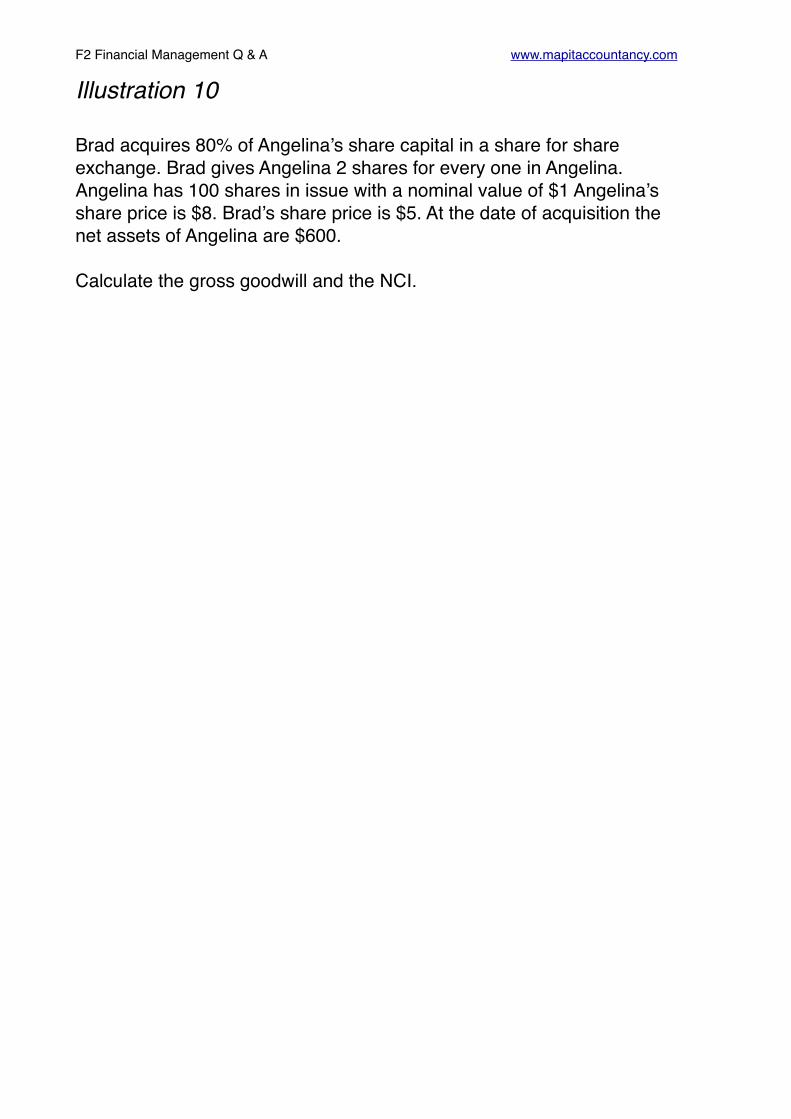
Illustration 10
Brad acquires 80% of Angelina’s share capital in a share for share exchange. Brad gives Angelina 2 shares for every one in Angelina. Angelina has 100 shares in issue with a nominal value of $1 Angelina’s share price is $8. Brad’s share price is $5. At the date of acquisition the net assets of Angelina are $600.
Calculate the gross goodwill and the NCI.

F2 Financial Management Q & A www.mapitaccountancy.com
Solution
Consideration
Brad is purchasing 80% of 100 shares = 80 shares
He is issuing 2 shares for each of the 80 he is purchasing (80 x 2) = 160
Each of the 160 shares is worth $5 so consideration is (160 x 5) = $800
Goodwill
Cost of Parent’s investment 800
Fair value of NCI at acquisition (Market Value) 160
960
Less 100% net assets at acquisition in W2 -600
Gross Goodwill 360

F2 Financial Management Q & A www.mapitaccountancy.com
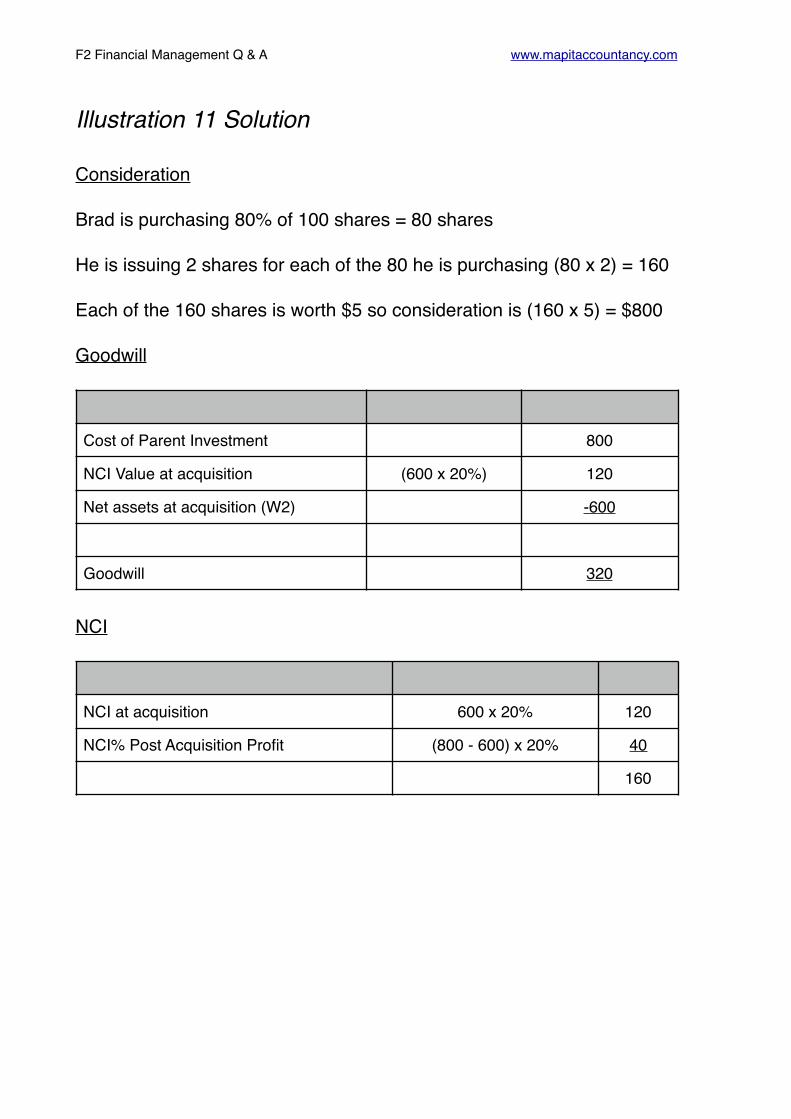
Illustration 11
Brad acquires 80% of Angelina’s share capital in a share for share exchange. Brad gives Angelina 2 shares for every one in Angelina. Angelina has 100 shares in issue with a nominal value of $1. Brad’s share price is $5. At the date of acquisition the net assets of Angelina are $600.
Calculate the goodwill arising using the proportionate method and the NCI.
F2 Financial Management Q & A www.mapitaccountancy.com
Illustration 11 Solution
Consideration
Brad is purchasing 80% of 100 shares = 80 shares
He is issuing 2 shares for each of the 80 he is purchasing (80 x 2) = 160
Each of the 160 shares is worth $5 so consideration is (160 x 5) = $800
Goodwill
NCI
Cost of Parent Investment 800
NCI Value at acquisition (600 x 20%) 120
Net assets at acquisition (W2) -600
Goodwill 320
NCI at acquisition 600 x 20% 120
NCI% Post Acquisition Profit (800 - 600) x 20% 40
160

F2 Financial Management Q & A www.mapitaccountancy.com
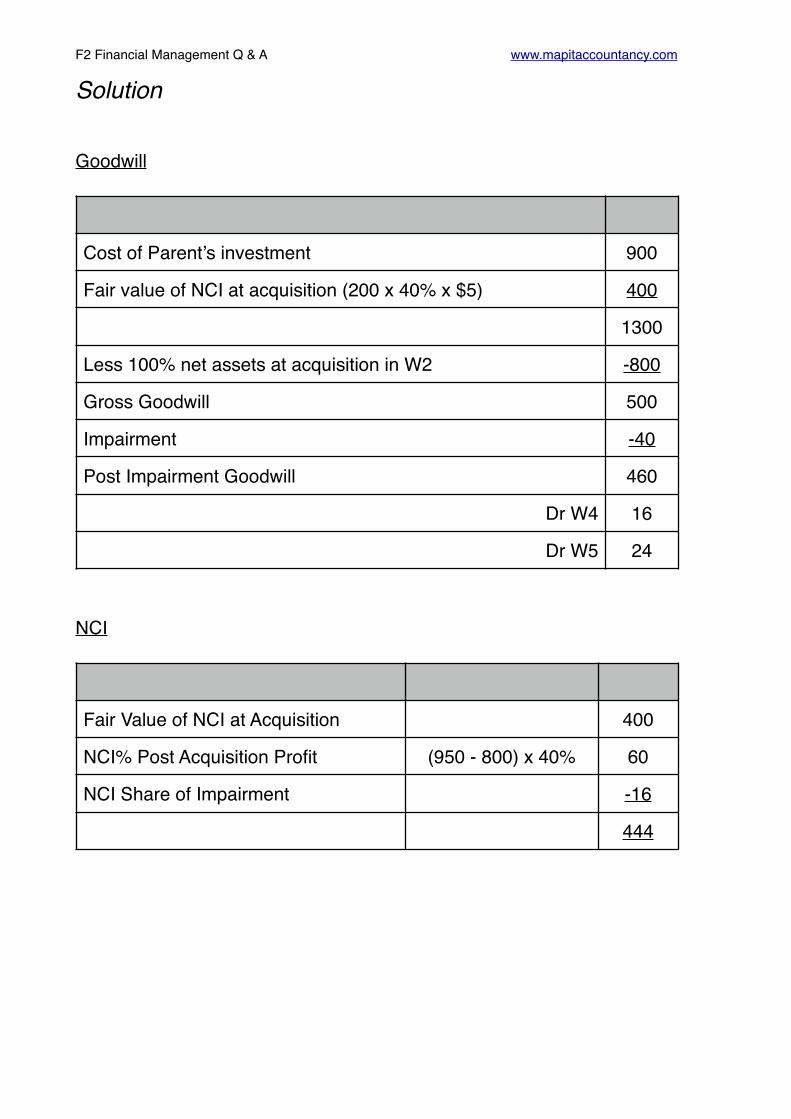
Illustration 12
(i)Archie acquires 60% of Mitchell’s share capital with consideration of $900. Mitchell has 200 shares in issue with a share price is $5. At the date of acquisition the net assets of Mitchell were $800 and are $950 at the year end. At the year end the retained earnings of Archie were $1,000.
An impairment review has been carried out on the goodwill at the year end which has found it to be impaired by $40.
Calculate the gross goodwill, the retained earnings and the NCI at the year end.
F2 Financial Management Q & A www.mapitaccountancy.com
Solution
Goodwill
NCI
Cost of Parent’s investment 900
Fair value of NCI at acquisition (200 x 40% x $5) 400
1300
Less 100% net assets at acquisition in W2 -800
Gross Goodwill 500
Impairment -40
Post Impairment Goodwill 460
Dr W4 16
Dr W5 24
Fair Value of NCI at Acquisition 400
NCI% Post Acquisition Profit (950 - 800) x 40% 60
NCI Share of Impairment -16
444

F2 Financial Management Q & A www.mapitaccountancy.com
Retained Earnings
Parent 1000
NCI% Post Acquisition Profit (950 - 800) x 60% 90
Parent Share of Impairment -24
1066

F2 Financial Management Q & A www.mapitaccountancy.com
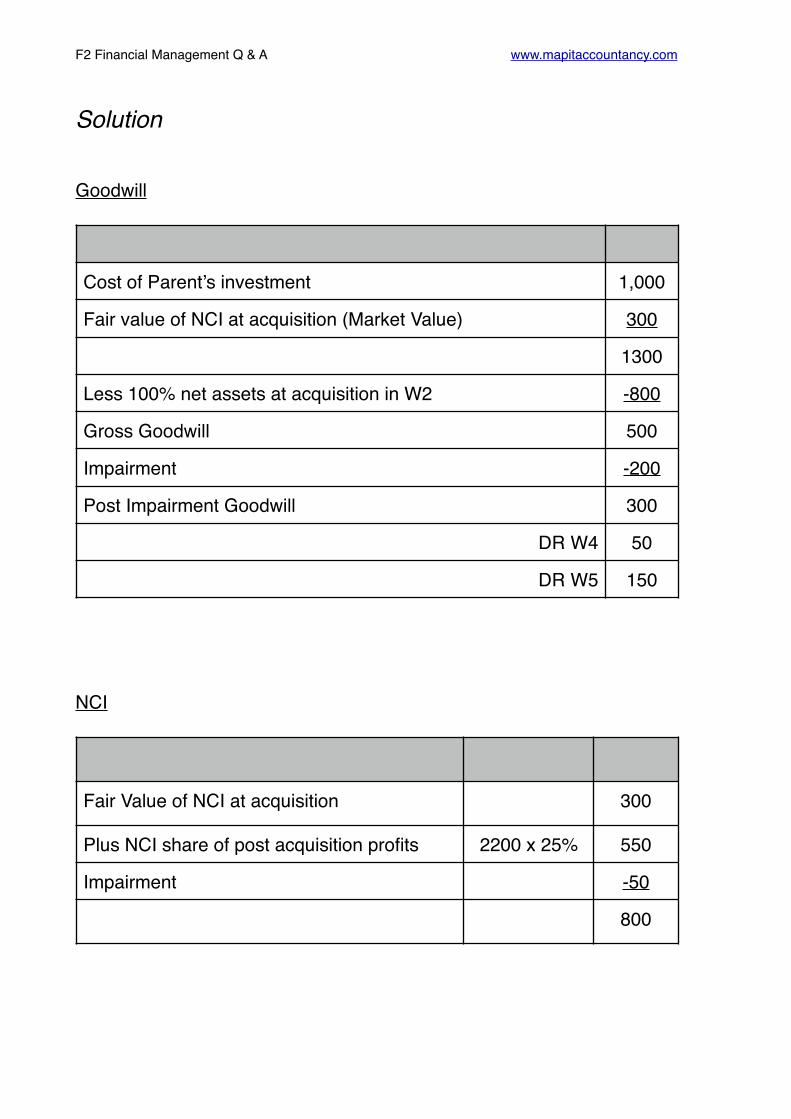
Illustration 12 (ii)
French acquired 75% of Shambles several years ago.
If French has $1500 of retained earnings at the year end, calculate the gross goodwill, retained earnings for the group and the NCI at the year end.
Cost of Investment
Fair Value of NCI at
acquisition
Net assets at acquisition
Net assets at year end
Goodwill Impairment at
Y/E
$ $ $ $ $
1,000 300 800 3,000 200
F2 Financial Management Q & A www.mapitaccountancy.com
Solution
Goodwill
NCI
Cost of Parent’s investment 1,000
Fair value of NCI at acquisition (Market Value) 300
1300
Less 100% net assets at acquisition in W2 -800
Gross Goodwill 500
Impairment -200
Post Impairment Goodwill 300
DR W4 50
DR W5 150
Fair Value of NCI at acquisition 300
Plus NCI share of post acquisition profits 2200 x 25% 550
Impairment -50
800

F2 Financial Management Q & A www.mapitaccountancy.com
Retained Earnings
Parent 1500
NCI% Post Acquisition Profit 2200 x 75% 1650
Parent Share of Impairment -150
3000

F2 Financial Management Q & A www.mapitaccountancy.com
Illustration 12 (iii)
Pinky acquired 80% of Brain 4 years ago. The following information is relevant:
Goodwill is calculated gross and is subject to an annual impairment review. In the current year goodwill has been impaired by $20.
Net Assets at year end
Net Assets at acquisition
Cost of investment
Fair Value of NCI at
acquisition
$ $ $ $
150 100 175 25
Pinky Brain
Investment in Pinky 175
Assets 100 100
Inventory 140 200
Receivables 160 100
Bank 125 200
700 600
Ordinary Shares ($1) 160 50
Accumulated Profits 240 100
Equity 400 150
Non current liabilities 100 250
Liabilities 300 100
700 600

F2 Financial Management Q & A www.mapitaccountancy.com
Solution
Working 1- Group Structure
Working 2 - Net Assets Subsidiary
Pinky
↓80%
Brain
Date Acquired 4 Years Ago
Parent Share 80%
NCI 20%
100%
At Acquisition At Year End
Share Capital 50 50
Accumulated Profits 50 100
100 150
F2 Financial Management Q & A www.mapitaccountancy.com
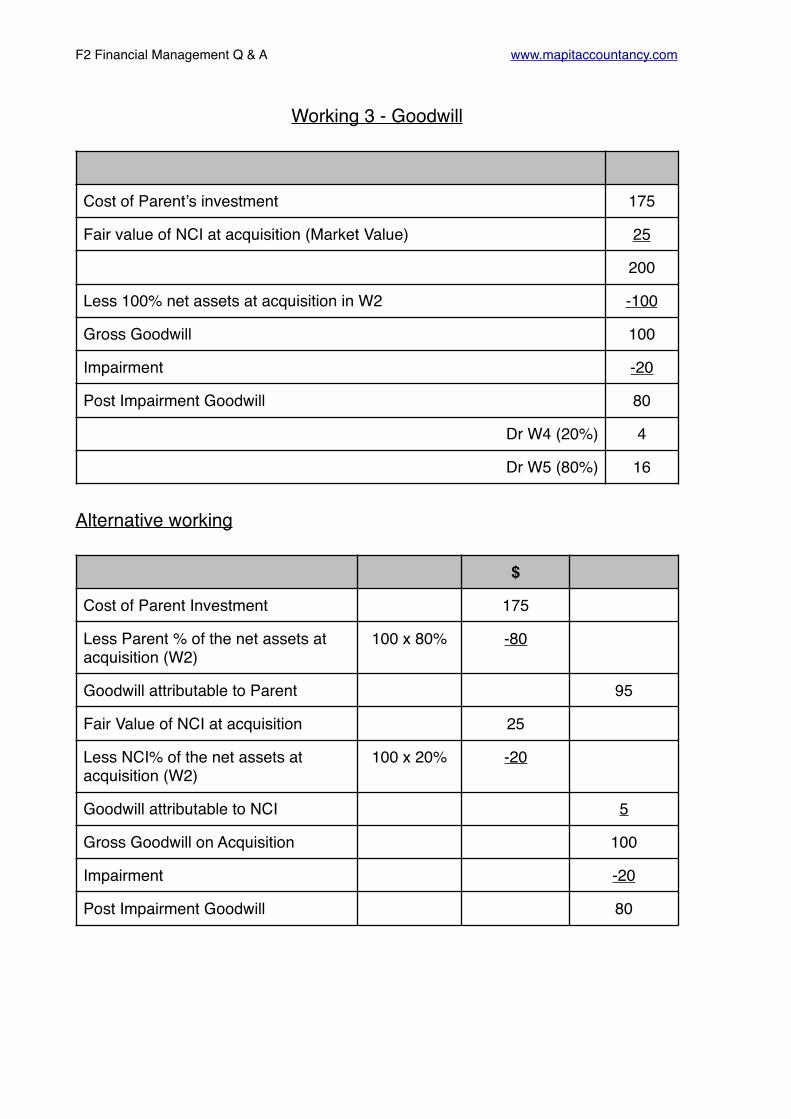
Working 3 - Goodwill
Alternative working
Cost of Parent’s investment 175
Fair value of NCI at acquisition (Market Value) 25
200
Less 100% net assets at acquisition in W2 -100
Gross Goodwill 100
Impairment -20
Post Impairment Goodwill 80
Dr W4 (20%) 4
Dr W5 (80%) 16
$
Cost of Parent Investment 175
Less Parent % of the net assets at acquisition (W2)
100 x 80% -80
Goodwill attributable to Parent 95
Fair Value of NCI at acquisition 25
Less NCI% of the net assets at acquisition (W2)
100 x 20% -20
Goodwill attributable to NCI 5
Gross Goodwill on Acquisition 100
Impairment -20
Post Impairment Goodwill 80
F2 Financial Management Q & A www.mapitaccountancy.com
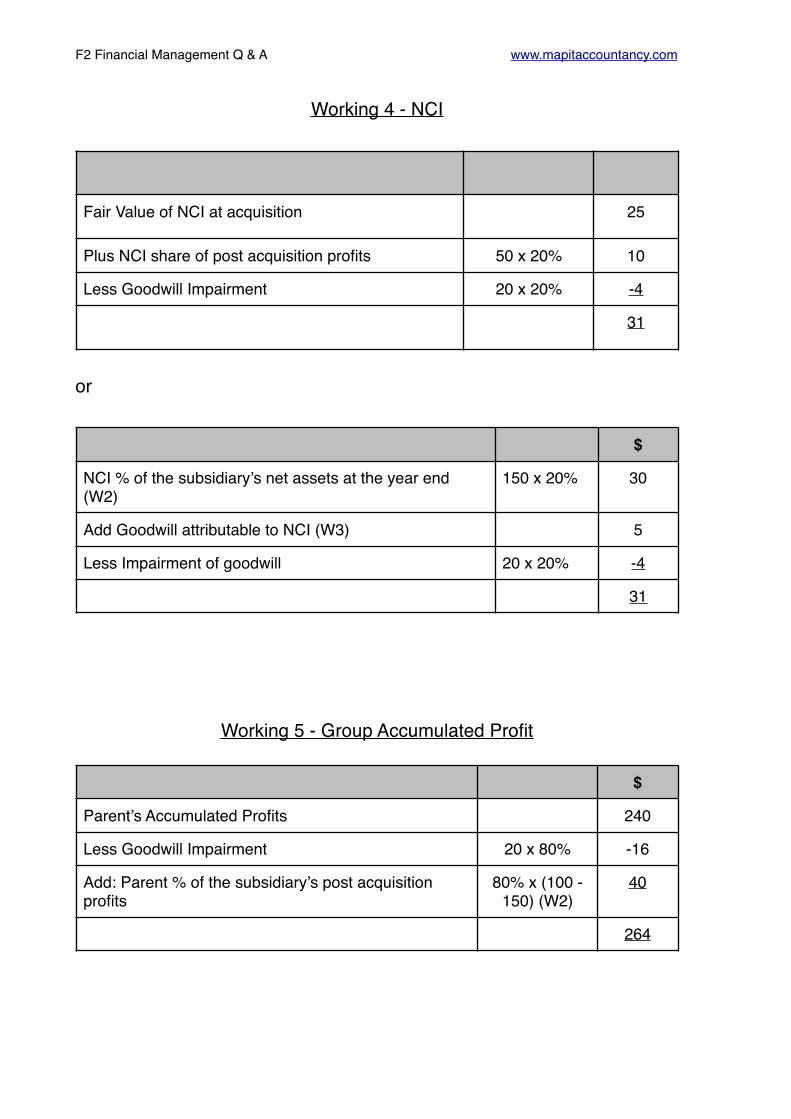
Working 4 - NCI
or
Working 5 - Group Accumulated Profit
Fair Value of NCI at acquisition 25
Plus NCI share of post acquisition profits 50 x 20% 10
Less Goodwill Impairment 20 x 20% -4
31
$
NCI % of the subsidiary’s net assets at the year end (W2)
150 x 20% 30
Add Goodwill attributable to NCI (W3) 5
Less Impairment of goodwill 20 x 20% -4
31
$
Parent’s Accumulated Profits 240
Less Goodwill Impairment 20 x 80% -16
Add: Parent % of the subsidiary’s post acquisition profits
80% x (100 - 150) (W2)
40
264
F2 Financial Management Q & A www.mapitaccountancy.com
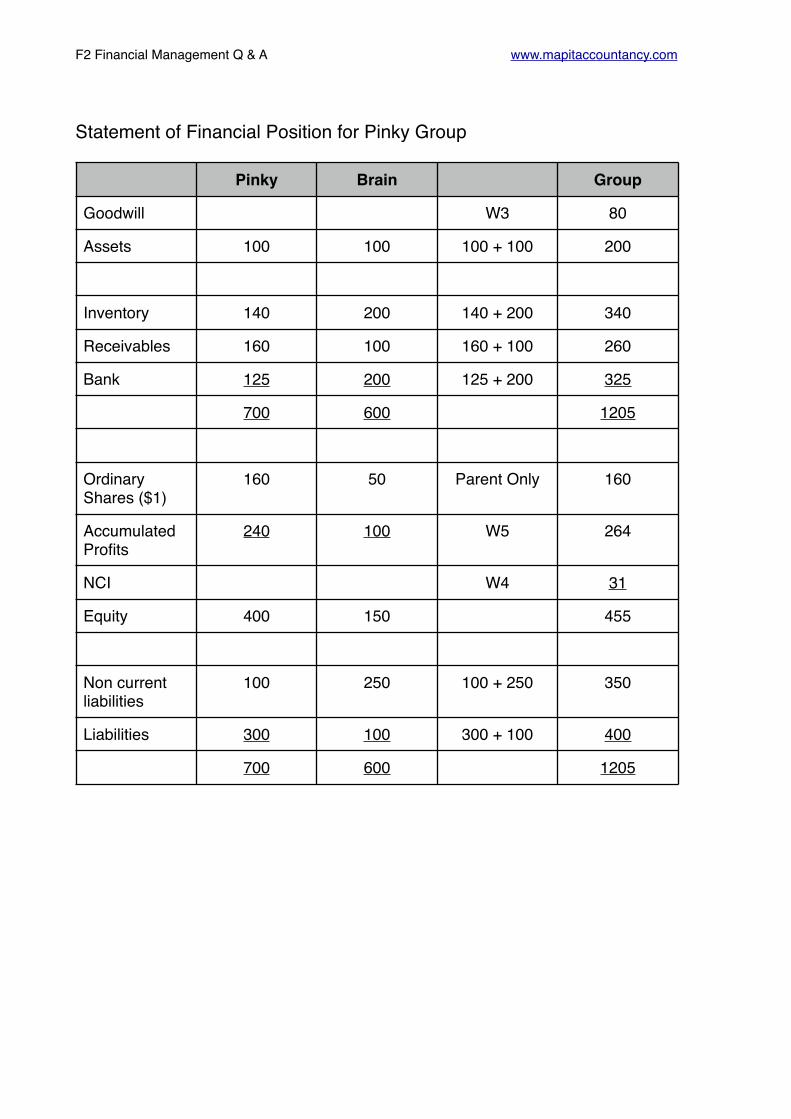
Statement of Financial Position for Pinky Group
Pinky Brain Group
Goodwill W3 80
Assets 100 100 100 + 100 200
Inventory 140 200 140 + 200 340
Receivables 160 100 160 + 100 260
Bank 125 200 125 + 200 325
700 600 1205
Ordinary Shares ($1)
160 50 Parent Only 160
Accumulated Profits
240 100 W5 264
NCI W4 31
Equity 400 150 455
Non current liabilities
100 250 100 + 250 350
Liabilities 300 100 300 + 100 400
700 600 1205

F2 Financial Management Q & A www.mapitaccountancy.com
Illustration 13
George owns 80% of the subsidiary Bungle. Goodwill has been calculated on a proportionate basis and at acquisition was $400m.
During the impairment review in the current year it was found that the carrying value of the goodwill has been impaired by $50m
What is the required treatment to deal with the impairment of goodwill?

F2 Financial Management Q & A www.mapitaccountancy.com
Solution
Goodwill on Balance Sheet
Proportionate goodwill 400
Impairment -50
Goodwill after impairment 350
Treatment
DR Retained Earnings (W5) 50
CR Goodwill 50

F2 Financial Management Q & A www.mapitaccountancy.com
Illustration 14A Parent company has recorded an asset of $300 goods receivable with a subsidiary.
The subsidiary had recorded this as an initial liability payable of $300 but has just recorded and sent a cheque payment to the parent of $50 leaving the payable balance of $250.
How should this be adjusted for on consolidation?

F2 Financial Management Q & A www.mapitaccountancy.com
SolutionWhen cross casting assets & liabilities:
Less Payables $250 (DR)
Plus Cash at bank $50 (DR)
Less Receivables $300 (CR)

F2 Financial Management Q & A www.mapitaccountancy.com
Illustration 15Parent has been selling goods to subsidiary. The parent has recorded an asset of $500 receivable from the subsidiary.
The $500 includes goods worth $100 sent prior to the year end to the subsidiary who has not received them. As a result the subsidiary has a balance of $400 recorded as a liability in payables.
How should this be treated on consolidation?

F2 Financial Management Q & A www.mapitaccountancy.com
SolutionWhen cross casting assets & liabilities:
Less Payables $400 (DR)
Plus Inventory $100 (DR)
Less Receivables $500 (CR)

F2 Financial Management Q & A www.mapitaccountancy.com
Illustration 16Arctic is the parent of a subsidiary Monkeys. Extracts of their SFPs are below
The trade payables of Monkeys includes $35m due to Arctic. This was after the deduction of $10m in respect of cash sent by Monkeys but not yet received by Arctic.
The receivables of Arctic at the year end include $70m due from Monkeys. $25m of these goods had been dispatched by Arctic, but were not yet received by Monkeys.
Show the treatment on consolidation.
Arctic Monkeys
Current Assets
Inventory 300 100
Receivables 200 250
Bank 100 50
600 400
Current Liabilities 420 220

F2 Financial Management Q & A www.mapitaccountancy.com
SolutionRemember!
Add the goods/cash in transit
Subtract the inter company current accounts
+/- Item Where? $m
+ Cash in transit Cash at Bank 10
+ Goods in transit Inventory 25
- Inter Company Current Account Payables 35
- inter Company Current Account Receivables 70
Arctic Monkeys Group
Current Assets
Inventory 300 100 300 + 100 + Goods in transit of 25
425
Receivables 200 250 200 + 250 - 70 inter company current account
380
Bank 100 50 100 + 50 + cash in transit 10
160
600 400 965
Current Liabilities
420 220 420 + 220 - inter company current account
35
605

F2 Financial Management Q & A www.mapitaccountancy.com
Illustration 17Sea is the parent of a subsidiary Lion. Extracts of their SFPs are below
The trade payables of Lion includes $20m due to Arctic. This was after the deduction of $15m in respect of cash sent by Lion but not yet received by Sea.
The receivables of Sea at the year end include $50m due from Lion. $15m of these goods had been dispatched by Sea, but were not yet received by Lion.
Show the treatment on consolidation.
Sea Lion
Current Assets
Inventory 400 250
Receivables 100 100
Bank 150 100
650 450
Current Liabilities 90 140

F2 Financial Management Q & A www.mapitaccountancy.com
SolutionRemember!
Add the goods/cash in transit
Subtract the inter company current accounts
+/- Item Where? $m
+ Cash in transit Cash at Bank 15
+ Goods in transit Inventory 15
- Inter Company Current Account Payables 20
- inter Company Current Account Receivables 50
Sea Lion Group
Current Assets
Inventory 400 250 400 + 250 + Goods in transit of 15
665
Receivables 100 100 100 + 100 - 50 inter company current account
150
Bank 150 100 150 + 100 + cash in transit 15
265
650 450 965
Current Liabilities
90 140 90 + 140 - inter company current account 20
210

F2 Financial Management Q & A www.mapitaccountancy.com
Illustration 18Inter company sales of $400 have occurred in Attila group at a mark up on cost of 25%. At the year end 1/4 of these goods had been sold on. Attila has an 80% interest in Hun.
I. Calculate the PURP.
II. Show the accounting treatment if the parent company is the seller.
III. Show the accounting treatment if the subsidiary company is the seller.
IV. Do parts I - III if the goods had been sold at a margin of 30%.

F2 Financial Management Q & A www.mapitaccountancy.com
Solution (Mark-up)
Parent is seller
Subsidiary is seller
Unsold Inventory Mark-up PURP
(400 x 3/4) = 300 25/125 60
DR/CR Account $ $
DR Accumulated Profits (W5) to decrease 60
CR Inventory to decrease 60
DR/CR Account $ $
DR Accumulated Profits (W5) with parent share to decrease (60 x 80%)
48
DR NCI (W4) with subsidiary share to decrease 12
CR Inventory to decrease 60
F2 Financial Management Q & A www.mapitaccountancy.com
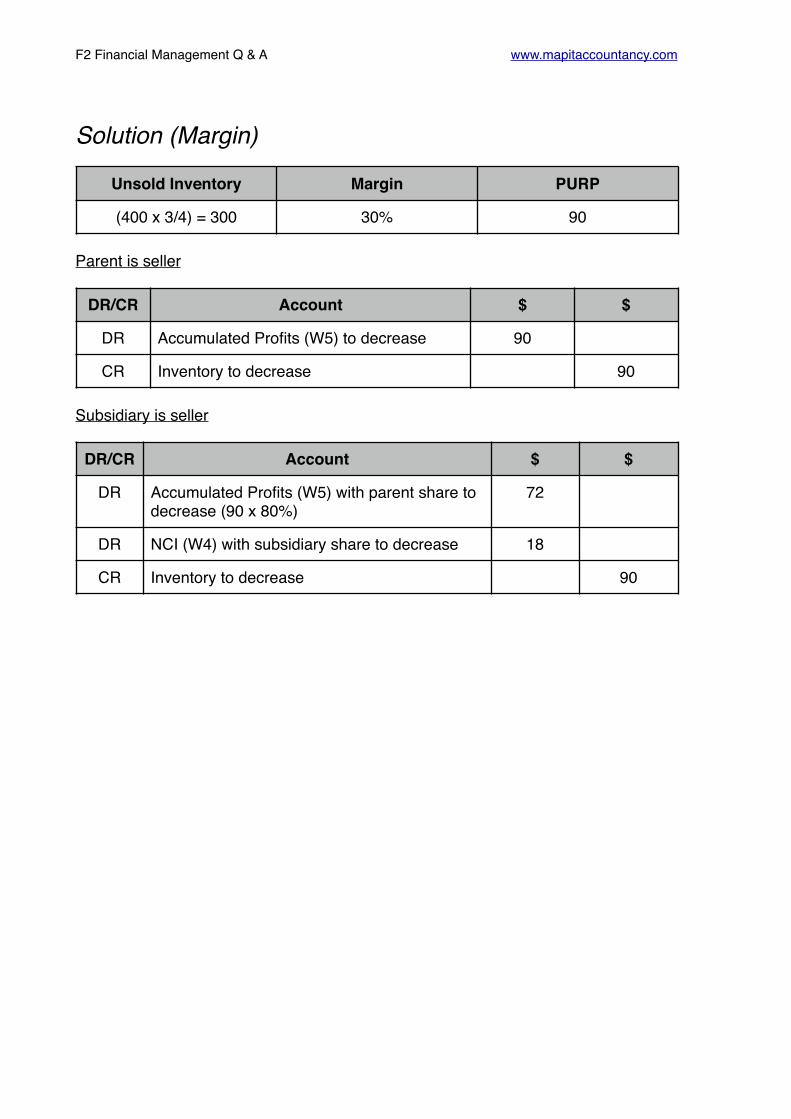
Solution (Margin)
Parent is seller
Subsidiary is seller
Unsold Inventory Margin PURP
(400 x 3/4) = 300 30% 90
DR/CR Account $ $
DR Accumulated Profits (W5) to decrease 90
CR Inventory to decrease 90
DR/CR Account $ $
DR Accumulated Profits (W5) with parent share to decrease (90 x 80%)
72
DR NCI (W4) with subsidiary share to decrease 18
CR Inventory to decrease 90

F2 Financial Management Q & A www.mapitaccountancy.com
Illustration 19Argentina owns an 80% share of Messi which it purchased one year ago.
The information below relates to Messi at the date of acquisition.
The income statements for both are:
Other information
I. Argentina sold goods to Messi during the year at a margin of 40% and worth $100m. Half of these goods have been sold on by Messi by the year end.
II. The fair value of Messi’s net assets were equal to their book value at the date of acquisition, with the exception of some machinery which had a useful life of 5 years.
III. Calculate goodwill using the fair value of the NCI at the date of acquisition. At the year end an impairment review has found that the goodwill has been impaired by 10%.
Produce a consolidated Income Statement for the Argentina group.
Ordinary Share Capital
Reserves Fair Value of the net assets
Fair value of the NCI
Cost of the investment
$m $m $m $m $m
200 400 800 200 1900
Argentina Messi
Revenue 8000 3000
Cost of Sales -4000 -1000
Gross Profit 4000 2000
Operating Costs -1500 -1500
Finance Costs -1000 -200
Profit Before Tax 1500 300
Tax -700 -100
Profit for the year 800 200

F2 Financial Management Q & A www.mapitaccountancy.com
Illustration 19 SolutionWorking 1- Group Structure
Working 2 - Inter Company
PURP
As the Parent is seller
Remember to remove the total amount of the sales also from sales and cost of sales
Argentina
↓80%
Messi
Date Acquired 1 Year Ago (No time apportionment)
Parent Share 80%
NCI 20%
100%
Unsold Inventory Margin PURP
(100 x 1/2) = 50 40% 20
DR/CR Account $ $
DR Cost of sales to increase 20
CR Inventory to decrease 20
DR/CR Account $ $
DR Revenue to decrease 100
CR Cost of sales to decrease 100

F2 Financial Management Q & A www.mapitaccountancy.com
Working 3 - Goodwill
We don’t need the net assets at the year end, but we do need them at acquisition to calculate goodwill. Be careful - we are given the total and told that the difference is machinery - this will lead to an additional depreciation expense.
The $200m asset has a useful life of 5 years so the extra depreciation will be $200m x 1/5 = $40m. The treatment for this is:
We can then use this to calculate the goodwill on acquisition
At Acquisition At Year End
Share Capital 200 N/A
Accumulated Profits 400 N/A
Fair Value Adjustment (Balancing figure)
200 N/A
800 N/A
DR/CR Account $ $
DR Cost of sales to increase 40
CR Non current assets to decrease 40
Cost of Parent’s investment 1900
Fair value of NCI at acquisition (Market Value) 200
2100
Less 100% net assets at acquisition in W2 -800
Gross Goodwill 1300
Goodwill impairment
Gross Goodwill 1300
Impairment Loss (1300 x 10%) 130

F2 Financial Management Q & A www.mapitaccountancy.com
The treatment for this is:
Working 4 - Cost of Sales
Working 5 - NCI
DR/CR Account $ $
DR Cost of sales to increase 130
CR Goodwill Intangible Asset to decrease 130
$m
Parent 4000
Subsidiary 1000
Less Inter Company Sales -100
Plus the PURP 20
Plus additional depreciation 40
Plus impairment loss 130
5090
$
NCI % of the subsidiary’s profits in question 200 x 20% 40
Less NCI share of additional depreciation 40 x 20% -8
Less NCI share of Impairment of goodwill 130 x 20% -26
6

F2 Financial Management Q & A www.mapitaccountancy.com
Income statement for Argentina Group
Argentina
Messi Group
Revenue 8000 3000 8000 + 3000 - 100 inter company sales
10900
Cost of Sales -4000 -1000 W4 -5090
Gross Profit 4000 2000 5810
Operating Costs -1500 -1500 1500 + 1500 -3000
Finance Costs -1000 -200 1000 + 200 -1200
Profit Before Tax 1500 300 1610
Tax -700 -100 700 + 100 -800
Profit for the year 800 200 810
Attributable to Parent (Balancing Figure) 804
Attributable to NCI (W5) 6
810

F2 Financial Management Q & A www.mapitaccountancy.com
Statement of Changes in Equity Pro-forma
Share Capital
Share Premium
Revaluation Reserve
Accumulated Profits
NCI Total
O’Balance X X X X X X
Share Issues X X X
Revaluation Gains
X X X
Profit for period
X X X
Less Dividends
(X) (X) (X)
Cl’Balance X X X X X X

F2 Financial Management Q & A www.mapitaccountancy.com
Illustration 20Nadal is a 90% subsidiary of Federer. It was acquired one year ago for $4000m. At that time the accumulated profits were $800m.
Income Statements
Statements of Financial Position
Federer Nadal
Revenue 20000 4000
Cost of Sales -12000 -2000
Gross Profit 8000 2000
Distribution Costs -2100 -300
Admin Expenses -1400 -500
Operating Profit 1500 1200
Exceptional Gain Nil 580
Investment Income 90 Nil
Finance Costs -600 -150
Profit Before Tax 3990 1630
Tax -700 -130
Profit for the year 3290 1500
Federer Nadal
Investment in Nadal 4000
Assets 20000 5000
24000 5000
Share Capital 5000 1000
Accumulated Profits 15690 2200
Equity 20690 3200
Liabilities 3310 1800
24000 5000

F2 Financial Management Q & A www.mapitaccountancy.com
Federer Statement of changes in Equity
Nadal Statement of changes in Equity
Other Information:
In the year Federer sold goods to Nadal at a margin of 20%. The total amount sold was $100m, of which a quarter remain in inventory at the year end.
Also during the year Nadal sold $180m of goods to Federer. These goods were sold at a mark up of 50%. Half of the goods remain in inventory at the year end.
At the date of acquisition the fair values of Nadal’s net assets were equal to their book value with the exception of an item of plant that had a fair value of $200m in excess of its carrying value and a remaining useful life of 4 years. Goodwill is to be calculated on a proportionate basis.
Federer paid a dividend during the year of $200m while Nadal paid a dividend of $100m. Federer has recognised the dividend received from Nadal as investment income.
Required
Prepare the consolidated Income Statement, consolidated Statement of Changes in Equity and the consolidated Statement of Financial Position for the Federer group.
Share Capital Accumulated Profits
Total Equity
Opening Balance 5000 12600 17600
Profits for the year 3290 3290
Less Dividends -200 -200
Closing Balance 5000 15690 20690
Share Capital Accumulated Profits
Total Equity
Opening Balance 1000 800 1800
Profits for the year 1500 1500
Less Dividends -100 -100
Closing Balance 1000 2200 3200

F2 Financial Management Q & A www.mapitaccountancy.com
SolutionWorking 1- Group Structure & PURP
PURP
Parent is seller
Subsidiary is seller
Federer
↓90%
Nadal
Date Acquired 1 Year Ago
Parent Share 90%
NCI 10%
100%
Unsold Inventory Margin PURP
(100 x 1/4) = 25 20% 5
DR/CR Account $ $
DR Accumulated Profits (W5) to decrease 5
CR Inventory to decrease 5
Unsold Inventory Margin PURP
(180 x 1/2) = 90 50/150 30
DR/CR Account $ $
DR Accumulated Profits (W5) with parent share to decrease (30 x 90%)
27
DR NCI (W4) with subsidiary share to decrease 3
CR Inventory to decrease 30
F2 Financial Management Q & A www.mapitaccountancy.com
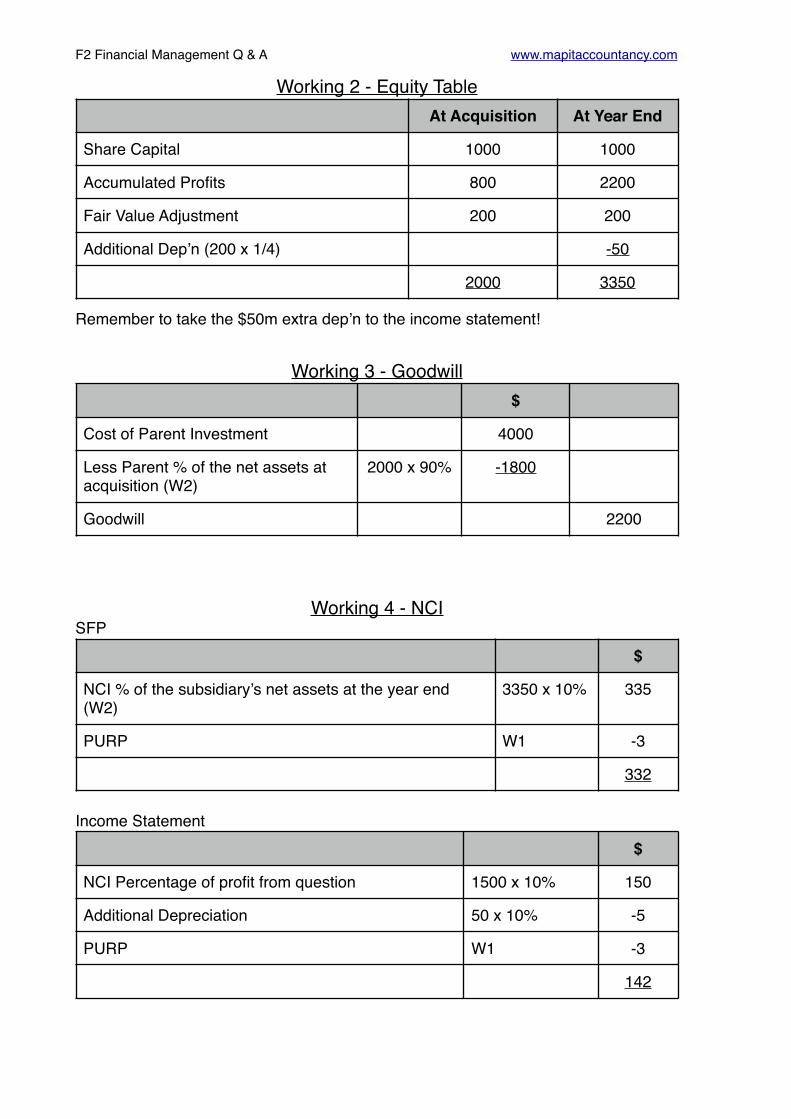
Working 2 - Equity Table
Remember to take the $50m extra dep’n to the income statement!
Working 3 - Goodwill
Working 4 - NCISFP
Income Statement
At Acquisition At Year End
Share Capital 1000 1000
Accumulated Profits 800 2200
Fair Value Adjustment 200 200
Additional Dep’n (200 x 1/4) -50
2000 3350
$
Cost of Parent Investment 4000
Less Parent % of the net assets at acquisition (W2)
2000 x 90% -1800
Goodwill 2200
$
NCI % of the subsidiary’s net assets at the year end (W2)
3350 x 10% 335
PURP W1 -3
332
$
NCI Percentage of profit from question 1500 x 10% 150
Additional Depreciation 50 x 10% -5
PURP W1 -3
142

F2 Financial Management Q & A www.mapitaccountancy.com
Working 5 - Group Accumulated Profit
Income Statement
$
Parent’s Accumulated Profits 15690
PURP 5 + 27 -32
Add: Parent % of the subsidiary’s post acquisition profits
90% x (2000 - 3350) (W2)
1215
16873
Federer Nadal Group
Revenue 20000 4000 20000 + 4000 - 100 - 180
23720
Cost of Sales -12000 -2000 12000 + 2000 - 100 - 180 - 35 -
50
-13805
Gross Profit 8000 2000 9915
Distribution Costs -2100 -300 2100 + 300 -2400
Admin Expenses -1400 -500 1400 + 500 -1900
Operating Profit 1500 1200 5615
Exceptional Gain Nil 580 580
Investment Income 90 Nil Nil
Finance Costs -600 -150 600 + 150 -750
Profit Before Tax 3990 1630 5445
Tax -700 -130 700 + 130 -830
Profit for the year 3290 1500 4615
Attributable to Parent (Balancing Figure)
4473
Attributable to NCI W4 142
4615
F2 Financial Management Q & A www.mapitaccountancy.com
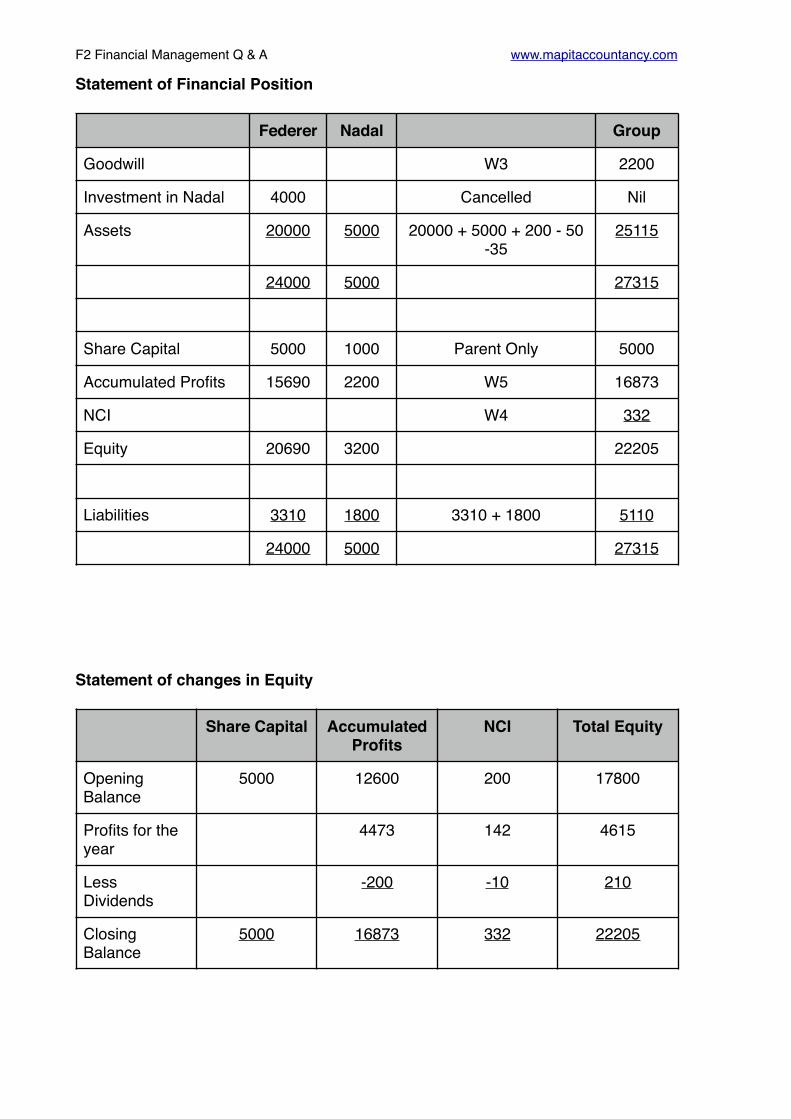
Statement of Financial Position
Statement of changes in Equity
Federer Nadal Group
Goodwill W3 2200
Investment in Nadal 4000 Cancelled Nil
Assets 20000 5000 20000 + 5000 + 200 - 50 -35
25115
24000 5000 27315
Share Capital 5000 1000 Parent Only 5000
Accumulated Profits 15690 2200 W5 16873
NCI W4 332
Equity 20690 3200 22205
Liabilities 3310 1800 3310 + 1800 5110
24000 5000 27315
Share Capital Accumulated Profits
NCI Total Equity
Opening Balance
5000 12600 200 17800
Profits for the year
4473 142 4615
Less Dividends
-200 -10 210
Closing Balance
5000 16873 332 22205
F2 Financial Management Q & A www.mapitaccountancy.com
Associates(IAS 28)
F2 Financial Management Q & A www.mapitaccountancy.com
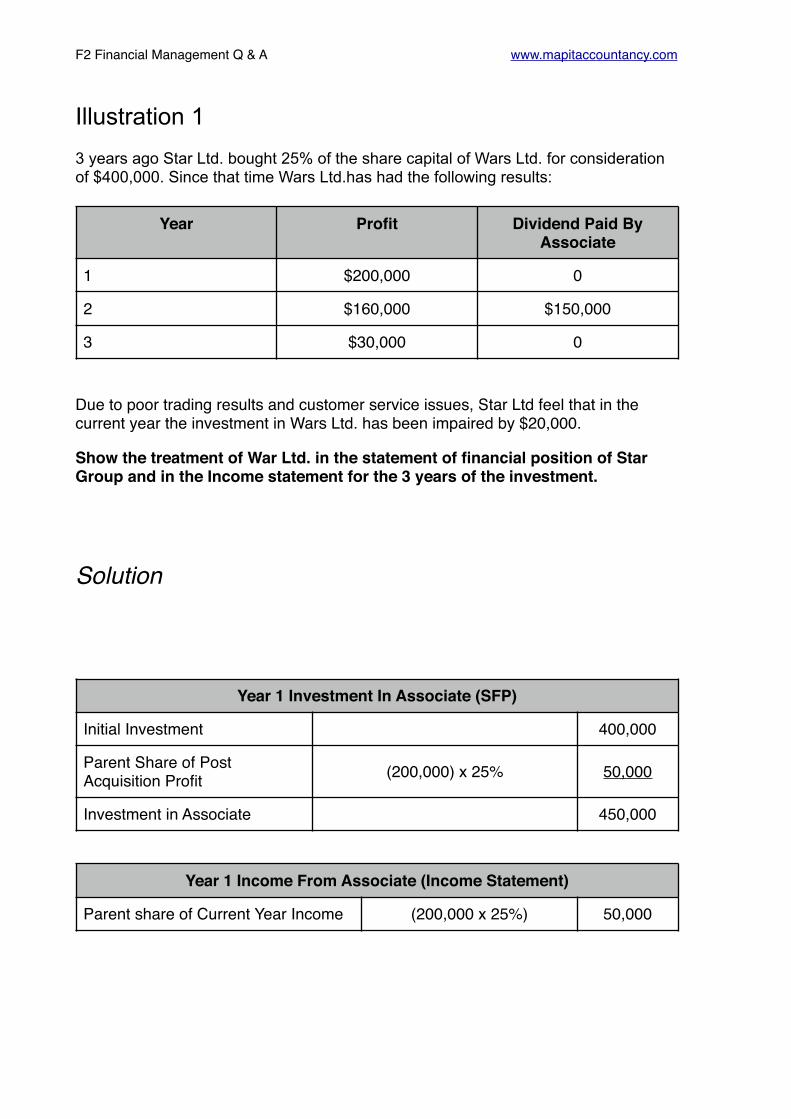
Illustration 1 3 years ago Star Ltd. bought 25% of the share capital of Wars Ltd. for consideration of $400,000. Since that time Wars Ltd.has had the following results:
Due to poor trading results and customer service issues, Star Ltd feel that in the current year the investment in Wars Ltd. has been impaired by $20,000.
Show the treatment of War Ltd. in the statement of financial position of Star Group and in the Income statement for the 3 years of the investment.
Solution
Year Profit Dividend Paid By Associate
1 $200,000 0
2 $160,000 $150,000
3 $30,000 0
Year 1 Investment In Associate (SFP)
Initial Investment 400,000
Parent Share of Post Acquisition Profit (200,000) x 25% 50,000
Investment in Associate 450,000
Year 1 Income From Associate (Income Statement)
Parent share of Current Year Income (200,000 x 25%) 50,000

F2 Financial Management Q & A www.mapitaccountancy.com
Year 2 Investment In Associate (SFP)
Initial Investment 400,000
Parent Share of Post Acquisition Profit (200,000 + 160,000) x 25% 90,000
Share of Dividend (150,000 x 25%) -37,500
Investment in Associate 452,500
Year 2 Income From Associate (Income Statement)
Parent share of Current Year Income (160,000 x 25%) 40,000
Year 3 Investment In Associate (SFP)
Initial Investment 400,000
Parent Share of Post Acquisition Profit
(200,000 + 160,000 + 30,000) x 25% 97,500
Share of Dividend (150,000 x 25%) -37,500
Impairment -20,000
Investment in Associate 440,000
Year 3 Income From Associate (Income Statement)
Parent share of Current Year Income (30,000 x 25%) 7500
Impairment -20,000
Loss From Associate -12500

F2 Financial Management Q & A www.mapitaccountancy.com
Illustration 2 Inter company sales of $1,300 have occurred in Attila group at a mark up on cost of 30%. At the year end 1/2 of these goods had been sold on. Attila has an 30% interest in Hun.
I. Calculate the PURP.
II. Show the accounting treatment if the parent company is the seller.
III. Show the accounting treatment if the Associate company is the seller.

F2 Financial Management Q & A www.mapitaccountancy.com
Solution (Mark-up)
Parent is seller
Subsidiary is seller
Unsold Inventory Mark-up PURP Group %
(1300 x 1/2) = 650 30/130 150 45
DR/CR Account $ $
DR Accumulated Profits (W5) to decrease 45
CR Investment in Associate 45
DR/CR Account $ $
DR Accumulated Profits (W5) to decrease 45
CR Group Inventory 45
F2 Financial Management Q & A www.mapitaccountancy.com
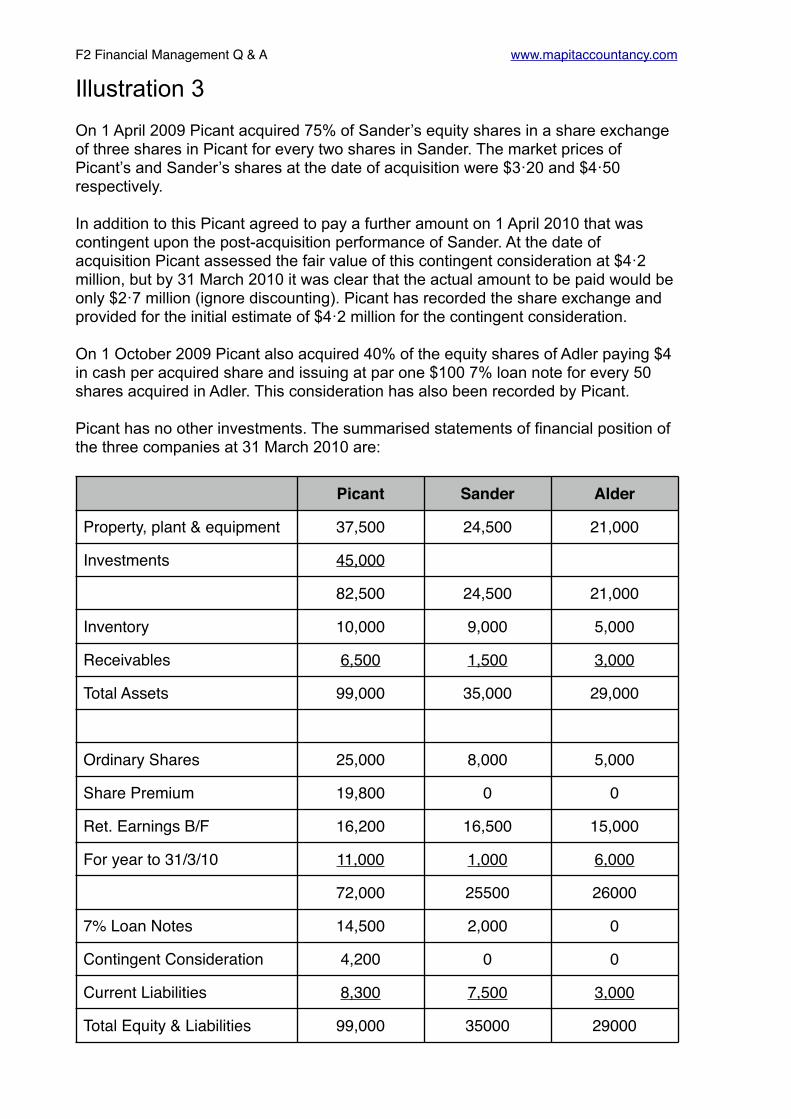
Illustration 3 On 1 April 2009 Picant acquired 75% of Sander’s equity shares in a share exchange of three shares in Picant for every two shares in Sander. The market prices of Picant’s and Sander’s shares at the date of acquisition were $3·20 and $4·50 respectively.
In addition to this Picant agreed to pay a further amount on 1 April 2010 that was contingent upon the post-acquisition performance of Sander. At the date of acquisition Picant assessed the fair value of this contingent consideration at $4·2 million, but by 31 March 2010 it was clear that the actual amount to be paid would be only $2·7 million (ignore discounting). Picant has recorded the share exchange and provided for the initial estimate of $4·2 million for the contingent consideration.
On 1 October 2009 Picant also acquired 40% of the equity shares of Adler paying $4 in cash per acquired share and issuing at par one $100 7% loan note for every 50 shares acquired in Adler. This consideration has also been recorded by Picant.
Picant has no other investments. The summarised statements of financial position of the three companies at 31 March 2010 are:
Picant Sander Alder
Property, plant & equipment 37,500 24,500 21,000
Investments 45,000
82,500 24,500 21,000
Inventory 10,000 9,000 5,000
Receivables 6,500 1,500 3,000
Total Assets 99,000 35,000 29,000
Ordinary Shares 25,000 8,000 5,000
Share Premium 19,800 0 0
Ret. Earnings B/F 16,200 16,500 15,000
For year to 31/3/10 11,000 1,000 6,000
72,000 25500 26000
7% Loan Notes 14,500 2,000 0
Contingent Consideration 4,200 0 0
Current Liabilities 8,300 7,500 3,000
Total Equity & Liabilities 99,000 35000 29000
F2 Financial Management Q & A www.mapitaccountancy.com
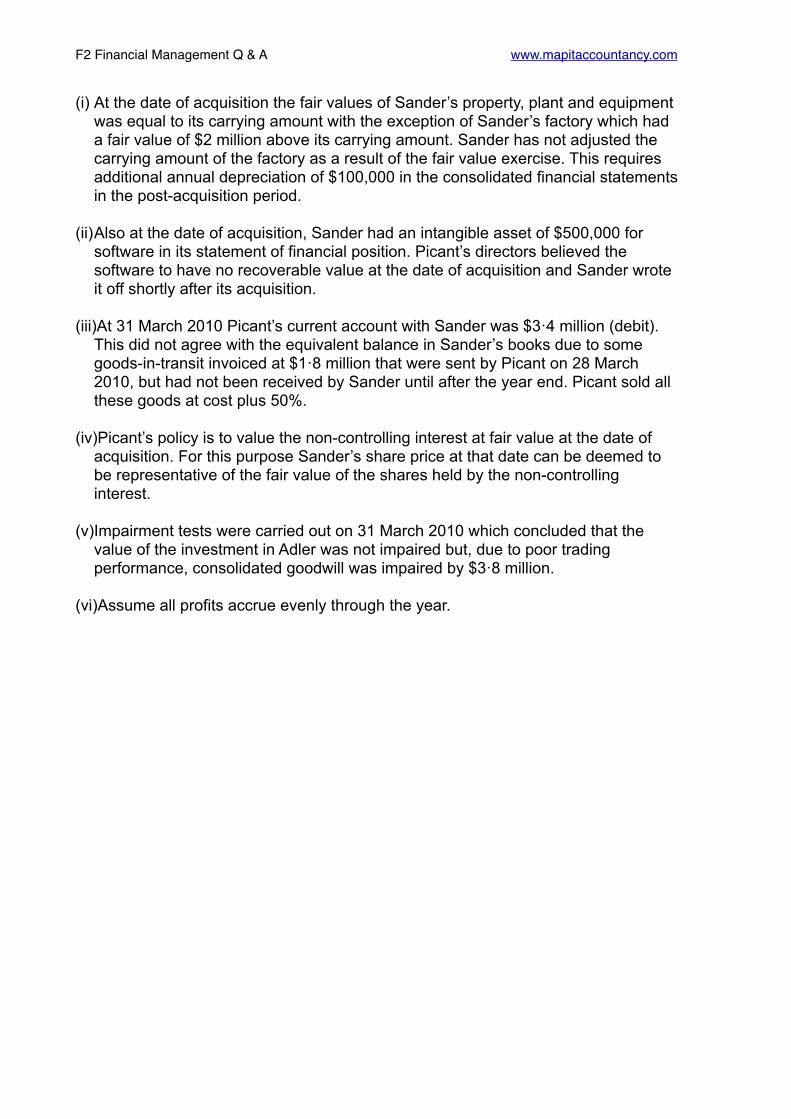
(i) At the date of acquisition the fair values of Sander’s property, plant and equipment was equal to its carrying amount with the exception of Sander’s factory which had a fair value of $2 million above its carrying amount. Sander has not adjusted the carrying amount of the factory as a result of the fair value exercise. This requires additional annual depreciation of $100,000 in the consolidated financial statements in the post-acquisition period.
(ii)Also at the date of acquisition, Sander had an intangible asset of $500,000 for software in its statement of financial position. Picant’s directors believed the software to have no recoverable value at the date of acquisition and Sander wrote it off shortly after its acquisition.
(iii)At 31 March 2010 Picant’s current account with Sander was $3·4 million (debit). This did not agree with the equivalent balance in Sander’s books due to some goods-in-transit invoiced at $1·8 million that were sent by Picant on 28 March 2010, but had not been received by Sander until after the year end. Picant sold all these goods at cost plus 50%.
(iv)Picant’s policy is to value the non-controlling interest at fair value at the date of acquisition. For this purpose Sander’s share price at that date can be deemed to be representative of the fair value of the shares held by the non-controlling interest.
(v)Impairment tests were carried out on 31 March 2010 which concluded that the value of the investment in Adler was not impaired but, due to poor trading performance, consolidated goodwill was impaired by $3·8 million.
(vi)Assume all profits accrue evenly through the year.
F2 Financial Management Q & A www.mapitaccountancy.com
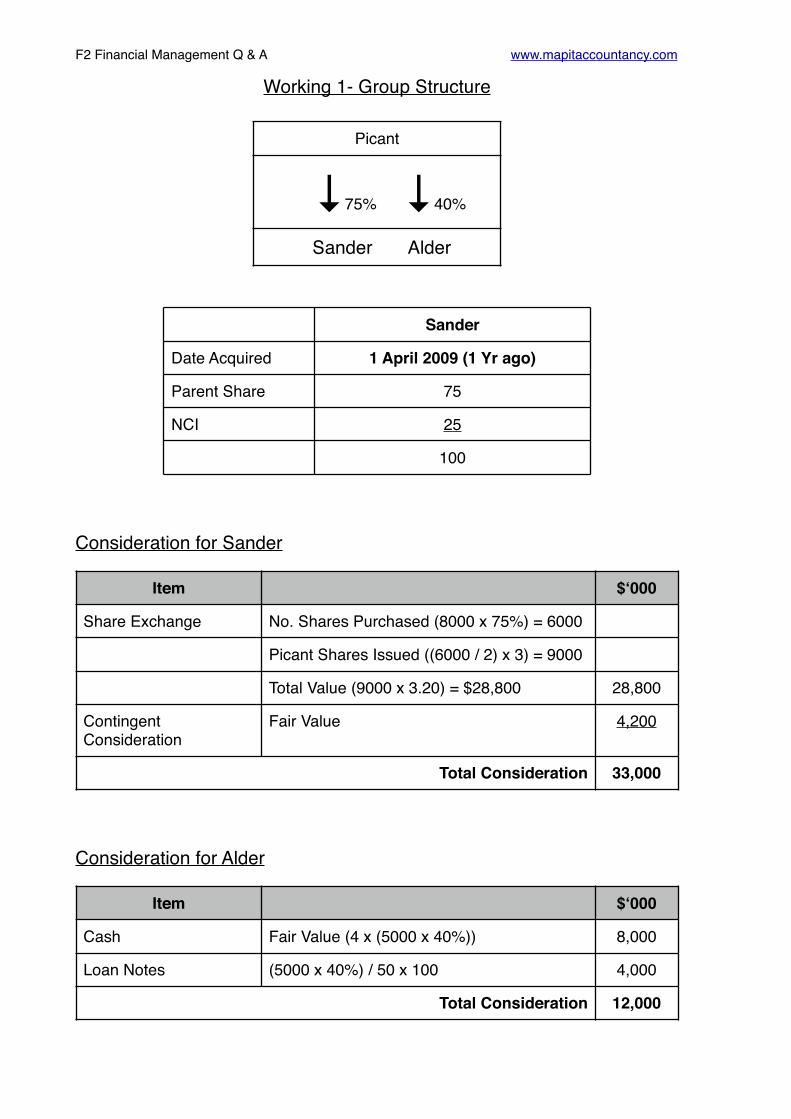
Working 1- Group Structure
Consideration for Sander
Consideration for Alder
Picant
↓75% ↓40%
Sander Alder
Sander
Date Acquired 1 April 2009 (1 Yr ago)
Parent Share 75
NCI 25
100
Item $‘000
Share Exchange No. Shares Purchased (8000 x 75%) = 6000
Picant Shares Issued ((6000 / 2) x 3) = 9000
Total Value (9000 x 3.20) = $28,800 28,800
Contingent Consideration
Fair Value 4,200
Total Consideration 33,000
Item $‘000
Cash Fair Value (4 x (5000 x 40%)) 8,000
Loan Notes (5000 x 40%) / 50 x 100 4,000
Total Consideration 12,000
F2 Financial Management Q & A www.mapitaccountancy.com
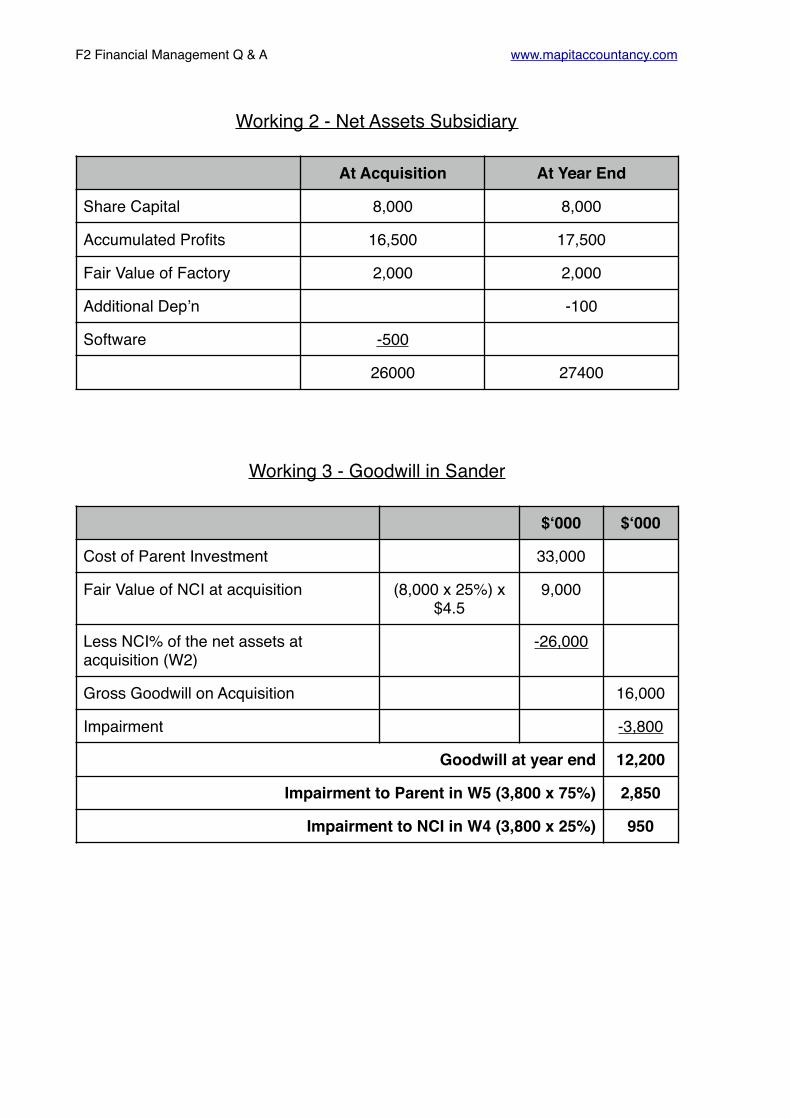
Working 2 - Net Assets Subsidiary
Working 3 - Goodwill in Sander
At Acquisition At Year End
Share Capital 8,000 8,000
Accumulated Profits 16,500 17,500
Fair Value of Factory 2,000 2,000
Additional Dep’n -100
Software -500
26000 27400
$‘000 $‘000
Cost of Parent Investment 33,000
Fair Value of NCI at acquisition (8,000 x 25%) x $4.5
9,000
Less NCI% of the net assets at acquisition (W2)
-26,000
Gross Goodwill on Acquisition 16,000
Impairment -3,800
Goodwill at year end 12,200
Impairment to Parent in W5 (3,800 x 75%) 2,850
Impairment to NCI in W4 (3,800 x 25%) 950
F2 Financial Management Q & A www.mapitaccountancy.com
Working 4 - NCI
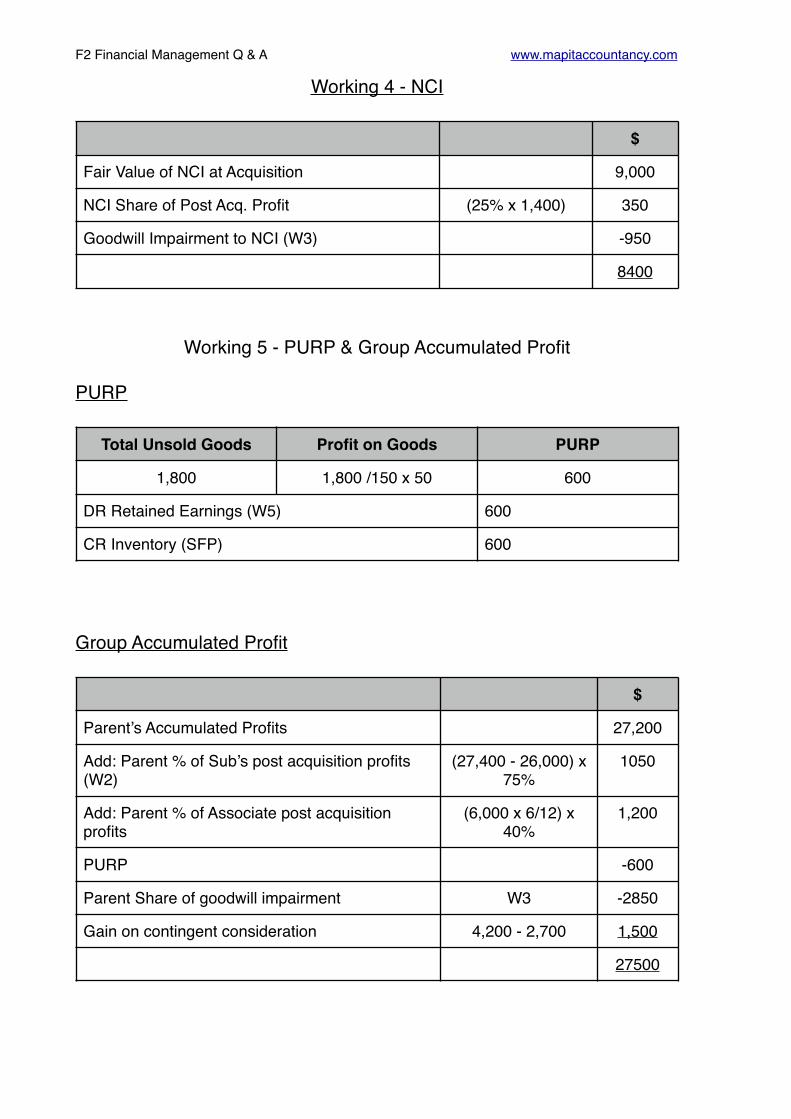
Working 5 - PURP & Group Accumulated Profit
PURP
Group Accumulated Profit
$
Fair Value of NCI at Acquisition 9,000
NCI Share of Post Acq. Profit (25% x 1,400) 350
Goodwill Impairment to NCI (W3) -950
8400
Total Unsold Goods Profit on Goods PURP
1,800 1,800 /150 x 50 600
DR Retained Earnings (W5) 600
CR Inventory (SFP) 600
$
Parent’s Accumulated Profits 27,200
Add: Parent % of Sub’s post acquisition profits (W2)
(27,400 - 26,000) x 75%
1050
Add: Parent % of Associate post acquisition profits
(6,000 x 6/12) x 40%
1,200
PURP -600
Parent Share of goodwill impairment W3 -2850
Gain on contingent consideration 4,200 - 2,700 1,500
27500
F2 Financial Management Q & A www.mapitaccountancy.com
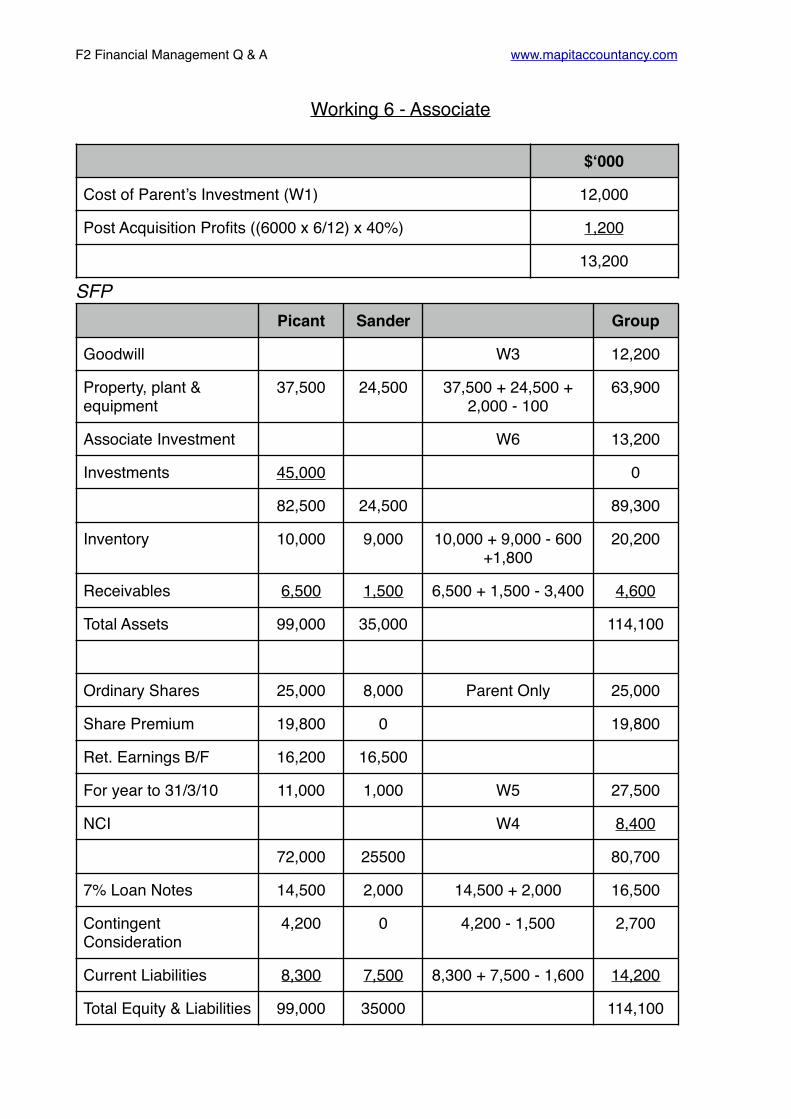
Working 6 - Associate
SFP
$‘000
Cost of Parent’s Investment (W1) 12,000
Post Acquisition Profits ((6000 x 6/12) x 40%) 1,200
13,200
Picant Sander Group
Goodwill W3 12,200
Property, plant & equipment
37,500 24,500 37,500 + 24,500 + 2,000 - 100
63,900
Associate Investment W6 13,200
Investments 45,000 0
82,500 24,500 89,300
Inventory 10,000 9,000 10,000 + 9,000 - 600 +1,800
20,200
Receivables 6,500 1,500 6,500 + 1,500 - 3,400 4,600
Total Assets 99,000 35,000 114,100
Ordinary Shares 25,000 8,000 Parent Only 25,000
Share Premium 19,800 0 19,800
Ret. Earnings B/F 16,200 16,500
For year to 31/3/10 11,000 1,000 W5 27,500
NCI W4 8,400
72,000 25500 80,700
7% Loan Notes 14,500 2,000 14,500 + 2,000 16,500
Contingent Consideration
4,200 0 4,200 - 1,500 2,700
Current Liabilities 8,300 7,500 8,300 + 7,500 - 1,600 14,200
Total Equity & Liabilities 99,000 35000 114,100

F2 Financial Management Q & A www.mapitaccountancy.com
Increasing/Decreasing Holding

F2 Financial Management Q & A www.mapitaccountancy.com
Illustration 1Vic purchased 10% of the shares in Bob several years ago. The investment cost $17,000 and Vic currently carries the investment at cost in the accounts. Vic has subsequently purchased 45% of the shares in Bob for $120,000. The net assets of Bob have a fair value of $60,000 and the fair value of the original investment is $45,000. The fair value of the NCI is $90,000.
Calculate the gain or loss arising on the subsequent acquisition of shares
Solution 1
Fair value of original investment 45,000
Less the cost of the original investment -17,000
Gain taken to income statement 28,000

F2 Financial Management Q & A www.mapitaccountancy.com
Illustration 2Vic purchased 10% of the shares in Bob several years ago. The investment cost $17,000 and Vic currently carries the investment at cost in the accounts. Vic has subsequently purchased 45% of the shares in Bob for $120,000. The net assets of Bob have a fair value of $60,000 and the fair value of the original investment is $45,000. The fair value of the NCI is $90,000.
Calculate the gross goodwill arising on the acquisition of Bob.
Solution 2
Working 1- Group Structure
Working 2 - Revaluation
Vic
↓10% ↓45%
Bob
Date 10% Acquired Years Ago
Date 45% Acquired Now
Parent Share 55%
NCI 45%
1
Fair value of original investment 45,000
Less the cost of the original investment -17,000
Gain taken to income statement 28,000

F2 Financial Management Q & A www.mapitaccountancy.com
Working 3 - Goodwill
Fair value of original investment 45,000
Fair value of consideration for second investment 120,000
165,000
Fair value of NCI at acquisition 90,000
Less 100% net assets at acquisition -60,000
Gross Goodwill 195,000

F2 Financial Management Q & A www.mapitaccountancy.com
Illustration 3Aldo purchased 15% of the shares in Giro several years ago. The investment cost $85,000 and they currently carry it at cost in the accounts. Aldo has subsequently purchased 75% of the shares in Giro for $700,000. The net assets of Giro have a fair value of $750,000 and the fair value of the original investment is now $145,000. The fair value of the NCI on acquisition was $180,000.
Calculate the gross goodwill arising on the acquisition of Giro.
Solution 3
Working 1- Group Structure
Working 2 - Revaluation
Aldo
↓15% ↓75%
Giro
Date 15% Acquired Years Ago
Date 75% Acquired Now
Parent Share 90%
NCI 10%
1
Fair value of original investment 145,000
Less the cost of the original investment -85,000
Gain taken to income statement 60,000

F2 Financial Management Q & A www.mapitaccountancy.com
Working 3 - Goodwill
Fair value of original investment 145,000
Fair value of consideration for second investment 700,000
845,000
Fair value of NCI at acquisition 180,000
Less 100% net assets at acquisition -750,000
Gross Goodwill 275,000

F2 Financial Management Q & A www.mapitaccountancy.com
Illustration 4A parent has owned 70% of a subsidiary for a long period of time. The NCI in the subsidiary is currently measured at $500,000. If the parent buys another 10% what will the value of the NCI fall to?
Solution 4
$
Current NCI value (30% holding) 500,000
Proportion being purchased (500,000 x 10/30) 166,667
New Value of NCI (500,000 - 166,667) 333,333

F2 Financial Management Q & A www.mapitaccountancy.com
Illustration 5A parent has owned 90% of a subsidiary for a long period of time. The NCI in the subsidiary is currently measured at $300,000.
I. The parent acquires all of the remaining shares for consideration of $250,000.
II. The parent acquires 3% of the shares for $200,000 reducing the NCI to 7%.
What is the difference taken to equity in both situations?
Solution 5
I.
II.
$
Amount of cash paid for subsequent investment 250,000
Decrease in the NCI 300,000
Difference to an equity reserve 50,000
$
Amount of cash paid for subsequent investment 200,000
Decrease in the NCI 300,000 x 3/10 90,000
Difference to an equity reserve -110,000

F2 Financial Management Q & A www.mapitaccountancy.com
Illustration 6Inter purchased 70% of the shares in Milan several years ago. At that time goodwill of $80,000 arose. The net assets of Milan are currently $100,000 and the NCI is $18,000.
I. Calculate the gain arising on disposal if Inter sells it’s entire holding for $350,000.
II. Calculate the gain arising on disposal if Inter sells 30% for $250,000 and the fair value of the residual value is $30,000

F2 Financial Management Q & A www.mapitaccountancy.com
Solution 6I.
II.
$
Sale Proceeds 350,000
Less net assets of sub at date of disposal -100,000
Less all goodwill remaining at disposal -80,000
Plus all NCI at date of disposal 18,000
Plus fair value of any residual holding Nil
Gain to group 188,000
$
Sale Proceeds 250,000
Less net assets of sub at date of disposal -100,000
Less all goodwill remaining at disposal -80,000
Plus all NCI at date of disposal 18,000
Plus fair value of any residual holding 30,000
Gain to group 118,000

F2 Financial Management Q & A www.mapitaccountancy.com
Illustration 7For several years Jeremy has owned 70% of Richard. The net assets of Richard at this time are $250,000. The NCI is $68,000 and the gross goodwill is $200,000.
Jeremy has just sold 15% to take the holding to 55% for consideration of $150,000. Calculate the difference arising that will be taken to equity.

F2 Financial Management Q & A www.mapitaccountancy.com
Solution 7
$
DR Amount of cash received for sale of subsequent investment 150,000
CR Increase in the NCI (% of net assets & goodwill)
15% x (250,000 + 200,000) 67,500
CR Difference to an equity reserve (Gain) 82,500

F2 Financial Management Q & A www.mapitaccountancy.com
Vertical Groups

F2 Financial Management Q & A www.mapitaccountancy.com
Illustration 1Consider a group with the following structure and detail:
Required
Calculate the Goodwill & the NCI at the acquisition date.
P
↓80% - 1 Year Ago
S
↓60% - 1 Year Ago
S1
Cost of Investment
Net Assets on Acquisition
FV NCI on Acquisition
S 250 200 60
S1 220 150 100

F2 Financial Management Q & A www.mapitaccountancy.com
Working 1 - Effective Interest in S1
Working 2 - Goodwill in S
Working 3 - Goodwill in S1
Working Total
P’s Direct Interest in S 80%
Non Controlling Interest in S 20%
100%
P’s indirect interest in S1 (80% x 60%) 48%
Non Controlling Interest in S1 (Balancing figure) 52%
100%
$
Cost of Parent Investment 250
Fair Value of NCI at acquisition 60
Less net assets at acquisition -200
Goodwill attributable to Parent 110
$
Cost of Investment 220
Less indirect holding adjustment 220 x 20% -44
Fair Value of NCI at acquisition 100
Less net assets at acquisition -150
Goodwill attributable to Parent 126
F2 Financial Management Q & A www.mapitaccountancy.com
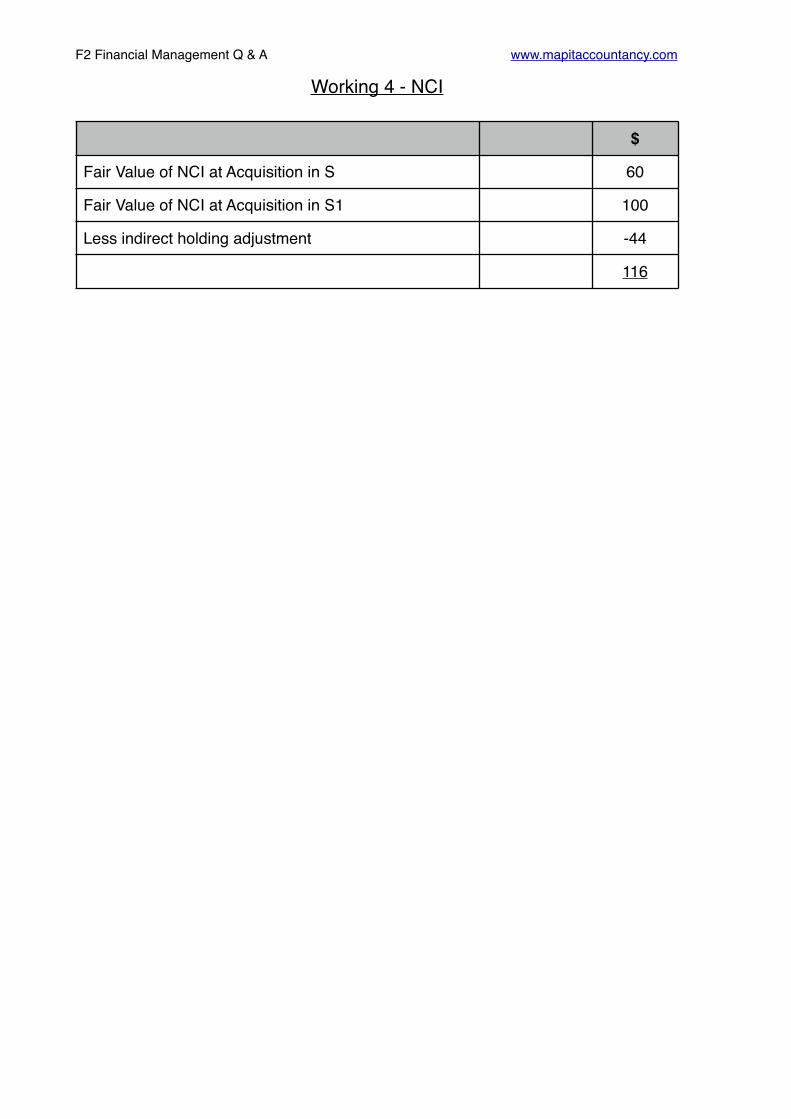
Working 4 - NCI
$
Fair Value of NCI at Acquisition in S 60
Fair Value of NCI at Acquisition in S1 100
Less indirect holding adjustment -44
116

F2 Financial Management Q & A www.mapitaccountancy.com
Illustration 2Ozzy acquired a 70% holding in Sharon 2 years ago. Sharon purchased a 60% shareholding in Jack one year ago. The following financial statements relate to the Ozzy group.
Statements of Financial Position Ozzy Sharon Jack
$ $ $
Investment in Sharon 50
Investment in Jack 17
Other assets 25 18 20
75 35 20
Ordinary Shares 50 20 8
Accumulated profits 20 12 8
Equity 70 32 16
Liabilities 5 3 4
75 35 20
Income Statements Ozzy Sharon Jack
$ $ $
Revenue 400 60 85
Operating Costs -395 55 -83
Operating Profit 5 5 2
Tax -3 -2 -1
Profit for Year 2 3 1
Accumulated Profits Sharon Jack
One year ago 3 4
Two years ago 2 3

F2 Financial Management Q & A www.mapitaccountancy.com
Goods worth $8m were sold in the year by Jack to Sharon and by the year end all of these had been sold to a third party.
An impairment review at the year end found the goodwill of Sharon to be impaired by $3m, goodwill is to be calculated gross.
Prepare the consolidated statement of financial position and consolidated income statement for the Ozzy group.
Fair Value of NCI based on effective shareholdings
Sharon Jack
One year ago 8 10
Two years ago 7 6

F2 Financial Management Q & A www.mapitaccountancy.com
SolutionWorking 1- Group Structure
Ozzy’s effective Interest in Jack
Ozzy
↓70% - 2 Years Ago
Sharon
↓60% - 1 Year Ago
Jack
Working Total
Ozzy’s direct interest in Jack 0%
Ozzy’s indirect interest (via Sharon)
(70% x 60%) 42%
Ozzy’s effective interest in Jack 0.42
Non Controlling Interest in Jack (Balancing figure) 0.58
100%
Ozzy’s Direct Interest in Sharon 70%
Non Controlling Interest in Sharon 30%
100%

F2 Financial Management Q & A www.mapitaccountancy.com
Working 2 - Equity Table
Working 3 - Goodwill in Sharon
At Acquisition At Year End
At Acquisition At Year End
Sharon Jack
Share Capital 20 20 8 8
Accumulated Profits 2 12 4 8
22 32 12 16
Cost of Parent’s investment 50
Fair value of NCI at acquisition (Market Value) 7
57
Less 100% net assets at acquisition in W2 -22
Gross Goodwill 35
Impairment -3
Goodwill after Impairment 32
F2 Financial Management Q & A www.mapitaccountancy.com
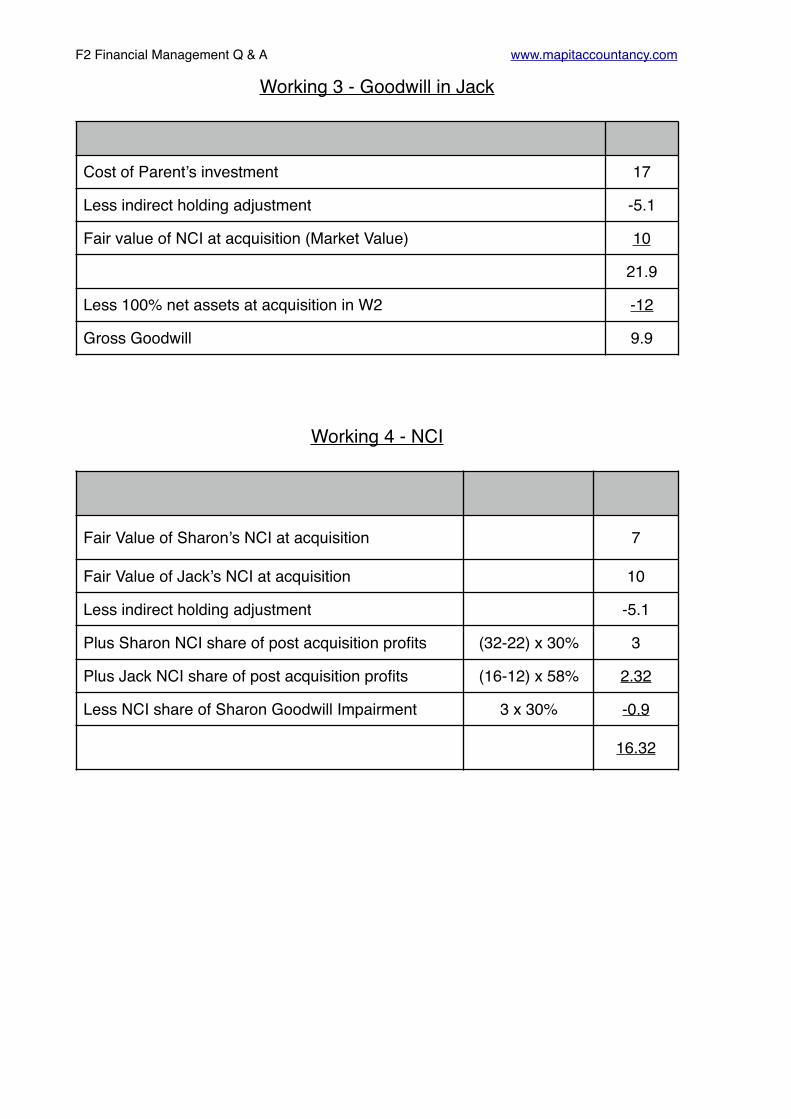
Working 3 - Goodwill in Jack
Working 4 - NCI
Cost of Parent’s investment 17
Less indirect holding adjustment -5.1
Fair value of NCI at acquisition (Market Value) 10
21.9
Less 100% net assets at acquisition in W2 -12
Gross Goodwill 9.9
Fair Value of Sharon’s NCI at acquisition 7
Fair Value of Jack’s NCI at acquisition 10
Less indirect holding adjustment -5.1
Plus Sharon NCI share of post acquisition profits (32-22) x 30% 3
Plus Jack NCI share of post acquisition profits (16-12) x 58% 2.32
Less NCI share of Sharon Goodwill Impairment 3 x 30% -0.9
16.32

F2 Financial Management Q & A www.mapitaccountancy.com
Working 5 - Group Accumulated Profit
Working 6 - NCI (Income Statement)
$
Parent’s Accumulated Profits 20
Less Goodwill Impairment 3 x 70% -2.1
Add: Parent % of Sharon’s post acquisition profits 10 x 70% 7
Add: Parent % of the Jack’s post acquisition profits 4 x 42% 1.68
26.58
Sharon Jack
NCI % of Profit in Question (30% x 3) 0.9 (1 x 58%) 0.58
NCI Share Goodwill Impairment (30% x 3) -0.9
NCI Share Group Profit -0.00 0.58
Total 0.58
F2 Financial Management Q & A www.mapitaccountancy.com
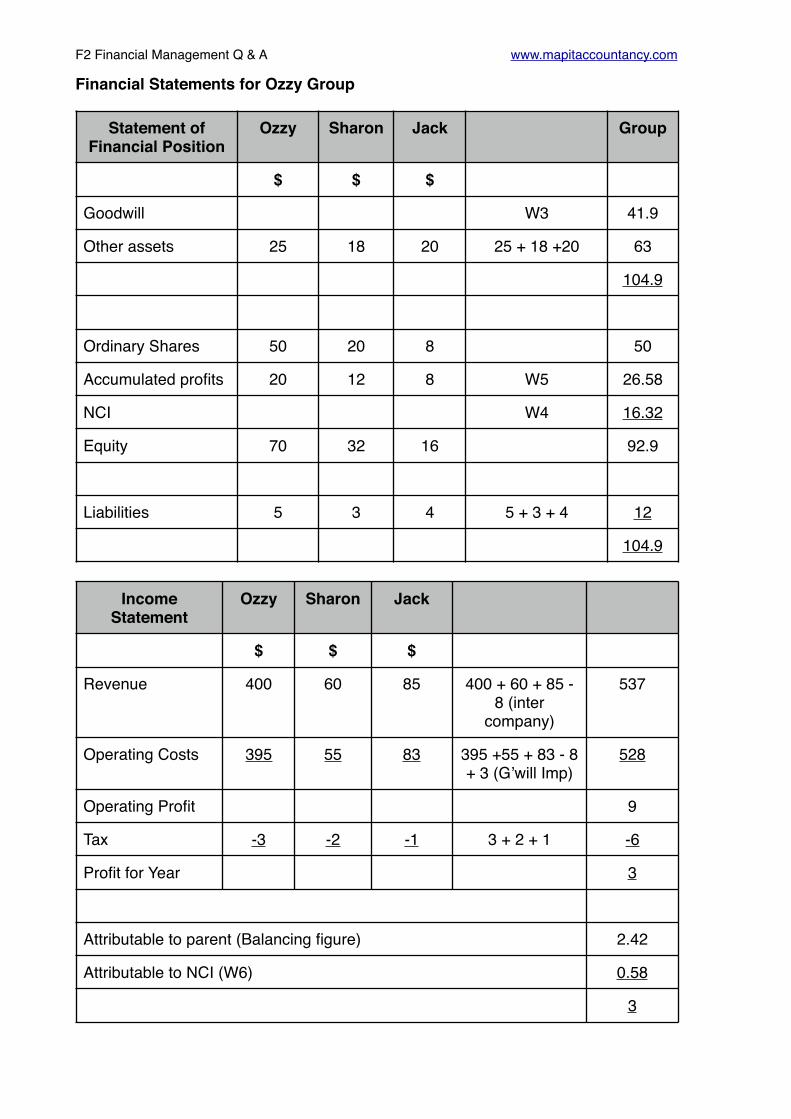
Financial Statements for Ozzy Group
Statement of Financial Position
Ozzy Sharon Jack Group
$ $ $
Goodwill W3 41.9
Other assets 25 18 20 25 + 18 +20 63
104.9
Ordinary Shares 50 20 8 50
Accumulated profits 20 12 8 W5 26.58
NCI W4 16.32
Equity 70 32 16 92.9
Liabilities 5 3 4 5 + 3 + 4 12
104.9
Income Statement
Ozzy Sharon Jack
$ $ $
Revenue 400 60 85 400 + 60 + 85 - 8 (inter
company)
537
Operating Costs 395 55 83 395 +55 + 83 - 8 + 3 (G’will Imp)
528
Operating Profit 9
Tax -3 -2 -1 3 + 2 + 1 -6
Profit for Year 3
Attributable to parent (Balancing figure) 2.42
Attributable to NCI (W6) 0.58
3

F2 Financial Management Q & A www.mapitaccountancy.com
Indirect Associates

F2 Financial Management Q & A www.mapitaccountancy.com
Illustration 1
The parent has an 60% holding in the subsidiary. The subsidiary has an associate in which it holds 40%. The following information is relevant.
Show the treatment for the associate in the group financial statements.
Subsidiary’s cost of investment in associate 200
Fair value of net assets in associate at acquisition 120
Fair value of net assets in associate at year end 300

F2 Financial Management Q & A www.mapitaccountancy.com
Solution 1
Effective interest & NCI
Parent’s’s indirect interest (via Sub)
(60% x 40%) 24%
NCI (Balancing figure) 16%
Parent’s effective interest 40%
Post Acquisition Profits
Fair value of net assets in associate at year end 300
Fair value of net assets in associate at acquisition -120
Post acquisition profits 180
Carrying Value of Associate $
Cost of Investment 200
Subsidiary share of post acquisition profits (40% x 180) 72
Carrying Value of Associate 272
Treatment
DR Investment in Associate 40% x 180 72
CR Equity W5 (Parent share of post acquisition profits)
24/40 x 72 43.2
CR NCI W4 (NCI share of post acquisition profits) 16/40 x 72 28.8

F2 Financial Management Q & A www.mapitaccountancy.com
Illustration 1The statements of financial position for 3 companies are as follows:
Other information:
I. John acquired a 60% holding in Paul for $600
II. Paul acquired a 60% holding in Ringo for $200
III. John acquired a 30% holding in Ringo for $75
IV. All of the investments were made on the same date
V. Goodwill is to be calculated gross and no impairment has been recorded
VI. The carrying value of assets & liabilities were the same as the fair values on the date of acquisition
VII. On the date of acquisition the following information was correct:
Prepare the consolidated statement of financial position for John Group.
John Paul Ringo
Investments 675 200
Assets 900 700 400
1575 900 400
Share Capital 300 200 100
Accumulated Profits
700 400 100
Equity 1000 600 200
Liabilities 575 300 200
1575 900 400
Paul Ringo
Accumulated Profits 250 60
Fair value of the effective NCI 100 60
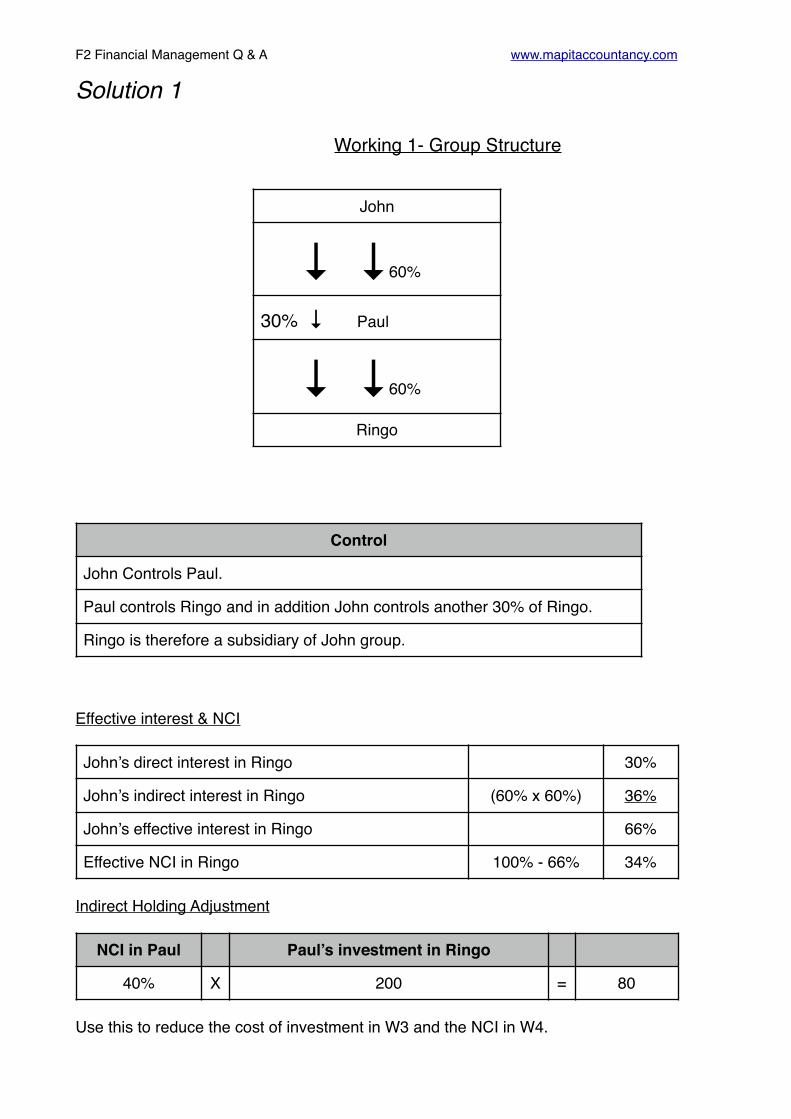
F2 Financial Management Q & A www.mapitaccountancy.com
Solution 1
Working 1- Group Structure
Effective interest & NCI
Indirect Holding Adjustment
Use this to reduce the cost of investment in W3 and the NCI in W4.
John
↓ ↓60%
30% ↓ Paul
↓ ↓60%
Ringo
Control
John Controls Paul.
Paul controls Ringo and in addition John controls another 30% of Ringo.
Ringo is therefore a subsidiary of John group.
John’s direct interest in Ringo 30%
John’s indirect interest in Ringo (60% x 60%) 36%
John’s effective interest in Ringo 66%
Effective NCI in Ringo 100% - 66% 34%
NCI in Paul Paul’s investment in Ringo
40% X 200 = 80

F2 Financial Management Q & A www.mapitaccountancy.com
Working 2 - Net Assets Subsidiary
Working 3 - Goodwill in Paul
Working 3 - Goodwill in Ringo
At Acquisition At Year End
At Acquisition At Year End
Paul Ringo
Share Capital 200 200 100 100
Accumulated Profits 250 400 60 100
450 600 160 200
Cost of Parent’s investment 600
Fair value of NCI at acquisition (Market Value) 100
700
Less 100% net assets at acquisition in W2 -450
Gross Goodwill 250
Cost of Paul’s investment 200
Cost of John’s investment 75
Less indirect holding adjustment -80
Fair value of NCI at acquisition (Market Value) 60
255
Less 100% net assets at acquisition in W2 -160
Gross Goodwill 95

F2 Financial Management Q & A www.mapitaccountancy.com
Working 4 - NCI
Working 5 - Group Accumulated Profit
Fair Value of Paul NCI at acquisition 100
Fair Value of Ringo NCI at acquisition 60
Less indirect holding adjustment -80
Plus Paul NCI share of post acquisition profits (600-450) x 40%
60
Plus Ringo NCI share of post acquisition profits (100 - 60) x 34%
13.6
153.6
$
Parent’s Accumulated Profits 700
Add: Parent % of Paul’s post acquisition profits 150 x 60% 90
Add: Parent % of Ringo’s post acquisition profits 40 x 66% 26.4
816.4

F2 Financial Management Q & A www.mapitaccountancy.com
Statement of financial position for John Group
John Paul Ringo Group
Goodwill W3 (95 + 250)
345
Assets 900 700 400 900 + 700 + 400
2,000
2,345
Share Capital
300 200 100 Parent 300
Accumulated Profits
700 400 100 W5 816
NCI W4 154
Equity 1,270
Liabilities 575 300 200 500 + 300 +200
1,075
2,345

F2 Financial Management Q & A www.mapitaccountancy.com
Changes in Mixed Groups

F2 Financial Management Q & A www.mapitaccountancy.com
Solutions to Lecture Illustrations
Working Total
A’s direct interest in C 25%
A’s indirect interest (via B) (90% x 70%) 63%
A’s effective interest in C 0.88
Non Controlling Interest in C (Balancing figure) 12%
100%
Working Total
D’s direct interest in F 30%
D’s indirect interest (via E) (70% x 40%) 28%
D’s effective interest in F 0.58
Non Controlling Interest in F (Balancing figure) 0.42
100%
Action Result
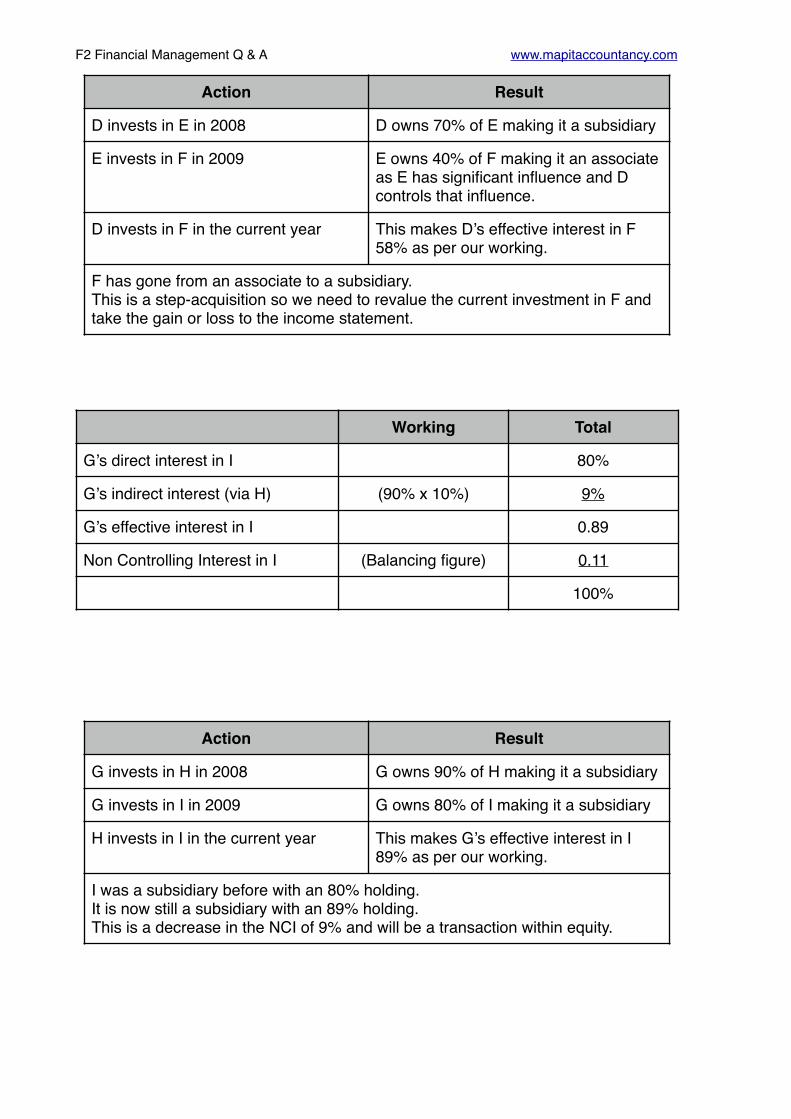
D invests in E in 2008 D owns 70% of E making it a subsidiary
D invests in F in 2009 D owns 30% of F making it an associate
E invests in F in the current year This makes D’s effective interest in F 58% as per our working.
F has gone from an associate to a subsidiary.This is a step-acquisition so we need to revalue the current investment in F and take the gain or loss to the income statement.
F2 Financial Management Q & A www.mapitaccountancy.com
Action Result
D invests in E in 2008 D owns 70% of E making it a subsidiary
E invests in F in 2009 E owns 40% of F making it an associate as E has significant influence and D controls that influence.
D invests in F in the current year This makes D’s effective interest in F 58% as per our working.
F has gone from an associate to a subsidiary.This is a step-acquisition so we need to revalue the current investment in F and take the gain or loss to the income statement.
Working Total
G’s direct interest in I 80%
G’s indirect interest (via H) (90% x 10%) 9%
G’s effective interest in I 0.89
Non Controlling Interest in I (Balancing figure) 0.11
100%
Action Result
G invests in H in 2008 G owns 90% of H making it a subsidiary
G invests in I in 2009 G owns 80% of I making it a subsidiary
H invests in I in the current year This makes G’s effective interest in I 89% as per our working.
I was a subsidiary before with an 80% holding.It is now still a subsidiary with an 89% holding.This is a decrease in the NCI of 9% and will be a transaction within equity.

F2 Financial Management Q & A www.mapitaccountancy.com
Action Result
G invests in H in 2008 G owns 90% of H making it a subsidiary
H invests in I in 2009 I is a simple investment of 10%
G invests in I in the current year This makes G’s effective interest in I 89% as per our working.
I was an investment before.It is now a subsidiary with an 89% holding.This is a step acquisition.

F2 Financial Management Q & A www.mapitaccountancy.com
IAS 21 Foreign Currency

F2 Financial Management Q & A www.mapitaccountancy.com
Illustration 1Which of the following statements relating to IAS 21 The effects of changes in foreign exchange rates is correct?
A. The functional currency of a foreign subsidiary is the currency that the group financial statements are presented in.
B. A foreign subsidiary must present it’s financial statements in the presentational currency of the parent.
C. Consideration will be given to the currency of the costs and sales of the entity when determining it’s functional currency.
D. The more autonomous a subsidiary, the more likely it’s functional currency is that of the parent entity.
Answer C
Illustration 2Bulldog Ltd has a year end of 31 January.
On 13th October Bulldog Ltd buys goods from Eagle Inc. a US supplier for $250,000.
On 24th November Bulldog settles the transaction in full.
Exchange rates
13th October £1 : $1.45
24th November £1 : $1.55
Show the accounting entries for these transactions.
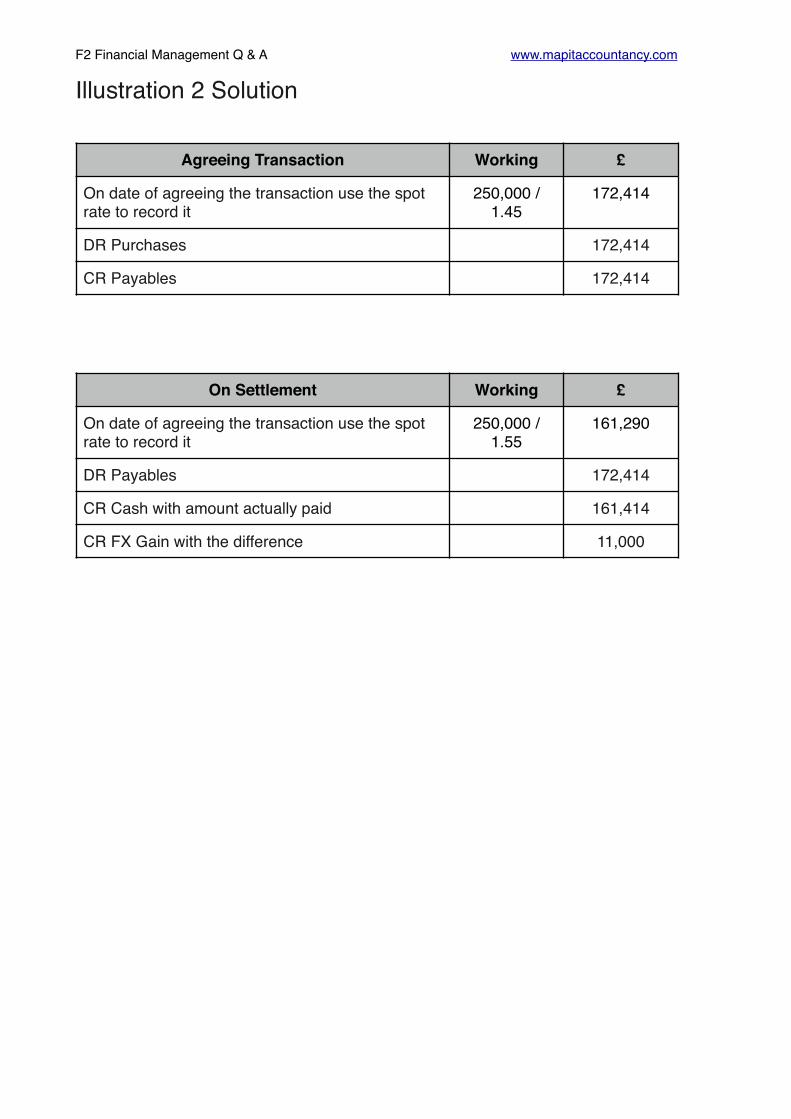
F2 Financial Management Q & A www.mapitaccountancy.com
Illustration 2 Solution
Agreeing Transaction Working £
On date of agreeing the transaction use the spot rate to record it
250,000 / 1.45
172,414
DR Purchases 172,414
CR Payables 172,414
On Settlement Working £
On date of agreeing the transaction use the spot rate to record it
250,000 / 1.55
161,290
DR Payables 172,414
CR Cash with amount actually paid 161,414
CR FX Gain with the difference 11,000

F2 Financial Management Q & A www.mapitaccountancy.com
Illustration 3Jeff Ltd. purchases an item of plant on 1st June from a foreign supplier on one month’s credit for €100,000. Jeff is a US company.
Exchange rates
1st June $ = €1.50
21st June $ = €1.40
How will this transaction be dealt with in the accounts for the year to 21st June?

F2 Financial Management Q & A www.mapitaccountancy.com
Solution to Illustration 3
At Purchase Date Working $
The rate at the time of purchase is $ : €1.50 €100,000 / 1.50 66,666
DR Asset 66,666
CR Payables 66,666
At 21st June Working $
The rate at this time is $ : €1.40 €100,000 / 1.40 71,429
The payable must be retranslated at the year end as it is a monetary balance. So........
DR FX Loss (71,429 - 66,666) 4,763
CR Payables (71,429 - 66,666) 4,763
The $4,763 is unrealised so is included in Other Comprehensive Income.

F2 Financial Management Q & A www.mapitaccountancy.com
Illustration 4
Big Ltd. acquired 80% of Cahoona Inc. on 1st July 20X1.Cahoona Inc are based in Burgerland where the functional currency is Francs (Fr). The financial statements for the year to 30 June 20X2 are below.
SFP Big$
CahoonaFr
Investment in Cahoona 5000
Non Current Assets 10,000 3,000
Current Assets 5,000 2,000
20000 5,000
Share Capital 6,000 1,500
Retained Earnings 4,000 2,500
Liabilities 10,000 1,000
20,000 5,000
Income Statement Big$
CahoonaFr
Revenue 25,000 35,000
Operating Costs -15,000 -26,250
Profit Before Tax 10,000 8,750
Tax -5,000 -7,450
Profit for the Year 5,000 1,300

F2 Financial Management Q & A www.mapitaccountancy.com
There was no other comprehensive income for either entity in the period.
Other information:
I. The fair value of the net assets of Cahoona was Fr6,000 on the date of acquisition with any increase being attributable to land held at historic cost.
II. Big sold goods to Cahoona during the year for $1,000 cash.
III.The NCI is valued using the Fair Value method at FR 2000 at acquisition.
IV. The Goodwill in Cahoona was impairment tested at the year end and was impaired by FR200. The impairment was deemed to have accrued evenly over the year so the average rate should be used to treat it.
Exchange rates to $1:
Fr 1 July 2001 1.5 Average rate 1.75 1 June 1.9 30 June 2
Prepare the group statement of financial position and statement of other comprehensive income.
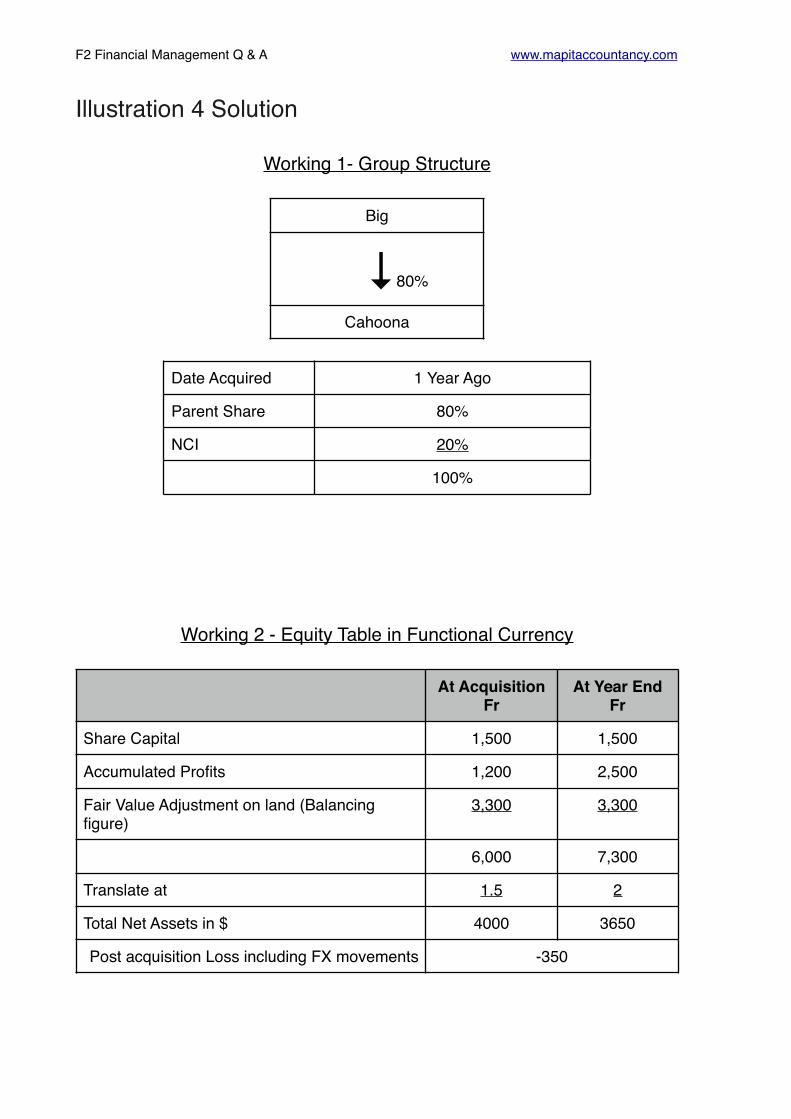
F2 Financial Management Q & A www.mapitaccountancy.com
Illustration 4 Solution
Working 1- Group Structure
Working 2 - Equity Table in Functional Currency
Big
↓80%
Cahoona
Date Acquired 1 Year Ago
Parent Share 80%
NCI 20%
100%
At AcquisitionFr
At Year EndFr
Share Capital 1,500 1,500
Accumulated Profits 1,200 2,500
Fair Value Adjustment on land (Balancing figure)
3,300 3,300
6,000 7,300
Translate at 1.5 2
Total Net Assets in $ 4000 3650
Post acquisition Loss including FX movements -350
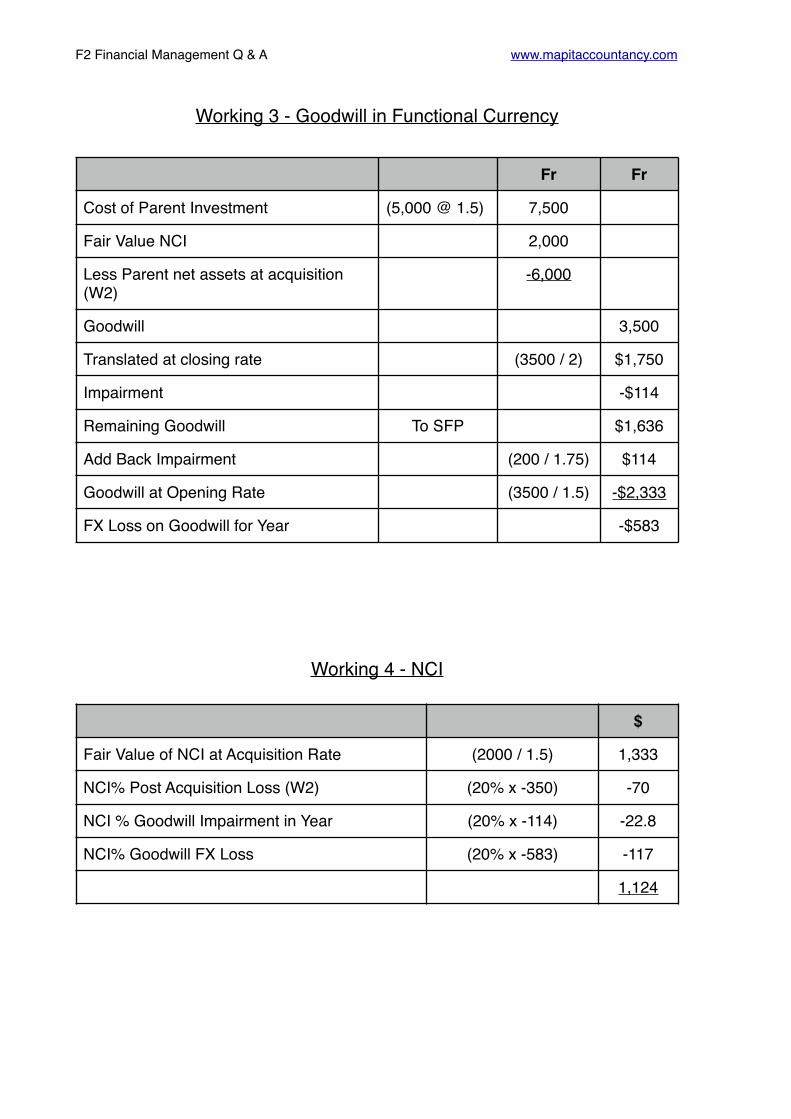
F2 Financial Management Q & A www.mapitaccountancy.com
Working 3 - Goodwill in Functional Currency
Working 4 - NCI
Fr Fr
Cost of Parent Investment (5,000 @ 1.5) 7,500
Fair Value NCI 2,000
Less Parent net assets at acquisition (W2)
-6,000
Goodwill 3,500
Translated at closing rate (3500 / 2) $1,750
Impairment -$114
Remaining Goodwill To SFP $1,636
Add Back Impairment (200 / 1.75) $114
Goodwill at Opening Rate (3500 / 1.5) -$2,333
FX Loss on Goodwill for Year -$583
$
Fair Value of NCI at Acquisition Rate (2000 / 1.5) 1,333
NCI% Post Acquisition Loss (W2) (20% x -350) -70
NCI % Goodwill Impairment in Year (20% x -114) -22.8
NCI% Goodwill FX Loss (20% x -583) -117
1,124
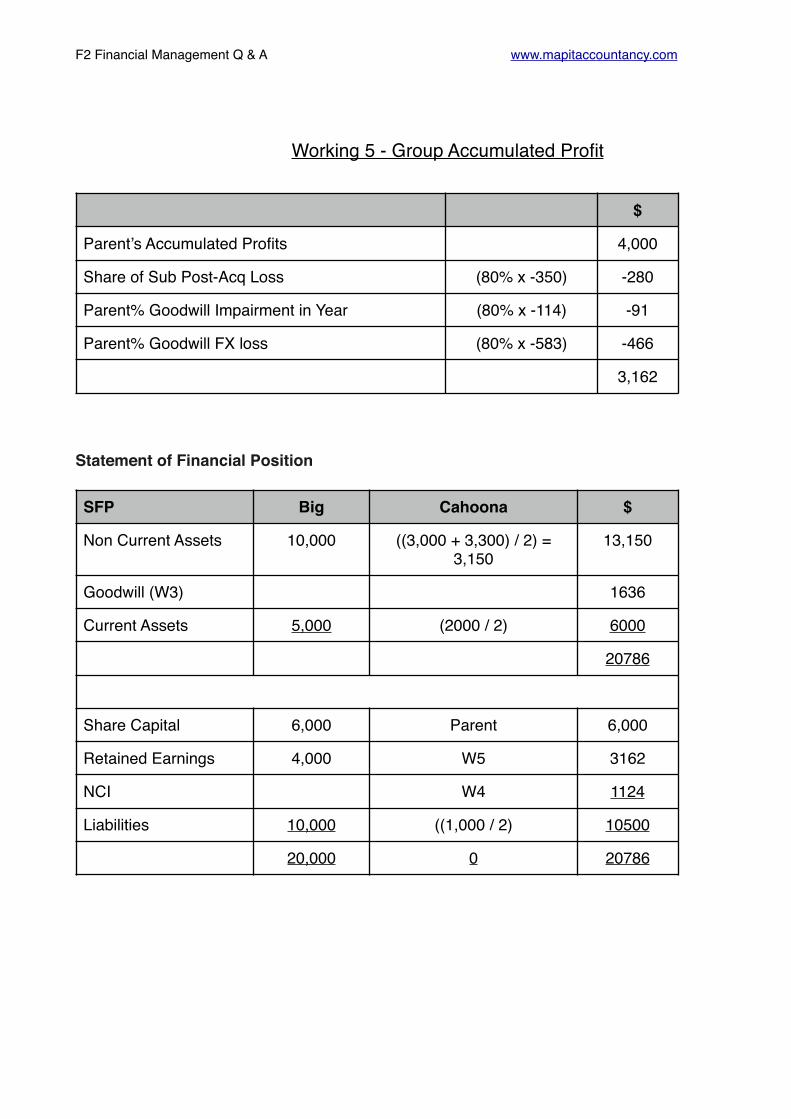
F2 Financial Management Q & A www.mapitaccountancy.com
Working 5 - Group Accumulated Profit
Statement of Financial Position
$
Parent’s Accumulated Profits 4,000
Share of Sub Post-Acq Loss (80% x -350) -280
Parent% Goodwill Impairment in Year (80% x -114) -91
Parent% Goodwill FX loss (80% x -583) -466
3,162
SFP Big Cahoona $
Non Current Assets 10,000 ((3,000 + 3,300) / 2) = 3,150
13,150
Goodwill (W3) 1636
Current Assets 5,000 (2000 / 2) 6000
20786
Share Capital 6,000 Parent 6,000
Retained Earnings 4,000 W5 3162
NCI W4 1124
Liabilities 10,000 ((1,000 / 2) 10500
20,000 0 20786

F2 Financial Management Q & A www.mapitaccountancy.com
FX Gains/Losses for year
NCI Share Profit/Loss for Period
Closing Net Assets at Cl. Rate (W2) (7300 / 2) 3650
Comprehensive Income for Year at Ave. Rate (1300 / 1.75)
-743
Opening Net Assets at Op. Rate (6000 / 1.5) -4000
FX Loss for Year on Net Assets -1,093
FX Loss for Year on Goodwill (W3) -583
Total FX Loss for the year -1,676
NCI Share Profit in Period 20% x 1300 260
NCI Share Goodwill Impairment 20% x 200 -40
Share of Profit in FR 220
Translate at Ave. Rate (220 / 1.75) 126

F2 Financial Management Q & A www.mapitaccountancy.com
Statement of Comprehensive Income
Big Cahoonas Adjustment $
Revenue 25,000 (35,000 / 1.75) Inter Co-1,000
44,000
Operating Costs -15,000 (26,250 / 1.75 Inter Co-1,000
-29,000
Profit Before Tax 15,000
Tax -5000 (7,450 / 1.75) -9,257
Profit for the Year 5,743
Profit Attributable to:
Parent (Balance) 5,617
Non Controlling Interest 126
5,743
Comprehensive Income
Profit for the Year 5,743
FX differences on translation of foreign operations (W6) -1,676
4,067

F2 Financial Management Q & A www.mapitaccountancy.com
IFRS 2Share Based Payments

F2 Financial Management Q & A www.mapitaccountancy.com
Illustration 1
An entity grants 1 share option to each of its 100 employees on 1 January Year 1. Each grant is conditional upon the employee working for the entity over the next three years.
The fair value of each share option as at 1 January Year 1 is $8
At the end of each year the number of employees expected to take up the options are:
Year 1: 95Year 2: 97
When the rights are taken up in year 3, 98 employees actually receive the options.
Show the treatment for the employee benefits over the three years.
Solution
Year Total Employees expected to
qualify
Value of
option
Proportion of
vesting period
Total cumulative charge
Cost for each period
Dr WagesCr equity
1 95 8 1/3 253 253
2 97 8 2/3 517 517 - 253 = 264
3 98 8 3/3 784 784 - 253 - 264 = 267

F2 Financial Management Q & A www.mapitaccountancy.com
Illustration 2An entity grants 1 share option to each of its 500 employees on 1 January Year 1. Each grant is conditional upon the employee working for the entity over the next three years.
The fair value of each share option as at 1 January Year 1 is $10
On the basis of a weighted average probability, the entity estimates on 1 January that 100 employees will leave during the three-year period and therefore forfeit their rights to share options.
The following actually occurs:
– 20 employees leave during Year 1 and the estimate of total employee departures over the three-year period is revised to 70 employees
– 25 employees leave during Year 2 and the estimate of total employee departures over the three-year period is revised to 60 employees
– 10 employees leave during Year 3
Solution
Year Employee Departures
Total EXPECTED to leave
TOTAL EXPECTED TO VEST AT YEAR
END
1 20 70 430
2 25 60 440
3 10 20 + 25 + 10 (Actual) 445
Year Total Employees expected to
qualify
Value of
option
Proportion of
vesting period
Total cumulativ
e cost
Cost for each period
Dr ExpenseCr equity
1 430 10 1/3 1433 1433
2 440 10 2/3 2933 2,933 - 1,433 = 1,500
3 445 10 3/3 4450 4,450 - 2933 = 1,517

F2 Financial Management Q & A www.mapitaccountancy.com
Illustration 3
Same question with additional information of share option price at the end of each year:
Year 1 10 Year 2 12 Year 3 14
Solution
Year Total Employees expected to
qualify
Share Option Price
Proportion of
vesting period
Total cumulativ
e cost
Cost for each period
Dr ExpenseCr Liability
1 430 10 1/3 1433 1433
2 440 12 2/3 3520 3,520 - 1,433 = 2,087
3 445 14 3/3 6230 6,230 - 3,520 = 2,710

F2 Financial Management Q & A www.mapitaccountancy.com
Financial Instruments I

F2 Financial Management Q & A www.mapitaccountancy.com
Illustration 1VB acquired 40,000 shares in another entity, JK, in March 2011 for $2.68 per share. The investment was classified as available for sale on initial recognition. The shares were trading at $2.96 per share on 31 July 2011. Commission of 5% of the value of the transaction is payable on all purchases and disposals of shares.
Calculate the amount recognised in the Financial Statements on initial recognition of the Financial Asset.
Illustration 2(i) VB acquired 40,000 shares in another entity, JK, in March 2012 for $2.68 per share. The investment was classified as available for sale on initial recognition. The shares were trading at $2.96 per share on 31 July 2012. Commission of 5% of the value of the transaction is payable on all purchases and disposals of shares.
Show the treatment for the shares at 31 July 2012
(ii) VB subsequently sold the shares on 31 July 2013 when the share price was $3.00.
Show the treatment for the shares at 31 July 2013
(i)
DR CR
Recognition of Financial Asset (40,000 x $2.68) + $5,360 112,560
Cash 112,560
$
Recognition of Financial Asset (40,000 x $2.68) + $5,360
112,560
Fair Value on 31 July 2012 (40,000 x $2.96) 118400
Movement to Statement of Comprehensive Income(Gain) 5840

F2 Financial Management Q & A www.mapitaccountancy.com
(ii)
$
Fair Value on 31 July 2012 (40,000 x $2.96) 118400
Fair Value on 31 July 2013 (40,000 x $3.00) 120000
Movement to Statement of Comprehensive Income (Gain) 1600
Previous movement shown in Statement of Comprehensive Income (Gain) 5,840
Total Taken to Income Statement when sold
DR ReserveCR Income Statement 7440

F2 Financial Management Q & A www.mapitaccountancy.com
Financial Instruments II

F2 Financial Management Q & A www.mapitaccountancy.com
Illustration 1A company invests $10,000 in a 3 year redeemable 10% bond which is redeemable at a premium.
The bond consists of interest payments and principle only and the company intends to hold it until it is redeemed.
The effective interest rate on the bond is 12%.
Show the treatment for the bond over the 3 year period.
O’Bal Interest (12%)DR Financial Asset
CR Income Statement
Cash Rec’d (10% x 10,000)
DR CashCR Financial
Asset
Cl’bal
10,000 1,200 -1,000 10,200
10,200 1,224 -1,000 10,424
10,424 1,251 -1,000 10,675
The Premium payable at the end of the term therefore is $675.

F2 Financial Management Q & A www.mapitaccountancy.com
Illustration 2A company issues a $30,000 3 year 7% redeemable bond at a discount of 10% with issue costs of $1,000.
The bond is redeemable at a premium of $1,297.
The effective interest rate is 14%.
Show the treatment for the bond over the 3 year period.
$
Issue Proceeds 30,000
Discount -3,000
Issue Costs -1,000
Net Proceeds 26,000
O’Bal Interest (14%)DR Income StatementCR Financial Liability
Cash Paid (7% x 30,000)DR Financial Liability
CR Cash
Cl’bal
26,000 3,640 -2,100 27,540
27,540 3,856 -2,100 29,296
29,296 4,101 -2,100 31,297

F2 Financial Management Q & A www.mapitaccountancy.com
Illustration 3Ambush loaned $200,000 to Bromwich on 1 December 2003. The effective and stated interest rate for this loan was 8 per cent. Interest is payable by Bromwich at the end of each year and the loan is repayable on 30 November 2007. At 30 November 2005, the directors of Ambush have heard that Bromwich is in financial difficulties and is undergoing a financial reorganisation. The directors feel that it is likely that they will only receive $100,000 on 30 November 2007 and no future interest payment. Interest for the year ended 30 November 2005 had been received. The financial year end of Ambush is 30 November 2005.
Required: (i) Outline the requirements of IAS 39 as regards the impairment of financial
assets. (6 marks)
(ii) Explain the accounting treatment under IAS39 of the loan to Bromwich in the financial statements of Ambush for the year ended 30 November 2005. (4
marks)
SolutionIAS 39 requires an entity to assess at each balance sheet date whether there is any objective evidence that financial assets are impaired and whether the impairment impacts on future cash flows. Objective evidence that financial assets are impaired includes the significant financial difficulty of the issuer or obligor and whether it becomes probable that the borrower will enter bankruptcy or other financial reorganisation.
For investments in equity instruments that are classified as available for sale, a significant and prolonged decline in the fair value below its cost is also objective evidence of impairment.
If any objective evidence of impairment exists, the entity recognises any associated impairment loss in profit or loss. Only losses that have been incurred from past events can be reported as impairment losses. Therefore, losses expected from future events, no matter how likely, are not recognised. A loss is incurred only if both of the following two conditions are met:
(i) there is objective evidence of impairment as a result of one or more events that occurred after the initial recognition of the asset (a ‘loss event’), and
(ii) the loss event has an impact on the estimated future cash flows of the financial asset or group of financial assets that can be reliably estimated
The impairment requirements apply to all types of financial assets. The only category of financial asset that is not subject to testing for impairment is a financial asset held at fair value through profit or loss, since any decline in value for such assets are recognised immediately in profit or loss.

F2 Financial Management Q & A www.mapitaccountancy.com
For assets at amortised cost, impaired assets are measured at the present value of the estimated future cash flows discounted using the original effective interest rate of the financial assets. Any difference between the carrying amount and the new value of the impaired asset is an impairment loss.
There is objective evidence of impairment because of the financial difficulties and reorganisation of Bromwich. The impairment loss on the loan will be calculated by discounting the estimated future cash flows. The future cash flows will be $100,000 on 30 November 2007. This will be discounted at an effective interest rate of 8% to give a present value of $85,733. The loan will, therefore, be impaired by ($200,000 – $85,733) i.e. $114,267.

F2 Financial Management Q & A www.mapitaccountancy.com
Financial Instruments III
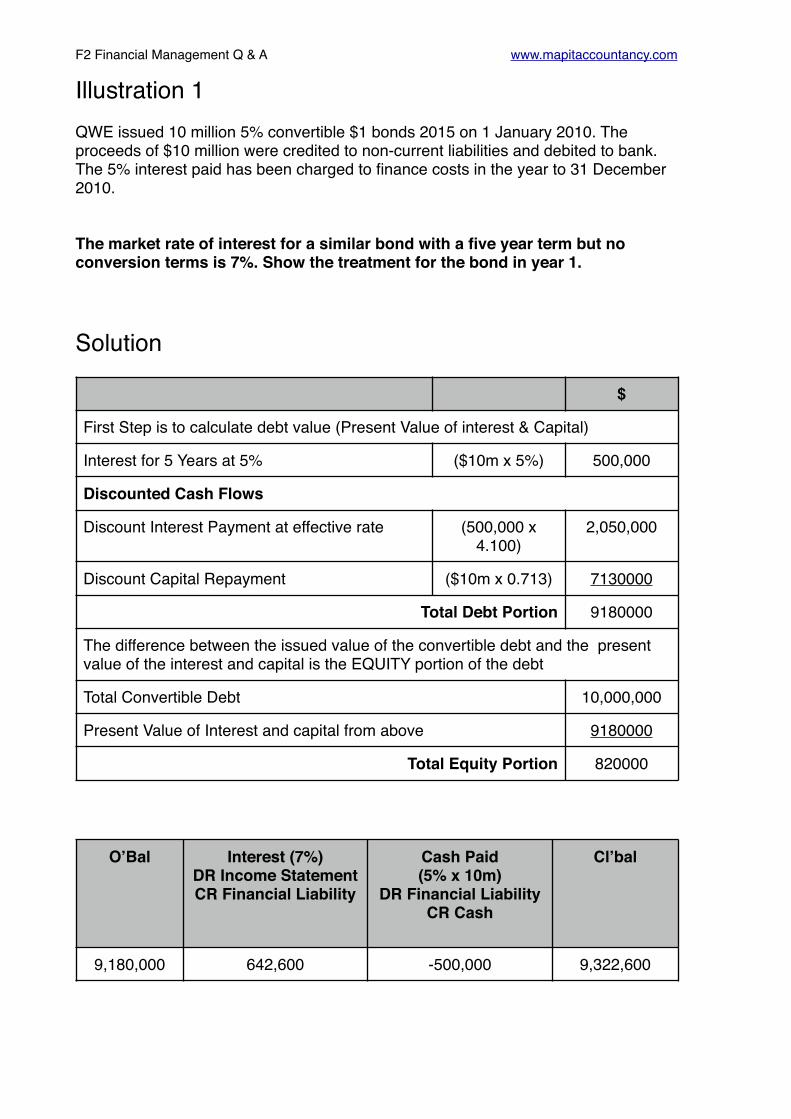
F2 Financial Management Q & A www.mapitaccountancy.com
Illustration 1QWE issued 10 million 5% convertible $1 bonds 2015 on 1 January 2010. The proceeds of $10 million were credited to non-current liabilities and debited to bank. The 5% interest paid has been charged to finance costs in the year to 31 December 2010.
The market rate of interest for a similar bond with a five year term but no conversion terms is 7%. Show the treatment for the bond in year 1.
Solution
$
First Step is to calculate debt value (Present Value of interest & Capital)
Interest for 5 Years at 5% ($10m x 5%) 500,000
Discounted Cash Flows
Discount Interest Payment at effective rate (500,000 x 4.100)
2,050,000
Discount Capital Repayment ($10m x 0.713) 7130000
Total Debt Portion 9180000
The difference between the issued value of the convertible debt and the present value of the interest and capital is the EQUITY portion of the debt
Total Convertible Debt 10,000,000
Present Value of Interest and capital from above 9180000
Total Equity Portion 820000
O’Bal Interest (7%)DR Income Statement CR Financial Liability
Cash Paid (5% x 10m)
DR Financial Liability CR Cash
Cl’bal
9,180,000 642,600 -500,000 9,322,600

F2 Financial Management Q & A www.mapitaccountancy.com
Illustration 2Aron issued one million convertible bonds on 1 June 2006. The bonds had a term of three years and were issued with a total fair value of $100 million which is also the par value. Interest is paid annually in arrears at a rate of 6% per annum and bonds, without the conversion option, attracted an interest rate of 9% per annum on 1 June 2006. The company incurred issue costs of $1 million. If the investor did not convert to shares they would have been redeemed at par. At maturity all of the bonds were converted into 25 million ordinary shares of $1 of Aron. No bonds could be converted before that date. The directors are uncertain how the bonds should have been accounted for up to the date of the conversion on 31 May 2009 and have been told that the impact of the issue costs is to increase the effective interest rate to 9·38%.
Solution
Debt & Equity Split
Year Cash Flows DR 9% PV
1 6 0.917 5.50
2 6 0.841 5.05
3 6 0.772 4.63
3 100 0.772 77.20
Debt Total 92.38
Total Value 100.00
Equity Total (Bal) 7.62
Issue Costs $
Debt ($1m x 92.38/100) 923,800
Equity ($1m x 7.62/100) 76,200
Debt Equity Total
Pre- Issue Costs 92.38 7.62 100
Issue Costs 0.92 0.08 1
Net Value 91.46 7.54 99

F2 Financial Management Q & A www.mapitaccountancy.com
Year O’bal Interest (9.38%)
Cash Paid Cl’bal
1 91.46 8.58 6.00 94.04
2 94.04 8.82 6.00 96.86
3 96.86 9.09 6.00 99.95
This is the $100m conversion value of the bond with slight rounding difference

F2 Financial Management Q & A www.mapitaccountancy.com
Illustration 1An entity issued 300,000 shares at full market price on 1st July 2009. The year end of the entity is 31st December.
There were 900,000 shares in issue on 1st Jan 2009 and the profit for the year to 31st December 2009 was $1,000,000.
Calculate the EPS at 31st December 2009.
Solution
Date Shares Months Fraction Ave
1/01/09 900,000 6/12 - 450,000
1/07/09 1,200,000 6/12 - 600,000
1,050,000
EPS = 1,000,000 / 1,050,000 = 95.24c

F2 Financial Management Q & A www.mapitaccountancy.com
Illustration 2ABC Ltd. makes a bonus issue of 1 for 6 on 1st July 2009. The year end of the entity is 31st December.
There were 900,000 shares in issue on 1st Jan 2009 and the profit for the year to 31st December 2009 was $1,000,000.
Calculate the EPS at 31st December 2009.
Solution
Date Shares Months Fraction Ave
1/01/09 900,000 6/12 7/6 525,000
1/07/09 1,050,000 6/12 525,000
1,050,000
EPS = 1,000,000 / 1,050,000 = 95.24c

F2 Financial Management Q & A www.mapitaccountancy.com
Illustration 3ABC Ltd. makes a rights issue of 1 for 3 on 1st July 2009. The current share price is $4 and the rights issue is at a price of $3 The year end of the entity is 31st December.
There were 900,000 shares in issue on 1st Jan 2009 and the profit for the year to 31st December 2009 was $1,000,000.
Last year’s earnings were $900,000
Calculate the EPS at 31st December 2009 and the new EPS for 2008.
Solution
No. Shares Price Total
3 4 12
1 3 3
4 15
THERP = (15 / 4) = $3.75 so rights fraction is: 4/3.75
Date Shares Months Fraction Ave
1/01/09 900,000 6/12 4/3.75 480,000
1/07/09 1,200,000 6/12 600,000
1,080,000
December 2009 EPS = 1,000,000 / 1,080,000 = 92.59c
c
December 2008 EPS (900,000 / 900,000) 100
Inverted Bonus Fraction 3.75/4
Comparable EPS 93.75
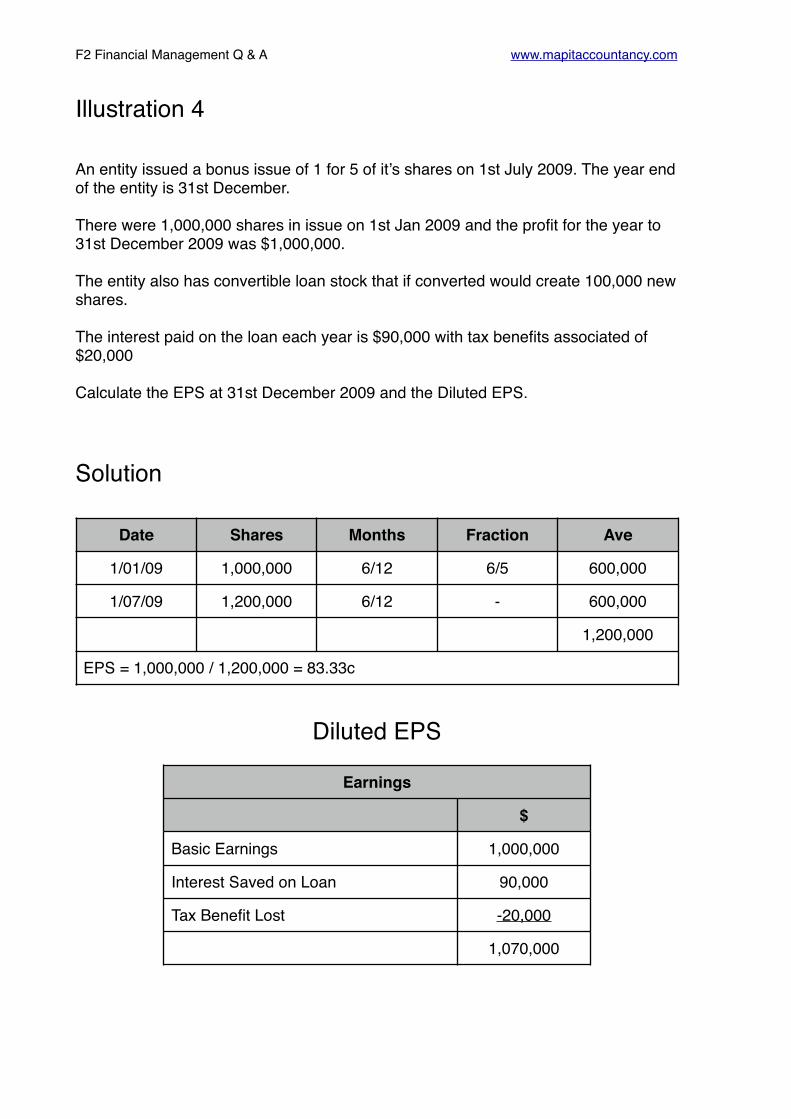
F2 Financial Management Q & A www.mapitaccountancy.com
Illustration 4
An entity issued a bonus issue of 1 for 5 of it’s shares on 1st July 2009. The year end of the entity is 31st December.
There were 1,000,000 shares in issue on 1st Jan 2009 and the profit for the year to 31st December 2009 was $1,000,000.
The entity also has convertible loan stock that if converted would create 100,000 new shares.
The interest paid on the loan each year is $90,000 with tax benefits associated of $20,000
Calculate the EPS at 31st December 2009 and the Diluted EPS.
Solution
Diluted EPS
Date Shares Months Fraction Ave
1/01/09 1,000,000 6/12 6/5 600,000
1/07/09 1,200,000 6/12 - 600,000
1,200,000
EPS = 1,000,000 / 1,200,000 = 83.33c
Earnings
$
Basic Earnings 1,000,000
Interest Saved on Loan 90,000
Tax Benefit Lost -20,000
1,070,000

F2 Financial Management Q & A www.mapitaccountancy.com
No. Shares
Basic number of shares 1,200,000
New shares created on conversion 100,000
1,300,000
Diluted EPS
Diluted Earnings 1,070,000
Diluted No. Shares 1,300,000
Diluted EPS 82.31c

F2 Financial Management Q & A www.mapitaccountancy.com
Illustration 5
An entity has a basic weighted average number of shares of 2m and earnings of $1.5m. It also has in issue 300,000 share options with an exercise price of $5. The average market value of the shares in the year was $6.
Calculate the basic EPS for the entity and the diluted EPS.
Solution
Basic EPS (1,500,000 / 2,000,000) 75c
Cash Inflow (Number of Share Options x Exercise Price)
(300,000 x $5) $1,500,000
Non Dilutive Shares (Cash Inflow / Average Market Value of Share)
(1,500,000 / $6) 250,000
Dilutive Shares (No. Options - Non Dilutive Shares)
(300,000 - 250,000) 50,000
Basic Number of Shares 2,000,000
Total Shares for diluted EPS 2,050,000
Diluted EPS (1,500,000 / 2,050,000 73.2c

F2 Financial Management Q & A www.mapitaccountancy.com
Illustration 1An asset is leased by a company on the 01/01/X0 over a 3 year period. They pay 3 annual payments of $2,500, the first of which is payable on 31/12/X0.
The actuarial interest rate is 12% (annuity rate for 3 years 2.402) and the fair value of the asset was $6,500.
Show the treatment in the lessees financial statements over the life of the asset.
Solution
Recognition of the Asset
Fair Value 6,500
PV minimum lease payments 2,500 x 2.402 6005
Recognise at lower of the two so..... 6,005
DR Asset 6,005
CR Lease Liability 6,005
Period
Opening Bal
Interest Charge(12%)DR Income Statement
CR Lease Liability
Lease PaymentDR Lease Liability
CR Cash
Closing Bal
1 6,005 721 -2,500 4,226
2 4,226 507 -2,500 2,233
3 2,233 268 -2,500 0
The asset will be depreciated over the 3 year period at (6,005 x 1/3) = 2,002

F2 Financial Management Q & A www.mapitaccountancy.com
Illustration 2An asset is leased by a company on the 01/01/X0 over a 3 year period. They pay 3 annual payments of $2,500, the first of which is payable on 31/12/X0.
The actuarial interest rate is 12% (annuity rate for 3 years 2.402) and the fair value of the asset was $6,500.
Calculate the interest payable each year over the term of the lease using the sum of digits method.
SolutionTotal Interest = Amount Payable - Asset Value
Total Interest = (2,500 x 3) - 6005 = $1,495
Sum of Digits = 3 x (3 + 1) / 2 = 6
Year Remaining / SOD Total Interest Annual Interest
1 3/6 1495 748
2 2/6 1495 498
3 1/6 1495 249

F2 Financial Management Q & A www.mapitaccountancy.com
Illustration 3A company takes out a 6 year operating lease.
They pay $1,500 deposit up front on the first day of year one and $2,000 in arrears on the last day of years 1, 2, 3, 4, 5 and 6.
How much will be recognised in the Income Statement and the SFP at the end of year 1 of the lease?
Solution
Total Amount Due Under Lease (1,500 + (2,000 x 6) 13,500
Number of Years 6
Amount to Income Statement each year (13,500 / 6) 2250
Cash Paid in Period 1 (1,500 + 2,000) 3,500
Difference between Income Statement amount and actually paid is a Prepayment (3,500 - 2,250) 1250
Income Statement Amount 2250
Prepayment on SFP 1250
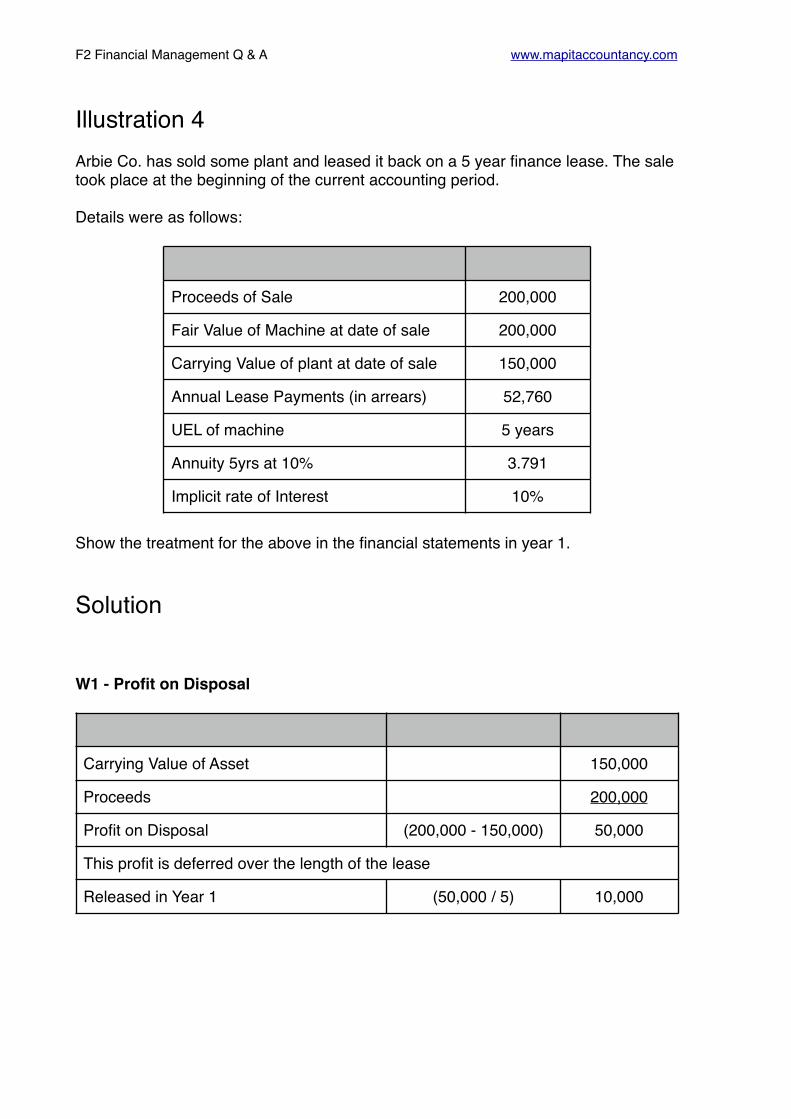
F2 Financial Management Q & A www.mapitaccountancy.com
Illustration 4Arbie Co. has sold some plant and leased it back on a 5 year finance lease. The sale took place at the beginning of the current accounting period.
Details were as follows:
Show the treatment for the above in the financial statements in year 1.
Solution
W1 - Profit on Disposal
Proceeds of Sale 200,000
Fair Value of Machine at date of sale 200,000
Carrying Value of plant at date of sale 150,000
Annual Lease Payments (in arrears) 52,760
UEL of machine 5 years
Annuity 5yrs at 10% 3.791
Implicit rate of Interest 10%
Carrying Value of Asset 150,000
Proceeds 200,000
Profit on Disposal (200,000 - 150,000) 50,000
This profit is deferred over the length of the lease
Released in Year 1 (50,000 / 5) 10,000

F2 Financial Management Q & A www.mapitaccountancy.com
W2 - Recognise New Asset
W3 - Depreciation
W4 - Lease Workings
Recognition of the Asset
Fair Value 200,000
PV minimum lease payments (52,760 x 3.791) 200,013
Recognise at lower of the two so..... 200,000
DR Asset 200,000
CR Lease Liability 200,000
Value UEL Depreciation
200,000 5 40000
Period
Opening Bal
Interest Charge(10%)DR Income Statement
CR Lease Liability
Lease PaymentDR Lease Liability
CR Cash
Closing Bal
1 200,000 20,000 -52,760 167,240
2 167,240 16,724 -52,760 131,204
3 131,204 13,120 -52,760 91,564
4 91,564 9,156 -52,760 47,961
5 47,961 4,796 -52,760 -3
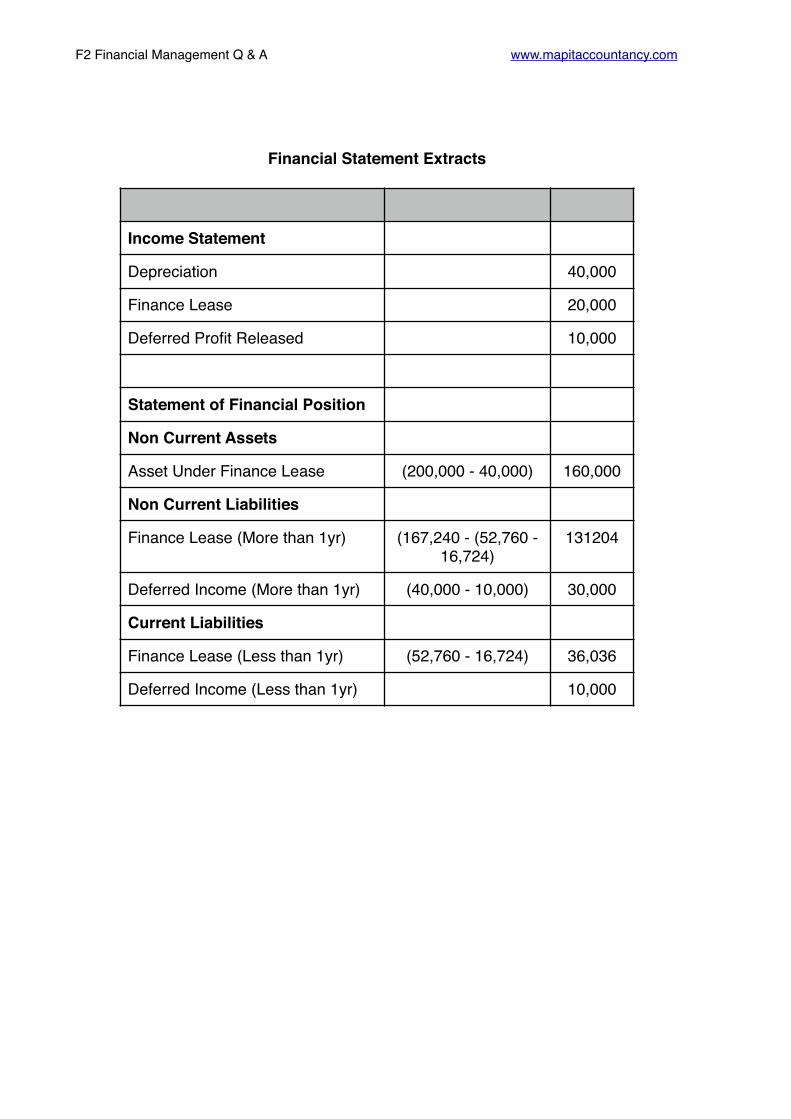
F2 Financial Management Q & A www.mapitaccountancy.com
Financial Statement Extracts
Income Statement
Depreciation 40,000
Finance Lease 20,000
Deferred Profit Released 10,000
Statement of Financial Position
Non Current Assets
Asset Under Finance Lease (200,000 - 40,000) 160,000
Non Current Liabilities
Finance Lease (More than 1yr) (167,240 - (52,760 - 16,724)
131204
Deferred Income (More than 1yr) (40,000 - 10,000) 30,000
Current Liabilities
Finance Lease (Less than 1yr) (52,760 - 16,724) 36,036
Deferred Income (Less than 1yr) 10,000

F2 Financial Management Q & A www.mapitaccountancy.com
Illustration 5
How would the following be treated in the financial statements for the next year?
Company A has sold 6 assets with the intention of leasing them back on 5 year operating leases.
Solution
Item Carrying Value
Proceeds Fair Value Annual Lease Payments
1 360 300 400 50
2 400 300 360 50
3 300 360 400 66
4 300 400 360 70
5 360 400 300 70
6 400 360 300 66
Item Carrying Value
Proceeds Fair Value Above/Below Fair
Value?
Gain/Loss
1 360 300 400 Below -60
2 400 300 360 Below -100
3 300 360 400 Below 60
4 300 400 360 Above 100
5 360 400 300 Above 40
6 400 360 300 Above -40

F2 Financial Management Q & A www.mapitaccountancy.com
Year 1 Treatment
Item
Gain/Loss Recognised
Lease Payments
1 60 loss on sale (unless lower future rentals) -60 50
2 100 loss on sale (unless 60 is for lower future rentals) -100 50
3 60 gain on sale 60 66
4 60 gain on sale; 40 to deferred income
60 + (40 /5) =68 70
5 60 impairment to income statement; 100 to deferred income
60 Impairment20 Deferred Income 70
6 100 impairment to income statement; 60 to deferred income
100 Impairment12 Deferred Income 66

F2 Financial Management Q & A www.mapitaccountancy.com
Substance Over Form
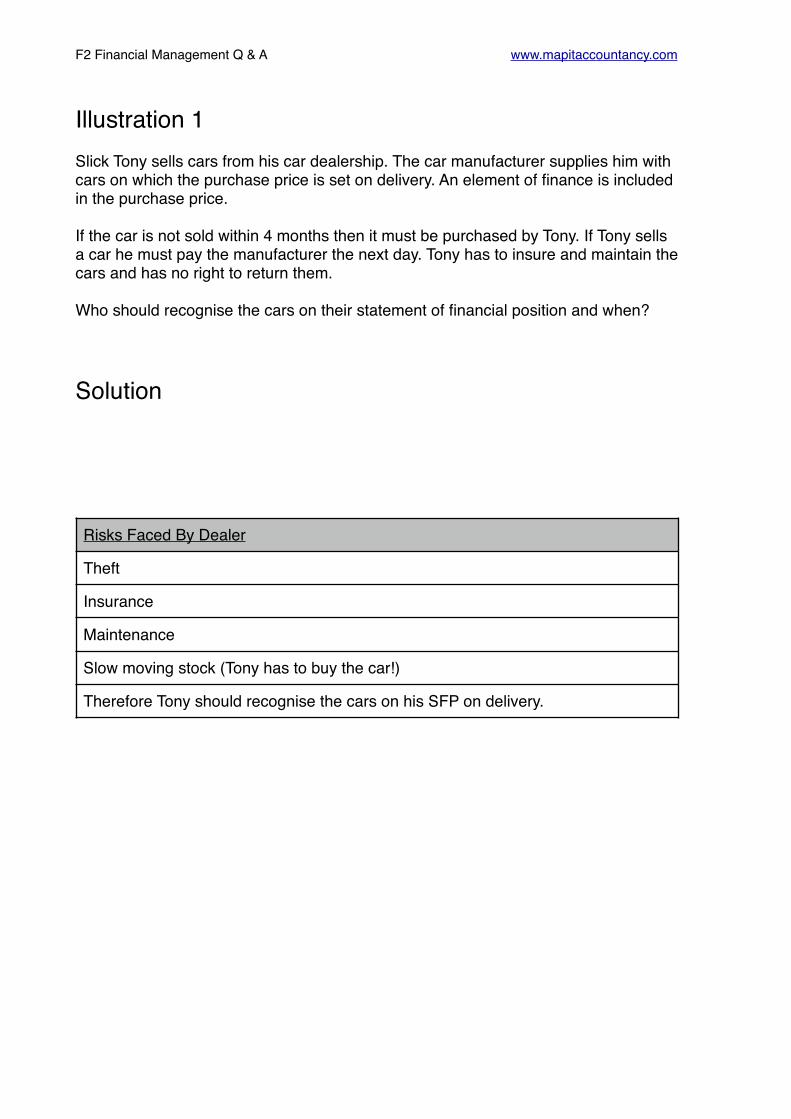
F2 Financial Management Q & A www.mapitaccountancy.com
Illustration 1Slick Tony sells cars from his car dealership. The car manufacturer supplies him with cars on which the purchase price is set on delivery. An element of finance is included in the purchase price.
If the car is not sold within 4 months then it must be purchased by Tony. If Tony sells a car he must pay the manufacturer the next day. Tony has to insure and maintain the cars and has no right to return them.
Who should recognise the cars on their statement of financial position and when?
Solution
Risks Faced By Dealer
Theft
Insurance
Maintenance
Slow moving stock (Tony has to buy the car!)
Therefore Tony should recognise the cars on his SFP on delivery.

F2 Financial Management Q & A www.mapitaccountancy.com
Illustration 2Pinky Social Club has sold it’s building to an investment company for $300,000. They have signed an agreement that they can buy back the building at any stage over the next 5 years for the original price plus interest accrued and paid at the end of the 5 years charged at an effective rate of 5%.
The building’s current market value is $500,000.
How should Pinky show this transaction in their financial statements?
Solution
The substance of this transaction is a loan secured on the building as the expectation is that Pinky would re-purchase using the negotiated option.
A loan should be recognised in the financial statements.
DR Cash 300,000
CR Loan 300,000
DR P/L Interest (300,000 x 5%) 15,000
CR Loan 15,000

F2 Financial Management Q & A www.mapitaccountancy.com
Related Parties

F2 Financial Management Q & A www.mapitaccountancy.com
Revenue Recognition

F2 Financial Management Q & A www.mapitaccountancy.com
Illustration 1ABC Co. has sold a large item of plant to CD Co. for $10m on the first day of their accounting period. They do not expect to receive payment for the plant for 24 months.
The relevant discount rate is 10% with rates:
Year Rate 1 0.909 2 0.826
How should ABC Co treat the revenue on the plant over the next 2 years?
Solution
Year 1 $
Create a discounted receivable ($10m x 0.826) 8260000
Dr Receivable 8260000
Cr Revenue 8260000
Unwind Discount ($8,260,000 x 10%) 826000
Dr Receivable 826000
Cr P/L (Interest Income) 826000
Year 2 $
Opening Balance on Receivable (8,260,000 + 826,000) 9086000
Unwind Discount ($9,086,000 x 10%) 908600
Dr Receivable 908600
Cr P/L (Interest Income) 908600
Closing Balance on Receivable (9,086,000 + 908,600) 9994600
F2 Financial Management Q & A www.mapitaccountancy.com
Illustration 2A company sells an IT system to a customer on the first day of a new accounting period.
The package includes hardware delivered immediately and a contract for support over the next 3 years with that support worth $50,000 p/a.
The total cost of the contract is paid up front and is $300,000.
How much should the company recognise as revenue from the transaction in the current year?
Solution
Split of the Contract $
Total Revenue from Goods (Hardware)
(300,000 - (50,000 x 3) 150,000
Total Revenue from Services (Support)
(50,000 x 3) 150,000
Total Revenue from the transaction 300,000
Revenue for the Period
Revenue for the Period from Goods All delivered 150,000
Revenue for the Period from Services (150,000 / 3) 50,000
Total Revenue for the Period 200,000
Deferred Income (Remainder) 100,000

F2 Financial Management Q & A www.mapitaccountancy.com
IAS 37Provisions

F2 Financial Management Q & A www.mapitaccountancy.com
Illustration 1ABC Co. does not offer warranties with the radio’s it sells to customers, however if a customer is dissatisfied with the product for any reason they provide a refund with ‘no questions asked’. This policy is generally known by customers to be the case.
Should any provision for refunds be made at the year end?
Solution
There is no legal obligation to refund customers.
However:
This looks like a constructive obligation as the customers know of the policy creating a valid expectation.
We could estimate the returns based on past experience.
There will probably be some refunds made.
Therefore a provision should be created.

F2 Financial Management Q & A www.mapitaccountancy.com
Illustration 2A company has entered into a contract to pay for specialist engineering support over the next 3 years for annual payments with a present value of £100,000. Unfortunately due to a change in the trading environment the support is no longer needed but the contract cannot be changed. The directors feel they may be able to sell the contract to another business for $50,000 but are unsure whether this is possible.
How should this be treated in the financial statements?
Solution
The onerous contract means that a provision should be recognised for the $100,000.
It would need to be assessed if the $50,000 was probable or virtually certain.
If virtually certain create an asset.
If only possible then disclose a contingent asset.
If neither then no action is required for the $50,000.
F2 Financial Management Q & A www.mapitaccountancy.com
Illustration 3A company with a year end of 30th April has decided to re-organise trading in it’s UK division closing several outlets. It made the decision on the 30th April 2010 at a board meeting where the directors decided that a detailed plan for the re-structuring would be created as soon as possible. Employees affected by the re-structuring were sent notice on the 31st May 2010.
Should a provision for re-structuring be created in the financial statements at the year ended 31 April 2010?
Solution
There is no detailed plan available at 30th April 2010.
Employees were not informed until 31st May 2010.
No constructive obligation therefore exists and no provision should be made.

F2 Financial Management Q & A www.mapitaccountancy.com
Illustration 4A company sells radios with a warranty offering instant replacement of any defective goods for the first year.
Sales in the year to date were $4,000,000 and past experience suggests that 1.7% of the radios sold will be replaced in the first year by the company.
What provision should be included in the financial statements?
Solution
A provision of (4m x 1.7%) $68,000 should be made.

F2 Financial Management Q & A www.mapitaccountancy.com
Illustration 5A power generating company has just won a contract to build a new power station at a cost of $12m. The terms of the contract state that the company is not responsible for any environmental damage caused around the site such as pollution to the local environment.
It is estimated by the company that by the end of the useful economic life of the power station in 25 years time it will cost $2m to rectify any environmental impact of the plant. The company has a very clear environmental charter that has targets for limiting environmental impact and a policy of rectifying any environmental damage caused by their operations.
The company has a cost of capital of 10%
What entries should be included in the financial statements to deal with the above in the first year?
Solution
Journal Entries
DR CR
Non Current Asset (12m + (2m x 1 / 1.125))
12,184,592
Cash 12,000,000
Environmental Provision (2m x 1 / 1.125) 184,592
Depreciation (12,184,592 / 25) 487,383
Accumulated Depreciation 487,383
Finance Cost (Unwind Discount)
(184,592 x 10%) 18,459
Environmental Provision 18,459

F2 Financial Management Q & A www.mapitaccountancy.com
Inventories & Construction Contracts

F2 Financial Management Q & A www.mapitaccountancy.com
Illustration 1
ABC Co. has the following items in inventory:
i) Goods purchased for resale at a cost of $40,000. The recent downturn in the economy has meant that these goods will now sell for $42,000 with costs to sell of $2,500.
ii)Materials purchased at a cost of $30,000 per tonne which will be sold at a profit. The manufacturer of the materials has just announced that from now on they will sell these materials to you at a lower price of $28,000 per tonne.
iii)Plant constructed for a specific customer at a cost of $50,000 and an agreed price to the customer of $60,000. New health and safety requirements mean that the plant will need to be modified at a cost to ABC Co. of $4,000 before it can be delivered to the customer.
At what value should each of the above be included in the inventory of ABC Co.
SolutionGoods at $40,000
Cost 40,000
Net Realisable Value ($42,000 - 2,500) 39,500
Use Lower so value at... 39,500
The value of inventory will be reduced by $500 and this will be written off to the income statement.
Materials at $30,000 per tonne
The fact that the manufacturer has changed the cost price is irrelevant.
The goods will be sold at a profit and thus will be valued at $30,000 per tonne cost.
Plant at $50,000
Cost 50,000
Net Realisable Value ($60,000 - 4,000) 56,000
Use Lower so value at... 50,000
The value of the inventory will remain at $50,000.

F2 Financial Management Q & A www.mapitaccountancy.com
Illustration 2
ABC Co. is building a football stadium under a construction contract.
The estimated costs to complete the stadium are $400,000.
The costs to date have been $350,000.
The total estimated revenue is $1,000,000.
It is estimated that the contract is 50% complete.
(i) What amounts of revenue, costs and profit will be recognised in the income statement?
(ii) If the expected revenue from the contract was $500,000 show the amounts of revenue, costs and profit that would be recognised in the income statement?
Solution
Expected Profit
$
Total Expected Revenue 1,000,000
Total Expected Costs (400,000 + 350,000) 750,000
Total Expected Profit 250,000
Recognised this year (250,000 x 50%) 125,000
Total Loss expected to be recognised immediately
$
Total Expected Revenue 500,000
Costs (400,000 + 350,000) 750,000
Loss -250,000

F2 Financial Management Q & A www.mapitaccountancy.com
Illustration 3
ABC Co. is building a football stadium under a construction contract.
The estimated costs to complete the stadium are $400,000.
The costs to date have been $350,000.
It is estimated that the contract is 50% complete.
The company is not able to reliably estimate the outcome of the contract but believes it will recover all costs from the customer.
What amounts of revenue, costs and profit will be recognised in the income statement?
Solution
$
Costs to date 350,000
Revenue (Costs to be recovered) 350,000
Profit 0

F2 Financial Management Q & A www.mapitaccountancy.com
Illustration 4A construction company has the following contracts in progress:
Profit is accrued on the contracts as a percentage of completion derived by comparing work certified to the total sales value.
Calculate the figures to be included in the financial statements in relation to the above contracts.
Solution
Step 1 - Calculate the expected profit on each contract
X Y Z
Costs Incurred to Date 300 200 600
Costs to complete 100 800 900
Work Certified to date 400 300 1000
Contract Price 500 600 2000
Progress billings 25 80 90
X Y Z
Costs Incurred to Date 300 200 600
Costs to complete 100 800 900
Total Costs Expected 400 1000 1500
Contract Price 500 600 2000
Profit Expected 100 -400 500

F2 Financial Management Q & A www.mapitaccountancy.com
Step 2 - Percentage completion
Step 3 - Profit to be recognised
Step 4 - Income Statement Figures
Step 5 - Bal. Sheet Figures
X Y Z
Work Certified to date 400 300 1000
Contract Price 500 600 2000
Percentage complete 80% 50% 50%
X Y Z
Profit Expected 100 -400 500
Percentage Completion 80% N/A 50%
Profit/Loss 80 -400 250
X Y Z Total
Sales (Work Certified)
400 300 1000 1700
Costs (Bal. Fig) 320 700 750 1770
Profit/Loss 80 -400 250 -70
X Y Z
Costs Incurred to Date 300 200 600
Profit Recognised 80 0 250
Loss Recognised 0 -400 0
Less:Progress Billings -25 -80 -90
Balance 355 -280 760
Total Asset (355 + 760) 1115
Total Liability 280

F2 Financial Management Q & A www.mapitaccountancy.com
Illustration 5On 1 October 2009 Mocca entered into a construction contract that was expected to take 27 months and therefore be completed on 31 December 2011.
Details of the contract are:$’000
Agreed contract price 12,500 Estimated total cost of contract (excluding plant) 5,500
Plant for use on the contract was purchased on 1 January 2010 (three months into the contract as it was not required at the start) at a cost of $8 million. The plant has a four-year life and after two years, when the contract is complete, it will be transferred to another contract at its carrying amount. Annual depreciation is calculated using the straight-line method (assuming a nil residual value) and charged to the contract on a monthly basis at 1/12 of the annual charge.
The correctly reported income statement results for the contract for the year ended 31 March 2010 were:
$‘000Revenue recognised 3,500Contract expenses recognised (2,680)Profit recognised 840
Details of the progress of the contract at 31 March 2011 are:$’000
Contract costs incurred to date (excluding depreciation) 4,800Agreed value of work completed and billed to date 8,125Total cash received to date (payments on account) 7,725
The percentage of completion is calculated as the agreed value of work completed as a percentage of the agreed contract price.
Required:
Calculate the amounts which would appear in the income statement and statement of financial position of Mocca, including the disclosure note of amounts due to/from customers, for the year ended/as at 31 March 2011 in respect of the above contract.
(10 marks)
F2 Financial Management Q & A www.mapitaccountancy.com
Solution
Percentage Completion
Value of Work Completed to date 8,125
Contract Value 12,500
Percentage Completion (8,125 / 12,500) 65%
Expected Total Profit
Total Costs Expected 5,500
Depreciation (8/48 x 24) 4000
Total Costs 9,500
Total Revenue 12,500
Expected Total Profit (12,500 - 9,500) 3,000
Recognise to date (3,000 x 65%) 1,950
Recognised Last Year 840
Recognise this year (1,950 - 840) 1,110
Note to accounts showing amounts due to/from customers
Costs incurred to date From Question 4,800
Dep’n (8,000/48 x 15) 2500
Total 7300
Profit Recognised to Date 1,950
Progress Billings -8,125
Amount Due from Customers 1,125

F2 Financial Management Q & A www.mapitaccountancy.com
Income Statement Extracts
Revenue (12,500 x 65%) - 3,500 4,625
Costs (9,500 x 65%) - 2,660 3,515
Gross Profit Recognised 1,110
SFP Extracts
Non Current Asset (8,000 - 2,500) 5500
Receivables (8,125 - 7,725) 400
Amounts due from customers 1,125

F2 Financial Management Q & A www.mapitaccountancy.com
IAS 12Deferred Tax

F2 Financial Management Q & A www.mapitaccountancy.com
Illustration 1An entity has profit before tax of $1,000 in it’s financial statements in each of years 1, 2, 3 and 4.
Tax allowances are allowed on an item of plant purchased for $1,000 at the start of year 1 over 3 years straight line.
The company charges depreciation on the asset at a rate of 25% straight line.
The tax rate is 30%
Solution
Net Book Value in FInancial Statements
Year 1 2 3 4
Cost 1,000 1,000 1,000 1,000
Depreciation 250 250 250 250
Accumulated Depreciation 250 500 750 1,000
Net Book Value 750 500 250 0
Tax Base
Year 1 2 3 4
Cost 1,000 1,000 1,000 1,000
WDAs 333 333 333 0
Total WDAs 333 667 1,000 1,000
Net Book Value 667 333 0 0

F2 Financial Management Q & A www.mapitaccountancy.com
Compare
Year 1 2 3 4
Financial Statements NBV 750 500 250 0
Tax Base 667 333 0 0
Difference (More Asset) 83 167 250 0
Deferred Tax Liability (30%) on SFP
25 50 75 0
Movement to I/S in yearDR Income Statement Tax Chg.CR Deferred Tax Liability...or opposite to reduce...
25 25 25 -75
Tax Computation
Year 1 2 3 4
Profit Before Tax 1,000 1,000 1,000 1,000
Add Back Depreciation 250 250 250 250
WDAs -333 -333 -333
Taxable Profit 917 917 917 1,250
Tax at 30% 275 275 275 375

F2 Financial Management Q & A www.mapitaccountancy.com
Income Statement Comparison
Ignoring Deferred Tax
Year 1 2 3 4 Total
Profit Before Tax 1,000 1,000 1,000 1,000 4,000
Tax (W1) 275 275 275 375 1,200
Profit After Tax 725 725 725 625 2,800
With Deferred Tax
Profit Before Tax 1,000 1,000 1,000 1,000 4,000
Tax (W1) 275 275 275 375 1,200
Deferred Tax 25 25 25 -75 0
Profit After Tax 700 700 700 700 2,800

F2 Financial Management Q & A www.mapitaccountancy.com
Illustration 2At the year end ABC Co. has non current assets that have a carrying amount of $2,000,000 but a tax base of $1,400,000.
There is currently a deferred tax liability carried forward of $250,000 and the tax rate is 30%.
Tax for the year has been estimated as $500,000.
Show the treatment for deferred tax in the period and the effect this has on the financial statements.
Solution
Carrying Value of Asset 2,000,000
Tax Base 1,400,000
Difference (More Asset) 600,000
Deferred Tax Liability Required (600,000 x 30%) 180,000
Current Deferred Tax Liability 250,000
Movement Required -70,000
Treatment DR CR
Deferred Tax Liability (To reduce) 70,000
Income Statement (Income Tax Charge) 70,000
Amounts in Financial Statements
Income Statement Tax Charge (500,000 - 70,000) 430,000
Deferred Tax Liability 180,000
Income Tax Due 500,000

F2 Financial Management Q & A www.mapitaccountancy.com
Interpretation of Financial Statements

F2 Financial Management Q & A www.mapitaccountancy.com
Illustration 1
All sales are made on credit.
Required:
Calculate the Inventory, Receivables and Payables days for Inter Ltd. in each of the 2 years
2011 2010
ASSETS $‘000 $‘000
Non Current Assets 1000 1000
Inventory 300 400
Receivables 200 300
Cash 300 200
1800 1900
LIABILITIES
Ordinary Shares 800 800
Reserves 200 100
Long term Liabilities 700 900
Payables 100 100
Overdraft -
1800 1900
$‘000 $‘000
Revenue 1000 1200
COS 800 1100
Gross Profit 200 100
Other Costs 100 90
Net Profit 100 10

F2 Financial Management Q & A www.mapitaccountancy.com
Solution
Item Working 2011 Working 2010
Inventory Period 300/800 x 365
137 400/1100 x 365
133
Collection Period 200/1000 x 365
73 300/1200 x 365
92
Less:
Payables Period 100/800 x 365
46 100/1100 x 365
34
164 259
F2 Financial Management Q & A www.mapitaccountancy.com
Illustration 2
X1 X2 X3
Non Current Assets 500 700 1000
Current Assets 150 200 300
650 900 1300
Ordinary Shares ($1) 300 300 300
Reserves 100 280 430
Loan Notes 150 200 300
Payables 100 120 270
650 900 1300
Revenue 3000 3500 4200
COS 2000 2400 3200
Gross Profit 1000 1100 1000
Admin Costs 300 350 400
Distribution Costs 200 250 300
PBIT 500 500 300
Interest 100 150 220
Tax 120 90 50
Profit After Tax 280 260 30
Dividends 100 110 30
Retained Earnings 180 150 0
Share Price $3.30 $4.00 $2.20

F2 Financial Management Q & A www.mapitaccountancy.com
Using the information on the previous page calculate and comment on the following Ratios:
I. Return on Capital EmployedII. Return on EquityIII. Gross MarginIV. Net MarginV. Operating MarginVI. Revenue GrowthVII. GearingVIII. Interest CoverIX. Dividend CoverX. Dividend YieldXI. P/E Ratio
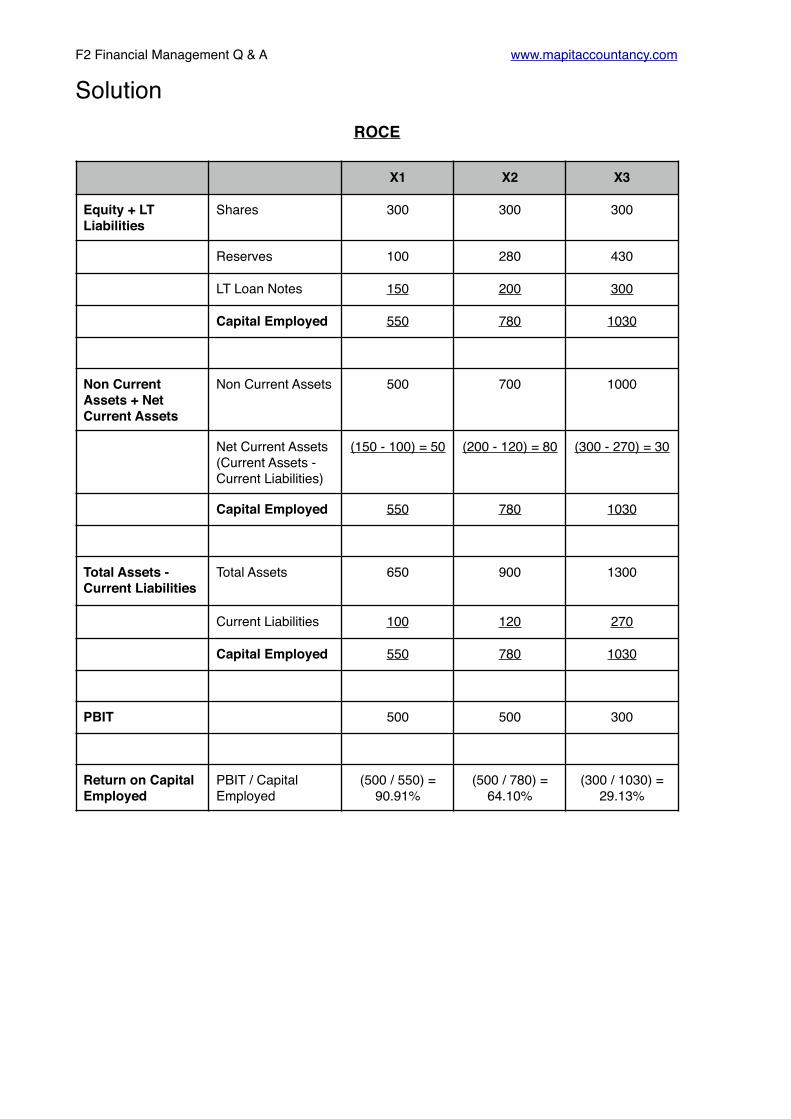
F2 Financial Management Q & A www.mapitaccountancy.com
SolutionROCE
X1 X2 X3
Equity + LT Liabilities
Shares 300 300 300
Reserves 100 280 430
LT Loan Notes 150 200 300
Capital Employed 550 780 1030
Non Current Assets + Net Current Assets
Non Current Assets 500 700 1000
Net Current Assets (Current Assets - Current Liabilities)
(150 - 100) = 50 (200 - 120) = 80 (300 - 270) = 30
Capital Employed 550 780 1030
Total Assets - Current Liabilities
Total Assets 650 900 1300
Current Liabilities 100 120 270
Capital Employed 550 780 1030
PBIT 500 500 300
Return on Capital Employed
PBIT / Capital Employed
(500 / 550) = 90.91%
(500 / 780) = 64.10%
(300 / 1030) = 29.13%

F2 Financial Management Q & A www.mapitaccountancy.com
ROE
X1 X2 X3
Return on Capital Employed (ROCE) 90.91% 64.1% 29.13%
In the first year the ROCE was 90.91%. At first glance this would appear to be a good return, however without industry averages or prior period information we are unable to tell if this is the case.
In year X2 the ROCE is 64.10%. This is a fall of 29.5% from the previous year indicating that the business in not able to make the same return on it’s assets that it has previously been able to do.
In the year X3 the ROCE is 29.13%. This is a fall of 54.55% indicating that there may be some serious underlying problems which are affecting the ability of the business to generate the return on capital previously generated.
X1 X2 X3
Profit After Tax 280 260 300
Ordinary Shares 300 300 300
Reserves 100 280 430
Total 400 580 730
Return on Equity (PAT / Ord Shares + Reserves)
(280 / 400) = 70%
(260 / 580) = 44.8%
(300 / 730) = 41%
In the first year the ROE was 70%. At first glance this would appear to be a good return, however without industry averages or prior period information we are unable to tell if this is the case.
In year X2 the ROE is 44.8%. This is a fall of 36% from the previous year indicating that the business in not able to make the same return on the shareholders funds that it has previously been able to do.
In the year X3 the ROE is 41%. This is a fall of 8.4% indicating that the business may be having difficulty generating the returns it was able to do previously.

F2 Financial Management Q & A www.mapitaccountancy.com
Margins
X1 X2 X3
Revenue 3000 3500 4200
Gross Profit 1000 1100 1000
PAT 280 260 30
PBIT 500 500 300
Gross Margin (Gross Profit / Revenue) (1000 / 3000) = 33.33%
(1100 / 3500) = 31.42%
(1000 / 4200) = 23.89%
Net Margin (PAT / Revenue) (280 / 3000) = 9.3%
(260 / 3500) = 7.4%
(30 / 4200) = 0.7%
Operating Margin (PBIT / Revenue) (500 / 3000) = 16.66%
(500 / 3500) = 14.28%
(300 / 4200) = 7.1%
The Gross Margin is 33.33% in X1 and holds reasonably steady in X2 at 31.42%. However in X3 the Gross Margin falls to 23.89% indicating that the business has either had to cut prices to sell the greater volume it has, or the cost of it’s purchases have gone up.
The Net Margin is 9.3% in X1 but begins to fall in X2 with 7.4% achieved, before falling dramatically to 0.7% in X3. The main reason for this is the fall in Gross Profit as other costs have risen in line with expectations given the increase in sales. However another point to note is that interest costs have risen with the increase in long term loans. The extra interest costs have put pressure on the business.
The Operating Margin dropped slightly in X2 to 14.28% from 16.66% the previous year - a fall of almost 15%. In X3 the Operating Margin fell away to 7.1%, a decrease of over 50%. This is due to the decreasing Gross Margin achieved as well as rises in the other expenses.
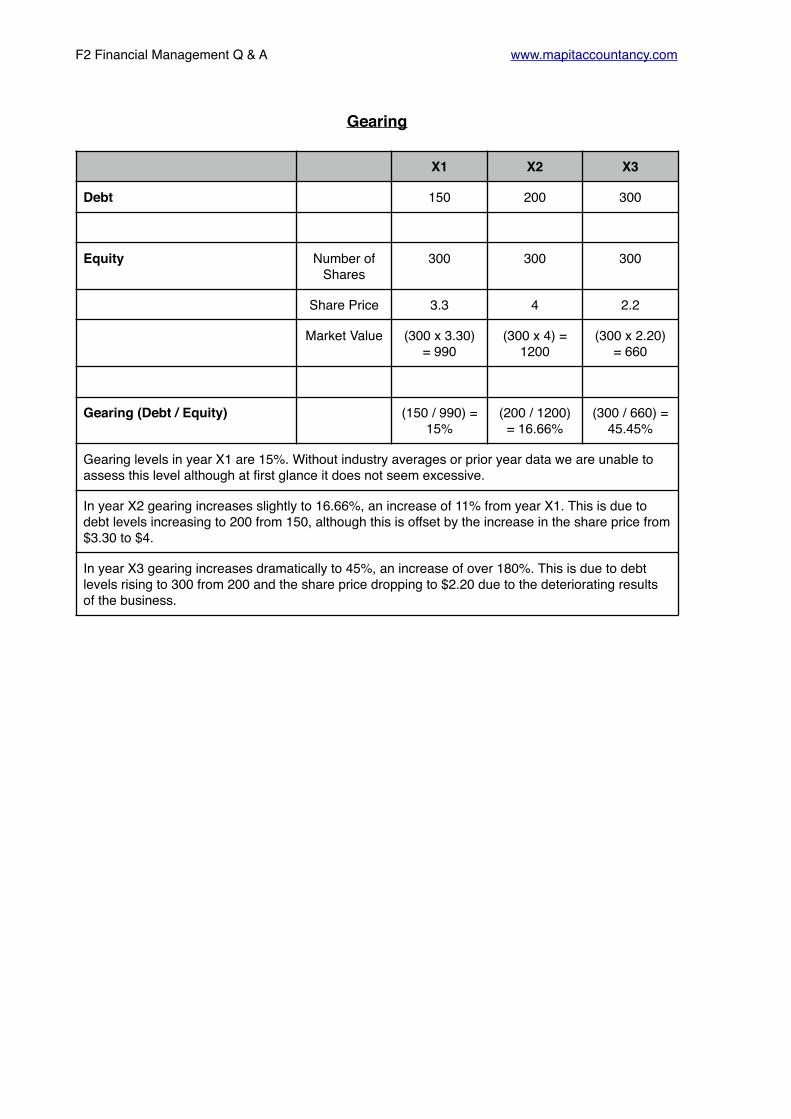
F2 Financial Management Q & A www.mapitaccountancy.com
Gearing
X1 X2 X3
Debt 150 200 300
Equity Number of Shares
300 300 300
Share Price 3.3 4 2.2
Market Value (300 x 3.30) = 990
(300 x 4) = 1200
(300 x 2.20) = 660
Gearing (Debt / Equity) (150 / 990) = 15%
(200 / 1200) = 16.66%
(300 / 660) = 45.45%
Gearing levels in year X1 are 15%. Without industry averages or prior year data we are unable to assess this level although at first glance it does not seem excessive.
In year X2 gearing increases slightly to 16.66%, an increase of 11% from year X1. This is due to debt levels increasing to 200 from 150, although this is offset by the increase in the share price from $3.30 to $4.
In year X3 gearing increases dramatically to 45%, an increase of over 180%. This is due to debt levels rising to 300 from 200 and the share price dropping to $2.20 due to the deteriorating results of the business.
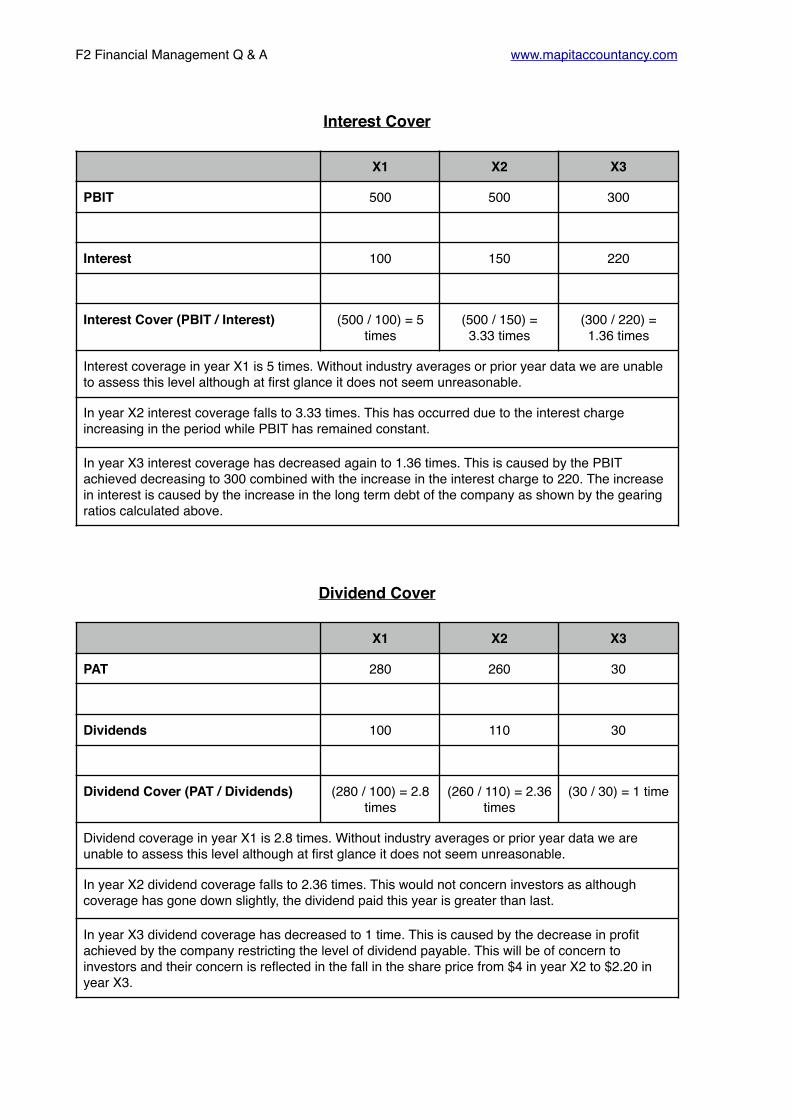
F2 Financial Management Q & A www.mapitaccountancy.com
Interest Cover
Dividend Cover
X1 X2 X3
PBIT 500 500 300
Interest 100 150 220
Interest Cover (PBIT / Interest) (500 / 100) = 5 times
(500 / 150) = 3.33 times
(300 / 220) = 1.36 times
Interest coverage in year X1 is 5 times. Without industry averages or prior year data we are unable to assess this level although at first glance it does not seem unreasonable.
In year X2 interest coverage falls to 3.33 times. This has occurred due to the interest charge increasing in the period while PBIT has remained constant.
In year X3 interest coverage has decreased again to 1.36 times. This is caused by the PBIT achieved decreasing to 300 combined with the increase in the interest charge to 220. The increase in interest is caused by the increase in the long term debt of the company as shown by the gearing ratios calculated above.
X1 X2 X3
PAT 280 260 30
Dividends 100 110 30
Dividend Cover (PAT / Dividends) (280 / 100) = 2.8 times
(260 / 110) = 2.36 times
(30 / 30) = 1 time
Dividend coverage in year X1 is 2.8 times. Without industry averages or prior year data we are unable to assess this level although at first glance it does not seem unreasonable.
In year X2 dividend coverage falls to 2.36 times. This would not concern investors as although coverage has gone down slightly, the dividend paid this year is greater than last.
In year X3 dividend coverage has decreased to 1 time. This is caused by the decrease in profit achieved by the company restricting the level of dividend payable. This will be of concern to investors and their concern is reflected in the fall in the share price from $4 in year X2 to $2.20 in year X3.
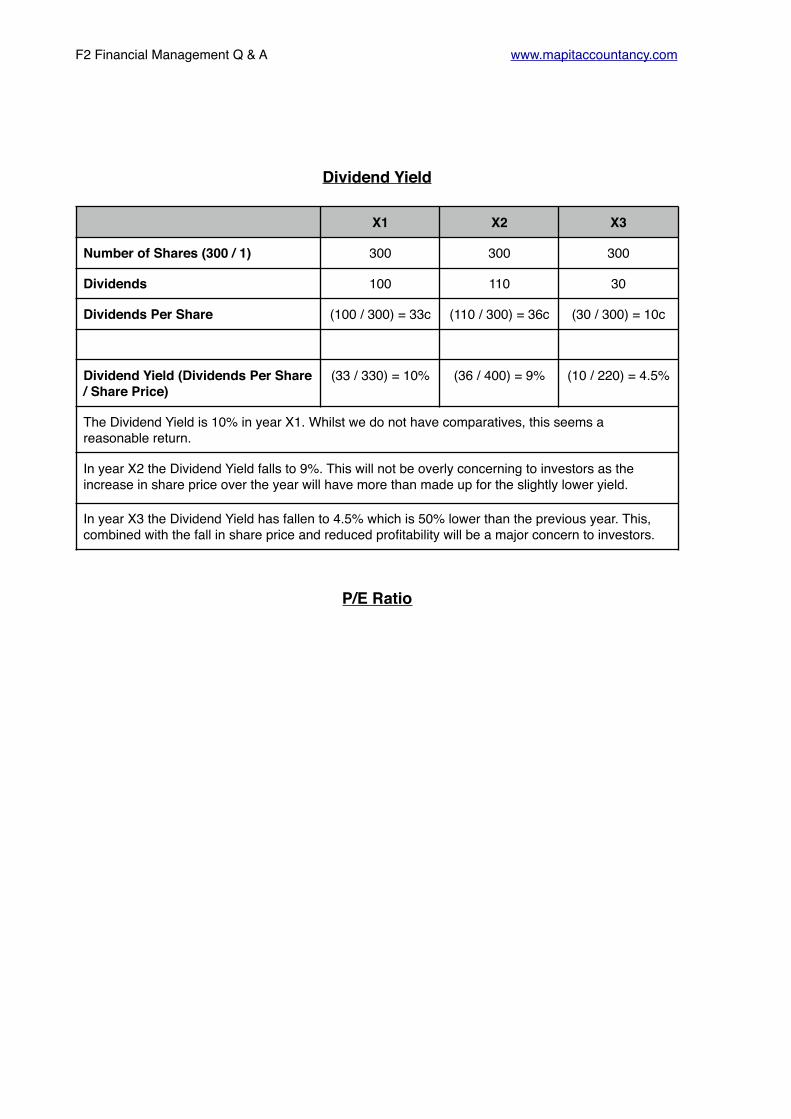
F2 Financial Management Q & A www.mapitaccountancy.com
Dividend Yield
P/E Ratio
X1 X2 X3
Number of Shares (300 / 1) 300 300 300
Dividends 100 110 30
Dividends Per Share (100 / 300) = 33c (110 / 300) = 36c (30 / 300) = 10c
Dividend Yield (Dividends Per Share / Share Price)
(33 / 330) = 10% (36 / 400) = 9% (10 / 220) = 4.5%
The Dividend Yield is 10% in year X1. Whilst we do not have comparatives, this seems a reasonable return.
In year X2 the Dividend Yield falls to 9%. This will not be overly concerning to investors as the increase in share price over the year will have more than made up for the slightly lower yield.
In year X3 the Dividend Yield has fallen to 4.5% which is 50% lower than the previous year. This, combined with the fall in share price and reduced profitability will be a major concern to investors.

F2 Financial Management Q & A www.mapitaccountancy.com
X1 X2 X3
Share Price $3.30 $4 $2.20
Profit After Tax 280 260 30
No. Ordinary Shares 300 300 300
EPS (280 / 300) = 93c (260 / 300) = 86c (30 / 300) = 10c
P/E Ratio (Share Price / EPS) (330 / 93) = 3.54 (400 / 86) = 4.65 (220 / 10) = 22
The P/E Ratio in year X1 is 3.54. We do not have industry comparatives or prior year information with which to compare this.
In year X2 the P/E Ratio increases to 4.65. This indicates that the market expectations for this share have risen since X1 and that investors are now willing to pay 4.65 times what the business earns in a year to own the share.
In year X4 the P/E ratio has increased dramatically to 22. This is unusual as the earnings have decreased to 12% of the previous year. The share price has fallen to reflect this, but not by as much as would be expected. This may indicate that the market feels that the results in year X3 were perhaps a one-off and that next years results will improve.
F2 Financial Management Q & A www.mapitaccountancy.com
Cash Flow Statements I

F2 Financial Management Q & A www.mapitaccountancy.com
Illustration 1An entity has the following results in their financial statements:
2011 2010
ASSETS $‘000 $‘000
Non Current Assets 1000 1000
Inventory 300 400
Receivables 200 300
Cash 300 200
1800 1900
LIABILITIES
Ordinary Shares 800 800
Reserves 200 199
Long term Liabilities 700 801
Payables 100 100
1800 1900
$‘000 $‘000
Revenue 1000 1200
COS 800 1100
Gross Profit 200 100
Profit on Sale of Non Current Asset 30 0
Other Costs 70 90
PBIT 100 10
Interest Cost 10 7
PBT 90 3
Tax 30 2
PAT 60 1
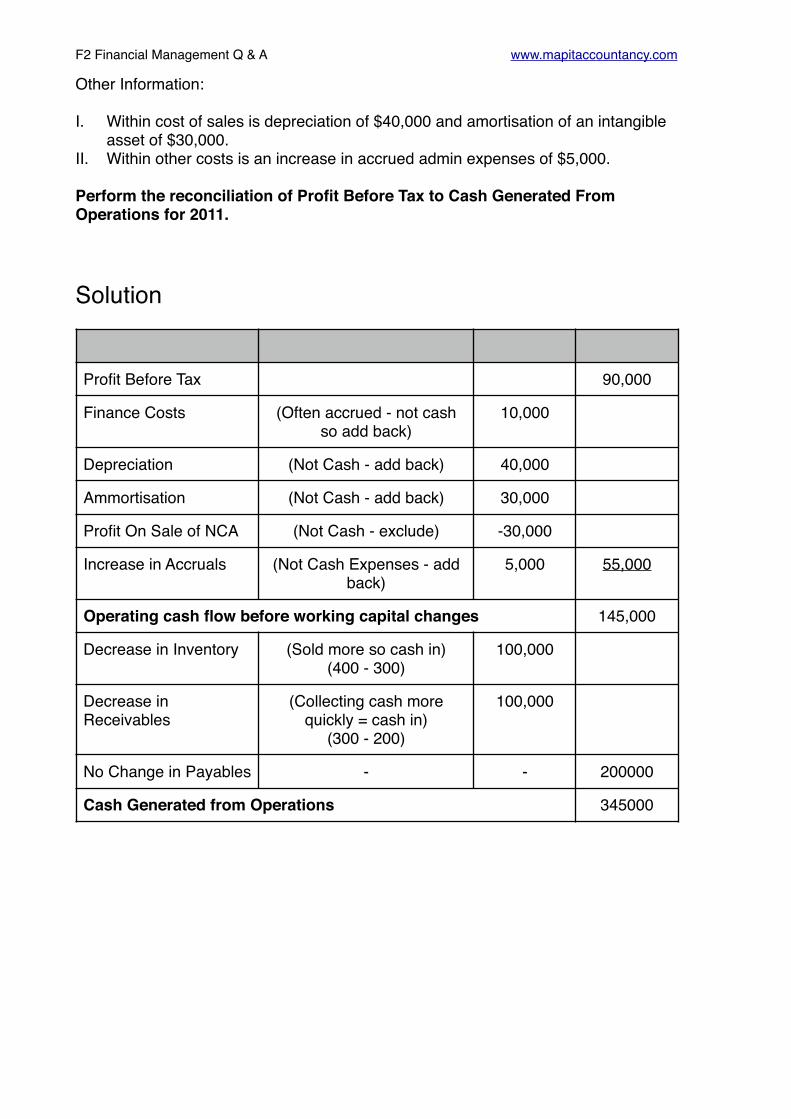
F2 Financial Management Q & A www.mapitaccountancy.com
Other Information:
I. Within cost of sales is depreciation of $40,000 and amortisation of an intangible asset of $30,000.
II. Within other costs is an increase in accrued admin expenses of $5,000.
Perform the reconciliation of Profit Before Tax to Cash Generated From Operations for 2011.
Solution
Profit Before Tax 90,000
Finance Costs (Often accrued - not cash so add back)
10,000
Depreciation (Not Cash - add back) 40,000
Ammortisation (Not Cash - add back) 30,000
Profit On Sale of NCA (Not Cash - exclude) -30,000
Increase in Accruals (Not Cash Expenses - add back)
5,000 55,000
Operating cash flow before working capital changes 145,000
Decrease in Inventory (Sold more so cash in)(400 - 300)
100,000
Decrease in Receivables
(Collecting cash more quickly = cash in)
(300 - 200)
100,000
No Change in Payables - - 200000
Cash Generated from Operations 345000

F2 Financial Management Q & A www.mapitaccountancy.com
Illustration 2An entity has the following information in their financial statements:
Other information:
I. The entity disposed of a piece of plant during the year with a carrying value of $300 for a profit of $50.
II. Intangible assets are made up of qualifying development expenditure on a product currently being sold, with amortisation in 2011 of $100.
What cash flows will appear in the statement of cash flows for the entity in the year 2011?
Solution
2011 2010
PPE 2,000 1,100
Intangible Assets 500 400
Property Plant & Equipment
Opening Balance 1,100
Closing Balance -2,000
Disposal (Remove Carrying Amount) -300
Balance -1200
This difference needs to increase the amount of PPE from 800 to 2000 to balance the account so must be additions - A CASH FLOW
We have also sold some PPE & so received cash.The amount received will be the carrying value plus the profit made.
(300 + 50) 350

F2 Financial Management Q & A www.mapitaccountancy.com
Intangible Assets
Opening Balance 400
Closing Balance -500
Amortisation (Reduces the balance) -100
Balance -200
This difference needs to increase the amount of Intangible Asset by 200 to balance the account so must be development expenditure - A CASH FLOW

F2 Financial Management Q & A www.mapitaccountancy.com
Illustration 3
Statement of Financial Position 2011 2010
Non Current Assets
PPE (note (i)) 32,600 24,100
Financial Assets (note (ii)) 4,500 7,000
37,100 31,100
Current Assets
Inventory 10,200 7,200
Receivables 3,500 3,700
Bank 1,400
13,700 12,300
Total Assets 50,800 43,400
Equity & Liabilities
Ordinary Shares of $1 (note (iii)) 14,000 8,000
Share Premium (note (iii)) 2,000
Revaluation Reserve (note (iii)) 2,000 3,600
Retained Earnings 13,000 10,100
Non Current Liabilities
Finance Lease Obligations 7,000 6,900
Deferred Tax 1,300 900
Current Liabilities
Tax 1,000 1,200
Bank Overdraft 2,900
Prov’n for warranties (note (iv)) 1,600 4,000
Finance Lease Obligations 4,800 2,100
Trade Payables 3,200 4,600
Total Equity & Liabilities 50,800 43,400
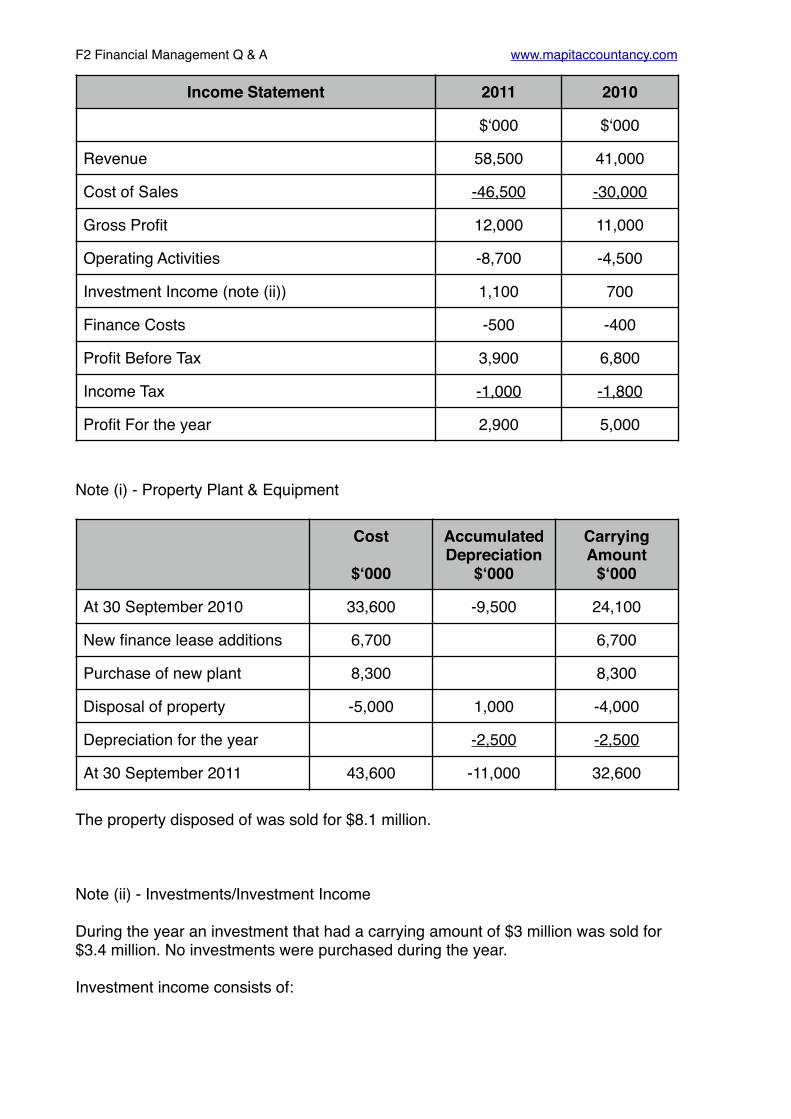
F2 Financial Management Q & A www.mapitaccountancy.com
Note (i) - Property Plant & Equipment
The property disposed of was sold for $8.1 million.
Note (ii) - Investments/Investment Income
During the year an investment that had a carrying amount of $3 million was sold for $3.4 million. No investments were purchased during the year.
Investment income consists of:
Income Statement 2011 2010
$‘000 $‘000
Revenue 58,500 41,000
Cost of Sales -46,500 -30,000
Gross Profit 12,000 11,000
Operating Activities -8,700 -4,500
Investment Income (note (ii)) 1,100 700
Finance Costs -500 -400
Profit Before Tax 3,900 6,800
Income Tax -1,000 -1,800
Profit For the year 2,900 5,000
Cost
$‘000
Accumulated Depreciation
$‘000
Carrying Amount
$‘000
At 30 September 2010 33,600 -9,500 24,100
New finance lease additions 6,700 6,700
Purchase of new plant 8,300 8,300
Disposal of property -5,000 1,000 -4,000
Depreciation for the year -2,500 -2,500
At 30 September 2011 43,600 -11,000 32,600
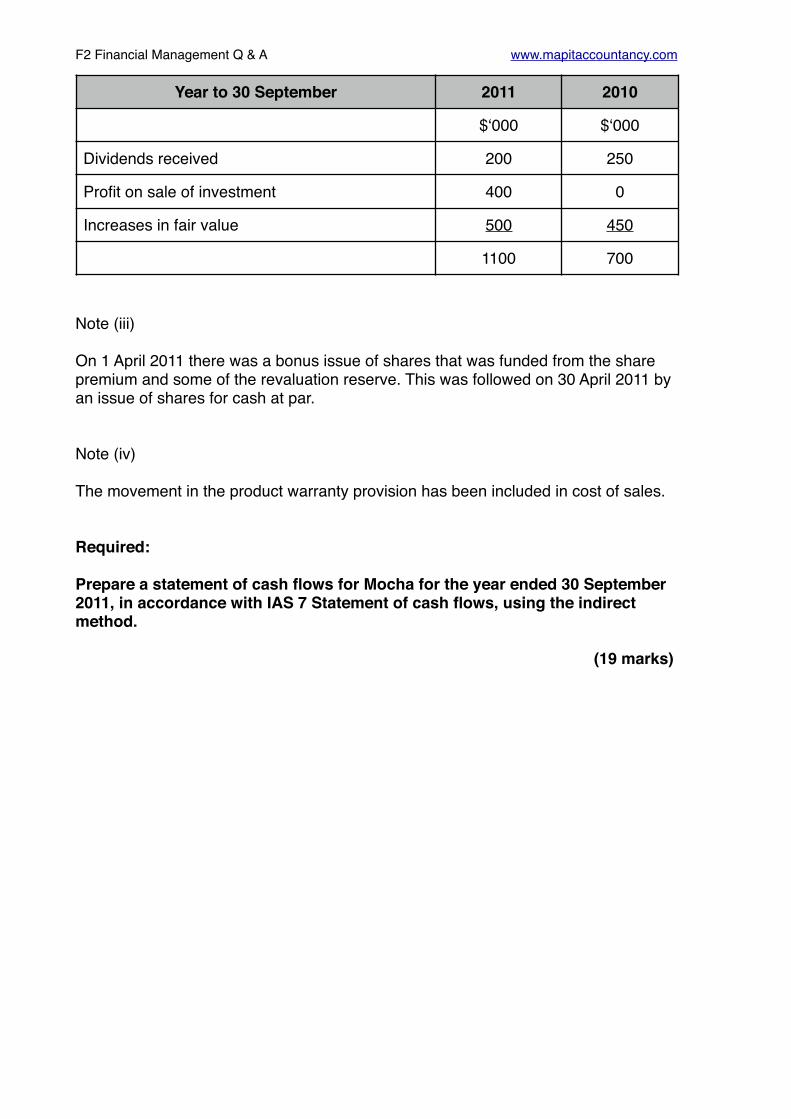
F2 Financial Management Q & A www.mapitaccountancy.com
Note (iii)
On 1 April 2011 there was a bonus issue of shares that was funded from the share premium and some of the revaluation reserve. This was followed on 30 April 2011 by an issue of shares for cash at par.
Note (iv)
The movement in the product warranty provision has been included in cost of sales.
Required:
Prepare a statement of cash flows for Mocha for the year ended 30 September 2011, in accordance with IAS 7 Statement of cash flows, using the indirect method.
(19 marks)
Year to 30 September 2011 2010
$‘000 $‘000
Dividends received 200 250
Profit on sale of investment 400 0
Increases in fair value 500 450
1100 700

F2 Financial Management Q & A www.mapitaccountancy.com
SolutionW1 - Financial Assets
W2 - Shares Issued
W3 - Finance Leases
Financial Assets
Opening Balance 7,000
Closing Balance -4,500
Sale of Asset -3,000
Increase in Fair Value 500
Total 0
No Cash flows to deal with in Financial Assets
Ordinary Shares of $1 (note (iii)) 8,000
Share Premium (note (iii)) 2,000
Revaluation Reserve (note (iii)) 3,600
Ordinary Shares of $1 (note (iii)) -14,000
Share Premium (note (iii)) 0
Revaluation Reserve (note (iii)) -2,000
Balance -2400
The difference is the shares issued for cash in the year which is a cash flow
Opening Balance (Current Leases) 2,100
Opening Balance (Non Current Leases) 6,900
Closing Balance (Current Leases) -4,800
Closing Balance (Non Current Leases) -7,000
New Leases in Year 6,700
Balance 3,900
The difference is the leases REPAID in the year which is a cash flow

F2 Financial Management Q & A www.mapitaccountancy.com
W4 - Income Tax
Opening Balance (Income Tax) 1,200
Opening Balance (Deferred Tax) 900
Closing Balance (Income Tax) -1,000
Closing Balance (Deferred Tax) -1,300
Income Statement Charge (Increase tax due) 1000
Balance 800
The difference is the tax PAID in the year which is a cash flow

F2 Financial Management Q & A www.mapitaccountancy.com
$‘000 $’000
Profit Before Tax 3,900
Finance Costs 500
Finance Income -1,100
Depreciation Note (i) 2,500
Profit On Sale of NCA (8,100 - 4,000) -4,100
Increase in Warranty Provision
(4,000 - 1,600) -2,400 -4600
Operating cash flow before working capital changes -700
Increase in Inventory (10,200 - 7,200) -3,000
Decrease in Receivables (3,700 - 3,500) 200
Decrease in Payables (4,600 - 1,600) -1,400 -4200
Cash Generated from Operations -4900
Interest Paid -500
Income Tax Paid (W4) -800
Net Cash Deficit from operating activities -6200
Cash flows from investing activities
Purchase of Property Plant & Equipment -8,300
Disposal of Property Plant & Equipment 8,100
Disposal of Investment 3,400
Dividends Received 200
Net cash from investing activities 3400
Cash flows from financing activities
Shares Issued (W2) 2,400
Payment of Finance Lease obligations (W3) -3,900
Net cash from financing activities -1,500
Net decrease in cash and cash equivalents -4300
Cash and cash equivalents brought forward 1,400
Cash and cash equivalents carried forward -2900

F2 Financial Management Q & A www.mapitaccountancy.com
Cash Flow Statements II

F2 Financial Management Q & A www.mapitaccountancy.com
Illustration 1The group financial statements for Nasser Ltd. show the following information:
What was the dividend paid to the NCI in the year X1?
Solution
X1 X0
NCI on Statement of Financial Position 820 700
NCI share of Profit after Tax 220 130
NCI
Opening Balance 700
Closing Balance -820
Share of Profit 220
Total 100
Dividend to NCI was $100 = CASH OUTFLOW

F2 Financial Management Q & A www.mapitaccountancy.com
Illustration 2Indigo Ltd, took up a 40% holding in Violet Ltg. for consideration of $120 in 20X1. The group financial statements for Indigo Ltd. show the following information:
What amounts will be included in the group cash flow statement in the year X1?
Solution
X1 X0
Post tax Income from Associate (Income Statement)
50 0
Investment in Associate (SFP) 150 0
Loan to Associate 20 0
Associate
Opening Balance 0
Closing Balance -150
Purchase of Associate 120
Share of Profit 50
Total 20
Dividend Received from Associate was 20
Amounts for cash flow statement $
Income from Associate (Remove from profit before tax) -50
Consideration Paid (Cash paid out) -120
Dividend Received from associate 20
Loan to Associate 0 - 20 -20

F2 Financial Management Q & A www.mapitaccountancy.com
Illustration 3Extracts from the group SFP of Express Ltd are outlined below:
During the period Express Ltd purchased 75% of Delivery Ltd. At the date of acquisition the fair value of the following assets and liabilities were determined:
Show the movements in cash for the 4 items outlined above.
Solution
X1 X0
Property Plant & Equipment 50,600 44,050
Inventory 33,500 28,700
Receivables 27,130 26,300
Trade Payables 33,340 32,810
Property Plant & Equipment 4,200
Inventory 1,650
Receivables 1,300
Payables 1,950
PPE INV REC PAY
Opening Balance 44,050 28,700 26,300 32,810
Closing Balance -50,600 -33,500 -27,130 -33,340
Purchase sub 4,200 1,650 1,300 1,950
Total -2,350 -3,150 470 1,420
OUT OUT IN OUT

F2 Financial Management Q & A www.mapitaccountancy.com
Illustration 4Using the information in illustration 3 show the movements in cash if Express Ltd. Had already owned the subsidiary and sold it during the period.
Solution
PPE INV REC PAY
Opening Balance 44,050 28,700 26,300 32,810
Closing Balance -50,600 -33,500 -27,130 -33,340
Sale sub -4,200 -1,650 -1,300 -1,950
Total -10,750 -6,450 -2,130 -2,480
OUT OUT OUT IN

F2 Financial Management Q & A www.mapitaccountancy.com
Illustration 5A Group has a foreign subsidiary which had the following FX Gains & Losses on translation into the Group presentational currency:
The Balances on these accounts in the Group Financial Statements were:
Depreciation in the period was $25m.
Show the cash flows arising from the above information to be included in the Group Statement of Cash-flows.
Solution
$m
PPE 30
Inventory 5
Receivables 18
Payables (7)
2011 2010
PPE 335 240
Inventory 70 50
Receivables 72 40
Payables -35 -25
PPE INV REC PAY
Opening Balance 240 50 40 25
Closing Balance -335 -70 -72 -35
FX Differences 30 5 18 7
Dep’n -25
Total -90 -15 -14 -3
OUT OUT OUT IN

F2 Financial Management Q & A www.mapitaccountancy.com
Illustration 6Consolidated Financial Statements for Group.
Group Income Statement $m
Revenue 4,000
COS -2,200
Gross Profit 1,800
Other Expenses -789
Profit from operations 1011
Gain on sale of sub (Note i) 50
Finance cost (Note ii) -200
PBT 861
Tax -180
Profit after tax 681
Foreign Currency Translations 62
Total Comprehensive Income 743
Attributable to Parent 600
Attributable to NCI 143
Group Statement of Changes in Equity $m
Balance B/F 3,307
Profit Attributable to Parent 600
Dividends Paid -240
Issue of Shares 1000
Balance C/F 4667
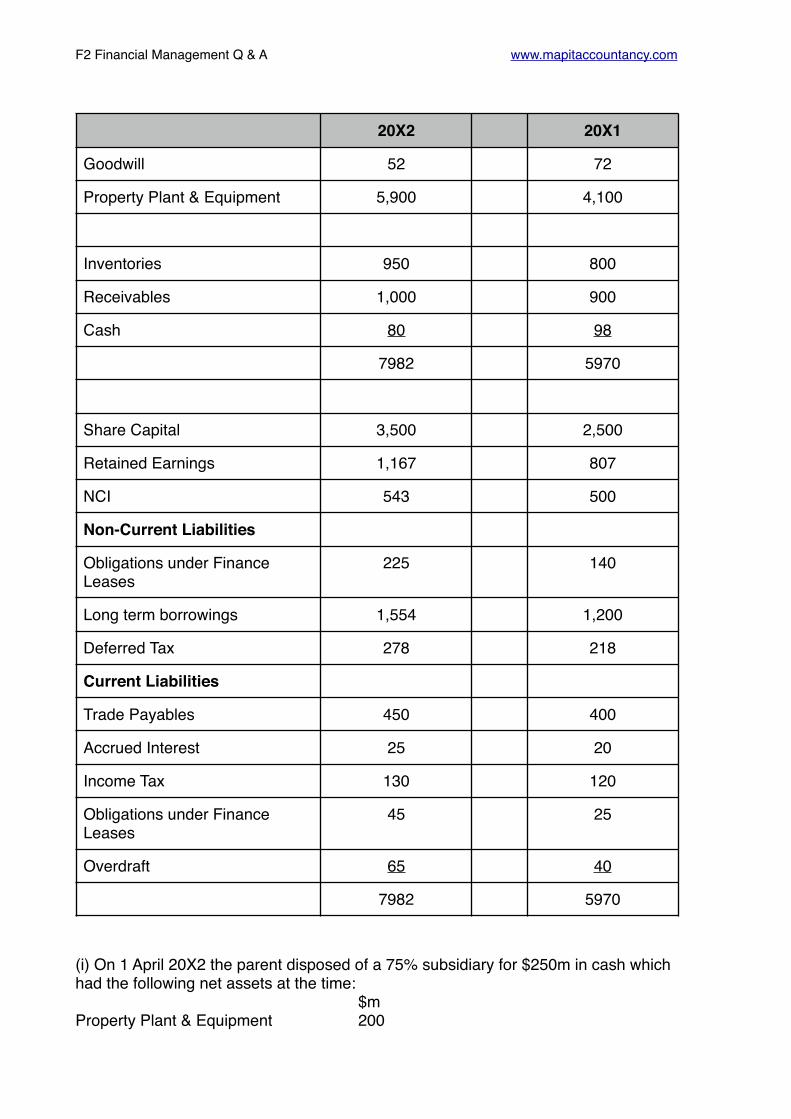
F2 Financial Management Q & A www.mapitaccountancy.com
(i) On 1 April 20X2 the parent disposed of a 75% subsidiary for $250m in cash which had the following net assets at the time:
$mProperty Plant & Equipment 200
20X2 20X1
Goodwill 52 72
Property Plant & Equipment 5,900 4,100
Inventories 950 800
Receivables 1,000 900
Cash 80 98
7982 5970
Share Capital 3,500 2,500
Retained Earnings 1,167 807
NCI 543 500
Non-Current Liabilities
Obligations under Finance Leases
225 140
Long term borrowings 1,554 1,200
Deferred Tax 278 218
Current Liabilities
Trade Payables 450 400
Accrued Interest 25 20
Income Tax 130 120
Obligations under Finance Leases
45 25
Overdraft 65 40
7982 5970

F2 Financial Management Q & A www.mapitaccountancy.com
Inventory 100Receivables 110Cash 10Payables (80)Income Tax (25)Interest bearing borrowings (75)
240
The subsidiary had been purchased several years ago for a cash payment of $110m when it’s net assets had been $120m.
(ii) Goodwill is measured using the proportionate method
(iii)The following currency differences occurred
The exchange losses on borrowings relate to foreign loans taken out to finance investments in subsidiaries. The accounts assistant has offset these against the retranslation of the net investments in the subsidiaries. The exchange gain on retranslation of the income statement (from average rate for the year to the closing rate) relates to operating profit excluding depreciation.
(iv) Depreciation for the year was $320m and the group disposed of PPE with a net book value of $190m for cash of $198m. the profit on this disposal has been credited to ‘Other operating expenses’.
The group entered into a significant number of new finance leases in the period of which $250m related to additions to property, plant & equipment.
Prepare the consolidated cash flow statement for the period.
Total $m
Parent Share $m
On retranslation of net assets:
Property Plant & Equipment 25 20
Inventories 20 15
Receivables 20 16
Payables -9 -6
56 45
Retranslation of Profit for period 16 12
Offset exchange losses on borrowings (see below)
-10 -10
62 47

F2 Financial Management Q & A www.mapitaccountancy.com
Solution
W1 - Goodwill
W2 - PPE
Goodwill in Disposal Subsidiary $m
Cost of Investment 110
Net assets acquired 120 x 75% -90
Goodwill 20
Goodwill
Opening Balance 72
Closing Balance -52
Disposal -20
Total 0
PPE
Opening Balance 4,100
Closing Balance -5,900
Disposal of Sub -200
Other Disposals (Note iv) -190
Exchange Differences (Note iii) 25
Additions on Finance Leases (Note iv) 250
Depreciation -320
Total -2235
Difference is Additions - CASH OUT

F2 Financial Management Q & A www.mapitaccountancy.com
W3 - Working Capital Movements
W4 - Share Capital
W5 - NCI
Inventories Receivables Payables
O’Bal 800 900 400
Cl’Bal -950 -1,000 -450
Sub -100 -110 -80
FX 20 20 9
Movement -230 -190 -121
CASH OUT OUT IN
Net Movement OUT 299
Opening Balance 2,500
Closing Balance -3,500
Total -1,000
Shares of 1,000 issued = CASH IN
Opening Balance 500
Closing Balance -543
Share of Profit 143
Disposal of Sub (240 x 25%) -60
Total 40
Dividend to NCI was 40 = CASH OUTFLOW

F2 Financial Management Q & A www.mapitaccountancy.com
W6 - Finance Leases
W7 - Long Term Borrowings
Opening Balance (Current Leases) 25
Opening Balance (Non Current Leases) 140
Closing Balance (Current Leases) -45
Closing Balance (Non Current Leases) -225
New Leases in Year 250
Balance 145
The difference is the leases REPAID in the year which is a cash flow
Opening Balance 1,200
Closing Balance -1,554
Disposal of Sub -75
Exchange Loss 10
Total -419
New Borrowings therefore of 419 - CASH IN
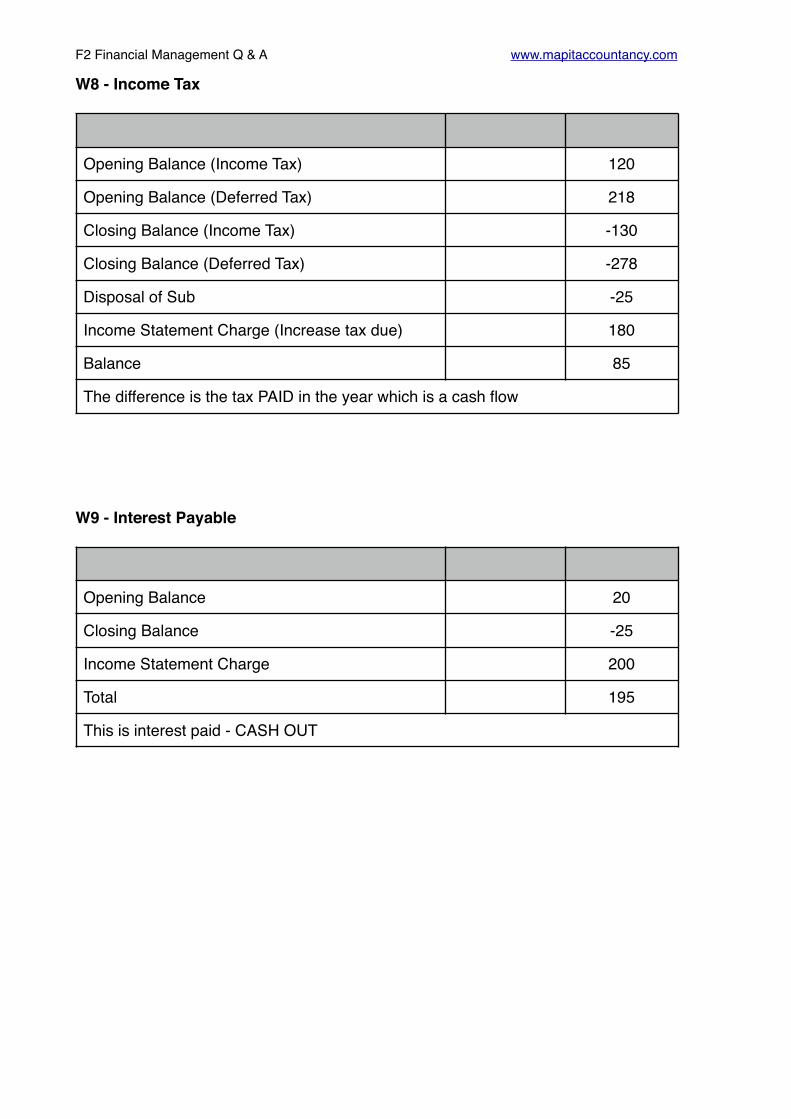
F2 Financial Management Q & A www.mapitaccountancy.com
W8 - Income Tax
W9 - Interest Payable
Opening Balance (Income Tax) 120
Opening Balance (Deferred Tax) 218
Closing Balance (Income Tax) -130
Closing Balance (Deferred Tax) -278
Disposal of Sub -25
Income Statement Charge (Increase tax due) 180
Balance 85
The difference is the tax PAID in the year which is a cash flow
Opening Balance 20
Closing Balance -25
Income Statement Charge 200
Total 195
This is interest paid - CASH OUT
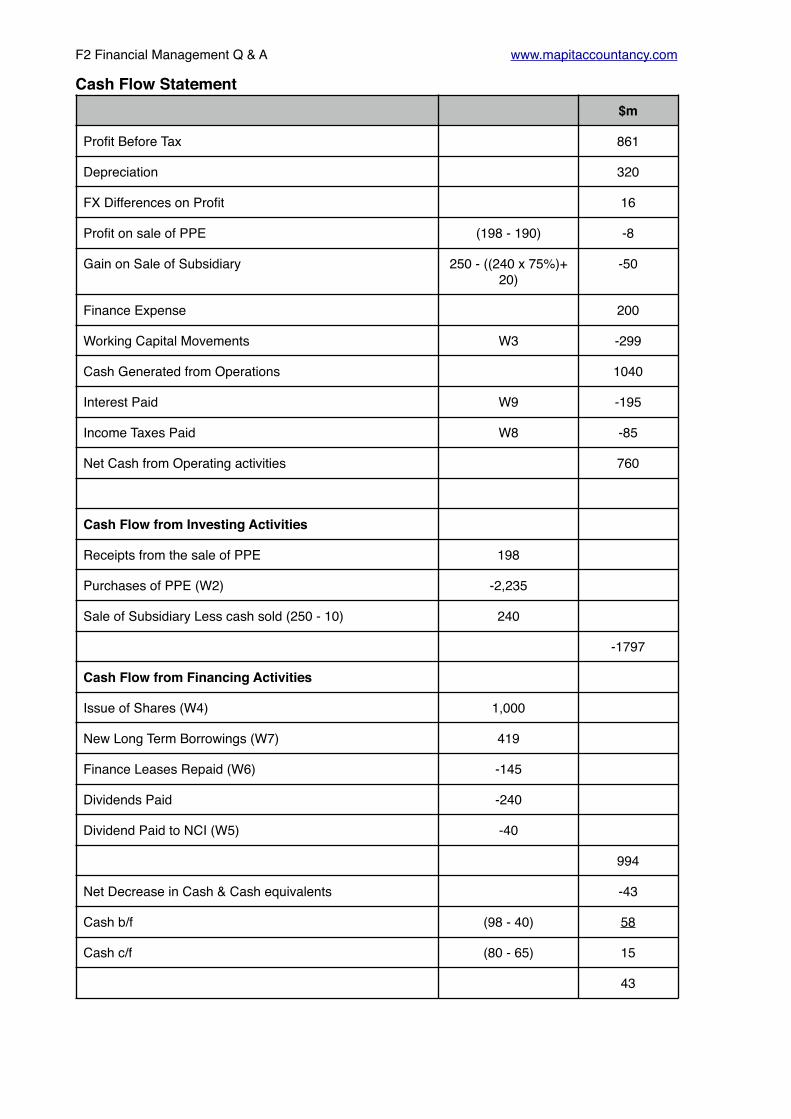
F2 Financial Management Q & A www.mapitaccountancy.com
Cash Flow Statement$m
Profit Before Tax 861
Depreciation 320
FX Differences on Profit 16
Profit on sale of PPE (198 - 190) -8
Gain on Sale of Subsidiary 250 - ((240 x 75%)+ 20)
-50
Finance Expense 200
Working Capital Movements W3 -299
Cash Generated from Operations 1040
Interest Paid W9 -195
Income Taxes Paid W8 -85
Net Cash from Operating activities 760
Cash Flow from Investing Activities
Receipts from the sale of PPE 198
Purchases of PPE (W2) -2,235
Sale of Subsidiary Less cash sold (250 - 10) 240
-1797
Cash Flow from Financing Activities
Issue of Shares (W4) 1,000
New Long Term Borrowings (W7) 419
Finance Leases Repaid (W6) -145
Dividends Paid -240
Dividend Paid to NCI (W5) -40
994
Net Decrease in Cash & Cash equivalents -43
Cash b/f (98 - 40) 58
Cash c/f (80 - 65) 15
43

F2 Financial Management Q & A www.mapitaccountancy.com
Sources of Finance I

F2 Financial Management Q & A www.mapitaccountancy.com
Illustration 1
XYZ Ltd. intends to raise capital via a rights issue.
The current share price is $8.
They are offering a 1 for 4 issue at a price of $6.
Calculate the Theoretical Ex-rights Price.
Solution
Number of Shares Share Price Total
4 $8 (4 x $8) = 32
1 $6 (1 x $6) = 6
5 38
We now have 5 shares in issue at total value of $38 so the THERP is (38 / 5) = $7.60

F2 Financial Management Q & A www.mapitaccountancy.com
Illustration 2
ABC Ltd. has decided to raise capital via a rights issue.
The share price is currently $5.50 and ABC intends to raise $5m.
There are currently 6.25m shares in issue and ABC is offering a 1 for 5 rights issue.
Calculate the Theoretical Ex-Rights Price.
Solution
Amount of Capital to raise $5m
No. of shares issued (6.25m / 5) 1.25m
Share issue price ($5m / 1.25m) $4
Number of Shares Share Price Total
5 $5.50 (5 x 5.50) = 27.5
1 $4 (1 x 4) = 4
6 31.5
We now have 6 shares in issue at total value of $31.5 so the THERP is (31.5 / 6) = $5.25

F2 Financial Management Q & A www.mapitaccountancy.com
Sources of Finance II
F2 Financial Management Q & A www.mapitaccountancy.com
Weighted Average Cost of Capital
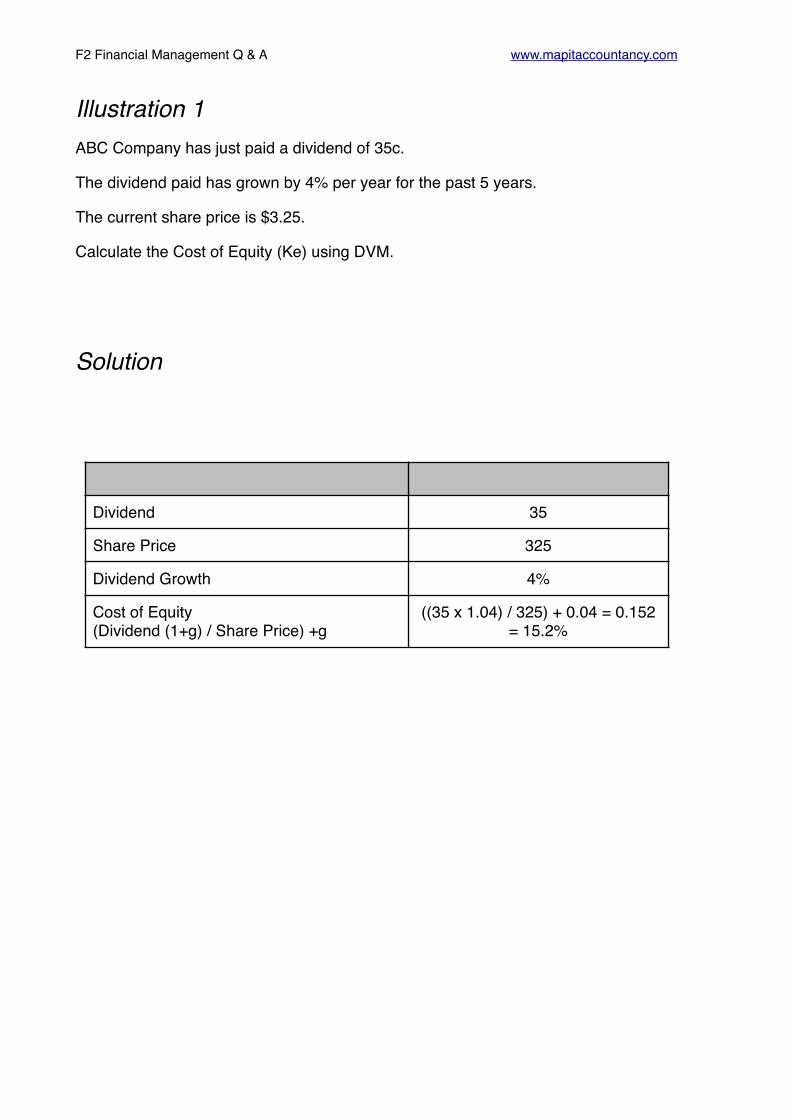
F2 Financial Management Q & A www.mapitaccountancy.com
Illustration 1ABC Company has just paid a dividend of 35c.
The dividend paid has grown by 4% per year for the past 5 years.
The current share price is $3.25.
Calculate the Cost of Equity (Ke) using DVM.
Solution
Dividend 35
Share Price 325
Dividend Growth 4%
Cost of Equity (Dividend (1+g) / Share Price) +g
((35 x 1.04) / 325) + 0.04 = 0.152= 15.2%

F2 Financial Management Q & A www.mapitaccountancy.com
Illustration 2ABC Company has just paid a dividend of 35c.
The ROE in recent years has been 10% and the dividend retention rate is 60%.
The current share price is $3.25.
Calculate the Cost of Equity (Ke) using DVM.
Solution
Dividend 35
Share Price 325
Dividend Growth (g = r x b) (0.1 x 0.6) 6%
Cost of Equity (Dividend (1+g) / Share Price) +g
((35 x 1.06) / 325) + 0.06 = 0.1741
= 17.41%
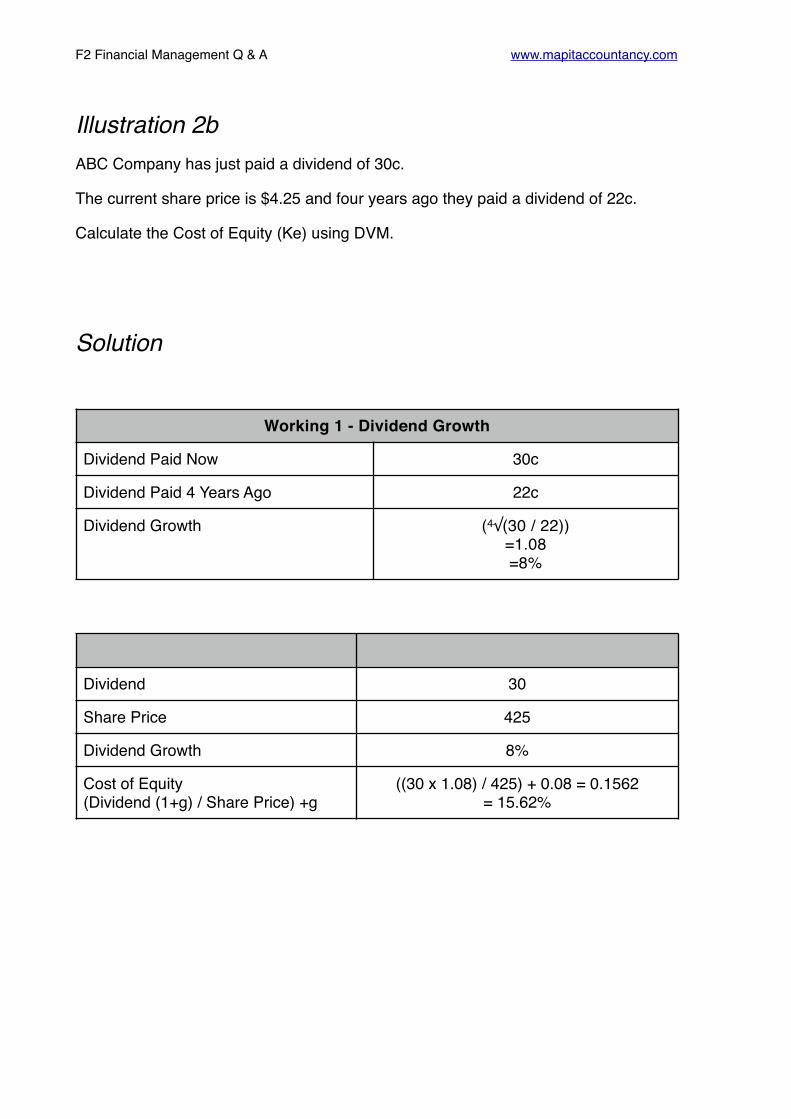
F2 Financial Management Q & A www.mapitaccountancy.com
Illustration 2bABC Company has just paid a dividend of 30c.
The current share price is $4.25 and four years ago they paid a dividend of 22c.
Calculate the Cost of Equity (Ke) using DVM.
Solution
Working 1 - Dividend Growth
Dividend Paid Now 30c
Dividend Paid 4 Years Ago 22c
Dividend Growth (4√(30 / 22))=1.08=8%
Dividend 30
Share Price 425
Dividend Growth 8%
Cost of Equity (Dividend (1+g) / Share Price) +g
((30 x 1.08) / 425) + 0.08 = 0.1562= 15.62%

F2 Financial Management Q & A www.mapitaccountancy.com
Illustration 3A company has a bank loan of $2m at an interest rate of 10%.
The tax rate is 30%.
Calculate the cost of debt (Kd).
Solution
Interest Rate before Tax 10
Tax Rate 30%
After Tax Cost of Debt (10 x (1 - 0.3)) 7%

F2 Financial Management Q & A www.mapitaccountancy.com
Illustration 4A company has issued 10% irredeemable debt.
The market value of the debt is $90.
The tax rate is 30%
Calculate the cost of debt (Kd).
Solution
Interest paid (Per $100 nominal) $10
Tax Rate 30%
After tax interest (Amount Paid (1 - t)) $10 x (1 - 0.30) = $7
Market Value of Debt (Per $100 nominal) $90
Cost of Debt (After tax interest / Market Value of Debt)
(7 / 90) = 7.7%

F2 Financial Management Q & A www.mapitaccountancy.com
Illustration 5A Company has issued debt which is redeemable in 5 years time.
Interest is payable at 8%.
The current market value of the debt is $102.
Ignore taxation.
Calculate the Cost of Debt (Kd).
Solution
Period
Item $ DR 5% PV DR 15% PV
1 -5 Interest 8 4.329 34.63 3.352 26.82
5 Capital 100 0.784 78.40 0.497 49.70
Market Value -102 -102
11.03 -25.48
IRR Calculation: 5 + (11.03 / (11.03 - (25.48)) (15 - 5) = 8.02%

F2 Financial Management Q & A www.mapitaccountancy.com
Illustration 6A Company has issued debt which is redeemable in 5 years time.
Interest is payable at 10%.
The current market value of the debt is $104.
Tax is payable at 30%.
Calculate the Cost of Debt (Kd).
Solution
Period
Item $ DR 5% PV DR 15% PV
1 -5 Interest (10 x (1 - 0.3)
7 4.329 30.30 3.352 23.46
5 Capital 100 0.784 78.40 0.497 49.70
Market Value -104 -104
4.70 -30.84
IRR Calculation: 5 + (4.7 / (4.7 - (30.84)) (15 - 5) = 6.32%

F2 Financial Management Q & A www.mapitaccountancy.com
Illustration 7A Company has issued debt which is convertible in 5 years time.
Interest is payable at 10%.
The current market value of the debt is $120.
On conversion, investors will have a choice of either:
I. Cash at a 15% premium; or
II. 18 shares per loan note.
The current share price is $6 and it is expected to grow in value by 4% per year.
Tax is payable at 30%.
Calculate the Cost of Debt (Kd).
Solution
Working 1 - Cash or Convert?
Working
Cash (15% Premium) 100 x 1.15 $115
Shares
Current Value $6
Value in 5 years with 4% growth
6 x (1.04 to the power of 5)
$7.30
Number of shares per $100
18
Conversion Value 7.30 x 18 $131.40
The conversion value is higher than the cash so the investors will choose to convert.
Do an IRR the same as for redeemable but filling $131.40 into the capital repaid
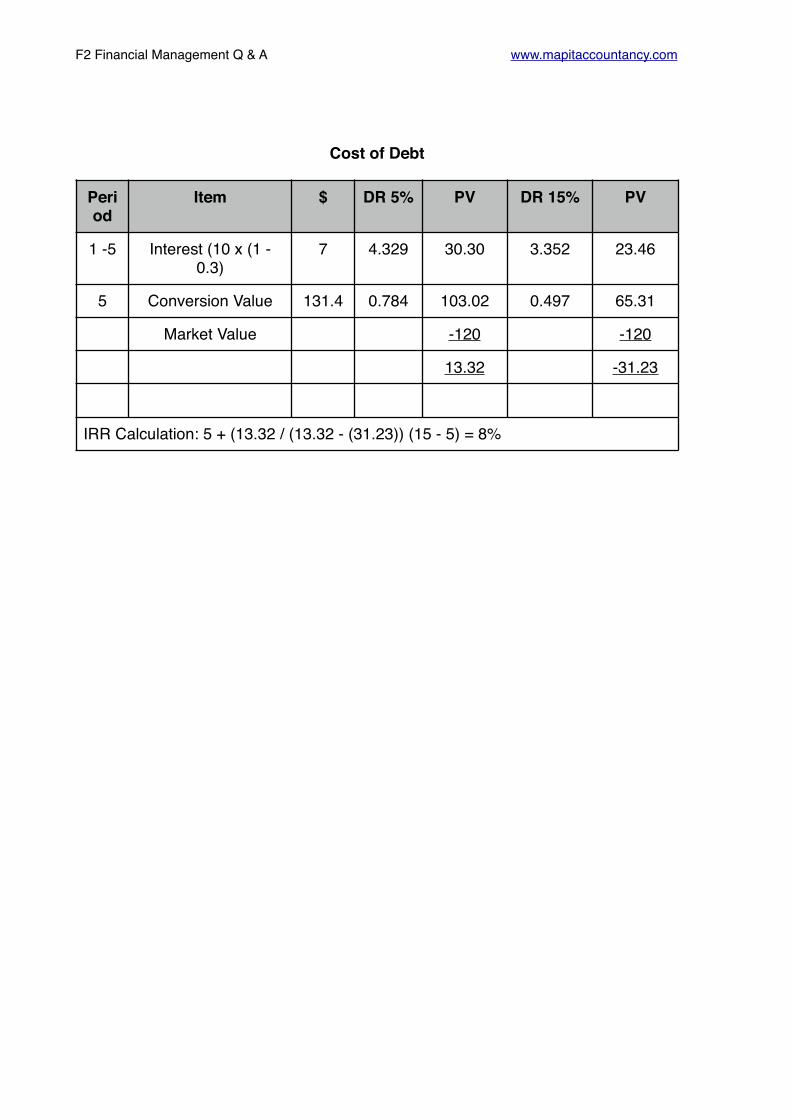
F2 Financial Management Q & A www.mapitaccountancy.com
Cost of Debt
Period
Item $ DR 5% PV DR 15% PV
1 -5 Interest (10 x (1 - 0.3)
7 4.329 30.30 3.352 23.46
5 Conversion Value 131.4 0.784 103.02 0.497 65.31
Market Value -120 -120
13.32 -31.23
IRR Calculation: 5 + (13.32 / (13.32 - (31.23)) (15 - 5) = 8%

F2 Financial Management Q & A www.mapitaccountancy.com
Illustration 8Company A is funded as follows:
Calculate the Weighted Average Cost of Capital.
Solution
Item Capital Structure Cost
Equity 85% 15%
Debt 15% 7%
Item Capital Structure Cost Ave
Equity 85% 15 12.75
Debt 15% 7 1.05
WACC 13.8

F2 Financial Management Q & A www.mapitaccountancy.com
Illustration 9Company A is funded as follows:
Balance Sheet Extract
The cost to the company of each of the above items has been calculated as:
The Loan notes are currently trading at $94.
The current share price is $1.50
Calculate the Weighted Average Cost of Capital.
Ordinary Shares (50c) 3000
Loan Notes 2000
Bank Loan 1000
Ordinary Shares 13%
Loan Notes 8%
Bank Loan 5%
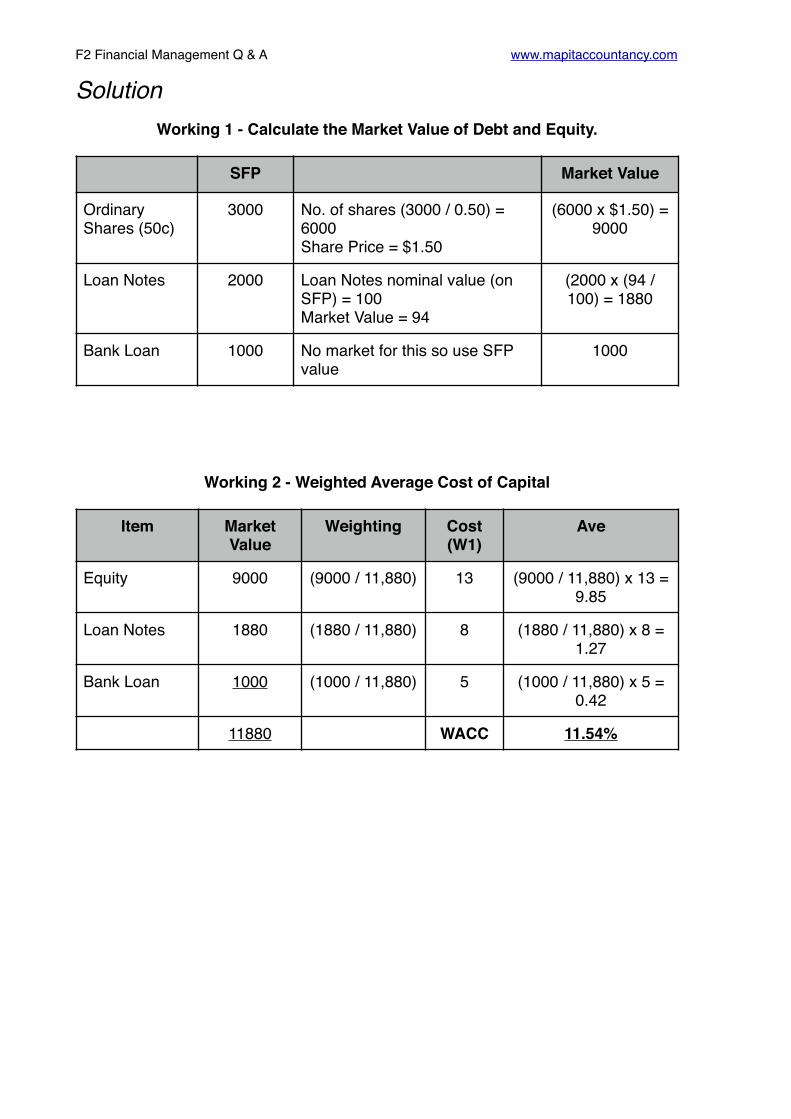
F2 Financial Management Q & A www.mapitaccountancy.com
SolutionWorking 1 - Calculate the Market Value of Debt and Equity.
Working 2 - Weighted Average Cost of Capital
SFP Market Value
Ordinary Shares (50c)
3000 No. of shares (3000 / 0.50) = 6000Share Price = $1.50
(6000 x $1.50) = 9000
Loan Notes 2000 Loan Notes nominal value (on SFP) = 100Market Value = 94
(2000 x (94 / 100) = 1880
Bank Loan 1000 No market for this so use SFP value
1000
Item Market Value
Weighting Cost (W1)
Ave
Equity 9000 (9000 / 11,880) 13 (9000 / 11,880) x 13 = 9.85
Loan Notes 1880 (1880 / 11,880) 8 (1880 / 11,880) x 8 = 1.27
Bank Loan 1000 (1000 / 11,880) 5 (1000 / 11,880) x 5 = 0.42
11880 WACC 11.54%

F2 Financial Management Q & A www.mapitaccountancy.com
Illustration 10Company A is funded as follows:
Balance Sheet Extract
Details on these are as follows.
They have just paid a dividend of 15c and the dividend has grown by 5% per year for the past 5 years.
The redeemable loan notes are currently trading at $106 and are redeemable at par in 5 years time.
The irredeemable loan notes are currently trading at $92
The bank loan has an interest rate of 10%.
The current share price is $1.25.
The tax rate is 30%.
Calculate the Weighted Average Cost of Capital.
Ordinary Shares (50c) 2000
12% Redeemable Loan Notes 1500
8% Irredeemable Loan Notes 500
Bank Loan 750

F2 Financial Management Q & A www.mapitaccountancy.com
Solution Working 1 - Calculate Cost of Capital for each item.
Cost of Equity using DVM
Cost of 12% Loan Notes
Div Just Paid 15
Growth 5%
Share Price 1.25
Ke ((15 x 1.05) / 1.25) + 0.05 = 17.6%
Period Item $ DR 5% PV DR 15% PV
1 -5 Interest (12 x (1 - 0.3) 8.4 4.329 36.36 3.352 28.16
5 Capital 100 0.784 78.40 0.497 49.70
Market Value -106 -106
8.76 -28.14
IRR Calculation: 5 + (8.76 / (8.76 - (28.14)) (15 - 5) = 7.37%

F2 Financial Management Q & A www.mapitaccountancy.com
Cost of 8% Loan Notes
Cost of Bank Debt
Working 2 - Calculate the Market Value of Debt and Equity.
Interest Paid 8
Market Value 92
Cost (Kd) (Interest Paid (1 - t) / Market Value) (8 (1 - 0.3) / 92) = 6%
Interest Rate before Tax 10
Tax Rate 30%
After Tax Cost of Debt (10 x (1 - 0.3)) 7%
SFP Market Value
Ordinary Shares (50c) 2000
No. of shares (2000 / 0.50) = 4000Share Price = $1.25
(4000 x $1.25) = 5000
12% Loan Notes 1500
Loan Notes nominal value (on SFP) = 100Market Value = 106
(1500 x (106 / 100) = 1590
8% Loan Notes 500
Loan Notes nominal value (on SFP) = 100Market Value = 92
(500 x (92 / 100)) = 460
Bank Loan 750 No market for this so use SFP figure 750

F2 Financial Management Q & A www.mapitaccountancy.com
Working 3 - Calculate the weighting of each item.
Working 4 - Weighting & Weighted Average Cost of Capital
Item Market Value Weighting
Equity 5000 (5000 / 7800)
Loan Notes 1590 (1590 / 7800)
Preference Shares 460 (460 / 7800)
Bank Loan 750 (750 / 7800)
7800
Item Market Value
Weighting Cost (W1)
Ave
Equity 5000 (5000 / 7800) 17.6 (5000 / 7800) x 17.6 = 11.28
Redeemable Notes
1590 (1590 / 7800) 7.37 (1590 / 7800) x 7.37 = 1.50
Irredeemable Notes
460 (460 / 7800) 6 (460 / 7800) x 6 = 0.35
Bank Loan 750 (750 / 7800) 7 (750 / 7800) x 7 = 0.67
7800 WACC 13.8%