
CIERMMI Women in Science Engineering and Technology
180
Handbook T-XV CIERMMI Women in Science Engineering and Technology MARROQUÍN-DE JESÚS, Ángel OLIVARES-RAMÍREZ, Juan Manuel CRUZ-RAMÍREZ, Marisela CRUZ-CARPIO, Luis Eduardo Coordinators ECORFAN ®
-
Upload
khangminh22 -
Category
Documents
-
view
3 -
download
0
Transcript of CIERMMI Women in Science Engineering and Technology
Handbook T-XV
CIERMMI Women in Science
Engineering and Technology
MARROQUÍN-DE JESÚS, Ángel OLIVARES-RAMÍREZ, Juan Manuel
CRUZ-RAMÍREZ, Marisela CRUZ-CARPIO, Luis Eduardo Coordinators
ECORFAN®
ECORFAN®
Coordinators
MARROQUÍN-DE JESÚS, Ángel. PhD
OLIVARES-RAMÍREZ, Juan Manuel. PhD
CRUZ-RAMÍREZ, Marisela. PhD CRUZ-CARPIO, Luis Eduardo. BsC
Editor in Chief
VARGAS-DELGADO, Oscar. PhD
Executive Director
RAMOS-ESCAMILLA, María. PhD
Editorial Director
PERALTA-CASTRO, Enrique. MsC
Web Designer
ESCAMILLA-BOUCHAN, Imelda. PhD
Web Diagrammer
LUNA-SOTO, Vladimir. PhD
Editorial Assistant
TREJO-RAMOS, Iván. BsC
Translator
DÍAZ-OCAMPO, Javier. BsC
Philologist
RAMOS-ARANCIBIA, Alejandra. BsC
ISBN: 978-607-8695-58-4
ECORFAN Publishing Label: 607-8695
HET Control Number: 2021-10
HET Classification (2021): 251021-1006
©ECORFAN-México, S.C. No part of this writing protected by the Federal Copyright Law may be reproduced, transmitted or used in any form or by any
means, graphic, electronic or mechanical, including, but not limited to, the following: Quotations in radio or electronic
journalistic data compilation articles and bibliographic commentaries. For the purposes of articles 13, 162,163 fraction I, 164
fraction I, 168, 169,209 fraction III and other relative articles of the Federal Copyright Law. Infringements: Being compelled
to prosecute under Mexican copyright law. The use of general descriptive names, registered names, trademarks, or trade names
in this publication does not imply, even in the absence of a specific statement, that such names are exempt from the relevant
protection in laws and regulations of Mexico and therefore free for general use by the international scientific community.
HET is part of ECORFAN Media (www.ecorfan.org)
Handbooks
Definition of Handbooks
Scientific Objectives
To support the International Scientific Community in its written production of Science, Technology and
Innovation in the CONACYT and PRODEP research areas.
ECORFAN-Mexico, S.C. is a Scientific and Technological Company in contribution to the formation of
Human Resources focused on the continuity in the critical analysis of International Research and is
attached to the RENIECYT of CONACYT with number 1702902, its commitment is to disseminate
research and contributions of the International Scientific Community, academic institutions, agencies
and entities of the public and private sectors and contribute to the linkage of researchers who perform
scientific activities, technological developments and training of specialized human resources with
governments, businesses and social organizations.
To encourage the interlocution of the International Scientific Community with other study centres in
Mexico and abroad and to promote a wide incorporation of academics, specialists and researchers to the
serial publication in Science Niches of Autonomous Universities - State Public Universities - Federal
IES - Polytechnic Universities - Technological Universities - Federal Technological Institutes - Teacher
Training Colleges - Decentralised Technological Institutes - Intercultural Universities - S&T Councils -
CONACYT Research Centres.
Scope, Coverage and Audience
Handbooks is a product edited by ECORFAN-Mexico S.C. in its Holding with repository in Mexico, it
is a refereed and indexed scientific publication. It admits a wide range of contents that are evaluated by
academic peers by the double-blind method, on topics related to the theory and practice of the
CONACYT and PRODEP research areas respectively with diverse approaches and perspectives, which
contribute to the dissemination of the development of Science, Technology and Innovation that allow
arguments related to decision-making and influence the formulation of international policies in the field
of Science. The editorial horizon of ECORFAN-Mexico® extends beyond academia and integrates other
segments of research and analysis outside that field, as long as they meet the requirements of
argumentative and scientific rigour, in addition to addressing issues of general and current interest of the
International Scientific Society.
Editorial Board
ROCHA - RANGEL, Enrique. PhD
Oak Ridge National Laboratory
CARBAJAL - DE LA TORRE, Georgina. PhD
Université des Sciencies et Technologies de Lille
GUZMÁN - ARENAS, Adolfo. PhD
Institute of Technology
CASTILLO - TÉLLEZ, Beatriz. PhD
University of La Rochelle
FERNANDEZ - ZAYAS, José Luis. PhD
University of Bristol
DECTOR - ESPINOZA, Andrés. PhD
Centro de Microelectrónica de Barcelona
TELOXA - REYES, Julio. PhD
Advanced Technology Center
HERNÁNDEZ - PRIETO, María de Lourdes. PhD
Universidad Gestalt
CENDEJAS - VALDEZ, José Luis. PhD
Universidad Politécnica de Madrid
HERNANDEZ - ESCOBEDO, Quetzalcoatl Cruz. PhD
Universidad Central del Ecuador
Arbitration Committee
URBINA - NAJERA, Argelia Berenice. PhD
Universidad Popular Autónoma del Estado de Puebla
PEREZ - ORNELAS, Felicitas. PhD
Universidad Autónoma de Baja California
CASTRO - ENCISO, Salvador Fernando. PhD
Universidad Popular Autónoma del Estado de Puebla
CASTAÑÓN - PUGA, Manuel. PhD
Universidad Autónoma de Baja California
BAUTISTA - SANTOS, Horacio. PhD
Universidad Popular Autónoma del Estado de Puebla
GONZÁLEZ - REYNA, Sheila Esmeralda. PhD
Instituto Tecnológico Superior de Irapuato
RUELAS - SANTOYO, Edgar Augusto. PhD
Centro de Innovación Aplicada en Tecnologías Competitivas
HERNÁNDEZ - GÓMEZ, Víctor Hugo. PhD
Universidad Nacional Autónoma de México
OLVERA - MEJÍA, Yair Félix. PhD
Instituto Politécnico Nacional
CUAYA - SIMBRO, German. PhD
Instituto Nacional de Astrofísica, Óptica y Electrónica

Assignment of Rights
By submitting a Scientific Work to ECORFAN Handbooks, the author undertakes not to submit it
simultaneously to other scientific publications for consideration. To do so, the author must complete the
Originality Form for his or her Scientific Work.
The authors sign the Authorisation Form for their Scientific Work to be disseminated by the means that
ECORFAN-Mexico, S.C. in its Holding Mexico considers pertinent for the dissemination and diffusion
of their Scientific Work, ceding their Scientific Work Rights.
Declaration of Authorship
Indicate the name of 1 Author and a maximum of 3 Co-authors in the participation of the Scientific Work
and indicate in full the Institutional Affiliation indicating the Unit.
Identify the name of 1 author and a maximum of 3 co-authors with the CVU number -PNPC or SNI-
CONACYT- indicating the level of researcher and their Google Scholar profile to verify their citation
level and H index.
Identify the Name of 1 Author and 3 Co-authors maximum in the Science and Technology Profiles widely
accepted by the International Scientific Community ORC ID - Researcher ID Thomson - arXiv Author
ID - PubMed Author ID - Open ID respectively.
Indicate the contact for correspondence to the Author (Mail and Telephone) and indicate the Contributing
Researcher as the first Author of the Scientific Work.
Plagiarism Detection
All Scientific Works will be tested by the PLAGSCAN plagiarism software. If a Positive plagiarism level
is detected, the Scientific Work will not be sent to arbitration and the receipt of the Scientific Work will
be rescinded, notifying the responsible Authors, claiming that academic plagiarism is typified as a crime
in the Penal Code.
Refereeing Process
All Scientific Works will be evaluated by academic peers using the Double Blind method. Approved
refereeing is a requirement for the Editorial Board to make a final decision which will be final in all
cases. MARVID® is a spin-off brand of ECORFAN® specialised in providing expert reviewers all of
them with PhD degree and distinction of International Researchers in the respective Councils of Science
and Technology and the counterpart of CONACYT for the chapters of America-Europe-Asia-Africa and
Oceania. The identification of authorship should only appear on a first page, which can be removed, in
order to ensure that the refereeing process is anonymous and covers the following stages: Identification
of ECORFAN Handbooks with their author occupancy rate - Identification of Authors and Co-authors -
PLAGSCAN Plagiarism Detection - Review of Authorisation and Originality Forms-Assignment to the
Editorial Board - Assignment of the pair of Expert Referees - Notification of Opinion - Statement of
Observations to the Author - Modified Scientific Work Package for Editing - Publication.

ECORFAN CIERMMI Women in Science
Volume XV
The Handbook will offer volumes of selected contributions from researchers who contribute to the
scientific dissemination activity of the Colegio de Ingenieros en Energías Renovables de Querétaro A.C.
in their areas of research in Engineering and Technology. In addition to having a total evaluation, in the
hands of the directors of the Colegio de Ingenieros en Energías Renovables de Querétaro A.C., the quality
and timeliness of its chapters, each individual contribution was refereed to international standards
(RESEARCH GATE, MENDELEY, GOOGLE SCHOLAR and REDIB), the Handbook thus proposes
to the academic community, recent reports on new developments in the most interesting and promising
areas of research in the Engineering and Technology.
For future volumes:
http://www.ecorfan.org/handbooks/
MARROQUÍN-DE JESÚS, Ángel. PhD
OLIVARES-RAMÍREZ, Juan Manuel. PhD
CRUZ-RAMÍREZ, Marisela. PhD
CRUZ-CARPIO, Luis Eduardo. BsC
Coordinators
CIERMMI Women in Science T-XV
Engineering and Technology
Handbooks
Colegio de Ingenieros en Energías Renovables de Querétaro A.C – Mexico. October, 2021
DOI: 10.35429/H.2021.6.1.180
2021 All Rights Reserved ECORFAN® Mexico - Bolivia - Spain - Ecuador - Cameroon - Colombia - Taiwan - Salvador
- Guatemala - Nicaragua - Paraguay - Democratic Republic of Congo - Peru

Preface
In recent years, society has achieved a better quality of life; this has been possible thanks to scientific
and technological advances. Among the advances that have allowed us to move forward is, without a
doubt, the development of the vaccine against the SARS-CoV-2 virus. The method used for the synthesis
of this vaccine was developed by Ugur Sahin and Öezlem Türeci, founders of BioNTech. Yes, behind
the scientific development of greatest impact and relevance in recent years are a man and a woman. This
scientific development was possible thanks to both of them, and here it is important to highlight the
quality of women in science related to seeing issues from another perspective.
Therefore, the union of their strengths and their differences made it possible to have a vaccine
that makes it possible to return to life without confinement, without fear of going out, and with the
possibility of enjoying it. Thus, the role of women in science is not only valuable, but fundamental to
solve the problems that afflict us today. In this context, I can only thank and congratulate the women
who today, thanks to their training, discipline and commitment, are giving us this wonderful work of
science. I am sure that more challenges will come, but always counting on them, we will come out ahead.
My most sincere appreciation and admiration.
DOMÍNGUEZ-CUELLO, Alma Delia M.D.
Executive Director Querétaro Energy Cluster

Introduction
The Colegio de Ingenieros en Energías Renovables de Querétaro A.C (CIER-QUERÉTARO), and its
chapters of Renewable Energy, Industrial Maintenance, Mechatronics and Computer Science, technical
sponsors of the International Interdisciplinary Congress on Renewable Energy, Maintenance,
Mechatronics and Computer Science, CIERMMI 2021 has as general objective to establish a space for
discussion and reflection on issues related to the areas of: renewable energy, industrial maintenance,
mechatronics and computer science with the participation of students, professors, researchers and
national and international speakers, promoting the formation and consolidation of research networks.
Contributing to provide a space for dissemination and discussion of the presentations of students,
graduates, academics and researchers, representatives of various higher education institutions, research
centers in our country, as well as educational institutions beyond our borders. Promoting the formation
of research networks between different institutions. Offering a space for undergraduate, master's, doctoral
and postdoctoral students, in which they can present the progress of the research they carry out in their
different educational centers. Providing a space in which study groups and members of academic bodies,
linked to the curricular program of renewable energy, industrial maintenance, mechatronics and
computer science careers, can present the research work developed within their institution and in
collaboration with other national or international educational institutions. Establishing a training space
for the attendees, through the development of specific lectures and conferences.
This volume, Women in Science T-XV-2021 contains 10 refereed chapters dealing with these
issues, chosen from among the contributions, we gathered some researchers and graduate students from
the 32 states of our country. We thank the reviewers for their feedback that contributed greatly in
improving the book chapters for publication in these proceedings by reviewing the manuscripts that were
submitted.
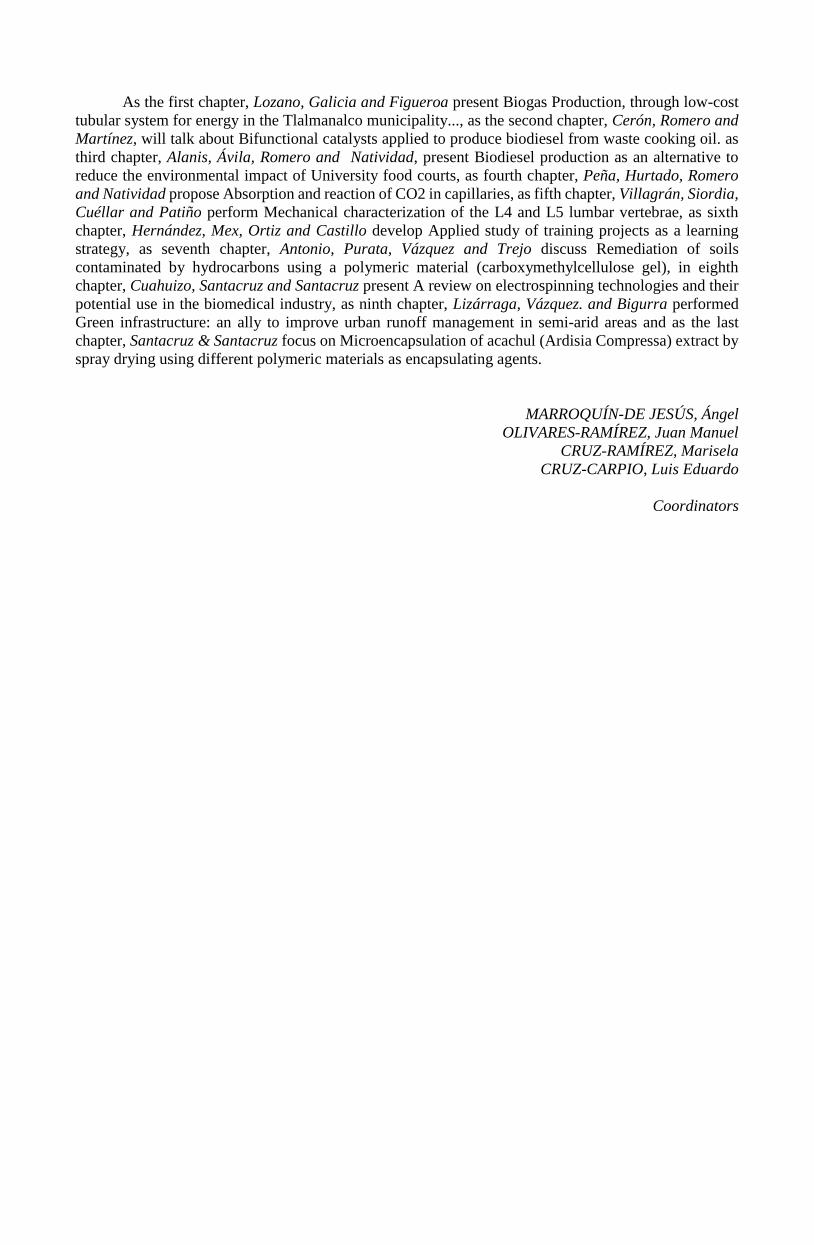
As the first chapter, Lozano, Galicia and Figueroa present Biogas Production, through low-cost
tubular system for energy in the Tlalmanalco municipality..., as the second chapter, Cerón, Romero and
Martínez, will talk about Bifunctional catalysts applied to produce biodiesel from waste cooking oil. as
third chapter, Alanis, Ávila, Romero and Natividad, present Biodiesel production as an alternative to
reduce the environmental impact of University food courts, as fourth chapter, Peña, Hurtado, Romero
and Natividad propose Absorption and reaction of CO2 in capillaries, as fifth chapter, Villagrán, Siordia,
Cuéllar and Patiño perform Mechanical characterization of the L4 and L5 lumbar vertebrae, as sixth
chapter, Hernández, Mex, Ortiz and Castillo develop Applied study of training projects as a learning
strategy, as seventh chapter, Antonio, Purata, Vázquez and Trejo discuss Remediation of soils
contaminated by hydrocarbons using a polymeric material (carboxymethylcellulose gel), in eighth
chapter, Cuahuizo, Santacruz and Santacruz present A review on electrospinning technologies and their
potential use in the biomedical industry, as ninth chapter, Lizárraga, Vázquez. and Bigurra performed
Green infrastructure: an ally to improve urban runoff management in semi-arid areas and as the last
chapter, Santacruz & Santacruz focus on Microencapsulation of acachul (Ardisia Compressa) extract by
spray drying using different polymeric materials as encapsulating agents.
MARROQUÍN-DE JESÚS, Ángel
OLIVARES-RAMÍREZ, Juan Manuel
CRUZ-RAMÍREZ, Marisela
CRUZ-CARPIO, Luis Eduardo
Coordinators
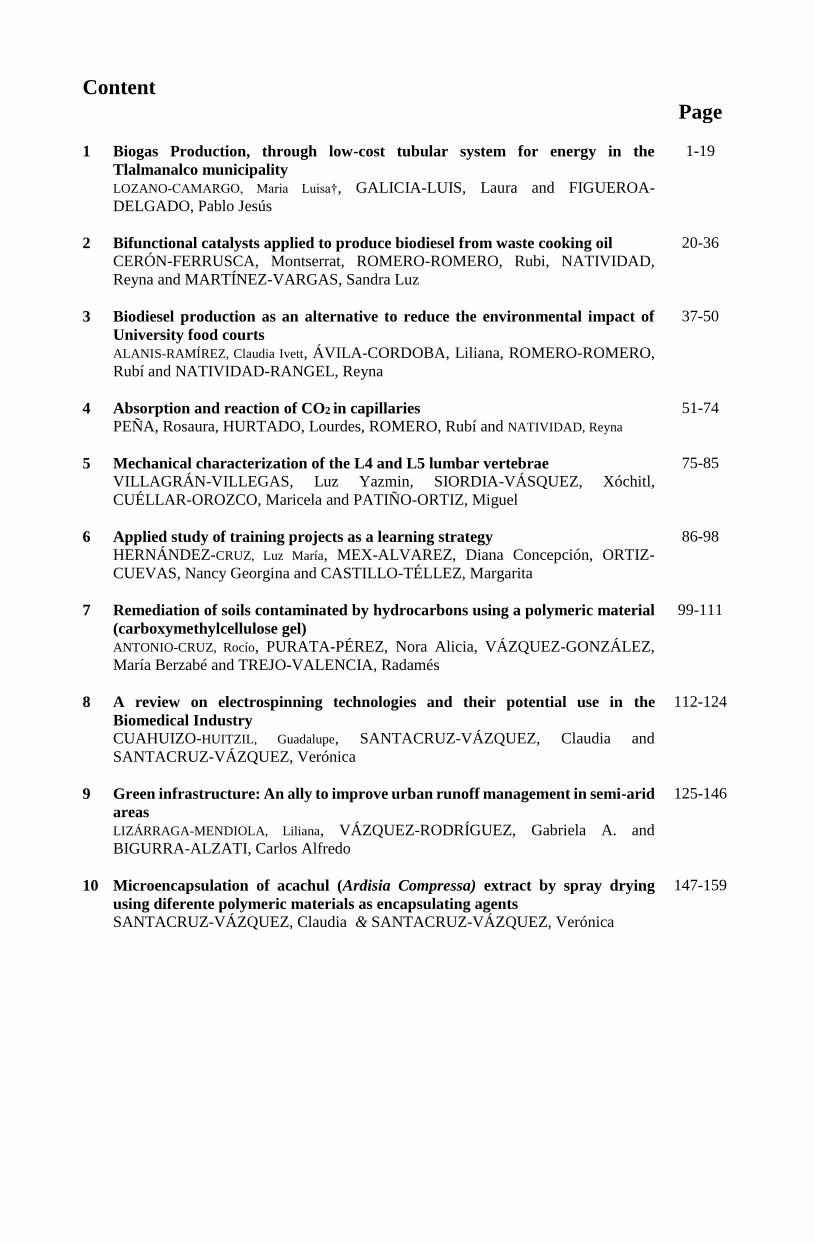
Content
Page
1 Biogas Production, through low-cost tubular system for energy in the
Tlalmanalco municipality LOZANO-CAMARGO, Maria Luisa†, GALICIA-LUIS, Laura and FIGUEROA-
DELGADO, Pablo Jesús
1-19
2 Bifunctional catalysts applied to produce biodiesel from waste cooking oil CERÓN-FERRUSCA, Montserrat, ROMERO-ROMERO, Rubi, NATIVIDAD,
Reyna and MARTÍNEZ-VARGAS, Sandra Luz
20-36
3 Biodiesel production as an alternative to reduce the environmental impact of
University food courts ALANIS-RAMÍREZ, Claudia Ivett, ÁVILA-CORDOBA, Liliana, ROMERO-ROMERO,
Rubí and NATIVIDAD-RANGEL, Reyna
37-50
4 Absorption and reaction of CO2 in capillaries PEÑA, Rosaura, HURTADO, Lourdes, ROMERO, Rubí and NATIVIDAD, Reyna
51-74
5 Mechanical characterization of the L4 and L5 lumbar vertebrae VILLAGRÁN-VILLEGAS, Luz Yazmin, SIORDIA-VÁSQUEZ, Xóchitl,
CUÉLLAR-OROZCO, Maricela and PATIÑO-ORTIZ, Miguel
75-85
6 Applied study of training projects as a learning strategy
HERNÁNDEZ-CRUZ, Luz María, MEX-ALVAREZ, Diana Concepción, ORTIZ-
CUEVAS, Nancy Georgina and CASTILLO-TÉLLEZ, Margarita
86-98
7 Remediation of soils contaminated by hydrocarbons using a polymeric material
(carboxymethylcellulose gel) ANTONIO-CRUZ, Rocío, PURATA-PÉREZ, Nora Alicia, VÁZQUEZ-GONZÁLEZ,
María Berzabé and TREJO-VALENCIA, Radamés
99-111
8 A review on electrospinning technologies and their potential use in the
Biomedical Industry CUAHUIZO-HUITZIL, Guadalupe, SANTACRUZ-VÁZQUEZ, Claudia and
SANTACRUZ-VÁZQUEZ, Verónica
112-124
9 Green infrastructure: An ally to improve urban runoff management in semi-arid
areas LIZÁRRAGA-MENDIOLA, Liliana, VÁZQUEZ-RODRÍGUEZ, Gabriela A. and
BIGURRA-ALZATI, Carlos Alfredo
125-146
10 Microencapsulation of acachul (Ardisia Compressa) extract by spray drying
using diferente polymeric materials as encapsulating agents SANTACRUZ-VÁZQUEZ, Claudia & SANTACRUZ-VÁZQUEZ, Verónica
147-159
1
Chapter 1 Biogas Production, through low-cost tubular system for energy in the
Tlalmanalco municipality
Capítulo 1 Producción de biogás, por medio de sistemas tubulares de bajo costo, para
la generación de energía en el municipio de Tlalmanalco LOZANO-CAMARGO, Maria Luisa†*, GALICIA-LUIS, Laura and FIGUEROA-DELGADO, Pablo
Jesús
Tecnológico de Estudios Superiores del Oriente del Estado de México. Dept. Environmental
Engineering, Paraje San Isidro S / N, Barrio de Tecamachalco, Los Reyes La Paz, State of Mexico. CP
56400, Mexico.
Universidad Autónoma Metropolitana-Iztapalapa, Department of Chemistry. Av. Michoacán y la
Purísima, Col. Vicentina. CP 09340, Mexico.
1st Author ID: Maria Luisa Lozano-Camargo / ORD ID: 00-0002-0777-6392, CVU CONACYT ID:
46638
1st Co-Author ID: Laura, Galicia-Luis / CVU CONACYT ID: 120121
2nd Co-Author ID: Pablo Jesús, Figueroa- Delgado / ORD ID: 0000-0002-7875-8669
DOI: 10.35429/H.2021.6.1.19
M. Lozano, L. Galicia and P. Figueroa.
A. Marroquín, J. Olivares, M. Ramírez and L. Cruz (Coord) Engineering and Technology. Handbooks-©ECORFAN-México,
Querétaro, 2021.
2
Abstract
Biogas is a renewable biofuel product of anaerobic digestion, of the decomposition of organic matter
(biomass) generating methane (CH4) with high energy value that represents 50 and 75% gas, it is an
excellent ecological alternative in energy production, in order to take advantage of the biogas production
from human and animals generated feces in the municipality of Tlalmanalco in the State of Mexico, a
theoretical study was carried out in order to verify how feasible it is to implement a system of tubular
biodigesters of low cost favoring the community with the lowest resources, as well as reducing the
environmental impact of CO2 emissions.
Tubular biodigester, Fecal matter, Energy Systems, Biogas, Municipality of Tlalmanalco
Resumen
El biogás es un biocombustible renovable producto de la digestión anaerobia, de la descomposición de
materia orgánica (biomasa) generando metano (CH4) con alto valor energético que representa un 50 y un
75%de gas, es una excelente alternativa ecológica en la producción energética, con la finalidad de
aprovechar la producción de biogás procedente de las heces fecales generadas por los humanos y
animales en el municipio de Tlalmanalco del Estado de México, se realizó un estudio teórico con la
finalidad de verificar que tan viable es implementar un sistema de biodigestores tubulares de bajo costo
favoreciendo a la comunidad de más bajos recursos, así como a disminuir el impacto ambiental que se
tiene por las emisiones de CO2.
Biodigestor tubular, Materia fecal, Sistemas energéticos, Biogás, Municipio de Tlalmanalco
1. Introduction
Sometimes organic waste does not receive adequate treatment for final disposal, generating various
harmful events, such as the spread of diseases that affect human populations or the transmission of
pollutants to environmental ecosystems. Often these wastes from human or animal activities are
deposited in vacant lots, rivers, ravines, or open-air dumps, where they generate waste. One way to
rescind these affectations is using biogas generating systems, with the purpose of treating waste through
controlled anaerobic biological processes, where the result is a biogas rich in methane and carbon
dioxide, capable of serving as a biofuel to obtain various benefits. Biodigesters are elementary systems
to obtain a biogas with the ideal composition to generate energy. There are several models of biodigesters,
some have more advanced technological features, but this research proposes the use of low-cost tubular
biodigesters as implementation, to the various problems and theoretical solutions, which are suitable to
the social, economic and environmental context of the municipality of Tlalmanalco through minimal
investment in materials, installation and maintenance, which is focused on sustainability, promoting
long-term benefits throughout the community, especially in areas most lacking in economic resources
and services, to directly influence sustainable development.
General Objectives
Analyze the characteristics and energy benefits of low-cost tubular systems, for their future
implementation in economically vulnerable areas in the municipality of Tlalmanalco.
Specific objectives
Determine the sustainable potential of Tlalmanalco, to analyze the projection feasibility of biogas
generating systems.
Energy benefits of tubular systems in the population of the municipality of Tlalmanalco.
3
Methodology
Several scientific articles on biogas generation focused on low-cost tubular systems were analyzed in
order to extract relevant information, with the purpose of making known some characteristics about the
sustainable energy potential of these systems in order to promote their implementation, acceptance and
benefits in the society of Tlalmanalco.
2 Development and method
Anaerobic digestion
Biogas is a gas that is produced under natural conditions, as well as in places designed and established
by man, from a series of metabolic processes generating biodegradation reactions of organic matter, by
the action of microorganisms (methanogenic bacteria). In anaerobic conditions (without oxygen) where
a mixture of compound gases is obtained, which have the capacity to generate biomass energy made up
of methane (CH4), carbon dioxide (CO2), and a lower proportion of hydrogen (H2), hydrogen sulfide.
During the fermentation process, various bacterial consortia are required that depend on the energy
provided by the substrate, which is essential for the degradation of the matter that is transformed into
biomass. Thus, the formation of biogas depends on a fundamental process that takes place through the
degradation of organic matter; where biodigestion is an intricate system due to the various chemical and
biological changes and the various bacterial microorganisms that interact in the process in a synchronized
way. (Lorenzo et. al, 2005; Torres, 2021)
Elementary process biology
Bacterial microorganisms require nutrients extracted from organic matter to break down the polymers
found in the macromolecules available in the organic material, and enzymes that they use to degrade the
cellular structure to obtain acetic acid. (Leon, 1991). This is subsequently transformed into methane
(CH4) and carbon dioxide (CO2)
Phases of biodigestion
In 1991 Leon considered that the usual anaerobic degradation process consisted of three main stages for
both solid waste or sludge (hydrolysis, acidogenesis, methanogenesis) and two for liquid residues
(acidogenesis, methanogenesis). Currently, the 4 stages are considered important for obtaining
biodigestion, which are defined below
Hydrolysis: The macromolecules (proteins, carbohydrates, and lipids) are hydrolyzed by means
of enzymes that require degrading the cellular structure to obtain simpler compounds such as sugars,
amino acids or fatty acids. "Proteins are hydrolyzed into peptides and amino acids by the action of
proteolytic enzymes called proteases."
Acidogenesis: The product compounds of the hydrolysis are transformed into acid by means of
"soluble molecules that can be used directly by methanogenic bacteria in acetic acid and in smaller
organic compounds (propanoicobutyric, valeric, lactic and ethanol)".
Acetogenesis: Compound’s products of acidogenesis are transformed by "acetogenic bacteria,
where they are transformed into simpler components, such as hydrogen (H2) and carbon dioxide (CO2)".
Methanogenesis: The Archeo methanogenic bacteria generate methane gas, through the
metabolization of “monocarbon substrates united by the union of acetate covalent bonds, H2 /CO2,
format, methanol and some methylamines" and the resulting methane is given mostly by means of acetic
acid dexcarboxylation (Varnero, 2011).
In Figure 1.1. the diagram of the fundamental phases that describe the anaerobic digestion process
is shown.

4
Figure 1 Phases of anaerobic digestion (Pérez, 2010)
The phases and main characteristics of the most common bacteria generated during the
biodigestion process that interfere in the anaerobic phases are shown in Table 1.1.
Table 1.1 Characteristics of common bacteria in the biodigestion process
Source: :(Varnero, 2011; Constanza, et al., 2015)
Result of biodigestion
Once the biodigestion process is finished, methane gas (CH4), carbon dioxide (CO2), and trace
compounds such as hydrogen sulfide (H2S) are obtained as the main product, and as residues of the
organic raw material inside the Biodigester is transformed into a semi-liquid fertilizer, which generates
sludge or biol, which are used as a mineralizer for crops and plants. It is important to control some
parameters (climatic conditions, altitude, composition of the organic substrate, biological conditions) in
order to obtain adequate methane, as well as the various resulting compounds; By not correctly stabilizing
the parameters inside the biodigester, the process can be inhibited, obtaining biogas with lower capacity
to produce biofuel with little efficiency to generate energy.
Biodigestion process conditions
pH: This parameter is important to avoid that the substrate during the anaerobic digestion process goes
through acidic and/or basic conditions, the optimal pH quantification should be in the range of 6.5 to 7.5,
to avoid inhibition during the process since methanogenic microorganisms are more susceptible to pH
variations than any other anaerobic microorganism. (Varnero, 2011; Olaya, et al, 2009).
Phases Bacteria Features
Hydrolysis Lactobacillus,
Propioni- bacterium, Sphingomonas,
Sporobacterium, Megasphaera,
Bifidobacterium
Series of bacteria that are responsible for degrading the
complex bonds of macromolecules (proteins, cellulose, lignin,
and fatty acids).
Acidogenesis
Clostridium, Paenibacillus and
Ruminococcus
Bacterial consortium that is responsible for metabolizing
"sugars, amino acids and lipids into organic acids, alcohols
and ketones, acetate, CO2 and H2".
Acetogenesis Syntrophobacter wolinii,
Syntrophomonas wolfei,
This bacterial group "fatty acids with 4 to 8 carbon atoms,
convert propionic, butyric and some alcohols into acetate,
hydrogen and carbon dioxide, which is used in
methanogenesis"
Methanogenesis Methanobacterium,
Methanospirillum hungatii, and
Methanosarcina.
Strict methane-forming anaerobic bacteria, their main
characteristic is that they are very susceptible to drastic
changes in temperature.
hydrolysis Genesis acid Acetogenesis Methanogenesi
s
C. hydrates.
Fats, Proteins
In solution: CC of
sugars amino
acids, Fatty acids
CC of acids
alcohols CO2,
H2
Carbonic acid, alcohols, acetate
Homo
acetate
genesis
CO2 +
H2 Sulfate reduction
Nitrate reduction
Stage 1 Stage 2
CH4, CO2,
H2O
H2S
NH3, NH4
5
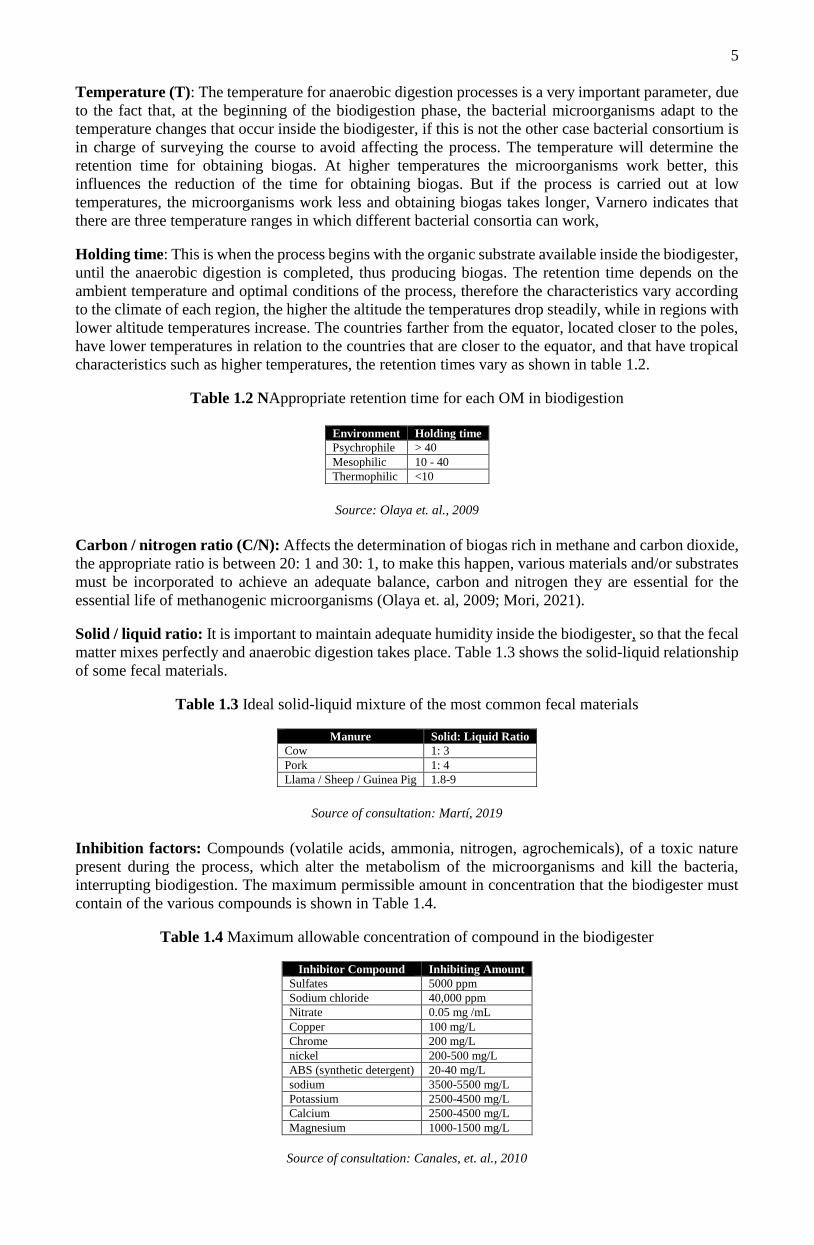
Temperature (T): The temperature for anaerobic digestion processes is a very important parameter, due
to the fact that, at the beginning of the biodigestion phase, the bacterial microorganisms adapt to the
temperature changes that occur inside the biodigester, if this is not the other case bacterial consortium is
in charge of surveying the course to avoid affecting the process. The temperature will determine the
retention time for obtaining biogas. At higher temperatures the microorganisms work better, this
influences the reduction of the time for obtaining biogas. But if the process is carried out at low
temperatures, the microorganisms work less and obtaining biogas takes longer, Varnero indicates that
there are three temperature ranges in which different bacterial consortia can work,
Holding time: This is when the process begins with the organic substrate available inside the biodigester,
until the anaerobic digestion is completed, thus producing biogas. The retention time depends on the
ambient temperature and optimal conditions of the process, therefore the characteristics vary according
to the climate of each region, the higher the altitude the temperatures drop steadily, while in regions with
lower altitude temperatures increase. The countries farther from the equator, located closer to the poles,
have lower temperatures in relation to the countries that are closer to the equator, and that have tropical
characteristics such as higher temperatures, the retention times vary as shown in table 1.2.
Table 1.2 NAppropriate retention time for each OM in biodigestion
Environment Holding time
Psychrophile > 40
Mesophilic 10 - 40
Thermophilic <10
Source: Olaya et. al., 2009
Carbon / nitrogen ratio (C/N): Affects the determination of biogas rich in methane and carbon dioxide,
the appropriate ratio is between 20: 1 and 30: 1, to make this happen, various materials and/or substrates
must be incorporated to achieve an adequate balance, carbon and nitrogen they are essential for the
essential life of methanogenic microorganisms (Olaya et. al, 2009; Mori, 2021).
Solid / liquid ratio: It is important to maintain adequate humidity inside the biodigester, so that the fecal
matter mixes perfectly and anaerobic digestion takes place. Table 1.3 shows the solid-liquid relationship
of some fecal materials.
Table 1.3 Ideal solid-liquid mixture of the most common fecal materials
Manure Solid: Liquid Ratio
Cow 1: 3
Pork 1: 4
Llama / Sheep / Guinea Pig 1.8-9
Source of consultation: Martí, 2019
Inhibition factors: Compounds (volatile acids, ammonia, nitrogen, agrochemicals), of a toxic nature
present during the process, which alter the metabolism of the microorganisms and kill the bacteria,
interrupting biodigestion. The maximum permissible amount in concentration that the biodigester must
contain of the various compounds is shown in Table 1.4.
Table 1.4 Maximum allowable concentration of compound in the biodigester
Inhibitor Compound Inhibiting Amount
Sulfates 5000 ppm
Sodium chloride 40,000 ppm
Nitrate 0.05 mg /mL
Copper 100 mg/L
Chrome 200 mg/L
nickel 200-500 mg/L
ABS (synthetic detergent) 20-40 mg/L
sodium 3500-5500 mg/L
Potassium 2500-4500 mg/L
Calcium 2500-4500 mg/L
Magnesium 1000-1500 mg/L
Source of consultation: Canales, et. al., 2010
6
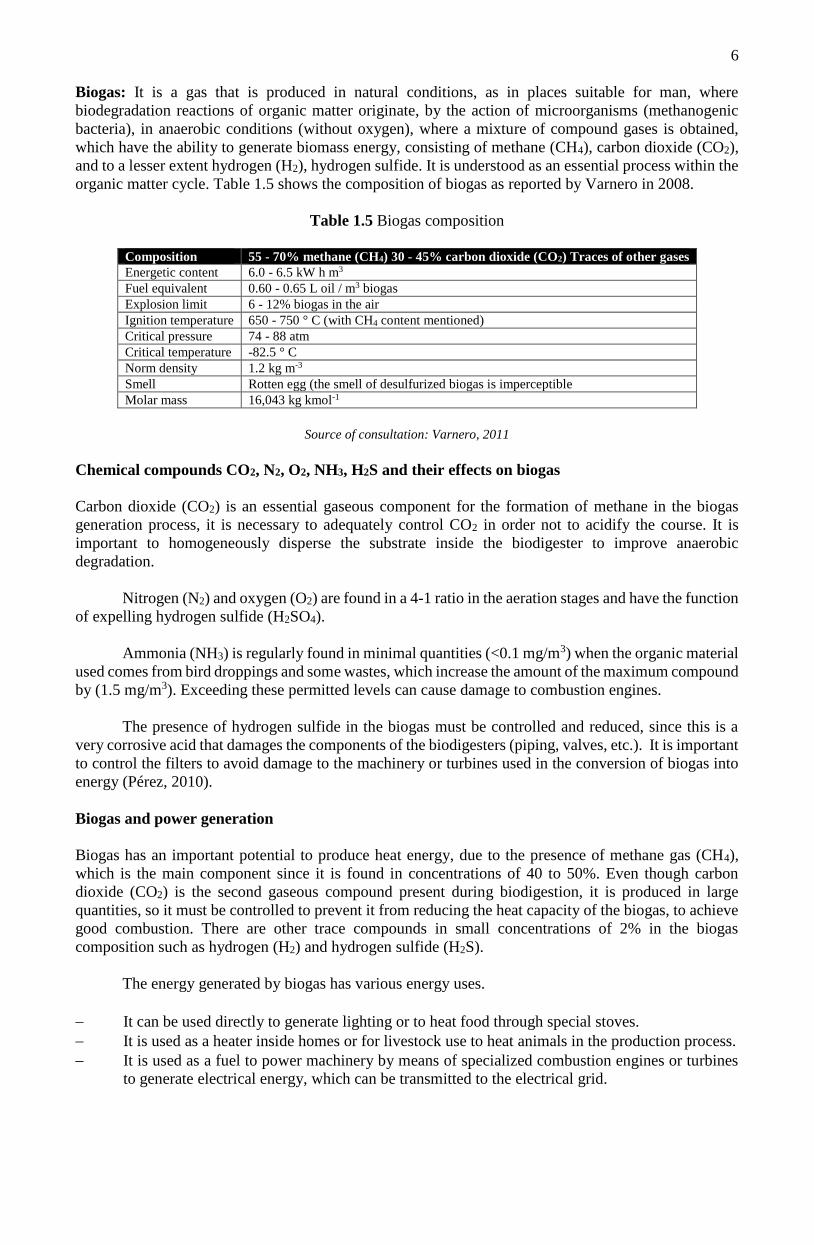
Biogas: It is a gas that is produced in natural conditions, as in places suitable for man, where
biodegradation reactions of organic matter originate, by the action of microorganisms (methanogenic
bacteria), in anaerobic conditions (without oxygen), where a mixture of compound gases is obtained,
which have the ability to generate biomass energy, consisting of methane (CH4), carbon dioxide (CO2),
and to a lesser extent hydrogen (H2), hydrogen sulfide. It is understood as an essential process within the
organic matter cycle. Table 1.5 shows the composition of biogas as reported by Varnero in 2008.
Table 1.5 Biogas composition
Composition 55 - 70% methane (CH4) 30 - 45% carbon dioxide (CO2) Traces of other gases
Energetic content 6.0 - 6.5 kW h m3
Fuel equivalent 0.60 - 0.65 L oil / m3 biogas
Explosion limit 6 - 12% biogas in the air
Ignition temperature 650 - 750 ° C (with CH4 content mentioned)
Critical pressure 74 - 88 atm
Critical temperature -82.5 ° C
Norm density 1.2 kg m-3
Smell Rotten egg (the smell of desulfurized biogas is imperceptible
Molar mass 16,043 kg kmol-1
Source of consultation: Varnero, 2011
Chemical compounds CO2, N2, O2, NH3, H2S and their effects on biogas
Carbon dioxide (CO2) is an essential gaseous component for the formation of methane in the biogas
generation process, it is necessary to adequately control CO2 in order not to acidify the course. It is
important to homogeneously disperse the substrate inside the biodigester to improve anaerobic
degradation.
Nitrogen (N2) and oxygen (O2) are found in a 4-1 ratio in the aeration stages and have the function
of expelling hydrogen sulfide (H2SO4).
Ammonia (NH3) is regularly found in minimal quantities (<0.1 mg/m3) when the organic material
used comes from bird droppings and some wastes, which increase the amount of the maximum compound
by (1.5 mg/m3). Exceeding these permitted levels can cause damage to combustion engines.
The presence of hydrogen sulfide in the biogas must be controlled and reduced, since this is a
very corrosive acid that damages the components of the biodigesters (piping, valves, etc.). It is important
to control the filters to avoid damage to the machinery or turbines used in the conversion of biogas into
energy (Pérez, 2010).
Biogas and power generation
Biogas has an important potential to produce heat energy, due to the presence of methane gas (CH4),
which is the main component since it is found in concentrations of 40 to 50%. Even though carbon
dioxide (CO2) is the second gaseous compound present during biodigestion, it is produced in large
quantities, so it must be controlled to prevent it from reducing the heat capacity of the biogas, to achieve
good combustion. There are other trace compounds in small concentrations of 2% in the biogas
composition such as hydrogen (H2) and hydrogen sulfide (H2S).
The energy generated by biogas has various energy uses.
It can be used directly to generate lighting or to heat food through special stoves.
It is used as a heater inside homes or for livestock use to heat animals in the production process.
It is used as a fuel to power machinery by means of specialized combustion engines or turbines
to generate electrical energy, which can be transmitted to the electrical grid.
7
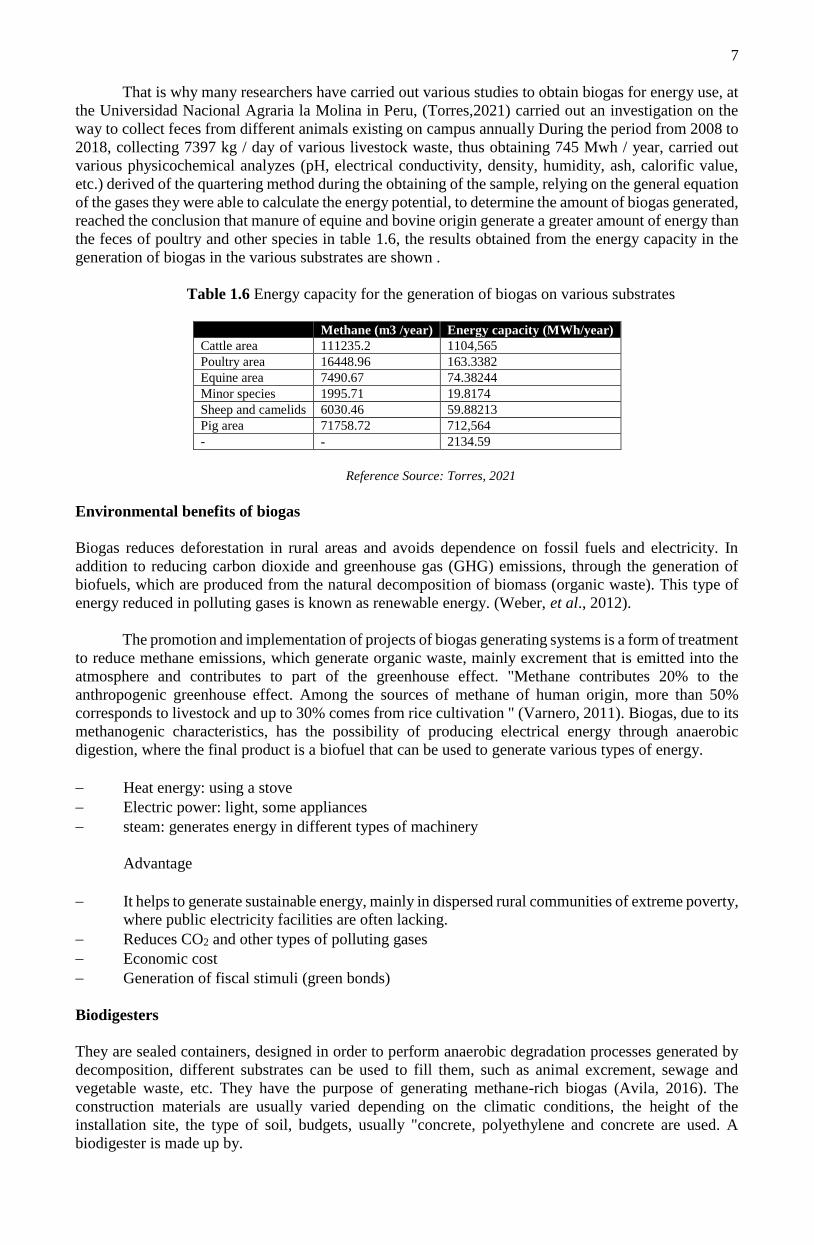
That is why many researchers have carried out various studies to obtain biogas for energy use, at
the Universidad Nacional Agraria la Molina in Peru, (Torres,2021) carried out an investigation on the
way to collect feces from different animals existing on campus annually During the period from 2008 to
2018, collecting 7397 kg / day of various livestock waste, thus obtaining 745 Mwh / year, carried out
various physicochemical analyzes (pH, electrical conductivity, density, humidity, ash, calorific value,
etc.) derived of the quartering method during the obtaining of the sample, relying on the general equation
of the gases they were able to calculate the energy potential, to determine the amount of biogas generated,
reached the conclusion that manure of equine and bovine origin generate a greater amount of energy than
the feces of poultry and other species in table 1.6, the results obtained from the energy capacity in the
generation of biogas in the various substrates are shown .
Table 1.6 Energy capacity for the generation of biogas on various substrates
Methane (m3 /year) Energy capacity (MWh/year)
Cattle area 111235.2 1104,565
Poultry area 16448.96 163.3382
Equine area 7490.67 74.38244
Minor species 1995.71 19.8174
Sheep and camelids 6030.46 59.88213
Pig area 71758.72 712,564
- - 2134.59
Reference Source: Torres, 2021
Environmental benefits of biogas
Biogas reduces deforestation in rural areas and avoids dependence on fossil fuels and electricity. In
addition to reducing carbon dioxide and greenhouse gas (GHG) emissions, through the generation of
biofuels, which are produced from the natural decomposition of biomass (organic waste). This type of
energy reduced in polluting gases is known as renewable energy. (Weber, et al., 2012).
The promotion and implementation of projects of biogas generating systems is a form of treatment
to reduce methane emissions, which generate organic waste, mainly excrement that is emitted into the
atmosphere and contributes to part of the greenhouse effect. "Methane contributes 20% to the
anthropogenic greenhouse effect. Among the sources of methane of human origin, more than 50%
corresponds to livestock and up to 30% comes from rice cultivation " (Varnero, 2011). Biogas, due to its
methanogenic characteristics, has the possibility of producing electrical energy through anaerobic
digestion, where the final product is a biofuel that can be used to generate various types of energy.
Heat energy: using a stove
Electric power: light, some appliances
steam: generates energy in different types of machinery
Advantage
It helps to generate sustainable energy, mainly in dispersed rural communities of extreme poverty,
where public electricity facilities are often lacking.
Reduces CO2 and other types of polluting gases
Economic cost
Generation of fiscal stimuli (green bonds)
Biodigesters
They are sealed containers, designed in order to perform anaerobic degradation processes generated by
decomposition, different substrates can be used to fill them, such as animal excrement, sewage and
vegetable waste, etc. They have the purpose of generating methane-rich biogas (Avila, 2016). The
construction materials are usually varied depending on the climatic conditions, the height of the
installation site, the type of soil, budgets, usually "concrete, polyethylene and concrete are used. A
biodigester is made up by.
8
Cargo tank: It conducts the organic matter through a tube generally made of materials resistant to high
pressure, towards the center line of the tank.
Gas storage tank: Consists of a circular or square brick construction with a polished concrete finish and
a sturdy material bag, is used in the globe digesters. These materials serve to retain the gas in a thermal
way so that when availability is required, it can be used.
Discharge tank: It is the part of the pipeline where residual sludge is extracted, generally these sludge
are used as fertilizer due to its mineralization characteristics in crops or plants.
Driving line: Quantity of gas to be transported, and the distance between the places where the different
processes take place in which plastic, copper or metallic piping is used, depending on the characteristics
of the project, as well as the environmental conditions to be determined.
Valves: Two valves are required for the gas, the first will be installed at the beginning of the process and
the second at the end of the outlet line, must be made of resistant materials such as PVC or stainless steel.
Traps: The gas must be eliminated from impurities such as sulfuric acid, this in order not to damage any
part of the system that does not have the resistance to withstand this type of corrosive compound.
(Corona, 2007).
Classification of biodigesters
There are various types of biodigesters, the most common being of the "horizontal and vertical type and
of the continuous, semi-continuous, discontinuous" type. (Pascual, et al, 2011)
Laptops: They are simple biodigesters that are used in domestic activities, they are built of resistant
materials but easy to transport.
Continuous flow: It is one that "allows the continuous transport of organic matter, mainly in vertical
digesters, they are used in large-scale projects and have high-tech instrumentation such as agitators and
heating."
Semi-continuous flow: They are loaded in short periods of approximately 12 hours, 1 time every 24
hours or every 48 hours, the available load of organic raw material is used constantly on a daily basis.
The 3 most common digester models that have the semi-continuous flow feature are Indian, Chinese, and
Taiwanese. These digesters are used mainly in rural areas.
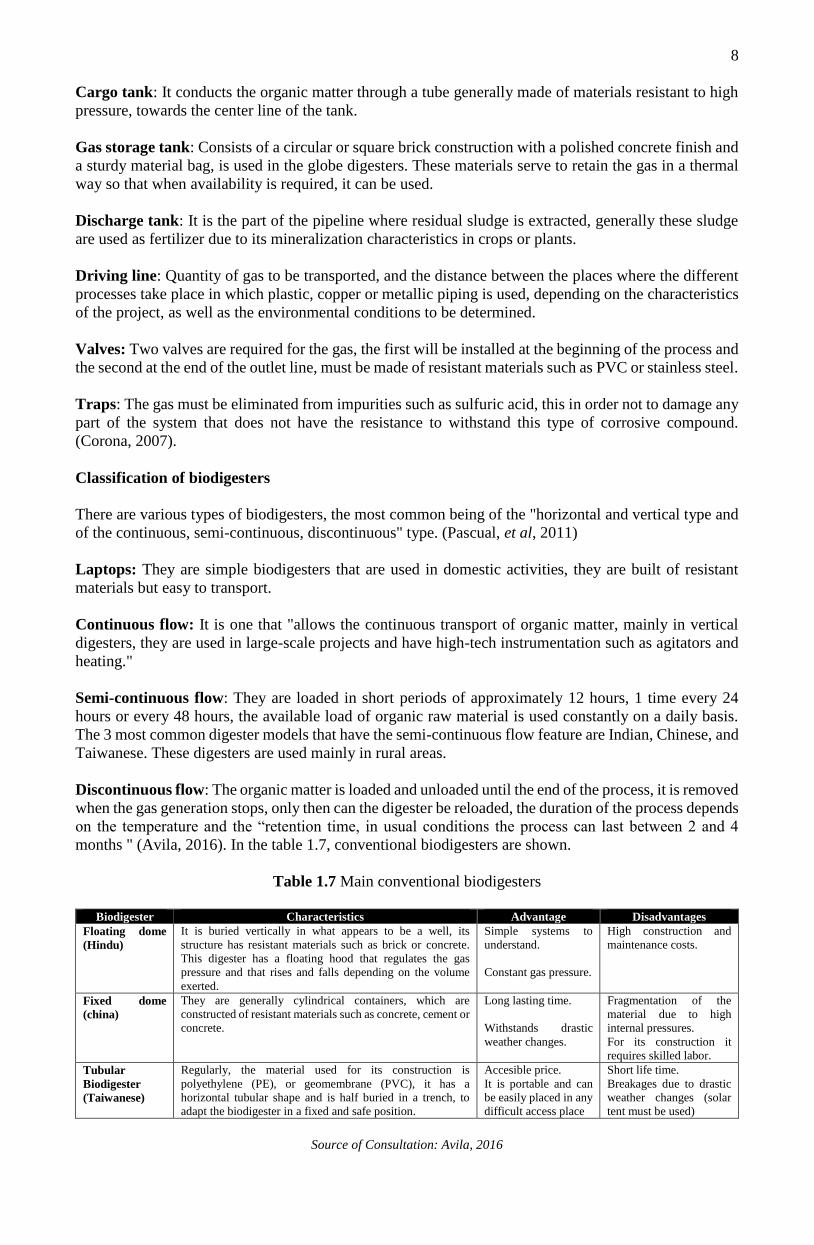
Discontinuous flow: The organic matter is loaded and unloaded until the end of the process, it is removed
when the gas generation stops, only then can the digester be reloaded, the duration of the process depends
on the temperature and the “retention time, in usual conditions the process can last between 2 and 4
months " (Avila, 2016). In the table 1.7, conventional biodigesters are shown.
Table 1.7 Main conventional biodigesters
Biodigester Characteristics Advantage Disadvantages
Floating dome
(Hindu)
It is buried vertically in what appears to be a well, its
structure has resistant materials such as brick or concrete.
This digester has a floating hood that regulates the gas
pressure and that rises and falls depending on the volume
exerted.
Simple systems to
understand.
Constant gas pressure.
High construction and
maintenance costs.
Fixed dome
(china)
They are generally cylindrical containers, which are
constructed of resistant materials such as concrete, cement or
concrete.
Long lasting time.
Withstands drastic
weather changes.
Fragmentation of the
material due to high
internal pressures.
For its construction it
requires skilled labor.
Tubular
Biodigester
(Taiwanese)
Regularly, the material used for its construction is
polyethylene (PE), or geomembrane (PVC), it has a
horizontal tubular shape and is half buried in a trench, to
adapt the biodigester in a fixed and safe position.
Accesible price.
It is portable and can
be easily placed in any
difficult access place
Short life time.
Breakages due to drastic
weather changes (solar
tent must be used)
Source of Consultation: Avila, 2016
9
Tlalmanalco municipal context
Tlalmanalco de Velázquez is a municipality located in the eastern part of the State of Mexico, with the
following coordinates 19º 80 '48” and 19º 15' 43” of north latitude and 98º 37 '58” and 98º 51' 20” of
west longitude. It is adjacent to the municipalities Puebla (West), Chalco (North), Ixtapaluca and
Cocotitlán (West), Amecameca, Ayapango and Tenango del Aire (South). The municipality has a current
population of 51,804 inhabitants and a territorial extension of 158 km2, “due to its extensive forest areas,
the municipality focuses on the provision of environmental services such as the maintenance of biomass
for carbon capture and the provision of oxygen” (Cervantes, 2011). The general aspects of the
municipality of Tlalmanalco are shown in table 1.8.
Table 1.8 General aspects of the Municipality of Tlalmanalco
Important aspects (SAE) of
Tlalmanalco
General data
Coordinates 19º 80 '48 ”and 19º 15' 43” of north latitude and 98º 37 '58 ”and 98º 51' 20” of west
longitude
Total population (2021) 47,390 inhabitants
Area Km2 158.58 km
HDI (2015) 0.779%
Poverty (2015) 22,833 inhabitants
Altitude 2400m
GDP (2017) 1253.4
Climate Temperate coniferous forest
Rural population (2010) 7,746 inhabitants
Source of consultation: Municipal Development Plan Tlalmanalco, 2019
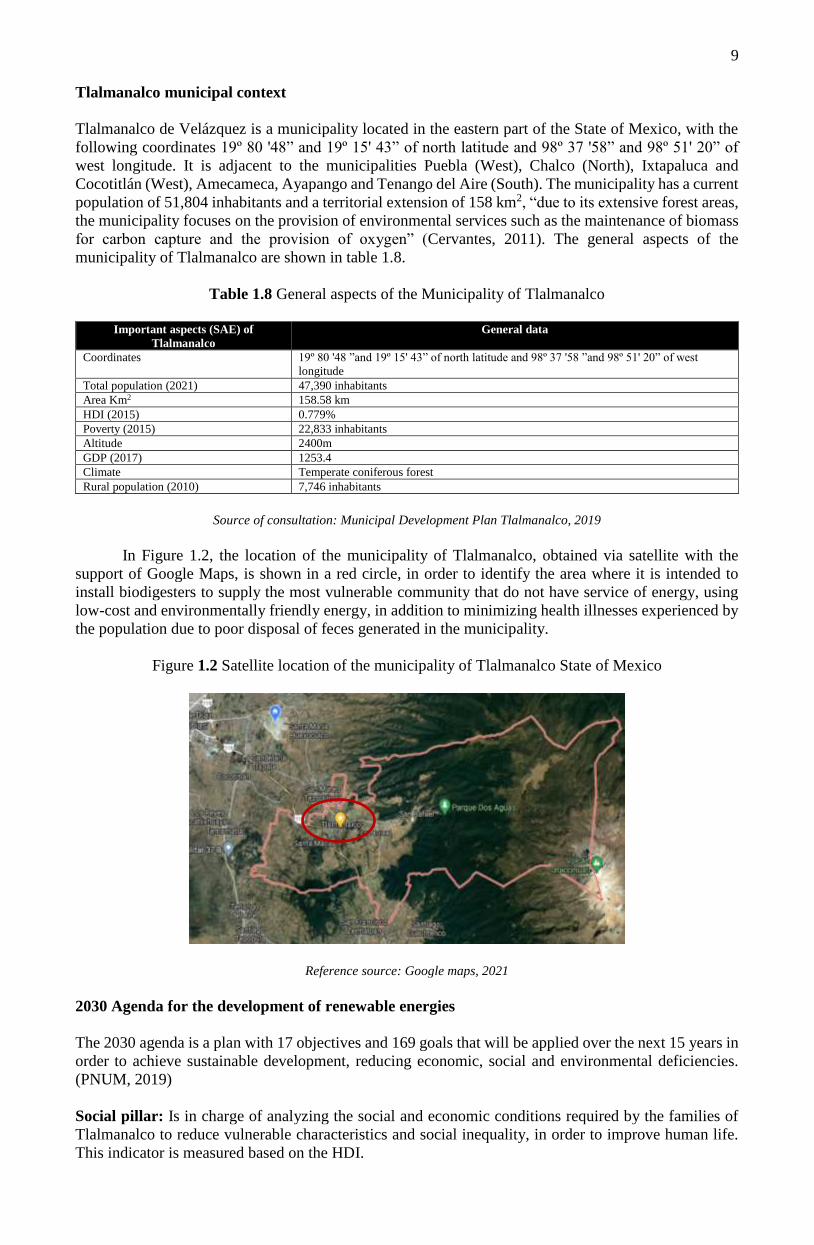
In Figure 1.2, the location of the municipality of Tlalmanalco, obtained via satellite with the
support of Google Maps, is shown in a red circle, in order to identify the area where it is intended to
install biodigesters to supply the most vulnerable community that do not have service of energy, using
low-cost and environmentally friendly energy, in addition to minimizing health illnesses experienced by
the population due to poor disposal of feces generated in the municipality.
Figure 1.2 Satellite location of the municipality of Tlalmanalco State of Mexico
Reference source: Google maps, 2021
2030 Agenda for the development of renewable energies
The 2030 agenda is a plan with 17 objectives and 169 goals that will be applied over the next 15 years in
order to achieve sustainable development, reducing economic, social and environmental deficiencies.
(PNUM, 2019)
Social pillar: Is in charge of analyzing the social and economic conditions required by the families of
Tlalmanalco to reduce vulnerable characteristics and social inequality, in order to improve human life.
This indicator is measured based on the HDI.
10
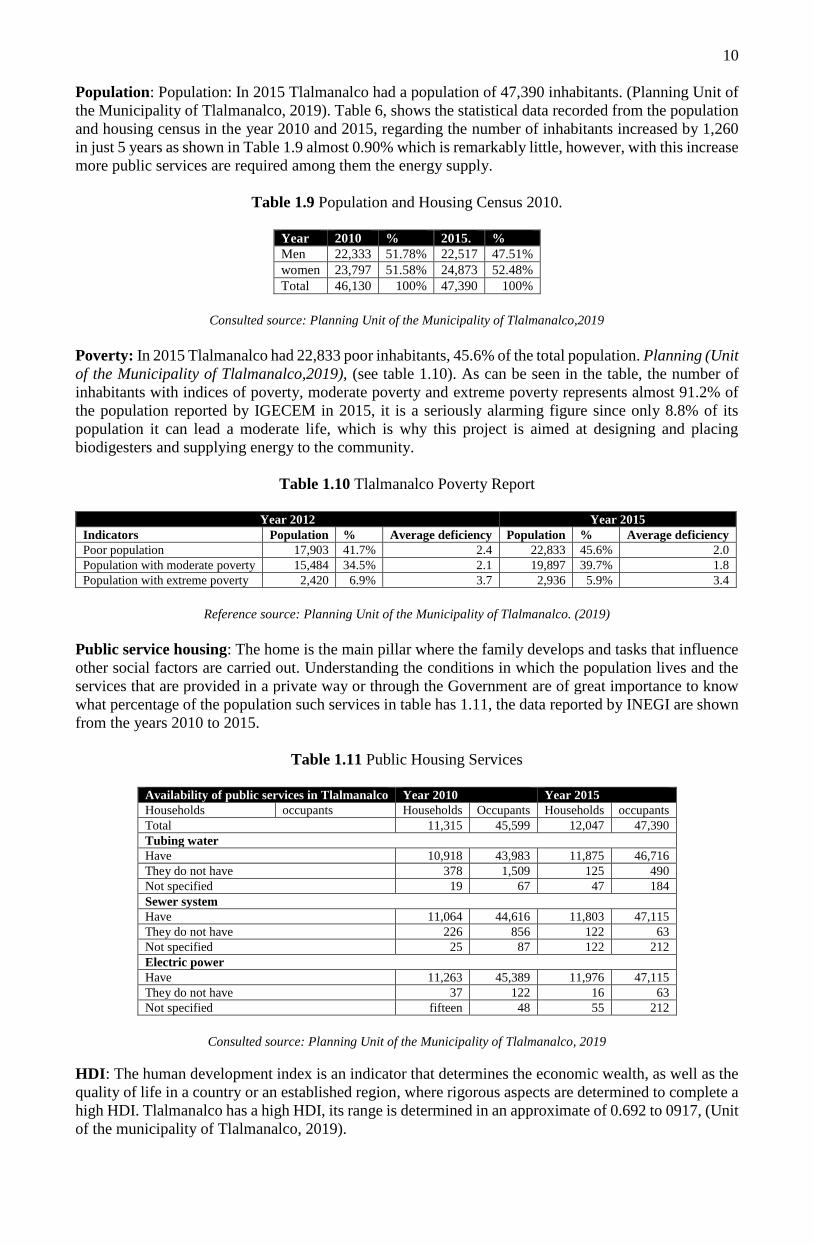
Population: Population: In 2015 Tlalmanalco had a population of 47,390 inhabitants. (Planning Unit of
the Municipality of Tlalmanalco, 2019). Table 6, shows the statistical data recorded from the population
and housing census in the year 2010 and 2015, regarding the number of inhabitants increased by 1,260
in just 5 years as shown in Table 1.9 almost 0.90% which is remarkably little, however, with this increase
more public services are required among them the energy supply.
Table 1.9 Population and Housing Census 2010.
Year 2010 % 2015. %
Men 22,333 51.78% 22,517 47.51%
women 23,797 51.58% 24,873 52.48%
Total 46,130 100% 47,390 100%
Consulted source: Planning Unit of the Municipality of Tlalmanalco,2019
Poverty: In 2015 Tlalmanalco had 22,833 poor inhabitants, 45.6% of the total population. Planning (Unit
of the Municipality of Tlalmanalco,2019), (see table 1.10). As can be seen in the table, the number of
inhabitants with indices of poverty, moderate poverty and extreme poverty represents almost 91.2% of
the population reported by IGECEM in 2015, it is a seriously alarming figure since only 8.8% of its
population it can lead a moderate life, which is why this project is aimed at designing and placing
biodigesters and supplying energy to the community.
Table 1.10 Tlalmanalco Poverty Report
Year 2012 Year 2015
Indicators Population % Average deficiency Population % Average deficiency
Poor population 17,903 41.7% 2.4 22,833 45.6% 2.0
Population with moderate poverty 15,484 34.5% 2.1 19,897 39.7% 1.8
Population with extreme poverty 2,420 6.9% 3.7 2,936 5.9% 3.4
Reference source: Planning Unit of the Municipality of Tlalmanalco. (2019)
Public service housing: The home is the main pillar where the family develops and tasks that influence
other social factors are carried out. Understanding the conditions in which the population lives and the
services that are provided in a private way or through the Government are of great importance to know
what percentage of the population such services in table has 1.11, the data reported by INEGI are shown
from the years 2010 to 2015.
Table 1.11 Public Housing Services
Availability of public services in Tlalmanalco Year 2010 Year 2015
Households occupants Households Occupants Households occupants
Total 11,315 45,599 12,047 47,390
Tubing water
Have 10,918 43,983 11,875 46,716
They do not have 378 1,509 125 490
Not specified 19 67 47 184
Sewer system
Have 11,064 44,616 11,803 47,115
They do not have 226 856 122 63
Not specified 25 87 122 212
Electric power
Have 11,263 45,389 11,976 47,115
They do not have 37 122 16 63
Not specified fifteen 48 55 212
Consulted source: Planning Unit of the Municipality of Tlalmanalco, 2019
HDI: The human development index is an indicator that determines the economic wealth, as well as the
quality of life in a country or an established region, where rigorous aspects are determined to complete a
high HDI. Tlalmanalco has a high HDI, its range is determined in an approximate of 0.692 to 0917, (Unit
of the municipality of Tlalmanalco, 2019).
11
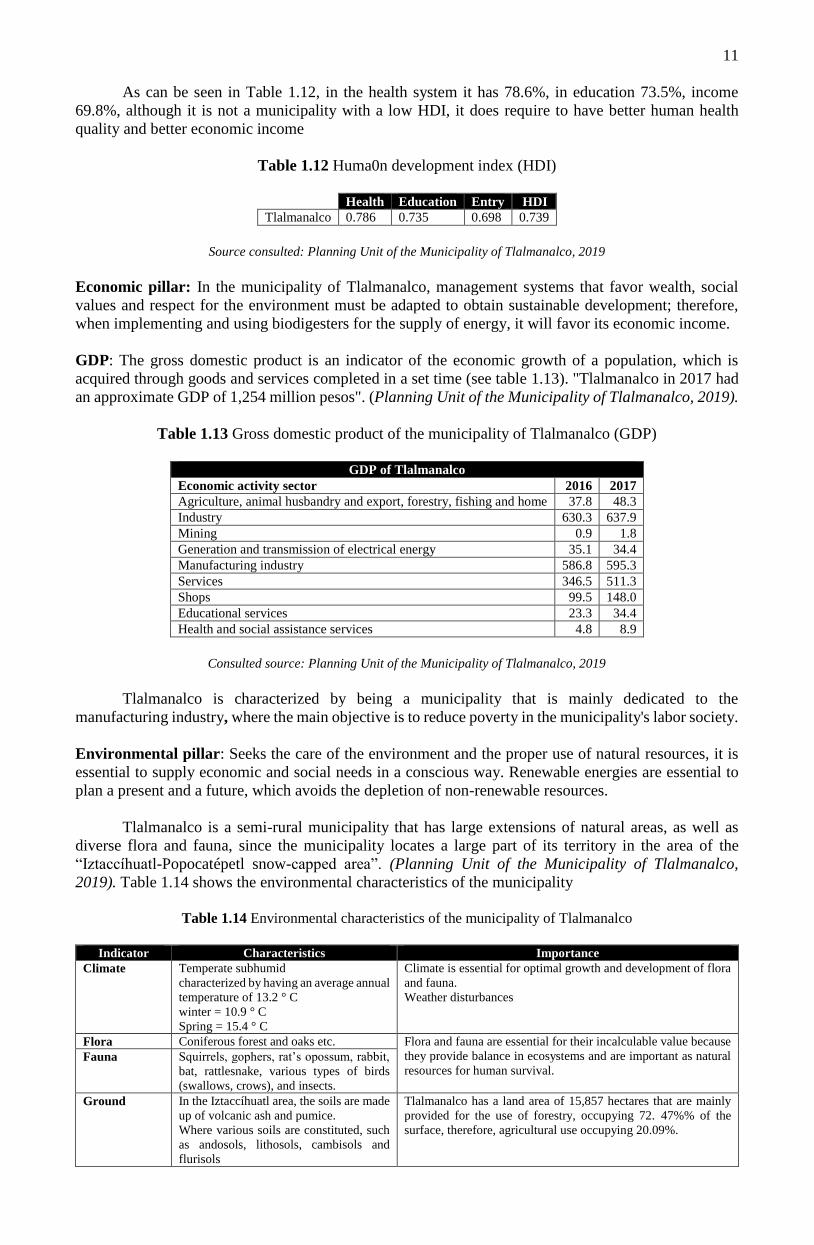
As can be seen in Table 1.12, in the health system it has 78.6%, in education 73.5%, income
69.8%, although it is not a municipality with a low HDI, it does require to have better human health
quality and better economic income
Table 1.12 Huma0n development index (HDI)
Health Education Entry HDI
Tlalmanalco 0.786 0.735 0.698 0.739
Source consulted: Planning Unit of the Municipality of Tlalmanalco, 2019
Economic pillar: In the municipality of Tlalmanalco, management systems that favor wealth, social
values and respect for the environment must be adapted to obtain sustainable development; therefore,
when implementing and using biodigesters for the supply of energy, it will favor its economic income.
GDP: The gross domestic product is an indicator of the economic growth of a population, which is
acquired through goods and services completed in a set time (see table 1.13). "Tlalmanalco in 2017 had
an approximate GDP of 1,254 million pesos". (Planning Unit of the Municipality of Tlalmanalco, 2019).
Table 1.13 Gross domestic product of the municipality of Tlalmanalco (GDP)
GDP of Tlalmanalco
Economic activity sector 2016 2017
Agriculture, animal husbandry and export, forestry, fishing and home 37.8 48.3
Industry 630.3 637.9
Mining 0.9 1.8
Generation and transmission of electrical energy 35.1 34.4
Manufacturing industry 586.8 595.3
Services 346.5 511.3
Shops 99.5 148.0
Educational services 23.3 34.4
Health and social assistance services 4.8 8.9
Consulted source: Planning Unit of the Municipality of Tlalmanalco, 2019
Tlalmanalco is characterized by being a municipality that is mainly dedicated to the
manufacturing industry, where the main objective is to reduce poverty in the municipality's labor society.
Environmental pillar: Seeks the care of the environment and the proper use of natural resources, it is
essential to supply economic and social needs in a conscious way. Renewable energies are essential to
plan a present and a future, which avoids the depletion of non-renewable resources.
Tlalmanalco is a semi-rural municipality that has large extensions of natural areas, as well as
diverse flora and fauna, since the municipality locates a large part of its territory in the area of the
“Iztaccíhuatl-Popocatépetl snow-capped area”. (Planning Unit of the Municipality of Tlalmanalco,
2019). Table 1.14 shows the environmental characteristics of the municipality
Table 1.14 Environmental characteristics of the municipality of Tlalmanalco
Indicator Characteristics Importance
Climate Temperate subhumid
characterized by having an average annual
temperature of 13.2 ° C
winter = 10.9 ° C
Spring = 15.4 ° C
Climate is essential for optimal growth and development of flora
and fauna.
Weather disturbances
Flora Coniferous forest and oaks etc. Flora and fauna are essential for their incalculable value because
they provide balance in ecosystems and are important as natural
resources for human survival. Fauna Squirrels, gophers, rat’s opossum, rabbit,
bat, rattlesnake, various types of birds
(swallows, crows), and insects.
Ground In the Iztaccíhuatl area, the soils are made
up of volcanic ash and pumice.
Where various soils are constituted, such
as andosols, lithosols, cambisols and
flurisols
Tlalmanalco has a land area of 15,857 hectares that are mainly
provided for the use of forestry, occupying 72. 47%% of the
surface, therefore, agricultural use occupying 20.09%.

12
Hydrography Sub-basin the company.
Micro-basin of San Lorenzo Tlaminilolpa
San Rafael micro-basin
Water is a primary resource for the development of activities and
survival of the inhabitants of Tlamanalco. For this reason,
responsible use is essential, to avoid contamination, damage to
bodies of water.
Forest
resources
Tlalmanalco has 10,600 hectares of forest
occupying more than 50% of the total
area.
Forest resources are generally used as raw material to transform
cellulose into paper, or as fuel to heat food.
Uncontrolled degradation and deforestation are a matter of great
concern for the inhabitants of Tlalmanalco
Consulted source: (Zamorano, 2009; INAFED, 2010; Planning Unit of the Municipality of Tlalmanalco, 2019)
Low cost biodigester
Low-cost biodigesters have been stablished in developing countries since the 1980s. The first model to
be implemented was the red mud PVC, later several flexible tubular models were developed, leading to
the development of several low cost biodigester models, they lack complex technological systems
(stirring and heating systems), and that are adapted to the use of cheap and easy-to-transport materials,
to satisfy the demand in rural populations that do not have the necessary sanitary sanitation services,
and/or the lack of a comprehensive waste management system (SIGR). They are ideal for domestic use
in small farms (agricultural), and/or for the treatment of fecal waste and urine with the use of latrines, In
order to obtain biogas that can be used as bioenergetics, they also help prevent the transmission of
diseases from the mismanagement of waste spread during the volatilization of pathogenic materials that
are transmitted to human beings; That is why these biodigesters help to carry out a comprehensive and
controlled treatment of waste, whether of agricultural and/or human origin (Martí, 2019).
Its implementation and use are a good alternative to reduce the consumption of firewood in the
kitchen and stop producing high amounts of carbon dioxide (CO2) that affects the respiratory tract, causes
headaches, causes seizures and in extreme cases death, in addition to reducing the physical work of the
peasant, thus avoiding long-term diseases caused by poor posture or excessive load. This technology
allows the control of the biodigestion process avoiding the transmission of infectious microorganisms
from organic waste, since feces of animal and human origin contain various pathogens that cause
alterations in human health, which are shown in table 1.15. Providing with this, welfare of the population,
having clean energy helps the family economy.
Table 1.15 Pathogens that may be present in stool and associated symptoms
Group Pathogens Symptoms
Bacteria
Aeromas spp Enteritis
Campylobacter jenuni / coli Camylobacteriosis, diarrhea, colic, abdominal pain, fever, nausea,
arthritis, Gullain syndrome, Barre
Eschererichia coli (EIEC, EPEC,
ETEC, EHEC)
Enteritis, with the EHEC variety, there may be even fatal internal
bleeding
Salmonella typhi / paratyphi Fever, typhoid / paratyphoid, headache, fever, malaise, anorexia,
bradycardia, splenomegaly, cough
Salmonella pp Salmonellosis, diarrhea, fever, abdominal colic
Shingella spp Shingellosis, dysentery (bloody diarrhea), vomiting, colic, fever,
Reiter's syndrome
Vibrio cholera Cholera, acute diarrhea, fatal if severe and untreated
Virus
Adenovirus Various respiratory problems, some varieties attack the intestines
Enteric adenovirus, type 40 and 41 Enteritis
Hepatitis A Hepatitis, fever, malaise, anorexia, nausea, abdominal pain, jaundice
Rotavirus Enteritis
Protozoan
parasite
Cryptosporidium parvum Cryptosporidiosis, acute diarrhea, abdominal colic, pain
Cyclospora histolytica Diarrhea, abdominal pain
Helminths
Ascaris lumbricoides Usually without symptoms, sometimes wheezing, fever, enteritis,
pulmonary eosinophilia
Taenia solium / saginata Taeniasis
Trichuris Trichura Trichuriasis, without symptoms or general digestive upset, wasting
with dry skin and diarrhea
Source consulted: Strande, et al., 2014
13
The installation of biodigesters represents various social challenges, such as the recycling of
organic waste, which allows obtaining biogas, this is not entirely accepted by diverse groups of
inhabitants for reasons of religion that does not allow the handling of animal fecal matter and/or stigma,
they do not share the use of these systems. In order to implement these low-cost structures and educate
populations that are not interested in the subject, it is necessary to disseminate and design procedures
within communities so that they can see how they work.
Although the design of the project is essentially good, the consumer must be constant in the
maintenance of the scheme so that the obtaining of biogas is adequate, if the necessary care is not taken,
the project can fail with a great economic loss and if the biodigester is not dismantled It can cause
contamination in the area it is located, unfortunately in Mexico projects of this type have been abandoned
due to lack of economic resources or of interest on the part of the population or municipalities.
Regarding the governmental and management aspects, should consider planning improvements
in obtaining energy and fuels through the implementation of technologies that are friendly to the
environment and that are accessible to all the inhabitants of Tlalmanalco. In the case of low-cost tubular
biodigesters, the Government and society as a whole will have to adapt to new changes in the
management systems, to obtain mutual benefits, giving way to a future that is adapted to the needs of
clean energy, to ensure the precepts of the 2030 agenda, achieving the use of biomass in biogas generation
supporting sustainable development.
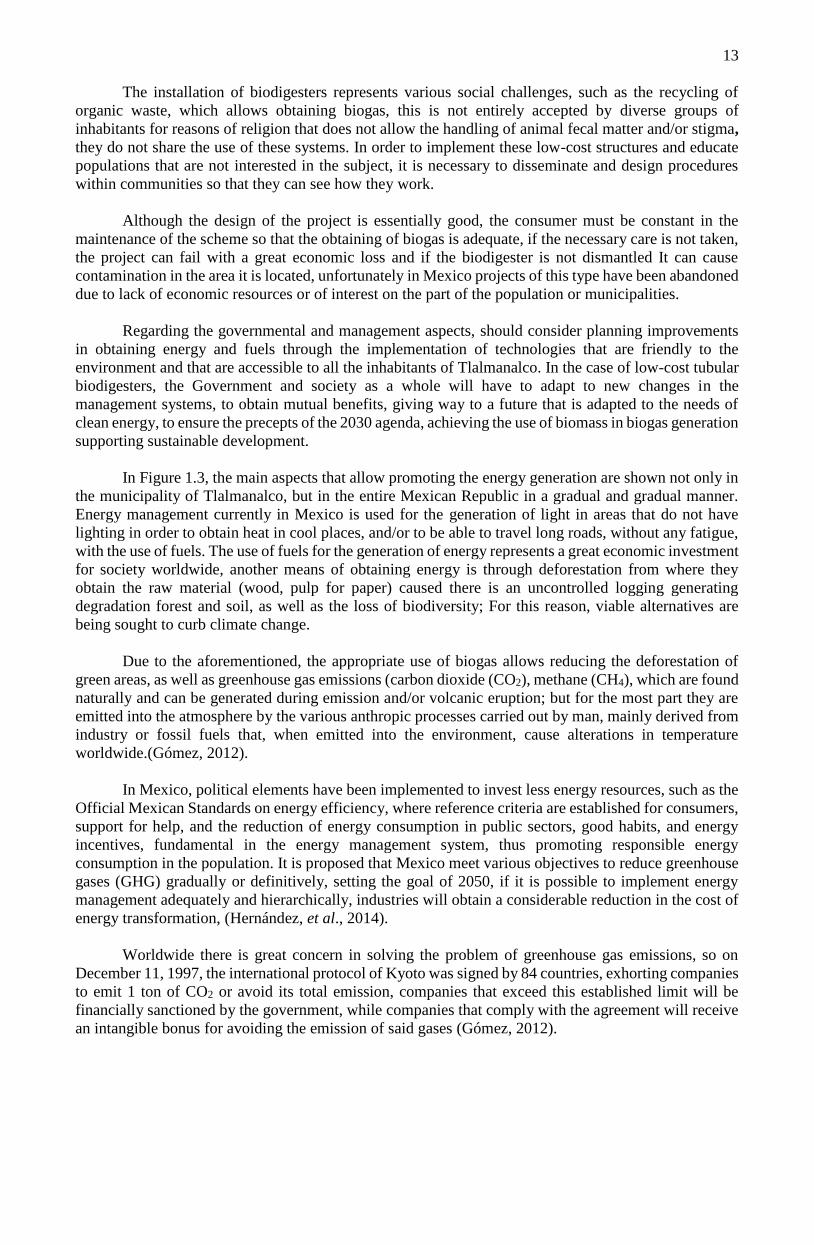
In Figure 1.3, the main aspects that allow promoting the energy generation are shown not only in
the municipality of Tlalmanalco, but in the entire Mexican Republic in a gradual and gradual manner.
Energy management currently in Mexico is used for the generation of light in areas that do not have
lighting in order to obtain heat in cool places, and/or to be able to travel long roads, without any fatigue,
with the use of fuels. The use of fuels for the generation of energy represents a great economic investment
for society worldwide, another means of obtaining energy is through deforestation from where they
obtain the raw material (wood, pulp for paper) caused there is an uncontrolled logging generating
degradation forest and soil, as well as the loss of biodiversity; For this reason, viable alternatives are
being sought to curb climate change.
Due to the aforementioned, the appropriate use of biogas allows reducing the deforestation of
green areas, as well as greenhouse gas emissions (carbon dioxide (CO2), methane (CH4), which are found
naturally and can be generated during emission and/or volcanic eruption; but for the most part they are
emitted into the atmosphere by the various anthropic processes carried out by man, mainly derived from
industry or fossil fuels that, when emitted into the environment, cause alterations in temperature
worldwide.(Gómez, 2012).
In Mexico, political elements have been implemented to invest less energy resources, such as the
Official Mexican Standards on energy efficiency, where reference criteria are established for consumers,
support for help, and the reduction of energy consumption in public sectors, good habits, and energy
incentives, fundamental in the energy management system, thus promoting responsible energy
consumption in the population. It is proposed that Mexico meet various objectives to reduce greenhouse
gases (GHG) gradually or definitively, setting the goal of 2050, if it is possible to implement energy
management adequately and hierarchically, industries will obtain a considerable reduction in the cost of
energy transformation, (Hernández, et al., 2014).
Worldwide there is great concern in solving the problem of greenhouse gas emissions, so on
December 11, 1997, the international protocol of Kyoto was signed by 84 countries, exhorting companies
to emit 1 ton of CO2 or avoid its total emission, companies that exceed this established limit will be
financially sanctioned by the government, while companies that comply with the agreement will receive
an intangible bonus for avoiding the emission of said gases (Gómez, 2012).
14
Figure 1.3 Boost scheme energy management
Source consulted: Hernández, et al., 2014
The design and implementation of this type of project must be carried out by people specialized
in the area and have the necessary knowledge to obtain favorable results, during planning the first thing
to be done is to choose the correct area to make the trench where the pipe will be installed. biodigester
for this, the following points must be taken into account:
The installation should not be carried out in areas close to flammable material, nor removed from
the house (do not use unnecessary material)
Do not place in an area where infants usually carry out their activities, or muddy areas where the
earth can cause landslides.
Delimit the area with bars or obstacles to avoid any accident.
If its usefulness is predetermined for the use of stoves, it is important to place it with an
unevenness with respect to the kitchen, this because the gas flows better from the bottom to the
top.
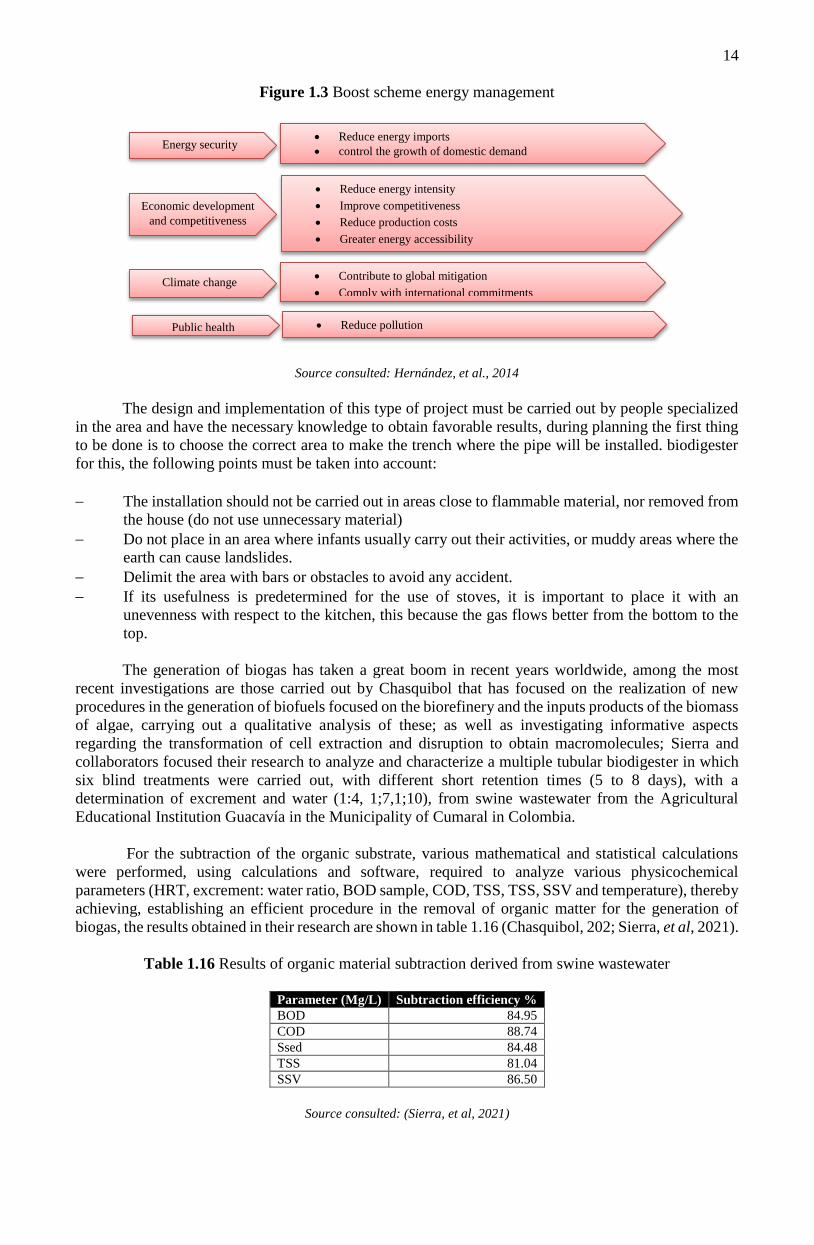
The generation of biogas has taken a great boom in recent years worldwide, among the most
recent investigations are those carried out by Chasquibol that has focused on the realization of new
procedures in the generation of biofuels focused on the biorefinery and the inputs products of the biomass
of algae, carrying out a qualitative analysis of these; as well as investigating informative aspects
regarding the transformation of cell extraction and disruption to obtain macromolecules; Sierra and
collaborators focused their research to analyze and characterize a multiple tubular biodigester in which
six blind treatments were carried out, with different short retention times (5 to 8 days), with a
determination of excrement and water (1:4, 1;7,1;10), from swine wastewater from the Agricultural
Educational Institution Guacavía in the Municipality of Cumaral in Colombia.
For the subtraction of the organic substrate, various mathematical and statistical calculations
were performed, using calculations and software, required to analyze various physicochemical
parameters (HRT, excrement: water ratio, BOD sample, COD, TSS, TSS, SSV and temperature), thereby
achieving, establishing an efficient procedure in the removal of organic matter for the generation of
biogas, the results obtained in their research are shown in table 1.16 (Chasquibol, 202; Sierra, et al, 2021).
Table 1.16 Results of organic material subtraction derived from swine wastewater
Parameter (Mg/L) Subtraction efficiency %
BOD 84.95
COD 88.74
Ssed 84.48
TSS 81.04
SSV 86.50
Source consulted: (Sierra, et al, 2021)
Economic development
and competitiveness
Climate change
Public health
Energy security Reduce energy imports
control the growth of domestic demand
Reduce energy intensity
Improve competitiveness
Reduce production costs
Greater energy accessibility
Contribute to global mitigation
Comply with international commitments
Reduce pollution
15
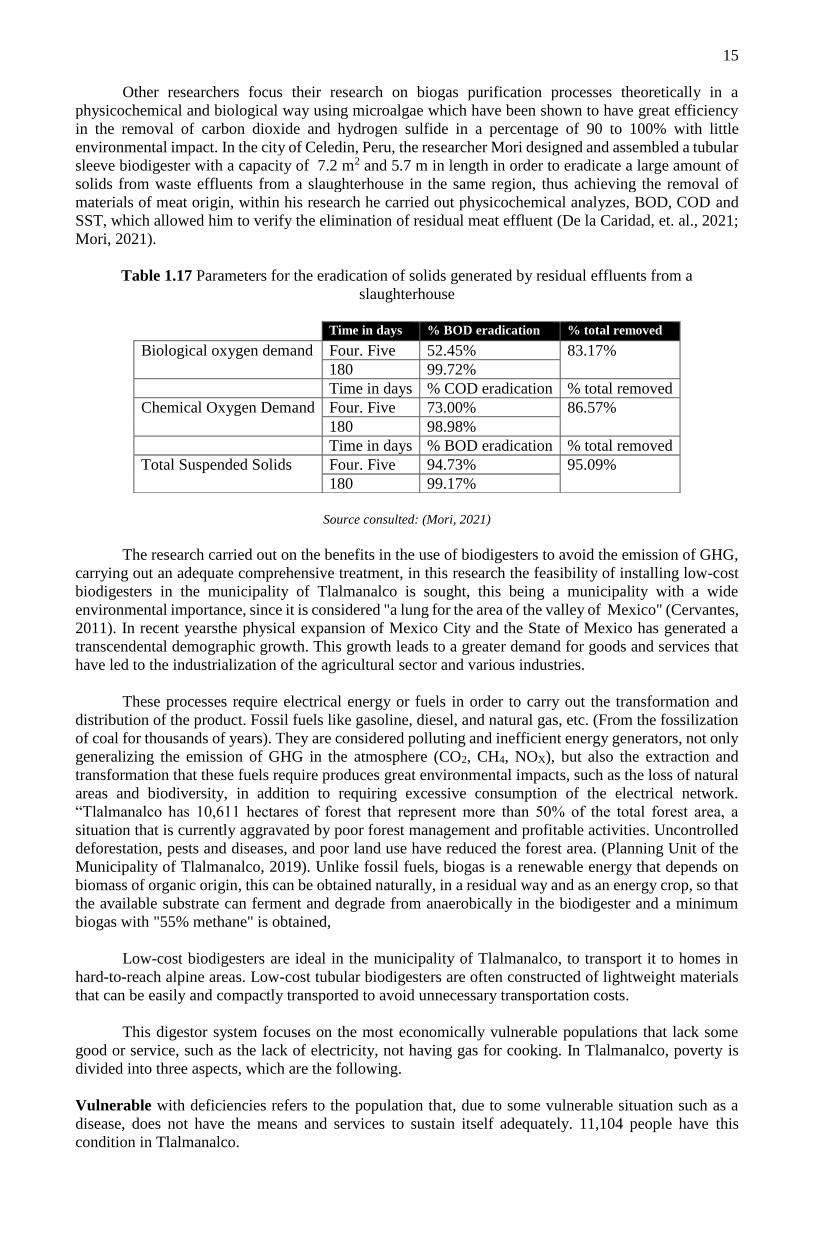
Other researchers focus their research on biogas purification processes theoretically in a
physicochemical and biological way using microalgae which have been shown to have great efficiency
in the removal of carbon dioxide and hydrogen sulfide in a percentage of 90 to 100% with little
environmental impact. In the city of Celedin, Peru, the researcher Mori designed and assembled a tubular
sleeve biodigester with a capacity of 7.2 m2 and 5.7 m in length in order to eradicate a large amount of
solids from waste effluents from a slaughterhouse in the same region, thus achieving the removal of
materials of meat origin, within his research he carried out physicochemical analyzes, BOD, COD and
SST, which allowed him to verify the elimination of residual meat effluent (De la Caridad, et. al., 2021;
Mori, 2021).
Table 1.17 Parameters for the eradication of solids generated by residual effluents from a
slaughterhouse
Source consulted: (Mori, 2021)
The research carried out on the benefits in the use of biodigesters to avoid the emission of GHG,
carrying out an adequate comprehensive treatment, in this research the feasibility of installing low-cost
biodigesters in the municipality of Tlalmanalco is sought, this being a municipality with a wide
environmental importance, since it is considered "a lung for the area of the valley of Mexico" (Cervantes,
2011). In recent yearsthe physical expansion of Mexico City and the State of Mexico has generated a
transcendental demographic growth. This growth leads to a greater demand for goods and services that
have led to the industrialization of the agricultural sector and various industries.
These processes require electrical energy or fuels in order to carry out the transformation and
distribution of the product. Fossil fuels like gasoline, diesel, and natural gas, etc. (From the fossilization
of coal for thousands of years). They are considered polluting and inefficient energy generators, not only
generalizing the emission of GHG in the atmosphere (CO2, CH4, NOX), but also the extraction and
transformation that these fuels require produces great environmental impacts, such as the loss of natural
areas and biodiversity, in addition to requiring excessive consumption of the electrical network.
“Tlalmanalco has 10,611 hectares of forest that represent more than 50% of the total forest area, a
situation that is currently aggravated by poor forest management and profitable activities. Uncontrolled
deforestation, pests and diseases, and poor land use have reduced the forest area. (Planning Unit of the
Municipality of Tlalmanalco, 2019). Unlike fossil fuels, biogas is a renewable energy that depends on
biomass of organic origin, this can be obtained naturally, in a residual way and as an energy crop, so that
the available substrate can ferment and degrade from anaerobically in the biodigester and a minimum
biogas with "55% methane" is obtained,
Low-cost biodigesters are ideal in the municipality of Tlalmanalco, to transport it to homes in
hard-to-reach alpine areas. Low-cost tubular biodigesters are often constructed of lightweight materials
that can be easily and compactly transported to avoid unnecessary transportation costs.
This digestor system focuses on the most economically vulnerable populations that lack some
good or service, such as the lack of electricity, not having gas for cooking. In Tlalmanalco, poverty is
divided into three aspects, which are the following.
Vulnerable with deficiencies refers to the population that, due to some vulnerable situation such as a
disease, does not have the means and services to sustain itself adequately. 11,104 people have this
condition in Tlalmanalco.
Time in days % BOD eradication % total removed
Biological oxygen demand Four. Five 52.45% 83.17%
180 99.72%
Time in days % COD eradication % total removed
Chemical Oxygen Demand Four. Five 73.00% 86.57%
180 98.98%
Time in days % BOD eradication % total removed
Total Suspended Solids Four. Five 94.73% 95.09%
180 99.17%
16
Moderate poverty: has poverty, but still has income. 19,897 people have this condition in Tlalmanalco.
Extreme poverty: population with lower income capacity 2936 people have this condition in
Tlalmanalco. (CONEVAL, 2015).
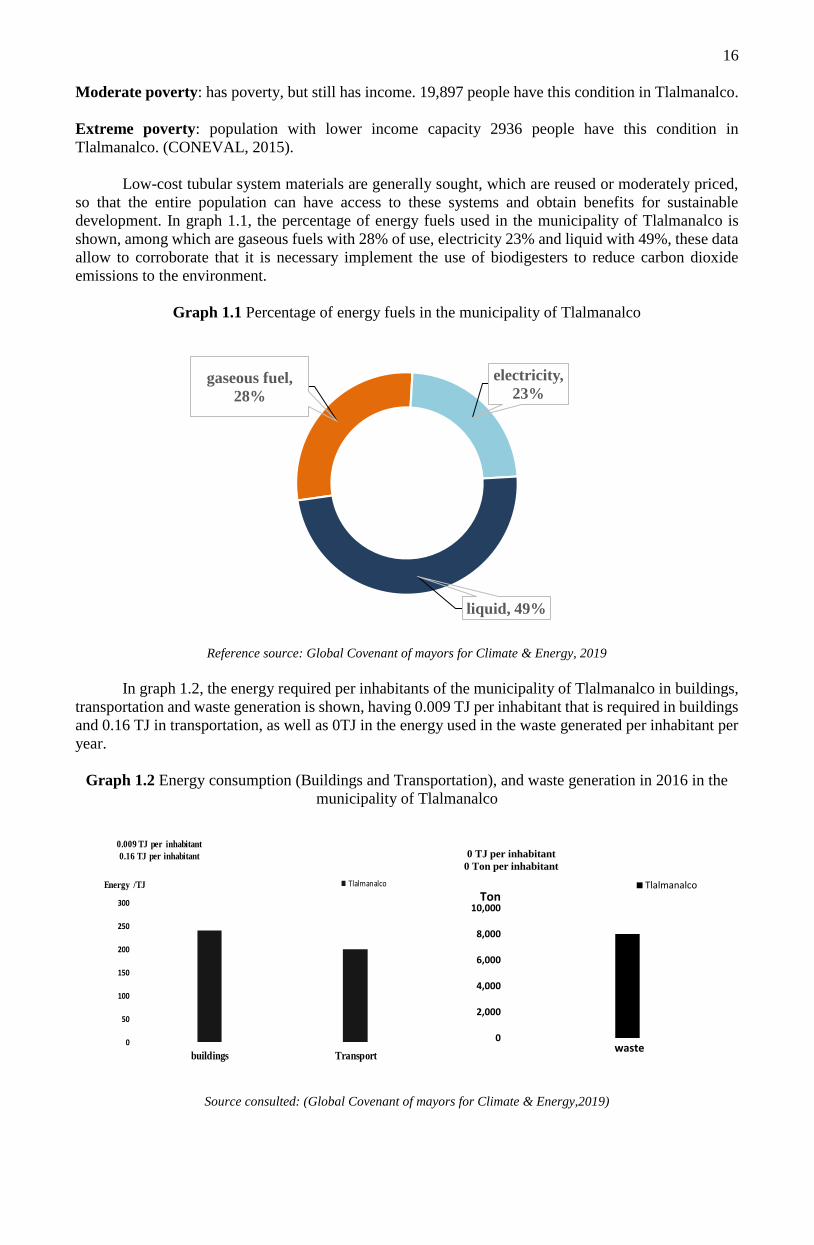
Low-cost tubular system materials are generally sought, which are reused or moderately priced,
so that the entire population can have access to these systems and obtain benefits for sustainable
development. In graph 1.1, the percentage of energy fuels used in the municipality of Tlalmanalco is
shown, among which are gaseous fuels with 28% of use, electricity 23% and liquid with 49%, these data
allow to corroborate that it is necessary implement the use of biodigesters to reduce carbon dioxide
emissions to the environment.
Graph 1.1 Percentage of energy fuels in the municipality of Tlalmanalco
Reference source: Global Covenant of mayors for Climate & Energy, 2019
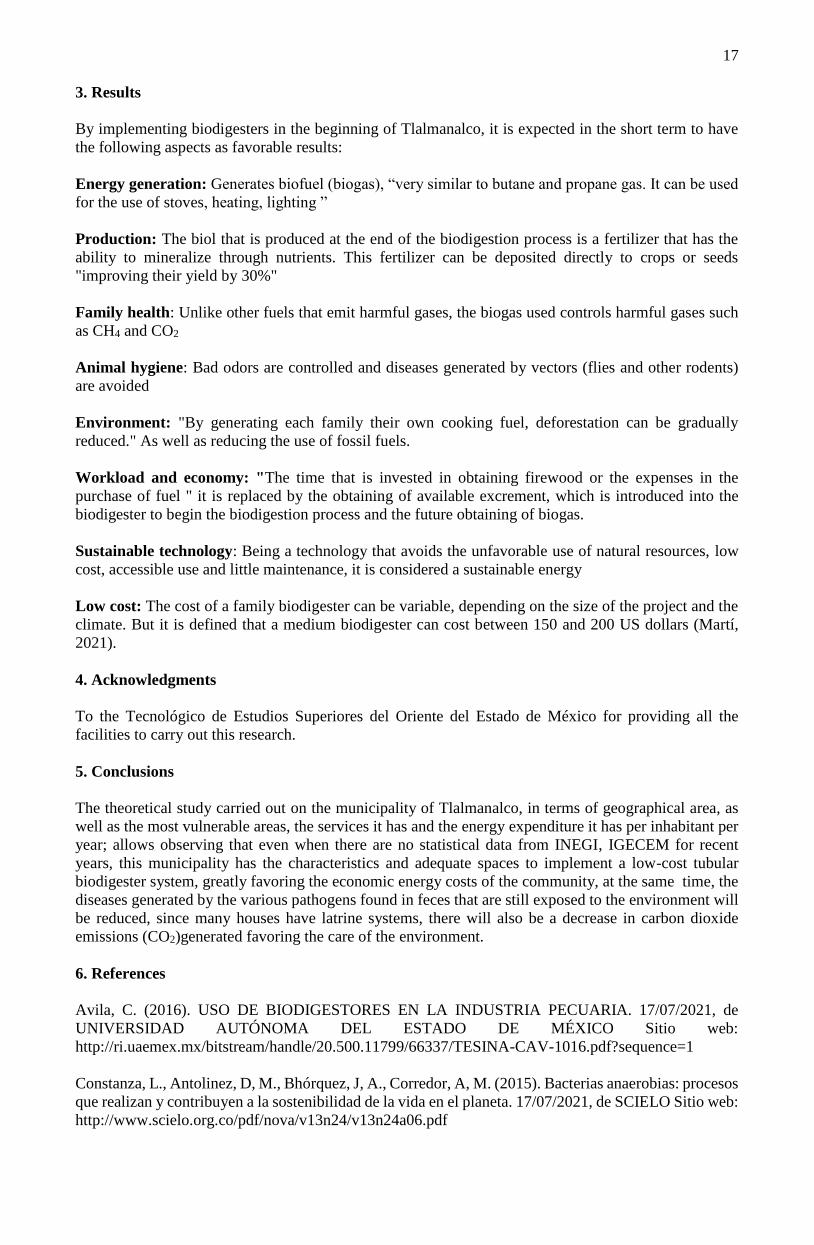
In graph 1.2, the energy required per inhabitants of the municipality of Tlalmanalco in buildings,
transportation and waste generation is shown, having 0.009 TJ per inhabitant that is required in buildings
and 0.16 TJ in transportation, as well as 0TJ in the energy used in the waste generated per inhabitant per
year.
Graph 1.2 Energy consumption (Buildings and Transportation), and waste generation in 2016 in the
municipality of Tlalmanalco
0
50
100
150
200
250
300
buildings Transport
Energy /TJ
0.009 TJ per inhabitant
0.16 TJ per inhabitant
Tlalmanalco
Source consulted: (Global Covenant of mayors for Climate & Energy,2019)
gaseous fuel,
28%
electricity,
23%
liquid, 49%
0
2,000
4,000
6,000
8,000
10,000Ton
0 TJ per inhabitant
0 Ton per inhabitant
Tlalmanalco
waste
17
3. Results
By implementing biodigesters in the beginning of Tlalmanalco, it is expected in the short term to have
the following aspects as favorable results:
Energy generation: Generates biofuel (biogas), “very similar to butane and propane gas. It can be used
for the use of stoves, heating, lighting ”
Production: The biol that is produced at the end of the biodigestion process is a fertilizer that has the
ability to mineralize through nutrients. This fertilizer can be deposited directly to crops or seeds
"improving their yield by 30%"
Family health: Unlike other fuels that emit harmful gases, the biogas used controls harmful gases such
as CH4 and CO2
Animal hygiene: Bad odors are controlled and diseases generated by vectors (flies and other rodents)
are avoided
Environment: "By generating each family their own cooking fuel, deforestation can be gradually
reduced." As well as reducing the use of fossil fuels.
Workload and economy: "The time that is invested in obtaining firewood or the expenses in the
purchase of fuel " it is replaced by the obtaining of available excrement, which is introduced into the
biodigester to begin the biodigestion process and the future obtaining of biogas.
Sustainable technology: Being a technology that avoids the unfavorable use of natural resources, low
cost, accessible use and little maintenance, it is considered a sustainable energy
Low cost: The cost of a family biodigester can be variable, depending on the size of the project and the
climate. But it is defined that a medium biodigester can cost between 150 and 200 US dollars (Martí,
2021).
4. Acknowledgments
To the Tecnológico de Estudios Superiores del Oriente del Estado de México for providing all the
facilities to carry out this research.
5. Conclusions
The theoretical study carried out on the municipality of Tlalmanalco, in terms of geographical area, as
well as the most vulnerable areas, the services it has and the energy expenditure it has per inhabitant per
year; allows observing that even when there are no statistical data from INEGI, IGECEM for recent
years, this municipality has the characteristics and adequate spaces to implement a low-cost tubular
biodigester system, greatly favoring the economic energy costs of the community, at the same time, the
diseases generated by the various pathogens found in feces that are still exposed to the environment will
be reduced, since many houses have latrine systems, there will also be a decrease in carbon dioxide
emissions (CO2)generated favoring the care of the environment.
6. References
Avila, C. (2016). USO DE BIODIGESTORES EN LA INDUSTRIA PECUARIA. 17/07/2021, de
UNIVERSIDAD AUTÓNOMA DEL ESTADO DE MÉXICO Sitio web:
http://ri.uaemex.mx/bitstream/handle/20.500.11799/66337/TESINA-CAV-1016.pdf?sequence=1
Constanza, L., Antolinez, D, M., Bhórquez, J, A., Corredor, A, M. (2015). Bacterias anaerobias: procesos
que realizan y contribuyen a la sostenibilidad de la vida en el planeta. 17/07/2021, de SCIELO Sitio web:
http://www.scielo.org.co/pdf/nova/v13n24/v13n24a06.pdf
18
Canales, M, C., Rivas, L, A., Sorto, R, J. (2010). ESTUDIO DEL PROCESO BIOQUIMICO DE
FERMENTACION EN DIGESTORES PARA LA PRODUCCION DE BIOGAS Y
BIOFERTILIZANTE A PARTIR DE RESIDUOS ORGANICOS PROVENIENTES DEL CAMPUS
DE LA UNIVERSIDAD DE EL SALVADOR. 14/08/2021, de UNIVERSIDAD DE EL SALVADOR
Sitio web: http://ri.ues.edu.sv/id/eprint/138/1/10136039.pdf
Corona, I. (2007). Biodigestores. 26/03/2021, de UAEH Sitio web:
https://repository.uaeh.edu.mx/bitstream/bitstream/handle/123456789/10722/Biodigestores.pdf?sequen
ce=1
Cervantes, A. (2011). El proceso de urbanización en el municipio de Tlalmanalco. 10/03/2021, de UAM
Sitio web: http://hdl.handle.net/11191/626
CONEVAL. (2015). Informe anual sobre la situación de pobreza y rezago social Tlalmanalco.
10/03/2021, de Gobierno de México Sitio web:
https://www.gob.mx/cms/uploads/attachment/file/611599/Informe_anual_2021_mun_15103.pdf
Chasquibol Calongos, S. D. (2021). Revisión de las técnicas de producción de biocombustibles a partir
de microalgas.
De la Caridad Brunet-Ramos, S., Jiménez-Hernández, J., Pedraza-Gárciga, J., & López-González, L. M.
(2021). Consorcios de microalgas-bacterias para la purificación biológica de biogás. Tecnología
Química, 41(2), 277-295.
Gómez, S. (2012). DISEÑO, CONSTRUCCIÓN Y PUESTA A PUNTO DE UN BIODIGESTOR
TUBULAR. 27/03/2021, de Universidad Carlos lll de Madrid Sitio web: https://e-
archivo.uc3m.es/bitstream/handle/10016/17044/PFC_SusanaGomezMunoz.pdf?sequence=1&isAllowe
d=y
Global Covenant of mayors for Climate & Energy. Data Portal for Cities. (2019). Disponible en línea
en: http://www.dataportalforcities.org
Healt. (2016). Hoja informativa de sustancia peligrosa. 28/03/2021, de NJ Healt Sitio web:
https://www.nj.gov/health/eoh/rtkweb/documents/fs/0343sp.pdf
Hernández, P., Carmona, G, E., Flores, L., Sosa, R. (2014). MANUAL PARALA IMPLEMENTACIÓN
DE UN SITEMA DE GESTÓN DE LA ENERGA. 27/03/21, de Cooperación alemana DEUTSCHE
ZUSAMMENARBEIT Sitio web:
https://www.gob.mx/cms/uploads/attachment/file/55467/ManualGestionEnergia_V2_1.pdf
INAFED. (2010). 06/04/2021, de Enciclopedia de Los Municipios y Delegaciones de México Sitio web:
http://www.inafed.gob.mx/work/enciclopedia/EMM15mexico/municipios/15103a.html
Lorenzo, Y., Abreu, M. (2005). La digestión anaerobia. Aspectos teóricos. ICIDCA, XXXIX, 35-48.
León, R, M. (1991). DISEÑO, CALCULOS Y EVALUACIÓN DE BIODIGESTORES. 10/03/2021, de
CORPORACIÓN UNIVERSITARIA AUTONOMA DE OCCIDENTE Sitio web:
https://red.uao.edu.co/bitstream/handle/10614/4773/T0002583.pdf?sequence=1&isAllowed=y
Mori Leyva, K. S. (2021). Eficiencia de un biodigestor tubular en la remoción de la carga orgánica y
sólidos de un efluente del beneficio cárnico, en Celendín.
Martí Herrero J. (2019). Biodigestores Tubulares: Guía de Diseño y manual de instalación Redbiolac.
Ecuador. ISBN:978-9942-36-276-6
Martí, J. (2021). BIODIGESTORES DE BAJO COSTO. 05/04/2021, de IDEASS Sitio web:
https://ecotec.unam.mx/wp-content/uploads/Biodigestores-de-bajo-costo.pdf
19
Olaya, J., Gonzáles, L, O. (2009). FUNDAMENTOS PARA EL DISEÑO DE BIODIGESTORES.
11/03/2021, de UNIVERSIDAD NACIONAL DE COLOMBIA SEDE PALMIRA Sitio web:
repositorio.unal.edu.co/bitstream/handle/unal/10762/luisoctaviogonzalezsalcedo.20121.pdf?sequence=
1&isAllowed=y
Pascual, A., Ruiz, B., Gómez, P., Flotats, X., Belén, F. (2011). SITACIÓN Y PPOTENCIAL DE
GENERACIÓN DE BIOGÁS. 11/07/2021, de IDAE Sitio web:
https://www.idae.es/uploads/documentos/documentos_11227_e16_biogas_db43a675.pdf
PNUM. (2019). EL ENFOQUE DE LA AGENDA 2030 EN PLANES Y PROGRAMAS PÚBLICOS
EN MÉXICO. 27/03/2021, de Agenda 2030 Sitio web:
https://www.undp.org/content/dam/argentina/Publications/Agenda2030/PNUDArgent-DossierODS.pdf
Pérez, J, A. (2010). ESTUDIO Y DISEÑO DE UN BIODIGESTOR PARA APLICACION EN
PEQUEÑOS GANADEROS Y LECHEROS. 10/03/2021, de UNIVERSIDAD DE CHILE Sitio web:
http://repositorio.uchile.cl/bitstream/handle/2250/103926/cf-perez_jm.pdf?sequence=3
Strande, L., Ronteltap, M., Brdjanovic, D. (2014). Manejo de Lodos Fecales Un enfoque sistémico para
su implementación y operación. 05/04/2021, de IWA PUBLISHING Sitio web:
https://www.iwapublishing.com/sites/default/files/ebooks/manejo_fsm.pdf
Sierra, D. F. C., Huertas, D. M. H., & León, H. C. (2021). EVALUACIÓN DE LA EFICIENCIA DE
REMOCIÓN DE MATERIA ORGÁNICA DE UN BIODIGESTOR TUBULAR ANAEROBIO A
ESCALA PILOTO. Ciencia e ingeniería, 5(1), 43-57.
Torres, I., & María, I. A. (2021). Potencial energético de la biomasa residual pecuaria en el Campus de
la UNALM.
Unidad de Planeación del Municipio de Tlalmanalco. (2019). PLAN DE DESARROLLO MUNICIPAL
2019-2021. 10/03/2021, de Gobierno Municipal de Tlalmanalco Sitio web:
https://www.tlalmanalco.gob.mx/pdf_gacetas/68.pdf
Varnero, M, T. (2011). MANUAL DE BIOGÁS. 10/03/2021, de Gobierno de Chile Ministerio de
Energía Sitio web: http://www.fao.org/3/as400s/as400s.pdf
Weber, B., Rojas, M., Torres, M., Pampillón, L. (2012). PRODUCCIÓN DE BIOGÁS EN MÉXICO.
11/03/2021, de Red Mexicana de Bioenergía Sitio web: http://rembio.org.mx/wp-
content/uploads/2014/12/CT5.pdf
Zamorano, P. (2009). La flora y fauna silvestre en México. Estudios agrarios, 15, 159-167
20
Chapter 2 Bifunctional catalysts applied to produce biodiesel from waste cooking oil
Capítulo 2 Catalizadores bifuncionales aplicados a la producción de biodiésel a
partir de aceite de cocina usado
CERÓN-FERRUSCA, Montserrat1*†, ROMERO-ROMERO, Rubi1, NATIVIDAD, Reyna1 and
MARTÍNEZ-VARGAS, Sandra Luz2
1Chemical Engineering Lab., Centro Conjunto de Investigación en Química Sustentable, UAEM-UNAM,
Universidad Autónoma del Estado de México, Km 14.5 Toluca-Atlacomulco Road, Toluca, México,
50200 2Faculty of Chemistry, Universidad Autónoma del Estado de México, Paseo Colón Esq. Paseo Tollocan,
Toluca, México, 50120
ID 1st Author: Montserrat, Cerón-Ferrusca / ORC ID: 0000-0002-3726-6078, CVU CONACYT ID:
1000624
ID 1st Co-author: Rubi, Romero-Romero / ORC ID: 0000-0001-9163-7936, CVU CONACYT ID:
121454
ID 2nd Co-author: Reyna, Natividad / ORC ID: 0000-0001-8978-1066, CVU CONACYT ID: 87755
ID 3rd Co-author: Sandra Luz, Martínez-Vargas / ORC ID: 0000-0001-5078-7225, CVU CONACYT
ID: 280129
DOI: 10.35429/H.2021.6.20.36
M. Cerón, R. Romero, R. Natividad and S. Martínez
A. Marroquín, J. Olivares, M. Ramírez and L. Cruz (Coord) Engineering and Technology. Handbooks-©ECORFAN-México,
Querétaro, 2021.
21
Abstract
This work aims to present the analysis of the catalytic performance of Fe2O3/CaO as a bifunctional
catalyst in the production of biodiesel from waste cooking oil. The clamshell was used as a source of
calcium oxide by calcination. The catalyst was characterized by Thermogravimetric analysis and
Differential scanning calorimetry (TGA-DSC), X-ray diffraction (XRD) and Inductively coupled plasma
atomic emission spectroscopy (ICP-AES). The catalytic tests were conducted at 55 °C, the methanol:oil
ratio was 12:1, amount of catalyst of 6%wt and reaction time of 5 h. The content of methyl esters in the
produced biodiesel was >98% and was found to fulfill the specifications of European Norm UNE-EN
14214.
Biodiesel, Waste cooking oil, Clamshell, Bifunctional, Transesterification
Resumen
El objetivo del presente proyecto fue evaluar el comportamiento catalítico del catalizador bifuncional
Fe2O3/CaO en la obtención de biodiesel a partir de aceite de cocina usado. La concha de mar se utilizó
como fuente alternativa de óxido de calcio por medio de la calcinación de la misma. El catalizador fue
caracterizado por medio del análisis termogravimétrico y calorimetría diferencial de barrido (TGA-
DSC), difracción de rayos X (DRX) y espectroscopia de emisión atómica de plasma acoplado por
inducción (ICP-AES). Las pruebas catalíticas se realizaron a las siguientes condiciones de reacción:
55°C, relación metanol:aceite de 12:1, cantidad de catalizador de 6% en peso y tiempo de reacción de
5h. El biodiesel producido obtuvo un contenido de ésteres metílicos superior al 98%, además de que el
mismo cumple con las especificaciones de la Norma Europea UNE-EN 14214.
Biodiesel, Aceite de reúso, Concha de almeja, Bifuncional, Transesterificación
1. Introduction
It is well known that the current energy sector depends mainly on the use of fossil fuels and together with
globalization, has led to an increase in greenhouse gas emissions (Hafeez et al., 2020). Also, since it is a
non-renewable energy source, the price of fossil fuels has been increasing, while their reserves have been
decreasing. This has motivated the search for less polluting alternatives, such as biodiesel.
Biodiesel is currently considered one of the most viable options coming from a renewable and
clean energy source, since it can be synthesized from various vegetable and / or animal fats (Borah et al.,
2019). In addition, it can be used in diesel engines, because biodiesel has physicochemical properties
similar to petroleum diesel (Lv et al., 2020). However, the main challenge to face in the biodiesel
synthesis, lies in the decrease of its production cost, as well as looking for alternatives to replace edible
oils as a raw lipid source (Khan et al., 2019). Derived from the above, reuse cooking oils have been used
as raw material for obtaining biodiesel. However, most of the current heterogeneous catalysts are not
capable of handling the high content of free fatty acids (FFA) that this type of lipid raw material has,
which makes it necessary to carry out the process of obtaining biodiesel in two separate reactions:
esterification and transesterification, thus increasing biodiesel production costs.
Nowadays, studies referring to heterogeneous catalysis have focused on the search for
bifunctional catalysts, which can handle lipid raw materials such as used cooking oils, due to the fact that
they have two different active sites, one acidic, capable of esterifying free fatty acids and a basic site,
which allows the transesterification of triglycerides, in the same stage. For this, the present work proposes
the use of a bifunctional catalyst based on clam shell waste from restaurants, impregnated with iron.
The originality of this work lies in the identification of the catalytically active iron crystalline
phase for the production of biodiesel, using the reuse cooking oil transesterification reaction, where the
calcination temperature of the catalyst is a determining variable for the identification of said complex,
within which are those corresponding to the system 𝐶𝑎𝑛𝐹𝑒𝑛𝑂2𝑛+1 (1≤𝑛≤2) and are directly related to
oxygen vacancies. The combination of CaO and Fe salt, at the appropriate calcination temperature, will
allow to obtain a bifunctional catalyst.
22
The foregoing has aroused great interest, because:
1. You can give a second use to a waste such as used cooking oils.
2. Decrease in production costs (approximately 60-70% for raw material only).
3. It involves the principles of "Green Chemistry" (Pájaro & Verbel, 2011) such as:
The use of processes that use substances with the least possible toxicity.
Put the use of renewable raw materials first.
The process must be completed in the minimum number of steps, avoiding extra steps.
Prioritize the use of catalyzed reactions over non-catalyzed ones.
2. Environmental problem
Nowadays, the energy supply is mainly based on the use of fossil fuels, because at least 60% of the total
energy used worldwide is obtained from their use (Mansir et al., 2018a). This is mainly attributed to the
fact that it was adapted to various sectors such as agriculture, transport and industry (Ogunkunle &
Ahmed, 2019).
In recent years, one of the main objectives that various investigations have had is to reduce
greenhouse gas emissions such as CO2, of which approximately 25% correspond to emissions related to
the use of fossil fuel for transportation (Hafeez et al., 2020; Llanes Cedeño, 2017). In this sense, biodiesel
has become one of the most used options to reduce the use of fossil fuels, by having a cleaner combustion,
it can help to reduce CO emissions, which is a product of incomplete combustion and that can be
transformed in CO2 in the presence of an atmosphere with a sufficient amount of oxygen (Llanes Cedeño,
2017). However, the commercialization of biodiesel has not spread, because it has a high production cost
compared to a diesel of fossil origin (Mansir et al., 2018b).
The above problem has led to various investigations that aim to use lower-cost raw materials,
such as waste cooking oils, since their use as lipid raw material allows a double benefit by significantly
reducing production costs (Mahmood Khan et al., 2020) and by reducing contamination to soils and
water bodies, which can be generated by improper disposal (Lee et al., 2014).
3. Biodiesel
Biodiesel is defined by the American Society for Testing and Materials (ASTM) as a mixture of long
chain fatty acid monoalkyl esters, which can be derived from lipids coming from vegetable or animal
fats. In recent decades, biodiesel has become a viable alternative fuel, mainly due to its physicochemical
characteristics and its renewable character, since it is possible to obtain it from vegetable oils (refined,
inedible or reused), as well as animal fats (Bhavani & Sharma, 2018). Some of the advantages and
disadvantages of using biodiesel versus petroleum diesel are summarized in Figure 2.1.
3.1 Lipid raw material
To obtain a biodiesel with the quality to accomplish with different regulations, it is necessary to have a
refined lipid raw material, or as clean as possible, because most catalysts cannot handle the presence of
free fatty acids (FFA) in percentages greater than 2%.
Currently, there is a great controversy about the use of vegetable oils with nutritional value as
lipid raw material for the biodiesel production, due to the enormous demand that exist (Lv et al., 2020),
for which, various studies have been have oriented to the search for lipid raw materials that do not have
a nutritional value, as is the case of used cooking oil, which is a highly polluting waste and available in
large quantities (Khodadadi et al., 2020). Cooking oil changes its chemical composition when subjected
to high temperatures and when it comes into contact with moisture and other substances from food. This
results in a large amount of impurities, which greatly affect the performance of the transesterification
reaction and the purity of the final product.
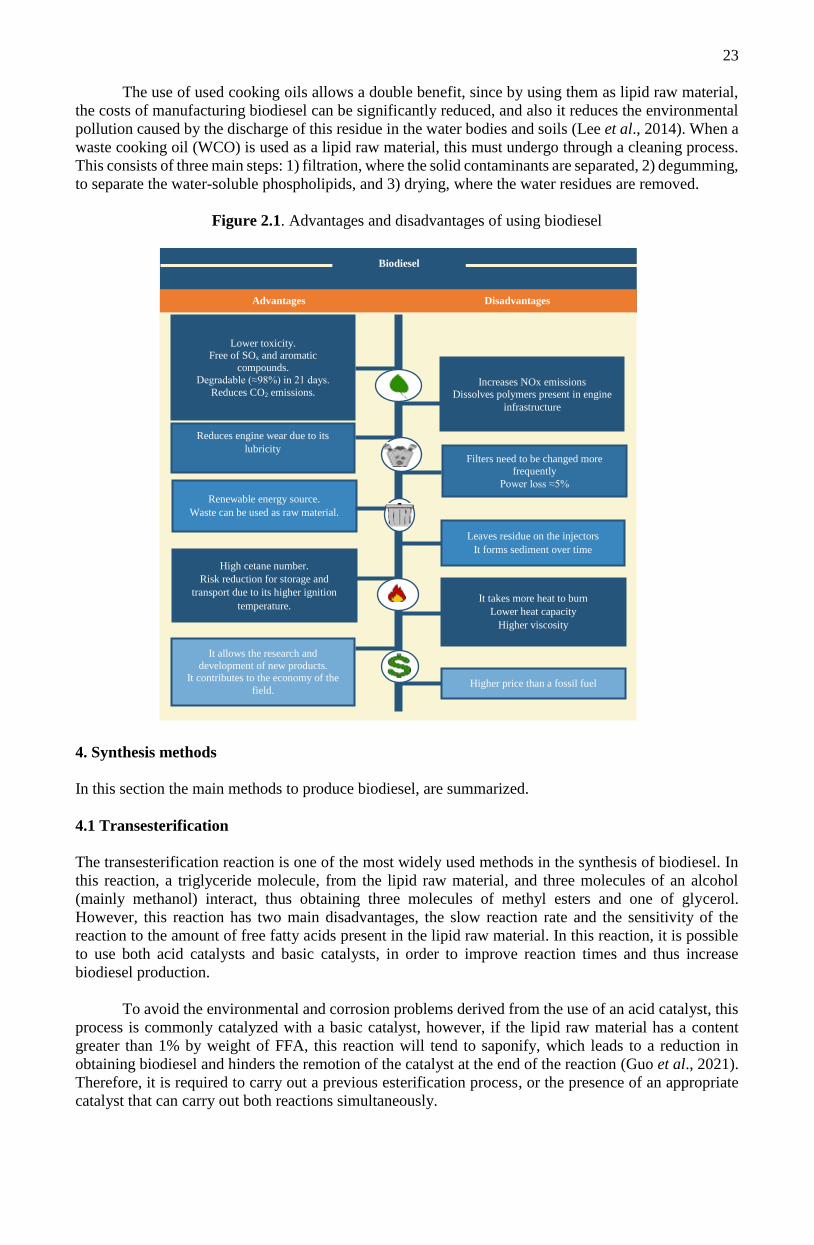
23
The use of used cooking oils allows a double benefit, since by using them as lipid raw material,
the costs of manufacturing biodiesel can be significantly reduced, and also it reduces the environmental
pollution caused by the discharge of this residue in the water bodies and soils (Lee et al., 2014). When a
waste cooking oil (WCO) is used as a lipid raw material, this must undergo through a cleaning process.
This consists of three main steps: 1) filtration, where the solid contaminants are separated, 2) degumming,
to separate the water-soluble phospholipids, and 3) drying, where the water residues are removed.
Figure 2.1. Advantages and disadvantages of using biodiesel
s0
4. Synthesis methods
In this section the main methods to produce biodiesel, are summarized.
4.1 Transesterification
The transesterification reaction is one of the most widely used methods in the synthesis of biodiesel. In
this reaction, a triglyceride molecule, from the lipid raw material, and three molecules of an alcohol
(mainly methanol) interact, thus obtaining three molecules of methyl esters and one of glycerol.
However, this reaction has two main disadvantages, the slow reaction rate and the sensitivity of the
reaction to the amount of free fatty acids present in the lipid raw material. In this reaction, it is possible
to use both acid catalysts and basic catalysts, in order to improve reaction times and thus increase
biodiesel production.
To avoid the environmental and corrosion problems derived from the use of an acid catalyst, this
process is commonly catalyzed with a basic catalyst, however, if the lipid raw material has a content
greater than 1% by weight of FFA, this reaction will tend to saponify, which leads to a reduction in
obtaining biodiesel and hinders the remotion of the catalyst at the end of the reaction (Guo et al., 2021).
Therefore, it is required to carry out a previous esterification process, or the presence of an appropriate
catalyst that can carry out both reactions simultaneously.
Biodiesel
Disadvantages Advantages
Lower toxicity. Free of SOx and aromatic
compounds.
Degradable (≈98%) in 21 days.
Reduces CO2 emissions.
Reduces engine wear due to its
lubricity
High cetane number.
Risk reduction for storage and
transport due to its higher ignition
temperature. It takes more heat to burn
Lower heat capacity
Higher viscosity
Filters need to be changed more
frequently
Power loss ≈5%
Renewable energy source.
Waste can be used as raw material.
It allows the research and
development of new products.
It contributes to the economy of the
field.
Increases NOx emissions
Dissolves polymers present in engine
infrastructure
Leaves residue on the injectors
It forms sediment over time
Higher price than a fossil fuel
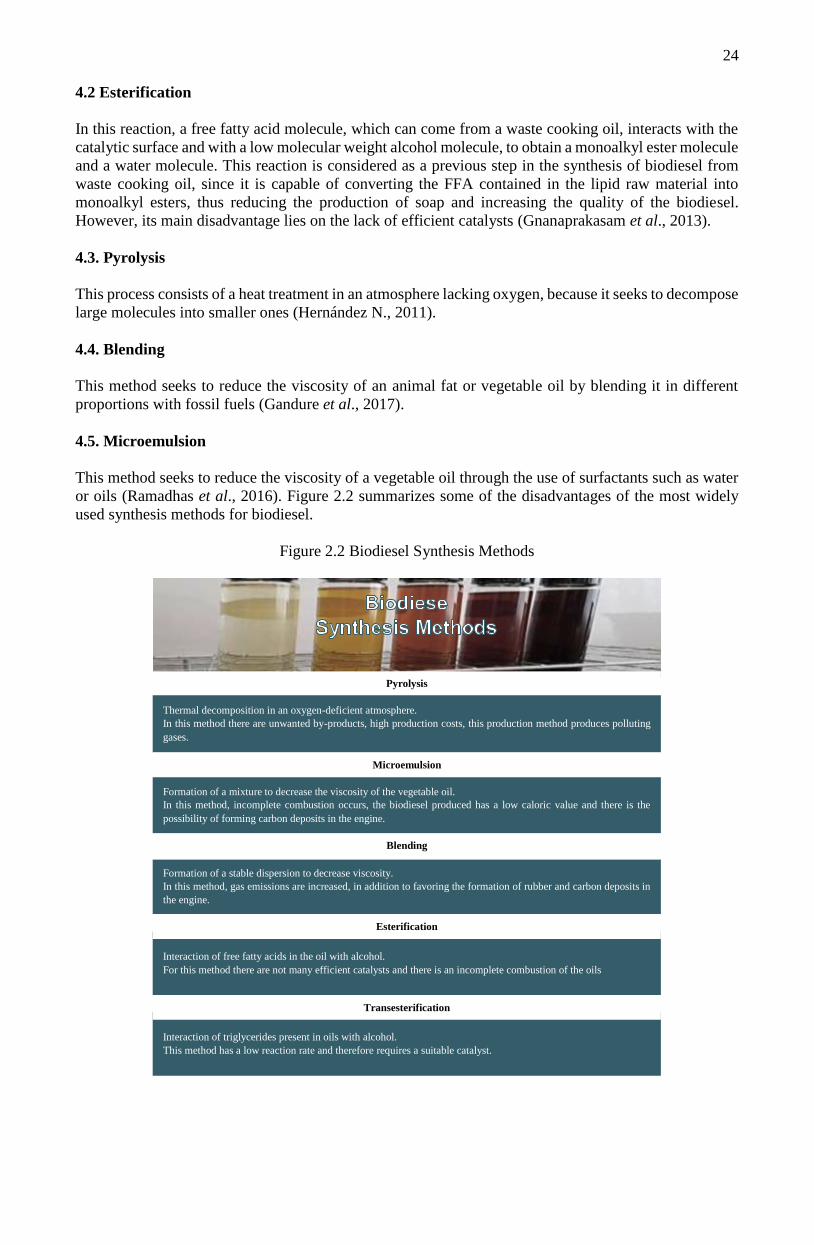
24
4.2 Esterification
In this reaction, a free fatty acid molecule, which can come from a waste cooking oil, interacts with the
catalytic surface and with a low molecular weight alcohol molecule, to obtain a monoalkyl ester molecule
and a water molecule. This reaction is considered as a previous step in the synthesis of biodiesel from
waste cooking oil, since it is capable of converting the FFA contained in the lipid raw material into
monoalkyl esters, thus reducing the production of soap and increasing the quality of the biodiesel.
However, its main disadvantage lies on the lack of efficient catalysts (Gnanaprakasam et al., 2013).
4.3. Pyrolysis
This process consists of a heat treatment in an atmosphere lacking oxygen, because it seeks to decompose
large molecules into smaller ones (Hernández N., 2011).
4.4. Blending
This method seeks to reduce the viscosity of an animal fat or vegetable oil by blending it in different
proportions with fossil fuels (Gandure et al., 2017).
4.5. Microemulsion
This method seeks to reduce the viscosity of a vegetable oil through the use of surfactants such as water
or oils (Ramadhas et al., 2016). Figure 2.2 summarizes some of the disadvantages of the most widely
used synthesis methods for biodiesel.
Figure 2.2 Biodiesel Synthesis Methods
Interaction of triglycerides present in oils with alcohol.
This method has a low reaction rate and therefore requires a suitable catalyst.
Transesterification
Interaction of free fatty acids in the oil with alcohol.
For this method there are not many efficient catalysts and there is an incomplete combustion of the oils
Esterification
Formation of a stable dispersion to decrease viscosity.
In this method, gas emissions are increased, in addition to favoring the formation of rubber and carbon deposits in
the engine.
Blending
Pyrolysis
Thermal decomposition in an oxygen-deficient atmosphere.
In this method there are unwanted by-products, high production costs, this production method produces polluting
gases.
Microemulsion
Formation of a mixture to decrease the viscosity of the vegetable oil.
In this method, incomplete combustion occurs, the biodiesel produced has a low caloric value and there is the
possibility of forming carbon deposits in the engine.
25
5. Catalysis in the transesterification reaction for the production of biodiesel
As previously mentioned, the transesterification reaction has a low reaction rate, which is why the
presence of a catalyst is necessary to help the process be carried out in a faster and more efficient way.
The catalysts used in the transesterification reaction can be divided into three main categories:
homogeneous, heterogeneous and enzymatic catalysts.
5.1 Homogeneous catalysis
In this type of catalysis, both the reactants and the catalyst are in the same phase, which allows the
reactants to mix, forming unstable intermediates that combine with more reagents to obtain the
corresponding reaction products (Guo et al., 2021). The main disadvantage of this type of catalysis is the
loss of the catalyst at the end of the reaction, as well as the need to carry out a cleaning process at the
end of the reaction. This cleaning process usually implies the use of large quantities of water and this
reduces the process sustainability.
5.1.1 Homogeneous acid catalysis
Within homogeneous catalysis, we can find homogeneous acid catalysts, which are capable of handling
unrefined lipid raw materials, since they can catalyze both, the esterification and transesterification
reactions. Despite this, these catalysts require longer reaction times and high reaction temperatures (Lam
et al., 2010). In addition, there is a great risk of environmental damage due to its use, as well as corrosion
in the pipes and reactors that handle it. Some of the most commonly used homogeneous acid catalysts
are: HCl, CH₂O₂, CH₃COOH, HNO3, H2SO4, Fe2(SO4)3, H2PO4 (Gebremariam & Marchetti, 2018a).
5.1.2 Basic homogeneous catalysis
Basic homogeneous catalysis is preferred at an industrial level, due to the fact that it is friendly to the
environment and has higher reaction rates than acid catalysis, in addition to requiring lower reaction
temperatures that can range from room temperature to 70 ° C (Guczi & Erdöhelyi, 2011; Lam et al.,
2010; Tariq et al., 2012). However, this type of catalysis gives low reaction yields with unrefined lipid
raw materials, due to the presence of FFA (Guo et al., 2021; Lam op. Cit.). Some of the most commonly
used basic homogeneous catalyst are: NaOH (Guo op. Cit.), KOH, KOCH (Molina, 2013), NaOCH3
(Guo op. Cit.; Mosali Raj and Bobbili Sharath, 2011; Talha & Sulaiman, 2016)
5.2 Enzyme catalysis
Currently, this type of catalyst has caught attention because this type of catalysis is capable of reducing
the number of impurities of the final product and facilitates the work of removing the catalyst at the end
of the reaction. However, its main disadvantage is related to the high price of this type of catalyst
(Molina, 2013).
Lipases are usually the most used as catalysts, due to their high tolerance to the content of free
fatty acids and to obtain yields close to 100%. Some of the most commonly used are: Pseudomonas
cepacia, Rhizomucor miehei , Rhizopus orizae, Candida antárctica, among others (Guncheva &
Zhiryakova, 2011).
5.3 Heterogeneous catalysis
In this type of catalysis, the reagents and the catalyst are in the different phase. These types of catalysts
provide a surface on which the reaction will take place. (Aguilar R., 2003).
The main advantages of this type of catalysis are the ease of recovery of the catalyst at the end of
the reaction, the possibility of using the catalyst in more than one reaction cycle and also the fact that
they can be designed with greater selectivity for the process. However, this type of catalyst also has some
important disadvantages, such as the decrease in its catalytic activity due to the deactivation of the
catalyst after the reaction cycle.
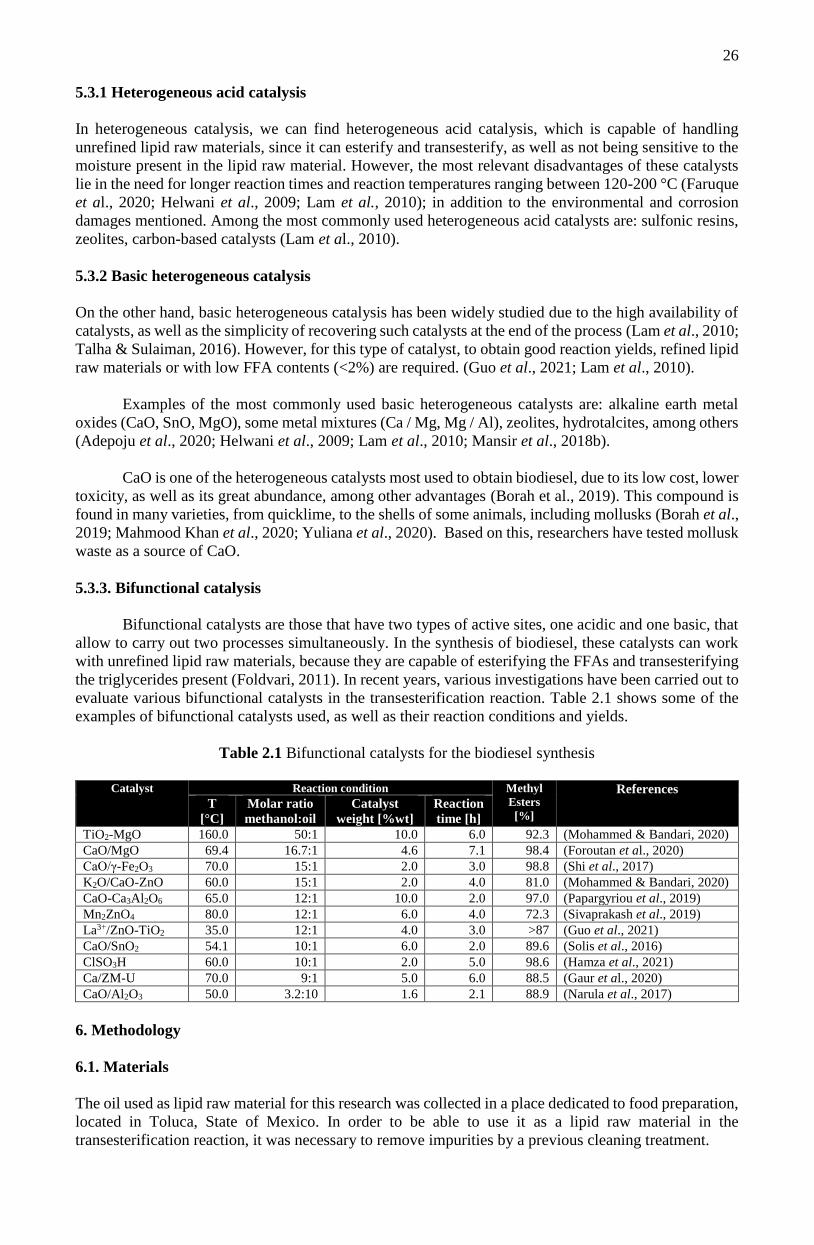
26
5.3.1 Heterogeneous acid catalysis
In heterogeneous catalysis, we can find heterogeneous acid catalysis, which is capable of handling
unrefined lipid raw materials, since it can esterify and transesterify, as well as not being sensitive to the
moisture present in the lipid raw material. However, the most relevant disadvantages of these catalysts
lie in the need for longer reaction times and reaction temperatures ranging between 120-200 °C (Faruque
et al., 2020; Helwani et al., 2009; Lam et al., 2010); in addition to the environmental and corrosion
damages mentioned. Among the most commonly used heterogeneous acid catalysts are: sulfonic resins,
zeolites, carbon-based catalysts (Lam et al., 2010).
5.3.2 Basic heterogeneous catalysis
On the other hand, basic heterogeneous catalysis has been widely studied due to the high availability of
catalysts, as well as the simplicity of recovering such catalysts at the end of the process (Lam et al., 2010;
Talha & Sulaiman, 2016). However, for this type of catalyst, to obtain good reaction yields, refined lipid
raw materials or with low FFA contents (<2%) are required. (Guo et al., 2021; Lam et al., 2010).
Examples of the most commonly used basic heterogeneous catalysts are: alkaline earth metal
oxides (CaO, SnO, MgO), some metal mixtures (Ca / Mg, Mg / Al), zeolites, hydrotalcites, among others
(Adepoju et al., 2020; Helwani et al., 2009; Lam et al., 2010; Mansir et al., 2018b).
CaO is one of the heterogeneous catalysts most used to obtain biodiesel, due to its low cost, lower
toxicity, as well as its great abundance, among other advantages (Borah et al., 2019). This compound is
found in many varieties, from quicklime, to the shells of some animals, including mollusks (Borah et al.,
2019; Mahmood Khan et al., 2020; Yuliana et al., 2020). Based on this, researchers have tested mollusk
waste as a source of CaO.
5.3.3. Bifunctional catalysis
Bifunctional catalysts are those that have two types of active sites, one acidic and one basic, that
allow to carry out two processes simultaneously. In the synthesis of biodiesel, these catalysts can work
with unrefined lipid raw materials, because they are capable of esterifying the FFAs and transesterifying
the triglycerides present (Foldvari, 2011). In recent years, various investigations have been carried out to
evaluate various bifunctional catalysts in the transesterification reaction. Table 2.1 shows some of the
examples of bifunctional catalysts used, as well as their reaction conditions and yields.
Table 2.1 Bifunctional catalysts for the biodiesel synthesis
Catalyst Reaction condition Methyl
Esters
[%]
References T
[°C]
Molar ratio
methanol:oil
Catalyst
weight [%wt]
Reaction
time [h]
TiO2-MgO 160.0 50:1 10.0 6.0 92.3 (Mohammed & Bandari, 2020)
CaO/MgO 69.4 16.7:1 4.6 7.1 98.4 (Foroutan et al., 2020)
CaO/γ-Fe2O3 70.0 15:1 2.0 3.0 98.8 (Shi et al., 2017)
K2O/CaO-ZnO 60.0 15:1 2.0 4.0 81.0 (Mohammed & Bandari, 2020)
CaO-Ca3Al2O6 65.0 12:1 10.0 2.0 97.0 (Papargyriou et al., 2019)
Mn2ZnO4 80.0 12:1 6.0 4.0 72.3 (Sivaprakash et al., 2019)
La3+/ZnO-TiO2 35.0 12:1 4.0 3.0 >87 (Guo et al., 2021)
CaO/SnO2 54.1 10:1 6.0 2.0 89.6 (Solis et al., 2016)
ClSO3H 60.0 10:1 2.0 5.0 98.6 (Hamza et al., 2021)
Ca/ZM-U 70.0 9:1 5.0 6.0 88.5 (Gaur et al., 2020)
CaO/Al2O3 50.0 3.2:10 1.6 2.1 88.9 (Narula et al., 2017)
6. Methodology
6.1. Materials
The oil used as lipid raw material for this research was collected in a place dedicated to food preparation,
located in Toluca, State of Mexico. In order to be able to use it as a lipid raw material in the
transesterification reaction, it was necessary to remove impurities by a previous cleaning treatment.
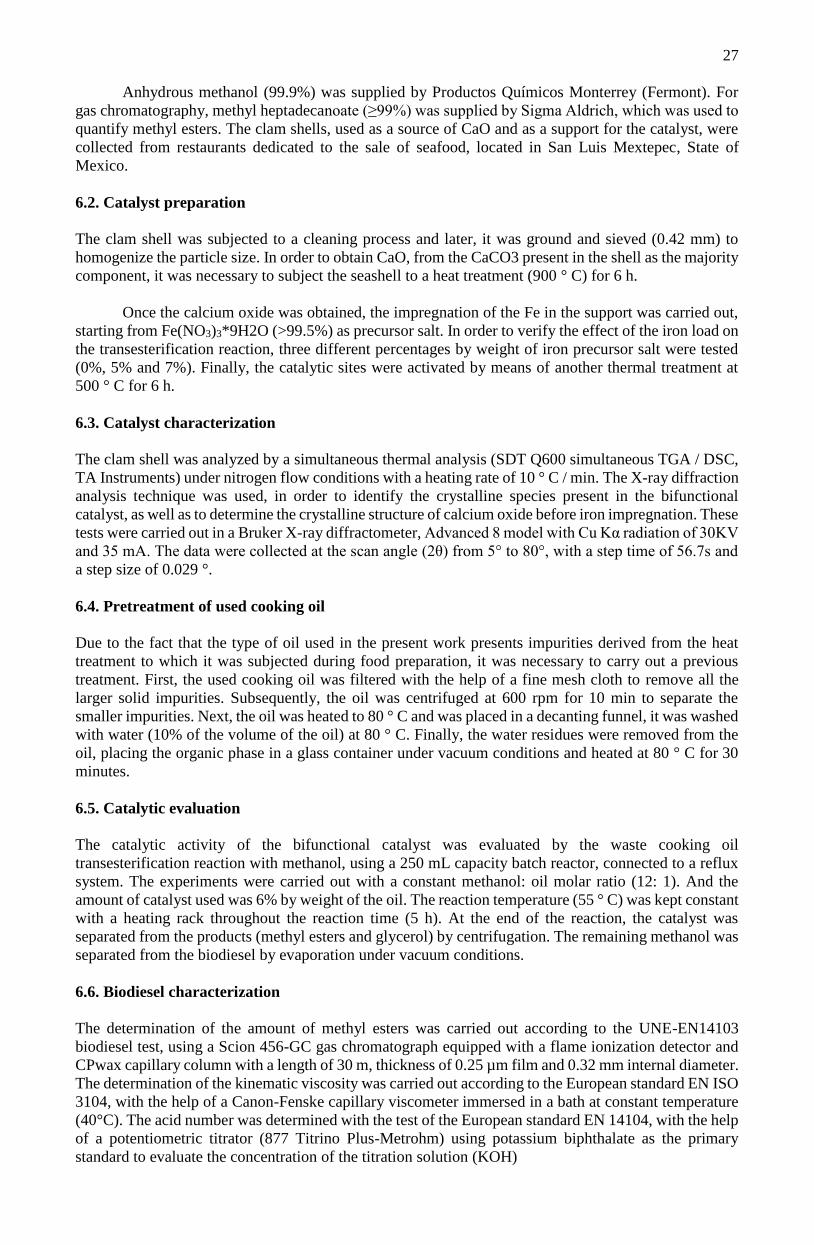
27
Anhydrous methanol (99.9%) was supplied by Productos Químicos Monterrey (Fermont). For
gas chromatography, methyl heptadecanoate (≥99%) was supplied by Sigma Aldrich, which was used to
quantify methyl esters. The clam shells, used as a source of CaO and as a support for the catalyst, were
collected from restaurants dedicated to the sale of seafood, located in San Luis Mextepec, State of
Mexico.
6.2. Catalyst preparation
The clam shell was subjected to a cleaning process and later, it was ground and sieved (0.42 mm) to
homogenize the particle size. In order to obtain CaO, from the CaCO3 present in the shell as the majority
component, it was necessary to subject the seashell to a heat treatment (900 ° C) for 6 h.
Once the calcium oxide was obtained, the impregnation of the Fe in the support was carried out,
starting from Fe(NO3)3*9H2O (>99.5%) as precursor salt. In order to verify the effect of the iron load on
the transesterification reaction, three different percentages by weight of iron precursor salt were tested
(0%, 5% and 7%). Finally, the catalytic sites were activated by means of another thermal treatment at
500 ° C for 6 h.
6.3. Catalyst characterization
The clam shell was analyzed by a simultaneous thermal analysis (SDT Q600 simultaneous TGA / DSC,
TA Instruments) under nitrogen flow conditions with a heating rate of 10 ° C / min. The X-ray diffraction
analysis technique was used, in order to identify the crystalline species present in the bifunctional
catalyst, as well as to determine the crystalline structure of calcium oxide before iron impregnation. These
tests were carried out in a Bruker X-ray diffractometer, Advanced 8 model with Cu Kα radiation of 30KV
and 35 mA. The data were collected at the scan angle (2θ) from 5° to 80°, with a step time of 56.7s and
a step size of 0.029 °.
6.4. Pretreatment of used cooking oil
Due to the fact that the type of oil used in the present work presents impurities derived from the heat
treatment to which it was subjected during food preparation, it was necessary to carry out a previous
treatment. First, the used cooking oil was filtered with the help of a fine mesh cloth to remove all the
larger solid impurities. Subsequently, the oil was centrifuged at 600 rpm for 10 min to separate the
smaller impurities. Next, the oil was heated to 80 ° C and was placed in a decanting funnel, it was washed
with water (10% of the volume of the oil) at 80 ° C. Finally, the water residues were removed from the
oil, placing the organic phase in a glass container under vacuum conditions and heated at 80 ° C for 30
minutes.
6.5. Catalytic evaluation
The catalytic activity of the bifunctional catalyst was evaluated by the waste cooking oil
transesterification reaction with methanol, using a 250 mL capacity batch reactor, connected to a reflux
system. The experiments were carried out with a constant methanol: oil molar ratio (12: 1). And the
amount of catalyst used was 6% by weight of the oil. The reaction temperature (55 ° C) was kept constant
with a heating rack throughout the reaction time (5 h). At the end of the reaction, the catalyst was
separated from the products (methyl esters and glycerol) by centrifugation. The remaining methanol was
separated from the biodiesel by evaporation under vacuum conditions.
6.6. Biodiesel characterization
The determination of the amount of methyl esters was carried out according to the UNE-EN14103
biodiesel test, using a Scion 456-GC gas chromatograph equipped with a flame ionization detector and
CPwax capillary column with a length of 30 m, thickness of 0.25 µm film and 0.32 mm internal diameter.
The determination of the kinematic viscosity was carried out according to the European standard EN ISO
3104, with the help of a Canon-Fenske capillary viscometer immersed in a bath at constant temperature
(40°C). The acid number was determined with the test of the European standard EN 14104, with the help
of a potentiometric titrator (877 Titrino Plus-Metrohm) using potassium biphthalate as the primary
standard to evaluate the concentration of the titration solution (KOH)
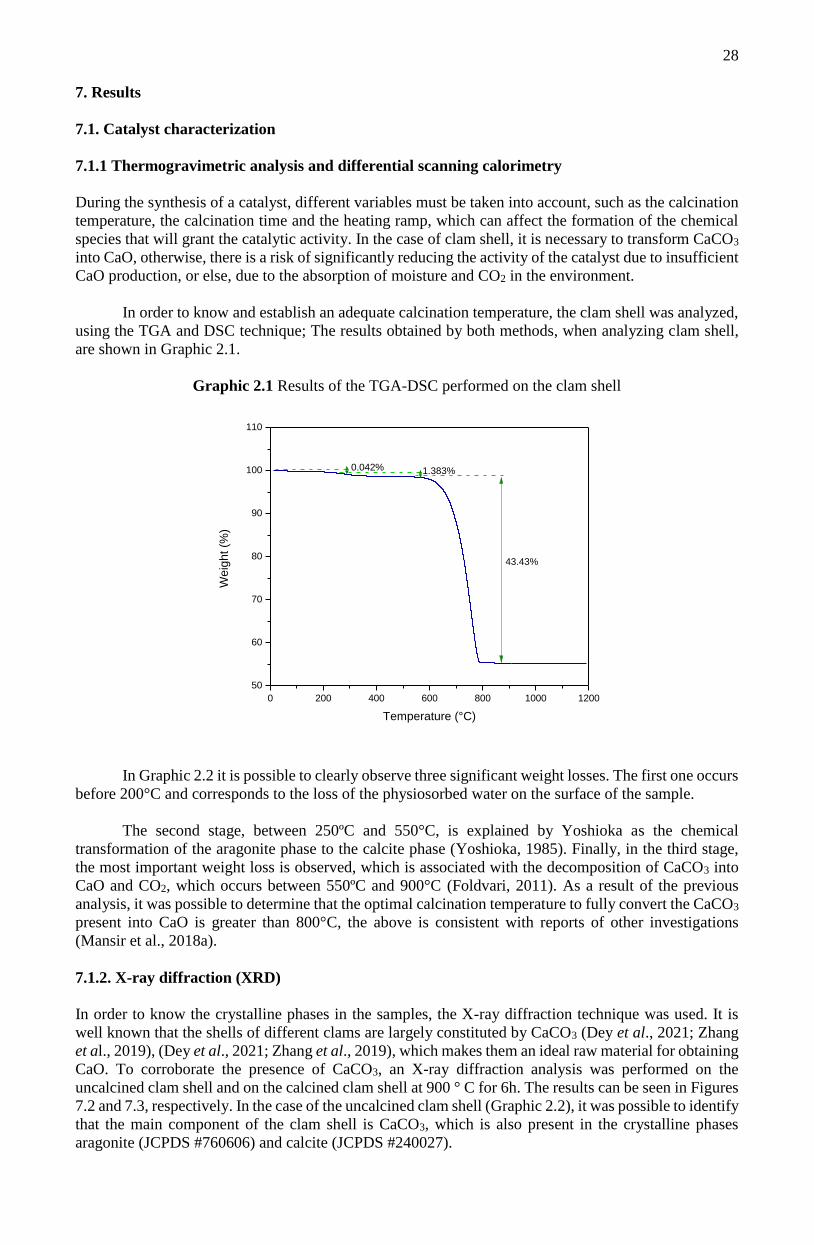
28
7. Results
7.1. Catalyst characterization
7.1.1 Thermogravimetric analysis and differential scanning calorimetry
During the synthesis of a catalyst, different variables must be taken into account, such as the calcination
temperature, the calcination time and the heating ramp, which can affect the formation of the chemical
species that will grant the catalytic activity. In the case of clam shell, it is necessary to transform CaCO3
into CaO, otherwise, there is a risk of significantly reducing the activity of the catalyst due to insufficient
CaO production, or else, due to the absorption of moisture and CO2 in the environment.
In order to know and establish an adequate calcination temperature, the clam shell was analyzed,
using the TGA and DSC technique; The results obtained by both methods, when analyzing clam shell,
are shown in Graphic 2.1.
Graphic 2.1 Results of the TGA-DSC performed on the clam shell
0 200 400 600 800 1000 1200
50
60
70
80
90
100
110
We
igh
t (%
)
Temperature (°C)
0.042% 1.383%
43.43%
In Graphic 2.2 it is possible to clearly observe three significant weight losses. The first one occurs
before 200°C and corresponds to the loss of the physiosorbed water on the surface of the sample.
The second stage, between 250ºC and 550°C, is explained by Yoshioka as the chemical
transformation of the aragonite phase to the calcite phase (Yoshioka, 1985). Finally, in the third stage,
the most important weight loss is observed, which is associated with the decomposition of CaCO3 into
CaO and CO2, which occurs between 550ºC and 900°C (Foldvari, 2011). As a result of the previous
analysis, it was possible to determine that the optimal calcination temperature to fully convert the CaCO3
present into CaO is greater than 800°C, the above is consistent with reports of other investigations
(Mansir et al., 2018a).
7.1.2. X-ray diffraction (XRD)
In order to know the crystalline phases in the samples, the X-ray diffraction technique was used. It is
well known that the shells of different clams are largely constituted by CaCO3 (Dey et al., 2021; Zhang
et al., 2019), (Dey et al., 2021; Zhang et al., 2019), which makes them an ideal raw material for obtaining
CaO. To corroborate the presence of CaCO3, an X-ray diffraction analysis was performed on the
uncalcined clam shell and on the calcined clam shell at 900 ° C for 6h. The results can be seen in Figures
7.2 and 7.3, respectively. In the case of the uncalcined clam shell (Graphic 2.2), it was possible to identify
that the main component of the clam shell is CaCO3, which is also present in the crystalline phases
aragonite (JCPDS #760606) and calcite (JCPDS #240027).

29
Graphic 2.2 Uncalcined clam shell diffractogram
( aragonite, calcite)
20 30 40 50 60
Inte
nsi
ty (
a.u
.)
Angle (2teta)
In the shell sample calcined for 6 h at 900ºC (Graphic 2.3) it was possible to identify the complete
transformation of CaCO3 into CaO (JCPDS #371497). Similar results were observed in calcium oxide
catalysts from natural materials such as eggshell and sea snail shell (Krishnamurthy et al., 2020).
Graphic 2.3: Calcined clam shell diffractogram
( CaO)
20 30 40 50 60 70 80
Inte
nsity (
a.u
.)
Angle (2teta)
According to the previous diffractograms, all the CaCO3 has been transformed into CaO after
subjecting the sample to a calcination of 900ºC, which agrees with the results of the TGA analysis.
On the other hand, for the Fe2O3/CaO catalyst (calcined for 6 h at 600ºC), the X-ray diffraction
analysis managed to identify the following phases: Fe2O3 (JCPDS #330664), Fe3O4 (JCPDS #890688),
Ca2Fe2O5 (JCPDS #712264), Ca2Fe15.57O25.56 (JCPDS #722346) y CaO (JCPDS #371497).

30
Graphic 2.4 Catalyst diffractogram Fe2O3/CaO
( Fe2O3 Fe3O4 Ca2Fe2O5 Ca2Fe15.57O25.56 CaO)
10 20 30 40 50 60 70
Inte
nsity (
a.u
.)
Angle (2teta)
Catalizador de Fe
7.1.3 Inductively coupled plasma atomic emission spectroscopy (ICP-AES)
In order to know the composition of the bifunctional catalyst Fe2O3/CaO, an induction coupled plasma
atomic emission spectrometry (ICP-AES) was performed.
For the synthesized sample, using 7% by weight of the precursor salt, 1.0% by weight
corresponding to iron and 57.30% by weight of calcium were obtained.
7.2. Characterization of waste cooking oil
7.2.1. Acid value
To demonstrate the bifunctionality of our catalyst, it is necessary to work with a lipid raw material that
has a higher amount of FFA, compared to a refined oil. This is because a conventional basic
heterogeneous catalyst would saponify such FFAs.
A comparison was made between the acid value of a refined oil and the waste cooking oil that
was used as raw material for the transesterification reaction. This was conducted in order to show that
waste cooking oil has more free fatty acids than refined oil.
In this test it was found that the acid value of the refined oil was 0.041 mgKOH/g, in comparison
with the 4 mgKOH/g (2%) present in the waste cooking oil.
7.2.2. Viscosity
Viscosity is a parameter that will allow us to know if the transesterification reaction did occur, since there
is a decrease in the viscosity of the raw material after the production of methyl esters.
In order to be able to carry out a comparison before and after the transesterification reaction, the
measurement of the viscosity of the waste cooking oil was used and, as a reference point, a refined oil.
The kinematic viscosity oil determination was carried out at 40 ° C by triplicate, obtaining an
average value of 39.2 mm2 /s for refining oil and 41.33mm2/s for waste cooking oil.
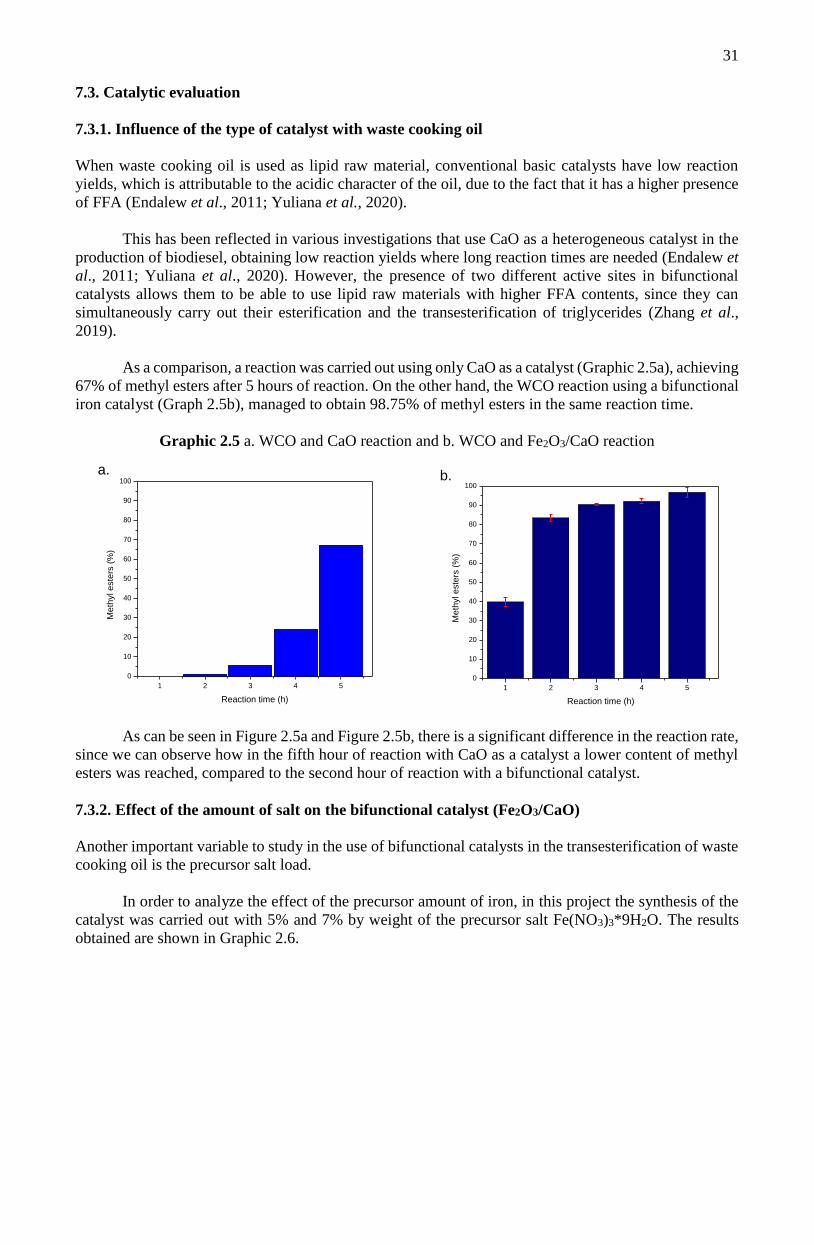
31
7.3. Catalytic evaluation
7.3.1. Influence of the type of catalyst with waste cooking oil
When waste cooking oil is used as lipid raw material, conventional basic catalysts have low reaction
yields, which is attributable to the acidic character of the oil, due to the fact that it has a higher presence
of FFA (Endalew et al., 2011; Yuliana et al., 2020).
This has been reflected in various investigations that use CaO as a heterogeneous catalyst in the
production of biodiesel, obtaining low reaction yields where long reaction times are needed (Endalew et
al., 2011; Yuliana et al., 2020). However, the presence of two different active sites in bifunctional
catalysts allows them to be able to use lipid raw materials with higher FFA contents, since they can
simultaneously carry out their esterification and the transesterification of triglycerides (Zhang et al.,
2019).
As a comparison, a reaction was carried out using only CaO as a catalyst (Graphic 2.5a), achieving
67% of methyl esters after 5 hours of reaction. On the other hand, the WCO reaction using a bifunctional
iron catalyst (Graph 2.5b), managed to obtain 98.75% of methyl esters in the same reaction time.
Graphic 2.5 a. WCO and CaO reaction and b. WCO and Fe2O3/CaO reaction
1 2 3 4 5
0
10
20
30
40
50
60
70
80
90
100
Me
thyl e
ste
rs (
%)
Reaction time (h)
a.
As can be seen in Figure 2.5a and Figure 2.5b, there is a significant difference in the reaction rate,
since we can observe how in the fifth hour of reaction with CaO as a catalyst a lower content of methyl
esters was reached, compared to the second hour of reaction with a bifunctional catalyst.
7.3.2. Effect of the amount of salt on the bifunctional catalyst (Fe2O3/CaO)
Another important variable to study in the use of bifunctional catalysts in the transesterification of waste
cooking oil is the precursor salt load.
In order to analyze the effect of the precursor amount of iron, in this project the synthesis of the
catalyst was carried out with 5% and 7% by weight of the precursor salt Fe(NO3)3*9H2O. The results
obtained are shown in Graphic 2.6.
1 2 3 4 5
0
10
20
30
40
50
60
70
80
90
100
Me
thyl e
ste
rs (
%)
Reaction time (h)
b.
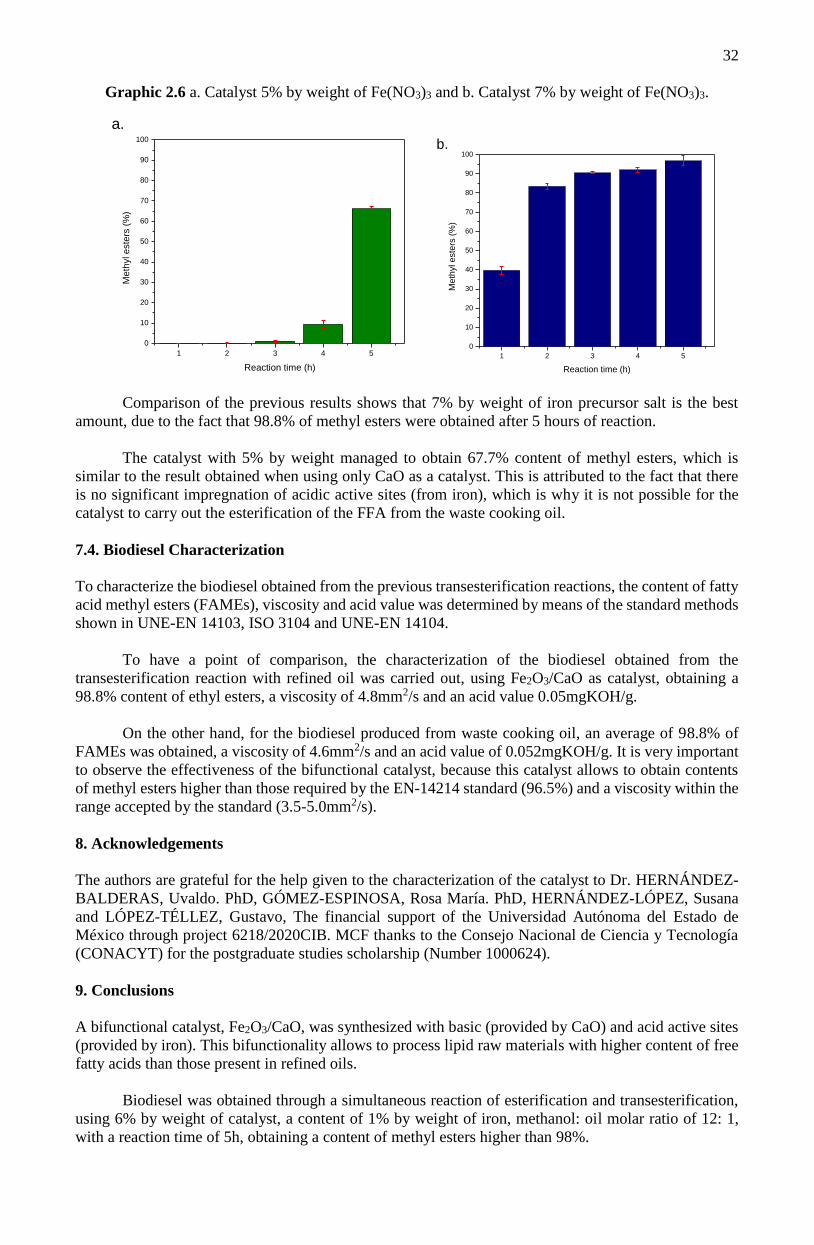
32
Graphic 2.6 a. Catalyst 5% by weight of Fe(NO3)3 and b. Catalyst 7% by weight of Fe(NO3)3.
Comparison of the previous results shows that 7% by weight of iron precursor salt is the best
amount, due to the fact that 98.8% of methyl esters were obtained after 5 hours of reaction.
The catalyst with 5% by weight managed to obtain 67.7% content of methyl esters, which is
similar to the result obtained when using only CaO as a catalyst. This is attributed to the fact that there
is no significant impregnation of acidic active sites (from iron), which is why it is not possible for the
catalyst to carry out the esterification of the FFA from the waste cooking oil.
7.4. Biodiesel Characterization
To characterize the biodiesel obtained from the previous transesterification reactions, the content of fatty
acid methyl esters (FAMEs), viscosity and acid value was determined by means of the standard methods
shown in UNE-EN 14103, ISO 3104 and UNE-EN 14104.
To have a point of comparison, the characterization of the biodiesel obtained from the
transesterification reaction with refined oil was carried out, using Fe2O3/CaO as catalyst, obtaining a
98.8% content of ethyl esters, a viscosity of 4.8mm2/s and an acid value 0.05mgKOH/g.
On the other hand, for the biodiesel produced from waste cooking oil, an average of 98.8% of
FAMEs was obtained, a viscosity of 4.6mm2/s and an acid value of 0.052mgKOH/g. It is very important
to observe the effectiveness of the bifunctional catalyst, because this catalyst allows to obtain contents
of methyl esters higher than those required by the EN-14214 standard (96.5%) and a viscosity within the
range accepted by the standard (3.5-5.0mm2/s).
8. Acknowledgements
The authors are grateful for the help given to the characterization of the catalyst to Dr. HERNÁNDEZ-
BALDERAS, Uvaldo. PhD, GÓMEZ-ESPINOSA, Rosa María. PhD, HERNÁNDEZ-LÓPEZ, Susana
and LÓPEZ-TÉLLEZ, Gustavo, The financial support of the Universidad Autónoma del Estado de
México through project 6218/2020CIB. MCF thanks to the Consejo Nacional de Ciencia y Tecnología
(CONACYT) for the postgraduate studies scholarship (Number 1000624).
9. Conclusions
A bifunctional catalyst, Fe2O3/CaO, was synthesized with basic (provided by CaO) and acid active sites
(provided by iron). This bifunctionality allows to process lipid raw materials with higher content of free
fatty acids than those present in refined oils.
Biodiesel was obtained through a simultaneous reaction of esterification and transesterification,
using 6% by weight of catalyst, a content of 1% by weight of iron, methanol: oil molar ratio of 12: 1,
with a reaction time of 5h, obtaining a content of methyl esters higher than 98%.
1 2 3 4 5
0
10
20
30
40
50
60
70
80
90
100
M
eth
yl e
ste
rs (
%)
Reaction time (h)
a.
1 2 3 4 5
0
10
20
30
40
50
60
70
80
90
100
Me
thyl e
ste
rs (
%)
Reaction time (h)
b.
33
It was determined that 7% by weight of iron precursor salt in the synthesis of the catalyst is the
optimal amount of precursor salt to obtain biodiesel that complies with EN-14214 regulations.
The development of efficient heterogeneous catalysts in the use of lipid raw materials with a
higher FFA content represents a significant area of opportunity in reducing the cost of biodiesel
production. However, the efficiency of a heterogeneous catalyst depends on several variables, such as
the type of raw material, the type of alcohol used, the molar ratio of alcohol: oil, reaction temperature,
stirring speed, type of reactor, in addition to the type of catalyst used.
10. References
Adepoju, T. F., Ibeh, M. A., Babatunde, E. O., & Asquo, A. J. (2020). Methanolysis of CaO based catalyst
derived from egg shell-snail shell-wood ash mixed for fatty acid methylester (FAME) synthesis from a
ternary mixture of Irvingia gabonensis -Pentaclethra macrophylla - Elais guineensis oil blend: An
application of simple. Fuel, 275(May), 117997. https://doi.org/10.1016/j.fuel.2020.117997
Adepoju, T. F., Olatunbosun, B. E., Olatunji, O. M., & Ibeh, M. A. (2018). Brette Pearl Spar Mable
(BPSM): a potential recoverable catalyst as a renewable source of biodiesel from Thevetia peruviana
seed oil for the benefit of sustainable development in West Africa. Energy, Sustainability and Society,
8(1), 1–17. https://doi.org/10.1186/s13705-018-0164-1
Aguilar R., G. y S. B. J. (2003). Fundamentos de Catálisis. Alfaomega. México DF, IPN.
Bhavani, A. G., & Sharma, V. K. (2018). Production of Biodiesel from Waste Cooking Oil: A Review.
Journal of Advanced Chemical Sciences, 4(1), 549–555. https://doi.org/10.30799/jacs.181.18040105
Borah, M. J., Das, A., Das, V., Bhuyan, N., & Deka, D. (2019). Transesterification of waste cooking oil
for biodiesel production catalyzed by Zn substituted waste egg shell derived CaO nanocatalyst. Fuel,
242(January), 345–354. https://doi.org/10.1016/j.fuel.2019.01.060
Dey, S., Reang, N. M., Das, P. K., & Deb, M. (2021). A comprehensive study on prospects of economy,
environment, and efficiency of palm oil biodiesel as a renewable fuel. Journal of Cleaner Production,
286, 124981. https://doi.org/10.1016/j.jclepro.2020.124981
Endalew, A. K., Kiros, Y., & Zanzi, R. (2011). Heterogeneous catalysis for biodiesel production from
Jatropha curcas oil (JCO). Energy, 36(5), 2693–2700. https://doi.org/10.1016/j.energy.2011.02.010
Ezzah-Mahmudah, S., Lokman, I. M., Saiman, M. I., & Taufiq-Yap, Y. H. (2016). Synthesis and
characterization of Fe2O3/CaO derived from Anadara Granosa for methyl ester production. Energy
Conversion and Management, 126, 124–131. https://doi.org/10.1016/j.enconman.2016.07.072
Faruque, M. O., Razzak, S. A., & Hossain, M. M. (2020). Application of heterogeneous catalysts for
biodiesel production from microalgal oil—a review. Catalysts, 10(9), 1–25.
https://doi.org/10.3390/catal10091025
Foldvari, M. (2011). Handbook of thermo-gravimetric system of minerals and its use in geological
practice. In Occasional papers of the geological institute of Hungary (Vol. 213).
Foroutan, R., Mohammadi, R., Esmaeili, H., Mirzaee Bektashi, F., & Tamjidi, S. (2020).
Transesterification of waste edible oils to biodiesel using calcium oxide@magnesium oxide nanocatalyst.
Waste Management, 105, 373–383. https://doi.org/10.1016/j.wasman.2020.02.032
Gan, S., Ng, H. K., Chan, P. H., & Leong, F. L. (2012). Heterogeneous free fatty acids esterification in
waste cooking oil using ion-exchange resins. Fuel Processing Technology, 102, 67–72.
https://doi.org/10.1016/j.fuproc.2012.04.038
Gandure, J., Ketlogetswe, C., & Jonas, M. (2017). Production, Composition and Fuel Properties of
Tallow Biodiesel: A Case of Botswana. Energy and Power Engineering, 09(07), 355–365.
https://doi.org/10.4236/epe.2017.97024
34
Gaur, A., Mishra, S., Chowdhury, S., Baredar, P., & Verma, P. (2020). A review on factor affecting
biodiesel production from waste cooking oil: An Indian perspective. Materials Today: Proceedings, xxxx.
https://doi.org/10.1016/j.matpr.2020.09.432
Gebremariam, S. N., & Marchetti, J. M. (2018a). Biodiesel production through sulfuric acid catalyzed
transesteri fi cation of acidic oil : Techno economic feasibility of di ff erent process alternatives.
174(August), 639–648. https://doi.org/10.1016/j.enconman.2018.08.078
Gebremariam, S. N., & Marchetti, J. M. (2018b). Economics of biodiesel production: Review. In Energy
Conversion and Management (Vol. 168). https://doi.org/10.1016/j.enconman.2018.05.002
Gnanaprakasam, A., Sivakumar, V. M., Surendhar, A., Thirumarimurugan, M., & Kannadasan, T.
(2013). Recent Strategy of Biodiesel Production from Waste Cooking Oil and Process Influencing
Parameters: A Review. Journal of Energy, 2013, 1–10. https://doi.org/10.1155/2013/926392
Guczi, L., & Erdöhelyi, A. (2011). Catalysis for alternative energy generation. Catalysis for Alternative
Energy Generation, 9781461403, 1–536. https://doi.org/10.1007/978-1-4614-0344-9
Guncheva, M., & Zhiryakova, D. (2011). Catalytic properties and potential applications of Bacillus
lipases. Journal of Molecular Catalysis B: Enzymatic, 68(1), 1–21.
https://doi.org/10.1016/j.molcatb.2010.09.002
Guo, M., Jiang, W., Chen, C., Qu, S., Lu, J., Yi, W., & Ding, J. (2021). Process optimization of biodiesel
production from waste cooking oil by esterification of free fatty acids using La3+/ZnO-TiO2
photocatalyst. Energy Conversion and Management, 229(December 2020), 113745.
https://doi.org/10.1016/j.enconman.2020.113745
Hafeez, S., Al-Salem, S. M., Manos, G., & Constantinou, A. (2020). Fuel production using membrane
reactors: a review. Environmental Chemistry Letters, 18(5), 1477–1490. https://doi.org/10.1007/s10311-
020-01024-7
Hamza, M., Ayoub, M., Shamsuddin, R. Bin, Mukhtar, A., Saqib, S., Zahid, I., Ameen, M., Ullah, S.,
Al-Sehemi, A. G., & Ibrahim, M. (2021). A review on the waste biomass derived catalysts for biodiesel
production. Environmental Technology and Innovation, 21, 101200.
https://doi.org/10.1016/j.eti.2020.101200
Helwani, Z., Othman, M. R., Aziz, N., Fernando, W. J. N., & Kim, J. (2009). Technologies for production
of biodiesel focusing on green catalytic techniques: A review. Fuel Processing Technology, 90(12),
1502–1514. https://doi.org/10.1016/j.fuproc.2009.07.016
Hernández N. (2011). Pirólisis de biomasa para producir biocuombustible. Universidad Autónoma de
Nuevo León.
Khan, H. M., Ali, C. H., Iqbal, T., Yasin, S., Sulaiman, M., Mahmood, H., Raashid, M., Pasha, M., &
Mu, B. (2019). Current scenario and potential of biodiesel production from waste cooking oil in Pakistan:
An overview. Chinese Journal of Chemical Engineering, 27(10), 2238–2250.
https://doi.org/10.1016/j.cjche.2018.12.010
Khodadadi, M. R., Malpartida, I., Tsang, C. W., Lin, C. S. K., & Len, C. (2020). Recent advances on the
catalytic conversion of waste cooking oil. Molecular Catalysis, 494(July), 111128.
https://doi.org/10.1016/j.mcat.2020.111128
Krishnamurthy, K. N., Sridhara, S. N., & Ananda Kumar, C. S. (2020). Optimization and kinetic study
of biodiesel production from Hydnocarpus wightiana oil and dairy waste scum using snail shell CaO
nano catalyst. Renewable Energy, 146, 280–296. https://doi.org/10.1016/j.renene.2019.06.161
Lam, M. K., Lee, K. T., & Mohamed, A. R. (2010). Homogeneous , heterogeneous and enzymatic
catalysis for transesteri fi cation of high free fatty acid oil ( waste cooking oil ) to biodiesel : A review.
Biotechnology Advances, 28(4), 500–518. https://doi.org/10.1016/j.biotechadv.2010.03.002
35
Lee, A. F., Bennett, J. A., Manayil, J. C., & Wilson, K. (2014). Heterogeneous catalysis for sustainable
biodiesel production via esterification and transesterification. Chemical Society Reviews, 43(22), 7887–
7916. https://doi.org/10.1039/c4cs00189c
Llanes Cedeño, E. A. (2017). Producción e Impacto del Biodiesel: Una Revisión. INNOVA Research
Journal, 2(7), 59–76. https://doi.org/10.33890/innova.v2.n7.2017.229
Lv, E., Dou, T., Ding, S., Lu, J., Li, Z., Yi, W., Li, J., & Ding, J. (2020). Membrane dehydration-enhanced
esterification for biodiesel production from a potential feedstock of Firmiana platanifolia L.f. seed oil.
Chemical Engineering Research and Design, 153, 1–7. https://doi.org/10.1016/j.cherd.2019.10.020
Mahmood Khan, H., Iqbal, T., Haider Ali, C., Javaid, A., & Iqbal Cheema, I. (2020). Sustainable
biodiesel production from waste cooking oil utilizing waste ostrich (Struthio camelus) bones derived
heterogeneous catalyst. Fuel, 277(January), 118091. https://doi.org/10.1016/j.fuel.2020.118091
Mansir, N., Teo, S. H., Rashid, U., Saiman, M. I., Tan, Y. P., Alsultan, G. A., & Taufiq-Yap, Y. H.
(2018a). Modified waste egg shell derived bifunctional catalyst for biodiesel production from high FFA
waste cooking oil. A review. Renewable and Sustainable Energy Reviews, 82(November 2016), 3645–
3655. https://doi.org/10.1016/j.rser.2017.10.098
Mansir, N., Teo, S. H., Rashid, U., Saiman, M. I., Tan, Y. P., Alsultan, G. A., & Taufiq-Yap, Y. H.
(2018b). Modified waste egg shell derived bifunctional catalyst for biodiesel production from high FFA
waste cooking oil. A review. Renewable and Sustainable Energy Reviews, 82(October 2017), 3645–
3655. https://doi.org/10.1016/j.rser.2017.10.098
Mohammed, A. R., & Bandari, C. (2020). Lab-scale catalytic production of biodiesel from waste cooking
oil – a review. Biofuels, 11(4), 409–419. https://doi.org/10.1080/17597269.2017.1370882
Molina, C. (2013). Estudio de la composición y estabilidad de biodiesel obtenido a partir de aceites
vegetales limpios y procedentes de aceites de fritura. ftp://h3.bbtk.ull.es/ccppytec/cp439.pdf
Mosali Raj and Bobbili Sharath. (2011). Biodiesel Magazine - The Latest News and Data About Biodiesel
Production. http://www.biodieselmagazine.com/articles/7793/homogenous-catalyst-and-effects-on-
multifeedstock-processing
Narula, V., Khan, M. F., Negi, A., Kalra, S., Thakur, A., & Jain, S. (2017). Low temperature optimization
of biodiesel production from algal oil using CaO and CaO/Al2O3 as catalyst by the application of
response surface methodology. Energy, 140, 879–884. https://doi.org/10.1016/j.energy.2017.09.028
Nur Syazwani, O., Lokman Ibrahim, M., Wahyudiono, Kanda, H., Goto, M., & Taufiq-Yap, Y. H. (2017).
Esterification of high free fatty acids in supercritical methanol using sulfated angel wing shells as
catalyst. Journal of Supercritical Fluids, 124, 1–9. https://doi.org/10.1016/j.supflu.2017.01.002
Ogunkunle, O., & Ahmed, N. A. (2019). A review of global current scenario of biodiesel adoption and
combustion in vehicular diesel engines. Energy Reports, 5, 1560–1579.
https://doi.org/10.1016/j.egyr.2019.10.028
Pájaro, N. P., & Verbel, J. T. (2011). Química verde: un nuevo reto. Ciencia e Ingeniería Neogranadina,
21(2), 169–182.
Papargyriou, D., Broumidis, E., de Vere-Tucker, M., Gavrielides, S., Hilditch, P., Irvine, J. T. S., &
Bonaccorso, A. D. (2019). Investigation of solid base catalysts for biodiesel production from fish oil.
Renewable Energy, 139, 661–669. https://doi.org/10.1016/j.renene.2019.02.124
Ramadhas, A. S., Jayaraj, S., & Muraleedharan, C. (2016). Biodiesel. In Alternative Fuels for
Transportation (pp. 41–80). https://doi.org/10.1520/mnl11645m
36
Shi, M., Zhang, P., Fan, M., Jiang, P., & Dong, Y. (2017). Influence of crystal of Fe2O3 in magnetism
and activity of nanoparticle CaO@Fe2O3 for biodiesel production. Fuel, 197, 343–347.
https://doi.org/10.1016/j.fuel.2017.02.060
Sivaprakash, G., Mohanrasu, K., Ananthi, V., Jothibasu, M., Nguyen, D. D., Ravindran, B., Chang, S.
W., Nguyen-Tri, P., Tran, N. H., Sudhakar, M., Gurunathan, K., Arokiyaraj, S., & Arun, A. (2019).
Biodiesel production from Ulva linza, Ulva tubulosa, Ulva fasciata, Ulva rigida, Ulva reticulate by using
Mn2ZnO4 heterogenous nanocatalysts. Fuel, 255(February), 115744.
https://doi.org/10.1016/j.fuel.2019.115744
Solis, J. L., Alejo, L., & Kiros, Y. (2016). Calcium and tin oxides for heterogeneous transesterification
of Babasssu oil (Attalea speciosa). Journal of Environmental Chemical Engineering, 4(4), 4870–4877.
https://doi.org/10.1016/j.jece.2016.04.006
Talha, N. S., & Sulaiman, S. (2016). Overview of catalysts in biodiesel production. ARPN Journal of
Engineering and Applied Sciences, 11(1), 439–442.
Tariq, M., Ali, S., & Khalid, N. (2012). Activity of homogeneous and heterogeneous catalysts,
spectroscopic and chromatographic characterization of biodiesel: A review. Renewable and Sustainable
Energy Reviews, 16(8), 6303–6316. https://doi.org/10.1016/j.rser.2012.07.005
Yoshioka, S. (1985). A-i. 19, 245–249.
Yuliana, M., Santoso, S. P., Soetaredjo, F. E., Ismadji, S., Angkawijaya, A. E., Irawaty, W., Ju, Y. H.,
Tran-Nguyen, P. L., & Hartono, S. B. (2020). Utilization of waste capiz shell - Based catalyst for the
conversion of leather tanning waste into biodiesel. Journal of Environmental Chemical Engineering,
8(4), 104012. https://doi.org/10.1016/j.jece.2020.104012
Zhang, H., Li, H., Hu, Y., Venkateswara Rao, K. T., Xu, C. (Charles), & Yang, S. (2019). Advances in
production of bio-based ester fuels with heterogeneous bifunctional catalysts. Renewable and
Sustainable Energy Reviews, 114(February). https://doi.org/10.1016/j.rser.2019.109296

37
Chapter 3 Biodiesel production as an alternative to reduce the environmental impact
of University food courts
Capítulo 3 Producción de biodiesel como escenario alternativo para mejorar el
desempeño ambiental de cafeterías universitarias
ALANIS-RAMÍREZ, Claudia Ivett†*, ÁVILA-CORDOBA, Liliana2, ROMERO-ROMERO, Rubi1 and
NATIVIDAD, Reyna1
1Chemical Eng. Lab., Centro Conjunto de Investigación en Química Sustentable UAEM-UNAM,
Universidad Autónoma del Estado de México, Toluca, Mexico, CP 50200 2Universidad Autónoma del Estado de México, Centro Conjunto en Química Sustentable.
ID 1st Author: Claudia Ivett, Alanis-Ramírez / ORC ID: 0000-0001-6935-1798, CVU CONACYT ID:
360631
ID 1st Co-author: Liliana, Ávila-Cordoba / ORC ID: 0000-0002-1073-5196, CVU CONACYT ID:
323060
ID 2nd Co-author: Rubi, Romero-Romero / ORC ID: 0000-0001-9163-7936, CVU CONACYT ID:
121454
ID 3rd Co-author: Reyna, Natividad / ORC ID: 0000-0001-8978-1066, CVU CONACYT ID: 87755
DOI: 10.35429/H.2021.6.37.50
C. Alanis, L. Ávila, R. Rubi and R. Natividad
A. Marroquín, J. Olivares, M. Ramírez and L. Cruz (Coord). Engineering and Technology. Handbooks-©ECORFAN-México,
Querétaro, 2021.

38
Abstract
The objective of this work was to assess the environmental impacts of producing biodiesel by
heterogeneous and homogeneous catalysis. The raw material for the process was the waste cooking oil
(WCO) generated at 27 food courts of Autonomous University of the State of Mexico. The study was
conducted by applying Life Cycle Assessment methodology and the environmental impacts were
calculated with the SimaPro 9.1.0.11 PhD software with the Ecoinvent database. The method was CML-
IA base line C3.06/EU25. The assessed impact categories were: Abiotic Depletion Potential (ADP,
elements), Abiotic Depletion Potential (ADP, fossil fuels), Global Warming Potential (100 years) (GWP),
Ozone Layer Depletion (ODP), Human Toxicity (HT), Freshwater Aquatic Ecotoxicity (FWAE), Marine
Aquatic Ecotoxicity (MAE), Terrestrial Ecotoxicity (TE), Photochemical Oxidation (PO), Acidification
(A) and Eutrophication (E). In addition, end point environmental indicators were also calculated
(Ecosystems Quality, Human Health Damage and Resources Availability) by the method ReCiPe 2016
Endpoint (H) V1.04 / World (2010) H/A. The system boundary enclosed three main stages, WCO
collection, pre-treatment and reaction (to produce biodiesel). It was concluded that the reaction stage is
the one with the highest environmental impact. In this sense, the highest impact categories were ADP
(fossil fuels) (105.56 MJ), GWP (8.91 kg CO2 eq) and MAE (2387.89 kg 1, 4-DB eq). Nevertheless, it was
also found that the GWP for the heterogeneous process is 82.52 % lower than that calculated for the
homogeneous process. In addition, the human health damage of the homogeneous process is 1.77 points
and is higher than the observed with the heterogeneous process.
Waste cooking oil, Life cycle analysis, Heterogeneous process, Homogeneous process, Bifuntional
catalyst
Resumen
El objetivo de este trabajo fue evaluar los impactos ambientales de la producción de biodiésel mediante
catálisis heterogénea y homogénenea. La materia prima para el proceso fue el aceite de cocina residual
(ACR) generado en 27 cafeterías de la Universidad Autónoma del Estado de México. El estudio se realizó
aplicando la metodología de Análisis de Ciclo de Vida y los impactos ambientales se calcularon con el
software SimaPro 9.1.0.11 y la base de datos Ecoinvent. El método fue CML-IA C3.06/EU25. Las
categorías de impacto evaluadas fueron: Agotamiento Abiótico Potencial (AAP, elementos),
Agotamiento Abiótico Potential (AAP, combustibles fósiles), Potencial de Calentamiento Global (100
años) (PCG), Agotamiento Capa de Ozono (ACO), Toxicidad Humana (TH), Ecotoxicidad de Agua
Dulce (EAD), Ecotoxicidad de Agua Marina (EAM), Ecotoxicidad Terrestre (ET), Oxidación
Fotoquímica (OF), Acidificación (A) y Eutrofización (E). También se calcularon indicadores ambientales
de punto final (Calidad de los Ecosistemas, Daño a la Salud Humana y Disponibilidad de Recursos) por
el método ReCiPe 2016 Endpoint (H) V1.04 / World (2010) H/A. El sistema analizado consistió en tres
etapas principales: colecta, pretratamiento y reacción del ACR para producir biodiésel. Se concluyó que
la etapa de reacción es la que tiene el mayor impacto ambiental. En este sentido, las categorías de mayor
impacto fueron: ACF (105.56 MJ), PCG (8.91 kg de CO2 eq) y EAM (2387.89 kg 1,4-DB eq). No
obstante, también se constató que el PCG para el proceso heterogéneo es 82.52 % inferior al reportado
proceso homogéneneo. Además, el daño a la salud humana del proceso homogéneo es 1.77 puntos mayor
que en el proceso heterogéneo estudiado.
Aceite residual de cocina, Análisis de ciclo de vida, Proceso heterogéneo, Proceso homogéneo,
Catalizador bifuncional
1. Introduction
The Ministry of the Environmental and Natural Resources (SEMARNAT in spanish) in its Sectoral
Program 2020-2024 (SEMARNAT, 2020), suggests that for the sustainable management of organic
waste, it is necessary to strengthen its comprehensive management under a circular economy approach,
integrating this vision into educational processes to promote environmental management in national
and international academic institutions (green schools) (SEMARNAT, 2019). For this, it is necessary
to identify the stages with the greatest environmental impact and this can be achieved by applying a
life cycle assessment (LCA) (Chung et al., 2019). This is an approved international methodology for
the evaluation of bioenergy systems using residual biomass streams from food (Antoniadou et al.,
2020).
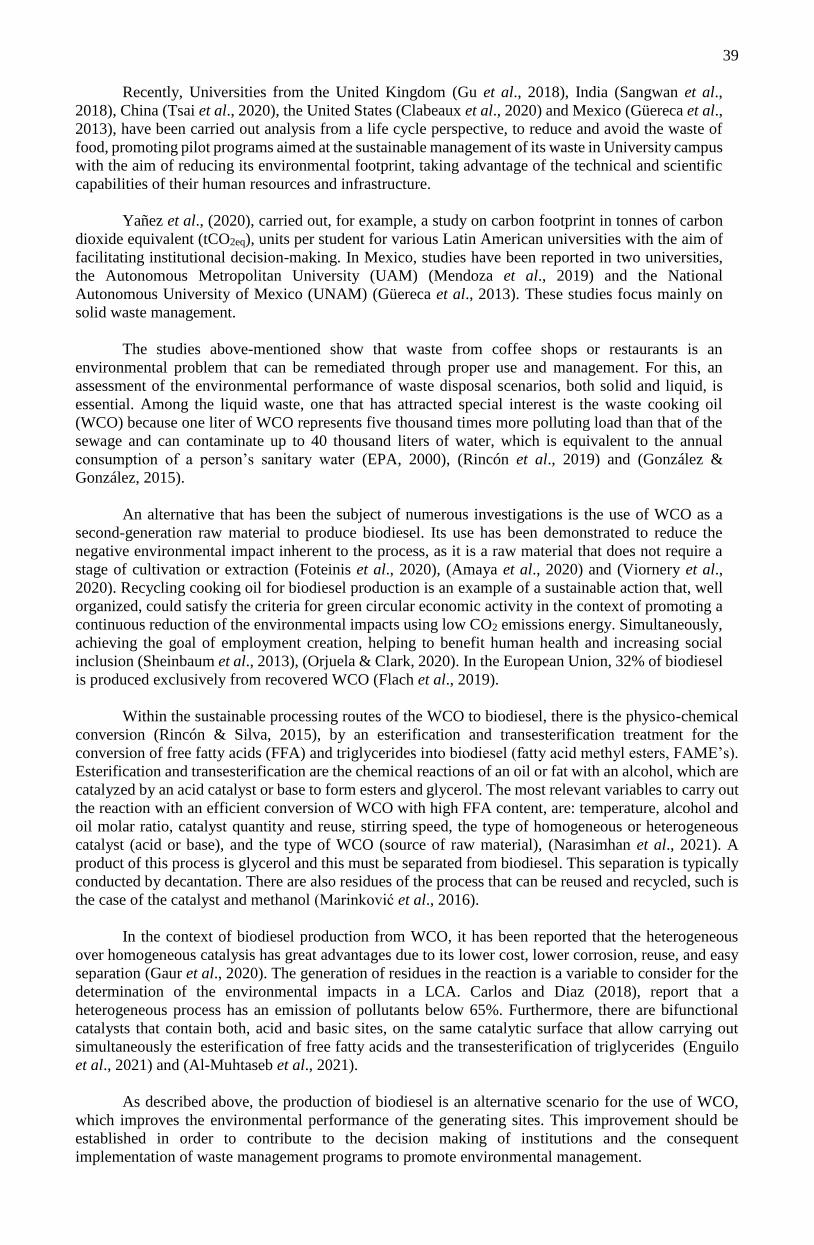
39
Recently, Universities from the United Kingdom (Gu et al., 2018), India (Sangwan et al.,
2018), China (Tsai et al., 2020), the United States (Clabeaux et al., 2020) and Mexico (Güereca et al.,
2013), have been carried out analysis from a life cycle perspective, to reduce and avoid the waste of
food, promoting pilot programs aimed at the sustainable management of its waste in University campus
with the aim of reducing its environmental footprint, taking advantage of the technical and scientific
capabilities of their human resources and infrastructure.
Yañez et al., (2020), carried out, for example, a study on carbon footprint in tonnes of carbon
dioxide equivalent (tCO2eq), units per student for various Latin American universities with the aim of
facilitating institutional decision-making. In Mexico, studies have been reported in two universities,
the Autonomous Metropolitan University (UAM) (Mendoza et al., 2019) and the National
Autonomous University of Mexico (UNAM) (Güereca et al., 2013). These studies focus mainly on
solid waste management.
The studies above-mentioned show that waste from coffee shops or restaurants is an
environmental problem that can be remediated through proper use and management. For this, an
assessment of the environmental performance of waste disposal scenarios, both solid and liquid, is
essential. Among the liquid waste, one that has attracted special interest is the waste cooking oil
(WCO) because one liter of WCO represents five thousand times more polluting load than that of the
sewage and can contaminate up to 40 thousand liters of water, which is equivalent to the annual
consumption of a person’s sanitary water (EPA, 2000), (Rincón et al., 2019) and (González &
González, 2015).
An alternative that has been the subject of numerous investigations is the use of WCO as a
second-generation raw material to produce biodiesel. Its use has been demonstrated to reduce the
negative environmental impact inherent to the process, as it is a raw material that does not require a
stage of cultivation or extraction (Foteinis et al., 2020), (Amaya et al., 2020) and (Viornery et al.,
2020). Recycling cooking oil for biodiesel production is an example of a sustainable action that, well
organized, could satisfy the criteria for green circular economic activity in the context of promoting a
continuous reduction of the environmental impacts using low CO2 emissions energy. Simultaneously,
achieving the goal of employment creation, helping to benefit human health and increasing social
inclusion (Sheinbaum et al., 2013), (Orjuela & Clark, 2020). In the European Union, 32% of biodiesel
is produced exclusively from recovered WCO (Flach et al., 2019).
Within the sustainable processing routes of the WCO to biodiesel, there is the physico-chemical
conversion (Rincón & Silva, 2015), by an esterification and transesterification treatment for the
conversion of free fatty acids (FFA) and triglycerides into biodiesel (fatty acid methyl esters, FAME’s).
Esterification and transesterification are the chemical reactions of an oil or fat with an alcohol, which are
catalyzed by an acid catalyst or base to form esters and glycerol. The most relevant variables to carry out
the reaction with an efficient conversion of WCO with high FFA content, are: temperature, alcohol and
oil molar ratio, catalyst quantity and reuse, stirring speed, the type of homogeneous or heterogeneous
catalyst (acid or base), and the type of WCO (source of raw material), (Narasimhan et al., 2021). A
product of this process is glycerol and this must be separated from biodiesel. This separation is typically
conducted by decantation. There are also residues of the process that can be reused and recycled, such is
the case of the catalyst and methanol (Marinković et al., 2016).
In the context of biodiesel production from WCO, it has been reported that the heterogeneous
over homogeneous catalysis has great advantages due to its lower cost, lower corrosion, reuse, and easy
separation (Gaur et al., 2020). The generation of residues in the reaction is a variable to consider for the
determination of the environmental impacts in a LCA. Carlos and Diaz (2018), report that a
heterogeneous process has an emission of pollutants below 65%. Furthermore, there are bifunctional
catalysts that contain both, acid and basic sites, on the same catalytic surface that allow carrying out
simultaneously the esterification of free fatty acids and the transesterification of triglycerides (Enguilo
et al., 2021) and (Al-Muhtaseb et al., 2021).
As described above, the production of biodiesel is an alternative scenario for the use of WCO,
which improves the environmental performance of the generating sites. This improvement should be
established in order to contribute to the decision making of institutions and the consequent
implementation of waste management programs to promote environmental management.
40
In this chapter it is presented as a subject of study, the University food courts (UFC) of the
Autonomous University of the State of Mexico (UAEMéx). This institution has a guide for the
management of solid urban waste, which classifies the WCO as a waste of special management, coming
mainly from the UFC. However, the destination remains unknown even though collection campaigns
have been conducted to facilitate and ensure final disposal.
The least favorable route is one that negatively impacts the sewage system, wastewater treatment
and increases the risk of contaminating the soil and water bodies (ecotoxicity) (Hartini et al., 2020),
directly affecting biodiversity; for the UFC, is the landfill located in San Luis Mextepec, in the
municipality of Zinacantepec, State of Mexico, approximately 50 kilometers from the central area,
managed by the private company of Environmental Services and Maintenance S.A de C.V (MASERA).
It is worth mentioning that the standard (NADF-012-AMBT-2015) was published in Mexico City, which
"envisages establishing separation as a basic strategy of environmental policy, with the aim of
implementing the management and adequate disposal of waste animal and/or plant fats and oils, seeking
to consider the adoption of management measures, to prevent and reduce environmental impacts and
harmful health effects" (Gaceta oficial de la Ciudad de México, 2018). Based on the above, the main
objective of this work was to establish alternative scenarios to valorize the WCO generated in the UFC
of the Autonomous University of the State of Mexico to biodiesel, through a heterogeneous catalyzed
process and compare it with a homogeneous one.
The objective described in the previous paragraph was achieved through applying the LCA
methodology under ISO 14044 (Environmental management, life cycle analysis, requirements, and
guidelines), which is described in detail in Section 2. In defining the scope, the following aspects were
considered: intended application, reasons for carrying out the study, benefited sector of society,
comparative and individual description of the process under study, functional unit definition, reference
flow and system boundaries. In addition, an inventory was integrated from the data collection, with the
application of surveys to the UFC managers, defining the general characteristics of the WCO generated
in the UFC in the current waste management system. In the analysis of the inventory, inputs and outputs
in the production of biodiesel were quantified, with the experimental information generated in the
Chemical Engineering Laboratory of the Joint Research Center on Sustainable Chemistry UAEM-
UNAM (CCIQS) triglycerides (Enguilo et al., 2021).
For the homogeneous process, theoretical data were obtained from documentary information
(Talens et al., 2010). The results are reported in Section 3, where data for the assessment of mid-point
environmental impacts for the WCO are analyzed, as well as weighting and grouping of those directly
related to life cycle impacts (characterization and classification) for the heterogeneous process. In
addition, the mid-point and end-point environmental impacts for alternative esterification and
transesterification scenarios are compared using homogeneous and heterogeneous catalysis. Finally, the
conclusions section establishes the magnitude of the environmental impacts of the current management
of WCO in the UFC and the feasibility of its reduction, through the production and use of biodiesel in
mobile transport.
The aforementioned opens a window of opportunity, to reduce the environmental footprint of the
University through the implementation of sustainable actions aimed at evaluating environmental
performance indicators such as the reduction of the volume of organic waste for special management
discharged to landfills, extending the lifetime of universities towards a circular economy and promoting
sustainable consumption patterns, and waste management among the University community and
subsequently in other social sectors, within the local level.
2. Methodology
The methodology was developed under the Mexican Standard of Life Cycle Assessment, Requirements
and Guidelines (ISO 14044, 2006) and (UNEP/SETAC Life cycle Initiative, 2005), as shown in Figure
3.1.
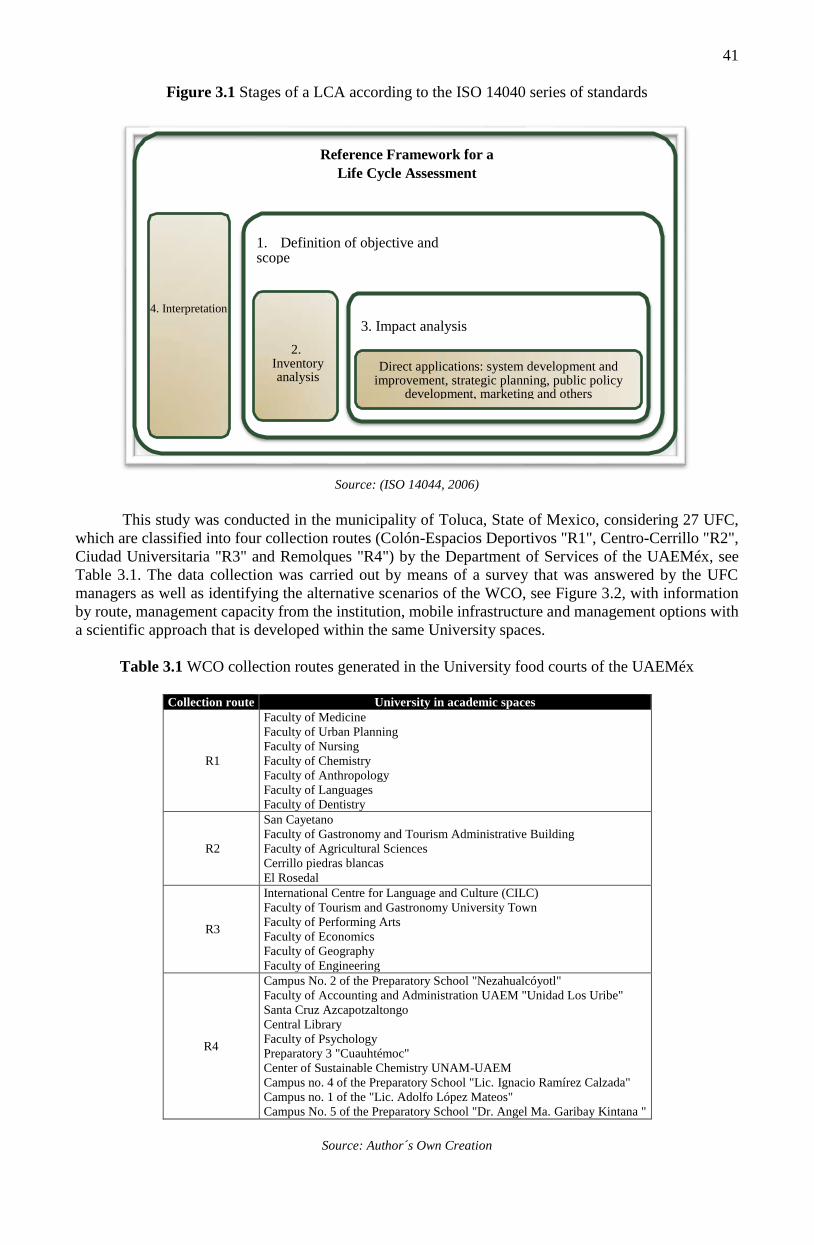
41
Figure 3.1 Stages of a LCA according to the ISO 14040 series of standards
Source: (ISO 14044, 2006)
This study was conducted in the municipality of Toluca, State of Mexico, considering 27 UFC,
which are classified into four collection routes (Colón-Espacios Deportivos "R1", Centro-Cerrillo "R2",
Ciudad Universitaria "R3" and Remolques "R4") by the Department of Services of the UAEMéx, see
Table 3.1. The data collection was carried out by means of a survey that was answered by the UFC
managers as well as identifying the alternative scenarios of the WCO, see Figure 3.2, with information
by route, management capacity from the institution, mobile infrastructure and management options with
a scientific approach that is developed within the same University spaces.
Table 3.1 WCO collection routes generated in the University food courts of the UAEMéx
Collection route University in academic spaces
R1
Faculty of Medicine
Faculty of Urban Planning
Faculty of Nursing
Faculty of Chemistry
Faculty of Anthropology
Faculty of Languages
Faculty of Dentistry
R2
San Cayetano
Faculty of Gastronomy and Tourism Administrative Building
Faculty of Agricultural Sciences
Cerrillo piedras blancas
El Rosedal
R3
International Centre for Language and Culture (CILC)
Faculty of Tourism and Gastronomy University Town
Faculty of Performing Arts
Faculty of Economics
Faculty of Geography
Faculty of Engineering
R4
Campus No. 2 of the Preparatory School "Nezahualcóyotl"
Faculty of Accounting and Administration UAEM "Unidad Los Uribe"
Santa Cruz Azcapotzaltongo
Central Library
Faculty of Psychology
Preparatory 3 "Cuauhtémoc"
Center of Sustainable Chemistry UNAM-UAEM
Campus no. 4 of the Preparatory School "Lic. Ignacio Ramírez Calzada"
Campus no. 1 of the "Lic. Adolfo López Mateos"
Campus No. 5 of the Preparatory School "Dr. Angel Ma. Garibay Kintana "
Source: Author´s Own Creation
Reference Framework for a
Life Cycle Assessment
1. Definition of objective and scope
3. Impact analysis
2. Inventory analysis
Direct applications: system development and improvement, strategic planning, public policy
development, marketing and others
4. Interpretation
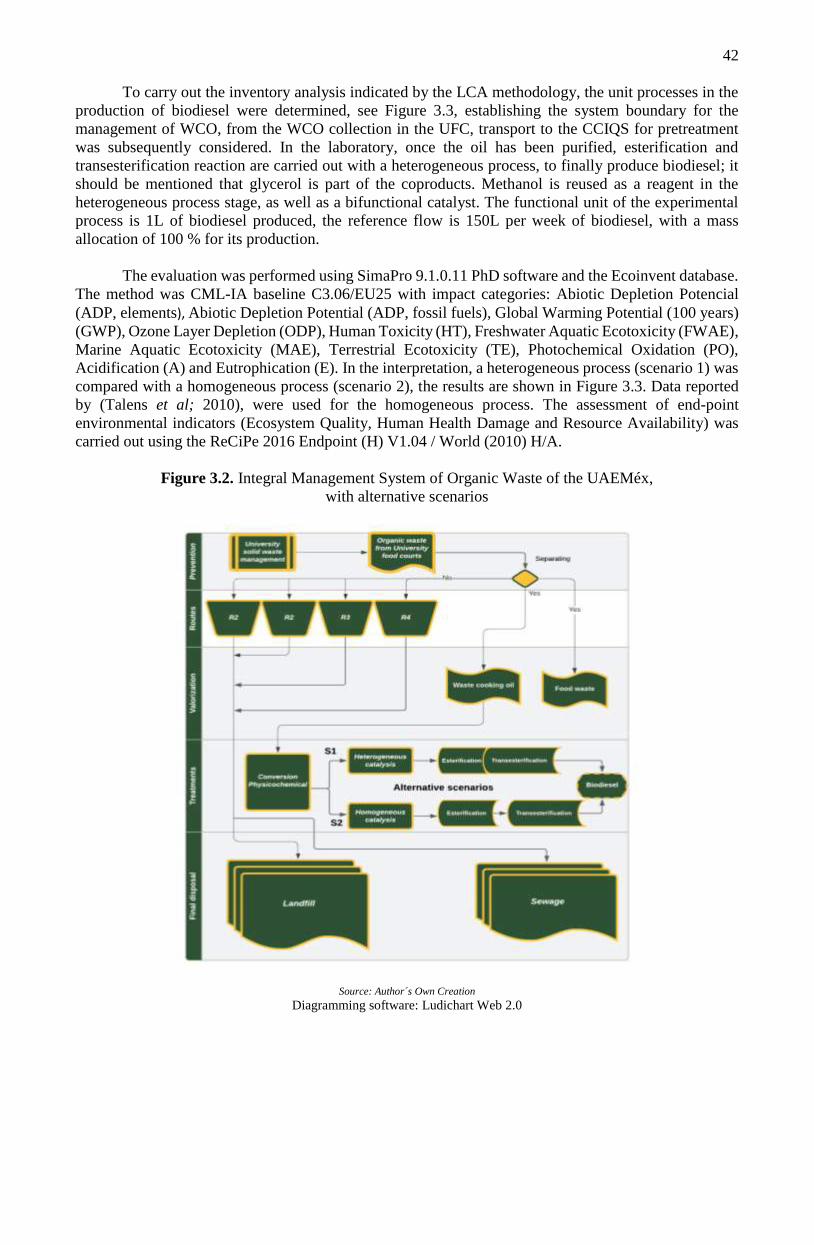
42
To carry out the inventory analysis indicated by the LCA methodology, the unit processes in the
production of biodiesel were determined, see Figure 3.3, establishing the system boundary for the
management of WCO, from the WCO collection in the UFC, transport to the CCIQS for pretreatment
was subsequently considered. In the laboratory, once the oil has been purified, esterification and
transesterification reaction are carried out with a heterogeneous process, to finally produce biodiesel; it
should be mentioned that glycerol is part of the coproducts. Methanol is reused as a reagent in the
heterogeneous process stage, as well as a bifunctional catalyst. The functional unit of the experimental
process is 1L of biodiesel produced, the reference flow is 150L per week of biodiesel, with a mass
allocation of 100 % for its production.
The evaluation was performed using SimaPro 9.1.0.11 PhD software and the Ecoinvent database.
The method was CML-IA baseline C3.06/EU25 with impact categories: Abiotic Depletion Potencial
(ADP, elements), Abiotic Depletion Potential (ADP, fossil fuels), Global Warming Potential (100 years)
(GWP), Ozone Layer Depletion (ODP), Human Toxicity (HT), Freshwater Aquatic Ecotoxicity (FWAE),
Marine Aquatic Ecotoxicity (MAE), Terrestrial Ecotoxicity (TE), Photochemical Oxidation (PO),
Acidification (A) and Eutrophication (E). In the interpretation, a heterogeneous process (scenario 1) was
compared with a homogeneous process (scenario 2), the results are shown in Figure 3.3. Data reported
by (Talens et al; 2010), were used for the homogeneous process. The assessment of end-point
environmental indicators (Ecosystem Quality, Human Health Damage and Resource Availability) was
carried out using the ReCiPe 2016 Endpoint (H) V1.04 / World (2010) H/A.
Figure 3.2. Integral Management System of Organic Waste of the UAEMéx,
with alternative scenarios
Source: Author´s Own Creation
Diagramming software: Ludichart Web 2.0
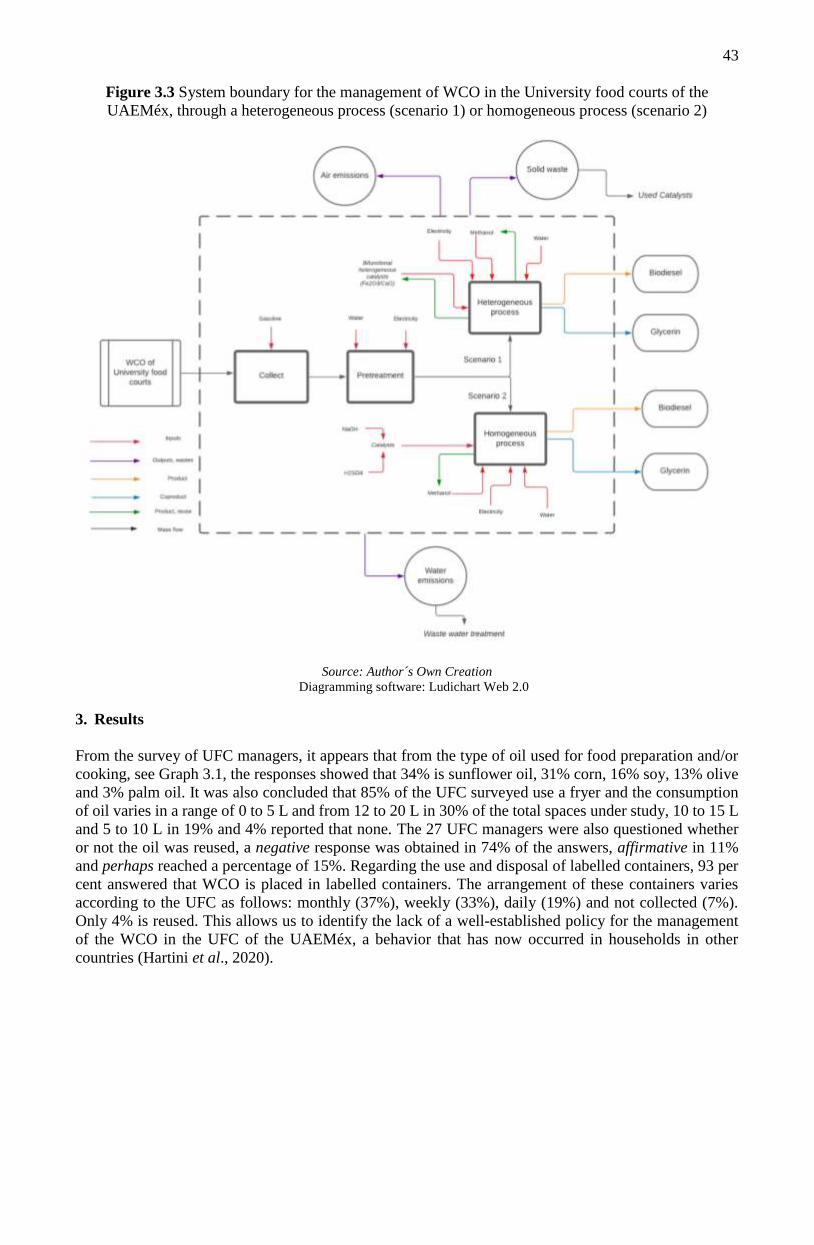
43
Figure 3.3 System boundary for the management of WCO in the University food courts of the
UAEMéx, through a heterogeneous process (scenario 1) or homogeneous process (scenario 2)
Source: Author´s Own Creation
Diagramming software: Ludichart Web 2.0
3. Results
From the survey of UFC managers, it appears that from the type of oil used for food preparation and/or
cooking, see Graph 3.1, the responses showed that 34% is sunflower oil, 31% corn, 16% soy, 13% olive
and 3% palm oil. It was also concluded that 85% of the UFC surveyed use a fryer and the consumption
of oil varies in a range of 0 to 5 L and from 12 to 20 L in 30% of the total spaces under study, 10 to 15 L
and 5 to 10 L in 19% and 4% reported that none. The 27 UFC managers were also questioned whether
or not the oil was reused, a negative response was obtained in 74% of the answers, affirmative in 11%
and perhaps reached a percentage of 15%. Regarding the use and disposal of labelled containers, 93 per
cent answered that WCO is placed in labelled containers. The arrangement of these containers varies
according to the UFC as follows: monthly (37%), weekly (33%), daily (19%) and not collected (7%).
Only 4% is reused. This allows us to identify the lack of a well-established policy for the management
of the WCO in the UFC of the UAEMéx, a behavior that has now occurred in households in other
countries (Hartini et al., 2020).
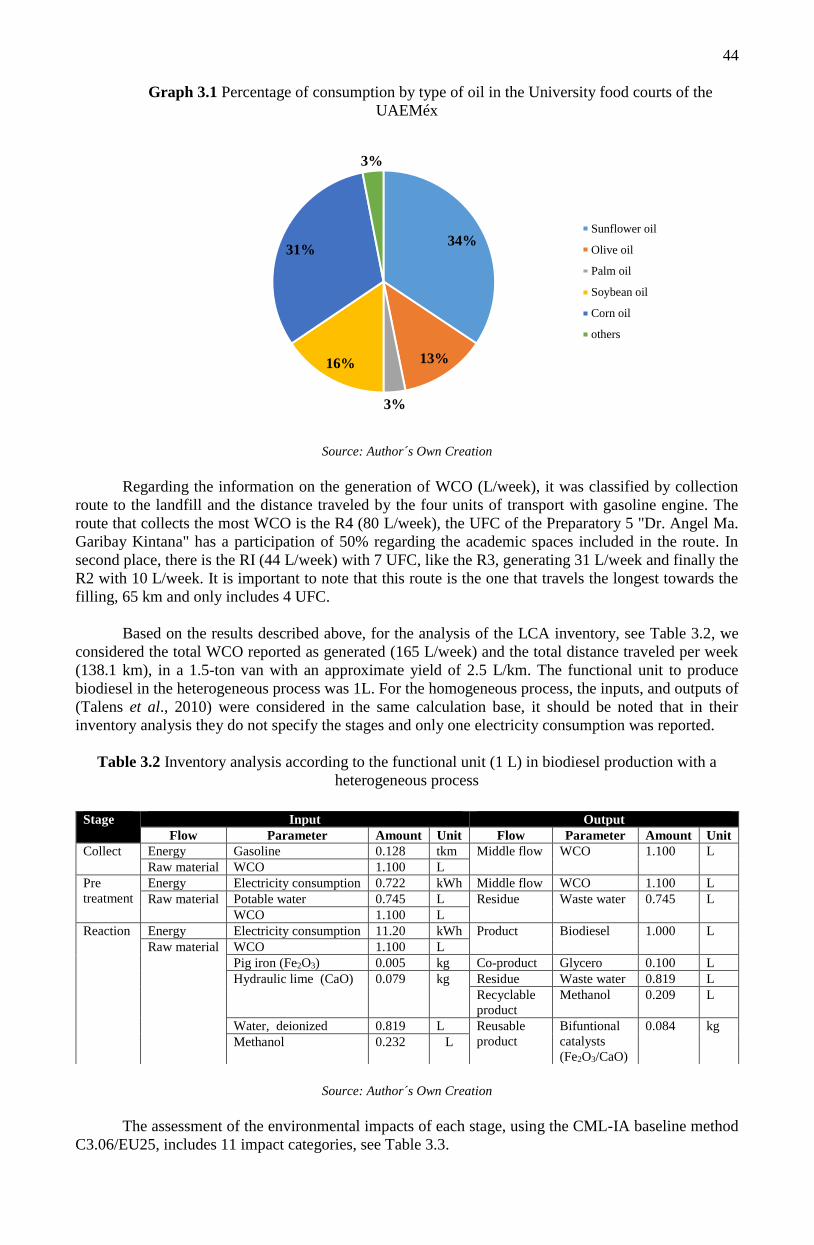
44
Graph 3.1 Percentage of consumption by type of oil in the University food courts of the
UAEMéx
Source: Author´s Own Creation
Regarding the information on the generation of WCO (L/week), it was classified by collection
route to the landfill and the distance traveled by the four units of transport with gasoline engine. The
route that collects the most WCO is the R4 (80 L/week), the UFC of the Preparatory 5 "Dr. Angel Ma.
Garibay Kintana" has a participation of 50% regarding the academic spaces included in the route. In
second place, there is the RI (44 L/week) with 7 UFC, like the R3, generating 31 L/week and finally the
R2 with 10 L/week. It is important to note that this route is the one that travels the longest towards the
filling, 65 km and only includes 4 UFC.
Based on the results described above, for the analysis of the LCA inventory, see Table 3.2, we
considered the total WCO reported as generated (165 L/week) and the total distance traveled per week
(138.1 km), in a 1.5-ton van with an approximate yield of 2.5 L/km. The functional unit to produce
biodiesel in the heterogeneous process was 1L. For the homogeneous process, the inputs, and outputs of
(Talens et al., 2010) were considered in the same calculation base, it should be noted that in their
inventory analysis they do not specify the stages and only one electricity consumption was reported.
Table 3.2 Inventory analysis according to the functional unit (1 L) in biodiesel production with a
heterogeneous process
Source: Author´s Own Creation
The assessment of the environmental impacts of each stage, using the CML-IA baseline method
C3.06/EU25, includes 11 impact categories, see Table 3.3.
34%
13%
3%
16%
31%
3%
Sunflower oil
Olive oil
Palm oil
Soybean oil
Corn oil
others
Stage
Input Output
Flow Parameter Amount Unit Flow Parameter Amount Unit
Collect Energy Gasoline 0.128 tkm Middle flow WCO 1.100 L
Raw material WCO 1.100 L
Pre
treatment
Energy Electricity consumption 0.722 kWh Middle flow WCO 1.100 L
Raw material Potable water 0.745 L Residue Waste water 0.745 L
WCO 1.100 L
Reaction
Energy Electricity consumption 11.20 kWh Product Biodiesel 1.000 L
Raw material WCO 1.100 L
Pig iron (Fe2O3) 0.005 kg Co-product Glycero 0.100 L
Hydraulic lime (CaO) 0.079 kg Residue Waste water 0.819 L
Recyclable
product
Methanol 0.209 L
Water, deionized 0.819 L Reusable
product
Bifuntional
catalysts
(Fe2O3/CaO)
0.084 kg
Methanol 0.232 L
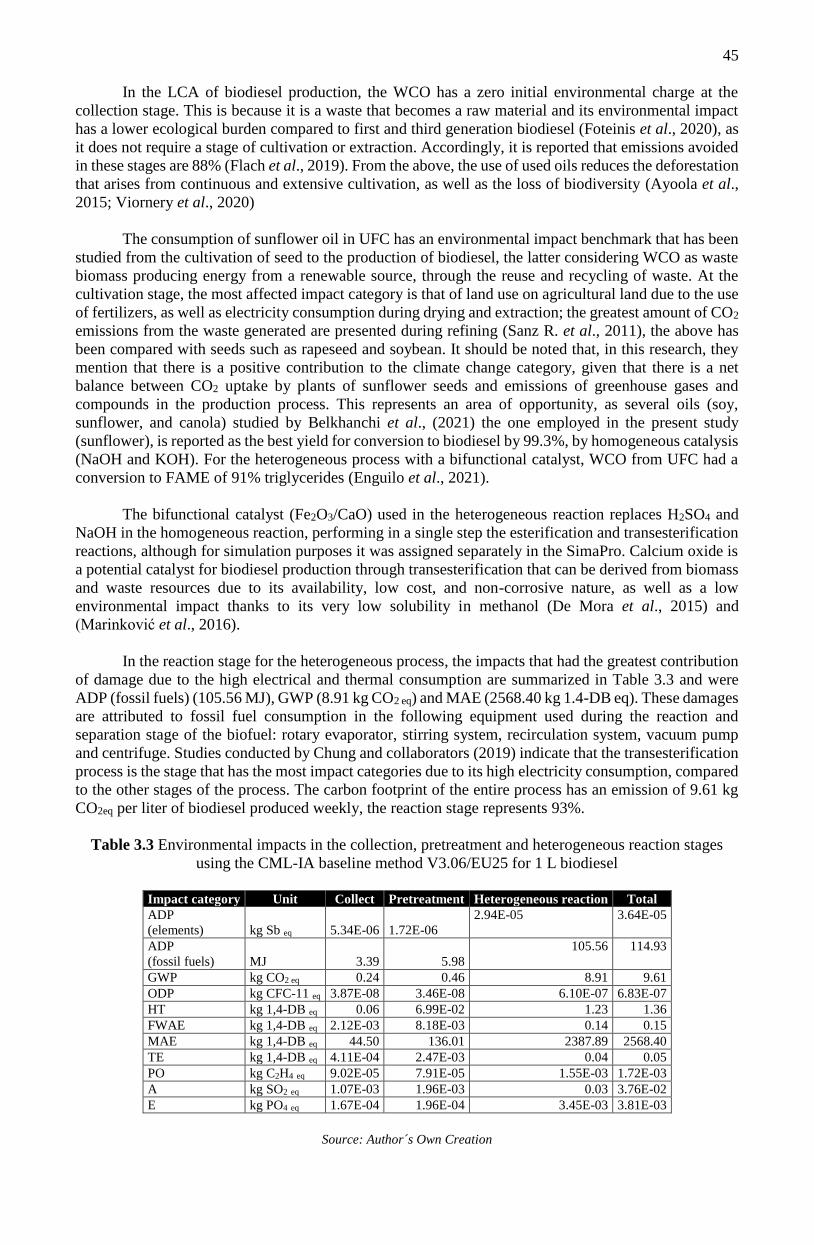
45
In the LCA of biodiesel production, the WCO has a zero initial environmental charge at the
collection stage. This is because it is a waste that becomes a raw material and its environmental impact
has a lower ecological burden compared to first and third generation biodiesel (Foteinis et al., 2020), as
it does not require a stage of cultivation or extraction. Accordingly, it is reported that emissions avoided
in these stages are 88% (Flach et al., 2019). From the above, the use of used oils reduces the deforestation
that arises from continuous and extensive cultivation, as well as the loss of biodiversity (Ayoola et al.,
2015; Viornery et al., 2020)
The consumption of sunflower oil in UFC has an environmental impact benchmark that has been
studied from the cultivation of seed to the production of biodiesel, the latter considering WCO as waste
biomass producing energy from a renewable source, through the reuse and recycling of waste. At the
cultivation stage, the most affected impact category is that of land use on agricultural land due to the use
of fertilizers, as well as electricity consumption during drying and extraction; the greatest amount of CO2
emissions from the waste generated are presented during refining (Sanz R. et al., 2011), the above has
been compared with seeds such as rapeseed and soybean. It should be noted that, in this research, they
mention that there is a positive contribution to the climate change category, given that there is a net
balance between CO2 uptake by plants of sunflower seeds and emissions of greenhouse gases and
compounds in the production process. This represents an area of opportunity, as several oils (soy,
sunflower, and canola) studied by Belkhanchi et al., (2021) the one employed in the present study
(sunflower), is reported as the best yield for conversion to biodiesel by 99.3%, by homogeneous catalysis
(NaOH and KOH). For the heterogeneous process with a bifunctional catalyst, WCO from UFC had a
conversion to FAME of 91% triglycerides (Enguilo et al., 2021).
The bifunctional catalyst (Fe2O3/CaO) used in the heterogeneous reaction replaces H2SO4 and
NaOH in the homogeneous reaction, performing in a single step the esterification and transesterification
reactions, although for simulation purposes it was assigned separately in the SimaPro. Calcium oxide is
a potential catalyst for biodiesel production through transesterification that can be derived from biomass
and waste resources due to its availability, low cost, and non-corrosive nature, as well as a low
environmental impact thanks to its very low solubility in methanol (De Mora et al., 2015) and
(Marinković et al., 2016).
In the reaction stage for the heterogeneous process, the impacts that had the greatest contribution
of damage due to the high electrical and thermal consumption are summarized in Table 3.3 and were
ADP (fossil fuels) (105.56 MJ), GWP (8.91 kg CO2 eq) and MAE (2568.40 kg 1.4-DB eq). These damages
are attributed to fossil fuel consumption in the following equipment used during the reaction and
separation stage of the biofuel: rotary evaporator, stirring system, recirculation system, vacuum pump
and centrifuge. Studies conducted by Chung and collaborators (2019) indicate that the transesterification
process is the stage that has the most impact categories due to its high electricity consumption, compared
to the other stages of the process. The carbon footprint of the entire process has an emission of 9.61 kg
CO2eq per liter of biodiesel produced weekly, the reaction stage represents 93%.
Table 3.3 Environmental impacts in the collection, pretreatment and heterogeneous reaction stages
using the CML-IA baseline method V3.06/EU25 for 1 L biodiesel
Impact category Unit Collect Pretreatment Heterogeneous reaction Total
ADP
(elements) kg Sb eq 5.34E-06 1.72E-06
2.94E-05 3.64E-05
ADP
(fossil fuels) MJ 3.39 5.98
105.56 114.93
GWP kg CO2 eq 0.24 0.46 8.91 9.61
ODP kg CFC-11 eq 3.87E-08 3.46E-08 6.10E-07 6.83E-07
HT kg 1,4-DB eq 0.06 6.99E-02 1.23 1.36
FWAE kg 1,4-DB eq 2.12E-03 8.18E-03 0.14 0.15
MAE kg 1,4-DB eq 44.50 136.01 2387.89 2568.40
TE kg 1,4-DB eq 4.11E-04 2.47E-03 0.04 0.05
PO kg C2H4 eq 9.02E-05 7.91E-05 1.55E-03 1.72E-03
A kg SO2 eq 1.07E-03 1.96E-03 0.03 3.76E-02
E kg PO4 eq 1.67E-04 1.96E-04 3.45E-03 3.81E-03
Source: Author´s Own Creation
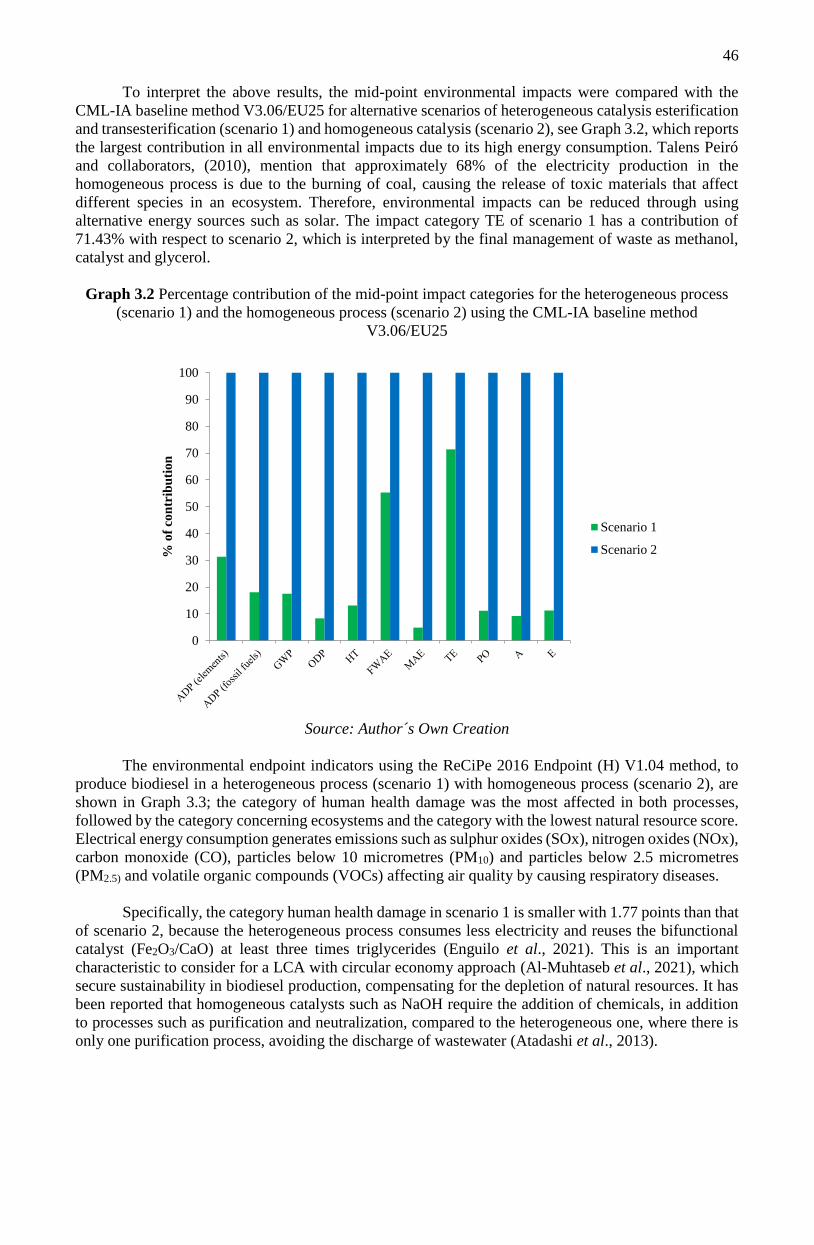
46
To interpret the above results, the mid-point environmental impacts were compared with the
CML-IA baseline method V3.06/EU25 for alternative scenarios of heterogeneous catalysis esterification
and transesterification (scenario 1) and homogeneous catalysis (scenario 2), see Graph 3.2, which reports
the largest contribution in all environmental impacts due to its high energy consumption. Talens Peiró
and collaborators, (2010), mention that approximately 68% of the electricity production in the
homogeneous process is due to the burning of coal, causing the release of toxic materials that affect
different species in an ecosystem. Therefore, environmental impacts can be reduced through using
alternative energy sources such as solar. The impact category TE of scenario 1 has a contribution of
71.43% with respect to scenario 2, which is interpreted by the final management of waste as methanol,
catalyst and glycerol.
Graph 3.2 Percentage contribution of the mid-point impact categories for the heterogeneous process
(scenario 1) and the homogeneous process (scenario 2) using the CML-IA baseline method
V3.06/EU25
Source: Author´s Own Creation
The environmental endpoint indicators using the ReCiPe 2016 Endpoint (H) V1.04 method, to
produce biodiesel in a heterogeneous process (scenario 1) with homogeneous process (scenario 2), are
shown in Graph 3.3; the category of human health damage was the most affected in both processes,
followed by the category concerning ecosystems and the category with the lowest natural resource score.
Electrical energy consumption generates emissions such as sulphur oxides (SOx), nitrogen oxides (NOx),
carbon monoxide (CO), particles below 10 micrometres (PM10) and particles below 2.5 micrometres
(PM2.5) and volatile organic compounds (VOCs) affecting air quality by causing respiratory diseases.
Specifically, the category human health damage in scenario 1 is smaller with 1.77 points than that
of scenario 2, because the heterogeneous process consumes less electricity and reuses the bifunctional
catalyst (Fe2O3/CaO) at least three times triglycerides (Enguilo et al., 2021). This is an important
characteristic to consider for a LCA with circular economy approach (Al-Muhtaseb et al., 2021), which
secure sustainability in biodiesel production, compensating for the depletion of natural resources. It has
been reported that homogeneous catalysts such as NaOH require the addition of chemicals, in addition
to processes such as purification and neutralization, compared to the heterogeneous one, where there is
only one purification process, avoiding the discharge of wastewater (Atadashi et al., 2013).
0
10
20
30
40
50
60
70
80
90
100
% o
f co
ntr
ibu
tio
n
Scenario 1
Scenario 2
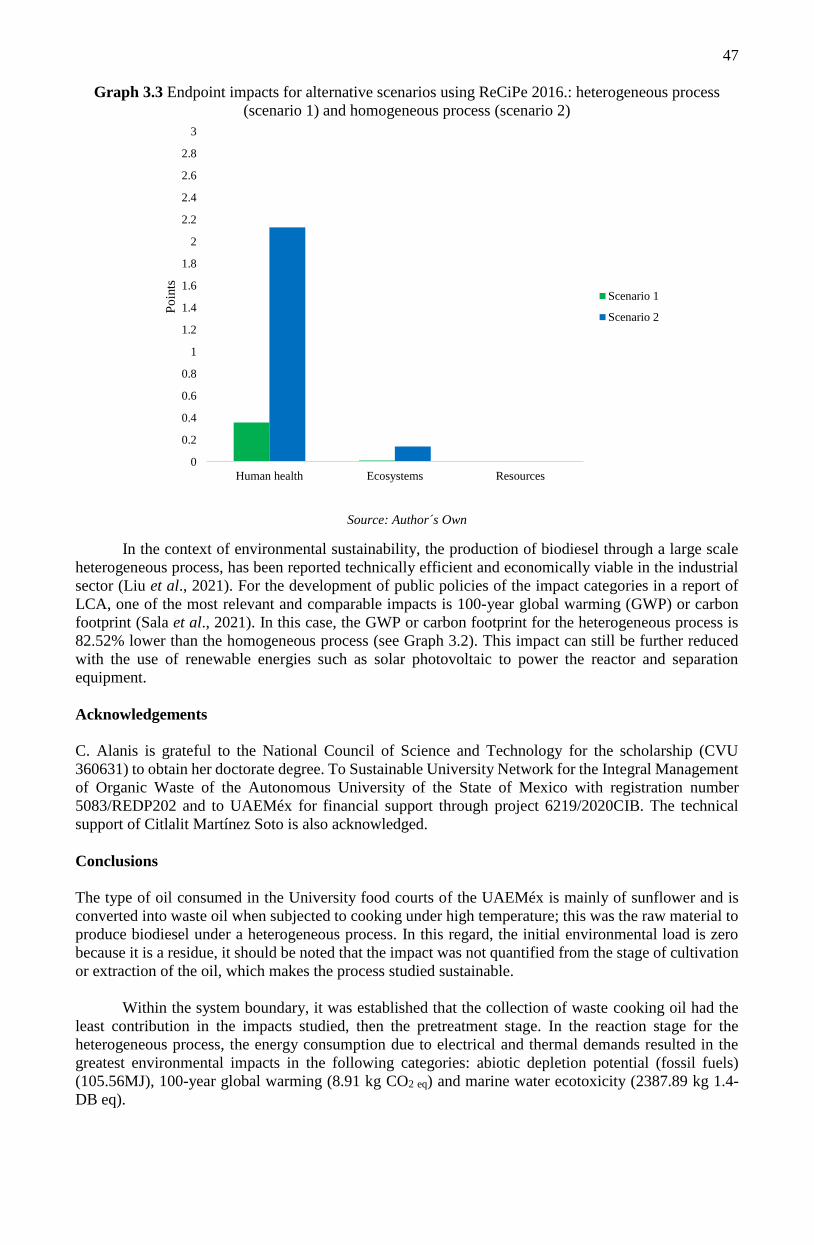
47
Graph 3.3 Endpoint impacts for alternative scenarios using ReCiPe 2016.: heterogeneous process
(scenario 1) and homogeneous process (scenario 2)
Source: Author´s Own
In the context of environmental sustainability, the production of biodiesel through a large scale
heterogeneous process, has been reported technically efficient and economically viable in the industrial
sector (Liu et al., 2021). For the development of public policies of the impact categories in a report of
LCA, one of the most relevant and comparable impacts is 100-year global warming (GWP) or carbon
footprint (Sala et al., 2021). In this case, the GWP or carbon footprint for the heterogeneous process is
82.52% lower than the homogeneous process (see Graph 3.2). This impact can still be further reduced
with the use of renewable energies such as solar photovoltaic to power the reactor and separation
equipment.
Acknowledgements
C. Alanis is grateful to the National Council of Science and Technology for the scholarship (CVU
360631) to obtain her doctorate degree. To Sustainable University Network for the Integral Management
of Organic Waste of the Autonomous University of the State of Mexico with registration number
5083/REDP202 and to UAEMéx for financial support through project 6219/2020CIB. The technical
support of Citlalit Martínez Soto is also acknowledged.
Conclusions
The type of oil consumed in the University food courts of the UAEMéx is mainly of sunflower and is
converted into waste oil when subjected to cooking under high temperature; this was the raw material to
produce biodiesel under a heterogeneous process. In this regard, the initial environmental load is zero
because it is a residue, it should be noted that the impact was not quantified from the stage of cultivation
or extraction of the oil, which makes the process studied sustainable.
Within the system boundary, it was established that the collection of waste cooking oil had the
least contribution in the impacts studied, then the pretreatment stage. In the reaction stage for the
heterogeneous process, the energy consumption due to electrical and thermal demands resulted in the
greatest environmental impacts in the following categories: abiotic depletion potential (fossil fuels)
(105.56MJ), 100-year global warming (8.91 kg CO2 eq) and marine water ecotoxicity (2387.89 kg 1.4-
DB eq).
0
0.2
0.4
0.6
0.8
1
1.2
1.4
1.6
1.8
2
2.2
2.4
2.6
2.8
3
Human health Ecosystems Resources
Po
ints
Scenario 1
Scenario 2
48
In the heterogeneous reaction step, the bifunctional catalyst (Fe2O3/CaO) replaces H2SO4 and
NaOH, performing in a single step the esterification and transesterification, consuming less electricity at
the activation of the catalyst that is at least three times reused and does not require any further thermal
treatment; methanol is recovered for recycling during the reaction; as for glycerol, it is purified, which
gives the process a circular economy approach that ensures the sustainability of biodiesel production.
With respect to the end-point environmental impacts, the homogeneous process has greater to
human health damage with 1.77 points more than the heterogeneous process. This process is mainly
affected by emissions from waste disposal and electricity consumption.
The carbon footprint for the heterogeneous process is lower by 82.52% compared to the
homogeneous process. This contributes to the mitigation of greenhouse gases and compounds, as it
replaces fossil fuels, maintains carbon sinks and prevents deforestation.
The identified areas of opportunity were the reduction of electricity consumption using renewable
energies such as solar photovoltaics; the environmental sustainability of the process from the energy
generated by the production of biodiesel and the energy consumed; the economic and environmental
valorization of glycerol. In the University food courts, it is suggested to conduct environmental education
campaigns in the collection sites to efficiently perform this stage with a pretreatment (purification of
impurities), as well as standardizing a process that allows sampling to verify the initial quality of waste
cooking oil and a collection route that guarantees the recycling of waste cooking oil. Finally, it was also
concluded that a program of management of waste cooking oil in the UAEMéx should be implemented
in order to reduce the carbon footprint of the University food courts.
References
Al-Muhtaseb, A. H., Osman, A. I., Murphin Kumar, P. S., Jamil, F., Al-Haj, L., Al Nabhani, A., Kyaw,
H. H., Myint, M. T. Z., Mehta, N., & Rooney, D. W. (2021). Circular economy approach of enhanced
bifunctional catalytic system of CaO/CeO2 for biodiesel production from waste loquat seed oil with life
cycle assessment study. Energy Conversion and Management, 236, 114040.
https://doi.org/10.1016/j.enconman.2021.114040
Amaya, J., Coello, S., Crespo, T., Hidalgo, J., Jervis, F., Moreira, C., & Soto, M. (2020). Waste to Energy
Potential of Domestic Waste Cooking Oil in Guayaquil: A review. 18th LACCEI International Multi-
Conference for Engineering, Education, and Technology:, 1–7.
https://doi.org/10.18687/laccei2020.1.1.485
Antoniadou, M., Tsarouhas, P., & Varzakas, T. (2020). GSC Advanced Research and Reviews Life cycle
assessment and circular economy in conjunction with treatment methodologies : Presentation and
critical comparison between different food industry waste. 03(03).
Atadashi, I. M., Aroua, M. K., Abdul Aziz, A. R., & Sulaiman, N. M. N. (2013). The effects of catalysts
in biodiesel production: A review. Journal of Industrial and Engineering Chemistry, 19(1), 14–26.
https://doi.org/10.1016/j.jiec.2012.07.009
Ayoola, B., Ayodele, A., Submitted, T., Engineering, C., & Engineering, C. (2015). Production and Life
Cycle Assessment of Biodiesel from Three Waste Oils By A Thesis Submitted in the Department of
Chemical Engineering to the School of Post Graduate Studies ( Ph . D .) in Chemical Engineering ,
College of Science and Technology , Covena.
Belkhanchi, H., Rouan, M., Hammi, M., & Ziat, Y. (2021). Synthesis of Biodiesel by Transesterification
of Used Frying Oils ( UFO ) through Basic Homogeneous Catalysts ( NaOH and KOH ). 11(5), 12858–
12868.
Carlos, S., & Díaz, M. D. L. V. (2018). Evaluación De Un Proceso Industrial De Producción De Biodiésel
Mediante Análisis De Ciclo De Vida. Revista Internacional de Contaminacion Ambiental, 34(3), 453–
465. https://doi.org/10.20937/RICA.2018.34.03.08
49
Chung, Z. L., Tan, Y. H., Chan, Y. S., Kansedo, J., Mubarak, N. M., Ghasemi, M., & Abdullah, M. O.
(2019). Life cycle assessment of waste cooking oil for biodiesel production using waste chicken eggshell
derived CaO as catalyst via transesterification. Biocatalysis and Agricultural Biotechnology.
https://doi.org/10.1016/j.bcab.2019.101317
Clabeaux, R., Carbajales-dale, M., Ladner, D., & Walker, T. (2020). Assessing the carbon footprint of a
university campus using a life cycle assessment approach. Journal of Cleaner Production, 122600.
https://doi.org/10.1016/j.jclepro.2020.122600
De Mora, E. F., Torres, C., & Valero, A. (2015). Thermoeconomic analysis of biodiesel production from
used cooking oils. Sustainability (Switzerland), 7(5), 6321–6335. https://doi.org/10.3390/su7056321
Enguilo, V., Romero, R., Gómez-Espinosa, R. M., Romero, A., Martínez, S. L., & Natividad, R. (2021).
Biodiesel Production from Waste Cooking Oil Catalyzed by a Bifunctional Catalyst. ACS Omega.
24092−24105. https://doi.org/10.1021/acsomega.1c03586
EPA. (2000). Recycled cooking oils: Assessment of risks for public health. Working document for
Scientific and Technological Options Assessment (STOA). European Union, September, 373–385.
http://dx.doi.org/10.1016/B978-1-893997-92-9.50027-X
Flach, B., Lieberz, S., & Bolla, S. (2019). GAIN Report - EU Biofuels Annual 2019. Global Agricultural
Information Network, 52.
https://apps.fas.usda.gov/newgainapi/api/report/downloadreportbyfilename?filename=Biofuels
Annual_The Hague_EU-28_7-15-2019.pdf
Foteinis, S., Chatzisymeon, E., Litinas, A., & Tsoutsos, T. (2020). Used-cooking-oil biodiesel: Life cycle
assessment and comparison with first- and third-generation biofuel. Renewable Energy, 153, 588–600.
https://doi.org/10.1016/j.renene.2020.02.022
Gaceta oficial de la Ciudad de México. (2018). NADF- 012-AMBT-2015. En Diario Oficial de la
Federación. https://doi.org/10.1017/CBO9781107415324.004
Gaur, A., Mishra, S., Chowdhury, S., Baredar, P., & Verma, P. (2020). Materials Today : Proceedings A
review on factor affecting biodiesel production from waste cooking oil : An Indian perspective. Materials
Today: Proceedings, 7. https://doi.org/10.1016/j.matpr.2020.09.432
González, I., & González, J. (2015). Aceites usados de cocina. problemática ambiental, incidencias en
redes de saneamiento y coste del tratamiento en depuradoras. Consorcio de Aguas Bilbao Bizkaia, 1–8.
http://www.aguasresiduales.info/revista/articulos/problematica-ambiental-incidencias-en-redes-de-
saneamiento-y-coste-del-tratamiento-en-depuradoras-de-los-aceites-usados-en-cocina
Gu, Y., Wang, H., Robinson, Z. P., Wang, X., Wu, J., Li, X., Xu, J., & Li, F. (2018). Environmental
footprint assessment of green campus from a food-water-energy nexus perspective. Energy Procedia.
https://doi.org/10.1016/j.egypro.2018.09.109
Güereca, L. P., Torres, N., & Noyola, A. (2013). Carbon Footprint as a basis for a cleaner research
institute in Mexico. Journal of Cleaner Production, 47, 396–403.
https://doi.org/10.1016/j.jclepro.2013.01.030
Hartini, S., Puspitasari, D., Aisy, N. R., & Widharto, Y. (2020). Eco-efficiency Level of Production
Process of Waste Cooking Oil to be Biodiesel with Life Cycle Assessment. ICENIS, 10004, 1–9.
ISO 14044. (2006). Environmental management — Life cycle assessment — Requirements and
guidelines. En International Organization for Standardization.
http://www.springerlink.com/index/10.1007/s11367-011-0297-3
Liu, Y., Yang, X., & Zhu, Z. (2021). Economic evaluation and production process simulation of biodiesel
production from waste cooking oil. Current Research in Green and Sustainable Chemistry, 100091.
https://doi.org/10.1016/j.crgsc.2021.100091
50
Marinković, D. M., Stanković, M. V., Veličković, A. V., Avramović, J. M., Miladinović, M. R.,
Stamenković, O. O., Veljković, V. B., & Jovanović, D. M. (2016). Calcium oxide as a promising
heterogeneous catalyst for biodiesel production: Current state and perspectives. Renewable and
Sustainable Energy Reviews, 56, 1387–1408. https://doi.org/10.1016/j.rser.2015.12.007
Mendoza, R., Quintero, R., & Ortiz, I. (2019). The carbon footprint of a public university campus in
Mexico City. Carbon Management, 10(5), 501–511. https://doi.org/10.1080/17583004.2019.1642042
Narasimhan, M., Chandrasekaran, M., Govindasamy, S., & Aravamudhan, A. (2021). Heterogeneous
nanocatalysts for sustainable biodiesel production: A review. Journal of Environmental Chemical
Engineering, 9(1), 104876. https://doi.org/10.1016/j.jece.2020.104876
Orjuela, A., & Clark, J. (2020). Green Chemicals from Used Cooking Oils: Trends, Challenges and
Opportunities. Current Opinion in Green and Sustainable Chemistry, 100369.
https://doi.org/10.1016/j.cogsc.2020.100369
Rincón, J., & Silva, E. (2015). Bioenergía: Fuentes, conversión y sustentabilidad (CYTED).
https://books.google.com/books?id=YpnxCAAAQBAJ&pgis=1
Rincón, L., Cadavid, J., & Orjuela, A. (2019). Used cooking oils as potential oleochemical feedstock for
urban biorefineries – Study case in Bogota, Colombia. Waste Management, 88, 200–210.
https://doi.org/10.1016/j.wasman.2019.03.042
Sala, S., Martino, A., Antoine, A., & Fulvio, B. (2021). The evolution of life cycle assessment in
European policies over three decades. The International Journal of Life Cycle Assessment, 0123456789.
https://doi.org/10.1007/s11367-021-01893-2
Sangwan, K. S., Bhakar, V., Arora, V., & Solanki, P. (2018). Measuring Carbon Footprint of an Indian
University Using Life Cycle Assessment. Procedia CIRP, 69(May), 475–480.
https://doi.org/10.1016/j.procir.2017.11.111
Sanz R., J. F., Guimaraes, A. C., Quirós Alpera, S., Relea Gangas, E., Hernandez-Navarro, S., Navas
Gracia, L. M., Martin-Gil, J., & Fresneda Cuesta, H. (2011). Life Cycle Assessment (LCA) of the biofuel
production process from sunflower oil, rapeseed oil and soybean oil. Fuel Processing Technology, 92(2),
190–199. https://doi.org/10.1016/j.fuproc.2010.03.004
SEMARNAT. (2019). Visión Nacional hacia una gestión Sustentable: Cero Residuos.
SEMARNAT. (2020). Programa Sectorial de Medio Ambiente y Recursos Naturales 2020-2024.
Sheinbaum, C., Caldero, A., & Ramı, M. (2013). Potential of biodiesel from waste cooking oil in Mexico.
Biomass and Bioenergy, 6(55). https://doi.org/10.1016/j.biombioe.2013.05.008
Talens, L., Lombardi, L., Villalba Méndez, G., & Gabarrell i Durany, X. (2010). Life cycle assessment
(LCA) and exergetic life cycle assessment (ELCA) of the production of biodiesel from used cooking oil
(UCO). Energy, 35(2), 889–893. https://doi.org/10.1016/j.energy.2009.07.013
Tsai, W.-C., Chen, X., & Yang, C. (2020). Consumer Food Waste Behavior among Emerging Adults:
Evidence from China. Foods, 9(7), 961. https://doi.org/10.3390/foods9070961
UNEP/SETAC Life cycle Initiative. (2005). Life Cycle approaches : The road from analysis to practice.
En Assessment.
Viornery, E. A., Bravo, B., & Mena, V. Y. (2020). Life cycle assessment and emission analysis of waste
cooking oil biodiesel blend and fossil diesel used in a power generator. Fuel, 281(March), 118739.
https://doi.org/10.1016/j.fuel.2020.118739
Yañez, P., Sinha, A., & Vásquez, M. (2020). Carbon footprint estimation in a university campus:
Evaluation and insights. Sustainability (Switzerland), 12(1), 1–15. https://doi.org/10.3390/SU12010181
51
Chapter 4 Absorption and reaction of CO2 in capillaries
Capítulo 4 Absorción y reacción de CO2 en capilares
PEÑA, Rosaura†1, HURTADO, Lourdes2, ROMERO, Rubi1 and NATIVIDAD, Reyna*1
1Chemical Engineering Lab / Centro Conjunto de Investigación en Química Sustentable UAEM-UNAM,
Universidad Autónoma del Estado de México 2Unidad Académica Profesional Acolman, Universidad Autónoma del Estado de México
ID 1st Author: Rosaura, Peña / ORC ID: 0000-0001-9184-8477, CVU CONACYT ID: 239954
ID 1st Co-author: Lourdes, Hurtado / ORC ID: 0000-0001-9892-9528, CVU CONACYT ID: 368065
ID 2nd Co-author: Rubi, Romero / ORC ID: 0000-0001-9163-7936, CVU CONACYT ID: 121454
ID 3rd Co-author: Reyna, Natividad / ORC ID: 0000-0001-8978-1066, CVU CONACYT ID: 87755
DOI: 10.35429/H.2021.6.51.74
R. Peña, L. Hurtado, R. Romero, and R. Natividad
A. Marroquín, J. Olivares, M. Ramírez and L. Cruz (Coord) Engineering and Technology. Handbooks-©ECORFAN-México,
Querétaro, 2021.
52
Abstract
The process of carbon dioxide (CO2) reduction to value-added chemicals is being extensively studied
worldwide. The main purpose is to decrease emissions to the environment that are associated with global
warming, as well as the creation of renewable and sustainable energy sources. In the aforementioned
process, the absorption of CO2 is of paramount importance as well as the reactor where the CO2
conversion takes place. In this context, the objective of this chapter is to present and analyze the results
of the CO2 absorption in alkaline solutions in capillary reactors. A hydrodynamic study is included in
order to establish the operational window of liquid and gas velocities in order to achieve the Taylor flow
regime. All experiments were conducted in a capillary reactor (dc = 3 mm). The studied variables were
temperature, NaOH concentration (0-0.75 M) and capillary length (300 and 100 mm). It was found that
the volumetric mass transfer coefficient of the absorption of CO2 in water increases when the temperature
decreases, while the CO2 absorption in NaOH solutions increases directly with temperature. By means
of the Ha number, it was concluded that the mass transfer controlled the absorption process when using
alkaline solutions.
CO2 absorption, capillary reactor, mass transfer, pH, reactive absorption
Resumen
El proceso de reducción de dióxido de carbono (CO2) a productos químicos de valor agregado se está
estudiando ampliamente a nivel mundial. La finalidad principal es disminuir emisiones al medio
ambiente, las cuales se asocian al calentamiento global, así como la creación de fuentes de energías
renovables y sustentables. En el proceso antes mencionado, la absorción de CO2 es de suma importancia,
así como el reactor donde se realiza la conversión del CO2. En este contexto, el objetivo de este capítulo
es presentar los resultados de la absorción de CO2 en soluciones alcalinas llevada a cabo en un reactor
capilar. Se incluye un estudio hidrodinámico para establecer la ventana de operación de velocidades de
líquido y gas para obtener el régimen tipo Taylor. Todos los experimentos se realizaron en un reactor
capilar (dc = 3 mm). Las variables estudiadas fueron temperatura, concentración de NaOH (0-0.75M) y
la longitud del capilar (300 y 100 mm). Se encontró que el valor del coeficiente de transferencia de masa
si la absorción de CO2 se realiza en agua incrementa cuando la temperatura disminuye mientras que la
absorción en soluciones de NaOH incrementa directamente con la temperatura. Mediante el número de
Hatta (Ha) se concluye que la transferencia de masa controla el proceso de absorción cuando se emplean
soluciones alcalinas.
Absorción de CO2, reactor capilar, transferencia de masa, pH, absorción reactiva
1. Introduction
Currently, the conservation of terrestrial ecosystems has attracted the attention of the scientific
community due to the fact that damage to these ecosystems because of global warming has been
observed. In this context, various research groups have focused on proposing strategies aimed at reducing
pollutants in the environment. Global warming is caused by the greenhouse effect, a natural mechanism
in which the Earth's atmosphere heats up, and it occurs thanks to the presence of certain gases, including
carbon dioxide and other gases present in the air -such as water vapor (H2O), methane (CH4), nitrogen
oxides (NO, N2O, NO2) and ozone (O3), which are known as greenhouse gases. These gases can absorb
solar radiation favoring the increase in temperature in the atmosphere. One of the most important is
carbon dioxide since its concentration in the atmosphere is constantly increasing. The exponential
increase in anthropogenic activities such as agriculture, industry, indiscriminate felling of trees,
destruction of vegetation, the burning of fossil fuels along with the intensive destruction of ecosystems,
have caused carbon dioxide emissions to the atmosphere to be greater than the amount required to carry
out photosynthesis or the amount of gas that dissolves in ocean waters.
In addition to this, the development of alternative energy sources to replace fossil fuels has
focused mainly on the development of clean energy sources, without carbon emissions, such as turbines
powered by water and wind and solar energy; however, the drawback with renewable energy sources is
the intermittent nature of the energy produced (Mebrahtu et al., 2019).
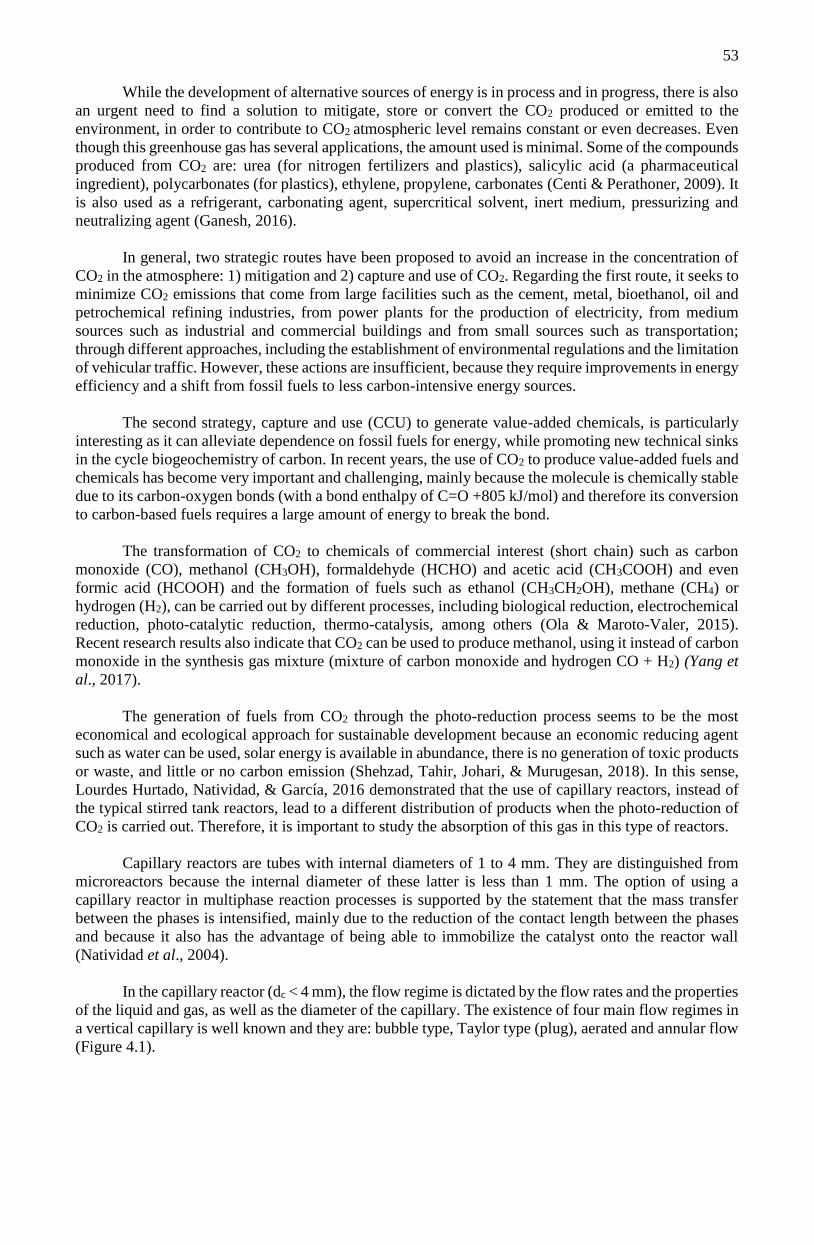
53
While the development of alternative sources of energy is in process and in progress, there is also
an urgent need to find a solution to mitigate, store or convert the CO2 produced or emitted to the
environment, in order to contribute to CO2 atmospheric level remains constant or even decreases. Even
though this greenhouse gas has several applications, the amount used is minimal. Some of the compounds
produced from CO2 are: urea (for nitrogen fertilizers and plastics), salicylic acid (a pharmaceutical
ingredient), polycarbonates (for plastics), ethylene, propylene, carbonates (Centi & Perathoner, 2009). It
is also used as a refrigerant, carbonating agent, supercritical solvent, inert medium, pressurizing and
neutralizing agent (Ganesh, 2016).
In general, two strategic routes have been proposed to avoid an increase in the concentration of
CO2 in the atmosphere: 1) mitigation and 2) capture and use of CO2. Regarding the first route, it seeks to
minimize CO2 emissions that come from large facilities such as the cement, metal, bioethanol, oil and
petrochemical refining industries, from power plants for the production of electricity, from medium
sources such as industrial and commercial buildings and from small sources such as transportation;
through different approaches, including the establishment of environmental regulations and the limitation
of vehicular traffic. However, these actions are insufficient, because they require improvements in energy
efficiency and a shift from fossil fuels to less carbon-intensive energy sources.
The second strategy, capture and use (CCU) to generate value-added chemicals, is particularly
interesting as it can alleviate dependence on fossil fuels for energy, while promoting new technical sinks
in the cycle biogeochemistry of carbon. In recent years, the use of CO2 to produce value-added fuels and
chemicals has become very important and challenging, mainly because the molecule is chemically stable
due to its carbon-oxygen bonds (with a bond enthalpy of C=O +805 kJ/mol) and therefore its conversion
to carbon-based fuels requires a large amount of energy to break the bond.
The transformation of CO2 to chemicals of commercial interest (short chain) such as carbon
monoxide (CO), methanol (CH3OH), formaldehyde (HCHO) and acetic acid (CH3COOH) and even
formic acid (HCOOH) and the formation of fuels such as ethanol (CH3CH2OH), methane (CH4) or
hydrogen (H2), can be carried out by different processes, including biological reduction, electrochemical
reduction, photo-catalytic reduction, thermo-catalysis, among others (Ola & Maroto-Valer, 2015).
Recent research results also indicate that CO2 can be used to produce methanol, using it instead of carbon
monoxide in the synthesis gas mixture (mixture of carbon monoxide and hydrogen CO + H2) (Yang et
al., 2017).
The generation of fuels from CO2 through the photo-reduction process seems to be the most
economical and ecological approach for sustainable development because an economic reducing agent
such as water can be used, solar energy is available in abundance, there is no generation of toxic products
or waste, and little or no carbon emission (Shehzad, Tahir, Johari, & Murugesan, 2018). In this sense,
Lourdes Hurtado, Natividad, & García, 2016 demonstrated that the use of capillary reactors, instead of
the typical stirred tank reactors, lead to a different distribution of products when the photo-reduction of
CO2 is carried out. Therefore, it is important to study the absorption of this gas in this type of reactors.
Capillary reactors are tubes with internal diameters of 1 to 4 mm. They are distinguished from
microreactors because the internal diameter of these latter is less than 1 mm. The option of using a
capillary reactor in multiphase reaction processes is supported by the statement that the mass transfer
between the phases is intensified, mainly due to the reduction of the contact length between the phases
and because it also has the advantage of being able to immobilize the catalyst onto the reactor wall
(Natividad et al., 2004).
In the capillary reactor (dc < 4 mm), the flow regime is dictated by the flow rates and the properties
of the liquid and gas, as well as the diameter of the capillary. The existence of four main flow regimes in
a vertical capillary is well known and they are: bubble type, Taylor type (plug), aerated and annular flow (Figure 4.1).
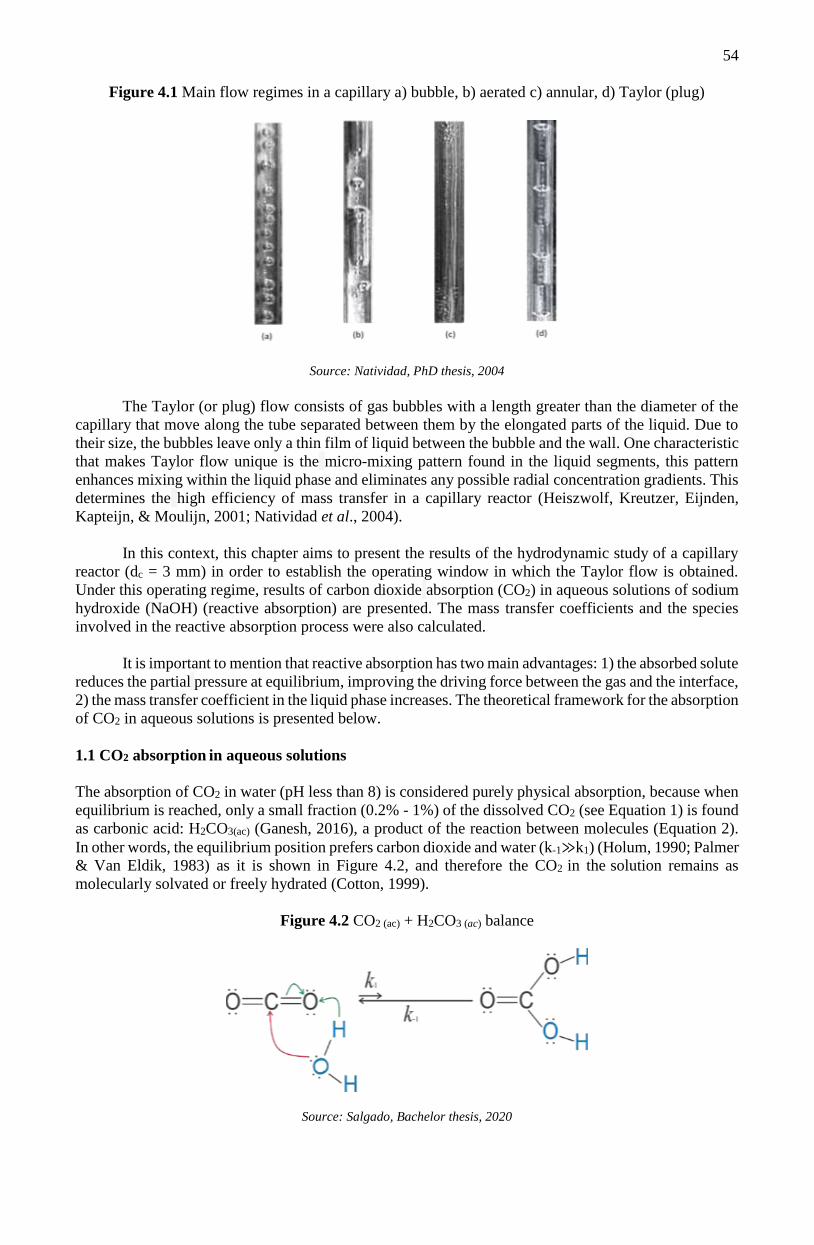
54
Figure 4.1 Main flow regimes in a capillary a) bubble, b) aerated c) annular, d) Taylor (plug)
Source: Natividad, PhD thesis, 2004
The Taylor (or plug) flow consists of gas bubbles with a length greater than the diameter of the
capillary that move along the tube separated between them by the elongated parts of the liquid. Due to
their size, the bubbles leave only a thin film of liquid between the bubble and the wall. One characteristic
that makes Taylor flow unique is the micro-mixing pattern found in the liquid segments, this pattern
enhances mixing within the liquid phase and eliminates any possible radial concentration gradients. This
determines the high efficiency of mass transfer in a capillary reactor (Heiszwolf, Kreutzer, Eijnden,
Kapteijn, & Moulijn, 2001; Natividad et al., 2004).
In this context, this chapter aims to present the results of the hydrodynamic study of a capillary
reactor (dc = 3 mm) in order to establish the operating window in which the Taylor flow is obtained.
Under this operating regime, results of carbon dioxide absorption (CO2) in aqueous solutions of sodium
hydroxide (NaOH) (reactive absorption) are presented. The mass transfer coefficients and the species
involved in the reactive absorption process were also calculated.
It is important to mention that reactive absorption has two main advantages: 1) the absorbed solute
reduces the partial pressure at equilibrium, improving the driving force between the gas and the interface,
2) the mass transfer coefficient in the liquid phase increases. The theoretical framework for the absorption
of CO2 in aqueous solutions is presented below.
1.1 CO2 absorption in aqueous solutions
The absorption of CO2 in water (pH less than 8) is considered purely physical absorption, because when
equilibrium is reached, only a small fraction (0.2% - 1%) of the dissolved CO2 (see Equation 1) is found
as carbonic acid: H2CO3(ac) (Ganesh, 2016), a product of the reaction between molecules (Equation 2).
In other words, the equilibrium position prefers carbon dioxide and water (k-1≫k1) (Holum, 1990; Palmer
& Van Eldik, 1983) as it is shown in Figure 4.2, and therefore the CO2 in the solution remains as
molecularly solvated or freely hydrated (Cotton, 1999).
Figure 4.2 CO2 (ac) + H2CO3 (ac) balance
Source: Salgado, Bachelor thesis, 2020
55
Equilibrium is reached when carbonic acid, which is a weak acid, dissociates twice due to its two
protons attached to its oxygen atoms. In the first dissociation (Equation 3) a proton (H+) and a bicarbonate
ion (HCO3-) are released, in the second dissociation (Equation 4) the carbonate ion (CO3
2-) is generated
and the second H+ proton is released. If the conjugated bases are not found with another species with a
positive charge different from the protons, carbonic acid is formed again. Therefore, it can be asserted
that, if the absorption medium is only water, the only species found in solution is dissolved CO2, for
practical purposes H2CO3*, without omitting the small amount of carbonic acid formed (Equation 5)
(Ganesh, 2016).
𝐶𝑂2(𝑔) ↔ 𝐶𝑂2(𝑎𝑞) (1)
𝐶𝑂2 (𝑎𝑞) + 𝐻2𝑂 ↔ 𝐻2𝐶𝑂3∗ (2)
𝐻2𝐶𝑂3 ↔ 𝐻+ + 𝐻𝐶𝑂3− (3)
𝐻𝐶𝑂3− ↔ 𝐻+ + 𝐶𝑂3
2− (4)
𝐻2𝐶𝑂3∗ = 𝐻2𝐶𝑂3 (𝑎𝑞) + 𝐶𝑂2 (𝑎𝑞) (5)
During the reactive absorption of CO2, the dissolution is carried out in solutions at a pH higher
than 8, which is reached when alkaline solutions are used. The presence of cations (Na+, K+, Mg2+, Ca2+)
and anions (OH-) in aqueous solution causes that the equilibrium in the reaction H2CO3* is not reached
until the reactions between the dissolved ions and the resulting ions of the dissociation reactions of
H2CO3* take place (Savage, Astarita, & Joshi, 1980; Shim, Lee, Lee, & Kwak, 2016; Skoog, 2014).
𝐻2𝐶𝑂3 + 𝑂𝐻− ↔ 𝐻𝐶𝑂3− + 𝐻2𝑂 (6)
𝐻𝐶𝑂3− + 𝑂𝐻− ↔ 𝐶𝑂3
2− + 𝐻2𝑂 (7)
The absorption of CO2 in alkaline aqueous solutions involves fairly rapid homogeneous reactions
(Skoog, 2014). The global reactions are presented in Equations 8 and 9,
𝐶𝑂2(𝑎𝑞) + 2𝑂𝐻− → 𝐶𝑂32− + 𝐻2O (8)
𝐶𝑂2 (𝑎𝑞) + 𝐻2𝑂 + 𝐶𝑂32− → 2𝐻𝐶𝑂3
− (9)
2. Methodology
2.1 Set up of the CO2 absorption and reaction system
The system used to absorb CO2 in the capillary reactor was set up according to that described in the
patent application MX/Aa/2017/003883 and is described below (see Figure 4.3). At the top of the
capillary reactor, a "T" shaped connection was installed to simultaneously feed the liquid and gas phases.
In one of the “T” outlets, the quartz capillary with an internal diameter of 3 mm and a length of 300 mm
was placed and this was submerged in a 100 mL 3 neck ball flask, the temperature was monitored inside
the flask and it was controlled with a thermal bath.
The gas phase was supplied through a stainless-steel pipe and the gas flow was controlled by an
AALBORG mass flow controller (model GFC17). A Masterflex peristaltic pump (model 7557-12) with
a Masterflex flow controller (model 07557-14) was used to recirculate the liquid phase.

56
Figure 4.3 Experimental set-up for the absorption of CO2 (Original image)
Source: “Obtained by the author”
2.2 Hydrodynamic study
The experiment set-up depicted in Figure 4.3 was used to carry out a hydrodynamic study, which
consisted in obtaining the velocity operating window for both phases, in order to develop a Taylor flow
regime. The experiments were carried out using two different reducing agents: water and a 0.5 M solution
of sodium hydroxide. The surface velocity of CO2 was varied between 0.01 m/s and 0.53 m/s, while the
interval of variation of the surface velocity for the liquid phase was set between 0.01 m/s and 0.26 m/s.
Next steps were followed to carry out this study: after the installation of the system, a previous
washing was carried out using 60 mL of deionized water and recirculating it through the pipes,
connections and the capillary reactor through the peristaltic pump. The temperature was kept constant at
each assessed value by using a thermal bath, 60 mL of either water or NaOH solution were added and
the flow rate was regulated by adjusting the liquid flow rate in the pump. The reactor CO2 supply valve
was opened, and the speed was adjusted using the mass flow meter. The gas and liquid flow rates were
independently changed, and the hydrodynamic regime observed in the capillary reactor was recorded.
2.2.1 Effect of temperature on the hydrodynamics of the system
The experiments were performed at 10 and 25 °C, to determine the effect of this variable on the
hydrodynamics of the system, as the section 2.2 indicates, by modifying the temperature under study.
2.3 CO2 absorption
The effect of three operational variables (temperature, NaOH concentration and reactor length) on CO2
absorption has been elucidated. This study was carried out with a superficial gas velocity of 0.05 m/s and
liquid of 0.08 m/s, these velocities showed a Taylor-type regime, in a capillary with an internal diameter
of 3 mm. To determine the effect of temperature on the amount of absorbed CO2, experiments were
carried out at 10, 15, 25, 35 and 40 °C, the concentration of the NaOH solution was 0.5 M. The effect of
NaOH concentration on the CO2 absorption was established by performing experiments with solutions
of different initial concentration (0.25, 0.5 and 0.75 M), in this case the temperature was kept constant at
25 °C.
For the study of both variables, temperature and NaOH concentration, a 300 mm length quartz
capillary was used. An additional experiment was carried out at a temperature of 25 °C and a solution
with a molar concentration of NaOH of 0.5M, using a 100 mm capillary in order to establish the effect
of the length of the capillary reactor. In all cases, the response variable was the amount of CO2 absorbed
in the solutions, which, in turn, was used to estimate the mass transfer coefficients between the different
phases.
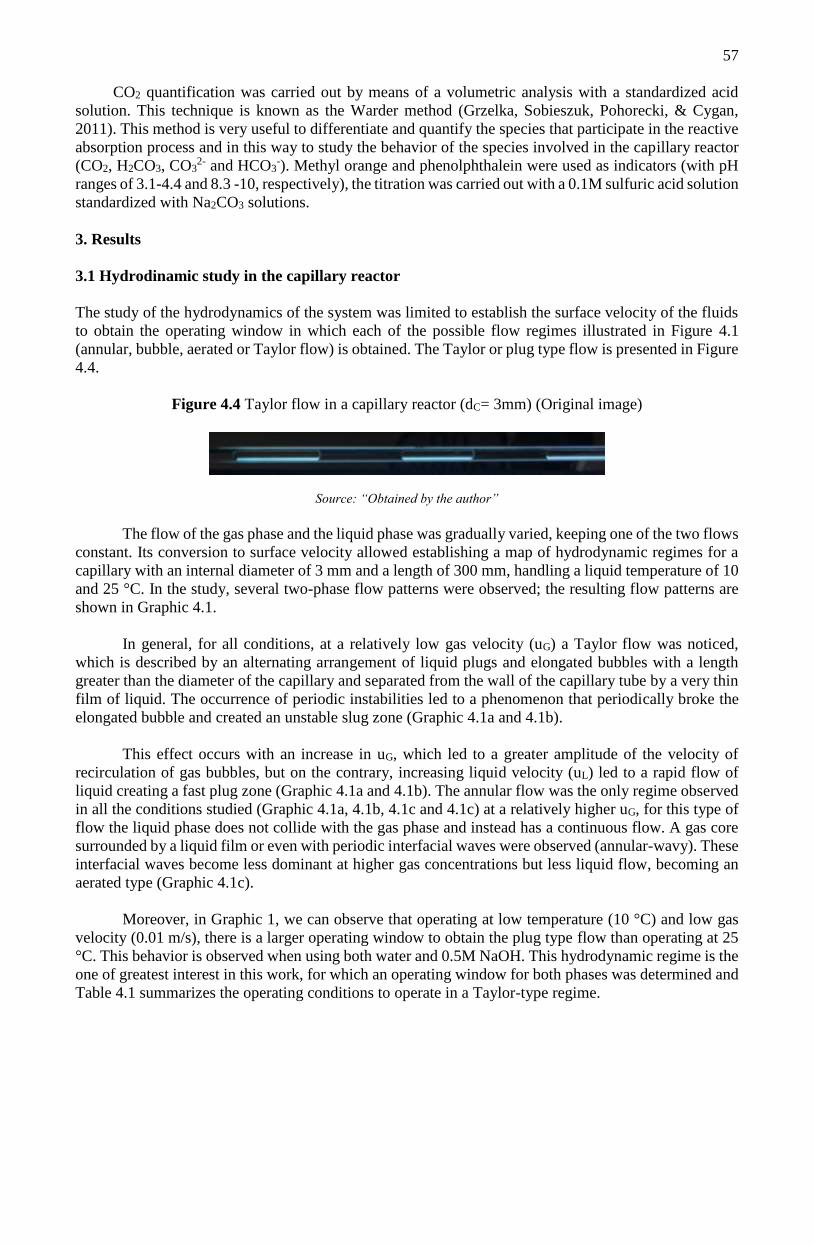
57
CO2 quantification was carried out by means of a volumetric analysis with a standardized acid
solution. This technique is known as the Warder method (Grzelka, Sobieszuk, Pohorecki, & Cygan,
2011). This method is very useful to differentiate and quantify the species that participate in the reactive
absorption process and in this way to study the behavior of the species involved in the capillary reactor
(CO2, H2CO3, CO32- and HCO3
-). Methyl orange and phenolphthalein were used as indicators (with pH
ranges of 3.1-4.4 and 8.3 -10, respectively), the titration was carried out with a 0.1M sulfuric acid solution
standardized with Na2CO3 solutions.
3. Results
3.1 Hydrodinamic study in the capillary reactor
The study of the hydrodynamics of the system was limited to establish the surface velocity of the fluids
to obtain the operating window in which each of the possible flow regimes illustrated in Figure 4.1
(annular, bubble, aerated or Taylor flow) is obtained. The Taylor or plug type flow is presented in Figure
4.4.
Figure 4.4 Taylor flow in a capillary reactor (dC= 3mm) (Original image)
Source: “Obtained by the author”
The flow of the gas phase and the liquid phase was gradually varied, keeping one of the two flows
constant. Its conversion to surface velocity allowed establishing a map of hydrodynamic regimes for a
capillary with an internal diameter of 3 mm and a length of 300 mm, handling a liquid temperature of 10
and 25 °C. In the study, several two-phase flow patterns were observed; the resulting flow patterns are
shown in Graphic 4.1.
In general, for all conditions, at a relatively low gas velocity (uG) a Taylor flow was noticed,
which is described by an alternating arrangement of liquid plugs and elongated bubbles with a length
greater than the diameter of the capillary and separated from the wall of the capillary tube by a very thin
film of liquid. The occurrence of periodic instabilities led to a phenomenon that periodically broke the
elongated bubble and created an unstable slug zone (Graphic 4.1a and 4.1b).
This effect occurs with an increase in uG, which led to a greater amplitude of the velocity of
recirculation of gas bubbles, but on the contrary, increasing liquid velocity (uL) led to a rapid flow of
liquid creating a fast plug zone (Graphic 4.1a and 4.1b). The annular flow was the only regime observed
in all the conditions studied (Graphic 4.1a, 4.1b, 4.1c and 4.1c) at a relatively higher uG, for this type of
flow the liquid phase does not collide with the gas phase and instead has a continuous flow. A gas core
surrounded by a liquid film or even with periodic interfacial waves were observed (annular-wavy). These
interfacial waves become less dominant at higher gas concentrations but less liquid flow, becoming an
aerated type (Graphic 4.1c).
Moreover, in Graphic 1, we can observe that operating at low temperature (10 °C) and low gas
velocity (0.01 m/s), there is a larger operating window to obtain the plug type flow than operating at 25
°C. This behavior is observed when using both water and 0.5M NaOH. This hydrodynamic regime is the
one of greatest interest in this work, for which an operating window for both phases was determined and
Table 4.1 summarizes the operating conditions to operate in a Taylor-type regime.
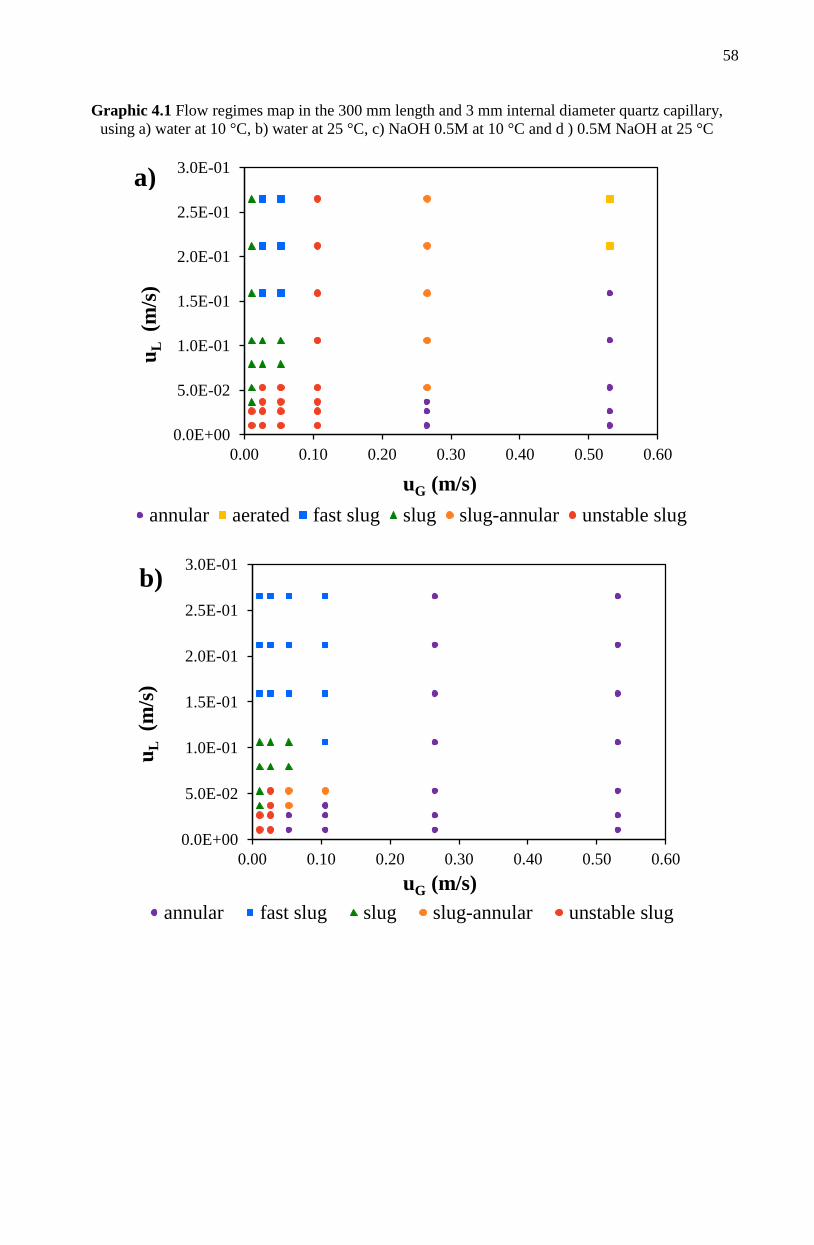
58
Graphic 4.1 Flow regimes map in the 300 mm length and 3 mm internal diameter quartz capillary,
using a) water at 10 °C, b) water at 25 °C, c) NaOH 0.5M at 10 °C and d ) 0.5M NaOH at 25 °C
0.0E+00
5.0E-02
1.0E-01
1.5E-01
2.0E-01
2.5E-01
3.0E-01
0.00 0.10 0.20 0.30 0.40 0.50 0.60
uL
(m/s
)
uG (m/s)
annular aerated fast slug slug slug-annular unstable slug
a)
0.0E+00
5.0E-02
1.0E-01
1.5E-01
2.0E-01
2.5E-01
3.0E-01
0.00 0.10 0.20 0.30 0.40 0.50 0.60
uL
(m/s
)
uG (m/s)
annular fast slug slug slug-annular unstable slug
b)
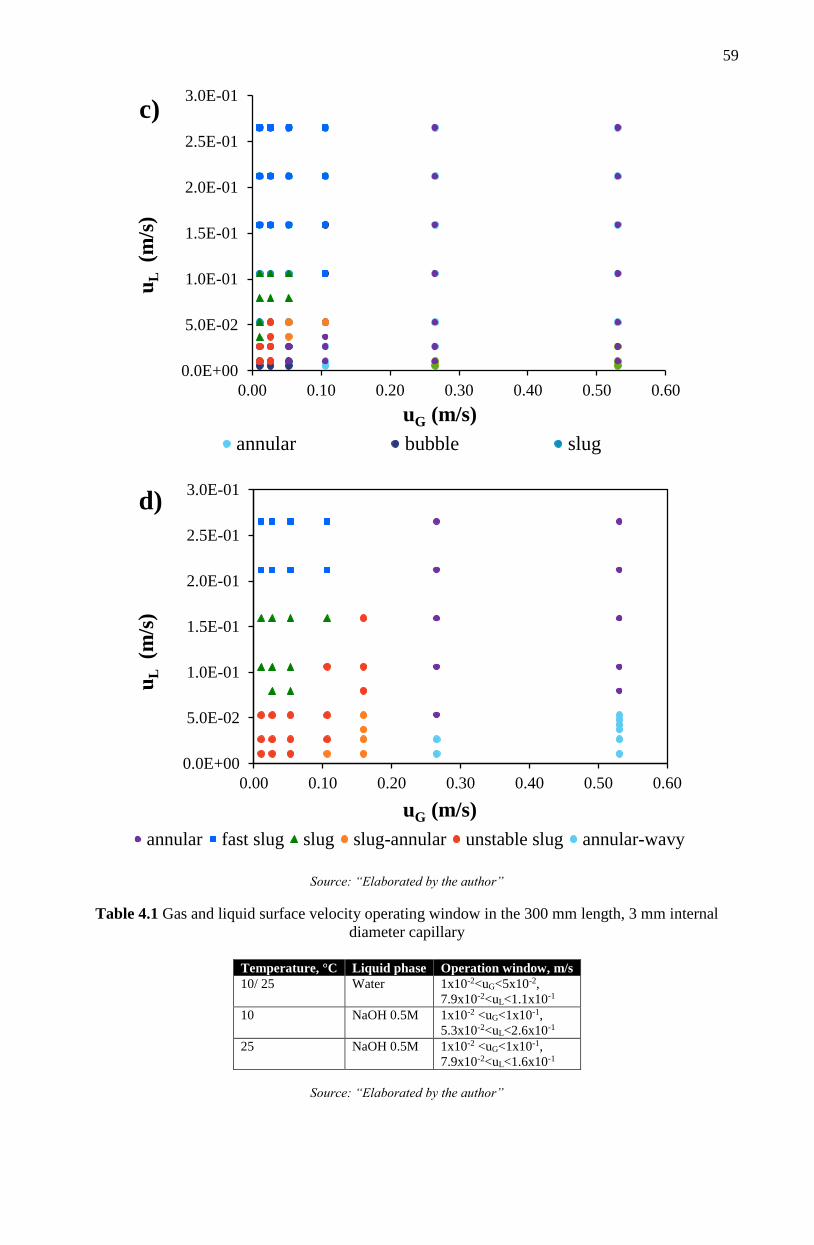
59
Source: “Elaborated by the author”
Table 4.1 Gas and liquid surface velocity operating window in the 300 mm length, 3 mm internal
diameter capillary
Temperature, °C Liquid phase Operation window, m/s
10/ 25 Water 1x10⁻²<uG<5x10⁻²,
7.9x10⁻²<uL<1.1x10⁻¹
10 NaOH 0.5M 1x10⁻² <uG<1x10⁻¹,
5.3x10⁻²<uL<2.6x10⁻¹
25 NaOH 0.5M 1x10⁻² <uG<1x10⁻¹,
7.9x10⁻²<uL<1.6x10⁻¹
Source: “Elaborated by the author”
0.0E+00
5.0E-02
1.0E-01
1.5E-01
2.0E-01
2.5E-01
3.0E-01
0.00 0.10 0.20 0.30 0.40 0.50 0.60
uL
(m/s
)
uG (m/s)
annular bubble slug
c)
0.0E+00
5.0E-02
1.0E-01
1.5E-01
2.0E-01
2.5E-01
3.0E-01
0.00 0.10 0.20 0.30 0.40 0.50 0.60
uL
(m/s
)
uG (m/s)
annular fast slug slug slug-annular unstable slug annular-wavy
d)
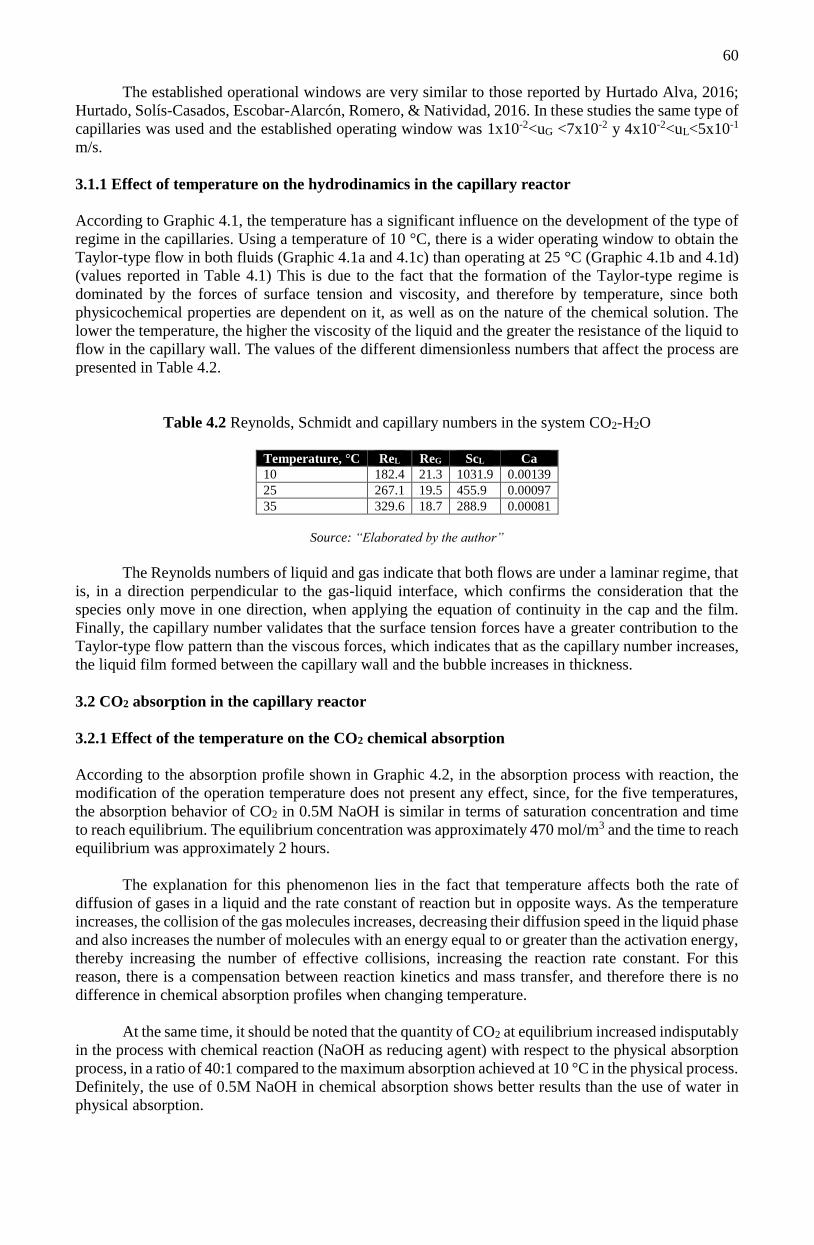
60
The established operational windows are very similar to those reported by Hurtado Alva, 2016;
Hurtado, Solís-Casados, Escobar-Alarcón, Romero, & Natividad, 2016. In these studies the same type of
capillaries was used and the established operating window was 1x10⁻²<uG <7x10⁻² y 4x10⁻²<uL<5x10⁻¹
m/s.
3.1.1 Effect of temperature on the hydrodinamics in the capillary reactor
According to Graphic 4.1, the temperature has a significant influence on the development of the type of
regime in the capillaries. Using a temperature of 10 °C, there is a wider operating window to obtain the
Taylor-type flow in both fluids (Graphic 4.1a and 4.1c) than operating at 25 °C (Graphic 4.1b and 4.1d)
(values reported in Table 4.1) This is due to the fact that the formation of the Taylor-type regime is
dominated by the forces of surface tension and viscosity, and therefore by temperature, since both
physicochemical properties are dependent on it, as well as on the nature of the chemical solution. The
lower the temperature, the higher the viscosity of the liquid and the greater the resistance of the liquid to
flow in the capillary wall. The values of the different dimensionless numbers that affect the process are
presented in Table 4.2.
Table 4.2 Reynolds, Schmidt and capillary numbers in the system CO2-H2O
Temperature, °C ReL ReG ScL Ca
10 182.4 21.3 1031.9 0.00139
25 267.1 19.5 455.9 0.00097
35 329.6 18.7 288.9 0.00081
Source: “Elaborated by the author”
The Reynolds numbers of liquid and gas indicate that both flows are under a laminar regime, that
is, in a direction perpendicular to the gas-liquid interface, which confirms the consideration that the
species only move in one direction, when applying the equation of continuity in the cap and the film.
Finally, the capillary number validates that the surface tension forces have a greater contribution to the
Taylor-type flow pattern than the viscous forces, which indicates that as the capillary number increases,
the liquid film formed between the capillary wall and the bubble increases in thickness.
3.2 CO2 absorption in the capillary reactor
3.2.1 Effect of the temperature on the CO2 chemical absorption
According to the absorption profile shown in Graphic 4.2, in the absorption process with reaction, the
modification of the operation temperature does not present any effect, since, for the five temperatures,
the absorption behavior of CO2 in 0.5M NaOH is similar in terms of saturation concentration and time
to reach equilibrium. The equilibrium concentration was approximately 470 mol/m3 and the time to reach
equilibrium was approximately 2 hours.
The explanation for this phenomenon lies in the fact that temperature affects both the rate of
diffusion of gases in a liquid and the rate constant of reaction but in opposite ways. As the temperature
increases, the collision of the gas molecules increases, decreasing their diffusion speed in the liquid phase
and also increases the number of molecules with an energy equal to or greater than the activation energy,
thereby increasing the number of effective collisions, increasing the reaction rate constant. For this
reason, there is a compensation between reaction kinetics and mass transfer, and therefore there is no
difference in chemical absorption profiles when changing temperature.
At the same time, it should be noted that the quantity of CO2 at equilibrium increased indisputably
in the process with chemical reaction (NaOH as reducing agent) with respect to the physical absorption
process, in a ratio of 40:1 compared to the maximum absorption achieved at 10 °C in the physical process.
Definitely, the use of 0.5M NaOH in chemical absorption shows better results than the use of water in
physical absorption.

61
Graphic 4.2 Comparison of the CO2 absorption profile in a) water and b) in 0.5M NaOH, using a
quartz capillary (300 mm length and 3 mm internal diameter)
Source: “Elaborated by the author”
The pH of the liquid phase was measured during the absorption process. The profile obtained is
shown in Graphic 4.3.
0.0
2.0
4.0
6.0
8.0
10.0
12.0
14.0
0 10 20 30 40 50 60 70
CO
2(m
ol/
m3)
time (min)
10°C 25°C 35°C
a)
0
100
200
300
400
500
600
700
0 25 50 75 100 125
CO
2(m
ol/
m3)
time (min)
10°C 15°C 25°C 35°C 40°C
b)
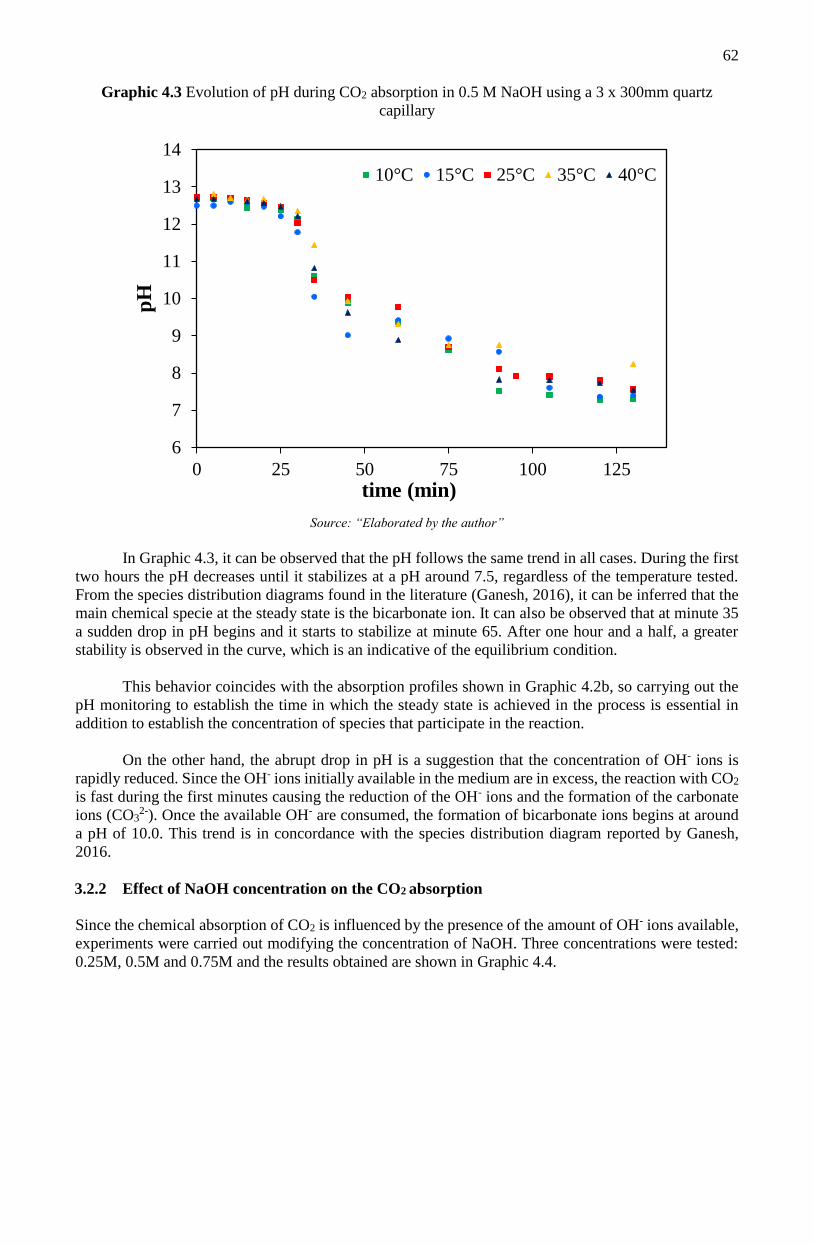
62
Graphic 4.3 Evolution of pH during CO2 absorption in 0.5 M NaOH using a 3 x 300mm quartz
capillary
Source: “Elaborated by the author”
In Graphic 4.3, it can be observed that the pH follows the same trend in all cases. During the first
two hours the pH decreases until it stabilizes at a pH around 7.5, regardless of the temperature tested.
From the species distribution diagrams found in the literature (Ganesh, 2016), it can be inferred that the
main chemical specie at the steady state is the bicarbonate ion. It can also be observed that at minute 35
a sudden drop in pH begins and it starts to stabilize at minute 65. After one hour and a half, a greater
stability is observed in the curve, which is an indicative of the equilibrium condition.
This behavior coincides with the absorption profiles shown in Graphic 4.2b, so carrying out the
pH monitoring to establish the time in which the steady state is achieved in the process is essential in
addition to establish the concentration of species that participate in the reaction.
On the other hand, the abrupt drop in pH is a suggestion that the concentration of OH- ions is
rapidly reduced. Since the OH- ions initially available in the medium are in excess, the reaction with CO2
is fast during the first minutes causing the reduction of the OH- ions and the formation of the carbonate
ions (CO32-). Once the available OH- are consumed, the formation of bicarbonate ions begins at around
a pH of 10.0. This trend is in concordance with the species distribution diagram reported by Ganesh,
2016.
3.2.2 Effect of NaOH concentration on the CO2 absorption
Since the chemical absorption of CO2 is influenced by the presence of the amount of OH- ions available,
experiments were carried out modifying the concentration of NaOH. Three concentrations were tested:
0.25M, 0.5M and 0.75M and the results obtained are shown in Graphic 4.4.
6
7
8
9
10
11
12
13
14
0 25 50 75 100 125
pH
time (min)
10°C 15°C 25°C 35°C 40°C
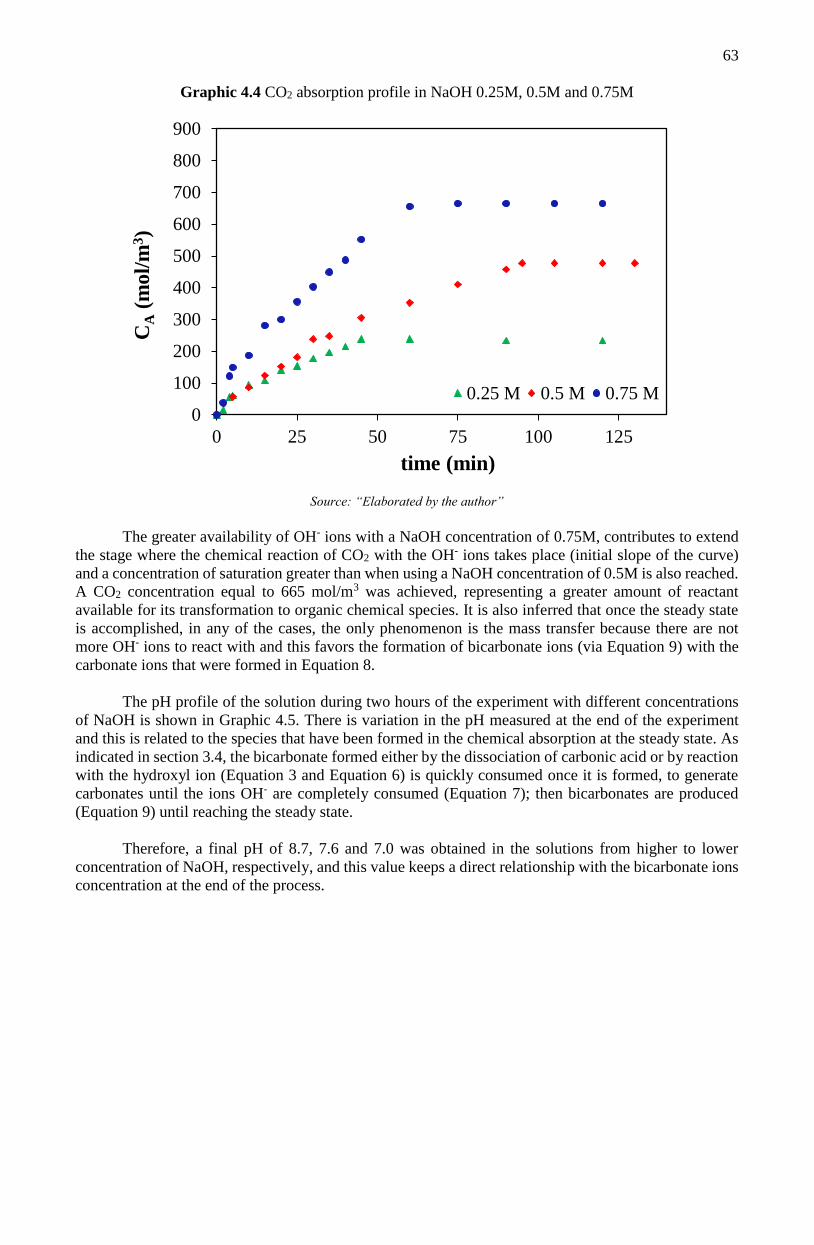
63
Graphic 4.4 CO2 absorption profile in NaOH 0.25M, 0.5M and 0.75M
Source: “Elaborated by the author”
The greater availability of OH- ions with a NaOH concentration of 0.75M, contributes to extend
the stage where the chemical reaction of CO2 with the OH- ions takes place (initial slope of the curve)
and a concentration of saturation greater than when using a NaOH concentration of 0.5M is also reached.
A CO2 concentration equal to 665 mol/m3 was achieved, representing a greater amount of reactant
available for its transformation to organic chemical species. It is also inferred that once the steady state
is accomplished, in any of the cases, the only phenomenon is the mass transfer because there are not
more OH- ions to react with and this favors the formation of bicarbonate ions (via Equation 9) with the
carbonate ions that were formed in Equation 8.
The pH profile of the solution during two hours of the experiment with different concentrations
of NaOH is shown in Graphic 4.5. There is variation in the pH measured at the end of the experiment
and this is related to the species that have been formed in the chemical absorption at the steady state. As
indicated in section 3.4, the bicarbonate formed either by the dissociation of carbonic acid or by reaction
with the hydroxyl ion (Equation 3 and Equation 6) is quickly consumed once it is formed, to generate
carbonates until the ions OH- are completely consumed (Equation 7); then bicarbonates are produced
(Equation 9) until reaching the steady state.
Therefore, a final pH of 8.7, 7.6 and 7.0 was obtained in the solutions from higher to lower
concentration of NaOH, respectively, and this value keeps a direct relationship with the bicarbonate ions
concentration at the end of the process.
0
100
200
300
400
500
600
700
800
900
0 25 50 75 100 125
CA
(mo
l/m
3)
time (min)
0.25 M 0.5 M 0.75 M
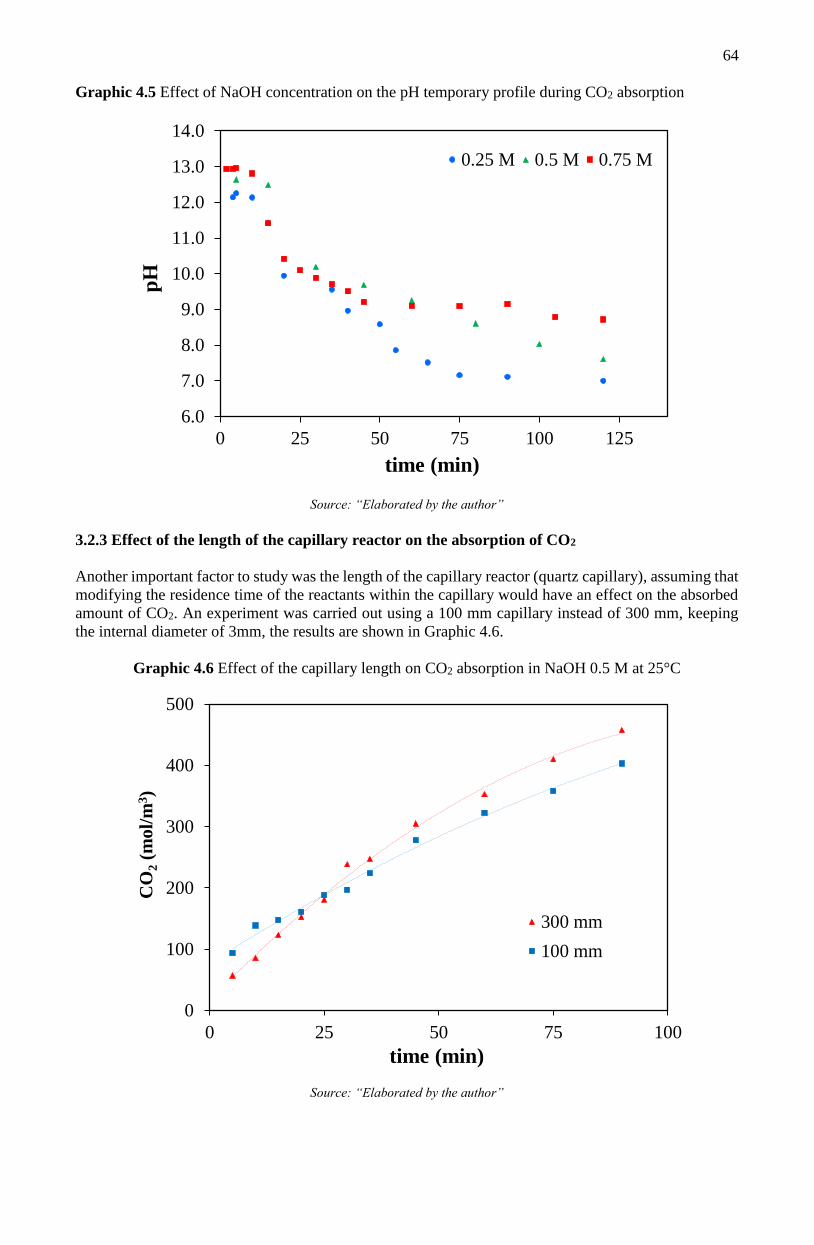
64
Graphic 4.5 Effect of NaOH concentration on the pH temporary profile during CO2 absorption
Source: “Elaborated by the author”
3.2.3 Effect of the length of the capillary reactor on the absorption of CO2
Another important factor to study was the length of the capillary reactor (quartz capillary), assuming that
modifying the residence time of the reactants within the capillary would have an effect on the absorbed
amount of CO2. An experiment was carried out using a 100 mm capillary instead of 300 mm, keeping
the internal diameter of 3mm, the results are shown in Graphic 4.6.
Graphic 4.6 Effect of the capillary length on CO2 absorption in NaOH 0.5 M at 25°C
Source: “Elaborated by the author”
6.0
7.0
8.0
9.0
10.0
11.0
12.0
13.0
14.0
0 25 50 75 100 125
pH
time (min)
0.25 M 0.5 M 0.75 M
0
100
200
300
400
500
0 25 50 75 100
CO
2(m
ol/
m3)
time (min)
300 mm
100 mm
65
The concentration of saturation in the capillary of 100 mm reached 403 mol/m3, in 90 minutes,
which implies a decrease of 14% for the concentration obtained with the capillary of 300 mm, in the
same period. This difference is considered as significant since the determined error is 0.47%. This result
suggests that the residence time of the reactants is an important variable influencing the amount of CO2
absorbed.
3.3 Determination of mass transfer coefficients
Physical absorption
For the determination of the mass transfer coefficient in the absorption with water, some considerations
were made. Performing the molar flow balance in the system, we arrive at the continuity equation for a
component in a binary mixture (Equation 10), which describes the variation of the concentration of a
component with respect to time for a given point in space (Fogler, 2008),
DAB [∂2CA
∂x2+
∂2CA
∂y2+
∂2CA
∂z2] − Ux
∂CA
∂x− Uy
∂CA
∂y− Uz
∂CA
∂z+ rA =
∂CA
∂t (10)
This equation has been simplified, according to film theory, by assuming that the mass transfer
occurs only in one direction by diffusion, in a gas-liquid system with two films, one for each phase, and
stationary state; that is, the concentration of CO2 in the liquid phase does not vary during the contact time
between the gas phase of the bubble and the liquid phase, since the CO2 is absorbed relatively slowly in
water. The volumetric movement is too small to influence the diffusion of gases has also been considered
(Beltrán, 2003). The equation has been reduced to a single term (Equation 11), with the boundary
conditions indicated below,
𝐷𝐴𝐵𝑑2𝐶𝐴
𝑑𝑥2 = 0 (11)
𝑥 = 0; 𝐶𝐴 = 𝐶𝐴
∗
𝑥 = 𝛿; 𝐶𝐴 = 𝐶𝐴𝑏
and it was related to Fick's first law, obtaining the following equation:
𝐴𝑠𝑁𝑖 =𝑑
𝑑𝑡𝑉𝑐𝐶𝐴 = 𝐴𝑠𝑘𝐿
0(𝐶𝑒 − 𝐶𝐴𝑏) (12)
𝑘𝐿0 =
𝐷𝐴𝐵
𝛿 (13)
Where:
As = Contact area between phases
Ni = Molar flux
Vc = Microreactor volume (capillary)
CA = CO2 concentration (variable)
kL0 = Mass transfer coefficient for physical absorption (in water)
Ce = Equilibrium concentration in liquid phase
CAb = CO2 concentration at equilibrium (saturation)
DAB = Diffusion coefficient of CO2 – water system
𝛿 = film thickness
Since the volume of the capillary reactor, Vc, is considered constant, the Equation 14 is obtained,
𝑑𝐶𝐴
𝑑𝑡= 𝑘𝐿
0𝑎(𝐶𝑒 − 𝐶𝐴𝑏) (14)
Chemical absorption
In the Taylor-type regime, the mass transfer from the bubble to the gas-liquid interface can be neglected
if the gas phase is pure CO2, so the contribution is due only to the processes that occur within the liquid
phase.
66
Furthermore, it is considered that the speed with which CO2 diffuses into the liquid is the same
which OH- ions diffuse to the area where they are consumed. Applying the continuity equation to both
CO2 (species A) and OH- ions (species B) and considering that they move in the x direction, the chemical
absorption of CO2 is described with Equations 15 and 16 (Nijsing, 1959; Beltrán, 2004)
𝜕𝐶𝐴
𝜕𝑡= 𝒟𝐴
𝜕2𝐶𝐴
𝑑𝑥2− 𝑘𝐵𝐶𝐵𝐶𝐴 (15)
𝜕𝐶𝐵
𝜕𝑡= 𝒟𝐵
𝜕2𝐶𝐵
𝑑𝑥2− 𝑘𝐵𝐶𝐵𝐶𝐴 (16)
This system of differential equations has an infinite number of solutions, the initial and boundary
conditions were established,
𝑡 = 0, 𝑥 ≥ 0, 𝐶𝐴 = 0 , 𝐶𝐵 = 𝐶𝐵,0
𝑥 = 0, 𝑡 > 0, 𝐶𝐴 = 𝐶𝐴𝑖 ,
𝜕𝐶𝐵
𝜕𝑥= 0
𝑥 = ∞, 𝑡 ≥ 0, 𝐶𝐴 = 0, 𝐶𝐵 = 𝐶𝐵,0
A general solution makes use of the term improvement factor (), which is based on the
relationship between the mass transfer coefficient for chemical absorption (kL) and that of physical
absorption (kL0) (Perry, Green, & Maloney, 1992). The solution is a function of the Hatta number (Ha),
the relationship between the initial OH- concentration and the CO2 concentration at the interface, and the
relationship between the diffusivities of OH- and CO2 ions in water. Hatta is a dimensionless number that
relates the rate of reaction in a liquid film to the rate of diffusion through the film (Beltrán, 2003) and is
calculated as follows,
𝐻𝑎 = √𝑘𝐵𝐶𝐵,0𝒟𝐴𝐵
𝑘𝐿0 (17)
On the other hand, it is necessary to know the reaction rate constant to determine the mass transfer
coefficient. Regarding the order of reaction, two cases have been proposed, among several:
a. Pseudo-first order reaction, when CB is too large compared to CiA and its diffusion rate to the
reaction zone is very fast compared to the rate at which it is consumed in the reaction.
b. Second order reaction (extremely fast), when CB is not so large compared to CiA and both species
diffuse towards areas where their concentrations are lower.
With regard to reaction kinetics, it has been widely reported that the kinetic constant depends on
the reaction temperature, the ionic strength of the solution, and the nature of the cation (Danckwerts &
Kennedy, 1958; Harish Ganapathy, Al-hajri, & Ohadi, 2013; Grzelka et al., 2011; Pohorecki & Moniuk,
1988). Therefore, the equation proposed by Pohorecki & Moniuk, 1988 (Equation 18) was used to
estimate the value of the kinetic constant in the chemical absorption of CO2 in aqueous electrolyte
solutions, in this equation, the kinetic constant depends on the temperature (T) and the ionic strength (I),
𝑙𝑜𝑔10(𝑘𝐵) = 11.916 −2382
𝑇+ 0.221𝐼 − 0.016𝐼2 (18)
The ionic strength is calculated with the molar concentration of the ions (𝐶𝑖 ) present and their
respective valence (zi), characteristic of each ion, as indicates Equation 19.
𝐼 = 0.5 ∑ 𝐶𝑖𝑧𝑖2
𝑖 (19)
In this study, during physical absorption (𝑘𝐿0), Equation 14 was used to estimate the mass transfer
coefficient, using the slope of the straight line of the absorption profiles when using water as absorbent
(data from Graphic 4.2a). Graphic 4.7 shows the trend lines for each temperature and Table 4.3 shows
the results of the volumetric mass transfer coefficient for each temperature as well as the coefficients of
determination (R2) for each trend line.
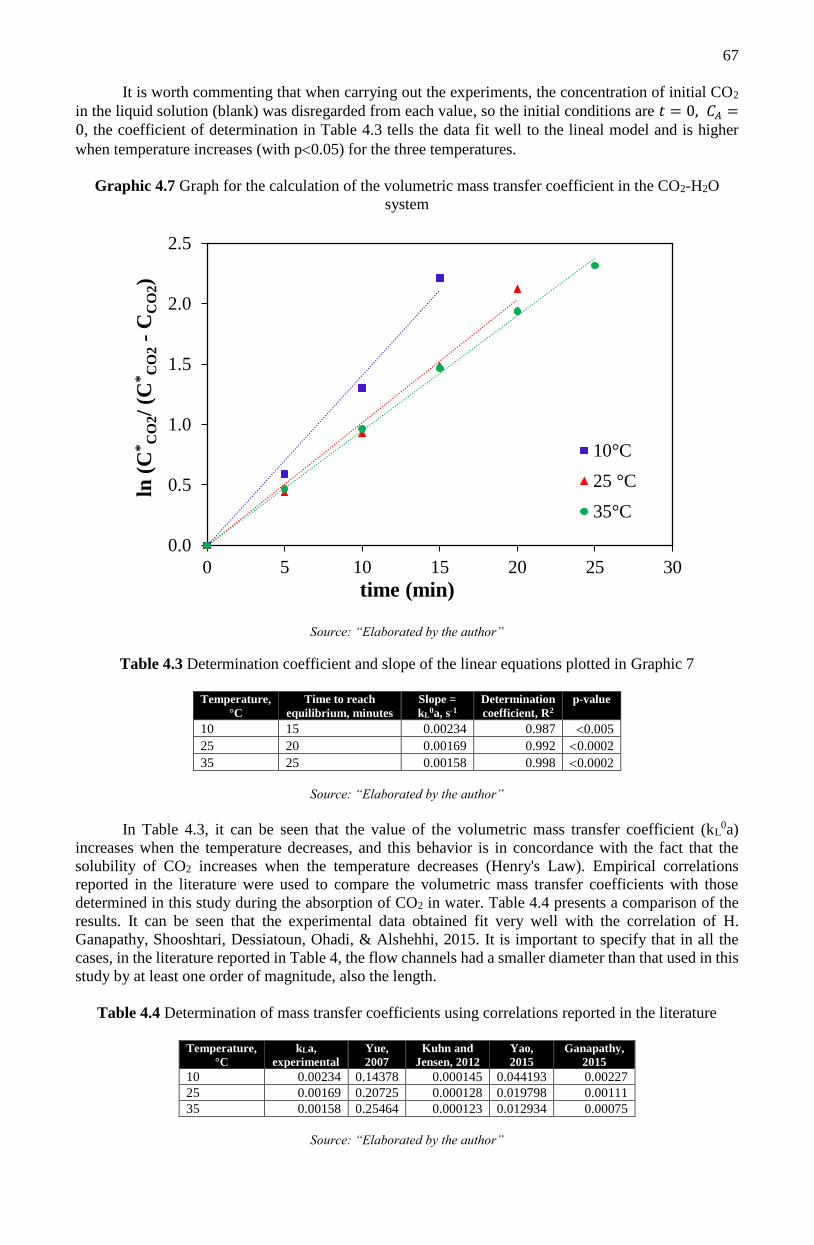
67
It is worth commenting that when carrying out the experiments, the concentration of initial CO2
in the liquid solution (blank) was disregarded from each value, so the initial conditions are 𝑡 = 0, 𝐶𝐴 =0, the coefficient of determination in Table 4.3 tells the data fit well to the lineal model and is higher
when temperature increases (with p0.05) for the three temperatures.
Graphic 4.7 Graph for the calculation of the volumetric mass transfer coefficient in the CO2-H2O
system
Source: “Elaborated by the author”
Table 4.3 Determination coefficient and slope of the linear equations plotted in Graphic 7
Temperature,
°C
Time to reach
equilibrium, minutes
Slope =
kL0a, s-1
Determination
coefficient, R2
p-value
10 15 0.00234 0.987 0.005
25 20 0.00169 0.992 0.0002
35 25 0.00158 0.998 0.0002
Source: “Elaborated by the author”
In Table 4.3, it can be seen that the value of the volumetric mass transfer coefficient (kL0a)
increases when the temperature decreases, and this behavior is in concordance with the fact that the
solubility of CO2 increases when the temperature decreases (Henry's Law). Empirical correlations
reported in the literature were used to compare the volumetric mass transfer coefficients with those
determined in this study during the absorption of CO2 in water. Table 4.4 presents a comparison of the
results. It can be seen that the experimental data obtained fit very well with the correlation of H.
Ganapathy, Shooshtari, Dessiatoun, Ohadi, & Alshehhi, 2015. It is important to specify that in all the
cases, in the literature reported in Table 4, the flow channels had a smaller diameter than that used in this
study by at least one order of magnitude, also the length.
Table 4.4 Determination of mass transfer coefficients using correlations reported in the literature
Temperature,
°C
kLa,
experimental
Yue,
2007
Kuhn and
Jensen, 2012
Yao,
2015
Ganapathy,
2015
10 0.00234 0.14378 0.000145 0.044193 0.00227
25 0.00169 0.20725 0.000128 0.019798 0.00111
35 0.00158 0.25464 0.000123 0.012934 0.00075
Source: “Elaborated by the author”
0.0
0.5
1.0
1.5
2.0
2.5
0 5 10 15 20 25 30
ln (
C*
CO
2/
(C*
CO
2-
CC
O2)
time (min)
10°C
25 °C
35°C
68
The results of the reaction rate constant and the mass transfer coefficient when performing
chemical absorption are shown in Table 4.5. The Hatta number relates the rate of reaction in a liquid film
to the rate of diffusion through the film and indicates whether or not the reaction occurs faster than the
mass transfer, identifying the controlling step of the absorption process.
Table 4.5 Kinetic and mass transfer coefficients obtained in the chemical absorption process of CO2 in
0.5M NaOH
Temperature 10°C 25°C 35°C
Ha 47.0 72.7 127.1
kB (m3/mol s) 0.0372 0.0551 0.0716
kL x 105 (m/s) 3.381 2.831 2.296
k0L x 106 (m/s) 1.657 1.272 9.939
kL/k0L 20 22 23
Source: “Elaborated by the author”
The Ha values shown in Table 4.5, indicate that the chemical reaction is much faster than
diffusion, and therefore, the absorption process is controlled by mass transfer. The behavior observed in
the CO2 absorption profiles obtained by modifying the NaOH concentration in the solution (Graphic 4.4)
is consistent with the previous statement: on the initial slope of the absorption profile curve, the OH- ions
are found in excess and all absorbed CO2 reacts immediately, in contrast, later the concentration of OH-
ions decreases and this chemical species is no longer available to react with the CO2 molecules at the
interface.
As for the kinetic constant, kB, it is observed that it increases proportionally with temperature,
since the increase in temperature affects the activation energy of the molecules. The value of the mass
transfer coefficient, kL, decreases with increasing temperature and this behavior is consistent with that
reported in the literature. These results confirm that there is a compensation between the chemical
reaction and the mass transfer in the process of chemical absorption of CO2 in the 0.5 M NaOH solution
when carried out at different temperatures. As the temperature increases, the OH- ions and CO2 in the
reaction are activated more quickly, however, the increase in temperature represents a lower availability
of OH- ions due to the low solubility and molecular diffusion.
In this way, there is a compensation in both phenomena (while one grows the other decreases due
to the effect of temperature) obtaining similar absorption profiles (Graphic 4.2). Another important point
to conclude besides that the use of a NaOH solution improves the absorption process of CO2 in water, is
the relationship between the mass transfer coefficient with chemical absorption and that of physical
absorption, which is approximately 20 times higher.
From the results of Table 4.6, when modifying the concentration of NaOH in the solution, no
significant effect is observed in the reaction rate constant (kB), since the kinetic constants for the three
concentrations are similar. This indicates that the rate at which the OH- ions is consumed is similar,
regardless of whether there is a greater quantity of them as their concentration increases. However, there
is a very slight increase in the mass transfer constant (kL) when the concentration of the ions increases,
which indicates that having more ions leads to a better mass transfer.
Table 4.6 Kinetic and mass transfer coefficients obtained at 25 ° C in the process of chemical
absorption of CO2 in NaOH solutions with concentrations of 0.25, 0.5 and 0.75M
NaOH concentration 0.25M 0.5M 0.75M
Ha 40.5 72.7 103.1
kB (m3/mol s) 0.0537 0.0551 0.0573
kL x 105 (m/s) 2.466 2.83 2.924
k0L x 106 (m/s) 1.272 1.272 1.272
kL/k0L 19 22 23
Source: “Elaborated by the author”
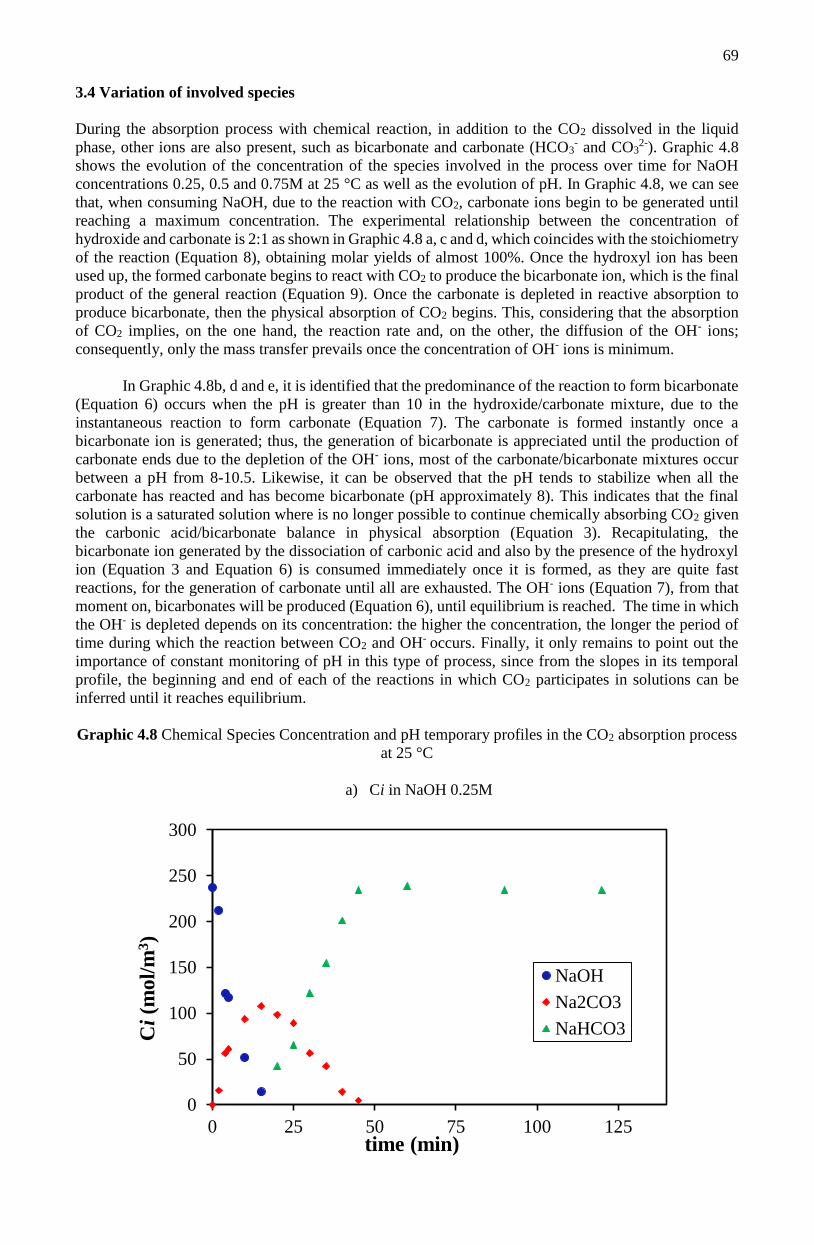
69
3.4 Variation of involved species
During the absorption process with chemical reaction, in addition to the CO2 dissolved in the liquid
phase, other ions are also present, such as bicarbonate and carbonate (HCO3- and CO3
2-). Graphic 4.8
shows the evolution of the concentration of the species involved in the process over time for NaOH
concentrations 0.25, 0.5 and 0.75M at 25 °C as well as the evolution of pH. In Graphic 4.8, we can see
that, when consuming NaOH, due to the reaction with CO2, carbonate ions begin to be generated until
reaching a maximum concentration. The experimental relationship between the concentration of
hydroxide and carbonate is 2:1 as shown in Graphic 4.8 a, c and d, which coincides with the stoichiometry
of the reaction (Equation 8), obtaining molar yields of almost 100%. Once the hydroxyl ion has been
used up, the formed carbonate begins to react with CO2 to produce the bicarbonate ion, which is the final
product of the general reaction (Equation 9). Once the carbonate is depleted in reactive absorption to
produce bicarbonate, then the physical absorption of CO2 begins. This, considering that the absorption
of CO2 implies, on the one hand, the reaction rate and, on the other, the diffusion of the OH- ions;
consequently, only the mass transfer prevails once the concentration of OH- ions is minimum.
In Graphic 4.8b, d and e, it is identified that the predominance of the reaction to form bicarbonate
(Equation 6) occurs when the pH is greater than 10 in the hydroxide/carbonate mixture, due to the
instantaneous reaction to form carbonate (Equation 7). The carbonate is formed instantly once a
bicarbonate ion is generated; thus, the generation of bicarbonate is appreciated until the production of
carbonate ends due to the depletion of the OH- ions, most of the carbonate/bicarbonate mixtures occur
between a pH from 8-10.5. Likewise, it can be observed that the pH tends to stabilize when all the
carbonate has reacted and has become bicarbonate (pH approximately 8). This indicates that the final
solution is a saturated solution where is no longer possible to continue chemically absorbing CO2 given
the carbonic acid/bicarbonate balance in physical absorption (Equation 3). Recapitulating, the
bicarbonate ion generated by the dissociation of carbonic acid and also by the presence of the hydroxyl
ion (Equation 3 and Equation 6) is consumed immediately once it is formed, as they are quite fast
reactions, for the generation of carbonate until all are exhausted. The OH- ions (Equation 7), from that
moment on, bicarbonates will be produced (Equation 6), until equilibrium is reached. The time in which
the OH- is depleted depends on its concentration: the higher the concentration, the longer the period of
time during which the reaction between CO2 and OH- occurs. Finally, it only remains to point out the
importance of constant monitoring of pH in this type of process, since from the slopes in its temporal
profile, the beginning and end of each of the reactions in which CO2 participates in solutions can be
inferred until it reaches equilibrium.
Graphic 4.8 Chemical Species Concentration and pH temporary profiles in the CO2 absorption process
at 25 °C
a) Ci in NaOH 0.25M
0
50
100
150
200
250
300
0 25 50 75 100 125
Ci
(mo
l/m
3)
time (min)
NaOH
Na2CO3
NaHCO3
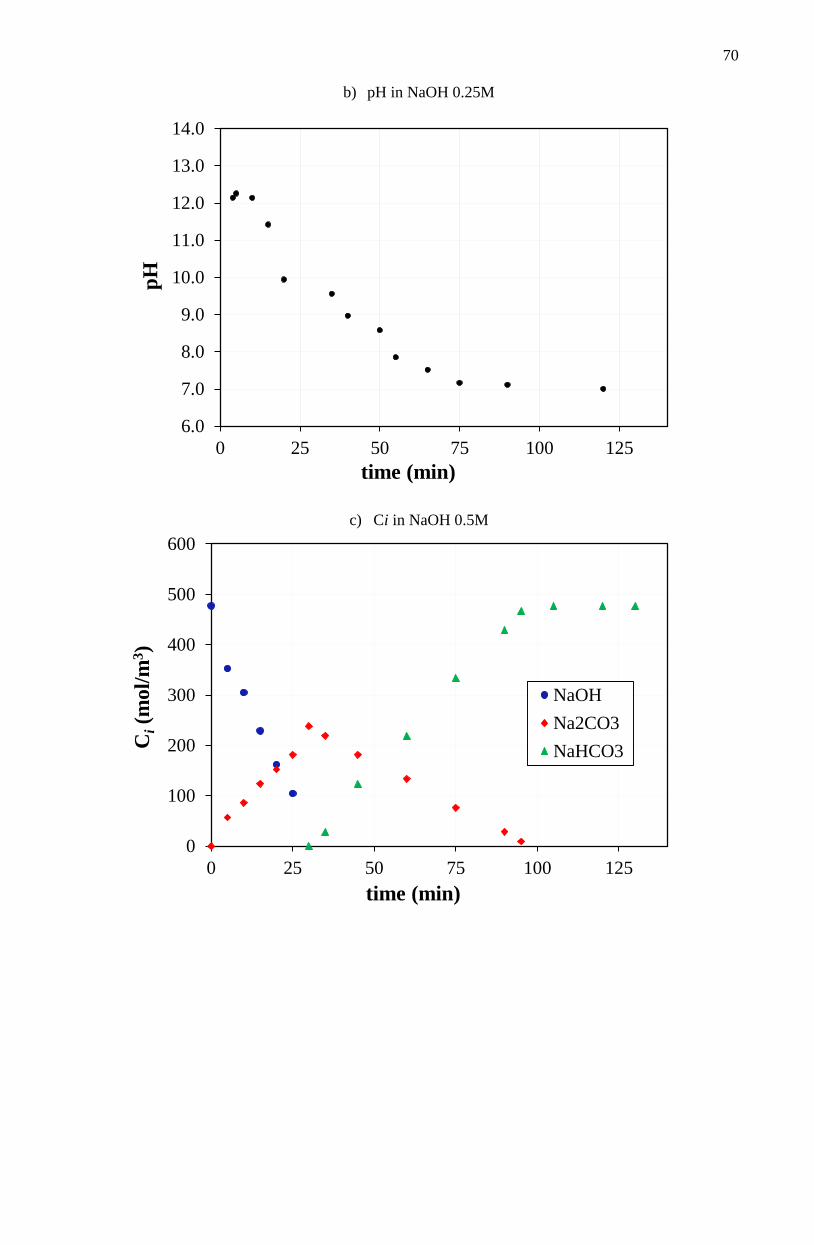
70
b) pH in NaOH 0.25M
c) Ci in NaOH 0.5M
6.0
7.0
8.0
9.0
10.0
11.0
12.0
13.0
14.0
0 25 50 75 100 125
pH
time (min)
0
100
200
300
400
500
600
0 25 50 75 100 125
Ci(m
ol/
m3)
time (min)
NaOH
Na2CO3
NaHCO3

71
d) pH in NaOH 0.5M
e) Ci in NaOH 0.75M
6.0
7.0
8.0
9.0
10.0
11.0
12.0
13.0
14.0
0 25 50 75 100 125
pH
time (min)
0
100
200
300
400
500
600
700
800
900
0 25 50 75 100 125
Ci
(mo
l/m
3)
time (min)
NaOH
Na2CO3
NaHCO3
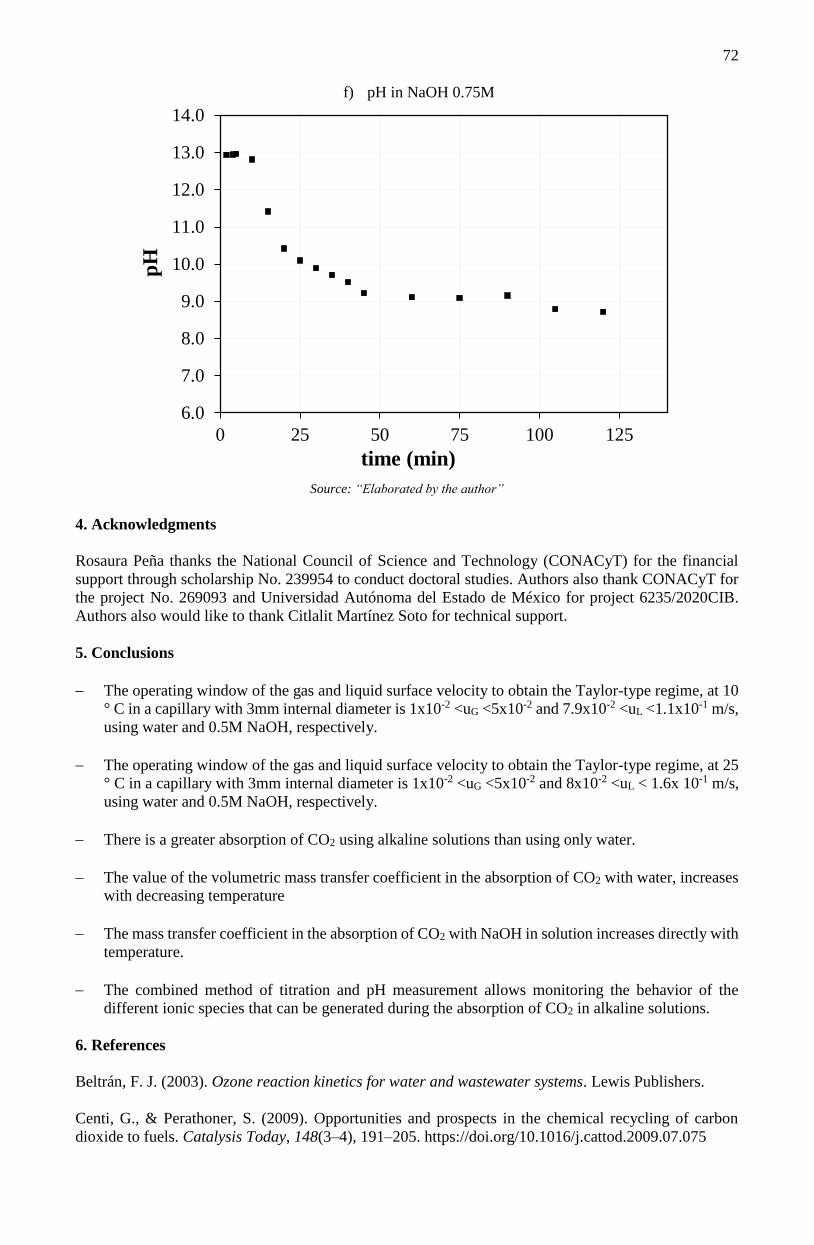
72
f) pH in NaOH 0.75M
Source: “Elaborated by the author”
4. Acknowledgments
Rosaura Peña thanks the National Council of Science and Technology (CONACyT) for the financial
support through scholarship No. 239954 to conduct doctoral studies. Authors also thank CONACyT for
the project No. 269093 and Universidad Autónoma del Estado de México for project 6235/2020CIB.
Authors also would like to thank Citlalit Martínez Soto for technical support.
5. Conclusions
The operating window of the gas and liquid surface velocity to obtain the Taylor-type regime, at 10
° C in a capillary with 3mm internal diameter is 1x10⁻² <uG <5x10⁻² and 7.9x10⁻² <uL <1.1x10⁻¹ m/s,
using water and 0.5M NaOH, respectively.
The operating window of the gas and liquid surface velocity to obtain the Taylor-type regime, at 25
° C in a capillary with 3mm internal diameter is 1x10⁻² <uG <5x10⁻² and 8x10⁻² <uL < 1.6x 10⁻¹ m/s,
using water and 0.5M NaOH, respectively.
There is a greater absorption of CO2 using alkaline solutions than using only water.
The value of the volumetric mass transfer coefficient in the absorption of CO2 with water, increases
with decreasing temperature
The mass transfer coefficient in the absorption of CO2 with NaOH in solution increases directly with
temperature.
The combined method of titration and pH measurement allows monitoring the behavior of the
different ionic species that can be generated during the absorption of CO2 in alkaline solutions.
6. References
Beltrán, F. J. (2003). Ozone reaction kinetics for water and wastewater systems. Lewis Publishers.
Centi, G., & Perathoner, S. (2009). Opportunities and prospects in the chemical recycling of carbon
dioxide to fuels. Catalysis Today, 148(3–4), 191–205. https://doi.org/10.1016/j.cattod.2009.07.075
6.0
7.0
8.0
9.0
10.0
11.0
12.0
13.0
14.0
0 25 50 75 100 125
pH
time (min)
73
Cotton, F. A. et al. (1999). Advanced inorganic chemistry (6a ed.). Wiley.
Danckwerts, P. V., & Kennedy, A. M. (1958). The kinetics of absorption of carbon dioxide into neutral
and alkaline solutions. Chemical Engineering Science, 8(3–4), 201–215. https://doi.org/10.1016/0009-
2509(58)85027-7
Fogler, H. S. (2008). Elementos de ingeniería de las reacciones químicas (4a ed.). México: PEARSON
EDUCACIÓN.
Ganapathy, H, Shooshtari, A., Dessiatoun, S., Ohadi, M. M., & Alshehhi, M. (2015). Hydrodynamics
and mass transfer performance of a microreactor for enhanced gas separation processes. Chemical
Engineering Journal, 266, 258–270.
Ganapathy, Harish, Al-hajri, E., & Ohadi, M. (2013). Mass transfer characteristics of gas – liquid
absorption during Taylor fl ow in mini / microchannel reactors. Chemical Engineering Science, 101, 69–
80. https://doi.org/10.1016/j.ces.2013.06.005
Ganesh, I. (2016). Electrochemical conversion of carbon dioxide into renewable fuel chemicals – The
role of nanomaterials and the commercialization. Renewable and Sustainable Energy Reviews, 59, 1269–
1297. https://doi.org/10.1016/j.rser.2016.01.026
Grzelka, J., Sobieszuk, P., Pohorecki, R., & Cygan, P. (2011). Determination of the interfacial area and
mass transfer coefficients in the Taylor gas – liquid flow in a microchannel, 66, 6048–6056.
https://doi.org/10.1016/j.ces.2011.08.029
Heiszwolf, J. J., Kreutzer, M. T., Eijnden, M. G. Van Den, Kapteijn, F., & Moulijn, J. A. (2001). Gas –
liquid mass transfer of aqueous Taylor flow in monoliths, 69, 51–55.
Holum, J. R. (1990). Principios de fisicoquímica, química orgánica y química. México: Limusa.
Hurtado Alva, L. (2016). Reactores capilares para fotosíntesis artificial. Universidad Autónoma del
Estado de México.
Hurtado, L., Solís-Casados, D., Escobar-Alarcón, L., Romero, R., & Natividad, R. (2016). Multiphase
photo-capillary reactors coated with TiO2 films: Preparation, characterization and photocatalytic
performance. Chemical Engineering Journal, 304, 39–47. https://doi.org/10.1016/j.cej.2016.06.003
Hurtado, Lourdes, Natividad, R., & García, H. (2016). Photocatalytic activity of Cu2O supported on multi
layers graphene for CO2 reduction by water under batch and continuous flow. Catalysis Communications,
84, 30–35.
Mebrahtu, C., Krebs, F., Abate, S., Perathoner, S., Centi, G., & Palkovits, R. (2019). and Challenges,
178, 85–103.
Natividad, R., Kulkarni, R., Nuithitikul, K., Raymahasay, S., Wood, J., & Winterbottom, J. M. (2004).
Analysis of the performance of single capillary and multiple capillary (monolith) reactors for the
multiphase Pd-catalyzed hydrogenation of 2-butyne-1,4-diol. Chemical Engineering Science, 59(22–23),
5431–5438. https://doi.org/10.1016/j.ces.2004.09.011
Ola, O., & Maroto-Valer, M. M. (2015). Review of material design and reactor engineering on TiO2
photocatalysis for CO2 reduction. Journal of Photochemistry and Photobiology C: Photochemistry
Reviews, 24, 16–42. https://doi.org/10.1016/j.jphotochemrev.2015.06.001
Palmer, D. A., & Van Eldik, R. (1983). The chemistry of metal carbonato and carbon dioxide complexes.
American Chemical Society, 83, 651–731.
Perry, R. H., Green, D. W., & Maloney, J. O. (1992). Manual del ingeniero químico (6a ed.). McGraw-
Hill.

74
Pohorecki, R., & Moniuk, W. (1988). Kinetics of reaction between carbon dioxide and ions in aqueous
electrolyte solutions. Chemical Engineering Science, 43(7), 1677–1684.
Savage, D. W., Astarita, G., & Joshi, S. (1980). Chemical absorption and desorption of carbon dioxide
from hot carbonate solutions. Chemical Enginering Science, 35, 1513–1522.
Shehzad, N., Tahir, M., Johari, K., & Murugesan, T. (2018). A critical review on TiO2 based
photocatalytic CO2 reduction system : Strategies to improve efficiency, 26(May), 98–122.
https://doi.org/10.1016/j.jcou.2018.04.026
Shim, J.-G., Lee, D. W., Lee, J. H., & Kwak, N.-S. (2016). Experimental study on capture of carbon
dioxide and production of sodium bicarbonate from sodium hydroxide. Environmental Engineering
Research, 21, 297–303.
Skoog, D. R. (2014). Fundamentals of analytical chemistry (9th ed.). CENGAGE Learning.
Yang, H., Zhang, C., Gao, P., Wang, H., Li, X., Zhong, L., Sun, Y. (2017). A review of the catalytic
hydrogenation of carbon dioxide into value-added hydrocarbons. Catalysis Science and Technology,
7(20), 4580–4598. https://doi.org/10.1039/c7cy01403a

75
Chapter 5 Mechanical characterization of the L4 and L5 lumbar vertebrae
Capítulo 5 Caracterización mecánica de las vértebras lumbares L4 y L5
VILLAGRÁN-VILLEGAS, Luz Yazmin1†*, SIORDIA-VÁSQUEZ, Xóchitl2, CUÉLLAR-OROZCO,
Maricela2 and PATIÑO-ORTIZ, Miguel1
1Instituto Politécnico Nacional. Unidad Profesional “Adolfo López Mateos”- Zacatenco, Gustavo A.
Madero, Mexico D.F. 2Universidad Veracruzana. Faculty of Engineering and Chemical Sciences“Campus Poza Rica-
Tuxpan”- Av. Venustiano Carranza s/n Col. Revolución, Poza Rica, Ver. Ph: +52 782 8238143
ID 1er Author: Luz Yazmin, Villagrán-Villegas / ORC ID: 0000-0003-3860-2923, CVU CONACYT ID:
96365
ID 1er Co-author: Xóchitl, Siordia-Vásquez / ORC ID: 0002-8472-8001, CVU CONACYT ID: 1036998
ID 2do Co-author: Maricela, Cuéllar-Orozco / ORC ID: 0000-0002-6558-4938, CVU CONACYT ID:
662076
ID 3er Co-author: Miguel, Patiño-Ortiz / ORC ID: 0000-0002-5630-8077, CVU CONACYT ID: 167388
DOI: 10.35429/H.2021.6.75.85
L. Villagrán, X. Siordia, M. Cuéllar and M. Patiño
A. Marroquín, J. Olivares, M. Ramírez and L. Cruz (Coord) Engineering and Technology. Handbooks-©ECORFAN-México,
Querétaro, 2021.
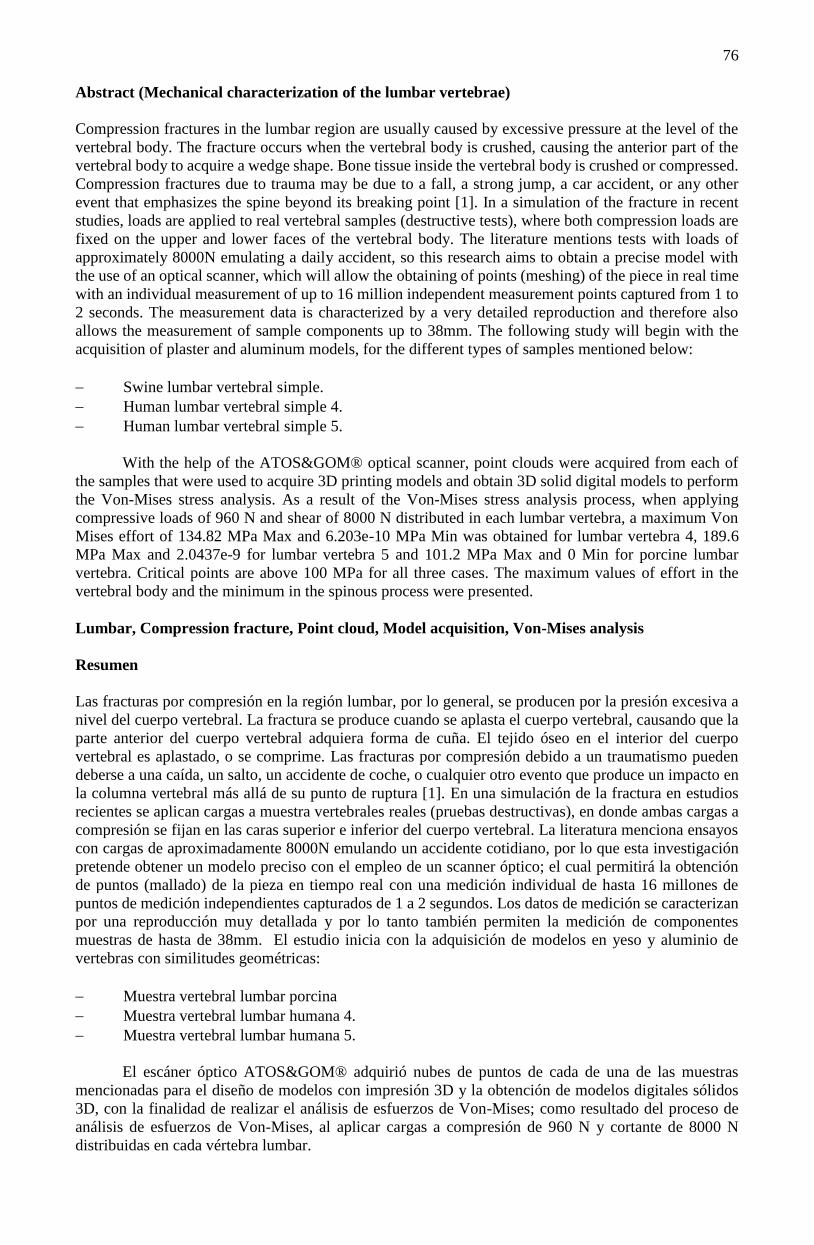
76
Abstract (Mechanical characterization of the lumbar vertebrae)
Compression fractures in the lumbar region are usually caused by excessive pressure at the level of the
vertebral body. The fracture occurs when the vertebral body is crushed, causing the anterior part of the
vertebral body to acquire a wedge shape. Bone tissue inside the vertebral body is crushed or compressed.
Compression fractures due to trauma may be due to a fall, a strong jump, a car accident, or any other
event that emphasizes the spine beyond its breaking point [1]. In a simulation of the fracture in recent
studies, loads are applied to real vertebral samples (destructive tests), where both compression loads are
fixed on the upper and lower faces of the vertebral body. The literature mentions tests with loads of
approximately 8000N emulating a daily accident, so this research aims to obtain a precise model with
the use of an optical scanner, which will allow the obtaining of points (meshing) of the piece in real time
with an individual measurement of up to 16 million independent measurement points captured from 1 to
2 seconds. The measurement data is characterized by a very detailed reproduction and therefore also
allows the measurement of sample components up to 38mm. The following study will begin with the
acquisition of plaster and aluminum models, for the different types of samples mentioned below:
Swine lumbar vertebral simple.
Human lumbar vertebral simple 4.
Human lumbar vertebral simple 5.
With the help of the ATOS&GOM® optical scanner, point clouds were acquired from each of
the samples that were used to acquire 3D printing models and obtain 3D solid digital models to perform
the Von-Mises stress analysis. As a result of the Von-Mises stress analysis process, when applying
compressive loads of 960 N and shear of 8000 N distributed in each lumbar vertebra, a maximum Von
Mises effort of 134.82 MPa Max and 6.203e-10 MPa Min was obtained for lumbar vertebra 4, 189.6
MPa Max and 2.0437e-9 for lumbar vertebra 5 and 101.2 MPa Max and 0 Min for porcine lumbar
vertebra. Critical points are above 100 MPa for all three cases. The maximum values of effort in the
vertebral body and the minimum in the spinous process were presented.
Lumbar, Compression fracture, Point cloud, Model acquisition, Von-Mises analysis
Resumen
Las fracturas por compresión en la región lumbar, por lo general, se producen por la presión excesiva a
nivel del cuerpo vertebral. La fractura se produce cuando se aplasta el cuerpo vertebral, causando que la
parte anterior del cuerpo vertebral adquiera forma de cuña. El tejido óseo en el interior del cuerpo
vertebral es aplastado, o se comprime. Las fracturas por compresión debido a un traumatismo pueden
deberse a una caída, un salto, un accidente de coche, o cualquier otro evento que produce un impacto en
la columna vertebral más allá de su punto de ruptura [1]. En una simulación de la fractura en estudios
recientes se aplican cargas a muestra vertebrales reales (pruebas destructivas), en donde ambas cargas a
compresión se fijan en las caras superior e inferior del cuerpo vertebral. La literatura menciona ensayos
con cargas de aproximadamente 8000N emulando un accidente cotidiano, por lo que esta investigación
pretende obtener un modelo preciso con el empleo de un scanner óptico; el cual permitirá la obtención
de puntos (mallado) de la pieza en tiempo real con una medición individual de hasta 16 millones de
puntos de medición independientes capturados de 1 a 2 segundos. Los datos de medición se caracterizan
por una reproducción muy detallada y por lo tanto también permiten la medición de componentes
muestras de hasta de 38mm. El estudio inicia con la adquisición de modelos en yeso y aluminio de
vertebras con similitudes geométricas:
Muestra vertebral lumbar porcina
Muestra vertebral lumbar humana 4.
Muestra vertebral lumbar humana 5.
El escáner óptico ATOS&GOM® adquirió nubes de puntos de cada de una de las muestras
mencionadas para el diseño de modelos con impresión 3D y la obtención de modelos digitales sólidos
3D, con la finalidad de realizar el análisis de esfuerzos de Von-Mises; como resultado del proceso de
análisis de esfuerzos de Von-Mises, al aplicar cargas a compresión de 960 N y cortante de 8000 N
distribuidas en cada vértebra lumbar.
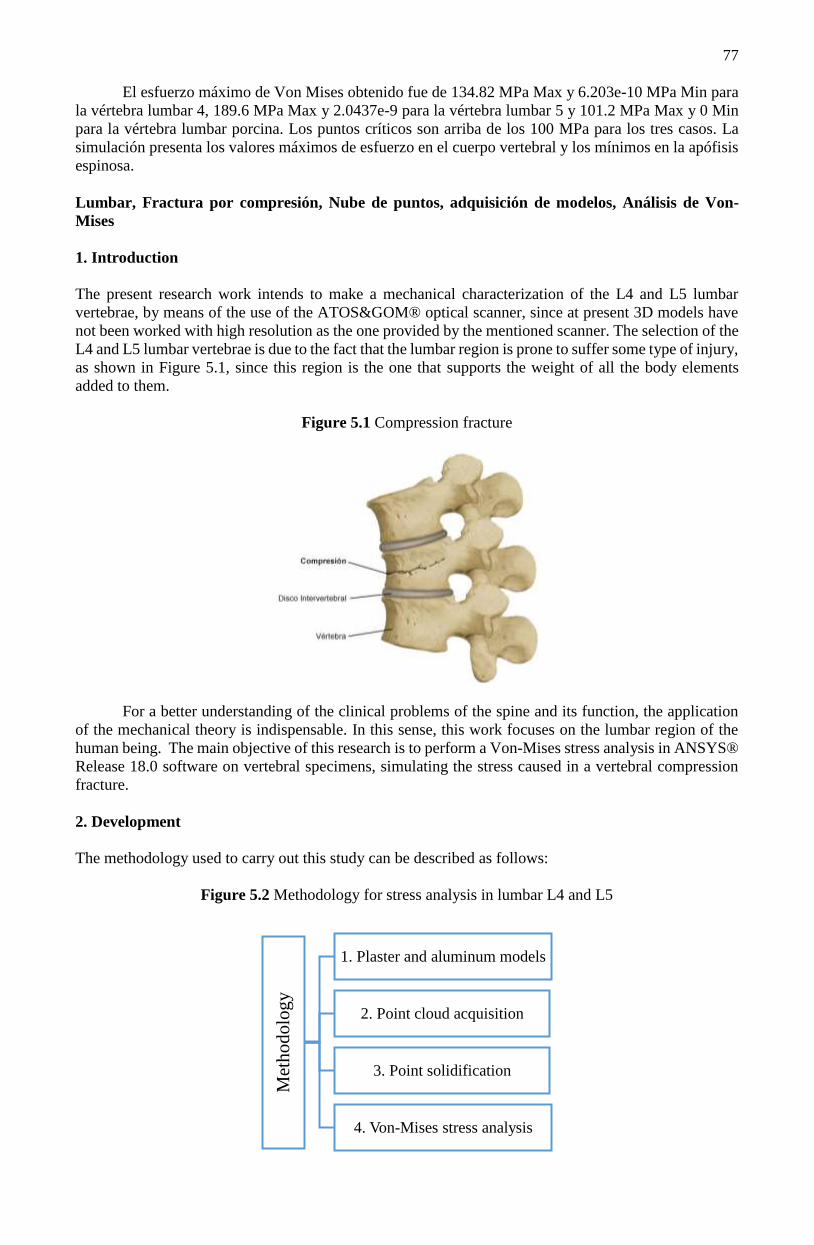
77
El esfuerzo máximo de Von Mises obtenido fue de 134.82 MPa Max y 6.203e-10 MPa Min para
la vértebra lumbar 4, 189.6 MPa Max y 2.0437e-9 para la vértebra lumbar 5 y 101.2 MPa Max y 0 Min
para la vértebra lumbar porcina. Los puntos críticos son arriba de los 100 MPa para los tres casos. La
simulación presenta los valores máximos de esfuerzo en el cuerpo vertebral y los mínimos en la apófisis
espinosa.
Lumbar, Fractura por compresión, Nube de puntos, adquisición de modelos, Análisis de Von-
Mises
1. Introduction
The present research work intends to make a mechanical characterization of the L4 and L5 lumbar
vertebrae, by means of the use of the ATOS&GOM® optical scanner, since at present 3D models have
not been worked with high resolution as the one provided by the mentioned scanner. The selection of the
L4 and L5 lumbar vertebrae is due to the fact that the lumbar region is prone to suffer some type of injury,
as shown in Figure 5.1, since this region is the one that supports the weight of all the body elements
added to them.
Figure 5.1 Compression fracture
For a better understanding of the clinical problems of the spine and its function, the application
of the mechanical theory is indispensable. In this sense, this work focuses on the lumbar region of the
human being. The main objective of this research is to perform a Von-Mises stress analysis in ANSYS®
Release 18.0 software on vertebral specimens, simulating the stress caused in a vertebral compression
fracture.
2. Development
The methodology used to carry out this study can be described as follows:
Figure 5.2 Methodology for stress analysis in lumbar L4 and L5
Met
ho
dolo
gy
1. Plaster and aluminum models
2. Point cloud acquisition
3. Point solidification
4. Von-Mises stress analysis

78
2.1 Plaster and aluminum models
The acquisition of the plaster and aluminum models was for the samples of human lumbar vertebrae 4
and 5. Initially, bipartite molds were obtained with the help of dental alginate, which is a gelling agent
that allows obtaining impressions; two impressions were made in each vertebral sample, the first one on
the upper faces and the second one on the lower faces. (Figure 5.3).
Figure 5.3 Bipartite mold
When the bipartite molds were obtained, Type IV high resistance dental plaster with a
compressive strength of 510 kg/cm2 was poured into them to obtain the plaster models. With the help of
a micromotor and a pink stone bur, special for polishing and conical cutting, the excess material generated
during the casting was removed (Figure 5.4).
Figure 5.4 Plaster model of L4 vertebra
Taking advantage of the bipartite molds in alginate, kerosene wax was poured in them to obtain
replicas of the vertebrae shown in Figure 5.5, which allowed acquiring new plaster molds, with the
technique known as "lost wax", which were used to receive the molten aluminum. (Figure 5.5)
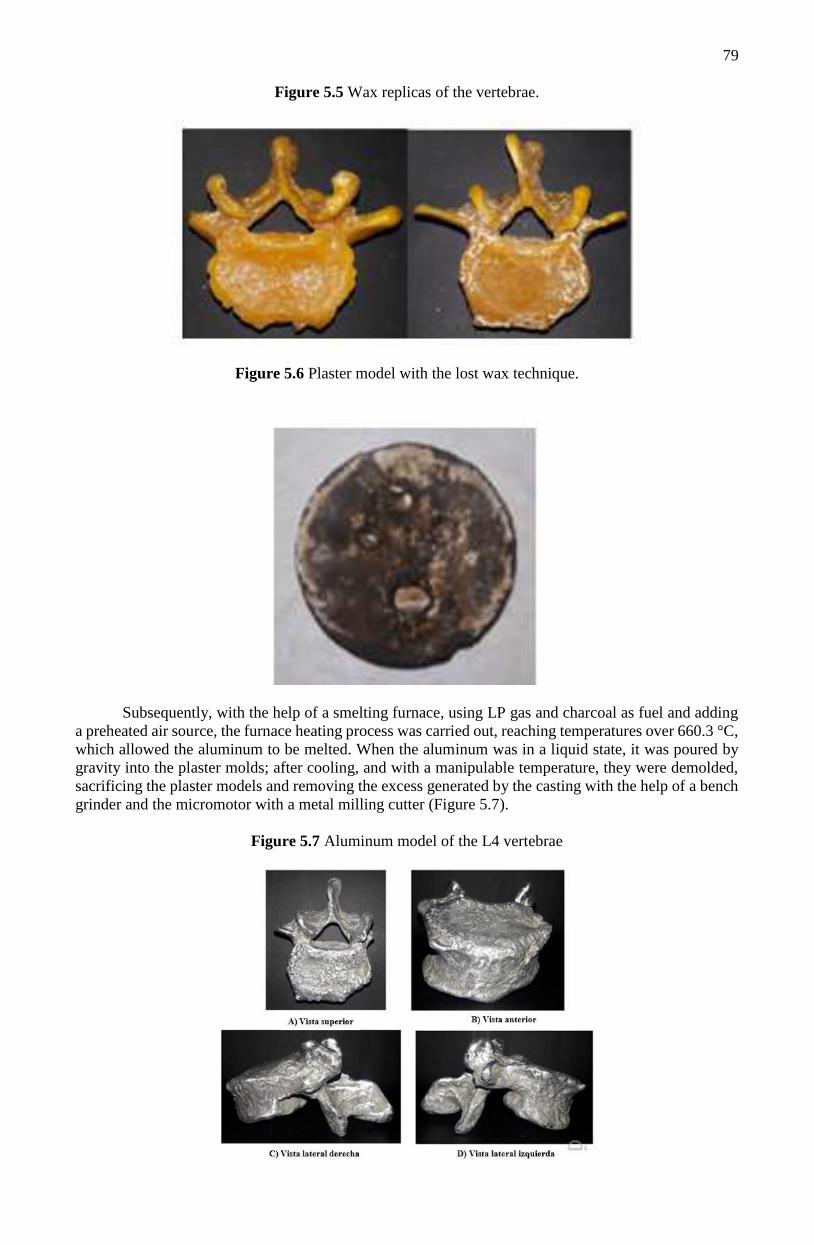
79
Figure 5.5 Wax replicas of the vertebrae.
Figure 5.6 Plaster model with the lost wax technique.
Subsequently, with the help of a smelting furnace, using LP gas and charcoal as fuel and adding
a preheated air source, the furnace heating process was carried out, reaching temperatures over 660.3 °C,
which allowed the aluminum to be melted. When the aluminum was in a liquid state, it was poured by
gravity into the plaster molds; after cooling, and with a manipulable temperature, they were demolded,
sacrificing the plaster models and removing the excess generated by the casting with the help of a bench
grinder and the micromotor with a metal milling cutter (Figure 5.7).
Figure 5.7 Aluminum model of the L4 vertebrae
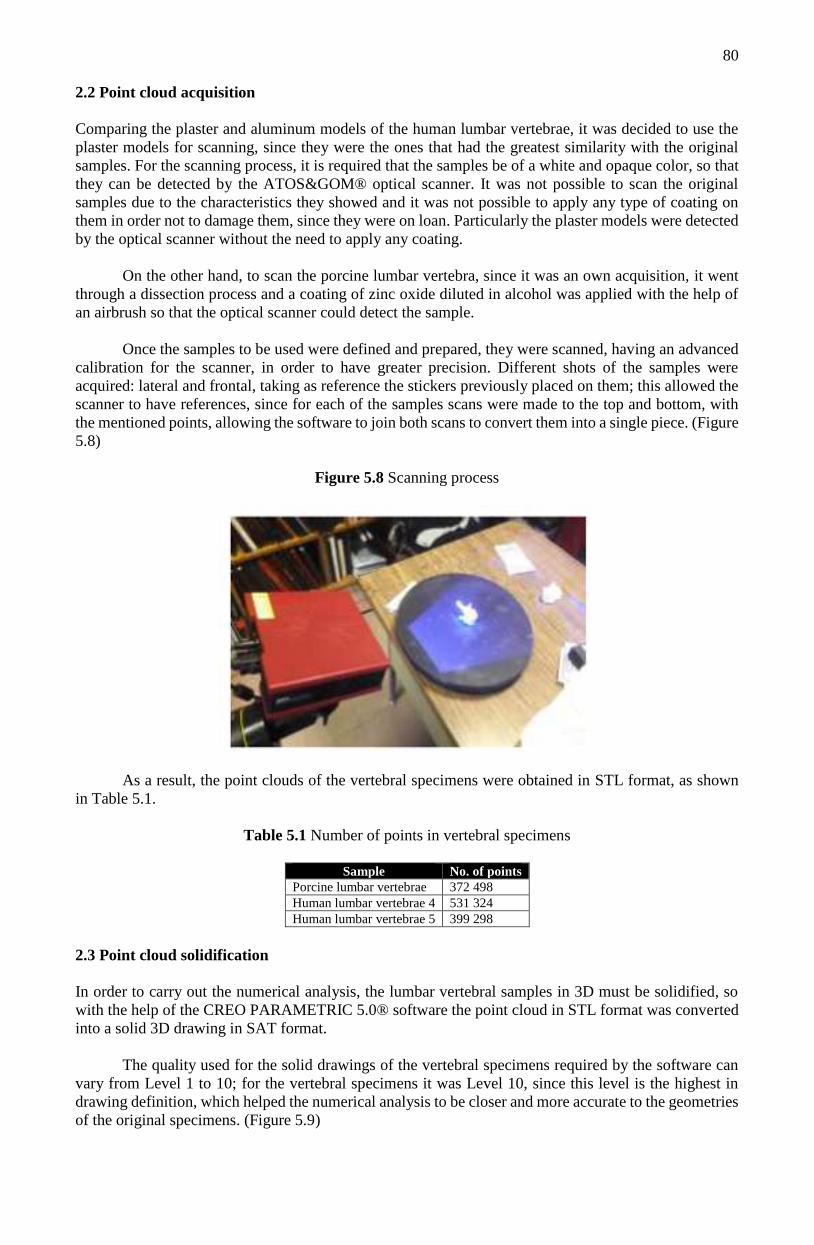
80
2.2 Point cloud acquisition
Comparing the plaster and aluminum models of the human lumbar vertebrae, it was decided to use the
plaster models for scanning, since they were the ones that had the greatest similarity with the original
samples. For the scanning process, it is required that the samples be of a white and opaque color, so that
they can be detected by the ATOS&GOM® optical scanner. It was not possible to scan the original
samples due to the characteristics they showed and it was not possible to apply any type of coating on
them in order not to damage them, since they were on loan. Particularly the plaster models were detected
by the optical scanner without the need to apply any coating.
On the other hand, to scan the porcine lumbar vertebra, since it was an own acquisition, it went
through a dissection process and a coating of zinc oxide diluted in alcohol was applied with the help of
an airbrush so that the optical scanner could detect the sample.
Once the samples to be used were defined and prepared, they were scanned, having an advanced
calibration for the scanner, in order to have greater precision. Different shots of the samples were
acquired: lateral and frontal, taking as reference the stickers previously placed on them; this allowed the
scanner to have references, since for each of the samples scans were made to the top and bottom, with
the mentioned points, allowing the software to join both scans to convert them into a single piece. (Figure
5.8)
Figure 5.8 Scanning process
As a result, the point clouds of the vertebral specimens were obtained in STL format, as shown
in Table 5.1.
Table 5.1 Number of points in vertebral specimens
Sample No. of points
Porcine lumbar vertebrae 372 498
Human lumbar vertebrae 4 531 324
Human lumbar vertebrae 5 399 298
2.3 Point cloud solidification
In order to carry out the numerical analysis, the lumbar vertebral samples in 3D must be solidified, so
with the help of the CREO PARAMETRIC 5.0® software the point cloud in STL format was converted
into a solid 3D drawing in SAT format.
The quality used for the solid drawings of the vertebral specimens required by the software can
vary from Level 1 to 10; for the vertebral specimens it was Level 10, since this level is the highest in
drawing definition, which helped the numerical analysis to be closer and more accurate to the geometries
of the original specimens. (Figure 5.9)
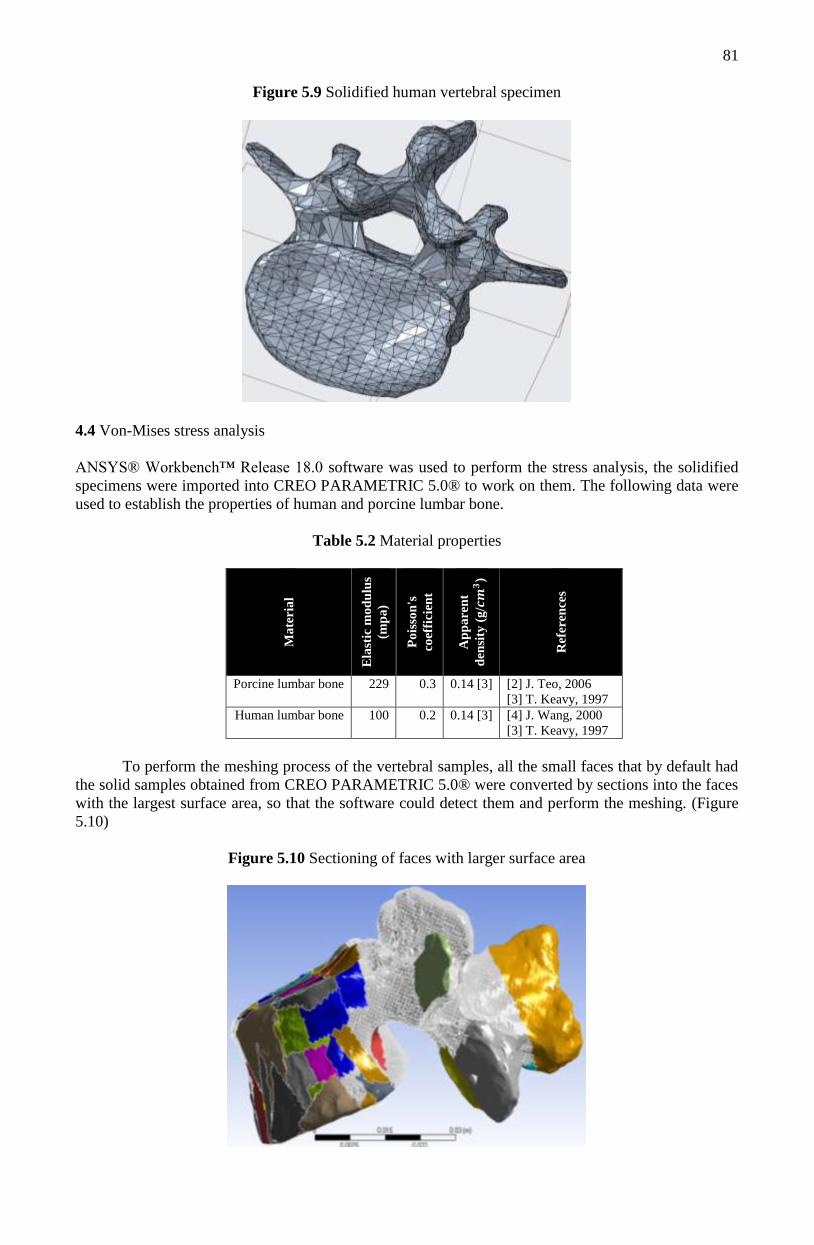
81
Figure 5.9 Solidified human vertebral specimen
4.4 Von-Mises stress analysis
ANSYS® Workbench™ Release 18.0 software was used to perform the stress analysis, the solidified
specimens were imported into CREO PARAMETRIC 5.0® to work on them. The following data were
used to establish the properties of human and porcine lumbar bone.
Table 5.2 Material properties
Ma
teria
l
Ela
stic
mo
du
lus
(mp
a)
Po
isso
n's
coef
fici
ent
Ap
pa
ren
t
den
sity
(g
/𝒄𝒎
𝟑)
Ref
eren
ces
Porcine lumbar bone 229 0.3 0.14 [3] [2] J. Teo, 2006
[3] T. Keavy, 1997
Human lumbar bone 100 0.2 0.14 [3] [4] J. Wang, 2000
[3] T. Keavy, 1997
To perform the meshing process of the vertebral samples, all the small faces that by default had
the solid samples obtained from CREO PARAMETRIC 5.0® were converted by sections into the faces
with the largest surface area, so that the software could detect them and perform the meshing. (Figure
5.10)
Figure 5.10 Sectioning of faces with larger surface area

82
After finishing joining the faces, the parameters that were modified to perform a fine meshing
were established, in order to match the geometries of the lumbar vertebrae for greater accuracy in the
results. Tables 5.3 and 5.4 show only the parameters that were modified in the software, leaving the
others by default for the human vertebral samples and the porcine sample.
Table 5.3 Meshing parameters for human vertebral samples
Human vertebral samples
Defaults
Relevance 100
Sizing
Relevance center Fine
Element size 5.e-004 m
Span angle center Fine
Defeature size 5.e-004 m
Quality
Target quality 5.e-004 m
Smoothing High
Table 5.4 Meshing parameters for porcine vertebral specimen
Porcine vertebral specimen
Defaults
Relevance 50
Sizing
Relevance center Medium
Transition Slow
Span angle center Fine
Defeature size 5.e-004 m
Quality
Smoothing High
After finishing the meshing of the vertebral samples, the statistics in Table 5.5 were obtained.
Figure 5.11 presents a meshed vertebral sample.
Table 5.5 Meshing statistics
Muestra Nodes Elements
Porcine lumbar vertebrae 260 796 176 696
Human lumbar vertebra 4 180 294 113 346
Human lumbar vertebra 5 175 373 109 781
Figure 5.11 Meshed vertebral specimen

83
To simulate the compression fracture, the boundary conditions were established with the
following data: three loads were applied to each vertebral specimen, two of them according to studies
carried out by Nachemson in 1976 [5]; a subject who paradoxically when sitting (sedentary) without
dorsal support increases the pressure to 140% of his body weight. For this case the subject has 70 kg, so
a load of 960 N was used. In which both compression loads are fixed on the upper and lower faces of the
vertebral body.
The third load was 8000 N, maximum load at which the lumbar bone fails, taken from the
literature "Clinical Biomechanics of the Spine" of 1990 [6], considering that it can be produced by an
accident in daily life. This shear load was fixed in the anterior area of the vertebral body.
Figure 5.12 shows in red the areas in which the three loads mentioned above were fixed and in
purple the areas that supported these loads. [7]
Figure 5.12 Boundary conditions
5 Results
The results obtained for the porcine vertebral specimen are the maximum and minimum values of stress
concentration in the lateral zones, upper and lower faces and anterior zone of the vertebral body, as well
as in the vertebral arch zone and in the upper notch. Particularly, the maximum stresses were found in
the lateral zone and vertebral arch and the minimum stresses in the spinous process zone. (Figure 12)For
the human vertebral specimens, the maximum and minimum values of stress concentration were found
in the lateral zones, upper and lower faces and anterior zone of the vertebral body, as well as in the
vertebral arch zone and in the upper notch. In particular, maximum stresses were found in the lower face
and lateral zone and minimum stresses in the area of the spinous process. (Figures 5.13 and 5.14) The
results also show the Von-Mises stress concentration values shown in Table 5.6.
Figure 5.13 Results in porcine lumbar vertebra
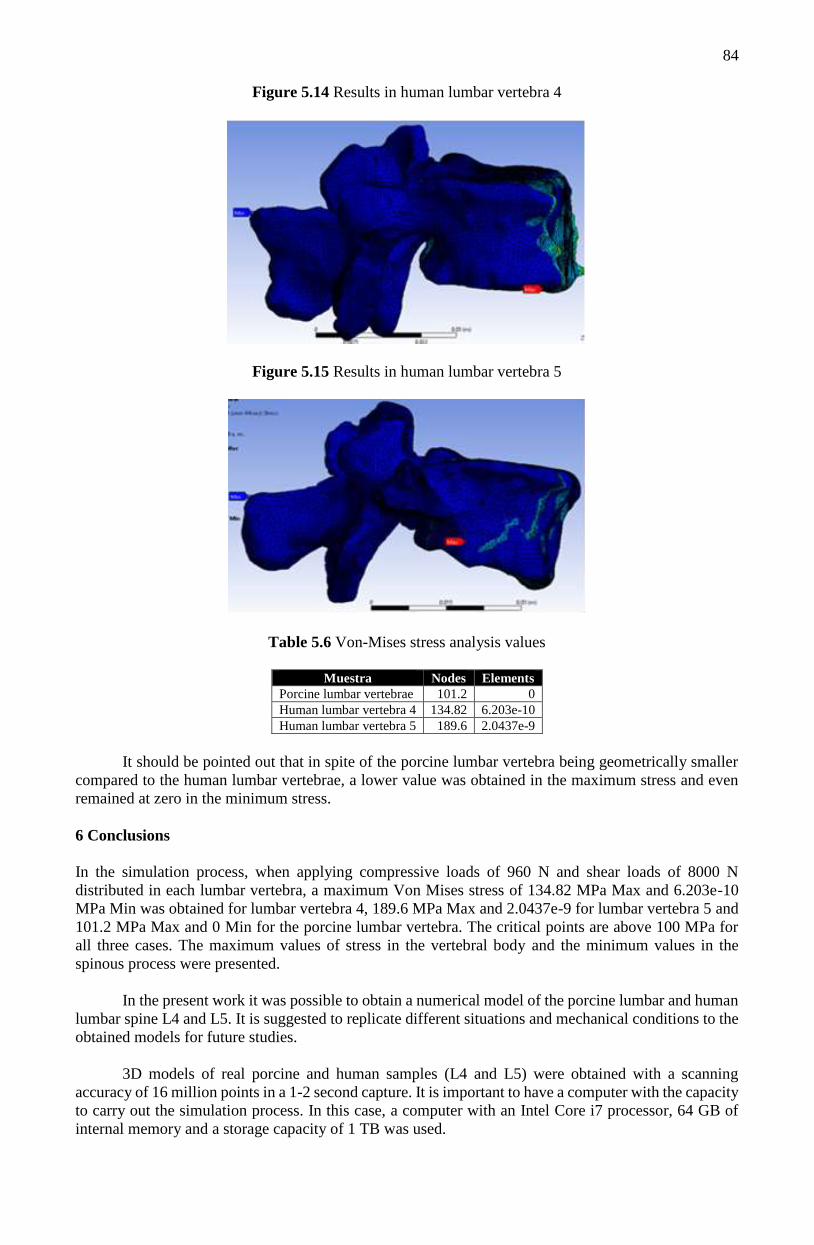
84
Figure 5.14 Results in human lumbar vertebra 4
Figure 5.15 Results in human lumbar vertebra 5
Table 5.6 Von-Mises stress analysis values
Muestra Nodes Elements
Porcine lumbar vertebrae 101.2 0
Human lumbar vertebra 4 134.82 6.203e-10
Human lumbar vertebra 5 189.6 2.0437e-9
It should be pointed out that in spite of the porcine lumbar vertebra being geometrically smaller
compared to the human lumbar vertebrae, a lower value was obtained in the maximum stress and even
remained at zero in the minimum stress.
6 Conclusions
In the simulation process, when applying compressive loads of 960 N and shear loads of 8000 N
distributed in each lumbar vertebra, a maximum Von Mises stress of 134.82 MPa Max and 6.203e-10
MPa Min was obtained for lumbar vertebra 4, 189.6 MPa Max and 2.0437e-9 for lumbar vertebra 5 and
101.2 MPa Max and 0 Min for the porcine lumbar vertebra. The critical points are above 100 MPa for
all three cases. The maximum values of stress in the vertebral body and the minimum values in the
spinous process were presented.
In the present work it was possible to obtain a numerical model of the porcine lumbar and human
lumbar spine L4 and L5. It is suggested to replicate different situations and mechanical conditions to the
obtained models for future studies.
3D models of real porcine and human samples (L4 and L5) were obtained with a scanning
accuracy of 16 million points in a 1-2 second capture. It is important to have a computer with the capacity
to carry out the simulation process. In this case, a computer with an Intel Core i7 processor, 64 GB of
internal memory and a storage capacity of 1 TB was used.
85
Acknowledgements
The authors would like to thank the Unidad ESIME Zacatenco of the Instituto Politécnico Nacional for
their kindness and the Unidad de Ciencias de la Salud of the Universidad Veracruzana Campus Poza
Rica - Tuxpan for their support.
7 References
[1] Vanaclocha, V. (2016). Clínica Neuros. Obtenido de Clínica Neuros: http://neuros.net/es/fractura-
aplastamiento_vertebral/
[2] J. Teo, K. S.-H. (2006). "Reationship between CT intensity, micro-architecture and mechanical
properties of porcine vertebral cancellous bone". En Clinical Biomechanics (Vol. 21, págs. 235-244).
[3] T. Keavy, T. p. (1997). "Systematic and random errors in compression testing of trabecular bone".
En Orthopaedic Research (Vol. 15, págs. 101-110).
[4] J. Wang, M. P.-A. (2000). "Viscoelastic finite-element analysis of a lumbar motion segment in
combined compression and sagital flexion". En Spine (Vol. 25, págs. 310-318).
[5] Nachemson A.L (1976). The lumbar spine. An orthopedic challenge. Spine.
[6] A. White III, M. Panjabi (1990). Clinical Biomechanics of the Spine. 2da Ed. Lippincott Williams &
Wilkins. Philadelphia, USA. pp. 2-56.
[7] Blanco Ortiz, K. A. A. (2021). Propuesta de protocolo de ejercicios para fortalecimiento del CORE
como medida preventiva en lesiones músculo esqueléticas del raquis lumbar en trabajadores que se
encuentran en sedestación con edades comprendidas entre 25 y 30 años por medio de un análisis
(Doctoral dissertation).
86
Chapter 6 Applied study of training projects as a learning strategy
Capítulo 6 Estudio aplicado de proyectos formativos como estrategia de aprendizaje
HERNÁNDEZ-CRUZ, Luz María †*, MEX-ALVAREZ, Diana Concepción, ORTIZ-CUEVAS, Nancy
Georgina and CASTILLO-TÉLLEZ, Margarita
Universidad Autónoma de Campeche. Faculty of Engineering
ID 1st Author: Luz María, Hernández-Cruz / ORC ID: 0000-0002-0469-5298, Researcher ID
Thomson: H-3153-2018, CVU CONACYT ID: 662220
ID 1st Co-author: Diana Concepción, Mex-Álvarez / ORC ID: 0000-0001-9419-7868, Researcher ID
Thomson: I-4164-2018, CVU CONACYT ID: 842039
ID 2nd Co-author: Nancy Georgina, Ortiz-Cuevas / ORC ID: 0000-0003-4191-9630, CVU CONACYT
ID: 964285
ID 3rd Co-author: Margarita, Castillo-Téllez / ORC ID: 0000-0001-9639-1736, Researcher ID
Thomson: S-2283-2018, CVU CONACYT ID: 210428
DOI: 10.35429/H.2021.6.86.98
L. Hernández, D. Mex, N. Ortiz and M. Castillo
A. Marroquín, J. Olivares, M. Ramírez and L. Cruz (Coord) Engineering and Technology. Handbooks-©ECORFAN-México,
Querétaro, 2021.
87
Abstract
This article analyzes the use of Training Projects as a learning strategy, a two-step methodology is carried
out: the first corresponds to an applied research, in which the phases of the Training Project are
implemented during the course of a learning unit (Software Project Management). The second, once the
case study has been put into practice, a field investigation is applied, for the self-evaluation of the applied
strategy. The data collection instrument is a survey designed with the Google Forms tool and shared via
institutional email. The results of the study are promising, the use of Formative Projects in learning, they
are fully aligned to the learning unit and the achievement of its competence was very satisfactory,
showing that 96.1% of the students agree or fully agree that they successfully completed their projects
and clearly identify the disciplinary competence achieved in the process. There is no doubt that this study
opens the gap to design methodologies and/or action plans where Training Projects can contribute to the
achievement of the skills of knowledge, know-how and know-how in the disciplinary field of any area.
Training projects, Competencies, Learning
Resumen
Este artículo analiza el uso de los Proyectos Formativos como una estrategia de aprendizaje; se lleva a
cabo una metodología de dos pasos: el primero corresponde a una investigación aplicada, en la que las
fases del Proyecto Formativo se implementan durante el transcurso de una unidad de aprendizaje
(Proyecto de Software Gestión). En el segundo paso, una vez puesto en práctica el estudio de caso, se
aplica una investigación de campo, para la autoevaluación de la estrategia propuesta. El instrumento de
recolección de datos es una encuesta diseñada con la herramienta Google Forms y compartida a través
de correo electrónico institucional. Los resultados del estudio son prometedores, el uso de Proyectos
Formativos en el aprendizaje, están totalmente alineados a la unidad de aprendizaje y el logro de su
competencia fue muy satisfactorio, mostrando que el 96,1% de los estudiantes están de acuerdo o
totalmente de acuerdo en haber culminado con éxito sus proyectos e identificar claramente la
competencia disciplinaria lograda en el proceso. No cabe duda, de que este estudio abre la brecha para
diseñar metodologías y/o planes de acción donde los Proyectos Formativos puedan contribuir al logro de
las competencias de conocimiento, saber y saber hacer en el ámbito disciplinar de cualquier área.
Proyectos formativos, Competencias, Aprendizaje
1 Introduction
A project is an operation of remarkable complexity, singular, with defined start and finish dates. It is a
non-repetitive job that must be planned and executed according to predetermined technical specifications,
with a preset budget and temporal organization, with the participation of various departments of a
company later dismantled at the end of the project, and maybe the collaboration of third parties.
At some point of our academic education, we must work on certain projects, which contribute
important lessons when we reach the labour market. Nevertheless, we must consider that for a project’s
management and execution to have a guarantee of success, it is important to know what a project is, as
well as its peculiarities in both its approach and management.
Formative projects’ goal is the realisation of certain activities that help to the resolution of a
problem, during the course of the project, the competences determined in an educational program will be
developed, in this type of project the final product is important because, based on it, the capability and
the learning advances developed will be determined, as well as the realization of the acquired
competences.
2 Project
Nowadays, “project” is one of the most daily used terms, everybody, either consciously or unconsciously,
is involved in one. Neverthless, defining the concept of “project” is not easy at all, so it’s best to
understand its meaning. The word “project” comes from the latin “projectus” (projected), plant and
disposition formed for the realisation of an agreement, or execution of something important.
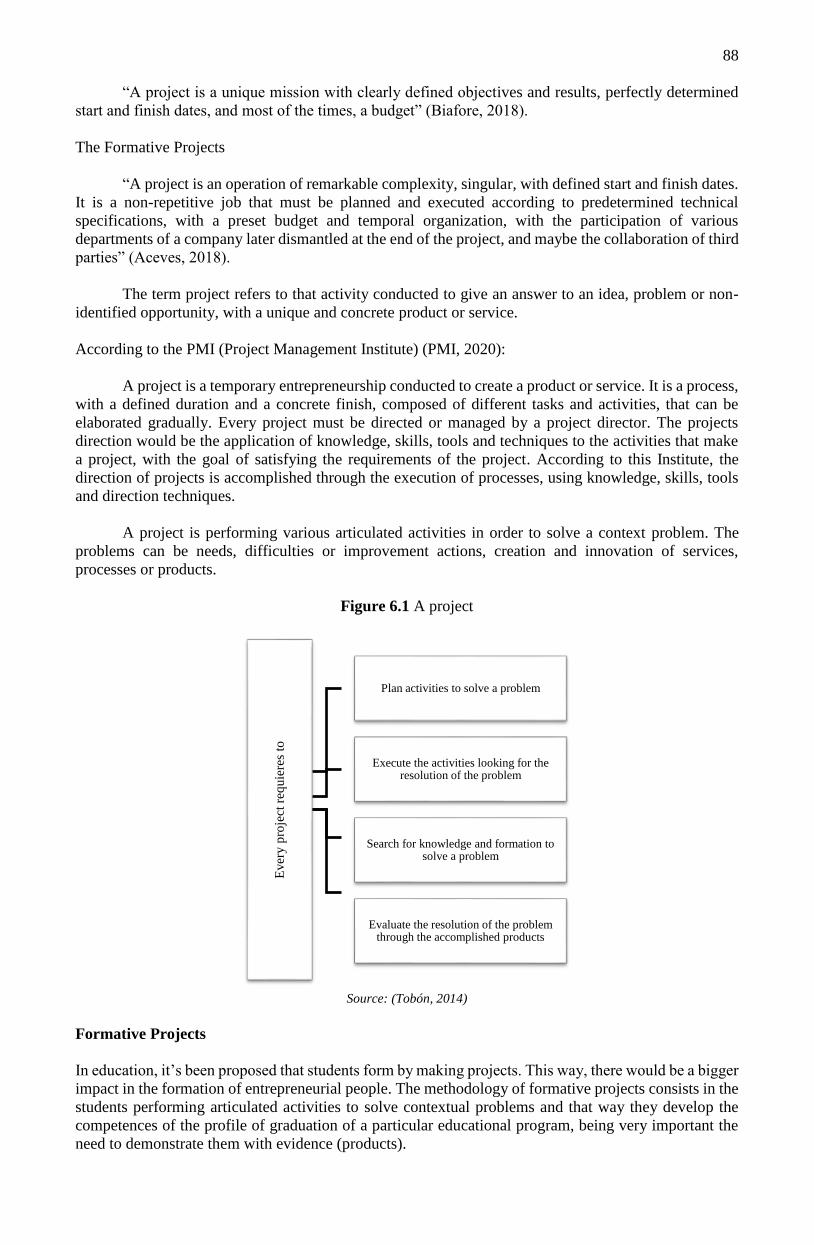
88
“A project is a unique mission with clearly defined objectives and results, perfectly determined
start and finish dates, and most of the times, a budget” (Biafore, 2018).
The Formative Projects
“A project is an operation of remarkable complexity, singular, with defined start and finish dates.
It is a non-repetitive job that must be planned and executed according to predetermined technical
specifications, with a preset budget and temporal organization, with the participation of various
departments of a company later dismantled at the end of the project, and maybe the collaboration of third
parties” (Aceves, 2018).
The term project refers to that activity conducted to give an answer to an idea, problem or non-
identified opportunity, with a unique and concrete product or service.
According to the PMI (Project Management Institute) (PMI, 2020):
A project is a temporary entrepreneurship conducted to create a product or service. It is a process,
with a defined duration and a concrete finish, composed of different tasks and activities, that can be
elaborated gradually. Every project must be directed or managed by a project director. The projects
direction would be the application of knowledge, skills, tools and techniques to the activities that make
a project, with the goal of satisfying the requirements of the project. According to this Institute, the
direction of projects is accomplished through the execution of processes, using knowledge, skills, tools
and direction techniques.
A project is performing various articulated activities in order to solve a context problem. The
problems can be needs, difficulties or improvement actions, creation and innovation of services,
processes or products.
Figure 6.1 A project
Source: (Tobón, 2014)
Formative Projects
In education, it’s been proposed that students form by making projects. This way, there would be a bigger
impact in the formation of entrepreneurial people. The methodology of formative projects consists in the
students performing articulated activities to solve contextual problems and that way they develop the
competences of the profile of graduation of a particular educational program, being very important the
need to demonstrate them with evidence (products).
Ever
y p
roje
ct r
equie
res
to
Plan activities to solve a problem
Execute the activities looking for the resolution of the problem
Search for knowledge and formation to solve a problem
Evaluate the resolution of the problem through the accomplished products
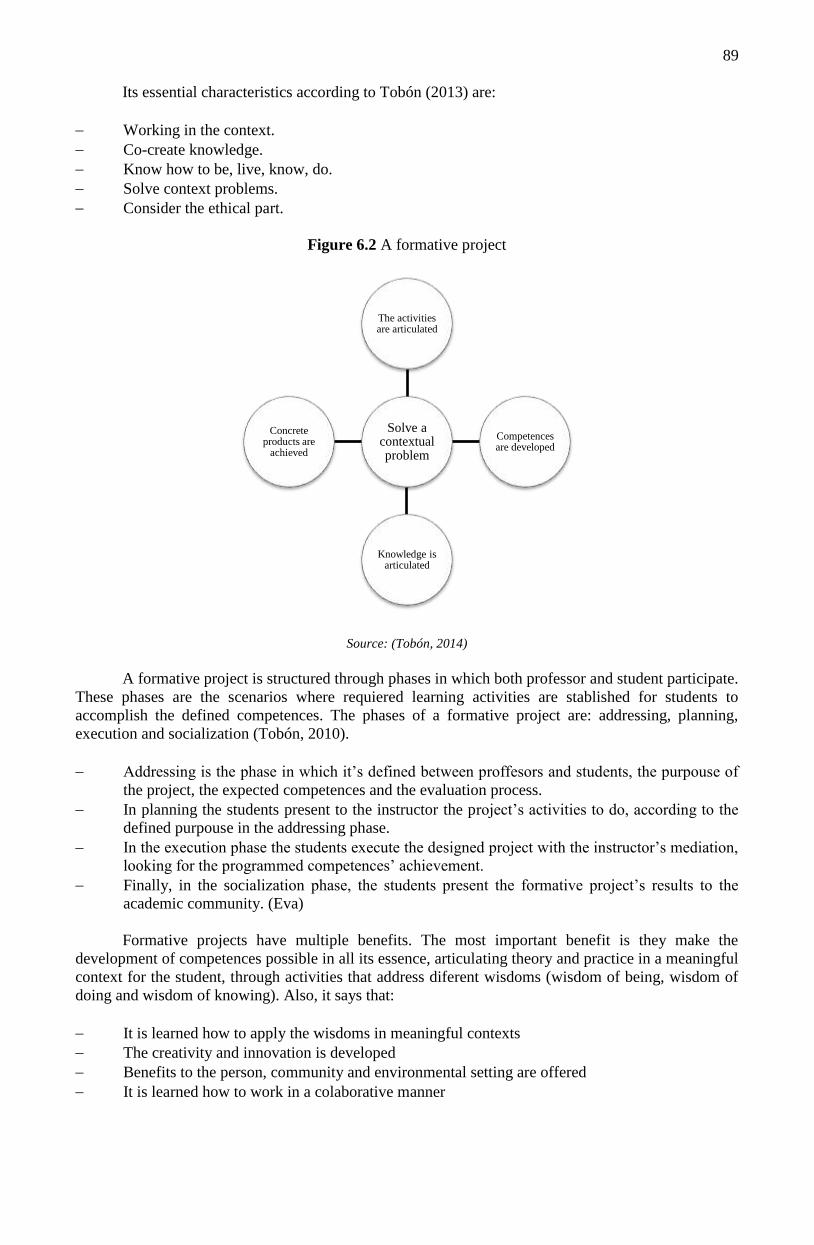
89
Its essential characteristics according to Tobón (2013) are:
Working in the context.
Co-create knowledge.
Know how to be, live, know, do.
Solve context problems.
Consider the ethical part.
Figure 6.2 A formative project
Source: (Tobón, 2014)
A formative project is structured through phases in which both professor and student participate.
These phases are the scenarios where requiered learning activities are stablished for students to
accomplish the defined competences. The phases of a formative project are: addressing, planning,
execution and socialization (Tobón, 2010).
Addressing is the phase in which it’s defined between proffesors and students, the purpouse of
the project, the expected competences and the evaluation process.
In planning the students present to the instructor the project’s activities to do, according to the
defined purpouse in the addressing phase.
In the execution phase the students execute the designed project with the instructor’s mediation,
looking for the programmed competences’ achievement.
Finally, in the socialization phase, the students present the formative project’s results to the
academic community. (Eva)
Formative projects have multiple benefits. The most important benefit is they make the
development of competences possible in all its essence, articulating theory and practice in a meaningful
context for the student, through activities that address diferent wisdoms (wisdom of being, wisdom of
doing and wisdom of knowing). Also, it says that:
It is learned how to apply the wisdoms in meaningful contexts
The creativity and innovation is developed
Benefits to the person, community and environmental setting are offered
It is learned how to work in a colaborative manner
Solve a contextual problem
The activities are articulated
Competences are developed
Knowledge is articulated
Concrete products are
achieved
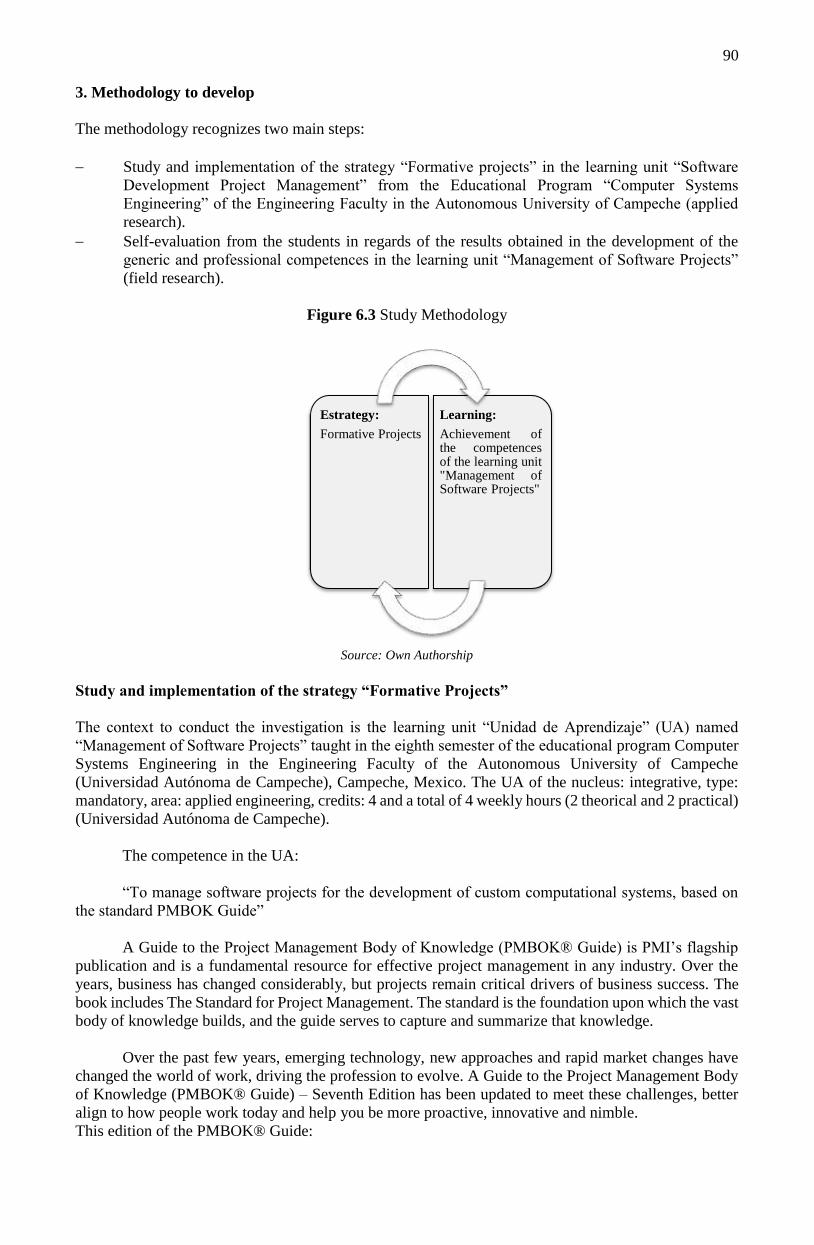
90
3. Methodology to develop
The methodology recognizes two main steps:
Study and implementation of the strategy “Formative projects” in the learning unit “Software
Development Project Management” from the Educational Program “Computer Systems
Engineering” of the Engineering Faculty in the Autonomous University of Campeche (applied
research).
Self-evaluation from the students in regards of the results obtained in the development of the
generic and professional competences in the learning unit “Management of Software Projects”
(field research).
Figure 6.3 Study Methodology
Source: Own Authorship
Study and implementation of the strategy “Formative Projects”
The context to conduct the investigation is the learning unit “Unidad de Aprendizaje” (UA) named
“Management of Software Projects” taught in the eighth semester of the educational program Computer
Systems Engineering in the Engineering Faculty of the Autonomous University of Campeche
(Universidad Autónoma de Campeche), Campeche, Mexico. The UA of the nucleus: integrative, type:
mandatory, area: applied engineering, credits: 4 and a total of 4 weekly hours (2 theorical and 2 practical)
(Universidad Autónoma de Campeche).
The competence in the UA:
“To manage software projects for the development of custom computational systems, based on
the standard PMBOK Guide”
A Guide to the Project Management Body of Knowledge (PMBOK® Guide) is PMI’s flagship
publication and is a fundamental resource for effective project management in any industry. Over the
years, business has changed considerably, but projects remain critical drivers of business success. The
book includes The Standard for Project Management. The standard is the foundation upon which the vast
body of knowledge builds, and the guide serves to capture and summarize that knowledge.
Over the past few years, emerging technology, new approaches and rapid market changes have
changed the world of work, driving the profession to evolve. A Guide to the Project Management Body
of Knowledge (PMBOK® Guide) – Seventh Edition has been updated to meet these challenges, better
align to how people work today and help you be more proactive, innovative and nimble.
This edition of the PMBOK® Guide:
Estrategy:
Formative Projects
Learning:
Achievement ofthe competencesof the learning unit"Management ofSoftware Projects"
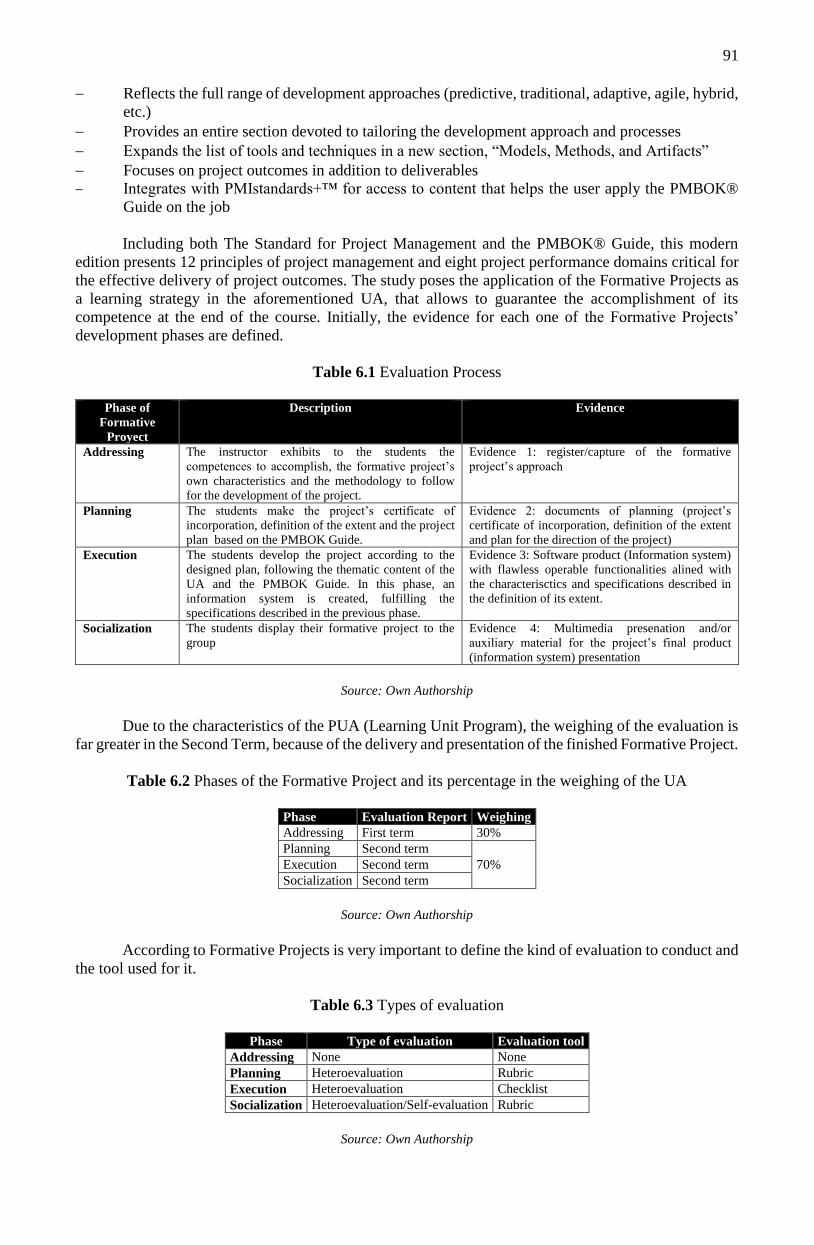
91
Reflects the full range of development approaches (predictive, traditional, adaptive, agile, hybrid,
etc.)
Provides an entire section devoted to tailoring the development approach and processes
Expands the list of tools and techniques in a new section, “Models, Methods, and Artifacts”
Focuses on project outcomes in addition to deliverables
Integrates with PMIstandards+™ for access to content that helps the user apply the PMBOK®
Guide on the job
Including both The Standard for Project Management and the PMBOK® Guide, this modern
edition presents 12 principles of project management and eight project performance domains critical for
the effective delivery of project outcomes. The study poses the application of the Formative Projects as
a learning strategy in the aforementioned UA, that allows to guarantee the accomplishment of its
competence at the end of the course. Initially, the evidence for each one of the Formative Projects’
development phases are defined.
Table 6.1 Evaluation Process
Phase of
Formative
Proyect
Description Evidence
Addressing The instructor exhibits to the students the
competences to accomplish, the formative project’s
own characteristics and the methodology to follow
for the development of the project.
Evidence 1: register/capture of the formative
project’s approach
Planning The students make the project’s certificate of
incorporation, definition of the extent and the project
plan based on the PMBOK Guide.
Evidence 2: documents of planning (project’s
certificate of incorporation, definition of the extent
and plan for the direction of the project)
Execution The students develop the project according to the
designed plan, following the thematic content of the
UA and the PMBOK Guide. In this phase, an
information system is created, fulfilling the
specifications described in the previous phase.
Evidence 3: Software product (Information system)
with flawless operable functionalities alined with
the characterisctics and specifications described in
the definition of its extent.
Socialization The students display their formative project to the
group
Evidence 4: Multimedia presenation and/or
auxiliary material for the project’s final product
(information system) presentation
Source: Own Authorship
Due to the characteristics of the PUA (Learning Unit Program), the weighing of the evaluation is
far greater in the Second Term, because of the delivery and presentation of the finished Formative Project.
Table 6.2 Phases of the Formative Project and its percentage in the weighing of the UA
Phase Evaluation Report Weighing
Addressing First term 30%
Planning Second term
70% Execution Second term
Socialization Second term
Source: Own Authorship
According to Formative Projects is very important to define the kind of evaluation to conduct and
the tool used for it.
Table 6.3 Types of evaluation
Phase Type of evaluation Evaluation tool
Addressing None None
Planning Heteroevaluation Rubric
Execution Heteroevaluation Checklist
Socialization Heteroevaluation/Self-evaluation Rubric
Source: Own Authorship

92
Immediately, each phase of the Formative Project strategy is described for the raised case study.
Phase 1: Addressing
The experimentation with the students was conducted on the january-july 2021 school cycle. In the first
session the instructor conducts the addressing phase. Students have one week to clarify doubts, and once
work-teams are assembled, they capture in an ad-hoc Quiz the formative project to implement.
The addressing phase does not have a weighing in the student’s evaluation process, so, there is
no evaluation tool assigned. Evidence is not assessable, it’s required. It is worth mentioning that the
technological tool used in this study is Google Workspace (formerly G Suite). This way, the virtual
learning platform of the UA is Classroom.
Google Classroom enables teachers to create an online classroom area in which they can manage
all the documents that their students need. Documents are stored on Google Drive and can be edited in
Drive’s apps, such as Google Docs, Sheets, and so on. But what separates Google Classroom from the
regular Google Drive experience is the teacher/student interface, which Google designed for the way
teachers and students think and work. Google Classroom sits between you and Google Drive and provides
a teacher/student-friendly way of managing classroom documents.
Here’s what you can do with Google Classroom:
Make assignments: The main thing you, as the teacher, will do with Google Classroom is making
homework assignments for your students. When you create an assignment, you can upload the
necessary documents for the students to read or work on. Students receive e-mail notification of
new assignment. The students “turn in” the assignments when finished, and you can then grade
the assignments.
Make announcements: If you have a quick announcement for the entire class, you can quickly
type in the announcement, which is e-mailed to all your students in the class.
Store classroom materials: The materials you add to an assignment aren’t the only documents you
can store. You can store any other necessary documents for students on Google Drive.
Allow students to interact: Students have the ability to comment on assignments and
announcements, as well as e-mail each other through the Classroom interface.
Phase 2. Planning
The planning phase is directly related to the group of processes Management of Integration of the Project
from the PMBOK Guide.
1. Develop the project’s certificate of incorporation: Is the process of developing a document that
formally authorizes the existence of the project and gives the director of the project the authority
to apply the organization’s resources to the project’s activities. The key benefits of this process
are that it provides a direct link between the project and the organization’s strategic objectives,
creates a formal register of the project and shows the organization’s commitment to the project.
2. Develop the plan for the addressing of the project: Is the process of defining, preparing and
coordinating all of the plan’s components and consolidate them in an integrative plan for the
addressing of the project.
The Project’s Certificate of Incorporation is a document issued by the project’s initiator or
sponsor, who formally authorizes the existence of a project and gives the director of the project the
authority to apply the organization’s resources to the project’s activities. It documents the high-level
information about the project and product, service or result that the project pretends to satisfy, such as:
The project’s purpose
The measurable objectives of the project and the associated success criteria
The high-level requirements
The high-level description of the project, the limits and the key deliverables
The project’s general risk

93
The accomplishment schedule’s summary
The pre-approved finantial resources
The key investors list
The project approval requirements (what does the project consist of who decides if the project is
successful and who signs the project’s approval)
The project’s release criteria (what conditions must be accomplished in order to close or cancel
the project of phase)
The assigned project director, its responsibility and authority level
The name and level of authority of the sponsor or whoever authorizes the project’s certificate of
incorporation.
At a high level, the project’s certificate of incorporation secures a common understanding by the
stakeholders of the key deliverables, the accomplishments, the roles and the responsibilities of everybody
involved in the project (PMBOK, 2017). The project’s certificate of incorporation was evaluated with a
rubric. On its behalf, according to the PMBOK Guide, the plan for the direction of the project defines
the way the project is executed, monitored, controlled and closed. The plan’s content for the direction of
the project varies in function of the area of application and the project’s complexity. The plan for the
project’s direction can be presented either summarized or detailed. Each plan component is described to
the level required for the specific project. The plan for the addressing of the project should be robust
enough to respond to the project’s always changing environment.
This agility can give place to more precise information as the project advances. The base lines of
the plan should be defined for the project’s addressing, meaning, it is necessary to define at least the
project’s reference in terms of extent, time and cost, that way the execution of the project can be measured
and compared with those references and the performance can be managed. Before defining the base lines,
the plan for the addressing of the project can be updated as many times as necessary. Any formal process
of any kind is not required in that moment. Nevertheless, once the base lines have been defined, the plan
for the addressing of the project can only be modified through the process “Realizar el Control Integrado
de Cambios”. Therefore, every time a change is requested, change forms will be generated and decided.
This results in a plan for the addressing of the project that is progressively elaborated through controlled
and approved updates that extent to the project’s closure.
Phase 3. Execution
In this phase the next processes are considered (PMBOK, 2017):
1. Monitor and control the project’s work: This is the process of following, revise and inform the
general advance in order to accomplish the pre-stablished performance objectives in the
addressing of the project.
2. Make the Integrated Change Control: It is the process of revising all the change requests, approve
and manage the changes for deliverables, actives of the organization’s processes, project
documents and the plan for the addressing of the project, as well as communicating the choices.
Phase 4. Socialization
In addition to considering the end of the Formative Project, this phase wraps the final evaluation,
meaning, the competences accomplishment for the learning unit. The only process in this phase,
according to the PMBOK Guide is:
1. Close the project or phase: Is the process of finishing all the activities for the project, phase or
contract.
4 Results
The results of the investigation were oriented towards:
Analyzing the results of the self-evaluation of the students according to the accomplishment of
the learning unit’s competences.
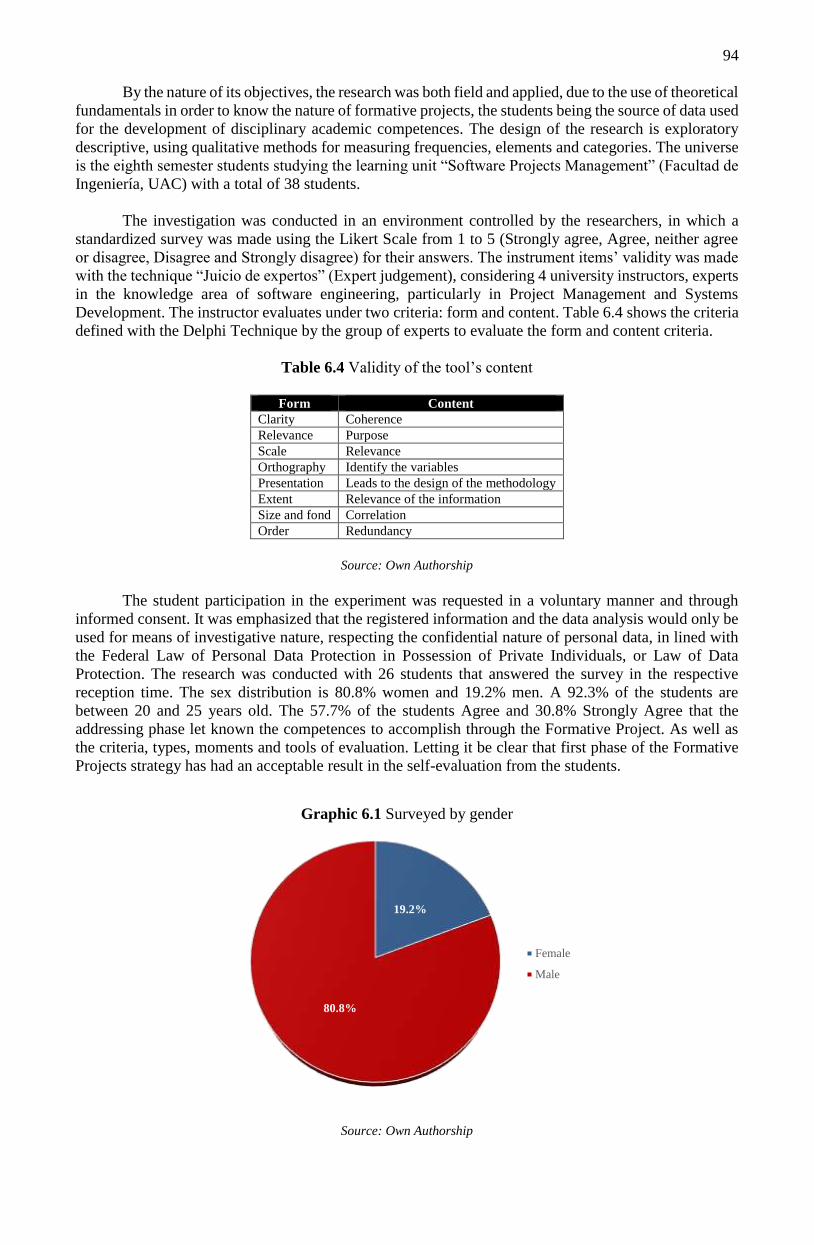
94
By the nature of its objectives, the research was both field and applied, due to the use of theoretical
fundamentals in order to know the nature of formative projects, the students being the source of data used
for the development of disciplinary academic competences. The design of the research is exploratory
descriptive, using qualitative methods for measuring frequencies, elements and categories. The universe
is the eighth semester students studying the learning unit “Software Projects Management” (Facultad de
Ingeniería, UAC) with a total of 38 students.
The investigation was conducted in an environment controlled by the researchers, in which a
standardized survey was made using the Likert Scale from 1 to 5 (Strongly agree, Agree, neither agree
or disagree, Disagree and Strongly disagree) for their answers. The instrument items’ validity was made
with the technique “Juicio de expertos” (Expert judgement), considering 4 university instructors, experts
in the knowledge area of software engineering, particularly in Project Management and Systems
Development. The instructor evaluates under two criteria: form and content. Table 6.4 shows the criteria
defined with the Delphi Technique by the group of experts to evaluate the form and content criteria.
Table 6.4 Validity of the tool’s content
Form Content
Clarity Coherence
Relevance Purpose
Scale Relevance
Orthography Identify the variables
Presentation Leads to the design of the methodology
Extent Relevance of the information
Size and fond Correlation
Order Redundancy
Source: Own Authorship
The student participation in the experiment was requested in a voluntary manner and through
informed consent. It was emphasized that the registered information and the data analysis would only be
used for means of investigative nature, respecting the confidential nature of personal data, in lined with
the Federal Law of Personal Data Protection in Possession of Private Individuals, or Law of Data
Protection. The research was conducted with 26 students that answered the survey in the respective
reception time. The sex distribution is 80.8% women and 19.2% men. A 92.3% of the students are
between 20 and 25 years old. The 57.7% of the students Agree and 30.8% Strongly Agree that the
addressing phase let known the competences to accomplish through the Formative Project. As well as
the criteria, types, moments and tools of evaluation. Letting it be clear that first phase of the Formative
Projects strategy has had an acceptable result in the self-evaluation from the students.
Graphic 6.1 Surveyed by gender
Source: Own Authorship
19.2%
80.8%
Female
Male
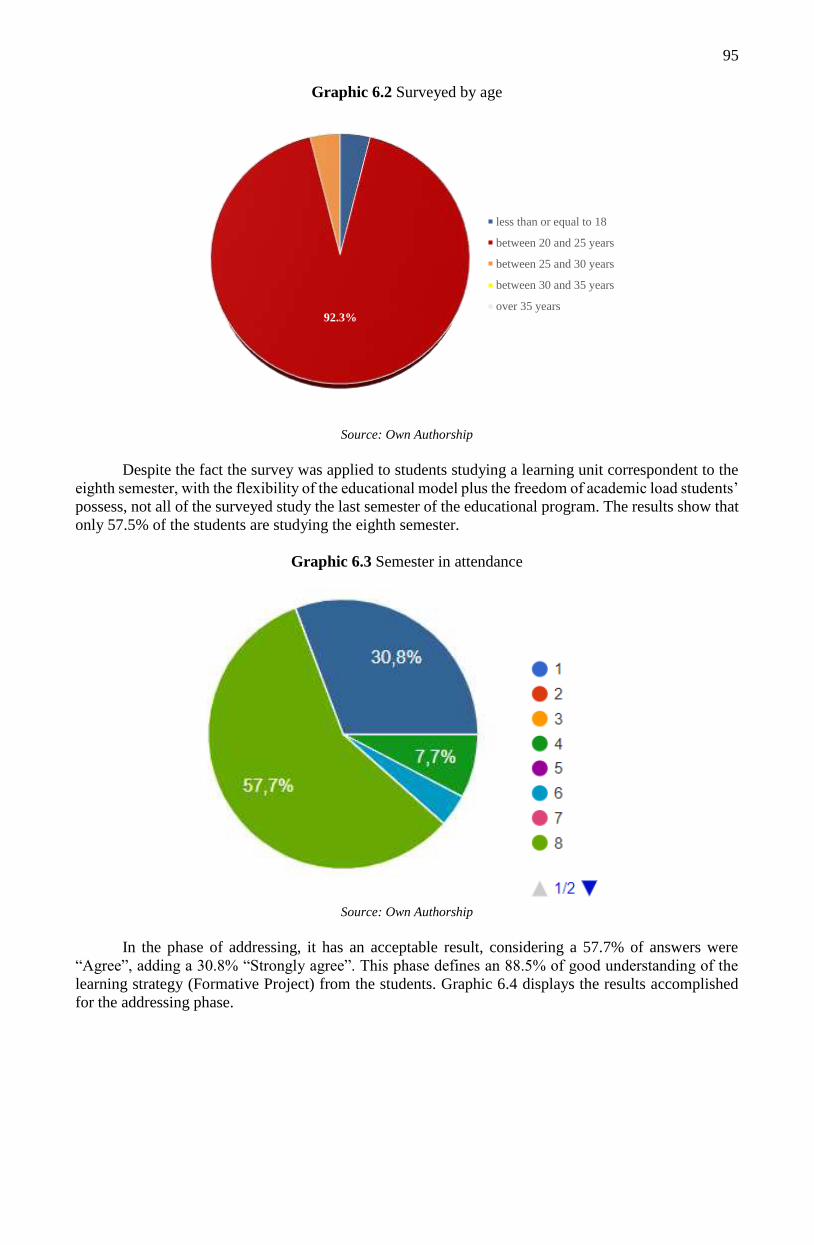
95
Graphic 6.2 Surveyed by age
Source: Own Authorship
Despite the fact the survey was applied to students studying a learning unit correspondent to the
eighth semester, with the flexibility of the educational model plus the freedom of academic load students’
possess, not all of the surveyed study the last semester of the educational program. The results show that
only 57.5% of the students are studying the eighth semester.
Graphic 6.3 Semester in attendance
Source: Own Authorship
In the phase of addressing, it has an acceptable result, considering a 57.7% of answers were
“Agree”, adding a 30.8% “Strongly agree”. This phase defines an 88.5% of good understanding of the
learning strategy (Formative Project) from the students. Graphic 6.4 displays the results accomplished
for the addressing phase.
3.9%
92.3%
3.9%0.0%0.0%
less than or equal to 18
between 20 and 25 years
between 25 and 30 years
between 30 and 35 years
over 35 years
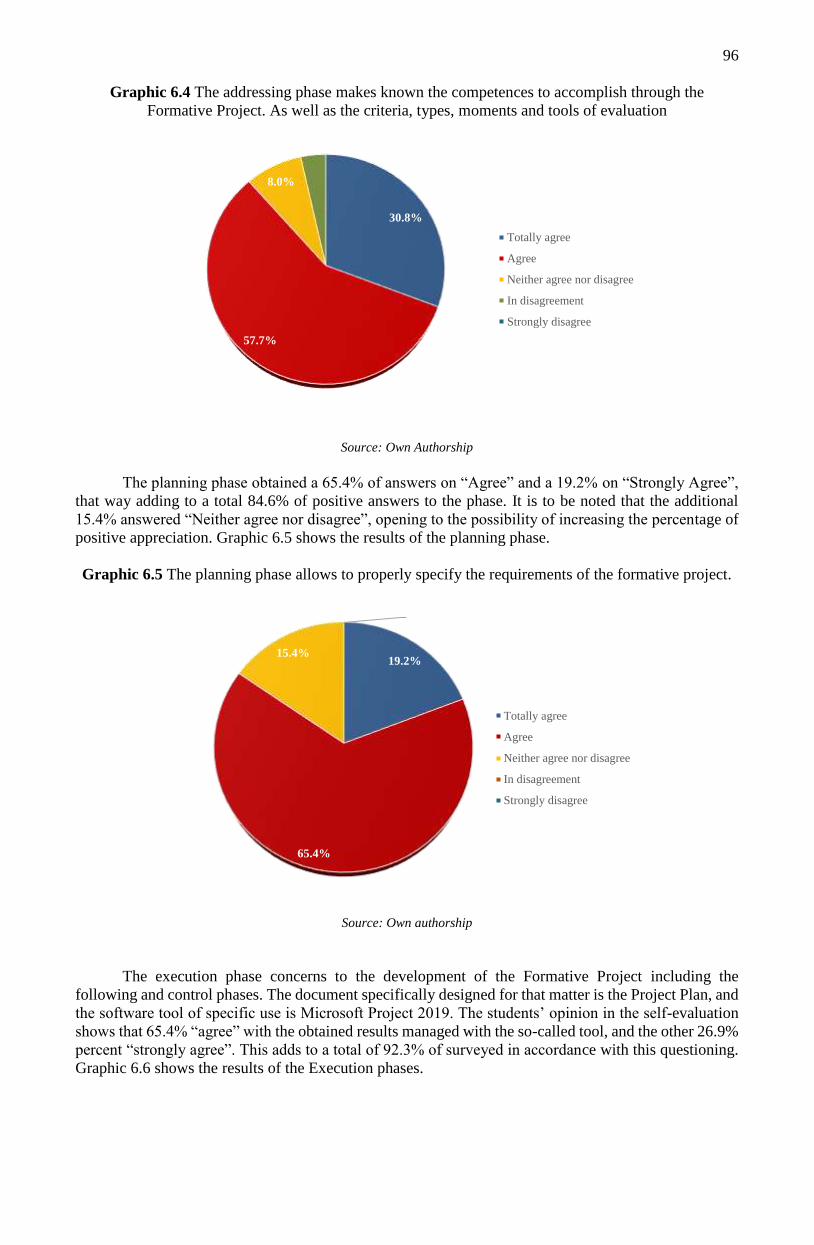
96
Graphic 6.4 The addressing phase makes known the competences to accomplish through the
Formative Project. As well as the criteria, types, moments and tools of evaluation
Source: Own Authorship
The planning phase obtained a 65.4% of answers on “Agree” and a 19.2% on “Strongly Agree”,
that way adding to a total 84.6% of positive answers to the phase. It is to be noted that the additional
15.4% answered “Neither agree nor disagree”, opening to the possibility of increasing the percentage of
positive appreciation. Graphic 6.5 shows the results of the planning phase.
Graphic 6.5 The planning phase allows to properly specify the requirements of the formative project.
Source: Own authorship
The execution phase concerns to the development of the Formative Project including the
following and control phases. The document specifically designed for that matter is the Project Plan, and
the software tool of specific use is Microsoft Project 2019. The students’ opinion in the self-evaluation
shows that 65.4% “agree” with the obtained results managed with the so-called tool, and the other 26.9%
percent “strongly agree”. This adds to a total of 92.3% of surveyed in accordance with this questioning.
Graphic 6.6 shows the results of the Execution phases.
30.8%
57.7%
8.0%
3.5% 0.0%
Totally agree
Agree
Neither agree nor disagree
In disagreement
Strongly disagree
19.2%
65.4%
15.4%
0.0% 0.0%
Totally agree
Agree
Neither agree nor disagree
In disagreement
Strongly disagree
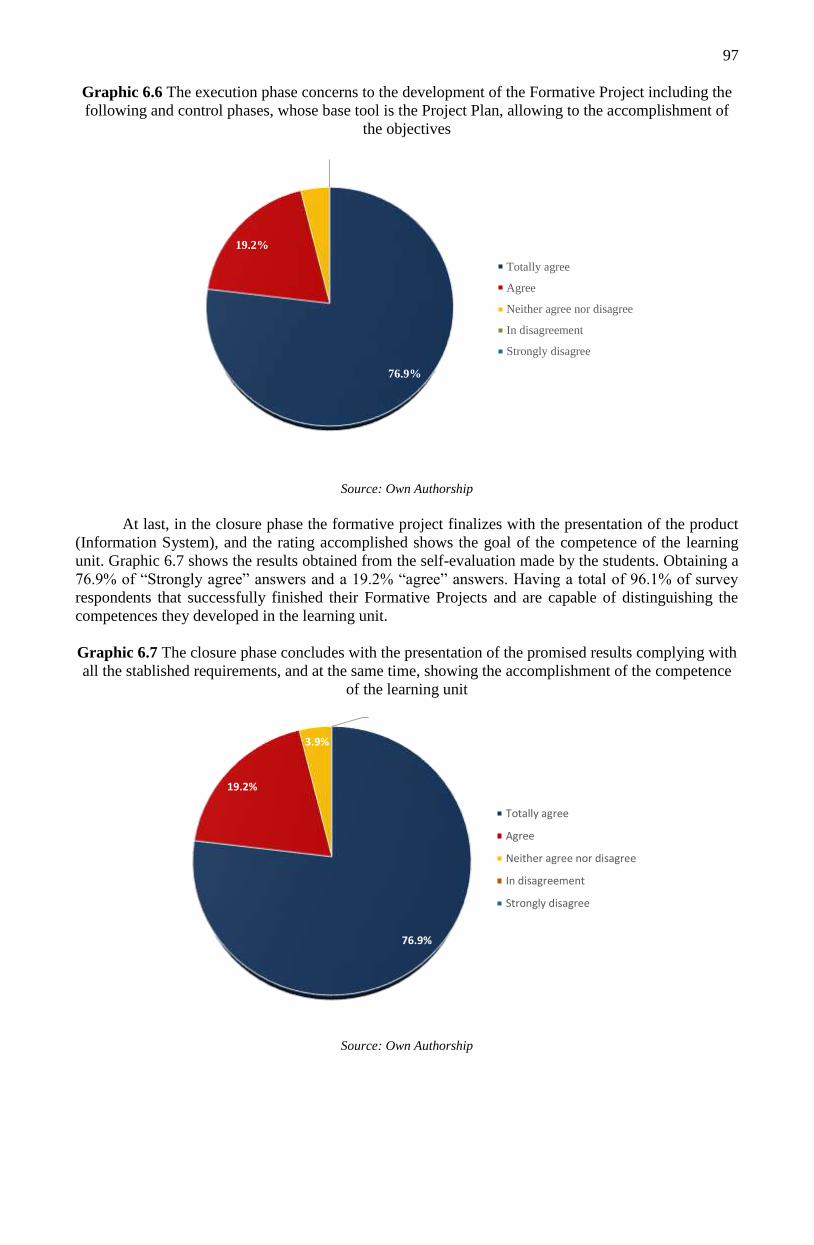
97
Graphic 6.6 The execution phase concerns to the development of the Formative Project including the
following and control phases, whose base tool is the Project Plan, allowing to the accomplishment of
the objectives
Source: Own Authorship
At last, in the closure phase the formative project finalizes with the presentation of the product
(Information System), and the rating accomplished shows the goal of the competence of the learning
unit. Graphic 6.7 shows the results obtained from the self-evaluation made by the students. Obtaining a
76.9% of “Strongly agree” answers and a 19.2% “agree” answers. Having a total of 96.1% of survey
respondents that successfully finished their Formative Projects and are capable of distinguishing the
competences they developed in the learning unit.
Graphic 6.7 The closure phase concludes with the presentation of the promised results complying with
all the stablished requirements, and at the same time, showing the accomplishment of the competence
of the learning unit
Source: Own Authorship
76.9%
19.2%
3.9%
0.0%
0.0%
Totally agree
Agree
Neither agree nor disagree
In disagreement
Strongly disagree
76.9%
19.2%
3.9%
0.0% 0.0%
Totally agree
Agree
Neither agree nor disagree
In disagreement
Strongly disagree
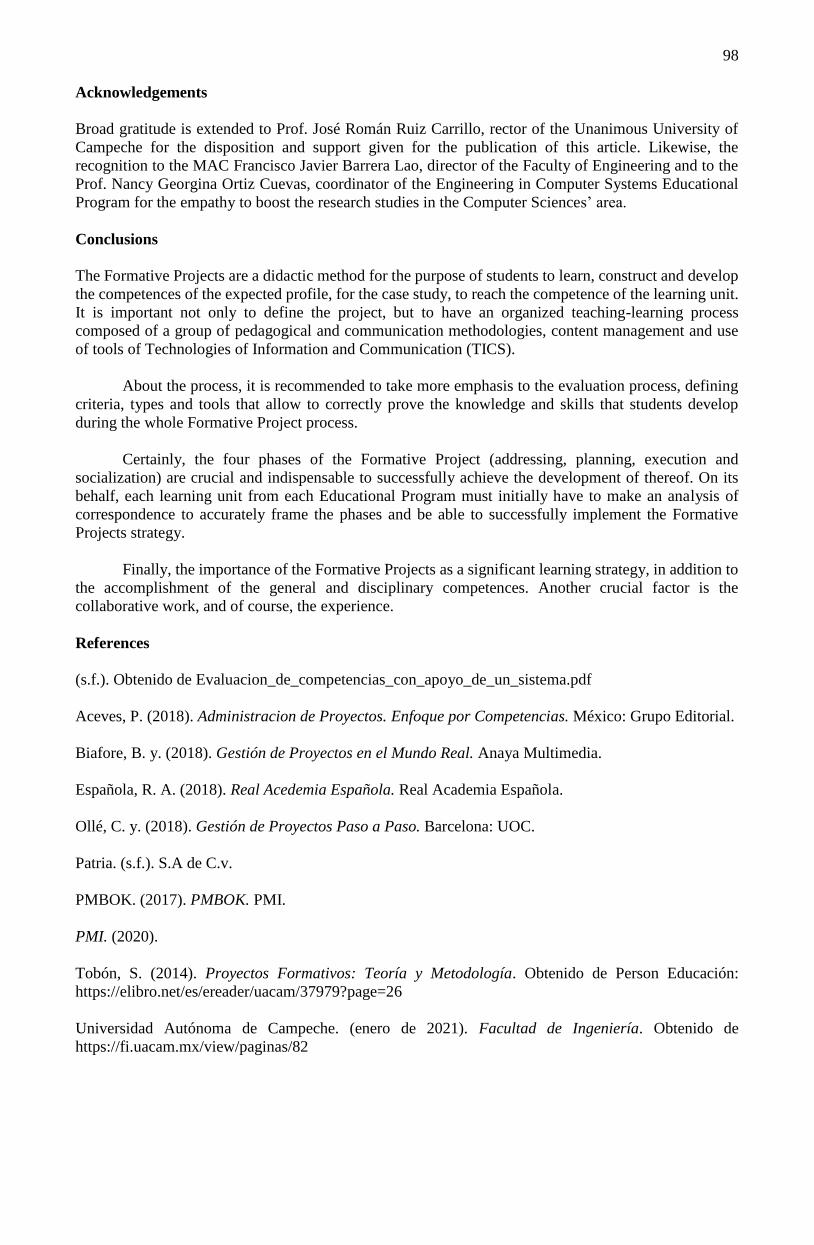
98
Acknowledgements
Broad gratitude is extended to Prof. José Román Ruiz Carrillo, rector of the Unanimous University of
Campeche for the disposition and support given for the publication of this article. Likewise, the
recognition to the MAC Francisco Javier Barrera Lao, director of the Faculty of Engineering and to the
Prof. Nancy Georgina Ortiz Cuevas, coordinator of the Engineering in Computer Systems Educational
Program for the empathy to boost the research studies in the Computer Sciences’ area.
Conclusions
The Formative Projects are a didactic method for the purpose of students to learn, construct and develop
the competences of the expected profile, for the case study, to reach the competence of the learning unit.
It is important not only to define the project, but to have an organized teaching-learning process
composed of a group of pedagogical and communication methodologies, content management and use
of tools of Technologies of Information and Communication (TICS).
About the process, it is recommended to take more emphasis to the evaluation process, defining
criteria, types and tools that allow to correctly prove the knowledge and skills that students develop
during the whole Formative Project process.
Certainly, the four phases of the Formative Project (addressing, planning, execution and
socialization) are crucial and indispensable to successfully achieve the development of thereof. On its
behalf, each learning unit from each Educational Program must initially have to make an analysis of
correspondence to accurately frame the phases and be able to successfully implement the Formative
Projects strategy.
Finally, the importance of the Formative Projects as a significant learning strategy, in addition to
the accomplishment of the general and disciplinary competences. Another crucial factor is the
collaborative work, and of course, the experience.
References
(s.f.). Obtenido de Evaluacion_de_competencias_con_apoyo_de_un_sistema.pdf
Aceves, P. (2018). Administracion de Proyectos. Enfoque por Competencias. México: Grupo Editorial.
Biafore, B. y. (2018). Gestión de Proyectos en el Mundo Real. Anaya Multimedia.
Española, R. A. (2018). Real Acedemia Española. Real Academia Española.
Ollé, C. y. (2018). Gestión de Proyectos Paso a Paso. Barcelona: UOC.
Patria. (s.f.). S.A de C.v.
PMBOK. (2017). PMBOK. PMI.
PMI. (2020).
Tobón, S. (2014). Proyectos Formativos: Teoría y Metodología. Obtenido de Person Educación:
https://elibro.net/es/ereader/uacam/37979?page=26
Universidad Autónoma de Campeche. (enero de 2021). Facultad de Ingeniería. Obtenido de
https://fi.uacam.mx/view/paginas/82
99
Chapter 7 Remediation of soils contaminated by hydrocarbons using a polymeric
material (carboxymethylcellulose gel)
Capítulo 7 Remediación de suelos contaminados por hidrocarburos mediante un
material polimérico (gel de carboximetilcelulosa)
ANTONIO-CRUZ, Rocío†*, PURATA-PÉREZ, Nora Alicia, VÁZQUEZ-GONZÁLEZ, María Berzabé
and TREJO-VALENCIA, Radamés
Tecnológico Nacional de México campus Villahermosa, Chemical, Biochemical and Environmental
Engineering Department. Carr. Villahermosa-Frontera km 3.5 Cd Industrial, Villahermosa, Tabasco,
México. C.P. 86010.
Tecnológico Nacional de México campus Minatitlán, Department of Chemical and Environmental
Engineering. Blvd. Institutos Tecnológicos S/N Col. Buena Vista Norte, Minatitlán, Veracruz, México.
C.P. 96848
ID 1st Author: Rocío, Antonio-Cruz / ORC ID: 0000-0003-3638-5152, CVU CONACYT: 25705
ID 1st Co-author: Nora Alicia, Purata-Pérez / ORC ID: 0000-0002-6823-6912, CVU CONACYT ID:
328771
ID 2nd Co-author: María Berzabé, Vázquez-González / ORC ID: 0000-003-2814-8819, CVU
CONACYT ID: 774648
ID 3rd Co-author: Radamés, Trejo-Valencia / ORC ID: 0000-0002-3046-4872, CVU CONACYT ID:
721964
DOI: 10.35429/H.2021.6.99.111
R. Antonio, N. Purata, M. Vázquez and R. Trejo
A. Marroquín, J. Olivares, M. Ramírez and L. Cruz (Coord) Engineering and Technology. Handbooks-©ECORFAN-México,
Querétaro, 2021.
100
Abstract
In recent years, the pollution caused by hydrocarbon spills has increased, and this leads to research to
mitigate the deterioration caused to the environment, therefore, this work has the purpose of remedying
a contaminated soil due to the explosion of the Well Terra 123 of Mexican Oil (PEMEX) occurred in
October 2013, which left in its wake contamination, death of animals and diseases in the population,
causing both environmental and health effects on the inhabitants of the region such as vitiligo, problems
vision, throat, cough and flu (Reporte Indigo, 2019). The studies carried out by Duran in 2015 on
"Environmental impact on the indigenous communities of Nacajuca, Tabasco, due to the explosion of
the Well Terra 123", gathered evidence of the impact that this oil accident had on the health of those
close to it to the facilities and the environment. This chapter will deal with the remediation of soil
contaminated by hydrocarbons due to the explosion of the Terra 123 Well, using a polymeric material
(carboxymethylcellulose gel), which was synthesized at the laboratory level using
carboxymethylcellulose (CMC), glutaraldehyde (GA) as agent of crosslinking and hydrochloric acid
(HCl) as a catalyst for synthesis. The CMC gel was incorporated into the contaminated soil for the
absorption of the hydrocarbon for a period of three months. The samples were collected from the soil
contaminated with hydrocarbon from Terra 123 well, located in Oxiacaque, Nacajuca, Tabasco, and the
effectiveness was studied in two stages: (1) The soil particle was decreased by sieving and (2) Pre and
post soil analyzes were carried out (moisture percentage and fat content). In addition, the CMC gels were
analyzed using infrared spectroscopy (FTIR) and scanning electron microscopy (SEM) techniques before
and after being incorporated into the contaminated soil. The amount of hydrocarbon initially contained
in the soil was made using the Soxhlet method, obtaining 0.99 mg of hydrocarbon / kg of soil.
Remediation, Gel, Carboxymethylcellulose, Hydrocarbons, Polymers
Resumen
En los últimos años se ha incrementado la contaminación provocado por derrames de hidrocarburos, y
esto conlleva a realizar investigaciones que permitan mitigar el deterioro provocado al medio ambiente,
por lo tanto, este trabajo tiene la finalidad de remediar un suelo contaminado debido a la explosión del
Pozo Terra 123 de Petróleos Mexicanos (PEMEX) ocurrido en el mes de octubre del año 2013, lo cual
dejó a su paso contaminación, muerte de animales y enfermedades en la población, provocando
afectaciones tanto ambientales como de salud en los pobladores de la región como vitíligo, problemas de
visión, de garganta, tos y gripa (Reporte Indigo, 2019). Los estudios realizados por Duran en el 2015 de
“Impacto ambiental en las comunidades indígenas de Nacajuca, Tabasco, a causa de la explosión del
Pozo Terra 123”, acudieron a recoger evidencias del impacto que tuvo este accidente petrolero en la salud
de las personas cercanas a las instalaciones y en el medio ambiente. El presente capítulo tratará sobre la
remediación del suelo contaminado por hidrocarburos debido a la explosión del Pozo Terra 123,
empleando un material polimérico (gel de carboximetilcelulosa), el cual se sintetizó a nivel laboratorio
utilizando carboximetilcelulosa (CMC), glutaraldehído (GA) como agente de entrecruzamiento y ácido
clorhídrico (HCl) como catalizador de la síntesis. El gel de CMC se incorporó al suelo contaminado para
la absorción del hidrocarburo por un periodo de tres meses. Las muestras fueron recolectadas del suelo
contaminado con hidrocarburo proveniente del pozo Terra 123, ubicado en el ejido Oxiacaque, municipio
de Nacajuca, Tabasco y, se estudió la efectividad en dos etapas: (1) Se disminuyó la partícula de suelo
mediante tamizado y (2) Se realizaron análisis previos y posteriores al suelo (porcentaje de humedad y
contenido de grasa). Además, los geles de CMC se analizaron mediante las técnicas de espectroscopia
de infrarrojo (FTIR) y microscopia electrónica de barrido (SEM) antes y después de ser incorporados al
suelo contaminado. La cantidad de hidrocarburo que contenía inicialmente el suelo se realizó mediante
el método Soxhlet, obteniendo 0.99 mg de hidrocarburo/kg de suelo.
Remediación, Gel, Carboximetilcelulosa, Hidrocarburos, Polímeros
1 Introduction
The petrochemical industry in Mexico has developed rapidly, generating diverse economic benefits.
However, its expansion and development has also given rise to serious environmental problems, resulting
in environmental emergencies, with serious repercussions on the health of the population and the
ecological balance of ecosystems (Quadri 1994).
101
Among the causes that have generated this environmental deterioration due to the contamination
of water bodies and soils throughout the country are the following: (i) improper handling and
abandonment of hazardous materials and waste; (ii) inadequate maintenance or lack thereof in oil
facilities; (iii) explosions in high-risk facilities; (iv) leaks in pipelines; and (v) hydrocarbon spills
(CENAPRED 2001, PROFEPA 2002).
In PEMEX's final inventory of hazardous waste, with a total of 19.6 thousand tons at the end of
2020 (SISPA, 2021), the inventory increased 16% over 2019. During 2020, 56 thousand tons were
generated and 53.2 thousand tons were disposed of, resulting in a disposal to generation ratio of 0.95.
Pemex Transformación Industrial's activities account for 76% of the hazardous waste inventory, where
45% corresponds to oily sludge, 14% to solid waste impregnated with hydrocarbons, 13% to spent soda
and the rest to others (laboratory, sewage treatment sludge, etc.).
On the other hand, the total number of leaks and spills in Pemex in 2020 was 931 events (not
including those due to clandestine outlets), with respect to 2019, showing a 15% decrease, mainly due to
a reduction in the number of events presented in Pemex Logística and Pemex Exploración y Producción
(PEP). Of these events, 77% correspond to PEP, 13% to Pemex Logística, 8% to Pemex TRI
(Transformación Industrial) and 2% to PMI (Comercio Internacional, S.A. de C.V.).
Among the most serious environmental disasters that threaten biodiversity are oil spills, and it is
estimated that 3,800 million liters enter the oceans each year as a result of human activities. Of these,
only 8 percent are due to natural sources; at least 22 percent to intentional operational discharges from
ships, 12 percent to spills from ships, and another 36 percent to sewage discharges (Suchanek, 1993).
In a biodiversity report in 2006, it published that in 2002, Mexico spilled 160 barrels of
hydrocarbons, thus increasing the area of contaminated soil. On the other hand, the Procuraduría de
Protección al Ambiente (PROFEPA, 2016), published that, in the state of Tabasco, only in the last 11
years, a total of 385 oil spills have been registered.
Garcia et al. in 2010, conducted a study on the removal of polycyclic aromatic hydrocarbons
(PAH) and total petroleum hydrocarbons (TPH) in a soil contaminated with crude oil, using two types of
agro-industrial residues, cachaza and sugarcane bagasse as amendments and texturizers, where cachaza
was highly effective for the removal of PAH and TPH hydrocarbons, obtaining similar results with
sugarcane bagasse. On the other hand, the cachaza, besides obtaining good results in the repair, has as an
additional advantage the contribution of microorganisms to the soil, which have the capacity to bio-
transform the toxics and provide nutrients in higher concentration.
At the Instituto Tecnológico de Durango in 2011, the evaluation of the aerobic bioremediation
process of a soil contaminated with petroleum hydrocarbons using residual sludge (biosolids) from a
domestic wastewater treatment plant (WWTP) as an alternative source of macro and micronutrients was
carried out, which resulted in the conclusion that sewage sludge is a viable alternative for the removal of
petroleum hydrocarbons, in addition to being an alternative source of nutrients, also mentioning that the
mineralization or maturity of the sludge influenced the rate of hydrocarbon removal (Martínez et al.
2011).
Ordaz et al. in 2011 conducted bioremediation tests at the microcosm level on a clay soil
contaminated with crude oil, with different concentrations of total petroleum hydrocarbons (TPH) and
used sugarcane bagasse as a texturizer and amendment, being sugarcane bagasse a profitable alternative
for the development of microcosms, in addition to being effective in the removal of TPH.
By obtaining favorable results with these types of techniques, in Peru in 2013, the Soil Fertility
Laboratory of the National Agrarian University La Molina, conducted a bioassay experiment where
manure and sawdust were used, having as substrate the "corn" indicator plant (Zea mays L. ), for the
elimination of total petroleum hydrocarbons, obtaining as a result that the greatest reduction in the
concentration of petroleum hydrocarbons was obtained with the use of manure; however, with the use of
sawdust there is also a reduction in the concentration, but in smaller quantities (Buendía, 2013).
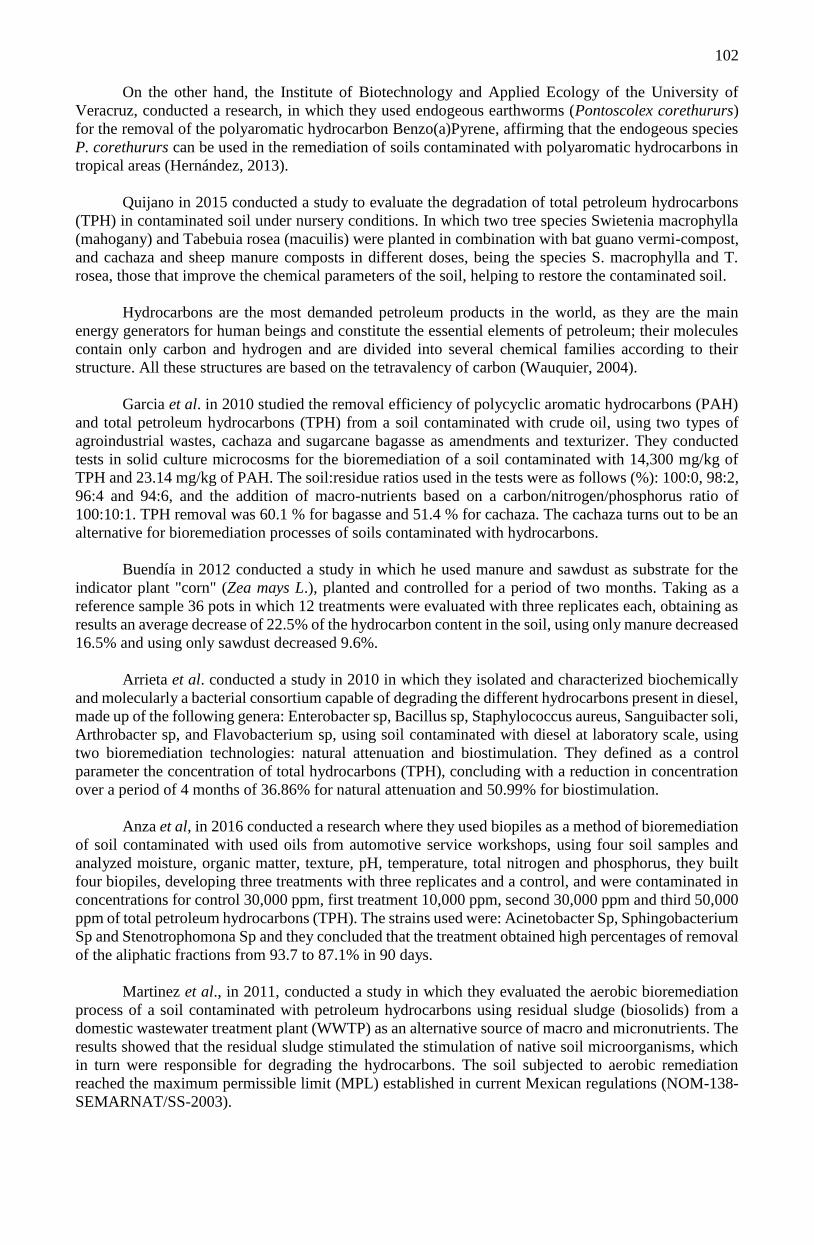
102
On the other hand, the Institute of Biotechnology and Applied Ecology of the University of
Veracruz, conducted a research, in which they used endogeous earthworms (Pontoscolex corethururs)
for the removal of the polyaromatic hydrocarbon Benzo(a)Pyrene, affirming that the endogeous species
P. corethururs can be used in the remediation of soils contaminated with polyaromatic hydrocarbons in
tropical areas (Hernández, 2013).
Quijano in 2015 conducted a study to evaluate the degradation of total petroleum hydrocarbons
(TPH) in contaminated soil under nursery conditions. In which two tree species Swietenia macrophylla
(mahogany) and Tabebuia rosea (macuilis) were planted in combination with bat guano vermi-compost,
and cachaza and sheep manure composts in different doses, being the species S. macrophylla and T.
rosea, those that improve the chemical parameters of the soil, helping to restore the contaminated soil.
Hydrocarbons are the most demanded petroleum products in the world, as they are the main
energy generators for human beings and constitute the essential elements of petroleum; their molecules
contain only carbon and hydrogen and are divided into several chemical families according to their
structure. All these structures are based on the tetravalency of carbon (Wauquier, 2004).
Garcia et al. in 2010 studied the removal efficiency of polycyclic aromatic hydrocarbons (PAH)
and total petroleum hydrocarbons (TPH) from a soil contaminated with crude oil, using two types of
agroindustrial wastes, cachaza and sugarcane bagasse as amendments and texturizer. They conducted
tests in solid culture microcosms for the bioremediation of a soil contaminated with 14,300 mg/kg of
TPH and 23.14 mg/kg of PAH. The soil:residue ratios used in the tests were as follows (%): 100:0, 98:2,
96:4 and 94:6, and the addition of macro-nutrients based on a carbon/nitrogen/phosphorus ratio of
100:10:1. TPH removal was 60.1 % for bagasse and 51.4 % for cachaza. The cachaza turns out to be an
alternative for bioremediation processes of soils contaminated with hydrocarbons.
Buendía in 2012 conducted a study in which he used manure and sawdust as substrate for the
indicator plant "corn" (Zea mays L.), planted and controlled for a period of two months. Taking as a
reference sample 36 pots in which 12 treatments were evaluated with three replicates each, obtaining as
results an average decrease of 22.5% of the hydrocarbon content in the soil, using only manure decreased
16.5% and using only sawdust decreased 9.6%.
Arrieta et al. conducted a study in 2010 in which they isolated and characterized biochemically
and molecularly a bacterial consortium capable of degrading the different hydrocarbons present in diesel,
made up of the following genera: Enterobacter sp, Bacillus sp, Staphylococcus aureus, Sanguibacter soli,
Arthrobacter sp, and Flavobacterium sp, using soil contaminated with diesel at laboratory scale, using
two bioremediation technologies: natural attenuation and biostimulation. They defined as a control
parameter the concentration of total hydrocarbons (TPH), concluding with a reduction in concentration
over a period of 4 months of 36.86% for natural attenuation and 50.99% for biostimulation.
Anza et al, in 2016 conducted a research where they used biopiles as a method of bioremediation
of soil contaminated with used oils from automotive service workshops, using four soil samples and
analyzed moisture, organic matter, texture, pH, temperature, total nitrogen and phosphorus, they built
four biopiles, developing three treatments with three replicates and a control, and were contaminated in
concentrations for control 30,000 ppm, first treatment 10,000 ppm, second 30,000 ppm and third 50,000
ppm of total petroleum hydrocarbons (TPH). The strains used were: Acinetobacter Sp, Sphingobacterium
Sp and Stenotrophomona Sp and they concluded that the treatment obtained high percentages of removal
of the aliphatic fractions from 93.7 to 87.1% in 90 days.
Martinez et al., in 2011, conducted a study in which they evaluated the aerobic bioremediation
process of a soil contaminated with petroleum hydrocarbons using residual sludge (biosolids) from a
domestic wastewater treatment plant (WWTP) as an alternative source of macro and micronutrients. The
results showed that the residual sludge stimulated the stimulation of native soil microorganisms, which
in turn were responsible for degrading the hydrocarbons. The soil subjected to aerobic remediation
reached the maximum permissible limit (MPL) established in current Mexican regulations (NOM-138-
SEMARNAT/SS-2003).
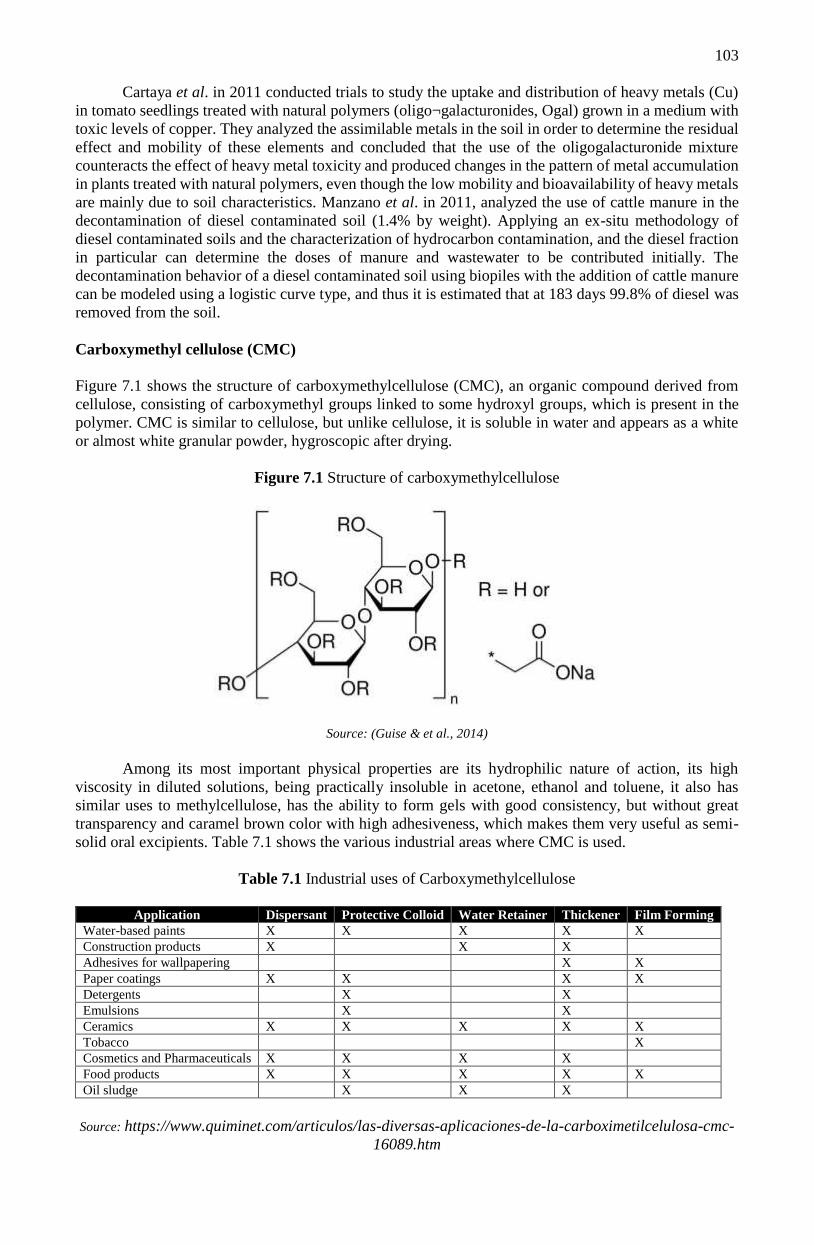
103
Cartaya et al. in 2011 conducted trials to study the uptake and distribution of heavy metals (Cu)
in tomato seedlings treated with natural polymers (oligo¬galacturonides, Ogal) grown in a medium with
toxic levels of copper. They analyzed the assimilable metals in the soil in order to determine the residual
effect and mobility of these elements and concluded that the use of the oligogalacturonide mixture
counteracts the effect of heavy metal toxicity and produced changes in the pattern of metal accumulation
in plants treated with natural polymers, even though the low mobility and bioavailability of heavy metals
are mainly due to soil characteristics. Manzano et al. in 2011, analyzed the use of cattle manure in the
decontamination of diesel contaminated soil (1.4% by weight). Applying an ex-situ methodology of
diesel contaminated soils and the characterization of hydrocarbon contamination, and the diesel fraction
in particular can determine the doses of manure and wastewater to be contributed initially. The
decontamination behavior of a diesel contaminated soil using biopiles with the addition of cattle manure
can be modeled using a logistic curve type, and thus it is estimated that at 183 days 99.8% of diesel was
removed from the soil.
Carboxymethyl cellulose (CMC)
Figure 7.1 shows the structure of carboxymethylcellulose (CMC), an organic compound derived from
cellulose, consisting of carboxymethyl groups linked to some hydroxyl groups, which is present in the
polymer. CMC is similar to cellulose, but unlike cellulose, it is soluble in water and appears as a white
or almost white granular powder, hygroscopic after drying.
Figure 7.1 Structure of carboxymethylcellulose
Source: (Guise & et al., 2014)
Among its most important physical properties are its hydrophilic nature of action, its high
viscosity in diluted solutions, being practically insoluble in acetone, ethanol and toluene, it also has
similar uses to methylcellulose, has the ability to form gels with good consistency, but without great
transparency and caramel brown color with high adhesiveness, which makes them very useful as semi-
solid oral excipients. Table 7.1 shows the various industrial areas where CMC is used.
Table 7.1 Industrial uses of Carboxymethylcellulose
Application Dispersant Protective Colloid Water Retainer Thickener Film Forming
Water-based paints X X X X X
Construction products X X X
Adhesives for wallpapering X X
Paper coatings X X X X
Detergents X X
Emulsions X X
Ceramics X X X X X
Tobacco X
Cosmetics and Pharmaceuticals X X X X
Food products X X X X X
Oil sludge X X X
Source: https://www.quiminet.com/articulos/las-diversas-aplicaciones-de-la-carboximetilcelulosa-cmc-
16089.htm
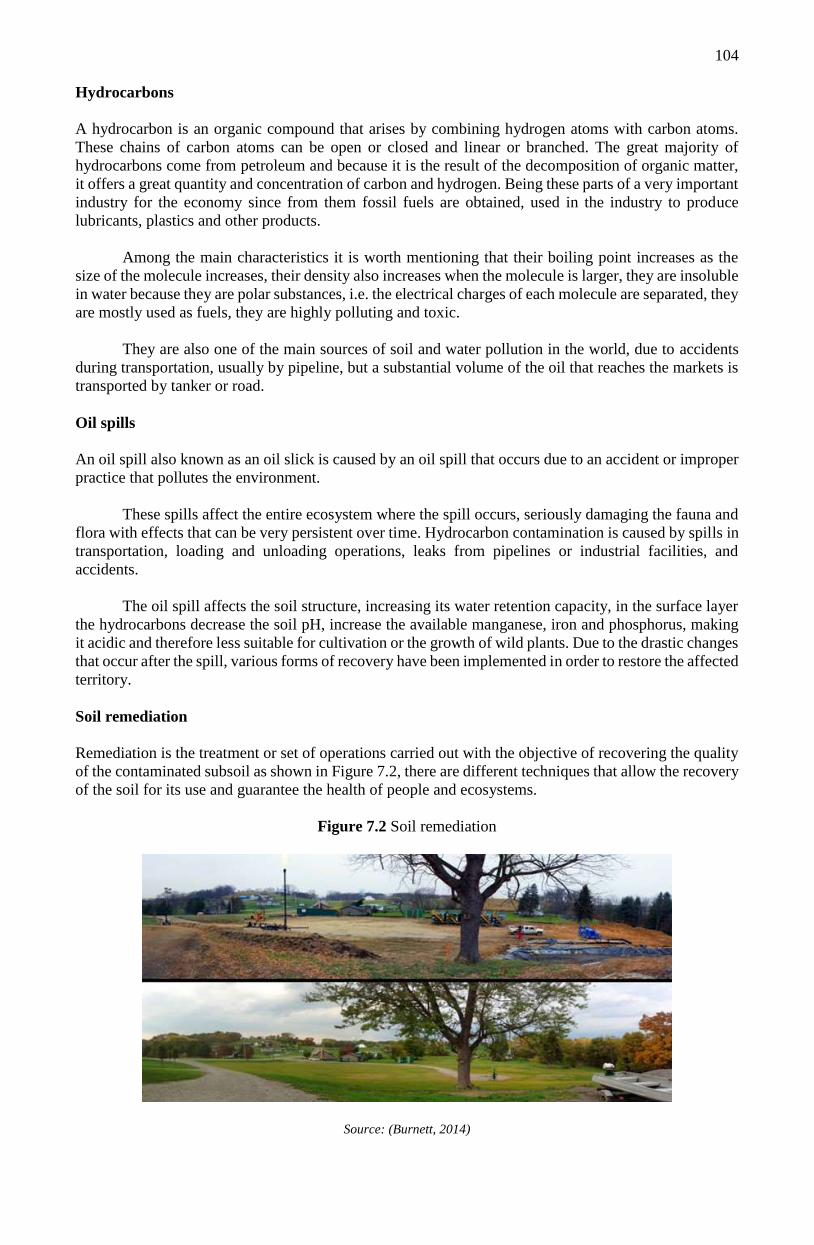
104
Hydrocarbons
A hydrocarbon is an organic compound that arises by combining hydrogen atoms with carbon atoms.
These chains of carbon atoms can be open or closed and linear or branched. The great majority of
hydrocarbons come from petroleum and because it is the result of the decomposition of organic matter,
it offers a great quantity and concentration of carbon and hydrogen. Being these parts of a very important
industry for the economy since from them fossil fuels are obtained, used in the industry to produce
lubricants, plastics and other products.
Among the main characteristics it is worth mentioning that their boiling point increases as the
size of the molecule increases, their density also increases when the molecule is larger, they are insoluble
in water because they are polar substances, i.e. the electrical charges of each molecule are separated, they
are mostly used as fuels, they are highly polluting and toxic.
They are also one of the main sources of soil and water pollution in the world, due to accidents
during transportation, usually by pipeline, but a substantial volume of the oil that reaches the markets is
transported by tanker or road.
Oil spills
An oil spill also known as an oil slick is caused by an oil spill that occurs due to an accident or improper
practice that pollutes the environment.
These spills affect the entire ecosystem where the spill occurs, seriously damaging the fauna and
flora with effects that can be very persistent over time. Hydrocarbon contamination is caused by spills in
transportation, loading and unloading operations, leaks from pipelines or industrial facilities, and
accidents.
The oil spill affects the soil structure, increasing its water retention capacity, in the surface layer
the hydrocarbons decrease the soil pH, increase the available manganese, iron and phosphorus, making
it acidic and therefore less suitable for cultivation or the growth of wild plants. Due to the drastic changes
that occur after the spill, various forms of recovery have been implemented in order to restore the affected
territory.
Soil remediation
Remediation is the treatment or set of operations carried out with the objective of recovering the quality
of the contaminated subsoil as shown in Figure 7.2, there are different techniques that allow the recovery
of the soil for its use and guarantee the health of people and ecosystems.
Figure 7.2 Soil remediation
Source: (Burnett, 2014)
105
Remediation techniques are applied depending on the type of pollutant. Treatment systems can
be classified into three main areas.
1. Non-recovery, for which the properties of the soil must be modified and the affected space must
be perfectly delimited, in addition to monitoring to ensure the impossibility of affecting third
parties.
2. Isolation of contamination, consists of establishing correct safety measures to prevent the
progression of contamination and mitigating the adverse effects related to the dispersion of
contaminating substances.
3. Remediation, remediation measures are divided into in situ treatment, which involves the removal
of contaminants without removing the soil, and ex situ where the material to be treated is taken
to a confined space or treated in appropriate facilities.
Gels
A gel is a material made from cross-linked polymers in the form of a network, hydrophilic in nature, i.e.
it has the capacity to absorb liquids. They can be classified into two types, depending on the nature of
the junctions of the three-dimensional network that constitute them.
1. Chemical gels: These are those in which the network is formed through covalent bonds. This type
of bond is very strong and its rupture leads to the degradation of the gel.
2. Physical gels: They present a three-dimensional network formed by bonds that are not completely
stable. Generally, the bonds are of the Van der Waals type, much weaker than covalent bonds.
The objective of this chapter is to calculate the maximum amount of hydrocarbon absorption by
means of a polymeric material (carboxymethylcellulose gel) for the remediation of a contaminated soil
due to the explosion of PEMEX's Terra 123 well, performing several analyses (maximum swelling
percentage, amount of hydrocarbon removed, pH, conductivity, etc.), where the results will constitute a
basis for the remediation of hydrocarbon-contaminated soils.
In addition, it will contribute to and, if necessary, solve different national problems identified by
the National Council of Science and Technology (CONACYT), among the areas related to PRONACES
that affect the social welfare, sustainability and economic and cultural development of Mexico, among
which the following stand out:
1. Social-ecological systems and sustainability.
2. Toxic agents and polluting processes.
3. Risk and disaster prevention
4. Sustainable cities
5. Sustainable, safe, culturally and environmentally relevant housing
2 Methodology
Sampling área
The sampling area was in the town of Oxiacaque in the municipality of Nacajuca, Tabasco in the facilities
of the Terra 123 well of Petróleos Mexicanos (PEMEX), where an explosion occurred in one of the
pipelines, affecting 120 by 160 m2 of industrial land, as well as surrounding areas (agricultural land) as
a result of the spill of crude oil (PROFEPA, 2015).
Soil sampling
Samples were taken in accordance with the guidelines of the NOM-021-SEMARNAT-2000 standard
"Establishing specifications for fertility, salinity and soil classification, study, sampling and analysis",
selecting two points. Samples were taken with a shovel at a depth of 50 cm and placed in transparent
plastic bags for transport to the laboratory. The samples were dried in the sun for 12 hours, after which
time they were crushed using a mortar with a pestle to reduce the particle diameter of the sample and
then sieved to obtain uniform particles of approximately 2 mm in diameter, in order to carry out the
pertinent analyses.
106
Moisture determination
For moisture content determination, 2 g of sieved soil was placed in an aluminum container and placed
in the Labrem Thermobalaza for 10 minutes for analysis.
Determination of the amount of hydrocarbons
Two g of dry and sieved contaminated soil were weighed and placed in a 100 ml volumetric flask, this
was done in triplicate and the flasks were placed inside an extraction hood, then 25 ml of ethylene
tetrachloride was added and the flasks were volumetrized with distilled water, finally they were left to
stand for a period of 48 hours. After this time, the substrates were filtered using a cone-shaped Whatman
filter over a beaker to obtain the samples and were analyzed five times to obtain absorbance records and
calculate the hydrocarbon content present in the contaminated soil with the INFRACAL equipment using
the EPA method (Infrared Spectrometry).
Determination of the amount of fats (Soxhlet)
This analysis was carried out according to the standard, using a 250 ml flat bottom flask and 90 ml of
hexane was added. A homogeneous mixture of 10 g of sieved contaminated soil sample and 10 g of
sodium sulfate was introduced into the cellulose capsule and placed in the cornet of the Soxhlet
equipment. Subsequently, the Soxhlet equipment was correctly installed and a temperature of 75°C was
set for a period of 8 hours, until the sample performed 6 cycles. At the end of the process, the flask was
removed and placed in an oven at 60°C for 45 min to remove the remaining steam, after which time it
was placed in a desiccator until a constant weight was obtained.
Synthesis of carboxymethyl cellulose (CMC) gel:
In a glass batch reactor with a capacity of 500 ml, 10 g of CMC and distilled water were added until
obtaining a 5% solution in weight and it was stirred for a period of 1 hour with constant agitation at 80°C
in an electric grill with agitation and controlled temperature, once the solution was diluted, 4 ml of
glutaraldehyde was added as crosslinking agent and 4 ml of hydrochloric acid as catalyst, and it was
maintained in constant agitation at 80°C during a reaction time of 2 h. After that time, the mixture was
placed in molds and dried in an oven maintaining a slow drying at a temperature of 60°C for 48 h, to
obtain the CMC gel film. Finally, the films were removed from the molds for use in the remediation
treatment of hydrocarbon-contaminated soils.
Fourier Transform Infrared Spectroscopy (FTIR)
Infrared spectroscopy is a technique that works with a small sample that is placed in an infrared cell,
where it is subjected to an infrared light source,which scans from wavelengths of 4000 cm-1 to 600 cm-1.
The intensity of the light transmitted through the sample is measured at each wavenumber, which
allows the amount of light absorbed by the sample to be calculated by the difference between the intensity
of the light before and after passing through the sample cell.
This analysis was performed on the carboxymethyl cellulose gel film to determine the
characteristic functional groups of the polymer before and after exposure to the contaminated soil, in
order to observe if there are significant changes in the structure of the polymeric material.
Scanning electron microscopy (SEM)
Scanning electron microscopy is a technique based on the principle of optical microscopy in which the
light beam is replaced by an electron beam used for the visualization and analysis of the characteristics
of high-resolution solid samples. It works by scanning a beam of electrons over the sample, the sample
is coated with a very thin layer of gold or carbon, which gives it conductive properties.
This analysis was performed on the carboxymethyl cellulose gel film to determine the
morphological surface of the polymer before and after being exposed to the contaminated soil, in order
to observe if there are significant changes in the morphology of the polymeric material.
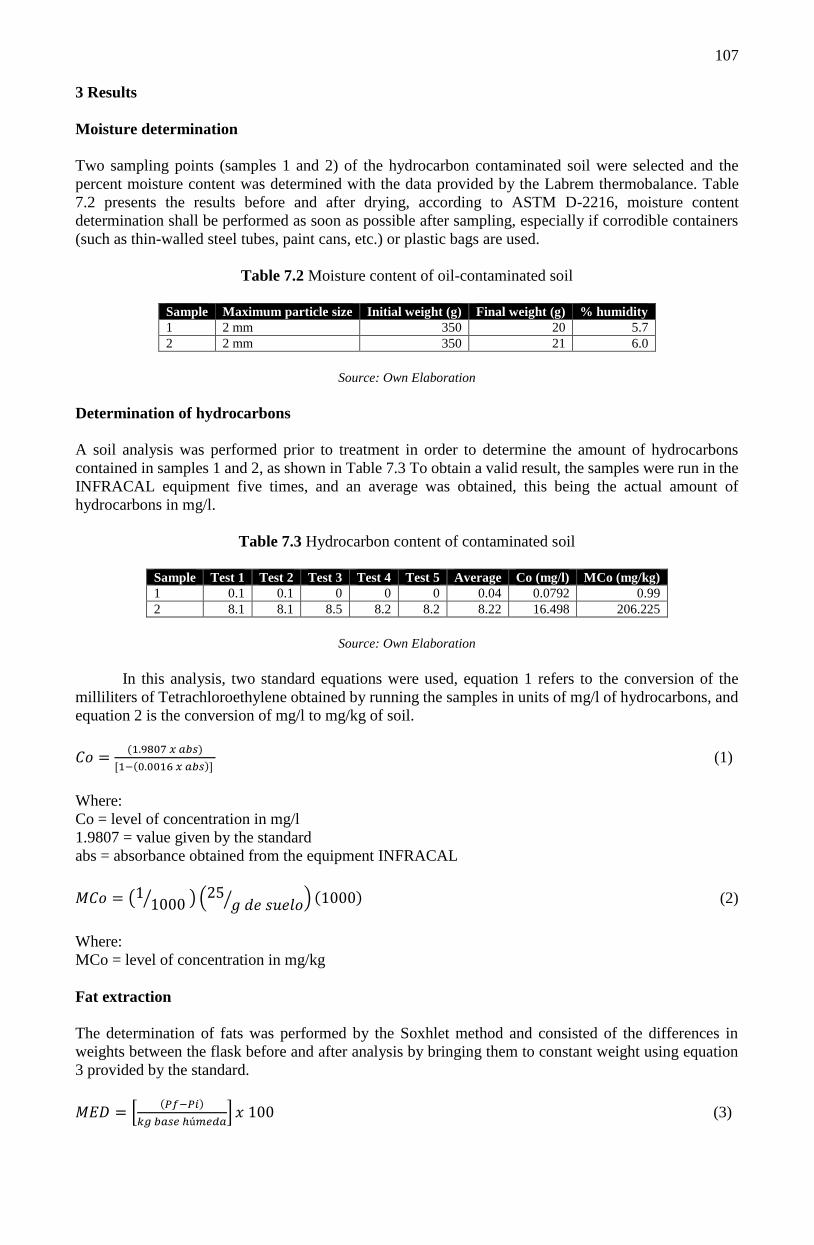
107
3 Results
Moisture determination
Two sampling points (samples 1 and 2) of the hydrocarbon contaminated soil were selected and the
percent moisture content was determined with the data provided by the Labrem thermobalance. Table
7.2 presents the results before and after drying, according to ASTM D-2216, moisture content
determination shall be performed as soon as possible after sampling, especially if corrodible containers
(such as thin-walled steel tubes, paint cans, etc.) or plastic bags are used.
Table 7.2 Moisture content of oil-contaminated soil
Sample Maximum particle size Initial weight (g) Final weight (g) % humidity
1 2 mm 350 20 5.7
2 2 mm 350 21 6.0
Source: Own Elaboration
Determination of hydrocarbons
A soil analysis was performed prior to treatment in order to determine the amount of hydrocarbons
contained in samples 1 and 2, as shown in Table 7.3 To obtain a valid result, the samples were run in the
INFRACAL equipment five times, and an average was obtained, this being the actual amount of
hydrocarbons in mg/l.
Table 7.3 Hydrocarbon content of contaminated soil
Sample Test 1 Test 2 Test 3 Test 4 Test 5 Average Co (mg/l) MCo (mg/kg)
1 0.1 0.1 0 0 0 0.04 0.0792 0.99
2 8.1 8.1 8.5 8.2 8.2 8.22 16.498 206.225
Source: Own Elaboration
In this analysis, two standard equations were used, equation 1 refers to the conversion of the
milliliters of Tetrachloroethylene obtained by running the samples in units of mg/l of hydrocarbons, and
equation 2 is the conversion of mg/l to mg/kg of soil.
𝐶𝑜 =(1.9807 𝑥 𝑎𝑏𝑠)
[1−(0.0016 𝑥 𝑎𝑏𝑠)] (1)
Where:
Co = level of concentration in mg/l
1.9807 = value given by the standard
abs = absorbance obtained from the equipment INFRACAL
𝑀𝐶𝑜 = (11000 ⁄ ) (25
𝑔 𝑑𝑒 𝑠𝑢𝑒𝑙𝑜⁄ ) (1000) (2)
Where:
MCo = level of concentration in mg/kg
Fat extraction
The determination of fats was performed by the Soxhlet method and consisted of the differences in
weights between the flask before and after analysis by bringing them to constant weight using equation
3 provided by the standard.
𝑀𝐸𝐷 = [(𝑃𝑓−𝑃𝑖)
𝑘𝑔 𝑏𝑎𝑠𝑒 ℎú𝑚𝑒𝑑𝑎] 𝑥 100 (3)
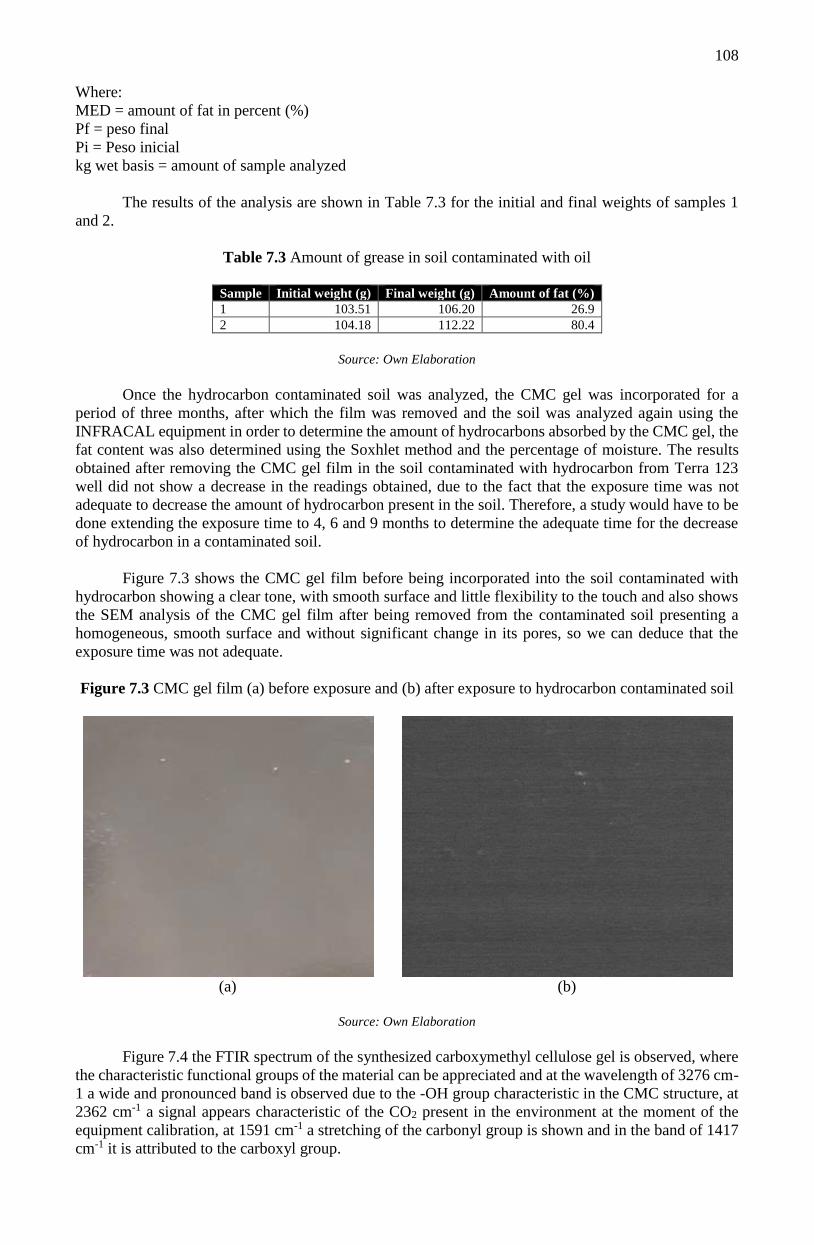
108
Where:
MED = amount of fat in percent (%)
Pf = peso final
Pi = Peso inicial
kg wet basis = amount of sample analyzed
The results of the analysis are shown in Table 7.3 for the initial and final weights of samples 1
and 2.
Table 7.3 Amount of grease in soil contaminated with oil
Sample Initial weight (g) Final weight (g) Amount of fat (%)
1 103.51 106.20 26.9
2 104.18 112.22 80.4
Source: Own Elaboration
Once the hydrocarbon contaminated soil was analyzed, the CMC gel was incorporated for a
period of three months, after which the film was removed and the soil was analyzed again using the
INFRACAL equipment in order to determine the amount of hydrocarbons absorbed by the CMC gel, the
fat content was also determined using the Soxhlet method and the percentage of moisture. The results
obtained after removing the CMC gel film in the soil contaminated with hydrocarbon from Terra 123
well did not show a decrease in the readings obtained, due to the fact that the exposure time was not
adequate to decrease the amount of hydrocarbon present in the soil. Therefore, a study would have to be
done extending the exposure time to 4, 6 and 9 months to determine the adequate time for the decrease
of hydrocarbon in a contaminated soil.
Figure 7.3 shows the CMC gel film before being incorporated into the soil contaminated with
hydrocarbon showing a clear tone, with smooth surface and little flexibility to the touch and also shows
the SEM analysis of the CMC gel film after being removed from the contaminated soil presenting a
homogeneous, smooth surface and without significant change in its pores, so we can deduce that the
exposure time was not adequate.
Figure 7.3 CMC gel film (a) before exposure and (b) after exposure to hydrocarbon contaminated soil
(a) (b)
Source: Own Elaboration
Figure 7.4 the FTIR spectrum of the synthesized carboxymethyl cellulose gel is observed, where
the characteristic functional groups of the material can be appreciated and at the wavelength of 3276 cm-
1 a wide and pronounced band is observed due to the -OH group characteristic in the CMC structure, at
2362 cm-1 a signal appears characteristic of the CO2 present in the environment at the moment of the
equipment calibration, at 1591 cm-1 a stretching of the carbonyl group is shown and in the band of 1417
cm-1 it is attributed to the carboxyl group.
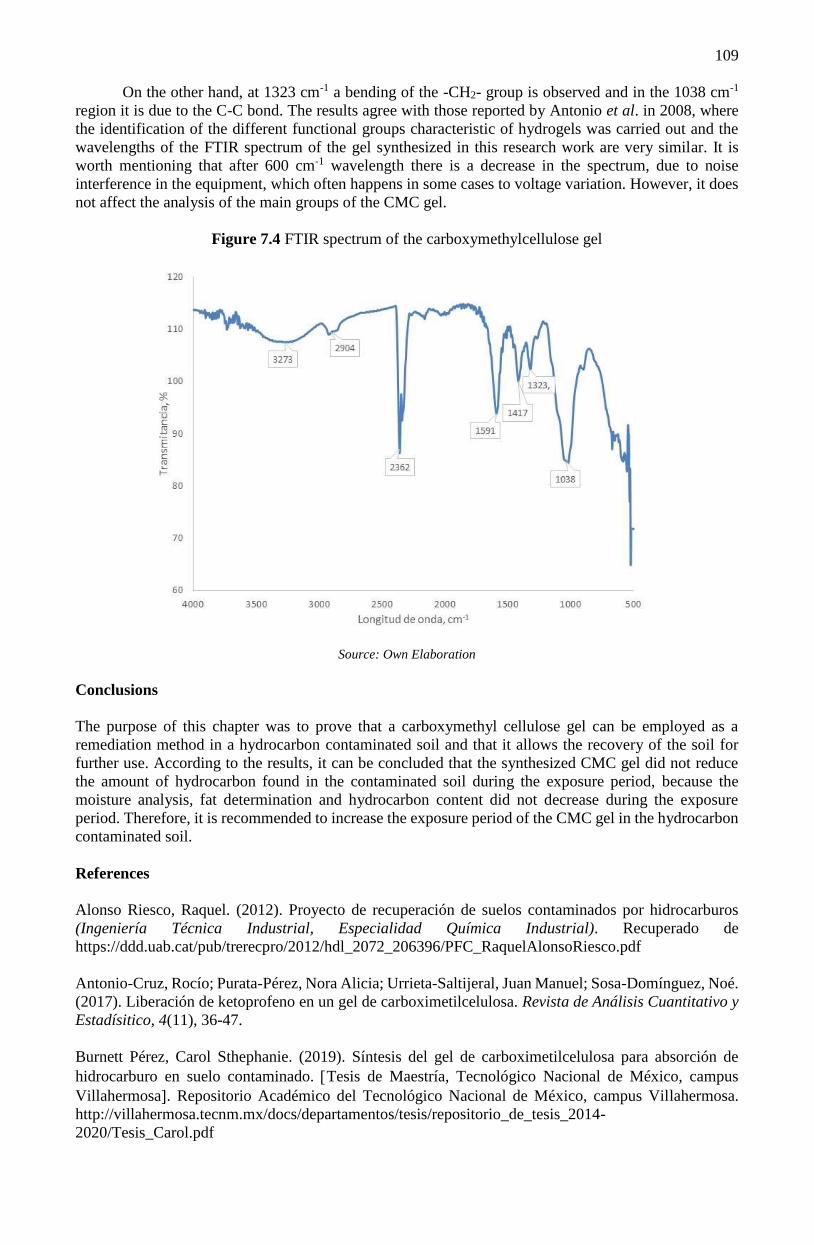
109
On the other hand, at 1323 cm-1 a bending of the -CH2- group is observed and in the 1038 cm-1
region it is due to the C-C bond. The results agree with those reported by Antonio et al. in 2008, where
the identification of the different functional groups characteristic of hydrogels was carried out and the
wavelengths of the FTIR spectrum of the gel synthesized in this research work are very similar. It is
worth mentioning that after 600 cm-1 wavelength there is a decrease in the spectrum, due to noise
interference in the equipment, which often happens in some cases to voltage variation. However, it does
not affect the analysis of the main groups of the CMC gel.
Figure 7.4 FTIR spectrum of the carboxymethylcellulose gel
Source: Own Elaboration
Conclusions
The purpose of this chapter was to prove that a carboxymethyl cellulose gel can be employed as a
remediation method in a hydrocarbon contaminated soil and that it allows the recovery of the soil for
further use. According to the results, it can be concluded that the synthesized CMC gel did not reduce
the amount of hydrocarbon found in the contaminated soil during the exposure period, because the
moisture analysis, fat determination and hydrocarbon content did not decrease during the exposure
period. Therefore, it is recommended to increase the exposure period of the CMC gel in the hydrocarbon
contaminated soil.
References
Alonso Riesco, Raquel. (2012). Proyecto de recuperación de suelos contaminados por hidrocarburos
(Ingeniería Técnica Industrial, Especialidad Química Industrial). Recuperado de
https://ddd.uab.cat/pub/trerecpro/2012/hdl_2072_206396/PFC_RaquelAlonsoRiesco.pdf
Antonio-Cruz, Rocío; Purata-Pérez, Nora Alicia; Urrieta-Saltijeral, Juan Manuel; Sosa-Domínguez, Noé.
(2017). Liberación de ketoprofeno en un gel de carboximetilcelulosa. Revista de Análisis Cuantitativo y
Estadísitico, 4(11), 36-47.
Burnett Pérez, Carol Sthephanie. (2019). Síntesis del gel de carboximetilcelulosa para absorción de
hidrocarburo en suelo contaminado. Tesis de Maestría, Tecnológico Nacional de México, campus
Villahermosa. Repositorio Académico del Tecnológico Nacional de México, campus Villahermosa.
http://villahermosa.tecnm.mx/docs/departamentos/tesis/repositorio_de_tesis_2014-
2020/Tesis_Carol.pdf
110
CARTAYA, Omar E.; REYNALDO, Inés; PENICHE, Carlos; y GARRIDO, María. L. (2011). Empleo
de polímeros naturales como alternativa para la remediación de suelos contaminados por metales
pesados. Revista Internacional de Contaminación Ambiental, 27(1), 41-46.
Centro Nacional de Prevención de Desastres (CENAPRED) 2001. Diagnóstico de peligros e
identificación de riesgos de desastres en México: Atlas Nacional de Riesgos de la República Mexicana.
Secretaría de Gobernación, México.
Daniel Coria Ignacio. (2007). Remediación de suelos contaminados con hidrocarburos. 17/Mayo/2021,
de Universidad Abierta Interamericana (UAIS), Sitio web:
http://sustentabilidad.uai.edu.ar/pdf/ing/UAIS-IGA-600-001%20-%20Remediacion.pdf
Duran-Carmona, Verónica. (2015). Impacto ambiental en las comunidades indígenas de Nacajuca,
Tabasco a causa de la explosión del pozo Terra 123. Actas Educación Ambiental desde la Innovación, la
Transdisciplinariedad e Interculturalidad T-I, 1, 54-68.
García-Torres, Reyna; Rios-Leal, Elvira; Martínez-Toledo, Ángeles; Ramos-Morales, Fernando Rafael;
Cruz-Sanchez, Jesús Samuel y Cuevas-Díaz, María del Carmen. (2011). Uso de cachaza y bagazo de
caña de azúcar en la remoción de hidrocarburos en suelo contaminado. Revista Internacional de
Contaminación Ambiental, 27(1), 31-39.
Guise, R., Filipe-Ribeiro, L., Nascimento, D., Bessa, O., Nunes, F. M., Cosme, F. (2014). Comparison
between different types of carboxylmethylcellulose and other oenological additives used for white wine
tartaric stabilization. Food Chemistry, 25, 150-157
Hildebrando Buendía R. (2012). Biorremediación de suelos contaminados por hidrocarburos mediante
el compost de aserrín y estiércol. Revista del Instituto de Investigación (RIIGEO), 15(30), 123-130.
Mejía Sandoval, Gregory. (2006). Aproximación teórica a la biosorción de metales pesados por medio
de microorganismos. Revista CES Medicina Veterinaria y Zootecnia, 1(1), 77-99.
Nahle, N., & Romero O. (2020). Informa Anual 2020. México: Petróleos Mexicanos.
Nápoles, J.; Marañón, A.; Cumbá, F.; Anllo, Y.; Abalos, A. (2005). Tratabilidad de suelos contaminados
con petróleo aplicando microcosmos. Revista Cubana de Química, 17(1), 179-188.
NORMA OFICIAL MEXICANA NOM-138-SEMARNAT/SSA1-2012, límites máximos permisibles de
hidrocarburos en suelos y lineamientos para el muestreo en la caracterización y especificaciones para la
remediación.
NORMA OFICIAL MEXICANA NOM-021-RETNAT-2000, que establece las especificaciones de
fertilidad, sanidad y clasificación de suelos.
Ortínez Brito, Oscar; Ize Lema, Irina; Gavilán García, Arturo. (2003). La restauración de suelos
contaminados con hidrocarburos en México. Gaceta ecológica, Secretaría de Medio Ambiente y
Recursos Naturales, (69), 83-92.
Ortiz Bernad, Irene; Sanz García, Juana; Dorado Valiño, Miriam; Villar Fernández, Susana. (2011),
Técnicas de recuperación de suelos contaminados: Estrategia de biorrecuperación para la precipitación e
inmovilización de Uranio y otros metales tóxicos en suelos contaminados de la desembocadura de Río
Tinto (Huelva, España)”. Nanomedicina Informe de vigilancia tecnológica, 1-109.
Petróleos Mexicanos (PEMEX) 2001. Informe 2001: Seguridad, salud y medio ambiente. Dirección
Corporativa de Seguridad Industrial y Protección Ambiental, PEMEX, México.
Pérez Casimiro, Guillermina; Iturbe Argüelles, Rosario; Flores Serrano, Rosa María (2006). Cambio en
las propiedades físicas de un suelo contaminado con hidrocarburos debido a la aplicación de una
tecnología de remediación. Revista AIDIS de Ingeniería y Ciencias Ambientales: Investigación,
desarrollo y práctica, 1(1), 1-10.

111
Procuraduría Federal de Protección al Ambiente (PROFEPA) 2002. Dirección General de Inspección de
Fuentes de Contaminación, México. http://www.profepa.gob.mx/
Procuraduría Federal de Protección al Ambiente PROFEPA (2015), Inspección preliminar en Pozo Terra
123 en Tabasco,
https://www.profepa.gob.mx/innovaportal/v/5681/1/mx.wap/realiza_profepa_inspeccion_preliminar_en
_pozo_terra_123_en_tabasco.html
Quadri, G. 1994. Industria y política ambiental. El Nacional, sábado 18 de junio, México.
Reporte Indigo (2019), https://www.reporteindigo.com/reporte/la-maldicion-petroleraproyectos-pemex-
tabasco-riesgos-poblacion-dos-bocas/
Rodríguez, Héctor; Donado, Rafael; Lozada, Jefferson. (2013). Espectroscopia Infrarroja por
Transformada de Fourier. 17/Mayo/2021, de IDOCPUB Sitio web:
https://idoc.pub/documents/espectroscopia-infrarroja-con-transformada-de-fourier-klzzp093d7lg
Suchanek, Thomas H. (1993). Oil Impacts on Marine Invertebrate Populations and Communities.
American Zoologist, 33(6), 510-523.
Wauquier, Jean-Pierre. (2004). El Refino del Petróleo. Madrid: Díaz de Santos.
112
Chapter 8 A review on electrospinning technologies and their potential use in the
Biomedical Industry
Capítulo 8 Una revisión sobre las tecnologías de electrohilado y su uso potencial en
la Industria Biomédica
CUAHUIZO-HUITZIL, Guadalupe†*, SANTACRUZ-VÁZQUEZ, Claudia and SANTACRUZ-
VÁZQUEZ, Verónica
Benemérita Universidad Autónoma de Puebla, Faculty of Engineering
ID 1st Author: Guadalupe, Cuahuizo-Huitzil / ORC ID: 0000-0003-1541-1454, CVU CONACYT ID:
781460
ID 1st Co-author: Claudia, Santacruz-Vázquez / ORC ID: 0000-0001-6660-469X, CVU CONACYT
ID: 70094
ID 2nd Co-author: Verónica, Santacruz-Vázquez / ORC ID: 0000-0003-0527-5815, CVU CONACYT
ID: 70091
DOI: 10.35429/H.2021.6.112.124
G. Cuahuizo, V. Santacruz, and C.Santacruz
A. Marroquín, J. Olivares, M. Ramírez and L. Cruz (Coord) Engineering and Technology. Handbooks-©ECORFAN-México,
Querétaro, 2021.
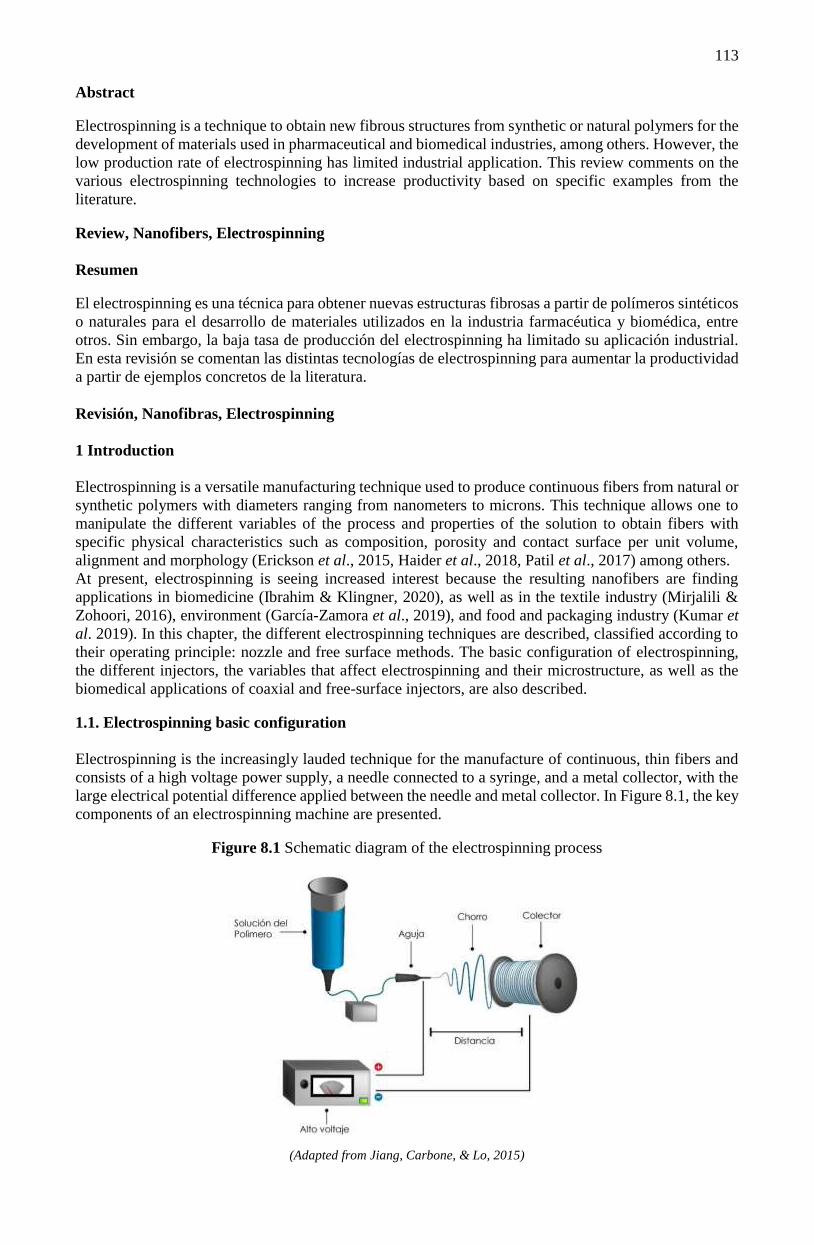
113
Abstract
Electrospinning is a technique to obtain new fibrous structures from synthetic or natural polymers for the
development of materials used in pharmaceutical and biomedical industries, among others. However, the
low production rate of electrospinning has limited industrial application. This review comments on the
various electrospinning technologies to increase productivity based on specific examples from the
literature.
Review, Nanofibers, Electrospinning
Resumen
El electrospinning es una técnica para obtener nuevas estructuras fibrosas a partir de polímeros sintéticos
o naturales para el desarrollo de materiales utilizados en la industria farmacéutica y biomédica, entre
otros. Sin embargo, la baja tasa de producción del electrospinning ha limitado su aplicación industrial.
En esta revisión se comentan las distintas tecnologías de electrospinning para aumentar la productividad
a partir de ejemplos concretos de la literatura.
Revisión, Nanofibras, Electrospinning
1 Introduction
Electrospinning is a versatile manufacturing technique used to produce continuous fibers from natural or
synthetic polymers with diameters ranging from nanometers to microns. This technique allows one to
manipulate the different variables of the process and properties of the solution to obtain fibers with
specific physical characteristics such as composition, porosity and contact surface per unit volume,
alignment and morphology (Erickson et al., 2015, Haider et al., 2018, Patil et al., 2017) among others.
At present, electrospinning is seeing increased interest because the resulting nanofibers are finding
applications in biomedicine (Ibrahim & Klingner, 2020), as well as in the textile industry (Mirjalili &
Zohoori, 2016), environment (García-Zamora et al., 2019), and food and packaging industry (Kumar et
al. 2019). In this chapter, the different electrospinning techniques are described, classified according to
their operating principle: nozzle and free surface methods. The basic configuration of electrospinning,
the different injectors, the variables that affect electrospinning and their microstructure, as well as the
biomedical applications of coaxial and free-surface injectors, are also described.
1.1. Electrospinning basic configuration
Electrospinning is the increasingly lauded technique for the manufacture of continuous, thin fibers and
consists of a high voltage power supply, a needle connected to a syringe, and a metal collector, with the
large electrical potential difference applied between the needle and metal collector. In Figure 8.1, the key
components of an electrospinning machine are presented.
Figure 8.1 Schematic diagram of the electrospinning process
(Adapted from Jiang, Carbone, & Lo, 2015)
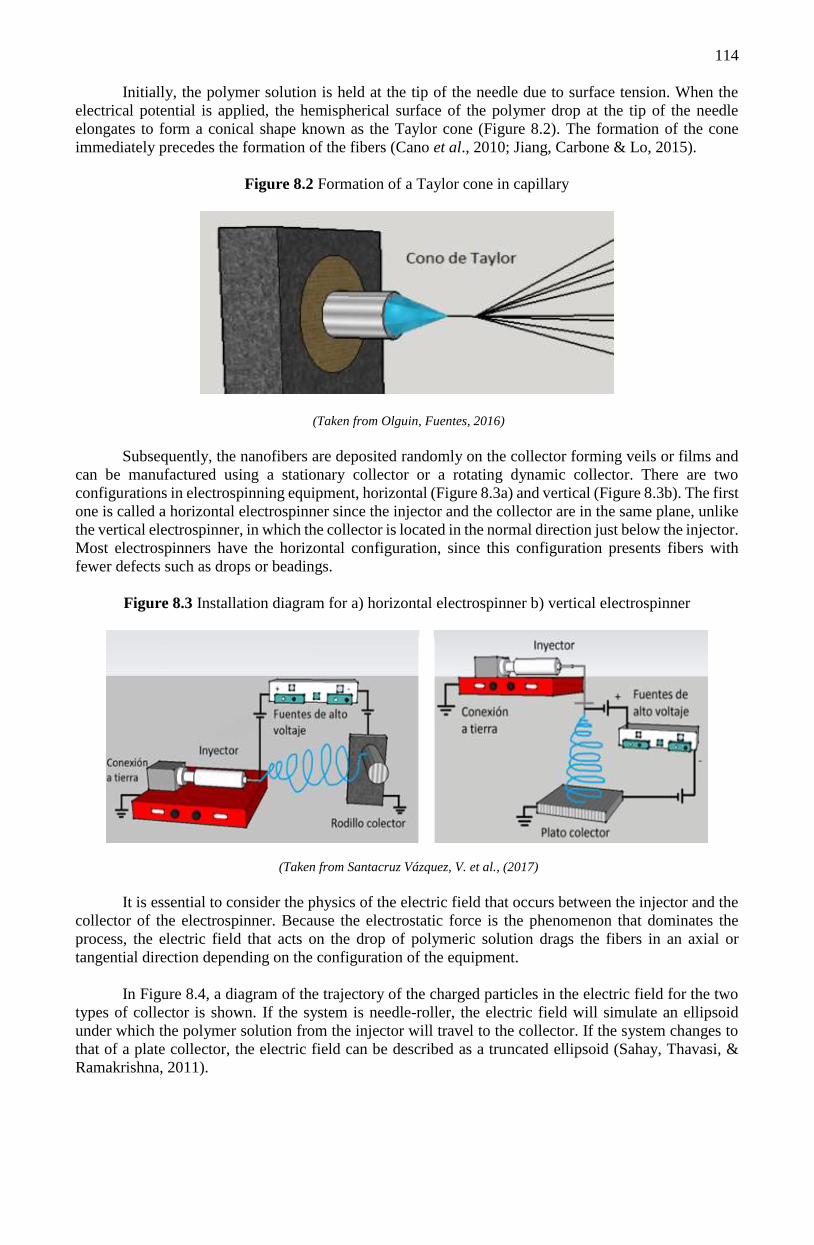
114
Initially, the polymer solution is held at the tip of the needle due to surface tension. When the
electrical potential is applied, the hemispherical surface of the polymer drop at the tip of the needle
elongates to form a conical shape known as the Taylor cone (Figure 8.2). The formation of the cone
immediately precedes the formation of the fibers (Cano et al., 2010; Jiang, Carbone & Lo, 2015).
Figure 8.2 Formation of a Taylor cone in capillary
(Taken from Olguin, Fuentes, 2016)
Subsequently, the nanofibers are deposited randomly on the collector forming veils or films and
can be manufactured using a stationary collector or a rotating dynamic collector. There are two
configurations in electrospinning equipment, horizontal (Figure 8.3a) and vertical (Figure 8.3b). The first
one is called a horizontal electrospinner since the injector and the collector are in the same plane, unlike
the vertical electrospinner, in which the collector is located in the normal direction just below the injector.
Most electrospinners have the horizontal configuration, since this configuration presents fibers with
fewer defects such as drops or beadings.
Figure 8.3 Installation diagram for a) horizontal electrospinner b) vertical electrospinner
(Taken from Santacruz Vázquez, V. et al., (2017)
It is essential to consider the physics of the electric field that occurs between the injector and the
collector of the electrospinner. Because the electrostatic force is the phenomenon that dominates the
process, the electric field that acts on the drop of polymeric solution drags the fibers in an axial or
tangential direction depending on the configuration of the equipment.
In Figure 8.4, a diagram of the trajectory of the charged particles in the electric field for the two
types of collector is shown. If the system is needle-roller, the electric field will simulate an ellipsoid
under which the polymer solution from the injector will travel to the collector. If the system changes to
that of a plate collector, the electric field can be described as a truncated ellipsoid (Sahay, Thavasi, &
Ramakrishna, 2011).
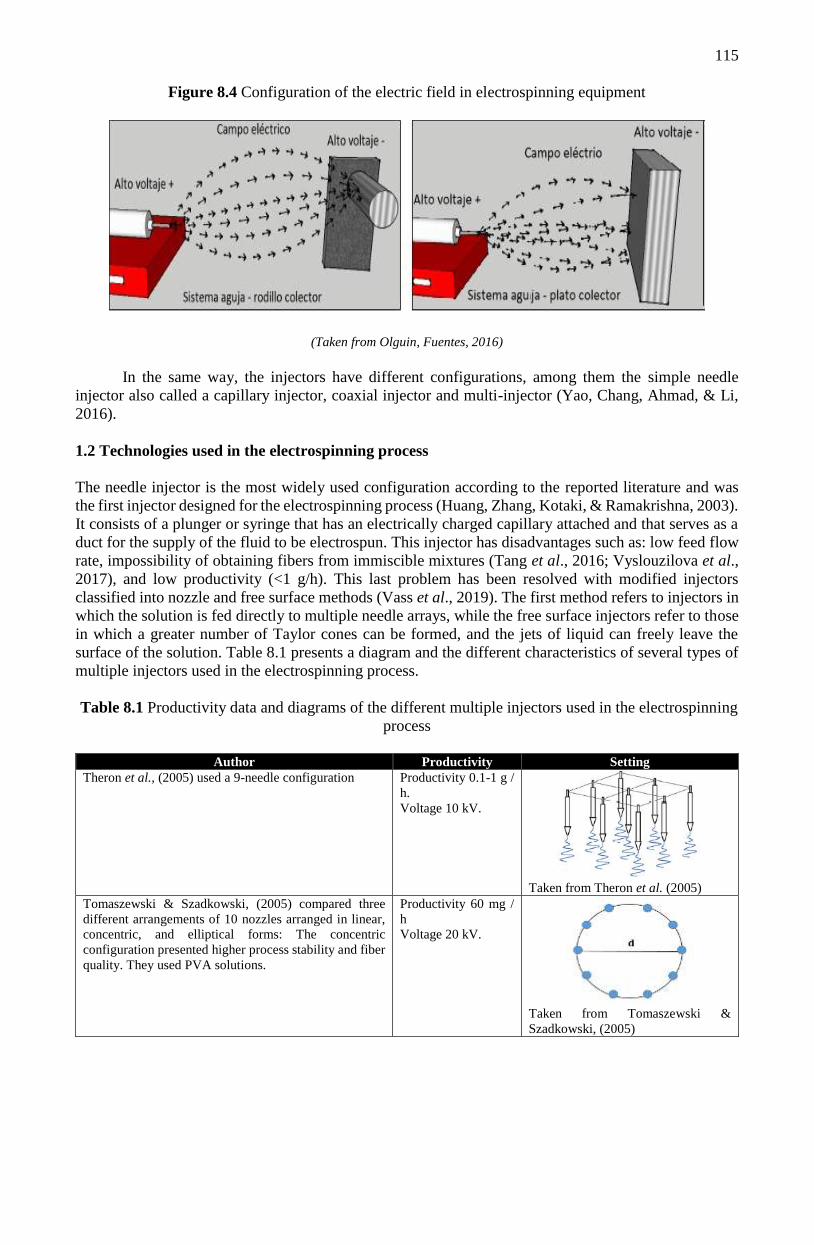
115
Figure 8.4 Configuration of the electric field in electrospinning equipment
(Taken from Olguin, Fuentes, 2016)
In the same way, the injectors have different configurations, among them the simple needle
injector also called a capillary injector, coaxial injector and multi-injector (Yao, Chang, Ahmad, & Li,
2016).
1.2 Technologies used in the electrospinning process
The needle injector is the most widely used configuration according to the reported literature and was
the first injector designed for the electrospinning process (Huang, Zhang, Kotaki, & Ramakrishna, 2003).
It consists of a plunger or syringe that has an electrically charged capillary attached and that serves as a
duct for the supply of the fluid to be electrospun. This injector has disadvantages such as: low feed flow
rate, impossibility of obtaining fibers from immiscible mixtures (Tang et al., 2016; Vyslouzilova et al.,
2017), and low productivity (<1 g/h). This last problem has been resolved with modified injectors
classified into nozzle and free surface methods (Vass et al., 2019). The first method refers to injectors in
which the solution is fed directly to multiple needle arrays, while the free surface injectors refer to those
in which a greater number of Taylor cones can be formed, and the jets of liquid can freely leave the
surface of the solution. Table 8.1 presents a diagram and the different characteristics of several types of
multiple injectors used in the electrospinning process.
Table 8.1 Productivity data and diagrams of the different multiple injectors used in the electrospinning
process
Author Productivity Setting
Theron et al., (2005) used a 9-needle configuration
Productivity 0.1-1 g /
h.
Voltage 10 kV.
Taken from Theron et al. (2005)
Tomaszewski & Szadkowski, (2005) compared three
different arrangements of 10 nozzles arranged in linear,
concentric, and elliptical forms: The concentric
configuration presented higher process stability and fiber
quality. They used PVA solutions.
Productivity 60 mg /
h
Voltage 20 kV.
Taken from Tomaszewski &
Szadkowski, (2005)
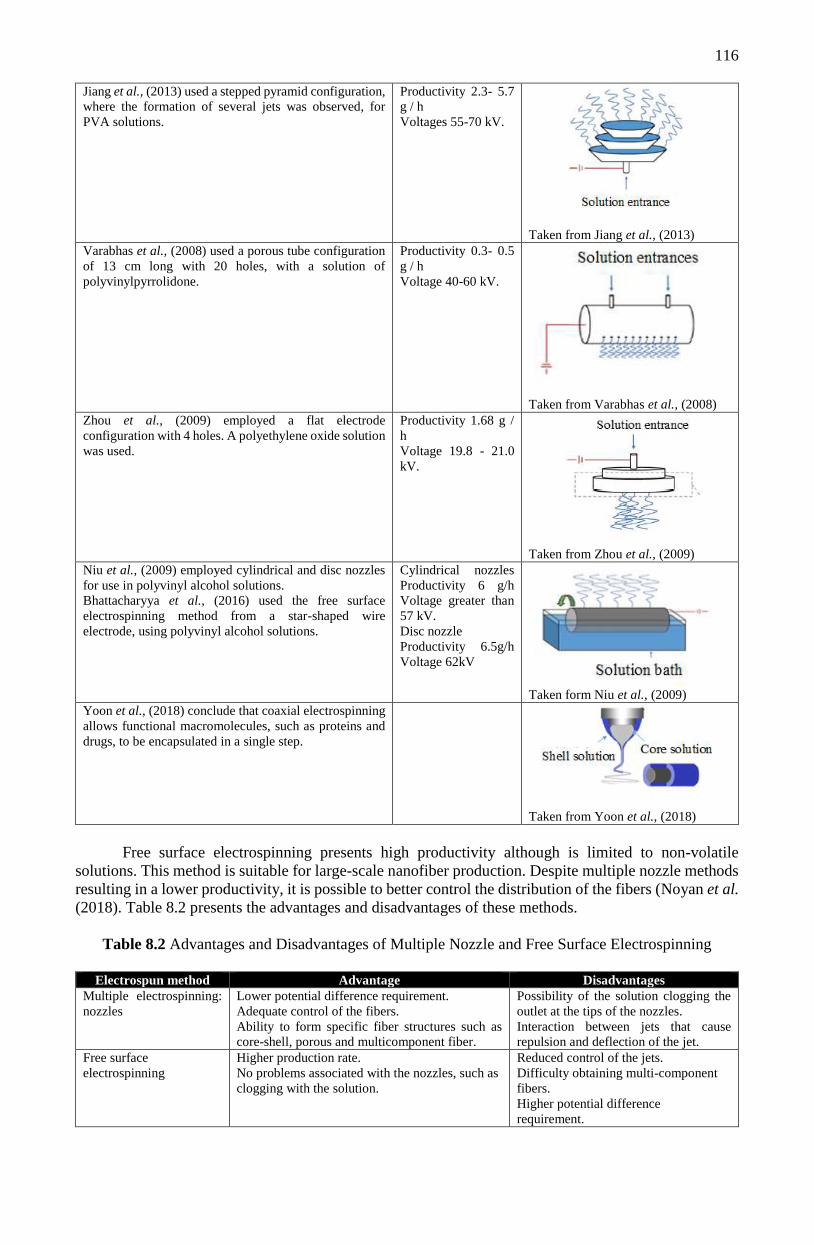
116
Jiang et al., (2013) used a stepped pyramid configuration,
where the formation of several jets was observed, for
PVA solutions.
Productivity 2.3- 5.7
g / h
Voltages 55-70 kV.
Taken from Jiang et al., (2013)
Varabhas et al., (2008) used a porous tube configuration
of 13 cm long with 20 holes, with a solution of
polyvinylpyrrolidone.
Productivity 0.3- 0.5
g / h
Voltage 40-60 kV.
Taken from Varabhas et al., (2008)
Zhou et al., (2009) employed a flat electrode
configuration with 4 holes. A polyethylene oxide solution
was used.
Productivity 1.68 g /
h
Voltage 19.8 - 21.0
kV.
Taken from Zhou et al., (2009)
Niu et al., (2009) employed cylindrical and disc nozzles
for use in polyvinyl alcohol solutions.
Bhattacharyya et al., (2016) used the free surface
electrospinning method from a star-shaped wire
electrode, using polyvinyl alcohol solutions.
Cylindrical nozzles
Productivity 6 g/h
Voltage greater than
57 kV.
Disc nozzle
Productivity 6.5g/h
Voltage 62kV
Taken form Niu et al., (2009)
Yoon et al., (2018) conclude that coaxial electrospinning
allows functional macromolecules, such as proteins and
drugs, to be encapsulated in a single step.
Taken from Yoon et al., (2018)
Free surface electrospinning presents high productivity although is limited to non-volatile
solutions. This method is suitable for large-scale nanofiber production. Despite multiple nozzle methods
resulting in a lower productivity, it is possible to better control the distribution of the fibers (Noyan et al.
(2018). Table 8.2 presents the advantages and disadvantages of these methods.
Table 8.2 Advantages and Disadvantages of Multiple Nozzle and Free Surface Electrospinning
Electrospun method Advantage Disadvantages
Multiple electrospinning:
nozzles
Lower potential difference requirement.
Adequate control of the fibers.
Ability to form specific fiber structures such as
core-shell, porous and multicomponent fiber.
Possibility of the solution clogging the
outlet at the tips of the nozzles.
Interaction between jets that cause
repulsion and deflection of the jet.
Free surface
electrospinning
Higher production rate.
No problems associated with the nozzles, such as
clogging with the solution.
Reduced control of the jets.
Difficulty obtaining multi-component
fibers.
Higher potential difference
requirement.
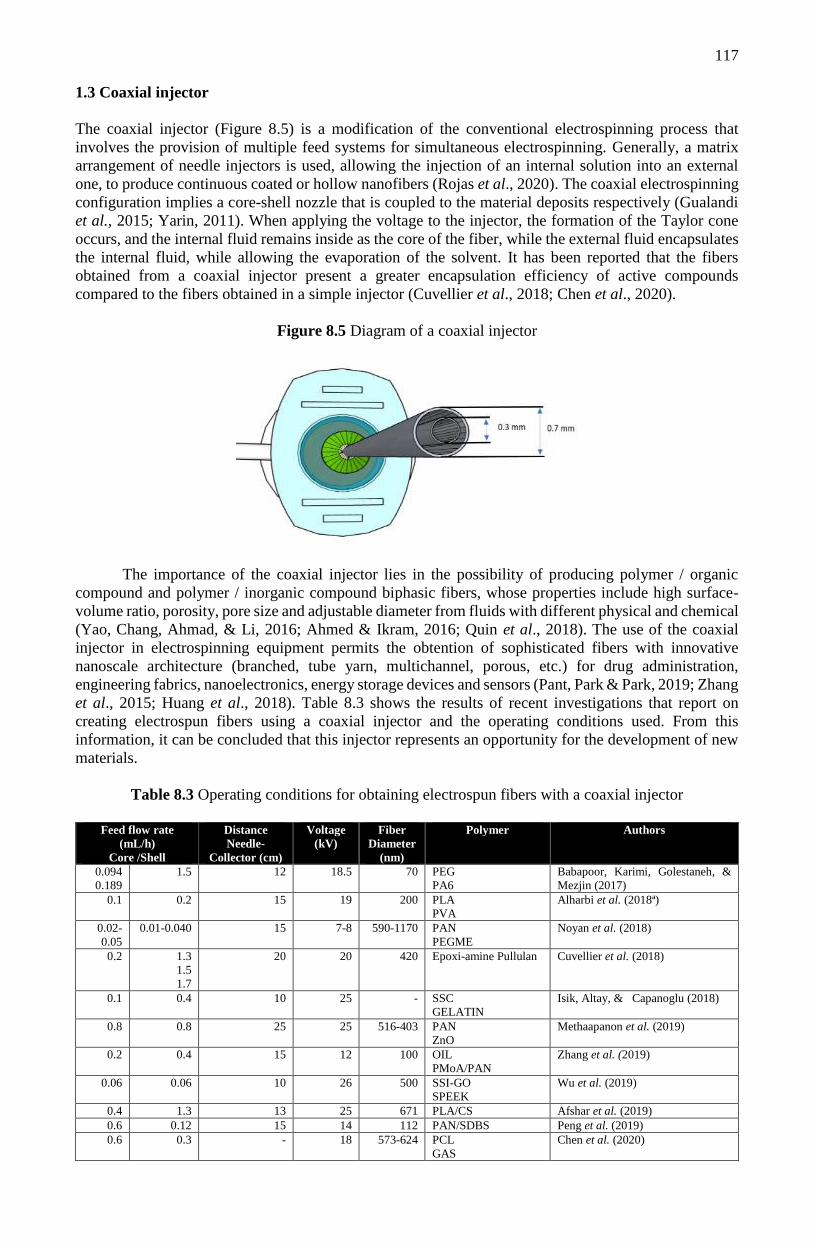
117
1.3 Coaxial injector
The coaxial injector (Figure 8.5) is a modification of the conventional electrospinning process that
involves the provision of multiple feed systems for simultaneous electrospinning. Generally, a matrix
arrangement of needle injectors is used, allowing the injection of an internal solution into an external
one, to produce continuous coated or hollow nanofibers (Rojas et al., 2020). The coaxial electrospinning
configuration implies a core-shell nozzle that is coupled to the material deposits respectively (Gualandi
et al., 2015; Yarin, 2011). When applying the voltage to the injector, the formation of the Taylor cone
occurs, and the internal fluid remains inside as the core of the fiber, while the external fluid encapsulates
the internal fluid, while allowing the evaporation of the solvent. It has been reported that the fibers
obtained from a coaxial injector present a greater encapsulation efficiency of active compounds
compared to the fibers obtained in a simple injector (Cuvellier et al., 2018; Chen et al., 2020).
Figure 8.5 Diagram of a coaxial injector
The importance of the coaxial injector lies in the possibility of producing polymer / organic
compound and polymer / inorganic compound biphasic fibers, whose properties include high surface-
volume ratio, porosity, pore size and adjustable diameter from fluids with different physical and chemical
(Yao, Chang, Ahmad, & Li, 2016; Ahmed & Ikram, 2016; Quin et al., 2018). The use of the coaxial
injector in electrospinning equipment permits the obtention of sophisticated fibers with innovative
nanoscale architecture (branched, tube yarn, multichannel, porous, etc.) for drug administration,
engineering fabrics, nanoelectronics, energy storage devices and sensors (Pant, Park & Park, 2019; Zhang
et al., 2015; Huang et al., 2018). Table 8.3 shows the results of recent investigations that report on
creating electrospun fibers using a coaxial injector and the operating conditions used. From this
information, it can be concluded that this injector represents an opportunity for the development of new
materials.
Table 8.3 Operating conditions for obtaining electrospun fibers with a coaxial injector
Feed flow rate
(mL/h)
Core /Shell
Distance
Needle-
Collector (cm)
Voltage
(kV)
Fiber
Diameter
(nm)
Polymer
Authors
0.094
0.189
1.5 12 18.5 70 PEG
PA6
Babapoor, Karimi, Golestaneh, &
Mezjin (2017)
0.1 0.2 15 19 200 PLA
PVA
Alharbi et al. (2018ª)
0.02-
0.05
0.01-0.040 15 7-8 590-1170 PAN
PEGME
Noyan et al. (2018)
0.2 1.3
1.5
1.7
20 20 420 Epoxi-amine Pullulan Cuvellier et al. (2018)
0.1 0.4 10 25 - SSC
GELATIN
Isik, Altay, & Capanoglu (2018)
0.8 0.8 25 25 516-403 PAN
ZnO
Methaapanon et al. (2019)
0.2 0.4 15 12 100 OIL
PMoA/PAN
Zhang et al. (2019)
0.06 0.06 10 26 500 SSI-GO
SPEEK
Wu et al. (2019)
0.4 1.3 13 25 671 PLA/CS Afshar et al. (2019)
0.6 0.12 15 14 112 PAN/SDBS Peng et al. (2019)
0.6 0.3 - 18 573-624 PCL
GAS
Chen et al. (2020)
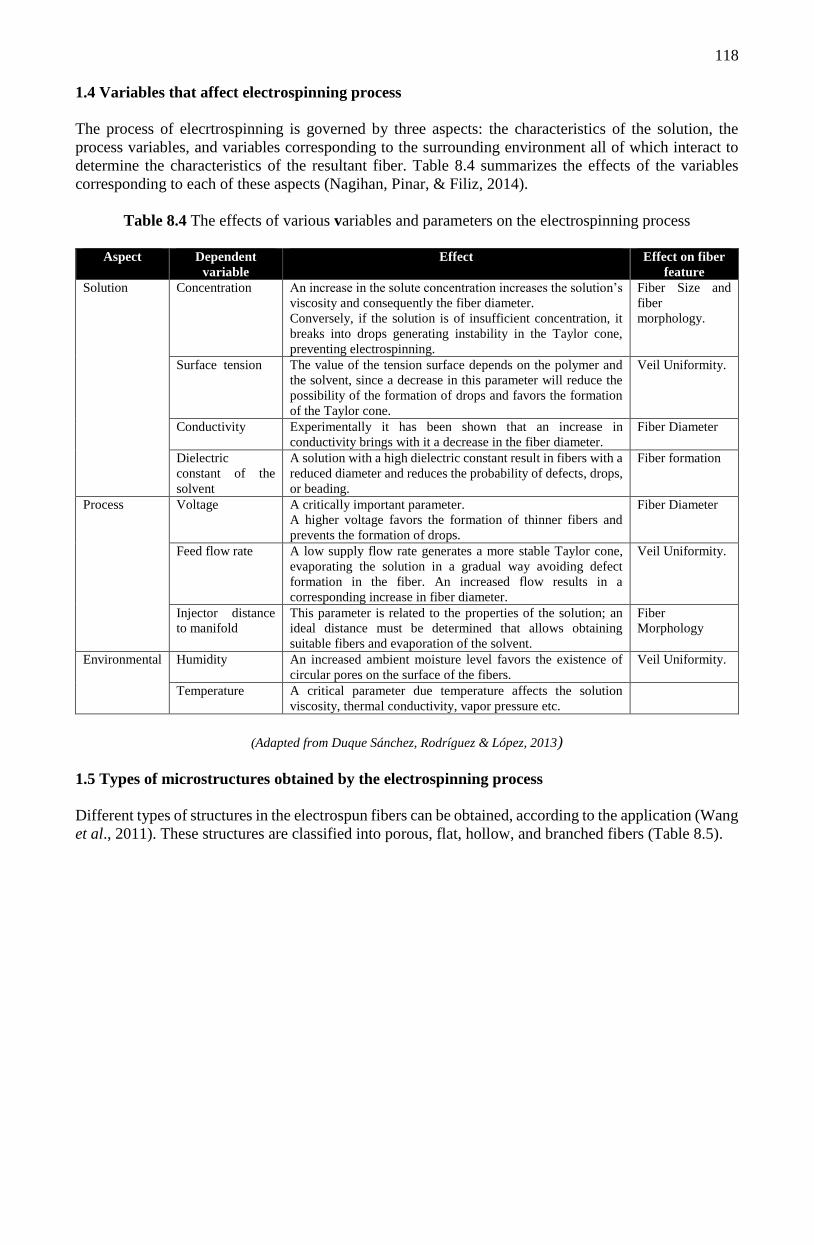
118
1.4 Variables that affect electrospinning process
The process of elecrtrospinning is governed by three aspects: the characteristics of the solution, the
process variables, and variables corresponding to the surrounding environment all of which interact to
determine the characteristics of the resultant fiber. Table 8.4 summarizes the effects of the variables
corresponding to each of these aspects (Nagihan, Pinar, & Filiz, 2014).
Table 8.4 The effects of various variables and parameters on the electrospinning process
Aspect Dependent
variable
Effect Effect on fiber
feature
Solution Concentration An increase in the solute concentration increases the solution’s
viscosity and consequently the fiber diameter.
Conversely, if the solution is of insufficient concentration, it
breaks into drops generating instability in the Taylor cone,
preventing electrospinning.
Fiber Size and
fiber
morphology.
Surface tension The value of the tension surface depends on the polymer and
the solvent, since a decrease in this parameter will reduce the
possibility of the formation of drops and favors the formation
of the Taylor cone.
Veil Uniformity.
Conductivity Experimentally it has been shown that an increase in
conductivity brings with it a decrease in the fiber diameter.
Fiber Diameter
Dielectric
constant of the
solvent
A solution with a high dielectric constant result in fibers with a
reduced diameter and reduces the probability of defects, drops,
or beading.
Fiber formation
Process Voltage A critically important parameter.
A higher voltage favors the formation of thinner fibers and
prevents the formation of drops.
Fiber Diameter
Feed flow rate A low supply flow rate generates a more stable Taylor cone,
evaporating the solution in a gradual way avoiding defect
formation in the fiber. An increased flow results in a
corresponding increase in fiber diameter.
Veil Uniformity.
Injector distance
to manifold
This parameter is related to the properties of the solution; an
ideal distance must be determined that allows obtaining
suitable fibers and evaporation of the solvent.
Fiber
Morphology
Environmental Humidity An increased ambient moisture level favors the existence of
circular pores on the surface of the fibers.
Veil Uniformity.
Temperature A critical parameter due temperature affects the solution
viscosity, thermal conductivity, vapor pressure etc.
(Adapted from Duque Sánchez, Rodríguez & López, 2013)
1.5 Types of microstructures obtained by the electrospinning process
Different types of structures in the electrospun fibers can be obtained, according to the application (Wang
et al., 2011). These structures are classified into porous, flat, hollow, and branched fibers (Table 8.5).

119
Table 8.5 Classification of the structure of micro and nanofibers obtained by electrospinning
Name Source Shape
Porous Pores are generated when the solvent used to dissolve the polymer is
thermodynamically unstable and when subjected to an electric field the solvent
coexists in two phases, liquid and gaseous. (Li & Hsieh, 2006)
Flat Flattened nanofibers occur when high molecular weight polymers electrospun
fibers impact against the collector (Yu et al., 2014).
Hollow Hollow structures are achieved by using a coaxial electrospinning head of the
tube-shell type. The polymer is injected through the shell and through the internal
tube a compound that is immiscible with the external polymer is passed (Li,
McCann, & Xia, 2005).
Branched Branched structure is obtained when electrospun primary jets form branches
prior to arriving at the collector. due a balance between electrostatic forces and
surface tension of the polymeric solution (Huang, Zhang, Kotaki &
Ramakrishna, 2003).
1.6 Most commonly used polymers electrospinning process
Electrospinning technique is restricted to polymeric substances that allow the formation of fibers, and
for the selection of electrospinning polymers, specific physical and chemical properties such as density,
electrical conductivity, viscosity, molecular weight of the polymer must be considered, as well as
polymer-solvent interactions (Frenot & Chronakis, 2003). A wide variety of electrospinning polymers
have been reported; however, polymers of natural origin have the advantage of being biocompatible and
immunogenic in comparison with synthetic ones (Liao et al., 2018). Among them are collagen, elastin,
silk, gelatin, chitosan etc. (Horng Lin, Kuang Chen, Lin Huang, & Chieh Huang, 2015). Table 8.6 lists
some of investigations carried out with electrospun biopolymers.
Table 8.6 Biopolymers most frequently used for electrospinning
Polymers Fibers uses Operation conditions Reference
Gelatin and
poly-caprolactone
Pharmaceutical
industry
Solution 10% w/v.
Feed flow rate 1 mL/h.
Applied voltage 0.5, 0.8, and
0.3 kV.
Zhang, Ouyang, Lim, Ramakrishna,
& Huang, (2004)
Jelly Nutritional products Solution in a range of 7 to 20%
w/v.
Feed flow rate 0.1 and 1 mL/h.
Applied voltage 28 and 35 kV.
Nagihan, Pinar, & Filiz, (2014)
Gelatin and polyvinyl
alcohol
Packing industry Solutions 10% w/v.
Feed flow rate 0.5 mL/h.
Applied voltage 15, 20 and 25
kV.
Horng Lin, Kuang Chen, Lin Huang,
& Chieh Huang, (2015)
Jelly Biomedical industry Solutions 2.5 to 15% w/v.
Feed flow rate 0.8mL/h.
Applied voltage 10 to 16 kV.
Huang, Zhang, Kotaki, &
Ramakrishna, (2003)
Chitosan and PVA Management
Drugs
Feed flow rate 0.6 mL/h.
Applied voltaje 22 kV.
Roya et al., (2016)
Chitosan and PVA
Biomedical industry Solution of QS/PVA 30/70
Feed flow rate 0.5 mL/h.
Applied voltage 20 kV.
Koosha, & Mirzadeh, (2015)

120
1.7. Biomedical Applications of Coaxial and Free Surface Injectors
Coaxial and free-surface electrospinning have potential applications in the biomedical industry; such
fibers are used as tissue engineering scaffolds, wound dressings, and drug delivery devices (Table 8.7).
The controlled release of incorporated drugs is a very important feature, especially for toxic drugs such
as doxorubicin. Electrospun nanofibers allow controlled drug release in order to minimize negative side
effects for patients. In most cases, drug molecules are incorporated into coaxial fibers, in which the drug
is introduced into the core of the fiber and are protected by biopolymeric materials in the shell, allowing
sustained release.
Table 8.7 Uses of coaxial and free surface injectors and their biomedical applications
Injector
type
Application Author
Coaxial Controlled release of hygroscopic drug poly (DL-lactic acid) and dimethyloxalylglycine
fed into the core and poly (3-hydroxy butyrate) fed into the fiber shell.
Wang et al.
(2010)
Coaxial Chemotherapy against ovary cancer.
The doxorubicin is dispersed in the solution of PVA solution into the core and PVA and
chitosan solution located in the shell.
Yan et al.
(2014)
Coaxial Controlled release for wounds dressings.
Sodium hyaluronate located in the core and cellulose acetate in the shell.
Li et al. (2014)
Coaxial Proliferation of Schwann cells.
Laminin localized in the nucleus and poly (L-lactide) -co-poly (ε - caprolactone) in the
shell.
Kijeńska et al.
(2014)
Coaxial Tissue regeneration.
The antibiotic metronidazole is incorporated into the core of poly (ε - caprolactone)
providing good mechanical properties, while the shell of zein provides good
biocompatibility and a hydrophobic barrier for the prolonged release of the drug from the
core.
He et al.
(2017)
Coaxial Antibacterial material as dressing for wounds and filtration against Escherichia coli.
Polylactic acid was located in the nucleus and chitosan solution in the shell.
Nguyen et al.
(2011)
Free
sueface
Antibacterial properties against Escherichia coli gram - negative and Staphylococcus
aureus gram - positive.
Chitosan / PVA / AgNO3 or Chitosan / PVA / TiO2 nanofibers.
Wang et al.
(2016)
Free
surface
Anti-inflammatory activity and analgesic effect.
Niflumic acid and polyvinylpyrrolidone nanofibers.
Radacsi et al.
(2019)
Free
surface
Microbicide. PVA fibers with Tenofovir. Krogstad &
Woodrow
(2014)
Conclusions
In this review, research articles on electrospinning and its applications in materials for the medical and
pharmaceutical industries have been evaluated. Electrospun nanofiber structures have great potential to
be applied in processes that use membranes due to their high porosity of up to 90% and a large specific
surface area. Therefore, the authors comment on the need to develop injectors that allow higher efficiency
of the electrospinning technique and thereby increase the feasibility for large-scale production of these
nanostructures.
Acknowledgements
The first author appreciates the support of the National Council of Science and Technology (CONACYT)
for the scholarship granted to pursue a doctorate in Chemical Engineering at the Meritorious Autonomous
University of Puebla, included in the register of Postgraduates of Excellence.
References
Ahmed, S., & Ikram, S. (2016). Achievements in the Life Sciences Chitosan Based Scaffolds and Their
Applications in Wound Healing. Achievements in the Life Sciences, 10(1), 27–37.
121
Afshar, S., Rashedi, S., Nazozkdast, H., Ghazalian, M. (2019). Preparation and characterization of
electrospun poly(lactic acid)- chitosan core-shell nanofibers with a new solvent system. International
Journal of Biological Macromolecules. 138, 1130-1137.
Alharbi, H., Luqman, M., Fouad, H., Khalil, K.A., Alharthi, N.H. (2018). Viscoelastic behavior of core-
shell structured nanofibers of PLA and PVA produced by coaxial electrospinning. Polymer Testing. 67,
136-143.
Alharbi, H., Luqman, M., Khalil, K.A., Elnakady, Y.A., Abb-Elkader, H.O., Rady, A.M., Alharthi, N.H.,
Karim, M.R. (2018). Fabrication of core-shell structured nanofibers of poly (lactic acid) and poly(vinyl
alcohol) by coaxial electrospinning for tissue engineering. European Polymer Journal. 98, 483-491.
Babapoor, A., Karimi, g., Golestaneh, S.I., & Mezjin, M.A. (2017). Coaxial electro-spun PEG/PA6
composite fibers: Fabrication and characterization. Applied Termal Engineering. 118 (25), 398-407.
Bhattacharyya, I., Molaro, C.M., Braatz, D.R., Rutledge, C.G. (2016). Free surface electrospinning of
aqueous polymer solutions from a wire electrod. Chemical Engineering Journal, 203-311.
Cano, F., Tornero., A., & Naik, A. (2010). Produccion de nanofibras a partir de un diseño innovador de
maqinaria protopito de electrospinning. Boletin Intexter (UPC), 5-11.
Chen, W., Wang, C., Gao, Y., Wu, Y., Wu, G., Shi, X., Du, Y., Deng, H. (2020). Incorporating chitin
derived glucosamine sulfate into nanofibers via coaxial electrospinning for cartilage regeneration.
Carbohydrate Polymers. 229.
Cuvellier, A., Torre-Muruzabal, A., Kizildag, N., Daelemans, L., Ba, Y., Clerck, D.K., Rahier, H. (2018).
Coaxial electrospinning of epoxy and amine monomers in a pullulan shell for self-healing nanovascular
systems. Polymer Testing, 69, 146.156.
Duque Sánchez, L. M., Rodríguez, L., & López, M. (2013). Electrospinning: La era de las nanofibras.
Iberoamericana de Polímeros, 10 - 27.
Erickson, A. E., Edmondson, D., Chang, F., Wood, D., Gong, A., Levengood, S. L., & Zhang, M. (2015).
High-throughput and high-yield fabrication of uniaxially-aligned chitosan- based nanofibers by
centrifugal electrospinning. Carbohydrate Polymers, 134, 467–474.
Frenot, A., & Chronakis, I. S. (2003). Polymer nanofibers assembled by electrospinning. Current
Opinion in Colloid and Interface Science, 8, 64 - 75.
García-Zamora, J.L. Santacruz-Vázquez, V., Valera-Pérez, M.A., Moreira, M.T., Cardenas-Chavez,
D.L., Tapia-Salazar, M., Torres, E. (2019). Oxidation of Flame Retardant Tetrabromobisphenol A by a
Biocatalytic Nanofiber of Chloroperoxidase. Int. J. Environ. Res. Public Health, 16, 4917.
Gualandi, C., Celli, A., Zucchelli, A., Focarete, M.L., (2015). Nanohybrid materials by electrospinning.
Organic–Inorganic Hybrid Nanomaterials. Springer, Berlin.
Haider, A., Haider, S., Kang, I-K. (2018). A comprehensive review summarizing the effect of
electrospinning parameters and potential applications of nanofibers in biomedical and biotechnology,
Arabian Journal of Chemistry, 11, 1165-1188.
He, M., Jiang, H., Wang, R., Xie, Y.X., Zhao, C. (2017). Fabrication of metronidazole loaded poly (e-
caprolactone)/zein core/ shell nanofiber membranes via coaxial electrospinning for guided tissue
regeneration. Journal of Colloid and Interface Science, 490, 270-278.
Horng Lin, J., Kuang Chen, C., Lin Huang, C., & Chieh Huang, S. (2015). Manufacturing techniques
and property evaluations of PVA/Gelatin electrospinning nanofiber membranes. Applied Mechanics and
Materials, 749, 178 - 181.
122
Huang, Z.-M., Zhang, Y., Kotaki, M., & Ramakrishna, S. (2003). A review on polymer nanofibers by
electrospinning and their applications in nanocomposites. Composites science and technology, 6, 2223-
2253.
Huang, B., Zhang, Z., Zhao, C., Cairang, L., Bai, J., Zhang, Y., Mu, X., Du, J., Wang, H., Pan, X., Zhou,
J., Xie, E. (2018). Enhanced gas-sensing performance of ZnO@In2O3 core@shell nanofibers prepared
by coaxial electrospinning. Sensors and Actuators B: Chemical, 255(2), 2248-2257.
Ibrahim, M.H & Klingner, A. (2020). A review on electrospun polymeric nanofibers: Production
parameters and potential applications. Polymer Testing, 90, 106647.
Isik, B.S., Altay, F., & Capanoglu, E. (2018). The uniaxial and coaxial encapsulations of sour cherry
(Prunus cerasus L.). Food Chemistry, 265, 260-273.
Jiang, T., Carbone, E. J., & Lo, K. W. (2015). Progress in Polymer Science Electrospinning of polymer
nanofibers for tissue regeneration. Progress in Polymer Science, 46, 1–24.
Jiang, G., Zhang, S., Qin, X. (2013). High through put of quality nanofibers via one stepped pyramid-
shaped spinneret. Materials Letters, 106, 56-58.
Krogstad, E. A., & Woodrow, K. A. (2014). Manufacturing scale-up of electrospun poly (vinyl alcohol)
fibers containing tenofovir for vaginal drug delivery. International Journal of Pharmaceutics, 475(1-2),
282-291.
Kijeńska, E., Prabhakaran, p.m., Swieszkowski, W., Kurzydlowski, K.J., Ramakrishna, S. (2014).
Interaction of Schwann cells with laminin encapsulated PLCL core–shell nanofibers for nerve tissue
engineering. European Polymer Journal, 50, 30-38.
Koosha, M., Hamid Mirzadeh, H. (2015). Electrospinning, mechanical properties, and cell behavior
study of chitosan/PVA nanofibers. Society For Biomateriales, 3081-3093.
Kumar, T.S.M., Kumar K.S., Rajini, N., Siengchin, S., Ayrilmis, N., Rajulu, A.V. (2019). A
comprehensive review of electrospun nanofibers: Food and packaging perspective. Composites Part B,
176, 107074.
Li, Z., Kang, H., Chen, N., Liu, Z., Li, P., Li, W., Zhang, C., Cao, C., Liu, R., Huang, Y. (2014).
Controlled release of liposome-encapsulated Naproxen fromcore-sheath electrospun nanofibers.
Carbohydrate Polymers, 111, 18-24.
Li, D., McCann, J., & Xia, Y. (2005). Use of electrospinning to directly fabricate hollow nanofibers with
functionalized inner and outer surfaces. Small, 1, 83-86.
Li, L., & Hsieh, Y.-L. (2006). Chitosan bicomponent nanofibers and nanoporous fibers. Carbohydrate
Research, 341, 374 – 381.
Liao, Y., Loh, C-H., Tian, M., Wang, R., Fane, G.A. (2018). Progress in electrospun polymeric
nanofibrous membranes for water treatment: Fabrication, modification and applications. Progress in
Polymer Science, 77, 69-94.
Methaapanon, R., Chutchakul, K., & Pavarajarn, V. (2019). Photocatalytic zinc oxide on flexible
polyacrylonitrile nanofibers via sol–gel coaxial electrospinning. Ceramics International.
Mirjalili, M., & Zohoori, S. (2016). Review for application of electrospinning and electrospun nanofibers
technology in textile industry. J Nanostruct Chem, 6, 207-213.
Nagihan, O., Pınar, T., & Filiz, A. (2014). Affecting parameters on electrospinning process and
characterization of electrospun gelatin nanofibers. Food Hydrocolloids 39, 19-26.
123
Niu, H., Lin, T., & Wang, X. (2009). Needleless Electrospinning. I. A Comparison of Cylinder and Disk
Nozzles. Journal ofAppliedPolymer Science, 114, 3524-3530.
Noyan, C.B.E., Onder, E., Sarier, N., Arat, R. (2018). Development of heat storing poly(acrylonitrile)
nanofibers by coaxial electrospinning. Thermochimica Acta, 662, 135-148.
Nguyen, T.T.T., Chung, O.H., & Park, J.S. (2011). Coaxial electrospun poly(lactic acid)/chitosan
(core/shell) composite nanofibers and their antibacterial activity. Carbohydrate Polymer, 86, 1799-1806.
Radacsi, N., Giapis, P.K., Ovari, G., Szabó-Révész, P., Ambrus, R. (2019). Electrospun nanofiber-based
niflumic acid capsules with superiorphysicochemical properties. Journal of Pharmaceutical and
Biomedical Analysis, 166, 371-378.
Rojas, A., Velasquez, E., Garrido, L., Galotto, M.J., Dicastillo, L.C. (2020). Design of active electrospun
mats with single and core-shell structures to achieve different curcumin release kinetics. Journal of Food
Engineering. 273.
Roya, S., Alireza, S., Zohreh, M., Samadi, F. Y., Elham, I.(2016). Biocompatible Electrospinning
Chitosan Nanofibers: A Novel Delivery System with Superior Local Cancer Therapy. Carbohydrate
Polymers.
Pant, B., Park, M & Park, S-J. (2019). Drug Delivery Applications of Core-Sheath Nanofibers Prepared
by Coaxial Electrospinning: A Review. pharmaceutics, 11,305.
Patil, J.V., Mali, S.S., Kamble, S.A., Hong, K.C., Kim, H.J., Patil, S.P. (2017). Electrospinning: A
versatile technique for making of 1D growth of nanostructured nanofibers and its applications: an
experimental approach. Applied Surface Science.
Peng, H., Xiao, L., Sun, K., Ma, G., Wei, G., Lei, Z. (2019). Preparation of a cheap and environmentally
friendly separator by coaxial electrospinning toward suppressing self-discharge of supercapacitors.
Journal of Power Sources, 435.
Quin, Z., Zhang, P., Wu, Z., Yin, M., Geng, Y., Pan, K. (2018). Coaxial electrospinning for flexible
uniform white-light-emiting porous fibrous membrane. Materials & Desing, 145(5), 175-181.
Sahay, R., Thavasi, V., & Ramakrishna, S. (2011). Design modifications in electrospinning setup for
advanced applications. Journal of nanomaterials, 1-17.
Tang, Y., Chen, L., Zhao, K., Wu, Z., Wang, Y., & Tan, Q. (2016). Fabrication of PLGA/HA (core)-
collagen/amoxicillin (shell) nanofiber membranes through coaxial electrospinning for guided tissue
regeneration. Composites Science and Technology, 125, 100–107.
Theron, S.A., Yarin, A.L., Zussman, E, & Kroll, E. (2005). Multiple jets in electrospinning: experiment
and modeling. Polymer, 46, 2889-2899.
Tomaszewski, W, & Szadkowski, M. (2005), Investigation of Electrospinning with the Use of a Multi-
jet Electrospinning Head. Fibres & Textiles in Eastern Europe, 13(4), 22-26.
Varabhas, J,S., Chase, G.G., Reneker, D.H. (2008). Electrospun nanofibers from a porous hollow tuve.
Polymer, 49, 4226-4229.
Vass, p., Szabó, E., Domokos,A., Hirsch, E., Galata, D., Farkas, B., Démuth, B., Andersen, K,S., Vigh,
T., Verreck, G., Marosi, G., Nagy, K.Z. (2019). Scale-up of electrospinning technology: Applications in
the pharmaceutical industry. WIREs Nanomedicine and Nanobiotechnology.
Vyslouzilova, L., Buzgo, M., Pokorny, P., Chvojka, J., Mickova, A., Rampichova, M., Amler, E. (2017).
Needleless coaxial electrospinning: A novel approach to mass production of coaxial nanofibers.
International Journal of Pharmaceutics, 516(1–2), 293–300.
124
Wang, C., Yan, K-W., Lin, Y-D, & Hsieh, C.H.P. (2010). Biodegradable Core/Shell Fibers by Coaxial
Electrospinning: Processing, Fiber Characterization, and Its Application in Sustained Drug Release.
Macromolecules, 43, 6389-6397.
Wang, L., Zhang, C., Gao, F., & Pan, G. (2016). Needleless electrospinning for scaled-up production of
ultrafine chitosan hybrid nanofibers used for air filtration, RSC Adv, 6 (107), 105988-105995.
Wu, Y., He, G., Wu, X., Yuan, Q., Gong, X., Zhen, D., Sun, B. (2019). Confinement of functionalized
graphene oxide in sulfonated poly (ether ether ketone) nanofibers by coaxial electrospinning for polymer
electrolyte membranes. International Journal of Hidrogen Energy, 44, 7494.7504.
Yan, E., Fan, Y., Sun, Z., Gao, J., Hao, X., Pei, S., Wang, C., Sun, L., Zhang, D. (2014). Biocompatible
core–shell electrospun nanofibers as potential application for chemotherapy against ovary cancer.
Materials Science and Engineering C, 41, 217-223.
Yarin, A., (2011). Coaxial electrospinning and emulsion electrospinning of core–shell fibers. Polym.
Adv. Technol. 22, 310–317.
Yao, Z. C., Gao, Y., Chang, M. W., Ahmad, Z., & Li, J. S. (2016). Regulating poly-caprolactone fiber
characteristics in-situ during one-step coaxial electrospinning via enveloping liquids. Materials Letters,
183, 202–206.
Yoon, J., Yang, H-S., Lee, B-S, & Yu, W-R. (2018). Recent Progress in Coaxial Electrospinning: New
Parameters, Various Structures, and Wide Applications. Advanced Materials, 30, 1704765.
Yu, D.-G., Xu, Y., Li, Z., Du, L.-P., Zhao, B.-G., & Wang, X. (2014). Coaxial electrospinning with
mixed solvents: From flat to round eudragit L100 nanofibers for better colon-targeted sustained drug
release profiles. Journal of Nanomaterials, 8.
Zhang, Y., Ouyang, H., Lim, C. T., Ramakrishna, S., & Huang, Z.-M. (2004). Electrospinning of Gelatin
Fibers and Gelatin/PCL Composite Fibrous Sacffolds. Interscience, 156 - 165.
Zhang, H., Qin, X., Wu, J., He, Y.-B., Du, H., Li, B., Kang, F., (2015). Electrospun core–shell
silicon/carbon fibers with an internal honeycomb-like conductive carbon framework as an anode for
lithium ion batteries. J. Mater. Chem. A. 3, 7112–7120.
Zhang, M., Huang, X., Xin, H., Li, D., Zhao, Y., Shi, L., Lin, Y., Yu, J., Yu, Z., Zhu, C., Xu, J. (2019).
Coaxial electrospinning synthesis hollow Mo2C@C core-shell nanofibers for high-performance and
long-term lithium-ion batteries. Applied Surface Science, 473, 352-358.
Zhou, F-L., Gong, R-H., & Porat, I. (2009). Polymeric Nanofibers via Flat Spinneret Electrospinning.
Polymer Engineering and Science, 2475-2481.
125
Chapter 9 Green infrastructure: An ally to improve urban runoff management in
semi-arid areas
Capítulo 9 Infraestructura verde: Una aliada para mejorar la gestión de escorrentías
urbanas en zonas semiáridas
LIZÁRRAGA-MENDIOLA, Liliana†*, VÁZQUEZ-RODRÍGUEZ, Gabriela A. and BIGURRA-
ALZATI, Carlos Alfredo
Academic Area of Engineering and Architecture, Universidad Autónoma del Estado de Hidalgo
Academic Area of Chemistry, Universidad Autónoma del Estado de Hidalgo
Academic Area of Engineering and Architecture, Universidad Autónoma del Estado de Hidalgo
ID 1st Author: Liliana, Lizárraga-Mendiola / ORC ID: 0000-0001-6320-8923, CVU CONACYT:
99262
ID 1st Co-author: Gabriela Alejandra, Vázquez-Rodríguez / ORC ID: 0000-0001-8351-8451, CVU
CONACYT: 25767
ID 2nd Co-author: Carlos Alfredo, Bigurra-Alzati / ORC ID: 0000-0001-9740-9483, CVU CONACYT:
352163
DOI: 10.35429/H.2021.6.125.146
L. Lizárraga, G. Vázquez and C. Bigurra
A. Marroquín, J. Olivares, M. Ramírez and L. Cruz (Coord) Engineering and Technology. Handbooks-©ECORFAN-México,
Querétaro, 2021.
126
Abstract
The growth of cities negatively alters the urban hydrological cycle, and causes problems such as the
reduction of their permeable surfaces, increases in temperature that affect the thermal comfort of
buildings, large volumes of urban runoff that produce floods, and its contamination. This work highlights
the hydrological, hydraulic, and ecosystem advantages of green infrastructure as a strategy of climate
change adaptation in cities with a semi-arid climate. Case studies published in international journals,
design criteria in technical manuals, national and international standards, and regulations were reviewed.
The types of green infrastructure most studied and implemented in various regions with a semi-arid
climate were selected, and the most frequently applied criteria and recommendations were chosen. It was
possible to determine the most appropriate design and construction parameters for their adaptation in
spaces already provided with gray infrastructure, where they can be applied as complementary works
that help to solve problems of water shortages to the population, as well as damage to infrastructure due
to floods, aquifer overexploitation and pollution.
Water scarcity, Floods, Sustainable infrastructure
Resumen
El crecimiento de las ciudades altera negativamente el ciclo hidrológico urbano, y ocasiona
problemáticas tales como la reducción de sus superficies permeables, aumentos en la temperatura que
afectan el confort térmico de las edificaciones, grandes volúmenes de escorrentía urbana que producen
inundaciones, así como su contaminación. En este trabajo se destacan las principales ventajas
hidrológicas, hidráulicas y ecosistémicas de la infraestructura verde, como una estrategia de adaptación
al cambio climático en ciudades con clima semiárido. Se revisaron casos de estudio publicados en revistas
internacionales, criterios de diseño en manuales técnicos, normas y reglamentos nacionales e
internacionales. Se seleccionaron los tipos de infraestructura verde más estudiados e implementados en
diversas regiones con clima semiárido y se eligieron los criterios y recomendaciones más frecuentemente
aplicados. Fue posible determinar los parámetros de diseño y construcción más apropiados para su
adaptación en espacios que ya cuentan con infraestructura gris, donde se pueden aplicar como obras
complementarias que ayuden a resolver problemáticas de desabasto de agua a la población, así como
daños a la infraestructura por inundaciones, sobreexplotación de acuíferos y contaminación.
Escasez hídrica, Inundaciones, Infraestructura sostenible
1 Introduction
Nearly one billion people living in arid or semi-arid areas of the planet are at risk due to water scarcity
problems (UN, n.d.). An arid zone is defined as a region where water supply is insufficient because
precipitation and atmospheric humidity are lower than the global annual average of 840 mm (González-
Medrano, 2012). Other authors define semi-arid zones as those with precipitation between 250-500 mm
(Lane and Nichols, 1999). In Mexico, the average annual precipitation is 780 mm and some authors
consider that about 63% of the national territory has some level of aridity; in addition, these areas are
inhabited by about 41% of the total population (Díaz-Padilla et al., 2011).
The rainy season mainly comprises the months of June to September; however, about 49% of
these rains occur in the southeastern region of the country, while the central-northern region experiences
significant droughts (CONAGUA, 2018). The constant population growth has also decreased water
availability; in 1950 it was 18,000 m3/inhabitant/a, while by 2015 this was reduced to only 20.5% (3,692
m3/inhabitant/a) (CONAGUA, 2018). Similarly, a large part of the country experiences a high degree of
water pressure (40-100%); this has caused that, at present, about 9 million people do not have access to
drinking water, while 10.4 million do not have access to sewerage services (INEGI, 2015).
This scarcity situation makes it necessary to look for more water supply sources to meet the
population's demand; however, alternative options to conventional infrastructure must also be
considered, in order to mitigate the problems of evaporation, overexploitation, scarcity, contamination
and low availability that exist today. Green infrastructure offers a series of options designed to mitigate
the impacts caused by the natural risks associated with climate change.
127
Among its main advantages are environmental (conservation of resources and biodiversity),
social (construction of water drains or green spaces, which generate an environment that promotes
outdoor coexistence) and economic (job creation, increased property appreciation) (Austin, 2017).
Overall, this type of infrastructure represents benefits by providing more efficient water management, as
well as additional benefits to those of gray or conventional infrastructure. The adaptation of this type of
infrastructure seeks to mimic the conditions that the environment had prior to its urbanization, where the
soil surface and vegetation had the capacity to absorb rainwater, evapotranspire it, infiltrate it, and
recharge aquifers, among other natural functions (UN-HABITAT, 2018). In contrast, we are familiar
with gray infrastructure (that construction that serves as a base for urban activities, their services,
technical means and facilities), which generally fulfill a single function: supplying drinking water to the
population, channeling wastewater through sewage works, improving wastewater quality through
treatment plants, disposing of solid waste in landfills, or mobilizing the population through
communication and transportation routes, among others (NWRM, 2014). Currently, it has been
demonstrated that this type of infrastructure is insufficient to meet the needs of a constantly growing
population with a sustainable vision.
One of the alternatives to mitigate the consequences of urban growth and the negative effects it
represents is to introduce green infrastructure in cities. Among the most common examples are permeable
pavement (Liu et al., 2014; Jia et al., 2015), bioretention systems or rain gardens (Chapman and Horner,
2010), infiltration trenches (Ahiablame et al., 2012) rainwater harvesting on rooftops (Martin-Mikle et
al., 2015), as well as green roofs and green walls (Jia et al., 2015; Martin-Mikle et al., 2015). The
implementation of green infrastructure is an effective tool for climate change adaptation (Melo dos
Santos et al., 2019). Its use in urbanized environments with semi-arid climate can help restore up to 82%
of the hydrological balance (Feng et al., 2016). In arid sites such as Arizona in the United States, green
infrastructure was adapted with xeric vegetation and sustainable irrigation practices; the positive effect
of these measures achieved a saving of 0.77 ± 0.05 ± 0.05 × 10⁸ m3 of water (Yang and Wang, 2017)
and an increase in water availability for the population (Guertin et al., 2015). Choosing this type of
strategies can annually reduce urban runoff (35-45%; Feng et al., 2016) and restore evapotranspiration
(18-25%; Li and Davis, 2009; Feng et al., 2016); moreover, infiltration is favored and ponding is
decreased (84%; Braswell et al., 2018); they have the capacity to remove pollutants through natural
processes (Kamali et al., 2017); they provide ecological benefits (Li and Davis, 2009); they are an option
for domestic self-consumption and waste discharge management (Melo dos Santos and Farias, 2017);
they improve the thermal and acoustic insulation of buildings (Reyes et al., 2016), among others.
The objective of this work is to review the positive effects of green infrastructure as an adaptation
strategy in cities with semi-arid climates where the hydrological cycle has been negatively altered due to
urbanization. Its main hydrological and ecosystemic functions, most commonly recommended design
criteria, physical factors necessary for its adaptation in previously urbanized environments, as well as its
hydraulic efficiency to mitigate flooding and water scarcity problems are defined. The scope of this work
is limited to the effects of urban surface runoff and its management through examples of green
infrastructure in semi-arid climate zones.
2 Main approaches to green infrastructure
Green infrastructure is defined as an emerging urban planning and design concept (Dige, 2015) that
contributes to the resilience of urban ecosystems by providing services to maintain or restore ecological
and hydrological functions (Zölch et al., 2017). Its main applications include reducing runoff from
impervious areas (Martin-Mikle et al., 2015), facilitating infiltration and increasing evapotranspiration
(Zahmatkesh et al., 2015), replicating water balance to preserve local ecosystem integrity (Feng et al.,
2016), and improving infiltrated water quality (Obropta et al., 2018), to name a few. Among their main
attractions are their low cost compared to gray infrastructure works (Jia et al., 2015) and their ability to
adapt to a previously urbanized environment. Its variety of applications is wide, as it can be adapted from
the micro-scale (a building) to the macro-scale (watershed or city). This depends, among other things, on
the function they perform, the space available, as well as the budget and the management of users and
authorities for their implementation. The most common examples are shown in Figure 9.1.

128
Figure 9.1 Most common green infrastructure applications
Source of reference: Image prepared by the authors
The green infrastructure also has several hydrological functions that help to improve the
restoration capacity of the water cycle. The composition of materials and construction elements used is
simple and practical to install. Table 9.1 defines their basic components, as well as the most well-known
hydrological functions.
Table 9.1 Composition and hydrological functions of the green infrastructure.
Ranking Composition Hydrological function Author
Permeable
pavement
Aggregates (gravels), cement and water Infiltrate and reduce runoff Liu et al. (2014); Jia et al.
(2015)
Photocatalytic film on its surface Improve the quality of
infiltrated water
Martin-Mikle et al.
(2015); Zahmatkesh et al.
(2015); Ortega-Villar et
al. (2019)
Rain garden Coarse aggregate layer at the bottom,
medium aggregate layer in the middle layer,
soil and vegetation layer on its surface
Retention and infiltration of
runoff
Chapman and Horner
(2010)
Reducing the amount of
pollutants
Zahmatkesh et al. (2015);
Zúñiga-Estrada et al.
(2020)
Temporarily storing and
treating a volume of runoff
water and improving its quality
Winston et al. (2016);
Zölch et al. (2017); Eaton
(2018); Tavakol-Davani
et al. (2019)
Rainwater
harvesting
Tanks for storing rainwater that is normally
used for non-drinking purposes
Public supply Martin-Mikle et al.
(2015)
Green roofs
and walls
They have waterproofing at the base, anti-
root layer, intermediate layer to reduce
saturation, soil substrate and vegetation on
its surface
Reduce nutrients and
sediments
Martin-Mikle et al.
(2015)
Reducing the amount of runoff
and pollutants
Jia et al. (2015); Tavakol-
Davani et al. (2019)
Increase evapotranspiration Zölch et al. (2017)
Infiltration
trench
A layer of fine aggregate on the bottom and
a layer of coarse aggregate on its surface. It
is used parallel to walkways, sidewalks and
medians. May or may not have vegetation
Reduce runoff, increase
infiltration and filtration, and
reduce pollution
Ahiablame et al. (2012);
Lizárraga-Mendiola et al.
(2017)
Source of reference: Table prepared by the authors
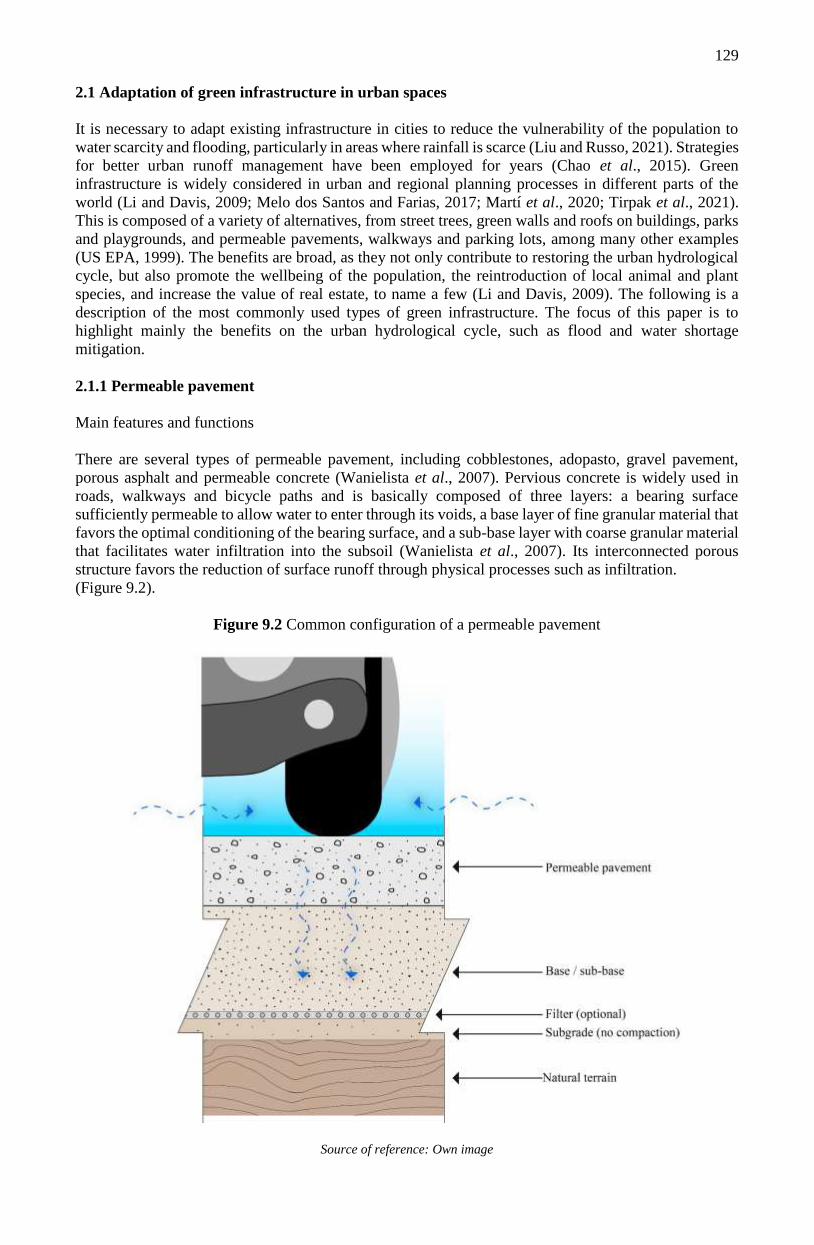
129
2.1 Adaptation of green infrastructure in urban spaces
It is necessary to adapt existing infrastructure in cities to reduce the vulnerability of the population to
water scarcity and flooding, particularly in areas where rainfall is scarce (Liu and Russo, 2021). Strategies
for better urban runoff management have been employed for years (Chao et al., 2015). Green
infrastructure is widely considered in urban and regional planning processes in different parts of the
world (Li and Davis, 2009; Melo dos Santos and Farias, 2017; Martí et al., 2020; Tirpak et al., 2021).
This is composed of a variety of alternatives, from street trees, green walls and roofs on buildings, parks
and playgrounds, and permeable pavements, walkways and parking lots, among many other examples
(US EPA, 1999). The benefits are broad, as they not only contribute to restoring the urban hydrological
cycle, but also promote the wellbeing of the population, the reintroduction of local animal and plant
species, and increase the value of real estate, to name a few (Li and Davis, 2009). The following is a
description of the most commonly used types of green infrastructure. The focus of this paper is to
highlight mainly the benefits on the urban hydrological cycle, such as flood and water shortage
mitigation.
2.1.1 Permeable pavement
Main features and functions
There are several types of permeable pavement, including cobblestones, adopasto, gravel pavement,
porous asphalt and permeable concrete (Wanielista et al., 2007). Pervious concrete is widely used in
roads, walkways and bicycle paths and is basically composed of three layers: a bearing surface
sufficiently permeable to allow water to enter through its voids, a base layer of fine granular material that
favors the optimal conditioning of the bearing surface, and a sub-base layer with coarse granular material
that facilitates water infiltration into the subsoil (Wanielista et al., 2007). Its interconnected porous
structure favors the reduction of surface runoff through physical processes such as infiltration.
(Figure 9.2).
Figure 9.2 Common configuration of a permeable pavement
Source of reference: Own image
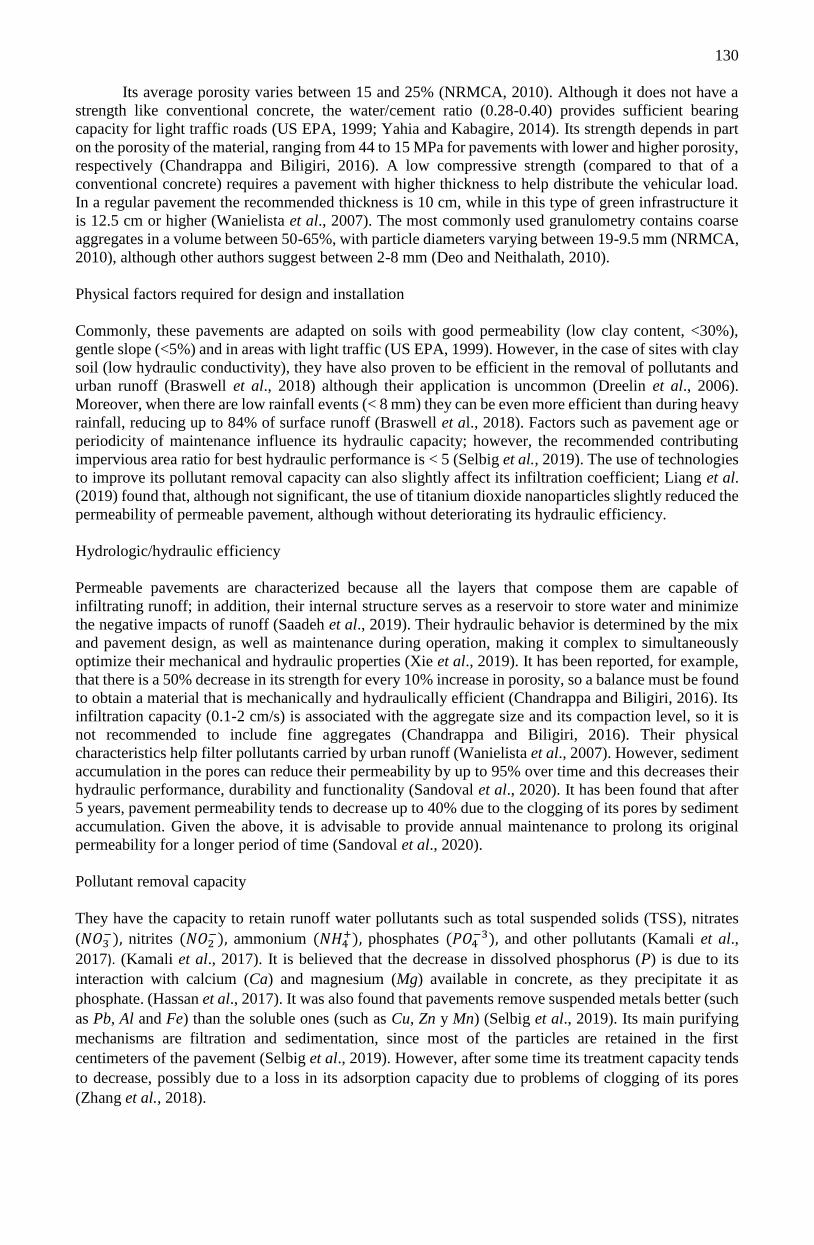
130
Its average porosity varies between 15 and 25% (NRMCA, 2010). Although it does not have a
strength like conventional concrete, the water/cement ratio (0.28-0.40) provides sufficient bearing
capacity for light traffic roads (US EPA, 1999; Yahia and Kabagire, 2014). Its strength depends in part
on the porosity of the material, ranging from 44 to 15 MPa for pavements with lower and higher porosity,
respectively (Chandrappa and Biligiri, 2016). A low compressive strength (compared to that of a
conventional concrete) requires a pavement with higher thickness to help distribute the vehicular load.
In a regular pavement the recommended thickness is 10 cm, while in this type of green infrastructure it
is 12.5 cm or higher (Wanielista et al., 2007). The most commonly used granulometry contains coarse
aggregates in a volume between 50-65%, with particle diameters varying between 19-9.5 mm (NRMCA,
2010), although other authors suggest between 2-8 mm (Deo and Neithalath, 2010).
Physical factors required for design and installation
Commonly, these pavements are adapted on soils with good permeability (low clay content, <30%),
gentle slope (<5%) and in areas with light traffic (US EPA, 1999). However, in the case of sites with clay
soil (low hydraulic conductivity), they have also proven to be efficient in the removal of pollutants and
urban runoff (Braswell et al., 2018) although their application is uncommon (Dreelin et al., 2006).
Moreover, when there are low rainfall events (< 8 mm) they can be even more efficient than during heavy
rainfall, reducing up to 84% of surface runoff (Braswell et al., 2018). Factors such as pavement age or
periodicity of maintenance influence its hydraulic capacity; however, the recommended contributing
impervious area ratio for best hydraulic performance is < 5 (Selbig et al., 2019). The use of technologies
to improve its pollutant removal capacity can also slightly affect its infiltration coefficient; Liang et al.
(2019) found that, although not significant, the use of titanium dioxide nanoparticles slightly reduced the
permeability of permeable pavement, although without deteriorating its hydraulic efficiency.
Hydrologic/hydraulic efficiency
Permeable pavements are characterized because all the layers that compose them are capable of
infiltrating runoff; in addition, their internal structure serves as a reservoir to store water and minimize
the negative impacts of runoff (Saadeh et al., 2019). Their hydraulic behavior is determined by the mix
and pavement design, as well as maintenance during operation, making it complex to simultaneously
optimize their mechanical and hydraulic properties (Xie et al., 2019). It has been reported, for example,
that there is a 50% decrease in its strength for every 10% increase in porosity, so a balance must be found
to obtain a material that is mechanically and hydraulically efficient (Chandrappa and Biligiri, 2016). Its
infiltration capacity (0.1-2 cm/s) is associated with the aggregate size and its compaction level, so it is
not recommended to include fine aggregates (Chandrappa and Biligiri, 2016). Their physical
characteristics help filter pollutants carried by urban runoff (Wanielista et al., 2007). However, sediment
accumulation in the pores can reduce their permeability by up to 95% over time and this decreases their
hydraulic performance, durability and functionality (Sandoval et al., 2020). It has been found that after
5 years, pavement permeability tends to decrease up to 40% due to the clogging of its pores by sediment
accumulation. Given the above, it is advisable to provide annual maintenance to prolong its original
permeability for a longer period of time (Sandoval et al., 2020).
Pollutant removal capacity
They have the capacity to retain runoff water pollutants such as total suspended solids (TSS), nitrates
(𝑁𝑂3−), nitrites (𝑁𝑂2
−), ammonium (𝑁𝐻4+), phosphates (𝑃𝑂4
−3), and other pollutants (Kamali et al.,
2017). (Kamali et al., 2017). It is believed that the decrease in dissolved phosphorus (P) is due to its
interaction with calcium (Ca) and magnesium (Mg) available in concrete, as they precipitate it as
phosphate. (Hassan et al., 2017). It was also found that pavements remove suspended metals better (such
as Pb, Al and Fe) than the soluble ones (such as Cu, Zn y Mn) (Selbig et al., 2019). Its main purifying
mechanisms are filtration and sedimentation, since most of the particles are retained in the first
centimeters of the pavement (Selbig et al., 2019). However, after some time its treatment capacity tends
to decrease, possibly due to a loss in its adsorption capacity due to problems of clogging of its pores
(Zhang et al., 2018).
131
Technologies have also been used for urban runoff treatment such as the incorporation of
photocatalytic coatings, e.g., based on nanoparticles of TiO2, for the removal of various pollutants from
runoff water (Liang et al., 2019). Photocatalytic oxidation occurs on the surface of permeable pavement
in contact with ultraviolet light (Hassan et al., 2017). Then, Xu et al. (2020) determined that a permeable
pavement with a granulometry between 5-10 mm impregnated with nanoparticles of TiO2 had a greater
capacity for oxidation of NO than one with larger particles. In another study, nanoparticles of Fe2O3 as a
coating were found to be capable of removing Mn and various microbiological indicators due to oxidation
processes (Ortega-Villar et al., 2019).
2.1.2 Rain gardens
Main features and functions
They are also known as bioretention systems, biofilters or swales (Le Costumer et al., 2009). They are
widely used in urban environments to improve their quality and hydrological impacts on infrastructure
(Vijayaraghavan et al., 2021). They are able to reduce runoff, mitigate its pollutants and provide aesthetic
and ecological benefits (Li and Davis, 2009). They favor the development of local flora and fauna,
improve water quality and infiltrate stormwater runoff, thus mitigating waterlogging problems (Tirpak
et al., 2021). Although they can have different sizes and shapes, they are mainly composed of vegetation
on a substrate layer, fine (sand) and coarse (gravel) granular material; occasionally, they can include
drainage at their base to increase their hydraulic conductivity (Vijayaraghavan et al., 2021) (Figure 9.3).
The granulometry of the filter media must drain quickly, but at the same time, it must allow sufficient
retention time for the treatment of runoff and vegetation growth (Le Costumer et al., 2009).
Figure 9.3 Common configuration of a rain garden
Source of reference: Own image
Physical factors required for design and installation
They are a very versatile type of green infrastructure; however, it is important to consider the catchment
area and the type of pollutants they will infiltrate, since selecting the most efficient design will depend
on this (Tirpak et al., 2021).
132
It is possible to combine their shape, size, filtering materials and the type of vegetation, adapt
facilities to partially store the infiltrated water or increase its hydraulic conductivity. On the other hand,
in climates with low rainfall it is advisable to increase the density of native vegetation in this type of
infrastructure, since they have the capacity to absorb pollutants through plants and microbial
communities that proliferate in their soil (Houdeschel et al., 2012). Likewise, it is advisable to previously
characterize the filtering materials in order to improve their decontaminant treatment capacity and predict
negative interactions with runoff water (Zúñiga-Estrada et al., 2020). Some examples used are gravels
of granitic composition with very low dissolving capacity (Caldelas et al., 2021) as well as pebbles,
quartz sand, slag, loess and activated carbon due to their high porosity and adsorption capacity (Zhang
et al., 2021a).
Hydrologic/hydraulic efficiency
Their hydrological performance depends on many factors, such as design configuration, location, average
annual precipitation, potential evapotranspiration, ratio of catchment area to rain garden area, subsoil
infiltration rate, as well as the composition of the growing substrate (Skorobogatov et al., 2020). The
pore size of the filter media is also thought to influence water availability to plants, so the presence of
mesopores (0.2 to 60 μm) is desirable (Skorobogatov et al., 2020). Its permeability may decrease as
incoming sediment accumulates and clogs the pores of the material; however, vegetation roots play an
important role in counteracting this effect (New Jersey Department of Environmental Protection, 2004).
It is recommended that its hydraulic conductivity be at least 12.5 mm/h (ARC, 2003), although other
sources recommend between 50-200 mm/h (Melbourne Water, 2005) and 4-6 mm/min (Zhang et al.,
2021b).
Depending on the type of vegetation selected, their roots have the ability to promote the passage
of water and air through the pores, mainly in the surface layers. Houdeschel et al. (2012) found that
grasses can neutralize clogging due to sediment accumulation in this type of infrastructure. Le Costumer
et al. (2012) demonstrated that plants with thick roots maintain their infiltration capacity and also delay
the clogging of their pores with sediments. However, regardless of these benefits, the selection of
vegetation should take into account other factors such as its adaptation to the local climate, its
phytoremediation potential, sorption capacity, high biomass production and extensive root systems,
among others (Vijayaraghavan et al., 2021). Another important hydrological function in rain gardens is
evapotranspiration, which can account for up to 19% of intercepted urban runoff, even when the ratio of
catchment area to garden area is 1:0.045 (Li and Davis, 2009). In another study, it was found that when
this ratio is 2.5%, its retention capacity increases up to 88% (Le Costumer et al., 2012).
Pollutant removal capacity
Rain gardens are effective in treating suspended sediments, heavy metals, nutrients and organic
compounds (Vijayaraghavan et al., 2021). Water quality improves through a complex combination of
natural processes that take place in the filter material, such as adsorption, precipitation, microbial
biodegradation, photodegradation, volatilization and absorption through plants (Caldelas et al., 2021).
As for the materials selected for backfilling, those commonly used (soil with organic matter, sand, clay
loam and clayey sand) have a limited capacity to treat dissolved contaminants, which tend to infiltrate
into the subsoil (Tirpak et al., 2021). Studies have proven their ability to reduce the presence of nutrients
(N and P), metals and metalloids, as well as microplastics (Smyth et al., 2021). The presence of
microplastics in urban runoff is considered to come from various anthropogenic sources such as tire and
road wear, plastics, paints, construction materials, industrial waste, among others. Their concentration
tends to be higher (66-191 particles/L) during the first rains after prolonged periods of drought (Piñon-
Colin et al., 2020). When they enter a rain garden, retention of up to 84% is possible (Smyth et al., 2021).
2.1.3 Rainwater harvesting
Main features and functions
The collection, storage and use of rainwater in urban areas can have a positive impact on the public
supply system, since it would not only facilitate the reduction in the demand and use of drinking water,
but also mitigate the volume of urban runoff that occasionally causes flooding and negative damage to
infrastructure (Melo dos Santos and Farias, 2017).
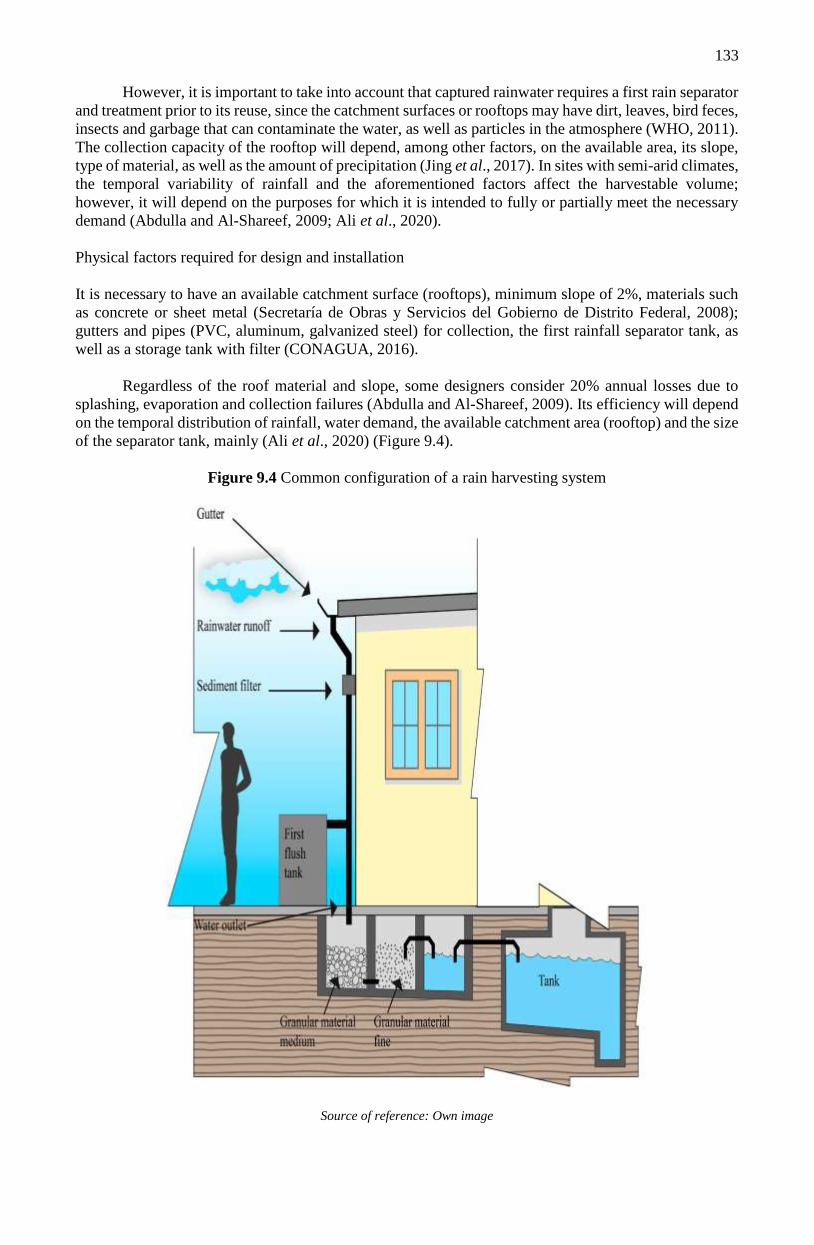
133
However, it is important to take into account that captured rainwater requires a first rain separator
and treatment prior to its reuse, since the catchment surfaces or rooftops may have dirt, leaves, bird feces,
insects and garbage that can contaminate the water, as well as particles in the atmosphere (WHO, 2011).
The collection capacity of the rooftop will depend, among other factors, on the available area, its slope,
type of material, as well as the amount of precipitation (Jing et al., 2017). In sites with semi-arid climates,
the temporal variability of rainfall and the aforementioned factors affect the harvestable volume;
however, it will depend on the purposes for which it is intended to fully or partially meet the necessary
demand (Abdulla and Al-Shareef, 2009; Ali et al., 2020).
Physical factors required for design and installation
It is necessary to have an available catchment surface (rooftops), minimum slope of 2%, materials such
as concrete or sheet metal (Secretaría de Obras y Servicios del Gobierno de Distrito Federal, 2008);
gutters and pipes (PVC, aluminum, galvanized steel) for collection, the first rainfall separator tank, as
well as a storage tank with filter (CONAGUA, 2016).
Regardless of the roof material and slope, some designers consider 20% annual losses due to
splashing, evaporation and collection failures (Abdulla and Al-Shareef, 2009). Its efficiency will depend
on the temporal distribution of rainfall, water demand, the available catchment area (rooftop) and the size
of the separator tank, mainly (Ali et al., 2020) (Figure 9.4).
Figure 9.4 Common configuration of a rain harvesting system
Source of reference: Own image
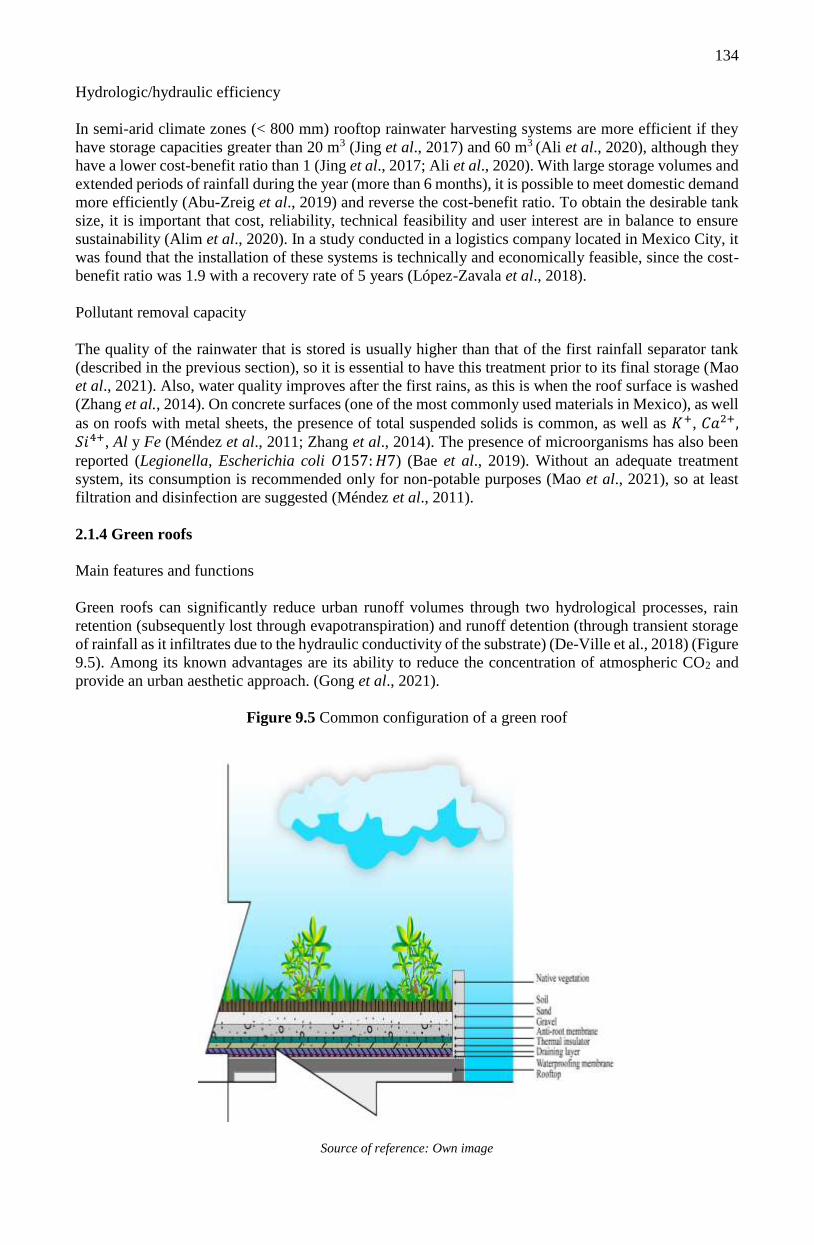
134
Hydrologic/hydraulic efficiency
In semi-arid climate zones (< 800 mm) rooftop rainwater harvesting systems are more efficient if they
have storage capacities greater than 20 m3 (Jing et al., 2017) and 60 m3 (Ali et al., 2020), although they
have a lower cost-benefit ratio than 1 (Jing et al., 2017; Ali et al., 2020). With large storage volumes and
extended periods of rainfall during the year (more than 6 months), it is possible to meet domestic demand
more efficiently (Abu-Zreig et al., 2019) and reverse the cost-benefit ratio. To obtain the desirable tank
size, it is important that cost, reliability, technical feasibility and user interest are in balance to ensure
sustainability (Alim et al., 2020). In a study conducted in a logistics company located in Mexico City, it
was found that the installation of these systems is technically and economically feasible, since the cost-
benefit ratio was 1.9 with a recovery rate of 5 years (López-Zavala et al., 2018).
Pollutant removal capacity
The quality of the rainwater that is stored is usually higher than that of the first rainfall separator tank
(described in the previous section), so it is essential to have this treatment prior to its final storage (Mao
et al., 2021). Also, water quality improves after the first rains, as this is when the roof surface is washed
(Zhang et al., 2014). On concrete surfaces (one of the most commonly used materials in Mexico), as well
as on roofs with metal sheets, the presence of total suspended solids is common, as well as 𝐾+, 𝐶𝑎2+, 𝑆𝑖4+, Al y Fe (Méndez et al., 2011; Zhang et al., 2014). The presence of microorganisms has also been
reported (Legionella, Escherichia coli 𝑂157: 𝐻7) (Bae et al., 2019). Without an adequate treatment
system, its consumption is recommended only for non-potable purposes (Mao et al., 2021), so at least
filtration and disinfection are suggested (Méndez et al., 2011).
2.1.4 Green roofs
Main features and functions
Green roofs can significantly reduce urban runoff volumes through two hydrological processes, rain
retention (subsequently lost through evapotranspiration) and runoff detention (through transient storage
of rainfall as it infiltrates due to the hydraulic conductivity of the substrate) (De-Ville et al., 2018) (Figure
9.5). Among its known advantages are its ability to reduce the concentration of atmospheric CO2 and
provide an urban aesthetic approach. (Gong et al., 2021).
Figure 9.5 Common configuration of a green roof
Source of reference: Own image
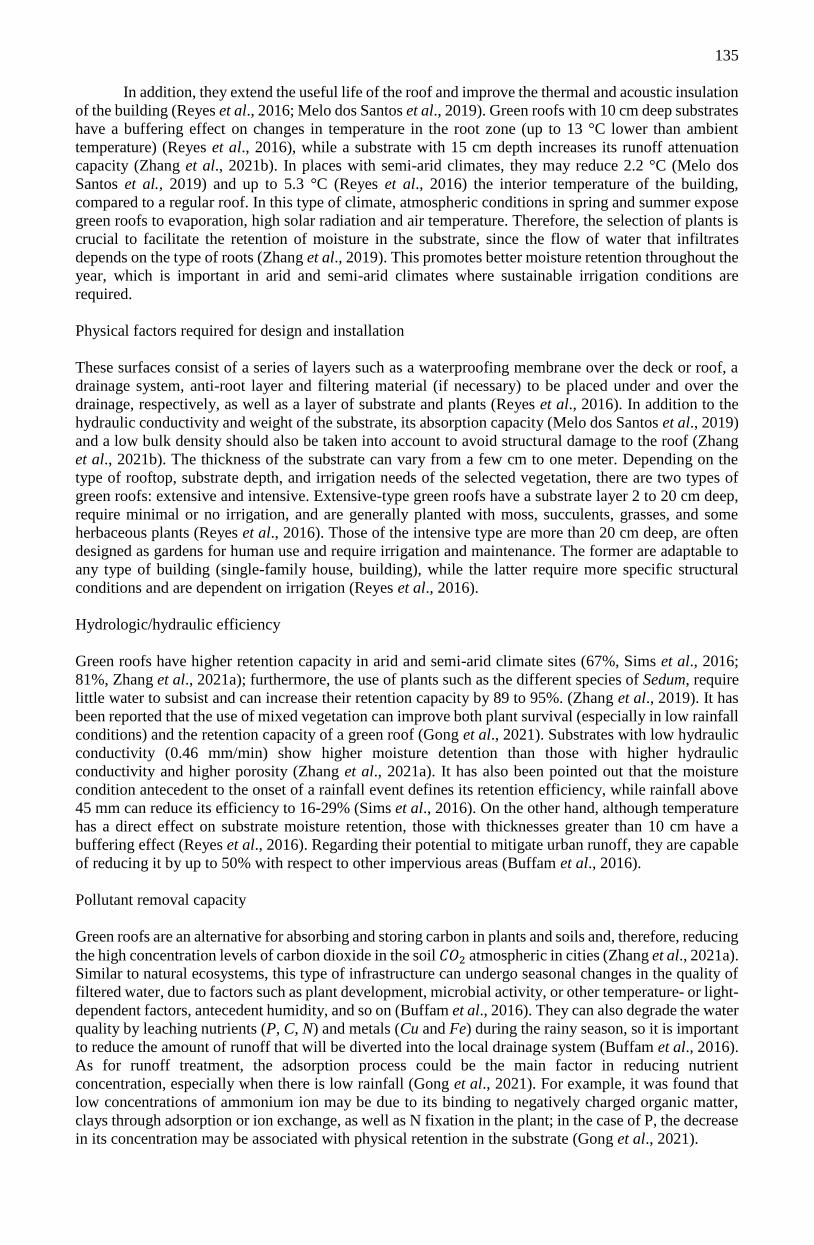
135
In addition, they extend the useful life of the roof and improve the thermal and acoustic insulation
of the building (Reyes et al., 2016; Melo dos Santos et al., 2019). Green roofs with 10 cm deep substrates
have a buffering effect on changes in temperature in the root zone (up to 13 °C lower than ambient
temperature) (Reyes et al., 2016), while a substrate with 15 cm depth increases its runoff attenuation
capacity (Zhang et al., 2021b). In places with semi-arid climates, they may reduce 2.2 °C (Melo dos
Santos et al., 2019) and up to 5.3 °C (Reyes et al., 2016) the interior temperature of the building,
compared to a regular roof. In this type of climate, atmospheric conditions in spring and summer expose
green roofs to evaporation, high solar radiation and air temperature. Therefore, the selection of plants is
crucial to facilitate the retention of moisture in the substrate, since the flow of water that infiltrates
depends on the type of roots (Zhang et al., 2019). This promotes better moisture retention throughout the
year, which is important in arid and semi-arid climates where sustainable irrigation conditions are
required.
Physical factors required for design and installation
These surfaces consist of a series of layers such as a waterproofing membrane over the deck or roof, a
drainage system, anti-root layer and filtering material (if necessary) to be placed under and over the
drainage, respectively, as well as a layer of substrate and plants (Reyes et al., 2016). In addition to the
hydraulic conductivity and weight of the substrate, its absorption capacity (Melo dos Santos et al., 2019)
and a low bulk density should also be taken into account to avoid structural damage to the roof (Zhang
et al., 2021b). The thickness of the substrate can vary from a few cm to one meter. Depending on the
type of rooftop, substrate depth, and irrigation needs of the selected vegetation, there are two types of
green roofs: extensive and intensive. Extensive-type green roofs have a substrate layer 2 to 20 cm deep,
require minimal or no irrigation, and are generally planted with moss, succulents, grasses, and some
herbaceous plants (Reyes et al., 2016). Those of the intensive type are more than 20 cm deep, are often
designed as gardens for human use and require irrigation and maintenance. The former are adaptable to
any type of building (single-family house, building), while the latter require more specific structural
conditions and are dependent on irrigation (Reyes et al., 2016).
Hydrologic/hydraulic efficiency
Green roofs have higher retention capacity in arid and semi-arid climate sites (67%, Sims et al., 2016;
81%, Zhang et al., 2021a); furthermore, the use of plants such as the different species of Sedum, require
little water to subsist and can increase their retention capacity by 89 to 95%. (Zhang et al., 2019). It has
been reported that the use of mixed vegetation can improve both plant survival (especially in low rainfall
conditions) and the retention capacity of a green roof (Gong et al., 2021). Substrates with low hydraulic
conductivity (0.46 mm/min) show higher moisture detention than those with higher hydraulic
conductivity and higher porosity (Zhang et al., 2021a). It has also been pointed out that the moisture
condition antecedent to the onset of a rainfall event defines its retention efficiency, while rainfall above
45 mm can reduce its efficiency to 16-29% (Sims et al., 2016). On the other hand, although temperature
has a direct effect on substrate moisture retention, those with thicknesses greater than 10 cm have a
buffering effect (Reyes et al., 2016). Regarding their potential to mitigate urban runoff, they are capable
of reducing it by up to 50% with respect to other impervious areas (Buffam et al., 2016).
Pollutant removal capacity
Green roofs are an alternative for absorbing and storing carbon in plants and soils and, therefore, reducing
the high concentration levels of carbon dioxide in the soil 𝐶𝑂2 atmospheric in cities (Zhang et al., 2021a).
Similar to natural ecosystems, this type of infrastructure can undergo seasonal changes in the quality of
filtered water, due to factors such as plant development, microbial activity, or other temperature- or light-
dependent factors, antecedent humidity, and so on (Buffam et al., 2016). They can also degrade the water
quality by leaching nutrients (P, C, N) and metals (Cu and Fe) during the rainy season, so it is important
to reduce the amount of runoff that will be diverted into the local drainage system (Buffam et al., 2016).
As for runoff treatment, the adsorption process could be the main factor in reducing nutrient
concentration, especially when there is low rainfall (Gong et al., 2021). For example, it was found that
low concentrations of ammonium ion may be due to its binding to negatively charged organic matter,
clays through adsorption or ion exchange, as well as N fixation in the plant; in the case of P, the decrease
in its concentration may be associated with physical retention in the substrate (Gong et al., 2021).
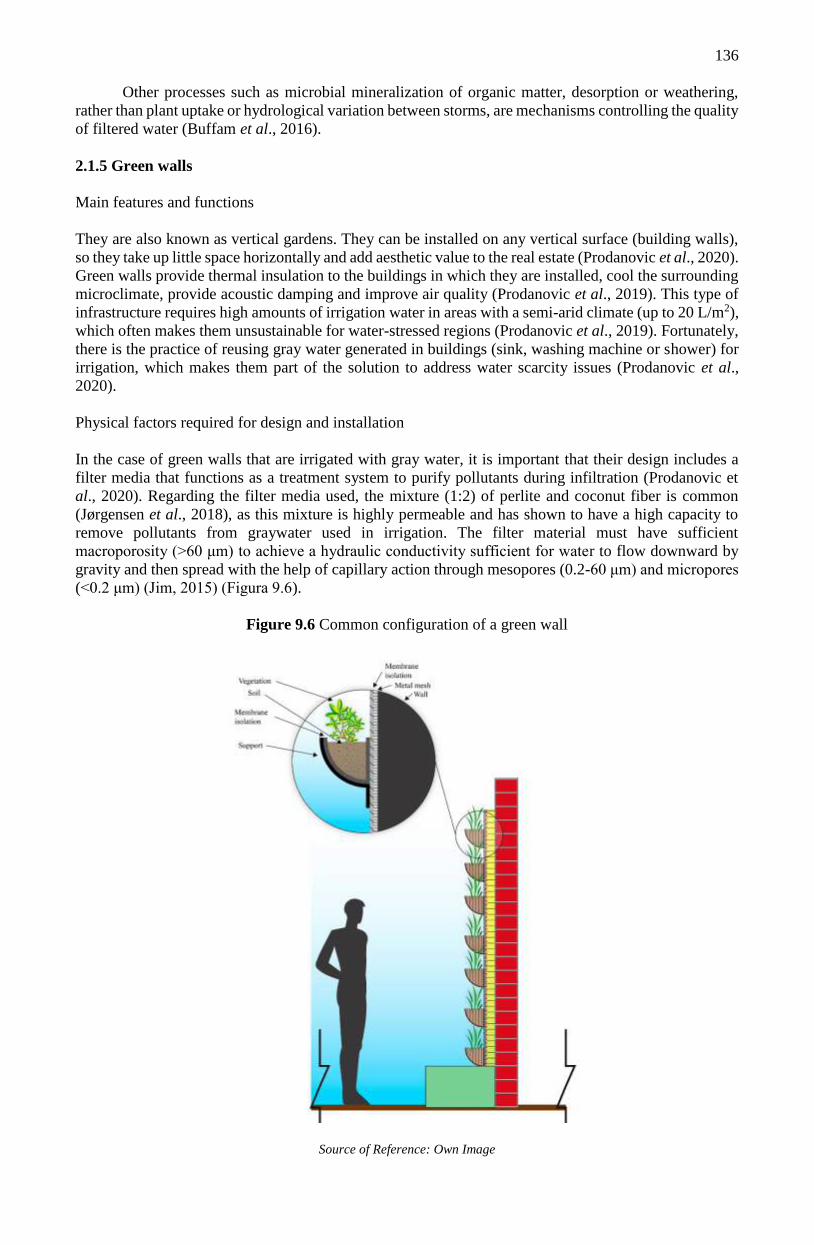
136
Other processes such as microbial mineralization of organic matter, desorption or weathering,
rather than plant uptake or hydrological variation between storms, are mechanisms controlling the quality
of filtered water (Buffam et al., 2016).
2.1.5 Green walls
Main features and functions
They are also known as vertical gardens. They can be installed on any vertical surface (building walls),
so they take up little space horizontally and add aesthetic value to the real estate (Prodanovic et al., 2020).
Green walls provide thermal insulation to the buildings in which they are installed, cool the surrounding
microclimate, provide acoustic damping and improve air quality (Prodanovic et al., 2019). This type of
infrastructure requires high amounts of irrigation water in areas with a semi-arid climate (up to 20 L/m2),
which often makes them unsustainable for water-stressed regions (Prodanovic et al., 2019). Fortunately,
there is the practice of reusing gray water generated in buildings (sink, washing machine or shower) for
irrigation, which makes them part of the solution to address water scarcity issues (Prodanovic et al.,
2020).
Physical factors required for design and installation
In the case of green walls that are irrigated with gray water, it is important that their design includes a
filter media that functions as a treatment system to purify pollutants during infiltration (Prodanovic et
al., 2020). Regarding the filter media used, the mixture (1:2) of perlite and coconut fiber is common
(Jørgensen et al., 2018), as this mixture is highly permeable and has shown to have a high capacity to
remove pollutants from graywater used in irrigation. The filter material must have sufficient
macroporosity (>60 μm) to achieve a hydraulic conductivity sufficient for water to flow downward by
gravity and then spread with the help of capillary action through mesopores (0.2-60 μm) and micropores
(<0.2 μm) (Jim, 2015) (Figura 9.6).
Figure 9.6 Common configuration of a green wall
Source of Reference: Own Image
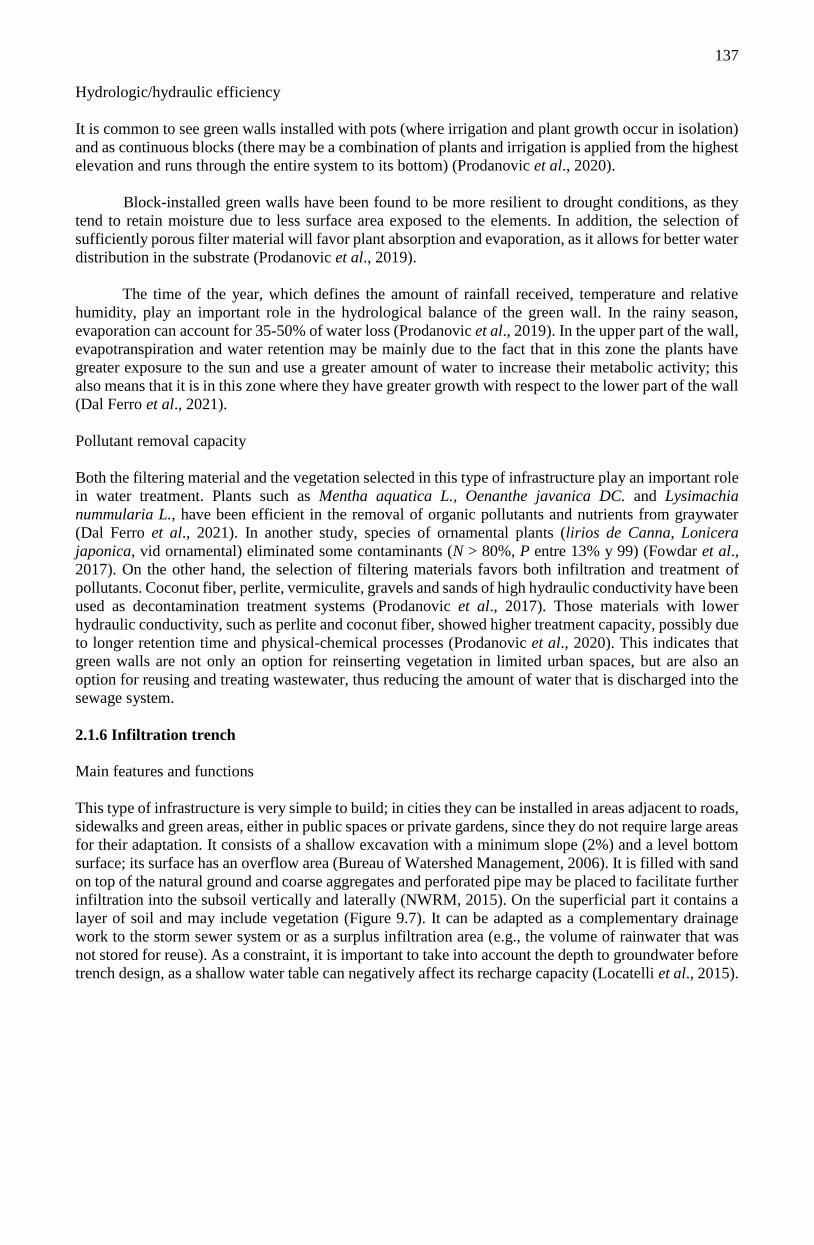
137
Hydrologic/hydraulic efficiency
It is common to see green walls installed with pots (where irrigation and plant growth occur in isolation)
and as continuous blocks (there may be a combination of plants and irrigation is applied from the highest
elevation and runs through the entire system to its bottom) (Prodanovic et al., 2020).
Block-installed green walls have been found to be more resilient to drought conditions, as they
tend to retain moisture due to less surface area exposed to the elements. In addition, the selection of
sufficiently porous filter material will favor plant absorption and evaporation, as it allows for better water
distribution in the substrate (Prodanovic et al., 2019).
The time of the year, which defines the amount of rainfall received, temperature and relative
humidity, play an important role in the hydrological balance of the green wall. In the rainy season,
evaporation can account for 35-50% of water loss (Prodanovic et al., 2019). In the upper part of the wall,
evapotranspiration and water retention may be mainly due to the fact that in this zone the plants have
greater exposure to the sun and use a greater amount of water to increase their metabolic activity; this
also means that it is in this zone where they have greater growth with respect to the lower part of the wall
(Dal Ferro et al., 2021).
Pollutant removal capacity
Both the filtering material and the vegetation selected in this type of infrastructure play an important role
in water treatment. Plants such as Mentha aquatica L., Oenanthe javanica DC. and Lysimachia
nummularia L., have been efficient in the removal of organic pollutants and nutrients from graywater
(Dal Ferro et al., 2021). In another study, species of ornamental plants (lirios de Canna, Lonicera
japonica, vid ornamental) eliminated some contaminants (N > 80%, P entre 13% y 99) (Fowdar et al.,
2017). On the other hand, the selection of filtering materials favors both infiltration and treatment of
pollutants. Coconut fiber, perlite, vermiculite, gravels and sands of high hydraulic conductivity have been
used as decontamination treatment systems (Prodanovic et al., 2017). Those materials with lower
hydraulic conductivity, such as perlite and coconut fiber, showed higher treatment capacity, possibly due
to longer retention time and physical-chemical processes (Prodanovic et al., 2020). This indicates that
green walls are not only an option for reinserting vegetation in limited urban spaces, but are also an
option for reusing and treating wastewater, thus reducing the amount of water that is discharged into the
sewage system.
2.1.6 Infiltration trench
Main features and functions
This type of infrastructure is very simple to build; in cities they can be installed in areas adjacent to roads,
sidewalks and green areas, either in public spaces or private gardens, since they do not require large areas
for their adaptation. It consists of a shallow excavation with a minimum slope (2%) and a level bottom
surface; its surface has an overflow area (Bureau of Watershed Management, 2006). It is filled with sand
on top of the natural ground and coarse aggregates and perforated pipe may be placed to facilitate further
infiltration into the subsoil vertically and laterally (NWRM, 2015). On the superficial part it contains a
layer of soil and may include vegetation (Figure 9.7). It can be adapted as a complementary drainage
work to the storm sewer system or as a surplus infiltration area (e.g., the volume of rainwater that was
not stored for reuse). As a constraint, it is important to take into account the depth to groundwater before
trench design, as a shallow water table can negatively affect its recharge capacity (Locatelli et al., 2015).
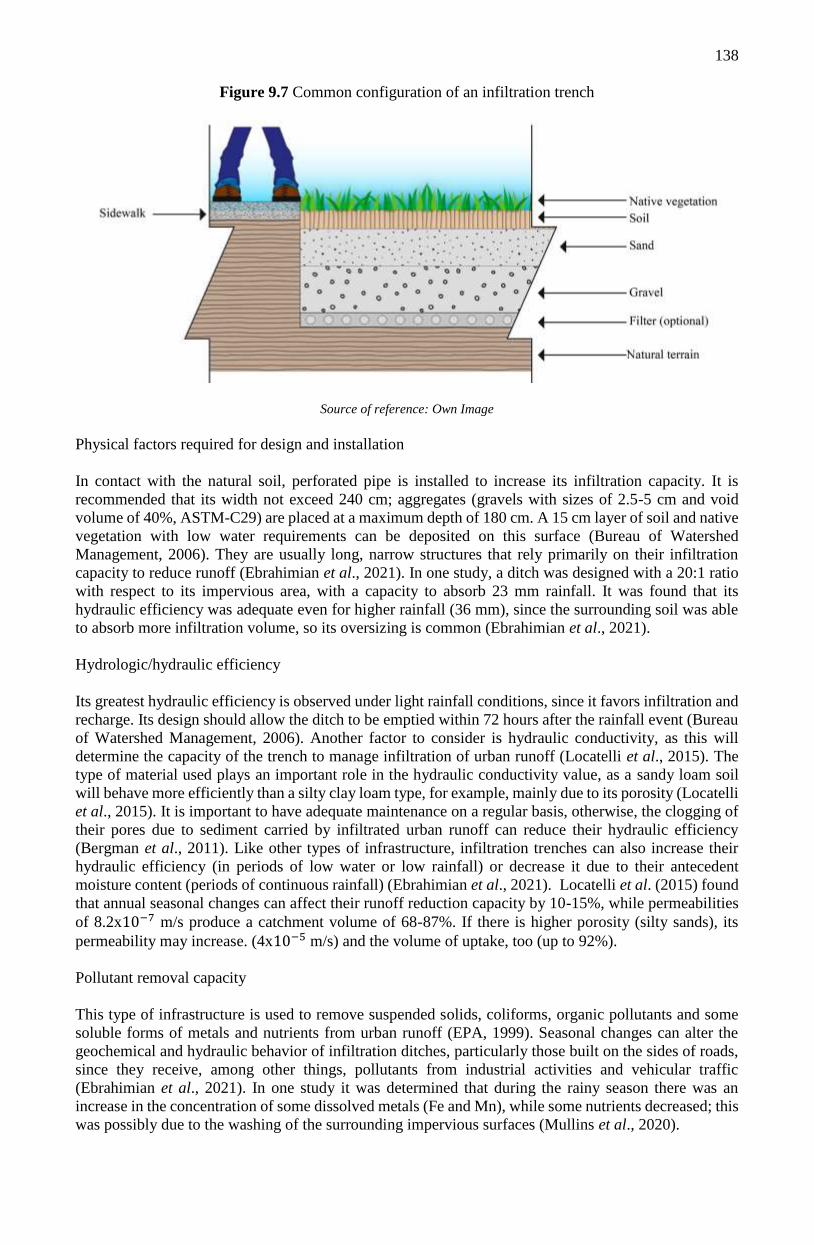
138
Figure 9.7 Common configuration of an infiltration trench
Source of reference: Own Image
Physical factors required for design and installation
In contact with the natural soil, perforated pipe is installed to increase its infiltration capacity. It is
recommended that its width not exceed 240 cm; aggregates (gravels with sizes of 2.5-5 cm and void
volume of 40%, ASTM-C29) are placed at a maximum depth of 180 cm. A 15 cm layer of soil and native
vegetation with low water requirements can be deposited on this surface (Bureau of Watershed
Management, 2006). They are usually long, narrow structures that rely primarily on their infiltration
capacity to reduce runoff (Ebrahimian et al., 2021). In one study, a ditch was designed with a 20:1 ratio
with respect to its impervious area, with a capacity to absorb 23 mm rainfall. It was found that its
hydraulic efficiency was adequate even for higher rainfall (36 mm), since the surrounding soil was able
to absorb more infiltration volume, so its oversizing is common (Ebrahimian et al., 2021).
Hydrologic/hydraulic efficiency
Its greatest hydraulic efficiency is observed under light rainfall conditions, since it favors infiltration and
recharge. Its design should allow the ditch to be emptied within 72 hours after the rainfall event (Bureau
of Watershed Management, 2006). Another factor to consider is hydraulic conductivity, as this will
determine the capacity of the trench to manage infiltration of urban runoff (Locatelli et al., 2015). The
type of material used plays an important role in the hydraulic conductivity value, as a sandy loam soil
will behave more efficiently than a silty clay loam type, for example, mainly due to its porosity (Locatelli
et al., 2015). It is important to have adequate maintenance on a regular basis, otherwise, the clogging of
their pores due to sediment carried by infiltrated urban runoff can reduce their hydraulic efficiency
(Bergman et al., 2011). Like other types of infrastructure, infiltration trenches can also increase their
hydraulic efficiency (in periods of low water or low rainfall) or decrease it due to their antecedent
moisture content (periods of continuous rainfall) (Ebrahimian et al., 2021). Locatelli et al. (2015) found
that annual seasonal changes can affect their runoff reduction capacity by 10-15%, while permeabilities
of 8.2x10⁻⁷ m/s produce a catchment volume of 68-87%. If there is higher porosity (silty sands), its
permeability may increase. (4x10⁻⁵ m/s) and the volume of uptake, too (up to 92%).
Pollutant removal capacity
This type of infrastructure is used to remove suspended solids, coliforms, organic pollutants and some
soluble forms of metals and nutrients from urban runoff (EPA, 1999). Seasonal changes can alter the
geochemical and hydraulic behavior of infiltration ditches, particularly those built on the sides of roads,
since they receive, among other things, pollutants from industrial activities and vehicular traffic
(Ebrahimian et al., 2021). In one study it was determined that during the rainy season there was an
increase in the concentration of some dissolved metals (Fe and Mn), while some nutrients decreased; this
was possibly due to the washing of the surrounding impervious surfaces (Mullins et al., 2020).

139
Also, when large amounts of runoff are received and the water table is shallow, saturation of the
filter material may increase and form anaerobic zones, leading to some heterotrophic bacteria rapidly
consuming the little oxygen available (Machusick et al., 2011). This behavior facilitates the mobilization
of some metals and metalloids through the reduction of metal oxides (Mullins et al., 2020).
2.2 Mitigation of water scarcity
It is evident that water scarcity affects a large part of the population living in arid and semi-arid areas,
either due to prolonged droughts or poor management (Yang and Wang, 2017). This paper reviews green
infrastructure alternatives to mitigate this problem, identifying that rainwater harvesting on rooftops can
positively and directly impact users, by collecting in situ and have it available almost immediately.
Among its main advantages are that most buildings can collect it; it is only necessary to have a minimum
slope, adequate surfaces to avoid contamination or unnecessary losses, as well as periodic maintenance.
As for its storage and treatment prior to consumption, it will depend on the space available, as well as
the user's budget for its installation, since, as mentioned by Ali et al. (2020), the larger the collection and
storage area, the greater the availability of water for self-consumption. Table 9.2 shows examples studied
in different parts of the world with semi-arid climates.
Table 9.2 Rainfall distribution and rainwater availability in different semiarid regions
. Location Annual
precipitation (mm)
Annual precipitation
(mm/m2)
Annual
availability (m3)
Author
Brazil 800 9.83
15.61 Melo dos Santos and Farías
(2017)
Jordan 300 1 0.56 Abdulla and Al-Shareef (2009)
446.5 0.44 N/D Abu-Zreig et al. (2019)
Pakistan 295 1.05 3.39 Ali et al. (2020)
China 600 1.66 N/D Jing et al. (2017)
Source of reference: Table prepared by the authors
As can be seen in Table 9.2, in semi-arid regions there are important variations in the amount of
annual precipitation. While in those regions with higher precipitation (800 mm/year) it is possible to have
large volumes of water available for self-consumption, in those regions with lower precipitation (800
mm/year) it is possible to have large volumes of water available for self-consumption (15.61 m3), in sites
with very low rainfall (295 mm/a) the available volume is reduced 4.6 times. Seasonal periods, the
duration of rainfall events, as well as their intensity, possibly influence the amount of water that can be
collected through rooftops in these areas (Melo dos Santos and Farias, 2017). However, in those sites
where there are water scarcity problems, they are an alternative option to reduce dependence on the public
supply system and achieve better management of drinking water.
2.3 Reduction of urban runoff
All of the examples of green infrastructure discussed in this chapter help reduce urban runoff through
different processes, and their hydraulic efficiency tends to be greatest when light rainfall occurs (Bureau
of Watershed Management, 2006). Some types do this through detention by infiltration (permeable
pavement, rain gardens, infiltration trenches) and storage (rainwater harvesting), others through retention
and evapotranspiration (green roofs, green walls). Their advantages include facilitating the recharge of
aquifers in waterproofed spaces, reducing the temperature in buildings and their surroundings, and
reducing waterlogging and damage to infrastructure. If complemented with storage facilities, they can
help to recover part of the infiltrated volume and use it for non-potable purposes such as irrigation of
public parks and gardens (Prodanovic et al., 2020). Factors such as the impermeable area, the appropriate
selection of materials with good hydraulic conductivity and capacity to reduce pollutants, the space
available for their construction, among others, determine their efficiency in mitigating flooding problems
and increasing the recharge of groundwater sources. Among the positive ecosystemic effects are the
reinsertion of native plants and the removal of contaminants through different physical, chemical and
microbiological processes. Periodic maintenance is essential to avoid clogging of pores and the
accumulation of sediments, organic matter and other debris. Moreover, the selection of vegetation should
take into account both its adaptation to local hydrological conditions, as well as its phytoremediation
potential (Buffam et al., 2016; Vijayaraghavan et al., 2021).
140
Acknowledgment
This work was not financed by any institution.
Conclusions
The examples of green infrastructure most frequently used to mitigate water scarcity and flooding
problems in cities with semi-arid climates were reviewed. The main design criteria required for their
installation were highlighted, such as available space, slope, type of surface and materials to be used
during their construction. In addition, their capacity to retain and detain urban runoff, infiltrate it into the
subsoil, evapotranspirate it, purify the pollutants it acquires during its trajectory (in the atmosphere and
on the urban surface), as well as its reuse for supply purposes were highlighted. Although their hydraulic
and environmental potential may be limited, if properly designed and constructed, they are a sustainable
option to complement the capacity of existing gray infrastructure and mitigate problems of water
shortages, overexploitation and flooding. It is recommended that planners and designers take into account
the appropriate choice of the site, the composition of the materials and the selection of the vegetation to
be used, since this will determine their efficiency. Although in Mexico there are national standards and
local regulations that take into account aspects of green infrastructure, it is still necessary to promote the
main sustainable benefits it offers to the population, especially those living in places with semi-arid
climates.
References
Abdulla F.A., Al-Shareef A.W. (2009). Roof rainwater harvesting systems for household water supply
in Jordan. Desalination, 243, 195-207. Doi:10.1016/j.desal.2008.05.013
Abu-Zreigh M., Ababneh F., Abdullah F. (2019). Assessment of rooftop rainwater harvesting in northern
Jordan. Physics and Chemistry of the Earth, Parts A/B/C, vol. 114, 102794.
Doi:10.1016/j.pce.2019.08.002
Ahiablame L.M., Engel B.A., Chaubey I. (2012). Effectiveness of Low Impact Development Practices:
Literature Review and Suggestions for Future Research. Water Air and Soil Pollution, 223, 4253-4273.
Doi: 10.1007/s11270-012-1189-2
Ali S., Zhang S., Yue T. (2020). Environmental and economic assessment of rainwater harvesting
systems under five climatic conditions of Pakistan. Journal of Cleaner Production, vol. 259 (20), 120829.
Doi: 10.1016/j.jclepro.2020.120829
Alim M.A., Rahman A., Tao Z., Samali B., Khan M.M., Shirin S. (2020). Suitability of roof harvested
rainwater for potential potable water production: A scoping review. Journal of Cleaner Production, vol.
248 (1), 119226. Doi: 10.1016/j.jclepro.2019.119226
ARC (2003). Stormwater Management Devices: Design Guidelines Manual, Auckland Regional Council,
Auckland, New Zealand.
ASTM C29 / C29M-17a, Standard Test Method for Bulk Density (“Unit Weight”) and Voids in
Aggregate, ASTM International, West Conshohocken, PA, 2017. Doi: 10.1520/C0029_C0029M-17A
Austin, G. (2017). Infraestructura verde para la planeación del paisaje. Interacción humana y sistemas
naturales. Editorial Trillas, primera edición en español. ISBN: 978-607-17-2997-2.
Bae S., Maestre J.P., Kinney K.A., Kirisits M.J. (2019). An examination of the microbial community and
occurrence of potential human pathogens in rainwater harvested from different roofing materials. Water
Research, vol. 159, 406-413. Doi: 10.1016/j.watres.2019.05.029
Bergman M., Hedegaard M.R., Petersen M.F., Binning P., Mark O., Mikkelsen P.S. (2011). Evaluation
of two stormwater infiltration trenches in central Copenhagen after 15 years of operation. Water Science
& Technology, vol. 63(10), 2279-2286. Doi: 10.2166/wst.2011.158
141
Braswell A.S., Winston R.J., Hung W.F. (2018). Hydrologic and water quality performance of permeable
pavement with internal water storage over a clay soil in Durham, North Carolina. Journal of
Environmental Management, vol. 224, 277-287. Doi: 10.1016/j.jenvman.2018.07.040
Buffam I., Mitchel M.E., Durtsche R.D. (2016). Environmental drivers of seasonal variation in green
roof runoff water quality. Ecological Engineering, vol. 91, 506-514. Doi: 10.1016/j.ecoleng.2016.02.044
Bureau of Watershed Management (2006). Pennsylvania Stormwater Best Management Practices
Manual. Department of Environmental Protection, document number 363-0300-002. December 30,
2006, 685 p. https://pecpa.org/wp-content/uploads/Stormwater-BMP-Manual.pdf
Caldelas C., Gurí R., Araus J.L., Sorolla A. (2021). Effect of ZnO nanoparticles on Zn, Cu, and Pb
dissolution in a green bioretention system for urban stormwater remediation. Chemosphere,
https://doi.org/10.1016/j.chemosphere.2021.131045
Chandrappa A.K., Biligiri K.P. (2016). Pervious concrete as a sustainable pavement material-Research
findings and future prospects: A state-of-the-art review. Construction and Building Materials, 111, 262-
274. Doi: 10.1016/j.conbuildmat.2016.02.054
Chang M., McBroom M.W., Beasley R.S. (2004). Roofing as a source of nonpoint water pollution.
Journal of Environmental Management, 73(4), 307-315. Doi: 10.1016/j.jenvman.2004.06.014
Chao P.R., Umapathi S., Sa W. (2015). Water consumption characteristics at a sustainable residential
development with rainwater-sourced hot water supply. Journal of Cleaner Production, 109, 190-202.
Doi: 10.1016/j.jclepro.2015.04.091
Chapman, C., Horner, R.R. (2010). Performance assessment of a street-drainage bioretention system.
Water Environmental Research, 82, 109–119. Doi: 10.2175/106143009X426112
CONAGUA. (2016). Lineamientos Técnicos: Sistema de captación de agua de lluvia con fines de abasto
de agua potable a nivel vivienda. Programas de Agua Potable. Versión 1.0, abril de 2016. 42 p.
CONAGUA (2018). Estadísticas del Agua en México. Comisión Nacional del Agua y Secretaría de
Medio Ambiente y Recursos Naturales, edición 2018. 306 p.
Dal Ferro N., De Mattia C., Gandini M.A., Maucieri C., Stevanato P., Squartini A., Borin M. (2021).
Green walls to treat kitchen greywater in urban areas: Performance from a pilot-scale experiment. Science
of the Total Environment, vol. 757, 144189. Doi: 10.1016/j.scitotenv.2020.144189
Deo O., Neithalath N. (2010). Compressive behavior of pervious concretes and a quantification of the
influence of random pore structure features. Materials Science Engineering, A 528, 402-412. Doi:
10.1016/j.msea.2010.09.024
De-Ville S., Menon M., Stovin V. (2018). Temporal variations in the potential hydrological performance
of extensive green roof systems. Journal of Hydrology, vol. 558, 564-578. Doi:
10.1016/j.jhydrol.2018.01.055
Dige, G. (2015). Infraestructura verde: una vida mejor mediante soluciones naturales. European
Environment Agency Newsletter, issue no. 3, 15 de septiembre de 2015.
https://www.eea.europa.eu/es/articles/infraestructura-verde-una-vida-mejor
Dreelin E.A., Fowler L., Carroll C.R. (2006). A test of porous pavement effectiveness on clay soils during
natural storm events. Water Research, vol. 40 (4), 799-805. https://doi.org/10.1016/j.watres.2005.12.002
Díaz-Padilla G., Sánchez-Cohen I., Guajardo-Panes R.A., Del-Ángel-Pérez A.L., Ruíz-Corral A.,
Medina-García G., Ibarra-Castillo D. (2011). Mapeo del índice de aridez y su distribución poblacional
en México. Revista Chapingo Serie Ciencias Forestales y del Ambiente, vol. 17, número especial enero,
267-275. Doi: 10.5154/r.rchscfa.2010.09.069
142
Eaton, T.T. (2018). Approach and case-study of green infrastructure screening analysis for urban
stormwater control. Journal of Environmental Management, 209, 495–504. Doi:
10.1016/j.jenvman.2017.12.068
Ebrahimian A., Sokolovskaya N., Wadzuk B. (2021). Modeling dynamic performance of urban
infiltration trench systems: Methodology and a case study in Philadelphia. Journal of Hydrology, vol.
594, 125938. Doi: 10.1016/j.jhydrol.2020.125938
Environmental Protection Agency, EPA (1999). Storm Water Technology Fact Sheet. Infiltration Trench.
EPA 832-F-99-019, September 1999, Washington, D.C.
Feng Y., Burian S., Pomeroy C. (2016). Potential of green infrastructure to restore the predevelopment
water budget of a semi-arid urban catchment. Journal of Hydrology, vol. 542, 744-755. Doi:
10.1016/j.jhydrol.2016.09.044
Fowdar H.S., Hatt B.E., Breen P., Cook P.L.M., Deletic A. (2017). Designing living walls for greywater
treatment. Water Research, vol. 110, 218-232. Doi: 10.1016/j.watres.2016.12.018
Guertin D.P., Korgaonkar Y., Burns S., Barlow J., Unkrich C., Goodrich D.C., Kepner W. (2015).
Evaluation of Green Infrastructure Designs Using the Automated Geospatial Watershed Assessment
Tool. Watershed Management Symposium, agosto 5–7, 2015. Reston, VA
Gong Y., Zhang X., Li H., Zhang X., He S., Miao Y. (2021). A comparison of the growth status, rainfall
retention and purification effects of four green roof plant species. Journal of Environmental Management,
vol. 278, part 1, 111451. Doi: 10.1016/j.jenvman.2020.111451
González-Medrano F. (2012). Las zonas áridas y semiáridas de México y su vegetación. Instituto
Nacional de Ecología, México. 173 p. ISBN: 9786077908692
Hassan M.R., Zain M.F.M., Hamid R., Kaish A.B.M.A., Nahar S. (2017). A comprehensive study on
sustainable photocatalytic pervious concrete for storm water pollution mitigation: A review. Materials
Today: Proceedings 4, 9773-9776. Doi: 10.1016/j.matpr.2017.06.265
Houdeschel C.D., Pomeroy C.A., Hultine K.R. (2012). Bioretention design for xeric climates based on
ecological principles. Journal of American Water Association, 48, 1178-1190. Doi: 10.1111/j.1752-
1688.2012.00678.x
INEGI (2015). Datos estadísticos nacionales. Temas sobre Medio Ambiente y Agua. Base de datos del
Instituto Nacional de Estadística Geografía e Informática.
Jia H., Yao H., Tang Y., Yu S.L., Field R., Tafuri A.N. (2015). LID-BMPs planning for urban runoff
control and the case study in China. Journal of Environmental Management, 149, 65-76. Doi:
10.1016/j.jenvman.2014.10.003
Jim C.Y. (2015). Greenwall classification and critical design-management assessments. Ecological
Engineering, vol. 77, 348-362. Doi: 10.1016/j.ecoleng.2015.01.021
Jing X., Zhang S., Zhang J., Wang Y., Wang Y. (2017). Assessing efficiency and economic viability of
rainwater harvesting systems for meeting non-potable water demands in four climatic zones of China.
Resources, Conservation and Recycling, vol. 126, 74-85. Doi: 10.1016/j.resconrec.2017.07.027
Jørgensen L., Thorup-Kristensen K., Dresbll D.B. (2018). Against the wall-root growth and competition
in four perennial winter hardy plant species grown in living walls. Urban Forestry and Urban Greening,
29, 293-302. Doi: 10.1016/j.ufug.2017.12.012
Kamali M., Delkash M., Tajrishy M. (2017). Evaluation of permeable pavement responses to urban
surface runoff. Journal of Environmental Management, vol. 187(1), 43-53. Doi:
10.1016/j.jenvman.2016.11.027
143
Lane L.J., Nichols M.H. (1999). Semi-arid climates and terrain. En: Environmental Geology.
Encyclopedia of Earth Science. Springer, Dordrecht. Doi: 10.1007/1-4020-4494-1_300
Le Costumer S., Fletcher T.D., Deletic A., Barraud S., Lewis J.F. (2009). Hydraulic performance of
biofilter systems for stormwater management: Influences of design and operation. Journal of Hydrology,
vol. 376(1-2), 16-23. Doi: 10.1016/j.jhydrol.2009.07.012
Le Costumer S., Fletcher T.D., Deletic A., Barraud S., Poelsma P. (2012). The influence of design
parameters on clogging of stormwater biofilters: a large-scale column study. Water Research, 46, 6743-
6752. Doi: 10.1016/j.watres.2012.01.026
Li H., Davis A.P. (2009). Water quality improvement through reductions of pollutant loads using
bioretention. Journal of Environmental Engineering, 135, 567-576. Doi: 10.1061/(ASCE)EE.1943-
7870.0000026
Li J., Liu Z., Jiang C., Li Y., Li H., Xia J. (2021). Optimization design of key parameters for bioretention
cells with mixed filter media via HYDRUS-1D model and regression analysis. Ecological Engineering,
vol. 164 (1), 106206. Doi: 10.1016/j.ecoleng.2021.106206
Liang X., Cui S., Li H., Abdelhady A., Wang H., Zhou H. (2019). Removal effect on stormwater runoff
pollution of porous concrete treated with nanometer titanium dioxide. Transportation Research Part D:
Transport and Environment, vol. 73, 34-45. Doi: 10.1016/j.trd.2019.06.001
Liu, W., Chen, W., Peng, C. (2014). Assessing the effectiveness of green infrastructures on urban
flooding reduction: A community scale study. Ecological Modelling, 291, 6–14. Doi:
10.1016/j.ecolmodel.2014.07.012
Liu O.Y., Russo A. (2021). Assessing the contribution of urban green spaces in green infrastructure
strategy planning for urban ecosystem conditions and services. Sustainable Cities and Society, vol. 68,
102772. Doi: 10.1016/j.scs.2021.102772
Lizárraga-Mendiola L., Vázquez-Rodríguez G.A., Lucho-Constantino C.A., Bigurra-Alzati C.A.,
Beltrán-Hernández R.I., Ortiz-Hernández J.E., López-León L.D. (2017). Hydrological Design of Two
Low-Impact Development Techniques in a Semi-Arid Climate Zone of Central Mexico. Water, vol. 9(8),
561. Doi: 10.3390/w9080561
Locatelli L., Mark O., Mikkelsen P.S., Arnbjerg-Nielsen K., Wong T., Binning P.J. (2015). Determining
the extent of groundwater interference on the performance of infiltration trenches. Journal of Hydrology,
vol. 529, Part 3, 1360-1372. Doi: doi.org/10.1016/j.jhydrol.2015.08.047
López-Zavala M.A., Prieto M.J.C., Rojas C.A.R. (2018). Rainwater harvesting as an alternative for water
supply in regions with high water stress. Water Science and Technology. Water Supply, 18(6), 1946-
1955. Doi: 10.2166/ws.2018.018
Machusick M., Welker A., Traver R. (2011). Groundwater mounding at a storm-water infiltration BMP.
Journal of Irrigation Drainage Engineering, 137(1), 154-160. Doi: 10.1061/(ASCE)IR.1943-
4774.0000184
Mao J., Xia B., Zhou Y., Bi F., Zhang X., Zhang W., Xia S. (2021). Effect of roof materials and weather
patterns on the quality of harvested rainwater in Shanghai, China. Journal of Cleaner Production, vol.
279, 123419. Doi: 10.1016/j.jclepro.2020.123419
Martí P., García-Mayor C., Nolasco-Cirugeda A., Serrano-Estrada L. (2020). Green infrastructure
planning: Unveiling meaningful spaces through Foursquare users’ preferences. Land Use Policy, vol. 97,
104641. Doi: 10.1016/j.landusepol.2020.104641
Martin-Mikle C.J., de Beurs K.M., Julian J.P., Mayer P.M. (2015). Identifying priority sites for low
impact development (LID) in a mixed-use watershed. Landscape and Urban Planning, vol. 140, 29-41.
Doi: 10.1016/j.landurbplan.2015.04.002

144
Melbourne Water (2005). Water Sensitive Urban Design (WSUD). Engineering Procedures: Stormwater.
CSIRO Publishing, Melbourne.
Melo dos Santos S., Farías M.M.M.W.E.C. (2017). Potential for rainwater harvesting in a dry climate:
Assessments in a semiarid region in northeast Brazil. Journal of Cleaner Production, vol. 164(15), 1007-
1015. Doi: 10.1016/j.jclepro.2017.06.251
Melo dos Santos S., Fernandes Ferreira Silva J., Chaves dos Santos G., Martins Torres de Macedo P.,
Gavazza S. (2019). Integrating conventional and green roofs for mitigating thermal discomfort and water
scarcity in urban areas. Journal of Cleaner Production, vol. 219, 639-648. Doi:
10.1016/j.jclepro.2019.01.068
Mendez C.B., Klenzendorf J.B., Afshar B.R., Simmons M.T., Barrett M.E., Kinney K.A., Kirisits M.J.
(2011). The effect of roofing material on the quality of harvested rainwater. Water Research, vol. 45(5),
2049-2059. Doi: 10.1016/j.watres.2010.12.015
Mullins A.R., Brain D.J., Pfeil-McCullough E., Hopkins K.G., Lavin S., Copeland E. (2020). Seasonal
drivers of chemical and hydrological patterns in roadside infiltration-based green infrastructure. Science
of the Total Environment, vol. 714, 136503. Doi: 10.1016/j.scitotenv.2020.136503
National Ready Mix Concrete Association, NRMCA (2010). NRMCA-Concrete in Practice-38 (CIP-38).
New Jersey Department of Environmental Protection (2004). New jersey Stormwater Best Management
Practices Manual. Trenton, NJ.
Nnadi E.O., Newman A.P., Coupe S.J., Mbanaso F.U. (2015). Stormwater harvesting for irrigation
purposes: An investigation of chemical quality of water recycled in pervious pavement system. Journal
of Environmental Management, vol. 147(1), 246-256. Doi: 10.1016/j.jenvman.2014.08.020
Natural Water Retention Measures, NWRM (2014). Una guía para apoyar la elección, el diseño y la
implementación de las medidas naturales retención de agua Europa. Comisión Europea. Dirección
General de Medio Ambiente. Bruselas. 98 p. http://nwrm.eu/guide-es/files/assets/basic-
html/index.html#2
Natural Water Retention Measures, NWRM (2015). U8. Infiltration trenches. European Commission, 14
p. http://nwrm.eu/sites/default/files/nwrm_ressources/u8_-_infiltration_trenches.pdf
Obropta C.C., Del Monaco N. (2018). Reducing Directly Connected Impervious Areas with Green
Stormwater Infrastructure. Journal of Sustainable Water Built Environment, vol. 4(1): 05017004. Doi:
10.1061/JSWBAY.0000833.
ONU, s.f. Ordenación de los ecosistemas frágiles: Lucha contra la desertificación y la sequía. Cumbre
para la Tierra, capítulo 12. https://www.un.org/spanish/esa/sustdev/agenda21/agenda21spchapter12.htm
ONU HABITAT (2018a). Ciudades resilientes. Nueva Agenda Urbana de la ONU. Publicado en octubre
de 2018.
Organización Mundial de la Salud, OMS (2011). Guidelines for drinking-water quality. 4ta edición,
WHO Library Cataloguing-in-Publication Data.
Ortega-Villar R., Lizárraga-Mendiola L., Coronel-Olivares C., López-León L.D., Bigurra-Alzati C.,
Vázquez-Rodríguez G.A. (2019). Effect of photocatalytic Fe2O3 nanoparticles on urban runoff pollutant
removal by permeable concrete. Journal of Environmental Management, vol. 242, 487-495. Doi:
10.1016/j.jenvman.2019.04.104
Piñon-Colin T., Rodríguez-Jimenez R., Rogel-Hernández E., Álvarez-Andrade A., Wakida F.T. (2020).
Microplastics in stormwater runoff in a semiarid region, Tijuana, Mexico. Science of the Total
Environment, vol. 704, 135411. Doi: 10.1016/j.scitotenv.2019.135411
145
Prodanovic V., Hatt B., McCarthy D., Zhang K., Deletic A. (2017). Green walls for greywater reuse:
Understanding the role of media on pollutant removal. Ecological Engineering, vol. 102, 625-635. Doi:
10.1016/j.ecoleng.2017.02.045
Prodanovic V., Wang A., Deletic A. (2019). Assessing water retention and correlation to climate
conditions of five plant species in greywater treating green walls. Water Research, vol. 167, 115092.
Doi: 10.1016/j.watres.2019.115092
Prodanovic V., Hatt B., McCarthy D., Deletic A. (2020). Green wall height and design optimisation for
effective greywater pollution treatment and reuse. Journal of Environmental Management, vol. 261,
110173. Doi: 10.1016/j.jenvman.2020.110173
Reyes R., Bustamante W., Gironás J., Pastén P.A., Rojas V., Suárez F., Vera S., Victorero F., Bonilla
C.A. (2016). Effect of substrate depth and roof layers on green roof temperature and water requirements
in a semi-arid climate. Ecological Engineering, vol. 97, 624-632. Doi: 10.1016/j.ecoleng.2016.10.025
Saadeh S., Ralla A., Al-Zubi Y., Wu R., Harvey J. (2019). Application of fully permeable pavements as
a sustainable approach for mitigation of stormwater runoff. International Journal of Transportation
Science and Technology, vol. 8(4), 338-350. Doi: 10.1016/j.ijtst.2019.02.001
Sandoval G.F.B., Galobardes I., Campos de Moura A., Toralles B.M. (2020). Hydraulic behavior
variation of pervious concrete due to clogging. Case Studies in Construction Materials, vol. 13, e00354.
Doi: 10.1016/j.cscm.2020.e00354
Secretaría de Obras y Servicios del Gobierno del Distrito Federal. (2008). Normas De Construcción de
la Administración Pública del Distrito Federal Construcción e Instalaciones. Obra Civil en
Edificaciones. http://cgservicios.df.gob.mx/prontuario/vigente/r314501.pdf
Selbig W.R., Buer N., Danz M.E. (2019). Stormwater-quality performance of lined permeable pavement
systems. Journal of Environmental Management, vol. 251, 109510. Doi:
10.1016/j.jenvman.2019.109510
Sims A.W., Robinson C.E., Smart C.C., Voogt J.A., Hay G.J., Lundholm J.T., Powers B., O´Carroll D.M.
(2016). Retention performance of green roofs in three different climate regions. Journal of Hydrology,
vol. 542, 115-124. Doi: 10.1016/j.jhydrol.2016.08.055
Skorobogatov A., He J., Chu A., Valeo C., van Duin B. (2020). The impact of media, plants and their
interactions on bioretention performance: A review. Science of the Total Environment, vol. 715(1),
136918. Doi: 10.1016/j.scitotenv.2020.136918
Smyth K., Drake J., Li Y., Rochman C., Van-Seters T., Passeport E. (2021). Bioretention cells remove
microplastics from urban stormwater. Water Research, vol. 191(1), 116785. Doi:
10.1016/j.watres.2020.116785
Tavakol-Davani H., Tavakol-Davani H., Burian S.J., McPherson B.J., Barber M.E. (2019). Green
infrastructure optimization to achieve predevelopment conditions of a semiarid urban catchment.
Environmental Science Water Research & Technology, 5, 1157-1171. Doi: 10.1039/c8ew00789f
Tirpak R.A., Afrooz A.R.M.N., Winston R.J., Valenca R., Schiff K., Mohanty S.K. (2021). Conventional
and amended bioretention soil media for targeted pollutant treatment: A critical review to guide the state
of the practice. Water Research, vol. 189(1), 116648. Doi: 10.1016/j.watres.2020.116648
U.S. Environmental Protection Agency (US EPA, 1999). Storm Water Technology Fact Sheet: Porous
Pavement. EPA 832-F-99-023.
Vijayaraghavan K., Biswal B.K., Adam M.G., Soh S.H., Tsen-Tieng D.L., Davis A.P., Chew S.H., Tan
P.Y., Babovic V., Balasubramanian R. (2021). Bioretention systems for stormwater management: Recent
advances and future prospects. Journal of Environmental Management, vol. 292, 112766. Doi:
10.1016/j.jenvman.2021.112766
146
Wanielista M., Chopra M., Spence J., Ballock C. (2007). Hydraulic performance assessment of pervious
concrete pavements for stormwater management credit. Final report, University of Central Florida. 81 p.
https://rmc-foundation.org/wp-content/uploads/2017/07/PerformanceAssessmenFBD13pdf.pdf
Winston R.J., Dorsey J.D., Hunt W.F. (2016). Quantifying volume reduction and peak flow mitigation
for three bioretention cells in clay soils in northeast Ohio. Science of the Total Environment, 553, 83-95.
Doi: 10.1016/j.scitotenv.2016.02.081
Xie N., Akin M., Shi X. (2019). Permeable concrete pavements: A review of environmental benefits and
durability. Journal of Cleaner Production, 210, 1605-1621. Doi: 10.1016/j.jclepro.2018.11.134
Xu Y., Jin R., Hu L., Li B., Chen W., Shen J., Wu P., Fang J. (2020). Studying the mix design and
investigating the photocatalytic performance of pervious concrete containing TiO2-Soaked recycled
aggregates. Journal of Cleaner Production, vol. 248, 119281. Doi: 10.1016/j.jclepro.2019.119281
Yahia A., Kabagire D. (2014). New approach to proportion pervious concrete. Construction and Building
Materials, 62, 38-46. Doi: 10.1016/j.conbuildmat.2014.03.025
Yang J., Wang Z.H. (2017). Planning for a sustainable desert city: The potential water buffering capacity
of urban green infrastructure. Landscape and Urban Planning, vol. 167, 339-347. Doi:
10.1016/j.landurbplan.2017.07.014
Zahmatkesh Z., Burian S.J., Karamouz M., ASCE F., Tavakol-Davani, Goharian E. (2015). Low-Impact
Development Practices to Mitigate Climate Change Effects on Urban Stormwater Runoff: Case Study of
New York City. Journal of Irrigation Drainage Engineering, 141(1), 04014043. Doi:
10.1061/(ASCE)IR.1943-4774.0000770
Zhang Q., Wang X., Hou P., Wan W., Li R., Ren Y., Ouyang Z. (2014). Quality and seasonal variation
of rainwater harvested from concrete, asphalt, ceramic tile and green roofs in Chongqing, China. Journal
of Environmental Management, vol. 132, 178-187. Doi: 10.1016/j.jenvman.2013.11.009
Zhang K., Yong F., McCarthy D.T., Deletic A. (2018). Predicting long term removal of heavy metals
from porous pavements for stormwater treatment. Water Research, vol. 142(1), 236-245. Doi:
10.1016/j.watres.2018.05.038
Zhang Z., Szota C., Fletcher T.D., Williams N.S.G., Farrell C. (2019). Green roof storage capacity can
be more important than evapotranspiration for retention performance. Journal of Environmental
Management, vol. 232, 404-412. Doi: 10.1016/j.jenvman.2018.11.070
Zhang L., Lu Q., Ding Y., Wu J. (2021a). A procedure to design road bioretention soil media based on
runoff reduction and pollutant removal performance. Journal of Cleaner Production, vol. 287, 125524.
Doi: 10.1016/j.jclepro.2020.125524
Zhang S., Lin Z., Zhang S., Ge D. (2021b). Stormwater retention and detention performance of green
roofs with different substrates: Observational data and hydrological simulations. Journal of
Environmental Management, vol. 291, 112682. Doi: 10.1016/j.jenvman.2021.112682
Zölch T., Henze L., Keilholz P., Pauleit S. (2017). Regulating urban surface runoff through nature-based
solutions – An assessment at the micro-scale. Environmental Research, 157, 135-144. Doi:
10.1016/j.envres.2017.05.023
Zúñiga-Estrada M.A., Vázquez-Rodríguez G.A., Ramírez-Cardona M., Lizárraga-Mendiola L. (2020).
Mineralogical evidence of unfavorable geochemical interactions between urban runoff pollutants and
filter materials in low-impact systems. Journal of Hazardous Materials, 390, 122136. Doi:
10.1016/j.jhazmat.2020.122136

147
Chapter 10 Microencapsulation of acachul (Ardisia Compressa) extract by spray
drying using diferente polymeric materials as encapsulating agents
Capítulo 10 Microencapsulación de extractos de acachul (Ardisia Compressa) mediante secado por aspersión utilizando diferentes materiales poliméricos como
agentes encapsulantes
SANTACRUZ-VÁZQUEZ, Claudia†* & SANTACRUZ-VÁZQUEZ, Verónica
Benemérita Universidad Autónoma de Puebla. Faculty of Chemical Engineering. Departamento de
Alimentos. Boulevard 18 Sur y Av. San Claudio. Ciudad Universitaria. Puebla, Pue. México
ID 1st Author: Claudia, Santacruz-Vázquez /ORC ID: 0000-0001-6660-469X, CVU CONACYT: 70094
ID 1er Co-author: Verónica, Santacruz-Vázquez / ORC ID: 0000-0003-0527-5815, CVU CONACYT:
70091
DOI: 10.35429/H.2021.6.147.159
C. Santacruz & V. Santacruz
A. Marroquín, J. Olivares, M. Ramírez and L. Cruz (Coord) Engineering and Technology. Handbooks-©ECORFAN-México,
Querétaro, 2021.

148
Abstract
The microencapsulation process is a technique whose purpose is to protect liquid, solid and gaseous
compounds susceptible to thermal, light or oxidative deterioration, among other factors. The
particular substance may be individually coated with an encapsulating material to protect it from
the environment, from the reaction with other compounds or to prevent oxidation reactions from
light or oxygen present in its surroundings. There is a wide variety of biopolymeric materials used
as barrier materials for encapsulation. Among the materials that serve as encapsulating or
entraining agents are carbohydrates, lipids, proteins and polymers, while the active or encapsulated
compounds may be antimicrobials, pigments, vitamins, minerals or microorganisms. Therefore
there is a need to find the best option, to encapsulate the desired active ingredients using different
biopolymeric materials as barrier materials. Whence, in the present work, the effect and
characteristics from acachul (Ardisia Compressa) pigments were determined, encapsulated them
using maltodextrin, gum arabic and a combination of gum arabic- maltodextrin in a 1:1 ratio as
encapsulating agents. Determining that acachul (Ardisia Compressa) pigments were better
encapsulated when maltodextrin was utilized as the encapsulating agent.
Microencapsulation, Pigments, Encapsulation agents, Acachul
Resumen
El proceso de microencapsulación es una técnica que tiene como finalidad proteger, líquidos, sólidos
y gaseosos susceptibles al deterioro térmico, lumínico, oxidativo, entre otros. La sustancia en
particular puede ser cubierta de manera individual con un material encapsulante para protegerla
del ambiente, de la reacción con otros compuestos o para impedir que sufran reacciones de
oxidación debido a la luz o al oxígeno presentes en su entorno. Existe una gran variedad de
materiales biopolímericos como materiales de barrera utilizados para la encapsulación. Entre los
materiales que sirven como agentes encapsulantes o de arrastre se encuentran los carbohidratos,
lípidos, proteínas y polímeros, mientras que los agentes activos o encapsulados pueden ser
antimicrobianos, pigmentos, vitaminas, minerales o microorganísmos. Por lo que existe la necesidad
de encontrar la mejor opción, para encapsular los ingredientes activos deseados utilizando
diferentes materiales biopoliméricos como materiales de barrera. Por lo que en el presente trabajo,
se determinó el efecto y características que presentan los pigmentos de acachul (Ardisia
Compressa). Encapsulados al utilizar maltodextrina, goma arábiga y una combinación de goma
arábiga-maltodextrina en proporción 1:1 como agentes encapsulantes. Determinando que los
pigmentos de acachul (Ardisia Compressa) fueron mejor encapsulados al utilizar maltodextrina
como agente encapsulante.
Microencapsulación, Pigmentos, Agentes encapsulantes, Achachul
1 Introducción
Nowadays, consumers demand nutritious and functional products that also contribute to consumer
health. For such reason, food and coloring industries have been subject to making changes in
reformulation of their products and searching for new alternatives that do not affect consumers
health maintaining the desired characteristics of food. For this reason, natural pigments of vegetable
origin (carotenoids, chlorophylls, phenolic pigments: flavonoids, anthocyanins, tannins, and
betalains) have been chosen as substitutes for artificial colors. In addition to the above, Mexico has
a wide range of plant sources with attractive colors that are due to the presence of compounds
(anthocyanins) found in the epidermal tissues of flowers and fruits mainly, which provide red,
orange, blue and purple colors. By geographical location, in north of Puebla State an endemic fruit
called Acachul (Ardisia compressa) is produced, which is cultivated in the municipalities of
Xicotepec, Tlaxco, Zihuatehutla, Tlacuilotepec, Jalpan and Pahuatlán all of them belonging to
northern zone of Puebla State, Mexico (SAGARPA, 2018). This fruit is not entirety exploited, being
commonly used as raw material for elaboration of artisan wines, thereby opening a field of
application for obtaining natural coloring, having with it an economic and social benefit for
producers of Acachul fruit expanding the market and encouraging its production to prevent this
endemic crop from being lost by giving it a new added value and greater use.
149
Therefore, importance of this research lies fundamentally in using polymeric agents as
protective coatings of interest compounds (anthocyanins) and by means of spray drying used as a
micro-encapsulation technique to obtain a natural powder pigment and thuscarrying out its
physicochemical characterization, determining stability conditions for its application in food
systems.
2 Theoretical Fundaments
2.1 Acachul (Ardisia compressa)
In northern region of Puebla State, Acachul bush (Ardisia compressa) is cultivated, which is a plant that
is still in its natural agro-ecosystem. The municipalities Xicotepec, Tlaxco, Zihuatehutla, Tlacuilotepec,
Jalpan and Pahuatlán are the main producers with a production of 60 tons per year, including 30 hectares
area for this activity (SAGRAPA, 2018).
Acachul (Ardisia compressa) belongs to Myrsinaceae family, it is described as a shrub 1 to 3 m
high, it has round or elliptical-lanceolate leaves of 10 to 20 cm, with entire or serulated edge, with smooth
textures above and below. Flowers are pinkish-white in color and produce edible globose fruit. The seed
or wild fruit is similar to a bunch of grapes, which contains a single seed, its flavor is sour-sweet, similar
in size to blueberry, one of its main characteristics is that it has a high content of anthocyanin compounds
and can be used to obtaining a natural pigment (Vázquez., et al. 2019, Vázquez., et al. 2021).
2.2 Pigments
Color is an important factor in determining the attractiveness of most foods, color is often used
as an index of freshness and good condition. Unfortunately, color can change during processing, storage,
or preparation, thereby reducing food quality. So controlling, changing and stabilizing food color is one
of the main goals of food scientists and technologists.
2.3 Anthocyanins
Anthocyanins, alike flavonoids and betalains, are water-soluble pigments with glycoside characteristics,
they are made up of an anthocyanidin molecule, which is aglycone, to which a sugar is attached through
a β-glucosidic bond. Basic chemical structure of these aglycones is the flavillium ion, which consists of
two aromatic groups: a benzopyryl (A) and a phenolic ring (B); Due to its trivalent position of oxygen,
flavillium normally functions as a cation (Aguilera, et al. 2011). Currently about 20 anthocyanins are
known, the most important of which are perlargonidin, delphinidin, cyanidin, petunidin, peonidin and
malvidin. It is very common that an anthocyanidin interacts with more than one carbohydrate to form
different anthocyanins (Barragán, et al., 2018). Anthocyanins have become an interesting option for food
industry, as possible substitutes for synthetic colorants. Additionally, these substances exhibit an added
value due to their antioxidant and cytotoxic capacity (Cassidy, 2018). In addition to the above, the
expanded interest in anthocyanic compounds has become known, knowing that they play an important
role in reducing coronary heart disease, cancer, diabetes, anti-inflammatory effects and improvement of
visual acuity. Likewise, they are considered potential agents in obtaining products with added value for
human consumption (Garzón, 2008; Nardini & Garaguso, 2020). Consequently, demand for acquiring
these compounds has increased, which leads to search for new techniques for obtaining anthocyanins on
large scale, which is why the use of spray drying has been directed mainly; which has led to studies of
separation, structural characterization and quantification of obtained anthocyanins (Guerra and Ortega,
2006).
2.3.1 Color and stability of anthocyanins
One of best known and most widespread functions of anthocyanins is to provide flowers with color,
making them more attractive to pollinators. Considerable effort has been made to explain color variations
exhibited by anthocyanins in plants; various factors such as concentration and nature of anthocyanidin,
equilibrium forms of anthocyanidin, glycosylation or acylation, nature and concentration of co-
pigmentation, metal complexes, intra- and intermolecular association mechanisms, and the influence of
external factors such as pH, salts, among others, have been shown to have a certain impact on coloration
of anthocyanins.
150
Role of anthocyanins and flavones to provide angiosperm flowers with a stable blue color has
been recently studied, finding that anthocyanin with the greatest presence is delphinidin, and that co-
pigmentation with a specific flavone was most common mechanism to transform the mauve color of
delphinidin glycosides to blue hues. One of the first systematic reports on the role of pH in chemical
stability of anthocyanins, found that anthocyanins slightly diluted at typical pH values of various foods,
in a range of 3 to 6, resulted in being almost completely hydrated to obtain Colorless carbinol
pseudobases, while the flavyl ion exists mostly at pH values below 2.0 (Nollet & Toldrá, 2013).
2.3.2 Anthocyanin degradation mechanisms
Aside from typical factors, species, agronomic and environmental factors, which affect anthocyanin
content in fruits, its processing prior to consumption significantly influences total content in final
product. Thermal processing is one of the most common processes, involving heating to temperatures
between 50 and 150 ° C, depending on pH of the product and desired shelf life. Given their potential,
technical or benefits they could bring to human health, chemical stability of anthocyanins is a focus point
for many assays and analyzes.
As scrutinized, it has been observed that anthocyanins stability depends not only on processing
temperature, but also on intrinsic properties of the product such as its pH, storage temperature, chemical
structure and anthocyanin concentration, as well as presence of light, oxygen, enzymes, proteins, and
metal ions.
2.3.3 Nutritional and health aspects related to anthocyanins
Interest in anthocyanins for use as nutritional supplements in the daily diet of humans has increased. It
is postulated that regular consumption of anthocyanins and other polyphenols from fruits, vegetables,
wines, jellies, and preserves, is associated with a possible reduction in risk of chronic diseases such as
cancer, cardiovascular diseases, viral inhibition, and Alzheimer's (Rangel Huerta et al., 2015)
Anthocyanins, as well as other flavonoids, are considered important nutraceuticals due to their
antioxidant effects, which give them a potential role in prevention of various diseases related to oxidative
stress. There are several studies channelized to identify that anthocyanins and other flavonoids present
in food have effects in the diet, analyzing their bioavailability, their metabolism, pharmacokinetics of
their action, and safety of their consumption.
Current knowledge about molecular actions of anthocyanins to chemoprevent cancer is divided
into: antioxidat mechanism, molecular mechanisms of anticarcinogenesis, and molecular mechanism that
involves the induction of apoptosis of tumor cells (Khoo, et al., 2017)
2.3.4 Anthocyanins as food coloring
In addition to interest about the effects of anthocyanins on human health, there is a widespread interest
in using them as food colorants. Due to the fact that these are obtained from natural sources, consumers
show a certain proclivity towards this type of substances compared to synthetic colorants, which, at the
same time, have limitations established by corresponding legislation. Extensive studies related to
common food colorants, derived from anthocyanins, qualitative and quantitative aspects of anthocyanins
used in food, and their physicochemical properties (color characteristics and stability), have been carried
out along over years regarding information on the subject of application of these compounds.In cases
where anthocyanins are present as part of the ingredients of the product, they undergo various
transformations that lead such product acquires typical colors. Commonly, colorants that are sought to
be substituted with use of anthocyanins are those that present shades between red and purple. However,
biggest problem related to their use is pH control in products where they are applied, their susceptibility
to thermal processing and low stability during storage. Existing legislations do not indicate specific
sources from which anthocyanins, to be used as colorants, must be extracted, they simply define
acceptable procedures for their extraction. Extractions carried out with acidified water, methane and
ethanol are those that present a greater acceptance for this purpose. Extracts obtained by these methods
are known to also contain sugars, tannins, minerals and other interfering compounds. Anthocyanin
fraction, even though it can be recovered from various types of fruits and vegetables, commonly grapes,
strawberry, black currant, purple cabbage and others, for economic reasons, is obtained mainly from by-
products derived from the wine industry, especially the peel of grape.
151
A well-known commercial compound, derived from this latter matrix, distributed and used
globally in Europe, Asia, and North America, is enocyanin. Extracts of black carrots, known to reach
concentrations of 1,700 mg / kg of fresh product, as well as dried and deodorized extracts of purple
cabbage, are also widely used in beverages, candies, ice cream, jellies and jams, in addition to light drinks
( Nollet & Toldrá, 2013).
3. Methodology to be developed
3.1. Project development location
Development of this research was carried out in the city of Puebla de Zaragoza, Puebla, in the Food
Laboratory facilities FIQ4 / 105 of the Chemical Engineering Department and University Center for
Entailment and Technology Transfer (CUVyTT) of the Benemérita Universidad Autónoma de Puebla
(BUAP).
3.2. Collection of biological material
Acachul (Ardisia Compressa) in a commercial maturity state, was collected in municipality of Xicotepec
de Juárez, located in northwestern part of Puebla state. Fruits were stored in hermetic polyethylene bags
labeled with date and place, after harvesting they were stored at -4 ° C until use for experimentation.
3.3 Characterization of fresh Acachul fruit
3.3.1 Determination of total soluble solids (TSS)
Determination of TSS was resolved in fruit stored at -4 ° C, methodology consisted of pressing a piece
of fruit to extract a few drops of juice, considering the equatorial zone of fruit. Using a model PAL-1
digital refractometer at 20 ° C, prism of the refractometer was supported in a fixed place to ensure that
juice is distributed evenly.
3.3.2 Color determination
Colorimetry is a non-destructive physical method widely used to determine color of a sample. To measure
color (color saturation) a calibrated Hunterlab Model D25A-9000 colorimeter was used, it provides the
achromatic parameters or coordinates L * wich is luminosity or clarity and represents whether a color is
dark, gray or light, varying from zero to a black up to 100 for white and the chromatic coordinates a *
and b * form a plane perpendicular to L *, a * coordinate corresponds to red if a *> 0, or green if a * <0.
The b * coordinate corresponds to yellow if b *> 0, and blue if b * <0.
3.3.3 pH Determination
pH was determined using a digital potentiometer pH-meter brand Conductronic model pH10, previously
calibrated, using buffer solutions (pH = 4 and pH = 7), 6 g of fruit were taken and homogenized with 10
mL distilled water. All measurements were carried out in triplicate and result was expressed as average
value of determinations.
3.3.4 Preliminary treatment of Acachul fruit
Acachul fruit (Ardisia Compressa) was previously washed and sanitized using chlorine at 100 ppm,
forthcoming seed was manually separated from the pulp. Subsequently, quantity to be occupied was
weighed on a precision electronic balance. To obtain juice of acachul fruit, a Hamilton Beach juice
extractor model: 67608 was used, to which 10% (w / v) of encapsulating agents were incorporated with
respect to the amount of juice obtained, for which Three samples were prepared with two different
biopolymers (Gum arabic brand Fabpsa and Maltodextrin 10D Meyer) and a combination of both in
relation (1: 1), incorporation of encapsulating agents was carried out slowly by stirring, using an
electronic stirrer model: 102 at 7500 rpm speed following by a vacuum filtration, using a kitasato flask,
filter paper, Buchner funnel, vacuum pump, to eliminate the larger pulp residues that could clog nozzles
of spray dryer atomizer

152
3.4 Microencapsulation by spray drying
To encapsulate desired active ingredient (natural acachul pigments), different biopolymeric materials
were used as barrier materials, in different proportions, having three treatments as mentioned below in
Table 10.1.
Table 10.1 Encapsulating agent used in experimentation
Treatment Encapsulating agent Proportion tested
A Maltodextrin 10% weigth in volume
B Arabic Gum 10% weigth in volume
C Arabic Gum- Maltodextrin 10% weigth in volume in proportion 1:1
For spray drying, a Prendo brand spray dryer with serial number 1212IA900054A (Mexico) was
utilized, which uses a parallel flow pressure nozzle atomizer. Using different encapsulating agents as
barrier materials, such as maltodextrin, arabic gum, and a combination of maltodextrin and arabic gum.
Samples were placed for feeding through a peristaltic pump, where drying consists of atomizing the juice
generating small droplets, which are microencapsulated by a hot air stream. Being independent variables
to control the inlet temperature (140 ° C), feed flow of the sample (3 mL / min), air flow of 10 l / min at
a pressure of 5 mm Hg. At the moment in which the drops of acachul juice come into contact with hot
air, temperature balance and partial vapor pressure between liquid and gas phases is established.
Therefore heat transfer takes place from air to the product as a result of temperature difference while
water transfer takes place in the opposite direction due to vapor pressure difference, after that, droplets
evaporation is carried out at constant temperature and at partial pressure of water vapor. When water
content of droplet reaches a critical value, a dry crust forms on droplet surface, drying rate decreases
rapidly and becomes dependent on rate of water diffusion through crust. Drying is theoretically finished
when particle temperature is the same as that of the air, passing encapsulated product to a collector.
Product (powder) dried by spraying and encapsulated by using different encapsulating agents, was stored
in amber vials incorporating N2, which provides an inert atmosphere to avoid reactions of biological
material during storage (figure 10.1).
Figure 10.1 Microencapsulation by spray drying
3.5 Characterization of natural pigment
3.5.1 Determination of water activity (aw)
aw was determined in an AquaLab equipment, model series 3TE, determination consisted of placing
pigment in sample tray, introducing sample and then turning knob to the left to place it in reading
position, afterwards withdrawing sample when equipment alarm activates with an intermittent sound.
153
3.5.2 Water content determination
Water content was determined in an Ohaus brand thermobalance, model MB45 which uses halogen as a
heating source, equipment works on the basis of thermogravimetric principle: at the beginning of
measurement, moisture analyzer determines sample weight, sample is heated by means of the halogen
drying unit and moisture evaporates. During drying operation equipment continuously determines sample
weight and presents the result expressed in % of moisture content. Therefore, 0.5 g of sample were placed
reaching a temperature of 150 ° C for determination.
3.5.3 Color determination
Color was determined in a Hunterlab model D25A-9000 colorimeter, which was previously calibrated.
From the reflection spectra, color coordinates of CIELab system were obtained, each color reading
represents the average of three readings made L *, a * and b *. Subsequently, with values obtained from
the coordinates, color index (IC *) is determined as a reference of tonality acquired by the simple.
3.5.4 Scanning electron microscopy (SEM)
To evaluate the quality of encapsulated product and the shape of particles obtained, a Jeol JSM-5900LV
brand scanning electron microscope, Scanning Electron Microscopy, was used. Samples were placed in
sample holder with the help of double-sided carbon tape.
However, as it is a material of biological nature, it was coated with gold (Au) under vacuum in a
DENTON VACUUM model DESK V equipment, which gives conductive property to samples, they are
protected from collapse by vacuum generated and breakage by the incidence of electrons beam. Particles
were studied at magnifications ranging from 1000X to 20,000X.
3.5.5 Determination of total anthocyanins by spectrophotometry
To evaluate the total anthocyanin content of Acachul (Ardisia compressa) in all three treatments (a, b
and c), a Pharo Merck spectrophotometer was used, scanning at a wavelength from 200 to 600 nm range
in which anthocyanins are identified. . Pigment content was calculated as cyanidin-3-glucoside, using an
extinction coefficient of 26900 and molecular weight of 449.2, using formula (1) for anthocyanidin
quantification.
𝐴𝑇(𝑚𝑔
100𝑔) =
𝐴∙𝑃𝑀∙𝐹𝐷∙1000
𝑤 ∙ 𝜖 (1)
Where: A: is the absorbance; MW: molecular weight; FD: dilution factor; w: sample weight
occupied; E: molar extinction coefficient; AT: total anthocyanins expressed in milligrams per 100 grams
of fresh fruit.
For samples preparation, a solution of methanol: water: formic acid (70: 28: 2) was used for
anthocyanins extraction.
Procedure consisted of weighing 1 g of pigment and depositing it in a mortar, subsequently, 30
mL of acidified methanol was added for further extraction and solubilization, thus obtaining a mother
solution. From this solution, 1mL is taken which is added again to 9 mL of acidified methanol solution
as well as FD 10 (this was performed for all three treatments), making a scan of 200-600 nm, using
distilled water as a blank.
3.5.6 Hygroscopicity determination
Closed systems were used with saturated solutions of different salts that generate different relative
humidities at a temperature of 20 ° C, according to what was described in 1980 by Rockland and Nishi.
Procedure was carried out for three different treatments, which consisted of placing 0.2 g of sample
obtained from each treatment in closed desiccators. Thereafter, closed containers were stored during six
days in an extraction hood at 22 ° C temperature and 88% relative humidity, determining the value of
water activity (aw) before and after established time.
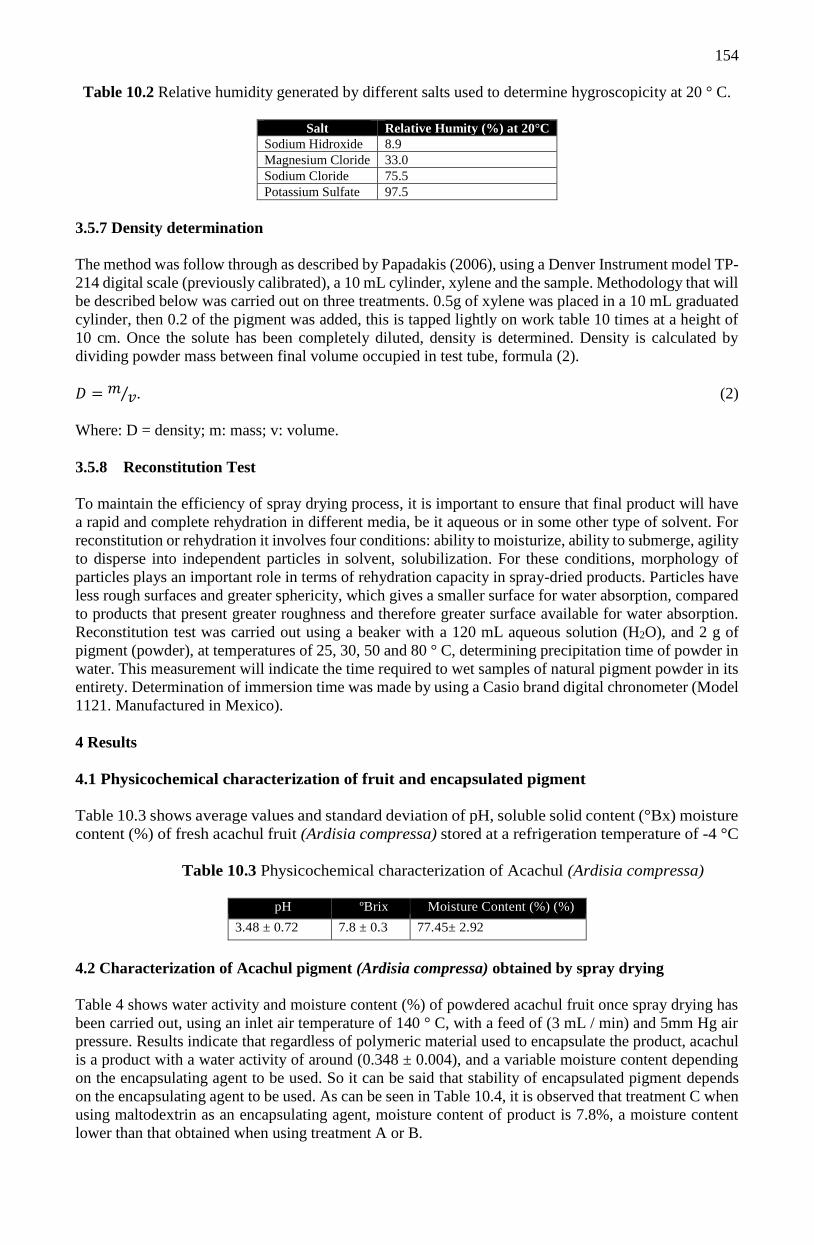
154
Table 10.2 Relative humidity generated by different salts used to determine hygroscopicity at 20 ° C.
Salt Relative Humity (%) at 20°C
Sodium Hidroxide 8.9
Magnesium Cloride 33.0
Sodium Cloride 75.5
Potassium Sulfate 97.5
3.5.7 Density determination
The method was follow through as described by Papadakis (2006), using a Denver Instrument model TP-
214 digital scale (previously calibrated), a 10 mL cylinder, xylene and the sample. Methodology that will
be described below was carried out on three treatments. 0.5g of xylene was placed in a 10 mL graduated
cylinder, then 0.2 of the pigment was added, this is tapped lightly on work table 10 times at a height of
10 cm. Once the solute has been completely diluted, density is determined. Density is calculated by
dividing powder mass between final volume occupied in test tube, formula (2).
𝐷 = 𝑚𝑣⁄ . (2)
Where: D = density; m: mass; v: volume.
3.5.8 Reconstitution Test
To maintain the efficiency of spray drying process, it is important to ensure that final product will have
a rapid and complete rehydration in different media, be it aqueous or in some other type of solvent. For
reconstitution or rehydration it involves four conditions: ability to moisturize, ability to submerge, agility
to disperse into independent particles in solvent, solubilization. For these conditions, morphology of
particles plays an important role in terms of rehydration capacity in spray-dried products. Particles have
less rough surfaces and greater sphericity, which gives a smaller surface for water absorption, compared
to products that present greater roughness and therefore greater surface available for water absorption.
Reconstitution test was carried out using a beaker with a 120 mL aqueous solution (H2O), and 2 g of
pigment (powder), at temperatures of 25, 30, 50 and 80 ° C, determining precipitation time of powder in
water. This measurement will indicate the time required to wet samples of natural pigment powder in its
entirety. Determination of immersion time was made by using a Casio brand digital chronometer (Model
1121. Manufactured in Mexico).
4 Results
4.1 Physicochemical characterization of fruit and encapsulated pigment
Table 10.3 shows average values and standard deviation of pH, soluble solid content (°Bx) moisture
content (%) of fresh acachul fruit (Ardisia compressa) stored at a refrigeration temperature of -4 °C
Table 10.3 Physicochemical characterization of Acachul (Ardisia compressa)
pH ºBrix Moisture Content (%) (%)
3.48 ± 0.72 7.8 ± 0.3 77.45± 2.92
4.2 Characterization of Acachul pigment (Ardisia compressa) obtained by spray drying
Table 4 shows water activity and moisture content (%) of powdered acachul fruit once spray drying has
been carried out, using an inlet air temperature of 140 ° C, with a feed of (3 mL / min) and 5mm Hg air
pressure. Results indicate that regardless of polymeric material used to encapsulate the product, acachul
is a product with a water activity of around (0.348 ± 0.004), and a variable moisture content depending
on the encapsulating agent to be used. So it can be said that stability of encapsulated pigment depends
on the encapsulating agent to be used. As can be seen in Table 10.4, it is observed that treatment C when
using maltodextrin as an encapsulating agent, moisture content of product is 7.8%, a moisture content
lower than that obtained when using treatment A or B.
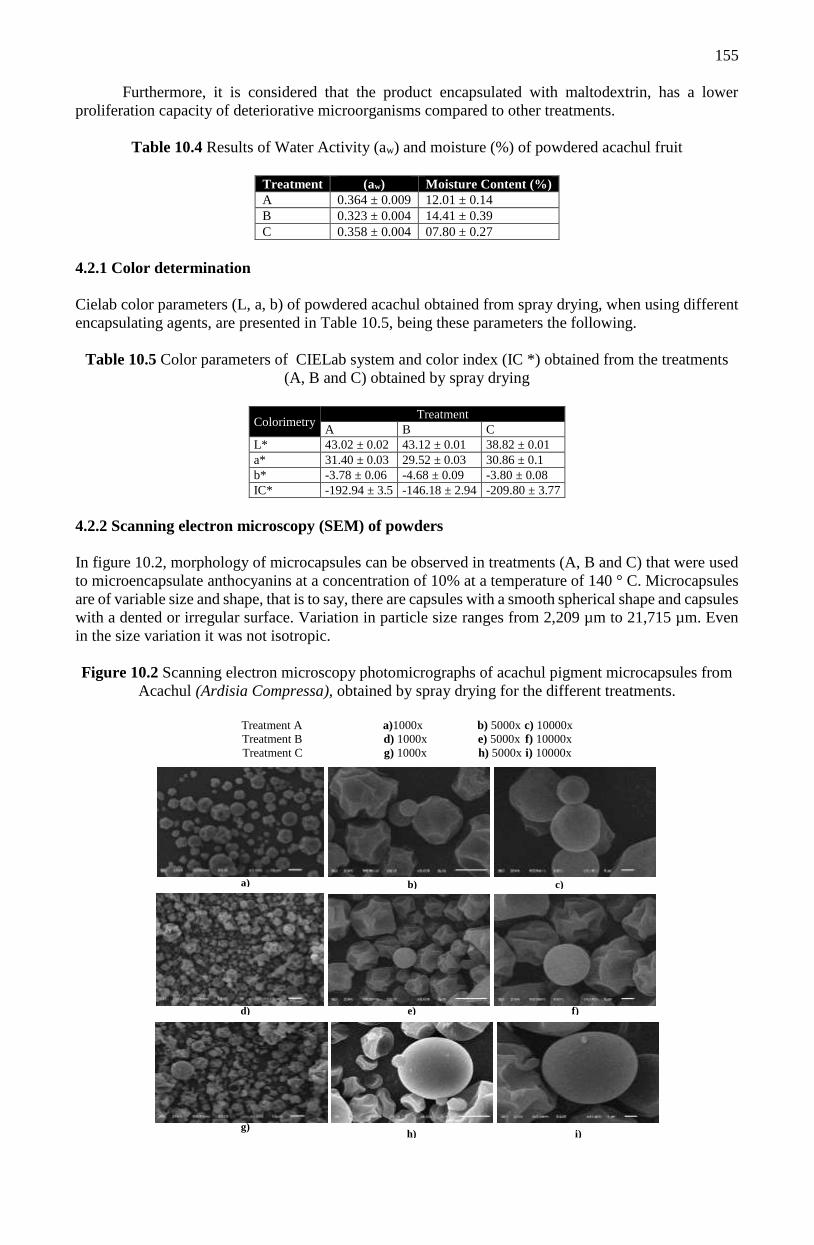
155
Furthermore, it is considered that the product encapsulated with maltodextrin, has a lower
proliferation capacity of deteriorative microorganisms compared to other treatments.
Table 10.4 Results of Water Activity (aw) and moisture (%) of powdered acachul fruit
Treatment (aw) Moisture Content (%)
A 0.364 ± 0.009 12.01 ± 0.14
B 0.323 ± 0.004 14.41 ± 0.39
C 0.358 ± 0.004 07.80 ± 0.27
4.2.1 Color determination
Cielab color parameters (L, a, b) of powdered acachul obtained from spray drying, when using different
encapsulating agents, are presented in Table 10.5, being these parameters the following.
Table 10.5 Color parameters of CIELab system and color index (IC *) obtained from the treatments
(A, B and C) obtained by spray drying
Colorimetry Treatment
A B C
L* 43.02 ± 0.02 43.12 ± 0.01 38.82 ± 0.01
a* 31.40 ± 0.03 29.52 ± 0.03 30.86 ± 0.1
b* -3.78 ± 0.06 -4.68 ± 0.09 -3.80 ± 0.08
IC* -192.94 ± 3.5 -146.18 ± 2.94 -209.80 ± 3.77
4.2.2 Scanning electron microscopy (SEM) of powders
In figure 10.2, morphology of microcapsules can be observed in treatments (A, B and C) that were used
to microencapsulate anthocyanins at a concentration of 10% at a temperature of 140 ° C. Microcapsules
are of variable size and shape, that is to say, there are capsules with a smooth spherical shape and capsules
with a dented or irregular surface. Variation in particle size ranges from 2,209 µm to 21,715 µm. Even
in the size variation it was not isotropic.
Figure 10.2 Scanning electron microscopy photomicrographs of acachul pigment microcapsules from
Acachul (Ardisia Compressa), obtained by spray drying for the different treatments.
Treatment A a)1000x b) 5000x c) 10000x
Treatment B d) 1000x e) 5000x f) 10000x
Treatment C g) 1000x h) 5000x i) 10000x
a) b) c)
g)
f) e) d)
h) i)
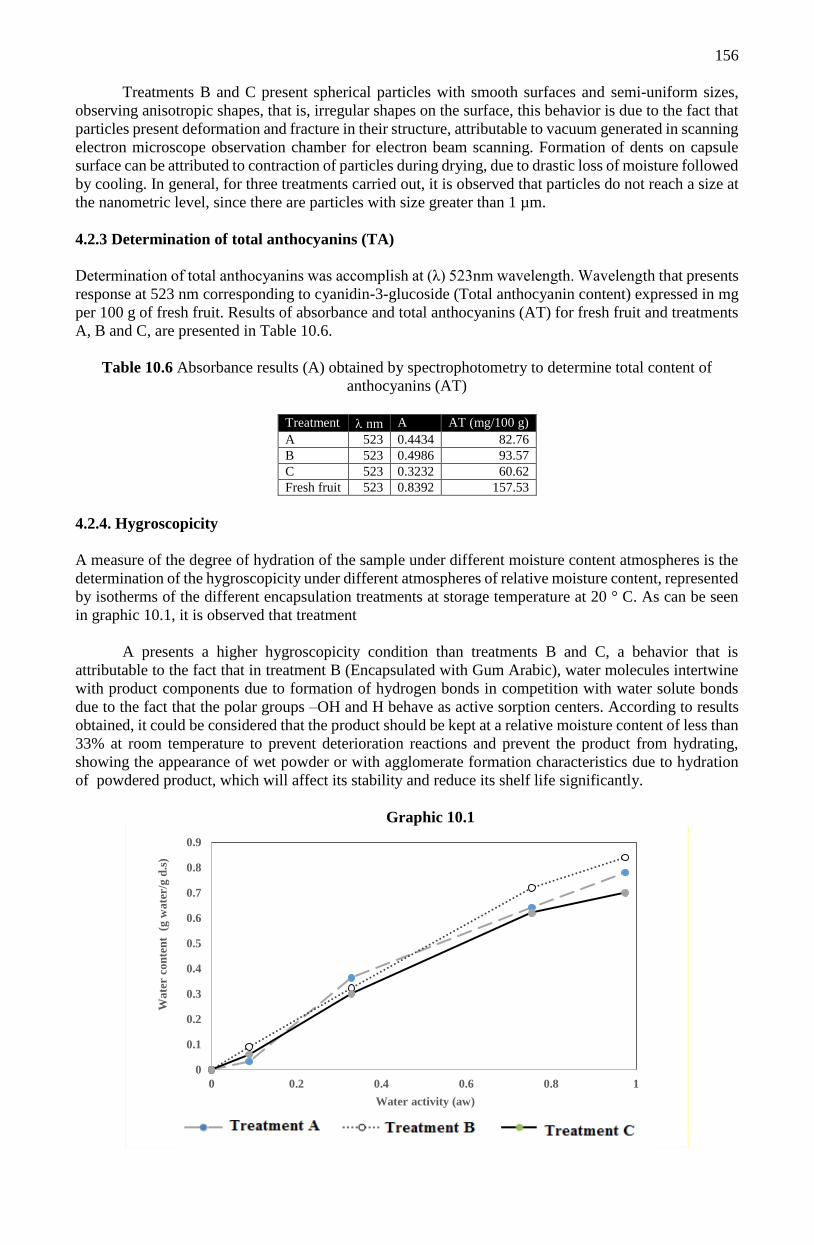
156
Treatments B and C present spherical particles with smooth surfaces and semi-uniform sizes,
observing anisotropic shapes, that is, irregular shapes on the surface, this behavior is due to the fact that
particles present deformation and fracture in their structure, attributable to vacuum generated in scanning
electron microscope observation chamber for electron beam scanning. Formation of dents on capsule
surface can be attributed to contraction of particles during drying, due to drastic loss of moisture followed
by cooling. In general, for three treatments carried out, it is observed that particles do not reach a size at
the nanometric level, since there are particles with size greater than 1 µm.
4.2.3 Determination of total anthocyanins (TA)
Determination of total anthocyanins was accomplish at (λ) 523nm wavelength. Wavelength that presents
response at 523 nm corresponding to cyanidin-3-glucoside (Total anthocyanin content) expressed in mg
per 100 g of fresh fruit. Results of absorbance and total anthocyanins (AT) for fresh fruit and treatments
A, B and C, are presented in Table 10.6.
Table 10.6 Absorbance results (A) obtained by spectrophotometry to determine total content of
anthocyanins (AT)
Treatment nm A AT (mg/100 g)
A 523 0.4434 82.76
B 523 0.4986 93.57
C 523 0.3232 60.62
Fresh fruit 523 0.8392 157.53
4.2.4. Hygroscopicity
A measure of the degree of hydration of the sample under different moisture content atmospheres is the
determination of the hygroscopicity under different atmospheres of relative moisture content, represented
by isotherms of the different encapsulation treatments at storage temperature at 20 ° C. As can be seen
in graphic 10.1, it is observed that treatment
A presents a higher hygroscopicity condition than treatments B and C, a behavior that is
attributable to the fact that in treatment B (Encapsulated with Gum Arabic), water molecules intertwine
with product components due to formation of hydrogen bonds in competition with water solute bonds
due to the fact that the polar groups –OH and H behave as active sorption centers. According to results
obtained, it could be considered that the product should be kept at a relative moisture content of less than
33% at room temperature to prevent deterioration reactions and prevent the product from hydrating,
showing the appearance of wet powder or with agglomerate formation characteristics due to hydration
of powdered product, which will affect its stability and reduce its shelf life significantly.
Graphic 10.1
0
0.1
0.2
0.3
0.4
0.5
0.6
0.7
0.8
0.9
0 0.2 0.4 0.6 0.8 1
Wate
r co
nte
nt
(g
wate
r/g
d.s
)
Water activity (aw)

157
4.2.5. Reconstitution
Reconstitution time of dehydrated powder pigment in an aqueous medium to determine the behavior of
the dehydrated product when it is subjected to rehydration with water, was carried out at rehydration
water temperatures of 25, 30, 50 and 80 ° C, results that are presented in Table 10.7.
Table 10.7 Pigment reconstitution time obtained by spray drying with different encapsulating agents
Temperature
(ºC)
Treatment
A
Treatment
B
Treatment
C
25 24 24 27
30 22 23 26
50 21 22 23
80 9 21 14
As can be seen from Table 10.7, it is observed that time to effect the dissolution of the powdered
pigment is inversely proportional to time used in the reconstitution. This behavior is attributable to the
fact that surface tension of water decreases with temperature, since the cohesion forces decrease with
increasing water temperature. Influence of the external environment is due to the fact that the molecules
of the environment exert attractive actions on the molecules located on the surface of the liquid,
counteracting the actions of the molecules of the liquid.
4.2.6 Apparent density
Apparent density of obtained product is the ratio of mass and its volume, including the volume
contribution of the empty space between particles. Consequently, apparent density depends on both
density of the powder particles and the spatial distribution of particles in the powder bed. Properties that
determine apparent density of powdered pigment depend on preparation, encapsulating agent used and
sample storage, that is to say on the way of handling. Particles can be compacted to have a variable range
of apparent densities; however, slightest disturbance to powder bed can cause a change in apparent
density. Obtained results are presented in Table 10.8.
Table 10.8 Apparent density of powder pigment when using different encapsulating agents
Treatment Apparent density (g/ml)
A 1
B 1
C 0.5
From the above table it can be observed that density of encapsulated powder with maltodextrin:
arabic gum, has a lower density than when using other encapsulating agents, behavior attributable to the
occurrence that empty space between particles is less than when using other encapsulating agents.
Acknowledgment
We are grateful for facilities granted to University Center for Linkage and Technology Transfer
(CUVyTT) of Benemérita Universidad Autónoma de Puebla for conducting scanning electron
microscopy studies.
Conclusions
Anthocyanins, although they can be recovered from various types of fruits and vegetables,
commonly grapes, strawberries, black currants, purple cabbage and others, for economic reasons,
are obtained mainly from by-products derived from wine industry, especially the grape peel,
therewithal it can be considered that acachul can be a good alternative to obtain these pigments.
Analysis of acachul anthocyanin content, reveal to have a significantly high anthocyanin content
compared to that reported for other fruits and by other authors, which can make acachul an important
source for obtaining this type of pigments, especially to obtain extracts with potential for application
as food colorants.
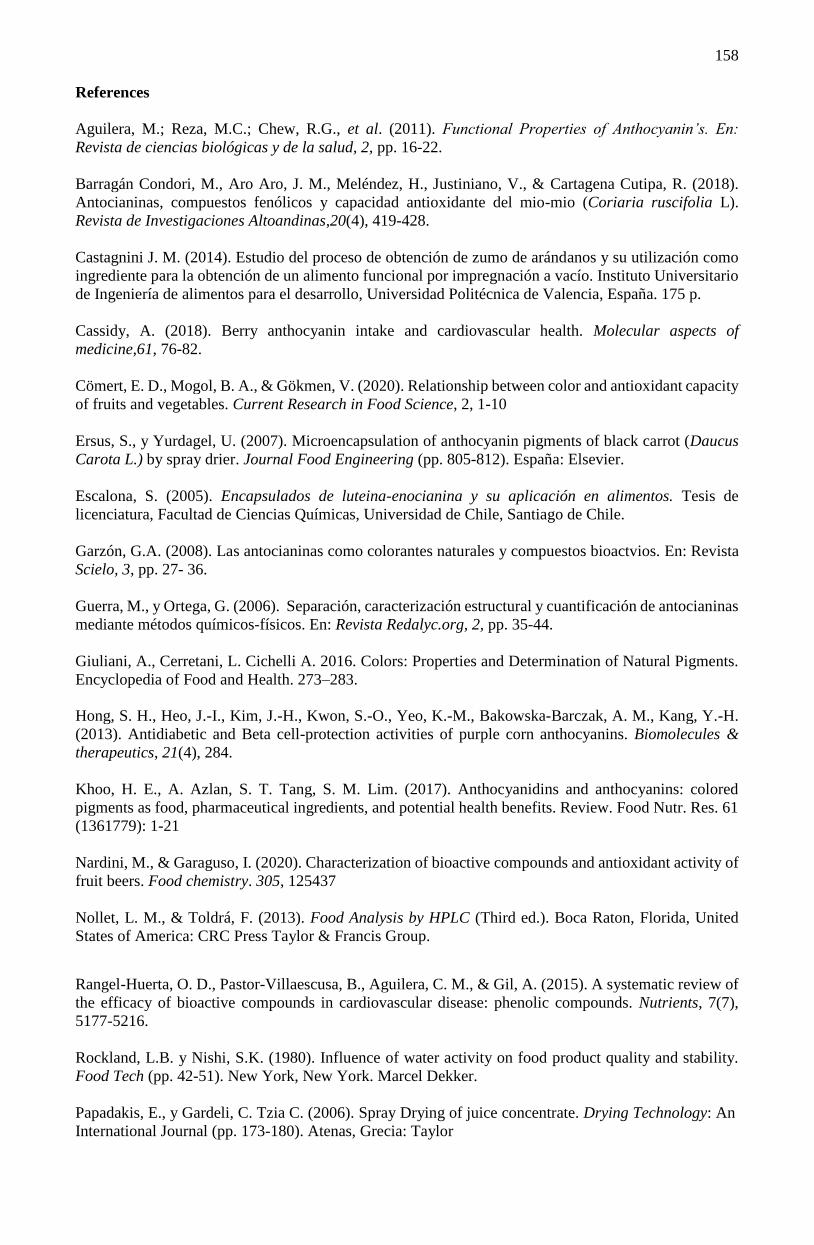
158
References
Aguilera, M.; Reza, M.C.; Chew, R.G., et al. (2011). Functional Properties of Anthocyanin’s. En:
Revista de ciencias biológicas y de la salud, 2, pp. 16-22.
Barragán Condori, M., Aro Aro, J. M., Meléndez, H., Justiniano, V., & Cartagena Cutipa, R. (2018).
Antocianinas, compuestos fenólicos y capacidad antioxidante del mio-mio (Coriaria ruscifolia L).
Revista de Investigaciones Altoandinas,20(4), 419-428.
Castagnini J. M. (2014). Estudio del proceso de obtención de zumo de arándanos y su utilización como
ingrediente para la obtención de un alimento funcional por impregnación a vacío. Instituto Universitario
de Ingeniería de alimentos para el desarrollo, Universidad Politécnica de Valencia, España. 175 p.
Cassidy, A. (2018). Berry anthocyanin intake and cardiovascular health. Molecular aspects of
medicine,61, 76-82.
Cömert, E. D., Mogol, B. A., & Gökmen, V. (2020). Relationship between color and antioxidant capacity
of fruits and vegetables. Current Research in Food Science, 2, 1-10
Ersus, S., y Yurdagel, U. (2007). Microencapsulation of anthocyanin pigments of black carrot (Daucus
Carota L.) by spray drier. Journal Food Engineering (pp. 805-812). España: Elsevier.
Escalona, S. (2005). Encapsulados de luteina-enocianina y su aplicación en alimentos. Tesis de
licenciatura, Facultad de Ciencias Químicas, Universidad de Chile, Santiago de Chile.
Garzón, G.A. (2008). Las antocianinas como colorantes naturales y compuestos bioactvios. En: Revista
Scielo, 3, pp. 27- 36.
Guerra, M., y Ortega, G. (2006). Separación, caracterización estructural y cuantificación de antocianinas
mediante métodos químicos-físicos. En: Revista Redalyc.org, 2, pp. 35-44.
Giuliani, A., Cerretani, L. Cichelli A. 2016. Colors: Properties and Determination of Natural Pigments.
Encyclopedia of Food and Health. 273–283.
Hong, S. H., Heo, J.-I., Kim, J.-H., Kwon, S.-O., Yeo, K.-M., Bakowska-Barczak, A. M., Kang, Y.-H.
(2013). Antidiabetic and Beta cell-protection activities of purple corn anthocyanins. Biomolecules &
therapeutics, 21(4), 284.
Khoo, H. E., A. Azlan, S. T. Tang, S. M. Lim. (2017). Anthocyanidins and anthocyanins: colored
pigments as food, pharmaceutical ingredients, and potential health benefits. Review. Food Nutr. Res. 61
(1361779): 1-21
Nardini, M., & Garaguso, I. (2020). Characterization of bioactive compounds and antioxidant activity of
fruit beers. Food chemistry. 305, 125437
Nollet, L. M., & Toldrá, F. (2013). Food Analysis by HPLC (Third ed.). Boca Raton, Florida, United
States of America: CRC Press Taylor & Francis Group.
Rangel-Huerta, O. D., Pastor-Villaescusa, B., Aguilera, C. M., & Gil, A. (2015). A systematic review of
the efficacy of bioactive compounds in cardiovascular disease: phenolic compounds. Nutrients, 7(7),
5177-5216.
Rockland, L.B. y Nishi, S.K. (1980). Influence of water activity on food product quality and stability.
Food Tech (pp. 42-51). New York, New York. Marcel Dekker.
Papadakis, E., y Gardeli, C. Tzia C. (2006). Spray Drying of juice concentrate. Drying Technology: An
International Journal (pp. 173-180). Atenas, Grecia: Taylor

159
SAGARPA. (2018). Comité Nacional del sistema producto VID. . En: Secretaria de Desarrollo Rural.
Vázquez-Sánchez A.Y., Aguilar-Zárate, P., Muñiz-Márquez D. B., Wong-Paz J. E., Romeo-Rojas, J. A.
Ascacio-Valdes, G., Martínez-Avila., G. C. G. (2019). Effect of ultrasound treatment on the extraction
of antioxidants from Ardisia compressa Kunth fruits and identification of phytochemicals by HPLC-
ESIMS. Heliyon 5 1-7.
Vázquez-Sánchez, A. Y., Corfield, R., Sosa, N., Salvatori, D., & Schebor, C. (2021). Physicochemical,
functional, and sensory characterization of apple leathers enriched with acáchul (Ardisia compressa
Kunth) powder. LWT, 146, 111472.
Instructions for Scientific, Technological and Innovation Publication
[[Title in Times New Roman and Bold No. 14 in English and Spanish]
Surname (IN UPPERCASE), Name 1st Author†*, Surname (IN UPPERCASE), Name 1st Coauthor,
Surname (IN UPPERCASE), Name 2nd Coauthor and Surname (IN UPPERCASE), Name 3rd Coauthor
Institution of Affiliation of the Author including dependency (in Times New Roman No.10 and Italics)
International Identification of Science - Technology and Innovation
ID 1st Author: (ORC ID - Researcher ID Thomson, arXiv Author ID - PubMed Author ID - Open ID) and CVU 1st author:
(Scholar-PNPC or SNI-CONACYT) (No.10 Times New Roman)
ID 1st Coauthor: (ORC ID - Researcher ID Thomson, arXiv Author ID - PubMed Author ID - Open ID) and CVU 1st coauthor:
(Scholar or SNI) (No.10 Times New Roman)
ID 2nd Coauthor: (ORC ID - Researcher ID Thomson, arXiv Author ID - PubMed Author ID - Open ID) and CVU 2nd coauthor:
(Scholar or SNI) (No.10 Times New Roman)
ID 3rd Coauthor: (ORC ID - Researcher ID Thomson, arXiv Author ID - PubMed Author ID - Open ID) and CVU 3rd coauthor:
(Scholar or SNI) (No.10 Times New Roman)
(Report Submission Date: Month, Day, and Year); Accepted (Insert date of Acceptance: Use Only ECORFAN)
Citation: First letter (IN UPPERCASE) of the Name of the 1st Author. Surname, First letter (IN UPPERCASE) of the First
Coauthor's Name. Surname, First letter (IN UPPERCASE) of the Name of the 2nd Co-author. Surname, First letter (IN
UPPERCASE) of the Name of the 3rd Co-author. Last name
Institutional mail [Times New Roman No.10]
First letter (IN UPPERCASE) of the Name Publishers. Surnames (eds.) Title of the Handbook [Times New Roman No.10],
Selected Topics of the corresponding area © ECORFAN- Subsidiary, Year.

Instructions for Scientific, Technological and Innovation Publication
ECORFAN® All rights reserved -México-Bolivia-Spain-Ecuador-Cameroon-Colombia-Salvador-Guatemala-
Paraguay- Nicaragua-Peru-Democratic Republic of Congo-Taiwan
Abstract (In English, 150-200 words)
Text written in Times New Roman No.12, single space
Keywords (In English)
Indicate 3 keywords in Times New Roman and Bold No. 12
1 Introduction
Text in Times New Roman No.12, single space.
General explanation of the subject and explain why it is important.
What is your added value with respect to other techniques?
Clearly focus each of its features
Clearly explain the problem to be solved and the central hypothesis.
Explanation of sections Chapter.
Development of headings and subheadings of the chapter with subsequent numbers
[Title No.12 in Times New Roman, single spaced and bold]
Products in development No.12 Times New Roman, single spaced.
Including graphs, figures and tables-Editable
In the Chapter content any graphic, table and figure should be editable formats that can change size, type
and number of letter, for the purposes of edition, these must be high quality, not pixelated and should be
noticeable even reducing image scale.
[Indicating the title at the bottom with No.10 and Times New Roman Bold]
Table 1.1 Title
Variable Descripción Valor
VV Volumen de Venta 20000
PV Postura de venta 490.61
VC Volumen de Compra 20000
Pc Postura de Compra 485.39
PUh Precio último Hecho 491.61
Vo Volumen Operado 1241979
Pu Precio/Utilidad 0
PVL Precio/Valor Libro 0
Ua Utilidad p/Acción 0
VLa Valor Libro p/Acción 0
Source (in italics)
Should not be images-everything must be editable.

Instructions for Scientific, Technological and Innovation Publication
ECORFAN® All rights reserved -México-Bolivia-Spain-Ecuador-Cameroon-Colombia-Salvador-Guatemala-
Paraguay- Nicaragua-Peru-Democratic Republic of Congo-Taiwan
Figure 1.1 Title
Source (in italics)
Should not be images-everything must be editable.
Graphic 1.1 Title
Source (in italics)
Should not be images-everything must be editable.
Each chapter shall present separately in 3 folders: a) Figures, b) Charts and c) Tables in .JPG format,
indicating the number and sequential Bold Title.
For the use of equations, noted as follows:
∫ =𝒍𝒊𝒎𝟏
𝒍𝒊𝒎−𝟏 ∫𝒍𝒊𝒎𝟏
𝒍𝒊𝒎−𝟏 = [
𝟏 (−𝟏)
𝒍𝒊𝒎]
𝟐
= (𝟎)𝟐
𝒍𝒊𝒎 = √𝒍𝒊𝒎 = 𝟎 = 𝟎 → ∝ (1)
Must be editable and number aligned on the right side.
Methodology
Develop give the meaning of the variables in linear writing and important is the comparison of the used
criteria.
Results
The results shall be by section of the Chapter.
Annexes
Tables and adequate sources
0
1
2
3
4
5
6
7
8
9
Day 14 Day 7 Day 3
Ro
ot
len
gth
(cm
)
TC
T1
T2
T3

Instructions for Scientific, Technological and Innovation Publication
ECORFAN® All rights reserved -México-Bolivia-Spain-Ecuador-Cameroon-Colombia-Salvador-Guatemala-
Paraguay- Nicaragua-Peru-Democratic Republic of Congo-Taiwan
Thanks
Indicate if they were financed by any institution, University or company.
Conclusions
Explain clearly the results and possibilities of improvement.
References
Use APA system. Should not be numbered, nor with bullets, however if necessary numbering will be
because reference or mention is made somewhere in the Chapter.
Use Roman Alphabet, all references you have used must be in the Roman Alphabet, even if you
have quoted an Chapter, book in any of the official languages of the United Nations (English, French,
German, Chinese, Russian, Portuguese, Italian, Spanish, Arabic), you must write the reference in Roman
script and not in any of the official languages.
Technical Specifications
Each chapter must submit your dates into a Word document (.docx):
Handbooks title
Chapter title
Abstract
Keywords
Proceedings sections, for example:
1. Introduction
2. Description of the method
3. Analysis from the regression demand curve
4. Results
5. Thanks
6. Conclusions
7. References
Author Name (s)
Email Correspondence to Author
References
Intellectual Property Requirements for editing:
-Authentic Signature in Color of Originality Format Author and Coauthors
-Authentic Signature in Color of the Acceptance Format of Author and Coauthors

Reservation of Editorial Policy
ECORFAN Handbooks se reserva el derecho de hacer los cambios editoriales requeridos para adecuar la
Obra Científica a la Política Editorial del ECORFAN Handbooks. Una vez aceptada la Obra Científica
en su versión final, el ECORFAN Handbooks enviará al autor las pruebas para su revisión. ECORFAN®
únicamente aceptará la corrección de erratas y errores u omisiones provenientes del proceso de edición
de la revista reservándose en su totalidad los derechos de autor y difusión de contenido. No se aceptarán
supresiones, sustituciones o añadidos que alteren la formación de la Obra Científica.
Code of Ethics - Good Practices and Declaration of Solution to Editorial Conflicts
Declaration of Originality and unpublished character of the Scientific Work, of Authorship, on
the obtaining of data and interpretation of results, Acknowledgments, Conflict of interests,
Assignment of rights and distribution
The ECORFAN-Mexico, S.C Directorate asserts to the Authors of the Scientific Work that its content
must be original, unpublished and of Scientific, Technological and Innovation content to be submitted
for evaluation.
The Authors signing the Scientific Work must be the same that have contributed to its conception,
realization and development, as well as the obtaining of data, interpretation of the results, its writing and
revision. The Correspondent Author of the proposed Scientific Work will request the form that follows.
Title of the Scientific Work:
– The sending of a Scientific Work to ECORFAN Handbooks emanates the commitment of the
author not to submit it simultaneously to the consideration of other serial publications for it must
complement the Format of Originality for its Scientific Work, unless it is rejected by the
Arbitration Committee, may be withdrawn.
– None of the data presented in this Scientific Work has been plagiarized or invented. The original
data are clearly distinguishable from those already published. And you have knowledge of the
test in PLAGSCAN if a level of plagiarism is detected Positive will not proceed to arbitrate.
– References are cited on which the information contained in the Scientific Work is based, as well
as theories and data from other previously published Scientific Works.
– The authors sign the Authorization Form for their Scientific Work to be disseminated by means
that ECORFAN-Mexico, S.C. in its Holding Mexico consider relevant for the dissemination and
dissemination of its Scientific Work by giving up its Scientific Work Rights.
– The consent of those who have provided unpublished data obtained by verbal or written
communication has been obtained, and such communication and authorship are adequately
identified.
– The Author and Co-Authors who sign this work have participated in its planning, design and
execution, as well as in the interpretation of the results. They also critically reviewed the paper,
approved its final version and agreed with its publication.
– No signature responsible for the work has been omitted and the criteria of Scientific
Authorization are satisfied.
– The results of this Scientific Work have been interpreted objectively. Any result contrary to the
point of view of those who sign is exposed and discussed in the Scientific Work.

Copyright and Access
The publication of this Scientific Work entails the transfer of the copyright to ECORFAN-Mexico, SC
in its Mexico Holding for its ECORFAN Handbooks, which reserves the right to distribute on the Web
the published version of the Scientific Work and the making available of the Scientific Work in this
format supposes for its Authors the fulfillment of what is established in the Law of Science and
Technology of the United States of Mexico, regarding the obligation to allow access to the results of
Scientific Research.
Title of the Scientific Work:
Name and surnames of the Contact Author and the Coauthors Signature
1.
2.
3.
4.
Principles of Ethics and Declaration of Solution to Editorial Conflicts
Publisher Responsibilities
The Publisher undertakes to guarantee the confidentiality of the evaluation process, it may not disclose
to the Arbitrators the identity of the Authors, nor may it reveal the identity of the Arbitrators at any time.
The Editor assumes the responsibility of properly informing the Author of the phase of the editorial
process in which the text is sent, as well as the resolutions of Double Blind Arbitration.
The Editor must evaluate the manuscripts and their intellectual content without distinction of race,
gender, sexual orientation, religious beliefs, ethnicity, nationality, or the political philosophy of the
Authors.
The Editor and his editing team of ECORFAN® Holdings will not disclose any information about the
Scientific Work sent to anyone other than the corresponding Author.
The Editor must make fair and impartial decisions and ensure a fair peer arbitration process.
Responsibilities of the Editorial Board
The description of the processes of peer review is made known by the Editorial Board in order that the
Authors know the evaluation criteria and will always be willing to justify any controversy in the
evaluation process. In case of Detection of Plagiarism to the Scientific Work the Committee notifies the
Authors for Violation to the Right of Scientific, Technological and Innovation Authorization.
Responsibilities of the Arbitration Committee
The Arbitrators undertake to notify about any unethical conduct by the Authors and to indicate all the
information that may be reason to reject the publication of the Scientific Work. In addition, they must
commit to keep confidential information related to the Scientific Work that they evaluate.
Any manuscript received for your arbitration must be treated as confidential, must not be displayed or
discussed with other experts, except with the permission of the Editor.
The Referees should conduct themselves objectively, any personal criticism of the Author is
inappropriate.
The Arbitrators must express their points of view with clear and valid arguments that contribute to the
Scientific, Technological and Innovation of the Author.
The Arbitrators should not evaluate the manuscripts in which they have conflicts of interest and that they
have been notified to the Editor before submitting the Scientific Work to evaluation.

Responsibilities of Authors
Authors must ensure that their Scientific Works are the product of their original work and that the data
have been obtained in an ethical manner.
Authors must ensure they have not been previously published or are not being considered in another
serial publication.
Authors must strictly follow the rules for the publication of Scientific Works defined by the Editorial
Board.
Authors should consider that plagiarism in all its forms constitutes unethical editorial conduct and is
unacceptable, consequently any manuscript that incurs plagiarism will be removed and not considered
for publication.
Authors should cite publications that have been influential in the nature of the Scientific Work submitted
to arbitration.
Information services
Indexing - Bases and Repositories
RESEARCH GATE (Germany)
MENDELEY (Bibliographic References Manager)
GOOGLE SCHOLAR (Citation indices-Google)
REDIB Ibero-American Network of Innovation and Scientific Knowledge-CSIC
Publishing Services
Citation and Index Identification H
Management of Originality Format and Authorization
Testing of Handbooks with PLAGSCAN
Evaluation of Scientific Work
Issuance of Certificate of Arbitration
Edition of Scientific Work
Web layout
Indexing and Repository
Publication of Scientific Work
Certificate of Scientific Work
Editing Service Billing
Editorial Policy and Management
143 – 50 Itzopan, Ecatepec de Morelos–Mexico. Phones: +52 1 55 6159 2296, +52 1 55 1260 0355, +52
1 55 6034 9181; Email: [email protected] www.ecorfan.org
ECORFAN®
Chief Editor
VARGAS-DELGADO, Oscar. PhD
Executive Director
RAMOS-ESCAMILLA, María. PhD
Editorial Director
PERALTA-CASTRO, Enrique. MsC
Web Designer
ESCAMILLA-BOUCHAN, Imelda. PhD
Web Diagrammer
LUNA-SOTO, Vladimir. PhD
Editorial Assistant
REYES-VILLAO, Angélica. BsC
Translator
DÍAZ-OCAMPO, Javier. BsC
Philologist
RAMOS-ARANCIBIA, Alejandra. BsC
Advertising & Sponsorship
(ECORFAN® -Mexico – Bolivia – Spain – Ecuador – Cameroon – Colombia - El Salvador – Guatemala
-Nicaragua-Peru-Paraguay-Democratic Republic of The Congo, Taiwan), [email protected]
Site Licences
03-2010-032610094200-01-For printed material ,03-2010-031613323600-01-For Electronic
material,03-2010-032610105200-01-For Photographic material,03-2010-032610115700-14-For the
facts Compilation,04-2010-031613323600-01-For its Web page,19502-For the Iberoamerican and
Caribbean Indexation,20-281 HB9-For its indexation in Latin-American in Social Sciences and
Humanities,671-For its indexing in Electronic Scientific Journals Spanish and Latin-America,7045008-
For its divulgation and edition in the Ministry of Education and Culture-Spain,25409-For its repository
in the Biblioteca Universitaria-Madrid,16258-For its indexing in the Dialnet,20589-For its indexing in
the edited Journals in the countries of Iberian-America and the Caribbean, 15048-For the international
registration of Congress and Colloquiums. [email protected]
Management Offices
143 – 50 Itzopan, Ecatepec de Morelos–México.
21 Santa Lucía, CP-5220. Libertadores -Sucre–Bolivia.
38 Matacerquillas, CP-28411. Moralzarzal –Madrid-España.
18 Marcial Romero, CP-241550. Avenue, Salinas l - Santa Elena-Ecuador.
1047 La Raza Avenue -Santa Ana, Cusco-Peru.
Boulevard de la Liberté, Immeuble Kassap, CP-5963.Akwa- Douala-Cameroon.
Southwest Avenue, San Sebastian – León-Nicaragua.
31 Kinshasa 6593 – Republique Démocratique du Congo.
San Quentin Avenue, R 1-17 Miralvalle - San Salvador-El Salvador.
16 Kilometro, American Highway, House Terra Alta, D7 Mixco Zona 1-Guatemala.
105 Alberdi Rivarola Captain, CP-2060. Luque City- Paraguay.
69 Street. YongHe district, ZhongXin. Taipei-Taiwan.
43 Street # 30 -90 B. El Triunfo CP.50001. Bogota Colombia